UNITED STATES
SECURITIES AND EXCHANGE COMMISSION
Washington, D.C. 20549
FORM N-CSR
CERTIFIED SHAREHOLDER REPORT OF REGISTERED
MANAGEMENT INVESTMENT COMPANIES
Investment Company Act file number 811-22201
Direxion Shares ETF Trust
(Exact name of registrant as specified in charter)
1301 Avenue of the Americas (6th Ave.), 28th Floor
New York, NY 10019
(Address of principal executive offices) (Zip code)
1301 Avenue of the Americas (6th Ave.), 28th Floor
New York, NY 10019
(Name and address of agent for service)
1-800-851-0511
Registrant's telephone number, including area code
Date of fiscal year end: October 31, 2022
Date of reporting period: October 31, 2022
Item 1. Report to Stockholders.
(a)

DIREXION SHARES ETF TRUST
ANNUAL REPORT OCTOBER 31, 2022
1301 Avenue of the Americas (6th Ave.), 28th Floor New York, New York 10019 www.direxioninvestments.com
1X BEAR FUNDS
Direxion Daily CSI 300 China A Share Bear 1X Shares
Direxion Daily S&P 500® Bear 1X Shares
Direxion Daily AAPL Bear 1X Shares
Direxion Daily AMZN Bear 1X Shares
Direxion Daily GOOGL Bear 1X Shares
Direxion Daily MSFT Bear 1X Shares
Direxion Daily TSLA Bear 1X Shares
1.5X BULL FUNDS
Direxion Daily AAPL Bull 1.5X Shares
Direxion Daily AMZN Bull 1.5X Shares
Direxion Daily GOOGL Bull 1.5X Shares
Direxion Daily MSFT Bull 1.5X Shares
Direxion Daily TSLA Bull 1.5X Shares
| 2X BULL FUNDS | | 2X BEAR FUNDS | |
| Direxion Daily CSI 300 China A Share Bull 2X Shares | | | | | |
| Direxion Daily CSI China Internet Index Bull 2X Shares | | | | | |
| Direxion Daily S&P 500® Bull 2X Shares | | | | | |
| Direxion Daily S&P 500® Equal Weight Bull 2X Shares | | | | | |
| Direxion Daily MSCI Brazil Bull 2X Shares | | | | | |
| Direxion Daily MSCI India Bull 2X Shares | | | | | |
| Direxion Daily Cloud Computing Bull 2X Shares | | | | | |
| Direxion Daily Electric and Autonomous Vehicles Bull 2X Shares | | | | | |
| Direxion Daily Energy Bull 2X Shares | | Direxion Daily Energy Bear 2X Shares | |
| Direxion Daily FinTech Bull 2X Shares | | | | | |
| Direxion Daily Global Clean Energy Bull 2X Shares | | | | | |
| Direxion Daily Gold Miners Index Bull 2X Shares | | Direxion Daily Gold Miners Index Bear 2X Shares | |
| Direxion Daily Junior Gold Miners Index Bull 2X Shares | | Direxion Daily Junior Gold Miners Index Bear 2X Shares | |
| Direxion Daily Metal Miners Bull 2X Shares | | | | | |
| Direxion Daily Oil Services Bull 2X Shares | | | | | |
| Direxion Daily Robotics, Artificial Intelligence & Automation Index Bull 2X Shares | | | | | |
| Direxion Daily S&P Oil & Gas Exp. & Prod. Bull 2X Shares | | Direxion Daily S&P Oil & Gas Exp. & Prod. Bear 2X Shares | |
| Direxion Daily Select Large Caps & FANGs Bull 2X Shares | | | | | |
| Direxion Daily Software Bull 2X Shares | | | | | |
| Direxion Daily TIPS Bull 2X Shares | | Direxion Daily TIPS Bear 2X Shares | |
| Direxion Daily Travel & Vacation Bull 2X Shares | | | | | |
| Direxion Daily US Infrastructure Bull 2X Shares | | | | | |
Letter to Shareholders (Unaudited) | | | 4 | | |
Letter to Single Stock Shareholders
(Unaudited) | | | 14 | | |
| Performance Summary (Unaudited) | | | 19 | | |
| Expense Example (Unaudited) | | | 58 | | |
| Allocation of Portfolio Holdings (Unaudited) | | | 62 | | |
| Schedules of Investments | | | 63 | | |
| Statements of Assets and Liabilities | | | 108 | | |
| Statements of Operations | | | 118 | | |
| Statements of Changes in Net Assets | | | 128 | | |
| Financial Highlights | | | 148 | | |
| Notes to the Financial Statements | | | 153 | | |
Report of Independent Registered Public
Accounting Firm | | | 188 | | |
| Supplemental Information (Unaudited) | | | 191 | | |
Board Review of Investment Advisory
Agreement (Unaudited) | | | 193 | | |
Board Review of Liquidity Risk Management
Program (Unaudited) | | | 198 | | |
| Trustees and Officers (Unaudited) | | | 199 | | |
Help Preserve the Environment – Go Green!
Go paperless with Direxion e-Delivery – a service allowing shareholders to reduce clutter with full online access to regulatory documents. Begin the preservation process with e-delivery.
With Direxion e-Delivery, you can:
• Receive email notifications when your most recent shareholder communications are available for review.
• Access prospectuses, annual reports and semi-annual reports online.
It's easy to enroll:
1. Visit www.direxioninvestments.com/edelivery
2. Follow the simple enrollment instructions
If you have questions about Direxion e-Delivery services, contact one of our shareholder representatives at 800-851-0511.


Dear Shareholders,
This Annual Report for the Direxion Shares exchange-traded funds (the "ETFs") covers the period from November 1, 2021 to October 31, 2022 (the "Annual Period").
Market Review:
Signs of broad-based inflation began in the fall of 2021, leading to a shaky global equity market environment. At the time, most experts predicted inflation levels were transitory, quelling investor concerns temporarily. Equity markets began to pick up through December, ending the year on a high. However, it soon became clear the widespread inflation was not going anywhere and the Federal Reserve announced an acceleration of monetary policy that was implemented through a series of interest rate hikes to combat inflation. Simultaneously, the highly contagious Covid-19 Omicron variant spread across the world and, despite high vaccination rates, breakthrough infections were at an all-time high. However, by the end of the Annual Period, Covid was far less of a concern for investors. Just as markets were looking up again, with the S&P 500 posting its first monthly gain in March 2022, Russia invaded Ukraine, and the effects of the invasion rippled across equity markets, as energy prices surged and fears of wider-spread conflict grew. In response, the United States and other western nations imposed extreme economic sanctions on Russia. Markets were very volatile on the heels of the Russian invasion, and the first two quarters of 2022 saw a shrinking U.S. GDP. June earnings reports were surprisingly strong, despite a mid-month S&P low. Despite these numbers, July was a strong month, but this positive sentiment did not last long. A hawkish speech from Federal Reserve Chair, Jerome Powell, in August negatively impacted markets around the world. September was another rough month for equities, with both the S&P 500 and NASDAQ dropping roughly 10%. Global markets fared no better, as the UK entered a recession, and China faced mass protests and unrest. October saw a modest increase in stocks as the Federal Reserve indicated it will pull back on its aggressive tightening in the near future after positive third quarter readings, but overall sentiment was still generally low. Investors are pivoting towards more risk-off investments in an attempt to navigate historic inflation levels, geopolitical conflict and high interest rates, although traditional safe haven investments, such as commodities, are less appealing than they have been in the past.
The U.S. bond market was in consistent decline for the majority of the Annual Period, oftentimes diverging from trends in the equities markets. In the fall, treasuries and international bonds were experiencing the worst performance of the Annual Period, as concerns over rising interest rates and inflation began. As inflation worsened and proved to be less transitory than initially predicted, central banks around the world pivoted towards more hawkish policies. In December, the Federal Reserve announced there would be three or four rate hikes throughout 2022, as well as a tapering of U.S. treasury asset purchases. In late February, the Russian invasion of Ukraine rippled through the global financial system, including fixed income markets. The U.S. Treasury yield curve started to flatten as the 10-20 year bond spread grew and became inverted. While bonds have typically been considered a way to hedge a portfolio against equities, this strategy has not typically held true in the current market environment. After the positive indication that the Federal Reserve is starting to get a handle on inflation, the global bond market saw a slight rebound, but the yield curve remained inverted at the end of the Annual Period, which remains a concern for many investors.
Direxion Shares Operational Review:
The discussion below relates to the performance of the ETFs for the Annual Period. The ETFs are leveraged and seek daily investment results, before fees and expenses, of 200%, -100% or -200% of the performance of a particular benchmark. All ETF returns are NAV (net asset value) returns.
The ETFs, as stated above, seek daily investment results. They do not seek to track a multiple of their respective benchmarks for periods longer than one day and the performance of the ETFs over longer periods may not correlate to their benchmarks' performance. The ETFs should not be held by investors for long periods and should be used as short-term trading vehicles. These products are not suitable for all investors, and should be utilized only by sophisticated investors who understand the risks associated with the use of leverage, the consequences of seeking daily leveraged investment results and intend to actively monitor and manage their investments.
DIREXION ANNUAL REPORT
4
The ETFs with the word "Bull" in their name (the "Bull ETFs"), attempt to provide investment results that correlate to 200%, before fees and expenses, of the daily performance of a benchmark index, meaning the Bull Funds attempt to move in the same direction as their respective target benchmark index.
The Funds with the word "Bear" in their name (the "Bear ETFs"), attempt to provide investment results that correlate to -100% or -200%, before fees and expenses, of the daily performance of a benchmark index, meaning that the Bear Funds attempt to move in the opposite, or inverse, direction of their respective target benchmark index.
In seeking to achieve each ETF's daily investment results, Rafferty Asset Management, LLC ("Rafferty" or the "Adviser"), relies upon a pre-determined investment model to generate orders resulting in repositioning each ETF's investments in accordance with its daily investment objective. Using this approach, Rafferty determines the type, quantity and mix of investment positions that it believes in combination should produce daily returns consistent with an ETF's objective. As a consequence, if an ETF is performing as designed, the return of the benchmark index will dictate the return for that ETF. Each ETF pursues its investment objective regardless of market conditions and does not take defensive positions.
Each ETF has a clearly articulated goal which requires the ETF to seek economic exposure significantly in excess of its net assets. To meet its objectives, each ETF invests in some combination of financial instruments, including derivatives. Each ETF invests significantly in derivatives, including swap agreements. Rafferty uses these types of investments to produce economically "leveraged" investment results. Leveraging allows Rafferty to generate a greater positive or negative return than what would be generated on the invested capital without leverage, thus changing small market movements into larger changes in the value of the investments of an ETF.
The ETFs may use certain investment techniques, including investments in derivatives, which may be considered aggressive. Investments in derivatives in general are subject to market risks that may cause their prices to fluctuate dramatically over time. Additionally, use of such instruments may increase the volatility of the ETFs. The use of derivatives may expose the ETFs to additional risks that they would not be subject to if they invested directly in the securities underlying those derivatives, such as counterparty risk. The use of derivatives may result in larger losses or smaller gains than otherwise would be the case.
Because each ETF seeks daily investment results of its relevant benchmark, a comparison of the return of the ETF to the relevant benchmark tells you little about whether an ETF has met its investment objective. To determine if an ETF has met its daily investment goals, Rafferty maintains models which indicate the expected performance of each ETF as compared to the underlying relevant index. The models do not take into account the ETF's expense ratio or any transaction or trading fees associated with creating or maintaining an ETF's portfolio.
Factors Affecting Direxion Shares Performance:
Benchmark Performance – The daily performance of each ETF's benchmark index, and the factors and market conditions implicitly affecting that index, are the primary factors driving ETF performance. Given the daily goals, the series of daily index returns are most important. The market conditions that affected the benchmark indexes during the past year are described below.
Leverage – Each ETF seeks daily investment results (before fees and expenses) of either 200% (for the Bull ETFs) or -100% or -200% (for the Bear ETFs) of the daily performance of its respective underlying index. The use of leverage magnifies an ETF's gains or losses and increases the investment's risk and volatility. The Bear ETFs seek to achieve inverse magnified correlation to their respective underlying indexes.
Volatility and Compounding – The goal of leveraged ETFs is to provide a multiple of the daily return of an underlying index. Over periods longer than a single day, an ETF should not be expected to provide its respective multiple of the return of the underlying index. Due to the effects of compounding, a universal mathematical concept that applies to all investments, returns of the ETFs over longer periods are greater or less than the ETF's daily stated goal. Periods of high volatility that lack a clear trend hurt an ETF's performance while trending, low volatility markets enhance an ETF's performance.
Cost of Financing – In order to attain leveraged exposure, a Bull ETF incurs a cost of SOFR plus or minus a spread and a Bear ETF receives SOFR plus or minus a spread as applied to the borrowed portion of the ETF's exposure. The spread varies
DIREXION ANNUAL REPORT
5
by both Fund and counterparty and is a function of market demand, hedging costs, access to balance sheet, borrow volatility, current counterparty exposure and administrative costs associated with the swap counterparty. Generally for most of the Bull ETFs, the financing costs will have a negative effect on tracking, but for Bear ETFs, the financing cost will have a positive effect on tracking. An increase in interest rates which effects the cost of financing will further impact an ETF's performance and ability to track its index.
Optimized Baskets – Each Bull ETF holds a basket of equities designed to provide returns that track its underlying index. In order to decrease transaction costs, certain Bull ETFs hold only a representative sample, or optimized basket, that tracks closely over time, but deviates from its underlying index in the short-term.
Equity Dividends and Bond Interest – Equity Bull ETFs are positively impacted by equity and index dividends as the ETFs receive those payments. Equity Bear ETFs are negatively impacted as they are obligated to pay the dividends. Treasury Bull ETFs receive interest, accrued on a daily basis, to account for the Treasury's semi-annual coupon payments while the Treasury Bear ETFs pay interest, accrued on a daily basis.
Fees, Expenses, and Transaction Costs – Fees and expenses are listed in each ETF's prospectus and may be higher than many traditional index ETFs' fees, which cause a greater negative impact on ETF performance. Transactions costs are not included in the expense ratio of the ETFs. Transaction costs can be higher due to the ETF's use of leverage, frequent creation and redemption activity, or trading securities that are comparatively less liquid.
Direxion Shares Performance Review:
The Direxion Daily CSI 300 China A Share Bear 1X Shares seeks to provide -100% of the daily return of the CSI 300 Index. The CSI 300 Index is a modified free-float market capitalization weighted index comprised of the largest and most liquid stocks in the Chinese A-share market. Index constituent stocks must have been listed for more than three months (unless the stock's average daily A-share market capitalization since its initial listing ranks among the top 30 of all A-shares) and must not be experiencing obvious abnormal fluctuations or market manipulations. For the Annual Period, the CSI 300 Index returned -36.09%. Given the daily investment objectives of the ETF and the path dependency of returns for longer periods, the annual return of the index alone should not generate expectations of annual performance of the ETF. The Direxion Daily CSI 300 China A Share Bear 1X Shares returned 45.10%, while the model indicated an expected return of 44.75%.
The Direxion Daily S&P 500® Bear 1X Shares seeks to provide -100% of the daily return of the S&P 500® Index. The S&P 500® Index is a capitalization-weighted index composed of 500 domestic common stocks. The S&P 500® Index is a capitalization-weighted index composed of 500 domestic common stocks. Standard & Poor's® selects the stocks comprising the S&P 500® Index on the basis of market capitalization, financial viability of the company and the public float, liquidity and price of a company's shares outstanding. The index is a float-adjusted, market capitalization-weighted index. For the Annual Period, the S&P 500® Index returned -14.61%. Given the daily investment objectives of the ETF and the path dependency of returns for longer periods, the annual return of the index alone should not generate expectations of annual performance of the ETF. The Direxion Daily S&P 500® Bear 1X Shares 12.88%, while the model indicated an expected return of 11.11%.
The Direxion Daily CSI 300 China A Share Bull 2X Shares seeks to provide 200% of the daily return of the CSI 300 Index. The CSI 300 Index is a modified free-float market capitalization weighted index comprised of the largest and most liquid stocks in the Chinese A-share market. Index constituent stocks must have been listed for more than three months (unless the stock's average daily A-share market capitalization since its initial listing ranks among the top 30 of all A-shares) and must not be experiencing obvious abnormal fluctuations or market manipulations. For the Annual Period, the CSI 300 Index returned -36.09%. Given the daily investment objectives of the ETF and the path dependency of returns for longer periods, the annual return of the index alone should not generate expectations of annual performance of the ETF. The Direxion Daily CSI 300 China A Share Bull 2X Shares returned -60.95%, while the model indicated an expected return -62.63%.
The Direxion Daily CSI China Internet Index Bull 2X Shares seeks to provide 200% of the daily return of the CSI Overseas China Internet Index. The CSI Overseas China Internet Index is provided by China Securities Index Co., LTD. The index is designed to measure the performance of the investable universe of publicly traded China-based companies whose primary business or businesses are in the internet and internet-related sectors, as defined by the index sponsor, China Securities
DIREXION ANNUAL REPORT
6
Index Co., Ltd. A China-based company is a company that meets at least one of the following criteria: 1) the company is incorporated in mainland China; 2) its headquarters are in mainland China; or 3) at least 50% of the revenue from goods produced or sold, or services performed in mainland China. The index provider then removes securities that during the past year had a daily average trading value of less than $500,000 or a daily average market capitalization of less than $500 million. For the Annual Period, the CSI Overseas China Internet Index returned -57.28%. Given the daily investment objectives of the ETF and the path dependency of returns for longer periods, the annual return of the index alone should not generate expectations of annual performance of the ETF. The Direxion Daily CSI China Internet Index Bull 2X Shares returned -88.53%, while the model indicated an expected return of -88.19%.
The Direxion Daily S&P 500® Bull 2X Shares seek to provide 200% of the daily return of the S&P 500® Index. The S&P 500® Index is a capitalization-weighted index composed of 500 domestic common stocks. The S&P 500® Index is a capitalization-weighted index composed of 500 domestic common stocks. Standard & Poor's® selects the stocks comprising the S&P 500® Index on the basis of market capitalization, financial viability of the company and the public float, liquidity and price of a company's shares outstanding. The index is a float-adjusted market capitalization-weighted index. For the Annual Period, the S&P 500® Index returned -14.61%. Given the daily investment objectives of the ETF and the path dependency of returns for longer periods, the annual return of the index alone should not generate expectations of annual performance of the ETF. The Direxion Daily S&P 500® Bull 2X Shares returned -32.51%, while the model indicated an expected return of -30.88%.
The Direxion Daily S&P 500® Equal Weight Bull 2X Shares seeks to provide 200% of the daily return of the S&P 500® Equal Weight Index. The S&P 500® Equal Weight Index consists of all of the components of the S&P 500® Index. The Index is an equal-weighted version of the S&P 500® Index. Unlike the S&P 500® Index, which employs a float-adjusted market capitalization weighted methodology, the Index assigns each component security the same weight upon rebalance. The Index is a stock market index tracking the performance of 500 large companies listed on stock exchanges in the United States. Since the Fund's inception on January 20, 2022, the S&P 500® Equal Weight Index returned -9.94%. Given the daily investment objectives of the ETF and the path dependency of returns for longer periods, the annual return of the index alone should not generate expectations of annual performance of the ETF. Since inception, the Direxion Daily S&P 500® Equal Weight Bull 2X Shares returned -24.27%, while the model indicated an expected return of -22.35%.
The Direxion Daily MSCI Brazil Bull 2X Shares seeks to provide 200% of the daily return of the MSCI Brazil 25/50 Index. The MSCI Brazil 25/50 Index is designed to measure the performance of the large- and mid-capitalization segments of the Brazilian equity market, covering approximately 85% of the free float-adjusted market capitalization of Brazilian issuers. For the Annual Period, the MSCI Brazil 25/50 Index returned 24.55%. Given the daily investment objectives of the ETF and the path dependency of returns for longer periods, the annual return of the index alone should not generate expectations of annual performance of the ETF. The Direxion Daily MSCI Brazil Bull 2X Shares returned 37.79%, while the model indicated an expected return of 41.27%.
The Direxion Daily MSCI India Bull 2X Shares seeks to provide 200% of the daily return of the MSCI India Index. The MSCI India Index is designed to measure the performance of the large- and mid-capitalization segments of the Indian equity market, covering approximately 85% of companies in the Indian equity universe. For the Annual Period, the MSCI India Index returned -6.89%. Given the daily investment objectives of the ETF and the path dependency of returns for longer periods, the annual return of the index alone should not generate expectations of annual performance of the ETF. The Direxion Daily MSCI India Bull 2X Shares returned -21.15%, while the model indicated an expected return of -18.70%.
The Direxion Daily Cloud Computing Bull 2X Shares seeks to provide 200% of the daily return of the Indxx USA Cloud Computing Index. The Indxx USA Cloud Computing Index is provided by Indxx, LLC. and includes domestic companies that deliver cloud computing infrastructure, platforms, or services. The companies included in the Index are involved in the delivery of computing services – servers, storage, databases, networking, software, analytics, and more, over the internet, which is often referred to as the "Cloud." The Index Provider has defined cloud computing to include three themes: Infrastructure as a service; Platform as a service; and Software as a service. For the Annual Period, the Indxx USA Cloud Computing Index returned -46.98%. Given the daily investment objectives of the ETF and the path dependency of returns for longer periods, the annual return of the index alone should not generate expectations of annual performance of the ETF. The Direxion Daily Cloud Computing Bull 2X Shares returned -77.03%, while the model indicated an expected return of -76.49%.
DIREXION ANNUAL REPORT
7
The Direxion Daily Electric and Autonomous Vehicles Bull 2X Shares seeks to provide 200% of the daily return of the Indxx US Electric and Autonomous Vehicles Index. The Indxx US Electric and Autonomous Vehicles Index is designed to track the performance of electric and autonomous vehicles companies. The Index Provider defines electric and autonomous vehicles companies as those companies that derive at least 50% of their revenues from the following activities (or "sub-themes"): Manufacturers – companies that manufacture and sell electric or autonomous vehicles; Enablers – companies that build infrastructure or create technology for electric or autonomous vehicles, such as charging docks and batteries; and Software and Technology Services – companies that engage in the development of software and technology for electric or autonomous vehicles. Since the Fund's inception on August 11, 2022, the Indxx US Electric and Autonomous Vehicles Index returned -36.07%. Given the daily investment objectives of the ETF and the path dependency of returns for longer periods, the annual return of the index alone should not generate expectations of annual performance of the ETF. Since inception, the Direxion Daily Electric and Autonomous Vehicles Bull 2X Shares returned -61.92%, while the model indicated an expected return of -60.76%.
The Direxion Daily Energy Bull 2X Shares and the Direxion Daily Energy Bear 2X Shares seek to provide 200% and -200%, respectively, of the daily return of the Energy Select Sector Index. The Energy Select Sector Index is provided by S&P Dow Jones Indices and includes domestic companies from the energy sector which includes the following industries: oil, gas and consumable fuels; and energy equipment and services. For the Annual Period, the Energy Select Sector Index returned 63.73%. Given the daily investment objectives of the ETFs and the path dependency of returns for longer periods, the annual return of the index alone should not generate expectations of annual performance of the ETFs. The Direxion Daily Energy Bull 2X Shares returned 130.82%, while the model indicated an expected return of 136.92%. Deviation from the model may be due to a combination of asset fluctuation, expenses, transaction costs, including swap contract related costs and underlying index volatility. The Direxion Daily Energy Bear 2X Shares returned -73.67%, while the model indicated an expected return of -74.14%.
The Direxion Daily FinTech Bull 2X Shares seeks to provide 200% of the daily return of the Indxx US FinTech and Decentralized Finance Index. The Indxx US FinTech and Decentralized Finance Index includes U.S.-listed securities, including ADRs, of companies that derive a minimum of 50% of their total revenue from offering technology-driven financial services ("FinTech"), including companies that facilitate decentralized finance systems. Indxx, the Index Provider, defines FinTech as being comprised of the following types of companies: Digital Payments, Point-of-Sale, Personal Finance Software and Credit/Debit Card Issuers, Tax Compliance Software and Backend Payment Processing, Decentralized Finance, Financial Enterprise Solutions, and Peer-to-Peer Lending and Crowdfunding. Since the Fund's inception on January 20, 2022, the Indxx US FinTech and Decentralized Finance Index returned -23.74%. Given the daily investment objectives of the ETF and the path dependency of returns for longer periods, the annual return of the index alone should not generate expectations of annual performance of the ETF. Since Inception, the Direxion Daily FinTech Bull 2X Shares returned -49.76%, while the model indicated an expected return of -48.39%.
The Direxion Daily Global Clean Energy Bull 2X Shares seeks to provide 200% of the daily return of the S&P Global Clean Energy Index. The S&P Global Clean Energy Index is designed to track the performance of companies from developed markets whose economic fortunes are tied to the global clean energy business. The Index has a target constituent count of 100 and is limited to those stocks traded on a developed market exchange that meet or exceed, at the time of inclusion, $300 million in total market capitalization, $100 million in float adjusted market capitalization, and $3 million average daily value traded over a six month period. The Index is rebalanced semiannually. For the Annual Period, the S&P Global Clean Energy Index returned -24.04%. Given the daily investment objectives of the ETF and the path dependency of returns for longer periods, the annual return of the index alone should not generate expectations of annual performance of the ETF. Since inception, the Direxion Daily Global Clean Energy Bull 2X Shares returned -50.82%, while the model indicated an expected return of -50.60%.
The Direxion Daily Gold Miners Index Bull 2X Shares and the Direxion Daily Gold Miners Index Bear 2X Shares seek to provide 200% and -200%, respectively, of the daily return of the NYSE Arca Gold Miners Index. The NYSE Arca Gold Miners Index is a modified market capitalization weighted index comprised of publicly traded companies that operate globally in both developed and emerging markets, and are involved primarily in mining for gold and, to a lesser extent, in mining for silver. The index will limit the weight of companies whose revenues are more significantly exposed to silver mining to less than 20% of the index at each rebalance date. The index may include small- and mid-capitalization companies and foreign issuers For the Annual Period, the NYSE Arca Gold Miners Index returned -22.19%. Given the daily investment objectives of the ETFs and the path dependency of returns for longer periods, the annual return of the index alone should not generate expectations of annual performance of the ETFs. The Direxion Daily Gold Miners Index Bull 2X Shares returned -49.11%,
DIREXION ANNUAL REPORT
8
while the model indicated an expected return of -47.29%. The Direxion Daily Gold Miners Index Bear 2X Shares returned 15.05%, while the model indicated an expected return of 12.36%.
The Direxion Daily Junior Gold Miners Index Bull 2X Shares and the Direxion Daily Junior Gold Miners Index Bear 2X Shares seek to provide 200% and -200%, respectively, of the daily return of the MVIS Global Junior Gold Miners Index. The MVIS Global Junior Gold Miners Index tracks the performance of foreign and domestic micro-, small- and mid-capitalization companies that generate, or demonstrate the potential to generate, at least 50% of their revenues from, or have at least 50% of their assets related to, gold mining and/or silver mining, hold real property or have mining projects that have the potential to produce at least 50% of the company's revenue from gold or silver mining when developed, or primarily invest in gold or silver. For the Annual Period, the MVIS Global Junior Gold Miners Index returned -30.47%. Given the daily investment objectives of the ETFs and the path dependency of returns for longer periods, the annual return of the index alone should not generate expectations of annual performance of the ETFs. The Direxion Daily Junior Gold Miners Index Bull 2X Shares returned -61.33%, while the model indicated an expected return of -59.91%. The Direxion Daily Junior Gold Miners Index Bear 2X Shares returned 22.45%, while the model indicated an expected return of 19.75%.
The Direxion Daily Metal Miners Bull 2X Shares seeks to provide 200% of the daily return of the S&P Metals & Mining Select Industry Index. The S&P Metals & Mining Select Industry Index is a modified equal-weighted index that is designed to measure the performance of the equity securities of companies in the S&P Total Market Index that are classified by the Global Industry Classification Standard (GICS) as being in the metals and mining industry. The metals and mining industry includes companies in the following sub-industries: aluminum; coal & consumable fuels; copper; diversified metals & mining; gold; precious metals & minerals; silver; and steel. The Index does not include metal commodities. Since the Fund's inception on December 16, 2021, the S&P Metals & Mining Select Industry Index returned 18.31%. Given the daily investment objectives of the ETF and the path dependency of returns for longer periods, the annual return of the index alone should not generate expectations of annual performance of the ETF. Since Inception, the Direxion Daily Metal Miners Bull 2X Shares returned 17.60%, while the model indicated an expected return of 20.94%.
The Direxion Daily Oil Services Bull 2X Shares seeks to provide 200% of the daily return of the MVIS US Listed Oil Services 25 Index. The MVIS US Listed Oil Services 25 Index includes companies that have common stocks or depositary receipts listed on a U.S. stock exchange and that provide services to the oil industry. To be eligible for initial inclusion in the Index, companies must generate at least 50% of their revenues from providing services to upstream oil companies, such as those engaged primarily in providing oil equipment, oil services or oil drilling. Of the largest 50 such stocks by full market capitalization, the top 25 by free-float market capitalization and three-month average daily trading volume are included in the Index. Since the Fund's inception on January 20, 2022, the MVIS US Listed Oil Services 25 Index returned 34.89%. Given the daily investment objectives of the ETF and the path dependency of returns for longer periods, the annual return of the index alone should not generate expectations of annual performance of the ETF. Since inception, the Direxion Daily Oil Services Bull 2X Shares returned 46.21%, while the model indicated an expected return of 49.50%.
The Direxion Daily Robotics, Artificial Intelligence & Automation Index Bull 2X Shares sought to provide 200% of the daily return of the Indxx Global Robotics & Artificial Intelligence Thematic Index. The Indxx Global Robotics & Artificial Intelligence Thematic Index is designed to provide exposure to exchange-listed companies in developed markets that are expected to benefit from the adoption and utilization of robotics and/or artificial intelligence, including companies involved in developing industrial robots and production systems, automated inventory management, unmanned vehicles, voice/image/text recognition, and medical robots or robotic instruments, as defined by the index provider, Indxx. Companies must have a minimum market capitalization of $100 million and a minimum average daily turnover for the last 6 months greater than, or equal to, $2 million in order to be eligible for inclusion in the Index. For the Annual Period, the Indxx Global Robotics & Artificial Intelligence Thematic Index returned -47.16%. Given the daily investment objectives of the ETF and the path dependency of returns for longer periods, the annual return of the index alone should not generate expectations of annual performance of the ETF. The Direxion Daily Robotics, Artificial Intelligence & Automation Index Bull 2X Shares returned -76.73%, while the model indicated an expected return of -75.86%.
The Direxion Daily S&P Oil & Gas Exp. & Prod. Bull 2X Shares and the Direxion Daily S&P Oil & Gas Exp. & Prod. Bear 2X Shares seek to provide 200% and -200%, respectively, of the daily return of the S&P Oil & Gas Exploration & Production Select Industry Index. The S&P Oil & Gas Exploration & Production Select Industry Index is provided by Standard & Poor's
DIREXION ANNUAL REPORT
9
and includes domestic companies from the oil and gas exploration and production sub-industry. The index is designed to measure the performance of a sub-industry or group of sub-industries determined based on the Global Industry Classification Standards. For the Annual Period, the S&P Oil & Gas Exploration & Production Select Industry Index returned 46.11%. Given the daily investment objectives of the ETFs and the path dependency of returns for longer periods, the annual return of the index alone should not generate expectations of annual performance of the ETFs. The Direxion Daily S&P Oil & Gas Exp. & Prod. Bull 2X Shares returned 68.43%, while the model indicated an expected return of 73.04%. The Direxion Daily S&P Oil & Gas Exp. & Prod. Bear 2X Shares returned -74.40%, while the model indicated an expected return of -74.75%.
The Direxion Daily Select Large Caps & FANGs Bull 2X Shares seeks to provide 200% of the daily return of the ICE FANG 20 Index. The ICE FANG 20 Index is an equal weighted index designed to include Facebook, Apple, Amazon, Netflix and (Alphabet's) Google (i.e., the FANGs) and similar highly-traded growth stocks of technology and tech-enabled companies, such as Microsoft, from the information technology, communication services and consumer discretionary sectors. The Index consists of 20 stocks or depository receipts that are listed on a U.S. Exchange that have a minimum of a $5 billion market capitalization and a 6-month average daily trading value of at least $50 million. The Index selects companies whose economic fortunes are tied to technologies such as social networking, autonomous driving, electric vehicles, smartphones, mobile payments, e-commerce, online games, streaming media, online entertainment, cryptocurrencies, blockchain, big data, artificial intelligence, machine learning, digital advertising, cloud services and other innovative technologies. The Index is reconstituted and rebalanced quarterly. For the Annual Period, the ICE FANG 20 Index returned -54.53%. Given the daily investment objectives of the ETF and the path dependency of returns for longer periods, the annual return of the index alone should not generate expectations of annual performance of the ETF. The Direxion Daily Select Large Caps & FANGs Bull 2X Shares returned -84.62%, while the model indicated an expected return of -84.18%.
The Direxion Daily Software Bull 2X Shares seeks to provide 200% of the daily return of the S&P North American Expanded Technology Software Index. The S&P North American Expanded Technology Software Index measures the performance of the constituents of the S&P North American Technology Software Index (the "Underlying Index") as well as certain eligible supplemental stocks. The Underlying Index measures the performance of U.S. and Canadian stocks that are classified in the application software, systems software and home entertainment software sub-industries of the Global Industry Classification Standard (GICS) information technology sector. At its quarterly rebalances, the Index is weighted by float-adjusted market capitalization, subject to the following diversification requirements: (1) the weight of a single component cannot exceed 8.5%, and (2) the aggregate weight of the Index components with a weight greater than 4.5% cannot exceed 45%. Since the Fund's inception on December 16, 2021, the S&P North American Expanded Technology Software Index returned -33.17%. Given the daily investment objectives of the ETF and the path dependency of returns for longer periods, the annual return of the index alone should not generate expectations of annual performance of the ETF. Since inception, the Direxion Daily Software Bull 2X Shares returned -61.60%, while the model indicated an expected return of -60.58%.
The Direxion Daily TIPS Bull 2X Shares and the Direxion Daily TIPS Bear 2X Shares seek to provide 200% and -200%, respectively, of the daily return of the Solactive TIPS ETF Index. The Solactive TIPS ETF Index provides exposure to the iShares TIPS Bond ETF, which seeks to track the investment results of an index composed of inflation-protected U.S Treasury bonds, commonly known as "TIPS." TIPS are securities issued by the U.S. Treasury that are designed to provide inflation protection to investors. Since the Funds' inception on April 7, 2022, the Solactive TIPS ETF Index returned -8.29%. Given the daily investment objectives of the ETFs and the path dependency of returns for longer periods, the annual return of the index alone should not generate expectations of annual performance of the ETFs. Since inception, the Direxion Daily TIPS Bull 2X Shares returned -17.76%, while the model indicated an expected return of -16.31%. Since inception, the Direxion Daily TIPS Bear 2X Shares returned 19.60%, while the model indicated an expected return of 17.12%.
The Direxion Daily Travel & Vacation Bull 2X Shares seeks to provide 200% of the daily return of the BlueStar® Travel and Vacation Index. The BlueStar® Travel and Vacation Index is provided by MV Index Solutions GmbH and is comprised of US listed stocks, including depository receipts, of companies that are "Travel and Vacation" companies, as defined by the Index Provider. To be eligible for inclusion in the Index, a company must either (a) derive 25% or more of its revenue from, or devote 25% or more of its annual budget to, operating theme parks and/or hotels or (b) derive 50% or more of its revenue from, or devote 50% or more of its annual budget to the following activities: 1. Hotel accommodations; 2. Commercial airlines; 3. Casino resorts; 4. Hotel time shares; 5. Ski resorts; 6. Cruises; 7. Hotel real estate investment trusts; 8. Performing arts centers; 9. Online travel and event booking; 10. Specialty travel and experiences (such as outer
DIREXION ANNUAL REPORT
10
space passenger travel), and 11. Operation of theme parks. For the Annual Period, the BlueStar® Travel and Vacation Index returned -22.67%. Given the daily investment objectives of the ETF and the path dependency of returns for longer periods, the annual return of the index alone should not generate expectations of annual performance of the ETF. The Direxion Daily Travel & Vacation Bull 2X Shares returned -50.05%, while the model indicated an expected return of -48.68%.
The Direxion Daily US Infrastructure Bull 2X Shares seeks to provide 200% of the daily return of the Indxx US Infrastructure Index. The Indxx US Infrastructure Index is designed to track the performance of U.S. listed securities, including ADRs, of companies which are involved in infrastructure through engineering, design, maintenance, and construction of infrastructure projects. The Index Provider defines infrastructure as being comprised of Construction & Engineering Services and Industrial Transportation companies. Companies that derive a minimum of 50% of their total revenue from Construction & Engineering Services or Industrial Transportation are eligible for inclusion. The Index Provider screens companies based on various market capitalization and liquidity metrics and selects the top 100 securities by market capitalization. In case there are fewer than 100 securities in the selection list, all the securities will form the portfolio. The Index constituents are equally weighted and the Index is reconstituted and rebalanced annually. For the Annual Period, the Indxx US Infrastructure Index returned 1.96%. Given the daily investment objectives of the ETF and the path dependency of returns for longer periods, the annual return of the index alone should not generate expectations of annual performance of the ETF. The Direxion Daily US Infrastructure Bull 2X Shares returned -3.44%, while the model indicated an expected return of -1.28%.
Index Volatility:
The Annual Period was extremely volatile, leaving investors without a clear strategy, and no clear sector winner. Typically defensive stocks were not immune to the volatility, and the market cycles were moving unpredictably. The VIX Index, a measure of volatility and market sentiment, averaged 25.20 during the Annual Period, with a high of 36.45 in early March 2022, whereas the average for the previous five years was 20.94.
Index | | Return | | Volatility | |
CSI 300 Index | | | -36.09 | % | | | 24.75 | % | |
S&P 500® Index | | | -14.61 | % | | | 23.08 | % | |
CSI Overseas China Internet Index | | | -57.28 | % | | | 69.80 | % | |
S&P 500® Equal Weight Index1 | | | -9.94 | % | | | 23.52 | % | |
MSCI Brazil 25/50 Index | | | 24.55 | % | | | 34.69 | % | |
MSCI India Index | | | -6.89 | % | | | 21.67 | % | |
Indxx USA Cloud Computing Index | | | -46.98 | % | | | 41.87 | % | |
Indxx US Electric and Autonomous Vehicles Index2 | | | -36.07 | % | | | 49.84 | % | |
Energy Select Sector Index | | | 63.73 | % | | | 34.94 | % | |
Indxx US Fintech and Decentralized Finance Index1 | | | -23.74 | % | | | 34.94 | % | |
S&P Global Clean Energy Index | | | -24.04 | % | | | 38.85 | % | |
NYSE Arca Gold Miners Index | | | -22.19 | % | | | 32.56 | % | |
MVIS Global Junior Gold Miners Index | | | -30.47 | % | | | 42.86 | % | |
S&P Metals and Mining Select Industry Index3 | | | 18.31 | % | | | 40.87 | % | |
MVIS US Listed Oil Services 25 Index1 | | | 34.89 | % | | | 49.94 | % | |
Indxx Global Robotics & Artificial Intelligence Thematic Index | | | -47.16 | % | | | 34.44 | % | |
S&P Oil & Gas Exploration & Production Select Industry Index | | | 46.11 | % | | | 45.58 | % | |
ICE FANG 20 Index | | | -54.53 | % | | | 51.22 | % | |
S&P North American Expanded Technology Software Index3 | | | -33.17 | % | | | 37.68 | % | |
Solactive TIPS ETF Index4 | | | -8.29 | % | | | 9.37 | % | |
BlueStar® Travel and Vacation Index | | | -22.67 | % | | | 38.96 | % | |
Indxx US Infrastructure Index | | | 1.96 | % | | | 22.56 | % | |
1 January 20, 2022 through October 31, 2022
2 August 11, 2022 through October 31, 2022
3 December 16, 2021 through October 31, 2022
4 April 7, 2022 through October 31, 2022
DIREXION ANNUAL REPORT
11
As always, we thank you for using the Direxion Shares ETFs and we look forward to our mutual success.
Best Regards,

| | 
| |
Patrick Rudnick | | Corey Noltner | |
Principal Executive Officer | | Principal Financial Officer | |
An investor should carefully consider a Fund's investment objective, risks, charges, and expenses before investing. A Fund's prospectus and summary prospectus contain this and other information about the Direxion Shares. To obtain a Fund's prospectus and summary prospectus call 866-476-7523 or visit our website at direxion.com. A Fund's prospectus and summary prospectus should be read carefully before investing.
Investing in a Direxion Shares ETF may be more volatile than investing in broadly diversified funds. The use of leverage by an ETF increases the risk to the ETF. The Direxion Shares ETFs are not suitable for all investors and should be utilized only by sophisticated investors who understand leverage risk, consequences of seeking daily leveraged, or daily inverse leveraged, investment results and intend to actively monitor and manage their investment. The Direxion Shares ETFs are not designed to track their respective underlying indices over a period of time longer than one day.
The performance data quoted represents past performance. Past performance does not guarantee future results. The investment return and principal value of an investment will fluctuate. An investor's shares, when redeemed, may be worth more or less than their original cost. Current performance may be lower or higher than the performance quoted. Returns for performance under one year are cumulative, not annualized. For the most recent month-end performance please visit the Funds website at direxion.com.
Short-term performance, in particular, is not a good indication of the Fund's future performance, and an investment should not be made based solely on returns. Because of ongoing market volatility, Fund performance may be subject to substantial short-term changes. For additional information, see the Fund's prospectus.
Shares of the Direxion Shares are bought and sold at market price (not NAV) and are not individually redeemed from a Fund. Market Price returns are based upon the midpoint of the bid/ask spread at 4:00 pm EST (when NAV is normally calculated) and do not represent the returns you would receive if you traded shares at other times. Brokerage commissions will reduce returns. Fund returns assume that dividends and capital gains distributions have been reinvested in the Fund at NAV. Some performance results reflect expense reimbursements or recoupments and fee waivers in effect during certain periods shown. Absent these reimbursements or recoupments and fee waivers, results would have been less favorable.
LIBOR (London Interbank Offered Rate) is the average interest rate estimated by leading banks in London that they would be charged if borrowing from other banks.
Direxion Shares Risks – An investment in the ETFs involves risk, including the possible loss of principal. The ETFs are non-diversified and include risks associated with concentration risk that results from the ETFs' investments in a particular industry or sector which can increase volatility. The use of derivatives such as futures contracts, forward contracts, options and swaps are subject to market risks that may cause their price to fluctuate over time. The ETFs do not attempt to, and should not be expected to; provide returns which are a multiple of the return of their respective underlying index for periods other than a single day. For other risks including correlation, leverage, compounding, market volatility and specific risks regarding each sector, please read each ETF's prospectus.
DIREXION ANNUAL REPORT
12
The views of this letter were those of the Adviser as of October 31, 2022 and may not necessarily reflect its views on the date this letter is first published or anytime thereafter. These views are intended to help shareholders in understanding the ETFs' present investment methodology and do not constitute investment advice.
Distributed by: Foreside Fund Services, LLC
DIREXION ANNUAL REPORT
13
Letter to Single Stock Shareholders
Dear Shareholders,
This Annual Report for the Direxion Shares exchange traded funds (the "ETFs") covers the period from November 1, 2021 to October 31, 2022 (the "Annual Period").
Market Review:
Signs of broad-based inflation began in the fall of 2021, leading to a shaky global equity market environment. At the time, most experts predicted inflation levels were transitory, quelling investor concerns temporarily. Equity markets began to pick up through December, ending the year on a high. However, it soon became clear the widespread inflation was not going anywhere and the Federal Reserve announced an acceleration of monetary policy that was implemented through a series of interest rate hikes to combat inflation. Simultaneously, the highly contagious Covid-19 Omicron variant spread across the world and, despite high vaccination rates, breakthrough infections were at an all-time high. However, by the end of the Annual Period, Covid was far less of a concern for investors. Just as markets were looking up again, with the S&P 500 posting its first monthly gain in March 2022, Russia invaded Ukraine, and the effects of the invasion rippled across equity markets, as energy prices surged and fears of wider-spread conflict grew. In response, the United States and other western nations imposed extreme economic sanctions on Russia. Markets were very volatile on the heels of the Russian invasion, and the first two quarters of 2022 saw a shrinking U.S. GDP. June earnings reports were surprisingly strong, despite a mid-month S&P low. Despite these numbers, July was a strong month, but this positive sentiment did not last long. A hawkish speech from Federal Reserve Chair, Jerome Powell, in August negatively impacted markets around the world. September was another rough month for equities, with both the S&P 500 and NASDAQ dropping roughly 10%. Global markets fared no better, as the UK entered a recession, and China faced mass protests and unrest. October saw a modest increase in stocks as the Federal Reserve indicated it will pull back on its aggressive tightening in the near future after positive third quarter readings, but overall sentiment was still generally low. Investors are pivoting towards more risk-off investments in an attempt to navigate historic inflation levels, geopolitical conflict and high interest rates, although traditional safe haven investments, such as commodities, are less appealing than they have been in the past.
The U.S. bond market was in consistent decline for the majority of the Annual Period, oftentimes diverging from trends in the equities markets. In the fall, treasuries and international bonds were experiencing the worst performance of the Annual Period, as concerns over rising interest rates and inflation began. As inflation worsened and proved to be less transitory than initially predicted, central banks around the world pivoted towards more hawkish policies. In December, the Federal Reserve announced there would be three or four rate hikes throughout 2022, as well as a tapering of U.S. treasury asset purchases. In late February, the Russian invasion of Ukraine rippled through the global financial system, including fixed income markets. The U.S. Treasury yield curve started to flatten as the 10-20 year bond spread grew and became inverted. While bonds have typically been considered a way to hedge a portfolio against equities, this strategy has not typically held true in the current market environment. After the positive indication that the Federal Reserve is starting to get a handle on inflation, the global bond market saw a slight rebound, but the yield curve remained inverted at the end of the Annual Period, which remains a concern for many investors.
Direxion Shares Operational Review:
The discussion below relates to the performance of the ETFs for the Annual Period. The ETFs are leveraged or inverse and seek daily investment results, before fees and expenses, of 150% or -100% (opposite or inverse) of the performance of a particular security. All ETF returns are NAV (net asset value) returns.
The ETFs, as stated above, seek daily investment results. They do not seek to track a multiple of their respective underlying security for periods of longer than one day, and the performance of the ETFs over longer periods may not correlate to their underlying security's performance. The ETFs should not be held by investors for long periods, and should be used as short-term trading vehicles. These products are not suitable for all investors, and should be utilized only by sophisticated investors who understand the risks associated with the use of leverage, the consequences of seeking daily leveraged investment results and intend to actively monitor and manage their investments.
DIREXION ANNUAL REPORT
14
The ETFs with the word "Bull" in their name (the "Bull ETFs"), attempt to provide investment results that correlate to 150%, before fees and expenses, of the daily performance of an underlying security, meaning the Bull Funds attempt to move in the same direction as their respective target underlying security.
The Funds with the word "Bear" in their name (the "Bear ETFs"), attempt to provide investment results that correlate to -100%, before fees and expenses, of the daily performance of an underlying security, meaning that the Bear Funds attempt to move in the opposite, or inverse, direction of their respective target underlying security.
In seeking to achieve each ETF's daily investment results, Rafferty Asset Management, LLC ("Rafferty" or the "Adviser"), relies upon a pre-determined investment model to generate orders resulting in repositioning each ETF's investments in accordance with its daily investment objective. Using this approach, Rafferty determines the type, quantity and mix of investment positions that it believes in combination should produce daily returns consistent with an ETF's objective. As a consequence, if an ETF is performing as designed, the return of the underlying security will dictate the return for that ETF. Each ETF pursues its investment objective regardless of market conditions and does not take defensive positions.
Each ETF has a clearly articulated goal which requires the ETF to seek economic exposure significantly in excess of its net assets. To meet its objectives, each ETF invests in some combination of financial instruments, including derivatives. Each ETF invests significantly in derivatives, including swap agreements. Rafferty uses these types of investments to produce economically "leveraged" investment results. Leveraging allows Rafferty to generate a greater positive or negative return than what would be generated on the invested capital without leverage, thus changing small market movements into larger changes in the value of the investments of an ETF.
The ETFs may use certain investment techniques, including investments in derivatives, which may be considered aggressive. Investments in derivatives in general are subject to market risks that may cause their prices to fluctuate dramatically over time. Additionally, use of such instruments may increase the volatility of the ETFs. The use of derivatives may expose the ETFs to additional risks that they would not be subject to if they invested directly in the securities underlying those derivatives, such as counterparty risk. The use of derivatives may result in larger losses or smaller gains than otherwise would be the case.
Because each ETF seeks daily investment results of a particular underlying security, a comparison of the return of the ETF to the relevant common shares tells you little about whether an ETF has met its investment objective. To determine if an ETF has met its daily investment goals, Rafferty maintains models which indicate the expected performance of each ETF as compared to the respective underlying security. The models do not take into account the ETF's expense ratio or any transaction or trading fees associated with creating or maintaining an ETF's portfolio.
Factors Affecting Direxion Shares Performance:
Benchmark Performance – The daily performance of each ETF's underlying security, and the factors and market conditions implicitly affecting that underlying security, are the primary factors driving ETF performance. Given the daily goals, the series of daily underlying security returns are most important. The market conditions that affected the underlying security during the past year are described below.
Leverage – Each ETF seeks daily investment results (before fees and expenses) of either 150% (for the Bull ETFs) or -100% (for the Bear ETFs) of the performance of its respective underlying security. The use of leverage magnifies an ETF's gains or losses and increases the investment's risk and volatility. The Bear ETFs seek to achieve inverse magnified correlation to their respective underlying security.
Volatility and Compounding – The goal of leveraged ETFs is to provide a multiple of the daily return of a particular underlying security. Over periods longer than a single day, an ETF should not be expected to provide its respective multiple of the return of the particular underlying security. Due to the effects of compounding, a universal mathematical concept that applies to all investments, returns of the ETFs over longer periods are greater or less than the ETF's daily stated goal.
DIREXION ANNUAL REPORT
15
Periods of high volatility that lack a clear trend hurt an ETF's performance while trending, low volatility markets enhance an ETF's performance.
Cost of Financing – In order to attain leveraged exposure, a Bull ETF incurs a cost of SOFR plus or minus a spread and a Bear ETF receives SOFR plus or minus a spread as applied to the borrowed portion of the ETF's exposure. The spread varies by both Fund and counterparty and is a function of market demand, hedging costs, access to balance sheet, borrow volatility, current counterparty exposure and administrative costs associated with the swap counterparty. Generally for most of the Bull ETFs, the financing costs will have a negative effect on tracking, but for Bear ETFs, the financing cost will have a positive effect on tracking. An increase in interest rates which effects the cost of financing will further impact an ETF's performance and ability to track its underlying security.
Equity Dividends and Bond Interest – Equity Bull ETFs are positively impacted by equity and common shares dividends as the ETFs receive those payments. Equity Bear ETFs are negatively impacted as they are obligated to pay the dividends.
Fees, Expenses, and Transaction Costs – Fees and expenses are listed in each ETF's prospectus and may be higher than many traditional ETFs' fees, which cause a greater negative impact on ETF performance. Transactions costs are not included in the expense ratio of the ETFs. Transaction costs can be higher due to the ETF's use of leverage, frequent creation and redemption activity, or trading securities that are comparatively less liquid.
Direxion Shares Performance Review:
The Direxion Daily AAPL Bull 1.5X Shares and the Direxion Daily AAPL Bear 1X Shares seek to provide 150% and -100%, respectively, of the daily return of the common shares of Apple Inc. (NASDAQ: AAPL). Apple Inc. designs, manufactures, and markets smartphones, personal computers, tablets, wearables, and accessories worldwide. It also sells various related services. Since the Funds' inception on August 9, 2022, the common shares of Apple Inc. returned -6.99%. Given the daily investment objectives of the ETFs and the path dependency of returns for longer periods, the annual return of the common shares alone should not generate expectations of annual performance of the ETFs. The Direxion Daily AAPL Bull 1.5X Shares returned -12.48%, while the model indicated an expected return of -11.63%. The Direxion Daily AAPL Bear 1X Shares returned 4.95%, while the model indicated an expected return of 4.38%.
The Direxion Daily AMZN Bull 1.5X Shares and the Direxion Daily AMZN Bear 1X Shares seek to provide 150% and -100%, respectively, of the daily return of the common shares of Amazon.com, Inc. (NASDAQ: AMZN). Amazon.com, Inc. engages in the retail sale of consumer products and subscriptions in North America and internationally. The company operates through three segments: North America, International, and Amazon Web Services. Since the Funds' inception on September 7, 2022, the common shares of Amazon.com, Inc. returned -18.77%. Given the daily investment objectives of the ETFs and the path dependency of returns for longer periods, the annual return of the common shares alone should not generate expectations of annual performance of the ETFs. The Direxion Daily AMZN Bull 1.5X Shares returned -28.42%, while the model indicated an expected return of -30.54%. The Direxion Daily AMZN Bear 1X Shares returned 19.48%, while the model indicated an expected return of 22.20%.
The Direxion Daily GOOGL Bull 1.5X Shares and the Direxion Daily GOOGL Bear 1X Shares seek to provide 150% and -100%, respectively, of the daily return of the class A shares of Alphabet Inc. (NASDAQ: GOOGL). Alphabet Inc. provides online advertising services in the United States, Europe, the Middle East, Africa, the Asia-Pacific, Canada, and Latin America. Since the Funds' inception on September 7, 2022, the common shares of Alphabet Inc. returned -11.52%. Given the daily investment objectives of the ETFs and the path dependency of returns for longer periods, the annual return of the common shares alone should not generate expectations of annual performance of the ETFs. The Direxion Daily GOOGL Bull 1.5X Shares returned -18.30%, while the model indicated an expected return of -12.54%. The Direxion Daily GOOGL Bear 1X Shares returned 10.68%, while the model indicated an expected return of 13.01%.
The Direxion Daily MSFT Bull 1.5X Shares and the Direxion Daily MSFT Bear 1X Shares seek to provide 150% and -100%, respectively, of the daily return of the common shares of Microsoft Corporation (NASDAQ: MSFT). Microsoft Corporation develops, licenses, and supports software, services, devices, and solutions worldwide. Since the Funds' inception on
DIREXION ANNUAL REPORT
16
September 7, 2022, the common shares of Microsoft Corporation returned -8.34%. Given the daily investment objectives of the ETFs and the path dependency of returns for longer periods, the annual return of the common shares alone should not generate expectations of annual performance of the ETFs. The Direxion Daily MSFT Bull 1.5X Shares returned -13.82%, while the model indicated an expected return of -15.52%. The Direxion Daily MSFT Bear 1X Shares returned 6.88%, while the model indicated an expected return of 8.47%.
The Direxion Daily TSLA Bull 1.5X Shares and the Direxion Daily TSLA Bear 1X Shares seek to provide 150% and -100%, respectively, of the daily return of the common shares of Tesla, Inc. (NASDAQ: TSLA). Tesla, Inc. designs, manufactures and sells electric vehicles and electric vehicle powertrain components. Since the Funds' inception on August 9, 2022, the common shares of Tesla, Inc. returned -21.65%. Given the daily investment objectives of the ETFs and the path dependency of returns for longer periods, the annual return of the common shares alone should not generate expectations of annual performance of the ETFs. The Direxion Daily TSLA Bull 1.5X Shares returned -33.40%, while the model indicated an expected return of -29.72%. The Direxion Daily TSLA Bear 1X Shares returned 20.84%, while the model indicated an expected return of 17.21%.
Common Shares Volatility:
The Annual Period was extremely volatile, leaving investors without a clear strategy, and no clear sector winner. Typically defensive stocks were not immune to the volatility, and the market cycles were moving unpredictably. The VIX Index, a measure of volatility and market sentiment, averaged 25.20 during the Annual Period, with a high of 36.45 in early March 2022, whereas the average for the previous five years was 20.94.
Common Shares | | Return | | Volatility | |
Common shares of Apple Inc. (AAPL)1 | | | -6.99 | % | | | 36.60 | % | |
Common shares of Amazon.com, Inc. (AMZN)2 | | | -18.77 | % | | | 47.38 | % | |
Class A shares of Alphabet Inc. (GOOGL)2 | | | -11.52 | % | | | 41.12 | % | |
Common shares of Microsoft Corporation (MSFT)2 | | | -8.34 | % | | | 41.26 | % | |
Common shares of Tesla, Inc. (TSLA)1 | | | -21.65 | % | | | 52.01 | % | |
1 August 9, 2022 through October 31, 2022
2 September 7, 2022 through October 31, 2022
As always, we thank you for using the Direxion Shares ETFs and we look forward to our mutual success.
Best Regards,

| | 
| |
Patrick Rudnick | | Corey Noltner | |
Principal Executive Officer | | Principal Financial Officer | |
Investing in the funds involves a high degree of risk. Unlike traditional ETFs, or even other leveraged and/or inverse ETFs, these leveraged and/or inverse single-stock ETFs track the price of a single stock rather than an index, eliminating the benefits of diversification. Leveraged and inverse ETFs pursue daily leveraged investment objectives, which means they are riskier than alternatives which do not use leverage. They seek daily goals and should not be expected to track the underlying stock's performance over periods longer than one day. They are not suitable for all investors and should be utilized only by investors who understand leverage risk and who actively manage their investments. The Funds will lose money if the underlying stock's performance is flat, and it is possible that the Bull Fund will lose money even if the underlying stock's performance increases, and the
DIREXION ANNUAL REPORT
17
Bear Fund will lose money even if the underlying stock's performance decreases, over a period longer than a single day. An investor could lose the full principal value of his or her investment in a single day.
An investor should carefully consider a Fund's investment objective, risks, charges, and expenses before investing. A Fund's prospectus and summary prospectus contain this and other information about the Direxion Shares. To obtain a Fund's prospectus and summary prospectus call 866-476-7523 or visit our website at direxion.com. A Fund's prospectus and summary prospectus should be read carefully before investing.
Shares of the Direxion Shares are bought and sold at market price (not NAV) and are not individually redeemed from a Fund. Market Price returns are based upon the midpoint of the bid/ask spread at 4:00 pm EST (when NAV is normally calculated) and do not represent the returns you would receive if you traded shares at other times. Brokerage commissions will reduce returns. Fund returns assume that dividends and capital gains distributions have been reinvested in the Fund at NAV. Some performance results reflect expense reimbursements or recoupments and fee waivers in effect during certain periods shown. Absent these reimbursements or recoupments and fee waivers, results would have been less favorable.
Direxion Shares ETF Risks – An investment in the ETFs involves risk, including the possible loss of principal. The ETFs are non-diversified and include risks associated with concentration that results from an ETF's investments in a particular company, which can increase volatility. The use of derivatives such as futures contracts and swaps are subject to market risks that may cause their price to fluctuate over time. The ETFs do not attempt to, and should not be expected to, provide returns which are a multiple of the return of their respective underlying security for periods other than a single day. For other risks including leverage, correlation, daily compounding, market volatility and risks specific to an industry, sector, or company, please read each ETF's prospectus.
The views of this letter were those of the Adviser as of October 31, 2022 and may not necessarily reflect its views on the date this letter is first published or anytime thereafter. These views are intended to help shareholders in understanding the ETFs' present investment methodology and do not constitute investment advice.
Distributed by: Foreside Fund Services, LLC
DIREXION ANNUAL REPORT
18
Direxion Daily CSI 300 China A Share Bear 1X Shares
Performance Summary (Unaudited)
June 17, 20151 - October 31, 2022

| | | Average Annual Total Return2 | |
| | | 1 Year | | 3 Years | | 5 Years | | Since Inception | |
Direxion Daily CSI 300 China A Share
Bear 1X Shares (NAV) | | | 45.10 | % | | | -6.12 | % | | | -4.58 | % | | | -6.00 | % | |
Direxion Daily CSI 300 China A Share
Bear 1X Shares (Market Price) | | | 45.19 | % | | | -6.10 | % | | | -4.56 | % | | | -6.00 | % | |
CSI 300 Index | | | -36.09 | % | | | -2.71 | % | | | -2.63 | % | | | -5.09 | % | |
The performance data quoted represents past performance; past performance does not guarantee future results; the investment return and principal value of an investment will fluctuate; an investor's shares, when redeemed, may be worth more or less than their original cost; current performance may be lower or higher than the performance quoted. As stated in the current prospectus, the Fund's total annual fund operating expense ratio (gross) is 0.76%. Rafferty Asset Management, LLC has contractually agreed to waive all or a portion of its management fee and/or reimburse the Fund for other expenses through September 1, 2024 to the extent the Total Annual Operating Expenses exceed 0.80% (excluding, as applicable, among other expenses, taxes, swap financing and related costs, acquired fund fees and expenses, dividends or interest on short positions, other interest expenses, brokerage commissions and extraordinary expenses). The performance table and graph do not reflect the deduction of taxes that a shareholder would pay on Fund distributions or the redemption of Fund shares. For the Fund's most recent month end performance please visit www.direxion.com.
A fund that meets its daily target over a period of time will not necessarily produce the returns that might be expected in light of the returns of its index or benchmark for that period. Differences may result from the compounding effect of market fluctuation, the use of leverage and a Bear Fund's inverse correlation. The pursuit of daily goals may result in daily, leveraged compounding, which means that the return of an index over a period of time greater than one day multiplied by a fund's specified inverse multiple (-100%) will not generally equal a fund's performance over that same period.
This chart illustrates the performance of a hypothetical $10,000 investment made on the Fund's inception and is not intended to imply any future performance. Shares of Direxion Shares are bought and sold at market price (not NAV) and are not individually redeemed from the Fund. Performance reflects reinvestment of all dividend and capital gains distributions. During this period, some of the Fund's fees were waived and/or expenses reimbursed; otherwise, the Fund's performance would have been lower.
The CSI 300 Index is a modified free-float market capitalization weighted index comprised of the largest and most liquid stocks in the Chinese A-share market. Index constituent stocks must have been listed for more than three months (unless the stock's average daily A-share market capitalization since its initial listing ranks among the top 30 of all A-shares) and must not be experiencing obvious abnormal fluctuations or market manipulations. Investors cannot invest directly in an index, although they can invest in its underlying securities.
Market Exposure
The Fund seeks daily exposure of -100% of its NAV through derivatives. "Market Exposure" includes the value of total investments (including the contract value of any derivatives) and excludes any short-term investments and cash equivalents divided by Net Assets.
1 Commencement of operations.
2 As of October 31, 2022.
DIREXION ANNUAL REPORT
19
Direxion Daily S&P 500® Bear 1X Shares
Performance Summary (Unaudited)
June 8, 20161 - October 31, 2022

| | | Average Annual Total Return2 | |
| | | 1 Year | | 3 Years | | 5 Years | | Since Inception | |
Direxion Daily S&P 500® Bear 1X Shares
(NAV) | | | 12.88 | % | | | -13.95 | % | | | -11.76 | % | | | -12.42 | % | |
Direxion Daily S&P 500® Bear 1X Shares
(Market Price) | | | 12.94 | % | | | -13.95 | % | | | -11.75 | % | | | -12.41 | % | |
S&P 500® Index | | | -14.61 | % | | | 10.22 | % | | | 10.44 | % | | | 11.96 | % | |
The performance data quoted represents past performance; past performance does not guarantee future results; the investment return and principal value of an investment will fluctuate; an investor's shares, when redeemed, may be worth more or less than their original cost; current performance may be lower or higher than the performance quoted. As stated in the current prospectus, the Fund's total annual fund operating expense ratio (gross) is 0.55%. Rafferty Asset Management, LLC has contractually agreed to waive all or a portion of its management fee and/or reimburse the Fund for other expenses through September 1, 2024 to the extent the Total Annual Operating Expenses exceed 0.45% (excluding, as applicable, among other expenses, taxes, swap financing and related costs, acquired fund fees and expenses, dividends or interest on short positions, other interest expenses, brokerage commissions and extraordinary expenses). The performance table and graph do not reflect the deduction of taxes that a shareholder would pay on Fund distributions or the redemption of Fund shares. For the Fund's most recent month end performance please visit www.direxion.com.
A fund that meets its daily target over a period of time will not necessarily produce the returns that might be expected in light of the returns of its index or benchmark for that period. Differences may result from the compounding effect of market fluctuation, the use of leverage and a Bear Fund's inverse correlation. The pursuit of daily goals may result in daily, leveraged compounding, which means that the return of an index over a period of time greater than one day multiplied by a fund's specified inverse multiple (-100%) will not generally equal a fund's performance over that same period.
This chart illustrates the performance of a hypothetical $10,000 investment made on the Fund's inception and is not intended to imply any future performance. Shares of Direxion Shares are bought and sold at market price (not NAV) and are not individually redeemed from the Fund. Performance reflects reinvestment of all dividend and capital gains distributions. During this period, some of the Fund's fees were waived and/or expenses reimbursed; otherwise, the Fund's performance would have been lower.
The S&P 500® Index is a capitalization-weighted index composed of 500 domestic common stocks. Most of the common stocks in the S&P 500® Index are issued by the 500 largest companies, in terms of the aggregate market value of their outstanding stock, and are generally listed on the New York Stock Exchange. The performance of the S&P 500® Index does not reflect the deduction of fees associated with the Fund, such as investment management fees. Investors cannot invest directly in an index, although they can invest in its underlying securities.
Market Exposure
The Fund seeks daily exposure of -100% of its NAV through derivatives. "Market Exposure" includes the value of total investments (including the contract value of any derivatives) and excludes any short-term investments and cash equivalents divided by Net Assets.
1 Commencement of operations.
2 As of October 31, 2022.
DIREXION ANNUAL REPORT
20
Direxion Daily AAPL Bear 1X Shares
Performance Summary (Unaudited)
August 9, 20221 - October 31, 2022
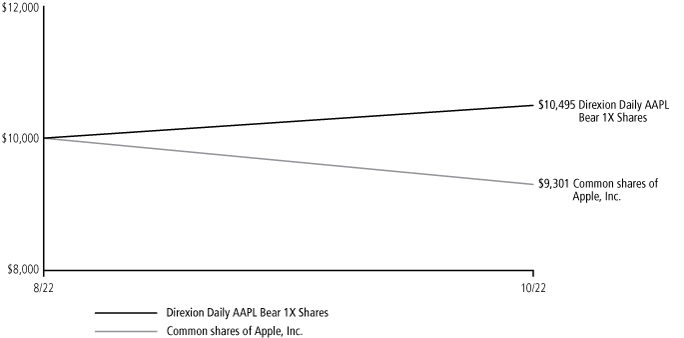
| | Total Return2 | |
| | | Since Inception | |
Direxion Daily AAPL Bear 1X Shares (NAV) | | | 4.95 | % | |
Direxion Daily AAPL Bear 1X Shares (Market Price) | | | 4.91 | % | |
Common shares of Apple, Inc. | | | -6.99 | % | |
The performance data quoted represents past performance; past performance does not guarantee future results; the investment return and principal value of an investment will fluctuate; an investor's shares, when redeemed, may be worth more or less than their original cost; current performance may be lower or higher than the performance quoted. As stated in the current prospectus, the Fund's total annual operating expense ratio (gross) is 0.99%. Rafferty Asset Management, LLC has contractually agreed to waive all or a portion of its management fee and/or reimburse the Fund for other expenses through September 1, 2024 to the extent the Total Annual Operating Expenses exceed 0.95% (excluding, as applicable, among other expenses, taxes, swap financing and related costs, acquired fund fees and expenses, dividends or interest on short positions, other interest expenses, brokerage commissions and extraordinary expenses). The performance table and graph do not reflect the deduction of taxes that a shareholder would pay on Fund distributions or the redemption of Fund shares. For the Fund's most recent month end performance please visit www.direxion.com.
A fund that meets its daily target over a period of time will not necessarily produce the returns that might be expected in light of the returns of its index or benchmark for that period. Differences may result from the compounding effect of market fluctuation and the use of leverage. The pursuit of daily goals may result in daily, leveraged compounding, which means that the return of an index over a period of time greater than one day multiplied by a fund's specified multiple (-100%) will not generally equal a fund's performance over that same period.
This chart illustrates the performance of a hypothetical $10,000 investment made on the Fund's inception and is not intended to imply any future performance. Shares of Direxion Shares are bought and sold at market price (not NAV) and are not individually redeemed from the Fund. Performance reflects reinvestment of all dividend and capital gains distributions. During this period, some of the Fund's fees were waived and/or expenses reimbursed; otherwise, the Fund's performance would have been lower.
The Fund seeks daily inverse investment results, before fees and expenses, of 100% of the inverse (or opposite) of the performance of the common shares of Apple, Inc. stock (NASDAQ: AAPL).
Market Exposure
The Fund seeks daily exposure of -100% of its NAV through a combination of equities and derivatives. "Market Exposure" includes the value of total investments (including the contract value of any derivatives) and excludes any short-term investments and cash equivalents divided by Net Assets.
1 Commencement of operations.
2 As of October 31, 2022.
DIREXION ANNUAL REPORT
21
Direxion Daily AMZN Bear 1X Shares
Performance Summary (Unaudited)
September 7, 20221 - October 31, 2022

| | Total Return2 | |
| | | Since Inception | |
Direxion Daily AMZN Bear 1X Shares (NAV) | | | 19.48 | % | |
Direxion Daily AMZN Bear 1X Shares (Market Price) | | | 19.44 | % | |
Common shares of Amazon, Inc. | | | -18.77 | % | |
The performance data quoted represents past performance; past performance does not guarantee future results; the investment return and principal value of an investment will fluctuate; an investor's shares, when redeemed, may be worth more or less than their original cost; current performance may be lower or higher than the performance quoted. As stated in the current prospectus, the Fund's total annual operating expense ratio (gross) is 0.99%. Rafferty Asset Management, LLC has contractually agreed to waive all or a portion of its management fee and/or reimburse the Fund for other expenses through September 1, 2024 to the extent the Total Annual Operating Expenses exceed 0.95% (excluding, as applicable, among other expenses, taxes, swap financing and related costs, acquired fund fees and expenses, dividends or interest on short positions, other interest expenses, brokerage commissions and extraordinary expenses). The performance table and graph do not reflect the deduction of taxes that a shareholder would pay on Fund distributions or the redemption of Fund shares. For the Fund's most recent month end performance please visit www.direxion.com.
A fund that meets its daily target over a period of time will not necessarily produce the returns that might be expected in light of the returns of its index or benchmark for that period. Differences may result from the compounding effect of market fluctuation and the use of leverage. The pursuit of daily goals may result in daily, leveraged compounding, which means that the return of an index over a period of time greater than one day multiplied by a fund's specified multiple (-100%) will not generally equal a fund's performance over that same period.
This chart illustrates the performance of a hypothetical $10,000 investment made on the Fund's inception and is not intended to imply any future performance. Shares of Direxion Shares are bought and sold at market price (not NAV) and are not individually redeemed from the Fund. Performance reflects reinvestment of all dividend and capital gains distributions. During this period, some of the Fund's fees were waived and/or expenses reimbursed; otherwise, the Fund's performance would have been lower.
The Fund seeks daily inverse investment results, before fees and expenses, of 100% of the inverse (or opposite) of the performance of the common shares of Amazon.com, Inc. stock (NASDAQ: AMZN).
Market Exposure
The Fund seeks daily exposure of -100% of its NAV through a combination of equities and derivatives. "Market Exposure" includes the value of total investments (including the contract value of any derivatives) and excludes any short-term investments and cash equivalents divided by Net Assets.
1 Commencement of operations.
2 As of October 31, 2022.
DIREXION ANNUAL REPORT
22
Direxion Daily GOOGL Bear 1X Shares
Performance Summary (Unaudited)
September 7, 20221 - October 31, 2022

| | Total Return2 | |
| | | Since Inception | |
Direxion Daily GOOGL Bear 1X Shares (NAV) | | | 10.68 | % | |
Direxion Daily GOOGL Bear 1X Shares (Market Price) | | | 10.80 | % | |
Common shares of Alphabet, Inc. Class A | | | -11.52 | % | |
The performance data quoted represents past performance; past performance does not guarantee future results; the investment return and principal value of an investment will fluctuate; an investor's shares, when redeemed, may be worth more or less than their original cost; current performance may be lower or higher than the performance quoted. As stated in the current prospectus, the Fund's total annual operating expense ratio (gross) is 0.99%. Rafferty Asset Management, LLC has contractually agreed to waive all or a portion of its management fee and/or reimburse the Fund for other expenses through September 1, 2024 to the extent the Total Annual Operating Expenses exceed 0.95% (excluding, as applicable, among other expenses, taxes, swap financing and related costs, acquired fund fees and expenses, dividends or interest on short positions, other interest expenses, brokerage commissions and extraordinary expenses). The performance table and graph do not reflect the deduction of taxes that a shareholder would pay on Fund distributions or the redemption of Fund shares. For the Fund's most recent month end performance please visit www.direxion.com.
A fund that meets its daily target over a period of time will not necessarily produce the returns that might be expected in light of the returns of its index or benchmark for that period. Differences may result from the compounding effect of market fluctuation and the use of leverage. The pursuit of daily goals may result in daily, leveraged compounding, which means that the return of an index over a period of time greater than one day multiplied by a fund's specified multiple (-100%) will not generally equal a fund's performance over that same period.
This chart illustrates the performance of a hypothetical $10,000 investment made on the Fund's inception and is not intended to imply any future performance. Shares of Direxion Shares are bought and sold at market price (not NAV) and are not individually redeemed from the Fund. Performance reflects reinvestment of all dividend and capital gains distributions. During this period, some of the Fund's fees were waived and/or expenses reimbursed; otherwise, the Fund's performance would have been lower.
The Fund seeks daily inverse investment results, before fees and expenses, of 100% of the inverse (or opposite) of the performance of the common shares of Alphabet, Inc. stock (NASDAQ: GOOGL).
Market Exposure
The Fund seeks daily exposure of -100% of its NAV through a combination of equities and derivatives. "Market Exposure" includes the value of total investments (including the contract value of any derivatives) and excludes any short-term investments and cash equivalents divided by Net Assets.
1 Commencement of operations.
2 As of October 31, 2022.
DIREXION ANNUAL REPORT
23
Direxion Daily MSFT Bear 1X Shares
Performance Summary (Unaudited)
September 7, 20221 - October 31, 2022

| | Total Return2 | |
| | | Since Inception | |
Direxion Daily MSFT Bear 1X Shares (NAV) | | | 6.88 | % | |
Direxion Daily MSFT Bear 1X Shares (Market Price) | | | 6.91 | % | |
Common shares of Microsoft Corp. | | | -8.34 | % | |
The performance data quoted represents past performance; past performance does not guarantee future results; the investment return and principal value of an investment will fluctuate; an investor's shares, when redeemed, may be worth more or less than their original cost; current performance may be lower or higher than the performance quoted. As stated in the current prospectus, the Fund's total annual operating expense ratio (gross) is 0.99%. Rafferty Asset Management, LLC has contractually agreed to waive all or a portion of its management fee and/or reimburse the Fund for other expenses through September 1, 2024 to the extent the Total Annual Operating Expenses exceed 0.95% (excluding, as applicable, among other expenses, taxes, swap financing and related costs, acquired fund fees and expenses, dividends or interest on short positions, other interest expenses, brokerage commissions and extraordinary expenses). The performance table and graph do not reflect the deduction of taxes that a shareholder would pay on Fund distributions or the redemption of Fund shares. For the Fund's most recent month end performance please visit www.direxion.com.
A fund that meets its daily target over a period of time will not necessarily produce the returns that might be expected in light of the returns of its index or benchmark for that period. Differences may result from the compounding effect of market fluctuation and the use of leverage. The pursuit of daily goals may result in daily, leveraged compounding, which means that the return of an index over a period of time greater than one day multiplied by a fund's specified multiple (-100%) will not generally equal a fund's performance over that same period.
This chart illustrates the performance of a hypothetical $10,000 investment made on the Fund's inception and is not intended to imply any future performance. Shares of Direxion Shares are bought and sold at market price (not NAV) and are not individually redeemed from the Fund. Performance reflects reinvestment of all dividend and capital gains distributions. During this period, some of the Fund's fees were waived and/or expenses reimbursed; otherwise, the Fund's performance would have been lower.
The Fund seeks daily inverse investment results, before fees and expenses, of 100% of the inverse (or opposite) of the performance of the common shares of Microsoft Corp. stock (NASDAQ: MSFT).
Market Exposure
The Fund seeks daily exposure of -100% of its NAV through a combination of equities and derivatives. "Market Exposure" includes the value of total investments (including the contract value of any derivatives) and excludes any short-term investments and cash equivalents divided by Net Assets.
1 Commencement of operations.
2 As of October 31, 2022.
DIREXION ANNUAL REPORT
24
Direxion Daily TSLA Bear 1X Shares
Performance Summary (Unaudited)
August 9, 20221 - October 31, 2022

| | Total Return2 | |
| | | Since Inception | |
Direxion Daily TSLA Bear 1X Shares (NAV) | | | 20.84 | % | |
Direxion Daily TSLA Bear 1X Shares (Market Price) | | | 20.76 | % | |
Common shares of Tesla, Inc. | | | -21.65 | % | |
The performance data quoted represents past performance; past performance does not guarantee future results; the investment return and principal value of an investment will fluctuate; an investor's shares, when redeemed, may be worth more or less than their original cost; current performance may be lower or higher than the performance quoted. As stated in the current prospectus, the Fund's total annual operating expense ratio (gross) is 0.99%. Rafferty Asset Management, LLC has contractually agreed to waive all or a portion of its management fee and/or reimburse the Fund for other expenses through September 1, 2024 to the extent the Total Annual Operating Expenses exceed 0.95% (excluding, as applicable, among other expenses, taxes, swap financing and related costs, acquired fund fees and expenses, dividends or interest on short positions, other interest expenses, brokerage commissions and extraordinary expenses). The performance table and graph do not reflect the deduction of taxes that a shareholder would pay on Fund distributions or the redemption of Fund shares. For the Fund's most recent month end performance please visit www.direxion.com.
A fund that meets its daily target over a period of time will not necessarily produce the returns that might be expected in light of the returns of its index or benchmark for that period. Differences may result from the compounding effect of market fluctuation and the use of leverage. The pursuit of daily goals may result in daily, leveraged compounding, which means that the return of an index over a period of time greater than one day multiplied by a fund's specified multiple (-100%) will not generally equal a fund's performance over that same period.
This chart illustrates the performance of a hypothetical $10,000 investment made on the Fund's inception and is not intended to imply any future performance. Shares of Direxion Shares are bought and sold at market price (not NAV) and are not individually redeemed from the Fund. Performance reflects reinvestment of all dividend and capital gains distributions. During this period, some of the Fund's fees were waived and/or expenses reimbursed; otherwise, the Fund's performance would have been lower.
The Fund seeks daily inverse investment results, before fees and expenses, of 100% of the inverse (or opposite) of the performance of the common shares of Tesla, Inc. stock (NASDAQ: TSLA).
Market Exposure
The Fund seeks daily exposure of -100% of its NAV through a combination of equities and derivatives. "Market Exposure" includes the value of total investments (including the contract value of any derivatives) and excludes any short-term investments and cash equivalents divided by Net Assets.
1 Commencement of operations.
2 As of October 31, 2022.
DIREXION ANNUAL REPORT
25
Direxion Daily AAPL Bull 1.5X Shares
Performance Summary (Unaudited)
August 9, 20221 - October 31, 2022

| | Total Return2 | |
| | | Since Inception | |
Direxion Daily AAPL Bull 1.5X Shares (NAV) | | | -12.48 | % | |
Direxion Daily AAPL Bull 1.5X Shares (Market Price) | | | -12.40 | % | |
Common shares of Apple, Inc. | | | -6.99 | % | |
The performance data quoted represents past performance; past performance does not guarantee future results; the investment return and principal value of an investment will fluctuate; an investor's shares, when redeemed, may be worth more or less than their original cost; current performance may be lower or higher than the performance quoted. As stated in the current prospectus, the Fund's total annual operating expense ratio (gross) is 0.99%. Rafferty Asset Management, LLC has contractually agreed to waive all or a portion of its management fee and/or reimburse the Fund for other expenses through September 1, 2024 to the extent the Total Annual Operating Expenses exceed 0.95% (excluding, as applicable, among other expenses, taxes, swap financing and related costs, acquired fund fees and expenses, dividends or interest on short positions, other interest expenses, brokerage commissions and extraordinary expenses). The performance table and graph do not reflect the deduction of taxes that a shareholder would pay on Fund distributions or the redemption of Fund shares. For the Fund's most recent month end performance please visit www.direxion.com.
A fund that meets its daily target over a period of time will not necessarily produce the returns that might be expected in light of the returns of its index or benchmark for that period. Differences may result from the compounding effect of market fluctuation and the use of leverage. The pursuit of daily goals may result in daily, leveraged compounding, which means that the return of an index over a period of time greater than one day multiplied by a fund's specified multiple (150%) will not generally equal a fund's performance over that same period.
This chart illustrates the performance of a hypothetical $10,000 investment made on the Fund's inception and is not intended to imply any future performance. Shares of Direxion Shares are bought and sold at market price (not NAV) and are not individually redeemed from the Fund. Performance reflects reinvestment of all dividend and capital gains distributions. During this period, some of the Fund's fees were waived and/or expenses reimbursed; otherwise, the Fund's performance would have been lower.
The Fund seeks daily inverse investment results, before fees and expenses, of 150% of the performance of the common shares of Apple, Inc. stock (NASDAQ: AAPL).
Market Exposure
The Fund seeks daily exposure of 150% of its NAV through a combination of equities and derivatives. "Market Exposure" includes the value of total investments (including the contract value of any derivatives) and excludes any short-term investments and cash equivalents divided by Net Assets.
1 Commencement of operations.
2 As of October 31, 2022.
DIREXION ANNUAL REPORT
26
Direxion Daily AMZN Bull 1.5X Shares
Performance Summary (Unaudited)
September 7, 20221 - October 31, 2022

| | Total Return2 | |
| | | Since Inception | |
Direxion Daily AMZN Bull 1.5X Shares (NAV) | | | -28.42 | % | |
Direxion Daily AMZN Bull 1.5X Shares (Market Price) | | | -28.46 | % | |
Common shares of Amazon, Inc. | | | -18.77 | % | |
The performance data quoted represents past performance; past performance does not guarantee future results; the investment return and principal value of an investment will fluctuate; an investor's shares, when redeemed, may be worth more or less than their original cost; current performance may be lower or higher than the performance quoted. As stated in the current prospectus, the Fund's total annual operating expense ratio (gross) is 0.99%. Rafferty Asset Management, LLC has contractually agreed to waive all or a portion of its management fee and/or reimburse the Fund for other expenses through September 1, 2024 to the extent the Total Annual Operating Expenses exceed 0.95% (excluding, as applicable, among other expenses, taxes, swap financing and related costs, acquired fund fees and expenses, dividends or interest on short positions, other interest expenses, brokerage commissions and extraordinary expenses). The performance table and graph do not reflect the deduction of taxes that a shareholder would pay on Fund distributions or the redemption of Fund shares. For the Fund's most recent month end performance please visit www.direxion.com.
A fund that meets its daily target over a period of time will not necessarily produce the returns that might be expected in light of the returns of its index or benchmark for that period. Differences may result from the compounding effect of market fluctuation and the use of leverage. The pursuit of daily goals may result in daily, leveraged compounding, which means that the return of an index over a period of time greater than one day multiplied by a fund's specified multiple (150%) will not generally equal a fund's performance over that same period.
This chart illustrates the performance of a hypothetical $10,000 investment made on the Fund's inception and is not intended to imply any future performance. Shares of Direxion Shares are bought and sold at market price (not NAV) and are not individually redeemed from the Fund. Performance reflects reinvestment of all dividend and capital gains distributions. During this period, some of the Fund's fees were waived and/or expenses reimbursed; otherwise, the Fund's performance would have been lower.
The Fund seeks daily inverse investment results, before fees and expenses, of 150% of the performance of the common shares of Amazon.com, Inc. stock (NASDAQ: AMZN).
Market Exposure
The Fund seeks daily exposure of 150% of its NAV through a combination of equities and derivatives. "Market Exposure" includes the value of total investments (including the contract value of any derivatives) and excludes any short-term investments and cash equivalents divided by Net Assets.
1 Commencement of operations.
2 As of October 31, 2022.
DIREXION ANNUAL REPORT
27
Direxion Daily GOOGL Bull 1.5X Shares
Performance Summary (Unaudited)
September 7, 20221 - October 31, 2022

| | Total Return2 | |
| | | Since Inception | |
Direxion Daily GOOGL Bull 1.5X Shares (NAV) | | | -18.30 | % | |
Direxion Daily GOOGL Bull 1.5X Shares (Market Price) | | | -18.42 | % | |
Common shares of Alphabet, Inc. Class A | | | -11.52 | % | |
The performance data quoted represents past performance; past performance does not guarantee future results; the investment return and principal value of an investment will fluctuate; an investor's shares, when redeemed, may be worth more or less than their original cost; current performance may be lower or higher than the performance quoted. As stated in the current prospectus, the Fund's total annual operating expense ratio (gross) is 0.99%. Rafferty Asset Management, LLC has contractually agreed to waive all or a portion of its management fee and/or reimburse the Fund for other expenses through September 1, 2024 to the extent the Total Annual Operating Expenses exceed 0.95% (excluding, as applicable, among other expenses, taxes, swap financing and related costs, acquired fund fees and expenses, dividends or interest on short positions, other interest expenses, brokerage commissions and extraordinary expenses). The performance table and graph do not reflect the deduction of taxes that a shareholder would pay on Fund distributions or the redemption of Fund shares. For the Fund's most recent month end performance please visit www.direxion.com.
A fund that meets its daily target over a period of time will not necessarily produce the returns that might be expected in light of the returns of its index or benchmark for that period. Differences may result from the compounding effect of market fluctuation and the use of leverage. The pursuit of daily goals may result in daily, leveraged compounding, which means that the return of an index over a period of time greater than one day multiplied by a fund's specified multiple (150%) will not generally equal a fund's performance over that same period.
This chart illustrates the performance of a hypothetical $10,000 investment made on the Fund's inception and is not intended to imply any future performance. Shares of Direxion Shares are bought and sold at market price (not NAV) and are not individually redeemed from the Fund. Performance reflects reinvestment of all dividend and capital gains distributions. During this period, some of the Fund's fees were waived and/or expenses reimbursed; otherwise, the Fund's performance would have been lower.
The Fund seeks daily inverse investment results, before fees and expenses, of 150% of the performance of the common shares of Alphabet, Inc. stock (NASDAQ: GOOGL).
Market Exposure
The Fund seeks daily exposure of 150% of its NAV through a combination of equities and derivatives. "Market Exposure" includes the value of total investments (including the contract value of any derivatives) and excludes any short-term investments and cash equivalents divided by Net Assets.
1 Commencement of operations.
2 As of October 31, 2022.
DIREXION ANNUAL REPORT
28
Direxion Daily MSFT Bull 1.5X Shares
Performance Summary (Unaudited)
September 7, 20221 - October 31, 2022

| | Total Return2 | |
| | | Since Inception | |
Direxion Daily MSFT Bull 1.5X Shares (NAV) | | | -13.82 | % | |
Direxion Daily MSFT Bull 1.5X Shares (Market Price) | | | -13.86 | % | |
Common shares of Microsoft Corp. | | | -8.34 | % | |
The performance data quoted represents past performance; past performance does not guarantee future results; the investment return and principal value of an investment will fluctuate; an investor's shares, when redeemed, may be worth more or less than their original cost; current performance may be lower or higher than the performance quoted. As stated in the current prospectus, the Fund's total annual operating expense ratio (gross) is 0.99%. Rafferty Asset Management, LLC has contractually agreed to waive all or a portion of its management fee and/or reimburse the Fund for other expenses through September 1, 2024 to the extent the Total Annual Operating Expenses exceed 0.95% (excluding, as applicable, among other expenses, taxes, swap financing and related costs, acquired fund fees and expenses, dividends or interest on short positions, other interest expenses, brokerage commissions and extraordinary expenses). The performance table and graph do not reflect the deduction of taxes that a shareholder would pay on Fund distributions or the redemption of Fund shares. For the Fund's most recent month end performance please visit www.direxion.com.
A fund that meets its daily target over a period of time will not necessarily produce the returns that might be expected in light of the returns of its index or benchmark for that period. Differences may result from the compounding effect of market fluctuation and the use of leverage. The pursuit of daily goals may result in daily, leveraged compounding, which means that the return of an index over a period of time greater than one day multiplied by a fund's specified multiple (150%) will not generally equal a fund's performance over that same period.
This chart illustrates the performance of a hypothetical $10,000 investment made on the Fund's inception and is not intended to imply any future performance. Shares of Direxion Shares are bought and sold at market price (not NAV) and are not individually redeemed from the Fund. Performance reflects reinvestment of all dividend and capital gains distributions. During this period, some of the Fund's fees were waived and/or expenses reimbursed; otherwise, the Fund's performance would have been lower.
The Fund seeks daily inverse investment results, before fees and expenses, of 150% of the performance of the common shares of Microsoft Corp. stock (NASDAQ: MSFT).
Market Exposure
The Fund seeks daily exposure of 150% of its NAV through a combination of equities and derivatives. "Market Exposure" includes the value of total investments (including the contract value of any derivatives) and excludes any short-term investments and cash equivalents divided by Net Assets.
1 Commencement of operations.
2 As of October 31, 2022.
DIREXION ANNUAL REPORT
29
Direxion Daily TSLA Bull 1.5X Shares
Performance Summary (Unaudited)
August 9, 20221 - October 31, 2022
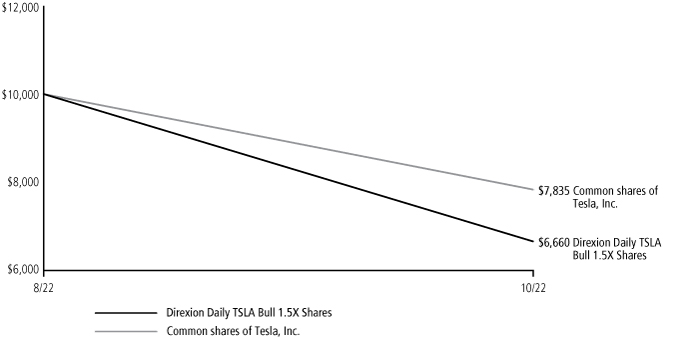
| | Total Return2 | |
| | | Since Inception | |
Direxion Daily TSLA Bull 1.5X Shares (NAV) | | | -33.40 | % | |
Direxion Daily TSLA Bull 1.5X Shares (Market Price) | | | -33.36 | % | |
Common shares of Tesla, Inc. | | | -21.65 | % | |
The performance data quoted represents past performance; past performance does not guarantee future results; the investment return and principal value of an investment will fluctuate; an investor's shares, when redeemed, may be worth more or less than their original cost; current performance may be lower or higher than the performance quoted. As stated in the current prospectus, the Fund's total annual operating expense ratio (gross) is 0.99%. Rafferty Asset Management, LLC has contractually agreed to waive all or a portion of its management fee and/or reimburse the Fund for other expenses through September 1, 2024 to the extent the Total Annual Operating Expenses exceed 0.95% (excluding, as applicable, among other expenses, taxes, swap financing and related costs, acquired fund fees and expenses, dividends or interest on short positions, other interest expenses, brokerage commissions and extraordinary expenses). The performance table and graph do not reflect the deduction of taxes that a shareholder would pay on Fund distributions or the redemption of Fund shares. For the Fund's most recent month end performance please visit www.direxion.com.
A fund that meets its daily target over a period of time will not necessarily produce the returns that might be expected in light of the returns of its index or benchmark for that period. Differences may result from the compounding effect of market fluctuation and the use of leverage. The pursuit of daily goals may result in daily, leveraged compounding, which means that the return of an index over a period of time greater than one day multiplied by a fund's specified multiple (150%) will not generally equal a fund's performance over that same period.
This chart illustrates the performance of a hypothetical $10,000 investment made on the Fund's inception and is not intended to imply any future performance. Shares of Direxion Shares are bought and sold at market price (not NAV) and are not individually redeemed from the Fund. Performance reflects reinvestment of all dividend and capital gains distributions. During this period, some of the Fund's fees were waived and/or expenses reimbursed; otherwise, the Fund's performance would have been lower.
The Fund seeks daily inverse investment results, before fees and expenses, of 150% of the performance of the common shares of Tesla, Inc. stock (NASDAQ: TSLA).
Market Exposure
The Fund seeks daily exposure of 150% of its NAV through a combination of equities and derivatives. "Market Exposure" includes the value of total investments (including the contract value of any derivatives) and excludes any short-term investments and cash equivalents divided by Net Assets.
1 Commencement of operations.
2 As of October 31, 2022.
DIREXION ANNUAL REPORT
30
Direxion Daily CSI 300 China A Share Bull 2X Shares
Performance Summary (Unaudited)
April 16, 20151 - October 31, 2022

| | | Average Annual Total Return2 | |
| | | 1 Year | | 3 Years | | 5 Years | | Since Inception | |
Direxion Daily CSI 300 China A Share
Bull 2X Shares (NAV) | | | -60.95 | % | | | -10.50 | % | | | -11.43 | % | | | -11.74 | % | |
Direxion Daily CSI 300 China A Share
Bull 2X Shares (Market Price) | | | -60.86 | % | | | -10.35 | % | | | -11.37 | % | | | -11.71 | % | |
CSI 300 Index | | | -36.09 | % | | | -2.71 | % | | | -2.63 | % | | | -3.10 | % | |
The performance data quoted represents past performance; past performance does not guarantee future results; the investment return and principal value of an investment will fluctuate; an investor's shares, when redeemed, may be worth more or less than their original cost; current performance may be lower or higher than the performance quoted. As stated in the current prospectus, the Fund's total annual operating expense ratio (gross) is 1.05%. Rafferty Asset Management, LLC has contractually agreed to waive all or a portion of its management fee and/or reimburse the Fund for other expenses through September 1, 2024 to the extent the Total Annual Operating Expenses exceed 0.95% (excluding, as applicable, among other expenses, taxes, swap financing and related costs, acquired fund fees and expenses, dividends or interest on short positions, other interest expenses, brokerage commissions and extraordinary expenses). The performance table and graph do not reflect the deduction of taxes that a shareholder would pay on Fund distributions or the redemption of Fund shares. For the Fund's most recent month end performance please visit www.direxion.com.
A fund that meets its daily target over a period of time will not necessarily produce the returns that might be expected in light of the returns of its index or benchmark for that period. Differences may result from the compounding effect of market fluctuation and the use of leverage. The pursuit of daily goals may result in daily, leveraged compounding, which means that the return of an index over a period of time greater than one day multiplied by a fund's specified multiple (200%) will not generally equal a fund's performance over that same period.
This chart illustrates the performance of a hypothetical $10,000 investment made on the Fund's inception and is not intended to imply any future performance. Shares of Direxion Shares are bought and sold at market price (not NAV) and are not individually redeemed from the Fund. Performance reflects reinvestment of all dividend and capital gains distributions. During this period, some of the Fund's fees were waived and/or expenses reimbursed; otherwise, the Fund's performance would have been lower.
The CSI 300 Index is a modified free-float market capitalization weighted index comprised of the largest and most liquid stocks in the Chinese A-share market. Index constituent stocks must have been listed for more than three months (unless the stock's average daily A-share market capitalization since its initial listing ranks among the top 30 of all A-shares) and must not be experiencing obvious abnormal fluctuations or market manipulations. Investors cannot invest directly in an index, although they can invest in its underlying securities.
Market Exposure
The Fund seeks daily exposure of 200% of its NAV through a combination of equities and derivatives. "Market Exposure" includes the value of total investments (including the contract value of any derivatives) and excludes any short-term investments and cash equivalents divided by Net Assets.
1 Commencement of operations.
2 As of October 31, 2022.
DIREXION ANNUAL REPORT
31
Direxion Daily CSI China Internet Index Bull 2X Shares
Performance Summary (Unaudited)
November 2, 20161 - October 31, 2022

| | | Average Annual Total Return2 | |
| | | 1 Year | | 3 Years | | 5 Years | | Since Inception | |
Direxion Daily CSI China Internet Bull 2X
Shares (NAV) | | | -88.53 | % | | | -54.80 | % | | | -45.60 | % | | | -32.64 | % | |
Direxion Daily CSI China Internet Bull 2X
Shares (Market Price) | | | -88.53 | % | | | -54.81 | % | | | -45.59 | % | | | -32.64 | % | |
CSI Overseas China Internet Index | | | -57.28 | % | | | -22.58 | % | | | -17.18 | % | | | -9.20 | % | |
The performance data quoted represents past performance; past performance does not guarantee future results; the investment return and principal value of an investment will fluctuate; an investor's shares, when redeemed, may be worth more or less than their original cost; current performance may be lower or higher than the performance quoted. As stated in the current prospectus, the Fund's total annual operating expense ratio (gross) is 1.32%. Rafferty Asset Management, LLC has contractually agreed to waive all or a portion of its management fee and/or reimburse the Fund for other expenses through September 1, 2024 to the extent the Total Annual Operating Expenses exceed 0.95% (excluding, as applicable, among other expenses, taxes, swap financing and related costs, acquired fund fees and expenses, dividends or interest on short positions, other interest expenses, brokerage commissions and extraordinary expenses). The performance table and graph do not reflect the deduction of taxes that a shareholder would pay on Fund distributions or the redemption of Fund shares. For the Fund's most recent month end performance please visit www.direxion.com.
A fund that meets its daily target over a period of time will not necessarily produce the returns that might be expected in light of the returns of its index or benchmark for that period. Differences may result from the compounding effect of market fluctuation and the use of leverage. The pursuit of daily goals may result in daily, leveraged compounding, which means that the return of an index over a period of time greater than one day multiplied by a fund's specified multiple (200%) will not generally equal a fund's performance over that same period.
This chart illustrates the performance of a hypothetical $10,000 investment made on the Fund's inception and is not intended to imply any future performance. Shares of Direxion Shares are bought and sold at market price (not NAV) and are not individually redeemed from the Fund. Performance reflects reinvestment of all dividend and capital gains distributions. During this period, some of the Fund's fees were waived and/or expenses reimbursed; otherwise, the Fund's performance would have been lower.
The CSI Overseas China Internet Index is designed to measure the performance of the investable universe of publicly traded China-based companies whose primary business or businesses are in the Internet and Internet-related sectors, as defined by the index sponsor, China Securities Index Co., Ltd. (''CSI''). A China-based company is a company that meets at least one of the following criteria: 1) the company is incorporated in mainland China; 2) its headquarters are in mainland China; or 3) at least 50% of the revenue from goods produced or sold, or services performed in mainland China. Investors cannot invest directly in an index, although they can invest in its underlying securities.
Market Exposure
The Fund seeks daily exposure of 200% of its NAV through a combination of equities and derivatives. "Market Exposure" includes the value of total investments (including the contract value of any derivatives) and excludes any short-term investments and cash equivalents divided by Net Assets.
1 Commencement of operations.
2 As of October 31, 2022.
DIREXION ANNUAL REPORT
32
Direxion Daily S&P 500® Bull 2X Shares
Performance Summary (Unaudited)
May 28, 20141 - October 31, 2022

| | | Average Annual Total Return2 | |
| | | 1 Year | | 3 Years | | 5 Years | | Since Inception | |
Direxion Daily S&P 500® Bull 2X Shares
(NAV) | | | -32.51 | % | | | 11.91 | % | | | 13.80 | % | | | 16.30 | % | |
Direxion Daily S&P 500® Bull 2X Shares
(Market Price) | | | -32.51 | % | | | 11.95 | % | | | 13.73 | % | | | 16.33 | % | |
S&P 500® Index | | | -14.61 | % | | | 10.22 | % | | | 10.44 | % | | | 10.81 | % | |
The performance data quoted represents past performance; past performance does not guarantee future results; the investment return and principal value of an investment will fluctuate; an investor's shares, when redeemed, may be worth more or less than their original cost; current performance may be lower or higher than the performance quoted. As stated in the current prospectus, the Fund's total annual operating expense ratio (gross) is 0.75%. Rafferty Asset Management, LLC has contractually agreed to waive all or a portion of its management fee and/or reimburse the Fund for other expenses through September 1, 2024 to the extent the Total Annual Operating Expenses exceed 0.60% (excluding, as applicable, among other expenses, taxes, swap financing and related costs, acquired fund fees and expenses, dividends or interest on short positions, other interest expenses, brokerage commissions and extraordinary expenses). The performance table and graph do not reflect the deduction of taxes that a shareholder would pay on Fund distributions or the redemption of Fund shares. For the Fund's most recent month end performance please visit www.direxion.com.
A fund that meets its daily target over a period of time will not necessarily produce the returns that might be expected in light of the returns of its index or benchmark for that period. Differences may result from the compounding effect of market fluctuation and the use of leverage. The pursuit of daily goals may result in daily, leveraged compounding, which means that the return of an index over a period of time greater than one day multiplied by a fund's specified multiple (200%) will not generally equal a fund's performance over that same period.
This chart illustrates the performance of a hypothetical $10,000 investment made on the Fund's inception and is not intended to imply any future performance. Shares of Direxion Shares are bought and sold at market price (not NAV) and are not individually redeemed from the Fund. Performance reflects reinvestment of all dividend and capital gains distributions. During this period, some of the Fund's fees were waived and/or expenses reimbursed; otherwise, the Fund's performance would have been lower.
The S&P 500® Index is a capitalization-weighted index composed of 500 domestic common stocks. Most of the common stocks in the S&P 500® Index are issued by the 500 largest companies, in terms of the aggregate market value of their outstanding stock, and are generally listed on the New York Stock Exchange. The performance of the S&P 500® Index does not reflect the deduction of fees associated with the Fund, such as investment management fees. Investors cannot invest directly in an index, although they can invest in its underlying securities.
Market Exposure
The Fund seeks daily exposure of 200% of its NAV through a combination of equities and derivatives. "Market Exposure" includes the value of total investments (including the contract value of any derivatives) and excludes any short-term investments and cash equivalents divided by Net Assets.
1 Commencement of operations.
2 As of October 31, 2022.
DIREXION ANNUAL REPORT
33
Direxion Daily S&P 500® Equal Weight Bull 2X Shares
Performance Summary (Unaudited)
January 20, 20221 - October 31, 2022

| | Total Return2 | |
| | | Since Inception | |
Direxion Daily S&P 500® Equal Weight Bull 2X Shares (NAV) | | | -24.27 | % | |
Direxion Daily S&P 500® Equal Weight Bull 2X Shares
(Market Price) | | | -24.18 | % | |
S&P 500® Equal Weight Index | | | -9.94 | % | |
The performance data quoted represents past performance; past performance does not guarantee future results; the investment return and principal value of an investment will fluctuate; an investor's shares, when redeemed, may be worth more or less than their original cost; current performance may be lower or higher than the performance quoted. Returns for performance under one year are cumulative, not annualized. As stated in the current prospectus, the Fund's total annual operating expense ratio (gross) is 1.09%. Rafferty Asset Management, LLC has contractually agreed to waive all or a portion of its management fee and/or reimburse the Fund for other expenses through September 1, 2024 to the extent the Total Annual Operating Expenses exceed 0.95% (excluding, as applicable, among other expenses, taxes, swap financing and related costs, acquired fund fees and expenses, dividends or interest on short positions, other interest expenses, brokerage commissions and extraordinary expenses). The performance table and graph do not reflect the deduction of taxes that a shareholder would pay on Fund distributions or the redemption of Fund shares. For the Fund's most recent month end performance please visit www.direxion.com.
A fund that meets its daily target over a period of time will not necessarily produce the returns that might be expected in light of the returns of its index or benchmark for that period. Differences may result from the compounding effect of market fluctuation and the use of leverage. The pursuit of daily goals may result in daily, leveraged compounding, which means that the return of an index over a period of time greater than one day multiplied by a fund's specified multiple (200%) will not generally equal a fund's performance over that same period.
This chart illustrates the performance of a hypothetical $10,000 investment made on the Fund's inception and is not intended to imply any future performance. Shares of Direxion Shares are bought and sold at market price (not NAV) and are not individually redeemed from the Fund. Performance reflects reinvestment of all dividend and capital gains distributions. During this period, some of the Fund's fees were waived and/or expenses reimbursed; otherwise, the Fund's performance would have been lower.
The S&P® Equal Weight Index consists of all of the components of the S&P 500® Index. The Index is an equal-weighted version of the S&P 500® Index. Unlike the S&P 500® Index, which employs a float-adjusted market capitalization weighted methodology, the Index assigns each component security the same weight upon rebalance. The Index is a stock market index tracking the performance of 500 large companies listed on stock exchanges in the United States. Investors cannot invest directly in an index, although they can invest in its underlying securities.
Market Exposure
The Fund seeks daily exposure of 200% of its NAV through a combination of equities and derivatives. "Market Exposure" includes the value of total investments (including the contract value of any derivatives) and excludes any short-term investments and cash equivalents divided by Net Assets.
1 Commencement of operations.
2 As of October 31, 2022.
DIREXION ANNUAL REPORT
34
Direxion Daily MSCI Brazil Bull 2X Shares
Performance Summary (Unaudited)
April 10, 20131 - October 31, 2022
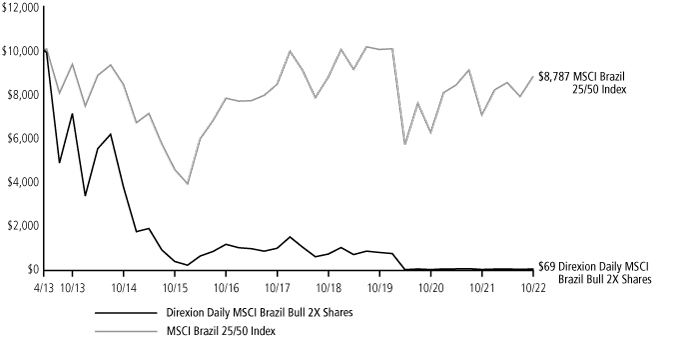
| | | Average Annual Total Return2 | |
| | | 1 Year | | 3 Years | | 5 Years | | Since Inception | |
Direxion Daily MSCI Brazil Bull 2X Shares
(NAV) | | | 37.79 | % | | | -56.08 | % | | | -41.44 | % | | | -40.54 | % | |
Direxion Daily MSCI Brazil Bull 2X Shares
(Market Price) | | | 37.79 | % | | | -56.06 | % | | | -41.52 | % | | | -40.56 | % | |
MSCI Brazil 25/50 Index | | | 24.55 | % | | | -4.29 | % | | | 0.81 | % | | | -1.34 | % | |
The performance data quoted represents past performance; past performance does not guarantee future results; the investment return and principal value of an investment will fluctuate; an investor's shares, when redeemed, may be worth more or less than their original cost; current performance may be lower or higher than the performance quoted. Returns for performance under one year are cumulative, not annualized. As stated in the current prospectus, the Fund's total annual operating expense ratio (gross) is 1.26%. Rafferty Asset Management, LLC has contractually agreed to waive all or a portion of its management fee and/or reimburse the Fund for other expenses through September 1, 2024 to the extent the Total Annual Operating Expenses exceed 0.95% (excluding, as applicable, among other expenses, taxes, swap financing and related costs, acquired fund fees and expenses, dividends or interest on short positions, other interest expenses, brokerage commissions and extraordinary expenses). The performance table and graph do not reflect the deduction of taxes that a shareholder would pay on Fund distributions or the redemption of Fund shares. For the Fund's most recent month end performance please visit www.direxion.com.
A fund that meets its daily target over a period of time will not necessarily produce the returns that might be expected in light of the returns of its index or benchmark for that period. Differences may result from the compounding effect of market fluctuation and the use of leverage. The pursuit of daily goals may result in daily, leveraged compounding, which means that the return of an index over a period of time greater than one day multiplied by a fund's specified multiple (200%) will not generally equal a fund's performance over that same period.
This chart illustrates the performance of a hypothetical $10,000 investment made on the Fund's inception and is not intended to imply any future performance. Shares of Direxion Shares are bought and sold at market price (not NAV) and are not individually redeemed from the Fund. Performance reflects reinvestment of all dividend and capital gains distributions. During this period, some of the Fund's fees were waived and/or expenses reimbursed; otherwise, the Fund's performance would have been lower.
The MSCI Brazil 25/50 Index is designed to measure the performance of the large and mid cap segments of the Brazil equity market, covering approximately 85% of the free float-adjusted market capitalization in Brazil. The Index applies certain screens and weightings to take into account the investment limits placed on regulated investment companies ("RICs") under federal tax regulations. One such requirement is that at the end of each quarter of a RIC's tax year, no more than 25% of its assets may be invested in a single issuer and the sum of the weights of all issuers representing more than 5% of the RIC should not exceed 50% of its total assets. The Index aims to reflect these requirements in the selection and weighting of its component securities. Investors cannot invest directly in an index, although they can invest in its underlying securities.
Market Exposure
The Fund seeks daily exposure of 200% of its NAV through a combination of equities and derivatives. "Market Exposure" includes the value of total investments (including the contract value of any derivatives) and excludes any short-term investments and cash equivalents divided by Net Assets.
1 Commencement of operations.
2 As of October 31, 2022.
DIREXION ANNUAL REPORT
35
Direxion Daily MSCI India Bull 2X Shares
Performance Summary (Unaudited)
October 31, 2012 - October 31, 2022

| | | Average Annual Total Return1 | |
| | | 1 Year | | 3 Years | | 5 Years | | 10 Years | |
Direxion Daily MSCI India Bull 2X
Shares (NAV) | | | -21.15 | % | | | -9.89 | % | | | -12.36 | % | | | -3.94 | % | |
Direxion Daily MSCI India Bull 2X
Shares (Market Price) | | | -21.05 | % | | | -9.92 | % | | | -12.26 | % | | | -3.95 | % | |
MSCI India Index | | | -6.89 | % | | | 10.88 | % | | | 7.00 | % | | | 7.96 | % | |
The performance data quoted represents past performance; past performance does not guarantee future results; the investment return and principal value of an investment will fluctuate; an investor's shares, when redeemed, may be worth more or less than their original cost; current performance may be lower or higher than the performance quoted. Returns for performance under one year are cumulative, not annualized. As stated in the current prospectus, the Fund's total annual operating expense ratio (gross) is 1.17%. Rafferty Asset Management, LLC has contractually agreed to waive all or a portion of its management fee and/or reimburse the Fund for other expenses through September 1, 2024 to the extent the Total Annual Operating Expenses exceed 0.95% (excluding, as applicable, among other expenses, taxes, swap financing and related costs, acquired fund fees and expenses, dividends or interest on short positions, other interest expenses, brokerage commissions and extraordinary expenses). The performance table and graph do not reflect the deduction of taxes that a shareholder would pay on Fund distributions or the redemption of Fund shares. For the Fund's most recent month end performance please visit www.direxion.com.
A fund that meets its daily target over a period of time will not necessarily produce the returns that might be expected in light of the returns of its index or benchmark for that period. Differences may result from the compounding effect of market fluctuation and the use of leverage. The pursuit of daily goals may result in daily, leveraged compounding, which means that the return of an index over a period of time greater than one day multiplied by a fund's specified multiple (200%) will not generally equal a fund's performance over that same period.
This chart illustrates the performance of a hypothetical $10,000 investment made on the Fund's inception and is not intended to imply any future performance. Shares of Direxion Shares are bought and sold at market price (not NAV) and are not individually redeemed from the Fund. Performance reflects reinvestment of all dividend and capital gains distributions. During this period, some of the Fund's fees were waived and/or expenses reimbursed; otherwise, the Fund's performance would have been lower.
The MSCI India Index is designed to measure the performance of equity securities whose market capitalization, as calculated by MSCI, represents the top 85% of companies in the Indian equity securities markets. The performance of the MSCI India Index does not reflect the deduction of fees associated with the Fund, such as investment management fees. Investors cannot invest directly in an index, although they can invest in its underlying securities.
Market Exposure
The Fund seeks daily exposure of 200% of its NAV through a combination of equities and derivatives. "Market Exposure" includes the value of total investments (including the contract value of any derivatives) and excludes any short-term investments and cash equivalents divided by Net Assets.
1 As of October 31, 2021.
DIREXION ANNUAL REPORT
36
Direxion Daily Cloud Computing Bull 2X Shares
Performance Summary (Unaudited)
January 8, 20211 - October 31, 2022
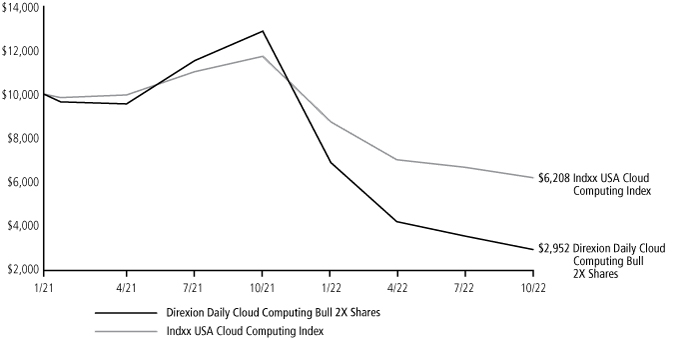
| | | Average Annual Total Return2 | |
| | | 1 Year | | Since Inception | |
Direxion Daily Cloud Computing Bull 2X Shares (NAV) | | | -77.03 | % | | | -48.97 | % | |
Direxion Daily Cloud Computing Bull 2X Shares
(Market Price) | | | -77.01 | % | | | -48.97 | % | |
Indxx USA Cloud Computing Index | | | -46.98 | % | | | -23.11 | % | |
The performance data quoted represents past performance; past performance does not guarantee future results; the investment return and principal value of an investment will fluctuate; an investor's shares, when redeemed, may be worth more or less than their original cost; current performance may be lower or higher than the performance quoted. Returns for performance under one year are cumulative, not annualized. As stated in the current prospectus, the Fund's total annual operating expense ratio (gross) is 1.04%. Rafferty Asset Management, LLC has contractually agreed to waive all or a portion of its management fee and/or reimburse the Fund for other expenses through September 1, 2024 to the extent the Total Annual Operating Expenses exceed 0.95% (excluding, as applicable, among other expenses, taxes, swap financing and related costs, acquired fund fees and expenses, dividends or interest on short positions, other interest expenses, brokerage commissions and extraordinary expenses). The performance table and graph do not reflect the deduction of taxes that a shareholder would pay on Fund distributions or the redemption of Fund shares. For the Fund's most recent month end performance please visit www.direxion.com.
A fund that meets its daily target over a period of time will not necessarily produce the returns that might be expected in light of the returns of its index or benchmark for that period. Differences may result from the compounding effect of market fluctuation and the use of leverage. The pursuit of daily goals may result in daily, leveraged compounding, which means that the return of an index over a period of time greater than one day multiplied by a fund's specified multiple (200%) will not generally equal a fund's performance over that same period.
This chart illustrates the performance of a hypothetical $10,000 investment made on the Fund's inception and is not intended to imply any future performance. Shares of Direxion Shares are bought and sold at market price (not NAV) and are not individually redeemed from the Fund. Performance reflects reinvestment of all dividend and capital gains distributions. During this period, some of the Fund's fees were waived and/or expenses reimbursed; otherwise, the Fund's performance would have been lower.
The Indxx USA Cloud Computing Index is provided by Indxx, LLC. and includes domestic companies that deliver cloud computing infrastructure, platforms, or services. The companies included in the Index are involved in the delivery of computing services – servers, storage, databases, networking, software, analytics, and more, over the internet, which is often referred to as the "Cloud." The Index Provider has defined cloud computing to include three themes: Infrastructure as a service; Platform as a service; and Software as a service. Investors cannot invest directly in an index, although they can invest in its underlying securities.
Market Exposure
The Fund seeks daily exposure of 200% of its NAV through a combination of equities and derivatives. "Market Exposure" includes the value of total investments (including the contract value of any derivatives) and excludes any short-term investments and cash equivalents divided by Net Assets.
1 Commencement of operations.
2 As of October 31, 2022.
DIREXION ANNUAL REPORT
37
Direxion Daily Electric and Autonomous Vehicles Bull 2X Shares
Performance Summary (Unaudited)
August 11, 20221 - October 31, 2022
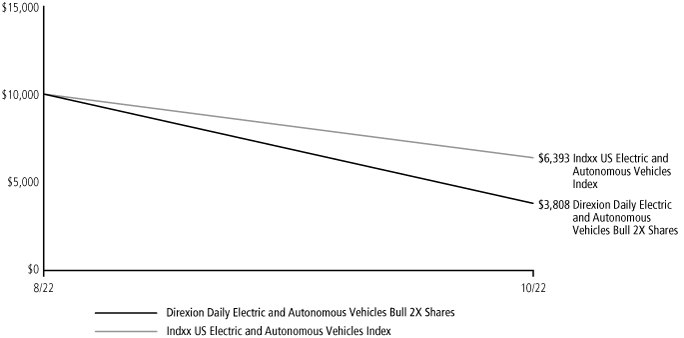
| | Total Return2 | |
| | | Since Inception | |
Direxion Daily Electric and Autonomous Vehicles Bull 2X Shares (NAV) | | | -61.92 | % | |
Direxion Daily Electric and Autonomous Vehicles Bull 2X Shares (Market Price) | | | -62.00 | % | |
Indxx US Electric and Autonomous Vehicles Index | | | -36.07 | % | |
The performance data quoted represents past performance; past performance does not guarantee future results; the investment return and principal value of an investment will fluctuate; an investor's shares, when redeemed, may be worth more or less than their original cost; current performance may be lower or higher than the performance quoted. Returns for performance under one year are cumulative, not annualized. As stated in the current prospectus, the Fund's total annual operating expense ratio (gross) is 1.09%. Rafferty Asset Management, LLC has contractually agreed to waive all or a portion of its management fee and/or reimburse the Fund for other expenses through September 1, 2024 to the extent the Total Annual Operating Expenses exceed 0.95% (excluding, as applicable, among other expenses, taxes, swap financing and related costs, acquired fund fees and expenses, dividends or interest on short positions, other interest expenses, brokerage commissions and extraordinary expenses). The performance table and graph do not reflect the deduction of taxes that a shareholder would pay on Fund distributions or the redemption of Fund shares. For the Fund's most recent month end performance please visit www.direxion.com.
A fund that meets its daily target over a period of time will not necessarily produce the returns that might be expected in light of the returns of its index or benchmark for that period. Differences may result from the compounding effect of market fluctuation and the use of leverage. The pursuit of daily goals may result in daily, leveraged compounding, which means that the return of an index over a period of time greater than one day multiplied by a fund's specified multiple (200%) will not generally equal a fund's performance over that same period.
This chart illustrates the performance of a hypothetical $10,000 investment made on the Fund's inception and is not intended to imply any future performance. Shares of Direxion Shares are bought and sold at market price (not NAV) and are not individually redeemed from the Fund. Performance reflects reinvestment of all dividend and capital gains distributions. During this period, some of the Fund's fees were waived and/or expenses reimbursed; otherwise, the Fund's performance would have been lower.
The Indxx US Electric and Autonomous Vehicles Index is designed to track the performance of electric and autonomous vehicles companies. Indxx (the "Index Provider") defines electric and autonomous vehicles companies as those companies that derive at least 50% of their revenues from the following activities (or "sub-themes"): • Manufacturers – companies that manufacture and sell electric or autonomous vehicles. • Enablers – companies that build infrastructure or create technology for electric or autonomous vehicles, such as charging docks and batteries. • Software and Technology Services – companies that engage in the development of software and technology for electric or autonomous vehicles. Investors cannot invest directly in an index, although they can invest in its underlying securities.
Market Exposure
The Fund seeks daily exposure of 200% of its NAV through a combination of equities and derivatives. "Market Exposure" includes the value of total investments (including the contract value of any derivatives) and excludes any short-term investments and cash equivalents divided by Net Assets.
1 Commencement of operations.
2 As of October 31, 2022.
DIREXION ANNUAL REPORT
38
Direxion Daily Energy Bull 2X Shares
Performance Summary (Unaudited)
October 31, 2012 - October 31, 2022

| | | Average Annual Total Return1 | |
| | | 1 Year | | 3 Years | | 5 Years | | 10 Years | |
Direxion Daily Energy Bull 2X Shares (NAV) | | | 130.82 | % | | | -18.91 | % | | | -22.97 | % | | | -16.76 | % | |
Direxion Daily Energy Bull 2X Shares
(Market Price) | | | 131.41 | % | | | -18.85 | % | | | -22.92 | % | | | -16.76 | % | |
Energy Select Sector Index | | | 63.73 | % | | | 23.03 | % | | | 1.11 | % | | | 6.20 | % | |
The performance data quoted represents past performance; past performance does not guarantee future results; the investment return and principal value of an investment will fluctuate; an investor's shares, when redeemed, may be worth more or less than their original cost; current performance may be lower or higher than the performance quoted. Returns for performance under one year are cumulative, not annualized. As stated in the current prospectus, the Fund's total annual operating expense ratio (gross) is 0.95%. Rafferty Asset Management, LLC has contractually agreed to waive all or a portion of its management fee and/or reimburse the Fund for other expenses through September 1, 2024 to the extent the Total Annual Operating Expenses exceed 0.95% (excluding, as applicable, among other expenses, taxes, swap financing and related costs, acquired fund fees and expenses, dividends or interest on short positions, other interest expenses, brokerage commissions and extraordinary expenses). The performance table and graph do not reflect the deduction of taxes that a shareholder would pay on Fund distributions or the redemption of Fund shares. For the Fund's most recent month end performance please visit www.direxion.com.
A fund that meets its daily target over a period of time will not necessarily produce the returns that might be expected in light of the returns of its index or benchmark for that period. Differences may result from the compounding effect of market fluctuation and the use of leverage. The pursuit of daily goals may result in daily, leveraged compounding, which means that the return of an index over a period of time greater than one day multiplied by a fund's specified multiple (200%) will not generally equal a fund's performance over that same period.
This chart illustrates the performance of a hypothetical $10,000 investment made on the Fund's inception and is not intended to imply any future performance. Shares of Direxion Shares are bought and sold at market price (not NAV) and are not individually redeemed from the Fund. Performance reflects reinvestment of all dividend and capital gains distributions. During this period, some of the Fund's fees were waived and/or expenses reimbursed; otherwise, the Fund's performance would have been lower.
The Energy Select Sector Index is provided by Standard & Poor's and includes domestic companies from the following industries: oil, gas & consumable fuels; and energy equipment & services. Each of the component securities of the Index is a constituent company of the S&P 500 Index. The performance of Energy Select Sector Index does not reflect the deduction of fees associated with the Fund, such as investment management fees. Investors cannot invest directly in an index, although they can invest in its underlying securities.
Market Exposure
The Fund seeks daily exposure of 200% of its NAV through a combination of equities and derivatives. "Market Exposure" includes the value of total investments (including the contract value of any derivatives) and excludes any short-term investments and cash equivalents divided by Net Assets.
1 As of October 31, 2022.
DIREXION ANNUAL REPORT
39
Direxion Daily Energy Bear 2X Shares
Performance Summary (Unaudited)
October 31, 2012 - October 31, 2022

| | | Average Annual Total Return1 | |
| | | 1 Year | | 3 Years | | 5 Years | | 10 Years | |
Direxion Daily Energy Bear 2X Shares (NAV) | | | -73.67 | % | | | -61.44 | % | | | -44.43 | % | | | -35.61 | % | |
Direxion Daily Energy Bear 2X Shares
(Market Price) | | | -73.66 | % | | | -61.44 | % | | | -44.43 | % | | | -35.62 | % | |
Energy Select Sector Index | | | 63.73 | % | | | 23.03 | % | | | 11.11 | % | | | 6.20 | % | |
The performance data quoted represents past performance; past performance does not guarantee future results; the investment return and principal value of an investment will fluctuate; an investor's shares, when redeemed, may be worth more or less than their original cost; current performance may be lower or higher than the performance quoted. Returns for performance under one year are cumulative, not annualized. As stated in the current prospectus, the Fund's total annual operating expense ratio (gross) is 1.03%. Rafferty Asset Management, LLC has contractually agreed to waive all or a portion of its management fee and/or reimburse the Fund for other expenses through September 1, 2024 to the extent the Total Annual Operating Expenses exceed 0.95% (excluding, as applicable, among other expenses, taxes, swap financing and related costs, acquired fund fees and expenses, dividends or interest on short positions, other interest expenses, brokerage commissions and extraordinary expenses). The performance table and graph do not reflect the deduction of taxes that a shareholder would pay on Fund distributions or the redemption of Fund shares. For the Fund's most recent month end performance please visit www.direxion.com.
A fund that meets its daily target over a period of time will not necessarily produce the returns that might be expected in light of the returns of its index or benchmark for that period. Differences may result from the compounding effect of market fluctuation, the use of leverage and a Bear Fund's inverse correlation. The pursuit of daily goals may result in daily, leveraged compounding, which means that the return of an index over a period of time greater than one day multiplied by a fund's specified inverse multiple (-200%) will not generally equal a fund's performance over that same period.
This chart illustrates the performance of a hypothetical $10,000 investment made on the Fund's inception and is not intended to imply any future performance. Shares of Direxion Shares are bought and sold at market price (not NAV) and are not individually redeemed from the Fund. Performance reflects reinvestment of all dividend and capital gains distributions. During this period, some of the Fund's fees were waived and/or expenses reimbursed; otherwise, the Fund's performance would have been lower.
The Energy Select Sector Index is provided by Standard & Poor's and includes domestic companies from the following industries: oil, gas & consumable fuels; and energy equipment & services. Each of the component securities of the Index is a constituent company of the S&P 500 Index. The performance of Energy Select Sector Index does not reflect the deduction of fees associated with the Fund, such as investment management fees. Investors cannot invest directly in an index, although they can invest in its underlying securities.
Market Exposure
The Fund seeks daily exposure of -200% of its NAV through derivatives. "Market Exposure" includes the value of total investments (including the contract value of any derivatives) and excludes any short-term investments and cash equivalents divided by Net Assets.
1 As of October 31, 2022.
DIREXION ANNUAL REPORT
40
Direxion Daily FinTech Bull 2X Shares
Performance Summary (Unaudited)
January 20, 20221 - October 31, 2022

| | | Total Return2 | |
| | | Since Inception | |
Direxion Daily FinTech Bull 2X Shares (NAV) | | | -49.76 | % | |
Direxion Daily FinTech Bull 2X Shares (Market Price) | | | -49.96 | % | |
Indxx US Fintech and Decentralized Finance Index | | | -23.74 | % | |
The performance data quoted represents past performance; past performance does not guarantee future results; the investment return and principal value of an investment will fluctuate; an investor's shares, when redeemed, may be worth more or less than their original cost; current performance may be lower or higher than the performance quoted. Returns for performance under one year are cumulative, not annualized. As stated in the current prospectus, the Fund's total annual operating expense ratio (gross) is 1.09%. Rafferty Asset Management, LLC has contractually agreed to waive all or a portion of its management fee and/or reimburse the Fund for other expenses through September 1, 2024 to the extent the Total Annual Operating Expenses exceed 0.95% (excluding, as applicable, among other expenses, taxes, swap financing and related costs, acquired fund fees and expenses, dividends or interest on short positions, other interest expenses, brokerage commissions and extraordinary expenses). The performance table and graph do not reflect the deduction of taxes that a shareholder would pay on Fund distributions or the redemption of Fund shares. For the Fund's most recent month end performance please visit www.direxion.com.
A fund that meets its daily target over a period of time will not necessarily produce the returns that might be expected in light of the returns of its index or benchmark for that period. Differences may result from the compounding effect of market fluctuation and the use of leverage. The pursuit of daily goals may result in daily, leveraged compounding, which means that the return of an index over a period of time greater than one day multiplied by a fund's specified multiple (200%) will not generally equal a fund's performance over that same period.
This chart illustrates the performance of a hypothetical $10,000 investment made on the Fund's inception and is not intended to imply any future performance. Shares of Direxion Shares are bought and sold at market price (not NAV) and are not individually redeemed from the Fund. Performance reflects reinvestment of all dividend and capital gains distributions. During this period, some of the Fund's fees were waived and/or expenses reimbursed; otherwise, the Fund's performance would have been lower.
The Indxx US Fintech and Decentralized Finance Index includes U.S.-listed securities, including ADRs, of companies that are offering technology-driven financial services ("FinTech"), which includes companies that facilitate decentralized finance systems. The Index is reconstituted and rebalanced annually. Investors cannot invest directly in an index, although they can invest in its underlying securities.
Market Exposure
The Fund seeks daily exposure of 200% of its NAV through a combination of equities and derivatives. "Market Exposure" includes the value of total investments (including the contract value of any derivatives) and excludes any short-term investments and cash equivalents divided by Net Assets.
1 Commencement of operations.
2 As of October 31, 2022.
DIREXION ANNUAL REPORT
41
Direxion Daily Global Clean Energy Bull 2X Shares
Performance Summary (Unaudited)
July 29, 20211 - October 31, 2022

| | | Average Annual Total Return2 | |
| | | 1 Year | | Since Inception | |
Direxion Daily Global Clean Energy Bull 2X Shares (NAV) | | | -50.82 | % | | | -33.98 | % | |
Direxion Daily Global Clean Energy Bull 2X Shares
(Market Price) | | | -50.84 | % | | | -33.98 | % | |
S&P Global Clean Energy Index | | | -24.04 | % | | | -12.44 | % | |
The performance data quoted represents past performance; past performance does not guarantee future results; the investment return and principal value of an investment will fluctuate; an investor's shares, when redeemed, may be worth more or less than their original cost; current performance may be lower or higher than the performance quoted. Returns for performance under one year are cumulative, not annualized. As stated in the current prospectus, the Fund's total annual operating expense ratio (gross) is 2.71%. Rafferty Asset Management, LLC has contractually agreed to waive all or a portion of its management fee and/or reimburse the Fund for other expenses through September 1, 2024 to the extent the Total Annual Operating Expenses exceed 0.95% (excluding, as applicable, among other expenses, taxes, swap financing and related costs, acquired fund fees and expenses, dividends or interest on short positions, other interest expenses, brokerage commissions and extraordinary expenses). The performance table and graph do not reflect the deduction of taxes that a shareholder would pay on Fund distributions or the redemption of Fund shares. For the Fund's most recent month end performance please visit www.direxion.com.
A fund that meets its daily target over a period of time will not necessarily produce the returns that might be expected in light of the returns of its index or benchmark for that period. Differences may result from the compounding effect of market fluctuation and the use of leverage. The pursuit of daily goals may result in daily, leveraged compounding, which means that the return of an index over a period of time greater than one day multiplied by a fund's specified multiple (200%) will not generally equal a fund's performance over that same period.
This chart illustrates the performance of a hypothetical $10,000 investment made on the Fund's inception and is not intended to imply any future performance. Shares of Direxion Shares are bought and sold at market price (not NAV) and are not individually redeemed from the Fund. Performance reflects reinvestment of all dividend and capital gains distributions. During this period, some of the Fund's fees were waived and/or expenses reimbursed; otherwise, the Fund's performance would have been lower.
The S&P Global Clean Energy Index is designed to track the performance of companies from developed markets whose economic fortunes are tied to the global clean energy business. The Index has a target constituent count of 100 and is limited to those stocks traded on a developed market exchange that meet or exceed, at the time of inclusion, $300 million in total market capitalization, $100 million in float adjusted market capitalization, and $3 million average daily value traded over a six month period. The Index is rebalanced semi-annually. Investors cannot invest directly in an index, although they can invest in its underlying securities.
Market Exposure
The Fund seeks daily exposure of 200% of its NAV through a combination of equities and derivatives. "Market Exposure" includes the value of total investments (including the contract value of any derivatives) and excludes any short-term investments and cash equivalents divided by Net Assets.
1 Commencement of operations.
2 As of October 31, 2022.
DIREXION ANNUAL REPORT
42
Direxion Daily Gold Miners Index Bull 2X Shares
Performance Summary (Unaudited)
October 31, 2012 - October 31, 2022

| | | Average Annual Total Return1 | |
| | | 1 Year | | 3 Years | | 5 Years | | 10 Years | |
Direxion Daily Gold Miners Index Bull 2X
Shares (NAV) | | | -49.11 | % | | | -45.87 | % | | | -29.49 | % | | | -51.20 | % | |
Direxion Daily Gold Miners Index Bull 2X
Shares (Market Price) | | | -49.08 | % | | | -45.81 | % | | | -29.55 | % | | | -51.21 | % | |
NYSE Arca Gold Miners Index | | | -22.19 | % | | | -3.51 | % | | | 2.69 | % | | | -6.43 | % | |
The performance data quoted represents past performance; past performance does not guarantee future results; the investment return and principal value of an investment will fluctuate; an investor's shares, when redeemed, may be worth more or less than their original cost; current performance may be lower or higher than the performance quoted. Returns for performance under one year are cumulative, not annualized. As stated in the current prospectus, the Fund's total annual operating expense ratio (gross) is 1.14%. Rafferty Asset Management, LLC has contractually agreed to waive all or a portion of its management fee and/or reimburse the Fund for other expenses through September 1, 2024 to the extent the Total Annual Operating Expenses exceed 0.95% (excluding, as applicable, among other expenses, taxes, swap financing and related costs, acquired fund fees and expenses, dividends or interest on short positions, other interest expenses, brokerage commissions and extraordinary expenses). The performance table and graph do not reflect the deduction of taxes that a shareholder would pay on Fund distributions or the redemption of Fund shares. For the Fund's most recent month end performance please visit www.direxion.com.
A fund that meets its daily target over a period of time will not necessarily produce the returns that might be expected in light of the returns of its index or benchmark for that period. Differences may result from the compounding effect of market fluctuation and the use of leverage. The pursuit of daily goals may result in daily, leveraged compounding, which means that the return of an index over a period of time greater than one day multiplied by a fund's specified multiple (200%) will not generally equal a fund's performance over that same period.
This chart illustrates the performance of a hypothetical $10,000 investment made on the Fund's inception and is not intended to imply any future performance. Shares of Direxion Shares are bought and sold at market price (not NAV) and are not individually redeemed from the Fund. Performance reflects reinvestment of all dividend and capital gains distributions. During this period, some of the Fund's fees were waived and/or expenses reimbursed; otherwise, the Fund's performance would have been lower.
The NYSE Arca Gold Miners Index is a modified market capitalization weighted index comprised of publicly traded companies that operate globally in both developed and emerging markets and are involved primarily in the mining for gold and silver. Investors cannot invest directly in an index, although they can invest in its underlying securities.
Market Exposure
The Fund seeks daily exposure of 200% of its NAV through a combination of equities and derivatives. "Market Exposure" includes the value of total investments (including the contract value of any derivatives) and excludes any short-term investments and cash equivalents divided by Net Assets.
1 As of October 31, 2022.
DIREXION ANNUAL REPORT
43
Direxion Daily Gold Miners Index Bear 2X Shares
Performance Summary (Unaudited)
October 31, 2012 - October 31, 2022

| | | Average Annual Total Return1 | |
| | | 1 Year | | 3 Years | | 5 Years | | 10 Years | |
Direxion Daily Gold Miners Index Bear 2X
Shares (NAV) | | | 15.05 | % | | | -47.89 | % | | | -48.68 | % | | | -47.35 | % | |
Direxion Daily Gold Miners Index Bear 2X
Shares (Market Price) | | | 14.90 | % | | | -47.98 | % | | | -48.68 | % | | | -47.35 | % | |
NYSE Arca Gold Miners Index | | | -22.19 | % | | | -3.51 | % | | | 2.69 | % | | | -6.43 | % | |
The performance data quoted represents past performance; past performance does not guarantee future results; the investment return and principal value of an investment will fluctuate; an investor's shares, when redeemed, may be worth more or less than their original cost; current performance may be lower or higher than the performance quoted. Returns for performance under one year are cumulative, not annualized. As stated in the current prospectus, the Fund's total annual operating expense ratio (gross) is 0.92%. Rafferty Asset Management, LLC has contractually agreed to waive all or a portion of its management fee and/or reimburse the Fund for other expenses through September 1, 2024 to the extent the Total Annual Operating Expenses exceed 0.95% (excluding, as applicable, among other expenses, taxes, swap financing and related costs, acquired fund fees and expenses, dividends or interest on short positions, other interest expenses, brokerage commissions and extraordinary expenses). The performance table and graph do not reflect the deduction of taxes that a shareholder would pay on Fund distributions or the redemption of Fund shares. For the Fund's most recent month end performance please visit www.direxion.com.
A fund that meets its daily target over a period of time will not necessarily produce the returns that might be expected in light of the returns of its index or benchmark for that period. Differences may result from the compounding effect of market fluctuation, the use of leverage and a Bear Fund's inverse correlation. The pursuit of daily goals may result in daily, leveraged compounding, which means that the return of an index over a period of time greater than one day multiplied by a fund's specified inverse multiple (-200%) will not generally equal a fund's performance over that same period.
This chart illustrates the performance of a hypothetical $10,000 investment made on the Fund's inception and is not intended to imply any future performance. Shares of Direxion Shares are bought and sold at market price (not NAV) and are not individually redeemed from the Fund. Performance reflects reinvestment of all dividend and capital gains distributions. During this period, some of the Fund's fees were waived and/or expenses reimbursed; otherwise, the Fund's performance would have been lower.
The NYSE Arca Gold Miners Index is a modified market capitalization weighted index comprised of publicly traded companies that operate globally in both developed and emerging markets and are involved primarily in the mining for gold and silver. Investors cannot invest directly in an index, although they can invest in its underlying securities.
Market Exposure
The Fund seeks daily exposure of -200% of its NAV through derivatives. "Market Exposure" includes the value of total investments (including the contract value of any derivatives) and excludes any short-term investments and cash equivalents divided by Net Assets.
1 As of October 31, 2022.
DIREXION ANNUAL REPORT
44
Direxion Daily Junior Gold Miners Index Bull 2X Shares
Performance Summary (Unaudited)
October 3, 20131 - October 31, 2022

| | | Average Annual Total Return2 | |
| | | 1 Year | | 3 Years | | 5 Years | | Since Inception | |
Direxion Daily Junior Gold Miners Index
Bull 2X Shares (NAV) | | | -61.33 | % | | | -66.52 | % | | | -48.93 | % | | | -55.18 | % | |
Direxion Daily Junior Gold Miners Index
Bull 2X Shares (Market Price) | | | -61.52 | % | | | -66.50 | % | | | -48.95 | % | | | -55.17 | % | |
MVIS Global Junior Gold Miners Index | | | -30.47 | % | | | -7.27 | % | | | -0.26 | % | | | -1.80 | % | |
The performance data quoted represents past performance; past performance does not guarantee future results; the investment return and principal value of an investment will fluctuate; an investor's shares, when redeemed, may be worth more or less than their original cost; current performance may be lower or higher than the performance quoted. Returns for performance under one year are cumulative, not annualized. As stated in the current prospectus, the Fund's total annual operating expense ratio (gross) is 1.06%. Rafferty Asset Management, LLC has contractually agreed to waive all or a portion of its management fee and/or reimburse the Fund for other expenses through September 1, 2024 to the extent the Total Annual Operating Expenses exceed 0.95% (excluding, as applicable, among other expenses, taxes, swap financing and related costs, acquired fund fees and expenses, dividends or interest on short positions, other interest expenses, brokerage commissions and extraordinary expenses). The performance table and graph do not reflect the deduction of taxes that a shareholder would pay on Fund distributions or the redemption of Fund shares. For the Fund's most recent month end performance please visit www.direxion.com.
A fund that meets its daily target over a period of time will not necessarily produce the returns that might be expected in light of the returns of its index or benchmark for that period. Differences may result from the compounding effect of market fluctuation and the use of leverage. The pursuit of daily goals may result in daily, leveraged compounding, which means that the return of an index over a period of time greater than one day multiplied by a fund's specified multiple (200%) will not generally equal a fund's performance over that same period.
This chart illustrates the performance of a hypothetical $10,000 investment made on the Fund's inception and is not intended to imply any future performance. Shares of Direxion Shares are bought and sold at market price (not NAV) and are not individually redeemed from the Fund. Performance reflects reinvestment of all dividend and capital gains distributions. During this period, some of the Fund's fees were waived and/or expenses reimbursed; otherwise, the Fund's performance would have been lower.
The MVIS Global Junior Gold Miners Index is a cap-weighted total return index that covers the largest and most liquid small-cap companies that derive at least 50% from Gold or Silver mining or have properties to do so. The performance of the MVIS Global Junior Gold Miners Index does not reflect the deduction of fees associated with the Fund, such as investment management fees. Investors cannot invest directly in an index, although they can invest in its underlying securities.
Market Exposure
The Fund seeks daily exposure of 200% of its NAV through a combination of equities and derivatives. "Market Exposure" includes the value of total investments (including the contract value of any derivatives) and excludes any short-term investments and cash equivalents divided by Net Assets.
1 Commencement of operations.
2 As of October 31, 2022.
DIREXION ANNUAL REPORT
45
Direxion Daily Junior Gold Miners Index Bear 2X Shares
Performance Summary (Unaudited)
October 3, 20131 - October 31, 2022

| | | Average Annual Total Return2 | |
| | | 1 Year | | 3 Years | | 5 Years | | Since Inception | |
Direxion Daily Junior Gold Miners Index
Bear 2X Shares (NAV) | | | 22.45 | % | | | -65.48 | % | | | -61.28 | % | | | -69.82 | % | |
Direxion Daily Junior Gold Miners Index
Bear 2X Shares (Market Price) | | | 22.97 | % | | | -65.50 | % | | | -61.30 | % | | | -69.82 | % | |
MVIS Global Junior Gold Miners Index | | | -30.47 | % | | | -7.27 | % | | | -0.26 | % | | | -1.80 | % | |
The performance data quoted represents past performance; past performance does not guarantee future results; the investment return and principal value of an investment will fluctuate; an investor's shares, when redeemed, may be worth more or less than their original cost; current performance may be lower or higher than the performance quoted. Returns for performance under one year are cumulative, not annualized. As stated in the current prospectus, the Fund's total annual operating expense ratio (gross) is 0.90%. Rafferty Asset Management, LLC has contractually agreed to waive all or a portion of its management fee and/or reimburse the Fund for other expenses through September 1, 2024 to the extent the Total Annual Operating Expenses exceed 0.95% (excluding, as applicable, among other expenses, taxes, swap financing and related costs, acquired fund fees and expenses, dividends or interest on short positions, other interest expenses, brokerage commissions and extraordinary expenses). The performance table and graph do not reflect the deduction of taxes that a shareholder would pay on Fund distributions or the redemption of Fund shares. For the Fund's most recent month end performance please visit www.direxion.com.
A fund that meets its daily target over a period of time will not necessarily produce the returns that might be expected in light of the returns of its index or benchmark for that period. Differences may result from the compounding effect of market fluctuation, the use of leverage and a Bear Fund's inverse correlation. The pursuit of daily goals may result in daily, leveraged compounding, which means that the return of an index over a period of time greater than one day multiplied by a fund's specified inverse multiple (-200%) will not generally equal a fund's performance over that same period.
This chart illustrates the performance of a hypothetical $10,000 investment made on the Fund's inception and is not intended to imply any future performance. Shares of Direxion Shares are bought and sold at market price (not NAV) and are not individually redeemed from the Fund. Performance reflects reinvestment of all dividend and capital gains distributions. During this period, some of the Fund's fees were waived and/or expenses reimbursed; otherwise, the Fund's performance would have been lower.
The MVIS Global Junior Gold Miners Index is a cap-weighted total return index that covers the largest and most liquid small-cap companies that derive at least 50% from Gold or Silver mining or have properties to do so. The performance of the MVIS Global Junior Gold Miners Index does not reflect the deduction of fees associated with the Fund, such as investment management fees. Investors cannot invest directly in an index, although they can invest in its underlying securities.
Market Exposure
The Fund seeks daily exposure of -200% of its NAV through derivatives. "Market Exposure" includes the value of total investments (including the contract value of any derivatives) and excludes any short-term investments and cash equivalents divided by Net Assets.
1 Commencement of operations.
2 As of October 31, 2022.
DIREXION ANNUAL REPORT
46
Direxion Daily Metal Miners Bull 2X Shares
Performance Summary (Unaudited)
December 16, 20211 - October 31, 2022

| | | Total Return2 | |
| | | Since Inception | |
Direxion Daily Metal Miners Bull 2X Shares (NAV) | | | 17.60 | % | |
Direxion Daily Metal Miners Bull 2X Shares (Market Price) | | | 17.60 | % | |
S&P Metals & Mining Select Industry Index | | | 18.31 | % | |
The performance data quoted represents past performance; past performance does not guarantee future results; the investment return and principal value of an investment will fluctuate; an investor's shares, when redeemed, may be worth more or less than their original cost; current performance may be lower or higher than the performance quoted. Returns for performance under one year are cumulative, not annualized. As stated in the current prospectus, the Fund's total annual operating expense ratio (gross) is 1.09%. Rafferty Asset Management, LLC has contractually agreed to waive all or a portion of its management fee and/or reimburse the Fund for other expenses through September 1, 2024 to the extent the Total Annual Operating Expenses exceed 0.95% (excluding, as applicable, among other expenses, taxes, swap financing and related costs, acquired fund fees and expenses, dividends or interest on short positions, other interest expenses, brokerage commissions and extraordinary expenses). The performance table and graph do not reflect the deduction of taxes that a shareholder would pay on Fund distributions or the redemption of Fund shares. For the Fund's most recent month end performance please visit www.direxion.com.
A fund that meets its daily target over a period of time will not necessarily produce the returns that might be expected in light of the returns of its index or benchmark for that period. Differences may result from the compounding effect of market fluctuation and the use of leverage. The pursuit of daily goals may result in daily, leveraged compounding, which means that the return of an index over a period of time greater than one day multiplied by a fund's specified multiple (200%) will not generally equal a fund's performance over that same period.
This chart illustrates the performance of a hypothetical $10,000 investment made on the Fund's inception and is not intended to imply any future performance. Shares of Direxion Shares are bought and sold at market price (not NAV) and are not individually redeemed from the Fund. Performance reflects reinvestment of all dividend and capital gains distributions. During this period, some of the Fund's fees were waived and/or expenses reimbursed; otherwise, the Fund's performance would have been lower.
The S&P Metals & Mining Select Industry Index is a modified equal-weighted index that is designed to measure the performance of the equity securities of companies in the S&P Total Market Index that are classified under the Global Industry Classification Standard (GICS) as being in the metals and mining industry. The metals and mining industry includes companies in the following sub-industries: aluminum; coal & consumable fuels; copper; diversified metals &mining; gold; precious metals &minerals; silver; and steel. The Index does not include metal commodities. Investors cannot invest directly in an index, although they can invest in its underlying securities.
Market Exposure
The Fund seeks daily exposure of 200% of its NAV through a combination of equities and derivatives. "Market Exposure" includes the value of total investments (including the contract value of any derivatives) and excludes any short-term investments and cash equivalents divided by Net Assets.
1 Commencement of operations.
2 As of October 31, 2022.
DIREXION ANNUAL REPORT
47
Direxion Daily Oil Services Bull 2X Shares
Performance Summary (Unaudited)
January 20, 20221 - October 31, 2022

| | | Total Return2 | |
| | | Since Inception | |
Direxion Daily Oil Services Bull 2X Shares (NAV) | | | 46.21 | % | |
Direxion Daily Oil Services Bull 2X Shares (Market Price) | | | 46.29 | % | |
MVIS US Listed Oil Services 25 Index | | | 34.89 | % | |
The performance data quoted represents past performance; past performance does not guarantee future results; the investment return and principal value of an investment will fluctuate; an investor's shares, when redeemed, may be worth more or less than their original cost; current performance may be lower or higher than the performance quoted. Returns for performance under one year are cumulative, not annualized. As stated in the current prospectus, the Fund's total annual operating expense ratio (gross) is 1.09%. Rafferty Asset Management, LLC has contractually agreed to waive all or a portion of its management fee and/or reimburse the Fund for other expenses through September 1, 2024 to the extent the Total Annual Operating Expenses exceed 0.95% (excluding, as applicable, among other expenses, taxes, swap financing and related costs, acquired fund fees and expenses, dividends or interest on short positions, other interest expenses, brokerage commissions and extraordinary expenses). The performance table and graph do not reflect the deduction of taxes that a shareholder would pay on Fund distributions or the redemption of Fund shares. For the Fund's most recent month end performance please visit www.direxion.com.
A fund that meets its daily target over a period of time will not necessarily produce the returns that might be expected in light of the returns of its index or benchmark for that period. Differences may result from the compounding effect of market fluctuation and the use of leverage. The pursuit of daily goals may result in daily, leveraged compounding, which means that the return of an index over a period of time greater than one day multiplied by a fund's specified multiple (200%) will not generally equal a fund's performance over that same period.
This chart illustrates the performance of a hypothetical $10,000 investment made on the Fund's inception and is not intended to imply any future performance. Shares of Direxion Shares are bought and sold at market price (not NAV) and are not individually redeemed from the Fund. Performance reflects reinvestment of all dividend and capital gains distributions. During this period, some of the Fund's fees were waived and/or expenses reimbursed; otherwise, the Fund's performance would have been lower.
The MVIS US Listed Oil Services 25 Index includes companies that have common stocks or depositary receipts listed on a U.S. stock exchange and that provide services to the oil industry. To be eligible for initial inclusion in the Index, companies must generate at least 50% of their revenues from providing services to upstream oil companies, such as those engaged primarily in providing oil equipment, oil services or oil drilling. Of the largest 50 such stocks by full market capitalization, the top 25 by free-float market capitalization and three-month average daily trading volume are included in the Index. Investors cannot invest directly in an index, although they can invest in its underlying securities.
Market Exposure
The Fund seeks daily exposure of 200% of its NAV through a combination of equities and derivatives. "Market Exposure" includes the value of total investments (including the contract value of any derivatives) and excludes any short-term investments and cash equivalents divided by Net Assets.
1 Commencement of operations.
2 As of October 31, 2022.
DIREXION ANNUAL REPORT
48
Direxion Daily Robotics, Artificial Intelligence & Automation Index Bull 2X Shares
Performance Summary (Unaudited)
April 19, 20181 - October 31, 2022

| | | Average Annual Total Return2 | |
| | | 1 Year | | 3 Years | | Since Inception | |
Direxion Daily Robotics, Artificial Intelligence &
Automation Index Bull 2X Shares (NAV) | | | -76.73 | % | | | -15.93 | % | | | -24.91 | % | |
Direxion Daily Robotics, Artificial Intelligence &
Automation Index Bull 2X Shares (Market Price) | | | -76.58 | % | | | -15.87 | % | | | -24.88 | % | |
Indxx Global Robotics & Artificial
Intelligence Thematic Index | | | -47.16 | % | | | -1.04 | % | | | -3.63 | % | |
The performance data quoted represents past performance; past performance does not guarantee future results; the investment return and principal value of an investment will fluctuate; an investor's shares, when redeemed, may be worth more or less than their original cost; current performance may be lower or higher than the performance quoted. Returns for performance under one year are cumulative, not annualized. As stated in the current prospectus, the Fund's total annual operating expense ratio (gross) is 1.29%. Rafferty Asset Management, LLC has contractually agreed to waive all or a portion of its management fee and/or reimburse the Fund for other expenses through September 1, 2024 to the extent the Total Annual Operating Expenses exceed 0.95% (excluding, as applicable, among other expenses, taxes, swap financing and related costs, acquired fund fees and expenses, dividends or interest on short positions, other interest expenses, brokerage commissions and extraordinary expenses). The performance table and graph do not reflect the deduction of taxes that a shareholder would pay on Fund distributions or the redemption of Fund shares. For the Fund's most recent month end performance please visit www.direxion.com.
A fund that meets its daily target over a period of time will not necessarily produce the returns that might be expected in light of the returns of its index or benchmark for that period. Differences may result from the compounding effect of market fluctuation and the use of leverage. The pursuit of daily goals may result in daily, leveraged compounding, which means that the return of an index over a period of time greater than one day multiplied by a fund's specified multiple (200%) will not generally equal a fund's performance over that same period.
This chart illustrates the performance of a hypothetical $10,000 investment made on the Fund's inception and is not intended to imply any future performance. Shares of Direxion Shares are bought and sold at market price (not NAV) and are not individually redeemed from the Fund. Performance reflects reinvestment of all dividend and capital gains distributions. During this period, some of the Fund's fees were waived and/or expenses reimbursed; otherwise, the Fund's performance would have been lower.
The Indxx Global Robotics & Artificial Intelligence Thematic Index is designed to provide exposure to exchange-listed companies in developed markets that are expected to benefit from the adoption and utilization of robotics and/or artificial intelligence, including companies involved in developing industrial robots and production systems, automated inventory management, unmanned vehicles, voice/image/text recognition, and medical robots or robotic instruments (collectively, "Robotics & Artificial Intelligence Companies"), as defined by Indxx, the Index Provider. Investors cannot invest directly in an index, although they can invest in its underlying securities.
Market Exposure
The Fund seeks daily exposure of 200% of its NAV through a combination of equities and derivatives. "Market Exposure" includes the value of total investments (including the contract value of any derivatives) and excludes any short-term investments and cash equivalents divided by Net Assets.
1 Commencement of operations.
2 As of October 31, 2022.
DIREXION ANNUAL REPORT
49
Direxion Daily S&P Oil & Gas Exp. & Prod. Bull 2X Shares
Performance Summary (Unaudited)
May 28, 20151 - October 31, 2022

| | | Average Annual Total Return2 | |
| | | 1 Year | | 3 Years | | 5 Years | | Since Inception | |
Direxion Daily S&P Oil & Gas Exp. & Prod.
Bull 2X Shares (NAV) | | | 68.43 | % | | | -44.31 | % | | | -54.61 | % | | | -55.54 | % | |
Direxion Daily S&P Oil & Gas Exp. & Prod.
Bull 2X Shares (Market Price) | | | 68.08 | % | | | -44.32 | % | | | -54.62 | % | | | -55.54 | % | |
S&P Oil & Gas Exploration & Production
Select Industry Index | | | 46.11 | % | | | 24.59 | % | | | 4.06 | % | | | -1.87 | % | |
The performance data quoted represents past performance; past performance does not guarantee future results; the investment return and principal value of an investment will fluctuate; an investor's shares, when redeemed, may be worth more or less than their original cost; current performance may be lower or higher than the performance quoted. Returns for performance under one year are cumulative, not annualized. As stated in the current prospectus, the Fund's total annual operating expense ratio (gross) is 1.01%. Rafferty Asset Management, LLC has contractually agreed to waive all or a portion of its management fee and/or reimburse the Fund for other expenses through September 1, 2024 to the extent the Total Annual Operating Expenses exceed 0.95% (excluding, as applicable, among other expenses, taxes, swap financing and related costs, acquired fund fees and expenses, dividends or interest on short positions, other interest expenses, brokerage commissions and extraordinary expenses). The performance table and graph do not reflect the deduction of taxes that a shareholder would pay on Fund distributions or the redemption of Fund shares. For the Fund's most recent month end performance please visit www.direxion.com.
A fund that meets its daily target over a period of time will not necessarily produce the returns that might be expected in light of the returns of its index or benchmark for that period. Differences may result from the compounding effect of market fluctuation and the use of leverage. The pursuit of daily goals may result in daily, leveraged compounding, which means that the return of an index over a period of time greater than one day multiplied by a fund's specified multiple (200%) will not generally equal a fund's performance over that same period.
This chart illustrates the performance of a hypothetical $10,000 investment made on the Fund's inception and is not intended to imply any future performance. Shares of Direxion Shares are bought and sold at market price (not NAV) and are not individually redeemed from the Fund. Performance reflects reinvestment of all dividend and capital gains distributions. During this period, some of the Fund's fees were waived and/or expenses reimbursed; otherwise, the Fund's performance would have been lower.
The S&P Oil & Gas Exploration & Production Select Industry Index is provided by Standard & Poor's Index Provider and includes domestic companies from the oil and gas exploration and production sub-industry. The Index is designed to measure the performance of a sub-industry or group of sub-industries determined based on the Global Industry Classification Standards (GICS). Investors cannot invest directly in an index, although they can invest in its underlying securities.
Market Exposure
The Fund seeks daily exposure of 200% of its NAV through a combination of equities and derivatives. "Market Exposure" includes the value of total investments (including the contract value of any derivatives) and excludes any short-term investments and cash equivalents divided by Net Assets.
1 Commencement of operations.
2 As of October 31, 2022.
DIREXION ANNUAL REPORT
50
Direxion Daily S&P Oil & Gas Exp. & Prod. Bear 2X Shares
Performance Summary (Unaudited)
May 28, 20151 - October 31, 2022

| | | Average Annual Total Return2 | |
| | | 1 Year | | 3 Years | | 5 Years | | Since Inception | |
Direxion Daily S&P Oil & Gas Exp. & Prod.
Bear 2X Shares (NAV) | | | -74.40 | % | | | -74.37 | % | | | -55.00 | % | | | -49.68 | % | |
Direxion Daily S&P Oil & Gas Exp. & Prod.
Bear 2X Shares (Market Price) | | | -74.31 | % | | | -74.36 | % | | | -54.96 | % | | | -49.67 | % | |
S&P Oil & Gas Exploration & Production
Select Industry Index | | | 46.11 | % | | | 24.59 | % | | | 4.06 | % | | | -1.87 | % | |
The performance data quoted represents past performance; past performance does not guarantee future results; the investment return and principal value of an investment will fluctuate; an investor's shares, when redeemed, may be worth more or less than their original cost; current performance may be lower or higher than the performance quoted. Returns for performance under one year are cumulative, not annualized. As stated in the current prospectus, the Fund's total annual operating expense ratio (gross) is 1.00%. Rafferty Asset Management, LLC has contractually agreed to waive all or a portion of its management fee and/or reimburse the Fund for other expenses through September 1, 2024 to the extent the Total Annual Operating Expenses exceed 0.95% (excluding, as applicable, among other expenses, taxes, swap financing and related costs, acquired fund fees and expenses, dividends or interest on short positions, other interest expenses, brokerage commissions and extraordinary expenses). The performance table and graph do not reflect the deduction of taxes that a shareholder would pay on Fund distributions or the redemption of Fund shares. For the Fund's most recent month end performance please visit www.direxion.com.
A fund that meets its daily target over a period of time will not necessarily produce the returns that might be expected in light of the returns of its index or benchmark for that period. Differences may result from the compounding effect of market fluctuation and the use of leverage and a Bear Fund's inverse correlation. The pursuit of daily goals may result in daily, leveraged compounding, which means that the return of an index over a period of time greater than one day multiplied by a fund's specified multiple (-200%) will not generally equal a fund's performance over that same period.
This chart illustrates the performance of a hypothetical $10,000 investment made on the Fund's inception and is not intended to imply any future performance. Shares of Direxion Shares are bought and sold at market price (not NAV) and are not individually redeemed from the Fund. Performance reflects reinvestment of all dividend and capital gains distributions. During this period, some of the Fund's fees were waived and/or expenses reimbursed; otherwise, the Fund's performance would have been lower.
The S&P Oil & Gas Exploration & Production Select Industry Index is provided by Standard & Poor's Index Provider and includes domestic companies from the oil and gas exploration and production sub-industry. The Index is designed to measure the performance of a sub-industry or group of sub-industries determined based on the Global Industry Classification Standards (GICS). Investors cannot invest directly in an index, although they can invest in its underlying securities.
Market Exposure
The Fund seeks daily exposure of -200% of its NAV through derivatives. "Market Exposure" includes the value of total investments (including the contract value of any derivatives) and excludes any short-term investments and cash equivalents divided by Net Assets.
1 Commencement of operations.
2 As of October 31, 2022.
DIREXION ANNUAL REPORT
51
Direxion Daily Select Large Caps & FANGs Bull 2X Shares
Performance Summary (Unaudited)
September 30, 20211 - October 31, 2022

| | | Average Annual Total Return2 | |
| | | 1 Year | | Since Inception | |
Direxion Daily Select Large Caps & FANGs Bull 2X Shares (NAV) | | | -84.62 | % | | | -79.07 | % | |
Direxion Daily Select Large Caps & FANGs Bull 2X Shares
(Market Price) | | | -84.60 | % | | | -79.03 | % | |
ICE FANG 20 Index | | | -54.53 | % | | | -47.45 | % | |
The performance data quoted represents past performance; past performance does not guarantee future results; the investment return and principal value of an investment will fluctuate; an investor's shares, when redeemed, may be worth more or less than their original cost; current performance may be lower or higher than the performance quoted. Returns for performance under one year are cumulative, not annualized. As stated in the current prospectus, the Fund's total annual operating expense ratio (gross) is 3.73%. Rafferty Asset Management, LLC has contractually agreed to waive all or a portion of its management fee and/or reimburse the Fund for other expenses through September 1, 2024 to the extent the Total Annual Operating Expenses exceed 0.95% (excluding, as applicable, among other expenses, taxes, swap financing and related costs, acquired fund fees and expenses, dividends or interest on short positions, other interest expenses, brokerage commissions and extraordinary expenses). The performance table and graph do not reflect the deduction of taxes that a shareholder would pay on Fund distributions or the redemption of Fund shares. For the Fund's most recent month end performance please visit www.direxion.com.
A fund that meets its daily target over a period of time will not necessarily produce the returns that might be expected in light of the returns of its index or benchmark for that period. Differences may result from the compounding effect of market fluctuation and the use of leverage. The pursuit of daily goals may result in daily, leveraged compounding, which means that the return of an index over a period of time greater than one day multiplied by a fund's specified multiple (200%) will not generally equal a fund's performance over that same period.
This chart illustrates the performance of a hypothetical $10,000 investment made on the Fund's inception and is not intended to imply any future performance. Shares of Direxion Shares are bought and sold at market price (not NAV) and are not individually redeemed from the Fund. Performance reflects reinvestment of all dividend and capital gains distributions. During this period, some of the Fund's fees were waived and/or expenses reimbursed; otherwise, the Fund's performance would have been lower.
The ICE FANG 20 Index is an equal weighted index designed to include Facebook, Apple, Amazon, Netflix and (Alphabet's) Google (i.e., the FANGs) and similar highly-traded growth stocks of technology and tech-enabled companies, such as Microsoft, from the information technology, communication services and consumer discretionary sectors. The Index consists of 20 stocks or depository receipts that are listed on a U.S. Exchange that have a minimum of a $5 billion market capitalization and a 6-month average daily trading value of at least $50 million. The Index selects companies whose economic fortunes are tied to technologies such as social networking, autonomous driving, electric vehicles, smartphones, mobile payments, e-commerce, online games, streaming media, online entertainment, cryptocurrencies, blockchain, big data, artificial intelligence machine learning, digital advertising, cloud services and other innovative technologies. The Index is reconstituted and rebalanced quarterly. Investors cannot invest directly in an index, although they can invest in its underlying securities.
Market Exposure
The Fund seeks daily exposure of 200% of its NAV through a combination of equities and derivatives. "Market Exposure" includes the value of total investments (including the contract value of any derivatives) and excludes any short-term investments and cash equivalents divided by Net Assets.
1 Commencement of operations.
2 As of October 31, 2022.
DIREXION ANNUAL REPORT
52
Direxion Daily Software Bull 2X Shares
Performance Summary (Unaudited)
December 16, 20211 - October 31, 2022

| | | Total Return2 | |
| | | Since Inception | |
Direxion Daily Software Bull 2X Shares (NAV) | | | -61.60 | % | |
Direxion Daily Software Bull 2X Shares (Market Price) | | | -61.60 | % | |
S&P North American Expanded Technology Software Index | | | -33.17 | % | |
The performance data quoted represents past performance; past performance does not guarantee future results; the investment return and principal value of an investment will fluctuate; an investor's shares, when redeemed, may be worth more or less than their original cost; current performance may be lower or higher than the performance quoted. Returns for performance under one year are cumulative, not annualized. As stated in the current prospectus, the Fund's total annual operating expense ratio (gross) is 1.09%. Rafferty Asset Management, LLC has contractually agreed to waive all or a portion of its management fee and/or reimburse the Fund for other expenses through September 1, 2024 to the extent the Total Annual Operating Expenses exceed 0.95% (excluding, as applicable, among other expenses, taxes, swap financing and related costs, acquired fund fees and expenses, dividends or interest on short positions, other interest expenses, brokerage commissions and extraordinary expenses). The performance table and graph do not reflect the deduction of taxes that a shareholder would pay on Fund distributions or the redemption of Fund shares. For the Fund's most recent month end performance please visit www.direxion.com.
A fund that meets its daily target over a period of time will not necessarily produce the returns that might be expected in light of the returns of its index or benchmark for that period. Differences may result from the compounding effect of market fluctuation and the use of leverage. The pursuit of daily goals may result in daily, leveraged compounding, which means that the return of an index over a period of time greater than one day multiplied by a fund's specified multiple (200%) will not generally equal a fund's performance over that same period.
This chart illustrates the performance of a hypothetical $10,000 investment made on the Fund's inception and is not intended to imply any future performance. Shares of Direxion Shares are bought and sold at market price (not NAV) and are not individually redeemed from the Fund. Performance reflects reinvestment of all dividend and capital gains distributions. During this period, some of the Fund's fees were waived and/or expenses reimbursed; otherwise, the Fund's performance would have been lower.
The S&P North American Expanded Technology Software Index measures the performance of the constituents of the S&P North American Technology Software Index as well as certain eligible supplemental stocks. At its quarterly rebalances, the Index is weighted by float-adjusted market capitalization, subject to the following diversification requirements: (1) the weight of a single component cannot exceed 8.5%, and (2) the aggregate weight of the Index components with a weight greater than 4.5% cannot exceed 45%. The Index is reconstituted and rebalanced quarterly. Investors cannot invest directly in an index, although they can invest in its underlying securities.
Market Exposure
The Fund seeks daily exposure of 200% of its NAV through a combination of equities and derivatives. "Market Exposure" includes the value of total investments (including the contract value of any derivatives) and excludes any short-term investments and cash equivalents divided by Net Assets.
1 Commencement of operations.
2 As of October 31, 2022.
DIREXION ANNUAL REPORT
53
Direxion Daily TIPS Bull 2X Shares
Performance Summary (Unaudited)
April 7, 20221 - October 31, 2022

| | | Total Return2 | |
| | | Since Inception | |
Direxion Daily TIPS Bull 2X Shares (NAV) | | | -17.76 | % | |
Direxion Daily TIPS Bull 2X Shares (Market Price) | | | -18.02 | % | |
Solactive TIPS ETF Index | | | -8.29 | % | |
The performance data quoted represents past performance; past performance does not guarantee future results; the investment return and principal value of an investment will fluctuate; an investor's shares, when redeemed, may be worth more or less than their original cost; current performance may be lower or higher than the performance quoted. Returns for performance under one year are cumulative, not annualized. As stated in the current prospectus, the Fund's total annual operating expense ratio (gross) is 1.09%. Rafferty Asset Management, LLC has contractually agreed to waive all or a portion of its management fee and/or reimburse the Fund for other expenses through September 1, 2024 to the extent the Total Annual Operating Expenses exceed 0.95% (excluding, as applicable, among other expenses, taxes, swap financing and related costs, acquired fund fees and expenses, dividends or interest on short positions, other interest expenses, brokerage commissions and extraordinary expenses). The performance table and graph do not reflect the deduction of taxes that a shareholder would pay on Fund distributions or the redemption of Fund shares. For the Fund's most recent month end performance please visit www.direxion.com.
A fund that meets its daily target over a period of time will not necessarily produce the returns that might be expected in light of the returns of its index or benchmark for that period. Differences may result from the compounding effect of market fluctuation and the use of leverage. The pursuit of daily goals may result in daily, leveraged compounding, which means that the return of an index over a period of time greater than one day multiplied by a fund's specified multiple (200%) will not generally equal a fund's performance over that same period.
This chart illustrates the performance of a hypothetical $10,000 investment made on the Fund's inception and is not intended to imply any future performance. Shares of Direxion Shares are bought and sold at market price (not NAV) and are not individually redeemed from the Fund. Performance reflects reinvestment of all dividend and capital gains distributions. During this period, some of the Fund's fees were waived and/or expenses reimbursed; otherwise, the Fund's performance would have been lower.
The Solactive TIPS ETF Index provides exposure to the iShares TIPS Bond ETF, which seeks to track the investment results of an index composed of inflation-protected U.S Treasury bonds, commonly known as "TIPS." TIPS are securities issued by the U.S. Treasury that are designed to provide inflation protection to investors. Investors cannot invest directly in an index, although they can invest in its underlying securities.
Market Exposure
The Fund seeks daily exposure of 200% of its NAV through a combination of equities and derivatives. "Market Exposure" includes the value of total investments (including the contract value of any derivatives) and excludes any short-term investments and cash equivalents divided by Net Assets.
1 Commencement of operations.
2 As of October 31, 2022.
DIREXION ANNUAL REPORT
54
Direxion Daily TIPS Bear 2X Shares
Performance Summary (Unaudited)
April 7, 20221 - October 31, 2022

| | | Total Return2 | |
| | | Since Inception | |
Direxion Daily TIPS Bear 2X Shares (NAV) | | | 19.60 | % | |
Direxion Daily TIPS Bear 2X Shares (Market Price) | | | 19.84 | % | |
Solactive TIPS ETF Index | | | -8.29 | % | |
The performance data quoted represents past performance; past performance does not guarantee future results; the investment return and principal value of an investment will fluctuate; an investor's shares, when redeemed, may be worth more or less than their original cost; current performance may be lower or higher than the performance quoted. Returns for performance under one year are cumulative, not annualized. As stated in the current prospectus, the Fund's total annual operating expense ratio (gross) is 1.09%. Rafferty Asset Management, LLC has contractually agreed to waive all or a portion of its management fee and/or reimburse the Fund for other expenses through September 1, 2024 to the extent the Total Annual Operating Expenses exceed 0.95% (excluding, as applicable, among other expenses, taxes, swap financing and related costs, acquired fund fees and expenses, dividends or interest on short positions, other interest expenses, brokerage commissions and extraordinary expenses). The performance table and graph do not reflect the deduction of taxes that a shareholder would pay on Fund distributions or the redemption of Fund shares. For the Fund's most recent month end performance please visit www.direxion.com.
A fund that meets its daily target over a period of time will not necessarily produce the returns that might be expected in light of the returns of its index or benchmark for that period. Differences may result from the compounding effect of market fluctuation and the use of leverage and a Bear Fund's inverse correlation. The pursuit of daily goals may result in daily, leveraged compounding, which means that the return of an index over a period of time greater than one day multiplied by a fund's specified multiple (-200%) will not generally equal a fund's performance over that same period.
This chart illustrates the performance of a hypothetical $10,000 investment made on the Fund's inception and is not intended to imply any future performance. Shares of Direxion Shares are bought and sold at market price (not NAV) and are not individually redeemed from the Fund. Performance reflects reinvestment of all dividend and capital gains distributions. During this period, some of the Fund's fees were waived and/or expenses reimbursed; otherwise, the Fund's performance would have been lower.
The Solactive TIPS ETF Index provides exposure to the iShares TIPS Bond ETF, which seeks to track the investment results of an index composed of inflation-protected U.S Treasury bonds, commonly known as "TIPS." TIPS are securities issued by the U.S. Treasury that are designed to provide inflation protection to investors. Investors cannot invest directly in an index, although they can invest in its underlying securities.
Market Exposure
The Fund seeks daily exposure of -200% of its NAV through derivatives. "Market Exposure" includes the value of total investments (including the contract value of any derivatives) and excludes any short-term investments and cash equivalents divided by Net Assets.
1 Commencement of operations.
2 As of October 31, 2022.
DIREXION ANNUAL REPORT
55
Direxion Daily Travel & Vacation Bull 2X Shares
Performance Summary (Unaudited)
June 10, 20211 - October 31, 2022

| | | Average Annual Total Return2 | |
| | | 1 Year | | Since Inception | |
Direxion Daily Travel & Vacation Bull 2X Shares (NAV) | | | -50.05 | % | | | -46.83 | % | |
Direxion Daily Travel & Vacation Bull 2X Shares
(Market Price) | | | -49.79 | % | | | -46.61 | % | |
BlueStar® Travel and Vacation Index | | | -22.67 | % | | | -21.38 | % | |
The performance data quoted represents past performance; past performance does not guarantee future results; the investment return and principal value of an investment will fluctuate; an investor's shares, when redeemed, may be worth more or less than their original cost; current performance may be lower or higher than the performance quoted. Returns for performance under one year are cumulative, not annualized. As stated in the current prospectus, the Fund's total annual operating expense ratio (gross) is 1.32%. Rafferty Asset Management, LLC has contractually agreed to waive all or a portion of its management fee and/or reimburse the Fund for other expenses through September 1, 2024 to the extent the Total Annual Operating Expenses exceed 0.95% (excluding, as applicable, among other expenses, taxes, swap financing and related costs, acquired fund fees and expenses, dividends or interest on short positions, other interest expenses, brokerage commissions and extraordinary expenses). The performance table and graph do not reflect the deduction of taxes that a shareholder would pay on Fund distributions or the redemption of Fund shares. For the Fund's most recent month end performance please visit www.direxion.com.
A fund that meets its daily target over a period of time will not necessarily produce the returns that might be expected in light of the returns of its index or benchmark for that period. Differences may result from the compounding effect of market fluctuation and the use of leverage. The pursuit of daily goals may result in daily, leveraged compounding, which means that the return of an index over a period of time greater than one day multiplied by a fund's specified multiple (200%) will not generally equal a fund's performance over that same period.
This chart illustrates the performance of a hypothetical $10,000 investment made on the Fund's inception and is not intended to imply any future performance. Shares of Direxion Shares are bought and sold at market price (not NAV) and are not individually redeemed from the Fund. Performance reflects reinvestment of all dividend and capital gains distributions. During this period, some of the Fund's fees were waived and/or expenses reimbursed; otherwise, the Fund's performance would have been lower.
The BlueStar® Travel and Vacation Index is provided by MV Index Solutions GmbH and is comprised of US-listed stocks, including depository receipts, of companies that are Travel and Vacation companies. Investors cannot invest directly in an index, although they can invest in its underlying securities.
Market Exposure
The Fund seeks daily exposure of 200% of its NAV through a combination of equities and derivatives. "Market Exposure" includes the value of total investments (including the contract value of any derivatives) and excludes any short-term investments and cash equivalents divided by Net Assets.
1 Commencement of operations.
2 As of October 31, 2022.
DIREXION ANNUAL REPORT
56
Direxion Daily US Infrastructure Bull 2X Shares
Performance Summary (Unaudited)
September 23, 20211 - October 31, 2022

| | | Total Return2 | |
| | | 1 Year | | Since Inception | |
Direxion Daily US Infrastructure Bull 2X Shares (NAV) | | | -3.44 | % | | | 6.26 | % | |
Direxion Daily US Infrastructure Bull 2X Shares (Market Price) | | | -3.52 | % | | | 6.30 | % | |
Indxx US Infrastructure Index | | | 1.96 | % | | | 6.81 | % | |
The performance data quoted represents past performance; past performance does not guarantee future results; the investment return and principal value of an investment will fluctuate; an investor's shares, when redeemed, may be worth more or less than their original cost; current performance may be lower or higher than the performance quoted. Returns for performance under one year are cumulative, not annualized. As stated in the current prospectus, the Fund's total annual operating expense ratio (gross) is 3.48%. Rafferty Asset Management, LLC has contractually agreed to waive all or a portion of its management fee and/or reimburse the Fund for other expenses through September 1, 2024 to the extent the Total Annual Operating Expenses exceed 0.95% (excluding, as applicable, among other expenses, taxes, swap financing and related costs, acquired fund fees and expenses, dividends or interest on short positions, other interest expenses, brokerage commissions and extraordinary expenses). The performance table and graph do not reflect the deduction of taxes that a shareholder would pay on Fund distributions or the redemption of Fund shares. For the Fund's most recent month end performance please visit www.direxion.com.
A fund that meets its daily target over a period of time will not necessarily produce the returns that might be expected in light of the returns of its index or benchmark for that period. Differences may result from the compounding effect of market fluctuation and the use of leverage. The pursuit of daily goals may result in daily, leveraged compounding, which means that the return of an index over a period of time greater than one day multiplied by a fund's specified multiple (200%) will not generally equal a fund's performance over that same period.
This chart illustrates the performance of a hypothetical $10,000 investment made on the Fund's inception and is not intended to imply any future performance. Shares of Direxion Shares are bought and sold at market price (not NAV) and are not individually redeemed from the Fund. Performance reflects reinvestment of all dividend and capital gains distributions. During this period, some of the Fund's fees were waived and/or expenses reimbursed; otherwise, the Fund's performance would have been lower.
The Indxx US Infrastructure Index is designed to track the performance of U.S.-listed securities, including ADRs, of companies which are involved in infrastructure through engineering, design, maintenance, and construction of infrastructure projects. Investors cannot invest directly in an index, although they can invest in its underlying securities.
Market Exposure
The Fund seeks daily exposure of 200% of its NAV through a combination of equities and derivatives. "Market Exposure" includes the value of total investments (including the contract value of any derivatives) and excludes any short-term investments and cash equivalents divided by Net Assets.
1 Commencement of operations.
2 As of October 31, 2022.
DIREXION ANNUAL REPORT
57
Expense Example (Unaudited)
October 31, 2022
As a shareholder of the Direxion Shares ETF Trust, you incur two types of costs: (1) transaction costs, for purchasing and selling shares and exchange fees; and (2) ongoing costs, including management fees; and other Fund expenses. This example is intended to help you understand your ongoing costs (in dollars) of investing in a fund and to compare these costs with the ongoing costs of investing in other funds.
The example is based on initial investments of $1,000 invested at the beginning of the period and held the entire period (May 1, 2022 to October 31, 2022).
Actual expenses
The first line under each Fund in the table provides information about actual account values and actual expenses. You may use the information in this line, together with the amount you invested, to estimate the expenses that you paid over the period. Simply divide your account value by $1,000 (for example, an $8,600 account value divided by $1,000 = 8.6), then multiply the result by the number in the first line for your Fund under the heading entitled "Expenses Paid During Period May 1, 2022 to October 31, 2022" to estimate the expenses you paid on your account during this period.
Hypothetical example for comparison purposes
The second line of the table below provides information about hypothetical account values and hypothetical expenses based on each Fund's actual expense ratio and an assumed rate of return of 5% per year before expenses, which is not the Fund's actual return. The hypothetical account values and expenses may not be used to estimate the actual ending account balance or expenses you paid for the period. You may use this information to compare the ongoing costs of investing in your Fund and other funds. To do so, compare this 5% hypothetical example with the 5% hypothetical examples that appear in the shareholder reports of the other funds.
Please note that the expenses shown in the table are meant to highlight your ongoing costs only and do not reflect any transactional costs, such as brokerage commissions paid on purchases and sales of Fund shares. Therefore, the second line under each Fund in the table is useful in comparing ongoing Fund costs only, and will not help you determine the relative total costs of owning different funds. In addition, if these transactional costs were included, your costs would have been higher.
Expense Example (Unaudited)
October 31, 2022
| | | Annualized
Expense Ratio | | Beginning
Account Value
May 1, 2022 | | Ending
Account Value
October 31, 2022 | | Expenses Paid
During Period
May 1, 2022 to
October 31, 2022* | |
Direxion Daily CSI 300 China A Share Bear 1X Shares | |
Based on actual fund return | | | 0.80 | % | | $ | 1,000.00 | | | $ | 1,187.80 | | | $ | 4.41 | | |
Based on hypothetical 5% return | | | 0.80 | % | | | 1,000.00 | | | | 1,021.17 | | | | 4.08 | | |
Direxion Daily S&P 500® Bear 1X Shares | |
Based on actual fund return | | | 0.50 | % | | | 1,000.00 | | | | 1,041.30 | | | | 2.57 | | |
Based on hypothetical 5% return | | | 0.50 | % | | | 1,000.00 | | | | 1,022.68 | | | | 2.55 | | |
Direxion Daily AAPL Bear 1X Shares1 | |
Based on actual fund return | | | 0.98 | % | | | 1,000.00 | | | | 1,049.50 | | | | 2.31 | | |
Based on hypothetical 5% return | | | 0.98 | % | | | 1,000.00 | | | | 1,009.25 | | | | 2.27 | | |
Direxion Daily AMZN Bear 1X Shares3 | |
Based on actual fund return | | | 0.96 | % | | | 1,000.00 | | | | 1,194.80 | | | | 1.59 | | |
Based on hypothetical 5% return | | | 0.96 | % | | | 1,000.00 | | | | 1,006.09 | | | | 1.45 | | |
DIREXION ANNUAL REPORT
58
Expense Example (Unaudited)
October 31, 2022
| | | Annualized
Expense Ratio | | Beginning
Account Value
May 1, 2022 | | Ending
Account Value
October 31, 2022 | | Expenses Paid
During Period
May 1, 2022 to
October 31, 2022* | |
Direxion Daily GOOGL Bear 1X Shares3 | |
Based on actual fund return | | | 0.95 | % | | $ | 1,000.00 | | | $ | 1,106.80 | | | $ | 1.51 | | |
Based on hypothetical 5% return | | | 0.95 | % | | | 1,000.00 | | | | 1,006.10 | | | | 1.44 | | |
Direxion Daily MSFT Bear 1X Shares3 | |
Based on actual fund return | | | 0.95 | % | | | 1,000.00 | | | | 1,068.80 | | | | 1.48 | | |
Based on hypothetical 5% return | | | 0.95 | % | | | 1,000.00 | | | | 1,006.10 | | | | 1.44 | | |
Direxion Daily TSLA Bear 1X Shares1 | |
Based on actual fund return | | | 0.96 | % | | | 1,000.00 | | | | 1,208.40 | | | | 2.44 | | |
Based on hypothetical 5% return | | | 0.96 | % | | | 1,000.00 | | | | 1,009.30 | | | | 2.22 | | |
Direxion Daily AAPL Bull 1.5X Shares1 | |
Based on actual fund return | | | 0.95 | % | | | 1,000.00 | | | | 875.20 | | | | 2.05 | | |
Based on hypothetical 5% return | | | 0.95 | % | | | 1,000.00 | | | | 1,009.32 | | | | 2.20 | | |
Direxion Daily AMZN Bull 1.5X Shares3 | |
Based on actual fund return | | | 0.95 | % | | | 1,000.00 | | | | 715.80 | | | | 1.23 | | |
Based on hypothetical 5% return | | | 0.95 | % | | | 1,000.00 | | | | 1,006.10 | | | | 1.44 | | |
Direxion Daily GOOGL Bull 1.5X Shares3 | |
Based on actual fund return | | | 0.95 | % | | | 1,000.00 | | | | 817.00 | | | | 1.30 | | |
Based on hypothetical 5% return | | | 0.95 | % | | | 1,000.00 | | | | 1,006.10 | | | | 1.44 | | |
Direxion Daily MSFT Bull 1.5X Shares3 | |
Based on actual fund return | | | 0.95 | % | | | 1,000.00 | | | | 861.80 | | | | 1.33 | | |
Based on hypothetical 5% return | | | 0.95 | % | | | 1,000.00 | | | | 1,006.10 | | | | 1.44 | | |
Direxion Daily TSLA Bull 1.5X Shares1 | |
Based on actual fund return | | | 0.98 | % | | | 1,000.00 | | | | 666.00 | | | | 1.88 | | |
Based on hypothetical 5% return | | | 0.98 | % | | | 1,000.00 | | | | 1,009.25 | | | | 2.27 | | |
Direxion Daily CSI 300 China A Share Bull 2X Shares | |
Based on actual fund return | | | 0.98 | % | | | 1,000.00 | | | | 656.00 | | | | 4.09 | | |
Based on hypothetical 5% return | | | 0.98 | % | | | 1,000.00 | | | | 1,020.26 | | | | 4.99 | | |
Direxion Daily CSI China Internet Index Bull 2X Shares | |
Based on actual fund return | | | 0.99 | % | | | 1,000.00 | | | | 381.00 | | | | 3.45 | | |
Based on hypothetical 5% return | | | 0.99 | % | | | 1,000.00 | | | | 1,020.21 | | | | 5.04 | | |
Direxion Daily S&P 500® Bull 2X Shares | |
Based on actual fund return | | | 0.61 | % | | | 1,000.00 | | | | 850.10 | | | | 2.84 | | |
Based on hypothetical 5% return | | | 0.61 | % | | | 1,000.00 | | | | 1,022.13 | | | | 3.11 | | |
Direxion Daily S&P 500 Equal Weight Bull 2X Shares | |
Based on actual fund return | | | 0.96 | % | | | 1,000.00 | | | | 869.70 | | | | 4.52 | | |
Based on hypothetical 5% return | | | 0.96 | % | | | 1,000.00 | | | | 1,020.37 | | | | 4.89 | | |
Direxion Daily MSCI Brazil Bull 2X Shares | |
Based on actual fund return | | | 1.06 | % | | | 1,000.00 | | | | 1,000.50 | | | | 5.34 | | |
Based on hypothetical 5% return | | | 1.06 | % | | | 1,000.00 | | | | 1,019.86 | | | | 5.40 | | |
Direxion Daily MSCI India Bull 2X Shares | |
Based on actual fund return | | | 1.00 | % | | | 1,000.00 | | | | 900.20 | | | | 4.79 | | |
Based on hypothetical 5% return | | | 1.00 | % | | | 1,000.00 | | | | 1,020.16 | | | | 5.09 | | |
Direxion Daily Cloud Computing Bull 2X Shares | |
Based on actual fund return | | | 0.97 | % | | | 1,000.00 | | | | 700.10 | | | | 4.16 | | |
Based on hypothetical 5% return | | | 0.97 | % | | | 1,000.00 | | | | 1,020.32 | | | | 4.94 | | |
Direxion Daily Electric and Autonomous Vehicles
Bull 2X Shares2 | |
Based on actual fund return | | | 0.95 | % | | | 1,000.00 | | | | 380.80 | | | | 1.47 | | |
Based on hypothetical 5% return | | | 0.95 | % | | | 1,000.00 | | | | 1,009.10 | | | | 2.14 | | |
Direxion Daily Energy Bull 2X Shares | |
Based on actual fund return | | | 1.14 | % | | | 1,000.00 | | | | 1,353.30 | | | | 6.76 | | |
Based on hypothetical 5% return | | | 1.14 | % | | | 1,000.00 | | | | 1,019.46 | | | | 5.80 | | |
DIREXION ANNUAL REPORT
59
Expense Example (Unaudited)
October 31, 2022
| | | Annualized
Expense Ratio | | Beginning
Account Value
May 1, 2022 | | Ending
Account Value
October 31, 2022 | | Expenses Paid
During Period
May 1, 2022 to
October 31, 2022* | |
Direxion Daily Energy Bear 2X Shares | |
Based on actual fund return | | | 1.04 | % | | $ | 1,000.00 | | | $ | 538.80 | | | $ | 4.03 | | |
Based on hypothetical 5% return | | | 1.04 | % | | | 1,000.00 | | | | 1,019.96 | | | | 5.30 | | |
Direxion Daily FinTech Bull 2X Shares | |
Based on actual fund return | | | 0.96 | % | | | 1,000.00 | | | | 707.60 | | | | 4.13 | | |
Based on hypothetical 5% return | | | 0.96 | % | | | 1,000.00 | | | | 1,020.37 | | | | 4.89 | | |
Direxion Daily Global Clean Energy Bull 2X Shares ETF | |
Based on actual fund return | | | 1.07 | % | | | 1,000.00 | | | | 934.30 | | | | 5.22 | | |
Based on hypothetical 5% return | | | 1.07 | % | | | 1,000.00 | | | | 1,019.81 | | | | 5.45 | | |
Direxion Daily Gold Miners Index Bull 2X Shares | |
Based on actual fund return | | | 0.93 | % | | | 1,000.00 | | | | 429.30 | | | | 3.35 | | |
Based on hypothetical 5% return | | | 0.93 | % | | | 1,000.00 | | | | 1,020.52 | | | | 4.74 | | |
Direxion Daily Gold Miners Index Bear 2X Shares | |
Based on actual fund return | | | 1.22 | % | | | 1,000.00 | | | | 1,694.10 | | | | 8.28 | | |
Based on hypothetical 5% return | | | 1.22 | % | | | 1,000.00 | | | | 1,019.05 | | | | 6.21 | | |
Direxion Daily Junior Gold Miners Index Bull 2X
Shares | |
Based on actual fund return | | | 0.88 | % | | | 1,000.00 | | | | 408.70 | | | | 3.12 | | |
Based on hypothetical 5% return | | | 0.88 | % | | | 1,000.00 | | | | 1,020.77 | | | | 4.48 | | |
Direxion Daily Junior Gold Miners Index Bear 2X
Shares | |
Based on actual fund return | | | 1.22 | % | | | 1,000.00 | | | | 1,525.50 | | | | 7.77 | | |
Based on hypothetical 5% return | | | 1.22 | % | | | 1,000.00 | | | | 1,019.05 | | | | 6.21 | | |
Direxion Daily Metal Miners Bull 2X Shares | |
Based on actual fund return | | | 0.97 | % | | | 1,000.00 | | | | 675.70 | | | | 4.10 | | |
Based on hypothetical 5% return | | | 0.97 | % | | | 1,000.00 | | | | 1,020.32 | | | | 4.94 | | |
Direxion Daily Oil Services Bull 2X Shares | |
Based on actual fund return | | | 0.98 | % | | | 1,000.00 | | | | 1,090.10 | | | | 5.16 | | |
Based on hypothetical 5% return | | | 0.98 | % | | | 1,000.00 | | | | 1,020.26 | | | | 4.99 | | |
Direxion Daily Robotics, Artificial Intelligence &
Automation Index Bull 2X Shares | |
Based on actual fund return | | | 0.96 | % | | | 1,000.00 | | | | 622.70 | | | | 3.93 | | |
Based on hypothetical 5% return | | | 0.96 | % | | | 1,000.00 | | | | 1,020.37 | | | | 4.89 | | |
Direxion Daily S&P Oil & Gas Exp. & Prod. Bull 2X
Shares | |
Based on actual fund return | | | 1.42 | % | | | 1,000.00 | | | | 1,170.80 | | | | 7.77 | | |
Based on hypothetical 5% return | | | 1.42 | % | | | 1,000.00 | | | | 1,018.05 | | | | 7.22 | | |
Direxion Daily S&P Oil & Gas Exp. & Prod. Bear 2X
Shares | |
Based on actual fund return | | | 1.05 | % | | | 1,000.00 | | | | 513.00 | | | | 4.00 | | |
Based on hypothetical 5% return | | | 1.05 | % | | | 1,000.00 | | | | 1,019.91 | | | | 5.35 | | |
Direxion Daily Select Large Caps & FANGs Bull 2X
Shares | |
Based on actual fund return | | | 0.97 | % | | | 1,000.00 | | | | 586.00 | | | | 3.88 | | |
Based on hypothetical 5% return | | | 0.97 | % | | | 1,000.00 | | | | 1,020.32 | | | | 4.94 | | |
Direxion Daily Software Bull 2X Shares | |
Based on actual fund return | | | 0.96 | % | | | 1,000.00 | | | | 730.00 | | | | 4.19 | | |
Based on hypothetical 5% return | | | 0.96 | % | | | 1,000.00 | | | | 1,020.37 | | | | 4.89 | | |
Direxion Daily TIPS Bull 2X Shares | |
Based on actual fund return | | | 0.95 | % | | | 1,000.00 | | | | 830.40 | | | | 4.38 | | |
Based on hypothetical 5% return | | | 0.95 | % | | | 1,000.00 | | | | 1,020.42 | | | | 4.84 | | |
Direxion Daily TIPS Bear 2X Shares | |
Based on actual fund return | | | 0.96 | % | | | 1,000.00 | | | | 1,187.40 | | | | 5.29 | | |
Based on hypothetical 5% return | | | 0.96 | % | | | 1,000.00 | | | | 1,020.37 | | | | 4.89 | | |
DIREXION ANNUAL REPORT
60
Expense Example (Unaudited)
October 31, 2022
| | | Annualized
Expense Ratio | | Beginning
Account Value
May 1, 2022 | | Ending
Account Value
October 31, 2022 | | Expenses Paid
During Period
May 1, 2022 to
October 31, 2022* | |
Direxion Daily Travel & Vacation Bull 2X Shares | |
Based on actual fund return | | | 0.99 | % | | $ | 1,000.00 | | | $ | 646.30 | | | $ | 4.11 | | |
Based on hypothetical 5% return | | | 0.99 | % | | | 1,000.00 | | | | 1,020.21 | | | | 5.04 | | |
Direxion Daily US Infrastructure Bull 2X Shares | |
Based on actual fund return | | | 0.98 | % | | | 1,000.00 | | | | 1,058.90 | | | | 5.09 | | |
Based on hypothetical 5% return | | | 0.98 | % | | | 1,000.00 | | | | 1,020.26 | | | | 4.99 | | |
* Expenses are equal to the Fund's annualized expense ratio, multiplied by the average account value over the period, multiplied by 184 days (the number of days in the period of May 1, 2022 to October 31, 2022), then divided by 365.
1 Expenses are equal to the Fund's annualized expense ratio, multiplied by the average account value over the period from August 9, 2022 (commencement of operations) to October 31, 2022, multiplied by 84 days (the number of days since commencement of operations to October 31, 2022), then divided by 365.
2 Expenses are equal to the Fund's annualized expense ratio, multiplied by the average account value over the period from August 11, 2022 (commencement of operations) to October 31, 2022, multiplied by 82 days (the number of days since commencement of operations to October 31, 2022), then divided by 365.
3 Expenses are equal to the Fund's annualized expense ratio, multiplied by the average account value over the period from September 7, 2022 (commencement of operations) to October 31, 2022, multiplied by 55 days (the number of days since commencement of operations to October 31, 2022), then divided by 365.
DIREXION ANNUAL REPORT
61
Allocation of Portfolio Holdings (Unaudited)
October 31, 2022
| | | Cash* | | Common
Stocks | | Investment
Companies | | Swaps | | Total | |
Direxion Daily CSI 300 China A Share Bear 1X Shares | | | 71 | % | | | — | | | | — | | | | 29 | % | | | 100 | % | |
Direxion Daily S&P 500® Bear 1X Shares | | | 106 | % | | | — | | | | — | | | | (6 | )% | | | 100 | % | |
Direxion Daily AAPL Bear 1X Shares | | | 97 | % | | | — | | | | — | | | | 3 | % | | | 100 | % | |
Direxion Daily AMZN Bear 1X Shares | | | 87 | % | | | — | | | | — | | | | 13 | % | | | 100 | % | |
Direxion Daily GOOGL Bear 1X Shares | | | 91 | % | | | — | | | | — | | | | 9 | % | | | 100 | % | |
Direxion Daily MSFT Bear 1X Shares | | | 94 | % | | | — | | | | — | | | | 6 | % | | | 100 | % | |
Direxion Daily TSLA Bear 1X Shares | | | 90 | % | | | — | | | | — | | | | 10 | % | | | 100 | % | |
Direxion Daily AAPL Bull 1.5X Shares | | | 82 | % | | | 20 | % | | | — | | | | (2 | )% | | | 100 | % | |
Direxion Daily AMZN Bull 1.5X Shares | | | 96 | % | | | 18 | % | | | — | | | | (14 | )% | | | 100 | % | |
Direxion Daily GOOGL Bull 1.5X Shares | | | 95 | % | | | 17 | % | | | — | | | | (12 | )% | | | 100 | % | |
Direxion Daily MSFT Bull 1.5X Shares | | | 89 | % | | | 20 | % | | | — | | | | (9 | )% | | | 100 | % | |
Direxion Daily TSLA Bull 1.5X Shares | | | 99 | % | | | 19 | % | | | — | | | | (18 | )% | | | 100 | % | |
Direxion Daily CSI 300 China A Share Bull 2X Shares | | | 138 | % | | | — | | | | 6 | % | | | (44 | )% | | | 100 | % | |
Direxion Daily CSI China Internet Index Bull 2X Shares | | | 105 | % | | | — | | | | 47 | % | | | (52 | )% | | | 100 | % | |
Direxion Daily S&P 500® Bull 2X Shares | | | 0 | %** | | | — | | | | 95 | % | | | 5 | % | | | 100 | % | |
Direxion Daily S&P 500® Equal Weight Bull 2X Shares | | | 34 | % | | | — | | | | 66 | % | | | 0 | %** | | | 100 | % | |
Direxion Daily MSCI Brazil Bull 2X Shares | | | 62 | % | | | — | | | | 27 | % | | | 11 | % | | | 100 | % | |
Direxion Daily MSCI India Bull 2X Shares | | | 55 | % | | | — | | | | 42 | % | | | 3 | % | | | 100 | % | |
Direxion Daily Cloud Computing Bull 2X Shares | | | 19 | % | | | 82 | % | | | — | | | | (1 | )% | | | 100 | % | |
Direxion Daily Electric and Autonomous Vehicles Bull 2X Shares | | | 10 | % | | | 91 | % | | | — | | | | (1 | )% | | | 100 | % | |
Direxion Daily Energy Bull 2X Shares | | | 1 | % | | | 77 | % | | | — | | | | 22 | % | | | 100 | % | |
Direxion Daily Energy Bear 2X Shares | | | 127 | % | | | — | | | | — | | | | (27 | )% | | | 100 | % | |
Direxion Daily FinTech Bull 2X Shares | | | 22 | % | | | 83 | % | | | — | | | | (5 | )% | | | 100 | % | |
Direxion Daily Global Clean Energy Bull 2X Shares | | | 37 | % | | | — | | | | 67 | % | | | (4 | )% | | | 100 | % | |
Direxion Daily Gold Miners Index Bull 2X Shares | | | 68 | % | | | — | | | | 50 | % | | | (18 | )% | | | 100 | % | |
Direxion Daily Gold Miners Index Bear 2X Shares | | | 82 | % | | | — | | | | — | | | | 18 | % | | | 100 | % | |
Direxion Daily Junior Gold Miners Index Bull 2X Shares | | | 75 | % | | | — | | | | 40 | % | | | (15 | )% | | | 100 | % | |
Direxion Daily Junior Gold Miners Index Bear 2X Shares | | | 92 | % | | | — | | | | — | | | | 8 | % | | | 100 | % | |
Direxion Daily Metal Miners Bull 2X Shares | | | 18 | % | | | 76 | % | | | — | | | | 6 | % | | | 100 | % | |
Direxion Daily Oil Services Bull 2X Shares | | | 19 | % | | | 64 | % | | | — | | | | 17 | % | | | 100 | % | |
Direxion Daily Robotics, Artificial Intelligence & Automation Index
Bull 2X Shares | | | 69 | % | | | — | | | | 51 | % | | | (20 | )% | | | 100 | % | |
Direxion Daily S&P Oil & Gas Exp. & Prod. Bull 2X Shares | | | 12 | % | | | 51 | % | | | — | | | | 37 | % | | | 100 | % | |
Direxion Daily S&P Oil & Gas Exp. & Prod. Bear 2X Shares | | | 122 | % | | | — | | | | — | | | | (22 | )% | | | 100 | % | |
Direxion Daily Select Large Caps & FANGs Bull 2X Shares | | | 19 | % | | | 81 | % | | | — | | | | 0 | %** | | | 100 | % | |
Direxion Daily Software Bull 2X Shares | | | 23 | % | | | 82 | % | | | — | | | | (5 | )% | | | 100 | % | |
Direxion Daily TIPS Bull 2X Shares | | | 31 | % | | | — | | | | 75 | % | | | (6 | )% | | | 100 | % | |
Direxion Daily TIPS Bear 2X Shares | | | 96 | % | | | — | | | | — | | | | 4 | % | | | 100 | % | |
Direxion Daily Travel & Vacation Bull 2X Shares | | | 25 | % | | | 70 | % | | | — | | | | 5 | % | | | 100 | % | |
Direxion Daily US Infrastructure Bull 2X Shares | | | 37 | % | | | 53 | % | | | — | | | | 10 | % | | | 100 | % | |
* Cash, cash equivalents and other assets less liabilities.
** Percentage is less than 0.5%.
DIREXION ANNUAL REPORT
62
Direxion Daily CSI 300 China A Share Bear 1X Shares
Schedule of Investments
October 31, 2022
Shares | | | | Fair Value | |
SHORT TERM INVESTMENTS - 97.2% | | | |
Money Market Funds - 97.2% | | | |
| | 27,586,060 | | | Dreyfus Government Cash
Management Institutional
Shares, 2.91% (a) | | $ | 27,586,060 | | |
| | 740,000 | | | Goldman Sachs Financial
Square Government
Fund Institutional Shares,
3.07% (a) | | | 740,000 | | |
| | 1 | | | Goldman Sachs Financial
Square Treasury
Instruments Fund
Institutional Shares,
3.10% (a) | | | 1 | | |
| | | | | TOTAL SHORT TERM
INVESTMENTS
(Cost $28,326,061) (b) | | $ | 28,326,061 | | |
| | | | | TOTAL INVESTMENTS
(Cost $28,326,061) - 97.2% | | $ | 28,326,061 | | |
| | | | | Other Assets in Excess of
Liabilities - 2.8% | | | 819,102 | | |
| | | | | TOTAL NET ASSETS - 100.0% | | $ | 29,145,163 | | |
Percentages are stated as a percent of net assets.
The geographic location of all investments is United States unless otherwise indicated.
(a) Represents annualized seven-day yield at October 31, 2022.
(b) All or a portion of these securities have been segregated as collateral for swap contracts. Total value of securities segregated amounted to $5,753,810.
Short Total Return Swap Contracts
October 31, 2022
Terms of Payments
to be Received/(Paid)
at Termination | | Terms of Payments
to be Paid
at Termination | | Counterparty | | Termination
Date | | Contracts | | Notional
Amount | | Unrealized
Appreciation | |
(3.3600)%
representing
1 month SOFR
rate + spread | | Total return of Deutsche
Xtrackers Harvest
CSI 300 China A-Shares
ETF | | UBS Securities LLC | | 12/14/2022 | | | 1,002,060 | | | $ | 33,402,737 | | | $ | 8,440,955 | | |
(3.4600)%
representing
1 month SOFR
rate + spread | | Total return of Deutsche
Xtrackers Harvest
CSI 300 China A-Shares
ETF | | Barclays | | 10/27/2023 | | | 201,409 | | | | 5,014,357 | | | | 135,140 | | |
| | | | | | | | | $ | 38,417,094 | | | $ | 8,576,095 | | |
The accompanying notes are an integral part of these financial statements.
DIREXION ANNUAL REPORT
63
Direxion Daily S&P 500® Bear 1X Shares
Schedule of Investments
October 31, 2022
Shares | | | | Fair Value | |
SHORT TERM INVESTMENTS - 108.0% | | | |
Money Market Funds - 108.0% | | | |
| | 622,233,487 | | | Dreyfus Government
Cash Management
Institutional Shares,
2.91% (a) | | $ | 622,233,487 | | |
| | 39,690,000 | | | Goldman Sachs Financial
Square Government Fund
Institutional Shares,
3.07% (a) | | | 39,690,000 | | |
| | 786,141 | | | Goldman Sachs Financial
Square Treasury Instruments
Fund Institutional Shares,
3.10% (a) | | | 786,141 | | |
| | | | | TOTAL SHORT TERM
INVESTMENTS
(Cost $662,709,628) (b) | | $ | 662,709,628 | | |
| | | | | TOTAL INVESTMENTS
(Cost $662,709,628) -
108.0% | | $ | 662,709,628 | | |
| | | | | Liabilities in Excess of
Other Assets - (8.0)% | | | (48,907,218 | ) | |
| | | | | TOTAL NET ASSETS - 100.0% | | $ | 613,802,410 | | |
Percentages are stated as a percent of net assets.
The geographic location of all investments is United States unless otherwise indicated.
(a) Represents annualized seven-day yield at October 31, 2022.
(b) All or a portion of these securities have been segregated as collateral for swap contracts. Total value of securities segregated amounted to $139,526,679.
Short Total Return Swap Contracts
October 31, 2022
Terms of Payments
to be Received at
Termination | | Terms of Payments to be
Paid at Termination | | Counterparty | | Termination
Date | | Contracts | | Notional
Amount | | Unrealized
Depreciation | |
3.360%
representing
1 month SOFR
rate + spread | |
Total return of
S&P 500® Index | | UBS Securities LLC | | 12/14/2022 | | | 115,596 | | | $ | 417,035,455 | | | $ | (29,836,524 | ) | |
3.3700%
representing
1 month SOFR
rate + spread | | Total return of
S&P 500® Index | | Barclays | | 10/17/2023 | | | 42,928 | | | | 159,083,881 | | | | (7,024,777 | ) | |
| | | | | | | | | $ | 576,119,336 | | | $ | (36,861,301 | ) | |
The accompanying notes are an integral part of these financial statements.
DIREXION ANNUAL REPORT
64
Direxion Daily AAPL Bear 1X Shares
Schedule of Investments
October 31, 2022
Shares | | | | Fair Value | |
SHORT TERM INVESTMENTS - 80.9% | | | |
Money Market Funds - 80.9% | | | |
| | 7,711,669 | | | Dreyfus Government Cash
Management Institutional
Shares, 2.91% (a) | | $ | 7,711,669 | | |
| | 1,121,706 | | | Dreyfus Treasury Securities Cash
Management Institutional
Shares, 3.01% (a) | | | 1,121,706 | | |
| | 1,767,094 | | | Goldman Sachs Financial
Square Treasury Instruments
Fund Institutional Shares,
3.10% (a) | | | 1,767,094 | | |
| | | | | TOTAL SHORT TERM
INVESTMENTS
(Cost $10,600,469) (b) | | $ | 10,600,469 | | |
| | | | | TOTAL INVESTMENTS
(Cost $10,600,469) - 80.9% | | $ | 10,600,469 | | |
| | | | | Other Assets in Excess of
Liabilities - 19.1% | | | 2,504,544 | | |
| | | | | TOTAL NET ASSETS - 100.0% | | $ | 13,105,013 | | |
Percentages are stated as a percent of net assets.
The geographic location of all investments is United States unless otherwise indicated.
(a) Represents annualized seven-day yield at October 31, 2022.
(b) All or a portion of these securities have been segregated as collateral for swap contracts. Total value of securities segregated amounted to $3,380,587.
Short Total Return Swap Contracts
October 31, 2022
Terms of Payments
to be Received at
Termination | | Terms of Payments to be
Paid at Termination | | Counterparty | | Termination
Date | | Contracts | | Notional
Amount | | Unrealized
Appreciation | |
1.5400%
representing
1 month SOFR
rate + spread | | Total return of
common shares of
Apple, Inc. | | BNP Paribas | | 12/15/2022 | | | 6,800 | | | $ | 1,138,443 | | | $ | 98,564 | | |
1.0400%
representing
1 month SOFR
rate + spread | | Total return of
common shares of
Apple, Inc. | | Citibank N.A. | | 12/16/2022 | | | 28,776 | | | | 4,518,095 | | | | 108,957 | | |
3.0400%
representing
1 month SOFR
rate + spread | | Total return of
common shares of
Apple, Inc. | | Goldman Sachs | | 9/11/2023 | | | 24,822 | | | | 3,867,737 | | | | 78,008 | | |
1.5400%
representing
1 month SOFR
rate + spread | | Total return of
common shares
of Apple, Inc. | | Bank of America
Merrill Lynch | | 9/26/2023 | | | 25,068 | | | | 3,936,985 | | | | 99,398 | | |
| | | | | | | | | | | $ | 13,461,260 | | | $ | 384,927 | | |
The accompanying notes are an integral part of these financial statements.
DIREXION ANNUAL REPORT
65
Direxion Daily AMZN Bear 1X Shares
Schedule of Investments
October 31, 2022
Shares | | | | Fair Value | |
SHORT TERM INVESTMENTS - 89.7% | | | |
Money Market Funds - 89.7% | | | |
| | 2,048,887 | | | Dreyfus Government Cash
Management Institutional
Shares, 2.91% (a) | | $ | 2,048,887 | | |
| | 260,367 | | | Dreyfus Treasury Securities Cash
Management Institutional
Shares, 3.01% (a) | | | 260,367 | | |
| | 1,038,210 | | | Goldman Sachs Financial
Square Treasury Instruments
Fund Institutional Shares,
3.10% (a) | | | 1,038,210 | | |
| | | | | TOTAL SHORT TERM
INVESTMENTS
(Cost $3,347,464) (b) | | $ | 3,347,464 | | |
| | | | | TOTAL INVESTMENTS
(Cost $3,347,464) - 89.7% | | $ | 3,347,464 | | |
| | | | | Other Assets in Excess of
Liabilities - 10.3% | | | 385,263 | | |
| | | | | TOTAL NET ASSETS - 100.0% | | $ | 3,732,727 | | |
Percentages are stated as a percent of net assets.
The geographic location of all investments is United States unless otherwise indicated.
(a) Represents annualized seven-day yield at October 31, 2022.
(b) All or a portion of these securities have been segregated as collateral for swap contracts. Total value of securities segregated amounted to $1,298,577.
Short Total Return Swap Contracts
October 31, 2022
Terms of Payments
to be Received at
Termination | | Terms of Payments to be
Paid at Termination | | Counterparty | | Termination
Date | | Contracts | | Notional
Amount | | Unrealized
Appreciation | |
1.0400%
representing
1 month SOFR
rate + spread | | Total return of
common shares of
Amazon.com, Inc. | | Citibank N.A. | | 12/15/2022 | | | 13,341 | | | $ | 1,378,932 | | | $ | 12,318 | | |
3.0400%
representing
1 month SOFR
rate + spread | | Total return of
common shares of
Amazon.com, Inc. | | Goldman Sachs | | 10/10/2023 | | | 11,597 | | | | 1,401,024 | | | | 216,877 | | |
1.5400%
representing
1 month SOFR
rate + spread | | Total return of
common shares of
Amazon.com, Inc. | | Bank of America
Merrill Lynch | | 10/26/2023 | | | 11,500 | | | | 1,419,745 | | | | 244,248 | | |
| | | | | | | | | | | $ | 4,199,701 | | | $ | 473,443 | | |
The accompanying notes are an integral part of these financial statements.
DIREXION ANNUAL REPORT
66
Direxion Daily GOOGL Bear 1X Shares
Schedule of Investments
October 31, 2022
Shares | | | | Fair Value | |
SHORT TERM INVESTMENTS - 96.4% | | | |
Money Market Funds - 96.4% | | | |
| | 2,687,249 | | | Dreyfus Government Cash
Management Institutional
Shares, 2.91% (a) | | $ | 2,687,249 | | |
| | 320,172 | | | Dreyfus Treasury Securities Cash
Management Institutional
Shares, 3.01% (a) | | | 320,172 | | |
| | 993,774 | | | Goldman Sachs Financial
Square Treasury Instruments
Fund Institutional Shares,
3.10% (a) | | | 993,774 | | |
| | | | | TOTAL SHORT TERM
INVESTMENTS
(Cost $4,001,195) (b) | | $ | 4,001,195 | | |
| | | | | TOTAL INVESTMENTS
(Cost $4,001,195) - 96.4% | | $ | 4,001,195 | | |
| | | | | Other Assets in Excess of
Liabilities - 3.6% | | | 148,567 | | |
| | | | | TOTAL NET ASSETS - 100.0% | | $ | 4,149,762 | | |
Percentages are stated as a percent of net assets.
The geographic location of all investments is United States unless otherwise indicated.
(a) Represents annualized seven-day yield at October 31, 2022.
(b) All or a portion of these securities have been segregated as collateral for swap contracts. Total value of securities segregated amounted to $1,313,946.
Short Total Return Swap Contracts
October 31, 2022
Terms of Payments
to be Received at
Termination | | Terms of Payments to be
Paid at Termination | | Counterparty | | Termination
Date | | Contracts | | Notional
Amount | | Unrealized
Appreciation | |
1.0400%
representing
1 month SOFR
rate + spread | | Total return of
common shares of
Alphabet, Inc. Class A | | Citibank N.A. | | 12/16/2022 | | | 19,206 | | | $ | 1,943,121 | | | $ | 129,381 | | |
3.0400%
representing
1 month SOFR
rate + spread | | Total return of
common shares of
Alphabet, Inc. Class A | | Goldman Sachs | | 10/10/2023 | | | 12,961 | | | | 1,337,555 | | | | 116,645 | | |
1.5400%
representing
1 month SOFR
rate + spread | | Total return of
common shares of
Alphabet, Inc. Class A | | Bank of America
Merrill Lynch | | 10/26/2023 | | | 11,741 | | | | 1,224,029 | | | | 116,766 | | |
| | | | | | | | | | | $ | 4,504,705 | | | $ | 362,792 | | |
The accompanying notes are an integral part of these financial statements.
DIREXION ANNUAL REPORT
67
Direxion Daily MSFT Bear 1X Shares
Schedule of Investments
October 31, 2022
Shares | | | | Fair Value | |
SHORT TERM INVESTMENTS - 99.0% | | | |
Money Market Funds - 99.0% | | | |
| | 2,542,893 | | | Dreyfus Government Cash
Management Institutional
Shares, 2.91% (a) | | $ | 2,542,893 | | |
| | 520,262 | | | Dreyfus Treasury Securities Cash
Management Institutional
Shares, 3.01% (a) | | | 520,262 | | |
| | 901,656 | | | Goldman Sachs Financial
Square Treasury Instruments
Fund Institutional Shares,
3.10% (a) | | | 901,656 | | |
| | | | | TOTAL SHORT TERM
INVESTMENTS
(Cost $3,964,811) (b) | | $ | 3,964,811 | | |
| | | | | TOTAL INVESTMENTS
(Cost $3,964,811) - 99.0% | | $ | 3,964,811 | | |
| | | | | Other Assets in Excess of
Liabilities - 1.0% | | | 41,367 | | |
| | | | | TOTAL NET ASSETS - 100.0% | | $ | 4,006,178 | | |
Percentages are stated as a percent of net assets.
The geographic location of all investments is United States unless otherwise indicated.
(a) Represents annualized seven-day yield at October 31, 2022.
(b) All or a portion of these securities have been segregated as collateral for swap contracts. Total value of securities segregated amounted to $1,421,918.
Short Total Return Swap Contracts
October 31, 2022
Terms of Payments
to be Received at
Termination | | Terms of Payments to be
Paid at Termination | | Counterparty | | Termination
Date | | Contracts | | Notional
Amount | | Unrealized
Appreciation | |
1.0400%
representing
1 month SOFR
rate + spread | | Total return of
common shares of
Microsoft Corp. | | Citibank N.A. | | 12/16/2022 | | | 5,484 | | | $ | 1,354,032 | | | $ | 82,371 | | |
3.0400%
representing
1 month SOFR
rate + spread | | Total return of
common shares of
Microsoft Corp. | | Goldman Sachs | | 10/10/2023 | | | 6,322 | | | | 1,547,516 | | | | 85,259 | | |
1.5400%
representing
1 month SOFR
rate + spread | | Total return of
common shares of
Microsoft Corp. | | Bank of America
Merrill Lynch | | 10/26/2023 | | | 5,452 | | | | 1,351,189 | | | | 88,029 | | |
| | | | | | | | | | | $ | 4,252,737 | | | $ | 255,659 | | |
The accompanying notes are an integral part of these financial statements.
DIREXION ANNUAL REPORT
68
Direxion Daily TSLA Bear 1X Shares
Schedule of Investments
October 31, 2022
Shares | | | | Fair Value | |
SHORT TERM INVESTMENTS - 91.1% | | | |
Money Market Funds - 91.1% | | | |
| | 6,754,838 | | | Dreyfus Government Cash
Management Institutional
Shares, 2.91% (a) | | $ | 6,754,838 | | |
| | 1,551,721 | | | Dreyfus Treasury Securities Cash
Management Institutional
Shares, 3.01% (a) | | | 1,551,721 | | |
| | 2,690,239 | | | Goldman Sachs Financial
Square Treasury Instruments
Fund Institutional Shares,
3.10% (a) | | | 2,690,239 | | |
| | | | | TOTAL SHORT TERM
INVESTMENTS
(Cost $10,996,798) (b) | | $ | 10,996,798 | | |
| | | | | TOTAL INVESTMENTS
(Cost $10,996,798) - 91.1% | | $ | 10,996,798 | | |
| | | | | Other Assets in Excess of
Liabilities - 8.9% | | | 1,074,662 | | |
| | | | | TOTAL NET ASSETS - 100.0% | | $ | 12,071,460 | | |
Percentages are stated as a percent of net assets.
The geographic location of all investments is United States unless otherwise indicated.
(a) Represents annualized seven-day yield at October 31, 2022.
(b) All or a portion of these securities have been segregated as collateral for swap contracts. Total value of securities segregated amounted to $5,284,237.
Short Total Return Swap Contracts
October 31, 2022
Terms of Payments
to be Received at
Termination | | Terms of Payments to be
Paid at Termination | | Counterparty | | Termination
Date | | Contracts | | Notional
Amount | | Unrealized
Appreciation | |
1.5400%
representing
1 month SOFR
rate + spread | | Total return of
common shares of
Tesla, Inc. | | BNP Paribas | | 12/15/2022 | | | 9,275 | | | $ | 2,773,668 | | | $ | 668,459 | | |
1.5400%
representing
1 month SOFR
rate + spread | | Total return of
common shares of
Tesla, Inc. | | Bank of America
Merrill Lynch | | 9/26/2023 | | | 17,100 | | | | 4,118,096 | | | | 232,193 | | |
3.0400%
representing
1 month SOFR
rate + spread | | Total return of
common shares of
Tesla, Inc. | | Goldman Sachs | | 12/6/2023 | | | 13,570 | | | | 3,245,160 | | | | 164,847 | | |
1.0400%
representing
1 month SOFR
rate + spread | | Total return of
common shares of
Tesla, Inc. | | Citibank N.A. | | 12/13/2023 | | | 13,106 | | | | 3,106,533 | | | | 126,510 | | |
| | | | | | | | | | | $ | 13,243,457 | | | $ | 1,192,009 | | |
The accompanying notes are an integral part of these financial statements.
DIREXION ANNUAL REPORT
69
Direxion Daily AAPL Bull 1.5X Shares
Schedule of Investments
October 31, 2022
Shares | | | | Fair Value | |
COMMON STOCKS - 19.6% | | | |
Computer and Electronic Product
Manufacturing - 19.6% | | | |
| | 9,116 | | | Apple, Inc. | | $ | 1,397,847 | | |
| | | | | TOTAL COMMON STOCKS
(Cost $1,470,976) | | $ | 1,397,847 | | |
SHORT TERM INVESTMENTS - 74.6% | | | |
Money Market Funds - 74.6% | | | |
| | 2,509,898 | | | Dreyfus Government Cash
Management Institutional
Shares, 2.91% (b) | | $ | 2,509,898 | | |
| | 961,644 | | | Dreyfus Treasury Securities Cash
Management Institutional
Shares, 3.01% (b) | | | 961,644 | | |
| | 1,829,681 | | | Goldman Sachs Financial
Square Treasury Instruments
Fund Institutional Shares,
3.10% (b) | | | 1,829,681 | | |
| | | | | TOTAL SHORT TERM
INVESTMENTS
(Cost $5,301,223) | | $ | 5,301,223 | | |
| | | | | TOTAL INVESTMENTS
(Cost $6,772,199) - 94.2% (c) | | $ | 6,699,070 | | |
| | | | | Other Assets in Excess of
Liabilities - 5.8% | | | 408,772 | | |
| | | | | TOTAL NET ASSETS - 100.0% | | $ | 7,107,842 | | |
Percentages are stated as a percent of net assets.
The geographic location of all investments is United States unless otherwise indicated.
(b) Represents annualized seven-day yield at October 31, 2022.
(c) All or a portion of these securities have been segregated as collateral for swap contracts. Total value of securities segregated amounted to $3,443,039.
Long Total Return Swap Contracts
October 31, 2022
Terms of Payments
to be Received at
Termination | | Terms of Payments to be
Paid at Termination | | Counterparty | | Termination
Date | | Contracts | | Notional
Amount | | Unrealized
Appreciation
(Depreciation) | |
Total return of
common shares of
Apple, Inc. | | 5.0400% representing
1 month SOFR rate +
spread | | BNP Paribas | | 12/15/2022 | | | 7,400 | | | $ | 1,228,249 | | | $ | (106,545 | ) | |
Total return of
common shares of
Apple, Inc. | | 5.5400% representing
1 month SOFR rate +
spread | | Citibank N.A. | | 12/16/2022 | | | 22,023 | | | | 3,263,538 | | | | 103,875 | | |
Total return of
common shares of
Apple, Inc. | | 4.0400% representing
1 month SOFR rate +
spread | | Goldman Sachs | | 9/11/2023 | | | 12,264 | | | | 2,009,803 | | | | (144,148 | ) | |
Total return of
common shares of
Apple, Inc. | | 5.5400% representing
1 month SOFR rate +
spread | | Bank of America
Merrill Lynch | | 9/26/2023 | | | 18,727 | | | | 2,820,848 | | | | 35,151 | | |
| | | | | | | | | | | $ | 9,322,438 | | | $ | (111,667 | ) | |
The accompanying notes are an integral part of these financial statements.
DIREXION ANNUAL REPORT
70
Direxion Daily AMZN Bull 1.5X Shares
Schedule of Investments
October 31, 2022
Shares | | | | Fair Value | |
COMMON STOCKS - 18.4% | | | |
General Merchandise Retailers - 18.4% | | | |
| | 11,242 | | | Amazon.com, Inc. (a) | | $ | 1,151,631 | | |
| | | | | TOTAL COMMON STOCKS
(Cost $1,264,873) | | $ | 1,151,631 | | |
SHORT TERM INVESTMENTS - 78.0% | | | |
Money Market Funds - 78.0% | | | |
| | 2,329,884 | | | Dreyfus Government Cash
Management Institutional
Shares, 2.91% (b) | | $ | 2,329,884 | | |
| | 990,578 | | | Dreyfus Treasury Securities Cash
Management Institutional
Shares, 3.01% (b) | | | 990,578 | | |
| | 1,563,992 | | | Goldman Sachs Financial
Square Treasury Instruments
Fund Institutional Shares,
3.10% (b) | | | 1,563,992 | | |
| | | | | TOTAL SHORT TERM
INVESTMENTS
(Cost $4,884,454) | | $ | 4,884,454 | | |
| | | | | TOTAL INVESTMENTS
(Cost $6,149,327) - 96.4% (c) | | $ | 6,036,085 | | |
| | | | | Other Assets in Excess of
Liabilities - 3.6% | | | 226,258 | | |
| | | | | TOTAL NET ASSETS - 100.0% | | $ | 6,262,343 | | |
Percentages are stated as a percent of net assets.
The geographic location of all investments is United States unless otherwise indicated.
(a) Non-income producing security.
(b) Represents annualized seven-day yield at October 31, 2022.
(c) All or a portion of these securities have been segregated as collateral for swap contracts. Total value of securities segregated amounted to $2,284,570.
Long Total Return Swap Contracts
October 31, 2022
Terms of Payments
to be Received at
Termination | | Terms of Payments to be
Paid at Termination | | Counterparty | | Termination
Date | | Contracts | | Notional
Amount | | Unrealized
Depreciation | |
Total return of
common shares of
Amazon.com, Inc. | | 6.0400% representing
1 month SOFR rate +
spread | | Citibank N.A. | | 12/16/2022 | | | 29,146 | | | $ | 3,263,195 | | | $ | (289,775 | ) | |
Total return of
common shares of
Amazon.com, Inc. | | 4.2900% representing
1 month SOFR rate +
spread | | Goldman Sachs | | 10/10/2023 | | | 25,814 | | | | 2,926,206 | | | | (291,066 | ) | |
Total return of
common shares of
Amazon.com, Inc. | | 5.5400% representing
1 month SOFR rate +
spread | | Bank of America
Merrill Lynch | | 10/26/2023 | | | 25,500 | | | | 2,878,187 | | | | (276,424 | ) | |
| | | | | | | | | | | $ | 9,067,588 | | | $ | (857,265 | ) | |
The accompanying notes are an integral part of these financial statements.
DIREXION ANNUAL REPORT
71
Direxion Daily GOOGL Bull 1.5X Shares
Schedule of Investments
October 31, 2022
Shares | | | | Fair Value | |
COMMON STOCKS - 16.5% | | | |
Web Search Portals, Libraries, Archives,
and Other Information Services - 16.5% | | | |
| | 8,008 | | | Alphabet, Inc. Class A (a) | | $ | 756,836 | | |
| | | | | TOTAL COMMON STOCKS
(Cost $823,420) | | $ | 756,836 | | |
SHORT TERM INVESTMENTS - 95.6% | | | |
Money Market Funds - 95.6% | | | |
| | 1,962,763 | | | Dreyfus Government Cash
Management Institutional
Shares, 2.91% (b) | | $ | 1,962,763 | | |
| | 600,479 | | | Dreyfus Treasury Securities Cash
Management Institutional
Shares, 3.01% (b) | | | 600,479 | | |
| | 1,827,167 | | | Goldman Sachs Financial
Square Treasury Instruments
Fund Institutional Shares,
3.10% (b) | | | 1,827,167 | | |
| | | | | TOTAL SHORT TERM
INVESTMENTS
(Cost $4,390,409) (c) | | $ | 4,390,409 | | |
| | | | | TOTAL INVESTMENTS
(Cost $5,213,829) - 112.1% | | $ | 5,147,245 | | |
| | | | | Liabilities in Excess of
Other Assets - (12.1)% | | | (553,780 | ) | |
| | | | | TOTAL NET ASSETS - 100.0% | | $ | 4,593,465 | | |
Percentages are stated as a percent of net assets.
The geographic location of all investments is United States unless otherwise indicated.
(a) Non-income producing security.
(b) Represents annualized seven-day yield at October 31, 2022.
(c) All or a portion of these securities have been segregated as collateral for swap contracts. Total value of securities segregated amounted to $2,427,647.
Long Total Return Swap Contracts
October 31, 2022
Terms of Payments
to be Received at
Termination | | Terms of Payments
to be Paid
at Termination | | Counterparty | | Termination
Date | | Contracts | | Notional
Amount | | Unrealized
Depreciation | |
Total return of
common shares of
Alphabet, Inc. Class A | | 5.5400% representing
1 month SOFR
rate + spread | | Citibank N.A. | | 12/16/2022 | | | 31,886 | | | $ | 3,229,275 | | | $ | (228,271 | ) | |
Total return of
common shares of
Alphabet, Inc. Class A | | 4.2900% representing
1 month SOFR
rate + spread | | Goldman Sachs | | 10/10/2023 | | | 19,504 | | | | 1,987,577 | | | | (152,510 | ) | |
Total return of
common shares of
Alphabet, Inc. Class A | | 5.5400% representing
1 month SOFR
rate + spread | | Bank of
America
Merrill Lynch | | 10/26/2023 | | | 13,507 | | | | 1,424,768 | | | | (158,455 | ) | |
| | | | | | | | | | | $ | 6,641,620 | | | $ | (539,236 | ) | |
The accompanying notes are an integral part of these financial statements.
DIREXION ANNUAL REPORT
72
Direxion Daily MSFT Bull 1.5X Shares
Schedule of Investments
October 31, 2022
Shares | | | | Fair Value | |
COMMON STOCKS - 20.3% | | | |
Publishing Industries - 20.3% | | | |
| | 2,824 | | | Microsoft Corp. | | $ | 655,535 | | |
| | | | | TOTAL COMMON STOCKS
(Cost $707,576) | | $ | 655,535 | | |
SHORT TERM INVESTMENTS - 89.1% | | | |
Money Market Funds - 89.1% | | | |
| | 1,375,944 | | | Dreyfus Government Cash
Management Institutional
Shares, 2.91% (a) | | $ | 1,375,944 | | |
| | 320,451 | | | Dreyfus Treasury Securities Cash
Management Institutional
Shares, 3.01% (a) | | | 320,451 | | |
| | 1,180,491 | | | Goldman Sachs Financial
Square Treasury Instruments
Fund Institutional Shares,
3.10% (a) | | | 1,180,491 | | |
| | | | | TOTAL SHORT TERM
INVESTMENTS
(Cost $2,876,886) (b) | | $ | 2,876,886 | | |
| | | | | TOTAL INVESTMENTS
(Cost $3,584,462) - 109.4% | | $ | 3,532,421 | | |
| | | | | Liabilities in Excess of
Other Assets - (9.4)% | | | (301,843 | ) | |
| | | | | TOTAL NET ASSETS - 100.0% | | $ | 3,230,578 | | |
Percentages are stated as a percent of net assets.
The geographic location of all investments is United States unless otherwise indicated.
(a) Represents annualized seven-day yield at October 31, 2022.
(b) All or a portion of these securities have been segregated as collateral for swap contracts. Total value of securities segregated amounted to $1,500,942.
Long Total Return Swap Contracts
October 31, 2022
Terms of Payments
to be Received
at Termination | | Terms of Payments to be
Paid at Termination | | Counterparty | | Termination
Date | | Contracts | | Notional
Amount | | Unrealized
Depreciation | |
Total return of
common shares of
Microsoft Corp. | |
5.5400% representing
1 month SOFR rate + spread | | Citibank N.A. | | 12/16/2022 | | | 4,990 | | | $ | 1,254,780 | | | $ | (105,284 | ) | |
Total return of
common shares of
Microsoft Corp. | |
4.2900% representing
1 month SOFR rate + spread | | Goldman Sachs | | 10/10/2023 | | | 6,469 | | | | 1,572,520 | | | | (77,683 | ) | |
Total return of
common shares of
Microsoft Corp. | |
5.5400% representing
1 month SOFR rate + spread | | Bank of America
Merrill Lynch | | 10/26/2023 | | | 6,593 | | | | 1,636,293 | | | | (116,939 | ) | |
| | | | | | | | | | | $ | 4,463,593 | | | $ | (299,906 | ) | |
The accompanying notes are an integral part of these financial statements.
DIREXION ANNUAL REPORT
73
Direxion Daily TSLA Bull 1.5X Shares
Schedule of Investments
October 31, 2022
Shares | | | | Fair Value | |
COMMON STOCKS - 18.5% | | | |
Transportation Equipment Manufacturing - 18.5% | | | |
| | 81,763 | | | Tesla, Inc. (a) | | $ | 18,604,353 | | |
| | | | | TOTAL COMMON STOCKS
(Cost $20,549,744) | | $ | 18,604,353 | | |
SHORT TERM INVESTMENTS - 97.2% | | | |
Money Market Funds - 97.2% | | | |
| | 36,410,027 | | | Dreyfus Government Cash
Management Institutional
Shares, 2.91% (b) | | $ | 36,410,027 | | |
| | 20,872,672 | | | Dreyfus Treasury Securities
Cash Management
Institutional Shares, 3.01% (b) | | | 20,872,672 | | |
| | 40,181,176 | | | Goldman Sachs Financial Square
Treasury Instruments Fund
Institutional Shares, 3.10% (b) | | | 40,181,176 | | |
| | | | | TOTAL SHORT TERM
INVESTMENTS
(Cost $97,463,875) | | $ | 97,463,875 | | |
| | | | | TOTAL INVESTMENTS
(Cost $118,013,619) -
115.7% (c) | | $ | 116,068,228 | | |
| | | | | Liabilities in Excess of
Other Assets - (15.7)% | | | (15,782,673 | ) | |
| | | | | TOTAL NET ASSETS - 100.0% | | $ | 100,285,555 | | |
Percentages are stated as a percent of net assets.
The geographic location of all investments is United States unless otherwise indicated.
(a) Non-income producing security.
(b) Represents annualized seven-day yield at October 31, 2022.
(c) All or a portion of these securities have been segregated as collateral for swap contracts. Total value of securities segregated amounted to $72,208,939.
Long Total Return Swap Contracts
October 31, 2022
Terms of Payments
to be Received at
Termination | | Terms of Payments to be
Paid at Termination | | Counterparty | | Termination
Date | | Contracts | | Notional
Amount | | Unrealized
Depreciation | |
Total return of
common shares
of Tesla, Inc. | | 5.0400% representing
1 month SOFR rate + spread | | BNP Paribas | | 12/15/2022 | | | 67,075 | | | $ | 19,251,241 | | | $ | (4,128,038 | ) | |
Total return of
common shares
of Tesla, Inc. | | 6.0400% representing
1 month SOFR rate + spread | | Citibank N.A. | | 12/16/2022 | | | 193,819 | | | | 49,858,496 | | | | (6,037,930 | ) | |
Total return of
common shares
of Tesla, Inc. | | 6.5400% representing
1 month SOFR rate + spread | | Goldman Sachs | | 9/11/2023 | | | 159,951 | | | | 40,779,676 | | | | (4,677,681 | ) | |
Total return of
common shares
of Tesla, Inc. | | 5.5400% representing
1 month SOFR rate + spread | | Bank of America
Merrill Lynch | | 9/26/2023 | | | 158,500 | | | | 39,058,859 | | | | (3,175,885 | ) | |
| | | | | | | | | | | $ | 148,948,272 | | | $ | (18,019,534 | ) | |
The accompanying notes are an integral part of these financial statements.
DIREXION ANNUAL REPORT
74
Direxion Daily CSI 300 China A Share Bull 2X Shares
Schedule of Investments
October 31, 2022
Shares | | | | Fair Value | |
INVESTMENT COMPANIES - 6.0% | | | |
| | 96,325 | | | Deutsche Xtrackers Harvest
CSI 300 China A-Shares ETF (a) | | $ | 2,332,992 | | |
| | | | | TOTAL INVESTMENT
COMPANIES
(Cost $2,913,503) | | $ | 2,332,992 | | |
SHORT TERM INVESTMENTS - 139.7% | | | |
Money Market Funds - 139.7% | | | |
| | 40,568,703 | | | Dreyfus Government Cash
Management Institutional
Shares, 2.91% (b) | | $ | 40,568,703 | | |
| | 14,062,892 | | | Goldman Sachs Financial
Square Treasury Instruments
Fund Institutional Shares,
3.10% (b) | | | 14,062,892 | | |
| | | | | TOTAL SHORT TERM
INVESTMENTS
(Cost $54,631,595) (c) | | $ | 54,631,595 | | |
| | | | | TOTAL INVESTMENTS
(Cost $57,545,098) - 145.6% | | $ | 56,964,587 | | |
| | | | | Liabilities in Excess of
Other Assets - (45.6)% | | | (17,845,358 | ) | |
| | | | | TOTAL NET ASSETS - 100.0% | | $ | 39,119,229 | | |
Percentages are stated as a percent of net assets.
The geographic location of all investments is United States unless otherwise indicated.
(a) Shareholders may obtain the financial statements of these investment companies at www.sec.gov.
(b) Represents annualized seven-day yield at October 31, 2022.
(c) All or a portion of these securities have been segregated as collateral for swap contracts. Total value of securities segregated amounted to $32,018,173.
Long Total Return Swap Contracts
October 31, 2022
Terms of Payments
to be Received at
Termination | | Terms of Payments
to be Paid/(Received)
at Termination | | Counterparty | | Termination
Date | | Contracts | | Notional
Amount | | Unrealized
Depreciation | |
Total return of
Deutsche Xtrackers
Harvest CSI 300
China A-Shares ETF | |
0.0400% representing
1 month SOFR rate + spread | | Citibank N.A. | | 12/13/2022 | | | 747,470 | | | $ | 21,639,037 | | | $ | (3,397,206 | ) | |
Total return of
Deutsche Xtrackers
Harvest CSI 300
China A-Shares ETF | |
1.0400% representing
1 month SOFR rate + spread | | J.P. Morgan | | 12/13/2022 | | | 773,960 | | | | 21,500,631 | | | | (2,772,620 | ) | |
Total return of
Deutsche Xtrackers
Harvest CSI 300
China A-Shares ETF | |
(3.0500)% representing
1 month SOFR rate + spread | | UBS Securities
LLC | | 12/14/2022 | | | 1,612,609 | | | | 50,739,665 | | | | (10,980,156 | ) | |
| | | | | | | | | | | $ | 93,879,333 | | | $ | (17,149,982 | ) | |
The accompanying notes are an integral part of these financial statements.
DIREXION ANNUAL REPORT
75
Direxion Daily CSI China Internet Index Bull 2X Shares
Schedule of Investments
October 31, 2022
Shares | | | | Fair Value | |
INVESTMENT COMPANIES - 46.6% | | | |
| | 3,928,723 | | | KraneShares CSI China
Internet ETF (a) | | $ | 75,431,482 | | |
| | | | | TOTAL INVESTMENT
COMPANIES
(Cost $96,544,012) | | $ | 75,431,482 | | |
SHORT TERM INVESTMENTS - 105.9% | | | |
Money Market Funds - 105.9% | | | |
| | 94,241,078 | | | Dreyfus Government Cash
Management Institutional
Shares, 2.91% (b) | | $ | 94,241,078 | | |
| | 27,363,182 | | | Dreyfus Treasury Securities
Cash Management
Institutional Shares, 3.01% (b) | | | 27,363,182 | | |
| | 49,933,344 | | | Goldman Sachs Financial Square
Treasury Instruments Fund
Institutional Shares, 3.10% (b) | | | 49,933,344 | | |
| | | | | TOTAL SHORT TERM
INVESTMENTS
(Cost $171,537,604) | | $ | 171,537,604 | | |
| | | | | TOTAL INVESTMENTS
(Cost $268,081,616) -
152.5% (c) | | $ | 246,969,086 | | |
| | | | | Liabilities in Excess of
Other Assets - (52.5)% | | | (84,995,460 | ) | |
| | | | | TOTAL NET ASSETS - 100.0% | | $ | 161,973,626 | | |
Percentages are stated as a percent of net assets.
The geographic location of all investments is United States unless otherwise indicated.
(a) Shareholders may obtain the financial statements of these investment companies at www.sec.gov.
(b) Represents annualized seven-day yield at October 31, 2022.
(c) All or a portion of these securities have been segregated as collateral for swap contracts. Total value of securities segregated amounted to $195,198,653.
Long Total Return Swap Contracts
October 31, 2022
Terms of Payments
to be Received at
Termination | | Terms of Payments to be
Paid at Termination | | Counterparty | | Termination
Date | | Contracts | | Notional
Amount | | Unrealized
Depreciation | |
Total return of
KraneShares CSI
China Internet ETF | | 3.4400% representing
1 month SOFR rate + spread | | Citibank N.A. | | 12/13/2022 | | | 2,737,277 | | | $ | 65,234,056 | | | $ | (12,962,468 | ) | |
Total return of
KraneShares CSI
China Internet ETF | | 3.7800% representing
1 month SOFR rate + spread | | UBS Securities
LLC | | 12/14/2022 | | | 2,778,115 | | | | 79,926,492 | | | | (27,261,841 | ) | |
Total return of
KraneShares CSI
China Internet ETF | | 3.4300% representing
1 month SOFR rate + spread | | BNP Paribas | | 12/15/2022 | | | 2,481,258 | | | | 62,018,023 | | | | (14,542,291 | ) | |
Total return of
KraneShares CSI
China Internet ETF | | 3.5900% representing
1 month SOFR rate + spread | | Bank of America
Merrill Lynch | | 2/23/2023 | | | 2,453,915 | | | | 61,210,305 | | | | (14,826,952 | ) | |
Total return of
KraneShares CSI
China Internet ETF | | 3.5900% representing
1 month SOFR rate + spread | | Goldman Sachs | | 4/25/2023 | | | 2,493,789 | | | | 62,338,237 | | | | (15,030,362 | ) | |
| | | | | | | | | | | $ | 330,727,113 | | | $ | (84,623,914 | ) | |
The accompanying notes are an integral part of these financial statements.
DIREXION ANNUAL REPORT
76
Direxion Daily S&P 500® Bull 2X Shares
Schedule of Investments
October 31, 2022
Shares | | | | Fair Value | |
INVESTMENT COMPANIES - 95.5% | | | |
| | 123,418 | | | iShares Core S&P 500 ETF (a) | | $ | 47,860,266 | | |
| | | | | TOTAL INVESTMENT
COMPANIES
(Cost $43,731,739) | �� | $ | 47,860,266 | | |
SHORT TERM INVESTMENTS - 6.8% | | | |
Money Market Funds - 6.8% | | | |
| | 1,009,706 | | | Dreyfus Government Cash
Management Institutional
Shares, 2.91% (b) | | $ | 1,009,706 | | |
| | 2,380,082 | | | Goldman Sachs Financial
Square Treasury Instruments
Fund Institutional Shares,
3.10% (b) | | | 2,380,082 | | |
| | | | | TOTAL SHORT TERM
INVESTMENTS
(Cost $3,389,788) | | $ | 3,389,788 | | |
| | | | | TOTAL INVESTMENTS
(Cost $47,121,527) - 102.3% (c) | | $ | 51,250,054 | | |
| | | | | Liabilities in Excess of
Other Assets - (2.3)% | | | (1,110,864 | ) | |
| | | | | TOTAL NET ASSETS - 100.0% | | $ | 50,139,190 | | |
Percentages are stated as a percent of net assets.
The geographic location of all investments is United States unless otherwise indicated.
(a) Shareholders may obtain the financial statements of these investment companies at www.sec.gov.
(b) Represents annualized seven-day yield at October 31, 2022.
(c) All or a portion of these securities have been segregated as collateral for swap contracts. Total value of securities segregated amounted to $33,821,949.
Long Total Return Swap Contracts
October 31, 2022
Terms of Payments
to be Received at
Termination | | Terms of Payments to be
Paid at Termination | | Counterparty | | Termination
Date | | Contracts | | Notional
Amount | | Unrealized
Appreciation | |
Total return of
S&P 500® Index | | 3.2900% representing
1 month SOFR rate + spread | | Citibank N.A. | | 12/13/2022 | | | 11,703 | | | $ | 43,167,078 | | | $ | 2,110,001 | | |
Total return of
S&P 500® Index | | 3.6100% representing
1 month SOFR rate + spread | | UBS Securities
LLC | | 12/14/2022 | | | 1,836 | | | | 6,683,903 | | | | 398,437 | | |
| | | | | | | | | $ | 49,850,981 | | | $ | 2,508,438 | | |
The accompanying notes are an integral part of these financial statements.
DIREXION ANNUAL REPORT
77
Direxion Daily S&P 500 Equal Weight Bull 2X Shares
Schedule of Investments
October 31, 2022
Shares | | | | Fair Value | |
INVESTMENT COMPANIES - 66.2% | |
| | 17,900 | | | Invesco S&P 500® Equal
Weight ETF (a)(b) | | $ | 2,498,124 | | |
| | | TOTAL INVESTMENT
COMPANIES
(Cost $2,816,905) | | $ | 2,498,124 | | |
SHORT TERM INVESTMENTS - 64.3% | |
Money Market Funds - 64.3% | |
| | 2,423,886 | | | Dreyfus Government Cash
Management Institutional
Shares, 2.91% (c)(d) | | $ | 2,423,886 | | |
| | | TOTAL SHORT TERM
INVESTMENTS
(Cost $2,423,886) | | $ | 2,423,886 | | |
| | | TOTAL INVESTMENTS
(Cost $5,240,791) - 130.5% (e) | | $ | 4,922,010 | | |
| | | Liabilities in Excess of
Other Assets - (30.5)% | | | (1,150,089 | ) | |
| | | TOTAL NET ASSETS - 100.0% | | $ | 3,771,921 | | |
Percentages are stated as a percent of net assets.
The geographic location of all investments is United States unless otherwise indicated.
(a) Shareholders may obtain the financial statements of these investment companies at www.sec.gov.
(b) A portion of this security represents a security on loan.
(c) Represents annualized seven-day yield at October 31, 2022.
(d) All or a portion of this security represents an investment of securities lending collateral.
(e) All or a portion of these securities have been segregated as collateral for swap contracts. Total value of securities segregated amounted to $768,657.
Long Total Return Swap Contracts
October 31, 2022
Terms of Payments
to be Received
at Termination | | Terms of Payments to be
Paid at Termination | | Counterparty | | Termination
Date | | Contracts | | Notional
Amount | | Unrealized
Depreciation | |
Total return of
S&P 500® Equal
Weight Index | |
3.6400% representing
1 month SOFR rate + spread | | UBS Securities LLC | | 12/14/2022 | | | 882 | | | $ | 4,988,630 | | | $ | (1,727 | ) | |
Total return of
S&P 500® Equal
Weight Index | |
3.5900% representing
1 month SOFR rate + spread | | Barclays | | 4/3/2023 | | | 8 | | | | 49,273 | | | | (4,007 | ) | |
| | | | | | | | | $ | 5,037,903 | | | $ | (5,734 | ) | |
The accompanying notes are an integral part of these financial statements.
DIREXION ANNUAL REPORT
78
Direxion Daily MSCI Brazil Bull 2X Shares
Schedule of Investments
October 31, 2022
Shares | | | | Fair Value | |
INVESTMENT COMPANIES - 27.4% | | | |
| | 1,164,806 | | | iShares MSCI Brazil
Capped ETF (a)(b) | | $ | 38,054,212 | | |
| | | | | TOTAL INVESTMENT
COMPANIES
(Cost $41,765,556) | | $ | 38,054,212 | | |
SHORT TERM INVESTMENTS - 68.3% | | | |
Money Market Funds - 68.3% | | | |
| | 77,456,208 | | | Dreyfus Government Cash
Management Institutional
Shares, 2.91% (c)(d) | | $ | 77,456,208 | | |
| | 1,425 | | | Goldman Sachs Financial Square
Government Fund
Institutional Shares, 3.07% (c) | | | 1,425 | | |
| | 17,463,908 | | | Goldman Sachs Financial Square
Treasury Instruments Fund
Institutional Shares, 3.10% (c) | | | 17,463,908 | | |
| | | | | TOTAL SHORT TERM
INVESTMENTS
(Cost $94,921,541) | | $ | 94,921,541 | | |
| | | | | TOTAL INVESTMENTS
(Cost $136,687,097) - 95.7% (e) | | $ | 132,975,753 | | |
| | | | | Other Assets in Excess of
Liabilities - 4.3% | | | 5,977,987 | | |
| | | | | TOTAL NET ASSETS - 100.0% | | $ | 138,953,740 | | |
Percentages are stated as a percent of net assets.
The geographic location of all investments is United States unless otherwise indicated.
(a) Shareholders may obtain the financial statements of these investment companies at www.sec.gov.
(b) A portion of this security represents a security on loan.
(c) Represents annualized seven-day yield at October 31, 2022.
(d) All or a portion of this security represents an investment of securities lending collateral.
(e) All or a portion of these securities have been segregated as collateral for swap contracts. Total value of securities segregated amounted to $60,699,375.
Long Total Return Swap Contracts
October 31, 2022
Terms of Payments
to be Received at
Termination | | Terms of Payments to be
Paid at Termination | | Counterparty | | Termination
Date | | Contracts | | Notional
Amount | | Unrealized
Appreciation | |
Total return of
iShares MSCI
Brazil Capped ETF | |
3.7900% representing
1 month SOFR rate + spread | | Barclays | | 12/7/2022 | | | 642,698 | | | $ | 20,360,596 | | | $ | 1,073,747 | | |
Total return of
iShares MSCI
Brazil Capped ETF | |
3.6300% representing
1 month SOFR rate + spread | | BNP Paribas | | 12/15/2022 | | | 1,828,497 | | | | 49,936,253 | | | | 9,326,753 | | |
Total return of
iShares MSCI
Brazil Capped ETF | |
2.5400% representing
1 month SOFR rate + spread | | J.P. Morgan | | 5/4/2023 | | | 2,760,020 | | | | 86,075,214 | | | | 4,417,267 | | |
Total return of
iShares MSCI
Brazil Capped ETF | |
3.1800% representing
1 month SOFR rate + spread | | UBS Securities LLC | | 12/11/2023 | | | 2,110,595 | | | | 68,251,081 | | | | 641,872 | | |
| | | | | | | | | | | $ | 224,623,144 | | | $ | 15,459,639 | | |
The accompanying notes are an integral part of these financial statements.
DIREXION ANNUAL REPORT
79
Direxion Daily MSCI India Bull 2X Shares
Schedule of Investments
October 31, 2022
Shares | | | | Fair Value | |
INVESTMENT COMPANIES - 41.5% | | | |
| | 514,503 | | | iShares MSCI India ETF (a)(b) | | $ | 21,712,026 | | |
| | | | | TOTAL INVESTMENT
COMPANIES
(Cost $25,365,968) | | $ | 21,712,026 | | |
SHORT TERM INVESTMENTS - 90.5% | | | |
Money Market Funds - 90.5% | | | |
| | 35,137,998 | | | Dreyfus Government Cash
Management Institutional
Shares, 2.91% (c)(d) | | $ | 35,137,998 | | |
| | 4,630,077 | | | Goldman Sachs Financial Square
Government Fund Institutional
Shares, 3.07% (c) | | | 4,630,077 | | |
| | 7,608,600 | | | Goldman Sachs Financial Square
Treasury Instruments Fund
Institutional Shares, 3.10% (c) | | | 7,608,600 | | |
| | | | | TOTAL SHORT TERM
INVESTMENTS
(Cost $47,376,675) (e) | | $ | 47,376,675 | | |
| | | | | TOTAL INVESTMENTS
(Cost $72,742,643) - 132.0% | | $ | 69,088,701 | | |
| | | | | Liabilities in Excess of
Other Assets - (32.0)% | | | (16,727,871 | ) | |
| | | | | TOTAL NET ASSETS - 100.0% | | $ | 52,360,830 | | |
Percentages are stated as a percent of net assets.
The geographic location of all investments is United States unless otherwise indicated.
(a) Shareholders may obtain the financial statements of these investment companies at www.sec.gov.
(b) A portion of this security represents a security on loan.
(c) Represents annualized seven-day yield at October 31, 2022.
(d) All or a portion of this security represents an investment of securities lending collateral.
(e) All or a portion of these securities have been segregated as collateral for swap contracts. Total value of securities segregated amounted to $15,475,112.
Long Total Return Swap Contracts
October 31, 2022
Terms of Payments
to be Received at
Termination | | Terms of Payments to be
Paid at Termination | | Counterparty | | Termination
Date | | Contracts | | Notional
Amount | | Unrealized
Appreciation | |
Total return of
iShares MSCI
India ETF | |
3.8400% representing
1 month SOFR rate + spread | | Barclays | | 12/7/2022 | | | 537,057 | | | $ | 22,361,151 | | | $ | 265,297 | | |
Total return of
iShares MSCI
India ETF | |
3.6900% representing
1 month SOFR rate + spread | | Citibank N.A. | | 12/13/2022 | | | 900,000 | | | | 37,774,497 | | | | 433,361 | | |
Total return of
iShares MSCI
India ETF | |
3.8300% representing
1 month SOFR rate + spread | | UBS Securities LLC | | 12/14/2022 | | | 530,000 | | | | 21,564,349 | | | | 615,550 | | |
| | | | | | | | | | | $ | 81,699,997 | | | $ | 1,314,208 | | |
The accompanying notes are an integral part of these financial statements.
DIREXION ANNUAL REPORT
80
Direxion Daily Cloud Computing Bull 2X Shares
Schedule of Investments
October 31, 2022
Shares | | | | Fair Value | |
COMMON STOCKS - 81.8% | | | |
Administrative and Support Services - 0.9% | | | |
| | 684 | | | Alarm.com, Inc. (a) | | $ | 40,247 | | |
| | 861 | | | nCino, Inc. (a) | | | 27,104 | | |
| | | | 67,351 | | |
Computer and Electronic Product Manufacturing - 0.2% | | | |
| | 583 | | | Radware Ltd. ADR (Israel) (a) | | | 13,421 | | |
Data Processing, Hosting and Related Services - 5.6% | | | |
| | 975 | | | Five9, Inc. (a) | | | 58,754 | | |
| | 1,187 | | | RingCentral, Inc. (a) | | | 42,162 | | |
| | 2,966 | | | VMware, Inc. | | | 333,764 | | |
| | | | 434,680 | | |
Heavy and Civil Engineering Construction - 0.6% | | | |
| | 775 | | | BlackLine, Inc. (a) | | | 43,400 | | |
Professional, Scientific, and Technical Services - 26.1% | | | |
| | 1,058 | | | 2U, Inc. (a) | | | 6,549 | | |
| | 644 | | | DigitalOcean Holdings, Inc. (a) | | | 23,132 | | |
| | 970 | | | Freshworks Inc. (a) | | | 13,182 | | |
| | 966 | | | LivePerson, Inc. (a) | | | 10,211 | | |
| | 466 | | | Model N, Inc. (a) | | | 17,708 | | |
| | 3,128 | | | Nutanix, Inc. (a) | | | 85,707 | | |
| | 731 | | | Paycom Software, Inc. (a) | | | 252,926 | | |
| | 572 | | | Paylocity Holding Corp. (a) | | | 132,584 | | |
| | 580 | | | PROS Holdings, Inc. (a) | | | 14,471 | | |
| | 3,893 | | | SAP SE ADR (Germany) | | | 373,962 | | |
| | 747 | | | ServiceNow, Inc. (a) | | | 314,293 | | |
| | 1,902 | | | Snowflake, Inc. (a) | | | 304,891 | | |
| | 934 | | | Unisys Corp. (a) | | | 7,939 | | |
| | 2,084 | | | Vimeo, Inc. (a) | | | 7,919 | | |
| | 1,797 | | | Workday, Inc. (a) | | | 280,008 | | |
| | 1,176 | | | Zscaler, Inc. (a) | | | 181,222 | | |
| | | | 2,026,704 | | |
Publishing Industries (except Internet) - 44.9% | | | |
| | 1,628 | | | ACI Worldwide, Inc. (a) | | | 39,609 | | |
| | 1,003 | | | Adobe Systems, Inc. (a) | | | 319,455 | | |
| | 2,264 | | | Akamai Technologies, Inc. (a) | | | 199,979 | | |
| | 255 | | | AppFolio, Inc. (a) | | | 31,969 | | |
| | 2,032 | | | Autodesk, Inc. (a) | | | 435,458 | | |
| | 1,374 | | | Bill.com Holdings, Inc. (a) | | | 183,237 | | |
| | 619 | | | Blackbaud, Inc. (a) | | | 33,859 | | |
| | 1,990 | | | Box, Inc. (a) | | | 57,810 | | |
| | 1,123 | | | C3.ai, Inc. (a) | | | 14,723 | | |
| | 519 | | | Clearwater Analytics Holdings, Inc. (a) | | | 8,455 | | |
| | 1,069 | | | Coupa Software, Inc. (a) | | | 56,903 | | |
| | 1,938 | | | CrowdStrike Holdings, Inc. (a) | | | 312,406 | | |
| | 2,791 | | | DocuSign, Inc. (a) | | | 134,805 | | |
| | 3,923 | | | Dropbox, Inc. (a) | | | 85,325 | | |
| | 482 | | | Enfusion, Inc. (a)(b) | | | 6,830 | | |
| | 557 | | | Everbridge, Inc. (a) | | | 17,451 | | |
| | 1,548 | | | Informatica, Inc. (a)(b) | | | 29,969 | | |
| | 131 | | | MicroStrategy, Inc. Class A (a)(b) | | | 35,044 | | |
| | 5,266 | | | Oracle Corp. | | | 411,117 | | |
| | 679 | | | Paycor HCM, Inc. (a) | | | 20,689 | | |
| | 499 | | | Qualys, Inc. (a) | | | 71,137 | | |
| | 2,024 | | | Salesforce.com, Inc. (a) | | | 329,082 | | |
| | 514 | | | SPS Commerce, Inc. (a) | | | 65,031 | | |
| | 4,797 | | | Tuya, Inc. ADR (China) (a) | | | 4,287 | | |
Shares | | | | Fair Value | |
Publishing Industries (except Internet) (continued) | | | |
| | 2,425 | | | Twilio, Inc. (a) | | $ | 180,347 | | |
| | 384 | | | Upland Software, Inc. (a) | | | 3,087 | | |
| | 1,988 | | | Veeva Systems, Inc. (a) | | | 333,865 | | |
| | 758 | | | VTEX ADR (United Kingdom) (a) | | | 3,168 | | |
| | 620 | | | Workiva, Inc. (a) | | | 48,242 | | |
| | 1,690 | | | Zuora, Inc. (a) | | | 12,996 | | |
| | | | 3,486,335 | | |
Telecommunications - 3.5% | | | |
| | 1,649 | | | 8x8, Inc. (a) | | | 6,975 | | |
| | 323 | | | Bandwidth, Inc. (a) | | | 3,834 | | |
| | 3,169 | | | Zoom Video Communications,
Inc. (a) | | | 264,421 | | |
| | | | 275,230 | | |
| | | | | TOTAL COMMON STOCKS
(Cost $8,955,434) | | $ | 6,347,121 | | |
SHORT TERM INVESTMENTS - 19.2% | | | |
Money Market Funds - 19.2% | | | |
| | 496,004 | | | Dreyfus Government Cash
Management Institutional
Shares, 2.91% (c)(d) | | $ | 496,004 | | |
| | 1 | | | Goldman Sachs Financial
Square Government Fund
Institutional Shares, 3.07% (c) | | | 1 | | |
| | 991,880 | | | Goldman Sachs Financial
Square Treasury Instruments
Fund Institutional Shares,
3.10% (c) | | | 991,880 | | |
| | | | | TOTAL SHORT TERM
INVESTMENTS
(Cost $1,487,885) | | $ | 1,487,885 | | |
| | | | | TOTAL INVESTMENTS
(Cost $10,443,319) - 101.0% (e) | | $ | 7,835,006 | | |
| | | | | Liabilities in Excess of
Other Assets - (1.0)% | | | (75,879 | ) | |
| | | | | TOTAL NET ASSETS - 100.0% | | $ | 7,759,127 | | |
Percentages are stated as a percent of net assets.
The geographic location of all investments is United States unless otherwise indicated.
(a) Non-income producing security.
(b) A portion of this security represents a security on loan.
(c) Represents annualized seven-day yield at October 31, 2022.
(d) All or a portion of this security represents an investment of securities lending collateral.
(e) All or a portion of these securities have been segregated as collateral for swap contracts. Total value of securities segregated amounted to $2,927,521.
ADR - American Depository Receipt
The accompanying notes are an integral part of these financial statements.
DIREXION ANNUAL REPORT
81
Direxion Daily Cloud Computing Bull 2X Shares
Long Total Return Swap Contracts
October 31, 2022
Terms of Payments
to be Received
at Termination | | Terms of Payments to be
Paid at Termination | | Counterparty | | Termination
Date | | Contracts | | Notional
Amount | | Unrealized
Depreciation | |
Total return of Indxx
USA Cloud
Computing Index | |
3.4400% representing
1 month SOFR rate + spread | | Citibank N.A. | | 12/13/2022 | | | 3,743 | | | $ | 2,720,151 | | | $ | (26,052 | ) | |
Total return of Indxx
USA Cloud
Computing Index | |
3.1900% representing
1 month SOFR rate + spread | | Bank of America
Merrill Lynch | | 12/13/2022 | | | 8,880 | | | | 6,467,271 | | | | (30,156 | ) | |
| | | | | | | | | $ | 9,187,422 | | | $ | (56,208 | ) | |
The accompanying notes are an integral part of these financial statements.
DIREXION ANNUAL REPORT
82
Direxion Daily Electric and Autonomous Vehicles Bull 2X Shares
Schedule of Investments
October 31, 2022
Shares | | | | Fair Value | |
COMMON STOCKS - 91.1% | | | |
Computer and Electronic Product Manufacturing - 5.9% | | | |
| | 7,864 | | | Blink Charging Co. (a) | | $ | 116,387 | | |
| | 6,782 | | | Indie Semiconductor, Inc. (a) | | | 53,035 | | |
| | | | 169,422 | | |
Management of Companies and Enterprises - 2.1% | | | |
| | 76,642 | | | Arrival Ltd. ADR (Luxembourg) (a) | | | 59,290 | | |
Motor Vehicle and Parts Dealers - 4.1% | | | |
| | 15,854 | | | EVgo, Inc. (a) | | | 117,478 | | |
Printing and Related Support Activities - 4.3% | | | |
| | 14,883 | | | Fisker, Inc. (a) | | | 121,297 | | |
Professional, Scientific, and Technical Services - 2.4% | | | |
| | 20,103 | | | TuSimple Holdings, Inc. (a) | | | 68,953 | | |
Rental and Leasing Services - 2.5% | | | |
| | 4,164 | | | Cerence, Inc. (a) | | | 71,621 | | |
Securities, Commodity Contracts, and Other Financial Investments and Related Activities - 30.9% | | | |
| | 12,764 | | | Aeva Technologies, Inc. (a) | | | 25,528 | | |
| | 3,898 | | | Allego NV ADR (Netherlands) (a) | | | 13,331 | | |
| | 82,185 | | | Canoo Inc. (a) | | | 112,593 | | |
| | 8,999 | | | ChargePoint Holdings, Inc. (a) | | | 125,806 | | |
| | 19,697 | | | Hyzon Motors, Inc. (a) | | | 37,621 | | |
| | 15,524 | | | Lucid Group, Inc. (a) | | | 221,838 | | |
| | 21,235 | | | Microvast Holdings, Inc. (a) | | | 52,026 | | |
| | 21,027 | | | Nio, Inc. ADR (China) (a) | | | 203,331 | | |
| | 10,277 | | | Proterra, Inc. (a) | | | 64,129 | | |
| | 8,301 | | | The Lion Electric Company ADR
(Canada) (a) | | | 25,152 | | |
| | | | 881,355 | | |
Specialty Trade Contractors - 4.0% | | | |
| | 13,833 | | | QuantumScape Corp. (a) | | | 115,229 | | |
Transportation Equipment Manufacturing - 34.9% | | | |
| | 4,521 | | | Gentex Corp. | | | 119,761 | | |
| | 13,536 | | | Li Auto, Inc. ADR (China) (a) | | | 184,361 | | |
| | 16,389 | | | Luminar Technologies, Inc. (a) | | | 132,587 | | |
| | 37,889 | | | Nikola Corp. (a) | | | 143,599 | | |
| | 7,188 | | | Niu Technologies ADR (China) (a) | | | 18,833 | | |
| | 941 | | | Tesla Motors, Inc. (a) | | | 214,115 | | |
| | 27,752 | | | XPeng, Inc. ADR (China) (a) | | | 183,718 | | |
| | | | 996,974 | | |
| | | | | TOTAL COMMON STOCKS
(Cost $3,569,999) | | $ | 2,601,619 | | |
Shares | | | | Fair Value | |
SHORT TERM INVESTMENTS - 9.7% | |
Money Market Funds - 9.7% | |
| | 276,011 | | | Dreyfus Government Cash
Management Institutional
Shares, 2.91% (b) | | $ | 276,011 | | |
| | 2,062 | | | Dreyfus Treasury Securities
Cash Management
Institutional Shares, 3.01% (b) | | | 2,062 | | |
| | | TOTAL SHORT TERM
INVESTMENTS
(Cost $278,073) | | $ | 278,073 | | |
| | | TOTAL INVESTMENTS
(Cost $3,848,072) - 100.8% (c) | | $ | 2,879,692 | | |
| | | Liabilities in Excess of
Other Assets - (0.8)% | | | (24,286 | ) | |
| | | TOTAL NET ASSETS - 100.0% | | $ | 2,855,406 | | |
Percentages are stated as a percent of net assets.
The geographic location of all investments is United States unless otherwise indicated.
(a) Non-income producing security.
(b) Represents annualized seven-day yield at October 31, 2022.
(c) All or a portion of these securities have been segregated as collateral for swap contracts. Total value of securities segregated amounted to $1,642,034.
ADR - American Depository Receipt
Long Total Return Swap Contracts
October 31, 2022
Terms of Payments
to be Received
at Termination | | Terms of Payments to be
Paid at Termination | | Counterparty | | Termination
Date | | Contracts | | Notional
Amount | | Unrealized
Depreciation | |
Total return of Indxx
US Electric and
Autonomous
Vehicles Index | |
3.1400% representing
1 month SOFR rate + spread | | Goldman Sachs | | 12/6/2023 | | | 2,752 | | | $ | 3,142,863 | | | $ | (37,352 | ) | |
| | | | | | | | | | | $ | 3,142,863 | | | $ | (37,352 | ) | |
The accompanying notes are an integral part of these financial statements.
DIREXION ANNUAL REPORT
83
Direxion Daily Energy Bull 2X Shares
Schedule of Investments
October 31, 2022
Shares | | | | Fair Value | |
COMMON STOCKS - 76.8% | | | |
Gasoline Stations - 15.0% | | | |
| | 463,671 | | | Chevron Corp. | | $ | 83,878,084 | | |
Machinery Manufacturing - 1.5% | | | |
| | 296,419 | | | Baker Hughes Co. | | | 8,198,949 | | |
Oil and Gas Extraction - 15.3% | | | |
| | 95,661 | | | APA Corp. | | | 4,348,749 | | |
| | 233,089 | | | Coterra Energy, Inc. | | | 7,256,061 | | |
| | 191,839 | | | Devon Energy Corp. | | | 14,838,747 | | |
| | 136,069 | | | EOG Resources, Inc. | | | 18,576,140 | | |
| | 90,928 | | | EQT Corp. | | | 3,804,427 | | |
| | 198,510 | | | Marathon Oil Corp. | | | 6,044,629 | | |
| | 218,323 | | | Occidental Petroleum Corp. | | | 15,850,250 | | |
| | 140,935 | | | Phillips 66 | | | 14,698,111 | | |
| | | | 85,417,114 | | |
Petroleum and Coal Products Manufacturing - 26.6% | | | |
| | 149,916 | | | ConocoPhillips | | | 18,902,908 | | |
| | 889,044 | | | Exxon Mobil Corp. | | | 98,514,966 | | |
| | 146,086 | | | Marathon Petroleum Corp. | | | 16,598,291 | | |
| | 115,423 | | | Valero Energy Corp. | | | 14,491,358 | | |
| | | | 148,507,523 | | |
Pipeline Transportation - 2.1% | | | |
| | 356,997 | | | Williams Companies, Inc. | | | 11,684,513 | | |
Support Activities for Mining - 13.0% | | | |
| | 52,080 | | | Diamondback Energy, Inc. | | | 8,182,289 | | |
| | 265,704 | | | Halliburton Co. | | | 9,676,940 | | |
| | 81,637 | | | Hess Corp. | | | 11,517,348 | | |
| | 69,926 | | | Pioneer Natural Resources Co. | | | 17,929,725 | | |
| | 414,380 | | | Schlumberger Ltd. ADR
(Curaco) | | | 21,560,191 | | |
| | 55,681 | | | Targa Resources Corp. | | | 3,806,910 | | |
| | | | 72,673,403 | | |
Utilities - 3.3% | | | |
| | 580,866 | | | Kinder Morgan, Inc. | | | 10,525,292 | | |
| | 130,918 | | | ONEOK, Inc. | | | 7,766,055 | | |
| | | | 18,291,347 | | |
| | | | | TOTAL COMMON STOCKS
(Cost $310,996,413) | | $ | 428,650,933 | | |
Shares | | | | Fair Value | |
SHORT TERM INVESTMENTS - 24.3% | | | |
Money Market Funds - 24.3% | | | |
| | 116,133,141 | | | Dreyfus Government Cash
Management Institutional
Shares, 2.91% (b) | | $ | 116,133,141 | | |
| | 19,572,271 | | | Goldman Sachs Financial
Square Government Fund
Institutional Shares, 3.07% (b) | | | 19,572,271 | | |
| | 31,815 | | | Goldman Sachs Financial
Square Treasury Instruments
Fund Institutional Shares,
3.10% (b) | | | 31,815 | | |
| | | | | TOTAL SHORT TERM
INVESTMENTS
(Cost $135,737,227) | | $ | 135,737,227 | | |
| | | | | TOTAL INVESTMENTS
(Cost $446,733,640) -
101.1% (c) | | $ | 564,388,160 | | |
| | | | | Liabilities in Excess of
Other Assets - (1.1)% | | | (6,360,017 | ) | |
| | | | | TOTAL NET ASSETS - 100.0% | | $ | 558,028,143 | | |
Percentages are stated as a percent of net assets.
The geographic location of all investments is United States unless otherwise indicated.
(a) Non-income producing security.
(b) Represents annualized seven-day yield at October 31, 2022.
(c) All or a portion of these securities have been segregated as collateral for swap contracts. Total value of securities segregated amounted to $273,163,126.
ADR - American Depository Receipt
Long Total Return Swap Contracts
October 31, 2022
Terms of Payments
to be Received at
Termination | | Terms of Payments to be
Paid at Termination | | Counterparty | | Termination
Date | | Contracts | | Notional
Amount | | Unrealized
Appreciation | |
Total return of Energy
Select Sector Index | | 3.4900% representing
1 month SOFR rate + spread | | J.P. Morgan | | 12/6/2022 | | | 187,164 | | | $ | 139,017,150 | | | $ | 38,943,721 | | |
Total return of Energy
Select Sector Index | | 3.5400% representing
1 month SOFR rate + spread | | Barclays | | 12/7/2022 | | | 236,992 | | | | 182,745,976 | | | | 41,533,113 | | |
Total return of Energy
Select Sector Index | | 3.6900% representing
1 month SOFR rate + spread | | UBS Securities LLC | | 12/14/2022 | | | 84,062 | | | | 62,406,902 | | | | 17,247,384 | | |
Total return of Energy
Select Sector Index | | 3.5300% representing
1 month SOFR rate + spread | | BNP Paribas | | 12/15/2022 | | | 219,744 | | | | 180,286,920 | | | | 27,505,193 | | |
| | | | | | | | | | | $ | 564,456,948 | | | $ | 125,229,411 | | |
The accompanying notes are an integral part of these financial statements.
DIREXION ANNUAL REPORT
84
Direxion Daily Energy Bear 2X Shares
Schedule of Investments
October 31, 2022
Shares | | | | Fair Value | |
SHORT TERM INVESTMENTS - 123.6% | | | |
Money Market Funds - 123.6% | | | |
| | 40,760,846 | | | Dreyfus Government Cash
Management Institutional
Shares, 2.91% (a) | | $ | 40,760,846 | | |
| | 3,361,599 | | | Goldman Sachs Financial
Square Government Fund
Institutional Shares, 3.07% (a) | | | 3,361,599 | | |
| | 4,720,462 | | | Goldman Sachs Financial
Square Treasury Instruments
Fund Institutional Shares,
3.10% (a) | | | 4,720,462 | | |
| | | | | TOTAL SHORT TERM
INVESTMENTS
(Cost $48,842,907) (b) | | $ | 48,842,907 | | |
| | | | | TOTAL INVESTMENTS
(Cost $48,842,907) - 123.6% | | $ | 48,842,907 | | |
| | | | | Liabilities in Excess of
Other Assets - (23.6)% | | | (9,330,315 | ) | |
| | | | | TOTAL NET ASSETS - 100.0% | | $ | 39,512,592 | | |
Percentages are stated as a percent of net assets.
The geographic location of all investments is United States unless otherwise indicated.
(a) Represents annualized seven-day yield at October 31, 2022.
(b) All or a portion of these securities have been segregated as collateral for swap contracts. Total value of securities segregated amounted to $25,658,185.
Short Total Return Swap Contracts
October 31, 2022
Terms of Payments
to be Received at
Termination | | Terms of Payments to be
Paid at Termination | | Counterparty | | Termination
Date | | Contracts | | Notional
Amount | | Unrealized
Depreciation | |
3.0400%
representing
1 month SOFR
rate + spread | | Total return of Energy
Select Sector Index | | J.P. Morgan | | 12/6/2022 | | | 16,628 | | | $ | 13,835,604 | | | $ | (1,868,435 | ) | |
3.2400%
representing
1 month SOFR
rate + spread | | Total return of Energy
Select Sector Index | | Barclays | | 12/7/2022 | | | 10,007 | | | | 7,647,775 | | | | (1,798,821 | ) | |
3.3600%
representing
1 month SOFR
rate + spread | | Total return of Energy
Select Sector Index | | UBS Securities LLC | | 12/14/2022 | | | 24,205 | | | | 20,963,847 | | | | (1,884,317 | ) | |
3.0800%
representing
1 month SOFR
rate + spread | | Total return of Energy
Select Sector Index | | BNP Paribas | | 12/15/2022 | | | 32,848 | | | | 25,842,313 | | | | (5,278,218 | ) | |
| | | | | | | | | | | $ | 68,289,539 | | | $ | (10,829,791 | ) | |
The accompanying notes are an integral part of these financial statements.
DIREXION ANNUAL REPORT
85
Direxion Daily FinTech Bull 2X Shares
Schedule of Investments
October 31, 2022
Shares | | | | Fair Value | |
COMMON STOCKS - 83.3% | | | |
Administrative and Support Services - 14.6% | | | |
| | 371 | | | Coinbase Global, Inc. (a)(b) | | $ | 24,579 | | |
| | 1,185 | | | Dlocal Ltd. ADR (Uruguay) (a) | | | 26,425 | | |
| | 529 | | | Envestnet, Inc. (a) | | | 26,085 | | |
| | 741 | | | Evertec, Inc. | | | 26,535 | | |
| | 182 | | | FleetCor Technologies, Inc. (a) | | | 33,874 | | |
| | 821 | | | nCino, Inc. (a) | | | 25,845 | | |
| | 2,341 | | | Paymentus Holdings, Inc. (a)(b) | | | 24,346 | | |
| | 2,379 | | | Remitly Global, Inc. (a) | | | 27,644 | | |
| | 1,127 | | | Upstart Holdings, Inc. (a)(b) | | | 26,124 | | |
| | 1,035 | | | Visa, Inc. Class A | | | 214,411 | | |
| | | | 455,868 | | |
Amusement, Gambling, and Recreation Industries - 2.5% | | | |
| | 686 | | | Global Payments, Inc. | | | 78,382 | | |
Computing Infrastructure Providers, Data Processing, Web Hosting, and Related Services - 3.8% | | | |
| | 1,146 | | | Fiserv, Inc. (a) | | | 117,740 | | |
Credit Intermediation and Related Activities - 26.6% | | | |
| | 1,345 | | | Affirm Holdings, Inc. (a) | | | 26,994 | | |
| | 1,407 | | | American Express Co. | | | 208,869 | | |
| | 681 | | | Discover Financial Services | | | 71,137 | | |
| | 299 | | | Euronet Worldwide, Inc. (a) | | | 25,119 | | |
| | 1,424 | | | Fidelity National Information
Services, Inc. | | | 118,178 | | |
| | 1,147 | | | Flywire Corp. (a) | | | 25,177 | | |
| | 2,174 | | | LendingClub Corp. (a) | | | 23,131 | | |
| | 652 | | | MasterCard, Inc. Class A | | | 213,973 | | |
| | 653 | | | Meta Financial Group, Inc. | | | 27,446 | | |
| | 862 | | | Nuvei Corp. ADR (Canada) (a) | | | 25,920 | | |
| | 1,199 | | | Synchrony Financial | | | 42,637 | | |
| | 1,807 | | | Western Union Co. | | | 24,413 | | |
| | | | 832,994 | | |
Data Processing, Hosting and Related Services - 1.7% | | | |
| | 1,767 | | | Pagseguro Digital Ltd.
ADR (Brazil) (a) | | | 24,173 | | |
| | 173 | | | WEX, Inc. (a) | | | 28,396 | | |
| | | | 52,569 | | |
Heavy and Civil Engineering Construction - 0.8% | | | |
| | 463 | | | BlackLine, Inc. (a) | | | 25,928 | | |
Lessors of Nonfinancial Intangible Assets
(except Copyrighted Works) - 0.9% | | | |
| | 2,105 | | | Marathon Digital Holdings, Inc. (a)(b) | | | 27,596 | | |
Management of Companies and Enterprises - 4.7% | | | |
| | 948 | | | Capital One Financial Corp. | | | 100,507 | | |
| | 14,746 | | | Lufax Holding Ltd. ADR (China) | | | 23,446 | | |
| | 2,363 | | | StoneCo Ltd. ADR (a) | | | 24,812 | | |
| | | | 148,765 | | |
Professional, Scientific, and Technical Services - 3.8% | | | |
| | 820 | | | Alliance Data Systems Corp. | | | 29,610 | | |
| | 181 | | | Jack Henry & Associates, Inc. | | | 36,030 | | |
| | 4,225 | | | Riot Blockchain, Inc. (a) | | | 29,110 | | |
| | 543 | | | Shift4 Payments, Inc. (a) | | | 24,962 | | |
| | | | 119,712 | | |
Shares | | | | Fair Value | |
Publishing Industries - 6.4% | | | |
| | 472 | | | Intuit, Inc. | | $ | 201,780 | | |
Publishing Industries (except Internet) - 8.6% | | | |
| | 1,094 | | | ACI Worldwide, Inc. (a) | | | 26,617 | | |
| | 248 | | | Bill.com Holdings, Inc. (a) | | | 33,073 | | |
| | 409 | | | Black Knight, Inc. (a) | | | 24,732 | | |
| | 1,313 | | | Block, Inc. (a) | | | 78,872 | | |
| | 884 | | | Q2 Holdings, Inc. (a) | | | 27,439 | | |
| | 513 | | | SS&C Technologies Holdings, Inc. | | | 26,379 | | |
| | 1,185 | | | Toast, Inc. (a) | | | 26,177 | | |
| | 1,487 | | | Vertex, Inc. (a) | | | 26,796 | | |
| | | | 270,085 | | |
Securities, Commodity Contracts, and Other Financial Investments and Related Activities - 2.6% | | | |
| | 1,332 | | | Assetmark Financial Holdings, Inc. (a) | | | 27,586 | | |
| | 16,984 | | | Paysafe Ltd. ADR (Douglas,
Isle of Man) (a) | | | 24,796 | | |
| | 2,428 | | | Robinhood Markets, Inc. (a) | | | 28,359 | | |
| | | | 80,741 | | |
Telecommunications - 6.3% | | | |
| | 2,347 | | | PayPal Holdings, Inc. (a) | | | 196,162 | | |
| | | | | TOTAL COMMON STOCKS
(Cost $3,272,362) | | $ | 2,608,322 | | |
SHORT TERM INVESTMENTS - 28.7% | | | |
Money Market Funds - 28.7% | | | |
| | 898,846 | | | Dreyfus Government Cash
Management Institutional
Shares, 2.91% (c)(d) | | $ | 898,846 | | |
| | | | | TOTAL SHORT TERM
INVESTMENTS
(Cost $898,846) | | $ | 898,846 | | |
| | | | | TOTAL INVESTMENTS
(Cost $4,171,208) - 112.0% (e) | | $ | 3,507,168 | | |
| | | | | Liabilities in Excess of
Other Assets - (12.0)% | | | (374,404 | ) | |
| | | | | TOTAL NET ASSETS - 100.0% | | $ | 3,132,764 | | |
Percentages are stated as a percent of net assets.
The geographic location of all investments is United States unless otherwise indicated.
(a) Non-income producing security.
(b) A portion of this security represents a security on loan.
(c) Represents annualized seven-day yield at October 31, 2022.
(d) All or a portion of this security represents an investment of securities lending collateral.
(e) All or a portion of these securities have been segregated as collateral for swap contracts. Total value of securities segregated amounted to $1,406,239.
ADR - American Depository Receipt
The accompanying notes are an integral part of these financial statements.
DIREXION ANNUAL REPORT
86
Direxion Daily FinTech Bull 2X Shares
Long Total Return Swap Contracts
October 31, 2022
Terms of Payments to be
Received at Termination | | Terms of Payments to be
Paid at Termination | | Counterparty | | Termination
Date | | Contracts | | Notional
Amount | | Unrealized
Depreciation | |
Total return of Indxx
US Fintech and
Decentralized Finance Index | | 3.6900% representing 1 month
SOFR rate + spread | | Barclays | | 12/7/2022 | | | 33 | | | $ | 69,980 | | | $ | (11,355 | ) | |
Total return of Indxx
US Fintech and
Decentralized Finance Index | | 3.7400% representing 1 month
SOFR rate + spread | | UBS Securities LLC | | 12/14/2022 | | | 2,010 | | | | 3,718,707 | | | | (134,374 | ) | |
| | | | | | | | | | | $ | 3,788,687 | | | $ | (145,729 | ) | |
The accompanying notes are an integral part of these financial statements.
DIREXION ANNUAL REPORT
87
Direxion Daily Global Clean Energy Bull 2X Shares
Schedule of Investments
October 31, 2022
Shares | | | | Fair Value | |
INVESTMENT COMPANIES - 66.9% | | | |
| | 156,721 | | | iShares Global Clean Energy ETF (a) | | $ | 2,960,460 | | |
| | | | | TOTAL INVESTMENT
COMPANIES
(Cost $3,580,774) | | $ | 2,960,460 | | |
SHORT TERM INVESTMENTS - 36.5% | | | |
Money Market Funds - 36.5% | | | |
| | 1,064,927 | | | Dreyfus Government Cash
Management Institutional
Shares, 2.91% (b) | | $ | 1,064,927 | | |
| | 548,653 | | | Goldman Sachs Financial
Square Treasury Instruments
Fund Institutional Shares,
3.10% (b) | | | 548,653 | | |
| | | | | TOTAL SHORT TERM
INVESTMENTS
(Cost $1,613,580) | | $ | 1,613,580 | | |
| | | | | TOTAL INVESTMENTS
(Cost $5,194,354) - 103.4% (c) | | $ | 4,574,040 | | |
| | | | | Liabilities in Excess of
Other Assets - (3.4)% | | | (149,603 | ) | |
| | | | | TOTAL NET ASSETS - 100.0% | | $ | 4,424,437 | | |
Percentages are stated as a percent of net assets.
The geographic location of all investments is United States unless otherwise indicated.
(a) Shareholders may obtain the financial statements of these investment companies at www.sec.gov.
(b) Represents annualized seven-day yield at October 31, 2022.
(c) All or a portion of these securities have been segregated as collateral for swap contracts. Total value of securities segregated amounted to $2,255,176.
Long Total Return Swap Contracts
October 31, 2022
Terms of Payments to be
Received at Termination | | Terms of Payments to be
Paid at Termination | | Counterparty | | Termination
Date | | Contracts | | Notional
Amount | | Unrealized
Appreciation
(Depreciation) | |
Total return of The S&P
Global Clean Energy Index | | 3.6900% representing 1 month
SOFR rate + spread | | Citibank N.A. | | 12/13/2022 | | | 98,793 | | | $ | 1,841,085 | | | $ | 11,373 | | |
Total return of The S&P
Global Clean Energy Index | | 3.4900% representing 1 month
SOFR rate + spread | | Bank of America
Merrill Lynch | | 12/13/2022 | | | 212,928 | | | | 4,186,086 | | | | (175,709 | ) | |
| | | | | | | | | | | $ | 6,027,171 | | | $ | (164,336 | ) | |
The accompanying notes are an integral part of these financial statements.
DIREXION ANNUAL REPORT
88
Direxion Daily Gold Miners Index Bull 2X Shares
Schedule of Investments
October 31, 2022
Shares | | | | Fair Value | |
INVESTMENT COMPANIES - 49.7% | | | |
| | 7,736,708 | | | VanEck Vectors® Gold
Miners ETF (a) | | $ | 186,918,866 | | |
| | | | | TOTAL INVESTMENT
COMPANIES
(Cost $199,805,629) | | $ | 186,918,866 | | |
SHORT TERM INVESTMENTS - 63.9% | | | |
Money Market Funds - 63.9% | | | |
| | 144,866,834 | | | Dreyfus Government Cash
Management Institutional
Shares, 2.91% (b) | | $ | 144,866,834 | | |
| | 9,650,000 | | | Dreyfus Treasury Securities
Cash Management
Institutional Shares, 3.01% (b) | | | 9,650,000 | | |
| | 85,723,536 | | | Goldman Sachs Financial
Square Treasury Instruments
Fund Institutional Shares,
3.10% (b) | | | 85,723,536 | | |
| | | | | TOTAL SHORT TERM
INVESTMENTS
(Cost $240,240,370) | | $ | 240,240,370 | | |
| | | | | TOTAL INVESTMENTS
(Cost $440,045,999) -
113.6% (c) | | $ | 427,159,236 | | |
| | | | | Liabilities in Excess of
Other Assets - (13.6)% | | | (51,251,093 | ) | |
| | | | | TOTAL NET ASSETS - 100.0% | | $ | 375,908,143 | | |
Percentages are stated as a percent of net assets.
The geographic location of all investments is United States unless otherwise indicated.
(a) Shareholders may obtain the financial statements of these investment companies at www.sec.gov.
(b) Represents annualized seven-day yield at October 31, 2022.
(c) All or a portion of these securities have been segregated as collateral for swap contracts. Total value of securities segregated amounted to $301,153,895.
Long Total Return Swap Contracts
October 31, 2022
Terms of Payments
to be Received at
Termination | | Terms of Payments to be
Paid at Termination | | Counterparty | | Termination
Date | | Contracts | | Notional
Amount | | Unrealized
Appreciation
(Depreciation) | |
Total return of VanEck
Vectors® Gold Miners
ETF | |
3.7900% representing
1 month SOFR rate + spread | | Citibank N.A. | | 12/13/2022 | | | 4,612,819 | | | $ | 146,631,080 | | | $ | (36,955,153 | ) | |
Total return of VanEck
Vectors® Gold Miners
ETF | |
3.8900% representing
1 month SOFR rate + spread | | Bank of America
Merrill Lynch | | 12/13/2022 | | | 4,345,609 | | | | 131,854,377 | | | | (26,981,402 | ) | |
Total return of VanEck
Vectors® Gold Miners
ETF | |
4.1500% representing
1 month SOFR rate + spread | | UBS Securities LLC | | 12/14/2022 | | | 5,332,844 | | | | 128,210,374 | | | | 81,711 | | |
Total return of VanEck
Vectors® Gold Miners
ETF | | 3.8300% representing
1 month SOFR rate + spread | | BNP Paribas | | 12/15/2022 | | | 3,617,624 | | | | 88,519,850 | | | | (1,373,622 | ) | |
Total return of VanEck
Vectors® Gold Miners
ETF | |
3.8900% representing
1 month SOFR rate + spread | | J.P. Morgan | | 2/10/2023 | | | 3,473,099 | | | | 85,474,614 | | | | (2,175,187 | ) | |
Total return of VanEck
Vectors® Gold Miners
ETF | |
3.6400% representing
1 month SOFR rate + spread | | Goldman Sachs | | 10/31/2023 | | | 2,000,000 | | | | 48,240,000 | | | | (61,129 | ) | |
| | | | | | | | | | | $ | 628,930,295 | | | $ | (67,464,782 | ) | |
The accompanying notes are an integral part of these financial statements.
DIREXION ANNUAL REPORT
89
Direxion Daily Gold Miners Index Bear 2X Shares
Schedule of Investments
October 31, 2022
Shares | | | | Fair Value | |
SHORT TERM INVESTMENTS - 104.5% | |
Money Market Funds - 104.5% | |
| | 68,647,091 | | | Dreyfus Government Cash
Management Institutional
Shares, 2.91% (a) | | $ | 68,647,091 | | |
| | 22,028,406 | | | Goldman Sachs Financial
Square Treasury Instruments
Fund Institutional Shares,
3.10% (a) | | | 22,028,406 | | |
| | | TOTAL SHORT TERM
INVESTMENTS
(Cost $90,675,497) (b) | | $ | 90,675,497 | | |
| | | TOTAL INVESTMENTS
(Cost $90,675,497) - 104.5% | | $ | 90,675,497 | | |
| | | Liabilities in Excess of
Other Assets - (4.5)% | | | (3,926,244 | ) | |
| | | TOTAL NET ASSETS - 100.0% | | $ | 86,749,253 | | |
Percentages are stated as a percent of net assets.
The geographic location of all investments is United States unless otherwise indicated.
(a) Represents annualized seven-day yield at October 31, 2022.
(b) All or a portion of these securities have been segregated as collateral for swap contracts. Total value of securities segregated amounted to $39,917,068.
Short Total Return Swap Contracts
October 31, 2022
Terms of Payments
to be Received at
Termination | | Terms of Payments to be
Paid at Termination | | Counterparty | | Termination
Date | | Contracts | | Notional
Amount | | Unrealized
Appreciation
(Depreciation) | |
3.2700%
representing
1 month SOFR
rate + spread | |
Total return of VanEck
Vectors® Gold Miners ETF | | Citibank N.A. | | 12/13/2022 | | | 621,009 | | | $ | 24,038,417 | | | $ | 9,296,822 | | |
3.6900%
representing
1 month SOFR
rate + spread | | Total return of VanEck
Vectors® Gold Miners ETF | | Bank of America
Merrill Lynch | | 12/13/2022 | | | 1,504,091 | | | | 43,911,161 | | | | 7,998,639 | | |
3.6300%
representing
1 month SOFR
rate + spread | | Total return of VanEck
Vectors® Gold Miners ETF | | UBS Securities LLC | | 12/14/2022 | | | 3,051,103 | | | | 72,117,924 | | | | (1,479,449 | ) | |
2.9900%
representing
1 month SOFR
rate + spread | | Total return of VanEck
Vectors® Gold Miners ETF | | J.P. Morgan | | 12/6/2023 | | | 1,324,647 | | | | 31,455,479 | | | | (456,651 | ) | |
3.4200%
representing
1 month SOFR
rate + spread | | Total return of VanEck
Vectors® Gold Miners ETF | | BNP Paribas | | 12/7/2023 | | | 680,312 | | | | 16,341,094 | | | | (62,675 | ) | |
| | | | | | | | | | | $ | 187,864,075 | | | $ | 15,296,686 | | |
The accompanying notes are an integral part of these financial statements.
DIREXION ANNUAL REPORT
90
Direxion Daily Junior Gold Miners Index Bull 2X Shares
Schedule of Investments
October 31, 2022
Shares | | | | Fair Value | |
INVESTMENT COMPANIES - 39.7% | | | |
| | 3,051,846 | | | VanEck VectorsTM Junior
Gold Miners ETF (a) | | $ | 90,029,457 | | |
| | | | | TOTAL INVESTMENT
COMPANIES
(Cost $96,575,980) | | $ | 90,029,457 | | |
SHORT TERM INVESTMENTS - 77.3% | | | |
Money Market Funds - 77.3% | | | |
| | 143,236,285 | | | Dreyfus Government Cash
Management Institutional
Shares, 2.91% (b) | | $ | 143,236,285 | | |
| | 32,011,031 | | | Goldman Sachs Financial
Square Treasury Instruments
Fund Institutional Shares,
3.10% (b) | | | 32,011,031 | | |
| | | | | TOTAL SHORT TERM
INVESTMENTS
(Cost $175,247,316) | | $ | 175,247,316 | | |
| | | | | TOTAL INVESTMENTS
(Cost $271,823,296) -
117.0% (c) | | $ | 265,276,773 | | |
| | | | | Liabilities in Excess of
Other Assets - (17.0)% | | | (38,591,251 | ) | |
| | | | | TOTAL NET ASSETS - 100.0% | | $ | 226,685,522 | | |
Percentages are stated as a percent of net assets.
The geographic location of all investments is United States unless otherwise indicated.
(a) Shareholders may obtain the financial statements of these investment companies at www.sec.gov.
(b) Represents annualized seven-day yield at October 31, 2022.
(c) All or a portion of these securities have been segregated as collateral for swap contracts. Total value of securities segregated amounted to $148,275,804.
Long Total Return Swap Contracts
October 31, 2022
Terms of Payments
to be Received at
Termination | | Terms of Payments to be
Paid at Termination | | Counterparty | | Termination
Date | | Contracts | | Notional
Amount | | Unrealized
Depreciation | |
Total return of
VanEck VectorsTM
Junior Gold
Miners ETF | | 3.8400% representing
1 month SOFR
rate + spread | | J.P. Morgan | | 12/6/2022 | | | 1,107,342 | | | $ | 46,891,241 | | | $ | (14,796,409 | ) | |
Total return of
VanEck VectorsTM
Junior Gold
Miners ETF | | 3.8100% representing
1 month SOFR
rate + spread | | Citibank N.A. | | 12/13/2022 | | | 5,657,722 | | | | 178,392,443 | | | | (12,630,450 | ) | |
Total return of
VanEck VectorsTM
Junior Gold
Miners ETF | | 4.0500% representing
1 month SOFR
rate + spread | | UBS Securities LLC | | 12/14/2022 | | | 1,280,561 | | | | 39,175,303 | | | | (1,564,957 | ) | |
Total return of
VanEck VectorsTM
Junior Gold
Miners ETF | | 3.8300% representing
1 month SOFR
rate + spread | | BNP Paribas | | 12/15/2022 | | | 4,271,136 | | | | 129,399,871 | | | | (4,256,948 | ) | |
| | | | | | | | | | | $ | 393,858,858 | | | $ | (33,248,764 | ) | |
The accompanying notes are an integral part of these financial statements.
DIREXION ANNUAL REPORT
91
Direxion Daily Junior Gold Miners Index Bear 2X Shares
Schedule of Investments
October 31, 2022
Shares | | | | Fair Value | |
SHORT TERM INVESTMENTS - 97.2% | |
Money Market Funds - 97.2% | |
| | 88,422,843 | | | Dreyfus Government Cash
Management Institutional
Shares, 2.91% (a) | | $ | 88,422,843 | | |
| | 22,018,922 | | | Goldman Sachs Financial
Square Treasury Instruments
Fund Institutional Shares,
3.10% (a) | | | 22,018,922 | | |
| | | TOTAL SHORT TERM
INVESTMENTS
(Cost $110,441,765) (b) | | $ | 110,441,765 | | |
| | | TOTAL INVESTMENTS
(Cost $110,441,765) - 97.2% | | $ | 110,441,765 | | |
| | | Other Assets in Excess of
Liabilities - 2.8% | | | 3,179,208 | | |
| | | TOTAL NET ASSETS - 100.0% | | $ | 113,620,973 | | |
Percentages are stated as a percent of net assets.
The geographic location of all investments is United States unless otherwise indicated.
(a) Represents annualized seven-day yield at October 31, 2022.
(b) All or a portion of these securities have been segregated as collateral for swap contracts. Total value of securities segregated amounted to $50,837,684.
Short Total Return Swap Contracts
October 31, 2022
Terms of Payments
to be Received at
Termination | | Terms of Payments to be
Paid at Termination | | Counterparty | | Termination
Date | | Contracts | | Notional
Amount | | Unrealized
Appreciation
(Depreciation) | |
3.4200%
representing
1 month SOFR
rate + spread | | Total return of
VanEck VectorsTM
Junior Gold Miners ETF | | BNP Paribas | | 12/8/2022 | | | 3,235,054 | | | $ | 97,769,784 | | | $ | 2,678,022 | | |
3.3200%
representing
1 month SOFR
rate + spread | | Total return of
VanEck VectorsTM
Junior Gold Miners ETF | | Citibank N.A. | | 12/13/2022 | | | 3,055,948 | | | | 88,614,736 | | | | (1,457,083 | ) | |
3.6100%
representing
1 month SOFR
rate + spread | | Total return of
VanEck VectorsTM
Junior Gold Miners ETF | | UBS Securities LLC | | 12/14/2022 | | | 783,737 | | | | 30,438,004 | | | | 7,593,348 | | |
2.9400%
representing
1 month SOFR
rate + spread | | Total return of
VanEck VectorsTM
Junior Gold Miners ETF | | J.P. Morgan | | 10/16/2023 | | | 628,502 | | | | 18,423,993 | | | | (51,897 | ) | |
| | | | | | | | | | | $ | 235,246,517 | | | $ | 8,762,390 | | |
The accompanying notes are an integral part of these financial statements.
DIREXION ANNUAL REPORT
92
Direxion Daily Metal Miners Bull 2X Shares
Schedule of Investments
October 31, 2022
Shares | | | | Fair Value | |
COMMON STOCKS - 76.3% | | | |
Fabricated Metal Product Manufacturing - 4.0% | | | |
| | 1,697 | | | Materion Corp. | | $ | 145,450 | | |
| | 2,408 | | | Nucor Corp. | | | 316,363 | | |
| | | | 461,813 | | |
Merchant Wholesalers, Durable Goods - 2.1% | | | |
| | 4,360 | | | Ryerson Holding, Corp. | | | 146,278 | | |
| | 3,548 | | | Schnitzer Steel Industries, Inc. | | | 95,760 | | |
| | | | 242,038 | | |
Mining (except Oil and Gas) - 27.0% | | | |
| | 2,351 | | | 5E Advanced Materials, Inc. (a)(b) | | | 31,456 | | |
| | 2,409 | | | Alpha Metallurgical Resources, Inc. | | | 406,760 | | |
| | 2,496 | | | Arch Resources, Inc. | | | 380,116 | | |
| | 82,197 | | | Coeur Mining, Inc. (a) | | | 310,705 | | |
| | 5,195 | | | Consol Energy, Inc. | | | 327,389 | | |
| | 10,744 | | | Freeport-McMoRan Copper &
Gold, Inc. | | | 340,477 | | |
| | 8,007 | | | Newmont Mining Corp. | | | 338,856 | | |
| | 14,816 | | | Peabody Energy Corp. (a) | | | 354,103 | | |
| | 3,599 | | | Royal Gold, Inc. | | | 341,761 | | |
| | 77,848 | | | Uranium Energy Corp. (a) | | | 327,740 | | |
| | | | 3,159,363 | | |
Primary Metal Manufacturing - 28.0% | | | |
| | 6,569 | | | Alcoa Corp. | | | 256,388 | | |
| | 11,107 | | | Allegheny Technologies, Inc. (a) | | | 330,544 | | |
| | 12,975 | | | Arconic Corp. (a) | | | 269,361 | | |
| | 4,482 | | | Carpenter Technology Corp. | | | 167,627 | | |
| | 33,248 | | | Century Aluminum Co. (a) | | | 239,718 | | |
| | 8,287 | | | Commercial Metals Co. | | | 377,058 | | |
| | 771 | | | Haynes International Inc. | | | 37,710 | | |
| | 2,459 | | | Kaiser Aluminum Corp. | | | 198,663 | | |
| | 1,753 | | | Reliance Steel & Aluminum Co. | | | 353,194 | | |
| | 3,995 | | | Steel Dynamics, Inc. | | | 375,730 | | |
| | 13,728 | | | SunCoke Energy Inc. | | | 99,665 | | |
| | 9,084 | | | TimkenSteel Corp. (a) | | | 158,425 | | |
| | 13,705 | | | United States Steel Corp. | | | 279,034 | | |
| | 2,863 | | | Worthington Industries, Inc. | | | 136,164 | | |
| | | | 3,279,281 | | |
Real Estate - 2.6% | | | |
| | 10,199 | | | MP Materials Corp. (a) | | | 306,378 | | |
Support Activities for Mining - 10.1% | | | |
| | 18,454 | | | Cleveland-Cliffs Inc. (a) | | | 239,718 | | |
| | 5,619 | | | Compass Minerals International,
Inc. | | | 222,175 | | |
Shares | | | | Fair Value | |
Support Activities for Mining (continued) | | | |
| | 82,889 | | | Hecla Mining Co. | | $ | 378,803 | | |
| | 5,519 | | | Piedmont Lithium, Inc. (a) | | | 343,392 | | |
| | | | 1,184,088 | | |
Wood Product Manufacturing - 2.5% | | | |
| | 4,883 | | | Enviva, Inc. | | | 292,199 | | |
| | | | | TOTAL COMMON STOCKS
(Cost $10,247,161) | | $ | 8,925,160 | | |
SHORT TERM INVESTMENTS - 23.2% | | | |
Money Market Funds - 23.2% | | | |
| | 1,875,014 | | | Dreyfus Government Cash
Management Institutional
Shares, 2.91% (c)(d) | | $ | 1,875,014 | | |
| | 834,671 | | | Goldman Sachs Financial Square
Treasury Instruments Fund
Institutional Shares, 3.10% (c) | | | 834,671 | | |
| | | | | TOTAL SHORT TERM
INVESTMENTS
(Cost $2,709,685) | | $ | 2,709,685 | | |
| | | | | TOTAL INVESTMENTS
(Cost $12,956,846) - 99.5% (e) | | $ | 11,634,845 | | |
| | | | | Other Assets in Excess of
Liabilities - 0.5% | | | 92,646 | | |
| | | | | TOTAL NET ASSETS - 100.0% | | $ | 11,696,976 | | |
Percentages are stated as a percent of net assets.
The geographic location of all investments is United States unless otherwise indicated.
(a) Non-income producing security.
(b) A portion of this security represents a security on loan.
(c) Represents annualized seven-day yield at October 31, 2022.
(d) All or a portion of this security represents an investment of securities lending collateral.
(e) All or a portion of these securities have been segregated as collateral for swap contracts. Total value of securities segregated amounted to $7,374,178.
Long Total Return Swap Contracts
October 31, 2022
Terms of Payments
to be Received at
Termination | | Terms of Payments to be
Paid at Termination | | Counterparty | | Termination
Date | | Contracts | | Notional
Amount | | Unrealized
Appreciation | |
Total return of
S&P Metals & Mining
Select Industry Index | | 3.7300% representing
1 month SOFR rate +
spread | | UBS Securities LLC | | 12/14/2022 | | | 2,032 | | | $ | 4,711,609 | | | $ | 315,557 | | |
Total return of S&P
Metals & Mining
Select Industry Index | | 3.4400% representing
1 month SOFR rate +
spread | | J.P. Morgan | | 5/5/2023 | | | 3,807 | | | | 8,989,699 | | | | 424,730 | | |
| | | | | | | | | | | $ | 13,701,308 | | | $ | 740,287 | | |
The accompanying notes are an integral part of these financial statements.
DIREXION ANNUAL REPORT
93
Direxion Daily Oil Services Bull 2X Shares
Schedule of Investments
October 31, 2022
Shares | | | | Fair Value | |
COMMON STOCKS - 63.5% | | | |
Machinery Manufacturing - 14.2% | | | |
| | 29,114 | | | Baker Hughes Co. | | $ | 805,293 | | |
| | 7,670 | | | Cactus, Inc. | | | 396,692 | | |
| | 3,960 | | | Dril-Quip, Inc. (a) | | | 98,525 | | |
| | 23,645 | | | NOV, Inc. | | | 529,648 | | |
| | 7,602 | | | Oil States International, Inc (a) | | | 49,185 | | |
| | 43,312 | | | TechnipFMC PLC ADR
(United Kingdom) (a) | | | 458,674 | | |
| | | | 2,338,017 | | |
Management of Companies and Enterprises - 1.3% | | | |
| | 11,086 | | | Expro Group Holdings
N.V. ADR (Netherlands) (a) | | | 209,858 | | |
Merchant Wholesalers, Durable Goods - 7.3% | | | |
| | 17,096 | | | ChampionX Corp. | | | 489,288 | | |
| | 18,823 | | | RPC, Inc. (a) | | | 209,500 | | |
| | 7,379 | | | Valaris Ltd. ADR (a) | | | 493,876 | | |
| | | | 1,192,664 | | |
Mining (except Oil and Gas) - 0.8% | | | |
| | 8,705 | | | U.S. Silica Holdings, Inc. (a) | | | 125,265 | | |
Primary Metal Manufacturing - 2.9% | | | |
| | 15,252 | | | Tenaris S.A. ADR (Luxembourg) | | | 479,218 | | |
Support Activities for Mining - 37.0% | | | |
| | 4,812 | | | Core Laboratories
N.V. ADR (Netherlands) | | | 93,642 | | |
| | 32,267 | | | Halliburton Co. | | | 1,175,164 | | |
| | 18,626 | | | Helix Energy Solutions Group,
Inc. (a) | | | 130,382 | | |
| | 8,712 | | | Helmerich & Payne, Inc. (a) | | | 431,331 | | |
| | 19,410 | | | Liberty Oilfield Services, Inc. (a) | | | 328,223 | | |
| | 1,370 | | | Nabors Industries Ltd. ADR (a) | | | 238,421 | | |
| | 21,716 | | | NexTier Oilfield Solutions, Inc. (a) | | | 218,897 | | |
| | 11,172 | | | Oceaneering International, Inc. (a) | | | 156,296 | | |
| | 22,932 | | | Patterson-UTI Energy, Inc. | | | 404,750 | | |
| | 10,445 | | | ProPetro Holding Corp. (a) | | | 123,669 | | |
| | 44,099 | | | Schlumberger Ltd. ADR (Curaco) | | | 2,294,471 | | |
| | 13,156 | | | Select Energy Services, Inc. (a) | | | 126,955 | | |
Shares | | | | Fair Value | |
Support Activities for Mining (continued) | | | |
| | 98,629 | | | Transocean Ltd. ADR
(Switzerland) (a) | | $ | 362,955 | | |
| | | | 6,085,156 | | |
| | | | | TOTAL COMMON STOCKS
(Cost $9,140,726) | | $ | 10,430,178 | | |
SHORT TERM INVESTMENTS - 33.3% | | | |
Money Market Funds - 33.3% | | | |
| | 3,874,637 | | | Dreyfus Government Cash
Management Institutional
Shares, 2.91% (b) | | $ | 3,874,637 | | |
| | 70,000 | | | Goldman Sachs Financial Square
Government Fund Institutional
Shares, 3.07% (b) | | | 70,000 | | |
| | 1,516,455 | | | Goldman Sachs Financial Square
Treasury Instruments Fund
Institutional Shares, 3.10% (b) | | | 1,516,455 | | |
| | | | | TOTAL SHORT TERM
INVESTMENTS
(Cost $5,461,092) | | $ | 5,461,092 | | |
| | | | | TOTAL INVESTMENTS
(Cost $14,601,818) - 96.8% (c) | | $ | 15,891,270 | | |
| | | | | Other Assets in Excess of
Liabilities - 3.2% | | | 528,445 | | |
| | | | | TOTAL NET ASSETS - 100.0% | | $ | 16,419,715 | | |
Percentages are stated as a percent of net assets.
The geographic location of all investments is United States unless otherwise indicated.
(a) Non-income producing security.
(b) Represents annualized seven-day yield at October 31, 2022.
(c) All or a portion of these securities have been segregated as collateral for swap contracts. Total value of securities segregated amounted to $11,472,827.
ADR - American Depository Receipt
Long Total Return Swap Contracts
October 31, 2022
Terms of Payments
to be Received at
Termination | | Terms of Payments to be
Paid at Termination | | Counterparty | | Termination
Date | | Contracts | | Notional
Amount | | Unrealized
Appreciation | |
Total return of
MVIS US Listed Oil
Services 25 Index | | 3.5400% representing
1 month SOFR
rate + spread | | Citibank N.A. | | 12/13/2022 | | | 11,808 | | | $ | 6,593,264 | | | $ | 1,538,724 | | |
Total return of
MVIS US Listed Oil
Services 25 Index | | 3.7400% representing
1 month SOFR
rate + spread | | UBS Securities LLC | | 12/14/2022 | | | 7,741 | | | | 4,336,929 | | | | 992,395 | | |
Total return of
MVIS US Listed Oil
Services 25 Index | | 3.5900% representing
1 month SOFR
rate + spread | | Barclays | | 12/21/2022 | | | 12,900 | | | | 8,562,388 | | | | 341,629 | | |
| | | | | | | | | | | $ | 19,492,581 | | | $ | 2,872,748 | | |
The accompanying notes are an integral part of these financial statements.
DIREXION ANNUAL REPORT
94
Direxion Daily Robotics, Artificial Intelligence & Automation Index Bull 2X Shares
Schedule of Investments
October 31, 2022
Shares | | | | Fair Value | |
INVESTMENT COMPANIES - 51.3% | | | |
| | 288,607 | | | Global X Robotics & Artificial
Intelligence ETF (a) | | $ | 5,662,469 | | |
| | | | | TOTAL INVESTMENT
COMPANIES
(Cost $7,307,398) | | $ | 5,662,469 | | |
SHORT TERM INVESTMENTS - 69.1% | | | |
Money Market Funds - 69.1% | | | |
| | 3,000,320 | | | Dreyfus Government Cash
Management Institutional
Shares, 2.91% (b) | | $ | 3,000,320 | | |
| | 1,600,136 | | | Goldman Sachs Financial
Square Government Fund
Institutional Shares, 3.07% (b) | | | 1,600,136 | | |
| | 3,028,437 | | | Goldman Sachs Financial
Square Treasury Instruments
Fund Institutional Shares,
3.10% (b) | | | 3,028,437 | | |
| | | | | TOTAL SHORT TERM
INVESTMENTS
(Cost $7,628,893) | | $ | 7,628,893 | | |
| | | | | TOTAL INVESTMENTS
(Cost $14,936,291) - 120.4% (c) | | $ | 13,291,362 | | |
| | | | | Liabilities in Excess of
Other Assets - (20.4)% | | | (2,248,401 | ) | |
| | | | | TOTAL NET ASSETS - 100.0% | | $ | 11,042,961 | | |
Percentages are stated as a percent of net assets.
The geographic location of all investments is United States unless otherwise indicated.
(a) Shareholders may obtain the financial statements of these investment companies at www.sec.gov.
(b) Represents annualized seven-day yield at October 31, 2022.
(c) All or a portion of these securities have been segregated as collateral for swap contracts. Total value of securities segregated amounted to $6,290,191.
Long Total Return Swap Contracts
October 31, 2022
Terms of Payments
to be Received at
Termination | | Terms of Payments to be
Paid at Termination | | Counterparty | | Termination
Date | | Contracts | | Notional
Amount | | Unrealized
Depreciation | |
Total return of Indxx
Global Robotics and
Artificial Intelligence
Thematic Index | | 3.4900% representing
1 month SOFR
rate + spread | | J.P. Morgan | | 12/6/2022 | | | 407,177 | | | $ | 8,016,601 | | | $ | (66,520 | ) | |
Total return of Indxx
Global Robotics and
Artificial Intelligence
Thematic Index | | 3.7900% representing
1 month SOFR
rate + spread | | Barclays | | 12/7/2022 | | | 124,387 | | | | 3,410,808 | | | | (1,064,185 | ) | |
Total return of Indxx
Global Robotics and
Artificial Intelligence
Thematic Index | | 3.6900% representing
1 month SOFR
rate + spread | | Citibank N.A. | | 12/13/2022 | | | 88,348 | | | | 2,807,622 | | | | (1,111,632 | ) | |
Total return of Indxx
Global Robotics and
Artificial Intelligence
Thematic Index | | 3.8300% representing
1 month SOFR
rate + spread | | UBS Securities LLC | | 12/14/2022 | | | 217,169 | | | | 4,250,730 | | | | (4,598 | ) | |
| | | | | | | | | | | $ | 18,485,761 | | | $ | (2,246,935 | ) | |
The accompanying notes are an integral part of these financial statements.
DIREXION ANNUAL REPORT
95
Direxion Daily S&P Oil & Gas Exp. & Prod. Bull 2X Shares
Schedule of Investments
October 31, 2022
Shares | | | | Fair Value | |
COMMON STOCKS - 51.5% | | | |
Chemical Manufacturing - 0.5% | | | |
| | 1,897,697 | | | Gevo, Inc. (a) | | $ | 4,269,818 | | |
Gasoline Stations - 2.1% | | | |
| | 49,249 | | | Chevron Corp. | | | 8,909,144 | | |
| | 264,370 | | | Delek US Holdings, Inc. | | | 7,841,214 | | |
| | | | 16,750,358 | | |
Merchant Wholesalers, Durable Goods - 0.1% | | | |
| | 25,661 | | | REX American Resources
Corp. (a) | | | 769,573 | | |
Merchant Wholesalers, Nondurable Goods - 0.3% | | | |
| | 78,887 | | | World Fuel Services Corp. | | | 2,010,830 | | |
Mining (except Oil and Gas) - 1.0% | | | |
| | 458,559 | | | CNX Resources Corp. (a) | | | 7,708,377 | | |
Oil and Gas Extraction - 27.0% | | | |
| | 196,559 | | | Antero Resources Corp. (a) | | | 7,205,853 | | |
| | 206,827 | | | APA Corp. | | | 9,402,356 | | |
| | 149,229 | | | Berry Petroleum Corp. | | | 1,323,661 | | |
| | 91,228 | | | Brigham Minerals Inc. | | | 2,828,068 | | |
| | 521,263 | | | Clean Energy Fuels Corp. (a) | | | 3,497,675 | | |
| | 419,489 | | | Comstock Resources Inc. (a) | | | 7,878,003 | | |
| | 111,968 | | | Continental Resources, Inc. | | | 8,282,273 | | |
| | 264,625 | | | Coterra Energy, Inc. | | | 8,237,776 | | |
| | 59,332 | | | Crescent Energy Co. (b) | | | 817,595 | | |
| | 114,994 | | | Devon Energy Corp. | | | 8,894,786 | | |
| | 333,049 | | | Earthstone Energy, Inc. (a)(b) | | | 5,382,072 | | |
| | 63,863 | | | EOG Resources, Inc. | | | 8,718,577 | | |
| | 162,936 | | | EQT Corp. | | | 6,817,242 | | |
| | 146,932 | | | Green Plains, Inc. (a) | | | 4,244,866 | | |
| | 1,240,633 | | | Kosmos Energy Ltd. (a) | | | 8,051,708 | | |
| | 282,958 | | | Magnolia Oil & Gas Corp. | | | 7,266,362 | | |
| | 298,978 | | | Marathon Oil Corp. | | | 9,103,880 | | |
| | 135,083 | | | Matador Resources Co. | | | 8,976,265 | | |
| | 197,794 | | | Murphy Oil Corp. | | | 9,594,987 | | |
| | 56,711 | | | Oasis Petroleum, Inc. | | | 8,681,887 | | |
| | 120,077 | | | Occidental Petroleum Corp. | | | 8,717,590 | | |
| | 150,631 | | | Ovintiv, Inc. | | | 7,629,460 | | |
| | 136,187 | | | Par Pacific Holdings, Inc. (a) | | | 3,115,959 | | |
| | 119,294 | | | PDC Energy, Inc. | | | 8,605,869 | | |
| | 89,492 | | | Phillips 66 | | | 9,333,121 | | |
| | 253,232 | | | Range Resources Corp. | | | 7,212,047 | | |
| | 84,786 | | | Ranger Oil Corp. | | | 3,467,747 | | |
| | 69,785 | | | SilverBow Resources, Inc. (a) | | | 2,475,274 | | |
| | 171,486 | | | SM Energy Co. | | | 7,713,440 | | |
| | 1,029,808 | | | Southwestern Energy Co. (a) | | | 7,136,570 | | |
| | 234,647 | | | Talos Energy, Inc. (a) | | | 4,993,288 | | |
| | 1,762,426 | | | Tellurian, Inc. (a)(b) | | | 4,758,550 | | |
| | 732,297 | | | W&T Offshore, Inc. (a) | | | 5,558,134 | | |
| | | | 215,922,941 | | |
Petroleum and Coal Products Manufacturing - 9.3% | | | |
| | 70,361 | | | ConocoPhillips | | | 8,871,818 | | |
| | 154,234 | | | CVR Energy, Inc. | | | 6,024,380 | | |
| | 81,636 | | | Exxon Mobil Corp. | | | 9,046,085 | | |
| | 148,276 | | | HF Sinclair Corp. | | | 9,070,043 | | |
| | 105,974 | | | Laredo Petroleum, Inc. (a) | | | 6,851,219 | | |
| | 78,773 | | | Marathon Petroleum Corp. | | | 8,950,188 | | |
Shares | | | | Fair Value | |
Petroleum and Coal Products Manufacturing (continued) | | | |
| | 235,448 | | | PBF Energy, Inc. (a) | | $ | 10,418,574 | | |
| | 69,520 | | | Valero Energy Corp. | | | 8,728,236 | | |
| | 808,120 | | | Vertex Energy, Inc. (a)(b) | | | 6,893,264 | | |
| | | | 74,853,807 | | |
Printing and Related Support Activities - 1.2% | | | |
| | 992,197 | | | Permian Resources Corp. (a) | | | 9,693,765 | | |
Securities, Commodity Contracts, and Other Financial Investments and Related Activities - 1.2% | | | |
| | 4,322 | | | Texas Pacific Land Corp. | | | 9,957,326 | | |
Support Activities for Mining - 8.2% | | | |
| | 135,450 | | | California Resources Corp. | | | 6,110,150 | | |
| | 186,423 | | | Callon Petroleum Co. (a) | | | 8,195,155 | | |
| | 118,042 | | | Civitas Resources, Inc. | | | 8,252,316 | | |
| | 88,805 | | | Denbury, Inc. (a) | | | 8,117,665 | | |
| | 58,346 | | | Diamondback Energy, Inc. | | | 9,166,740 | | |
| | 26,619 | | | Gulfport Energy Corp. (a) | | | 2,382,667 | | |
| | 64,327 | | | Hess Corp. | | | 9,075,253 | | |
| | 169,912 | | | Northern Oil and Gas, Inc. | | | 5,800,796 | | |
| | 32,876 | | | Pioneer Natural Resources Co. | | | 8,429,735 | | |
| | | | 65,530,477 | | |
Utilities - 0.6% | | | |
| | 186,673 | | | Archaea Energy, Inc. (a) | | | 4,818,030 | | |
| | | | | TOTAL COMMON STOCKS
(Cost $373,242,085) | | $ | 412,285,302 | | |
SHORT TERM INVESTMENTS - 48.4% | | | |
Money Market Funds - 48.4% | | | |
| | 276,893,439 | | | Dreyfus Government Cash
Management Institutional
Shares, 2.91% (c)(d) | | $ | 276,893,439 | | |
| | 22,502,796 | | | Dreyfus Treasury Securities
Cash Management
Institutional Shares, 3.01% (c) | | | 22,502,796 | | |
| | 88,044,853 | | | Goldman Sachs Financial
Square Treasury
Instruments Fund
Institutional Shares, 3.10% (c) | | | 88,044,853 | | |
| | | | | TOTAL SHORT TERM
INVESTMENTS
(Cost $387,441,088) | | $ | 387,441,088 | | |
| | | | | TOTAL INVESTMENTS
(Cost $760,683,173) -
99.9% (e) | | $ | 799,726,390 | | |
| | | | | Other Assets in Excess of
Liabilities - 0.1% | | | 891,367 | | |
| | | | | TOTAL NET ASSETS - 100.0% | | $ | 800,617,757 | | |
Percentages are stated as a percent of net assets.
The geographic location of all investments is United States unless otherwise indicated.
(a) Non-income producing security.
(b) A portion of this security represents a security on loan.
The accompanying notes are an integral part of these financial statements.
DIREXION ANNUAL REPORT
96
Direxion Daily S&P Oil & Gas Exp. & Prod. Bull 2X Shares
Schedule of Investments
October 31, 2022
(c) Represents annualized seven-day yield at October 31, 2022.
(d) All or a portion of this security represents an investment of securities lending collateral.
(e) All or a portion of these securities have been segregated as collateral for swap contracts. Total value of securities segregated amounted to $446,096,188.
Long Total Return Swap Contracts
October 31, 2022
Terms of Payments
to be Received at
Termination | | Terms of Payments to be
Paid at Termination | | Counterparty | | Termination
Date | | Contracts | | Notional
Amount | | Unrealized
Appreciation | |
Total return of
S&P Oil & Gas
Exploration &
Production Select
Industry Index | |
3.5800% representing
1 month SOFR rate + spread | | BNP Paribas | | 12/8/2022 | | | 61,000 | | | $ | 221,919,830 | | | $ | 135,988,244 | | |
Total return of
S&P Oil & Gas
Exploration &
Production Select
Industry Index | |
3.3200% representing
1 month SOFR rate + spread | | Citibank N.A. | | 12/13/2022 | | | 40,891 | | | | 160,744,438 | | | | 79,178,430 | | |
Total return of
S&P Oil & Gas
Exploration &
Production Select
Industry Index | |
3.4400% representing
1 month SOFR rate + spread | | Bank of America
Merrill Lynch | | 12/13/2022 | | | 32,204 | | | | 169,622,511 | | | | 17,800,314 | | |
Total return of
S&P Oil & Gas
Exploration &
Production Select
Industry Index | |
3.7700% representing
1 month SOFR rate + spread | | UBS Securities LLC | | 12/14/2022 | | | 21,281 | | | | 102,241,313 | | | | 21,586,296 | | |
Total return of
S&P Oil & Gas
Exploration &
Production Select
Industry Index | |
3.5400% representing
1 month SOFR rate + spread | | Goldman Sachs | | 8/30/2023 | | | 22,811 | | | | 112,516,586 | | | | 20,204,454 | | |
Total return of
S&P Oil & Gas
Exploration &
Production Select
Industry Index | |
3.2900% representing
1 month SOFR rate + spread | | J.P. Morgan | | 11/6/2023 | | | 25,771 | | | | 132,166,484 | | | | 17,770,886 | | |
| | | | | | | | | | | $ | 899,211,162 | | | $ | 292,528,624 | | |
The accompanying notes are an integral part of these financial statements.
DIREXION ANNUAL REPORT
97
Direxion Daily S&P Oil & Gas Exp. & Prod. Bear 2X Shares
Schedule of Investments
October 31, 2022
Shares | | | | Fair Value | |
SHORT TERM INVESTMENTS - 129.5% | | | |
Money Market Funds - 129.5% | | | |
| | 73,521,429 | | | Dreyfus Government Cash
Management Institutional
Shares, 2.91% (a) | | $ | 73,521,429 | | |
| | 10,520,000 | | | Dreyfus Treasury Securities Cash
Management Institutional
Shares, 3.01% (a) | | | 10,520,000 | | |
| | 49,004,684 | | | Goldman Sachs Financial
Square Treasury Instruments
Fund Institutional Shares,
3.10% (a) | | | 49,004,684 | | |
| | | | | TOTAL SHORT TERM
INVESTMENTS
(Cost $133,046,113) (b) | | $ | 133,046,113 | | |
| | | | | TOTAL INVESTMENTS
(Cost $133,046,113) - 129.5% | | $ | 133,046,113 | | |
| | | | | Liabilities in Excess of
Other Assets - (29.5)% | | | (30,299,169 | ) | |
| | | | | TOTAL NET ASSETS - 100.0% | | $ | 102,746,944 | | |
Percentages are stated as a percent of net assets.
The geographic location of all investments is United States unless otherwise indicated.
(a) Represents annualized seven-day yield at October 31, 2022.
(b) All or a portion of these securities have been segregated as collateral for swap contracts. Total value of securities segregated amounted to $65,879,183.
Short Total Return Swap Contracts
October 31, 2022
Terms of Payments
to be Received at
Termination | | Terms of Payments to be
Paid at Termination | | Counterparty | | Termination
Date | | Contracts | | Notional
Amount | | Unrealized
Depreciation | |
| 2.6400%
representing
1 month SOFR
rate + spread | | | Total return of
S&P Oil & Gas
Exploration & Production
Select Industry Index | | J.P. Morgan | | 12/6/2022 | | | 7,170 | | | $ | 34,775,551 | | | $ | (7,077,542 | ) | |
| 2.9900%
representing
1 month SOFR
rate + spread | | | Total return of
S&P Oil & Gas
Exploration & Production
Select Industry Index | | Citibank N.A. | | 12/13/2022 | | | 5,436 | | | | 25,861,750 | | | | (5,827,989 | ) | |
| 3.2400%
representing
1 month SOFR
rate + spread | | | Total return of
S&P Oil & Gas
Exploration & Production
Select Industry Index | | Bank of America
Merrill Lynch | | 12/13/2022 | | | 11,302 | | | | 62,981,056 | | | | (2,812,829 | ) | |
| 3.3600%
representing
1 month SOFR
rate + spread | | | Total return of
S&P Oil & Gas
Exploration & Production
Select Industry Index | | UBS Securities LLC | | 12/14/2022 | | | 4,900 | | | | 25,629,982 | | | | (2,871,768 | ) | |
| 3.2400%
representing
1 month SOFR
rate + spread | | | Total return of
S&P Oil & Gas
Exploration & Production
Select Industry Index | | Goldman Sachs | | 10/31/2023 | | | 6,444 | | | | 33,327,311 | | | | (4,175,393 | ) | |
| | | | | | | | | | | | | $ | 182,575,650 | | | $ | (22,765,521 | ) | |
The accompanying notes are an integral part of these financial statements.
DIREXION ANNUAL REPORT
98
Direxion Daily Select Large Caps & FANGs Bull 2X Shares
Schedule of Investments
October 31, 2022
Shares | | | | Fair Value | |
COMMON STOCKS - 80.5% | | | |
Administrative and Support Services - 4.1% | | | |
| | 2,577 | | | Atlassian Corp. (a) | | $ | 522,435 | | |
Computer and Electronic Product Manufacturing - 24.8% | | | |
| | 8,554 | | | Advanced Micro Devices, Inc. (a) | | | 513,753 | | |
| | 4,898 | | | Alphabet, Inc. Class A (a) | | | 462,910 | | |
| | 3,475 | | | Analog Devices, Inc. | | | 495,605 | | |
| | 3,360 | | | Apple, Inc. | | | 515,222 | | |
| | 1,982 | | | Enphase Energy, Inc. (a) | | | 608,474 | | |
| | 3,985 | | | NVIDIA Corp. (a) | | | 537,856 | | |
| | | | 3,133,820 | | |
Motion Picture and Sound Recording Industries - 4.1% | | | |
| | 1,778 | | | Netflix, Inc. (a) | | | 518,963 | | |
General Merchandise Retailers - 3.4% | | | |
| | 4,191 | | | Amazon.com, Inc. (a) | | | 429,326 | | |
Professional, Scientific, and Technical Services - 15.2% | | | |
| | 3,870 | | | Meta Platforms, Inc. (a) | | | 360,529 | | |
| | 1,369 | | | ServiceNow, Inc. (a) | | | 575,993 | | |
| | 2,873 | | | Snowflake, Inc. (a) | | | 460,542 | | |
| | 3,378 | | | Zscaler, Inc. (a) | | | 520,550 | | |
| | | | 1,917,614 | | |
Publishing Industries - 15.8% | | | |
| | 3,179 | | | CrowdStrike Holdings, Inc. (a) | | | 512,455 | | |
| | 6,091 | | | Datadog, Inc. (a) | | | 490,386 | | |
| | 1,202 | | | Intuit, Inc. | | | 513,855 | | |
| | 2,031 | | | Microsoft Corp. | | | 471,456 | | |
| | | | 1,988,152 | | |
Securities, Commodity Contracts, and Other Financial Investments and Related Activities - 4.4% | | | |
| | 39,229 | | | Lucid Group, Inc. (a)(b) | | | 560,582 | | |
Transportation Equipment Manufacturing - 8.7% | | | |
| | 16,022 | | | Rivian Automotive, Inc. (a) | | | 560,289 | | |
| | 2,377 | | | Tesla Motors, Inc. (a) | | | 540,863 | | |
| | | | 1,101,152 | | |
| | | | | TOTAL COMMON STOCKS
(Cost $10,309,093) | | $ | 10,172,044 | | |
Shares | | | | Fair Value | |
SHORT TERM INVESTMENTS - 36.5% | | | |
Money Market Funds - 36.5% | | | |
| | 4,066,842 | | | Dreyfus Government Cash
Management Institutional
Shares, 2.91% (c)(d) | | $ | 4,066,842 | | |
| | 390,004 | | | Goldman Sachs Financial
Square Government Fund
Institutional Shares, 3.07% (c) | | | 390,004 | | |
| | 160,965 | | | Goldman Sachs Financial
Square Treasury Instruments
Fund Institutional Shares,
3.10% (c) | | | 160,965 | | |
| | | | | TOTAL SHORT TERM
INVESTMENTS
(Cost $4,617,811) | | $ | 4,617,811 | | |
| | | | | TOTAL INVESTMENTS
(Cost $14,926,904) - 117.0% (e) | | $ | 14,789,855 | | |
| | | | | Liabilities in Excess of
Other Assets - (17.0)% | | | (2,149,745 | ) | |
| | | | | TOTAL NET ASSETS - 100.0% | | $ | 12,640,110 | | |
Percentages are stated as a percent of net assets.
The geographic location of all investments is United States unless otherwise indicated.
(a) Non-income producing security.
(b) A portion of this security represents a security on loan.
(c) Represents annualized seven-day yield at October 31, 2022.
(d) All or a portion of this security represents an investment of securities lending collateral.
(e) All or a portion of these securities have been segregated as collateral for swap contracts. Total value of securities segregated amounted to $5,194,929.
ADR - American Depository Receipt
Long Total Return Swap Contracts
October 31, 2022
Terms of Payments
to be Received at
Termination | | Terms of Payments to be
Paid at Termination | | Counterparty | | Termination
Date | | Contracts | | Notional
Amount | | Unrealized
Appreciation
(Depreciation) | |
Total return of
ICE FANG 20 Index | | 3.6300% representing
1 month SOFR rate + spread | | UBS Securities LLC | | 12/14/2022 | | | 65,488 | | | $ | 14,436,742 | | | $ | 111,515 | | |
Total return of
ICE FANG 20 Index | | 3.6900% representing
1 month SOFR rate + spread | | Barclays | | 4/3/2023 | | | 2,366 | | | | 559,358 | | | | (56,349 | ) | |
| | | | | | | | | | | $ | 14,996,100 | | | $ | 55,166 | | |
The accompanying notes are an integral part of these financial statements.
DIREXION ANNUAL REPORT
99
Direxion Daily Software Bull 2X Shares
Schedule of Investments
October 31, 2022
Shares | | | | Fair Value | |
COMMON STOCKS - 82.4% | | | |
Administrative and Support Services - 0.7% | | | |
| | 81 | | | Alarm.com, Inc. (a) | | $ | 4,766 | | |
| | 90 | | | Envestnet, Inc. (a) | | | 4,438 | | |
| | 123 | | | nCino, Inc. (a) | | | 3,872 | | |
| | 324 | | | SentinelOne, Inc. (a) | | | 7,400 | | |
| | 76 | | | Sprout Social, Inc. (a) | | | 4,585 | | |
| | | | 25,061 | | |
Computer and Electronic Product Manufacturing - 4.7% | | | |
| | 845 | | | BlackBerry, Ltd. ADR (Canada) (a) | | | 3,938 | | |
| | 100 | | | Dolby Laboratories, Inc. | | | 6,684 | | |
| | 1,065 | | | Fortinet, Inc. (a) | | | 60,875 | | |
| | 48 | | | InterDigital, Inc. | | | 2,394 | | |
| | 223 | | | NCR Corp. (a) | | | 4,741 | | |
| | 173 | | | Roper Technologies, Inc. | | | 71,715 | | |
| | 167 | | | Teradata Corp. (a) | | | 5,276 | | |
| | 67 | | | XPERI, Inc. (a) | | | 936 | | |
| | | | 156,559 | | |
Data Processing, Hosting and Related Services - 1.5% | | | |
| | 114 | | | Five9, Inc. (a) | | | 6,870 | | |
| | 67 | | | Pegasystems, Inc. | | | 2,493 | | |
| | 125 | | | RingCentral, Inc. (a) | | | 4,440 | | |
| | 336 | | | VMware, Inc. | | | 37,810 | | |
| | | | 51,613 | | |
Electronics and Appliance Stores - 0.4% | | | |
| | 211 | | | Smartsheet, Inc. (a) | | | 7,368 | | |
| | 564 | | | UiPath, Inc. (a) | | | 7,135 | | |
| | | | 14,503 | | |
Food Services and Drinking Places - 0.4% | | | |
| | 102 | | | Manhattan Associates, Inc. (a) | | | 12,410 | | |
Heavy and Civil Engineering Construction - 0.1% | | | |
| | 88 | | | BlackLine, Inc. (a) | | | 4,928 | | |
Lessors of Nonfinancial Intangible Assets (except Copyrighted Works) - 0.1% | | | |
| | 180 | | | Marathon Digital Holdings, Inc. (a)(b) | | | 2,360 | | |
Merchant Wholesalers, Durable Goods - 0.2% | | | |
| | 93 | | | New Relic, Inc. (a) | | | 5,509 | | |
Motion Picture and Sound Recording Industries - 1.0% | | | |
| | 169 | | | ADEIA, Inc. | | | 1,890 | | |
| | 255 | | | Take-Two Interactive Software, Inc. (a) | | | 30,212 | | |
| | | | 32,102 | | |
Other Information Services - 0.1% | | | |
| | 109 | | | LiveRamp Holdings, Inc. (a) | | | 2,001 | | |
Performing Arts, Spectator Sports, and Related Industries - 4.1% | | | |
| | 1,158 | | | Activision Blizzard, Inc. | | | 84,302 | | |
| | 430 | | | Electronic Arts, Inc. | | | 54,163 | | |
| | | | 138,465 | | |
Printing and Related Support Activities - 0.0%(†) | | | |
| | 142 | | | BTRS Holdings, Inc. (a) | | | 1,340 | | |
Professional, Scientific, and Technical Services - 14.7% | | | |
| | 99 | | | Alteryx, Inc. (a) | | | 4,824 | | |
| | 122 | | | Asana, Inc. (a) | | | 2,513 | | |
| | 47 | | | Aspen Technology, Inc. (a) | | | 11,348 | | |
Shares | | | | Fair Value | |
Professional, Scientific, and Technical
Services (continued) | | | |
| | 28 | | | CS Disco, Inc. (a) | | $ | 300 | | |
| | 146 | | | Digital Turbine, Inc. (a) | | | 2,131 | | |
| | 22 | | | Docebo, Inc. ADR (Canada) (a) | | | 642 | | |
| | 125 | | | Elastic NV ADR (Netherlands) (a) | | | 7,994 | | |
| | 73 | | | Jamf Holding Corp. (a) | | | 1,728 | | |
| | 113 | | | LivePerson, Inc. (a) | | | 1,194 | | |
| | 207 | | | Momentive Global, Inc. (a) | | | 1,606 | | |
| | 365 | | | Nutanix, Inc. (a) | | | 10,001 | | |
| | 438 | | | Open Text Corp. ADR (Canada) | | | 12,680 | | |
| | 2,844 | | | Palantir Technologies, Inc. (a) | | | 24,999 | | |
| | 486 | | | Palto Alto Networks, Inc. (a) | | | 83,393 | | |
| | 79 | | | Paycom Software, Inc. (a) | | | 27,334 | | |
| | 67 | | | Paylocity Holding Corp. (a) | | | 15,530 | | |
| | 67 | | | PROS Holdings, Inc. (a) | | | 1,672 | | |
| | 174 | | | Qualtrics International, Inc. (a) | | | 2,083 | | |
| | 220 | | | Riot Blockchain, Inc. (a) | | | 1,516 | | |
| | 329 | | | ServiceNow, Inc. (a) | | | 138,423 | | |
| | 1,680 | | | Snap, Inc. (a) | | | 16,649 | | |
| | 172 | | | Sumo Logic, Inc. (a) | | | 1,326 | | |
| | 722 | | | The Trade Desk, Inc. (a) | | | 38,439 | | |
| | 292 | | | Unity Software, Inc. (a) | | | 8,614 | | |
| | 105 | | | Verint Systems, Inc. (a) | | | 3,720 | | |
| | 324 | | | Workday, Inc. (a) | | | 50,486 | | |
| | 137 | | | Zscaler, Inc. (a) | | | 21,112 | | |
| | | | 492,257 | | |
Publishing Industries - 29.9% | | | |
| | 659 | | | Adobe Systems, Inc. (a) | | | 209,891 | | |
| | 142 | | | ANSYS, Inc. (a) | | | 31,405 | | |
| | 353 | | | Autodesk, Inc. (a) | | | 75,648 | | |
| | 445 | | | Cadence Design Systems, Inc. (a) | | | 67,369 | | |
| | 347 | | | CrowdStrike Holdings, Inc. (a) | | | 55,936 | | |
| | 402 | | | Datadog, Inc. (a) | | | 32,365 | | |
| | 326 | | | DocuSign, Inc. (a) | | | 15,746 | | |
| | 459 | | | Intuit, Inc. | | | 196,222 | | |
| | 979 | | | Microsoft Corp. | | | 227,255 | | |
| | 241 | | | Splunk, Inc. (a) | | | 20,030 | | |
| | 249 | | | Synopsys, Inc. (a) | | | 72,845 | | |
| | | | 1,004,712 | | |
Publishing Industries (except Internet) - 23.5% | | | |
| | 185 | | | ACI Worldwide, Inc. (a) | | | 4,501 | | |
| | 85 | | | Altair Engineering, Inc. (a) | | | 4,169 | | |
| | 30 | | | AppFolio, Inc. (a) | | | 3,761 | | |
| | 67 | | | Appian, Corp. (a) | | | 3,271 | | |
| | 319 | | | Bentley Systems, Inc. | | | 11,254 | | |
| | 152 | | | Bill.com Holdings, Inc. (a) | | | 20,271 | | |
| | 254 | | | Black Knight, Inc. (a) | | | 15,359 | | |
| | 73 | | | Blackbaud, Inc. (a) | | | 3,993 | | |
| | 235 | | | Box, Inc. (a) | | | 6,827 | | |
| | 133 | | | C3.ai, Inc. (a) | | | 1,744 | | |
| | 249 | | | Ceridian HCM Holding, Inc. (a) | | | 16,481 | | |
| | 73 | | | CommVault Systems, Inc. (a) | | | 4,445 | | |
| | 230 | | | Confluent, Inc. (a) | | | 6,182 | | |
| | 29 | | | Consensus Cloud Solutions, Inc. (a) | | | 1,628 | | |
| | 123 | | | Coupa Software, Inc. (a) | | | 6,547 | | |
| | 138 | | | Descartes Systems Group, Inc.
ADR (Canada) (a) | | | 9,532 | | |
The accompanying notes are an integral part of these financial statements.
DIREXION ANNUAL REPORT
100
Direxion Daily Software Bull 2X Shares
Schedule of Investments, continued
October 31, 2022
Shares | | | | Fair Value | |
Publishing Industries (except Internet) (continued) | | | |
| | 50 | | | Domo, Inc. (a) | | $ | 884 | | |
| | 448 | | | Dropbox, Inc. (a) | | | 9,744 | | |
| | 123 | | | Duck Creek Technologies, Inc. (a) | | | 1,469 | | |
| | 327 | | | Dynatrace, Inc. (a) | | | 11,524 | | |
| | 64 | | | Everbridge, Inc. (a) | | | 2,005 | | |
| | 41 | | | Fair Isaac Corp. (a) | | | 19,632 | | |
| | 137 | | | Guidewire Software, Inc. (a) | | | 8,139 | | |
| | 79 | | | HubSpot, Inc. (a) | | | 23,428 | | |
| | 219 | | | Lightspeed Commerce, Inc.
ADR (Canada) (a) | | | 4,196 | | |
| | 16 | | | MicroStrategy, Inc. Class A (a)(b) | | | 4,280 | | |
| | 109 | | | N-able, Inc. (a) | | | 1,181 | | |
| | 963 | | | NortonLifeLock, Inc. (a) | | | 21,696 | | |
| | 2,471 | | | Oracle Corp. | | | 192,911 | | |
| | 129 | | | PagerDuty, Inc. (a) | | | 3,217 | | |
| | 70 | | | Progress Software Corp. | | | 3,572 | | |
| | 172 | | | PTC, Inc. (a) | | | 20,267 | | |
| | 93 | | | Q2 Holdings, Inc. (a) | | | 2,887 | | |
| | 57 | | | Qualys, Inc. (a) | | | 8,126 | | |
| | 96 | | | Rapid7, Inc. (a) | | | 4,346 | | |
| | 1,612 | | | Salesforce.com, Inc. (a) | | | 262,095 | | |
| | 58 | | | SPS Commerce, Inc. (a) | | | 7,338 | | |
| | 182 | | | Tenable Holdings, Inc. (a) | | | 7,397 | | |
| | 68 | | | Tyler Technologies, Inc. (a) | | | 21,986 | | |
| | 179 | | | Varonis Systems, Inc. (a) | | | 4,792 | | |
| | 74 | | | Workiva, Inc. (a) | | | 5,758 | | |
| | 201 | | | Zendesk, Inc. (a) | | | 15,415 | | |
| | 197 | | | Zuora, Inc. (a) | | | 1,515 | | |
| | | | 789,765 | | |
Rental and Leasing Services - 0.0% (†) | | | |
| | 64 | | | Cerence, Inc. (a) | | | 1,101 | | |
Securities, Commodity Contracts, and Other Financial Investments and Related Activities - 0.1% | | | |
| | 280 | | | E2open, Inc. (a) | | | 1,632 | | |
| | 356 | | | Matterport, Inc. (a) | | | 1,243 | | |
| | | | 2,875 | | |
Shares | | | | Fair Value | |
Telecommunications - 0.9% | | | |
| | 195 | | | 8x8, Inc. (a) | | $ | 825 | | |
| | 361 | | | Zoom Video Communications,
Inc. (a) | | | 30,122 | | |
| | | | 30,947 | | |
| | | | | TOTAL COMMON STOCKS
(Cost $3,566,114) | | $ | 2,768,508 | | |
SHORT TERM INVESTMENTS - 22.2% | | | |
Money Market Funds - 22.2% | | | |
| | 746,570 | | | Dreyfus Government Cash
Management Institutional
Shares, 2.91% (c)(d) | | $ | 746,570 | | |
| | | | | TOTAL SHORT TERM
INVESTMENTS
(Cost $746,570) | | $ | 746,570 | | |
| | | | | TOTAL INVESTMENTS
(Cost $4,312,684) - 104.6% (e) | | $ | 3,515,078 | | |
| | | | | Liabilities in Excess of
Other Assets - (4.6)% | | | (153,193 | ) | |
| | | | | TOTAL NET ASSETS - 100.0% | | $ | 3,359,945 | | |
Percentages are stated as a percent of net assets.
The geographic location of all investments is United States unless otherwise indicated.
(†) Less than 0.05%.
(a) Non-income producing security.
(b) A portion of this security represents a security on loan.
(c) Represents annualized seven-day yield at October 31, 2022.
(d) All or a portion of this security represents an investment of securities lending collateral.
(e) All or a portion of these securities have been segregated as collateral for swap contracts. Total value of securities segregated amounted to $2,424,595.
ADR - American Depository Receipt
Long Total Return Swap Contracts
October 31, 2022
Terms of Payments
to be Received at
Termination | | Terms of Payments to be
Paid at Termination | | Counterparty | | Termination
Date | | Contracts | | Notional
Amount | | Unrealized
Depreciation | |
Total return of S&P
North American
Expanded Technology
Software Index | |
3.6400% representing
1 month SOFR
rate + spread | | Barclays | | 12/7/2022 | | | 760 | | | $ | 463,927 | | | $ | (71,367 | ) | |
Total return of S&P
North American
Expanded Technology
Software Index | |
3.7300% representing
1 month SOFR
rate + spread | | UBS Securities LLC | | 12/14/2022 | | | 6,832 | | | | 3,622,708 | | | | (81,829 | ) | |
| | | | | | | | | | | $ | 4,086,635 | | | $ | (153,196 | ) | |
The accompanying notes are an integral part of these financial statements.
DIREXION ANNUAL REPORT
101
Direxion Daily TIPS Bull 2X Shares
Schedule of Investments
October 31, 2022
Shares | | | | Fair Value | |
INVESTMENT COMPANIES - 74.8% | |
| | 49,053 | | | iShares TIPS Bond ETF (a) | | $ | 5,218,749 | | |
| | | TOTAL INVESTMENT COMPANIES
(Cost $5,839,129) | | $ | 5,218,749 | | |
SHORT TERM INVESTMENTS - 31.3% | |
Money Market Funds - 31.3% | |
| | 2,185,936 | | | Dreyfus Government Cash
Management Institutional
Shares, 2.91% (b) | | $ | 2,185,936 | | |
| | | TOTAL SHORT TERM INVESTMENTS
(Cost $2,185,936) | | $ | 2,185,936 | | |
| | | TOTAL INVESTMENTS
(Cost $8,025,065) - 106.2% (c) | | $ | 7,404,685 | | |
| | | Liabilities in Excess of
Other Assets - (6.2)% | | | (429,207 | ) | |
| | | TOTAL NET ASSETS - 100.0% | | $ | 6,975,478 | | |
Percentages are stated as a percent of net assets.
The geographic location of all investments is United States unless otherwise indicated.
(a) Shareholders may obtain the financial statements of these investment companies at www.sec.gov.
(b) Represents annualized seven-day yield at October 31, 2022.
(c) All or a portion of these securities have been segregated as collateral for swap contracts. Total value of securities segregated amounted to $7,206,272.
Long Total Return Swap Contracts
October 31, 2022
Terms of Payments
to be Received at
Termination | | Terms of Payments to be
Paid at Termination | | Counterparty | | Termination
Date | | Contracts | | Notional
Amount | | Unrealized
Depreciation | |
Total return of
iShares TIPS Bond ETF | | 3.1900% representing
1 month SOFR rate + spread | | UBS Securities LLC | | 12/14/2022 | | | 82,077 | | | $ | 9,322,669 | | | $ | (412,511 | ) | |
| | | | | | | | | | | $ | 9,322,669 | | | $ | (412,511 | ) | |
The accompanying notes are an integral part of these financial statements.
DIREXION ANNUAL REPORT
102
Direxion Daily TIPS Bear 2X Shares
Schedule of Investments
October 31, 2022
Shares | | | | Fair Value | |
SHORT TERM INVESTMENTS - 99.1% | |
Money Market Funds - 99.1% | |
| | 7,753,957 | | | Dreyfus Government Cash
Management Institutional
Shares, 2.91% (a) | | $ | 7,753,957 | | |
| | 1,120,583 | | | Goldman Sachs Financial Square
Treasury Instruments Fund
Institutional Shares, 3.10% (a) | | | 1,120,583 | | |
| | | TOTAL SHORT TERM INVESTMENTS
(Cost $8,874,540) (b) | | $ | 8,874,540 | | |
| | | TOTAL INVESTMENTS
(Cost $8,874,540) - 99.1% | | $ | 8,874,540 | | |
| | | Other Assets in Excess of
Liabilities - 0.9% | | | 77,064 | | |
| | | TOTAL NET ASSETS - 100.0% | | $ | 8,951,604 | | |
Percentages are stated as a percent of net assets.
The geographic location of all investments is United States unless otherwise indicated.
(a) Represents annualized seven-day yield at October 31, 2022.
(b) All or a portion of these securities have been segregated as collateral for swap contracts. Total value of securities segregated amounted to $1,120,925.
Short Total Return Swap Contracts
October 31, 2022
Terms of Payments
to be Received at
Termination | | Terms of Payments to be
Paid at Termination | | Counterparty | | Termination
Date | | Contracts | | Notional
Amount | | Unrealized
Appreciation | |
2.8900%
representing
1 month SOFR
rate + spread | |
Total return of
iShares TIPS Bond ETF | | J.P. Morgan | | 10/6/2023 | | | 57,137 | | | $ | 6,148,673 | | | $ | 88,255 | | |
2.9300%
representing
1 month SOFR
rate + spread | |
Total return of
iShares TIPS Bond ETF | | UBS Securities LLC | | 12/13/2023 | | | 111,154 | | | | 11,796,129 | | | | 237,499 | | |
| | | | | | | | | | | $ | 17,944,802 | | | $ | 325,754 | | |
The accompanying notes are an integral part of these financial statements.
DIREXION ANNUAL REPORT
103
Direxion Daily Travel & Vacation Bull 2X Shares
Schedule of Investments
October 31, 2022
Shares | | | | Fair Value | |
COMMON STOCKS - 70.0% | | | |
Accommodation - 25.0% | | | |
| | 5,079 | | | Boyd Gaming Co. | | $ | 293,363 | | |
| | 7,286 | | | Caesars Entertainment Inc. (a) | | | 318,617 | | |
| | 2,174 | | | Choice Hotels International, Inc. | | | 282,272 | | |
| | 2,015 | | | Hilton Grand Vacations, Inc. (a) | | | 79,069 | | |
| | 6,539 | | | Hilton Worldwide Holdings, Inc. | | | 884,465 | | |
| | 19,419 | | | Host Hotels & Resorts, Inc. | | | 366,631 | | |
| | 9,539 | | | Huazhu Group Ltd. ADR | | | 258,316 | | |
| | 1,043 | | | Hyatt Hotels Corp. (a) | | | 98,261 | | |
| | 7,170 | | | InterContinental Hotels Group
PLC ADR (United Kingdom) | | | 393,203 | | |
| | 15,652 | | | Las Vegas Sands Corp. (a) | | | 594,933 | | |
| | 5,363 | | | Marriott International, Inc.
Class A | | | 858,670 | | |
| | 16,320 | | | Melco Crown Entertainment
Ltd. ADR (a) | | | 89,270 | | |
| | 13,771 | | | MGM Resorts International | | | 489,834 | | |
| | 5,096 | | | Park Hotels & Resorts, Inc. | | | 66,656 | | |
| | 2,881 | | | Penn National Gaming, Inc. (a) | | | 95,361 | | |
| | 7,689 | | | Sunstone Hotel Investors, Inc. | | | 85,732 | | |
| | 1,801 | | | Travel + Leisure Co. | | | 68,402 | | |
| | 1,365 | | | Vail Resorts, Inc. | | | 299,112 | | |
| | 4,274 | | | Wyndham Hotels & Resorts, Inc. | | | 324,525 | | |
| | | | 5,946,692 | | |
Administrative and Support Services - 5.6% | | | |
| | 410 | | | Booking Holdings, Inc. (a) | | | 766,487 | | |
| | 5,190 | | | Live Nation Entertainment, Inc. (a) | | | 413,176 | | |
| | 3,137 | | | Six Flags Entertainment Corp. (a) | | | 69,955 | | |
| | 3,703 | | | TripAdvisor, Inc. (a) | | | 87,465 | | |
| | | | 1,337,083 | | |
Air Transportation - 12.3% | | | |
| | 6,811 | | | Alaska Air Group, Inc. (a) | | | 302,817 | | |
| | 615 | | | Allegiant Travel Co. (a) | | | 46,156 | | |
| | 24,764 | | | American Airlines Group, Inc. (a) | | | 351,153 | | |
| | 19,755 | | | Delta Air Lines, Inc. (a) | | | 670,287 | | |
| | 8,577 | | | JetBlue Airways Corp. (a) | | | 68,959 | | |
| | 5,285 | | | Ryanair Holdings PLC ADR
(Ireland) (a) | | | 364,084 | | |
| | 15,508 | | | Southwest Airlines Co. (a) | | | 563,716 | | |
| | 4,391 | | | Spirit Airlines, Inc. (a) | | | 96,602 | | |
| | 10,947 | | | United Continental Holdings,
Inc. (a) | | | 471,597 | | |
| | | | 2,935,371 | | |
Amusement, Gambling, and Recreation
Industries - 5.4% | | | |
| | 1,701 | | | SeaWorld Entertainment, Inc. (a) | | | 98,930 | | |
| | 8,337 | | | The Walt Disney Co. (a) | | | 888,224 | | |
| | 4,842 | | | Wynn Resorts Ltd. (a) | | | 309,404 | | |
| | | | 1,296,558 | | |
Data Processing, Hosting and Related Services - 3.4% | | | |
| | 7,616 | | | Airbnb, Inc. (a) | | | 814,226 | | |
Shares | | | | Fair Value | |
Management of Companies and Enterprises - 5.1% | | | |
| | 33,880 | | | Carnival Corp. ADR (a) | | $ | 306,953 | | |
| | 21,565 | | | Norwegian Cruise Line Holdings
Ltd. ADR (a) | | | 364,233 | | |
| | 23,535 | | | Trip.com Group Ltd. ADR (China) (a) | | | 532,597 | | |
| | | | 1,203,783 | | |
Other Information Services - 0.3% | | | |
| | 12,255 | | | Sabre Corp. (a) | | | 71,201 | | |
Performing Arts, Spectator Sports, and Related Industries - 1.4% | | | |
| | 1,585 | | | Churchill Downs, Inc. | | | 329,537 | | |
Real Estate - 7.9% | | | |
| | 5,513 | | | Apple Hospitality REIT, Inc. | | | 94,383 | | |
| | 8,384 | | | Gaming & Leisure Properties, Inc. | | | 420,206 | | |
| | 2,145 | | | Marriott Vacations Worldwide
Corp. | | | 316,945 | | |
| | 4,087 | | | Pebblebrook Hotel Trust | | | 65,556 | | |
| | 3,186 | | | Ryman Hospitality Properties, Inc. | | | 283,299 | | |
| | 22,161 | | | VICI Properties, Inc. | | | 709,595 | | |
| | | | 1,889,984 | | |
Securities, Commodity Contracts, and Other Financial Investments and Related Activities - 0.3% | | | |
| | 13,134 | | | Virgin Galactic Holdings, Inc. (a) | | | 60,679 | | |
Support Activities for Transportation - 1.7% | | | |
| | 4,406 | | | Expedia, Inc. (a) | | | 411,829 | | |
Water Transportation - 1.6% | | | |
| | 7,248 | | | Royal Caribbean Cruises Ltd.
ADR (Liberia) (a) | | | 386,898 | | |
| | | | | TOTAL COMMON STOCKS
(Cost $21,857,512) | | $ | 16,683,841 | | |
SHORT TERM INVESTMENTS - 23.3% | | | |
Money Market Funds - 23.3% | | | |
| | 4,030,194 | | | Dreyfus Government Cash
Management Institutional
Shares, 2.91% (b) | | $ | 4,030,194 | | |
| | 2 | | | Goldman Sachs Financial Square
Government Fund Institutional
Shares, 3.07% (b) | | | 2 | | |
| | 1,519,774 | | | Goldman Sachs Financial
Square Treasury Instruments
Fund Institutional Shares,
3.10% (b) | | | 1,519,774 | | |
| | | | | TOTAL SHORT TERM
INVESTMENTS
(Cost $5,549,970) | | $ | 5,549,970 | | |
| | | | | TOTAL INVESTMENTS
(Cost $27,407,482) - 93.3% (c) | | $ | 22,233,811 | | |
| | | | | Other Assets in Excess of
Liabilities - 6.7% | | | 1,590,349 | | |
| | | | | TOTAL NET ASSETS - 100.0% | | $ | 23,824,160 | | |
The accompanying notes are an integral part of these financial statements.
DIREXION ANNUAL REPORT
104
Direxion Daily Travel & Vacation Bull 2X Shares
Schedule of Investments, continued
October 31, 2022
Percentages are stated as a percent of net assets.
The geographic location of all investments is United States unless otherwise indicated.
(a) Non-income producing security.
(b) Represents annualized seven-day yield at October 31, 2022.
(c) All or a portion of these securities have been segregated as collateral for swap contracts. Total value of securities segregated amounted to $11,042,275.
ADR - American Depository Receipt
Long Total Return Swap Contracts
October 31, 2022
Terms of Payments
to be Received at
Termination | | Terms of Payments to be
Paid at Termination | | Counterparty | | Termination
Date | | Contracts | | Notional
Amount | | Unrealized
Appreciation
(Depreciation) | |
Total return of
BlueStar® Travel
and Vacation Index | | 3.4900% representing
1 month SOFR rate +
spread | | J.P. Morgan | | 12/6/2022 | | | 239,353 | | | $ | 27,971,720 | | | $ | 1,220,781 | | |
Total return of
BlueStar® Travel
and Vacation Index | | 3.5400% representing
1 month SOFR rate +
spread | | Bank of America
Merrill Lynch | | 12/13/2022 | | | 13,377 | | | | 1,648,544 | | | | (11,893 | ) | |
| | | | | | | | | | | $ | 29,620,264 | | | $ | 1,208,888 | | |
The accompanying notes are an integral part of these financial statements.
DIREXION ANNUAL REPORT
105
Direxion Daily US Infrastructure Bull 2X Shares
Schedule of Investments
October 31, 2022
Shares | | | | Fair Value | |
COMMON STOCKS - 53.4% | | | |
Administrative and Support Services - 1.7% | | | |
| | 284 | | | Mastec, Inc. (a) | | $ | 21,891 | | |
| | 158 | | | NV5 Global, Inc. (a) | | | 22,902 | | |
| | | | 44,793 | | |
Air Transportation - 0.8% | | | |
| | 217 | | | Atlas Air Worldwide Holdings, Inc. (a) | | | 21,947 | | |
Computer and Electronic Product Manufacturing - 0.6% | | | |
| | 291 | | | Itron, Inc. (a) | | | 14,227 | | |
Construction of Buildings - 1.4% | | | |
| | 210 | | | Dycom Industries, Inc. (a) | | | 24,818 | | |
| | 1,485 | | | Tutor Perini Corp. (a) | | | 11,018 | | |
| | | | 35,836 | | |
Couriers and Messengers - 0.7% | | | |
| | 654 | | | Air Transport Services Group, Inc. (a) | | | 19,097 | | |
Electrical Equipment, Appliance, and Component Manufacturing - 1.0% | | | |
| | 2,130 | | | American Superconductor Corp. (a) | | | 9,628 | | |
| | 660 | | | Powell Industries, Inc. | | | 16,282 | | |
| | | | 25,910 | | |
Fabricated Metal Product Manufacturing - 0.9% | | | |
| | 76 | | | Valmont Industries, Inc. | | | 24,261 | | |
Heavy and Civil Engineering Construction - 3.6% | | | |
| | 740 | | | Construction Partners, Inc. (a) | | | 23,044 | | |
| | 473 | | | Granite Construction, Inc. | | | 15,954 | | |
| | 1,258 | | | Great Lakes Dredge & Dock Corp. (a) | | | 9,510 | | |
| | 190 | | | MYR Group, Inc. (a) | | | 16,627 | | |
| | 675 | | | Primoris Services Corp. | | | 13,628 | | |
| | 645 | | | Sterling Construction Co., Inc. (a) | | | 17,409 | | |
| | | | 96,172 | | |
Machinery Manufacturing - 1.9% | | | |
| | 355 | | | Arcosa, Inc. | | | 22,791 | | |
| | 2,623 | | | TechnipFMC PLC ADR
(United Kingdom) (a) | | | 27,778 | | |
| | | | 50,569 | | |
Management of Companies and Enterprises - 1.8% | | | |
| | 422 | | | Brookfield Infrastructure
Partners L.P. | | | 15,352 | | |
| | 2,614 | | | Frontline Ltd. ADR | | | 32,832 | | |
| | | | 48,184 | | |
Pipeline Transportation - 2.6% | | | |
| | 1,441 | | | Scorpio Tankers, Inc. ADR (Monaco) | | | 69,082 | | |
Professional, Scientific, and Technical Services - 3.5% | | | |
| | 246 | | | AECOM | | | 18,519 | | |
| | 821 | | | Fluor Corp. (a) | | | 24,844 | | |
| | 133 | | | Jacobs Solutions, Inc. | | | 15,324 | | |
| | 326 | | | Stantec, Inc. ADR (Canada) | | | 15,948 | | |
| | 122 | | | Tetra Tech, Inc. | | | 17,236 | | |
| | | | 91,871 | | |
Rail Transportation - 2.3% | | | |
| | 139 | | | Canadian National Railway Co.
ADR (Canada) | | | 16,463 | | |
| | 228 | | | Canadian Pacific Railway Ltd.
ADR (Canada) | | | 16,984 | | |
Shares | | | | Fair Value | |
Rail Transportation (continued) | | | |
| | 498 | | | CSX Corp. | | $ | 14,472 | | |
| | 69 | | | Union Pacific Corp. | | | 13,602 | | |
| | | | 61,521 | | |
Real Estate - 1.9% | | | |
| | 70 | | | American Tower Corp. | | | 14,503 | | |
| | 93 | | | Crown Castle International Corp. | | | 12,393 | | |
| | 109 | | | Digital Realty Trust, Inc. | | | 10,927 | | |
| | 1,402 | | | Uniti Group, Inc. | | | 10,880 | | |
| | | | 48,703 | | |
Rental and Leasing Services - 1.2% | | | |
| | 740 | | | Global Ship Lease, Inc. ADR
(United Kingdom) | | | 12,654 | | |
| | 227 | | | Ryder System, Inc. | | | 18,276 | | |
| | | | 30,930 | | |
Securities, Commodity Contracts, and Other Financial Investments and Related Activities - 1.9% | | | |
| | 3,448 | | | DHT Holdings, Inc. ADR | | | 30,722 | | |
| | 1,142 | | | Verra Mobility Corp. (a) | | | 19,494 | | |
| | | | 50,216 | | |
Specialty Trade Contractors - 0.9% | | | |
| | 173 | | | Quanta Services, Inc. | | | 24,573 | | |
Support Activities for Transportation - 3.3% | | | |
| | 1,855 | | | Daseke, Inc. (a) | | | 11,056 | | |
| | 157 | | | Forward Air Corp. | | | 16,622 | | |
| | 219 | | | Hub Group, Inc. (a) | | | 16,994 | | |
| | 86 | | | J.B. Hunt Transport Services, Inc. | | | 14,712 | | |
| | 187 | | | Matson, Inc. | | | 13,759 | | |
| | 61 | | | Norfolk Southern Corp. | | | 13,912 | | |
| | | | 87,055 | | |
Telecommunications - 1.7% | | | |
| | 454 | | | Argan, Inc. | | | 15,740 | | |
| | 24 | | | Equinix, Inc. | | | 13,594 | | |
| | 54 | | | SBA Communications Corp. | | | 14,575 | | |
| | | | 43,909 | | |
Transportation Equipment Manufacturing - 1.7% | | | |
| | 1,135 | | | Embraer SA ADR (Brazil) (a) | | | 11,997 | | |
| | 451 | | | The Greenbrier Companies, Inc. | | | 15,925 | | |
| | 188 | | | Wabtec Corp. | | | 17,536 | | |
| | | | 45,458 | | |
Truck Transportation - 6.8% | | | |
| | 201 | | | ArcBest Corp. | | | 15,966 | | |
| | 1,081 | | | Heartland Express, Inc. | | | 16,085 | | |
| | 306 | | | Knight-Swift Transportation
Holdings, Inc. Class A | | | 14,697 | | |
| | 1,056 | | | Marten Transport Ltd. | | | 19,821 | | |
| | 58 | | | Old Dominion Freight Line, Inc. | | | 15,927 | | |
| | 62 | | | Saia, Inc. (a) | | | 12,329 | | |
| | 658 | | | Schneider National, Inc. | | | 14,634 | | |
| | 176 | | | TFI International, Inc.
ADR (Canada) | | | 16,021 | | |
| | 994 | | | Universal Logistics Holdings, Inc. | | | 31,808 | | |
| | 3,534 | | | US Xpress Enterprises, Inc. (a) | | | 8,234 | | |
| | 378 | | | Werner Enterprises, Inc. | | | 14,818 | | |
| | | | 180,340 | | |
The accompanying notes are an integral part of these financial statements.
DIREXION ANNUAL REPORT
106
Direxion Daily US Infrastructure Bull 2X Shares
Schedule of Investments, continued
October 31, 2022
Shares | | | | Fair Value | |
Utilities - 5.1% | | | |
| | 1,213 | | | Algonquin Power & Utilities Corp.
ADR (Canada) | | $ | 13,416 | | |
| | 189 | | | American Electric Power Co., Inc. | | | 16,617 | | |
| | 254 | | | Black Hills Corp. | | | 16,604 | | |
| | 586 | | | MDU Resources Group, Inc. | | | 16,689 | | |
| | 618 | | | NiSource, Inc. | | | 15,877 | | |
| | 434 | | | NRG Energy, Inc. | | | 19,270 | | |
| | 232 | | | Ormat Technologies, Inc. | | | 20,984 | | |
| | 249 | | | Xcel Energy, Inc. | | | 16,212 | | |
| | | | 135,669 | | |
Water Transportation - 6.1% | | | |
| | 1,228 | | | Atlas Corp. ADR (United Kingdom) | | | 18,162 | | |
| | 1,404 | | | Costamare, Inc. ADR
(Marshall Islands) | | | 13,254 | | |
| | 217 | | | Danaos Corp. ADR (Greece) | | | 12,304 | | |
| | 421 | | | Eagle Bulk Shipping, Inc.
ADR (Marshall Islands) | | | 20,368 | | |
| | 2,028 | | | Euronav NV ADR (Belgium) | | | 36,159 | | |
| | 272 | | | Kirby Corp. (a) | | | 18,972 | | |
| | 2,117 | | | SFL Corp. Ltd. ADR | | | 21,593 | | |
| | 845 | | | Star Bulk Carriers Corp.
ADR (Greece) | | | 14,720 | | |
| | 292 | | | ZIM Integrated Shipping Services
Ltd. ADR (United Kingdom) | | | 6,859 | | |
| | | | 162,391 | | |
| | | | | TOTAL COMMON STOCKS
(Cost $1,382,345) | | $ | 1,412,714 | | |
Shares | | | | Fair Value | |
SHORT TERM INVESTMENTS - 42.6% | |
Money Market Funds - 42.6% | |
| | 1,126,589 | | | Dreyfus Government Cash
Management Institutional
Shares, 2.91% (b) | | $ | 1,126,589 | | |
| | 442 | | | Goldman Sachs Financial
Square Treasury Instruments
Fund Institutional Shares,
3.10% (b) | | | 442 | | |
| | | TOTAL SHORT TERM
INVESTMENTS
(Cost $1,127,031) | | $ | 1,127,031 | | |
| | | TOTAL INVESTMENTS
(Cost $2,509,376) - 96.0% (c) | | $ | 2,539,745 | | |
| | | Other Assets in Excess of
Liabilities - 4.0% | | | 106,899 | | |
| | | TOTAL NET ASSETS - 100.0% | | $ | 2,646,644 | | |
Percentages are stated as a percent of net assets.
The geographic location of all investments is United States unless otherwise indicated.
(a) Non-income producing security.
(b) Represents annualized seven-day yield at October 31, 2022.
(c) All or a portion of these securities have been segregated as collateral for swap contracts. Total value of securities segregated amounted to $972,499.
ADR - American Depository Receipt
Long Total Return Swap Contracts
October 31, 2022
Terms of Payments
to be Received at
Termination | | Terms of Payments to be
Paid at Termination | | Counterparty | | Termination
Date | | Contracts | | Notional
Amount | | Unrealized
Appreciation | |
Total return of Indxx
US Infrastructure
Index | | 3.5400% representing
1 month SOFR rate +
spread | | Bank of America
Merrill Lynch | | 12/13/2022 | | | 1,512 | | | $ | 3,326,613 | | | $ | 257,437 | | |
Total return of Indxx
US Infrastructure
Index | | 3.4400% representing
1 month SOFR rate +
spread | | J.P. Morgan | | 11/24/2023 | | | 122 | | | | 283,475 | | | | 6,112 | | |
| | | | | | | | | | | $ | 3,610,088 | | | $ | 263,549 | | |
The accompanying notes are an integral part of these financial statements.
DIREXION ANNUAL REPORT
107
Statements of Assets and Liabilities
October 31, 2022
| | | Direxion
Daily CSI 300
China A Share
Bear 1X Shares | | Direxion
Daily S&P 500®
Bear 1X Shares | | Direxion
Daily AAPL
Bear 1X Shares | | Direxion
Daily AMZN
Bear 1X Shares | |
Assets: | |
Investments, at fair value (Note 2) | | $ | 28,326,061 | | | $ | 662,709,628 | | | $ | 10,600,469 | | | $ | 3,347,464 | | |
Cash | | | — | | | | — | | | | — | | | | 187,081 | | |
Receivable for Fund shares sold | | | — | | | | 825,006 | | | | 2,621,087 | | | | — | | |
Due from Adviser, net (Note 6) | | | — | | | | — | | | | 579 | | | | 6,378 | | |
Dividend and interest receivable | | | 203,868 | | | | 1,421,226 | | | | 25,170 | | | | 8,176 | | |
Due from broker for swap contracts | | | 23 | | | | 3,245,323 | | | | 20,454 | | | | — | | |
Unrealized appreciation on swap contracts | | | 8,576,095 | | | | — | | | | 384,927 | | | | 473,443 | | |
Prepaid expenses and other assets | | | 12,043 | | | | 13,014 | | | | 516 | | | | — | | |
Total Assets | | | 37,118,090 | | | | 668,214,197 | | | | 13,653,202 | | | | 4,022,542 | | |
Liabilities: | |
Payable for Fund shares redeemed | | | — | | | | 13,919,854 | | | | — | | | | — | | |
Unrealized depreciation on swap contracts | | | — | | | | 36,861,301 | | | | — | | | | — | | |
Due to Adviser, net (Note 6) | | | 41,835 | | | | 132,875 | | | | — | | | | — | | |
Due to broker for swap contracts | | | 7,890,123 | | | | 3,310,325 | | | | 543,710 | | | | 286,519 | | |
Accrued expenses and other liabilities | | | 40,969 | | | | 187,432 | | | | 4,479 | | | | 3,296 | | |
Total Liabilities | | | 7,972,927 | | | | 54,411,787 | | | | 548,189 | | | | 289,815 | | |
Net Assets | | $ | 29,145,163 | | | $ | 613,802,410 | | | $ | 13,105,013 | | | $ | 3,732,727 | | |
Net Assets Consist of: | |
Capital stock | | $ | 23,100,372 | | | $ | 695,659,566 | | | $ | 13,019,930 | | | $ | 3,119,580 | | |
Total distributable earnings (loss) | | | 6,044,791 | | | | (81,857,156 | ) | | | 85,083 | | | | 613,147 | | |
Net Assets | | $ | 29,145,163 | | | $ | 613,802,410 | | | $ | 13,105,013 | | | $ | 3,732,727 | | |
Calculation of Net Asset Value Per
Share: | |
Net assets | | $ | 29,145,163 | | | $ | 613,802,410 | | | $ | 13,105,013 | | | $ | 3,732,727 | | |
Shares outstanding (unlimited shares
of beneficial interest authorized,
par value) | | | 1,200,000 | | | | 37,199,983 | | | | 500,001 | | | | 125,001 | | |
Net assets value, redemption price
and offering price per share | | $ | 24.29 | | | $ | 16.50 | | | $ | 26.21 | | | $ | 29.86 | | |
Cost of Investments | | $ | 28,326,061 | | | $ | 662,709,628 | | | $ | 10,600,469 | | | $ | 3,347,464 | | |
The accompanying notes are an integral part of these financial statements.
DIREXION ANNUAL REPORT
108
Statements of Assets and Liabilities
October 31, 2022
| | | Direxion
Daily GOOGL
Bear 1X Shares | | Direxion
Daily MSFT
Bear 1X Shares | | Direxion
Daily TSLA
Bear 1X Shares | | Direxion
Daily AAPL
Bull 1.5X Shares | |
Assets: | |
Investments, at fair value (Note 2) | | $ | 4,001,195 | | | $ | 3,964,811 | | | $ | 10,996,798 | | | $ | 6,699,070 | | |
Cash | | | — | | | | — | | | | — | | | | 151,000 | | |
Receivable for Fund shares sold | | | — | | | | — | | | | 1,502,540 | | | | 436,505 | | |
Receivable for investments sold | | | — | | | | — | | | | — | | | | 76,664 | | |
Due from Adviser, net (Note 6) | | | 6,327 | | | | 5,998 | | | | 1,448 | | | | 3,510 | | |
Dividend and interest receivable | | | 8,351 | | | | 9,337 | | | | 24,875 | | | | 14,678 | | |
Due from broker for swap contracts | | | 2,557 | | | | 5,882 | | | | 1,005,861 | | | | 4,728 | | |
Unrealized appreciation on swap contracts | | | 362,792 | | | | 255,659 | | | | 1,192,009 | | | | 139,025 | | |
Prepaid expenses and other assets | | | — | | | | — | | | | 516 | | | | 516 | | |
Total Assets | | | 4,381,222 | | | | 4,241,687 | | | | 14,724,047 | | | | 7,525,696 | | |
Liabilities: | |
Payable for Fund shares redeemed | | | — | | | | — | | | | 754,456 | | | | — | | |
Unrealized depreciation on swap contracts | | | — | | | | — | | | | — | | | | 250,693 | | |
Due to broker for swap contracts | | | 228,094 | | | | 232,117 | | | | 1,893,673 | | | | 163,263 | | |
Accrued expenses and other liabilities | | | 3,366 | | | | 3,392 | | | | 4,458 | | | | 3,898 | | |
Total Liabilities | | | 231,460 | | | | 235,509 | | | | 2,652,587 | | | | 417,854 | | |
Net Assets | | $ | 4,149,762 | | | $ | 4,006,178 | | | $ | 12,071,460 | | | $ | 7,107,842 | | |
Net Assets Consist of: | |
Capital stock | | $ | 3,829,737 | | | $ | 3,817,143 | | | $ | 10,062,454 | | | $ | 8,038,994 | | |
Total distributable earnings (loss) | | | 320,025 | | | | 189,035 | | | | 2,009,006 | | | | (931,152 | ) | |
Net Assets | | $ | 4,149,762 | | | $ | 4,006,178 | | | $ | 12,071,460 | | | $ | 7,107,842 | | |
Calculation of Net Asset Value Per
Share: | |
Net assets | | $ | 4,149,762 | | | $ | 4,006,178 | | | $ | 12,071,460 | | | $ | 7,107,842 | | |
Shares outstanding (unlimited shares
of beneficial interest authorized,
par value) | | | 150,001 | | | | 150,001 | | | | 400,001 | | | | 325,001 | | |
Net assets value, redemption price
and offering price per share | | $ | 27.66 | | | $ | 26.71 | | | $ | 30.18 | | | $ | 21.87 | | |
Cost of Investments | | $ | 4,001,195 | | | $ | 3,964,811 | | | $ | 10,996,798 | | | $ | 6,772,199 | | |
The accompanying notes are an integral part of these financial statements.
DIREXION ANNUAL REPORT
109
Statements of Assets and Liabilities
October 31, 2022
| | | Direxion
Daily AMZN
Bull 1.5X Shares | | Direxion
Daily GOOGL
Bull 1.5X Shares | | Direxion
Daily MSFT
Bull 1.5X Shares | | Direxion
Daily TSLA
Bull 1.5X Shares | |
Assets: | |
Investments, at fair value (Note 2) | | $ | 6,036,085 | | | $ | 5,147,245 | | | $ | 3,532,421 | | | $ | 116,068,228 | | |
Receivable for Fund shares sold | | | 1,072,164 | | | | — | | | | — | | | | 5,697,948 | | |
Due from Adviser, net (Note 6) | | | 6,600 | | | | 6,512 | | | | 6,591 | | | | — | | |
Dividend and interest receivable | | | 7,593 | | | | 7,852 | | | | 6,650 | | | | 185,261 | | |
Due from broker for swap contracts | | | 12,025 | | | | — | | | | 21,360 | | | | — | | |
Prepaid expenses and other assets | | | — | | | | — | | | | — | | | | 516 | | |
Total Assets | | | 7,134,467 | | | | 5,161,609 | | | | 3,567,022 | | | | 121,951,953 | | |
Liabilities: | |
Unrealized depreciation on swap contracts | | | 857,265 | | | | 539,236 | | | | 299,906 | | | | 18,019,534 | | |
Due to Adviser, net (Note 6) | | | — | | | | — | | | | — | | | | 32,977 | | |
Due to broker for swap contracts | | | 11,307 | | | | 25,420 | | | | 33,214 | | | | 3,593,317 | | |
Accrued expenses and other liabilities | | | 3,552 | | | | 3,488 | | | | 3,324 | | | | 20,570 | | |
Total Liabilities | | | 872,124 | | | | 568,144 | | | | 336,444 | | | | 21,666,398 | | |
Net Assets | | $ | 6,262,343 | | | $ | 4,593,465 | | | $ | 3,230,578 | | | $ | 100,285,555 | | |
Net Assets Consist of: | |
Capital stock | | $ | 7,316,374 | | | $ | 5,267,057 | | | $ | 3,652,116 | | | $ | 123,461,773 | | |
Total distributable loss | | | (1,054,031 | ) | | | (673,592 | ) | | | (421,538 | ) | | | (23,176,218 | ) | |
Net Assets | | $ | 6,262,343 | | | $ | 4,593,465 | | | $ | 3,230,578 | | | $ | 100,285,555 | | |
Calculation of Net Asset Value Per
Share: | |
Net assets | | $ | 6,262,343 | | | $ | 4,593,465 | | | $ | 3,230,578 | | | $ | 100,285,555 | | |
Shares outstanding (unlimited shares
of beneficial interest authorized,
par value) | | | 350,001 | | | | 225,001 | | | | 150,001 | | | | 6,025,001 | | |
Net assets value, redemption price
and offering price per share | | $ | 17.89 | | | $ | 20.42 | | | $ | 21.54 | | | $ | 16.64 | | |
Cost of Investments | | $ | 6,149,327 | | | $ | 5,213,829 | | | $ | 3,584,462 | | | $ | 118,013,619 | | |
The accompanying notes are an integral part of these financial statements.
DIREXION ANNUAL REPORT
110
Statements of Assets and Liabilities
October 31, 2022
| | | Direxion
Daily CSI 300
China A Share
Bull 2X Shares | | Direxion
Daily CSI China
Internet Index
Bull 2X Shares | | Direxion
Daily S&P 500®
Bull 2X Shares | | Direxion
Daily S&P 500
Equal Weight
Bull 2X Shares | |
Assets: | |
Investments, at fair value (including
securities loaned*) (Note 2) | | $ | 56,964,587 | | | $ | 246,969,086 | | | $ | 51,250,054 | | | $ | 4,922,010 | | |
Receivable for Fund shares sold | | | — | | | | 929,171 | | | | — | | | | — | | |
Receivable for investments sold | | | — | | | | 5,718,169 | | | | — | | | | — | | |
Dividend and interest receivable | | | 137,245 | | | | 377,245 | | | | 10,153 | | | | 3,517 | | |
Due from broker for swap contracts | | | — | | | | 1,757,821 | | | | 609,939 | | | | — | | |
Unrealized appreciation on swap contracts | | | — | | | | — | | | | 2,508,438 | | | | — | | |
Prepaid expenses and other assets | | | 21,727 | | | | 31,717 | | | | 7,350 | | | | 5,233 | | |
Total Assets | | | 57,123,559 | | | | 255,783,209 | | | | 54,385,934 | | | | 4,930,760 | | |
Liabilities: | |
Collateral for securities loaned (Note 2) | | | — | | | | — | | | | — | | | | 1,143,670 | | |
Payable for Fund shares redeemed | | | — | | | | 14,598 | | | | — | | | | — | | |
Unrealized depreciation on swap contracts | | | 17,149,982 | | | | 84,623,914 | | | | — | | | | 5,734 | | |
Due to Adviser, net (Note 6) | | | 32,086 | | | | 126,968 | | | | 14,014 | | | | 126 | | |
Due to broker for swap contracts | | | 787,218 | | | | 8,896,311 | | | | 4,202,943 | | | | 2,321 | | |
Accrued expenses and other liabilities | | | 35,044 | | | | 147,792 | | | | 29,787 | | | | 6,988 | | |
Total Liabilities | | | 18,004,330 | | | | 93,809,583 | | | | 4,246,744 | | | | 1,158,839 | | |
Net Assets | | $ | 39,119,229 | | | $ | 161,973,626 | | | $ | 50,139,190 | | | $ | 3,771,921 | | |
Net Assets Consist of: | |
Capital stock | | $ | 93,559,098 | | | $ | 757,494,498 | | | $ | 57,539,774 | | | $ | 4,998,913 | | |
Total distributable loss | | | (54,439,869 | ) | | | (595,520,872 | ) | | | (7,400,584 | ) | | | (1,226,992 | ) | |
Net Assets | | $ | 39,119,229 | | | $ | 161,973,626 | | | $ | 50,139,190 | | | $ | 3,771,921 | | |
Calculation of Net Asset Value Per
Share: | |
Net assets | | $ | 39,119,229 | | | $ | 161,973,626 | | | $ | 50,139,190 | | | $ | 3,771,921 | | |
Shares outstanding (unlimited shares
of beneficial interest authorized,
par value) | | | 2,600,000 | | | | 7,274,087 | | | | 683,236 | | | | 200,001 | | |
Net assets value, redemption price
and offering price per share | | $ | 15.05 | | | $ | 22.27 | | | $ | 73.38 | | | $ | 18.86 | | |
Cost of Investments | | $ | 57,545,098 | | | $ | 268,081,616 | | | $ | 47,121,527 | | | $ | 5,240,791 | | |
* Securities loaned with values of $–, $–, $– and $1,121,440, respectively. See Note 2.
The accompanying notes are an integral part of these financial statements.
DIREXION ANNUAL REPORT
111
Statements of Assets and Liabilities
October 31, 2022
| | | Direxion Daily
MSCI Brazil
Bull 2X Shares | | Direxion Daily
MSCI India
Bull 2X Shares | | Direxion
Daily Cloud
Computing
Bull 2X Shares | | Direxion Daily
Electric and
Autonomous
Vehicles
Bull 2X Shares | |
Assets: | |
Investments, at fair value (including
securities loaned*) (Note 2) | | $ | 132,975,753 | | | $ | 69,088,701 | | | $ | 7,835,006 | | | $ | 2,879,692 | | |
Cash | | | — | | | | 563,000 | | | | — | | | | — | | |
Receivable for investments sold | | | — | | | | — | | | | — | | | | 398,338 | | |
Due from Adviser, net (Note 6) | | | — | | | | — | | | | — | | | | 17,365 | | |
Dividend and interest receivable | | | 230,484 | | | | 78,066 | | | | 4,184 | | | | 2,640 | | |
Due from broker for swap contracts | | | 138,745 | | | | 68,817 | | | | 60,468 | | | | 3,840 | | |
Foreign tax reclaims | | | — | | | | — | | | | 2,878 | | | | — | | |
Unrealized appreciation on swap contracts | | | 15,459,639 | | | | 1,314,208 | | | | — | | | | — | | |
Prepaid expenses and other assets | | | 15,559 | | | | 26,639 | | | | 19,733 | | | | — | | |
Total Assets | | | 148,820,180 | | | | 71,139,431 | | | | 7,922,269 | | | | 3,301,875 | | |
Liabilities: | |
Collateral for securities loaned (Note 2) | | | 996,103 | | | | 17,123,281 | | | | 14,327 | | | | — | | |
Payable for investments purchased | | | — | | | | — | | | | — | | | | 398,241 | | |
Unrealized depreciation on swap contracts | | | — | | | | — | | | | 56,208 | | | | 37,352 | | |
Due to Adviser, net (Note 6) | | | 95,210 | | | | 33,491 | | | | 971 | | | | — | | |
Due to broker for swap contracts | | | 8,708,745 | | | | 1,564,123 | | | | 74,879 | | | | 4,127 | | |
Accrued expenses and other liabilities | | | 66,382 | | | | 57,706 | | | | 16,757 | | | | 6,749 | | |
Total Liabilities | | | 9,866,440 | | | | 18,778,601 | | | | 163,142 | | | | 446,469 | | |
Net Assets | | $ | 138,953,740 | | | $ | 52,360,830 | | | $ | 7,759,127 | | | $ | 2,855,406 | | |
Net Assets Consist of: | |
Capital stock | | $ | 593,464,792 | | | $ | 57,182,765 | | | $ | 23,903,728 | | | $ | 6,481,338 | | |
Total distributable loss | | | (454,511,052 | ) | | | (4,821,935 | ) | | | (16,144,601 | ) | | | (3,625,932 | ) | |
Net Assets | | $ | 138,953,740 | | | $ | 52,360,830 | | | $ | 7,759,127 | | | $ | 2,855,406 | | |
Calculation of Net Asset Value Per
Share: | |
Net assets | | $ | 138,953,740 | | | $ | 52,360,830 | | | $ | 7,759,127 | | | $ | 2,855,406 | | |
Shares outstanding (unlimited shares
of beneficial interest authorized,
par value) | | | 1,608,631 | | | | 1,099,686 | | | | 1,100,001 | | | | 300,001 | | |
Net assets value, redemption price
and offering price per share | | $ | 86.38 | | | $ | 47.61 | | | $ | 7.05 | | | $ | 9.52 | | |
Cost of Investments | | $ | 136,687,097 | | | $ | 72,742,643 | | | $ | 10,443,319 | | | $ | 3,848,072 | | |
* Securities loaned with values of $971,396, $16,763,041, $14,033 and $–, respectively. See Note 2.
The accompanying notes are an integral part of these financial statements.
DIREXION ANNUAL REPORT
112
Statements of Assets and Liabilities
October 31, 2022
| | | Direxion Daily
Energy
Bull 2X Shares | | Direxion Daily
Energy
Bear 2X Shares | | Direxion Daily
FinTech
Bull 2X Shares | | Direxion Daily
Global Clean
Energy
Bull 2X Shares ETF | |
Assets: | |
Investments, at fair value (Note 2) | | $ | 564,388,160 | | | $ | 48,842,907 | | | $ | 3,507,168 | | | $ | 4,574,040 | | |
Receivable for Fund shares sold | | | 1,064 | | | | 1,447,068 | | | | — | | | | — | | |
Receivable for investments sold | | | — | | | | — | | | | 89,652 | | | | — | | |
Due from Adviser, net (Note 6) | | | — | | | | — | | | | — | | | | 757 | | |
Dividend and interest receivable | | | 608,060 | | | | 110,055 | | | | 3,778 | | | | 6,215 | | |
Due from broker for swap contracts | | | 898,220 | | | | 127,747 | | | | 415 | | | | — | | |
Unrealized appreciation on swap contracts | | | 125,229,411 | | | | — | | | | — | | | | 11,373 | | |
Prepaid expenses and other assets | | | 13,792 | | | | 23,700 | | | | 3,804 | | | | 22,884 | | |
Total Assets | | | 691,138,707 | | | | 50,551,477 | | | | 3,604,817 | | | | 4,615,269 | | |
Liabilities: | |
Collateral for securities loaned (Note 2) | | | — | | | | — | | | | 92,444 | | | | — | | |
Payable for Fund shares redeemed | | | 10,541,754 | | | | — | | | | — | | | | — | | |
Payable for investments purchased | | | — | | | | — | | | | 203,554 | | | | — | | |
Unrealized depreciation on swap contracts | | | — | | | | 10,829,791 | | | | 145,729 | | | | 175,709 | | |
Due to Adviser, net (Note 6) | | | 331,413 | | | | 25,366 | | | | 1,017 | | | | — | | |
Due to broker for swap contracts | | | 122,004,332 | | | | 138,783 | | | | 20,266 | | | | 4,204 | | |
Accrued expenses and other liabilities | | | 233,065 | | | | 44,945 | | | | 9,043 | | | | 10,919 | | |
Total Liabilities | | | 133,110,564 | | | | 11,038,885 | | | | 472,053 | | | | 190,832 | | |
Net Assets | | $ | 558,028,143 | | | $ | 39,512,592 | | | $ | 3,132,764 | | | $ | 4,424,437 | | |
Net Assets Consist of: | |
Capital stock | | $ | 420,156,128 | | | $ | 238,300,621 | | | $ | 6,121,584 | | | $ | 9,101,373 | | |
Total distributable earnings (loss) | | | 137,872,015 | | | | (198,788,029 | ) | | | (2,988,820 | ) | | | (4,676,936 | ) | |
Net Assets | | $ | 558,028,143 | | | $ | 39,512,592 | | | $ | 3,132,764 | | | $ | 4,424,437 | | |
Calculation of Net Asset Value Per
Share: | |
Net assets | | $ | 558,028,143 | | | $ | 39,512,592 | | | $ | 3,132,764 | | | $ | 4,424,437 | | |
Shares outstanding (unlimited shares
of beneficial interest authorized,
par value) | | | 7,863,531 | | | | 1,365,264 | | | | 250,001 | | | | 300,001 | | |
Net assets value, redemption price
and offering price per share | | $ | 70.96 | | | $ | 28.94 | | | $ | 12.53 | | | $ | 14.75 | | |
Cost of Investments | | $ | 446,733,640 | | | $ | 48,842,907 | | | $ | 4,171,208 | | | $ | 5,194,354 | | |
* Securities loaned with values of $–, $–, $90,157 and $–, respectively. See Note 2.
The accompanying notes are an integral part of these financial statements.
DIREXION ANNUAL REPORT
113
Statements of Assets and Liabilities
October 31, 2022
| | | Direxion Daily
Gold Miners
Index
Bull 2X Shares | | Direxion Daily
Gold Miners
Index
Bear 2X Shares | | Direxion Daily
Junior Gold
Miners Index
Bull 2X Shares | | Direxion Daily
Junior Gold
Miners Index
Bear 2X Shares | |
Assets: | |
Investments, at fair value (Note 2) | | $ | 427,159,236 | | | $ | 90,675,497 | | | $ | 265,276,773 | | | $ | 110,441,765 | | |
Cash | | | — | | | | 310,000 | | | | — | | | | — | | |
Receivable for Fund shares sold | | | 749 | | | | 1,067 | | | | — | | | | 2,694,921 | | |
Receivable for investments sold | | | 9,660,179 | | | | — | | | | — | | | | — | | |
Dividend and interest receivable | | | 620,420 | | | | 224,268 | | | | 449,213 | | | | 256,687 | | |
Due from broker for swap contracts | | | 9,213,618 | | | | — | | | | — | | | | 1,740,720 | | |
Unrealized appreciation on swap contracts | | | 81,711 | | | | 17,295,461 | | | | — | | | | 10,271,370 | | |
Prepaid expenses and other assets | | | 35,422 | | | | 30,947 | | | | 20,181 | | | | 21,290 | | |
Total Assets | | | 446,771,335 | | | | 108,537,240 | | | | 265,746,167 | | | | 125,426,753 | | |
Liabilities: | |
Payable for Fund shares redeemed | | | 2,497,448 | | | | 3,555,122 | | | | — | | | | — | | |
Unrealized depreciation on swap contracts | | | 67,546,493 | | | | 1,998,775 | | | | 33,248,764 | | | | 1,508,980 | | |
Due to Adviser, net (Note 6) | | | 250,814 | | | | 58,464 | | | | 153,108 | | | | 73,737 | | |
Due to broker for swap contracts | | | 264,352 | | | | 16,134,645 | | | | 5,531,199 | | | | 10,190,758 | | |
Accrued expenses and other liabilities | | | 304,085 | | | | 40,981 | | | | 127,574 | | | | 32,305 | | |
Total Liabilities | | | 70,863,192 | | | | 21,787,987 | | | | 39,060,645 | | | | 11,805,780 | | |
Net Assets | | $ | 375,908,143 | | | $ | 86,749,253 | | | $ | 226,685,522 | | | $ | 113,620,973 | | |
Net Assets Consist of: | |
Capital stock | | $ | 2,512,681,561 | | | $ | 705,964,610 | | | $ | 1,978,247,966 | | | $ | 311,609,728 | | |
Total distributable loss | | | (2,136,773,418 | ) | | | (619,215,357 | ) | | | (1,751,562,444 | ) | | | (197,988,755 | ) | |
Net Assets | | $ | 375,908,143 | | | $ | 86,749,253 | | | $ | 226,685,522 | | | $ | 113,620,973 | | |
Calculation of Net Asset Value Per
Share: | |
Net assets | | $ | 375,908,143 | | | $ | 86,749,253 | | | $ | 226,685,522 | | | $ | 113,620,973 | | |
Shares outstanding (unlimited shares
of beneficial interest authorized,
par value) | | | 15,051,908 | | | | 3,660,171 | | | | 8,743,351 | | | | 8,432,449 | | |
Net assets value, redemption price
and offering price per share | | $ | 24.97 | | | $ | 23.70 | | | $ | 25.93 | | | $ | 13.47 | | |
Cost of Investments | | $ | 440,045,999 | | | $ | 90,675,497 | | | $ | 271,823,296 | | | $ | 110,441,765 | | |
The accompanying notes are an integral part of these financial statements.
DIREXION ANNUAL REPORT
114
Statements of Assets and Liabilities
October 31, 2022
| | | Direxion Daily
Metal Miners
Bull 2X Shares | | Direxion Daily
Oil Services
Bull 2X Shares | | Direxion Daily
Robotics,
Artificial
Intelligence &
Automation
Index
Bull 2X Shares | | Direxion Daily
S&P Oil & Gas
Exp. & Prod.
Bull 2X Shares | |
Assets: | |
Investments, at fair value (including
securities loaned*) (Note 2) | | $ | 11,634,845 | | | $ | 15,891,270 | | | $ | 13,291,362 | | | $ | 799,726,390 | | |
Dividend and interest receivable | | | 13,452 | | | | 7,955 | | | | 19,085 | | | | 913,109 | | |
Due from broker for swap contracts | | | 112 | | | | — | | | | 15,268 | | | | 601,720 | | |
Unrealized appreciation on swap contracts | | | 740,287 | | | | 2,872,748 | | | | — | | | | 292,528,624 | | |
Prepaid expenses and other assets | | | 5,688 | | | | 3,312 | | | | 18,266 | | | | 13,819 | | |
Total Assets | | | 12,394,384 | | | | 18,775,285 | | | | 13,343,981 | | | | 1,093,783,662 | | |
Liabilities: | |
Collateral for securities loaned (Note 2) | | | 30,515 | | | | — | | | | — | | | | 9,515,889 | | |
Payable for Fund shares redeemed | | | — | | | | — | | | | — | | | | 9,006,238 | | |
Unrealized depreciation on swap contracts | | | — | | | | — | | | | 2,246,935 | | | | — | | |
Due to Adviser, net (Note 6) | | | 4,795 | | | | 3,964 | | | | 6,127 | | | | 504,576 | | |
Due to broker for swap contracts | | | 652,443 | | | | 2,339,000 | | | | 31,173 | | | | 273,762,915 | | |
Accrued expenses and other liabilities | | | 9,655 | | | | 12,606 | | | | 16,785 | | | | 376,287 | | |
Total Liabilities | | | 697,408 | | | | 2,355,570 | | | | 2,301,020 | | | | 293,165,905 | | |
Net Assets | | $ | 11,696,976 | | | $ | 16,419,715 | | | $ | 11,042,961 | | | $ | 800,617,757 | | |
Net Assets Consist of: | |
Capital stock | | $ | 18,050,400 | | | $ | 14,360,946 | | | $ | 36,002,820 | | | $ | 511,536,429 | | |
Total distributable earnings (loss) | | | (6,353,424 | ) | | | 2,058,769 | | | | (24,959,859 | ) | | | 289,081,328 | | |
Net Assets | | $ | 11,696,976 | | | $ | 16,419,715 | | | $ | 11,042,961 | | | $ | 800,617,757 | | |
Calculation of Net Asset Value Per
Share: | |
Net assets | | $ | 11,696,976 | | | $ | 16,419,715 | | | $ | 11,042,961 | | | $ | 800,617,757 | | |
Shares outstanding (unlimited shares
of beneficial interest authorized,
par value) | | | 400,001 | | | | 450,001 | | | | 973,646 | | | | 4,328,422 | | |
Net assets value, redemption price
and offering price per share | | $ | 29.24 | | | $ | 36.49 | | | $ | 11.34 | | | $ | 184.97 | | |
Cost of Investments | | $ | 12,956,846 | | | $ | 14,601,818 | | | $ | 14,936,291 | | | $ | 760,683,173 | | |
* Securities loaned with values of $29,801, $–, $– and $9,592,857, respectively. See Note 2.
The accompanying notes are an integral part of these financial statements.
DIREXION ANNUAL REPORT
115
Statements of Assets and Liabilities
October 31, 2022
| | | Direxion Daily
S&P Oil & Gas
Exp. & Prod.
Bear 2X Shares | | Direxion Daily
Select Large
Caps & FANGs
Bull 2X Shares | | Direxion Daily
Software
Bull 2X Shares | | Direxion
Daily TIPS
Bull 2X Shares | |
Assets: | |
Investments, at fair value (including
securities loaned*) (Note 2) | | $ | 133,046,113 | | | $ | 14,789,855 | | | $ | 3,515,078 | | | $ | 7,404,685 | | |
Receivable for investments sold | | | — | | | | 590,316 | | | | — | | | | — | | |
Dividend and interest receivable | | | 273,804 | | | | 12,205 | | | | 1,990 | | | | 5,669 | | |
Due from broker for swap contracts | | | 353 | | | | 2,187,123 | | | | — | | | | 206,501 | | |
Unrealized appreciation on swap contracts | | | — | | | | 111,515 | | | | — | | | | — | | |
Prepaid expenses and other assets | | | 29,071 | | | | 4,749 | | | | 10,348 | | | | 1,450 | | |
Total Assets | | | 133,349,341 | | | | 17,695,763 | | | | 3,527,416 | | | | 7,618,305 | | |
Liabilities: | |
Collateral for securities loaned (Note 2) | | | — | | | | 50,364 | | | | 1,940 | | | | — | | |
Payable for Fund shares redeemed | | | 3,196,101 | | | | — | | | | — | | | | — | | |
Payable for investments purchased | | | — | | | | 2,342,324 | | | | — | | | | — | | |
Unrealized depreciation on swap contracts | | | 22,765,521 | | | | 56,349 | | | | 153,196 | | | | 412,511 | | |
Due to Adviser, net (Note 6) | | | 58,476 | | | | 5,627 | | | | 1,060 | | | | 1,984 | | |
Due to broker for swap contracts | | | 4,514,335 | | | | 2,577,208 | | | | 3,821 | | | | 215,486 | | |
Accrued expenses and other liabilities | | | 67,964 | | | | 23,781 | | | | 7,454 | | | | 12,846 | | |
Total Liabilities | | | 30,602,397 | | | | 5,055,653 | | | | 167,471 | | | | 642,827 | | |
Net Assets | | $ | 102,746,944 | | | $ | 12,640,110 | | | $ | 3,359,945 | | | $ | 6,975,478 | | |
Net Assets Consist of: | |
Capital stock | | $ | 349,900,683 | | | $ | 28,409,478 | | | $ | 6,840,967 | | | $ | 8,837,175 | | |
Total distributable loss | | | (247,153,739 | ) | | | (15,769,368 | ) | | | (3,481,022 | ) | | | (1,861,697 | ) | |
Net Assets | | $ | 102,746,944 | | | $ | 12,640,110 | | | $ | 3,359,945 | | | $ | 6,975,478 | | |
Calculation of Net Asset Value Per
Share: | |
Net assets | | $ | 102,746,944 | | | $ | 12,640,110 | | | $ | 3,359,945 | | | $ | 6,975,478 | | |
Shares outstanding (unlimited shares
of beneficial interest authorized,
par value) | | | 8,257,895 | | | | 2,900,001 | | | | 350,001 | | | | 350,001 | | |
Net assets value, redemption price
and offering price per share | | $ | 12.44 | | | $ | 4.36 | | | $ | 9.60 | | | $ | 19.93 | | |
Cost of Investments | | $ | 133,046,113 | | | $ | 14,926,904 | | | $ | 4,312,684 | | | $ | 8,025,065 | | |
* Securities loaned with values of $–, $290,904, $1,893 and $–, respectively. See Note 2.
The accompanying notes are an integral part of these financial statements.
DIREXION ANNUAL REPORT
116
Statements of Assets and Liabilities
October 31, 2022
| | | Direxion
Daily TIPS
Bear 2X Shares | | Direxion Daily
Travel & Vacation
Bull 2X Shares | | Direxion Daily
US Infrastructure
Bull 2X Shares | |
Assets: | |
Investments, at fair value (Note 2) | | $ | 8,874,540 | | | $ | 22,233,811 | | | $ | 2,539,745 | | |
Cash | | | — | | | | — | | | | 227 | | |
Receivable for Fund shares sold | | | 1,492,031 | | | | — | | | | — | | |
Due from Adviser, net (Note 6) | | | — | | | | — | | | | 1,120 | | |
Dividend and interest receivable | | | 21,544 | | | | 16,324 | | | | 3,579 | | |
Due from broker for swap contracts | | | 22,183 | | | | 1,694,914 | | | | 55,804 | | |
Unrealized appreciation on swap contracts | | | 325,754 | | | | 1,220,781 | | | | 263,549 | | |
Prepaid expenses and other assets | | | 1,796 | | | | 8,785 | | | | 3,939 | | |
Total Assets | | | 10,737,848 | | | | 25,174,615 | | | | 2,867,963 | | |
Liabilities: | |
Payable for Fund shares redeemed | | | 1,487,530 | | | | — | | | | — | | |
Unrealized depreciation on swap contracts | | | — | | | | 11,893 | | | | — | | |
Due to Adviser, net (Note 6) | | | 3,511 | | | | 11,226 | | | | — | | |
Due to broker for swap contracts | | | 282,541 | | | | 1,298,421 | | | | 209,872 | | |
Accrued expenses and other liabilities | | | 12,662 | | | | 28,915 | | | | 11,447 | | |
Total Liabilities | | | 1,786,244 | | | | 1,350,455 | | | | 221,319 | | |
Net Assets | | $ | 8,951,604 | | | $ | 23,824,160 | | | $ | 2,646,644 | | |
Net Assets Consist of: | |
Capital stock | | $ | 8,082,691 | | | $ | 49,860,748 | | | $ | 2,727,390 | | |
Total distributable earnings (loss) | | | 868,913 | | | | (26,036,588 | ) | | | (80,746 | ) | |
Net Assets | | $ | 8,951,604 | | | $ | 23,824,160 | | | $ | 2,646,644 | | |
Calculation of Net Asset Value Per Share: | |
Net assets | | $ | 8,951,604 | | | $ | 23,824,160 | | | $ | 2,646,644 | | |
Shares outstanding (unlimited shares of beneficial interest
authorized, par value) | | | 300,001 | | | | 2,300,001 | | | | 100,001 | | |
Net assets value, redemption price and offering price
per share | | $ | 29.84 | | | $ | 10.36 | | | $ | 26.47 | | |
Cost of Investments | | $ | 8,874,540 | | | $ | 27,407,482 | | | $ | 2,509,376 | | |
The accompanying notes are an integral part of these financial statements.
DIREXION ANNUAL REPORT
117
Statements of Operations
For the Year Ended October 31, 2022
| | | Direxion
Daily CSI 300
China A Share
Bear 1X Shares | | Direxion
Daily S&P 500®
Bear 1X Shares | | Direxion
Daily AAPL
Bear 1X Shares1 | | Direxion
Daily AMZN
Bear 1X Shares2 | |
Investment Income: | |
Dividend income | | $ | — | | | $ | — | | | $ | — | | | $ | — | | |
Interest income | | | 1,172,384 | | | | 4,248,680 | | | | 44,203 | | | | 12,523 | | |
Total investment income | | | 1,172,384 | | | | 4,248,680 | | | | 44,203 | | | | 12,523 | | |
Expenses: | |
Investment advisory fees (Note 6) | | | 821,733 | | | | 1,117,867 | | | | 13,338 | | | | 3,564 | | |
Fund servicing fees | | | 51,400 | | | | 119,278 | | | | 1,710 | | | | 1,193 | | |
Licensing fees | | | 41,157 | | | | 159,694 | | | | — | | | | — | | |
Interest expense | | | 37,027 | | | | 112,294 | | | | 517 | | | | 51 | | |
Management service fees (Note 6) | | | 33,951 | | | | 79,307 | | | | 443 | | | | 119 | | |
Reports to shareholders | | | 22,228 | | | | 53,379 | | | | 313 | | | | 84 | | |
Professional fees | | | 20,301 | | | | 33,362 | | | | 10,142 | | | | 10,039 | | |
Pricing fees | | | 6,001 | | | | 6,001 | | | | 1,381 | | | | 904 | | |
Exchange listing fees | | | 5,438 | | | | 5,438 | | | | 1,151 | | | | 754 | | |
Trustees' fees and expenses | | | 4,459 | | | | 10,773 | | | | 69 | | | | 19 | | |
Insurance fees | | | 2,934 | | | | 7,024 | | | | 44 | | | | 12 | | |
Offering fees | | | — | | | | — | | | | 6,485 | | | | 6,544 | | |
Other | | | 3,973 | | | | 48,846 | | | | 974 | | | | 292 | | |
Total Expenses | | | 1,050,602 | | | | 1,753,263 | | | | 36,567 | | | | 23,575 | | |
Recoupment of expenses to
Adviser (Note 6) | | | 118 | | | | 2,110 | | | | — | | | | — | | |
Less: Reimbursement of expenses
from Adviser (Note 6) | | | (118 | ) | | | (205,822 | ) | | | (19,155 | ) | | | (19,009 | ) | |
Net Expenses | | | 1,050,602 | | | | 1,549,551 | | | | 17,412 | | | | 4,566 | | |
Net investment income | | | 121,782 | | | | 2,699,129 | | | | 26,791 | | | | 7,957 | | |
Net realized and unrealized gain
(loss) on investments: | |
Net realized gain (loss) on:
Investment securities | | | (1 | ) | | | — | | | | — | | | | — | | |
Swap contracts | | | 26,345,811 | | | | 51,953,665 | | | | (315,323 | ) | | | 132,589 | | |
Net realized gain (loss) | | | 26,345,810 | | | | 51,953,665 | | | | (315,323 | ) | | | 132,589 | | |
Change in net unrealized appreciation
(depreciation) on:
Swap contracts | | | 13,783,625 | | | | (27,471,031 | ) | | | 384,927 | | | | 473,443 | | |
Change in net unrealized appreciation
(depreciation) | | | 13,783,625 | | | | (27,471,031 | ) | | | 384,927 | | | | 473,443 | | |
Net realized and unrealized gain | | | 40,129,435 | | | | 24,482,634 | | | | 69,604 | | | | 606,032 | | |
Net increase in net assets resulting
from operations | | $ | 40,251,217 | | | $ | 27,181,763 | | | $ | 96,395 | | | $ | 613,989 | | |
1 Represents the period from August 9, 2022 (commencement of operations) to October 31, 2022.
2 Represents the period from September 7, 2022 (commencement of operations) to October 31, 2022.
The accompanying notes are an integral part of these financial statements.
DIREXION ANNUAL REPORT
118
Statements of Operations
For the Year Ended October 31, 2022
| | | Direxion
Daily GOOGL
Bear 1X Shares2 | | Direxion
Daily MSFT
Bear 1X Shares2 | | Direxion
Daily TSLA
Bear 1X Shares1 | | Direxion
Daily AAPL
Bull 1.5X Shares1 | |
Investment Income: | |
Dividend income | | $ | — | | | $ | — | | | $ | — | | | $ | — | | |
Interest income | | | 12,494 | | | | 13,594 | | | | 42,331 | | | | 28,648 | | |
Total investment income | | | 12,494 | | | | 13,594 | | | | 42,331 | | | | 28,648 | | |
Expenses: | |
Professional fees | | | 10,040 | | | | 10,043 | | | | 10,137 | | | | 10,106 | | |
Offering fees | | | 6,544 | | | | 6,544 | | | | 7,569 | | | | 6,485 | | |
Investment advisory fees (Note 6) | | | 3,628 | | | | 3,895 | | | | 12,787 | | | | 9,999 | | |
Fund servicing fees | | | 1,196 | | | | 1,211 | | | | 1,683 | | | | 1,530 | | |
Pricing fees | | | 904 | | | | 904 | | | | 1,381 | | | | 1,381 | | |
Exchange listing fees | | | 754 | | | | 753 | | | | 1,151 | | | | 1,151 | | |
Management service fees (Note 6) | | | 121 | | | | 130 | | | | 425 | | | | 332 | | |
Reports to shareholders | | | 86 | | | | 92 | | | | 300 | | | | 234 | | |
Trustees' fees and expenses | | | 19 | | | | 21 | | | | 67 | | | | 51 | | |
Insurance fees | | | 12 | | | | 13 | | | | 42 | | | | 32 | | |
Interest expense | | | — | | | | — | | | | 195 | | | | — | | |
Other | | | 356 | | | | 356 | | | | 984 | | | | 703 | | |
Total Expenses | | | 23,660 | | | | 23,962 | | | | 36,721 | | | | 32,004 | | |
Recoupment of expenses to
Adviser (Note 6) | | | — | | | | 849 | | | | — | | | | — | | |
Less: Reimbursement of expenses
from Adviser (Note 6) | | | (19,064 | ) | | | (19,877 | ) | | | (20,330 | ) | | | (19,339 | ) | |
Net Expenses | | | 4,596 | | | | 4,934 | | | | 16,391 | | | | 12,665 | | |
Net investment income | | | 7,898 | | | | 8,660 | | | | 25,940 | | | | 15,983 | | |
Net realized and unrealized gain
(loss) on investments: | |
Net realized gain (loss) on:
Investment securities | | | — | | | | — | | | | — | | | | (7,124 | ) | |
In-kind redemptions | | | — | | | | — | | | | — | | | | 3,969 | | |
Swap contracts | | | (49,876 | ) | | | (74,486 | ) | | | 1,099,836 | | | | (751,463 | ) | |
Net realized gain (loss) | | | (49,876 | ) | | | (74,486 | ) | | | 1,099,836 | | | | (754,618 | ) | |
Change in net unrealized appreciation
(depreciation) on:
Investment securities | | | — | | | | — | | | | — | | | | (73,129 | ) | |
Swap contracts | | | 362,792 | | | | 255,659 | | | | 1,192,009 | | | | (111,668 | ) | |
Change in net unrealized appreciation
(depreciation) | | | 362,792 | | | | 255,659 | | | | 1,192,009 | | | | (184,797 | ) | |
Net realized and unrealized gain (loss) | | | 312,916 | | | | 181,173 | | | | 2,291,845 | | | | (939,415 | ) | |
Net increase (decrease) in net assets
resulting from operations | | $ | 320,814 | | | $ | 189,833 | | | $ | 2,317,785 | | | $ | (923,432 | ) | |
1 Represents the period from August 9, 2022 (commencement of operations) to October 31, 2022.
2 Represents the period from September 7, 2022 (commencement of operations) to October 31, 2022.
The accompanying notes are an integral part of these financial statements.
DIREXION ANNUAL REPORT
119
Statements of Operations
For the Year Ended October 31, 2022
| | | Direxion
Daily AMZN
Bull 1.5X Shares2 | | Direxion
Daily GOOGL
Bull 1.5X Shares2 | | Direxion
Daily MSFT
Bull 1.5X Shares2 | | Direxion
Daily TSLA
Bull 1.5X Shares1 | |
Investment Income: | |
Dividend income | | $ | — | | | $ | — | | | $ | — | | | $ | — | | |
Interest income | | | 11,252 | | | | 11,466 | | | | 10,179 | | | | 295,080 | | |
Total investment income | | | 11,252 | | | | 11,466 | | | | 10,179 | | | | 295,080 | | |
Expenses: | |
Professional fees | | | 10,039 | | | | 10,039 | | | | 10,037 | | | | 10,853 | | |
Offering fees | | | 6,544 | | | | 6,544 | | | | 6,544 | | | | 7,569 | | |
Investment advisory fees (Note 6) | | | 3,548 | | | | 3,543 | | | | 3,373 | | | | 87,491 | | |
Fund servicing fees | | | 1,191 | | | | 1,191 | | | | 1,182 | | | | 5,425 | | |
Pricing fees | | | 904 | | | | 904 | | | | 904 | | | | 1,381 | | |
Exchange listing fees | | | 753 | | | | 753 | | | | 754 | | | | 1,151 | | |
Management service fees (Note 6) | | | 118 | | | | 118 | | | | 112 | | | | 2,908 | | |
Reports to shareholders | | | 84 | | | | 84 | | | | 79 | | | | 1,990 | | |
Trustees' fees and expenses | | | 19 | | | | 19 | | | | 18 | | | | 405 | | |
Insurance fees | | | 12 | | | | 12 | | | | 11 | | | | 288 | | |
Interest expense | | | — | | | | — | | | | — | | | | 3,134 | | |
Other | | | 550 | | | | 486 | | | | 340 | | | | 11,246 | | |
Total Expenses | | | 23,762 | | | | 23,693 | | | | 23,354 | | | | 133,841 | | |
Recoupment of expenses to
Adviser (Note 6) | | | — | | | | — | | | | — | | | | 5,334 | | |
Less: Reimbursement of expenses
from Adviser (Note 6) | | | (19,268 | ) | | | (19,205 | ) | | | (19,082 | ) | | | (25,219 | ) | |
Net Expenses | | | 4,494 | | | | 4,488 | | | | 4,272 | | | | 113,956 | | |
Net investment income | | | 6,758 | | | | 6,978 | | | | 5,907 | | | | 181,124 | | |
Net realized and unrealized gain
(loss) on investments: | |
Net realized gain (loss) on:
Investment securities | | | 4 | | | | — | | | | — | | | | (1,649,052 | ) | |
In-kind redemptions | | | — | | | | — | | | | — | | | | 59,890 | | |
Swap contracts | | | (89,773 | ) | | | (74,204 | ) | | | (74,937 | ) | | | (1,654,227 | ) | |
Net realized loss | | | (89,769 | ) | | | (74,204 | ) | | | (74,937 | ) | | | (3,243,389 | ) | |
Change in net unrealized
depreciation on:
Investment securities | | | (113,242 | ) | | | (66,584 | ) | | | (52,041 | ) | | | (1,945,391 | ) | |
Swap contracts | | | (857,265 | ) | | | (539,236 | ) | | | (299,906 | ) | | | (18,019,534 | ) | |
Change in net unrealized depreciation | | | (970,507 | ) | | | (605,820 | ) | | | (351,947 | ) | | | (19,964,925 | ) | |
Net realized and unrealized loss | | | (1,060,276 | ) | | | (680,024 | ) | | | (426,884 | ) | | | (23,208,314 | ) | |
Net decrease in net assets resulting
from operations | | $ | (1,053,518 | ) | | $ | (673,046 | ) | | $ | (420,977 | ) | | $ | (23,027,190 | ) | |
1 Represents the period from August 9, 2022 (commencement of operations) to October 31, 2022.
2 Represents the period from September 7, 2022 (commencement of operations) to October 31, 2022.
The accompanying notes are an integral part of these financial statements.
DIREXION ANNUAL REPORT
120
Statements of Operations
For the Year Ended October 31, 2022
| | | Direxion
Daily CSI 300
China A Share
Bull 2X Shares | | Direxion
Daily CSI China
Internet Index
Bull 2X Shares | | Direxion
Daily S&P 500®
Bull 2X Shares | | Direxion
Daily S&P 500
Equal Weight
Bull 2X Shares1 | |
Investment Income: | |
Dividend income | | $ | 398,036 | | | $ | — | | | $ | 706,945 | | | $ | 39,508 | | |
Interest income | | | 572,025 | | | | 1,630,874 | | | | 26,418 | | | | 13,950 | | |
Securities lending income | | | 86,539 | | | | — | | | | — | | | | 921 | | |
Total investment income | | | 1,056,600 | | | | 1,630,874 | | | | 733,363 | | | | 54,379 | | |
Expenses: | |
Investment advisory fees (Note 6) | | | 571,131 | | | | 2,402,992 | | | | 256,103 | | | | 24,684 | | |
Fund servicing fees | | | 28,940 | | | | 118,900 | | | | 19,807 | | | | 2,233 | | |
Licensing fees | | | 22,890 | | | | 96,121 | | | | 30,732 | | | | 11,713 | | |
Management service fees (Note 6) | | | 18,882 | | | | 79,428 | | | | 12,703 | | | | 817 | | |
Interest expense | | | 17,000 | | | | 135,857 | | | | 3,393 | | | | 105 | | |
Professional fees | | | 15,880 | | | | 34,185 | | | | 13,922 | | | | 10,406 | | |
Reports to shareholders | | | 12,017 | | | | 51,673 | | | | 8,202 | | | | 579 | | |
Pricing fees | | | 6,001 | | | | 6,001 | | | | 6,001 | | | | 4,685 | | |
Exchange listing fees | | | 5,438 | | | | 5,438 | | | | 5,439 | | | | 4,246 | | |
Trustees' fees and expenses | | | 2,390 | | | | 10,356 | | | | 1,635 | | | | 115 | | |
Insurance fees | | | 1,633 | | | | 6,866 | | | | 1,102 | | | | 72 | | |
Offering fees | | | — | | | | — | | | | — | | | | 3,444 | | |
Other | | | 2,606 | | | | 46,371 | | | | 1,869 | | | | 575 | | |
Total Expenses | | | 704,808 | | | | 2,994,188 | | | | 360,908 | | | | 63,674 | | |
Recoupment of expenses to
Adviser (Note 6) | | | — | | | | 2,361 | | | | — | | | | — | | |
Less: Reimbursement of expenses
from Adviser (Note 6) | | | — | | | | (1,911 | ) | | | (50,190 | ) | | | (32,302 | ) | |
Net Expenses | | | 704,808 | | | | 2,994,638 | | | | 310,718 | | | | 31,372 | | |
Net investment income (loss) | | | 351,792 | | | | (1,363,764 | ) | | | 422,645 | | | | 23,007 | | |
Net realized and unrealized gain
(loss) on investments: | |
Net realized gain (loss) on:
Investment securities | | | (12,303,638 | ) | | | (163,268,745 | ) | | | (3,175,715 | ) | | | (83,691 | ) | |
In-kind redemptions | | | (199,834 | ) | | | 23,528,681 | | | | 947,780 | | | | — | | |
Swap contracts | | | (25,303,339 | ) | | | (352,083,934 | ) | | | (10,432,554 | ) | | | (828,855 | ) | |
Net realized loss | | | (37,806,811 | ) | | | (491,823,998 | ) | | | (12,660,489 | ) | | | (912,546 | ) | |
Capital gain distributions from
regulated investment companies | | | — | | | | 12,059,110 | | | | — | | | | — | | |
Change in net unrealized appreciation
(depreciation) on:
Investment securities | | | 2,025,896 | | | | (18,573,802 | ) | | | (7,941,716 | ) | | | (318,781 | ) | |
Swap contracts | | | (24,320,521 | ) | | | (50,337,999 | ) | | | (820,922 | ) | | | (5,734 | ) | |
Change in net unrealized depreciation | | | (22,294,625 | ) | | | (68,911,801 | ) | | | (8,762,638 | ) | | | (324,515 | ) | |
Net realized and unrealized loss | | | (60,101,436 | ) | | | (548,676,689 | ) | | | (21,423,127 | ) | | | (1,237,061 | ) | |
Net decrease in net assets resulting
from operations | | $ | (59,749,644 | ) | | $ | (550,040,453 | ) | | $ | (21,000,482 | ) | | $ | (1,214,054 | ) | |
1 Represents the period from January 20, 2022 (commencement of operations) to October 31, 2022.
The accompanying notes are an integral part of these financial statements.
DIREXION ANNUAL REPORT
121
Statements of Operations
For the Year Ended October 31, 2022
| | | Direxion Daily
MSCI Brazil
Bull 2X Shares | | Direxion Daily
MSCI India
Bull 2X Shares | | Direxion
Daily Cloud
Computing
Bull 2X Shares | | Direxion Daily
Electric and
Autonomous
Vehicles
Bull 2X Shares1 | |
Investment Income: | |
Dividend income
(net of foreign withholding tax of
$—, $—, $1,626 and $—, respectively) | | $ | 12,339,402 | | | $ | 2,337,114 | | | $ | 30,258 | | | $ | 722 | | |
Interest income | | | 869,412 | | | | 312,249 | | | | 19,840 | | | | 6,848 | | |
Securities lending income | | | 120,354 | | | | 21,835 | | | | 283 | | | | — | | |
Total investment income | | | 13,329,168 | | | | 2,671,198 | | | | 50,381 | | | | 7,570 | | |
Expenses: | |
Investment advisory fees (Note 6) | | | 1,228,166 | | | | 522,408 | | | | 90,324 | | | | 6,784 | | |
Licensing fees | | | 100,628 | | | | 27,862 | | | | 23,999 | | | | 5,391 | | |
Interest expense | | | 86,698 | | | | 19,991 | | | | 1,260 | | | | — | | |
Fund servicing fees | | | 61,110 | | | | 26,561 | | | | 5,392 | | | | 1,354 | | |
Management service fees (Note 6) | | | 40,568 | | | | 17,271 | | | | 2,984 | | | | 225 | | |
Reports to shareholders | | | 26,204 | | | | 11,074 | | | | 1,858 | | | | 159 | | |
Professional fees | | | 22,519 | | | | 15,370 | | | | 10,949 | | | | 10,070 | | |
Excise tax | | | 17,616 | | | | — | | | | — | | | | — | | |
Pricing fees | | | 6,001 | | | | 6,000 | | | | 6,001 | | | | 1,348 | | |
Exchange listing fees | | | 5,438 | | | | 5,438 | | | | 5,439 | | | | 1,222 | | |
Trustees' fees and expenses | | | 5,250 | | | | 2,197 | | | | 364 | | | | 34 | | |
Insurance fees | | | 3,531 | | | | 1,497 | | | | 258 | | | | 21 | | |
Offering fees | | | — | | | | — | | | | — | | | | 15,601 | | |
Other | | | 5,375 | | | | 2,400 | | | | 692 | | | | 622 | | |
Total Expenses | | | 1,609,104 | | | | 658,069 | | | | 149,520 | | | | 42,831 | | |
Recoupment of expenses to
Adviser (Note 6) | | | 37 | | | | — | | | | — | | | | 775 | | |
Less: Reimbursement of expenses
from Adviser (Note 6) | | | (37 | ) | | | — | | | | (33,849 | ) | | | (35,013 | ) | |
Net Expenses | | | 1,609,104 | | | | 658,069 | | | | 115,671 | | | | 8,593 | | |
Net investment income (loss) | | | 11,720,064 | | | | 2,013,129 | | | | (65,290 | ) | | | (1,023 | ) | |
Net realized and unrealized gain
(loss) on investments: | |
Net realized gain (loss) on:
Investment securities | | | (15,969,114 | ) | | | — | | | | (3,073,903 | ) | | | (482,229 | ) | |
In-kind redemptions | | | 7,600,040 | | | | (67,247 | ) | | | 244,177 | | | | (90,166 | ) | |
Swap contracts | | | 13,860,504 | | | | 5,181,116 | | | | (10,846,871 | ) | | | (2,254,631 | ) | |
Net realized gain (loss) | | | 5,491,430 | | | | 5,113,869 | | | | (13,676,597 | ) | | | (2,827,026 | ) | |
Change in net unrealized appreciation
(depreciation) on:
Investment securities | | | 25,734,981 | | | | (5,354,848 | ) | | | (4,643,736 | ) | | | (968,380 | ) | |
Swap contracts | | | 45,449,723 | | | | (19,719,112 | ) | | | (2,693,426 | ) | | | (37,352 | ) | |
Change in net unrealized appreciation
(depreciation) | | | 71,184,704 | | | | (25,073,960 | ) | | | (7,337,162 | ) | | | (1,005,732 | ) | |
Net realized and unrealized gain (loss) | | | 76,676,134 | | | | (19,960,091 | ) | | | (21,013,759 | ) | | | (3,832,758 | ) | |
Net increase (decrease) in net assets
resulting from operations | | $ | 88,396,198 | | | $ | (17,946,962 | ) | | $ | (21,079,049 | ) | | $ | (3,833,781 | ) | |
1 Represents the period from August 11, 2022 (commencement of operations) to October 31, 2022.
The accompanying notes are an integral part of these financial statements.
DIREXION ANNUAL REPORT
122
Statements of Operations
For the Year Ended October 31, 2022
| | | Direxion Daily
Energy
Bull 2X Shares | | Direxion Daily
Energy
Bear 2X Shares | | Direxion Daily
FinTech
Bull 2X Shares1 | | Direxion Daily
Global Clean
Energy
Bull 2X Shares ETF | |
Investment Income: | |
Dividend income
(net of foreign withholding tax of
$—, $—, $9 and $—, respectively) | | $ | 20,648,240 | | | $ | — | | | $ | 19,494 | | | $ | 68,860 | | |
Interest income | | | 968,716 | | | | 502,152 | | | | 9,335 | | | | 15,383 | | |
Securities lending income | | | 1 | | | | — | | | | 2,048 | | | | 598 | | |
Total investment income | | | 21,616,957 | | | | 502,152 | | | | 30,877 | | | | 84,841 | | |
Expenses: | |
Investment advisory fees (Note 6) | | | 4,436,269 | | | | 308,219 | | | | 23,942 | | | | 50,345 | | |
Interest expense | | | 632,928 | | | | 22,173 | | | | 245 | | | | 3,497 | | |
Licensing fees | | | 451,995 | | | | 30,794 | | | | 18,739 | | | | 24,999 | | |
Fund servicing fees | | | 218,595 | | | | 16,194 | | | | 2,187 | | | | 3,478 | | |
Management service fees (Note 6) | | | 146,614 | | | | 10,209 | | | | 792 | | | | 1,665 | | |
Reports to shareholders | | | 96,274 | | | | 6,748 | | | | 554 | | | | 1,064 | | |
Professional fees | | | 54,090 | | | | 13,058 | | | | 10,396 | | | | 10,504 | | |
Trustees' fees and expenses | | | 19,337 | | | | 1,357 | | | | 110 | | | | 213 | | |
Insurance fees | | | 12,742 | | | | 897 | | | | 68 | | | | 139 | | |
Pricing fees | | | 6,001 | | | | 6,001 | | | | 4,685 | | | | 6,001 | | |
Exchange listing fees | | | 5,741 | | | | 5,438 | | | | 4,246 | | | | 5,438 | | |
Offering fees | | | — | | | | — | | | | 8,326 | | | | — | | |
Excise tax | | | — | | | | — | | | | — | | | | 145 | | |
Other | | | 16,319 | | | | 4,510 | | | | 675 | | | | 562 | | |
Total Expenses | | | 6,096,905 | | | | 425,598 | | | | 74,965 | | | | 108,050 | | |
Recoupment of expenses to
Adviser (Note 6) | | | 1,215 | | | | 887 | | | | — | | | | — | | |
Less: Reimbursement of expenses
from Adviser (Note 6) | | | — | | | | (13,901 | ) | | | (44,393 | ) | | | (40,638 | ) | |
Net Expenses | | | 6,098,120 | | | | 412,584 | | | | 30,572 | | | | 67,412 | | |
Net investment income | | | 15,518,837 | | | | 89,568 | | | | 305 | | | | 17,429 | | |
Net realized and unrealized gain
(loss) on investments: | |
Net realized gain (loss) on:
Investment securities | | | (16,713,646 | ) | | | — | | | | (559,235 | ) | | | (1,262,677 | ) | |
In-kind redemptions | | | 158,567,052 | | | | — | | | | — | | | | (350,250 | ) | |
Swap contracts | | | 305,766,762 | | | | (36,887,314 | ) | | | (1,619,816 | ) | | | (3,025,544 | ) | |
Net realized gain (loss) | | | 447,620,168 | | | | (36,887,314 | ) | | | (2,179,051 | ) | | | (4,638,471 | ) | |
Change in net unrealized appreciation
(depreciation) on:
Investment securities | | | 45,365,907 | | | | — | | | | (664,040 | ) | | | (1,224,397 | ) | |
Swap contracts | | | (3,082,477 | ) | | | (2,135,712 | ) | | | (145,729 | ) | | | (1,116,838 | ) | |
Change in net unrealized appreciation
(depreciation) | | | 42,283,430 | | | | (2,135,712 | ) | | | (809,769 | ) | | | (2,341,235 | ) | |
Net realized and unrealized gain (loss) | | | 489,903,598 | | | | (39,023,026 | ) | | | (2,988,820 | ) | | | (6,979,706 | ) | |
Net increase (decrease) in net assets
resulting from operations | | $ | 505,422,435 | | | $ | (38,933,458 | ) | | $ | (2,988,515 | ) | | $ | (6,962,277 | ) | |
1 Represents the period from January 20, 2022 (commencement of operations) to October 31, 2022.
The accompanying notes are an integral part of these financial statements.
DIREXION ANNUAL REPORT
123
Statements of Operations
For the Year Ended October 31, 2022
| | | Direxion Daily
Gold Miners
Index
Bull 2X Shares | | Direxion Daily
Gold Miners
Index
Bear 2X Shares | | Direxion Daily
Junior Gold
Miners Index
Bull 2X Shares | | Direxion Daily
Junior Gold
Miners Index
Bear 2X Shares | |
Investment Income: | |
Dividend income | | $ | 6,014,029 | | | $ | — | | | $ | 3,264,449 | | | $ | — | | |
Interest income | | | 2,450,843 | | | | 771,885 | | | | 1,937,169 | | | | 836,208 | | |
Securities lending income | | | 44 | | | | — | | | | 4,373 | | | | — | | |
Total investment income | | | 8,464,916 | | | | 771,885 | | | | 5,205,991 | | | | 836,208 | | |
Expenses: | |
Investment advisory fees (Note 6) | | | 4,361,088 | | | | 601,313 | | | | 2,758,365 | | | | 607,678 | | |
Fund servicing fees | | | 214,330 | | | | 30,565 | | | | 135,925 | | | | 30,897 | | |
Management service fees (Note 6) | | | 144,023 | | | | 19,886 | | | | 91,094 | | | | 20,096 | | |
Interest expense | | | 125,344 | | | | 144,221 | | | | 37,735 | | | | 153,114 | | |
Licensing fees | | | 118,260 | | | | 17,207 | | | | 2,500 | | | | 2,500 | | |
Reports to shareholders | | | 92,505 | | | | 13,115 | | | | 58,395 | | | | 13,159 | | |
Professional fees | | | 54,910 | | | | 15,964 | | | | 38,397 | | | | 16,026 | | |
Trustees' fees and expenses | | | 18,517 | | | | 2,635 | | | | 11,684 | | | | 2,642 | | |
Insurance fees | | | 12,473 | | | | 1,738 | | | | 7,886 | | | | 1,766 | | |
Pricing fees | | | 6,001 | | | | 6,001 | | | | 6,001 | | | | 6,001 | | |
Exchange listing fees | | | 5,438 | | | | 5,438 | | | | 5,438 | | | | 5,438 | | |
Other | | | 36,093 | | | | 18,006 | | | | 28,697 | | | | 18,064 | | |
Total Expenses | | | 5,188,982 | | | | 876,089 | | | | 3,182,117 | | | | 877,381 | | |
Recoupment of expenses to
Adviser (Note 6) | | | 7,397 | | | | 20,840 | | | | — | | | | 9,992 | | |
Less: Reimbursement of expenses
from Adviser (Note 6) | | | — | | | | (11,797 | ) | | | — | | | | (9,992 | ) | |
Net Expenses | | | 5,196,379 | | | | 885,132 | | | | 3,182,117 | | | | 877,381 | | |
Net investment income (loss) | | | 3,268,537 | | | | (113,247 | ) | | | 2,023,874 | | | | (41,173 | ) | |
Net realized and unrealized gain
(loss) on investments: | |
Net realized gain (loss) on:
Investment securities | | | (113,830,725 | ) | | | — | | | | (67,117,883 | ) | | | — | | |
In-kind redemptions | | | 27,131,497 | | | | — | | | | 25,120,476 | | | | — | | |
Swap contracts | | | (200,012,403 | ) | | | 23,187,657 | | | | (218,334,666 | ) | | | 42,186,314 | | |
Net realized gain (loss) | | | (286,711,631 | ) | | | 23,187,657 | | | | (260,332,073 | ) | | | 42,186,314 | | |
Change in net unrealized
appreciation on:
Investment securities | | | 29,374,563 | | | | — | | | | 3,489 | | | | — | | |
Swap contracts | | | 30,503,584 | | | | 6,708,766 | | | | 28,866,866 | | | | 10,279,173 | | |
Change in net unrealized appreciation | | | 59,878,147 | | | | 6,708,766 | | | | 28,870,355 | | | | 10,279,173 | | |
Net realized and unrealized gain (loss) | | | (226,833,484 | ) | | | 29,896,423 | | | | (231,461,718 | ) | | | 52,465,487 | | |
Net increase (decrease) in net assets
resulting from operations | | $ | (223,564,947 | ) | | $ | 29,783,176 | | | $ | (229,437,844 | ) | | $ | 52,424,314 | | |
The accompanying notes are an integral part of these financial statements.
DIREXION ANNUAL REPORT
124
Statements of Operations
For the Year Ended October 31, 2022
| | | Direxion Daily
Metal Miners
Bull 2X Shares1 | | Direxion Daily
Oil Services
Bull 2X Shares2 | | Direxion Daily
Robotics,
Artificial
Intelligence &
Automation
Index
Bull 2X Shares | | Direxion Daily
S&P Oil & Gas
Exp. & Prod.
Bull 2X Shares | |
Investment Income: | |
Dividend income
(net of foreign withholding tax of
$—, $28, $— and $—, respectively) | | $ | 137,370 | | | $ | 62,329 | | | $ | 13,723 | | | $ | 11,271,015 | | |
Interest income | | | 34,346 | | | | 28,509 | | | | 80,832 | | | | 3,277,751 | | |
Securities lending income | | | 1,131 | | | | — | | | | 459 | | | | 66,646 | | |
Total investment income | | | 172,847 | | | | 90,838 | | | | 95,014 | | | | 14,615,412 | | |
Expenses: | |
Investment advisory fees (Note 6) | | | 87,620 | | | | 60,828 | | | | 169,641 | | | | 6,318,724 | | |
Licensing fees | | | 13,151 | | | | 4,787 | | | | 13,743 | | | | 673,997 | | |
Professional fees | | | 10,861 | | | | 10,744 | | | | 11,787 | | | | 73,120 | | |
Fund servicing fees | | | 5,356 | | | | 4,069 | | | | 9,252 | | | | 311,025 | | |
Pricing fees | | | 5,261 | | | | 4,686 | | | | 6,000 | | | | 6,001 | | |
Exchange listing fees | | | 4,767 | | | | 4,246 | | | | 5,438 | | | | 5,438 | | |
Offering fees | | | 3,326 | | | | 3,864 | | | | — | | | | — | | |
Management service fees (Note 6) | | | 2,900 | | | | 2,015 | | | | 5,603 | | | | 208,847 | | |
Reports to shareholders | | | 1,977 | | | | 1,384 | | | | 3,475 | | | | 136,573 | | |
Interest expense | | | 1,199 | | | | 1,831 | | | | 1,655 | | | | 2,113,424 | | |
Trustees' fees and expenses | | | 401 | | | | 286 | | | | 674 | | | | 27,415 | | |
Insurance fees | | | 251 | | | | 178 | | | | 483 | | | | 18,175 | | |
Other | | | 1,718 | | | | 1,416 | | | | 911 | | | | 23,908 | | |
Total Expenses | | | 138,788 | | | | 100,334 | | | | 228,662 | | | | 9,916,647 | | |
Recoupment of expenses to
Adviser (Note 6) | | | — | | | | — | | | | 2,370 | | | | 2,261 | | |
Less: Reimbursement of expenses
from Adviser (Note 6) | | | (26,603 | ) | | | (21,454 | ) | | | (14,498 | ) | | | — | | |
Net Expenses | | | 112,185 | | | | 78,880 | | | | 216,534 | | | | 9,918,908 | | |
Net investment income (loss) | | | 60,662 | | | | 11,958 | | | | (121,520 | ) | | | 4,696,504 | | |
Net realized and unrealized gain
(loss) on investments: | |
Net realized gain (loss) on:
Investment securities | | | (1,812,395 | ) | | | (981,700 | ) | | | (1,410,917 | ) | | | (49,355,362 | ) | |
In-kind redemptions | | | 1,505,733 | | | | 1,154,940 | | | | — | | | | 194,293,358 | | |
Swap contracts | | | (3,355,097 | ) | | | (1,297,242 | ) | | | (15,824,052 | ) | | | 529,771,216 | | |
Net realized gain (loss) | | | (3,661,759 | ) | | | (1,124,002 | ) | | | (17,234,969 | ) | | | 674,709,212 | | |
Change in net unrealized appreciation
(depreciation) on:
Investment securities | | | (1,322,001 | ) | | | 1,289,452 | | | | (6,467,266 | ) | | | 18,784,707 | | |
Swap contracts | | | 740,287 | | | | 2,872,748 | | | | (11,002,567 | ) | | | (189,785,156 | ) | |
Change in net unrealized appreciation
(depreciation) | | | (581,714 | ) | | | 4,162,200 | | | | (17,469,833 | ) | | | (171,000,449 | ) | |
Net realized and unrealized gain (loss) | | | (4,243,473 | ) | | | 3,038,198 | | | | (34,704,802 | ) | | | 503,708,763 | | |
Net increase (decrease) in net assets
resulting from operations | | $ | (4,182,811 | ) | | $ | 3,050,156 | | | $ | (34,826,322 | ) | | $ | 508,405,267 | | |
1 Represents the period from December 16, 2021 (commencement of operations) to October 31, 2022.
2 Represents the period from January 20, 2022 (commencement of operations) to October 31, 2022.
The accompanying notes are an integral part of these financial statements.
DIREXION ANNUAL REPORT
125
Statements of Operations
For the Year Ended October 31, 2022
| | | Direxion Daily
S&P Oil & Gas
Exp. & Prod.
Bear 2X Shares | | Direxion Daily
Select Large
Caps & FANGs
Bull 2X Shares | | Direxion Daily
Software
Bull 2X Shares1 | | Direxion
Daily TIPS
Bull 2X Shares2 | |
Investment Income: | |
Dividend income
(net of foreign withholding tax of
$—, $—, $49 and $—, respectively) | | $ | — | | | $ | 12,796 | | | $ | 8,641 | | | $ | 275,030 | | |
Interest income | | | 1,126,130 | | | | 37,204 | | | | 7,586 | | | | 21,530 | | |
Securities lending income | | | — | | | | 16,140 | | | | 65 | | | | 3 | | |
Total investment income | | | 1,126,130 | | | | 66,140 | | | | 16,292 | | | | 296,563 | | |
Expenses: | |
Investment advisory fees (Note 6) | | | 770,163 | | | | 86,401 | | | | 22,953 | | | | 33,455 | | |
Licensing fees | | | 82,151 | | | | 10,001 | | | | 21,917 | | | | 6,155 | | |
Interest expense | | | 59,981 | | | | 1,687 | | | | 227 | | | | 171 | | |
Fund servicing fees | | | 38,862 | | | | 5,314 | | | | 2,125 | | | | 2,689 | | |
Management service fees (Note 6) | | | 25,470 | | | | 2,860 | | | | 759 | | | | 1,110 | | |
Professional fees | | | 17,710 | | | | 10,866 | | | | 10,242 | | | | 10,322 | | |
Reports to shareholders | | | 16,721 | | | | 1,886 | | | | 514 | | | | 780 | | |
Pricing fees | | | 6,001 | | | | 6,001 | | | | 5,261 | | | | 3,420 | | |
Exchange listing fees | | | 5,438 | | | | 5,438 | | | | 4,767 | | | | 3,048 | | |
Trustees' fees and expenses | | | 3,358 | | | | 386 | | | | 102 | | | | 165 | | |
Insurance fees | | | 2,208 | | | | 247 | | | | 64 | | | | 103 | | |
Offering fees | | | — | | | | — | | | | 3,326 | | | | 4,610 | | |
Other | | | 12,331 | | | | 2,313 | | | | 748 | | | | 876 | | |
Total Expenses | | | 1,040,394 | | | | 133,400 | | | | 73,005 | | | | 66,904 | | |
Recoupment of expenses to
Adviser (Note 6) | | | 4,842 | | | | 32 | | | | — | | | | — | | |
Less: Reimbursement of expenses
from Adviser (Note 6) | | | (9,715 | ) | | | (22,305 | ) | | | (43,705 | ) | | | (24,357 | ) | |
Net Expenses | | | 1,035,521 | | | | 111,127 | | | | 29,300 | | | | 42,547 | | |
Net investment income (loss) | | | 90,609 | | | | (44,987 | ) | | | (13,008 | ) | | | 254,016 | �� | |
Net realized and unrealized gain
(loss) on investments: | |
Net realized gain (loss) on:
Investment securities | | | — | | | | (7,455,726 | ) | | | (723,899 | ) | | | (182,000 | ) | |
In-kind redemptions | | | — | | | | 812,141 | | | | 95,515 | | | | — | | |
Swap contracts | | | (111,719,648 | ) | | | (9,101,466 | ) | | | (2,026,421 | ) | | | (596,929 | ) | |
Net realized loss | | | (111,719,648 | ) | | | (15,745,051 | ) | | | (2,654,805 | ) | | | (778,929 | ) | |
Change in net unrealized appreciation
(depreciation) on:
Investment securities | | | — | | | | (575,542 | ) | | | (797,606 | ) | | | (620,380 | ) | |
Swap contracts | | | 15,933,549 | | | | (154,734 | ) | | | (153,196 | ) | | | (412,511 | ) | |
Change in net unrealized appreciation
(depreciation) | | | 15,933,549 | | | | (730,276 | ) | | | (950,802 | ) | | | (1,032,891 | ) | |
Net realized and unrealized loss | | | (95,786,099 | ) | | | (16,475,327 | ) | | | (3,605,607 | ) | | | (1,811,820 | ) | |
Net decrease in net assets resulting
from operations | | $ | (95,695,490 | ) | | $ | (16,520,314 | ) | | $ | (3,618,615 | ) | | $ | (1,557,804 | ) | |
1 Represents the period from December 16, 2021 (commencement of operations) to October 31, 2022.
2 Represents the period from April 7, 2022 (commencement of operations) to October 31, 2022.
The accompanying notes are an integral part of these financial statements.
DIREXION ANNUAL REPORT
126
Statements of Operations
For the Year Ended October 31, 2022
| | | Direxion
Daily TIPS
Bear 2X Shares1 | | Direxion Daily
Travel & Vacation
Bull 2X Shares | | Direxion Daily
US Infrastructure
Bull 2X Shares | |
Investment Income: | |
Dividend income
(net of foreign withholding tax of $—, $— and $6,299,
respectively) | | $ | — | | | $ | 163,450 | | | $ | 92,679 | | |
Interest income | | | 72,880 | | | | 60,027 | | | | 13,956 | | |
Securities lending income | | | — | | | | 523 | | | | 320 | | |
Total investment income | | | 72,880 | | | | 224,000 | | | | 106,955 | | |
Expenses: | |
Investment advisory fees (Note 6) | | | 32,948 | | | | 229,268 | | | | 45,990 | | |
Professional fees | | | 10,320 | | | | 12,267 | | | | 10,466 | | |
Licensing fees | | | 6,155 | | | | 18,342 | | | | 23,999 | | |
Offering fees | | | 4,610 | | | | — | | | | — | | |
Pricing fees | | | 3,420 | | | | 6,001 | | | | 6,001 | | |
Exchange listing fees | | | 3,048 | | | | 5,438 | | | | 5,438 | | |
Fund servicing fees | | | 2,667 | | | | 12,259 | | | | 3,265 | | |
Management service fees (Note 6) | | | 1,094 | | | | 7,583 | | | | 1,521 | | |
Reports to shareholders | | | 768 | | | | 5,031 | | | | 1,003 | | |
Interest expense | | | 353 | | | | 5,256 | | | | 919 | | |
Trustees' fees and expenses | | | 164 | | | | 1,002 | | | | 197 | | |
Insurance fees | | | 102 | | | | 656 | | | | 127 | | |
Other | | | 627 | | | | 4,217 | | | | 202 | | |
Total Expenses | | | 66,276 | | | | 307,320 | | | | 99,128 | | |
Recoupment of expenses to Adviser (Note 6) | | | 430 | | | | 400 | | | | — | | |
Less: Reimbursement of expenses from Adviser (Note 6) | | | (24,619 | ) | | | (12,058 | ) | | | (39,954 | ) | |
Net Expenses | | | 42,087 | | | | 295,662 | | | | 59,174 | | |
Net investment income (loss) | | | 30,793 | | | | (71,662 | ) | | | 47,781 | | |
Net realized and unrealized gain (loss) on investments: | |
Net realized gain (loss) on:
Investment securities | | | — | | | | (6,032,892 | ) | | | (120,461 | ) | |
In-kind redemptions | | | — | | | | 1,177,794 | | | | 237,206 | | |
Swap contracts | | | 1,069,460 | | | | (17,213,986 | ) | | | (237,630 | ) | |
Net realized gain (loss) | | | 1,069,460 | | | | (22,069,084 | ) | | | (120,885 | ) | |
Change in net unrealized appreciation (depreciation) on:
Investment securities | | | — | | | | (4,698,977 | ) | | | (198,407 | ) | |
Swap contracts | | | 325,754 | | | | 1,225,059 | | | | (32,529 | ) | |
Change in net unrealized appreciation (depreciation) | | | 325,754 | | | | (3,473,918 | ) | | | (230,936 | ) | |
Net realized and unrealized gain (loss) | | | 1,395,214 | | | | (25,543,002 | ) | | | (351,821 | ) | |
Net increase (decrease) in net assets resulting from
operations | | $ | 1,426,007 | | | $ | (25,614,664 | ) | | $ | (304,040 | ) | |
1 Represents the period from April 7, 2022 (commencement of operations) to October 31, 2022.
The accompanying notes are an integral part of these financial statements.
DIREXION ANNUAL REPORT
127
Statements of Changes in Net Assets
| | | Direxion Daily CSI 300
China A Share Bear 1X Shares | | Direxion Daily
S&P 500® Bear 1X Shares | |
| | | Year Ended
October 31, 2022 | | Year Ended
October 31, 2021 | | Year Ended
October 31, 2022 | | Year Ended
October 31, 2021 | |
Operations: | |
Net investment income (loss) | | $ | 121,782 | | | $ | (1,257,195 | ) | | $ | 2,699,129 | | | $ | (536,836 | ) | |
Net realized gain (loss) | | | 26,345,810 | | | | (6,236,161 | ) | | | 51,953,665 | | | | (43,191,685 | ) | |
Change in net unrealized appreciation
(depreciation) | | | 13,783,625 | | | | (3,411,971 | ) | | | (27,471,031 | ) | | | (6,973,039 | ) | |
Net increase (decrease) in net assets
resulting from operations | | | 40,251,217 | | | | (10,905,327 | ) | | | 27,181,763 | | | | (50,701,560 | ) | |
Distributions to shareholders: | |
Net distributions to shareholders | | | — | | | | — | | | | (741,705 | ) | | | — | | |
Total distributions | | | — | | | | — | | | | (741,705 | ) | | | — | | |
Capital share transactions: | |
Proceeds from shares sold | | | 20,423,644 | | | | 264,056,763 | | | | 1,154,899,972 | | | | 59,430,595 | | |
Cost of shares redeemed | | | (162,975,123 | ) | | | (216,017,390 | ) | | | (691,207,042 | ) | | | (60,630,303 | ) | |
Transaction fees (Note 4) | | | 50,929 | | | | 59,679 | | | | 143 | | | | — | | |
Net increase (decrease) in net assets
resulting from capital transactions | | | (142,500,550 | ) | | | 48,099,052 | | | | 463,693,073 | | | | (1,199,708 | ) | |
Total increase (decrease) in net assets | | | (102,249,333 | ) | | | 37,193,725 | | | | 490,133,131 | | | | (51,901,268 | ) | |
Net assets: | |
Beginning of year | | | 131,394,496 | | | | 94,200,771 | | | | 123,669,279 | | | | 175,570,547 | | |
End of year | | $ | 29,145,163 | | | $ | 131,394,496 | | | $ | 613,802,410 | | | $ | 123,669,279 | | |
Changes in shares outstanding | |
Shares outstanding, beginning of year | | | 7,850,000 | | | | 4,650,000 | | | | 8,449,983 | | | | 8,249,983 | | |
Shares sold | | | 1,000,000 | | | | 15,600,000 | | | | 71,350,000 | | | | 3,650,000 | | |
Shares repurchased | | | (7,650,000 | ) | | | (12,400,000 | ) | | | (42,600,000 | ) | | | (3,450,000 | ) | |
Shares outstanding, end of year | | | 1,200,000 | | | | 7,850,000 | | | | 37,199,983 | | | | 8,449,983 | | |
The accompanying notes are an integral part of these financial statements.
DIREXION ANNUAL REPORT
128
Statements of Changes in Net Assets
| | | Direxion Daily
AAPL
Bear 1X Shares | | Direxion Daily
AMZN
Bear 1X Shares | |
| | | For the Period
August 9, 20221
through
October 31,
2022 | | For the Period
September 7, 20221
through
October 31,
2022 | |
Operations: | |
Net investment income | | $ | 26,791 | | | $ | 7,957 | | |
Net realized gain (loss) | | | (315,323 | ) | | | 132,589 | | |
Change in net unrealized appreciation | | | 384,927 | | | | 473,443 | | |
Net increase in net assets resulting from operations | | | 96,395 | | | | 613,989 | | |
Distributions to shareholders: | |
Net distributions to shareholders | | | (7,923 | ) | | | (1,055 | ) | |
Total distributions | | | (7,923 | ) | | | (1,055 | ) | |
Capital share transactions: | |
Proceeds from shares sold | | | 14,381,898 | | | | 3,119,793 | | |
Cost of shares redeemed | | | (1,365,767 | ) | | | — | | |
Transaction fees (Note 4) | | | 410 | | | | — | | |
Net increase in net assets resulting from capital transactions | | | 13,016,541 | | | | 3,119,793 | | |
Total increase in net assets | | | 13,105,013 | | | | 3,732,727 | | |
Net assets: | |
Beginning of period | | | — | | | | — | | |
End of period | | $ | 13,105,013 | | | $ | 3,732,727 | | |
Changes in shares outstanding | |
Shares outstanding, beginning of period | | | — | | | | — | | |
Shares sold | | | 550,001 | | | | 125,001 | | |
Shares repurchased | | | (50,000 | ) | | | — | | |
Shares outstanding, end of period | | | 500,001 | | | | 125,001 | | |
1 Commencement of Operations.
The accompanying notes are an integral part of these financial statements.
DIREXION ANNUAL REPORT
129
Statements of Changes in Net Assets
| | | Direxion Daily
GOOGL
Bear 1X Shares | | Direxion Daily
MSFT
Bear 1X Shares | |
| | | For the Period
September 7, 20221
through
October 31,
2022 | | For the Period
September 7, 20221
through
October 31,
2022 | |
Operations: | |
Net investment income | | $ | 7,898 | | | $ | 8,660 | | |
Net realized loss | | | (49,876 | ) | | | (74,486 | ) | |
Change in net unrealized appreciation | | | 362,792 | | | | 255,659 | | |
Net increase in net assets resulting from operations | | | 320,814 | | | | 189,833 | | |
Distributions to shareholders: | |
Net distributions to shareholders | | | (1,002 | ) | | | (1,011 | ) | |
Total distributions | | | (1,002 | ) | | | (1,011 | ) | |
Capital share transactions: | |
Proceeds from shares sold | | | 3,829,950 | | | | 3,817,356 | | |
Cost of shares redeemed | | | — | | | | — | | |
Net increase in net assets resulting from capital transactions | | | 3,829,950 | | | | 3,817,356 | | |
Total increase in net assets | | | 4,149,762 | | | | 4,006,178 | | |
Net assets: | |
Beginning of period | | | — | | | | — | | |
End of period | | $ | 4,149,762 | | | $ | 4,006,178 | | |
Changes in shares outstanding | |
Shares outstanding, beginning of period | | | — | | | | — | | |
Shares sold | | | 150,001 | | | | 150,001 | | |
Shares repurchased | | | — | | | | — | | |
Shares outstanding, end of period | | | 150,001 | | | | 150,001 | | |
1 Commencement of Operations.
The accompanying notes are an integral part of these financial statements.
DIREXION ANNUAL REPORT
130
Statements of Changes in Net Assets
| | | Direxion
Daily TSLA
Bear 1X Shares | | Direxion Daily
AAPL
Bull 1.5X Shares | |
| | | For the Period
August 9, 20221
through
October 31, 2022 | | For the Period
August 9, 20221
through
October 31, 2022 | |
Operations: | |
Net investment income | | $ | 25,940 | | | $ | 15,983 | | |
Net realized gain (loss) | | | 1,099,836 | | | | (754,618 | ) | |
Change in net unrealized appreciation (depreciation) | | | 1,192,009 | | | | (184,797 | ) | |
Net increase (decrease) in net assets resulting from operations | | | 2,317,785 | | | | (923,432 | ) | |
Distributions to shareholders: | |
Net distributions to shareholders | | | (6,449 | ) | | | (3,904 | ) | |
Total distributions | | | (6,449 | ) | | | (3,904 | ) | |
Capital share transactions: | |
Proceeds from shares sold | | | 15,844,577 | | | | 10,607,502 | | |
Cost of shares redeemed | | | (6,086,279 | ) | | | (2,572,989 | ) | |
Transaction fees (Note 4) | | | 1,826 | | | | 665 | | |
Net increase in net assets resulting from capital transactions | | | 9,760,124 | | | | 8,035,178 | | |
Total increase in net assets | | | 12,071,460 | | | | 7,107,842 | | |
Net assets: | |
Beginning of period | | | — | | | | — | | |
End of period | | $ | 12,071,460 | | | $ | 7,107,842 | | |
Changes in shares outstanding | |
Shares outstanding, beginning of period | | | — | | | | — | | |
Shares sold | | | 600,001 | | | | 450,001 | | |
Shares repurchased | | | (200,000 | ) | | | (125,000 | ) | |
Shares outstanding, end of period | | | 400,001 | | | | 325,001 | | |
1 Commencement of Operations.
The accompanying notes are an integral part of these financial statements.
DIREXION ANNUAL REPORT
131
Statements of Changes in Net Assets
| | | Direxion Daily
AMZN
Bull 1.5X Shares | | Direxion Daily
GOOGL
Bull 1.5X Shares | |
| | | For the Period
September 7, 20221
through
October 31, 2022 | | For the Period
September 7, 20221
through
October 31, 2022 | |
Operations: | |
Net investment income | | $ | 6,758 | | | $ | 6,978 | | |
Net realized loss | | | (89,769 | ) | | | (74,204 | ) | |
Change in net unrealized depreciation | | | (970,507 | ) | | | (605,820 | ) | |
Net decrease in net assets resulting from operations | | | (1,053,518 | ) | | | (673,046 | ) | |
Distributions to shareholders: | |
Net distributions to shareholders | | | (726 | ) | | | (759 | ) | |
Total distributions | | | (726 | ) | | | (759 | ) | |
Capital share transactions: | |
Proceeds from shares sold | | | 7,316,587 | | | | 5,267,270 | | |
Cost of shares redeemed | | | — | | | | — | | |
Net increase in net assets resulting from capital transactions | | | 7,316,587 | | | | 5,267,270 | | |
Total increase in net assets | | | 6,262,343 | | | | 4,593,465 | | |
Net assets: | |
Beginning of period | | | — | | | | — | | |
End of period | | $ | 6,262,343 | | | $ | 4,593,465 | | |
Changes in shares outstanding | |
Shares outstanding, beginning of period | | | — | | | | — | | |
Shares sold | | | 350,001 | | | | 225,001 | | |
Shares repurchased | | | — | | | | — | | |
Shares outstanding, end of period | | | 350,001 | | | | 225,001 | | |
1 Commencement of Operations.
The accompanying notes are an integral part of these financial statements.
DIREXION ANNUAL REPORT
132
Statements of Changes in Net Assets
| | | Direxion Daily
MSFT
Bull 1.5X Shares | | Direxion Daily
TSLA
Bull 1.5X Shares | |
| | | For the Period
September 7, 20221
through
October 31, 2022 | | For the Period
August 9, 20221
through
October 31, 2022 | |
Operations: | |
Net investment income | | $ | 5,907 | | | $ | 181,124 | | |
Net realized loss | | | (74,937 | ) | | | (3,243,389 | ) | |
Change in net unrealized depreciation | | | (351,947 | ) | | | (19,964,925 | ) | |
Net decrease in net assets resulting from operations | | | (420,977 | ) | | | (23,027,190 | ) | |
Distributions to shareholders: | |
Net distributions to shareholders | | | (774 | ) | | | (30,807 | ) | |
Total distributions | | | (774 | ) | | | (30,807 | ) | |
Capital share transactions: | |
Proceeds from shares sold | | | 3,652,329 | | | | 134,559,639 | | |
Cost of shares redeemed | | | — | | | | (11,218,388 | ) | |
Transaction fees (Note 4) | | | — | | | | 2,301 | | |
Net increase in net assets resulting from capital transactions | | | 3,652,329 | | | | 123,343,552 | | |
Total increase in net assets | | | 3,230,578 | | | | 100,285,555 | | |
Net assets: | |
Beginning of period | | | — | | | | — | | |
End of period | | $ | 3,230,578 | | | $ | 100,285,555 | | |
Changes in shares outstanding | |
Shares outstanding, beginning of period | | | — | | | | — | | |
Shares sold | | | 150,001 | | | | 6,550,001 | | |
Shares repurchased | | | — | | | | (525,000 | ) | |
Shares outstanding, end of period | | | 150,001 | | | | 6,025,001 | | |
1 Commencement of Operations.
The accompanying notes are an integral part of these financial statements.
DIREXION ANNUAL REPORT
133
Statements of Changes in Net Assets
| | | Direxion Daily CSI 300
China A Share Bull 2X Shares | | Direxion Daily CSI China
Internet Index Bull 2X Shares1 | |
| | | Year Ended
October 31, 2022 | | Year Ended
October 31, 2021 | | Year Ended
October 31, 2022 | | Year Ended
October 31, 2021 | |
Operations: | |
Net investment income (loss) | | $ | 351,792 | | | $ | (573,405 | ) | | $ | (1,363,764 | ) | | $ | (942,350 | ) | |
Net realized gain (loss) | | | (37,806,811 | ) | | | 46,095,087 | | | | (491,823,998 | ) | | | (83,670,156 | ) | |
Capital gain distributions from regulated
investment companies | | | — | | | | — | | | | 12,059,110 | | | | — | | |
Change in net unrealized depreciation | | | (22,294,625 | ) | | | (23,372,749 | ) | | | (68,911,801 | ) | | | (60,639,550 | ) | |
Net increase (decrease) in net assets resulting
from operations | | | (59,749,644 | ) | | | 22,148,933 | | | | (550,040,453 | ) | | | (145,252,056 | ) | |
Distributions to shareholders: | |
Net distributions to shareholders | | | (2,058,066 | ) | | | — | | | | — | | | | — | | |
Total distributions | | | (2,058,066 | ) | | | — | | | | — | | | | — | | |
Capital share transactions: | |
Proceeds from shares sold | | | 15,465,039 | | | | 87,079,703 | | | | 654,966,818 | | | | 442,985,463 | | |
Cost of shares redeemed | | | (32,460,891 | ) | | | (87,706,292 | ) | | | (257,428,128 | ) | | | (39,912,521 | ) | |
Transaction fees (Note 4) | | | 3,948 | | | | 8,771 | | | | 42,053 | | | | 4,773 | | |
Net increase (decrease) in net assets
resulting from capital transactions | | | (16,991,904 | ) | | | (617,818 | ) | | | 397,580,743 | | | | 403,077,715 | | |
Total increase (decrease) in net assets | | | (78,799,614 | ) | | | 21,531,115 | | | | (152,459,710 | ) | | | 257,825,659 | | |
Net assets: | |
Beginning of year | | | 117,918,843 | | | | 96,387,728 | | | | 314,433,336 | | | | 56,607,677 | | |
End of year | | $ | 39,119,229 | | | $ | 117,918,843 | | | $ | 161,973,626 | | | $ | 314,433,336 | | |
Changes in shares outstanding | |
Shares outstanding, beginning of year | | | 3,000,000 | | | | 2,950,000 | | | | 1,620,000 | | | | 105,000 | | |
Shares sold | | | 650,000 | | | | 2,000,000 | | | | 9,980,000 | | | | 1,605,000 | | |
Shares repurchased | | | (1,050,000 | ) | | | (1,950,000 | ) | | | (4,325,913 | ) | | | (90,000 | ) | |
Shares outstanding, end of year | | | 2,600,000 | | | | 3,000,000 | | | | 7,274,087 | | | | 1,620,000 | | |
1 Effective May 31, 2022, the Fund had a 1:10 reverse stock split. Share amounts for all periods have been adjusted to give effect to the 1:10 stock split.
The accompanying notes are an integral part of these financial statements.
DIREXION ANNUAL REPORT
134
Statements of Changes in Net Assets
| | | Direxion Daily
S&P 500® Bull 2X Shares | | Direxion Daily
S&P 500
Equal Weight
Bull 2X Shares | |
| | | Year Ended
October 31, 2022 | | Year Ended
October 31, 2021 | | For the Period
January 20, 20221
through
October 31, 2022 | |
Operations: | |
Net investment income | | $ | 422,645 | | | $ | 256,560 | | | $ | 23,007 | | |
Net realized gain (loss) | | | (12,660,489 | ) | | | 8,161,261 | | | | (912,546 | ) | |
Change in net unrealized appreciation (depreciation) | | | (8,762,638 | ) | | | 10,896,079 | | | | (324,515 | ) | |
Net increase (decrease) in net assets resulting from operations | | | (21,000,482 | ) | | | 19,313,900 | | | | (1,214,054 | ) | |
Distributions to shareholders: | |
Net distributions to shareholders | | | (1,711,768 | ) | | | (1,712,190 | ) | | | (14,050 | ) | |
Total distributions | | | (1,711,768 | ) | | | (1,712,190 | ) | | | (14,050 | ) | |
Capital share transactions: | |
Proceeds from shares sold | | | 19,723,377 | | | | 92,337,294 | | | | 5,000,025 | | |
Cost of shares redeemed | | | (6,521,292 | ) | | | (67,628,708 | ) | | | — | | |
Transaction fees (Note 4) | | | 1,640 | | | | 13,526 | | | | — | | |
Net increase in net assets resulting from capital transactions | | | 13,203,725 | | | | 24,722,112 | | | | 5,000,025 | | |
Total increase (decrease) in net assets | | | (9,508,525 | ) | | | 42,323,822 | | | | 3,771,921 | | |
Net assets: | |
Beginning of year/period | | | 59,647,715 | | | | 17,323,893 | | | | — | | |
End of year/period | | $ | 50,139,190 | | | $ | 59,647,715 | | | $ | 3,771,921 | | |
Changes in shares outstanding | |
Shares outstanding, beginning of year/period | | | 533,236 | | | | 283,236 | | | | — | | |
Shares sold | | | 250,000 | | | | 900,000 | | | | 200,001 | | |
Shares repurchased | | | (100,000 | ) | | | (650,000 | ) | | | — | | |
Shares outstanding, end of year/period | | | 683,236 | | | | 533,236 | | | | 200,001 | | |
1 Commencement of Operations.
The accompanying notes are an integral part of these financial statements.
DIREXION ANNUAL REPORT
135
Statements of Changes in Net Assets
| | | Direxion Daily MSCI
Brazil Bull 2X Shares | | Direxion Daily
MSCI India Bull 2X Shares | |
| | | Year Ended
October 31, 2022 | | Year Ended
October 31, 2021 | | Year Ended
October 31, 2022 | | Year Ended
October 31, 2021 | |
Operations: | |
Net investment income (loss) | | $ | 11,720,064 | | | $ | 1,145,805 | | | $ | 2,013,129 | | | $ | (876,295 | ) | |
Net realized gain | | | 5,491,430 | | | | 102,643,248 | | | | 5,113,869 | | | | 81,179,032 | | |
Change in net unrealized appreciation
(depreciation) | | | 71,184,704 | | | | (60,436,720 | ) | | | (25,073,960 | ) | | | (9,966,185 | ) | |
Net increase (decrease) in net assets
resulting from operations | | | 88,396,198 | | | | 43,352,333 | | | | (17,946,962 | ) | | | 70,336,552 | | |
Distributions to shareholders: | |
Net distributions to shareholders | | | (11,641,388 | ) | | | (1,145,805 | ) | | | (2,174,613 | ) | | | — | | |
Return of capital | | | — | | | | (490,797 | ) | | | — | | | | — | | |
Total distributions | | | (11,641,388 | ) | | | (1,636,602 | ) | | | (2,174,613 | ) | | | — | | |
Capital share transactions: | |
Proceeds from shares sold | | | 123,236,413 | | | | 218,999,576 | | | | 8,635,613 | | | | 157,703,223 | | |
Cost of shares redeemed | | | (246,578,721 | ) | | | (236,123,149 | ) | | | (29,004,628 | ) | | | (219,599,179 | ) | |
Transaction fees (Note 4) | | | 49,316 | | | | 47,224 | | | | 5,801 | | | | 58,878 | | |
Net decrease in net assets resulting
from capital transactions | | | (123,292,992 | ) | | | (17,076,349 | ) | | | (20,363,214 | ) | | | (61,837,078 | ) | |
Total increase (decrease) in net assets | | | (46,538,182 | ) | | | 24,639,382 | | | | (40,484,789 | ) | | | 8,499,474 | | |
Net assets: | |
Beginning of year | | | 185,491,922 | | | | 160,852,540 | | | | 92,845,619 | | | | 84,346,145 | | |
End of year | | $ | 138,953,740 | | | $ | 185,491,922 | | | $ | 52,360,830 | | | $ | 92,845,619 | | |
Changes in shares outstanding | |
Shares outstanding, beginning of year | | | 2,758,631 | | | | 2,608,631 | | | | 1,499,686 | | | | 2,749,686 | | |
Shares sold | | | 1,650,000 | | | | 2,400,000 | | | | 150,000 | | | | 2,600,000 | | |
Shares repurchased | | | (2,800,000 | ) | | | (2,250,000 | ) | | | (550,000 | ) | | | (3,850,000 | ) | |
Shares outstanding, end of year | | | 1,608,631 | | | | 2,758,631 | | | | 1,099,686 | | | | 1,499,686 | | |
The accompanying notes are an integral part of these financial statements.
DIREXION ANNUAL REPORT
136
Statements of Changes in Net Assets
| | | Direxion Daily Cloud
Computing Bull 2X Shares | | Direxion Daily
Electric and
Autonomous
Vehicles
Bull 2X Shares | |
| | | Year Ended
October 31, 2022 | | For the Period
January 8, 20211
through
October 31, 2021 | | For the Period
August 11, 20221
through
October 31, 2022 | |
Operations: | |
Net investment loss | | $ | (65,290 | ) | | $ | (174,933 | ) | | $ | (1,023 | ) | |
Net realized gain (loss) | | | (13,676,597 | ) | | | 2,518,027 | | | | (2,827,026 | ) | |
Change in net unrealized appreciation (depreciation) | | | (7,337,162 | ) | | | 4,672,641 | | | | (1,005,732 | ) | |
Net increase (decrease) in net assets resulting from operations | | | (21,079,049 | ) | | | 7,015,735 | | | | (3,833,781 | ) | |
Distributions to shareholders: | |
Net distributions to shareholders | | | (916,786 | ) | | | — | | | | — | | |
Total distributions | | | (916,786 | ) | | | — | | | | — | | |
Capital share transactions: | |
Proceeds from shares sold | | | 9,649,094 | | | | 30,376,308 | | | | 7,493,147 | | |
Cost of shares redeemed | | | (7,197,093 | ) | | | (10,092,861 | ) | | | (804,121 | ) | |
Transaction fees (Note 4) | | | 1,822 | | | | 1,957 | | | | 161 | | |
Net increase in net assets resulting from capital transactions | | | 2,453,823 | | | | 20,285,404 | | | | 6,689,187 | | |
Total increase (decrease) in net assets | | | (19,542,012 | ) | | | 27,301,139 | | | | 2,855,406 | | |
Net assets: | |
Beginning of year/period | | | 27,301,139 | | | | — | | | | — | | |
End of year/period | | $ | 7,759,127 | | | $ | 27,301,139 | | | $ | 2,855,406 | | |
Changes in shares outstanding | |
Shares outstanding, beginning of year/period | | | 850,001 | | | | — | | | | — | | |
Shares sold | | | 725,000 | | | | 1,200,001 | | | | 350,001 | | |
Shares repurchased | | | (475,000 | ) | | | (350,000 | ) | | | (50,000 | ) | |
Shares outstanding, end of year/period | | | 1,100,001 | | | | 850,001 | | | | 300,001 | | |
1 Commencement of Operations.
The accompanying notes are an integral part of these financial statements.
DIREXION ANNUAL REPORT
137
Statements of Changes in Net Assets
| | | Direxion Daily Energy
Bull 2X Shares | | Direxion Daily Energy
Bear 2X Shares1 | |
| | | Year Ended
October 31, 2022 | | Year Ended
October 31, 2021 | | Year Ended
October 31, 2022 | | Year Ended
October 31, 2021 | |
Operations: | |
Net investment income (loss) | | $ | 15,518,837 | | | $ | 12,969,518 | | | $ | 89,568 | | | $ | (280,063 | ) | |
Net realized gain (loss) | | | 447,620,168 | | | | 308,653,486 | | | | (36,887,314 | ) | | | (38,073,006 | ) | |
Change in net unrealized appreciation
(depreciation) | | | 42,283,430 | | | | 298,039,398 | | | | (2,135,712 | ) | | | (16,329,694 | ) | |
Net increase (decrease) in net assets
resulting from operations | | | 505,422,435 | | | | 619,662,402 | | | | (38,933,458 | ) | | | (54,682,763 | ) | |
Distributions to shareholders: | |
Net distributions to shareholders | | | (15,441,018 | ) | | | (13,092,316 | ) | | | — | | | | — | | |
Total distributions | | | (15,441,018 | ) | | | (13,092,316 | ) | | | — | | | | — | | |
Capital share transactions: | |
Proceeds from shares sold | | | 751,431,269 | | | | 345,538,387 | | | | 174,088,336 | | | | 156,689,364 | | |
Cost of shares redeemed | | | (1,283,479,408 | ) | | | (609,987,702 | ) | | | (134,787,990 | ) | | | (96,555,883 | ) | |
Transaction fees (Note 4) | | | 339,804 | | | | 136,002 | | | | 40,431 | | | | 28,967 | | |
Net increase (decrease) in net assets
resulting from capital transactions | | | (531,708,335 | ) | | | (264,313,313 | ) | | | 39,340,777 | | | | 60,162,448 | | |
Total increase (decrease) in net assets | | | (41,726,918 | ) | | | 342,256,773 | | | | 407,319 | | | | 5,479,685 | | |
Net assets: | |
Beginning of year | | | 599,755,061 | | | | 257,498,288 | | | | 39,105,273 | | | | 33,625,588 | | |
End of year | | $ | 558,028,143 | | | $ | 599,755,061 | | | $ | 39,512,592 | | | $ | 39,105,273 | | |
Changes in shares outstanding | |
Shares outstanding, beginning of year | | | 18,963,531 | | | | 30,463,531 | | | | 355,706 | | | | 45,706 | | |
Shares sold | | | 15,400,000 | | | | 18,350,000 | | | | 3,705,000 | | | | 770,000 | | |
Shares repurchased | | | (26,500,000 | ) | | | (29,850,000 | ) | | | (2,695,442 | ) | | | (460,000 | ) | |
Shares outstanding, end of year | | | 7,863,531 | | | | 18,963,531 | | | | 1,365,264 | | | | 355,706 | | |
1 Effective May 31, 2022, the Fund had a 1:10 reverse stock split. Share amounts for all periods have been adjusted to give effect to the 1:10 stock split.
The accompanying notes are an integral part of these financial statements.
DIREXION ANNUAL REPORT
138
Statements of Changes in Net Assets
| | | Direxion Daily
FinTech
Bull 2X Shares | | Direxion Daily
Global Clean Energy
Bull 2X Shares ETF | |
| | | For the Period
January 20, 20221
through
October 31, 2022 | | Year Ended
October 31, 2022 | | For the Period
July 29, 20211
through
October 31, 2021 | |
Operations: | |
Net investment income (loss) | | $ | 305 | | | $ | 17,429 | | | $ | (13,091 | ) | |
Net realized loss | | | (2,179,051 | ) | | | (4,638,471 | ) | | | (81,426 | ) | |
Change in net unrealized appreciation (depreciation) | | | (809,769 | ) | | | (2,341,235 | ) | | | 1,556,585 | | |
Net increase (decrease) in net assets resulting from operations | | | (2,988,515 | ) | | | (6,962,277 | ) | | | 1,462,068 | | |
Distributions to shareholders: | |
Net distributions to shareholders | | | (6,108 | ) | | | (23,227 | ) | | | — | | |
Return of capital | | | (1,477 | ) | | | (4,294 | ) | | | — | | |
Total distributions | | | (7,585 | ) | | | (27,521 | ) | | | — | | |
Capital share transactions: | |
Proceeds from shares sold | | | 6,128,864 | | | | 10,289,918 | | | | 6,067,048 | | |
Cost of shares redeemed | | | — | | | | (6,406,383 | ) | | | — | | |
Transaction fees (Note 4) | | | — | | | | 1,584 | | | | — | | |
Net increase in net assets resulting from capital transactions | | | 6,128,864 | | | | 3,885,119 | | | | 6,067,048 | | |
Total increase (decrease) in net assets | | | 3,132,764 | | | | (3,104,679 | ) | | | 7,529,116 | | |
Net assets: | |
Beginning of year/period | | | — | | | | 7,529,116 | | | | — | | |
End of year/period | | $ | 3,132,764 | | | $ | 4,424,437 | | | $ | 7,529,116 | | |
Changes in shares outstanding | |
Shares outstanding, beginning of year/period | | | — | | | | 250,001 | | | | — | | |
Shares sold | | | 250,001 | | | | 400,000 | | | | 250,001 | | |
Shares repurchased | | | — | | | | (350,000 | ) | | | — | | |
Shares outstanding, end of year/period | | | 250,001 | | | | 300,001 | | | | 250,001 | | |
1 Commencement of Operations.
The accompanying notes are an integral part of these financial statements.
DIREXION ANNUAL REPORT
139
Statements of Changes in Net Assets
| | | Direxion Daily Gold Miners
Index Bull 2X Shares | | Direxion Daily Gold Miners
Index Bear 2X Shares | |
| | | Year Ended
October 31, 2022 | | Year Ended
October 31, 2021 | | Year Ended
October 31, 2022 | | Year Ended
October 31, 2021 | |
Operations: | |
Net investment income (loss) | | $ | 3,268,537 | | | $ | (4,700,270 | ) | | $ | (113,247 | ) | | $ | (786,586 | ) | |
Net realized gain (loss) | | | (286,711,631 | ) | | | 8,619,940 | | | | 23,187,657 | | | | 8,499,717 | | |
Change in net unrealized appreciation
(depreciation) | | | 59,878,147 | | | | (307,663,100 | ) | | | 6,708,766 | | | | 17,699,304 | | |
Net increase (decrease) in net assets
resulting from operations | | | (223,564,947 | ) | | | (303,743,430 | ) | | | 29,783,176 | | | | 25,412,435 | | |
Distributions to shareholders: | |
Net distributions to shareholders | | | — | | | | — | | | | — | | | | — | | |
Total distributions | | | — | | | | — | | | | — | | | | — | | |
Capital share transactions: | |
Proceeds from shares sold | | | 460,894,417 | | | | 1,270,883,667 | | | | 330,933,462 | | | | 411,796,690 | | |
Cost of shares redeemed | | | (612,430,469 | ) | | | (1,248,537,836 | ) | | | (338,144,875 | ) | | | (474,856,919 | ) | |
Transaction fees (Note 4) | | | 145,063 | | | | 255,404 | | | | 101,443 | | | | 128,613 | | |
Net increase (decrease) in net assets
resulting from capital transactions | | | (151,390,989 | ) | | | 22,601,235 | | | | (7,109,970 | ) | | | (62,931,616 | ) | |
Total increase (decrease) in net assets | | | (374,955,936 | ) | | | (281,142,195 | ) | | | 22,673,206 | | | | (37,519,181 | ) | |
Net assets: | |
Beginning of year | | | 750,864,079 | | | | 1,032,006,274 | | | | 64,076,047 | | | | 101,595,228 | | |
End of year | | $ | 375,908,143 | | | $ | 750,864,079 | | | $ | 86,749,253 | | | $ | 64,076,047 | | |
Changes in shares outstanding | |
Shares outstanding, beginning of year | | | 15,301,908 | | | | 13,451,908 | | | | 3,110,171 | | | | 5,060,171 | | |
Shares sold | | | 12,650,000 | | | | 20,750,000 | | | | 18,450,000 | | | | 21,600,000 | | |
Shares repurchased | | | (12,900,000 | ) | | | (18,900,000 | ) | | | (17,900,000 | ) | | | (23,550,000 | ) | |
Shares outstanding, end of year | | | 15,051,908 | | | | 15,301,908 | | | | 3,660,171 | | | | 3,110,171 | | |
The accompanying notes are an integral part of these financial statements.
DIREXION ANNUAL REPORT
140
Statements of Changes in Net Assets
| | | Direxion Daily Junior
Gold Miners Index Bull 2X Shares | | Direxion Daily Junior
Gold Miners Index Bear 2X Shares | |
| | | Year Ended
October 31, 2022 | | Year Ended
October 31, 2021 | | Year Ended
October 31, 2022 | | Year Ended
October 31, 2021 | |
Operations: | |
Net investment income (loss) | | $ | 2,023,874 | | | $ | (545,141 | ) | | $ | (41,173 | ) | | $ | (660,911 | ) | |
Net realized gain (loss) | | | (260,332,073 | ) | | | (49,436,562 | ) | | | 42,186,314 | | | | 7,764,779 | | |
Change in net unrealized appreciation
(depreciation) | | | 28,870,355 | | | | (221,582,062 | ) | | | 10,279,173 | | | | 16,618,639 | | |
Net increase (decrease) in net assets
resulting from operations | | | (229,437,844 | ) | | | (271,563,765 | ) | | | 52,424,314 | | | | 23,722,507 | | |
Distributions to shareholders: | |
Net distributions to shareholders | | | — | | | | — | | | | — | | | | — | | |
Return of capital | | | — | | | | (2,449,837 | ) | | | — | | | | — | | |
Total distributions | | | — | | | | (2,449,837 | ) | | | — | | | | — | | |
Capital share transactions: | |
Proceeds from shares sold | | | 361,559,015 | | | | 783,062,248 | | | | 319,290,732 | | | | 303,061,049 | | |
Cost of shares redeemed | | | (421,336,708 | ) | | | (666,253,215 | ) | | | (333,869,034 | ) | | | (334,778,915 | ) | |
Transaction fees (Note 4) | | | 91,182 | | | | 134,753 | | | | 100,161 | | | | 100,434 | | |
Net increase (decrease) in net assets
resulting from capital transactions | | | (59,686,511 | ) | | | 116,943,786 | | | | (14,478,141 | ) | | | (31,617,432 | ) | |
Total increase (decrease) in net assets | | | (289,124,355 | ) | | | (157,069,816 | ) | | | 37,946,173 | | | | (7,894,925 | ) | |
Net assets: | |
Beginning of year | | | 515,809,877 | | | | 672,879,693 | | | | 75,674,800 | | | | 83,569,725 | | |
End of year | | $ | 226,685,522 | | | $ | 515,809,877 | | | $ | 113,620,973 | | | $ | 75,674,800 | | |
Changes in shares outstanding | |
Shares outstanding, beginning of year | | | 7,693,351 | | | | 5,743,351 | | | | 6,882,449 | | | | 7,132,449 | | |
Shares sold | | | 8,800,000 | | | | 8,850,000 | | | | 29,150,000 | | | | 30,400,000 | | |
Shares repurchased | | | (7,750,000 | ) | | | (6,900,000 | ) | | | (27,600,000 | ) | | | (30,650,000 | ) | |
Shares outstanding, end of year | | | 8,743,351 | | | | 7,693,351 | | | | 8,432,449 | | | | 6,882,449 | | |
The accompanying notes are an integral part of these financial statements.
DIREXION ANNUAL REPORT
141
Statements of Changes in Net Assets
| | | Direxion Daily
Metal Miners
Bull 2X Shares | | Direxion Daily
Oil Services
Bull 2X Shares | |
| | | For the Period
December 16, 20211
through
October 31, 2022 | | For the Period
January 20, 20221
through
October 31, 2022 | |
Operations: | |
Net investment income | | $ | 60,662 | | | $ | 11,958 | | |
Net realized loss | | | (3,661,759 | ) | | | (1,124,002 | ) | |
Change in net unrealized appreciation (depreciation) | | | (581,714 | ) | | | 4,162,200 | | |
Net increase (decrease) in net assets resulting from operations | | | (4,182,811 | ) | | | 3,050,156 | | |
Distributions to shareholders: | |
Net distributions to shareholders | | | (59,024 | ) | | | (12,713 | ) | |
Return of capital | | | — | | | | (3,245 | ) | |
Total distributions | | | (59,024 | ) | | | (15,958 | ) | |
Capital share transactions: | |
Proceeds from shares sold | | | 25,828,622 | | | | 20,602,114 | | |
Cost of shares redeemed | | | (9,891,789 | ) | | | (7,218,041 | ) | |
Transaction fees (Note 4) | | | 1,978 | | | | 1,444 | | |
Net increase in net assets resulting from capital transactions | | | 15,938,811 | | | | 13,385,517 | | |
Total increase in net assets | | | 11,696,976 | | | | 16,419,715 | | |
Net assets: | |
Beginning of period | | | — | | | | — | | |
End of period | | $ | 11,696,976 | | | $ | 16,419,715 | | |
Changes in shares outstanding | |
Shares outstanding, beginning of period | | | — | | | | — | | |
Shares sold | | | 650,001 | | | | 650,001 | | |
Shares repurchased | | | (250,000 | ) | | | (200,000 | ) | |
Shares outstanding, end of period | | | 400,001 | | | | 450,001 | | |
1 Commencement of Operations.
The accompanying notes are an integral part of these financial statements.
DIREXION ANNUAL REPORT
142
Statements of Changes in Net Assets
| | | Direxion Daily Robotics, Artificial
Intelligence & Automation Index
Bull 2X Shares | | Direxion Daily S&P Oil & Gas
Exp. & Prod. Bull 2X Shares | |
| | | Year Ended
October 31, 2022 | | Year Ended
October 31, 2021 | | Year Ended
October 31, 2022 | | Year Ended
October 31, 2021 | |
Operations: | |
Net investment income (loss) | | $ | (121,520 | ) | | $ | (439,632 | ) | | $ | 4,696,504 | | | $ | (1,837,763 | ) | |
Net realized gain (loss) | | | (17,234,969 | ) | | | 30,972,584 | | | | 674,709,212 | | | | 401,179,799 | | |
Change in net unrealized appreciation
(depreciation) | | | (17,469,833 | ) | | | (3,542,745 | ) | | | (171,000,449 | ) | | | 681,671,431 | | |
Net increase (decrease) in net assets
resulting from operations | | | (34,826,322 | ) | | | 26,990,207 | | | | 508,405,267 | | | | 1,081,013,467 | | |
Distributions to shareholders: | |
Net distributions to shareholders | | | (905,597 | ) | | | (8,502,373 | ) | | | (3,198,438 | ) | | | (875,162 | ) | |
Return of capital | | | — | | | | — | | | | — | | | | (116 | ) | |
Total distributions | | | (905,597 | ) | | | (8,502,373 | ) | | | (3,198,438 | ) | | | (875,278 | ) | |
Capital share transactions: | |
Proceeds from shares sold | | | 771,899 | | | | 61,949,312 | | | | 788,277,104 | | | | 694,180,923 | | |
Cost of shares redeemed | | | — | | | | (78,700,624 | ) | | | (1,384,481,531 | ) | | | (1,225,559,152 | ) | |
Transaction fees (Note 4) | | | — | | | | 21,880 | | | | 325,293 | | | | 280,356 | | |
Net increase (decrease) in net assets
resulting from capital transactions | | | 771,899 | | | | (16,729,432 | ) | | | (595,879,134 | ) | | | (531,097,873 | ) | |
Total increase (decrease) in net assets | | | (34,960,020 | ) | | | 1,758,402 | | | | (90,672,305 | ) | | | 549,040,316 | | |
Net assets: | |
Beginning of year | | | 46,002,981 | | | | 44,244,579 | | | | 891,290,062 | | | | 342,249,746 | | |
End of year | | $ | 11,042,961 | | | $ | 46,002,981 | | | $ | 800,617,757 | | | $ | 891,290,062 | | |
Changes in shares outstanding | |
Shares outstanding, beginning of year | | | 923,646 | | | | 1,323,645 | | | | 8,078,422 | | | | 17,528,422 | | |
Shares sold | | | 50,000 | | | | 1,300,001 | | | | 6,250,000 | | | | 10,250,000 | | |
Shares repurchased | | | — | | | | (1,700,000 | ) | | | (10,000,000 | ) | | | (19,700,000 | ) | |
Shares outstanding, end of year | | | 973,646 | | | | 923,646 | | | | 4,328,422 | | | | 8,078,422 | | |
The accompanying notes are an integral part of these financial statements.
DIREXION ANNUAL REPORT
143
Statements of Changes in Net Assets
| | | Direxion Daily S&P Oil & Gas
Exp. & Prod. Bear 2X Shares2 | | Direxion Daily Select Large Caps &
FANGs Bull 2X Shares | |
| | | Year Ended
October 31, 2022 | | Year Ended
October 31, 2021 | | Year Ended
October 31, 2022 | | For the Period
September 30, 20211
through
October 31, 2021 | |
Operations: | |
Net investment income (loss) | | $ | 90,609 | | | $ | (581,954 | ) | | $ | (44,987 | ) | | $ | (5,174 | ) | |
Net realized gain (loss) | | | (111,719,648 | ) | | | (86,858,681 | ) | | | (15,745,051 | ) | | | 412,332 | | |
Change in net unrealized appreciation
(depreciation) | | | 15,933,549 | | | | (55,088,450 | ) | | | (730,276 | ) | | | 648,393 | | |
Net increase (decrease) in net assets
resulting from operations | | | (95,695,490 | ) | | | (142,529,085 | ) | | | (16,520,314 | ) | | | 1,055,551 | | |
Distributions to shareholders: | |
Net distributions to shareholders | | | — | | | | — | | | | (408,960 | ) | | | — | | |
Return of capital | | | — | | | | (7,191 | ) | | | (4,293 | ) | | | — | | |
Total distributions | | | — | | | | (7,191 | ) | | | (413,253 | ) | | | — | | |
Capital share transactions: | |
Proceeds from shares sold | | | 596,239,590 | | | | 417,762,619 | | | | 30,327,495 | | | | 6,357,007 | | |
Cost of shares redeemed | | | (491,434,316 | ) | | | (220,848,691 | ) | | | (8,168,154 | ) | | | — | | |
Transaction fees (Note 4) | | | 147,419 | | | | 66,255 | | | | 1,778 | | | | — | | |
Net increase in net assets resulting
from capital transactions | | | 104,952,693 | | | | 196,980,183 | | | | 22,161,119 | | | | 6,357,007 | | |
Total increase in net assets | | | 9,257,203 | | | | 54,443,907 | | | | 5,227,552 | | | | 7,412,558 | | |
Net assets: | |
Beginning of year/period | | | 93,489,741 | | | | 39,045,834 | | | | 7,412,558 | | | | — | | |
End of year/period | | $ | 102,746,944 | | | $ | 93,489,741 | | | $ | 12,640,110 | | | $ | 7,412,558 | | |
Changes in shares outstanding | |
Shares outstanding, beginning of
year/period | | | 1,924,620 | | | | 54,620 | | | | 250,001 | | | | — | | |
Shares sold | | | 26,980,000 | | | | 3,780,000 | | | | 3,750,000 | | | | 250,001 | | |
Shares repurchased | | | (20,646,725 | ) | | | (1,910,000 | ) | | | (1,100,000 | ) | | | — | | |
Shares outstanding, end of year/period | | | 8,257,895 | | | | 1,924,620 | | | | 2,900,001 | | | | 250,001 | | |
1 Commencement of Operations.
2 Effective March 28, 2022, the Fund had a 1:10 reverse stock split. Share amounts for all periods have been adjusted to give effect to the 1:10 stock split.
The accompanying notes are an integral part of these financial statements.
DIREXION ANNUAL REPORT
144
Statements of Changes in Net Assets
| | | Direxion Daily
Software
Bull 2X Shares | | Direxion Daily
TIPS
Bull 2X Shares | |
| | | For the Period
December 16, 20211
through
October 31, 2022 | | For the Period
April 7, 20221
through
October 31, 2022 | |
Operations: | |
Net investment income (loss) | | $ | (13,008 | ) | | $ | 254,016 | | |
Net realized loss | | | (2,654,805 | ) | | | (778,929 | ) | |
Change in net unrealized depreciation | | | (950,802 | ) | | | (1,032,891 | ) | |
Net decrease in net assets resulting from operations | | | (3,618,615 | ) | | | (1,557,804 | ) | |
Distributions to shareholders: | |
Net distributions to shareholders | | | — | | | | (259,138 | ) | |
Total distributions | | | — | | | | (259,138 | ) | |
Capital share transactions: | |
Proceeds from shares sold | | | 14,293,161 | | | | 9,797,405 | | |
Cost of shares redeemed | | | (7,327,983 | ) | | | (1,005,287 | ) | |
Transaction fees (Note 4) | | | 13,382 | | | | 302 | | |
Net increase in net assets resulting from capital transactions | | | 6,978,560 | | | | 8,792,420 | | |
Total increase in net assets | | | 3,359,945 | | | | 6,975,478 | | |
Net assets: | |
Beginning of period | | | — | | | | — | | |
End of period | | $ | 3,359,945 | | | $ | 6,975,478 | | |
Changes in shares outstanding | |
Shares outstanding, beginning of period | | | — | | | | — | | |
Shares sold | | | 750,001 | | | | 400,001 | | |
Shares repurchased | | | (400,000 | ) | | | (50,000 | ) | |
Shares outstanding, end of period | | | 350,001 | | | | 350,001 | | |
1 Commencement of Operations.
The accompanying notes are an integral part of these financial statements.
DIREXION ANNUAL REPORT
145
Statements of Changes in Net Assets
| | | Direxion Daily
TIPS
Bear 2X Shares | | Direxion Daily Travel & Vacation
Bull 2X Shares | |
| | | For the Period
April 7, 20221
through
October 31, 2022 | | Year Ended
October 31, 2022 | | For the Period
June 10, 20211
through
October 31, 2021 | |
Operations: | |
Net investment income (loss) | | $ | 30,793 | | | $ | (71,662 | ) | | $ | (14,261 | ) | |
Net realized gain (loss) | | | 1,069,460 | | | | (22,069,084 | ) | | | (808,277 | ) | |
Change in net unrealized appreciation (depreciation) | | | 325,754 | | | | (3,473,918 | ) | | | (490,865 | ) | |
Net increase (decrease) in net assets resulting from operations | | | 1,426,007 | | | | (25,614,664 | ) | | | (1,313,403 | ) | |
Distributions to shareholders: | |
Net distributions to shareholders | | | (16,857 | ) | | | — | | | | — | | |
Total distributions | | | (16,857 | ) | | | — | | | | — | | |
Capital share transactions: | |
Proceeds from shares sold | | | 12,048,110 | | | | 80,233,471 | | | | 14,865,822 | | |
Cost of shares redeemed | | | (4,507,008 | ) | | | (43,250,498 | ) | | | (1,105,845 | ) | |
Transaction fees (Note 4) | | | 1,352 | | | | 9,056 | | | | 221 | | |
Net increase in net assets resulting from capital transactions | | | 7,542,454 | | | | 36,992,029 | | | | 13,760,198 | | |
Total increase in net assets | | | 8,951,604 | | | | 11,377,365 | | | | 12,446,795 | | |
Net assets: | |
Beginning of year/period | | | — | | | | 12,446,795 | | | | — | | |
End of year/period | | $ | 8,951,604 | | | $ | 23,824,160 | | | $ | 12,446,795 | | |
Changes in shares outstanding | |
Shares outstanding, beginning of year/period | | | — | | | | 600,001 | | | | — | | |
Shares sold | | | 450,001 | | | | 4,800,000 | | | | 650,001 | | |
Shares repurchased | | | (150,000 | ) | | | (3,100,000 | ) | | | (50,000 | ) | |
Shares outstanding, end of year/period | | | 300,001 | | | | 2,300,001 | | | | 600,001 | | |
1 Commencement of Operations.
The accompanying notes are an integral part of these financial statements.
DIREXION ANNUAL REPORT
146
Statements of Changes in Net Assets
| | | Direxion Daily US Infrastructure
Bull 2X Shares | |
| | | Year Ended
October 31, 2022 | | For the Period
September 23, 20211
through
October 31, 2021 | |
Operations: | |
Net investment income (loss) | | $ | 47,781 | | | $ | (1,016 | ) | |
Net realized gain (loss) | | | (120,885 | ) | | | 14,285 | | |
Change in net unrealized appreciation (depreciation) | | | (230,936 | ) | | | 524,854 | | |
Net increase (decrease) in net assets resulting from operations | | | (304,040 | ) | | | 538,123 | | |
Distributions to shareholders: | |
Net distributions to shareholders | | | (59,269 | ) | | | — | | |
Total distributions | | | (59,269 | ) | | | — | | |
Capital share transactions: | |
Proceeds from shares sold | | | 4,083,023 | | | | 5,000,025 | | |
Cost of shares redeemed | | | (6,612,817 | ) | | | — | | |
Transaction fees (Note 4) | | | 1,599 | | | | — | | |
Net increase (decrease) in net assets resulting from capital transactions | | | (2,528,195 | ) | | | 5,000,025 | | |
Total increase (decrease) in net assets | | | (2,891,504 | ) | | | 5,538,148 | | |
Net assets: | |
Beginning of year/period | | | 5,538,148 | | | | — | | |
End of year/period | | $ | 2,646,644 | | | $ | 5,538,148 | | |
Changes in shares outstanding | |
Shares outstanding, beginning of year/period | | | 200,001 | | | | — | | |
Shares sold | | | 150,000 | | | | 200,001 | | |
Shares repurchased | | | (250,000 | ) | | | — | | |
Shares outstanding, end of year/period | | | 100,001 | | | | 200,001 | | |
1 Commencement of Operations.
The accompanying notes are an integral part of these financial statements.
DIREXION ANNUAL REPORT
147
Financial Highlights
October 31, 2022
| | | | | RATIOS TO AVERAGE NET ASSETS5 | �� | | |
| | | Net Asset
Value,
Beginning
of Year/
Period | | Net
Investment
Income
(Loss)1 | | Net
Investment
Income
(Loss)1,2 | | Net Realized
and Unrealized
Gain (Loss)
on Investments3 | | Net Increase
(Decrease) in
Net Asset
Value Resulting
from Operations | | Dividends
from Net
Investment
Income | | Distributions
from
Realized
Capital Gains | | Distributions
from
Return
of Capital | | Total
Distributions | | Net
Asset
Value,
End of
Year/
Period | | Total
Return4 | | Net
Assets,
End of
Year/
Period
(000's
omitted) | | Net
Expenses6 | | Total
Expenses | | Net Investment
Income (Loss)
After Expense
Reimbursement | | Net
Expenses2,6 | | Total
Expenses2 | | Net Investment
Income (Loss)
After Expense
Reimbursement2 | | Portfolio
Turnover
Rate7 | |
Direxion Daily CSI 300 China A Share Bear 1X Shares | |
For the Year Ended October 31, 2022 | | $ | 16.74 | | | $ | 0.02 | | | $ | 0.02 | | | $ | 7.53 | | | $ | 7.55 | | | $ | — | | | $ | — | | | $ | — | | | $ | — | | | $ | 24.29 | | | | 45.10 | % | | $ | 29,145 | | | | 0.77 | % | | | 0.77 | % | | | 0.09 | % | | | 0.74 | % | | | 0.74 | % | | | 0.12 | % | | | 0 | % | |
| For the Year Ended October 31, 2021 | | | 20.26 | | | | (0.12 | ) | | | (0.12 | ) | | | (3.40 | ) | | | (3.52 | ) | | | — | | | | — | | | | — | | | | — | | | | 16.74 | | | | -17.37 | % | | | 131,394 | | | | 0.73 | % | | | 0.73 | % | | | (0.70 | )% | | | 0.73 | % | | | 0.73 | % | | | (0.70 | )% | | | 0 | % | |
| For the Year Ended October 31, 2020 | | | 29.45 | | | | (0.03 | ) | | | (0.03 | ) | | | (9.06 | ) | | | (9.09 | ) | | | (0.05 | ) | | | — | | | | (0.05 | ) | | | (0.10 | ) | | | 20.26 | | | | -30.98 | % | | | 94,201 | | | | 0.80 | % | | | 0.80 | % | | | (0.12 | )% | | | 0.80 | % | | | 0.80 | % | | | (0.12 | )% | | | 0 | % | |
| For the Year Ended October 31, 2019 | | | 38.58 | | | | 0.48 | | | | 0.50 | | | | (8.59 | ) | | | (8.11 | ) | | | (1.02 | ) | | | — | | | | — | | | | (1.02 | ) | | | 29.45 | | | | -21.08 | % | | | 20,615 | | | | 0.88 | % | | | 0.87 | % | | | 1.44 | % | | | 0.80 | % | | | 0.79 | % | | | 1.52 | % | | | 0 | % | |
| For the Year Ended October 31, 2018 | | | 32.04 | | | | 0.24 | | | | 0.26 | | | | 6.50 | | | | 6.74 | | | | (0.20 | ) | | | — | | | | — | | | | (0.20 | ) | | | 38.58 | | | | 21.11 | % | | | 115,750 | | | | 0.85 | % | | | 0.81 | % | | | 0.72 | % | | | 0.80 | % | | | 0.76 | % | | | 0.77 | % | | | 0 | % | |
Direxion Daily S&P 500® Bear 1X Shares | |
| For the Year Ended October 31, 2022 | | | 14.64 | | | | 0.13 | | | | 0.14 | | | | 1.76 | | | | 1.89 | | | | (0.03 | ) | | | — | | | | — | | | | (0.03 | ) | | | 16.50 | | | | 12.88 | % | | | 613,802 | | | | 0.49 | % | | | 0.55 | % | | | 0.84 | % | | | 0.45 | % | | | 0.51 | % | | | 0.88 | % | | | 0 | % | |
| For the Year Ended October 31, 2021 | | | 21.28 | | | | (0.07 | ) | | | (0.07 | ) | | | (6.57 | ) | | | (6.64 | ) | | | — | | | | — | | | | — | | | | — | | | | 14.64 | | | | -31.20 | % | | | 123,669 | | | | 0.45 | % | | | 0.51 | % | | | (0.42 | )% | | | 0.45 | % | | | 0.51 | % | | | (0.42 | )% | | | 0 | % | |
| For the Year Ended October 31, 2020 | | | 26.03 | | | | (0.06 | ) | | | (0.05 | ) | | | (4.60 | ) | | | (4.66 | ) | | | (0.05 | ) | | | — | | | | (0.04 | ) | | | (0.09 | ) | | | 21.28 | | | | -17.95 | % | | | 175,571 | | | | 0.45 | % | | | 0.56 | % | | | (0.24 | )% | | | 0.45 | % | | | 0.56 | % | | | (0.24 | )% | | | 0 | % | |
| For the Year Ended October 31, 2019 | | | 29.73 | | | | 0.52 | | | | 0.52 | | | | (3.72 | ) | | | (3.20 | ) | | | (0.50 | ) | | | — | | | | — | | | | (0.50 | ) | | | 26.03 | | | | -10.90 | % | | | 19,525 | | | | 0.45 | % | | | 0.73 | % | | | 1.86 | % | | | 0.45 | % | | | 0.73 | % | | | 1.86 | % | | | 0 | % | |
| For the Year Ended October 31, 2018 | | | 31.91 | | | | 0.30 | | | | 0.30 | | | | (2.14 | ) | | | (1.84 | ) | | | (0.34 | ) | | | — | | | | — | | | | (0.34 | ) | | | 29.73 | | | | -5.74 | % | | | 13,380 | | | | 0.45 | % | | | 0.65 | % | | | 0.99 | % | | | 0.45 | % | | | 0.65 | % | | | 0.99 | % | | | 0 | % | |
Direxion Daily AAPL Bear 1X Shares | |
For the Period August 9, 20228 through
October 31, 2022 | | | 25.00 | | | | 0.09 | | | | 0.09 | | | | 1.15 | | | | 1.24 | | | | (0.03 | ) | | | — | | | | — | | | | (0.03 | ) | | | 26.21 | | | | 4.95 | % | | | 13,105 | | | | 0.98 | % | | | 2.06 | % | | | 1.51 | % | | | 0.95 | % | | | 2.03 | % | | | 1.54 | % | | | 0 | % | |
Direxion Daily AMZN Bear 1X Shares | |
For the Period September 7, 20228 through
October 31, 2022 | | | 25.00 | | | | 0.07 | | | | 0.07 | | | | 4.80 | | | | 4.87 | | | | (0.01 | ) | | | — | | | | — | | | | (0.01 | ) | | | 29.86 | | | | 19.48 | % | | | 3,733 | | | | 0.96 | % | | | 4.96 | % | | | 1.68 | % | | | 0.95 | % | | | 4.95 | % | | | 1.69 | % | | | 0 | % | |
Direxion Daily GOOGL Bear 1X Shares | |
For the Period September 7, 20228 through
October 31, 2022 | | | 25.00 | | | | 0.06 | | | | 0.06 | | | | 2.61 | | | | 2.67 | | | | (0.01 | ) | | | — | | | | — | | | | (0.01 | ) | | | 27.66 | | | | 10.68 | % | | | 4,150 | | | | 0.95 | % | | | 4.89 | % | | | 1.63 | % | | | 0.95 | % | | | 4.89 | % | | | 1.63 | % | | | 0 | % | |
Direxion Daily MSFT Bear 1X Shares | |
For the Period September 7, 20228 through
October 31, 2022 | | | 25.00 | | | | 0.06 | | | | 0.06 | | | | 1.66 | | | | 1.72 | | | | (0.01 | ) | | | — | | | | — | | | | (0.01 | ) | | | 26.71 | | | | 6.88 | % | | | 4,006 | | | | 0.95 | % | | | 4.61 | % | | | 1.67 | % | | | 0.95 | % | | | 4.61 | % | | | 1.67 | % | | | 0 | % | |
Direxion Daily TSLA Bear 1X Shares | |
For the Period August 9, 20228 through
October 31, 2022 | | | 25.00 | | | | 0.10 | | | | 0.10 | | | | 5.10 | | | | 5.20 | | | | (0.02 | ) | | | — | | | | — | | | | (0.02 | ) | | | 30.18 | | | | 20.84 | % | | | 12,071 | | | | 0.96 | % | | | 2.15 | % | | | 1.52 | % | | | 0.95 | % | | | 2.14 | % | | | 1.53 | % | | | 0 | % | |
Direxion Daily AAPL Bull 1.5X Shares | |
For the Period August 9, 20228 through
October 31, 2022 | | | 25.00 | | | | 0.06 | | | | 0.06 | | | | (3.18 | ) | | | (3.12 | ) | | | (0.01 | ) | | | — | | | | — | | | | (0.01 | ) | | | 21.87 | | | | -12.48 | % | | | 7,108 | | | | 0.95 | % | | | 2.40 | % | | | 1.20 | % | | | 0.95 | % | | | 2.40 | % | | | 1.20 | % | | | 9 | % | |
Direxion Daily AMZN Bull 1.5X Shares | |
For the Period September 7, 20228 through
October 31, 2022 | | | 25.00 | | | | 0.05 | | | | 0.05 | | | | (7.15 | ) | | | (7.10 | ) | | | (0.01 | ) | | | — | | | | — | | | | (0.01 | ) | | | 17.89 | | | | -28.42 | % | | | 6,262 | | | | 0.95 | % | | | 5.02 | % | | | 1.43 | % | | | 0.95 | % | | | 5.02 | % | | | 1.43 | % | | | 0 | % | |
Direxion Daily GOOGL Bull 1.5X Shares | |
For the Period September 7, 20228 through
October 31, 2022 | | | 25.00 | | | | 0.05 | | | | 0.05 | | | | (4.62 | ) | | | (4.57 | ) | | | (0.01 | ) | | | — | | | | — | | | | (0.01 | ) | | | 20.42 | | | | -18.30 | % | | | 4,593 | | | | 0.95 | % | | | 5.02 | % | | | 1.48 | % | | | 0.95 | % | | | 5.02 | % | | | 1.48 | % | | | 0 | % | |
Direxion Daily MSFT Bull 1.5X Shares | |
For the Period September 7, 20228 through
October 31, 2022 | | | 25.00 | | | | 0.05 | | | | 0.05 | | | | (3.50 | ) | | | (3.45 | ) | | | (0.01 | ) | | | — | | | | — | | | | (0.01 | ) | | | 21.54 | | | | -13.82 | % | | | 3,231 | | | | 0.95 | % | | | 5.19 | % | | | 1.31 | % | | | 0.95 | % | | | 5.19 | % | | | 1.31 | % | | | 0 | % | |
Direxion Daily TSLA Bull 1.5X Shares | |
For the Period August 9, 20228 through
October 31, 2022 | | | 25.00 | | | | 0.07 | | | | 0.07 | | | | (8.42 | ) | | | (8.35 | ) | | | (0.01 | ) | | | — | | | | — | | | | (0.01 | ) | | | 16.64 | | | | -33.40 | % | | | 100,286 | | | | 0.98 | % | | | 1.15 | % | | | 1.55 | % | | | 0.95 | % | | | 1.12 | % | | | 1.58 | % | | | 33 | % | |
The accompanying notes are an integral part of these financial statements.
DIREXION ANNUAL REPORT
148
Financial Highlights
October 31, 2022
| | | | | RATIOS TO AVERAGE NET ASSETS5 | | | |
| | | Net Asset
Value,
Beginning
of Year/
Period | | Net
Investment
Income
(Loss)1 | | Net
Investment
Income
(Loss)1,2 | | Net Realized
and Unrealized
Gain (Loss)
on Investments3 | | Net Increase
(Decrease) in
Net Asset
Value Resulting
from Operations | | Dividends
from Net
Investment
Income | | Distributions
from
Realized
Capital Gains | | Distributions
from
Return
of Capital | | Total
Distributions | | Net
Asset
Value,
End of
Year/
Period | | Total
Return4 | | Net
Assets,
End of
Year/
Period
(000's
omitted) | | Net
Expenses6 | | Total
Expenses | | Net Investment
Income (Loss)
After Expense
Reimbursement | | Net
Expenses2,6 | | Total
Expenses2 | | Net Investment
Income (Loss)
After Expense
Reimbursement2 | | Portfolio
Turnover
Rate7 | |
Direxion Daily CSI 300 China A Share Bull 2X Shares | |
For the Year Ended October 31, 2022 | | $ | 39.31 | | | $ | 0.13 | | | $ | 0.14 | | | $ | (23.61 | ) | | $ | (23.48 | ) | | $ | (0.09 | ) | | $ | (0.69 | ) | | $ | — | | | $ | (0.78 | ) | | $ | 15.05 | | | | -60.95 | % | | $ | 39,119 | | | | 0.92 | % | | | 0.92 | % | | | 0.46 | % | | | 0.90 | % | | | 0.90 | % | | | 0.48 | % | | | 83 | % | |
| For the Year Ended October 31, 2021 | | | 32.67 | | | | (0.17 | ) | | | (0.17 | ) | | | 6.81 | | | | 6.64 | | | | — | | | | — | | | | — | | | | — | | | | 39.31 | | | | 20.32 | % | | | 117,919 | | | | 0.90 | % | | | 0.89 | % | | | (0.42 | )% | | | 0.89 | % | | | 0.88 | % | | | (0.41 | )% | | | 123 | % | |
| For the Year Ended October 31, 2020 | | | 21.50 | | | | 0.05 | | | | 0.06 | | | | 11.21 | | | | 11.26 | | | | (0.08 | ) | | | — | | | | (0.01 | ) | | | (0.09 | ) | | | 32.67 | | | | 52.60 | % | | | 96,388 | | | | 1.01 | % | | | 1.00 | % | | | 0.19 | % | | | 0.95 | % | | | 0.94 | % | | | 0.25 | % | | | 0 | % | |
| For the Year Ended October 31, 2019 | | | 15.95 | | | | 0.14 | | | | 0.19 | | | | 5.56 | | | | 5.70 | | | | (0.15 | ) | | | — | | | | — | | | | (0.15 | ) | | | 21.50 | | | | 35.87 | % | | | 127,897 | | | | 1.20 | % | | | 1.17 | % | | | 0.69 | % | | | 0.95 | % | | | 0.92 | % | | | 0.94 | % | | | 0 | % | |
| For the Year Ended October 31, 2018 | | | 28.60 | | | | 0.17 | | | | 0.19 | | | | (12.76 | ) | | | (12.59 | ) | | | (0.06 | ) | | | — | | | | — | | | | (0.06 | ) | | | 15.95 | | | | -44.05 | % | | | 76,552 | | | | 1.05 | % | | | 1.03 | % | | | 0.68 | % | | | 0.95 | % | | | 0.93 | % | | | 0.78 | % | | | 339 | % | |
Direxion Daily CSI China Internet Index Bull 2X Shares12 | |
| For the Year Ended October 31, 2022 | | | 194.10 | | | | (0.30 | ) | | | (0.27 | ) | | | (171.53 | ) | | | (171.83 | ) | | | — | | | | — | | | | — | | | | — | | | | 22.27 | | | | -88.53 | % | | | 161,974 | | | | 0.93 | % | | | 0.93 | % | | | (0.42 | )% | | | 0.89 | % | | | 0.89 | % | | | (0.38 | )% | | | 142 | % | |
| For the Year Ended October 31, 2021 | | | 539.10 | | | | (2.20 | ) | | | (2.20 | ) | | | (342.80 | ) | | | (345.00 | ) | | | — | | | | — | | | | — | | | | — | | | | 194.10 | | | | -64.00 | % | | | 314,433 | | | | 0.89 | % | | | 0.88 | % | | | (0.70 | )% | | | 0.89 | % | | | 0.88 | % | | | (0.70 | )% | | | 23 | % | |
| For the Year Ended October 31, 2020 | | | 241.90 | | | | (0.30 | ) | | | (0.10 | ) | | | 298.50 | | | | 298.20 | | | | (0.60 | ) | | | — | | | | (0.40 | ) | | | (1.00 | ) | | | 539.10 | | | | 123.61 | % | | | 56,608 | | | | 1.00 | % | | | 1.01 | % | | | (0.09 | )% | | | 0.95 | % | | | 0.96 | % | | | (0.04 | )% | | | 40 | % | |
| For the Year Ended October 31, 2019 | | | 227.00 | | | | 1.80 | | | | 2.00 | | | | 15.00 | | | | 16.80 | | | | (1.90 | ) | | | — | | | | — | | | | (1.90 | ) | | | 241.90 | | | | 7.53 | % | | | 53,219 | | | | 1.03 | % | | | 1.03 | % | | | 0.74 | % | | | 0.94 | % | | | 0.94 | % | | | 0.83 | % | | | 13 | % | |
| For the Year Ended October 31, 2018 | | | 490.70 | | | | 2.20 | | | | 2.80 | | | | (248.70 | ) | | | (246.50 | ) | | | (2.00 | ) | | | (15.20 | ) | | | — | | | | (17.20 | ) | | | 227.00 | | | | -52.04 | % | | | 49,937 | | | | 1.06 | % | | | 1.03 | % | | | 0.46 | % | | | 0.95 | % | | | 0.92 | % | | | 0.57 | % | | | 189 | % | |
Direxion Daily S&P 500® Bull 2X Shares | |
| For the Year Ended October 31, 2022 | | | 111.86 | | | | 0.75 | | | | 0.76 | | | | (36.02 | ) | | | (35.27 | ) | | | (0.94 | ) | | | (2.27 | ) | | | — | | | | (3.21 | ) | | | 73.38 | | | | -32.51 | % | | | 50,139 | | | | 0.61 | % | | | 0.71 | % | | | 0.82 | % | | | 0.60 | % | | | 0.70 | % | | | 0.83 | % | | | 72 | % | |
| For the Year Ended October 31, 2021 | | | 61.16 | | | | 0.77 | | | | 0.77 | | | | 55.98 | | | | 56.75 | | | | (0.69 | ) | | | (5.36 | ) | | | — | | | | (6.05 | ) | | | 111.86 | | | | 98.25 | % | | | 59,648 | | | | 0.60 | % | | | 0.72 | % | | | 0.85 | % | | | 0.60 | % | | | 0.72 | % | | | 0.85 | % | | | 42 | % | |
| For the Year Ended October 31, 2020 | | | 59.28 | | | | 0.69 | | | | 0.70 | | | | 2.15 | | | | 2.84 | | | | (0.75 | ) | | | (0.21 | ) | | | — | | | | (0.96 | ) | | | 61.16 | | | | 4.75 | % | | | 17,324 | | | | 0.63 | % | | | 0.88 | % | | | 1.20 | % | | | 0.60 | % | | | 0.85 | % | | | 1.23 | % | | | 105 | % | |
| For the Year Ended October 31, 2019 | | | 48.89 | | | | 0.96 | | | | 0.98 | | | | 10.36 | | | | 11.32 | | | | (0.93 | ) | | | — | | | | — | | | | (0.93 | ) | | | 59.28 | | | | 23.64 | % | | | 10,861 | | | | 0.51 | % | | | 0.97 | % | | | 1.85 | % | | | 0.47 | %9 | | | 0.93 | % | | | 1.89 | % | | | 75 | % | |
| For the Year Ended October 31, 2018 | | | 46.22 | | | | 0.89 | | | | 0.98 | | | | 4.02 | | | | 4.91 | | | | (0.87 | ) | | | (1.37 | ) | | | — | | | | (2.24 | ) | | | 48.89 | | | | 10.13 | % | | | 6,514 | | | | 0.18 | % | | | 1.24 | % | | | 1.71 | % | | | 0.00 | %9 | | | 1.06 | % | | | 1.89 | % | | | 59 | % | |
Direxion Daily S&P 500 Equal Weight Bull 2X Shares | |
For the Period January 20, 20228 through
October 31, 2022 | | | 25.00 | | | | 0.12 | | | | 0.12 | | | | (6.19 | ) | | | (6.07 | ) | | | (0.07 | ) | | | — | | | | — | | | | (0.07 | ) | | | 18.86 | | | | -24.27 | % | | | 3,772 | | | | 0.95 | % | | | 1.93 | % | | | 0.70 | % | | | 0.95 | % | | | 1.93 | % | | | 0.70 | % | | | 44 | % | |
Direxion Daily MSCI Brazil Bull 2X Shares | |
| For the Year Ended October 31, 2022 | | | 67.24 | | | | 5.75 | | | | 5.80 | | | | 18.05 | | | | 23.80 | | | | (4.66 | ) | | | — | | | | — | | | | (4.66 | ) | | | 86.38 | | | | 37.79 | % | | | 138,954 | | | | 0.98 | % | | | 0.98 | % | | | 7.16 | % | | | 0.92 | % | | | 0.92 | % | | | 7.22 | % | | | 54 | % | |
| For the Year Ended October 31, 2021 | | | 61.66 | | | | 0.56 | | | | 0.56 | | | | 5.94 | | | | 6.50 | | | | (0.64 | ) | | | — | | | | (0.28 | ) | | | (0.92 | ) | | | 67.24 | | | | 9.83 | % | | | 185,492 | | | | 0.91 | % | | | 0.91 | % | | | 0.55 | % | | | 0.91 | % | | | 0.91 | % | | | 0.55 | % | | | 25 | % | |
| For the Year Ended October 31, 2020 | | | 1116.50 | | | | 1.54 | | | | 1.69 | | | | (1,049.80 | ) | | | (1,048.26 | ) | | | (5.28 | ) | | | — | | | | (1.30 | ) | | | (6.58 | ) | | | 61.66 | | | | -94.40 | % | | | 160,853 | | | | 1.05 | % | | | 1.05 | % | | | 1.01 | % | | | 0.95 | % | | | 0.95 | % | | | 1.11 | % | | | 232 | % | |
| For the Year Ended October 31, 2019 | | | 1029.00 | | | | 10.85 | | | | 15.05 | | | | 88.90 | | | | 99.75 | | | | (12.25 | ) | | | — | | | | — | | | | (12.25 | ) | | | 1116.50 | | | | 9.85 | % | | | 413,185 | | | | 1.35 | % | | | 1.33 | % | | | 1.04 | % | | | 0.95 | % | | | 0.93 | % | | | 1.44 | % | | | 208 | % | |
| For the Year Ended October 31, 2018 | | | 1410.15 | | | | 14.00 | | | | 15.75 | | | | (380.80 | ) | | | (366.80 | ) | | | (13.65 | ) | | | — | | | | (0.70 | ) | | | (14.35 | ) | | | 1029.00 | | | | -25.98 | % | | | 407,268 | | | | 1.15 | % | | | 1.14 | % | | | 1.54 | % | | | 0.95 | % | | | 0.94 | % | | | 1.74 | % | | | 133 | % | |
Direxion Daily MSCI India Bull 2X Shares | |
| For the Year Ended October 31, 2022 | | | 61.91 | | | | 1.54 | | | | 1.56 | | | | (14.44 | ) | | | (12.90 | ) | | | (1.40 | ) | | | — | | | | — | | | | (1.40 | ) | | | 47.61 | | | | -21.15 | % | | | 52,361 | | | | 0.95 | % | | | 0.95 | % | | | 2.89 | % | | | 0.92 | % | | | 0.92 | % | | | 2.92 | % | | | 0 | % | |
| For the Year Ended October 31, 2021 | | | 30.67 | | | | (0.41 | ) | | | (0.40 | ) | | | 31.65 | | | | 31.24 | | | | — | | | | — | | | | — | | | | — | | | | 61.91 | | | | 101.86 | % | | | 92,846 | | | | 0.92 | % | | | 0.91 | % | | | (0.83 | )% | | | 0.91 | % | | | 0.90 | % | | | (0.82 | )% | | | 11 | % | |
| For the Year Ended October 31, 2020 | | | 66.74 | | | | (0.14 | ) | | | (0.13 | ) | | | (35.92 | ) | | | (36.06 | ) | | | (0.01 | ) | | | — | | | | (0.00 | )10 | | | (0.01 | ) | | | 30.67 | | | | -54.04 | % | | | 84,346 | | | | 0.99 | % | | | 0.98 | % | | | (0.46 | )% | | | 0.95 | % | | | 0.94 | % | | | (0.42 | )% | | | 157 | % | |
| For the Year Ended October 31, 2019 | | | 51.51 | | | | 0.60 | | | | 0.67 | | | | 15.20 | | | | 15.80 | | | | (0.57 | ) | | | — | | | | — | | | | (0.57 | ) | | | 66.74 | | | | 30.61 | % | | | 83,398 | | | | 1.05 | % | | | 1.03 | % | | | 0.92 | % | | | 0.95 | % | | | 0.93 | % | | | 1.02 | % | | | 111 | % | |
| For the Year Ended October 31, 2018 | | | 95.50 | | | | 0.09 | | | | 0.14 | | | | (43.76 | ) | | | (43.67 | ) | | | (0.24 | ) | | | — | | | | (0.08 | ) | | | (0.32 | ) | | | 51.51 | | | | -45.89 | % | | | 100,427 | | | | 1.01 | % | | | 0.99 | % | | | 0.11 | % | | | 0.95 | % | | | 0.93 | % | | | 0.17 | % | | | 59 | % | |
Direxion Daily Cloud Computing Bull 2X Shares | |
| For the Year Ended October 31, 2022 | | | 32.12 | | | | (0.07 | ) | | | (0.07 | ) | | | (23.98 | ) | | | (24.05 | ) | | | — | | | | (1.02 | ) | | | — | | | | (1.02 | ) | | | 7.05 | | | | -77.03 | % | | | 7,759 | | | | 0.96 | % | | | 1.24 | % | | | (0.54 | )% | | | 0.95 | % | | | 1.23 | % | | | (0.53 | )% | | | 16 | % | |
For the Period January 8, 20218 through
October 31, 2021 | | | 25.00 | | | | (0.18 | ) | | | (0.17 | ) | | | 7.30 | | | | 7.12 | | | | — | | | | — | | | | — | | | | — | | | | 32.12 | | | | 28.48 | % | | | 27,301 | | | | 0.95 | % | | | 1.03 | % | | | (0.82 | )% | | | 0.95 | % | | | 1.03 | % | | | (0.82 | )% | | | 19 | % | |
Direxion Daily Electric and Autonomous Vehicles Bull 2X Shares | |
For the Period August 11, 20228 through
October 31, 2022 | | | 25.00 | | | | 0.0010 | | | | 0.0010 | | | | (15.48 | ) | | | (15.48 | ) | | | — | | | | — | | | | — | | | | — | | | | 9.52 | | | | -61.92 | % | | | 2,855 | | | | 0.95 | % | | | 4.74 | % | | | (0.11 | )% | | | 0.95 | % | | | 4.74 | % | | | (0.11 | )% | | | 74 | % | |
Direxion Daily Energy Bull 2X Shares | |
| For the Year Ended October 31, 2022 | | | 31.63 | | | | 1.24 | | | | 1.29 | | | | 39.43 | | | | 40.67 | | | | (1.34 | ) | | | — | | | | — | | | | (1.34 | ) | | | 70.96 | | | | 130.82 | % | | | 558,028 | | | | 1.03 | % | | | 1.03 | % | | | 2.62 | % | | | 0.92 | % | | | 0.92 | % | | | 2.73 | % | | | 8 | % | |
| For the Year Ended October 31, 2021 | | | 8.45 | | | | 0.51 | | | | 0.51 | | | | 23.20 | | | | 23.71 | | | | (0.53 | ) | | | — | | | | — | | | | (0.53 | ) | | | 31.63 | | | | 283.45 | % | | | 599,755 | | | | 0.95 | % | | | 0.93 | % | | | 2.31 | % | | | 0.94 | % | | | 0.92 | % | | | 2.32 | % | | | 36 | % | |
| For the Year Ended October 31, 2020 | | | 143.60 | | | | 0.52 | | | | 0.53 | | | | (134.67 | ) | | | (134.15 | ) | | | (1.00 | ) | | | — | | | | — | | | | (1.00 | ) | | | 8.45 | | | | -93.97 | % | | | 257,498 | | | | 0.98 | % | | | 1.00 | % | | | 2.80 | % | | | 0.95 | % | | | 0.97 | % | | | 2.83 | % | | | 72 | % | |
| For the Year Ended October 31, 2019 | | | 253.40 | | | | 3.00 | | | | 3.30 | | | | (110.00 | ) | | | (107.00 | ) | | | (2.80 | ) | | | — | | | | — | | | | (2.80 | ) | | | 143.60 | | | | -42.46 | % | | | 285,099 | | | | 1.10 | % | | | 1.11 | % | | | 1.56 | % | | | 0.95 | % | | | 0.96 | % | | | 1.71 | % | | | 204 | % | |
| For the Year Ended October 31, 2018 | | | 291.60 | | | | 4.20 | | | | 4.60 | | | | (36.40 | ) | | | (32.20 | ) | | | (5.90 | ) | | | — | | | | (0.10 | ) | | | (6.00 | ) | | | 253.40 | | | | -11.59 | % | | | 349,655 | | | | 1.08 | % | | | 1.08 | % | | | 1.24 | % | | | 0.95 | % | | | 0.95 | % | | | 1.37 | % | | | 56 | % | |
The accompanying notes are an integral part of these financial statements.
DIREXION ANNUAL REPORT
149
Financial Highlights
October 31, 2022
| | | | | RATIOS TO AVERAGE NET ASSETS5 | | | |
| | | Net Asset
Value,
Beginning
of Year/
Period | | Net
Investment
Income
(Loss)1 | | Net
Investment
Income
(Loss)1,2 | | Net Realized
and Unrealized
Gain (Loss)
on Investments3 | | Net Increase
(Decrease) in
Net Asset
Value Resulting
from Operations | | Dividends
from Net
Investment
Income | | Distributions
from
Realized
Capital Gains | | Distributions
from
Return
of Capital | | Total
Distributions | | Net
Asset
Value,
End of
Year/
Period | | Total
Return4 | | Net
Assets,
End of
Year/
Period
(000's
omitted) | | Net
Expenses6 | | Total
Expenses | | Net Investment
Income (Loss)
After Expense
Reimbursement | | Net
Expenses2,6 | | Total
Expenses2 | | Net Investment
Income (Loss)
After Expense
Reimbursement2 | | Portfolio
Turnover
Rate7 | |
Direxion Daily Energy Bear 2X Shares12 | |
For the Year Ended October 31, 2022 | | $ | 109.90 | | | $ | 0.11 | | | $ | 0.14 | | | $ | (81.07 | ) | | $ | (80.96 | ) | | $ | — | | | $ | — | | | $ | — | | | $ | — | | | $ | 28.94 | | | | -73.67 | % | | $ | 39,513 | | | | 1.00 | % | | | 1.03 | % | | | 0.22 | % | | | 0.95 | % | | | 0.98 | % | | | 0.27 | % | | | 0 | % | |
| For the Year Ended October 31, 2021 | | | 735.70 | | | | (1.70 | ) | | | (1.70 | ) | | | (624.10 | ) | | | (625.80 | ) | | | — | | | | — | | | | — | | | | — | | | | 109.90 | | | | -85.06 | % | | | 39,105 | | | | 0.95 | % | | | 0.99 | % | | | (0.93 | )% | | | 0.95 | % | | | 0.99 | % | | | (0.93 | )% | | | 0 | % | |
| For the Year Ended October 31, 2020 | | | 506.10 | | | | (1.90 | ) | | | (1.60 | ) | | | 233.80 | | | | 231.90 | | | | (1.50 | ) | | | — | | | | (0.80 | ) | | | (2.30 | ) | | | 735.70 | | | | 45.80 | % | | | 33,626 | | | | 1.00 | % | | | 1.09 | % | | | (0.32 | )% | | | 0.95 | % | | | 1.04 | % | | | (0.27 | )% | | | 0 | % | |
| For the Year Ended October 31, 2019 | | | 448.70 | | | | 5.70 | | | | 6.60 | | | | 58.90 | | | | 64.60 | | | | (7.20 | ) | | | — | | | | — | | | | (7.20 | ) | | | 506.10 | | | | 14.51 | % | | | 25,663 | | | | 1.14 | % | | | 1.22 | % | | | 1.22 | % | | | 0.95 | % | | | 1.03 | % | | | 1.41 | % | | | 0 | % | |
| For the Year Ended October 31, 2018 | | | 558.50 | | | | 2.60 | | | | 2.80 | | | | (110.80 | ) | | | (108.20 | ) | | | (1.60 | ) | | | — | | | | — | | | | (1.60 | ) | | | 448.70 | | | | -19.34 | % | | | 51,915 | | | | 1.00 | % | | | 1.04 | % | | | 0.65 | % | | | 0.95 | % | | | 0.99 | % | | | 0.70 | % | | | 0 | % | |
Direxion Daily FinTech Bull 2X Shares | |
For the Period January 20, 20228 through
October 31, 2022 | | | 25.00 | | | | 0.0010 | | | | 0.0010 | | | | (12.44 | ) | | | (12.44 | ) | | | (0.02 | ) | | | — | | | | (0.01 | ) | | | (0.03 | ) | | | 12.53 | | | | -49.76 | % | | | 3,133 | | | | 0.96 | % | | | 2.35 | % | | | 0.01 | % | | | 0.95 | % | | | 2.34 | % | | | 0.02 | % | | | 81 | % | |
Direxion Daily Global Clean Energy Bull 2X Shares ETF | |
| For the Year Ended October 31, 2022 | | | 30.12 | | | | 0.05 | | | | 0.06 | | | | (15.34 | ) | | | (15.29 | ) | | | (0.07 | ) | | | — | | | | (0.01 | ) | | | (0.08 | ) | | | 14.75 | | | | -50.82 | % | | | 4,424 | | | | 1.00 | % | | | 1.61 | % | | | 0.26 | % | | | 0.95 | % | | | 1.56 | % | | | 0.31 | % | | | 0 | % | |
| For the Period July 29, 20218 through October 31, 2021 | | | 25.00 | | | | (0.06 | ) | | | (0.06 | ) | | | 5.18 | | | | 5.12 | | | | — | | | | — | | | | — | | | | — | | | | 30.12 | | | | 20.48 | % | | | 7,529 | | | | 0.95 | % | | | 2.37 | % | | | (0.95 | )% | | | 0.95 | % | | | 2.37 | % | | | (0.95 | )% | | | 15 | % | |
Direxion Daily Gold Miners Index Bull 2X Shares | |
| For the Year Ended October 31, 2022 | | | 49.07 | | | | 0.25 | | | | 0.26 | | | | (24.35 | ) | | | (24.10 | ) | | | — | | | | — | | | | — | | | | — | | | | 24.97 | | | | -49.11 | % | | | 375,908 | | | | 0.89 | % | | | 0.89 | % | | | 0.56 | % | | | 0.87 | % | | | 0.87 | % | | | 0.58 | % | | | 117 | % | |
| For the Year Ended October 31, 2021 | | | 76.72 | | | | (0.30 | ) | | | (0.30 | ) | | | (27.35 | ) | | | (27.65 | ) | | | — | | | | — | | | | — | | | | — | | | | 49.07 | | | | -36.04 | % | | | 750,864 | | | | 0.86 | % | | | 0.86 | % | | | (0.49 | )% | | | 0.86 | % | | | 0.86 | % | | | (0.49 | )% | | | 71 | % | |
| For the Year Ended October 31, 2020 | | | 158.15 | | | | (0.22 | ) | | | (0.06 | ) | | | (80.50 | ) | | | (80.72 | ) | | | (0.37 | ) | | | — | | | | (0.34 | ) | | | (0.71 | ) | | | 76.72 | | | | -51.26 | % | | | 1,032,006 | | | | 1.07 | % | | | 1.07 | % | | | (0.23 | )% | | | 0.90 | % | | | 0.90 | % | | | (0.06 | )% | | | 333 | % | |
| For the Year Ended October 31, 2019 | | | 66.40 | | | | 0.40 | | | | 0.80 | | | | 91.90 | | | | 92.30 | | | | (0.40 | ) | | | — | | | | (0.15 | ) | | | (0.55 | ) | | | 158.15 | | | | 139.42 | % | | | 1,541,547 | | | | 1.30 | % | | | 1.30 | % | | | 0.37 | % | | | 0.91 | % | | | 0.91 | % | | | 0.76 | % | | | 231 | % | |
| For the Year Ended October 31, 2018 | | | 145.15 | | | | 0.55 | | | | 0.60 | | | | (79.00 | ) | | | (78.45 | ) | | | (0.10 | ) | | | — | | | | (0.20 | ) | | | (0.30 | ) | | | 66.40 | | | | -54.12 | % | | | 1,131,021 | | | | 0.94 | % | | | 0.94 | % | | | 0.50 | % | | | 0.91 | % | | | 0.91 | % | | | 0.53 | % | | | 96 | % | |
Direxion Daily Gold Miners Index Bear 2X Shares | |
| For the Year Ended October 31, 2022 | | | 20.60 | | | | (0.03 | ) | | | 0.01 | | | | 3.13 | | | | 3.10 | | | | — | | | | — | | | | — | | | | — | | | | 23.70 | | | | 15.05 | % | | | 86,749 | | | | 1.10 | % | | | 1.09 | % | | | (0.14 | )% | | | 0.92 | % | | | 0.91 | % | | | 0.04 | % | | | 0 | % | |
| For the Year Ended October 31, 2021 | | | 20.08 | | | | (0.17 | ) | | | (0.17 | ) | | | 0.69 | | | | 0.52 | | | | — | | | | — | | | | — | | | | — | | | | 20.60 | | | | 2.59 | % | | | 64,076 | | | | 0.87 | % | | | 0.88 | % | | | (0.85 | )% | | | 0.87 | % | | | 0.88 | % | | | (0.85 | )% | | | 0 | % | |
| For the Year Ended October 31, 2020 | | | 169.75 | | | | 0.10 | | | | 0.11 | | | | (148.72 | ) | | | (148.62 | ) | | | (0.63 | ) | | | — | | | | (0.42 | ) | | | (1.05 | ) | | | 20.08 | | | | -88.01 | % | | | 101,595 | | | | 0.93 | % | | | 0.93 | % | | | 0.20 | % | | | 0.91 | % | | | 0.91 | % | | | 0.22 | % | | | 0 | % | |
| For the Year Ended October 31, 2019 | | | 875.50 | | | | 4.00 | | | | 4.25 | | | | (706.00 | ) | | | (702.00 | ) | | | (3.75 | ) | | | — | | | | — | | | | (3.75 | ) | | | 169.75 | | | | -80.38 | % | | | 378,674 | | | | 1.01 | % | | | 1.01 | % | | | 1.57 | % | | | 0.92 | % | | | 0.92 | % | | | 1.66 | % | | | 0 | % | |
| For the Year Ended October 31, 2018 | | | 683.50 | | | | 2.75 | | | | 3.75 | | | | 190.75 | | | | 193.50 | | | | (1.50 | ) | | | — | | | | — | | | | (1.50 | ) | | | 875.50 | | | | 28.33 | % | | | 154,753 | | | | 1.04 | % | | | 1.04 | % | | | 0.43 | % | | | 0.91 | % | | | 0.91 | % | | | 0.56 | % | | | 0 | % | |
Direxion Daily Junior Gold Miners Index Bull 2X Shares | |
| For the Year Ended October 31, 2022 | | | 67.05 | | | | 0.28 | | | | 0.28 | | | | (41.40 | ) | | | (41.12 | ) | | | — | | | | — | | | | — | | | | — | | | | 25.93 | | | | -61.33 | % | | | 226,686 | | | | 0.86 | % | | | 0.86 | % | | | 0.55 | % | | | 0.85 | % | | | 0.85 | % | | | 0.56 | % | | | 140 | % | |
| For the Year Ended October 31, 2021 | | | 117.16 | | | | (0.08 | ) | | | (0.07 | ) | | | (49.69 | ) | | | (49.77 | ) | | | — | | | | — | | | | (0.34 | ) | | | (0.34 | ) | | | 67.05 | | | | -42.53 | % | | | 515,810 | | | | 0.85 | % | | | 0.85 | % | | | (0.09 | )% | | | 0.84 | % | | | 0.84 | % | | | (0.08 | )% | | | 67 | % | |
| For the Year Ended October 31, 2020 | | | 695.10 | | | | (0.55 | ) | | | (0.30 | ) | | | (577.27 | ) | | | (577.82 | ) | | | (0.10 | ) | | | — | | | | (0.02 | ) | | | (0.12 | ) | | | 117.16 | | | | -83.11 | % | | | 672,880 | | | | 1.02 | % | | | 1.02 | % | | | (0.32 | )% | | | 0.87 | % | | | 0.87 | % | | | (0.17 | )% | | | 312 | % | |
| For the Year Ended October 31, 2019 | | | 357.50 | | | | 3.20 | | | | 5.10 | | | | 338.50 | | | | 341.70 | | | | (3.70 | ) | | | — | | | | (0.40 | ) | | | (4.10 | ) | | | 695.10 | | | | 95.77 | % | | | 948,731 | | | | 1.26 | % | | | 1.26 | % | | | 0.62 | % | | | 0.89 | % | | | 0.89 | % | | | 0.99 | % | | | 279 | % | |
| For the Year Ended October 31, 2018 | | | 756.50 | | | | 2.00 | | | | 2.50 | | | | (401.00 | ) | | | (399.00 | ) | | | — | | | | — | | | | — | | | | — | | | | 357.50 | | | | -52.74 | % | | | 635,801 | | | | 0.93 | % | | | 0.93 | % | | | 0.35 | % | | | 0.89 | % | | | 0.89 | % | | | 0.39 | % | | | 116 | % | |
Direxion Daily Junior Gold Miners Index Bear 2X Shares | |
| For the Year Ended October 31, 2022 | | | 11.00 | | | | (0.01 | ) | | | 0.02 | | | | 2.48 | | | | 2.47 | | | | — | | | | — | | | | — | | | | — | | | | 13.47 | | | | 22.45 | % | | | 113,621 | | | | 1.08 | % | | | 1.08 | % | | | (0.05 | )% | | | 0.89 | % | | | 0.89 | % | | | 0.14 | % | | | 0 | % | |
| For the Year Ended October 31, 2021 | | | 11.72 | | | | (0.09 | ) | | | (0.09 | ) | | | (0.63 | ) | | | (0.72 | ) | | | — | | | | — | | | | — | | | | — | | | | 11.00 | | | | -6.14 | % | | | 75,675 | | | | 0.87 | % | | | 0.87 | % | | | (0.84 | )% | | | 0.87 | % | | | 0.87 | % | | | (0.84 | )% | | | 0 | % | |
| For the Year Ended October 31, 2020 | | | 335.75 | | | | 0.0010 | | | | 0.01 | | | | (322.21 | ) | | | (322.21 | ) | | | (1.11 | ) | | | — | | | | (0.71 | ) | | | (1.82 | ) | | | 11.72 | | | | -96.42 | % | | | 83,570 | | | | 0.93 | % | | | 0.93 | % | | | 0.01 | % | | | 0.91 | % | | | 0.91 | % | | | 0.03 | % | | | 0 | % | |
| For the Year Ended October 31, 2019 | | | 1892.25 | | | | 8.50 | | | | 9.00 | | | | (1,555.75 | ) | | | (1,547.25 | ) | | | (9.25 | ) | | | — | | | | — | | | | (9.25 | ) | | | 335.75 | | | | -82.03 | % | | | 148,229 | | | | 1.06 | % | | | 1.03 | % | | | 10.44 | % | | | 0.95 | % | | | 0.92 | % | | | 1.55 | % | | | 0 | % | |
| For the Year Ended October 31, 2018 | | | 1612.00 | | | | 7.00 | | | | 8.25 | | | | 278.00 | | | | 285.00 | | | | (4.75 | ) | | | — | | | | — | | | | (4.75 | ) | | | 1892.25 | | | | 17.70 | % | | | 59,624 | | | | 1.03 | % | | | 0.99 | % | | | 0.51 | % | | | 0.95 | % | | | 0.91 | % | | | 0.59 | % | | | 0 | % | |
Direxion Daily Metal Miners Bull 2X Shares | |
For the Period December 16, 20218 through
October 31, 2022 | | | 25.00 | | | | 0.16 | | | | 0.16 | | | | 4.23 | | | | 4.39 | | | | (0.15 | ) | | | — | | | | — | | | | (0.15 | ) | | | 29.24 | | | | 17.60 | % | | | 11,697 | | | | 0.96 | % | | | 1.19 | % | | | 0.52 | % | | | 0.95 | % | | | 1.18 | % | | | 0.53 | % | | | 87 | % | |
Direxion Daily Oil Services Bull 2X Shares | |
For the Period January 20, 20228 through
October 31, 2022 | | | 25.00 | | | | 0.03 | | | | 0.04 | | | | 11.50 | | | | 11.53 | | | | (0.03 | ) | | | — | | | | (0.01 | ) | | | (0.04 | ) | | | 36.49 | | | | 46.21 | % | | | 16,420 | | | | 0.97 | % | | | 1.23 | % | | | 0.15 | % | | | 0.95 | % | | | 1.21 | % | | | 0.17 | % | | | 64 | % | |
The accompanying notes are an integral part of these financial statements.
DIREXION ANNUAL REPORT
150
Financial Highlights
October 31, 2022
| | | | | RATIOS TO AVERAGE NET ASSETS5 | | | |
| | | Net Asset
Value,
Beginning
of Year/
Period | | Net
Investment
Income
(Loss)1 | | Net
Investment
Income
(Loss)1,2 | | Net Realized
and Unrealized
Gain (Loss)
on Investments3 | | Net Increase
(Decrease) in
Net Asset
Value Resulting
from Operations | | Dividends
from Net
Investment
Income | | Distributions
from
Realized
Capital Gains | | Distributions
from
Return
of Capital | | Total
Distributions | | Net
Asset
Value,
End of
Year/
Period | | Total
Return4 | | Net
Assets,
End of
Year/
Period
(000's
omitted) | | Net
Expenses6 | | Total
Expenses | | Net Investment
Income (Loss)
After Expense
Reimbursement | | Net
Expenses2,6 | | Total
Expenses2 | | Net Investment
Income (Loss)
After Expense
Reimbursement2 | | Portfolio
Turnover
Rate7 | |
Direxion Daily Robotics, Artificial Intelligence & Automation Index Bull 2X Shares | |
For the Year Ended October 31, 2022 | | $ | 49.81 | | | $ | (0.13 | ) | | $ | (0.13 | ) | | $ | (37.36 | ) | | $ | (37.49 | ) | | $ | — | | | $ | (0.98 | ) | | $ | — | | | $ | (0.98 | ) | | $ | 11.34 | | | | -76.73 | % | | $ | 11,043 | | | | 0.96 | % | | | 1.01 | % | | | (0.54 | )% | | | 0.95 | % | | | 1.00 | % | | | (0.53 | )% | | | 0 | % | |
| For the Year Ended October 31, 2021 | | | 33.43 | | | | (0.38 | ) | | | (0.38 | ) | | | 23.19 | | | | 22.81 | | | | (2.81 | ) | | | (3.62 | ) | | | — | | | | (6.43 | ) | | | 49.81 | | | | 73.55 | % | | | 46,003 | | | | 0.96 | % | | | 0.95 | % | | | (0.88 | )% | | | 0.95 | % | | | 0.94 | % | | | (0.87 | )% | | | 11 | % | |
| For the Year Ended October 31, 2020 | | | 22.74 | | | | (0.13 | ) | | | (0.12 | ) | | | 10.85 | | | | 10.72 | | | | (0.03 | ) | | | — | | | | — | | | | (0.03 | ) | | | 33.43 | | | | 47.15 | % | | | 44,245 | | | | 1.03 | % | | | 1.10 | % | | | (0.56 | )% | | | 0.95 | % | | | 1.02 | % | | | (0.48 | )% | | | 93 | % | |
| For the Year Ended October 31, 2019 | | | 23.56 | | | | 0.16 | | | | 0.18 | | | | (0.82 | ) | | | (0.66 | ) | | | (0.16 | ) | | | — | | | | — | | | | (0.16 | ) | | | 22.74 | | | | -2.66 | % | | | 20,468 | | | | 1.05 | % | | | 1.19 | % | | | 0.76 | % | | | 0.95 | % | | | 1.09 | % | | | 0.86 | % | | | 184 | % | |
For the Period April 19, 20188 through
October 31, 2018 | | | 50.00 | | | | (0.06 | ) | | | (0.06 | ) | | | (26.38 | ) | | | (26.44 | ) | | | — | | | | — | | | | — | | | | — | | | | 23.56 | | | | -52.88 | % | | | 4,123 | | | | 0.95 | % | | | 2.34 | % | | | (0.27 | )% | | | 0.95 | % | | | 2.34 | % | | | (0.27 | )% | | | 75 | % | |
Direxion Daily S&P Oil & Gas Exp. & Prod. Bull 2X Shares | |
| For the Year Ended October 31, 2022 | | | 110.33 | | | | 0.76 | | | | 1.11 | | | | 74.57 | | | | 75.33 | | | | (0.69 | ) | | | — | | | | — | | | | (0.69 | ) | | | 184.97 | | | | 68.43 | % | | | 800,618 | | | | 1.18 | % | | | 1.18 | % | | | 0.56 | % | | | 0.93 | % | | | 0.93 | % | | | 0.81 | % | | | 55 | % | |
| For the Year Ended October 31, 2021 | | | 19.53 | | | | (0.16 | ) | | | (0.16 | ) | | | 91.03 | | | | 90.87 | | | | (0.07 | ) | | | — | | | | (0.00 | )10 | | | (0.07 | ) | | | 110.33 | | | | 465.94 | % | | | 891,290 | | | | 0.95 | % | | | 0.93 | % | | | (0.25 | )% | | | 0.94 | % | | | 0.92 | % | | | (0.24 | )% | | | 194 | % | |
| For the Year Ended October 31, 2020 | | | 1081.60 | | | | 0.18 | | | | 0.19 | | | | (1,059.32 | ) | | | (1,059.14 | ) | | | (2.93 | ) | | | — | | | | — | | | | (2.93 | ) | | | 19.53 | | | | -98.19 | % | | | 342,250 | | | | 0.97 | % | | | 1.00 | % | | | 0.47 | % | | | 0.95 | % | | | 0.98 | % | | | 0.49 | % | | | 315 | % | |
| For the Year Ended October 31, 2019 | | | 8752.00 | | | | 24.00 | | | | 27.60 | | | | (7,671.20 | ) | | | (7,647.20 | ) | | | (23.20 | ) | | | — | | | | — | | | | (23.20 | ) | | | 1081.60 | | | | -87.55 | % | | | 193,733 | | | | 1.09 | % | | | 1.10 | % | | | 0.95 | % | | | 0.95 | % | | | 0.96 | % | | | 1.09 | % | | | 257 | % | |
| For the Year Ended October 31, 2018 | | | 9772.00 | | | | 24.00 | | | | 36.00 | | | | (1,040.00 | ) | | | (1,016.00 | ) | | | (4.00 | ) | | | — | | | | — | | | | (4.00 | ) | | | 8752.00 | | | | -10.42 | % | | | 156,655 | | | | 1.04 | % | | | 1.05 | % | | | 0.21 | % | | | 0.95 | % | | | 0.96 | % | | | 0.30 | % | | | 119 | % | |
Direxion Daily S&P Oil & Gas Exp. & Prod. Bear 2X Shares11 | |
| For the Year Ended October 31, 2022 | | | 48.60 | | | | 0.02 | | | | 0.03 | | | | (36.18 | ) | | | (36.16 | ) | | | — | | | | — | | | | — | | | | — | | | | 12.44 | | | | -74.40 | % | | | 102,747 | | | | 1.01 | % | | | 1.01 | % | | | 0.09 | % | | | 0.95 | % | | | 0.95 | % | | | 0.15 | % | | | 0 | % | |
| For the Year Ended October 31, 2021 | | | 714.90 | | | | (0.90 | ) | | | (0.90 | ) | | | (665.40 | ) | | | (666.30 | ) | | | (0.00 | )10 | | | — | | | | — | | | | (0.00 | )10 | | | 48.60 | | | | -93.20 | % | | | 93,490 | | | | 0.95 | % | | | 0.95 | % | | | (0.93 | )% | | | 0.95 | % | | | 0.95 | % | | | (0.93 | )% | | | 0 | % | |
| For the Year Ended October 31, 2020 | | | 739.40 | | | | (3.00 | ) | | | (1.40 | ) | | | (21.20 | ) | | | (24.20 | ) | | | (0.30 | ) | | | — | | | | — | | | | (0.30 | ) | | | 714.90 | | | | -3.26 | % | | | 39,046 | | | | 1.18 | % | | | 1.24 | % | | | (0.44 | )% | | | 0.95 | % | | | 1.01 | % | | | (0.21 | )% | | | 0 | % | |
| For the Year Ended October 31, 2019 | | | 362.50 | | | | 4.40 | | | | 6.70 | | | | 379.20 | | | | 383.60 | | | | (6.70 | ) | | | — | | | | — | | | | (6.70 | ) | | | 739.40 | | | | 106.33 | % | | | 36,006 | | | | 1.40 | % | | | 1.46 | % | | | 0.88 | % | | | 0.95 | % | | | 1.01 | % | | | 1.33 | % | | | 0 | % | |
| For the Year Ended October 31, 2018 | | | 685.80 | | | | 2.50 | | | | 2.50 | | | | (324.20 | ) | | | (321.70 | ) | | | (1.60 | ) | | | — | | | | — | | | | (1.60 | ) | | | 362.50 | | | | -46.86 | % | | | 42,465 | | | | 0.99 | % | | | 1.02 | % | | | 0.77 | % | | | 0.95 | % | | | 0.98 | % | | | 0.81 | % | | | 0 | % | |
Direxion Daily Select Large Caps & FANGs Bull 2X Shares | |
| For the Year Ended October 31, 2022 | | | 29.65 | | | | (0.03 | ) | | | (0.03 | ) | | | (24.08 | ) | | | (24.11 | ) | | | — | | | | (1.17 | ) | | | (0.01 | ) | | | (1.18 | ) | | | 4.36 | | | | -84.62 | % | | | 12,640 | | | | 0.96 | % | | | 1.15 | % | | | (0.39 | )% | | | 0.95 | % | | | 1.14 | % | | | (0.38 | )% | | | 170 | % | |
For the Period September 30, 20218 through
October 31, 2021 | | | 25.00 | | | | (0.02 | ) | | | (0.02 | ) | | | 4.67 | | | | 4.65 | | | | — | | | | — | | | | — | | | | — | | | | 29.65 | | | | 18.60 | % | | | 7,413 | | | | 0.95 | % | | | 3.72 | % | | | (0.94 | )% | | | 0.95 | % | | | 3.72 | % | | | (0.94 | )% | | | 20 | % | |
Direxion Daily Software Bull 2X Shares | |
For the Period December 16, 20218 through
October 31, 2022 | | | 25.00 | | | | (0.05 | ) | | | (0.05 | ) | | | (15.35 | ) | | | (15.40 | ) | | | — | | | | — | | | | — | | | | — | | | | 9.60 | | | | -61.60 | % | | | 3,360 | | | | 0.96 | % | | | 2.39 | % | | | (0.43 | )% | | | 0.95 | % | | | 2.38 | % | | | (0.42 | )% | | | 118 | % | |
Direxion Daily TIPS Bull 2X Shares | |
For the Period April 7, 20228 through
October 31, 2022 | | | 25.00 | | | | 0.73 | | | | 0.74 | | | | (5.12 | ) | | | (4.39 | ) | | | (0.68 | ) | | | — | | | | — | | | | (0.68 | ) | | | 19.93 | | | | -17.76 | % | | | 6,975 | | | | 0.95 | % | | | 1.50 | % | | | 5.70 | % | | | 0.95 | % | | | 1.50 | % | | | 5.70 | % | | | 23 | % | |
Direxion Daily TIPS Bear 2X Shares | |
For the Period April 7, 20228 through
October 31, 2022 | | | 25.00 | | | | 0.11 | | | | 0.11 | | | | 4.79 | | | | 4.90 | | | | (0.06 | ) | | | — | | | | �� | | | | (0.06 | ) | | | 29.84 | | | | 19.60 | % | | | 8,952 | | | | 0.96 | % | | | 1.51 | % | | | 0.70 | % | | | 0.95 | % | | | 1.50 | % | | | 0.71 | % | | | 0 | % | |
Direxion Daily Travel & Vacation Bull 2X Shares | |
| For the Year Ended October 31, 2022 | | | 20.74 | | | | (0.03 | ) | | | (0.03 | ) | | | (10.35 | ) | | | (10.38 | ) | | | — | | | | — | | | | — | | | | — | | | | 10.36 | | | | -50.05 | % | | | 23,824 | | | | 0.97 | % | | | 1.01 | % | | | (0.24 | )% | | | 0.95 | % | | | 0.99 | % | | | (0.22 | )% | | | 10 | % | |
| For the Period June 10, 20218 through October 31, 2021 | | | 25.00 | | | | (0.03 | ) | | | (0.03 | ) | | | (4.23 | ) | | | (4.26 | ) | | | — | | | | — | | | | — | | | | — | | | | 20.74 | | | | -17.04 | % | | | 12,447 | | | | 0.95 | % | | | 1.31 | % | | | (0.36 | )% | | | 0.95 | % | | | 1.31 | % | | | (0.36 | )% | | | 26 | % | |
Direxion Daily US Infrastructure Bull 2X Shares | |
| For the Year Ended October 31, 2022 | | | 27.69 | | | | 0.21 | | | | 0.21 | | | | (1.18 | ) | | | (0.97 | ) | | | (0.20 | ) | | | (0.05 | ) | | | — | | | | (0.25 | ) | | | 26.47 | | | | -3.44 | % | | | 2,647 | | | | 0.96 | % | | | 1.61 | % | | | 0.78 | % | | | 0.95 | % | | | 1.60 | % | | | 0.79 | % | | | 86 | % | |
For the Period September 23, 20218 through
October 31, 2021 | | | 25.00 | | | | (0.01 | ) | | | (0.01 | ) | | | 2.70 | | | | 2.69 | | | | — | | | | — | | | | — | | | | — | | | | 27.69 | | | | 10.76 | % | | | 5,538 | | | | 0.95 | % | | | 3.47 | % | | | (0.18 | )% | | | 0.95 | % | | | 3.47 | % | | | (0.18 | )% | | | 0 | % | |
1 Net investment income (loss) per share represents net investment income divided by the daily average shares of beneficial interest outstanding throughout each period.
2 Excludes interest expense and extraordinary expenses which comprise of tax and litigation expenses.
3 Due to the timing of sales and redemptions of capital shares, the net realized and unrealized gain (loss) per share will not equal the Fund's changes in net realized and unrealized gain (loss) on investments, in-kind redemptions, futures and swaps for the period.
4 Total return is calculated assuming an initial investment made at the net asset value at the beginning of the period, reinvestment of all dividends and distributions at net asset value during the period and redemption on the last day of the period. Total return calculated for a period of less than one year is not annualized. The total return would have been lower if certain expenses had not been reimbursed/waived or recouped by the investment advisor.
The accompanying notes are an integral part of these financial statements.
DIREXION ANNUAL REPORT
151
Financial Highlights
October 31, 2022
5 For periods less than a year, these ratios are annualized.
6 Net expenses include effects of any reimbursement/waiver or recoupment.
7 Portfolio turnover rate is not annualized and excludes the value of portfolio securities received or delivered as a result of in-kind creations or redemptions of the Fund's capital shares. Portfolio turnover rate does not include effects of turnover of the swap and future contracts portfolio. Short-term securities with maturities less than or equal to 365 days are also excluded from portfolio turnover calculation.
8 Commencement of operations.
9 This ratio includes the voluntary waiver of expenses by the Adviser. Excluding the voluntary waiver, the net expense ratio would have been 0.60%.
10 Between $(0.005) and $0.005.
11 Effective March 28, 2022, the Fund had a 1:10 reverse stock split. Share amounts for all periods have been adjusted to give effect to the 1:10 stock split.
12 Effective May 31, 2022, the Fund had a 1:10 reverse stock split. Share amounts for all periods have been adjusted to give effect to the 1:10 stock split.
The accompanying notes are an integral part of these financial statements.
DIREXION ANNUAL REPORT
152
Direxion Shares ETF Trust
Notes to the Financial Statements
October 31, 2022
1. ORGANIZATION
The Direxion Shares ETF Trust (the "Trust") is a Delaware statutory trust formed on April 23, 2008, and is registered with the Securities and Exchange Commission ("SEC") as an open-end management investment company under the Investment Company Act of 1940, as amended (the "1940 Act"). The Trust is a registered investment company that has 87 separate series (each, a "Fund" and together the "Funds"). 39 of these Funds are included in this report:
Bull Funds | | Bear Funds | |
Direxion Daily AAPL Bull 1.5X Shares | | Direxion Daily CSI 300 China A Share Bear 1X Shares | |
Direxion Daily AMZN Bull .5X Shares | | Direxion Daily S&P 500® Bear 1X Shares | |
Direxion Daily GOOGL Bull 1.5X Shares | | Direxion Daily AAPL Bear 1X Shares | |
Direxion Daily MSFT Bull 1.5X Shares | | Direxion Daily AMZN Bear 1X Shares | |
Direxion Daily TSLA Bull 1.5X Shares | | Direxion Daily GOOGL Bear 1X Shares | |
Direxion Daily CSI 300 China A Share Bull 2X Shares | | Direxion Daily MSFT Bear 1X Shares | |
Direxion Daily CSI China Internet Index Bull 2X Shares | | Direxion Daily TSLA Bear 1X Shares | |
Direxion Daily S&P 500® Bull 2X Shares | | Direxion Daily Energy Bear 2X Shares | |
Direxion Daily S&P 500® Equal Weight Bull 2X Shares | | Direxion Daily Gold Miners Index Bear 2X Shares | |
Direxion Daily MSCI Brazil Bull 2X Shares | | Direxion Daily Junior Gold Miners Index Bear 2X Shares | |
Direxion Daily MSCI India Bull 2X Shares | | Direxion Daily S&P Oil & Gas Exp. & Prod. Bear 2X Shares | |
Direxion Daily Cloud Computing Bull 2X Shares | | Direxion Daily TIPS Bear 2X Shares | |
Direxion Daily Electric and Autonomous Vehicles Bull 2X Shares | | | | | |
Direxion Daily Energy Bull 2X Shares | | | | | |
Direxion Daily FinTech Bull 2X Shares | | | | | |
Direxion Daily Global Clean Energy Bull 2X Shares | | | | | |
Direxion Daily Gold Miners Index Bull 2X Shares | | | | | |
Direxion Daily Junior Gold Miners Index Bull 2X Shares | | | | | |
Direxion Daily Metal Miners Bull 2X Shares | | | | | |
Direxion Daily Oil Services Bull 2X Shares | | | | | |
Direxion Daily Robotics, Artificial Intelligence & Automation | | | | | |
Index Bull 2X Shares | | | | | |
Direxion Daily S&P Oil & Gas Exp. & Prod. Bull 2X Shares | | | | | |
Direxion Daily Select Large Caps & FANGs Bull 2X Shares | | | | | |
Direxion Daily Software Bull 2X Shares | | | | | |
Direxion Daily TIPS Bull 2X Shares | | | | | |
Direxion Daily Travel & Vacation Bull 2X Shares | | | | | |
Direxion Daily US Infrastructure Bull 2X Shares | | | | | |
The Trust has evaluated the structure, objective and activities of the Funds and determined that they meet the characteristics of an investment company. As such, these financial statements have applied the guidance as set forth in the Accounting Standards Codifications ("ASC") 946, Financial Services-Investment Companies.
Rafferty Asset Management, LLC (the "Adviser") has registered as a commodity pool operator ("CPO"). All Funds presented in this report are considered commodity pools under the Commodity Exchange Act (the "CEA). Accordingly, the Adviser is subject to registration and regulation as a CPO under the CEA and must comply with various regulatory requirements under the CEA and the rules and regulations of the Commodity Futures Trading Commission and the National Futures Association, including investor protection requirements, antifraud provisions, disclosure requirements and reporting and recordkeeping requirements.
Each Fund's investment objective is to seek daily investment results, before fees and expenses, that correspond to the performance of a particular index or benchmark. The Funds with the word "Bull" in their name attempt to provide investment results that correlate positively to the return of an index or benchmark. The Funds with the word "Bear" in their name attempt to provide investment results that correlate negatively to the return of an index or benchmark. The correlations sought by the Bull Funds are a multiple of 150% or 200% of the return of the target index or benchmark and a multiple of -100% or -200% of the return of the target index or benchmark for the Bear Funds.
DIREXION ANNUAL REPORT
153
Funds | | Index or Benchmark | | Daily Target | |
Direxion Daily CSI 300 China A Share Bear 1X Shares | | CSI 300 Index | | | -100 | % | |
Direxion Daily S&P 500® Bear 1X Shares | | S&P 500® Index | | | -100 | % | |
Direxion Daily AAPL Bear 1X Shares | | Common shares of Apple, Inc. | | | -100 | % | |
Direxion Daily AMZN Bear 1X Shares | | Common shares of Amazon, Inc. | | | -100 | % | |
Direxion Daily GOOGL Bear 1X Shares | | Common shares of Alphabet, Inc. Class A | | | -100 | % | |
Direxion Daily MSFT Bear 1X Shares | | Common shares of Microsoft Corp. | | | -100 | % | |
Direxion Daily TSLA Bear 1X Shares | | Common shares of Tesla, Inc. | | | -100 | % | |
Direxion Daily AAPL Bull 1.5X Shares | | Common shares of Apple, Inc. | | | 150 | % | |
Direxion Daily AMZN Bull 1.5X Shares | | Common shares of Amazon, Inc. | | | 150 | % | |
Direxion Daily GOOGL Bull 1.5X Shares | | Common shares of Alphabet, Inc. | | | 150 | % | |
Direxion Daily MSFT Bull 1.5X Shares | | Common shares of Microsoft Corp. | | | 150 | % | |
Direxion Daily TSLA Bull 1.5X Shares | | Common shares of Tesla, Inc. | | | 150 | % | |
Direxion Daily CSI 300 China A Share Bull 2X Shares | | CSI 300 Index | | | 200 | % | |
Direxion Daily CSI China Internet Index Bull 2X Shares | | CSI Overseas China Internet Index | | | 200 | % | |
Direxion Daily S&P 500® Bull 2X Shares | | S&P 500® Index | | | 200 | % | |
Direxion Daily S&P 500® Equal Weight Bull 2X Shares | | S&P 500® Equal Weight Index | | | 200 | % | |
Direxion Daily MSCI Brazil Bull 2X Shares | | MSCI Brazil 25/50 Index | | | 200 | % | |
Direxion Daily MSCI India Bull 2X Shares | | MSCI India Index | | | 200 | % | |
Direxion Daily Cloud Computing Bull 2X Shares | | Indxx USA Cloud Computing Index | | | 200 | % | |
Direxion Daily Electric and Autonomous Vehicles Bull
2X Shares | | Indxx US Electric and Autonomous Vehicles Index | | | 200 | % | |
Direxion Daily Energy Bull 2X Shares | | | | | | | 200 | % | |
Direxion Daily Energy Bear 2X Shares | | Energy Select Sector Index | | | -200 | % | |
Direxion Daily FinTech Bull 2X Shares | | Indxx US Fintech and Decentralized Finance Index | | | 200 | % | �� |
Direxion Global Clean Energy Bull 2X Shares | | S&P Global Clean Energy Index | | | 200 | % | |
Direxion Daily Gold Miners Index Bull 2X Shares | | | | | | | 200 | % | |
Direxion Daily Gold Miners Index Bear 2X Shares | | NYSE Arca Gold Miners Index | | | -200 | % | |
Direxion Daily Junior Gold Miners Index Bull 2X Shares | | | | | | | 200 | % | |
Direxion Daily Junior Gold Miners Index Bear 2X Shares | | MVIS Global Junior Gold Miners Index | | | -200 | % | |
Direxion Daily Metal Miners Bull 2X Shares | | S&P Metals & Mining Select Industry Index | | | 200 | % | |
Direxion Daily Oil Services Bull 2X Shares | | MVIS US Listed Oil Services 25 Index | | | 200 | % | |
Direxion Daily Robotics, Artificial Intelligence & | | Indxx Global Robotics and Artificial | | | |
Automation Index Bull 2X Shares | | Intelligence Thematic Index | | | 200 | % | |
Direxion Daily S&P Oil & Gas Exp. & Prod. Bull 2X Shares | | | | | | | 200 | % | |
Direxion Daily S&P Oil & Gas Exp. & Prod. Bear 2X Shares | | S&P Oil & Gas Exploration & Production
Select Industry Index | | | -200 | % | |
Direxion Daily Select Large Caps & FANGs Bull 2X Shares | | ICE FANG 20 Index | | | 200 | % | |
Direxion Daily Software Bull 2X Shares | | S&P North American Expanded Technology
Software Index | | | 200 | % | |
Direxion Daily TIPS Bull 2X Shares | | | | | | | 200 | % | |
Direxion Daily TIPS Bear 2X Shares | | Solactive TIPS ETF Index | | | -200 | % | |
Direxion Daily Travel & Vacation Bull 2X Shares | | BlueStar® Travel and Vacation Index | | | 200 | % | |
Direxion Daily US Infrastructure Bull 2X Shares | | Indxx US Infrastructure Index | | | 200 | % | |
DIREXION ANNUAL REPORT
154
2. SIGNIFICANT ACCOUNTING POLICIES
The following is a summary of significant accounting policies consistently followed by the Funds in the preparation of their financial statements. These policies are in conformity with U.S. generally accepted accounting principles ("GAAP").
a) Investment Valuation – The Net Asset Value ("NAV") per share of each Fund is determined daily, as of the close of regular trading on the New York Stock Exchange ("NYSE") (normally at 4:00 p.m. Eastern time ("Valuation Time")), each day the NYSE is open for business. A security listed or traded on an exchange, domestic or foreign, is valued at its last sales price on the principal exchange on which it is traded prior to the time when assets are valued. If no sale is reported at that time, the mean of the last bid and asked prices is used. Securities primarily traded on the NASDAQ® Global Market ("NASDAQ") for which market quotations are readily available are valued using the NASDAQ® Official Closing Price ("NOCP") provided by NASDAQ each business day. Over-the-counter ("OTC") securities held by a Fund are valued at the last sales price or, if no sales price is reported, the mean of the last bid and asked price is used. The portfolio securities of a Fund that are listed on national exchanges are valued at the last sales price of such securities or; if no sales price is reported, the mean of the last bid and asked price is used. Swap contracts are valued using the closing price of the underlying reference entity or the closing value of the underlying reference index. The Funds valued their investments in money market funds based on their daily net asset values. Futures contracts are valued at the settlement price established on the exchange on which they are traded, if that settlement price reflects trading prior to the Valuation Time. If the settlement price established by the exchange reflects trading after the Valuation Time, then the last sales price prior to Valuation Time will be used. Securities, swap or futures contracts are fair valued as determined by the Adviser under the supervision of the Board of Trustees (the "Board") in the following scenarios: a) reliable market quotations are not readily available; b) the Fund's pricing service does not provide a valuation for such securities; c) the Fund's pricing service provides a valuation that in the judgment of the Adviser does not represent fair value; or d) the Fund or Adviser believes the market price is stale.
b) Swap Contracts – Each Fund may enter into equity swap contacts. Standard equity swap contracts are between two parties that agree to exchange the returns (or differentials in rates of return) earned or realized on particular predetermined investments or instruments. The gross amount to be exchanged is calculated with respect to a "notional amount" (i.e. the return on or increase in value of a particular dollar amount invested in a "basket" of securities representing a particular index or industry sector). Each Fund enters into master netting agreements with counterparties to mitigate counterparty credit risk in derivative contracts. A Fund does not offset fair value amounts for derivative contracts and related cash collateral on the Statements of Assets and Liabilities arising from derivative contracts executed with the same counterparties under such master netting agreements. Each Fund's obligations are accrued daily and offset by any amounts owed to the Fund.
In a "long" equity swap agreement, the counterparty will generally agree to pay the Fund the amount, if any, by which the notional amount of the swap contract would have increased in value if the Fund had been invested in the particular securities, plus dividends that would have been received on those securities. The Fund will agree to pay the counterparty a floating rate of interest on the notional amount of the swap contract plus the amount, if any, by which the notional amount would have decreased in value had it been invested in such securities plus, in certain instances, commissions or trading spreads on the notional amounts. Thus, the return on the swap contract should be the gain or loss on the notional amount plus dividends on the securities less the interest and commission paid by the Fund on the notional amount. Payments may be made at the conclusion of the contract or periodically during its term. In certain instances, market factors such as the interest rate environment and the demand to borrow the securities underlying the swap agreement can cause a scenario in which the counterparty will pay the Fund interest. These swap contracts do not include the delivery of securities by the Funds to the counterparty. The net amount of the excess, if any, of the Fund's obligations owed over its entitlement with respect to each swap is accrued on a daily basis and an amount of cash or liquid assets having an aggregate net asset value at least equal to such accrued excess is maintained in a segregated account by the Funds' custodian. Until a swap contract is settled in cash, the gain or loss on the notional amount plus dividends on the securities less the interest paid by the Fund on the notional amount are recorded as "unrealized appreciation or depreciation on swaps" and when cash is exchanged, the gain or loss is recorded as "realized gains or losses on swaps".
Each Fund may enter into swap contracts that provide the opposite return of the underlying benchmark or security ("short" the index or security). The operations are similar to that of the swaps disclosed above except that the counterparty pays interest to the Fund on the notional amount outstanding and the dividends on the underlying securities reduce the return of the swap. However, in certain instances, market factors such as the interest rate environment and the demand to borrow the securities underlying the swap agreement can cause a scenario in which the Fund will pay the counterparty interest.
DIREXION ANNUAL REPORT
155
These amounts are netted with any unrealized appreciation or depreciation to determine the value of the swap. The Funds will typically enter into equity swap agreements to obtain leverage in order to meet their investment objectives.
Accounting Standards Update No. 2013-01, "Disclosures about Offsetting Assets and Liabilities" ("ASU 2013-01"), requires entities to disclose (i) gross and net information about both instruments and transactions eligible for offset in the financial statements, and (ii) instruments and transactions subject to an agreement similar to a master netting agreement. ASU 2013-01 is limited in scope recognize derivative instruments accounted for under ASC 815, Derivatives and Hedging, to the extent they are offset in the financial statements or subject to an enforceable master netting arrangement of similar agreement.
In order to better define its contractual rights and to secure rights that will help a Fund mitigate its counterparty risk, a Fund may enter into an International Swaps and Derivatives Association, Inc. Master Agreement ("ISDA Master Agreement") or similar agreement with its counterparties. An ISDA Master Agreement is a bilateral agreement between a Fund and a counterparty that governs OTC derivatives, including swap contracts, and typically contains, among other things, collateral posting terms, netting and rights of set-off provisions in the event of a default and/or termination event. Under an ISDA Master Agreement, a Fund may, under certain circumstances, offset with the counterparty certain derivative financial instruments' payables and receivables to create a single net payment. The provisions of the ISDA Master Agreement typically permit a single net payment in the event of a default (close-out netting) or similar event, including the bankruptcy or insolvency of the counterparty.
Collateral requirements generally differ by type of derivative. Collateral terms are contract specific for OTC derivatives (e.g. swaps). Generally, for transactions traded under an ISDA Master Agreement, the collateral requirements are calculated by netting the marked-to-market amount for each transaction under such agreement and comparing that amount to the value of any collateral currently pledged by a Fund and the counterparty. Generally, the amount of collateral due from or to the counterparty must exceed a minimum transfer amount threshold before a transfer is required to be made. To the extent amounts due to a Fund from its derivative counterparties are not fully collateralized, contractually or otherwise, the Fund bears the risk of loss from counterparty non-performance. Interest earned on collateral pledged to a counterparty is presented as part of Interest income on the Statements of Operations. Interest incurred on collateral received from a counterparty is presented as Interest expense on the Statements of Operations.
For financial reporting purposes, the Funds elect to not offset assets and liabilities subject to an ISDA Master Agreement, if any, in the Statements of Assets and Liabilities. Therefore, all qualifying transactions are presented on a gross basis in the Statements of Assets and Liabilities. As of October 31, 2022, the impact of netting of assets and liabilities and the offsetting of collateral pledged or received based on contractual netting/set-off provisions in the ISDA Master Agreement are detailed in the following tables.
In the event of the counterparty's default, bankruptcy or any other event for which the counterparty cannot meet its obligations, a Fund bears the risk of loss equal to the amount of the daily appreciation owed to the Fund. This obligation represents the daily gain accrued to the Fund from the close of business day prior to this event to the day on which this event occurs and the counterparty can no longer meet its obligations. A Fund will enter into swap agreements only with large, well-capitalized and established financial institutions. The creditworthiness of each of the firms that is a party to a swap agreement is monitored by the Adviser. Shareholders may obtain swap counterparty financial statements at www.sec.gov. Swap contracts are subject to credit risk. Credit risk occurs when the financial condition of an issuer of a security or instrument may cause it to default or become unable to pay interest or principal due on the security. The counterparty to a swap contract might default on its obligations. In addition, the Funds have agreements with certain counterparties with which it trades swap contracts that contain credit risk-related contingent features that could be triggered subject to certain circumstances. Such circumstances include agreed upon net asset value and performance-based thresholds. The maximum exposure to the Funds in regard to potential counterparty default and credit-risk related contingent features at October 31, 2022 is detailed in the following tables. If such credit risk-related contingencies were triggered, the counterparties would have the option to terminate any positions open under the master netting agreement.
DIREXION ANNUAL REPORT
156
Description: Swap Contract
Counterparty: Bank of America Merrill Lynch
| | |
| | Assets:
Gross Amounts not
offset in the Statement
of Asset and Liabilities | | | | | | Liabilities:
Gross Amounts not
offset in the Statement
of Asset and Liabilities | | | |
Fund Name | | Gross
Amounts of
Recognized
Assets | | Financial
Instruments | | Collateral
Received | | Net
Amount2 | | Gross
Amounts of
Recognized
Liabilities | | Financial
Instruments | | Collateral
Pledged | | Net
Amount | |
Direxion Daily
AAPL Bear
1X Shares | | $ | 99,398 | | | $ | — | | | $ | 60,000 | | | $ | 39,398 | | | $ | — | | | $ | — | | | $ | — | | | $ | — | | |
Direxion Daily AMZN
Bear 1X Shares | | | 244,248 | | | | — | | | | 120,000 | | | | 124,248 | | | | — | | | | — | | | | — | | | | — | | |
Direxion Daily GOOGL
Bear 1X Shares | | | 116,766 | | | | — | | | | 116,7661 | | | | — | | | | — | | | | — | | | | — | | | | — | | |
Direxion Daily MSFT
Bear 1X Shares | | | 88,029 | | | | — | | | | 88,0291 | | | | — | | | | — | | | | — | | | | — | | | | — | | |
Direxion Daily TSLA
Bear 1X Shares | | | 232,193 | | | | — | | | | 220,000 | | | | 12,193 | | | | — | | | | — | | | | — | | | | — | | |
Direxion Daily AAPL
Bull 1.5X Shares | | | 35,151 | | | | — | | | | — | | | | 35,151 | | | | — | | | | — | | | | — | | | | — | | |
Direxion Daily AMZN
Bull 1.5X Shares | | | — | | | | — | | | | — | | | | — | | | | 276,424 | | | | — | | | | 276,4241 | | | | — | | |
Direxion Daily GOOGL
Bull 1.5X Shares | | | — | | | | — | | | | — | | | | — | | | | 158,455 | | | | — | | | | 158,4551 | | | | — | | |
Direxion Daily MSFT
Bull 1.5X Shares | | | — | | | | — | | | | — | | | | — | | | | 116,939 | | | | — | | | | 116,9391 | | | | — | | |
Direxion Daily TSLA
Bull 1.5X Shares | | | — | | | | — | | | | — | | | | — | | | | 3,175,885 | | | | — | | | | 3,175,8851 | | | | — | | |
Direxion Daily CSI
China Internet
Index Bull 2X Shares | | | — | | | | — | | | | — | | | | — | | | | 14,826,952 | | | | — | | | | 14,826,9521 | | | | — | | |
Direxion Daily Cloud
Computing Bull
2X Shares | | | — | | | | — | | | | — | | | | — | | | | 30,156 | | | | — | | | | 30,1561 | | | | — | | |
Direxion Daily Global
Clean Energy Bull
2X Shares | | | — | | | | — | | | | — | | | | — | | | | 175,709 | | | | — | | | | 175,7091 | | | | — | | |
Direxion Daily Gold
Miners Index Bull
2X Shares | | | — | | | | — | | | | — | | | | — | | | | 26,981,402 | | | | — | | | | 26,981,4021 | | | | — | | |
Direxion Daily Gold
Miners Index Bear
2X Shares | | | 7,998,639 | | | | — | | | | 7,160,000 | | | | 838,639 | | | | — | | | | — | | | | — | | | | — | | |
Direxion Daily S&P
Oil & Gas Exp. &
Prod. Bull
2X Shares | | | 17,800,314 | | | | — | | | | 15,660,000 | | | | 2,140,314 | | | | — | | | | — | | | | — | | | | — | | |
Direxion Daily S&P
Oil & Gas Exp. &
Prod. Bear
2X Shares | | | — | | | | — | | | | — | | | | — | | | | 2,812,829 | | | | — | | | | 2,812,8291 | | | | — | | |
Direxion Daily Travel &
Vacation Bull
2X Shares | | | — | | | | — | | | | — | | | | — | | | | 11,893 | | | | — | | | | 11,8931 | | | | — | | |
Direxion Daily US
Infrastructure Bull
2X Shares | | | 257,437 | | | | — | | | | 210,000 | | | | 47,437 | | | | — | | | | — | | | | — | | | | — | | |
1 The amount of collateral shown has been limited such that the net amount cannot be less than zero.
2 The amount shown is the maximum credit exposure of the Fund for the corresponding counterparty.
DIREXION ANNUAL REPORT
157
Description: Swap Contract
Counterparty: BNP Paribas
| | |
| | Assets:
Gross Amounts not
offset in the Statement
of Asset and Liabilities | |
| |
| | Liabilities:
Gross Amounts not
offset in the Statement
of Asset and Liabilities | | | |
Fund Name | | Gross
Amounts of
Recognized
Assets | | Financial
Instruments | | Collateral
Received | | Net
Amount2 | | Gross
Amounts of
Recognized
Liabilities | | Financial
Instruments | | Collateral
Pledged | | Net
Amount | |
Direxion Daily
AAPL Bear
1X Shares | | $ | 98,564 | | | $ | — | | | $ | 98,5641 | | | $ | — | | | $ | — | | | $ | — | | | $ | — | | | $ | — | | |
Direxion Daily
TSLA Bear
1X Shares | | | 668,459 | | | | — | | | | 668,4591 | | | | — | | | | — | | | | — | | | | — | | | | — | | |
Direxion
Daily AAPL
Bull 1.5X
Shares | | | — | | | | — | | | | — | | | | — | | | | 106,545 | | | | — | | | | 106,5451 | | | | — | | |
Direxion
Daily TSLA
Bull 1.5X
Shares | | | — | | | | — | | | | — | | | | — | | | | 4,128,038 | | | | — | | | | 4,128,0381 | | | | — | | |
Direxion
Daily CSI
China Internet
Index Bull
2X Shares | | | — | | | | — | | | | — | | | | — | | | | 14,542,291 | | | | — | | | | 14,542,2911 | | | | — | | |
Direxion Daily
MSCI Brazil
Bull 2X Shares | | | 9,326,753 | | | | — | | | | 7,100,000 | | | | 2,226,753 | | | | — | | | | — | | | | — | | | | — | | |
Direxion Daily
Energy Bull
2X Shares | | | 27,505,193 | | | | — | | | | 25,990,000 | | | | 1,515,193 | | | | — | | | | — | | | | — | | | | — | | |
Direxion Daily
Energy Bear
2X Shares | | | — | | | | — | | | | — | | | | — | | | | 5,278,218 | | | | — | | | | 5,278,2181 | | | | — | | |
Direxion Daily
Gold Miners
Index Bull
2X Shares | | | — | | | | — | | | | — | | | | — | | | | 1,373,622 | | | | — | | | | 1,373,6221 | | | | — | | |
Direxion Daily
Gold Miners
Index Bear
2X Shares | | | — | | | | — | | | | — | | | | — | | | | 62,675 | | | | — | | | | 62,6751 | | | | — | | |
Direxion Daily
Junior Gold
Miners
Index Bull
2X Shares | | | — | | | | — | | | | — | | | | — | | | | 4,256,948 | | | | — | | | | 4,256,9481 | | | | — | | |
Direxion Daily
Junior Gold
Miners
Index Bear
2X Shares | | | 2,678,022 | | | | — | | | | 1,210,000 | | | | 1,468,022 | | | | — | | | | — | | | | — | | | | — | | |
Direxion Daily
S&P Oil &
Gas Exp. &
Prod. Bull
2X Shares | | | 135,988,244 | | | | — | | | | 131,279,000 | | | | 4,709,244 | | | | — | | | | — | | | | — | | | | — | | |
1 The amount of collateral shown has been limited such that the net amount cannot be less than zero.
2 The amount shown is the maximum credit exposure of the Fund for the corresponding counterparty.
DIREXION ANNUAL REPORT
158
Description: Swap Contract
Counterparty: Barclays
| | |
| | Assets:
Gross Amounts not
offset in the Statement
of Asset and Liabilities | |
| |
| | Liabilities:
Gross Amounts not
offset in the Statement
of Asset and Liabilities | | | |
Fund Name | | Gross
Amounts of
Recognized
Assets | | Financial
Instruments | | Collateral
Received | | Net
Amount2 | | Gross
Amounts of
Recognized
Liabilities | | Financial
Instruments | | Collateral
Pledged | | Net
Amount | |
Direxion Daily
CSI 300
China A Share
Bear 1X Shares | | $ | 135,140 | | | $ | — | | | $ | — | | | $ | 135,140 | | | $ | — | | | $ | — | | | $ | — | | | $ | — | | |
Direxion Daily
S&P 500® Bear
1X Shares | | | — | | | | — | | | | — | | | | — | | | | 7,024,777 | | | | — | | | | 7,024,7771 | | | | — | | |
Direxion Daily
S&P 500® Equal
Weight Bull
2X Shares | | | — | | | | — | | | | — | | | | — | | | | 4,007 | | | | — | | | | — | | | | 4,007 | | |
Direxion Daily
MSCI Brazil Bull
2X Shares | | | 1,073,747 | | | | — | | | | 410,000 | | | | 663,747 | | | | — | | | | — | | | | — | | | | — | | |
Direxion Daily
MSCI India Bull
2X Shares | | | 265,297 | | | | — | | | | 250,000 | | | | 15,297 | | | | — | | | | — | | | | — | | | | — | | |
Direxion Daily
Energy Bull
2X Shares | | | 41,533,113 | | | | — | | | | 39,910,000 | | | | 1,623,113 | | | | — | | | | — | | | | — | | | | — | | |
Direxion Daily
Energy Bear
2X Shares | | | — | | | | — | | | | — | | | | — | | | | 1,798,821 | | | | — | | | | 1,798,8211 | | | | — | | |
Direxion Daily
FinTech Bull
2X Shares | | | — | | | | — | | | | — | | | | — | | | | 11,355 | | | | — | | | | — | | | | 11,355 | | |
Direxion Daily Oil
Services Bull
2X Shares | | | 341,629 | | | | — | | | | 20,000 | | | | 321,629 | | | | — | | | | — | | | | — | | | | — | | |
Direxion Daily
Robotics,
Artificial
Intelligence &
Automation
Index Bull
2X Shares | | | — | | | | — | | | | — | | | | — | | | | 1,064,185 | | | | — | | | | 1,064,1851 | | | | — | | |
Direxion Daily
Select Large
Caps & FANGs
Bull 2X Shares | | | — | | | | — | | | | — | | | | — | | | | 56,349 | | | | — | | | | 56,3491 | | | | — | | |
Direxion Daily
Software Bull
2X Shares | | | — | | | | — | | | | — | | | | — | | | | 71,367 | | | | — | | | | — | | | | 71,367 | | |
1 The amount of collateral shown has been limited such that the net amount cannot be less than zero.
2 The amount shown is the maximum credit exposure of the Fund for the corresponding counterparty.
DIREXION ANNUAL REPORT
159
Description: Swap Contract
Counterparty: Citibank N.A.
| | |
| | Assets:
Gross Amounts not
offset in the Statement
of Asset and Liabilities | |
| |
| | Liabilities:
Gross Amounts not
offset in the Statement
of Asset and Liabilities | | | |
Fund Name | | Gross
Amounts of
Recognized
Assets | | Financial
Instruments | | Collateral
Received | | Net
Amount2 | | Gross
Amounts of
Recognized
Liabilities | | Financial
Instruments | | Collateral
Pledged | | Net
Amount | |
Direxion Daily
AAPL Bear
1X Shares | | $ | 108,957 | | | $ | — | | | $ | — | | | $ | 108,957 | | | $ | — | | | $ | — | | | $ | — | | | $ | — | | |
Direxion Daily
AMZN Bear
1X Shares | | | 12,318 | | | | — | | | | 12,3181 | | | | — | | | | — | | | | — | | | | — | | | | — | | |
Direxion Daily
GOOGL Bear
1X Shares | | | 129,381 | | | | — | | | | 93,000 | | | | 36,381 | | | | — | | | | — | | | | — | | | | — | | |
Direxion Daily
MSFT Bear
1X Shares | | | 82,371 | | | | — | | | | 82,3711 | | | | — | | | | — | | | | — | | | | — | | | | — | | |
Direxion Daily
TSLA Bear
1X Shares | | | 126,510 | | | | — | | | | 114,000 | | | | 12,510 | | | | — | | | | — | | | | — | | | | — | | |
Direxion Daily
AAPL Bull
1.5X Shares | | | 103,875 | | | | — | | | | 103,8751 | | | | — | | | | — | | | | — | | | | — | | | | — | | |
Direxion Daily
AMZN Bull
1.5X Shares | | | — | | | | — | | | | — | | | | — | | | | 289,775 | | | | — | | | | 289,7751 | | | | — | | |
Direxion Daily
GOOGL Bull
1.5X Shares | | | — | | | | — | | | | — | | | | — | | | | 228,271 | | | | — | | | | 228,2711 | | | | — | | |
Direxion Daily
MSFT Bull
1.5X Shares | | | — | | | | — | | | | — | | | | — | | | | 105,284 | | | | — | | | | 105,2841 | | | | — | | |
Direxion Daily
TSLA Bull
1.5X Shares | | | — | | | | — | | | | — | | | | — | | | | 6,037,930 | | | | — | | | | 6,037,9301 | | | | — | | |
Direxion Daily
CSI 300
China A
Share Bull
2X Shares | | | — | | | | — | | | | — | | | | — | | | | 3,397,206 | | | | — | | | | 3,397,2061 | | | | — | | |
Direxion Daily
CSI China
Internet Index
Bull 2X Shares | | | — | | | | — | | | | — | | | | — | | | | 12,962,468 | | | | — | | | | 12,962,4681 | | | | — | | |
Direxion Daily
S&P 500® Bull
2X Shares | | | 2,110,001 | | | | — | | | | 1,964,000 | | | | 146,001 | | | | — | | | | — | | | | — | | | | — | | |
Direxion Daily
MSCI India Bull
2X Shares | | | 433,361 | | | | — | | | | 433,3611 | | | | — | | | | — | | | | — | | | | — | | | | — | | |
Direxion Daily
Cloud
Computing
Bull 2X Shares | | | — | | | | — | | | | — | | | | — | | | | 26,052 | | | | — | | | | 26,0521 | | | | — | | |
Direxion Daily
Global Clean
Energy Bull
2X Shares | | | 11,373 | | | | — | | | | — | | | | 11,373 | | | | — | | | | — | | | | — | | | | — | | |
DIREXION ANNUAL REPORT
160
| | |
| | Assets:
Gross Amounts not
offset in the Statement
of Asset and Liabilities | |
| |
| | Liabilities:
Gross Amounts not
offset in the Statement
of Asset and Liabilities | | | |
Fund Name | | Gross
Amounts of
Recognized
Assets | | Financial
Instruments | | Collateral
Received | | Net
Amount2 | | Gross
Amounts of
Recognized
Liabilities | | Financial
Instruments | | Collateral
Pledged | | Net
Amount | |
Direxion Daily
Gold Miners
Index Bull
2X Shares | | $ | — | | | $ | — | | | $ | — | | | $ | — | | | $ | 36,955,153 | | | $ | — | | | $ | 36,955,1531 | | | $ | — | | |
Direxion Daily
Gold Miners
Index Bear
2X Shares | | | 9,296,822 | | | | — | | | | 8,947,001 | | | | 349,821 | | | | — | | | | — | | | | — | | | | — | | |
Direxion Daily
Junior Gold
Miners Index
Bull 2X Shares | | | — | | | | — | | | | — | | | | — | | | | 12,630,450 | | | | — | | | | 12,630,4501 | | | | — | | |
Direxion Daily
Junior Gold
Miners Index
Bear 2X Shares | | | — | | | | — | | | | — | | | | — | | | | 1,457,083 | | | | — | | | | 1,457,0831 | | | | — | | |
Direxion Daily
Oil Services
Bull 2X Shares | | | 1,538,724 | | | | — | | | | 1,409,000 | | | | 129,724 | | | | — | | | | — | | | | — | | | | — | | |
Direxion Daily
Robotics,
Artificial
Intelligence &
Automation
Index Bull
2X Shares | | | — | | | | — | | | | — | | | | — | | | | 1,111,632 | | | | — | | | | 1,111,6321 | | | | — | | |
Direxion Daily
S&P Oil &
Gas Exp. &
Prod. Bull
2X Shares | | | 79,178,430 | | | | — | | | | 72,522,664 | | | | 6,655,766 | | | | — | | | | — | | | | — | | | | — | | |
Direxion Daily
S&P Oil &
Gas Exp. &
Prod. Bear
2X Shares | | | — | | | | — | | | | — | | | | — | | | | 5,827,989 | | | | — | | | | 5,827,9891 | | | | — | | |
1 The amount of collateral shown has been limited such that the net amount cannot be less than zero.
2 The amount shown is the maximum credit exposure of the Fund for the corresponding counterparty.
DIREXION ANNUAL REPORT
161
Description: Swap Contract
Counterparty: Goldman Sachs
| | |
| | Assets:
Gross Amounts not
offset in the Statement
of Asset and Liabilities | |
| |
| | Liabilities:
Gross Amounts not
offset in the Statement
of Asset and Liabilities | | | |
Fund Name | | Gross
Amounts of
Recognized
Assets | | Financial
Instruments | | Collateral
Received | | Net
Amount2 | | Gross
Amounts of
Recognized
Liabilities | | Financial
Instruments | | Collateral
Pledged | | Net
Amount | |
Direxion Daily
AAPL Bear
1X Shares | | $ | 78,008 | | | $ | — | | | $ | 78,0081 | | | $ | — | | | $ | — | | | $ | — | | | $ | — | | | $ | — | | |
Direxion Daily
AMZN Bear
1X Shares | | | 216,877 | | | | — | | | | — | | | | 216,877 | | | | — | | | | — | | | | — | | | | — | | |
Direxion Daily
GOOGL Bear
1X Shares | | | 116,645 | | | | — | | | | — | | | | 116,645 | | | | — | | | | — | | | | — | | | | — | | |
Direxion Daily
MSFT Bear
1X Shares | | | 85,259 | | | | — | | | | — | | | | 85,259 | | | | — | | | | — | | | | — | | | | — | | |
Direxion Daily
TSLA Bear
1X Shares | | | 164,847 | | | | — | | | | 164,8471 | | | | — | | | | — | | | | — | | | | — | | | | — | | |
Direxion Daily
AAPL Bull
1.5X Shares | | | — | | | | — | | | | — | | | | — | | | | 144,148 | | | | — | | | | 144,1481 | | | | — | | |
Direxion Daily
AMZN Bull
1.5X Shares | | | — | | | | — | | | | — | | | | — | | | | 291,066 | | | | — | | | | 291,0661 | | | | — | | |
Direxion Daily
GOOGL Bull
1.5X Shares | | | — | | | | — | | | | — | | | | — | | | | 152,510 | | | | — | | | | 152,5101 | | | | — | | |
Direxion Daily
MSFT Bull
1.5X Shares | | | — | | | | — | | | | — | | | | — | | | | 77,683 | | | | — | | | | 77,6831 | | | | — | | |
Direxion Daily
TSLA Bull
1.5X Shares | | | — | | | | — | | | | — | | | | — | | | | 4,677,681 | | | | — | | | | 4,677,6811 | | | | — | | |
Direxion Daily
CSI China
Internet Index
Bull 2X Shares | | | — | | | | — | | | | — | | | | — | | | | 15,030,362 | | | | — | | | | 15,030,3621 | | | | — | | |
Direxion Daily
Electric and
Autonomous
Vehicles Bull
2X Shares | | | — | | | | — | | | | — | | | | — | | | | 37,352 | | | | — | | | | 37,3521 | | | | — | | |
Direxion Daily
Gold Miners
Index Bull
2X Shares | | | — | | | | — | | | | — | | | | — | | | | 61,129 | | | | — | | | | 61,1291 | | | | — | | |
Direxion Daily S&P
Oil & Gas Exp. &
Prod. Bull
2X Shares | | | 20,204,454 | | | | — | | | | 18,461,250 | | | | 1,743,204 | | | | — | | | | — | | | | — | | | | — | | |
Direxion Daily S&P
Oil & Gas Exp. &
Prod. Bear
2X Shares | | | — | | | | — | | | | — | | | | — | | | | 4,175,393 | | | | — | | | | 4,175,3931 | | | | — | | |
1 The amount of collateral shown has been limited such that the net amount cannot be less than zero.
2 The amount shown is the maximum credit exposure of the Fund for the corresponding counterparty.
DIREXION ANNUAL REPORT
162
Description: Swap Contract
Counterparty: J.P. Morgan
| | | | | Assets: | | | | | | Liabilities: | | | |
| | |
| | Gross Amounts not
offset in the Statement
of Asset and Liabilities | |
| |
| | Gross Amounts not
offset in the Statement
of Asset and Liabilities | | | |
Fund Name | | Gross
Amounts of
Recognized
Assets | | Financial
Instruments | | Collateral
Received | | Net
Amount2 | | Gross
Amounts of
Recognized
Liabilities | | Financial
Instruments | | Collateral
Pledged | | Net
Amount | |
Direxion Daily
CSI 300
China A Share
Bull 2X Shares | | $ | — | | | $ | — | | | $ | — | | | $ | — | | | $ | 2,772,620 | | | $ | — | | | $ | 2,772,6201 | | | $ | — | | |
Direxion Daily
MSCI Brazil Bull
2X Shares | | | 4,417,267 | | | | — | | | | 1,060,000 | | | | 3,357,267 | | | | — | | | | — | | | | — | | | | — | | |
Direxion Daily
Energy Bull
2X Shares | | | 38,943,721 | | | | — | | | | 37,660,000 | | | | 1,283,721 | | | | — | | | | — | | | | — | | | | — | | |
Direxion Daily
Energy Bear
2X Shares | | | — | | | | — | | | | — | | | | — | | | | 1,868,435 | | | | — | | | | 1,868,4351 | | | | — | | |
Direxion Daily Gold
Miners Index Bull
2X Shares | | | — | | | | — | | | | — | | | | — | | | | 2,175,187 | | | | — | | | | 2,175,1871 | | | | — | | |
Direxion Daily Gold
Miners Index Bear
2X Shares | | | — | | | | — | | | | — | | | | — | | | | 456,651 | | | | — | | | | 456,6511 | | | | — | | |
Direxion Daily
Junior Gold
Miners Index
Bull 2X Shares | | | — | | | | — | | | | — | | | | — | | | | 14,796,409 | | | | — | | | | 14,796,4091 | | | | — | | |
Direxion Daily
Junior Gold
Miners Index
Bear 2X Shares | | | — | | | | — | | | | — | | | | — | | | | 51,897 | | | | — | | | | 51,8971 | | | | — | | |
Direxion Daily
Metal Miners
Bull 2X Shares | | | 424,730 | | | | — | | | | 360,000 | | | | 64,730 | | | | — | | | | — | | | | — | | | | — | | |
Direxion Daily
Robotics, Artificial
Intelligence &
Automation
Index Bull
2X Shares | | | — | | | | — | | | | — | | | | — | | | | 66,520 | | | | — | | | | 66,5201 | | | | — | | |
Direxion Daily
S&P Oil & Gas
Exp. & Prod.
Bull 2X Shares | | | 17,770,886 | | | | — | | | | 15,890,000 | | | | 1,880,886 | | | | — | | | | — | | | | — | | | | — | | |
Direxion Daily
S&P Oil & Gas
Exp. & Prod.
Bear 2X Shares | | | — | | | | — | | | | — | | | | — | | | | 7,077,542 | | | | — | | | | 7,077,5421 | | | | — | | |
Direxion Daily TIPS
Bear 2X Shares | | | 88,255 | | | | — | | | | — | | | | 88,255 | | | | — | | | | — | | | | — | | | | — | | |
Direxion Daily
Travel & Vacation
Bull 2X Shares | | | 1,220,781 | | | | — | | | | 1,220,7811 | | | | — | | | | — | | | | — | | | | — | | | | — | | |
Direxion Daily US
Infrastructure
Bull 2X Shares | | | 6,112 | | | | — | | | | — | | | | 6,112 | | | | — | | | | — | | | | — | | | | — | | |
1 The amount of collateral shown has been limited such that the net amount cannot be less than zero.
2 The amount shown is the maximum credit exposure of the Fund for the corresponding counterparty.
DIREXION ANNUAL REPORT
163
Description: Swap Contract
Counterparty: UBS Securities LLC
| | |
| | Assets:
Gross Amounts not
offset in the Statement
of Asset and Liabilities | |
| |
| | Liabilities:
Gross Amounts not
offset in the Statement
of Asset and Liabilities | | | |
Fund Name | | Gross
Amounts of
Recognized
Assets | | Financial
Instruments | | Collateral
Received | | Net
Amount2 | | Gross
Amounts of
Recognized
Liabilities | | Financial
Instruments | | Collateral
Pledged | | Net
Amount | |
Direxion Daily
CSI 300
China A Share
Bear 1X Shares | | $ | 8,440,955 | | | $ | — | | | $ | 7,890,000 | | | $ | 550,955 | | | $ | — | | | $ | — | | | $ | — | | | $ | — | | |
Direxion Daily
S&P 500® Bear
1X Shares | | | — | | | | — | | | | — | | | | — | | | | 29,836,524 | | | | — | | | | 29,836,5241 | | | | — | | |
Direxion Daily
CSI 300 China A
Share Bull
2X Shares | | | — | | | | — | | | | — | | | | — | | | | 10,980,156 | | | | — | | | | 10,980,1561 | | | | — | | |
Direxion Daily CSI
China Internet
Index Bull
2X Shares | | | — | | | | — | | | | — | | | | — | | | | 27,261,841 | | | | — | | | | 27,261,8411 | | | | — | | |
Direxion Daily
S&P 500® Bull
2X Shares | | | 398,437 | | | | — | | | | 398,4371 | | | | — | | | | — | | | | — | | | | — | | | | — | | |
Direxion Daily
S&P 500® Equal
Weight Bull
2X Shares | | | — | | | | — | | | | — | | | | — | | | | 1,727 | | | | — | | | | 1,7271 | | | | — | | |
Direxion Daily
MSCI Brazil Bull
2X Shares | | | 641,872 | | | | — | | | | — | | | | 641,872 | | | | — | | | | — | | | | — | | | | — | | |
Direxion Daily
MSCI India Bull
2X Shares | | | 615,550 | | | | — | | | | 615,5501 | | | | — | | | | — | | | | — | | | | — | | | | — | | |
Direxion Daily
Energy Bull
2X Shares | | | 17,247,384 | | | | — | | | | 17,247,3841 | | | | — | | | | — | | | | — | | | | — | | | | — | | |
Direxion Daily
Energy Bear
2X Shares | | | — | | | | — | | | | — | | | | — | | | | 1,884,317 | | | | — | | | | 1,884,3171 | | | | — | | |
Direxion Daily
FinTech Bull
2X Shares | | | — | | | | — | | | | — | | | | — | | | | 134,374 | | | | — | | | | 134,3741 | | | | — | | |
Direxion Daily Gold
Miners Index Bull
2X Shares | | | 81,711 | | | | — | | | | 81,7111 | | | | — | | | | — | | | | — | | | | — | | | | — | | |
Direxion Daily Gold
Miners Index
Bear 2X Shares | | | — | | | | — | | | | — | | | | — | | | | 1,479,449 | | | | — | | | | 1,479,4491 | | | | — | | |
Direxion Daily
Junior Gold
Miners Index
Bull 2X Shares | | | — | | | | — | | | | — | | | | — | | | | 1,564,957 | | | | — | | | | 1,564,9571 | | | | — | | |
Direxion Daily
Junior Gold
Miners Index
Bear 2X Shares | | | 7,593,348 | | | | — | | | | 7,240,000 | | | | 353,348 | | | | — | | | | — | | | | — | | | | — | | |
Direxion Daily
Metal Miners
Bull 2X Shares | | | 315,557 | | | | — | | | | 280,000 | | | | 35,557 | | | | — | | | | — | | | | — | | | | — | | |
DIREXION ANNUAL REPORT
164
| | |
| | Assets:
Gross Amounts not
offset in the Statement
of Asset and Liabilities | |
| |
| | Liabilities:
Gross Amounts not
offset in the Statement
of Asset and Liabilities | | | |
Fund Name | | Gross
Amounts of
Recognized
Assets | | Financial
Instruments | | Collateral
Received | | Net
Amount2 | | Gross
Amounts of
Recognized
Liabilities | | Financial
Instruments | | Collateral
Pledged | | Net
Amount | |
Direxion Daily
Oil Services
Bull 2X Shares | | $ | 992,395 | | | $ | — | | | $ | 910,000 | | | $ | 82,395 | | | $ | — | | | $ | — | | | $ | — | | | $ | — | | |
Direxion Daily
Robotics,
Artificial
Intelligence &
Automation
Index Bull
2X Shares | | | — | | | | — | | | | — | | | | — | | | | 4,598 | | | | — | | | | 4,5981 | | | | — | | |
Direxion Daily
S&P Oil &
Gas Exp. &
Prod. Bull
2X Shares | | | 21,586,296 | | | | — | | | | 19,950,000 | | | | 1,636,296 | | | | — | | | | — | | | | — | | | | — | | |
Direxion Daily
S&P Oil &
Gas Exp. &
Prod. Bear
2X Shares | | | — | | | | — | | | | — | | | | — | | | | 2,871,768 | | | | — | | | | 2,871,7681 | | | | — | | |
Direxion Daily
Select Large
Caps & FANGs
Bull 2X Shares | | | 111,515 | | | | — | | | | 111,5151 | | | | — | | | | — | | | | — | | | | — | | | | — | | |
Direxion Daily
Software Bull
2X Shares | | | — | | | | — | | | | — | | | | — | | | | 81,829 | | | | — | | | | 81,8291 | | | | — | | |
Direxion Daily
TIPS Bull
2X Shares | | | — | | | | — | | | | — | | | | — | | | | 412,511 | | | | — | | | | 412,5111 | | | | — | | |
Direxion Daily
TIPS Bear
2X Shares | | | 237,499 | | | | — | | | | — | | | | 237,499 | | | | — | | | | — | | | | — | | | | — | | |
1 The amount of collateral shown has been limited such that the net amount cannot be less than zero.
2 The amount shown is the maximum credit exposure of the Fund for the corresponding counterparty.
c) Futures Contracts – Each Fund may purchase and sell futures contracts. A Fund may use futures contracts to gain exposure to, or hedge against, changes in the values of commodities, equities, interest rates or foreign currencies. Upon entering into a contract, the Fund deposits and maintains as collateral such initial margin as required by the exchange on which the transaction is effected. Pursuant to the contract, the Fund agrees to receive from or pay to the broker an amount of cash equal to the daily fluctuation in value of the contract. Such receipts or payments are known as "variation margin" and are recorded by the Fund as unrealized gains and losses. When the contract is closed, the Fund records a realized gain or loss equal to the difference between the value of the contract at the time it was opened and the value at the time it was closed. As collateral for futures contracts, the Fund is required under the 1940 Act to maintain assets consisting of cash, cash equivalents or liquid securities. This collateral is required to be adjusted daily to reflect the market value of the purchase obligation for long futures contracts or the market value of the instrument underlying the contract, but not less than the market price at which the futures contract was established, for short futures contracts
d) Risks of Futures Contracts, Options on Futures Contracts and Short Positions – The risks inherent in the use of options, futures contracts, options on futures contracts and short positions include 1) adverse changes in the fair value of such instruments; 2) imperfect correlation between the price of options and futures contracts and options thereon and movements in the price of the underlying securities, index or futures contracts; 3) the possible absence of a liquid secondary market for any particular instrument at any time; 4) the possible need to defer closing out certain positions to avoid adverse tax consequences; and 5) the possible non-performance by the counterparty under the terms of the contract. The Funds
DIREXION ANNUAL REPORT
165
designate cash, cash equivalents and liquid securities as collateral for written options, futures contracts, options on futures contracts and short positions. The Funds were not invested in any type of futures or options contracts during the period ended October 31, 2022.
e) Risks of Investing in Foreign Securities – Investments in foreign securities involve greater risks than investing in domestic securities. As a result, the Funds' returns and net asset values may be affected to a large degree by fluctuations in currency exchange rates, political, diplomatic or economic conditions and regulatory requirements in other countries. The laws, accounting and financial reporting standards in foreign countries may require less disclosure than required in the U.S., and therefore there may be less public information available about foreign companies. Investments in foreign emerging markets present a greater risk than investing in foreign issuers in general. The risk of political or social upheaval is greater in emerging markets. In addition, there may be risks of an economy's dependence on revenues from particular commodities, currency transfer restrictions, a limited number of potential buyers for such securities and delays and disruption in securities settlement procedures.
f) Security Transactions – Investment transactions are recorded on the trade date. The Funds determine the gain or loss realized from investment transactions by comparing the identified cost, which is the same basis used for U.S. Federal income tax purposes, with the net sales proceeds.
g) Securities Lending – Each Fund may lend up to 331/3% of the value of the securities in their portfolios to approved brokers, dealers and other financial institutions. The borrower pledges and maintains with the Fund collateral consisting of cash, cash equivalents, or securities issued or guaranteed by the U.S. government. The collateral received by each Fund is required to have a value of at least 102% of the current value of the loaned securities. During the term of the loan, each Fund is entitled to all distributions made on or in respect of the loaned securities but does not receive interest income on securities received as collateral. Each Fund receives compensation for lending its securities from interest or dividends earned on the cash, cash equivalents or U.S. Government securities held as collateral, net of fee rebates paid to borrower and net of fees paid to the lending agent. The amount of fees depends on a number of factors including the security type and the length of the loan. In addition, a Fund will receive a fee from the borrower for non-cash collateral equal to a percentage of the market value of the loaned securities. Loans of securities are terminable at any time and the borrower, after notice, is required to return borrowed securities within the standard time period for settlement of securities transactions. No more than 99% of the value of any security may be on loan at any time.
As of October 31, 2022, all securities on loan were collateralized by cash and/or U.S. government obligations. The cash received as collateral for securities on loan was invested in money market funds, whose maturities are overnight and continuous, and is disclosed in the Schedules of Investments. The securities on loan in each Fund are also disclosed in the Schedule of Investments. The total value of securities loaned and the value of the invested cash collateral are disclosed in the Statements of Assets and Liabilities. Non-cash collateral consists of U.S. Treasury securities and is not disclosed on the Statements of Assets and Liabilities as its held by the lending agent on behalf of the Funds, and the Funds do not have the ability to sell, reinvest or pledge those securities. Income earned by the Funds from securities lending is disclosed in the Statements of Operations.
The risks of securities lending include the risk that the borrower may not provide additional collateral when required or may not return the securities when due. To mitigate these risks, the Funds are contractually indemnified with the securities lending agent. Furthermore, the Funds require the value of the securities loaned to be computed daily at the close of the market and additional collateral be furnished, if required.
As of October 31, 2022, the market value of the securities loaned and the related cash and non-cash collateral received for securities lending were as follows:
Funds | | Market Value of
Securities Loaned | | Cash Collateral
Received | | Non-Cash
Collateral Received | | Total
Collateral Received | |
Direxion Daily S&P 500® Equal
Weight Bull 2X Shares | | $ | 1,121,440 | | | $ | 1,143,671 | | | $ | — | | | $ | 1,143,671 | | |
Direxion Daily MSCI Brazil Bull 2X Shares | | | 971,396 | | | | 996,103 | | | | — | | | | 996,103 | | |
Direxion Daily MSCI India Bull 2X Shares | | | 16,763,041 | | | | 17,123,281 | | | | — | | | | 17,123,281 | | |
Direxion Daily Cloud Computing
Bull 2X Shares | | | 14,033 | | | | 14,327 | | | | — | | | | 14,327 | | |
Direxion Daily FinTech Bull 2X Shares | | | 90,157 | | | | 92,444 | | | | — | | | | 92,444 | | |
Direxion Daily Metal Miners Bull 2X Shares | | | 29,801 | | | | 30,515 | | | | — | | | | 30,515 | | |
Direxion Daily S&P Oil & Gas Exp. & Prod.
Bull 2X Shares | | | 9,592,857 | | | | 9,515,889 | | | | 398,495 | | | | 9,914,384 | | |
Direxion Daily Software Bull 2X Shares | | | 1,893 | | | | 1,940 | | | | — | | | | 1,940 | | |
Direxion Daily Select Large Caps & FANGs
Bull 2X Shares | | | 290,904 | | | | 50,364 | | | | 248,635 | | | | 298,999 | | |
DIREXION ANNUAL REPORT
166
h) Federal Income Taxes – Each Fund intends to make the requisite distributions of income and capital gains to comply with the requirements of Subchapter M of the Internal Revenue Code of 1986, as amended, necessary to qualify as a regulated investment company. Therefore, no provision for U.S. Federal income tax has been made by the Funds.
The Funds may be subject to a nondeductible 4% U.S. excise tax calculated as a percentage of certain undistributed amounts of net investment income and net capital gains. Certain Funds paid this excise tax during the period ended October 31, 2022, which is disclosed on the Statements of Operations.
i) Income and Expenses – Interest income, including amortization of premiums and discounts, is recognized on an accrual basis. Distributions are recorded on the ex-dividend date.
The Funds are charged for those expenses that are directly attributable to each series, such as advisory fees and registration costs. Expenses that are not directly attributable to a series are generally allocated among the Trust's series in proportion to their respective average daily net assets.
j) Distributions to Shareholders – Each Fund pays dividends from net investment income and distributes net realized capital gains, if any, at least annually. Income and capital gain distributions are determined in accordance with U.S. Federal income tax regulations, which may differ from GAAP. Certain Funds also utilize earnings and profits distributed to shareholders on redemptions of shares as part of the dividends paid deduction. Distributions to shareholders are recorded on the ex-dividend date.
k) Guarantees and Indemnifications – In the ordinary course of business, the Funds enter into contracts that contain a variety of indemnification provisions pursuant to which the Funds agree to indemnify third parties upon the occurrence of specified events. The Funds' maximum exposure relating to these indemnification agreements is unknown. However, the Funds have not had prior claims or losses in connection with these provisions and believe the risk of loss is remote.
l) Use of Estimates – The preparation of financial statements in conformity with GAAP requires management to make estimates and assumptions that affect the reported amounts of assets and liabilities and disclosure of contingent assets and liabilities at the date of the financial statements and the reported amounts of revenues and expenses during the reporting period. Actual results could differ from those estimates.
3. INCOME TAX AND DISTRIBUTION INFORMATION
The tax character of distributions paid during the periods ended October 31, 2022 and October 31, 2021 are presented in the following table. The tax character of distributions to shareholders made during the period may differ from their ultimate characterization for U.S. Federal income tax purposes.
| | | Year/Period Ended
October 31, 2022 | | Year/Period Ended
October 31, 2021 | |
| | | Distributions Paid From: | | Distributions Paid From: | |
Funds | | Ordinary
Income | | Long Term
Capital Gains | | Return
of Capital | | Ordinary
Income | | Long Term
Capital Gains | | Return
of Capital | |
Direxion Daily CSI 300 China A
Share Bear 1X Shares | | $ | — | | | $ | — | | | $ | — | | | $ | — | | | $ | — | | | $ | — | | |
Direxion Daily S&P 500® Bear
1X Shares | | | 741,705 | | | | — | | | | — | | | | — | | | | — | | | | — | | |
Direxion Daily AAPL Bear 1X Shares9 | | | 7,923 | | | | — | | | | — | | | | — | | | | — | | | | — | | |
Direxion Daily AMZN Bear 1X Shares11 | | | 1,055 | | | | — | | | | — | | | | — | | | | — | | | | — | | |
Direxion Daily GOOGL Bear 1X Shares11 | | | 1,002 | | | | — | | | | — | | | | — | | | | — | | | | — | | |
Direxion Daily MSFT Bear 1X Shares11 | | | 1,011 | | | | — | | | | — | | | | — | | | | — | | | | — | | |
Direxion Daily TSLA Bear 1X Shares9 | | | 6,449 | | | | — | | | | — | | | | — | | | | — | | | | — | | |
Direxion Daily AAPL Bull 1.5X Shares9 | | | 3,904 | | | | — | | | | — | | | | — | | | | — | | | | — | | |
Direxion Daily AMZN Bull 1.5X Shares11 | | | 726 | | | | — | | | | — | | | | — | | | | — | | | | — | | |
Direxion Daily GOOGL Bull
1.5X Shares11 | | | 759 | | | | — | | | | — | | | | — | | | | — | | | | — | | |
Direxion Daily MSFT Bull 1.5X Shares11 | | | 774 | | | | — | | | | — | | | | — | | | | — | | | | — | | |
Direxion Daily TSLA Bull 1.5X Shares9 | | | 30,807 | | | | — | | | | — | | | | — | | | | — | | | | — | | |
DIREXION ANNUAL REPORT
167
| | | Year/Period Ended
October 31, 2022 | | Year/Period Ended
October 31, 2021 | |
| | | Distributions Paid From: | | Distributions Paid From: | |
Funds | | Ordinary
Income | | Long Term
Capital Gains | | Return
of Capital | | Ordinary
Income | | Long Term
Capital Gains | | Return
of Capital | |
Direxion Daily CSI 300 China A
Share Bull 2X Shares | | $ | 2,058,066 | | | $ | — | | | $ | — | | | $ | — | | | $ | — | | | $ | — | | |
Direxion Daily CSI China Internet
Index Bull 2X Shares | | | — | | | | — | | | | — | | | | — | | | | — | | | | — | | |
Direxion Daily S&P 500® Bull
2X Shares | | | 1,711,768 | | | | — | | | | — | | | | 1,712,190 | | | | — | | | | — | | |
Direxion Daily S&P 500® Equal
Weight Bull 2X Shares7 | | | 14,050 | | | | — | | | | — | | | | — | | | | — | | | | — | | |
Direxion Daily MSCI Brazil Bull
2X Shares | | | 11,641,388 | | | | — | | | | — | | | | 1,145,805 | | | | — | | | | 490,797 | | |
Direxion Daily MSCI India Bull
2X Shares | | | 2,174,613 | | | | — | | | | — | | | | — | | | | — | | | | — | | |
Direxion Daily Cloud Computing
Bull 2X Shares1 | | | 916,786 | | | | — | | | | — | | | | — | | | | — | | | | — | | |
Direxion Daily Electric and
Autonomous Vehicles Bull
2X Shares10 | | | — | | | | — | | | | — | | | | — | | | | — | | | | — | | |
Direxion Daily Energy Bull 2X Shares | | | 15,441,018 | | | | — | | | | — | | | | 13,092,316 | | | | — | | | | — | | |
Direxion Daily Energy Bear 2X Shares | | | — | | | | — | | | | — | | | | — | | | | — | | | | — | | |
Direxion Daily FinTech Bull 2X Shares7 | | | 6,108 | | | | — | | | | 1,477 | | | | — | | | | — | | | | — | | |
Direxion Daily Global Clean Energy
Bull 2X Shares3 | | | 23,227 | | | | — | | | | 4,294 | | | | — | | | | — | | | | — | | |
Direxion Daily Gold Miners Index
Bull 2X Shares | | | — | | | | — | | | | — | | | | — | | | | — | | | | — | | |
Direxion Daily Gold Miners Index
Bear 2X Shares | | | — | | | | — | | | | — | | | | — | | | | — | | | | — | | |
Direxion Daily Junior Gold Miners
Index Bull 2X Shares | | | — | | | | — | | | | — | | | | — | | | | — | | | | 2,449,837 | | |
Direxion Daily Junior Gold Miners
Index Bear 2X Shares | | | — | | | | — | | | | — | | | | — | | | | — | | | | — | | |
Direxion Daily Metal Miners Bull
2X Shares6 | | | 59,024 | | | | — | | | | — | | | | — | | | | — | | | | — | | |
Direxion Daily Oil Services Bull
2X Shares7 | | | 12,713 | | | | — | | | | 3,245 | | | | — | | | | — | | | | — | | |
Direxion Daily Robotics, Artificial
Intelligence & Automation Index
Bull 2X Shares | | | 905,597 | | | | — | | | | — | | | | 8,502,373 | | | | — | | | | — | | |
Direxion Daily S&P Oil & Gas Exp. &
Prod. Bull 2X Shares | | | 3,198,438 | | | | — | | | | — | | | | 875,162 | | | | — | | | | 116 | | |
Direxion Daily S&P Oil & Gas Exp. &
Prod. Bear 2X Shares | | | — | | | | — | | | | — | | | | — | | | | — | | | | 7,191 | | |
Direxion Daily Select Large Caps &
FANGs Bull 2X Shares5 | | | 408,960 | | | | — | | | | 4,293 | | | | — | | | | — | | | | — | | |
Direxion Daily Software Bull
2X Shares6 | | | — | | | | — | | | | — | | | | — | | | | — | | | | — | | |
Direxion Daily TIPS Bull 2X Shares8 | | | 259,138 | | | | — | | | | — | | | | — | | | | — | | | | — | | |
Direxion Daily TIPS Bear 2X Shares8 | | | 16,857 | | | | — | | | | — | | | | — | | | | — | | | | — | | |
Direxion Daily Travel & Vacation Bull
2X Shares2 | | | — | | | | — | | | | — | | | | — | | | | — | | | | — | | |
Direxion Daily US Infrastructure Bull
2X Shares4 | | | 59,260 | | | | 9 | | | | — | | | | — | | | | — | | | | — | | |
1 Commenced operations on January 8, 2021.
2 Commenced operations on June 10, 2021.
3 Commenced operations on July 29, 2021.
DIREXION ANNUAL REPORT
168
4 Commenced operations on September 23, 2021.
5 Commenced operations on September 30, 2021.
6 Commenced operations on December 16, 2021.
7 Commenced operations on January 20, 2022.
8 Commenced operations on April 7, 2022.
9 Commenced operations on August 9, 2022.
10 Commenced operations on August 11, 2022.
11 Commenced operations on September 7, 2022.
At October 31, 2022, the components of accumulated earnings/(losses) on a tax-basis were as follows:
| Funds | | Net
Unrealized
Appreciation
(Depreciation) | | Undistributed
Ordinary
Income (Loss) | | Undistributed
Capital
Gain (Loss) | | Other
Accumulated
Earnings (Losses)1 | | Total
Accumulated
Earnings (Losses) | |
Direxion Daily CSI 300 China A
Share Bear 1X Shares | | $ | 6,044,791 | | | $ | — | | | $ | — | | | $ | — | | | $ | 6,044,791 | | |
Direxion Daily S&P 500® Bear
1X Shares | | | (45,669,233 | ) | | | 1,533,131 | | | | — | | | | (37,721,054 | ) | | | (81,857,156 | ) | |
Direxion Daily AAPL Bear
1X Shares | | | 61,322 | | | | 25,071 | | | | — | | | | (1,310 | ) | | | 85,083 | | |
Direxion Daily AMZN Bear
1X Shares | | | 432,520 | | | | 181,944 | | | | — | | | | (1,317 | ) | | | 613,147 | | |
Direxion Daily GOOGL Bear
1X Shares | | | 312,924 | | | | 8,426 | | | | — | | | | (1,325 | ) | | | 320,025 | | |
Direxion Daily MSFT Bear
1X Shares | | | 178,590 | | | | 11,762 | | | | — | | | | (1,317 | ) | | | 189,035 | | |
Direxion Daily TSLA Bear
1X Shares | | | 1,097,587 | | | | 912,736 | | | | — | | | | (1,317 | ) | | | 2,009,006 | | |
Direxion Daily AAPL Bull
1.5X Shares | | | (907,076 | ) | | | 13,549 | | | | — | | | | (37,625 | ) | | | (931,152 | ) | |
Direxion Daily AMZN Bull
1.5X Shares | | | (1,058,113 | ) | | | 7,569 | | | | — | | | | (3,487 | ) | | | (1,054,031 | ) | |
Direxion Daily GOOGL Bull
1.5X Shares | | | (677,224 | ) | | | 7,756 | | | | — | | | | (4,124 | ) | | | (673,592 | ) | |
Direxion Daily MSFT Bull
1.5X Shares | | | (423,303 | ) | | | 6,670 | | | | — | | | | (4,905 | ) | | | (421,538 | ) | |
Direxion Daily TSLA Bull
1.5X Shares | | | (23,717,628 | ) | | | 542,727 | | | | — | | | | (1,317 | ) | | | (23,176,218 | ) | |
Direxion Daily CSI 300 China A
Share Bull 2X Shares | | | (43,041,349 | ) | | | 131,457 | | | | — | | | | (11,529,977 | ) | | | (54,439,869 | ) | |
Direxion Daily CSI China Internet
Index Bull 2X Shares | | | (402,370,577 | ) | | | — | | | | — | | | | (193,150,295 | ) | | | (595,520,872 | ) | |
Direxion Daily S&P 500® Bull
2X Shares | | | 2,792,835 | | | | 295,260 | | | | — | | | | (10,488,679 | ) | | | (7,400,584 | ) | |
Direxion Daily S&P 500® Equal
Weight Bull 2X Shares | | | (996,390 | ) | | | 10,069 | | | | — | | | | (240,671 | ) | | | (1,226,992 | ) | |
Direxion Daily MSCI Brazil Bull
2X Shares | | | (31,932,750 | ) | | | 96,292 | | | | — | | | | (422,674,594 | ) | | | (454,511,052 | ) | |
Direxion Daily MSCI India Bull
2X Shares | | | (4,821,935 | ) | | | — | | | | — | | | | — | | | | (4,821,935 | ) | |
Direxion Daily Cloud Computing
Bull 2X Shares | | | (11,752,306 | ) | | | — | | | | — | | | | (4,392,295 | ) | | | (16,144,601 | ) | |
Direxion Daily Electric and
Autonomous Vehicles Bull
2X Shares | | | (3,567,582 | ) | | | 10,637 | | | | — | | | | (68,987 | ) | | | (3,625,932 | ) | |
Direxion Daily Energy Bull
2X Shares | | | 208,887,776 | | | | 274,227 | | | | — | | | | (71,289,988 | ) | | | 137,872,015 | | |
Direxion Daily Energy Bear
2X Shares | | | (29,579,945 | ) | | | — | | | | — | | | | (169,208,084 | ) | | | (198,788,029 | ) | |
DIREXION ANNUAL REPORT
169
| Funds | | Net
Unrealized
Appreciation
(Depreciation) | | Undistributed
Ordinary
Income (Loss) | | Undistributed
Capital
Gain (Loss) | | Other
Accumulated
Earnings (Losses)1 | | Total
Accumulated
Earnings (Losses) | |
Direxion Daily FinTech Bull
2X Shares | | $ | (2,241,064 | ) | | $ | — | | | $ | — | | | $ | (747,756 | ) | | $ | (2,988,820 | ) | |
Direxion Daily Global Clean
Energy Bull 2X Shares | | | (2,434,415 | ) | | | — | | | | — | | | | (2,242,521 | ) | | | (4,676,936 | ) | |
Direxion Daily Gold Miners
Index Bull 2X Shares | | | (333,747,294 | ) | | | — | | | | — | | | | (1,803,026,124 | ) | | | (2,136,773,418 | ) | |
Direxion Daily Gold Miners
Index Bear 2X Shares | | | (2,385,133 | ) | | | — | | | | — | | | | (616,830,224 | ) | | | (619,215,357 | ) | |
Direxion Daily Junior Gold
Miners Index Bull 2X Shares | | | (343,692,965 | ) | | | — | | | | — | | | | (1,407,869,479 | ) | | | (1,751,562,444 | ) | |
Direxion Daily Junior Gold
Miners Index Bear 2X Shares | | | (15,361,033 | ) | | | — | | | | — | | | | (182,627,722 | ) | | | (197,988,755 | ) | |
Direxion Daily Metal Miners Bull
2X Shares | | | (6,355,865 | ) | | | 2,441 | | | | — | | | | — | | | | (6,353,424 | ) | |
Direxion Daily Oil Services Bull
2X Shares | | | 2,152,562 | | | | — | | | | — | | | | (93,793 | ) | | | 2,058,769 | | |
Direxion Daily Robotics, Artificial
Intelligence & Automation
Index Bull 2X Shares | | | (12,214,586 | ) | | | — | | | | — | | | | (12,745,273 | ) | | | (24,959,859 | ) | |
Direxion Daily S&P Oil & Gas Exp. &
Prod. Bull 2X Shares | | | 289,081,328 | | | | — | | | | — | | | | — | | | | 289,081,328 | | |
Direxion Daily S&P Oil & Gas Exp. &
Prod. Bear 2X Shares | | | (58,608,501 | ) | | | — | | | | — | | | | (188,545,238 | ) | | | (247,153,739 | ) | |
Direxion Daily Select Large Caps &
FANGs Bull 2X Shares | | | (12,053,658 | ) | | | — | | | | — | | | | (3,715,710 | ) | | | (15,769,368 | ) | |
Direxion Daily Software Bull
2X Shares | | | (2,942,502 | ) | | | — | | | | — | | | | (538,520 | ) | | | (3,481,022 | ) | |
Direxion Daily TIPS Bull 2X Shares | | | (1,937,341 | ) | | | 75,644 | | | | — | | | | — | | | | (1,861,697 | ) | |
Direxion Daily TIPS Bear 2X Shares | | | 289,633 | | | | 579,280 | | | | — | | | | — | | | | 868,913 | | |
Direxion Daily Travel &
Vacation Bull 2X Shares | | | (17,345,098 | ) | | | — | | | | — | | | | (8,691,490 | ) | | | (26,036,588 | ) | |
Direxion Daily US Infrastructure
Bull 2X Shares | | | (80,746 | ) | | | — | | | | — | | | | — | | | | (80,746 | ) | |
1 Other Accumulated Earnings (Losses) consist of capital loss carryover, qualified late year losses and organizational costs.
At October 31, 2022, the aggregate gross unrealized appreciation and depreciation of investments for U.S. Federal income tax purposes were as follows:
| Funds | | Tax Cost of
Investments | | Gross
Unrealized
Appreciation | | Gross
Unrealized
Depreciation | | Net
Unrealized
Appreciation
(Depreciation) | |
Direxion Daily CSI 300 China A Share Bear 1X Shares | | $ | 30,857,365 | | | $ | 8,576,095 | | | $ | (2,531,304 | ) | | $ | 6,044,791 | | |
Direxion Daily S&P 500® Bear 1X Shares | | | 671,517,560 | | | | — | | | | (45,669,233 | ) | | | (45,669,233 | ) | |
Direxion Daily AAPL Bear 1X Shares | | | 10,924,074 | | | | 384,927 | | | | (323,605 | ) | | | 61,322 | | |
Direxion Daily AMZN Bear 1X Shares | | | 3,388,387 | | | | 473,443 | | | | (40,923 | ) | | | 432,520 | | |
Direxion Daily GOOGL Bear 1X Shares | | | 4,051,063 | | | | 362,792 | | | | (49,868 | ) | | | 312,924 | | |
Direxion Daily MSFT Bear 1X Shares | | | 4,041,880 | | | | 255,659 | | | | (77,069 | ) | | | 178,590 | | |
Direxion Daily TSLA Bear 1X Shares | | | 11,091,220 | | | | 1,192,009 | | | | (94,422 | ) | | | 1,097,587 | | |
Direxion Daily AAPL Bull 1.5X Shares | | | 7,494,478 | | | | 150,347 | | | | (1,057,423 | ) | | | (907,076 | ) | |
Direxion Daily AMZN Bull 1.5X Shares | | | 6,236,933 | | | | — | | | | (1,058,113 | ) | | | (1,058,113 | ) | |
Direxion Daily GOOGL Bull 1.5X Shares | | | 5,285,233 | | | | — | | | | (677,224 | ) | | | (677,224 | ) | |
Direxion Daily MSFT Bull 1.5X Shares | | | 3,655,818 | | | | — | | | | (423,303 | ) | | | (423,303 | ) | |
Direxion Daily TSLA Bull 1.5X Shares | | | 121,766,322 | | | | 325,808 | | | | (24,043,436 | ) | | | (23,717,628 | ) | |
Direxion Daily CSI 300 China A Share Bull 2X Shares | | | 82,855,954 | | | | — | | | | (43,041,349 | ) | | | (43,041,349 | ) | |
DIREXION ANNUAL REPORT
170
| Funds | | Tax Cost of
Investments | | Gross
Unrealized
Appreciation | | Gross
Unrealized
Depreciation | | Net
Unrealized
Appreciation
(Depreciation) | |
Direxion Daily CSI China Internet Index Bull 2X Shares | | $ | 564,715,749 | | | $ | 920,975 | | | $ | (403,291,552 | ) | | $ | (402,370,577 | ) | |
Direxion Daily S&P 500® Bull 2X Shares | | | 50,965,656 | | | | 7,969,414 | | | | (5,176,579 | ) | | | 2,792,835 | | |
Direxion Daily S&P 500® Equal Weight Bull 2X Shares | | | 5,912,666 | | | | — | | | | (996,390 | ) | | | (996,390 | ) | |
Direxion Daily MSCI Brazil Bull 2X Shares | | | 180,368,144 | | | | 15,611,462 | | | | (47,544,212 | ) | | | (31,932,750 | ) | |
Direxion Daily MSCI India Bull 2X Shares | | | 75,224,843 | | | | 1,355,804 | | | | (6,177,739 | ) | | | (4,821,935 | ) | |
Direxion Daily Cloud Computing Bull 2X Shares | | | 19,531,104 | | | | 142,467 | | | | (11,894,773 | ) | | | (11,752,306 | ) | |
Direxion Daily Electric and Autonomous Vehicles Bull
2X Shares | | | 6,409,922 | | | | 39,799 | | | | (3,607,381 | ) | | | (3,567,582 | ) | |
Direxion Daily Energy Bull 2X Shares | | | 480,729,796 | | | | 243,063,669 | | | | (34,175,893 | ) | | | 208,887,776 | | |
Direxion Daily Energy Bear 2X Shares | | | 67,593,062 | | | | — | | | | (29,579,945 | ) | | | (29,579,945 | ) | |
Direxion Daily FinTech Bull 2X Shares | | | 5,602,503 | | | | 29,157 | | | | (2,270,221 | ) | | | (2,241,064 | ) | |
Direxion Daily Global Clean Energy Bull 2X Shares | | | 6,844,119 | | | | 11,373 | | | | (2,445,788 | ) | | | (2,434,415 | ) | |
Direxion Daily Gold Miners Index Bull 2X Shares | | | 693,441,747 | | | | 745,334 | | | | (334,492,628 | ) | | | (333,747,294 | ) | |
Direxion Daily Gold Miners Index Bear 2X Shares | | | 108,357,315 | | | | 17,295,461 | | | | (19,680,594 | ) | | | (2,385,133 | ) | |
Direxion Daily Junior Gold Miners Index Bull 2X Shares | | | 575,720,973 | | | | 222,765 | | | | (343,915,730 | ) | | | (343,692,965 | ) | |
Direxion Daily Junior Gold Miners Index Bear 2X Shares | | | 134,565,188 | | | | 10,271,370 | | | | (25,632,403 | ) | | | (15,361,033 | ) | |
Direxion Daily Metal Miners Bull 2X Shares | | | 18,700,482 | | | | 1,437,606 | | | | (7,793,471 | ) | | | (6,355,865 | ) | |
Direxion Daily Oil Services Bull 2X Shares | | | 16,611,456 | | | | 4,310,412 | | | | (2,157,850 | ) | | | 2,152,562 | | |
Direxion Daily Robotics, Artificial Intelligence &
Automation Index Bull 2X Shares | | | 23,259,013 | | | | — | | | | (12,214,586 | ) | | | (12,214,586 | ) | |
Direxion Daily S&P Oil & Gas Exp. & Prod. Bull 2X Shares | | | 803,173,686 | | | | 344,785,097 | | | | (55,703,769 | ) | | | 289,081,328 | | |
Direxion Daily S&P Oil & Gas Exp. & Prod. Bear 2X Shares | | | 168,889,093 | | | | — | | | | (58,608,501 | ) | | | (58,608,501 | ) | |
Direxion Daily Select Large Caps & FANGs Bull 2X Shares | | | 26,898,678 | | | | 1,169,863 | | | | (13,223,521 | ) | | | (12,053,658 | ) | |
Direxion Daily Software Bull 2X Shares | | | 6,304,384 | | | | 29,339 | | | | (2,971,841 | ) | | | (2,942,502 | ) | |
Direxion Daily TIPS Bull 2X Shares | | | 8,929,515 | | | | — | | | | (1,937,341 | ) | | | (1,937,341 | ) | |
Direxion Daily TIPS Bear 2X Shares | | | 8,910,661 | | | | 325,754 | | | | (36,121 | ) | | | 289,633 | | |
Direxion Daily Travel & Vacation Bull 2X Shares | | | 40,787,797 | | | | 1,340,435 | | | | (18,685,533 | ) | | | (17,345,098 | ) | |
Direxion Daily US Infrastructure Bull 2X Shares | | | 2,884,040 | | | | 389,493 | | | | (470,239 | ) | | | (80,746 | ) | |
The difference between the book cost of investments and the tax cost of investments is primarily attributable to tax deferral of losses on wash sales.
On the Statements of Assets and Liabilities, the following adjustments were made for permanent tax differences between accounting for total distributable earnings and capital stock under GAAP and tax reporting:
Funds | | Total Distributable
Earnings (Loss) | | Capital Stock | |
Direxion Daily CSI 300 China A Share Bear 1X Shares | | $ | 612,950 | | | $ | (612,950 | ) | |
Direxion Daily S&P 500® Bear 1X Shares | | | — | | | | — | | |
Direxion Daily AAPL Bear 1X Shares | | | (3,389 | ) | | | 3,389 | | |
Direxion Daily AMZN Bear 1X Shares | | | 213 | | | | (213 | ) | |
Direxion Daily GOOGL Bear 1X Shares | | | 213 | | | | (213 | ) | |
Direxion Daily MSFT Bear 1X Shares | | | 213 | | | | (213 | ) | |
Direxion Daily TSLA Bear 1X Shares | | | (302,330 | ) | | | 302,330 | | |
Direxion Daily AAPL Bull 1.5X Shares | | | (3,816 | ) | | | 3,816 | | |
Direxion Daily AMZN Bull 1.5X Shares | | | 213 | | | | (213 | ) | |
Direxion Daily GOOGL Bull 1.5X Shares | | | 213 | | | | (213 | ) | |
Direxion Daily MSFT Bull 1.5X Shares | | | 213 | | | | (213 | ) | |
Direxion Daily TSLA Bull 1.5X Shares | | | (118,221 | ) | | | 118,221 | | |
Direxion Daily CSI 300 China A Share Bull 2X Shares | | | 2,533,672 | | | | (2,533,672 | ) | |
Direxion Daily CSI China Internet Index Bull 2X Shares | | | 124,161,720 | | | | (124,161,720 | ) | |
Direxion Daily S&P 500® Bull 2X Shares | | | (908,373 | ) | | | 908,373 | | |
Direxion Daily S&P 500® Equal Weight Bull 2X Shares | | | 1,112 | | | | (1,112 | ) | |
Direxion Daily MSCI Brazil Bull 2X Shares | | | 10,061,313 | | | | (10,061,313 | ) | |
Direxion Daily MSCI India Bull 2X Shares | | | (4,944,636 | ) | | | 4,944,636 | | |
Direxion Daily Cloud Computing Bull 2X Shares | | | 685,814 | | | | (685,814 | ) | |
DIREXION ANNUAL REPORT
171
Funds | | Total Distributable
Earnings (Loss) | | Capital Stock | |
Direxion Daily Electric and Autonomous Vehicles Bull 2X Shares | | $ | 207,849 | | | $ | (207,849 | ) | |
Direxion Daily Energy Bull 2X Shares | | | (154,186,718 | ) | | | 154,186,718 | | |
Direxion Daily Energy Bear 2X Shares | | | 138,518 | | | | (138,518 | ) | |
Direxion Daily FinTech Bull 2X Shares | | | 5,803 | | | | (5,803 | ) | |
Direxion Daily Global Clean Energy Bull 2X Shares | | | 842,596 | | | | (842,596 | ) | |
Direxion Daily Gold Miners Index Bull 2X Shares | | | 37,498,101 | | | | (37,498,101 | ) | |
Direxion Daily Gold Miners Index Bear 2X Shares | | | 741,977 | | | | (741,977 | ) | |
Direxion Daily Junior Gold Miners Index Bull 2X Shares | | | 19,027,489 | | | | (19,027,489 | ) | |
Direxion Daily Junior Gold Miners Index Bear 2X Shares | | | 589,078 | | | | (589,078 | ) | |
Direxion Daily Metal Miners Bull 2X Shares | | | (2,111,589 | ) | | | 2,111,589 | | |
Direxion Daily Oil Services Bull 2X Shares | | | (978,674 | ) | | | 978,674 | | |
Direxion Daily Robotics, Artificial Intelligence & Automation Index Bull 2X Shares | | | 69,218 | | | | (69,218 | ) | |
Direxion Daily S&P Oil & Gas Exp. & Prod. Bull 2X Shares | | | (370,316,432 | ) | | | 370,316,432 | | |
Direxion Daily S&P Oil & Gas Exp. & Prod. Bear 2X Shares | | | 395,369 | | | | (395,369 | ) | |
Direxion Daily Select Large Caps & FANGs Bull 2X Shares | | | 107,322 | | | | (107,322 | ) | |
Direxion Daily Software Bull 2X Shares | | | 137,593 | | | | (137,593 | ) | |
Direxion Daily TIPS Bull 2X Shares | | | (44,755 | ) | | | 44,755 | | |
Direxion Daily TIPS Bear 2X Shares | | | (540,237 | ) | | | 540,237 | | |
Direxion Daily Travel & Vacation Bull 2X Shares | | | 979,370 | | | | (979,370 | ) | |
Direxion Daily US Infrastructure Bull 2X Shares | | | 255,692 | | | | (255,692 | ) | |
GAAP requires that certain components of net assets relating to permanent differences be reclassified between financial and tax reporting. These reclassifications have no effect on net assets or net asset value per share. For the year ended October 31, 2022, the permanent differences primarily relate to tax treatment of redemptions in-kind, non-deductible offering costs, net operating losses and the utilization of earnings and profits distributed to shareholders on redemption of shares.
In order to meet certain U.S. excise tax distribution requirements, each Fund is required to measure and distribute annually net capital gains realized during a twelve month period ending October 31 and net investment income earned during a twelve month period ending December 31. In connection with this, these Funds are permitted for tax purposes to defer into their next fiscal year qualified late year losses. Qualified late year ordinary losses are generally losses incurred between January 1 and the end of their fiscal year, October 31, 2022.
At October 31, 2022, these Funds deferred, on a tax basis, qualified late year losses of:
| Funds | | Ordinary Late
Year Loss
Deferral | |
Direxion Daily CSI China Internet Index Bull 2X Shares | | $ | 870,301 | | |
Direxion Daily Cloud Computing Bull 2X Shares | | | 42,215 | | |
Direxion Daily Global Clean Energy Bull 2X Shares | | | 5,653 | | |
Direxion Daily Gold Miners Index Bull 2X Shares | | | 1,654,482 | | |
Direxion Daily Gold Miners Index Bear 2X Shares | | | 11,432 | | |
Direxion Daily Junior Gold Miners Index Bull 2X Shares | | | 546,028 | | |
Direxion Daily Robotics, Artificial Intelligence & Automation Index Bull 2X Shares | | | 52,446 | | |
Direxion Daily Travel & Vacation Bull 2X Shares | | | 77,306 | | |
Under current law, each Fund may carry forward net capital losses indefinitely to use to offset capital gains realized in future years and their character is retained as either short-term and/or long-term.
DIREXION ANNUAL REPORT
172
At October 31, 2022, for U.S. Federal income tax purposes, the following Funds had capital loss carryforwards available to offset future capital gains:
Funds | | Utilized in
Current Year | | Unlimited ST | | Unlimited LT | |
Direxion Daily CSI 300 China A Share Bear 1X Shares | | $ | (26,925,905 | ) | | $ | — | | | $ | — | | |
Direxion Daily S&P 500® Bear 1X Shares | | | (18,757,644 | ) | | | 37,721,054 | | | | — | | |
Direxion Daily AAPL Bear 1X Shares | | | — | | | | — | | | | — | | |
Direxion Daily AMZN Bear 1X Shares | | | — | | | | — | | | | — | | |
Direxion Daily GOOGL Bear 1X Shares | | | — | | | | 8 | | | | — | | |
Direxion Daily MSFT Bear 1X Shares | | | — | | | | — | | | | — | | |
Direxion Daily TSLA Bear 1X Shares | | | — | | | | — | | | | — | | |
Direxion Daily AAPL Bull 1.5X Shares | | | — | | | | 36,308 | | | | — | | |
Direxion Daily AMZN Bull 1.5X Shares | | | — | | | | 2,163 | | | | — | | |
Direxion Daily GOOGL Bull 1.5X Shares | | | — | | | | 2,800 | | | | — | | |
Direxion Daily MSFT Bull 1.5X Shares | | | — | | | | 3,581 | | | | — | | |
Direxion Daily TSLA Bull 1.5X Shares | | | — | | | | — | | | | — | | |
Direxion Daily CSI 300 China A Share Bull 2X Shares | | | — | | | | 9,444,885 | | | | 2,085,092 | | |
Direxion Daily CSI China Internet Index Bull 2X Shares | | | — | | | | 192,279,994 | | | | — | | |
Direxion Daily S&P 500® Bull 2X Shares | | | — | | | | 10,488,679 | | | | — | | |
Direxion Daily S&P 500® Equal Weight Bull 2X Shares | | | — | | | | 240,671 | | | | — | | |
Direxion Daily MSCI Brazil Bull 2X Shares | | | (1,383,050 | ) | | | 421,558,341 | | | | 1,116,253 | | |
Direxion Daily MSCI India Bull 2X Shares | | | — | | | | — | | | | — | | |
Direxion Daily Cloud Computing Bull 2X Shares | | | — | | | | 3,807,087 | | | | 542,993 | | |
Direxion Daily Electric and Autonomous Vehicles Bull 2X Shares | | | — | | | | 68,987 | | | | — | | |
Direxion Daily Energy Bull 2X Shares | | | (221,757,766 | ) | | | 28,636,863 | | | | 42,651,859 | | |
Direxion Daily Energy Bear 2X Shares | | | — | | | | 169,207,601 | | | | — | | |
Direxion Daily FinTech Bull 2X Shares | | | — | | | | 747,756 | | | | — | | |
Direxion Daily Global Clean Energy Bull 2X Shares | | | — | | | | 2,236,868 | | | | — | | |
Direxion Daily Gold Miners Index Bull 2X Shares | | | — | | | | 1,196,796,131 | | | | 604,575,511 | | |
Direxion Daily Gold Miners Index Bear 2X Shares | | | (19,521,131 | ) | | | 616,818,792 | | | | — | | |
Direxion Daily Junior Gold Miners Index Bull 2X Shares | | | — | | | | 1,303,597,331 | | | | 103,726,120 | | |
Direxion Daily Junior Gold Miners Index Bear 2X Shares | | | (28,616,502 | ) | | | 182,627,722 | | | | — | | |
Direxion Daily Metal Miners Bull 2X Shares | | | — | | | | — | | | | — | | |
Direxion Daily Oil Services Bull 2X Shares | | | — | | | | 93,793 | | | | — | | |
Direxion Daily Robotics, Artificial Intelligence & Automation Index
Bull 2X Shares | | | — | | | | 11,280,447 | | | | 1,410,918 | | |
Direxion Daily S&P Oil & Gas Exp. & Prod. Bull 2X Shares | | | (251,412,275 | ) | | | — | | | | — | | |
Direxion Daily S&P Oil & Gas Exp. & Prod. Bear 2X Shares | | | — | | | | 188,545,238 | | | | — | | |
Direxion Daily Select Large Caps & FANGs Bull 2X Shares | | | — | | | | 3,369,884 | | | | 345,826 | | |
Direxion Daily Software Bull 2X Shares | | | — | | | | 538,520 | | | | — | | |
Direxion Daily TIPS Bull 2X Shares | | | — | | | | — | | | | — | | |
Direxion Daily TIPS Bear 2X Shares | | | — | | | | — | | | | — | | |
Direxion Daily Travel & Vacation Bull 2X Shares | | | — | | | | 8,238,677 | | | | 375,507 | | |
Direxion Daily US Infrastructure Bull 2X Shares | | | — | | | | — | | | | — | | |
The Funds follow authoritative financial reporting rules regarding recognition and measurement of tax positions taken or expected to be taken on a tax return. Management has reviewed all open tax years and concluded that there is no effect to the Funds' financial positions or results of operations and no tax liability was required to be recorded resulting from unrecognized tax benefits relating to uncertain income tax position taken or expected to be taken on a tax return. The Funds recognize interest and penalties, if any, related to unrecognized tax benefits as income tax expense in the Statements of Operations. During this period, the Funds did not incur any interest or penalties. Open tax years are those years that are open for examination by the relevant income taxing authority. As of October 31, 2022, open U.S. Federal and state income tax years include the tax years ended October 31, 2019 through October 31, 2022. The Funds have no examinations in progress. The Funds are also not aware of any tax positions for which it is reasonably possible that the total amounts of unrecognized tax expense will significantly change in the next twelve months.
DIREXION ANNUAL REPORT
173
4. CREATION AND REDEMPTION TRANSACTIONS AND TRANSACTION FEES
Each Fund issues and redeems shares on a continuous basis at NAV only in large blocks of shares called "Creation Units." The number of shares in a Creation Unit for each respective Fund is as follows:
| Fund | | Number of Shares
per Creation Unit | |
Direxion Daily CSI 300 China A Share Bear 1X Shares | | | 50,000 | shares | |
Direxion Daily S&P 500® Bear 1X Shares | | | 50,000 | shares | |
Direxion Daily AAPL Bear 1X Shares | | | 25,000 | shares | |
Direxion Daily AMZN Bear 1X Shares | | | 25,000 | shares | |
Direxion Daily GOOGL Bear 1X Shares | | | 25,000 | shares | |
Direxion Daily MSFT Bear 1X Shares | | | 25,000 | shares | |
Direxion Daily TSLA Bear 1X Shares | | | 25,000 | shares | |
Direxion Daily AAPL Bull 1.5X Shares | | | 25,000 | shares | |
Direxion Daily AMZN Bull 1.5X Shares | | | 25,000 | shares | |
Direxion Daily GOOGL Bull 1.5X Shares | | | 25,000 | shares | |
Direxion Daily MSFT Bull 1.5X Shares | | | 25,000 | shares | |
Direxion Daily TSLA Bull 1.5X Shares | | | 25,000 | shares | |
Direxion Daily CSI 300 China A Share Bull 2X Shares | | | 50,000 | shares | |
Direxion Daily CSI China Internet Index Bull 2X Shares | | | 50,000 | shares | |
Direxion Daily S&P 500® Bull 2X Shares | | | 50,000 | shares | |
Direxion Daily S&P 500® Equal Weight Bull 2X Shares | | | 50,000 | shares | |
Direxion Daily MSCI Brazil Bull 2X Shares | | | 50,000 | shares | |
Direxion Daily MSCI India Bull 2X Shares | | | 50,000 | shares | |
Direxion Daily Cloud Computing Bull 2X Shares | | | 50,000 | shares | |
Direxion Daily Electric and Autonomous Vehicles Bull 2X Shares | | | 50,000 | shares | |
Direxion Daily Energy Bull 2X Shares | | | 50,000 | shares | |
Direxion Daily Energy Bear 2X Shares | | | 50,000 | shares | |
Direxion Daily FinTech Bull 2X Shares | | | 50,000 | shares | |
Direxion Daily Global Clean Energy Bull 2X Shares | | | 50,000 | shares | |
Direxion Daily Gold Miners Index Bull 2X Shares | | | 50,000 | shares | |
Direxion Daily Gold Miners Index Bear 2X Shares | | | 50,000 | shares | |
Direxion Daily Junior Gold Miners Index Bull 2X Shares | | | 50,000 | shares | |
Direxion Daily Junior Gold Miners Index Bear 2X Shares | | | 50,000 | shares | |
Direxion Daily Metal Miners Bull 2X Shares | | | 50,000 | shares | |
Direxion Daily Oil Services Bull 2X Shares | | | 50,000 | shares | |
Direxion Daily Robotics, Artificial Intelligence & Automation Index Bull 2X Shares | | | 50,000 | shares | |
Direxion Daily S&P Oil & Gas Exp. & Prod. Bull 2X Shares | | | 50,000 | shares | |
Direxion Daily S&P Oil & Gas Exp. & Prod. Bear 2X Shares | | | 50,000 | shares | |
Direxion Daily Select Large Caps & FANGs Bull 2X Shares | | | 50,000 | shares | |
Direxion Daily Software Bull 2X Shares | | | 50,000 | shares | |
Direxion Daily TIPS Bull 2X Shares | | | 50,000 | shares | |
Direxion Daily TIPS Bear 2X Shares | | | 50,000 | shares | |
Direxion Daily Travel & Vacation Bull 2X Shares | | | 50,000 | shares | |
Direxion Daily US Infrastructure Bull 2X Shares | | | 50,000 | shares | |
Creation Units of the Bull Funds are issued and redeemed in cash and/or in-kind for securities included in the relevant underlying index. Creation Units of the Bear Funds are issued and redeemed for cash. Investors such as market makers, large investors and institutions who wish to deal in creation units directly with a Fund must have entered into an authorized participant agreement with the principal underwriter and the transfer agent, or purchase through a dealer that has entered into such an agreement. Transactions in shares for each Fund include both cash and in-kind transactions and are disclosed in detail in the Statements of Changes in Net Assets.
Transaction fees payable to the Trust are imposed to compensate the Trust for the transfer and other transaction costs of a Fund associated with the issuance and redemption of creation units. There is a fixed and a variable component to the total transaction fee. A fixed transaction fee is applicable to each creation or redemption transaction, regardless of the number of creation units purchased or redeemed. In addition, a variable transaction fee equal to a percentage of the value of each creation unit purchased or redeemed is applicable to each creation or redemption transaction. Not all Funds will have a
DIREXION ANNUAL REPORT
174
transaction fee associated with capital share activity for the year. Transaction fees received by each Fund are presented in the Capital Share Transaction section of the Statements of Changes in Net Assets.
5. INVESTMENT TRANSACTIONS
The table below presents each Fund's investment transactions during the period ended October 31, 2022. Purchases represent the aggregate purchases of investments excluding the cost of in-kind purchases, short-term investment purchases, swaps and futures contracts. Sales represent the aggregate sales of investments excluding proceeds from in-kind sales, short-term investments, swaps and futures contracts. Purchases in-kind are the aggregate of all in-kind purchases and sales in-kind are the aggregate of all proceeds from in-kind sales. The transactions for each of these categories are as follows:
Funds | | Purchases | | Sales | | Purchases
In-Kind | | Sales
In-Kind | |
Direxion Daily CSI 300 China A Share Bear 1X Shares | | $ | — | | | $ | — | | | $ | — | | | $ | — | | |
Direxion Daily S&P 500® Bear 1X Shares | | | — | | | | — | | | | — | | | | — | | |
Direxion Daily AAPL Bear 1X Shares4 | | | — | | | | — | | | | — | | | | — | | |
Direxion Daily AMZN Bear 1X Shares6 | | | — | | | | — | | | | — | | | | — | | |
Direxion Daily GOOGL Bear 1X Shares6 | | | — | | | | — | | | | — | | | | — | | |
Direxion Daily MSFT Bear 1X Shares6 | | | — | | | | — | | | | — | | | | — | | |
Direxion Daily TSLA Bear 1X Shares4 | | | — | | | | — | | | | — | | | | — | | |
Direxion Daily AAPL Bull 1.5X Shares4 | | | 854,203 | | | | 76,664 | | | | 909,793 | | | | 213,204 | | |
Direxion Daily AMZN Bull 1.5X Shares6 | | | 504,476 | | | | — | | | | 760,397 | | | | — | | |
Direxion Daily GOOGL Bull 1.5X Shares6 | | | 491,367 | | | | — | | | | 332,053 | | | | — | | |
Direxion Daily MSFT Bull 1.5X Shares6 | | | 707,576 | | | | — | | | | — | | | | — | | |
Direxion Daily TSLA Bull 1.5X Shares4 | | | 3,482,410 | | | | 3,279,621 | | | | 24,082,309 | | | | 2,146,192 | | |
Direxion Daily CSI 300 China A Share Bull 2X Shares | | | 16,703,118 | | | | 32,830,211 | | | | 9,802,501 | | | | 32,409,167 | | |
Direxion Daily CSI China Internet Index Bull 2X Shares | | | 237,506,160 | | | | 607,726,021 | | | | 623,684,639 | | | | 248,186,504 | | |
Direxion Daily S&P 500® Bull 2X Shares | | | 35,683,400 | | | | 36,875,202 | | | | 4,504,581 | | | | 3,235,759 | | |
Direxion Daily S&P 500® Equal Weight Bull 2X Shares2 | | | 4,091,594 | | | | 1,190,998 | | | | — | | | | — | | |
Direxion Daily MSCI Brazil Bull 2X Shares | | | 38,545,301 | | | | 37,878,415 | | | | 112,709,228 | | | | 245,295,213 | | |
Direxion Daily MSCI India Bull 2X Shares | | | 30,263,965 | | | | — | | | | 8,601,122 | | | | 28,951,803 | | |
Direxion Daily Cloud Computing Bull 2X Shares | | | 1,514,018 | | | | 9,239,367 | | | | 8,586,099 | | | | 3,352,793 | | |
Direxion Daily Electric and Autonomous Vehicles Bull
2X Shares5 | | | 4,408,279 | | | | 1,893,142 | | | | 2,442,148 | | | | 814,891 | | |
Direxion Daily Energy Bull 2X Shares | | | 35,335,446 | | | | 476,366,274 | | | | 740,785,626 | | | | 450,560,113 | | |
Direxion Daily Energy Bear 2X Shares | | | — | | | | — | | | | — | | | | — | | |
Direxion Daily FinTech Bull 2X Shares2 | | | 6,352,948 | | | | 2,485,782 | | | | — | | | | — | | |
Direxion Daily Global Clean Energy Bull 2X Shares | | | — | | | | 6,416,175 | | | | 10,265,714 | | | | 3,442,452 | | |
Direxion Daily Gold Miners Index Bull 2X Shares | | | 332,575,750 | | | | 547,815,967 | | | | 443,856,486 | | | | 383,287,899 | | |
Direxion Daily Gold Miners Index Bear 2X Shares | | | — | | | | — | | | | — | | | | — | | |
Direxion Daily Junior Gold Miners Index Bull 2X Shares | | | 197,223,850 | | | | 252,770,089 | | | | 364,187,328 | | | | 350,059,405 | | |
Direxion Daily Junior Gold Miners Index Bear 2X Shares | | | — | | | | — | | | | — | | | | — | | |
Direxion Daily Metal Miners Bull 2X Shares1 | | | 7,827,126 | | | | 7,962,237 | | | | 20,607,761 | | | | 9,918,822 | | |
Direxion Daily Oil Services Bull 2X Shares2 | | | 5,354,919 | | | | 4,745,510 | | | | 15,498,017 | | | | 7,139,931 | | |
Direxion Daily Robotics, Artificial Intelligence &
Automation Index Bull 2X Shares | | | — | | | | 3,861,608 | | | | 757,760 | | | | — | | |
Direxion Daily S&P Oil & Gas Exp. & Prod. Bull 2X Shares | | | 351,937,784 | | | | 238,783,309 | | | | 705,575,323 | | | | 886,344,583 | | |
Direxion Daily S&P Oil & Gas Exp. & Prod. Bear 2X Shares | | | — | | | | — | | | | — | | | | — | | |
Direxion Daily Select Large Caps & FANGs Bull 2X Shares | | | 15,507,567 | | | | 26,609,721 | | | | 28,400,272 | | | | 6,576,780 | | |
Direxion Daily Software Bull 2X Shares1 | | | 4,628,453 | | | | 3,624,993 | | | | 9,301,188 | | | | 6,028,795 | | |
Direxion Daily TIPS Bull 2X Shares3 | | | 5,969,805 | | | | 1,189,411 | | | | 1,240,735 | | | | — | | |
Direxion Daily TIPS Bear 2X Shares3 | | | — | | | | — | | | | — | | | | — | | |
Direxion Daily Travel & Vacation Bull 2X Shares | | | 2,277,270 | | | | 18,076,959 | | | | 69,976,802 | | | | 39,216,655 | | |
Direxion Daily US Infrastructure Bull 2X Shares | | | 4,111,964 | | | | 3,190,215 | | | | — | | | | 3,823,340 | | |
1 Represents the period from December 16, 2021 (commencement of operations) to October 31, 2022.
2 Represents the period from January 20, 2022 (commencement of operations) to October 31, 2022.
3 Represents the period from April 7, 2022 (commencement of operations) to October 31, 2022.
4 Represents the period from August 9, 2022 (commencement of operations) to October 31, 2022.
5 Represents the period from August 11, 2022 (commencement of operations) to October 31, 2022.
6 Represents the period from September 7, 2022 (commencement of operations) to October 31, 2022.
DIREXION ANNUAL REPORT
175
There were no purchases or sales of long-term U.S. Government securities in the Funds during the period ended October 31, 2022.
6. INVESTMENT ADVISORY AND OTHER AGREEMENTS
Under an Investment Advisory Agreement between the Adviser and the Trust, on behalf of each Fund, the Adviser provides a continuous investment program for each Fund's assets in accordance with its investment objectives, policies and limitations, and oversees the day-to-day operations of each Fund, subject to the supervision of the Trustees. Pursuant to the Advisory Agreement, each Fund pays the Adviser investment advisory fees at an annual rate based on its average daily net assets. These rates are as follows:
Direxion Daily CSI 300 China A Share Bear 1X Shares | | | 0.60 | % | |
Direxion Daily S&P 500® Bear 1X Shares | | | 0.35 | % | |
Direxion Daily AAPL Bear 1X Shares | | | 0.75 | % | |
Direxion Daily AMZN Bear 1X Shares | | | 0.75 | % | |
Direxion Daily GOOGL Bear 1X Shares | | | 0.75 | % | |
Direxion Daily MSFT Bear 1X Shares | | | 0.75 | % | |
Direxion Daily TSLA Bear 1X Shares | | | 0.75 | % | |
Direxion Daily AAPL Bull 1.5X Shares | | | 0.75 | % | |
Direxion Daily AMZN Bull 1.5X Shares | | | 0.75 | % | |
Direxion Daily GOOGL Bull 1.5X Shares | | | 0.75 | % | |
Direxion Daily MSFT Bull 1.5X Shares | | | 0.75 | % | |
Direxion Daily TSLA Bull 1.5X Shares | | | 0.75 | % | |
Direxion Daily CSI 300 China A Share Bull 2X Shares | | | 0.75 | % | |
Direxion Daily CSI China Internet Index Bull 2X Shares | | | 0.75 | % | |
Direxion Daily S&P 500® Bull 2X Shares | | | 0.50 | % | |
Direxion Daily S&P 500® Equal Weight Bull 2X Shares | | | 0.75 | % | |
Direxion Daily MSCI Brazil Bull 2X Shares | | | 0.75 | % | |
Direxion Daily MSCI India Bull 2X Shares | | | 0.75 | % | |
Direxion Daily Cloud Computing Bull 2X Shares | | | 0.75 | % | |
Direxion Daily Electric and Autonomous Vehicles Bull 2X Shares | | | 0.75 | % | |
Direxion Daily Energy Bull 2X Shares | | | 0.75 | % | |
Direxion Daily Energy Bear 2X Shares | | | 0.75 | % | |
Direxion Daily FinTech Bull 2X Shares | | | 0.75 | % | |
Direxion Daily Global Clean Energy Bull 2X Shares | | | 0.75 | % | |
Direxion Daily Gold Miners Index Bull 2X Shares | | | 0.75 | % | |
Direxion Daily Gold Miners Index Bear 2X Shares | | | 0.75 | % | |
Direxion Daily Junior Gold Miners Index Bull 2X Shares | | | 0.75 | % | |
Direxion Daily Junior Gold Miners Index Bear 2X Shares | | | 0.75 | % | |
Direxion Daily Metal Miners Bull 2X Shares | | | 0.75 | % | |
Direxion Daily Oil Services Bull 2X Shares | | | 0.75 | % | |
Direxion Daily Robotics, Artificial Intelligence & Automation Index Bull 2X Shares | | | 0.75 | % | |
Direxion Daily S&P Oil & Gas Exp. & Prod. Bull 2X Shares | | | 0.75 | % | |
Direxion Daily S&P Oil & Gas Exp. & Prod. Bear 2X Shares | | | 0.75 | % | |
Direxion Daily Select Large Caps & FANGs Bull 2X Shares | | | 0.75 | % | |
Direxion Daily Software Bull 2X Shares | | | 0.75 | % | |
Direxion Daily TIPS Bull 2X Shares | | | 0.75 | % | |
Direxion Daily TIPS Bear 2X Shares | | | 0.75 | % | |
Direxion Daily Travel & Vacation Bull 2X Shares | | | 0.75 | % | |
Direxion Daily US Infrastructure Bull 2X Shares | | | 0.75 | % | |
Additionally, the Trust has entered into a Management Services Agreement with the Adviser. Under the Management Services Agreement, the Trust pays the Adviser management service fees of 0.026% on the first $10,000,000,000 of the Trust's daily net assets and 0.024% on assets in excess of $10,000,000,000. This fee compensates the Adviser for performing certain management, administration and compliance functions related to the Trust.
Each Fund is responsible for its own operating expenses. The Adviser has contractually agreed to waive its fees and/or reimburse the Funds' operating expenses to the extent that they exceed the following rates multiplied by the Fund's
DIREXION ANNUAL REPORT
176
respective average daily net assets at least until September 1, 2024. Any expense waiver is subject to recoupment by the Adviser, as applicable, within the following three years if overall expenses fall below these percentage limitations.
Direxion Daily CSI 300 China A Share Bear 1X Shares | | | 0.80 | % | |
Direxion Daily S&P 500® Bear 1X Shares | | | 0.45 | % | |
Direxion Daily AAPL Bear 1X Shares | | | 0.95 | % | |
Direxion Daily AMZN Bear 1X Shares | | | 0.95 | % | |
Direxion Daily GOOGL Bear 1X Shares | | | 0.95 | % | |
Direxion Daily MSFT Bear 1X Shares | | | 0.95 | % | |
Direxion Daily TSLA Bear 1X Shares | | | 0.95 | % | |
Direxion Daily AAPL Bull 1.5X Shares | | | 0.95 | % | |
Direxion Daily AMZN Bull 1.5X Shares | | | 0.95 | % | |
Direxion Daily GOOGL Bull 1.5X Shares | | | 0.95 | % | |
Direxion Daily MSFT Bull 1.5X Shares | | | 0.95 | % | |
Direxion Daily TSLA Bull 1.5X Shares | | | 0.95 | % | |
Direxion Daily CSI 300 China A Share Bull 2X Shares | | | 0.95 | % | |
Direxion Daily CSI China Internet Index Bull 2X Shares | | | 0.95 | % | |
Direxion Daily S&P 500® Bull 2X Shares | | | 0.60 | % | |
Direxion Daily S&P 500® Equal Weight Bull 2X Shares | | | 0.95 | % | |
Direxion Daily MSCI Brazil Bull 2X Shares | | | 0.95 | % | |
Direxion Daily MSCI India Bull 2X Shares | | | 0.95 | % | |
Direxion Daily Cloud Computing Bull 2X Shares | | | 0.95 | % | |
Direxion Daily Electric and Autonomous Vehicles Bull 2X Shares | | | 0.95 | % | |
Direxion Daily Energy Bull 2X Shares | | | 0.95 | % | |
Direxion Daily Energy Bear 2X Shares | | | 0.95 | % | |
Direxion Daily FinTech Bull 2X Shares | | | 0.95 | % | |
Direxion Daily Global Clean Energy Bull 2X Shares | | | 0.95 | % | |
Direxion Daily Gold Miners Index Bull 2X Shares | | | 0.95 | % | |
Direxion Daily Gold Miners Index Bear 2X Shares | | | 0.95 | % | |
Direxion Daily Junior Gold Miners Index Bull 2X Shares | | | 0.95 | % | |
Direxion Daily Junior Gold Miners Index Bear 2X Shares | | | 0.95 | % | |
Direxion Daily Metal Miners Bull 2X Shares | | | 0.95 | % | |
Direxion Daily Oil Services Bull 2X Shares | | | 0.95 | % | |
Direxion Daily Robotics, Artificial Intelligence & Automation Index Bull 2X Shares | | | 0.95 | % | |
Direxion Daily S&P Oil & Gas Exp. & Prod. Bull 2X Shares | | | 0.95 | % | |
Direxion Daily S&P Oil & Gas Exp. & Prod. Bear 2X Shares | | | 0.95 | % | |
Direxion Daily Select Large Caps & FANGs Bull 2X Shares | | | 0.95 | % | |
Direxion Daily Software Bull 2X Shares | | | 0.95 | % | |
Direxion Daily TIPS Bull 2X Shares | | | 0.95 | % | |
Direxion Daily TIPS Bear 2X Shares | | | 0.95 | % | |
Direxion Daily Travel & Vacation Bull 2X Shares | | | 0.95 | % | |
Direxion Daily US Infrastructure Bull 2X Shares | | | 0.95 | % | |
The table below presents amounts that the Adviser recouped, reimbursed and the amounts available for potential recoupment by the Adviser.
| |
| |
| | Potential Recoupment
Amounts Expiring: | | Total Potential | |
| | | Expenses
Recouped | | Expenses
Reimbursed | | October 31,
2023 | | October 31,
2024 | | October 31,
2025 | | Recoupment
Amount | |
Direxion Daily CSI 300 China A
Share Bear 1X Shares | | $ | 118 | | | $ | 118 | | | $ | — | | | $ | — | | | $ | — | | | $ | — | | |
Direxion Daily S&P 500® Bear
1X Shares | | | 2,110 | | | | 205,822 | | | | 130,155 | | | | 69,822 | | | | 205,822 | | | | 405,799 | | |
Direxion Daily AAPL Bear 1X Shares | | | — | | | | 19,155 | | | | — | | | | — | | | | 19,155 | | | | 19,155 | | |
Direxion Daily AMZN Bear 1X Shares | | | — | | | | 19,009 | | | | — | | | | — | | | | 19,009 | | | | 19,009 | | |
Direxion Daily GOOGL Bear 1X Shares | | | — | | | | 19,064 | | | | — | | | | — | | | | 19,064 | | | | 19,064 | | |
Direxion Daily MSFT Bear 1X Shares | | | 849 | | | | 19,877 | | | | — | | | | — | | | | 19,028 | | | | 19,028 | | |
Direxion Daily TSLA Bear 1X Shares | | | — | | | | 20,330 | | | | — | | | | — | | | | 20,330 | | | | 20,330 | | |
Direxion Daily AAPL Bull 1.5X Shares | | | — | | | | 19,339 | | | | — | | | | — | | | | 19,339 | | | | 19,339 | | |
Direxion Daily AMZN Bull 1.5X Shares | | | — | | | | 19,268 | | | | — | | | | — | | | | 19,268 | | | | 19,268 | | |
Direxion Daily GOOGL Bull 1.5X Shares | | | — | | | | 19,205 | | | | — | | | | — | | | | 19,205 | | | | 19,205 | | |
Direxion Daily MSFT Bull 1.5X Shares | | | — | | | | 19,082 | | | | — | | | | — | | | | 19,082 | | | | 19,082 | | |
DIREXION ANNUAL REPORT
177
| |
| |
| | Potential Recoupment
Amounts Expiring: | | Total Potential | |
| | | Expenses
Recouped | | Expenses
Reimbursed | | October 31,
2023 | | October 31,
2024 | | October 31,
2025 | | Recoupment
Amount | |
Direxion Daily TSLA Bull 1.5X Shares | | $ | 5,334 | | | $ | 25,219 | | | $ | — | | | $ | — | | | $ | 19,885 | | | $ | 19,885 | | |
Direxion Daily CSI 300 China A Share
Bull 2X Shares | | | — | | | | — | | | | — | | | | — | | | | — | | | | — | | |
Direxion Daily CSI China Internet Index
Bull 2X Shares | | | 2,361 | | | | 1,911 | | | | — | | | | — | | | | — | | | | — | | |
Direxion Daily S&P 500® Bull 2X Shares | | | — | | | | 50,190 | | | | 41,789 | | | | 35,971 | | | | 50,190 | | | | 127,950 | | |
Direxion Daily S&P 500® Equal Weight
Bull 2X Shares | | | — | | | | 32,302 | | | | — | | | | — | | | | 32,302 | | | | 32,302 | | |
Direxion Daily MSCI Brazil Bull 2X Shares | | | 37 | | | | 37 | | | | — | | | | — | | | | — | | | | — | | |
Direxion Daily MSCI India Bull 2X Shares | | | — | | | | — | | | | — | | | | — | | | | — | | | | — | | |
Direxion Daily Cloud Computing Bull
2X Shares | | | — | | | | 33,849 | | | | — | | | | 17,799 | | | | 33,849 | | | | 51,648 | | |
Direxion Daily Electric and Autonomous
Vehicles Bull 2X Shares | | | 775 | | | | 35,013 | | | | — | | | | — | | | | 34,238 | | | | 34,238 | | |
Direxion Daily Energy Bull 2X Shares | | | 1,215 | | | | — | | | | — | | | | — | | | | — | | | | — | | |
Direxion Daily Energy Bear 2X Shares | | | 887 | | | | 13,901 | | | | 28,222 | | | | 11,909 | | | | 13,901 | | | | 54,032 | | |
Direxion Daily FinTech Bull 2X Shares | | | — | | | | 44,393 | | | | — | | | | — | | | | 44,393 | | | | 44,393 | | |
Direxion Daily Global Clean Energy Bull
2X Shares | | | — | | | | 40,638 | | | | — | | | | 19,710 | | | | 40,638 | | | | 60,348 | | |
Direxion Daily Gold Miners Index Bull
2X Shares | | | 7,397 | | | | — | | | | — | | | | — | | | | — | | | | — | | |
Direxion Daily Gold Miners Index Bear
2X Shares | | | 20,840 | | | | 11,797 | | | | — | | | | — | | | | — | | | | — | | |
Direxion Daily Junior Gold Miners Index
Bull 2X Shares | | | — | | | | — | | | | — | | | | — | | | | — | | | | — | | |
Direxion Daily Junior Gold Miners Index
Bear 2X Shares | | | 9,992 | | | | 9,992 | | | | — | | | | — | | | | — | | | | — | | |
Direxion Daily Metal Miners Bull
2X Shares | | | — | | | | 26,603 | | | | — | | | | — | | | | 26,603 | | | | 26,603 | | |
Direxion Daily Oil Services Bull
2X Shares | | | — | | | | 21,454 | | | | — | | | | — | | | | 21,454 | | | | 21,454 | | |
Direxion Daily Robotics, Artificial
Intelligence & Automation Index
Bull 2X Shares | | | 2,370 | | | | 14,498 | | | | 24,009 | | | | 248 | | | | 14,498 | | | | 38,755 | | |
Direxion Daily S&P Oil & Gas Exp. &
Prod. Bull 2X Shares | | | 2,261 | | | | — | | | | — | | | | — | | | | — | | | | — | | |
Direxion Daily S&P Oil & Gas Exp. &
Prod. Bear 2X Shares | | | 4,842 | | | | 9,715 | | | | 33,028 | | | | 2,524 | | | | 9,715 | | | | 45,267 | | |
Direxion Daily Select Large Caps &
FANGs Bull 2X Shares | | | 32 | | | | 22,305 | | | | — | | | | 15,183 | | | | 22,305 | | | | 37,488 | | |
Direxion Daily Software Bull 2X Shares | | | — | | | | 43,705 | | | | — | | | | — | | | | 43,705 | | | | 43,705 | | |
Direxion Daily TIPS Bull 2X Shares | | | — | | | | 24,357 | | | | — | | | | — | | | | 24,357 | | | | 24,357 | | |
Direxion Daily TIPS Bear 2X Shares | | | 430 | | | | 24,619 | | | | — | | | | — | | | | 24,189 | | | | 24,189 | | |
Direxion Daily Travel & Vacation Bull
2X Shares | | | 400 | | | | 12,058 | | | | — | | | | 13,991 | | | | 12,058 | | | | 26,049 | | |
Direxion Daily US Infrastructure Bull
2X Shares | | | — | | | | 39,954 | | | | — | | | | 14,240 | | | | 39,954 | | | | 54,194 | | |
The net amounts receivable (payable) arising from the Investment Advisory Agreement, Management Services Agreement and waiver of any expenses as of October 31, 2022 is presented on the Statement of Assets and Liabilities as Due from (to) Adviser, net.
The Board has adopted a Distribution and Service Plan (the "Plan") pursuant to Rule 12b-1 under the Investment Company Act of 1940. In accordance with the Plan, each Fund is authorized to charge an amount up to 0.25% of its average daily net assets each year for certain distribution-related activities and shareholder services. No 12b-1 fees were charged by any Fund.
DIREXION ANNUAL REPORT
178
7. FAIR VALUE MEASUREMENTS
The Funds follow authoritative fair valuation accounting standards, which establish an authoritative definition of fair value and set out a hierarchy for measuring fair value. These standards require additional disclosures about the various inputs and valuation techniques used to develop the measurements of fair value and a discussion of changes in valuation techniques and related inputs during the period. These inputs are summarized in the three broad levels below:
Level 1 – Quoted prices in active markets for identical securities
Level 2 – Evaluated price based on other significant observable inputs (including quoted prices for similar securities in active markets, quoted prices for identical or similar securities in inactive markets, interest rates, prepayment speeds, credit risk, etc.)
Level 3 – Significant unobservable inputs (including the Fund's own assumptions in determining the fair value of investments)
The inputs or methodology used for valuing securities are not necessarily an indication of the risk associated with investing in those securities.
The following is a summary of the inputs used to value the Funds' investments at October 31, 2022:
| | | Asset Class | | Liability Class | |
| | | Level 1 | | Level 2 | | Level 2 | |
Funds | | Investment
Companies | | Common
Stocks | | Short Term
Investments | | Total Return
Swap
Contracts* | | Total Return
Swap
Contracts* | |
Direxion Daily CSI 300
China A Share Bear
1X Shares | | $ | — | | | $ | — | | | $ | 28,326,061 | | | $ | 8,576,095 | | | $ | — | | |
Direxion Daily S&P 500® Bear
1X Shares | | | — | | | | — | | | | 662,709,628 | | | | — | | | | (36,861,301 | ) | |
Direxion Daily AAPL Bear
1X Shares | | | — | | | | — | | | | 10,600,469 | | | | 384,927 | | | | — | | |
Direxion Daily AMZN Bear
1X Shares | | | — | | | | — | | | | 3,347,464 | | | | 473,443 | | | | — | | |
Direxion Daily GOOGL Bear
1X Shares | | | — | | | | — | | | | 4,001,195 | | | | 362,792 | | | | — | | |
Direxion Daily MSFT Bear
1X Shares | | | — | | | | — | | | | 3,964,811 | | | | 255,659 | | | | — | | |
Direxion Daily TSLA Bear
1X Shares | | | — | | | | — | | | | 10,996,798 | | | | 1,192,009 | | | | — | | |
Direxion Daily AAPL Bull
1.5X Shares | | | — | | | | 1,397,847 | | | | 5,301,223 | | | | 139,026 | | | | (250,693 | ) | |
Direxion Daily AMZN Bull
1.5X Shares | | | — | | | | 1,151,631 | | | | 4,884,454 | | | | — | | | | (857,265 | ) | |
Direxion Daily GOOGL Bull
1.5X Shares | | | — | | | | 756,836 | | | | 4,390,409 | | | | — | | | | (539,236 | ) | |
Direxion Daily MSFT Bull
1.5X Shares | | | — | | | | 655,535 | | | | 2,876,886 | | | | — | | | | (299,906 | ) | |
Direxion Daily TSLA Bull
1.5X Shares | | | — | | | | 18,604,353 | | | | 97,463,875 | | | | — | | | | (18,019,534 | ) | |
Direxion Daily CSI 300 China A
Share Bull 2X Shares | | | 2,332,992 | | | | — | | | | 54,631,595 | | | | — | | | | (17,149,982 | ) | |
Direxion Daily CSI China Internet
Index Bull 2X Shares | | | 75,431,482 | | | | — | | | | 171,537,604 | | | | — | | | | (84,623,914 | ) | |
Direxion Daily S&P 500® Bull
2X Shares | | | 47,860,266 | | | | — | | | | 3,389,788 | | | | 2,508,438 | | | | — | | |
Direxion Daily S&P 500® Equal
Weight Bull 2X Shares | | | 2,498,124 | | | | — | | | | 2,423,886 | | | | — | | | | (5,734 | ) | |
Direxion Daily MSCI Brazil Bull
2X Shares | | | 38,054,212 | | | | — | | | | 94,921,541 | | | | 15,459,639 | | | | — | | |
DIREXION ANNUAL REPORT
179
| | | Asset Class | | Liability Class | |
| | | Level 1 | | Level 2 | | Level 2 | |
Funds | | Investment
Companies | | Common
Stocks | | Short Term
Investments | | Total Return
Swap
Contracts* | | Total Return
Swap
Contracts* | |
Direxion Daily MSCI India Bull
2X Shares | | $ | 21,712,026 | | | $ | — | | | $ | 47,376,675 | | | $ | 1,314,208 | | | $ | — | | |
Direxion Daily Cloud Computing
Bull 2X Shares | | | — | | | | 6,347,121 | | | | 1,487,885 | | | | — | | | | (56,208 | ) | |
Direxion Daily Electric and
Autonomous Vehicles Bull
2X Shares | | | — | | | | 2,601,619 | | | | 278,073 | | | | — | | | | (37,352 | ) | |
Direxion Daily Energy Bull
2X Shares | | | — | | | | 428,650,933 | | | | 135,737,227 | | | | 125,229,411 | | | | — | | |
Direxion Daily Energy Bear
2X Shares | | | — | | | | — | | | | 48,842,907 | | | | — | | | | (10,829,791 | ) | |
Direxion Daily FinTech Bull
2X Shares | | | — | | | | 2,608,322 | | | | 898,846 | | | | — | | | | (145,729 | ) | |
Direxion Daily Global Clean
Energy Bull 2X Shares | | | 2,960,460 | | | | — | | | | 1,613,580 | | | | 11,373 | | | | (175,709 | ) | |
Direxion Daily Gold Miners Index
Bull 2X Shares | | | 186,918,866 | | | | — | | | | 240,240,370 | | | | 81,711 | | | | (67,546,493 | ) | |
Direxion Daily Gold Miners Index
Bear 2X Shares | | | — | | | | — | | | | 90,675,497 | | | | 17,295,461 | | | | (1,998,775 | ) | |
Direxion Daily Junior Gold Miners
Index Bull 2X Shares | | | 90,029,457 | | | | — | | | | 175,247,316 | | | | — | | | | (33,248,764 | ) | |
Direxion Daily Junior Gold Miners
Index Bear 2X Shares | | | — | | | | — | | | | 110,441,765 | | | | 10,271,370 | | | | (1,508,980 | ) | |
Direxion Daily Metal Miners
Bull 2X Shares | | | — | | | | 8,925,160 | | | | 2,709,685 | | | | 740,287 | | | | — | | |
Direxion Daily Oil Services
Bull 2X Shares | | | — | | | | 10,430,178 | | | | 5,461,092 | | | | 2,872,748 | | | | — | | |
Direxion Daily Robotics, Artificial
Intelligence & Automation
Index Bull 2X Shares | | | 5,662,469 | | | | — | | | | 7,628,893 | | | | — | | | | (2,246,935 | ) | |
Direxion Daily S&P Oil & Gas
Exp. & Prod. Bull 2X Shares | | | — | | | | 412,285,302 | | | | 387,441,088 | | | | 292,528,624 | | | | — | | |
Direxion Daily S&P Oil & Gas
Exp. & Prod. Bear 2X Shares | | | — | | | | — | | | | 133,046,113 | | | | — | | | | (22,765,521 | ) | |
Direxion Daily Select Large
Caps & FANGs Bull 2X Shares | | | — | | | | 10,172,044 | | | | 4,617,811 | | | | 111,515 | | | | (56,349 | ) | |
Direxion Daily Software
Bull 2X Shares | | | — | | | | 2,768,508 | | | | 746,570 | | | | — | | | | (153,196 | ) | |
Direxion Daily TIPS Bull 2X Shares | | | 5,218,749 | | | | — | | | | 2,185,936 | | | | — | | | | (412,511 | ) | |
Direxion Daily TIPS Bear 2X Shares | | | — | | | | — | | | | 8,874,540 | | | | 325,754 | | | | — | | |
Direxion Daily Travel & Vacation
Bull 2X Shares | | | — | | | | 16,683,841 | | | | 5,549,970 | | | | 1,220,781 | | | | (11,893 | ) | |
Direxion Daily US Infrastructure
Bull 2X Shares | | | — | | | | 1,412,714 | | | | 1,127,031 | | | | 263,549 | | | | — | | |
For further detail on each asset class, see each Fund's Schedule of Investments.
* Total return swap contracts are valued at the unrealized appreciation/(depreciation).
The Funds also follow authoritative accounting standards, which require additional disclosure regarding fair value measurements. Specifically, these standards require reporting entities to disclose a) the input and valuation techniques used to measure fair value for both recurring and nonrecurring fair value measurements, for Level 2 or Level 3 positions, and b) purchases and sales on a gross basis in the Level 3 rollforward rather than as one net number. Additionally, reporting entities are required to disclose quantitative information about unobservable inputs used in the fair value measurements categorized within Level 3 of the fair value hierarchy.
There were no Level 3 securities held by the Funds during the period ended October 31, 2022.
DIREXION ANNUAL REPORT
180
8. VALUATION OF DERIVATIVE INSTRUMENTS
The Funds follow authoritative standards of accounting for derivative instruments, which establish disclosure requirements for derivative instruments. These standards improve financial reporting for derivative instruments by requiring enhanced disclosures that enable investors to understand how and why a fund uses derivative instruments, how derivative instruments are accounted for and how derivative instruments affect a fund's financial position and results of operations.
Certain Funds use derivative instruments as part of their principal investment strategy to achieve their investment objective. For additional discussion on the risks associated with derivative instruments refer to Note 2. As of October 31, 2022, the Funds were invested in swap contracts. At October 31, 2022, the fair values of derivative instruments, by primary risk, were as follows:
Swap Contracts | | Asset Derivatives1 | |
Fund | | Equity Risk | | Interest Rate Risk | | Total | |
Direxion Daily CSI 300 China A Share Bear 1X Shares | | $ | 8,576,095 | | | $ | — | | | $ | 8,576,095 | | |
Direxion Daily AAPL Bear 1X Shares | | | 384,927 | | | | — | | | | 384,927 | | |
Direxion Daily AMZN Bear 1X Shares | | | 473,443 | | | | — | | | | 473,443 | | |
Direxion Daily GOOGL Bear 1X Shares | | | 362,792 | | | | — | | | | 362,792 | | |
Direxion Daily MSFT Bear 1X Shares | | | 255,659 | | | | — | | | | 255,659 | | |
Direxion Daily TSLA Bear 1X Shares | | | 1,192,009 | | | | — | | | | 1,192,009 | | |
Direxion Daily AAPL Bull 1.5X Shares | | | 139,026 | | | | — | | | | 139,026 | | |
Direxion Daily S&P 500® Bull 2X Shares | | | 2,508,438 | | | | — | | | | 2,508,438 | | |
Direxion Daily MSCI Brazil Bull 2X Shares | | | 15,459,639 | | | | — | | | | 15,459,639 | | |
Direxion Daily MSCI India Bull 2X Shares | | | 1,314,208 | | | | — | | | | 1,314,208 | | |
Direxion Daily Energy Bull 2X Shares | | | 125,229,411 | | | | — | | | | 125,229,411 | | |
Direxion Daily Global Clean Energy Bull 2X Shares | | | 11,373 | | | | — | | | | 11,373 | | |
Direxion Daily Gold Miners Index Bull 2X Shares | | | 81,711 | | | | — | | | | 81,711 | | |
Direxion Daily Gold Miners Index Bear 2X Shares | | | 17,295,461 | | | | — | | | | 17,295,461 | | |
Direxion Daily Junior Gold Miners Index Bear 2X Shares | | | 10,271,370 | | | | — | | | | 10,271,370 | | |
Direxion Daily Metal Miners Bull 2X Shares | | | 740,287 | | | | — | | | | 740,287 | | |
Direxion Daily Oil Services Bull 2X Shares | | | 2,872,748 | | | | — | | | | 2,872,748 | | |
Direxion Daily S&P Oil & Gas Exp. & Prod. Bull 2X Shares | | | 292,528,624 | | | | — | | | | 292,528,624 | | |
Direxion Daily Select Large Caps & FANGs Bull 2X Shares | | | 111,515 | | | | — | | | | 111,515 | | |
Direxion Daily TIPS Bear 2X Shares | | | — | | | | 325,754 | | | | 325,754 | | |
Direxion Daily Travel & Vacation Bull 2X Shares | | | 1,220,781 | | | | — | | | | 1,220,781 | | |
Direxion Daily US Infrastructure Bull 2X Shares | | | 263,549 | | | | — | | | | 263,549 | | |
Swap Contracts | | Liability Derivatives2 | |
Fund | | Equity Risk | | Interest Rate Risk | | Total | |
Direxion Daily S&P 500® Bear 1X Shares | | $ | 36,861,301 | | | $ | — | | | $ | 36,861,301 | | |
Direxion Daily AAPL Bull 1.5X Shares | | | 250,693 | | | | — | | | | 250,693 | | |
Direxion Daily AMZN Bull 1.5X Shares | | | 857,265 | | | | — | | | | 857,265 | | |
Direxion Daily GOOGL Bull 1.5X Shares | | | 539,236 | | | | — | | | | 539,236 | | |
Direxion Daily MSFT Bull 1.5X Shares | | | 299,906 | | | | — | | | | 299,906 | | |
Direxion Daily TSLA Bull 1.5X Shares | | | 18,019,534 | | | | — | | | | 18,019,534 | | |
Direxion Daily CSI 300 China A Share Bull 2X Shares | | | 17,149,982 | | | | — | | | | 17,149,982 | | |
Direxion Daily CSI China Internet Index Bull 2X Shares | | | 84,623,914 | | | | — | | | | 84,623,914 | | |
Direxion Daily S&P 500® Equal Weight Bull 2X Shares | | | 5,734 | | | | — | | | | 5,734 | | |
Direxion Daily Cloud Computing Bull 2X Shares | | | 56,208 | | | | — | | | | 56,208 | | |
Direxion Daily Electric and Autonomous Vehicles Bull 2X Shares | | | 37,352 | | | | — | | | | 37,352 | | |
Direxion Daily Energy Bear 2X Shares | | | 10,829,791 | | | | — | | | | 10,829,791 | | |
Direxion Daily FinTech Bull 2X Shares | | | 145,729 | | | | — | | | | 145,729 | | |
Direxion Daily Global Clean Energy Bull 2X Shares | | | 175,709 | | | | — | | | | 175,709 | | |
Direxion Daily Gold Miners Index Bull 2X Shares | | | 67,546,493 | | | | — | | | | 67,546,493 | | |
Direxion Daily Gold Miners Index Bear 2X Shares | | | 1,998,775 | | | | — | | | | 1,998,775 | | |
Direxion Daily Junior Gold Miners Index Bull 2X Shares | | | 33,248,764 | | | | — | | | | 33,248,764 | | |
Direxion Daily Junior Gold Miners Index Bear 2X Shares | | | 1,508,980 | | | | — | | | | 1,508,980 | | |
Direxion Daily Robotics, Artificial Intelligence & Automation Index
Bull 2X Shares | | | 2,246,935 | | | | — | | | | 2,246,935 | | |
Direxion Daily S&P Oil & Gas Exp. & Prod. Bear 2X Shares | | | 22,765,521 | | | | — | | | | 22,765,521 | | |
Direxion Daily Select Large Caps & FANGs Bull 2X Shares | | | 56,349 | | | | — | | | | 56,349 | | |
Direxion Daily Software Bull 2X Shares | | | 153,196 | | | | — | | | | 153,196 | | |
DIREXION ANNUAL REPORT
181
Swap Contracts | | Liability Derivatives2 | |
Fund | | Equity Risk | | Interest Rate Risk | | Total | |
Direxion Daily TIPS Bull 2X Shares | | $ | — | | | $ | 412,511 | | | $ | 412,511 | | |
Direxion Daily Travel & Vacation Bull 2X Shares | | | 11,893 | | | | — | | | | 11,893 | | |
1 Statements of Assets and Liabilities location: Unrealized appreciation on swap contracts.
2 Statements of Assets and Liabilities location: Unrealized depreciation on swap contracts.
Transactions in derivative instruments during the period ended October 31, 2022, by primary risk, were as follows:
| | | | | Net Realized Gain (Loss)1 | | Net Unrealized
Appreciation
(Depreciation)2 | |
Fund | | | | Equity Risk | | Interest
Rate Risk | | Equity Risk | | Interest
Rate Risk | |
Direxion Daily CSI 300 China A Share Bear
1X Shares | | Swap Contracts | | $ | 26,345,811 | | | $ | — | | | $ | 13,783,625 | | | $ | — | | |
Direxion Daily S&P 500® Bear 1X Shares | | Swap Contracts | | | 51,953,665 | | | | — | | | | (27,471,031 | ) | | | — | | |
Direxion Daily AAPL Bear 1X Shares | | Swap Contracts | | | (315,323 | ) | | | — | | | | 384,927 | | | | — | | |
Direxion Daily AMZN Bear 1X Shares | | Swap Contracts | | | 132,589 | | | | — | | | | 473,443 | | | | — | | |
Direxion Daily GOOGL Bear 1X Shares | | Swap Contracts | | | (49,876 | ) | | | — | | | | 362,792 | | | | — | | |
Direxion Daily MSFT Bear 1X Shares | | Swap Contracts | | | (74,486 | ) | | | — | | | | 255,659 | | | | — | | |
Direxion Daily TSLA Bear 1X Shares | | Swap Contracts | | | 1,099,836 | | | | — | | | | 1,192,009 | | | | — | | |
Direxion Daily AAPL Bull 1.5X Shares | | Swap Contracts | | | (751,463 | ) | | | — | | | | (111,668 | ) | | | — | | |
Direxion Daily AMZN Bull 1.5X Shares | | Swap Contracts | | | (89,773 | ) | | | — | | | | (857,265 | ) | | | — | | |
Direxion Daily GOOGL Bull 1.5X Shares | | Swap Contracts | | | (74,204 | ) | | | — | | | | (539,236 | ) | | | — | | |
Direxion Daily MSFT Bull 1.5X Shares | | Swap Contracts | | | (74,937 | ) | | | — | | | | (299,906 | ) | | | — | | |
Direxion Daily TSLA Bull 1.5X Shares | | Swap Contracts | | | (1,654,227 | ) | | | — | | | | (18,019,534 | ) | | | — | | |
Direxion Daily CSI 300 China A Share Bull
2X Shares | | Swap Contracts | | | (25,303,339 | ) | | | — | | | | (24,320,521 | ) | | | — | | |
Direxion Daily CSI China Internet Index Bull
2X Shares | | Swap Contracts | | | (352,083,934 | ) | | | — | | | | (50,337,999 | ) | | | — | | |
Direxion Daily S&P 500® Bull 2X Shares | | Swap Contracts | | | (10,432,554 | ) | | | — | | | | (820,922 | ) | | | — | | |
Direxion Daily S&P 500® Equal Weight Bull
2X Shares | | Swap Contracts | | | (828,855 | ) | | | — | | | | (5,734 | ) | | | — | | |
Direxion Daily MSCI Brazil Bull 2X Shares | | Swap Contracts | | | 13,860,504 | | | | — | | | | 45,449,723 | | | | — | | |
Direxion Daily MSCI India Bull 2X Shares | | Swap Contracts | | | 5,181,116 | | | | — | | | | (19,719,112 | ) | | | — | | |
Direxion Daily Cloud Computing Bull 2X Shares | | Swap Contracts | | | (10,846,871 | ) | | | — | | | | (2,693,426 | ) | | | — | | |
Direxion Daily Electric and Autonomous
Vehicles Bull 2X Shares | | Swap Contracts | | | (2,254,631 | ) | | | — | | | | (37,352 | ) | | | — | | |
Direxion Daily Energy Bull 2X Shares | | Swap Contracts | | | 305,766,762 | | | | — | | | | (3,082,477 | ) | | | — | | |
Direxion Daily Energy Bear 2X Shares | | Swap Contracts | | | (36,887,314 | ) | | | — | | | | (2,135,712 | ) | | | — | | |
Direxion Daily FinTech Bull 2X Shares | | Swap Contracts | | | (1,619,816 | ) | | | — | | | | (145,729 | ) | | | — | | |
Direxion Daily Global Clean Energy Bull
2X Shares | | Swap Contracts | | | (3,025,544 | ) | | | — | | | | (1,116,838 | ) | | | — | | |
Direxion Daily Gold Miners Index Bull 2X Shares | | Swap Contracts | | | (200,012,403 | ) | | | — | | | | 30,503,584 | | | | — | | |
Direxion Daily Gold Miners Index Bear 2X Shares | | Swap Contracts | | | 23,187,657 | | | | — | | | | 6,708,766 | | | | — | | |
Direxion Daily Junior Gold Miners Index Bull
2X Shares | | Swap Contracts | | | (218,334,666 | ) | | | — | | | | 28,866,866 | | | | — | | |
DIREXION ANNUAL REPORT
182
| | | | | Net Realized Gain (Loss)1 | | Net Unrealized
Appreciation
(Depreciation)2 | |
Fund | | | | Equity Risk | | Interest
Rate Risk | | Equity Risk | | Interest
Rate Risk | |
Direxion Daily Junior Gold Miners Index Bear
2X Shares | | Swap Contracts | | $ | 42,186,314 | | | $ | — | | | $ | 10,279,173 | | | $ | — | | |
Direxion Daily Metal Miners Bull 2X Shares | | Swap Contracts | | | (3,355,097 | ) | | | — | | | | 740,287 | | | | — | | |
Direxion Daily Oil Services Bull 2X Shares | | Swap Contracts | | | (1,297,242 | ) | | | — | | | | 2,872,748 | | | | — | | |
Direxion Daily Robotics, Artificial Intelligence &
Automation Index Bull 2X Shares | | Swap Contracts | | | (15,824,052 | ) | | | — | | | | (11,002,567 | ) | | | — | | |
Direxion Daily S&P Oil & Gas Exp. & Prod. Bull
2X Shares | | Swap Contracts | | | 529,771,216 | | | | — | | | | (189,785,156 | ) | | | — | | |
Direxion Daily S&P Oil & Gas Exp. & Prod. Bear
2X Shares | | Swap Contracts | | | (111,719,648 | ) | | | — | | | | 15,933,549 | | | | — | | |
Direxion Daily Select Large Caps & FANGs Bull
2X Shares | | Swap Contracts | | | (9,101,466 | ) | | | — | | | | (154,734 | ) | | | — | | |
Direxion Daily Software Bull 2X Shares | | Swap Contracts | | | (2,026,421 | ) | | | — | | | | (153,196 | ) | | | — | | |
Direxion Daily TIPS Bull 2X Shares | | Swap Contracts | | | — | | | | (596,929 | ) | | | — | | | | (412,511 | ) | |
Direxion Daily TIPS Bear 2X Shares | | Swap Contracts | | | — | | | | 1,069,460 | | | | — | | | | 325,754 | | |
Direxion Daily Travel & Vacation Bull 2X Shares | | Swap Contracts | | | (17,213,986 | ) | | | — | | | | 1,225,059 | | | | — | | |
Direxion Daily US Infrastructure Bull 2X Shares | | Swap Contracts | | | (237,630 | ) | | | — | | | | (32,529 | ) | | | — | | |
1 Statements of Operations location: Net realized gain (loss) on swap contracts.
2 Statements of Operations location: Change in net unrealized appreciation (depreciation) on swap contracts.
For the period ended October 31, 2022, the volume of the derivatives held by the Funds was as follows:
| | | Quarterly Average Gross Notional Amounts | |
| | | Long Total Return
Swap Contracts | | Short Total Return
Swap Contracts | |
Direxion Daily CSI 300 China A Share Bear 1X Shares | | $ | — | | | $ | 124,623,483 | | |
Direxion Daily S&P 500® Bear 1X Shares | | | — | | | | 324,789,950 | | |
Direxion Daily AAPL Bear 1X Shares | | | — | | | | 6,730,630 | | |
Direxion Daily AMZN Bear 1X Shares | | | — | | | | 2,099,851 | | |
Direxion Daily GOOGL Bear 1X Shares | | | — | | | | 2,252,353 | | |
Direxion Daily MSFT Bear 1X Shares | | | — | | | | 2,126,369 | | |
Direxion Daily TSLA Bear 1X Shares | | | — | | | | 6,621,729 | | |
Direxion Daily AAPL Bull 1.5X Shares | | | 4,661,219 | | | | — | | |
Direxion Daily AMZN Bull 1.5X Shares | | | 4,533,794 | | | | — | | |
Direxion Daily GOOGL Bull 1.5X Shares | | | 3,320,810 | | | | — | | |
Direxion Daily MSFT Bull 1.5X Shares | | | 2,231,797 | | | | — | | |
Direxion Daily TSLA Bull 1.5X Shares | | | 74,474,136 | | | | — | | |
Direxion Daily CSI 300 China A Share Bull 2X Shares | | | 137,435,494 | | | | — | | |
Direxion Daily CSI China Internet Index Bull 2X Shares | | | 472,796,283 | | | | — | | |
Direxion Daily S&P 500® Bull 2X Shares | | | 54,599,393 | | | | — | | |
Direxion Daily S&P 500® Equal Weight Bull 2X Shares | | | 4,589,692 | | | | — | | |
Direxion Daily MSCI Brazil Bull 2X Shares | | | 242,983,405 | | | | — | | |
Direxion Daily MSCI India Bull 2X Shares | | | 113,845,749 | | | | — | | |
Direxion Daily Cloud Computing Bull 2X Shares | | | 17,179,004 | | | | — | | |
Direxion Daily Electric and Autonomous Vehicles Bull 2X Shares | | | 1,571,432 | | | | — | | |
Direxion Daily Energy Bull 2X Shares | | | 624,017,051 | | | | — | | |
Direxion Daily Energy Bear 2X Shares | | | — | | | | 74,750,287 | | |
Direxion Daily FinTech Bull 2X Shares | | | 4,322,542 | | | | — | | |
Direxion Daily Global Clean Energy Bull 2X Shares | | | 7,048,581 | | | | — | | |
Direxion Daily Gold Miners Index Bull 2X Shares | | | 873,215,243 | | | | — | | |
DIREXION ANNUAL REPORT
183
| | | Quarterly Average Gross Notional Amounts | |
| | | Long Total Return
Swap Contracts | | Short Total Return
Swap Contracts | |
Direxion Daily Gold Miners Index Bear 2X Shares | | $ | — | | | $ | 161,178,221 | | |
Direxion Daily Junior Gold Miners Index Bull 2X Shares | | | 640,204,615 | | | | — | | |
Direxion Daily Junior Gold Miners Index Bear 2X Shares | | | — | | | | 168,992,012 | | |
Direxion Daily Metal Miners Bull 2X Shares | | | 13,792,355 | | | | — | | |
Direxion Daily Oil Services Bull 2X Shares | | | 11,813,502 | | | | — | | |
Direxion Daily Robotics, Artificial Intelligence & Automation Index Bull 2X Shares | | | 38,137,952 | | | | — | | |
Direxion Daily S&P Oil & Gas Exp. & Prod. Bull 2X Shares | | | 1,009,851,253 | | | | — | | |
Direxion Daily S&P Oil & Gas Exp. & Prod. Bear 2X Shares | | | — | | | | 171,235,017 | | |
Direxion Daily Select Large Caps & FANGs Bull 2X Shares | | | 13,303,551 | | | | — | | |
Direxion Daily Software Bull 2X Shares | | | 3,382,421 | | | | — | | |
Direxion Daily TIPS Bull 2X Shares | | | 7,541,652 | | | | — | | |
Direxion Daily TIPS Bear 2X Shares | | | — | | | | 11,305,248 | | |
Direxion Daily Travel & Vacation Bull 2X Shares | | | 32,844,048 | | | | — | | |
Direxion Daily US Infrastructure Bull 2X Shares | | | 7,327,537 | | | | — | | |
The Funds utilize this volume of derivatives in order to obtain leverage in order to meet the investment objectives of -100%, 150%, 200%, or -200% daily performance of their respective index.
9. PRINCIPAL RISKS
Below are some of the principal risks of investing in the Funds. Please refer to the Funds' prospectus for a full discussion.
Counterparty Risk – A Fund will be subject to credit risk with respect to the amount it expects to receive from counterparties to financial instruments entered into by the Fund. The Funds' counterparties are generally required to post collateral to the Funds to the extent of the Funds' daily exposure to such counterparties. However, to the extent any such collateral is insufficient, the Funds will be exposed to counterparty risk as described in this paragraph. In addition, there may be a delay associated with realization by the Funds of the collateral posted by such counterparties in the event of counterparty default or bankruptcy. A Fund may be negatively impacted if a counterparty becomes bankrupt or otherwise fails to perform its obligations due to financial difficulties. A Fund may experience significant delays in obtaining any recovery in a bankruptcy or other reorganization proceeding, and a Fund may obtain only limited recovery or may obtain no recovery in such circumstances.
Daily Index Correlation/Tracking Risk – A number of factors may affect a Fund's ability to achieve a high degree of correlation with its benchmark, and there can be no guarantee that a Fund will achieve a high degree of correlation. A failure to achieve a high degree of correlation may prevent a Fund from achieving its investment objective. A number of factors may adversely affect a Fund's correlation with its benchmark, including fees, expenses, transaction costs, costs associated with the use of leveraged investment techniques, income items, accounting standards, and disruptions or illiquidity in the markets for the securities or financial instruments in which the Fund invests. A Fund may not have investment exposure to all securities in its underlying benchmark index, or its weighting of investment exposure to such stocks or industries may be different from that of the index. In addition, a Fund may invest in securities or financial instruments not included in the index underlying its benchmark. A Fund may be subject to large movements of assets into and out of the Fund, potentially resulting in the Fund being over- or under-exposed to its benchmark. Activities surrounding annual index reconstitutions and other index rebalancing or reconstitution events may hinder the Funds' ability to meet their daily investment objective on that day. Each Fund seeks to rebalance its portfolio daily to keep leverage consistent with its daily investment objective.
Certain Funds are "leveraged" funds in the sense that they have investment objectives to match a multiple of the performance of an index on a given day. These Funds are subject to all of the correlation risks described above. In addition, there is a special form of correlation risk that derives from these Funds' use of leverage, which is that for periods greater than one day, the use of leverage tends to cause the performance of a Fund to be either greater than or less than the index performance times the stated multiple in the fund objective, before accounting for fees and fund expenses. In general, given a particular index return, increased volatility of the index will cause a decrease in the performance relative to the index performance times the stated fund multiple.
DIREXION ANNUAL REPORT
184
Derivatives Risk – The Fund's investments in derivatives may pose risks in addition to, and greater than, those associated with directly investing in securities or other investments, including risk related to the market, leverage, imperfect daily correlations with underlying investments or the Fund's other portfolio holdings, higher price volatility, lack of availability, counterparty risk, liquidity, valuation and legal restrictions.
In addition, the Fund's investments in derivatives are subject to the following risks:
• Swap Agreements. Swap agreements are entered into primarily with major global financial institutions for a specified period which may range from one day to more than one year. In a standard swap transaction, two parties agree to exchange the return (or differentials in rates of return) earned or realized on particular predetermined reference assets or underlying securities or instruments. The gross return to be exchanged or swapped between the parties is calculated based on a notional amount or the return on or change in value of a particular dollar amount invested in a basket of securities representing a particular index or an ETF that seeks to track an index. Swaps are subject to counterparty, valuation and leveraging risks.
• Futures Contracts. Futures contracts are typically exchange-traded contracts that call for the future delivery of an asset at a certain price and date, or cash settlement of the terms of the contract. There may be an imperfect correlation between the changes in market value of the securities held by the Fund and the prices of futures contracts. Futures contracts are subject to liquidity risks; there may not be a liquid secondary market for the futures contracts and the Fund may not be able to enter into a closing transaction. Exchanges may also limit the number of positions that can be held or controlled by the Fund or the Adviser, thus limiting the ability of the Fund to implement its leveraged investment strategy. Futures markets are highly volatile and the use of futures may increase the Fund's volatility. Futures contracts are also subject to leverage risk.
Foreign Securities Risk – Investments in foreign securities directly or indirectly through investments in exchange traded funds which track foreign securities involve greater risks than investing in domestic securities. As a result, the Funds' returns and net asset values may be affected to a large degree by fluctuations in currency exchange rates, political, diplomatic or economic conditions and regulatory requirements in other countries. The laws, accounting and financial reporting standards in foreign countries may require less disclosure than required in the U.S., and therefore there may be less public information available about foreign companies. Investments in foreign emerging markets present a greater risk than investing in foreign issuers in general. The risk of political or social upheaval is greater in emerging markets. In addition, there may be risks of an economy's dependence on revenues from particular commodities, currency transfer restrictions, a limited number of potential buyers for such securities and delays and disruption in securities settlement procedures.
Leverage Risk – Leverage offers a means of magnifying market movements into larger changes in an investment's value and provides greater investment exposure than an unleveraged investment. Swap and futures contracts may be used to create leverage. Certain Funds employ leveraged investment techniques to achieve its investment objective.
Liquidity Risk – In certain circumstances, such as the disruption of the orderly markets for the securities or financial instruments in which a Fund invests, a Fund might not be able to dispose of certain holdings quickly or at prices that represent fair market value in the judgment of the Adviser. Additionally, certain counterparties may have the ability to demand repayment at any time, thereby exposing the Fund to the risk that it may be required to liquidate investments at an inopportune time. This may prevent a Fund from limiting losses, realizing gains or from achieving a high correlation or inverse correlation with its underlying index.
Market Disruption Risk – Geopolitical and other events, including public health crises and natural disasters, have recently led to increased market volatility and significant market losses. Significant market volatility and market downturns may limit a Fund's ability to sell securities and the Fund's sales may exacerbate the market volatility and downturn. Under such circumstances, a Fund may have difficulty achieving its investment objective for one or more trading days, which may adversely impact the Fund's returns on those days and periods inclusive of those days. Alternatively, the Fund may incur higher costs in order to achieve its investment objective and may be forced to purchase and sell securities (including other ETFs' shares) at market prices that do not represent their fair value (including in the case of an ETF, its net asset value) or at times that result in differences between the price the Fund receives for the security and the market closing price of the security. Under those circumstances, the Fund's ability to track its index is likely to be adversely affected, the market price of Fund shares may reflect a greater premium or discount to net asset value, and bid-ask spreads in the Fund's shares may
DIREXION ANNUAL REPORT
185
widen, resulting in increased transaction costs for secondary market purchasers and sellers. The Fund may also incur additional tracking error due to the use of other securities that are not perfectly correlated to the Fund's index.
The recent pandemic spread of the novel coronavirus known as COVID-19 has proven to be a market disrupting event. The impact of this virus, like other pandemics that may arise in the future, has negatively affected and may continue to negatively affect the economies of many nations, companies and the global securities and commodities markets, including by reducing liquidity in the markets. Adverse effects may be more pronounced for developing or emerging market countries that have less established health care systems. How long such events will last and whether they will continue or recur cannot be predicted.
Sector Concentration Risk – The risk of concentrating investments in a limited number of issuers in a particular industry is that a Fund will be more susceptible to the risks associated with that industry than a Fund that does not concentrate its investments.
10. ADDITIONAL INFORMATION
On March 28, 2022 and May 31, 2022, shares of the following Funds were adjusted to reflect a reverse stock split. The effect of the reverse stock split was to decrease the number of shares outstanding and increase the net asset value. The reverse stock split has no impact on the net assets of the Fund or the value of a shareholder's investment in the Fund. A summary of the reverse stock splits are as follows:
Funds | | Effective Date | | Rate | | Net Asset
Value Before
Split | | Net Asset
Value After
Split | | Shares
Outstanding
Before Split | | Shares
Outstanding
After Split | |
Direxion Daily S&P
Oil & Gas Exp. & Prod. Bear
2X Shares | | 3/28/22 | | | 1 | :10 | | $ | 2.26 | | | $ | 22.60 | | | | 45,096,196 | | | | 4,509,620 | | |
Direxion Daily CSI China Internet
Index Bull 2X Shares | | 5/31/22 | | | 1 | :10 | | | 5.46 | | | | 54.60 | | | | 61,750,001 | | | | 6,175,000 | | |
Direxion Daily Energy Bear 2X Shares | | 5/31/22 | | | 1 | :10 | | | 3.71 | | | | 37.10 | | | | 11,157,061 | | | | 1,115,706 | | |
11. SUBSEQUENT EVENTS
Management has performed an evaluation of subsequent events through the date of the financial statements were issued and has determined that no items require recognition or disclosure besides those noted below.
On December 7, 2022, certain Funds declared capital gain distributions with an ex-date of December 8, 2022 and payable date of December 14, 2022. The specific Funds and per share amounts of the distributions are listed below.
Funds | | Per Share
Short Term
Capital Gain
Distribution | |
Direxion Daily AAPL Bear 1X Shares | | $ | 0.00612 | | |
Direxion Daily AMZN Bear 1X Shares | | | 0.69405 | | |
Direxion Daily MSFT Bear 1X Shares | | | 0.01476 | | |
Direxion Daily TSLA Bear 1X Shares | | | 1.61944 | | |
Direxion Daily TSLA Bull 1.5X Shares | | | 0.03561 | | |
Direxion Daily TIPS Bull 2X Shares | | | 0.25215 | | |
Direxion Daily TIPS Bear 2X Shares | | | 2.25023 | | |
DIREXION ANNUAL REPORT
186
On December 19, 2022, certain Funds declared income distributions with an ex-date of December 20, 2022 and payable date of December 28, 2022. The specific Funds and per share amounts of the distributions are listed below.
Funds | | Per Share
Income
Distribution | |
Direxion Daily S&P 500® Bear 1X Shares | | $ | 0.13274 | | |
Direxion Daily AAPL Bear 1X Shares | | | 0.12666 | | |
Direxion Daily AMZN Bear 1X Shares | | | 0.14109 | | |
Direxion Daily GOOGL Bear 1X Shares | | | 0.04815 | | |
Direxion Daily MSFT Bear 1X Shares | | | 0.16223 | | |
Direxion Daily TSLA Bear 1X Shares | | | 0.05626 | | |
Direxion Daily AAPL Bull 1.5X Shares | | | 0.12086 | | |
Direxion Daily AMZN Bull 1.5X Shares | | | 0.05814 | | |
Direxion Daily GOOGL Bull 1.5X Shares | | | 0.10031 | | |
Direxion Daily MSFT Bull 1.5X Shares | | | 0.11265 | | |
Direxion Daily TSLA Bull 1.5X Shares | | | 0.04793 | | |
Direxion Daily CSI 300 China A Share Bull 2X Shares | | | 0.07006 | | |
Direxion Daily S&P 500® Bull 2X Shares | | | 0.62426 | | |
Direxion Daily S&P 500® Equal Weight Bull 2X Shares | | | 0.12840 | | |
Direxion Daily MSCI Brazil Bull 2X Shares | | | 2.14988 | | |
Direxion Daily MSCI India Bull 2X Shares | | | 0.04172 | | |
Direxion Daily Electric and Autonomous Vehicles Bull 2X Shares | | | 0.03040 | | |
Direxion Daily Energy Bull 2X Shares | | | 0.32979 | | |
Direxion Daily Energy Bear 2X Shares | | | 0.09231 | | |
Direxion Daily FinTech Bull 2X Shares | | | 0.00825 | | |
Direxion Daily Gold Miners Index Bull 2X Shares | | | 0.23961 | | |
Direxion Daily Metal Miners Bull 2X Shares | | | 0.12175 | | |
Direxion Daily TIPS Bull 2X Shares | | | 0.14971 | | |
Direxion Daily TIPS Bear 2X Shares | | | 0.20259 | | |
DIREXION ANNUAL REPORT
187
Direxion Shares ETF Trust
Report of Independent Registered Public Accounting Firm
To the Shareholders of Direxion Daily CSI 300 China A Share Bear 1X Shares, Direxion Daily S&P 500® Bear 1X Shares, Direxion Daily AAPL Bear 1X Shares, Direxion Daily AMZN Bear 1X Shares, Direxion Daily GOOGL Bear 1X Shares, Direxion Daily MSFT Bear 1X Shares, Direxion Daily TSLA Bear 1X Shares, Direxion Daily AAPL Bull 1.5X Shares, Direxion Daily AMZN Bull 1.5X Shares, Direxion Daily GOOGL Bull 1.5X Shares, Direxion Daily MSFT Bull 1.5X Shares, Direxion Daily TSLA Bull 1.5X Shares, Direxion Daily CSI 300 China A Share Bull 2X Shares, Direxion Daily CSI China Internet Index Bull 2X Shares, Direxion Daily S&P 500® Bull 2X Shares, Direxion Daily S&P 500® Equal Weight Bull 2X Shares, Direxion Daily MSCI Brazil Bull 2X Shares, Direxion Daily MSCI India Bull 2X Shares, Direxion Daily Cloud Computing Bull 2X Shares, Direxion Daily Electric and Autonomous Vehicles Bull 2X Shares, Direxion Daily Energy Bull 2X Shares, Direxion Daily Energy Bear 2X Shares, Direxion Daily FinTech Bull 2X Shares, Direxion Daily Global Clean Energy Bull 2X Shares, Direxion Daily Gold Miners Index Bull 2X Shares, Direxion Daily Gold Miners Index Bear 2X Shares, Direxion Daily Junior Gold Miners Index Bull 2X Shares, Direxion Daily Junior Gold Miners Index Bear 2X Shares, Direxion Daily Metal Miners Bull 2X Shares, Direxion Daily Oil Services Bull 2X Shares, Direxion Daily Robotics, Artificial Intelligence & Automation Index Bull 2X Shares, Direxion Daily S&P Oil & Gas Exp. & Prod. Bull 2X Shares, Direxion Daily S&P Oil & Gas Exp. & Prod. Bear 2X Shares, Direxion Daily Select Large Caps & FANGs Bull 2X Shares, Direxion Daily Software Bull 2X Shares, Direxion Daily TIPS Bull 2X Shares, Direxion Daily TIPS Bear 2X Shares, Direxion Daily Travel & Vacation Bull 2X Shares, Direxion Daily US Infrastructure Bull 2X Shares and the Board of Trustees of Direxion Shares ETF Trust.
Opinion on the Financial Statements
We have audited the accompanying statements of assets and liabilities of Direxion Daily CSI 300 China A Share Bear 1X Shares, Direxion Daily S&P 500® Bear 1X Shares, Direxion Daily AAPL Bear 1X Shares, Direxion Daily AMZN Bear 1X Shares, Direxion Daily GOOGL Bear 1X Shares, Direxion Daily MSFT Bear 1X Shares, Direxion Daily TSLA Bear 1X Shares, Direxion Daily AAPL Bull 1.5X Shares, Direxion Daily AMZN Bull 1.5X Shares, Direxion Daily GOOGL Bull 1.5X Shares, Direxion Daily MSFT Bull 1.5X Shares, Direxion Daily TSLA Bull 1.5X Shares, Direxion Daily CSI 300 China A Share Bull 2X Shares, Direxion Daily CSI China Internet Index Bull 2X Shares, Direxion Daily S&P 500® Bull 2X Shares, Direxion Daily S&P 500® Equal Weight Bull 2X Shares, Direxion Daily MSCI Brazil Bull 2X Shares, Direxion Daily MSCI India Bull 2X Shares, Direxion Daily Cloud Computing Bull 2X Shares, Direxion Daily Electric and Autonomous Vehicles Bull 2X Shares, Direxion Daily Energy Bull 2X Shares, Direxion Daily Energy Bear 2X Shares, Direxion Daily FinTech Bull 2X Shares, Direxion Daily Global Clean Energy Bull 2X Shares, Direxion Daily Gold Miners Index Bull 2X Shares, Direxion Daily Gold Miners Index Bear 2X Shares, Direxion Daily Junior Gold Miners Index Bull 2X Shares, Direxion Daily Junior Gold Miners Index Bear 2X Shares, Direxion Daily Metal Miners Bull 2X Shares, Direxion Daily Oil Services Bull 2X Shares, Direxion Daily Robotics, Artificial Intelligence & Automation Index Bull 2X Shares, Direxion Daily S&P Oil & Gas Exp. & Prod. Bull 2X Shares, Direxion Daily S&P Oil & Gas Exp. & Prod. Bear 2X Shares, Direxion Daily Select Large Caps & FANGs Bull 2X Shares, Direxion Daily Software Bull 2X Shares, Direxion Daily TIPS Bull 2X Shares, Direxion Daily TIPS Bear 2X Shares, Direxion Daily Travel & Vacation Bull 2X Shares and Direxion Daily US Infrastructure Bull 2X Shares (collectively referred to as the "Funds"), (39 of the funds constituting Direxion Shares ETF Trust (the "Trust")), including the schedules of investments, as of October 31, 2022, and the related statements of operations and changes in net assets, and the financial highlights for each of the periods indicated in the table below and the related notes (collectively referred to as the "financial statements"). In our opinion, the financial statements present fairly, in all material respects, the financial position of each of the Funds (39 of the funds constituting Direxion Shares ETF Trust) at October 31, 2022, and the results of their operations, changes in net assets and financial highlights for each of the periods indicated in the table below, in conformity with U.S. generally accepted accounting principles.
DIREXION ANNUAL REPORT
188
Direxion Shares ETF Trust
Report of Independent Registered Public Accounting Firm
Individual fund constituting the Direxion Shares
ETF Trust | | Statement of
operations | | Statements of
changes in net assets | | Financial highlights | |
Direxion Daily CSI 300 China A Share Bear 1X Shares
Direxion Daily S&P 500® Bear 1X Shares
Direxion Daily CSI 300 China A Share Bull 2X Shares
Direxion Daily CSI China Internet Index Bull 2X Shares
Direxion Daily S&P 500® Bull 2X Shares
Direxion Daily MSCI Brazil Bull 2X Shares
Direxion Daily MSCI India Bull 2X Shares
Direxion Daily Energy Bull 2X Shares
Direxion Daily Energy Bear 2X Shares
Direxion Daily Gold Miners Index Bull 2X Shares
Direxion Daily Gold Miners Index Bear 2X Shares
Direxion Daily Junior Gold Miners Index Bull 2X Shares
Direxion Daily Junior Gold Miners Index Bear 2X Shares
Direxion Daily S&P Oil & Gas Exp. & Prod. Bull 2X Shares
Direxion Daily S&P Oil & Gas Exp. & Prod. Bear 2X Shares | | For the year ended October 31, 2022 | | For each of the two years in the period ended October 31, 2022 | | For each of the five years in the period ended October 31, 2022 | |
Direxion Daily Robotics, Artificial Intelligence & Automation Index Bull 2X Shares | | For the year ended October 31, 2022 | | For each of the two years in the period ended October 31, 2022 | | For each of the four years in the period ended October 31, 2022 and the period from April 19, 2018 (commencement of operations) through October 31, 2018 | |
Direxion Daily Cloud Computing Bull 2X Shares | | For the year ended October 31, 2022 | | For the year ended October 31, 2022 and the period from January 8, 2021 (commencement of operations) through October 31, 2021 | |
Direxion Daily Global Clean Energy Bull 2X Shares | | For the year ended October 31, 2022 | | For the year ended October 31, 2022 and the period from July 29, 2021 (commencement of operations) through October 31, 2021 | |
Direxion Daily Select Large Caps & FANGs Bull 2X Shares | | For the year ended October 31, 2022 | | For the year ended October 31, 2022 and the period from September 30, 2021 (commencement of operations) through October 31, 2021 | |
Direxion Daily Travel & Vacation Bull 2X Shares | | For the year ended October 31, 2022 | | For the year ended October 31, 2022 and the period from June 10, 2021 (commencement of operations) through October 31, 2021 | |
Direxion Daily US Infrastructure Bull 2X Shares | | For the year ended October 31, 2022 | | For the year ended October 31, 2022 and the period from September 23, 2021 (commencement of operations) through October 31, 2021 | |
Direxion Daily AAPL Bear 1X Shares
Direxion Daily TSLA Bear 1X Shares
Direxion Daily AAPL Bull 1.5X Shares
Direxion Daily TSLA Bull 1.5X Shares | | For the period from August 9, 2022 (commencement of operations) through October 31, 2022 | |
Direxion Daily AMZN Bear 1X Shares
Direxion Daily GOOGL Bear 1X Shares
Direxion Daily MSFT Bear 1X Shares
Direxion Daily AMZN Bull 1.5X Shares
Direxion Daily GOOGL Bull 1.5X Shares
Direxion Daily MSFT Bull 1.5X Shares | | For the period from September 7, 2022 (commencement of operations) through October 31, 2022 | |
Direxion Daily S&P 500® Equal Weight Bull 2X Shares
Direxion Daily FinTech Bull 2X Shares
Direxion Daily Oil Services Bull 2X Shares | | For the period from January 20, 2022 (commencement of operations) through October 31, 2022 | |
Direxion Daily Electric and Autonomous Vehicles Bull 2X Shares | | For the period from August 11, 2022 (commencement of operations) through October 31, 2022 | |
Direxion Daily Metal Miners Bull 2X Shares
Direxion Daily Software Bull 2X Shares | | For the period from December 16, 2021 (commencement of operations) through October 31, 2022 | |
Direxion Daily TIPS Bull 2X Shares
Direxion Daily TIPS Bear 2X Shares | | For the period from April 7, 2022 (commencement of operations) through October 31, 2022 | |
DIREXION ANNUAL REPORT
189
Direxion Shares ETF Trust
Report of Independent Registered Public Accounting Firm
Basis for Opinion
These financial statements are the responsibility of the Trust's management. Our responsibility is to express an opinion on each of the Funds' financial statements based on our audits. We are a public accounting firm registered with the Public Company Accounting Oversight Board (United States) ("PCAOB") and are required to be independent with respect to the Trust in accordance with the U.S. federal securities laws and the applicable rules and regulations of the Securities and Exchange Commission and the PCAOB.
We conducted our audits in accordance with the standards of the PCAOB. Those standards require that we plan and perform the audit to obtain reasonable assurance about whether the financial statements are free of material misstatement, whether due to error or fraud. The Trust is not required to have, nor were we engaged to perform, an audit of the Trust's internal control over financial reporting. As part of our audits, we are required to obtain an understanding of internal control over financial reporting but not for the purpose of expressing an opinion on the effectiveness of the Trust's internal control over financial reporting. Accordingly, we express no such opinion.
Our audits included performing procedures to assess the risks of material misstatement of the financial statements, whether due to error or fraud, and performing procedures that respond to those risks. Such procedures included examining, on a test basis, evidence regarding the amounts and disclosures in the financial statements. Our procedures included confirmation of securities owned as of October 31, 2022, by correspondence with the custodian, brokers and others; when replies were not received from brokers and others, we performed other auditing procedures. Our audits also included evaluating the accounting principles used and significant estimates made by management, as well as evaluating the overall presentation of the financial statements. We believe that our audits provide a reasonable basis for our opinion.
We have served as the auditor of one or more of the Direxion investment companies since 2001.
Minneapolis, Minnesota
December 22, 2022
DIREXION ANNUAL REPORT
190
Direxion Shares ETF Trust
Supplemental Information (Unaudited)
Federal Tax Status of Dividends Declared during the Tax Year
For Federal income tax purposes, dividends from short-term capital gains are classified as ordinary income. The percentage of ordinary income distribution designated as qualifying for the corporate dividend received deduction ("DRD"), the individual qualified dividend rate ("QDI"), the qualified interest income rate ("QII"), and the qualified short-term gain rate ("QSTG") is presented below.
Funds | | DRD | | QDI | | QII | | QSTG | |
Direxion Daily CSI 300 China A Share Bear 1X Shares | | | 0.00 | % | | | 0.00 | % | | | 0.00 | % | | | 0.00 | % | |
Direxion Daily S&P 500® Bear 1X Shares | | | 0.00 | % | | | 0.00 | % | | | 0.00 | % | | | 0.00 | % | |
Direxion Daily AAPL Bear 1X Shares | | | 0.00 | % | | | 0.00 | % | | | 0.00 | % | | | 0.00 | % | |
Direxion Daily AMZN Bear 1X Shares | | | 0.00 | % | | | 0.00 | % | | | 0.00 | % | | | 0.00 | % | |
Direxion Daily GOOGL Bear 1X Shares | | | 0.00 | % | | | 0.00 | % | | | 0.00 | % | | | 0.00 | % | |
Direxion Daily MSFT Bear 1X Shares | | | 0.00 | % | | | 0.00 | % | | | 0.00 | % | | | 0.00 | % | |
Direxion Daily TSLA Bear 1X Shares | | | 0.00 | % | | | 0.00 | % | | | 0.00 | % | | | 0.00 | % | |
Direxion Daily AAPL Bull 1.5X Shares | | | 0.00 | % | | | 0.00 | % | | | 0.00 | % | | | 0.00 | % | |
Direxion Daily AMZN Bull 1.5X Shares | | | 0.00 | % | | | 0.00 | % | | | 0.00 | % | | | 0.00 | % | |
Direxion Daily GOOGL Bull 1.5X Shares | | | 0.00 | % | | | 0.00 | % | | | 0.00 | % | | | 0.00 | % | |
Direxion Daily MSFT Bull 1.5X Shares | | | 0.00 | % | | | 0.00 | % | | | 0.00 | % | | | 0.00 | % | |
Direxion Daily TSLA Bull 1.5X Shares | | | 0.00 | % | | | 0.00 | % | | | 0.00 | % | | | 0.00 | % | |
Direxion Daily CSI 300 China A Share Bull 2X Shares | | | 11.77 | % | | | 11.77 | % | | | 0.00 | % | | | 89.29 | % | |
Direxion Daily CSI China Internet Index Bull 2X Shares | | | 0.00 | % | | | 0.00 | % | | | 0.00 | % | | | 0.00 | % | |
Direxion Daily S&P 500® Bull 2X Shares | | | 12.81 | % | | | 12.81 | % | | | 0.00 | % | | | 86.82 | % | |
Direxion Daily S&P 500® Equal Weight Bull 2X Shares | | | 100.00 | % | | | 100.00 | % | | | 0.00 | % | | | 0.00 | % | |
Direxion Daily MSCI Brazil Bull 2X Shares | | | 100.00 | % | | | 100.00 | % | | | 0.00 | % | | | 0.00 | % | |
Direxion Daily MSCI India Bull X Shares | | | 32.52 | % | | | 32.52 | % | | | 0.00 | % | | | 7.43 | % | |
Direxion Daily Cloud Computing Bull 2X Shares | | | 0.78 | % | | | 0.78 | % | | | 0.00 | % | | | 100.00 | % | |
Direxion Daily Electric and Autonomous Vehicles Bull 2X Shares | | | 0.00 | % | | | 0.00 | % | | | 0.00 | % | | | 0.00 | % | |
Direxion Daily Energy Bull 2X Shares | | | 100.00 | % | | | 100.00 | % | | | 0.00 | % | | | 0.00 | % | |
Direxion Daily Energy Bear 2X Shares | | | 0.00 | % | | | 0.00 | % | | | 0.00 | % | | | 0.00 | % | |
Direxion Daily FinTech Bull 2X Shares | | | 100.00 | % | | | 100.00 | % | | | 0.00 | % | | | 0.00 | % | |
Direxion Daily Global Clean Energy Bull 2X Shares | | | 100.00 | % | | | 100.00 | % | | | 0.00 | % | | | 0.00 | % | |
Direxion Daily Gold Miners Index Bull 2X Shares | | | 0.00 | % | | | 0.00 | % | | | 0.00 | % | | | 0.00 | % | |
Direxion Daily Gold Miners Index Bear 2X Shares | | | 0.00 | % | | | 0.00 | % | | | 0.00 | % | | | 0.00 | % | |
Direxion Daily Junior Gold Miners Index Bull 2X Shares | | | 0.00 | % | | | 0.00 | % | | | 0.00 | % | | | 0.00 | % | |
Direxion Daily Junior Gold Miners Index Bear 2X Shares | | | 0.00 | % | | | 0.00 | % | | | 0.00 | % | | | 0.00 | % | |
Direxion Daily Metal Miners Bull 2X Shares | | | 19.52 | % | | | 19.52 | % | | | 0.00 | % | | | 0.00 | % | |
Direxion Daily Oil Services Bull 2X Shares | | | 100.00 | % | | | 100.00 | % | | | 0.00 | % | | | 0.00 | % | |
Direxion Daily Robotics, Artificial Intelligence & Automation
Index Bull 2X Shares | | | 0.13 | % | | | 0.13 | % | | | 0.00 | % | | | 100.00 | % | |
Direxion Daily S&P Oil & Gas Exp. & Prod. Bull 2X Shares | | | 5.54 | % | | | 5.54 | % | | | 0.00 | % | | | 6.80 | % | |
Direxion Daily S&P Oil & Gas Exp. & Prod. Bear 2X Shares | | | 0.00 | % | | | 0.00 | % | | | 0.00 | % | | | 0.00 | % | |
Direxion Daily Select Large Caps & FANGs Bull 2X Shares | | | 0.00 | % | | | 0.00 | % | | | 0.00 | % | | | 100.00 | % | |
Direxion Daily Software Bull 2X Shares | | | 0.00 | % | | | 0.00 | % | | | 0.00 | % | | | 0.00 | % | |
Direxion Daily TIPS Bull 2X Shares | | | 71.94 | % | | | 71.94 | % | | | 0.00 | % | | | 0.90 | % | |
Direxion Daily TIPS Bear 2X Shares | | | 0.00 | % | | | 0.00 | % | | | 0.00 | % | | | 0.00 | % | |
Direxion Daily Travel & Vacation Bull 2X Shares | | | 0.00 | % | | | 0.00 | % | | | 0.00 | % | | | 0.00 | % | |
Direxion Daily US Infrastructure Bull 2X Shares | | | 16.12 | % | | | 16.12 | % | | | 0.00 | % | | | 23.24 | % | |
The Funds are designating as long-term capital gain dividends, pursuant to Internal Revenue Code Section 852(b)(3), the amount necessary to reduce the earnings and profits of the Funds related to net capital gain to zero for the tax year ended October 31, 2022. To the extent necessary to fully distribute such capital gain, the Funds also designate earnings and profits distributed to shareholders on the redemption of shares.
DIREXION ANNUAL REPORT
191
Direxion Shares ETF Trust
Supplemental Information (Unaudited)
Householding
In an effort to decrease costs, the Funds intend to reduce the number of duplicate prospectuses, Annual and Semi-Annual Reports, proxy statements and other similar documents you receive by sending only one copy of each to those addresses shared by two or more accounts and to shareholders we reasonably believe are from the same family or household. Householding begins once you have signed your account application. After such time, if you would like to discontinue householding for your accounts, please call toll-free at (800) 851-0511 to request individual copies of these documents. Once the Funds receive notice to stop householding, we will begin sending individual copies thirty days after receiving your request. This policy does not apply to account statements.
DIREXION ANNUAL REPORT
192
Direxion Shares ETF Trust
Board Review of Investment Advisory Agreement (Unaudited)
Provided below is a summary of certain of the factors the Board of Trustees (the "Board") of the Direxion Shares ETF Trust (the "Trust"), including the trustees who are not "interested persons" as defined in the Investment Company Act of 1940, (the "Independent Trustees"), considered in approving the Investment Advisory Agreement (the "Agreement") between Rafferty Asset Management, LLC (the "Adviser") and the Trust, on behalf of the Direxion Daily AAPL Bear 1X Shares, Direxion Daily AMZN Bear 1X Shares, Direxion Daily GOOGL Bear 1X Shares, Direxion Daily MSFT Bear 1X Shares, Direxion Daily AAPL Bull 1.5X Shares, Direxion Daily AMZN Bull 1.5X Shares, Direxion Daily GOOGL Bull 1.5X Shares, and Direxion Daily MSFT Bull 1.5X Shares at the May 18, 2022 meeting, the Direxion Daily Electric and Autonomous Vehicles Bull 2X Shares at the February 9, 2022 meeting, the Direxion Daily TSLA Bull 1.5X Shares at the May 18, 2021 meeting, and the Direxion Daily TSLA Bear 1X Shares at the November 24, 2020 meeting, each a series of the Trust. On various dates, the Trustees approved Rafferty's recommended changes to the names and index names of certain of the Funds, and as a result, the Funds and/or their underlying indexes were renamed accordingly. Each series of the Trust listed above is referred to herein as a "Fund" and collectively as the "Funds." The Board, including the trustees who are not "interested persons" of the Trust as defined in the Investment Company Act of 1940 Act, as amended (the "Independent Trustees"), unanimously approved the Agreement on behalf of the Funds. The Board, including the Independent Trustees, determined that the terms of the Agreement for the Funds were fair and reasonable and in the best interests of shareholders.
The Board did not identify any particular information that was most relevant to its consideration to approve the Agreement and each Trustee may have afforded different weight or importance to different factors. For each Fund, the Board considered, among others, the following factors to the extent applicable: (1) the nature, extent, and quality of the services to be provided; (2) the projected profitability to the Adviser based upon its services to be provided to the Fund; (3) the extent to which economies of scale might be realized as the Fund grows; (4) whether fee levels reflect these economies of scale, if any, for the benefit of the Fund's shareholders; (5) comparisons of services and fees with contracts entered into by the Adviser with other clients (such as institutional investors), if any; and (6) other benefits anticipated to be derived and identified by the Adviser from its relationship with the Fund.
Nature, Extent and Quality of Services Provided. The Board considered the nature, extent and quality of the services to be provided under the Agreement by the Adviser. Based on written materials received, a presentation from senior representatives of the Adviser and a discussion with the Adviser about its personnel, operations and financial condition, the Board considered the quality of the services provided by the Adviser under the Agreement. In this regard, the Board considered information regarding the experience, qualifications and professional background of the portfolio managers and other personnel at the Adviser with principal responsibility for the Funds, as well as the capacity and integrity of the Adviser's senior management and staff. The Board noted that the Adviser has provided services to the Trust since its inception date and has developed an expertise in managing funds with investment strategies similar to the Funds. The Board considered the Adviser's representations that it has the financial resources and appropriate staffing to manage the Funds and to meet its fee waiver and expense obligations thereto. The Board considered that the Adviser will oversee all aspects of the operation of the Funds, including oversight of the Funds' service providers, and provide compliance services to the Funds. The Board observed that because the Funds had not commenced operations, they did not have any prior performance history. Under the totality of the circumstances, the Board determined that, in the exercise of its business judgment, the nature, extent and quality of the services to be provided by the Adviser to the Funds under the Agreement were fair and reasonable.
Costs of Services Provided to the Funds and Profits Realized. The Board considered the fairness and reasonableness of the investment advisory fee rates to be paid to the Adviser by the Funds, including in light of the investment advisory services to be provided by the Adviser. The Board considered the fees to be paid to the Adviser on an annual basis, including as limited by the Operating Expense Limitation Agreement. The Board considered the proposed advisory fee rate and net expense ratio for each Fund was similar to those of comparable exchange-traded funds and to those of similar series of the Trust.
The Board further considered the overall profitability of the Adviser's investment business and, because the Funds had not commenced operations and the Adviser had no prior profit data related to the Funds, the Board considered the break-even analysis provided by the Adviser for each Fund. The Board considered the significant drivers of cost for the Adviser including, but not limited to, intellectual capital, portfolio rebalancing, regulatory compliance, and entrepreneurial risk. The Board also considered the costs that investors would likely incur if they independently sought to achieve the investment objectives of the Funds. Based on these considerations, the Board determined that, in the exercise of its business judgment, the costs of the services to be provided and any profits that may be realized under the Agreement was not excessive.
DIREXION ANNUAL REPORT
193
Direxion Shares ETF Trust
Board Review of Investment Advisory Agreement (Unaudited)
Economies of Scale. The Board considered whether economies of scale may be realized by each Fund as it grows larger and the extent to which any such economies of scale are reflected in contractual fee rates. Noting that the Funds had not yet commenced operations and did not yet have any assets, the Board concluded that economies of scale were not a material factor for the Board to consider in approving the Agreement.
Other Benefits. The Board considered the Adviser's representation that its relationship with the Funds may enable it to attract assets to the other funds. The Board also considered that the Adviser's overall business with brokerage firms may allow it to negotiate lower commission rates and get better execution for all of its portfolio trades. Based on these and other considerations, the Board determined that such benefits to the Adviser would likely not be material and, overall, would be reasonable.
Conclusion. The Board did not identify any single factor as being of paramount importance, and different Trustees may have given different weight to different factors. The Board reviewed a memorandum from counsel discussing the legal standards applicable to its consideration of the Agreement. Based on its review, including consideration of each of the factors referenced above, and its consideration of information received throughout the year from the Adviser, the Board determined, in the exercise of its business judgment, that the advisory arrangements, as outlined in the Agreement, were fair and reasonable in light of the services performed, or to be performed, expenses incurred, or to be incurred and such other matters as the Board considered relevant.
DIREXION ANNUAL REPORT
194
Direxion Shares ETF Trust
Board Review of Investment Advisory Agreement (Unaudited)
Consistent with the Investment Company Act of 1940, as amended (the "1940 Act"), the Board of Trustees (the "Board") of the Direxion Shares ETF Trust (the "ETF Trust") annually considers the renewal of the Investment Advisory Agreement (the "Agreement") between Rafferty Asset Management, LLC (the "Adviser") and the ETF Trust, on behalf of the Direxion Daily CSI 300 China A Share Bear 1X Shares, Direxion Daily S&P 500® Bear 1X Shares, Direxion Daily CSI 300 China A Share Bull 2X Shares, Direxion Daily CSI China Internet Index Bull 2X Shares, Direxion Daily S&P 500® Bull 2X Shares, Direxion Daily MSCI Brazil Bull 2X Shares, Direxion Daily MSCI India Bull 2X Shares, Direxion Daily Cloud Computing Bull 2X Shares, Direxion Daily Energy Bull 2X Shares, Direxion Daily Energy Bear 2X Shares, Direxion Daily Global Clean Energy Bull 2X Shares, Direxion Daily Gold Miners Index Bull 2X Shares, Direxion Daily Gold Miners Index Bear 2X Shares, Direxion Daily Junior Gold Miners Index Bull 2X Shares, Direxion Daily Junior Gold Miners Index Bear 2X Shares, Direxion Daily Robotics, Artificial Intelligence & Automation Index Bull 2X Shares, Direxion Daily S&P Oil & Gas Exp. & Prod. Bull 2X Shares, Direxion Daily S&P Oil & Gas Exp. & Prod. Bear 2X Shares, Direxion Daily Select Large Caps & FANGs Bull 2X Shares, Direxion Daily Travel & Vacation Bull 2X Shares, and the Direxion Daily US Infrastructure Bull 2X Shares, each a series of the ETF Trust. The Agreement is initially approved for a two-year period and must be renewed yearly thereafter to remain in effect. Each series of the ETF Trust is referred to herein as a "Fund" and collectively as the "Funds."
At a meeting held on August 18, 2022, the Board, including the trustees who are not "interested persons" of the ETF Trust as defined in the 1940 Act (the "Independent Trustees"), unanimously approved the renewal of the Agreement, on behalf of the Funds. The Independent Trustees had previously considered information pertaining to the renewal of the Agreement outside the presence of the Adviser's representatives and Fund management in executive sessions held on August 4, 2022 and August 18, 2022.
In considering whether to renew the Agreement, the Board requested, and the Adviser provided, information that the Board and Adviser believed to be reasonably necessary to evaluate the Agreement. Among other information, the Board obtained and reviewed the following:
• Detailed information regarding the advisory services provided by the Adviser to the Funds;
• The investment objectives of the Funds, which require daily rebalancing and the utilization of complex financial instruments that are not typical of traditional index tracking exchange-traded funds;
• The level of attention and services required by the Adviser due to the frequent and large trading activity in the Funds;
• The Adviser's Form ADV;
• Information regarding the professional qualifications of those employees primarily responsible for providing services to the Funds;
• Information regarding each component of the contractual advisory fee rates for the prior fiscal year;
• Information regarding advisory fees earned and waivers made by the Adviser in connection with providing services to the Funds for the prior fiscal year or since inception, if shorter;
• Information regarding fees paid to the Adviser under, and an evaluation of the services provided per the Management Services Agreement for the prior fiscal year as separate and distinct from the fees paid and the services provided under the Agreement;
• Performance information;
• Comparative industry fee data, including peer group comparisons;
• Information regarding the consolidated financial condition of the Adviser and the profitability of each Fund to the Adviser; and
• Information regarding how the Adviser monitors the Funds' compliance with regulatory requirements and ETF Trust procedures.
The Board considered that, with respect to most Funds, they had also received information relevant to their annual review of the Agreement since the Fund's inception and, most recently, throughout the past year at regular Board meetings in connection with their oversight of the Funds, including information bearing on the Funds' service provider arrangements and performance results. In addition, the Board received a memorandum from counsel regarding its responsibilities with respect to the approval of the Agreement and participated in a question and answer session with representatives of the Adviser. The Board carefully evaluated the relevant information and the Independent Trustees were advised by legal counsel with respect to their deliberations.
DIREXION ANNUAL REPORT
195
Direxion Shares ETF Trust
Board Review of Investment Advisory Agreement (Unaudited)
The Board did not identify any particular information that was most relevant to its consideration to approve the Agreement and each Trustee may have afforded different weight or importance to different factors. For each Fund, the Board considered, among other matters, the following factors to the extent applicable: (1) the nature, extent, and quality of the services provided; (2) the investment performance; (3) the profitability of the Fund and the advisory business to the Adviser; (4) the extent to which economies of scale might be realized as the Fund grows and whether fee levels reflect these economies of scale, if any, for the benefit of the Fund's shareholders; (5) comparisons of services and fees with contracts entered into by the Adviser with other clients (such as institutional investors), if any; and (6) other benefits derived or anticipated to be derived by the Adviser from its relationship with the Fund.
Nature, Extent and Quality of Services Provided. The Board reviewed, among other matters, the Adviser's business, assets under management, financial resources and capitalization, quality and quantity of personnel, investment and related experience, the variety and complexity of its investment strategies, brokerage practices, the adequacy of its compliance systems and processes, and its reinvestment in each of these areas of the business. The Board reviewed the scope of services provided, and to be provided by the Adviser, under the Agreement and noted there would be no significant differences between the scope of services provided by the Adviser in the past year and those to be provided in the upcoming year. The Board considered the Adviser's representation to the Board that it would continue to provide investment and related services that are of materially the same quality as the services that have been provided to the Funds in the past, and it considered whether those services remain appropriate in scope and extent in light of the Funds' operations, the competitive landscape of the investment company business and investor needs.
The Board focused on the quality of the Adviser's personnel and operations and the systems and processes required to manage the Funds effectively, noting that such personnel, systems and processes may not be present at other investment advisers. The Board considered, as applicable: (1) the Adviser's success in achieving each Fund's daily leveraged investment objective or daily inverse leveraged investment objective; (2) differences between managing leveraged and non-leveraged portfolios, which include developing index optimization and representative sampling investment strategies as well as specialized skills for trading complex financial instruments; (3) information regarding the Adviser's management of derivatives trading activities on behalf of the Funds, including the selection of swap counterparties and the negotiation of favorable derivatives contract terms; (4) the Adviser's ability to manage the Funds in a tax efficient manner, which is more challenging for leveraged than non-leveraged funds; and (5) the size, professional experience and skills of the Adviser's portfolio management staff and the Adviser's ability to recruit, train, and retain personnel with the relevant experience and expertise necessary to manage the Funds. The Board considered that the Adviser oversees all aspects of the operation of the Funds, including oversight of the Funds' service providers, and provides compliance services to the Funds.
Comparison of Advisory Services and Fees. The Board considered the fairness and reasonableness of the investment advisory fee rate payable to the Adviser by each Fund in light of the investment advisory services provided by the Adviser. In this regard, the Board also considered the ability of investors to achieve independently the investment objective of the Funds and the costs to investors of seeking to do so by utilizing a margin account or other means. In this regard, the Board reviewed information provided by the Adviser comparing the cost of ownership for shareholders to replicate the Funds' leveraged or inverse investment strategies by other means. The Board noted that an independent consultant had reviewed the cost comparison information and determined the methodology used to be comprehensive and to constitute a sound and objective approach to conducting the cost comparison analysis. The Board concluded that it would be time- and resource-intensive for an investor to implement independently any Fund's investment strategy. The Board also concluded that doing so would likely be cost-prohibitive. From this perspective, the Board noted the cost effectiveness for investors of employing the Funds to achieve their stated investment objectives.
The Board further considered the fairness and reasonableness of the investment advisory fee rate payable to the Adviser by each Fund in light of fee rates paid by other investment companies offering strategies similar in nature to the Fund. In this regard, the Board reviewed information prepared by the Adviser, using data provided by Morningstar, Inc., to compare the Funds' actual advisory fee rates, and gross and net total expenses with those of other funds with common key characteristics, such as asset size, investment objective or industry focus ("Peer Group"). The Board noted the difficulty in compiling a broad and diverse Peer Group because, by design, each Fund is unique and, therefore, few (if any) fund complexes have funds with substantially similar investment objectives and operations. They noted that an independent consultant had reviewed the Adviser's peer selection methodology and each Fund's resulting peers and determined that the methodology was reasonable and well within industry standards.
DIREXION ANNUAL REPORT
196
Direxion Shares ETF Trust
Board Review of Investment Advisory Agreement (Unaudited)
The Board noted that the comparison reports included the contractual advisory fee and net and gross total expense ratios for each Fund and each Peer Group fund. The Board considered that the Adviser had agreed to limit the total expenses of the Funds (subject to certain exclusions) for the next year by contractually agreeing to pay certain expenses of the Funds under a separate Operating Expense Limitation Agreement. Additionally, the Board considered that the Adviser had agreed to limit its Investment Advisory Fees at various net asset levels for certain Funds under the Advisory Fee Waiver Agreement.
Performance of the Funds. The Board focused on the correlation of each Fund's return to the model performance return for the periods ending June 30, 2022 and June 30, 2021 or since inception if a Fund did not have two full years of operations. In this regard, the Board considered each Fund's daily returns versus model returns ("Tracking Difference"), the standard deviation of the Tracking Differences ("Tracking Error"), and a tracking analysis provided by the Adviser. The Board also reviewed the total return of each Fund for the one-year or, if shorter, since inception period ended June 30, 2022. The Board considered reports provided to it in anticipation of the meeting, as well as performance reports provided at regular Board meetings throughout the year. The Board noted that the correlation of returns for each Fund to its model performance was generally within expected ranges during the reviewed periods. The Board considered that, given the investment objectives of the Funds, the correlation of each such Fund's performance with the model performance and/or Tracking Error were more meaningful indicia of the quality of the Adviser's management than a Fund's total return.
Costs of Services Provided to the Funds and Profits Realized by the Adviser. The Board reviewed information regarding the profitability of the Adviser based on the fee rates payable under the Agreement. The Board considered the profitability of each Fund and the overall profitability of the Adviser, as reflected in the Adviser's profitability analysis, as well as information provided by the Adviser concerning the methodology used to allocate various expenses. The Board also considered significant drivers of cost for the Adviser including, but not limited to, intellectual capital, the dedication of personnel resources to daily portfolio management activities, such as creation and redemption activity and the daily rebalancing of the portfolio to maintain each Fund's daily investment objective, regulatory compliance, and entrepreneurial risk. The Board further considered a report on other investment advisers' profitability, which was compiled using publicly available information. The Board recognized that it is difficult to compare profitability among investment advisory firms because certain information is not publicly available. Further, to the extent such information is available with respect to certain advisers, the Board acknowledged that it is often affected by numerous factors, including the nature of a firm's fund shareholder base, the structure of the adviser and its tax status, the types of funds it manages, its business mix, assumptions regarding allocations and the reporting of operating profits and net income net (rather than gross) of distribution and marketing expenses.
Economies of Scale. The Board considered the current breakpoints included in the Advisory Fee Waiver Agreement, which provide for reduced advisory fee rates for certain Funds when the assets of such a Fund reaches certain levels. The Board also considered the Adviser's explanation as to why these breakpoints appropriately reflect the Funds' economies of scale. In considering the asset levels of the Funds that have no breakpoints in the Advisory Fee Waiver Agreement with the Adviser, the Board considered the size of these Funds. Overall, the Board also acknowledged that the assets in the Funds often increase and decrease significantly, making stable economies of scale elusive.
Other Benefits. The Board considered indirect and "fall-out" benefits that the Adviser or its affiliates may derive from their relationship to the Funds. Such benefits include the Adviser's ability to leverage its investment management personnel or infrastructure to manage other accounts. In this regard, the Board noted that the Funds pay a fee to the Adviser under the Management Services Agreement.
Conclusion. Based on, but not limited to, the above considerations, the Board, including the Independent Trustees, determined that the Agreement for the Funds was fair and reasonable in light of the nature, extent and quality of the services to be performed, the fee rates to be paid, the Adviser's expenses and such other matters as the Board considered relevant in the exercise of its business judgment. Accordingly, the Board concluded that the continuation of the Agreement was in the best interests of the shareholders of the Funds. On this basis, the Board unanimously voted in favor of the renewal of the Agreement.
DIREXION ANNUAL REPORT
197
Direxion Shares ETF Trust
Board Review of Liquidity Risk Management Program (Unaudited)
Consistent with Rule 22e-4 under the Investment Company Act of 1940, as amended (the "Liquidity Rule"), the Direxion Shares ETF Trust (the "Trust"), on behalf of each series of the Trust (the "Funds"), established a liquidity risk management program (the "Liquidity Program") to assess and manage each Fund's liquidity risk, which is the risk that a Fund is unable to meet investor redemption requests without significantly diluting the remaining investors' interests in the Fund.
At its November 18, 2022 meeting, the Board of Trustees (the "Board") of the Trust reviewed the Liquidity Program. The Board has appointed Rafferty Asset Management, LLC, the investment advisor to the Funds, as the Liquidity Program administrator. At the meeting, Rafferty Asset Management, LLC provided the Board with a written report that addressed the operation of the Funds' Liquidity Program and assessed the adequacy and effectiveness of the implementation of the Liquidity Program (the "Report"). The Report covered the period from November 1, 2021 through October 31, 2022 (the "Report Period"). The Report noted the following:
• The Liquidity Program supported each Fund's ability to meet redemption requests timely;
• The Liquidity Program supported Rafferty Asset Management, LLC's management of each Fund's liquidity, including during periods of market volatility and net redemptions;
• No material liquidity issues were identified during the report period;
• There was one material change to the Liquidity Program during the Report Period to adjust each Fund's liquidity parameters to reflect more accurately each Fund's redemption activity; and
• The Liquidity Program operated adequately during the report period.
The Report also described the Liquidity Program's liquidity classification methodology for categorizing a Fund's investment (including derivative transactions) into one of four liquidity buckets as required by the Liquidity Rule. The Report stated that the Liquidity Program is operating as intended and is effective in implementing the requirements of the Liquidity Rule.
There can be no assurance that the Liquidity Program will achieve its objectives in the future. Please refer to your Fund's prospectus for more information regarding the Fund's exposure to liquidity risk and other risks.
DIREXION ANNUAL REPORT
198
Direxion Shares ETF Trust
Trustees and Officers (Unaudited)
The business affairs of the Funds are managed by or under the direction of the Board of Trustees. Information pertaining to the Trustees and Officers of the Funds is set below. The report includes additional information about the Funds' Trustees and Officers and is available without charge, upon request by calling 1-800-851-0511.
Interested Trustee
Name, Address and
Age | | Position(s)
Held with
Fund | | Term of Office
and Length of
Time Served | | Principal Occupation(s)
During Past Five Years | | # of Portfolios
in Direxion
Family of
Investment
Companies
Overseen
by Trustee(3) | | Other Trusteeships/
Directorships Held by
Trustee During Past
Five Years | |
Daniel D. O'Neill(1)
Age: 54 | |
Chairman of the Board of Trustees | |
Lifetime of Trust until removal or resignation; Since 2008 | |
Chief Executive Officer, Rafferty Asset Management, LLC, from 2021 – September 2022; Managing Director, Rafferty Asset Management, LLC, January 1999 – January 2019. | | |
144 | | |
None. | |
Angela Brickl(2)
Age: 46 | |
Trustee | |
Lifetime of Trust until removal or resignation; Since 2022 | |
President, Rafferty Asset Management, LLC, from September 2022; Chief Operating Officer, Rafferty Asset Management, LLC, May 2021 – September 2022; General Counsel, Rafferty Asset Management LLC, since October 2010; Chief Compliance Officer, Rafferty Asset Management, LLC, since September 2012. | | |
144 | | |
None. | |
Independent Trustees
Name, Address and
Age | | Position(s)
Held with
Fund | | Term of Office
and Length of
Time Served | | Principal Occupation(s)
During Past Five Years | | # of Portfolios
in Direxion
Family of
Investment
Companies
Overseen
by Trustee(2) | | Other Trusteeships/
Directorships Held by
Trustee During Past
Five Years | |
David L. Driscoll
Age: 53 | |
Trustee | |
Lifetime of Trust until removal or resignation; Since 2014 | |
Partner, King Associates, LLP, since 2004; Board Advisor, University Common Real Estate, since 2012; Principal, Grey Oaks LLP since 2003; Member, Kendrick LLC, since 2006. | | |
144 | | |
None. | |
(1) Mr. O'Neill is affiliated with Rafferty and Direxion. Mr. O'Neill owns a beneficial interest in Rafferty.
(2) Ms. Brickl is affiliated with Rafferty because she serves as an officer of Rafferty.
(3) The Direxion Family of Investment Companies consists of the Direxion Shares ETF Trust which, as of the date of this report, offers for sale to the public 87 of the 134 funds registered with the SEC and the Direxion Funds which, as of the date of this report, offers for sale to the public 10 funds registered with the SEC.
DIREXION ANNUAL REPORT
199
Direxion Shares ETF Trust
Trustees and Officers (Unaudited)
Name, Address and
Age | | Position(s)
Held with
Fund | | Term of Office
and Length of
Time Served | | Principal Occupation(s)
During Past Five Years | | # of Portfolios
in Direxion
Family of
Investment
Companies
Overseen
by Trustee(2) | | Other Trusteeships/
Directorships Held by
Trustee During Past
Five Years | |
Jacob C. Gaffey
Age: 74 | |
Trustee | |
Lifetime of Trust until removal or resignation; Since 2014 | |
Managing Director of Loomis & Co. since 2012; Partner, Bay Capital Advisors, LLC 2008 – 2012. | |
144 | |
None. | |
Henry W. Mulholland
Age: 59 | |
Trustee | |
Lifetime of Trust until removal or resignation; Since 2017 | |
Grove Hill Partners LLC, since 2016 as Managing Partner; Bank of America Merrill Lynch, 1990 – 2015, most recently as Managing Director and Head of Equities for Americas. | |
144 | |
None. | |
Kathleen M. Berkery
Age: 55 | |
Trustee | |
Lifetime of Trust until removal or resignation; Since 2019 | |
Chief Financial Officer, Student Sponsor Partners, since November 2021; Senior Manager- Trusts & Estates, Rynkar, Vail & Barrett, LLC, since 2018; Financial Advisor, Lee, Nolan & Koroghlian Life Planning Group, 2010 – 2017. | |
144 | |
None. | |
Carlyle Peake
Age: 51 | |
Trustee | |
Lifetime of Trust until removal or resignation; Since 2022 | |
Head of US & LATAM Debt Syndicate, BBVA Securities, Inc., since 2011. | |
144 | |
None. | |
Mary Jo Collins
Age: 66 | |
Trustee | |
Lifetime of Trust until removal or resignation; Since 2022 | |
Managing Director, Imperial Capital LLC, since 2020; Director, Royal Bank of Canada, 2014 – 2020. | |
144 | |
None. | |
(2) The Direxion Family of Investment Companies consists of the Direxion Shares ETF Trust which, as of the date of this report, offers for sale to the public 87 of the 134 funds registered with the SEC and the Direxion Funds which, as of the date of this report, offers for sale to the public 10 funds registered with the SEC.
DIREXION ANNUAL REPORT
200
Direxion Shares ETF Trust
Trustees and Officers (Unaudited)
The officers of the Trust conduct and supervise its daily business. Unless otherwise noted, an individual's business address is 1301 Avenue of the Americas, 28th Floor, New York, New York 10019. As of the date of this report, the officers of the Trust, their ages, their business address and their principal occupations during the past five years are as follows:
Principal Officers of the Trust
Name, Address and
Age | | Position(s)
Held with
Fund | | Term of Office
and Length of
Time Served | | Principal Occupation(s)
During Past Five Years | | # of Portfolios
in Direxion
Family of
Investment
Companies
Overseen
by Trustee(2) | | Other Trusteeships/
Directorships Held by
Trustee During Past
Five Years | |
Angela Brickl
Age: 46 | |
President
Chief Compliance Officer | |
One Year; Since 2022
One Year; Since 2018 | |
President, Rafferty Asset Management, LLC, from September 2022; Chief Operating Officer, Rafferty Asset Management, LLC, May 2021 – September 2022; General Counsel, Rafferty Asset Management LLC, since October 2010; Chief Compliance Officer, Rafferty Asset Management, LLC, since September 2012. | |
N/A | |
N/A | |
Patrick J. Rudnick
Age: 49 | |
Principal Executive Officer | |
One Year; Since 2018 | |
Senior Vice President, since March 2013, Rafferty Asset Management, LLC; Senior Vice President, since November 2017, Direxion Advisors, LLC. | |
N/A | |
N/A | |
Corey Noltner
Age: 33 | |
Principal Financial Officer | |
One Year; Since 2021 | |
Senior Business Analyst, Rafferty Asset Management, LLC, since October 2015. | |
N/A | |
N/A | |
Alyssa Sherman
Age: 33 | |
Secretary | |
One Year; Since 2022 | |
Associate General Counsel, Rafferty Asset Management, LLC, since April 2021; Associate, K&L Gates LLP, September 2015 – March 2021. | |
N/A | |
N/A | |
(1) Ms. Brickl serves on the Board of Trustees of the Direxion Funds and Direxion Shares ETF Trust.
(2) The Direxion Family of Investment Companies consists of the Direxion Shares ETF Trust which, as of the date of this SAI, offers for sale to the public 87 of the 134 funds registered with the SEC and the Direxion Funds which, as of the date of this SAI, offers for sale to the public 10 funds registered with the SEC.
DIREXION ANNUAL REPORT
201

ANNUAL REPORT OCTOBER 31, 2022
1301 Avenue of the Americas (6th Ave.), 28th Floor New York, New York 10019 (800) 851-0511 www.direxioninvestments.com
Investment Adviser
Rafferty Asset Management, LLC
1301 Avenue of the Americas (6th Ave.), 28th Floor
New York, NY 10019
Administrator
U.S. Bancorp Fund Services, LLC
P.O. Box 1993
Milwaukee, WI 53201-1993
Transfer Agent, Custodian & Index Receipt Agent
The Bank of New York Mellon
101 Barclay Street
New York, New York 10286
Independent Registered Public Accounting Firm
Ernst & Young LLP
700 Nicollet Mall, Suite 500
Minneapolis, MN 55402
Distributor
Foreside Fund Services, LLC
3 Canal Plaza, Suite 100
Portland, Maine 04101
www.foreside.com
The Trust's Proxy Voting Policies are available without charge by calling 1-800-851-0511, or by accessing the SEC's website, at www.sec.gov.
The actual voting records relating to portfolio securities during the most recent period ended June 30 (starting with the year ended June 30, 2005) is available without charge by calling 1-800-851-0511 or by accessing the SEC's website at www.sec.gov.
Each Fund's premium/discount information is available free of charge on the Funds' website, www.direxioninvestments.com or by calling (800) 851-0511.
The Trust files complete schedule of portfolio holdings with the SEC for its first and third fiscal quarters on Part F of Form N-PORT. The Funds' Part F of Form N-PORT (and Form N-Q prior to April 30, 2019) is available on the SEC's website at www.sec.gov.
This report has been prepared for shareholders and may be distributed to others only if preceded or accompanied by a current prospectus.
At the Direxion Funds, we are committed to protecting your privacy. To open and service your Direxion accounts, we collect and maintain certain nonpublic personal information about you, such as your address, phone number, social security number, purchases, sales, account balances, bank account information and other personal financial information. We collect this information from the following sources:
• Account applications or other forms on which you provide information,
• Mail, e-mail, the telephone and our website, and
• Your transactions and account inquiries with us.
We safeguard the personal information that you have entrusted to us in the following ways:
• As a general policy, only those employees who maintain your account and respond to your requests for additional services have access to your account information.
• We maintain physical, electronic, and procedural safeguards to insure the security of your personal information and to prevent unauthorized access to your information.
We do not disclose any nonpublic personal information about you or our former shareholders to anyone, except as permitted or required by law. In the course of conducting business and maintaining your account we may share shareholder information, as allowed by law, with our affiliated companies and with other service providers, including financial intermediaries, custodians, transfer agents and marketing consultants. Those companies are contractually bound to use that information only for the services for which we hired them. They are not permitted to use or share our shareholders' nonpublic personal information for any other purpose. There also may be times when we provide information to federal, state or local authorities as required by law.
In the event that you hold fund shares of Direxion through a financial intermediary, including, but not limited to, a broker-dealer, bank, or trust company, the privacy policy of your financial intermediary would govern how your nonpublic personal information would be shared with nonaffiliated third parties.
For questions about our policy, please contact us at (800) 851-0511.
This page is not a part of the Annual Report.
DIREXION ANNUAL REPORT


DIREXION SHARES ETF TRUST
ANNUAL REPORT OCTOBER 31, 2022
1301 Avenue of the Americas (6th Ave.), 28th Floor New York, New York 10019 www.direxioninvestments.com
| 3X BULL FUNDS | | 3X BEAR FUNDS | |
| Direxion Daily Mid Cap Bull 3X Shares | | | | | |
| Direxion Daily S&P 500® Bull 3X Shares | | Direxion Daily S&P 500® Bear 3X Shares | |
| Direxion Daily Small Cap Bull 3X Shares | | Direxion Daily Small Cap Bear 3X Shares | |
| Direxion Daily FTSE China Bull 3X Shares | | Direxion Daily FTSE China Bear 3X Shares | |
| Direxion Daily FTSE Europe Bull 3X Shares | | | | | |
| Direxion Daily MSCI Emerging Markets Bull 3X Shares | | Direxion Daily MSCI Emerging Markets Bear 3X Shares | |
| Direxion Daily MSCI Mexico Bull 3X Shares | | | | | |
| Direxion Daily MSCI South Korea Bull 3X Shares | | | | | |
| Direxion Daily Aerospace & Defense Bull 3X Shares | | | | | |
| Direxion Daily Consumer Discretionary Bull 3X Shares | | | | | |
| Direxion Daily Dow Jones Internet Bull 3X Shares | | Direxion Daily Dow Jones Internet Bear 3X Shares | |
| Direxion Daily Financial Bull 3X Shares | | Direxion Daily Financial Bear 3X Shares | |
| Direxion Daily Healthcare Bull 3X Shares | | | | | |
| Direxion Daily Homebuilders & Supplies Bull 3X Shares | | | | | |
| Direxion Daily Industrials Bull 3X Shares | | | | | |
| Direxion Daily Pharmaceutical & Medical Bull 3X Shares | | | | | |
| Direxion Daily Real Estate Bull 3X Shares | | Direxion Daily Real Estate Bear 3X Shares | |
| (formerly Direxion Daily MSCI Real Estate Bull 3X Shares) | | (formerly Direxion Daily MSCI Real Estate Bear 3X Shares) | |
| Direxion Daily Regional Banks Bull 3X Shares | | | | | |
| Direxion Daily Retail Bull 3X Shares | | | | | |
| Direxion Daily S&P 500® High Beta Bull 3X Shares | | Direxion Daily S&P 500® High Beta Bear 3X Shares | |
| Direxion Daily S&P Biotech Bull 3X Shares | | Direxion Daily S&P Biotech Bear 3X Shares | |
| Direxion Daily Semiconductor Bull 3X Shares | | Direxion Daily Semiconductor Bear 3X Shares | |
| Direxion Daily Technology Bull 3X Shares | | Direxion Daily Technology Bear 3X Shares | |
| Direxion Daily Transportation Bull 3X Shares | | | | | |
| Direxion Daily Utilities Bull 3X Shares | | | | | |
| Direxion Daily 7-10 Year Treasury Bull 3X Shares | | Direxion Daily 7-10 Year Treasury Bear 3X Shares | |
| Direxion Daily 20+ Year Treasury Bull 3X Shares | | Direxion Daily 20+ Year Treasury Bear 3X Shares | |
You can find a Fund's prospectus, reports to shareholders, and other information about the Fund online at http://www.direxioninvestments.com/regulatory-documents. You can also get this information at no cost by calling (800) 851-0511 or by sending an email request to info@direxionfunds.com.
| Letter to Shareholders (Unaudited) | | | 4 | | |
| Performance Summary (Unaudited) | | | 15 | | |
| Expense Example (Unaudited) | | | 55 | | |
| Allocation of Portfolio Holdings (Unaudited) | | | 58 | | |
| Schedules of Investments | | | 59 | | |
| Statements of Assets and Liabilities | | | 124 | | |
| Statements of Operations | | | 134 | | |
| Statements of Changes in Net Assets | | | 144 | | |
| Financial Highlights | | | 164 | | |
| Notes to the Financial Statements | | | 170 | | |
Report of Independent Registered Public
Accounting Firm | | | 207 | | |
| Supplemental Information (Unaudited) | | | 210 | | |
Board Review of Investment Advisory
Agreement (Unaudited) | | | 212 | | |
Board Review of Liquidity Risk Management
Program (Unaudited) | | | 215 | | |
| Trustees and Officers (Unaudited) | | | 216 | | |
Help Preserve the Environment – Go Green!
Go paperless with Direxion e-Delivery – a service allowing shareholders to reduce clutter with full online access to regulatory documents. Begin the preservation process with e-delivery.
With Direxion e-Delivery, you can:
• Receive email notifications when your most recent shareholder communications are available for review.
• Access prospectuses, annual reports and semi-annual reports online.
It's easy to enroll:
1. Visit www.direxioninvestments.com/edelivery
2. Follow the simple enrollment instructions
If you have questions about Direxion e-Delivery services, contact one of our shareholder representatives at 800-851-0511.


Letter to Shareholders (Unaudited)
Dear Shareholders,
This Annual Report for the Direxion Shares exchange-traded funds (the "ETFs") covers the period from November 1, 2021 to October 31, 2022 (the "Annual Period").
Market Review:
Signs of broad-based inflation began in the fall of 2021, leading to a shaky global equity market environment. At the time, most experts predicted inflation levels were transitory, quelling investor concerns temporarily. Equity markets began to pick up through December, ending the year on a high. However, it soon became clear the widespread inflation was not going anywhere and the Federal Reserve announced an acceleration of monetary policy that was implemented through a series of interest rate hikes to combat inflation. Simultaneously, the highly contagious Covid-19 Omicron variant spread across the world and, despite high vaccination rates, breakthrough infections were at an all-time high. However, by the end of the Annual Period, Covid was far less of a concern for investors. Just as markets were looking up again, with the S&P 500 posting its first monthly gain in March 2022, Russia invaded Ukraine, and the effects of the invasion rippled across equity markets, as energy prices surged and fears of wider-spread conflict grew. In response, the United States and other western nations imposed extreme economic sanctions on Russia. Markets were very volatile on the heels of the Russian invasion, and the first two quarters of 2022 saw a shrinking U.S. GDP. June earnings reports were surprisingly strong, despite a mid-month S&P low. Despite these numbers, July was a strong month, but this positive sentiment did not last long. A hawkish speech from Federal Reserve Chair, Jerome Powell, in August negatively impacted markets around the world. September was another rough month for equities, with both the S&P 500 and NASDAQ dropping roughly 10%. Global markets fared no better, as the UK entered a recession, and China faced mass protests and unrest. October saw a modest increase in stocks as the Federal Reserve indicated it will pull back on its aggressive tightening in the near future after positive third quarter readings, but overall sentiment was still generally low. Investors are pivoting towards more risk-off investments in an attempt to navigate historic inflation levels, geopolitical conflict and high interest rates, although traditional safe haven investments, such as commodities, are less appealing than they have been in the past.
The U.S. bond market was in consistent decline for the majority of the Annual Period, oftentimes diverging from trends in the equities markets. In the fall, treasuries and international bonds were experiencing the worst performance of the Annual Period, as concerns over rising interest rates and inflation began. As inflation worsened and proved to be less transitory than initially predicted, central banks around the world pivoted towards more hawkish policies. In December, the Federal Reserve announced there would be three or four rate hikes throughout 2022, as well as a tapering of U.S. treasury asset purchases. In late February, the Russian invasion of Ukraine rippled through the global financial system, including fixed income markets. The U.S. Treasury yield curve started to flatten as the 10-20 year bond spread grew and became inverted. While bonds have typically been considered a way to hedge a portfolio against equities, this strategy has not typically held true in the current market environment. After the positive indication that the Federal Reserve is starting to get a handle on inflation, the global bond market saw a slight rebound, but the yield curve remained inverted at the end of the Annual Period, which remains a concern for many investors.
Direxion Shares Operational Review:
The discussion below relates to the performance of the ETFs for the Annual Period. The ETFs are leveraged and seek daily investment results, before fees and expenses, of 300% or -300% of the performance of a particular benchmark. All ETF returns are NAV (net asset value) returns.
The ETFs, as stated above, seek daily investment results. They do not seek to track a multiple of their respective benchmarks for periods longer than one day and the performance of the ETFs over longer periods may not correlate to their benchmarks' performance. The ETFs should not be held by investors for long periods and should be used as short-term trading vehicles. These products are not suitable for all investors, and should be utilized only by sophisticated investors who understand the
DIREXION ANNUAL REPORT
4
risks associated with the use of leverage, the consequences of seeking daily leveraged investment results and intend to actively monitor and manage their investments.
The ETFs with the word "Bull" in their name (the "Bull ETFs"), attempt to provide investment results that correlate to 300%, before fees and expenses, of the daily performance of a benchmark index, meaning the Bull Funds attempt to move in the same direction as their respective target benchmark index.
The Funds with the word "Bear" in their name (the "Bear ETFs"), attempt to provide investment results that correlate to -300%, before fees and expenses, of the daily performance of a benchmark index, meaning that the Bear Funds attempt to move in the opposite, or inverse, direction of their respective target benchmark index.
In seeking to achieve each ETF's daily investment results, Rafferty Asset Management, LLC ("Rafferty" or the "Adviser"), relies upon a pre-determined investment model to generate orders resulting in repositioning each ETF's investments in accordance with its daily investment objective. Using this approach, Rafferty determines the type, quantity and mix of investment positions that it believes in combination should produce daily returns consistent with an ETF's objective. As a consequence, if an ETF is performing as designed, the return of the benchmark index will dictate the return for that ETF. Each ETF pursues its investment objective regardless of market conditions and does not take defensive positions.
Each ETF has a clearly articulated goal which requires the ETF to seek economic exposure significantly in excess of its net assets. To meet its objectives, each ETF invests in some combination of financial instruments, including derivatives. Each ETF invests significantly in derivatives, including swap agreements. Rafferty uses these types of investments to produce economically "leveraged" investment results. Leveraging allows Rafferty to generate a greater positive or negative return than what would be generated on the invested capital without leverage, thus changing small market movements into larger changes in the value of the investments of an ETF.
The ETFs may use certain investment techniques, including investments in derivatives, which may be considered aggressive. Investments in derivatives in general are subject to market risks that may cause their prices to fluctuate dramatically over time. Additionally, use of such instruments may increase the volatility of the ETFs. The use of derivatives may expose the ETFs to additional risks that they would not be subject to if they invested directly in the securities underlying those derivatives, such as counterparty risk. The use of derivatives may result in larger losses or smaller gains than otherwise would be the case.
Because each ETF seeks daily investment results of its relevant benchmark, a comparison of the return of the ETF to the relevant benchmark tells you little about whether an ETF has met its investment objective. To determine if an ETF has met its daily investment goals, Rafferty maintains models which indicate the expected performance of each ETF as compared to the underlying relevant index. The models do not take into account the ETF's expense ratio or any transaction or trading fees associated with creating or maintaining an ETF's portfolio.
Factors Affecting Direxion Shares Performance:
Benchmark Performance – The daily performance of each ETF's benchmark index, and the factors and market conditions implicitly affecting that index, are the primary factors driving ETF performance. Given the daily goals, the series of daily index returns are most important. The market conditions that affected the benchmark indexes during the past year are described below.
Leverage – Each ETF seeks daily investment results (before fees and expenses) of either 300% (for the Bull ETFs) or -300% (for the Bear ETFs) of the daily performance of its respective underlying index. The use of leverage magnifies an ETF's gains or losses and increases the investment's risk and volatility. The Bear ETFs seek to achieve inverse magnified correlation to their respective underlying indexes.
Volatility and Compounding – The goal of leveraged ETFs is to provide a multiple of the daily return of an underlying index. Over periods longer than a single day, an ETF should not be expected to provide its respective multiple of the return of the underlying index. Due to the effects of compounding, a universal mathematical concept that applies to all investments,
DIREXION ANNUAL REPORT
5
returns of the ETFs over longer periods are greater or less than the ETF's daily stated goal. Periods of high volatility that lack a clear trend hurt an ETF's performance while trending, low volatility markets enhance an ETF's performance.
Cost of Financing – In order to attain leveraged exposure, a Bull ETF incurs a cost of SOFR plus or minus a spread and a Bear ETF receives SOFR plus or minus a spread as applied to the borrowed portion of the ETF's exposure. The spread varies by both Fund and counterparty and is a function of market demand, hedging costs, access to balance sheet, borrow volatility, current counterparty exposure and administrative costs associated with the swap counterparty. Generally for most of the Bull ETFs, the financing costs will have a negative effect on tracking, but for Bear ETFs, the financing cost will have a positive effect on tracking. An increase in interest rates which effects the cost of financing will further impact an ETF's performance and ability to track its index.
Optimized Baskets – Each Bull ETF holds a basket of equities designed to provide returns that track its underlying index. In order to decrease transaction costs, certain Bull ETFs hold only a representative sample, or optimized basket, that tracks closely over time, but deviates from its underlying index in the short-term.
Equity Dividends and Bond Interest – Equity Bull ETFs are positively impacted by equity and index dividends as the ETFs receive those payments. Equity Bear ETFs are negatively impacted as they are obligated to pay the dividends. Treasury Bull ETFs receive interest, accrued on a daily basis, to account for the Treasury's semi-annual coupon payments while the Treasury Bear ETFs pay interest, accrued on a daily basis.
Fees, Expenses, and Transaction Costs – Fees and expenses are listed in each ETF's prospectus and may be higher than many traditional index ETFs' fees, which cause a greater negative impact on ETF performance. Transactions costs are not included in the expense ratio of the ETFs. Transaction costs can be higher due to the ETF's use of leverage, frequent creation and redemption activity, or trading securities that are comparatively less liquid.
Direxion Shares Performance Review:
The Direxion Daily Mid Cap Bull 3X Shares seeks to provide 300% of the daily return of the S&P MidCap 400® Index. The S&P MidCap 400® Index is a float-adjusted market capitalization weighted index that attempts to measure the performance of 400 mid-sized companies in the United States. For the Annual Period, the S&P MidCap 400® Index returned -11.54%. Given the daily investment objectives of the ETF and the path dependency of returns for longer periods, the annual return of the index alone should not generate expectations of annual performance of the ETF. The Direxion Daily Mid Cap Bull 3X Shares returned -45.19%, while the model indicated an expected return of -42.72%.
The Direxion Daily S&P 500® Bull 3X Shares and the Direxion Daily S&P 500® 3X Bear Shares seek to provide 300% and -300%, respectively, of the daily return of the S&P 500® Index. Standard & Poor's® selects the stocks comprising the S&P 500® Index on the basis of market capitalization, financial viability of the company and the public float, liquidity and price of a company's shares outstanding. The Index is a float-adjusted, market capitalization-weighted index. For the Annual Period, the S&P 500® Index returned -14.61%. Given the daily investment objectives of the ETFs and the path dependency of returns for longer periods, the annual return of the index alone should not generate expectations of annual performance of the ETFs. The Direxion Daily S&P 500® Bull 3X Shares returned -49.27%, while the model indicated an expected return of -47.01%. The Direxion Daily S&P 500® Bear 3X Shares returned 20.66%, while the model indicated an expected return of 17.09%.
The Direxion Daily Small Cap Bull 3X Shares and the Direxion Daily Small Cap Bear 3X Shares seek to provide 300% and -300%, respectively, of the daily return of the Russell 2000® Index. The Russell 2000® Index measures the performance of approximately 2,000 small-capitalization companies in the Russell 3000® Index, based on a combination of their market capitalization and current index membership. For the Annual Period, the Russell 2000® Index returned -18.54%. Given the daily investment objectives of the ETFs and the path dependency of returns for longer periods, the annual return of the index alone should not generate expectations of annual performance of the ETFs. The Direxion Daily Small Cap Bull 3X Shares returned -58.86%, while the model indicated an expected return of -57.12%. The Direxion Daily Small Cap Bear 3X Shares returned 20.23%, while the model indicated an expected return of 17.23%.
DIREXION ANNUAL REPORT
6
The Direxion Daily FTSE China Bull 3X Shares and the Direxion Daily FTSE China Bear 3X Shares seek to provide 300% and -300%, respectively, of the daily return of the FTSE China 50 Index. The FTSE China 50 Index consists of the 50 largest and most liquid public Chinese companies currently trading on the Hong Kong Stock Exchange. Securities in the index are weighted based on the total market value of their shares, so that securities with higher total market values will generally have a higher representation in the index. Index constituents are screened for liquidity and weightings and are capped to prevent the index from being overly concentrated in any one stock. For the Annual Period, the FTSE China 50 Index returned -47.45%. Given the daily investment objectives of the ETFs and the path dependency of returns for longer periods, the annual return of the index alone should not generate expectations of annual performance of the ETFs. The Direxion Daily FTSE China Bull 3X Shares returned -91.06%, while the model indicated an expected return of -90.69%. The Direxion Daily FTSE China Bear 3X Shares returned 126.33%, while the model indicated an expected return of 118.42%. Deviation from the model may be due to a combination of asset fluctuation, expenses, transaction costs, including swap contract related costs and underlying index volatility.
The Direxion Daily FTSE Europe Bull 3X Shares seeks to provide 300% of the daily return of the FTSE Developed Europe All Cap Index. The FTSE Developed Europe All Cap Index is a market capitalization weighted index that is designed to measure the equity market performance of large-, mid- and small-cap companies in developed markets in Europe. For the Annual Period, the FTSE Developed Europe All Cap Index returned -24.55%. Given the daily investment objectives of the ETF and the path dependency of returns for longer periods, the annual return of the index alone should not generate expectations of annual performance of the ETF. The Direxion Daily FTSE Europe Bull 3X Shares returned -66.00%, while the model indicated an expected return of -64.32%.
The Direxion Daily MSCI Emerging Markets Bull 3X Shares and the Direxion Daily MSCI Emerging Markets Bear 3X Shares seek to provide 300% and -300%, respectively, of the daily return of the MSCI Emerging Markets IndexSM. The MSCI Emerging Market IndexSM is a free float-adjusted market capitalization index that is designed to represent the performance of large-and mid-capitalizations securities across 24 emerging markets countries. For the Annual Period, the MSCI Emerging Market IndexSM returned -31.03%. Given the daily investment objectives of the ETFs and the path dependency of returns for longer periods, the annual return of the index alone should not generate expectations of annual performance of the ETFs. The Direxion Daily Emerging Markets MSCI Bull 3X Shares returned -73.37%, while the model indicated an expected return of -72.02%. Deviation from the model may be due to a combination of asset fluctuation, expenses, transaction costs, including swap contract related costs and underlying index volatility. The Direxion Daily MSCI Emerging Markets Bear 3X Shares returned 132.00%, while the model indicated an expected return of 126.87%.
The Direxion Daily MSCI Mexico Bull 3X Shares seeks to provide 300% of the daily return of the MSCI Mexico IMI 25/50 Index. The MSCI Mexico IMI 25/50 Index is designed to measure the performance of the large-, mid- and small-capitalization segments of the Mexican equity market, covering approximately 99% of the free float-adjusted market capitalization in Mexico. The index consists of stocks traded primarily on the Mexican Stock Market. For the Annual Period, the MSCI Mexico IMI 25/50 Index returned 7.73%. Given the daily investment objectives of the ETF and the path dependency of returns for longer periods, the annual return of the index alone should not generate expectations of annual performance of the ETF. The Direxion Daily MSCI Mexico Bull 3X Shares returned 6.35%, while the model indicated an expected return of 7.72%.
The Direxion Daily MSCI South Korea Bull 3X Shares seeks to provide 300% of the MSCI Korea 25/50 Index. The MSCI Korea 25/50 Index is designed to measure the performance of the large- and mid-cap segments of the South Korean equity market, covering approximately 85% of the free float-adjusted market capitalization of South Korean issuers. For the Annual Period, the MSCI Korea 25/50 Index returned -33.60%. Given the daily investment objectives of the ETF and the path dependency of returns for longer periods, the annual return of the index alone should not generate expectations of annual performance of the ETF. The Direxion Daily MSCI South Korea Bull 3X Shares returned -76.86%, while the model indicated an expected return of -75.75%.
The Direxion Daily Aerospace & Defense Bull 3X Shares seeks to provide 300% of the daily return of the Dow Jones U.S. Select Aerospace & Defense Index. The Dow Jones U.S. Select Aerospace & Defense Index is provided by Dow Jones U.S. Index. The index attempts to measure the performance of the aerospace and defense industry of the U.S. equity market. The index provider selects the stocks comprising the index from the aerospace and defense sector on the basis of the float-adjusted, market
DIREXION ANNUAL REPORT
7
capitalization-weight of each constituent. Aerospace companies include manufacturers, assemblers and distributors of aircraft and aircraft parts. Defense companies include producers of components and equipment for the defense industry, such as military aircraft, radar equipment and weapons. For the Annual Period, the Dow Jones U.S. Select Aerospace & Defense Index returned 4.07%. Given the daily investment objectives of the ETF and the path dependency of returns for longer periods, the annual return of the index alone should not generate expectations of annual performance of the ETF. The Direxion Daily Aerospace & Defense Bull 3X Shares returned -10.07% for the same period, while the model indicated an expected return of -5.84%.
The Direxion Daily Consumer Discretionary Bull 3X Shares seeks to provide 300% of the daily return of the Consumer Discretionary Select Sector Index. The Consumer Discretionary Select Sector Index is provided by S&P Dow Jones Indices and includes domestic companies from the consumer discretionary sector which includes the following industries: retail (specialty, multiline, internet & direct marketing); hotels, restaurants & leisure; textiles, apparel & luxury goods; household durables; automobiles; automobile components; distributors; leisure equipment & products; and diversified consumer services. For the Annual Period, the Consumer Discretionary Select Sector Index returned -27.80%. Given the daily investment objectives of the ETF and the path dependency of returns for longer periods, the annual return of the index alone should not generate expectations of annual performance of the ETF. The Direxion Daily Consumer Discretionary Bull 3X Shares returned -74.51% for the same period, while the model indicated an expected return of -73.25%.
The Direxion Daily Dow Jones Internet Bull 3X Shares and the Direxion Daily Dow Jones Internet Bear 3X Shares seek to provide 300% and -300%, respectively, of the daily return of the Dow Jones Internet Composite Index. The Dow Jones Internet Composite Index includes companies that generate at least 50% of their annual sales/revenue from the internet as determined by the Index Provider. Additionally, each stock must have a minimum of three months' trading history and a three month average market capitalization of at least $100 million. The Index consists of 40 stocks that are included in two different sectors, internet commerce and internet services. For the Annual Period, the Dow Jones Internet Composite Index returned -47.01%. Given the daily investment objectives of the ETFs and the path dependency of returns for longer periods, the annual return of the index alone should not generate expectations of annual performance of the ETFs. The Direxion Daily Dow Jones Internet Bull 3X Shares returned -91.32%, while the model indicated an expected return of -90.90%. The Direxion Daily Dow Jones Internet Bear 3X Shares returned 165.69%, while the model indicated an expected return of 159.08%. Deviation from the model may be due to a combination of asset fluctuation, expenses, transaction costs, including swap contract related costs and underlying index volatility.
The Direxion Daily Financial Bull 3X Shares and the Direxion Daily Financial Bear 3X Shares (the "Financial ETFs") seek to provide 300% and -300%, respectively, of the daily return of the Financial Select Sector Index. The Financial Select Sector Index is provided by S&P Dow Jones Indices and includes securities of companies from the following industries: Banks; Thrifts & Mortgage Finance; Diversified Financial Services; Consumer Finance; Capital Markets; Insurance; and Mortgage Real Estate Investment Trusts (REITs). From August 1, 2022 through October 31, 2022, the Financial Select Sector Index returned 1.21%. Given the daily investment objectives of the ETFs and the path dependency of returns for longer periods, the annual return of the index alone should not generate expectations of annual performance of the ETFs. During this period, the Direxion Daily Financial Bull 3X Shares returned -3.48%, while the model indicated an expected return of -1.44%. The Direxion Daily Financial Bear 3X Shares returned -10.89%, while the model indicated an expected return of -13.05%.
From February 28, 2022 through July 31, 2022, the Financial ETFs sought to provide 300% and -300%, respectively, of the daily return of the Russell 1000 Financials 40 Act 15/22.5 Daily Capped Index. The Russell 1000 Financials 40 Act 15/22.5 Daily Capped Index is a subset of the Russell 1000® Index and measures the performance of US large capitalization companies that are assigned to the Financials Industry by the ICB sector classification framework. The Index is reviewed quarterly and at each review, all companies that have a weight greater than 4.5% in aggregate are no more than 22.5% of the index, and no individual company in the index has a weight greater than 15% of the index. From February 28, 2022 through July 31, 2022, the Russell 1000 Financials 40 Act 15/22.5 Daily Capped Index returned -11.93%. Given the daily investment objectives of the Financial ETFs and the path dependency of returns for longer periods, the annual return of the index alone should not generate expectations of annual performance of the ETFs. During this period, the Direxion Daily Financial Bull 3X Shares returned -38.76%, while the model indicated an expected return of -37.66% and the Direxion Daily Financial Bear 3X Shares returned 23.88%, while the model indicated an expected return of 22.19%.
DIREXION ANNUAL REPORT
8
From November 1, 2021 through February 27, 2022, the Financial ETFs sought to provide 300% and -300%, respectively, of the daily return of the Russell 1000® Index – Financials. The Russell 1000® Index – Financials is a subset of the Russell 1000® Index that measures the performance of the securities classified in the financial services sector of the large-capitalization U.S. equity market. This includes companies that are classified as banking, mortgage finance, consumer finance, specialized finance, investment banking and brokerage, asset management and custody, corporate lending, insurance, financial investments, and real estate, including real estate investment trusts (REITS). From November 1, 2021 through February 27, 2022, the Russell 1000® Index – Financials returned -3.06%. Given the daily investment objectives of the ETFs and the path dependency of returns for longer periods, the annual return of the index alone should not generate expectations of annual performance of the ETFs. During this period, the Direxion Daily Financial Bull 3X Shares returned -13.07%, while the model indicated an expected return of -12.33% and the Direxion Daily Financial Bear 3X Shares returned 1.69%, while the model indicated an expected return of 1.70%.
The Direxion Daily Healthcare Bull 3X Shares seeks to provide 300% of the daily return of the Health Care Select Sector Index. The Health Care Select Sector Index is provided by Standard & Poor's and includes domestic companies from the healthcare sector, which includes the following industries: pharmaceuticals; health care equipment and supplies; health care providers and services; biotechnology; life sciences tools and services; and health care technology. For the Annual Period, the Health Care Select Sector Index returned 0.81%. Given the daily investment objectives of the ETF and the path dependency of returns for longer periods, the annual return of the index alone should not generate expectations of annual performance of the ETF. The Direxion Daily Healthcare Bull 3X Shares returned -11.85%, while the model indicated an expected return of -7.67%.
The Direxion Daily Homebuilders & Supplies Bull 3X Shares seeks to provide 300% of the daily return of the Dow Jones U.S. Select Home Construction Index. The Dow Jones U.S. Select Home Construction Index measures U.S companies in the home construction sector that provide a wide range of products and services related to homebuilding, including home construction and producers, sellers and suppliers of building materials, furnishings and fixtures and also home improvement retailers. The index may include large-, mid- or small-capitalization companies. For the Annual Period, the Dow Jones U.S. Select Home Construction Index returned -20.91%. Given the daily investment objectives of the ETF and the path dependency of returns for longer periods, the annual return of the index alone should not generate expectations of annual performance of the ETF. The Direxion Daily Homebuilders & Supplies Bull 3X Shares -68.50%, while the model indicated an expected return of -66.99%.
The Direxion Daily Industrials Bull 3X Shares seeks to provide 300% of the daily return of the Industrials Select Sector Index. The Industrials Select Sector Index is provided by S&P Dow Jones Indices and includes domestic companies from the industrials sector which includes the following industries: aerospace and defense: industry conglomerates; machinery; road and rail; air freight and logistics; commercial services and supplies; professional services; electrical equipment; construction and engineering; trading companies and distributors; airlines; and building products. For the Annual Period, the Industrials Select Sector Index returned -8.19%. Given the daily investment objectives of the ETF and the path dependency of returns for longer periods, the annual return of the index alone should not generate expectations of annual performance of the ETF. The Direxion Daily Industrials Bull 3X Shares returned -35.71%, while the model indicated an expected return of -32.74%.
The Direxion Daily Pharmaceutical & Medical Bull 3X Shares seeks to provide 300% of the daily return of the S&P Pharmaceuticals Select Industry Index. The S&P Pharmaceuticals Select Industry Index is a modified equal-weighted index that is designed to measure performance of the stocks comprising the S&P Total Market Index that are classified in the Global Industry Classification Standard (GICS) pharmaceuticals subindustry. For the Annual Period, the S&P Pharmaceuticals Select Industry Index returned -14.61%. Given the daily investment objectives of the ETF and the path dependency of returns for longer periods, the annual return of the index alone should not generate expectations of annual performance of the ETF. The Direxion Daily Pharmaceutical & Medical Bull 3X Shares returned -43.75%, while the model indicated an expected return of -41.21%.
The Direxion Daily Real Estate Bull 3X Shares and the Direxion Daily Real Estate Bear 3X Shares (the "Real Estate ETFs") seek to provide 300% and -300%, respectively, of the daily return of the Real Estate Select Sector Index. The Real Estate Select Sector Index is provided by S&P Dow Jones Indices and includes securities of companies from the following industries: real
DIREXION ANNUAL REPORT
9
estate management and development and real estate investment trusts ("REITs"), excluding mortgage REITs. From February 28, 2022 through October 31, 2022, the Real Estate Select Sector Index returned -17.99%. Given the daily investment objectives of the Real Estate ETFs and the path dependency of returns for longer periods, the annual return of the index alone should not generate expectations of annual performance of the Real Estate ETFs. During this period, the Direxion Daily Real Estate Bull 3X Shares returned -53.60%, while the model indicated an expected return of -51.95%. The Direxion Daily Real Estate Bear 3X Shares returned 42.43%, while the model indicated an expected return of 38.74%.
From November 1, 2021 through February 27, 2022, the Real Estate ETFs, under their former names of the Direxion Daily MSCI Real Estate Bull 3X Shares and the Direxion Daily MSCI Real Estate Bear 3X Shares, sought to provide 300% and -300%, respectively, of the daily return of the MSCI US IMI Real Estate 25/50 Index. The MSCI US IMI Real Estate 25/50 Index is designed to measure the performance of the large-, mid- and small-capitalization segments of the U.S. equity universe that are classified in the real estate sector as per the Global Industry Classification Standard (GICS). From November 1, 2021 through February 27, 2022, the MSCI US IMI Real Estate 25/50 Index returned -3.51%. Given the daily investment objectives of the ETFs and the path dependency of returns for longer periods, the annual return of the index alone should not generate expectations of annual performance of the ETFs. During this period, the Direxion Daily Real Estate Bull 3X Shares returned -13.91%, while the model indicated an expected return of -13.19% and the Direxion Daily Real Estate Bear 3X Shares returned 3.77%, while the model indicated an expected return of 3.95%.
The Direxion Daily Regional Banks Bull 3X Shares seeks to provide 300% of the daily return of the S&P Regional Banks Select Industry Index. The S&P Regional Banks Select Industry Index is a modified equal-weighted index that is designed to measure performance of the stocks comprising the S&P Total Market Index that are classified in the Global Industry Classification Standard regional banks sub-industry. For the Annual Period, the S&P Regional Banks Select Industry Index returned -7.46%. Given the daily investment objectives of the ETF and the path dependency of returns for longer periods, the annual return of the index alone should not generate expectations of annual performance of the ETF. The Direxion Daily Regional Banks Bull 3X Shares returned -40.71%, while the model indicated an expected return of -37.93%.
The Direxion Daily Retail Bull 3X Shares seeks to provide 300% of the daily return of the S&P Retail Select Industry Index. The S&P Retail Select Industry Index is a modified equal-weighted index that is designed to measure performance of the stocks comprising the S&P Total Market Index that are classified in the Global Industry Classification Standard retail sub-industry. For the Annual Period, the S&P Retail Select Industry Index returned -31.90%. Given the daily investment objectives of the ETF and the path dependency of returns for longer periods, the annual return of the index alone should not generate expectations of annual performance of the ETF. The Direxion Daily Retail Bull 3X Shares returned -80.48%, while the model indicated an expected return of -79.57%
The Direxion Daily S&P 500® High Beta Bull 3X Shares and the Direxion Daily S&P 500® High Beta Bear 3X Shares seek to provide 300% and -300%, respectively, of the daily return of the S&P 500® High Beta Index. The S&P 500® High Beta Index selects 100 securities to include in the Index from the S&P 500® Index that have the highest sensitivity to market movements, or "beta" over the past 12 months as determined by the Index Provider. Securities with the highest beta are generally the most volatile securities of the S&P 500® Index. The Index is reviewed and rebalanced quarterly. For the Annual Period, the S&P 500® High Beta Index returned -19.77%. Given the daily investment objectives of the ETFs and the path dependency of returns for longer periods, the annual return of the index alone should not generate expectations of annual performance of the ETFs. The Direxion Daily S&P 500® High Beta Bull 3X Shares returned -66.20%, while the model indicated an expected return of -64.57%. The Direxion Daily S&P 500® High Beta Bear 3X Shares returned -4.86%, while the model indicated an expected return of -7.37%.
The Direxion Daily S&P Biotech Bull 3X Shares and the Direxion Daily S&P Biotech Bear 3X Shares seek to provide 300% and -300%, respectively, of the daily return of the S&P Biotechnology Select Industry Index. The S&P Biotechnology Select Industry Index is provided by Standard & Poor's and includes domestic companies from the biotechnology industry. The index is designed to measure the performance of the biotechnology sub-industry based on the Global Industry Classification Standards. For the Annual Period, the S&P Biotechnology Select Industry Index returned -34.03%. Given the daily investment objectives of the ETFs and the path dependency of returns for longer periods, the annual return of the index alone should
DIREXION ANNUAL REPORT
10
not generate expectations of annual performance of the ETFs. The Direxion Daily S&P Biotech Bull 3X Shares returned -86.07%, while the model indicated an expected return of -85.04%. The Direxion Daily S&P Biotech Bear 3X Shares returned -5.39%, while the model indicated an expected return of -7.48%.
The Direxion Daily Semiconductor Bull 3X Shares and the Direxion Daily Semiconductor Bear 3X Shares seek to provide 300% and -300%, respectively, of the daily return of the ICE Semiconductor Index. The ICE Semiconductor Index is a rules-based, modified float-adjusted market capitalization-weighted index that tracks the performance of the thirty largest U.S. listed semiconductor companies. For the Annual Period, the ICE Semiconductor Index returned -30.18%. Given the daily investment objectives of the ETFs and the path dependency of returns for longer periods, the annual return of the index alone should not generate expectations of annual performance of the ETFs. The Direxion Daily Semiconductor Bull 3X Shares returned -81.24%, while the model indicated an expected return of -80.29%. The Direxion Daily Semiconductor Bear 3X Shares returned 3.57%, while the model indicated an expected return of 0.65%.
The Direxion Daily Technology Bull 3X Shares and the Direxion Daily Technology Bear 3X Shares seek to provide 300% and -300%, respectively, of the daily return of the Technology Select Sector Index. The Technology Select Sector Index is provided by S&P Dow Jones Indices and includes domestic companies from the technology sector which includes domestic companies from the technology sector which includes the following industries: computers and peripherals; software; diversified telecommunications services; communications equipment; semiconductors and semi-conductor equipment; internet software and services; IT services; electronic equipment, instruments and components; wireless telecommunication services; and office electronics. For the Annual Period, the Technology Select Sector Index returned -20.08%. Given the daily investment objectives of the ETFs and the path dependency of returns for longer periods, the annual return of the index alone should not generate expectations of annual performance of the ETFs. The Direxion Daily Technology Bull 3X Shares returned -63.77%, while the model indicated an expected return of -61.96%. The Direxion Daily Technology Bear 3X Shares returned 12.97%, while the model indicated an expected return of 9.79%.
The Direxion Daily Transportation Bull 3X Shares (the "Transportation ETF") seeks to provide 300% of the daily return of the S&P Transportation Select Industry FMC Capped Index. The S&P Transportation Select Industry FMC Capped Index is provided by S&P Dow Jones Indices and is designed to measure stocks in the S&P Total Market Index that are included in the GICS transportation sub-industry From August 1, 2022 through October 31, 2022, the S&P Transportation Select Industry FMC Capped Index returned -8.38%. Given the daily investment objectives of the ETF and the path dependency of returns for longer periods, the annual return of the index alone should not generate expectations of annual performance of the ETF. During this period, the Transportation ETF returned -28.90%, while the model indicated an expected return of -27.31%.
From November 1, 2021 through July 31, 2022, the Transportation ETF sought to provide 300% of the daily return of the Dow Jones Transportation Average. The Dow Jones Transportation Average is provided by Dow Jones U.S. Index and measures the performance of large, well-known companies within the transportation industry (e.g. shipping, railroad companies, airlines, etc.). From November 1, 2021 through July 31, 2022, the Dow Jones Transportation Average returned -7.26%. Given the daily investment objectives of the ETF and the path dependency of returns for longer periods, the annual return of the index alone should not generate expectations of annual performance of the ETF. During this period, the Transportation ETF returned -35.86%, while the model indicated an expected return of -33.94%.
The Direxion Daily Utilities Bull 3X Shares seeks to provide 300% of the daily return of the Utilities Select Sector Index. The Utilities Select Sector Index is provided by S&P Dow Jones Indices and includes domestic companies from the utilities sector which includes the following industries: electric utilities; multi-utilities; water utilities; independent power producers and energy trades; and gas utilities. For the Annual Period, the Utilities Select Sector Index returned 2.88%. Given the daily investment objectives of the ETF and the path dependency of returns for longer periods, the annual return of the index alone should not generate expectations of annual performance of the ETF. The Direxion Daily Utilities Bull 3X Shares returned -8.50%, while the model indicated an expected return of -4.36%.
The Direxion Daily 7-10 Year Treasury Bull 3X Shares and the Direxion Daily 7-10 Year Treasury Bear 3X Shares seek to provide 300% and -300%, respectively, of the daily return of the ICE U.S. Treasury 7-10 Year Bond Index. The ICE U.S. Treasury 7-10 Year Bond Index is a market value weighted index that includes publicly issued U.S. Treasury securities that
DIREXION ANNUAL REPORT
11
have a remaining maturity of greater than seven years and less than or equal to ten years. Eligible securities must be fixed rate, denominated in U.S. dollars, and have $300 million or more of outstanding face value, excluding amounts held by the Federal Reserve. Securities excluded from the index are zero-coupon STRIPS, inflation linked securities, floating rate notes, cash management and Treasury bills, and any government agency debt issued with or without a government guarantee. For the Annual Period, the ICE U.S. Treasury 7-10 Year Bond Index returned -16.32%. Given the daily investment objectives of the ETFs and the path dependency of returns for longer periods, the annual return of the index alone should not generate expectations of annual performance of the ETFs. The Direxion Daily 7-10 Year Treasury Bull 3X Shares returned -44.91%, while the model indicated an expected return of -43.08%. The Direxion Daily 7-10 Year Treasury Bear 3X Shares returned 63.15%, while the model indicated and an expected return of 61.80%.
The Direxion Daily 20+ Year Treasury Bull 3X Shares and the Direxion Daily 20+ Year Treasury Bear 3X Shares seek to provide 300% and -300%, respectively, of the daily return of the ICE U.S. Treasury 20+ Year Bond Index. The ICE U.S. Treasury 20+ Year Bond Index is a market value weighted index that includes publicly issued U.S. Treasury securities that have a remaining maturity of greater than 20 years. Eligible securities must be fixed rate, denominated in U.S. dollars, and have $300 million or more of outstanding face value, excluding amounts held by the Federal Reserve. Securities excluded from the index are zero-coupon STRIPS, inflation linked securities, floating rate notes, cash management and Treasury bills, and any government agency debt issued with or without a government guarantee. For the Annual Period, the ICE U.S. Treasury 20+ Year Bond Index returned -33.65%. Given the daily investment objectives of the ETFs and the path dependency of returns for longer periods, the annual return of the index alone should not generate expectations of annual performance of the ETFs. The Direxion Daily 20+ Year Treasury Bull 3X Shares returned -74.89%, while the model indicated an expected return of -74.03%. The Direxion Daily 20+ Year Treasury Bear 3X Shares returned 177.78%, while the model indicated an expected return of 177.20%.
Index Volatility:
The Annual Period was extremely volatile, leaving investors without a clear strategy, and no clear sector winner. Typically defensive stocks were not immune to the volatility, and the market cycles were moving unpredictably. The VIX Index, a measure of volatility and market sentiment, averaged 25.20 during the Annual Period, with a high of 36.45 in early March 2022, whereas the average for the previous five years was 20.94.
Index | | Return | | Volatility | |
S&P Mid Cap 400® Index | | | -11.54 | % | | | 25.05 | % | |
S&P 500® Index | | | -14.61 | % | | | 23.08 | % | |
Russell 2000® Index | | | -18.54 | % | | | 27.67 | % | |
FTSE China 50 Index | | | -47.45 | % | | | 39.58 | % | |
FTSE Developed Europe All Cap Index | | | -24.55 | % | | | 24.37 | % | |
MSCI Emerging Markets IndexSM | | | -31.03 | % | | | 22.52 | % | |
MSCI Mexico IMI 25/50 Index | | | 7.73 | % | | | 22.54 | % | |
MSCI Korea 25/50 Index | | | -33.60 | % | | | 25.58 | % | |
Dow Jones U.S. Select Aerospace & Defense Index | | | 4.07 | % | | | 24.50 | % | |
Consumer Discretionary Select Sector Index | | | -27.80 | % | | | 33.38 | % | |
Dow Jones Internet Composite Index | | | -47.01 | % | | | 39.95 | % | |
Russell 1000® Index – Financials1 | | | -3.06 | % | | | 20.02 | % | |
Russell 1000 Financials 40 Act 15/22.5 Daily Capped Index2 | | | -11.93 | % | | | 26.86 | % | |
Financials Select Sector Index3 | | | 1.21 | % | | | 25.88 | % | |
Health Care Select Sector Index | | | 0.81 | % | | | 18.61 | % | |
Dow Jones U.S. Select Home Construction Index | | | -20.91 | % | | | 36.38 | % | |
Industrials Select Sector Index | | | -8.19 | % | | | 21.60 | % | |
S&P Pharmaceuticals Select Industry Index | | | -14.61 | % | | | 24.81 | % | |
MSCI US IMI Real Estate 25/50 Index1 | | | -3.51 | % | | | 18.78 | % | |
Real Estate Select Sector Index4 | | | -17.99 | % | | | 25.83 | % | |
DIREXION ANNUAL REPORT
12
Index | | Return | | Volatility | |
S&P Regional Banks Select Industry Index | | | -7.46 | % | | | 28.51 | % | |
S&P Retail Select Industry Index | | | -31.90 | % | | | 37.81 | % | |
S&P 500® High Beta Index | | | -19.77 | % | | | 35.22 | % | |
S&P Biotechnology Select Industry Index | | | -34.03 | % | | | 47.09 | % | |
ICE Semiconductor Index | | | -30.18 | % | | | 42.35 | % | |
Technology Select Sector Index | | | -20.08 | % | | | 31.17 | % | |
Dow Jones Transportation AverageTM | | | -7.26 | % | | | 29.01 | % | |
S&P Transportation Select Industry FMC Capped Index3 | | | -8.38 | % | | | 26.90 | % | |
Utilities Select Sector Index | | | 2.88 | % | | | 20.69 | % | |
ICE U.S. Treasury 7-10 Year Bond Index | | | -16.32 | % | | | 9.42 | % | |
ICE U.S. Treasury 20+ Year Bond Index | | | -33.65 | % | | | 18.75 | % | |
1 November 1, 2021 through February 27, 2022
2 February 28, 2022 through July 31, 2022
3 August 1, 2022 through October 31, 2022
4 February 28, 2022 through October 31, 2022
As always, we thank you for using the Direxion Shares ETFs and we look forward to our mutual success.
Best Regards,

| | 
| |
Patrick Rudnick | | Corey Noltner | |
Principal Executive Officer | | Principal Financial Officer | |
An investor should carefully consider a Fund's investment objective, risks, charges, and expenses before investing. A Fund's prospectus and summary prospectus contain this and other information about the Direxion Shares. To obtain a Fund's prospectus and summary prospectus call 866-476-7523 or visit our website at direxion.com. A Fund's prospectus and summary prospectus should be read carefully before investing.
Investing in a Direxion Shares ETF may be more volatile than investing in broadly diversified funds. The use of leverage by an ETF increases the risk to the ETF. The Direxion Shares ETFs are not suitable for all investors and should be utilized only by sophisticated investors who understand leverage risk, consequences of seeking daily leveraged, or daily inverse leveraged, investment results and intend to actively monitor and manage their investment. The Direxion Shares ETFs are not designed to track their respective underlying indices over a period of time longer than one day.
The performance data quoted represents past performance. Past performance does not guarantee future results. The investment return and principal value of an investment will fluctuate. An investor's shares, when redeemed, may be worth more or less than their original cost. Current performance may be lower or higher than the performance quoted. Returns for performance under one year are cumulative, not annualized. For the most recent month-end performance please visit the Funds website at direxion.com.
Short-term performance, in particular, is not a good indication of the Fund's future performance, and an investment should not be made based solely on returns. Because of ongoing market volatility, fund performance may be subject to substantial short-term changes. For additional information, see the Fund's prospectus.
DIREXION ANNUAL REPORT
13
Shares of the Direxion Shares are bought and sold at market price (not NAV) and are not individually redeemed from a Fund. Market Price returns are based upon the midpoint of the bid/ask spread at 4:00 pm EST (when NAV is normally calculated) and do not represent the returns you would receive if you traded shares at other times. Brokerage commissions will reduce returns. Fund returns assume that dividends and capital gains distributions have been reinvested in the Fund at NAV. Some performance results reflect expense reimbursements or recoupments and fee waivers in effect during certain periods shown. Absent these reimbursements or recoupments and fee waivers, results would have been less favorable.
SOFR (Secured Overnight Financing Rate) is a broad measure of the cost of borrowing cash overnight collateralized by Treasury securities.
Direxion Shares Risks – An investment in the ETFs involves risk, including the possible loss of principal. The ETFs are non-diversified and include risks associated with concentration risk that results from the ETFs' investments in a particular industry or sector which can increase volatility. The use of derivatives such as futures contracts, forward contracts, options and swaps are subject to market risks that may cause their price to fluctuate over time. The ETFs do not attempt to, and should not be expected to; provide returns which are a multiple of the return of their respective underlying index for periods other than a single day. For other risks including correlation, leverage, compounding, market volatility and specific risks regarding each sector, please read each ETF's prospectus.
The views of this letter were those of the Adviser as of October 31, 2022, and may not necessarily reflect its views on the date this letter is first published or anytime thereafter. These views are intended to help shareholders in understanding the ETFs' present investment methodology and do not constitute investment advice.
Distributed by: Foreside Fund Services, LLC
DIREXION ANNUAL REPORT
14
Direxion Daily Mid Cap Bull 3X Shares
Performance Summary (Unaudited)
October 31, 2012 - October 31, 2022

| | | Average Annual Total Return1 | |
| | | 1 Year | | 3 Years | | 5 Years | | 10 Years | |
Direxion Daily Mid Cap Bull 3X
Shares (NAV) | | | -45.19 | % | | | -4.39 | % | | | -2.22 | % | | | 17.06 | % | |
Direxion Daily Mid Cap Bull 3X
Shares (Market Price) | | | -45.12 | % | | | -4.30 | % | | | -2.19 | % | | | 17.09 | % | |
S&P Mid Cap 400® Index | | | -11.54 | % | | | 9.20 | % | | | 7.47 | % | | | 11.23 | % | |
The performance data quoted represents past performance; past performance does not guarantee future results; the investment return and principal value of an investment will fluctuate; an investor's shares, when redeemed, may be worth more or less than their original cost; current performance may be lower or higher than the performance quoted. Returns for performance under one year are cumulative, not annualized. As stated in the current prospectus, the Fund's total annual operating expense ratio (gross) is 1.00%. Rafferty Asset Management, LLC has contractually agreed to waive all or a portion of its management fee and/or reimburse the Fund for other expenses through September 1, 2024 to the extent the Total Annual Operating Expenses exceed 0.95% (excluding, as applicable, among other expenses, taxes, swap financing and related costs, acquired fund fees and expenses, dividends or interest on short positions, other interest expenses, brokerage commissions and extraordinary expenses). The performance table and graph do not reflect the deduction of taxes that a shareholder would pay on Fund distributions or the redemption of Fund shares. For the Fund's most recent month end performance please visit www.direxion.com.
A fund that meets its daily target over a period of time will not necessarily produce the returns that might be expected in light of the returns of its index or benchmark for that period. Differences may result from the compounding effect of market fluctuation and the use of leverage. The pursuit of daily goals may result in daily, leveraged compounding, which means that the return of an index over a period of time greater than one day multiplied by a fund's specified multiple (300%) will not generally equal a fund's performance over that same period.
This chart illustrates the performance of a hypothetical $10,000 investment made on the Fund's inception and is not intended to imply any future performance. Shares of Direxion Shares are bought and sold at market price (not NAV) and are not individually redeemed from the Fund. Performance reflects reinvestment of all dividend and capital gains distributions. During this period, some of the Fund's fees were waived and/or expenses reimbursed; otherwise, the Fund's performance would have been lower.
The S&P Mid Cap® 400 Index measures the performance of the mid-cap segment of the U.S. equity universe. The index is a capitalization-weighted index composed of 400 domestic common stocks. The performance of the S&P Mid Cap® 400 Index does not reflect the deduction of fees associated with the Fund, such as investment management fees. Investors cannot invest directly in an index, although they can invest in its underlying securities.
Market Exposure
The Fund seeks daily exposure of 300% of its NAV through a combination of equities and derivatives. "Market Exposure" includes the value of total investments (including the contract value of any derivatives) and excludes any short-term investments and cash equivalents divided by Net Assets.
1 As of October 31, 2022.
DIREXION ANNUAL REPORT
15
Direxion Daily S&P 500® Bull 3X Shares
Performance Summary (Unaudited)
October 31, 2012 - October 31, 2022

| | | Average Annual Total Return1 | |
| | | 1 Year | | 3 Years | | 5 Years | | 10 Years | |
Direxion Daily S&P 500® Bull 3X
Shares (NAV) | | | -49.27 | % | | | 6.42 | % | | | 11.44 | % | | | 25.79 | % | |
Direxion Daily S&P 500® Bull 3X
Shares (Market Price) | | | -49.22 | % | | | 6.43 | % | | | 11.42 | % | | | 25.83 | % | |
S&P 500® Index | | | -14.61 | % | | | 10.22 | % | | | 10.44 | % | | | 12.79 | % | |
The performance data quoted represents past performance; past performance does not guarantee future results; the investment return and principal value of an investment will fluctuate; an investor's shares, when redeemed, may be worth more or less than their original cost; current performance may be lower or higher than the performance quoted. Returns for performance under one year are cumulative, not annualized. As stated in the current prospectus, the Fund's total annual operating expense ratio (gross) is 0.97%. Rafferty Asset Management, LLC has contractually agreed to waive all or a portion of its management fee and/or reimburse the Fund for other expenses through September 1, 2024 to the extent the Total Annual Operating Expenses exceed 0.95% (excluding, as applicable, among other expenses, taxes, swap financing and related costs, acquired fund fees and expenses, dividends or interest on short positions, other interest expenses, brokerage commissions and extraordinary expenses). The performance table and graph do not reflect the deduction of taxes that a shareholder would pay on Fund distributions or the redemption of Fund shares. For the Fund's most recent month end performance please visit www.direxion.com.
A fund that meets its daily target over a period of time will not necessarily produce the returns that might be expected in light of the returns of its index or benchmark for that period. Differences may result from the compounding effect of market fluctuation and the use of leverage. The pursuit of daily goals may result in daily, leveraged compounding, which means that the return of an index over a period of time greater than one day multiplied by a fund's specified multiple (300%) will not generally equal a fund's performance over that same period.
This chart illustrates the performance of a hypothetical $10,000 investment made on the Fund's inception and is not intended to imply any future performance. Shares of Direxion Shares are bought and sold at market price (not NAV) and are not individually redeemed from the Fund. Performance reflects reinvestment of all dividend and capital gains distributions. During this period, some of the Fund's fees were waived and/or expenses reimbursed; otherwise, the Fund's performance would have been lower.
The S&P 500® Index is a capitalization-weighted index composed of 500 domestic common stocks. Most of the common stocks in the S&P 500 Index® are issued by the 500 largest companies, in terms of the aggregate market value of their outstanding stock, and are generally listed on the New York Stock Exchange. The performance of the S&P 500® Index does not reflect the deduction of fees associated with the Fund, such as investment management fees. Investors cannot invest directly in an index, although they can invest in its underlying securities.
Market Exposure
The Fund seeks daily exposure of 300% of its NAV through a combination of equities and derivatives. "Market Exposure" includes the value of total investments (including the contract value of any derivatives) and excludes any short-term investments and cash equivalents divided by Net Assets.
1 As of October 31, 2022.
DIREXION ANNUAL REPORT
16
Direxion Daily S&P 500® Bear 3X Shares
Performance Summary (Unaudited)
October 31, 2012 - October 31, 2022

| | | Average Annual Total Return1 | |
| | | 1 Year | | 3 Years | | 5 Years | | 10 Years | |
Direxion Daily S&P 500® Bear 3X
Shares (NAV) | | | 20.66 | % | | | -47.87 | % | | | -41.56 | % | | | -40.98 | % | |
Direxion Daily S&P 500® Bear 3X
Shares (Market Price) | | | 20.67 | % | | | -47.87 | % | | | -41.56 | % | | | -40.99 | % | |
S&P 500® Index | | | -14.61 | % | | | 10.22 | % | | | 10.44 | % | | | 12.79 | % | |
The performance data quoted represents past performance; past performance does not guarantee future results; the investment return and principal value of an investment will fluctuate; an investor's shares, when redeemed, may be worth more or less than their original cost; current performance may be lower or higher than the performance quoted. Returns for performance under one year are cumulative, not annualized. As stated in the current prospectus, the Fund's total annual operating expense ratio (gross) is 1.01%. Rafferty Asset Management, LLC has contractually agreed to waive all or a portion of its management fee and/or reimburse the Fund for other expenses through September 1, 2024 to the extent the Total Annual Operating Expenses exceed 0.95% (excluding, as applicable, among other expenses, taxes, swap financing and related costs, acquired fund fees and expenses, dividends or interest on short positions, other interest expenses, brokerage commissions and extraordinary expenses). The performance table and graph do not reflect the deduction of taxes that a shareholder would pay on Fund distributions or the redemption of Fund shares. For the Fund's most recent month end performance please visit www.direxion.com.
A fund that meets its daily target over a period of time will not necessarily produce the returns that might be expected in light of the returns of its index or benchmark for that period. Differences may result from the compounding effect of market fluctuation, the use of leverage and a Bear Fund's inverse correlation. The pursuit of daily goals may result in daily, leveraged compounding, which means that the return of an index over a period of time greater than one day multiplied by a fund's specified inverse multiple (-300%) will not generally equal a fund's performance over that same period.
This chart illustrates the performance of a hypothetical $10,000 investment made on the Fund's inception and is not intended to imply any future performance. Shares of Direxion Shares are bought and sold at market price (not NAV) and are not individually redeemed from the Fund. Performance reflects reinvestment of all dividend and capital gains distributions. During this period, some of the Fund's fees were waived and/or expenses reimbursed; otherwise, the Fund's performance would have been lower.
The S&P 500® Index is a capitalization-weighted index composed of 500 domestic common stocks. Most of the common stocks in the S&P 500 Index® are issued by the 500 largest companies, in terms of the aggregate market value of their outstanding stock, and are generally listed on the New York Stock Exchange. The performance of the S&P 500® Index does not reflect the deduction of fees associated with the Fund, such as investment management fees. Investors cannot invest directly in an index, although they can invest in its underlying securities.
Market Exposure
The Fund seeks daily exposure of -300% of its NAV through derivatives. "Market Exposure" includes the value of total investments (including the contract value of any derivatives) and excludes any short-term investments and cash equivalents divided by Net Assets.
1 As of October 31, 2022.
DIREXION ANNUAL REPORT
17
Direxion Daily Small Cap Bull 3X Shares
Performance Summary (Unaudited)
October 31, 2012 - October 31, 2022

| | | Average Annual Total Return1 | |
| | | 1 Year | | 3 Years | | 5 Years | | 10 Years | |
Direxion Daily Small Cap Bull 3X
Shares (NAV) | | | -58.86 | % | | | -13.64 | % | | | -10.17 | % | | | 10.70 | % | |
Direxion Daily Small Cap Bull 3X
Shares (Market Price) | | | -58.82 | % | | | -13.58 | % | | | -10.13 | % | | | 10.77 | % | |
Russell 2000® Index | | | -18.54 | % | | | 7.05 | % | | | 5.56 | % | | | 9.93 | % | |
The performance data quoted represents past performance; past performance does not guarantee future results; the investment return and principal value of an investment will fluctuate; an investor's shares, when redeemed, may be worth more or less than their original cost; current performance may be lower or higher than the performance quoted. Returns for performance under one year are cumulative, not annualized. As stated in the current prospectus, the Fund's total annual operating expense ratio (gross) is 1.05%. Rafferty Asset Management, LLC has contractually agreed to waive all or a portion of its management fee and/or reimburse the Fund for other expenses through September 1, 2024 to the extent the Total Annual Operating Expenses exceed 0.95% (excluding, as applicable, among other expenses, taxes, swap financing and related costs, acquired fund fees and expenses, dividends or interest on short positions, other interest expenses, brokerage commissions and extraordinary expenses). The performance table and graph do not reflect the deduction of taxes that a shareholder would pay on Fund distributions or the redemption of Fund shares. For the Fund's most recent month end performance please visit www.direxion.com.
A fund that meets its daily target over a period of time will not necessarily produce the returns that might be expected in light of the returns of its index or benchmark for that period. Differences may result from the compounding effect of market fluctuation and the use of leverage. The pursuit of daily goals may result in daily, leveraged compounding, which means that the return of an index over a period of time greater than one day multiplied by a fund's specified multiple (300%) will not generally equal a fund's performance over that same period.
This chart illustrates the performance of a hypothetical $10,000 investment made on the Fund's inception and is not intended to imply any future performance. Shares of Direxion Shares are bought and sold at market price (not NAV) and are not individually redeemed from the Fund. Performance reflects reinvestment of all dividend and capital gains distributions. During this period, some of the Fund's fees were waived and/or expenses reimbursed; otherwise, the Fund's performance would have been lower.
The Russell 2000® Index measures the small cap segment of the U.S. equity universe and includes the smallest 2,000 securities in the Russell 3000® Index based on market cap. The performance of the Russell 2000® Index does not reflect the deduction of fees associated with the Fund, such as investment management fees. Investors cannot invest directly in an index, although they can invest in its underlying securities.
Market Exposure
The Fund seeks daily exposure of 300% of its NAV through a combination of equities and derivatives. "Market Exposure" includes the value of total investments (including the contract value of any derivatives) and excludes any short-term investments and cash equivalents divided by Net Assets.
1 As of October 31, 2022.
DIREXION ANNUAL REPORT
18
Direxion Daily Small Cap Bear 3X Shares
Performance Summary (Unaudited)
October 31, 2012 - October 31, 2022

| | | Average Annual Total Return1 | |
| | | 1 Year | | 3 Years | | 5 Years | | 10 Years | |
Direxion Daily Small Cap Bear 3X
Shares (NAV) | | | 20.23 | % | | | -54.54 | % | | | -42.64 | % | | | -43.55 | % | |
Direxion Daily Small Cap Bear 3X
Shares (Market Price) | | | 20.15 | % | | | -54.57 | % | | | -42.68 | % | | | -43.58 | % | |
Russell 2000® Index | | | -18.54 | % | | | 7.05 | % | | | 5.56 | % | | | 9.93 | % | |
The performance data quoted represents past performance; past performance does not guarantee future results; the investment return and principal value of an investment will fluctuate; an investor's shares, when redeemed, may be worth more or less than their original cost; current performance may be lower or higher than the performance quoted. Returns for performance under one year are cumulative, not annualized. As stated in the current prospectus, the Fund's total annual operating expense ratio (gross) is 1.00%. Rafferty Asset Management, LLC has contractually agreed to waive all or a portion of its management fee and/or reimburse the Fund for other expenses through September 1, 2024 to the extent the Total Annual Operating Expenses exceed 0.95% (excluding, as applicable, among other expenses, taxes, swap financing and related costs, acquired fund fees and expenses, dividends or interest on short positions, other interest expenses, brokerage commissions and extraordinary expenses). The performance table and graph do not reflect the deduction of taxes that a shareholder would pay on Fund distributions or the redemption of Fund shares. For the Fund's most recent month end performance please visit www.direxion.com.
A fund that meets its daily target over a period of time will not necessarily produce the returns that might be expected in light of the returns of its index or benchmark for that period. Differences may result from the compounding effect of market fluctuation, the use of leverage and a Bear Fund's inverse correlation. The pursuit of daily goals may result in daily, leveraged compounding, which means that the return of an index over a period of time greater than one day multiplied by a fund's specified inverse multiple (-300%) will not generally equal a fund's performance over that same period.
This chart illustrates the performance of a hypothetical $10,000 investment made on the Fund's inception and is not intended to imply any future performance. Shares of Direxion Shares are bought and sold at market price (not NAV) and are not individually redeemed from the Fund. Performance reflects reinvestment of all dividend and capital gains distributions. During this period, some of the Fund's fees were waived and/or expenses reimbursed; otherwise, the Fund's performance would have been lower.
The Russell 2000® Index measures the small cap segment of the U.S. equity universe and includes the smallest 2,000 securities in the Russell 3000® Index based on market cap. The performance of the Russell 2000® Index does not reflect the deduction of fees associated with the Fund, such as investment management fees. Investors cannot invest directly in an index, although they can invest in its underlying securities.
Market Exposure
The Fund seeks daily exposure of -300% of its NAV through derivatives. "Market Exposure" includes the value of total investments (including the contract value of any derivatives) and excludes any short-term investments and cash equivalents divided by Net Assets.
1 As of October 31, 2022.
DIREXION ANNUAL REPORT
19
Direxion Daily FTSE China Bull 3X Shares
Performance Summary (Unaudited)
October 31, 2012 - October 31, 2022
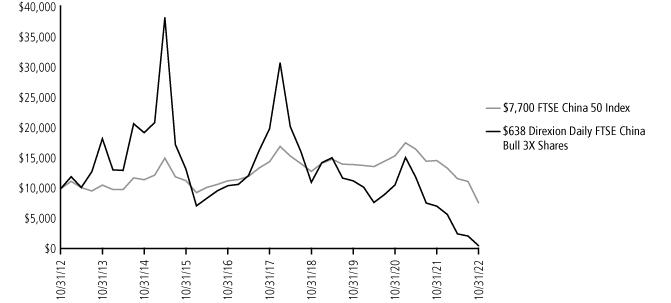
| | | Average Annual Total Return1 | |
| | | 1 Year | | 3 Years | | 5 Years | | 10 Years | |
Direxion Daily FTSE China Bull 3X
Shares (NAV) | | | -91.06 | % | | | -61.65 | % | | | -49.74 | % | | | -24.06 | % | |
Direxion Daily FTSE China Bull 3X
Shares (Market Price) | | | -91.05 | % | | | -61.62 | % | | | -49.70 | % | | | -24.10 | % | |
FTSE China 50 Index | | | -47.45 | % | | | -18.04 | % | | | -11.84 | % | | | -2.58 | % | |
The performance data quoted represents past performance; past performance does not guarantee future results; the investment return and principal value of an investment will fluctuate; an investor's shares, when redeemed, may be worth more or less than their original cost; current performance may be lower or higher than the performance quoted. Returns for performance under one year are cumulative, not annualized. As stated in the current prospectus, the Fund's total annual operating expense ratio (gross) is 1.42%. Rafferty Asset Management, LLC has contractually agreed to waive all or a portion of its management fee and/or reimburse the Fund for other expenses through September 1, 2024 to the extent the Total Annual Operating Expenses exceed 0.95% (excluding, as applicable, among other expenses, taxes, swap financing and related costs, acquired fund fees and expenses, dividends or interest on short positions, other interest expenses, brokerage commissions and extraordinary expenses). The performance table and graph do not reflect the deduction of taxes that a shareholder would pay on Fund distributions or the redemption of Fund shares. For the Fund's most recent month end performance please visit www.direxion.com.
A fund that meets its daily target over a period of time will not necessarily produce the returns that might be expected in light of the returns of its index or benchmark for that period. Differences may result from the compounding effect of market fluctuation and the use of leverage. The pursuit of daily goals may result in daily, leveraged compounding, which means that the return of an index over a period of time greater than one day multiplied by a fund's specified multiple (300%) will not generally equal a fund's performance over that same period.
This chart illustrates the performance of a hypothetical $10,000 investment made on the Fund's inception and is not intended to imply any future performance. Shares of Direxion Shares are bought and sold at market price (not NAV) and are not individually redeemed from the Fund. Performance reflects reinvestment of all dividend and capital gains distributions. During this period, some of the Fund's fees were waived and/or expenses reimbursed; otherwise, the Fund's performance would have been lower.
The FTSE China 50 Index consists of the 50 largest and most liquid Chinese companies currently trading on the Hong Kong Stock Exchange. Securities in the FTSE China 50 Index are weighted based on the total market value of their shares, so that the securities with the higher total market values will generally have a higher representation in the Index. Index constituents are screened for liquidity and weightings are capped to prevent the Index from being overly concentrated in any one stock. The performance of The FTSE China 50 Index does not reflect the deduction of fees associated with the Fund, such as investment management fees. Investors cannot invest directly in an index, although they can invest in its underlying securities.
Market Exposure
The Fund seeks daily exposure of 300% of its NAV through a combination of equities and derivatives. "Market Exposure" includes the value of total investments (including the contract value of any derivatives) and excludes any short-term investments and cash equivalents divided by Net Assets.
1 As of October 31, 2022.
DIREXION ANNUAL REPORT
20
Direxion Daily FTSE China Bear 3X Shares
Performance Summary (Unaudited)
October 31, 2012 - October 31, 2022
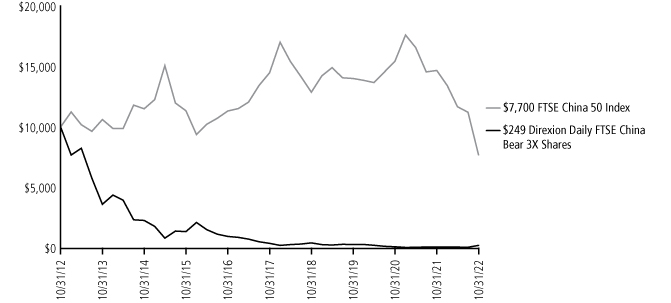
| | | Average Annual Total Return1 | |
| | | 1 Year | | 3 Years | | 5 Years | | 10 Years | |
Direxion Daily FTSE China Bear 3X
Shares (NAV) | | | 126.33 | % | | | -8.44 | % | | | -9.80 | % | | | -30.88 | % | |
Direxion Daily FTSE China Bear 3X
Shares (Market Price) | | | 126.35 | % | | | -8.42 | % | | | -9.84 | % | | | -30.82 | % | |
FTSE China 50 Index | | | -47.45 | % | | | -18.04 | % | | | -11.84 | % | | | -2.58 | % | |
The performance data quoted represents past performance; past performance does not guarantee future results; the investment return and principal value of an investment will fluctuate; an investor's shares, when redeemed, may be worth more or less than their original cost; current performance may be lower or higher than the performance quoted. Returns for performance under one year are cumulative, not annualized. As stated in the current prospectus, the Fund's total annual operating expense ratio (gross) is 1.03%. Rafferty Asset Management, LLC has contractually agreed to waive all or a portion of its management fee and/or reimburse the Fund for other expenses through September 1, 2024 to the extent the Total Annual Operating Expenses exceed 0.95% (excluding, as applicable, among other expenses, taxes, swap financing and related costs, acquired fund fees and expenses, dividends or interest on short positions, other interest expenses, brokerage commissions and extraordinary expenses). The performance table and graph do not reflect the deduction of taxes that a shareholder would pay on Fund distributions or the redemption of Fund shares. For the Fund's most recent month end performance please visit www.direxion.com.
A fund that meets its daily target over a period of time will not necessarily produce the returns that might be expected in light of the returns of its index or benchmark for that period. Differences may result from the compounding effect of market fluctuation, the use of leverage and a Bear Fund's inverse correlation. The pursuit of daily goals may result in daily, leveraged compounding, which means that the return of an index over a period of time greater than one day multiplied by a fund's specified inverse multiple (-300%) will not generally equal a fund's performance over that same period.
This chart illustrates the performance of a hypothetical $10,000 investment made on the Fund's inception and is not intended to imply any future performance. Shares of Direxion Shares are bought and sold at market price (not NAV) and are not individually redeemed from the Fund. Performance reflects reinvestment of all dividend and capital gains distributions. During this period, some of the Fund's fees were waived and/or expenses reimbursed; otherwise, the Fund's performance would have been lower.
The FTSE China 50 Index consists of the 50 largest and most liquid Chinese companies currently trading on the Hong Kong Stock Exchange. Securities in the FTSE China 50 Index are weighted based on the total market value of their shares, so that the securities with the higher total market values will generally have a higher representation in the Index. Index constituents are screened for liquidity and weightings are capped to prevent the Index from being overly concentrated in any one stock. The performance of The FTSE China 50 Index does not reflect the deduction of fees associated with the Fund, such as investment management fees. Investors cannot invest directly in an index, although they can invest in its underlying securities.
Market Exposure
The Fund seeks daily exposure of -300% of its NAV through derivatives. "Market Exposure" includes the value of total investments (including the contract value of any derivatives) and excludes any short-term investments and cash equivalents divided by Net Assets.
1 As of October 31, 2022.
DIREXION ANNUAL REPORT
21
Direxion Daily FTSE Europe Bull 3X Shares
Performance Summary (Unaudited)
January 22, 20141 - October 31, 2022

| | | Average Annual Total Return2 | |
| | | 1 Year | | 3 Years | | 5 Years | | Since Inception | |
Direxion Daily FTSE Europe Bull 3X
Shares (NAV) | | | -66.00 | % | | | -23.29 | % | | | -18.03 | % | | | -11.44 | % | |
Direxion Daily FTSE Europe Bull 3X
Shares (Market Price) | | | -65.89 | % | | | -23.20 | % | | | -18.00 | % | | | -11.42 | % | |
FTSE Developed Europe All Cap Index | | | -24.55 | % | | | -0.56 | % | | | 0.02 | % | | | 1.53 | % | |
The performance data quoted represents past performance; past performance does not guarantee future results; the investment return and principal value of an investment will fluctuate; an investor's shares, when redeemed, may be worth more or less than their original cost; current performance may be lower or higher than the performance quoted. Returns for performance under one year are cumulative, not annualized. As stated in the current prospectus, the Fund's total annual operating expense ratio (gross) is 1.01%. Rafferty Asset Management, LLC has contractually agreed to waive all or a portion of its management fee and/or reimburse the Fund for other expenses through September 1, 2024 to the extent the Total Annual Operating Expenses exceed 0.95% (excluding, as applicable, among other expenses, taxes, swap financing and related costs, acquired fund fees and expenses, dividends or interest on short positions, other interest expenses, brokerage commissions and extraordinary expenses). The performance table and graph do not reflect the deduction of taxes that a shareholder would pay on Fund distributions or the redemption of Fund shares. For the Fund's most recent month end performance please visit www.direxion.com.
A fund that meets its daily target over a period of time will not necessarily produce the returns that might be expected in light of the returns of its index or benchmark for that period. Differences may result from the compounding effect of market fluctuation and the use of leverage. The pursuit of daily goals may result in daily, leveraged compounding, which means that the return of an index over a period of time greater than one day multiplied by a fund's specified multiple (300%) will not generally equal a fund's performance over that same period.
This chart illustrates the performance of a hypothetical $10,000 investment made on the Fund's inception and is not intended to imply any future performance. Shares of Direxion Shares are bought and sold at market price (not NAV) and are not individually redeemed from the Fund. Performance reflects reinvestment of all dividend and capital gains distributions. During this period, some of the Fund's fees were waived and/or expenses reimbursed; otherwise, the Fund's performance would have been lower.
The FTSE Developed Europe All Cap Index is a market capitalization weighted index that is designed to measure the equity market performance of large, mid, and small cap companies in developed markets in Europe. The performance of FTSE Developed Europe All Cap Index does not reflect the deduction of fees associated with the Fund, such as investment management fees. Investors cannot invest directly in an index, although they can invest in its underlying securities.
Market Exposure
The Fund seeks daily exposure of 300% of its NAV through a combination of equities and derivatives. "Market Exposure" includes the value of total investments (including the contract value of any derivatives) and excludes any short-term investments and cash equivalents divided by Net Assets.
1 Commencement of operations.
2 As of October 31, 2022.
DIREXION ANNUAL REPORT
22
Direxion Daily MSCI Emerging Markets Bull 3X Shares
Performance Summary (Unaudited)
October 31, 2012 - October 31, 2022

| | | Average Annual Total Return1 | |
| | | 1 Year | | 3 Years | | 5 Years | | 10 Years | |
Direxion Daily MSCI Emerging Markets
Bull 3X Shares (NAV) | | | -73.37 | % | | | -32.97 | % | | | -28.03 | % | | | -15.14 | % | |
Direxion Daily MSCI Emerging Markets
Bull 3X Shares (Market Price) | | | -73.25 | % | | | -32.98 | % | | | -27.99 | % | | | -15.14 | % | |
MSCI Emerging Markets IndexSM | | | -31.03 | % | | | -4.42 | % | | | -3.09 | % | | | 0.79 | % | |
The performance data quoted represents past performance; past performance does not guarantee future results; the investment return and principal value of an investment will fluctuate; an investor's shares, when redeemed, may be worth more or less than their original cost; current performance may be lower or higher than the performance quoted. Returns for performance under one year are cumulative, not annualized. As stated in the current prospectus, the Fund's total annual operating expense ratio (gross) is 1.28%. Rafferty Asset Management, LLC has contractually agreed to waive all or a portion of its management fee and/or reimburse the Fund for other expenses through September 1, 2024 to the extent the Total Annual Operating Expenses exceed 0.95% (excluding, as applicable, among other expenses, taxes, swap financing and related costs, acquired fund fees and expenses, dividends or interest on short positions, other interest expenses, brokerage commissions and extraordinary expenses). The performance table and graph do not reflect the deduction of taxes that a shareholder would pay on Fund distributions or the redemption of Fund shares. For the Fund's most recent month end performance please visit www.direxion.com.
A fund that meets its daily target over a period of time will not necessarily produce the returns that might be expected in light of the returns of its index or benchmark for that period. Differences may result from the compounding effect of market fluctuation and the use of leverage. The pursuit of daily goals may result in daily, leveraged compounding, which means that the return of an index over a period of time greater than one day multiplied by a fund's specified multiple (300%) will not generally equal a fund's performance over that same period.
This chart illustrates the performance of a hypothetical $10,000 investment made on the Fund's inception and is not intended to imply any future performance. Shares of Direxion Shares are bought and sold at market price (not NAV) and are not individually redeemed from the Fund. Performance reflects reinvestment of all dividend and capital gains distributions. During this period, some of the Fund's fees were waived and/or expenses reimbursed; otherwise, the Fund's performance would have been lower.
The MSCI Emerging Markets IndexSM is a free float-adjusted market capitalization index that is designed to measure equity market performance in the global emerging markets. The performance of the MSCI Emerging Markets IndexSM does not reflect the deduction of fees associated with the Fund, such as investment management fees. Investors cannot invest directly in an index, although they can invest in its underlying securities.
Market Exposure
The Fund seeks daily exposure of 300% of its NAV through a combination of equities and derivatives. "Market Exposure" includes the value of total investments (including the contract value of any derivatives) and excludes any short-term investments and cash equivalents divided by Net Assets.
1 As of October 31, 2022.
DIREXION ANNUAL REPORT
23
Direxion Daily MSCI Emerging Markets Bear 3X Shares
Performance Summary (Unaudited)
October 31, 2012 - October 31, 2022

| | | Average Annual Total Return1 | |
| | | 1 Year | | 3 Years | | 5 Years | | 10 Years | |
Direxion Daily MSCI Emerging Markets
Bear 3X Shares (NAV) | | | 132.00 | % | | | -20.61 | % | | | -15.78 | % | | | -23.05 | % | |
Direxion Daily MSCI Emerging Markets
Bear 3X Shares (Market Price) | | | 130.76 | % | | | -20.64 | % | | | -15.80 | % | | | -23.05 | % | |
MSCI Emerging Markets IndexSM | | | -31.03 | % | | | -4.42 | % | | | -3.09 | % | | | 0.79 | % | |
The performance data quoted represents past performance; past performance does not guarantee future results; the investment return and principal value of an investment will fluctuate; an investor's shares, when redeemed, may be worth more or less than their original cost; current performance may be lower or higher than the performance quoted. Returns for performance under one year are cumulative, not annualized. As stated in the current prospectus, the Fund's total annual operating expense ratio (gross) is 1.22%. Rafferty Asset Management, LLC has contractually agreed to waive all or a portion of its management fee and/or reimburse the Fund for other expenses through September 1, 2024 to the extent the Total Annual Operating Expenses exceed 0.95% (excluding, as applicable, among other expenses, taxes, swap financing and related costs, acquired fund fees and expenses, dividends or interest on short positions, other interest expenses, brokerage commissions and extraordinary expenses). The performance table and graph do not reflect the deduction of taxes that a shareholder would pay on Fund distributions or the redemption of Fund shares. For the Fund's most recent month end performance please visit www.direxion.com.
A fund that meets its daily target over a period of time will not necessarily produce the returns that might be expected in light of the returns of its index or benchmark for that period. Differences may result from the compounding effect of market fluctuation, the use of leverage and a Bear Fund's inverse correlation. The pursuit of daily goals may result in daily, leveraged compounding, which means that the return of an index over a period of time greater than one day multiplied by a fund's specified inverse multiple (-300%) will not generally equal a fund's performance over that same period.
This chart illustrates the performance of a hypothetical $10,000 investment made on the Fund's inception and is not intended to imply any future performance. Shares of Direxion Shares are bought and sold at market price (not NAV) and are not individually redeemed from the Fund. Performance reflects reinvestment of all dividend and capital gains distributions. During this period, some of the Fund's fees were waived and/or expenses reimbursed; otherwise, the Fund's performance would have been lower.
The MSCI Emerging Markets IndexSM is a free float-adjusted market capitalization index that is designed to measure equity market performance in the global emerging markets. The performance of the MSCI Emerging Markets IndexSM does not reflect the deduction of fees associated with the Fund, such as investment management fees. Investors cannot invest directly in an index, although they can invest in its underlying securities.
Market Exposure
The Fund seeks daily exposure of -300% of its NAV through derivatives. "Market Exposure" includes the value of total investments (including the contract value of any derivatives) and excludes any short-term investments and cash equivalents divided by Net Assets.
1 As of October 31, 2022.
DIREXION ANNUAL REPORT
24
Direxion Daily MSCI Mexico Bull 3X Shares
Performance Summary (Unaudited)
May 3, 20171 - October 31, 2022
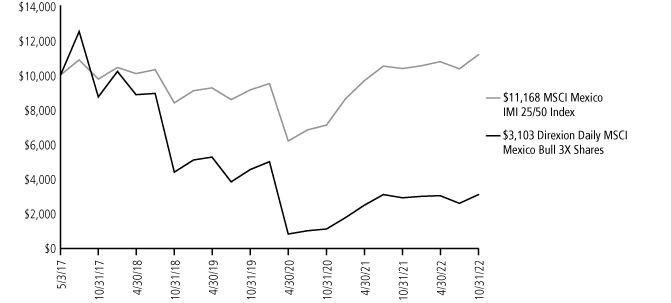
| | | Average Annual Total Return2 | |
| | | 1 Year | | 3 Years | | 5 Years | | Since Inception | |
Direxion Daily MSCI Mexico Bull 3X
Shares (NAV) | | | 6.35 | % | | | -11.95 | % | | | -18.69 | % | | | -19.17 | % | |
Direxion Daily MSCI Mexico Bull 3X
Shares (Market Price) | | | 6.71 | % | | | -11.88 | % | | | -18.70 | % | | | -19.18 | % | |
MSCI Mexico IMI 25/50 Index | | | 7.73 | % | | | 6.92 | % | | | 2.74 | % | | | 2.03 | % | |
The performance data quoted represents past performance; past performance does not guarantee future results; the investment return and principal value of an investment will fluctuate; an investor's shares, when redeemed, may be worth more or less than their original cost; current performance may be lower or higher than the performance quoted. Returns for performance under one year are cumulative, not annualized. As stated in the current prospectus, the Fund's total annual operating expense ratio (gross) is 1.18%. Rafferty Asset Management, LLC has contractually agreed to waive all or a portion of its management fee and/or reimburse the Fund for other expenses through September 1, 2024 to the extent the Total Annual Operating Expenses exceed 0.95% (excluding, as applicable, among other expenses, taxes, swap financing and related costs, acquired fund fees and expenses, dividends or interest on short positions, other interest expenses, brokerage commissions and extraordinary expenses). The performance table and graph do not reflect the deduction of taxes that a shareholder would pay on Fund distributions or the redemption of Fund shares. For the Fund's most recent month end performance please visit www.direxion.com.
A fund that meets its daily target over a period of time will not necessarily produce the returns that might be expected in light of the returns of its index or benchmark for that period. Differences may result from the compounding effect of market fluctuation and the use of leverage. The pursuit of daily goals may result in daily, leveraged compounding, which means that the return of an index over a period of time greater than one day multiplied by a fund's specified multiple (300%) will not generally equal a fund's performance over that same period.
This chart illustrates the performance of a hypothetical $10,000 investment made on the Fund's inception and is not intended to imply any future performance. Shares of Direxion Shares are bought and sold at market price (not NAV) and are not individually redeemed from the Fund. Performance reflects reinvestment of all dividend and capital gains distributions. During this period, some of the Fund's fees were waived and/or expenses reimbursed; otherwise, the Fund's performance would have been lower.
The MSCI Mexico IMI 25/50 Index is designed to measure the performance of the large, mid, and small capitalization segments of the Mexican equity market, covering approximately 99% of the free float-adjusted market capitalization in Mexico. The Index consists of stocks traded primarily on the Mexican Stock Market. Investors cannot invest directly in an index, although they can invest in its underlying securities.
Market Exposure
The Fund seeks daily exposure of 300% of its NAV through a combination of equities and derivatives. "Market Exposure" includes the value of total investments (including the contract value of any derivatives) and excludes any short-term investments and cash equivalents divided by Net Assets.
1 Commencement of operations.
2 As of October 31, 2022.
DIREXION ANNUAL REPORT
25
Direxion Daily MSCI South Korea Bull 3X Shares
Performance Summary (Unaudited)
April 10, 20131 - October 31, 2022

| | | Average Annual Total Return2 | |
| | | 1 Year | | 3 Years | | 5 Years | | Since Inception | |
Direxion Daily MSCI South Korea Bull 3X
Shares (NAV) | | | -76.86 | % | | | -34.14 | % | | | -36.14 | % | | | -17.25 | % | |
Direxion Daily MSCI South Korea Bull 3X
Shares (Market Price) | | | -76.99 | % | | | -34.13 | % | | | -36.11 | % | | | -17.26 | % | |
MSCI Korea 25/50 Index | | | -33.60 | % | | | -2.37 | % | | | -4.87 | % | | | 1.31 | % | |
The performance data quoted represents past performance; past performance does not guarantee future results; the investment return and principal value of an investment will fluctuate; an investor's shares, when redeemed, may be worth more or less than their original cost; current performance may be lower or higher than the performance quoted. Returns for performance under one year are cumulative, not annualized. As stated in the current prospectus, the Fund's total annual operating expense ratio (gross) is 1.24%. Rafferty Asset Management, LLC has contractually agreed to waive all or a portion of its management fee and/or reimburse the Fund for other expenses through September 1, 2024 to the extent the Total Annual Operating Expenses exceed 0.95% (excluding, as applicable, among other expenses, taxes, swap financing and related costs, acquired fund fees and expenses, dividends or interest on short positions, other interest expenses, brokerage commissions and extraordinary expenses). The performance table and graph do not reflect the deduction of taxes that a shareholder would pay on Fund distributions or the redemption of Fund shares. For the Fund's most recent month end performance please visit www.direxion.com.
A fund that meets its daily target over a period of time will not necessarily produce the returns that might be expected in light of the returns of its index or benchmark for that period. Differences may result from the compounding effect of market fluctuation and the use of leverage. The pursuit of daily goals may result in daily, leveraged compounding, which means that the return of an index over a period of time greater than one day multiplied by a fund's specified multiple (300%) will not generally equal a fund's performance over that same period.
This chart illustrates the performance of a hypothetical $10,000 investment made on the Fund's inception and is not intended to imply any future performance. Shares of Direxion Shares are bought and sold at market price (not NAV) and are not individually redeemed from the Fund. Performance reflects reinvestment of all dividend and capital gains distributions. During this period, some of the Fund's fees were waived and/or expenses reimbursed; otherwise, the Fund's performance would have been lower.
The MSCI Korea 25/50 Index is designed to measure the performance of the large and mid cap segments of the South Korean equity market, covering approximately 85% of the free float-adjusted market capitalization of South Korean issuers. Investors cannot invest directly in an index, although they can invest in its underlying securities.
Market Exposure
The Fund seeks daily exposure of 300% of its NAV through a combination of equities and derivatives. "Market Exposure" includes the value of total investments (including the contract value of any derivatives) and excludes any short-term investments and cash equivalents divided by Net Assets.
1 Commencement of operations.
2 As of October 31, 2022.
DIREXION ANNUAL REPORT
26
Direxion Daily Aerospace & Defense Bull 3X Shares
Performance Summary (Unaudited)
May 3, 20171 - October 31, 2022

| | | Average Annual Total Return2 | |
| | | 1 Year | | 3 Years | | 5 Years | | Since Inception | |
Direxion Daily Aerospace & Defense
Bull 3X Shares (NAV) | | | -10.07 | % | | | -30.42 | % | | | -13.64 | % | | | -4.66 | % | |
Direxion Daily Aerospace & Defense
Bull 3X Shares (Market Price) | | | -10.17 | % | | | -30.44 | % | | | -13.68 | % | | | -4.71 | % | |
Dow Jones U.S. Select Aerospace &
Defense Index | | | 4.07 | % | | | 0.75 | % | | | 5.14 | % | | | 7.95 | % | |
The performance data quoted represents past performance; past performance does not guarantee future results; the investment return and principal value of an investment will fluctuate; an investor's shares, when redeemed, may be worth more or less than their original cost; current performance may be lower or higher than the performance quoted. Returns for performance under one year are cumulative, not annualized. As stated in the current prospectus, the Fund's total annual operating expense ratio (gross) is 0.96%. Rafferty Asset Management, LLC has contractually agreed to waive all or a portion of its management fee and/or reimburse the Fund for other expenses through September 1, 2024 to the extent the Total Annual Operating Expenses exceed 0.95% (excluding, as applicable, among other expenses, taxes, swap financing and related costs, acquired fund fees and expenses, dividends or interest on short positions, other interest expenses, brokerage commissions and extraordinary expenses). The performance table and graph do not reflect the deduction of taxes that a shareholder would pay on Fund distributions or the redemption of Fund shares. For the Fund's most recent month end performance please visit www.direxion.com.
A fund that meets its daily target over a period of time will not necessarily produce the returns that might be expected in light of the returns of its index or benchmark for that period. Differences may result from the compounding effect of market fluctuation and the use of leverage. The pursuit of daily goals may result in daily, leveraged compounding, which means that the return of an index over a period of time greater than one day multiplied by a fund's specified multiple (300%) will not generally equal a fund's performance over that same period.
This chart illustrates the performance of a hypothetical $10,000 investment made on the Fund's inception and is not intended to imply any future performance. Shares of Direxion Shares are bought and sold at market price (not NAV) and are not individually redeemed from the Fund. Performance reflects reinvestment of all dividend and capital gains distributions. During this period, some of the Fund's fees were waived and/or expenses reimbursed; otherwise, the Fund's performance would have been lower.
The Dow Jones U.S. Select Aerospace & Defense Index attempts to measure the performance of the aerospace and defense industry of the U.S. equity market. The Index Provider selects the stocks comprising the Index from the aerospace and defense sector on the basis of the float-adjusted, market capitalization-weight of each constituent. Investors cannot invest directly in an index, although they can invest in its underlying securities.
Market Exposure
The Fund seeks daily exposure of 300% of its NAV through a combination of equities and derivatives. "Market Exposure" includes the value of total investments (including the contract value of any derivatives) and excludes any short-term investments and cash equivalents divided by Net Assets.
1 Commencement of operations.
2 As of October 31, 2022.
DIREXION ANNUAL REPORT
27
Direxion Daily Consumer Discretionary Bull 3X Shares
Performance Summary (Unaudited)
November 29, 20181 - October 31, 2022

| | | Average Annual Total Return2 | |
| | | 1 Year | | 3 Years | | Since Inception | |
Direxion Daily Consumer Discretionary
Bull 3X Shares (NAV) | | | -74.51 | % | | | -9.45 | % | | | -1.32 | % | |
Direxion Daily Consumer Discretionary
Bull 3X Shares (Market Price) | | | -74.42 | % | | | -9.27 | % | | | -1.28 | % | |
Consumer Discretionary Select
Sector Index | | | -27.80 | % | | | 7.06 | % | | | 8.92 | % | |
The performance data quoted represents past performance; past performance does not guarantee future results; the investment return and principal value of an investment will fluctuate; an investor's shares, when redeemed, may be worth more or less than their original cost; current performance may be lower or higher than the performance quoted. Returns for performance under one year are cumulative, not annualized. As stated in the current prospectus, the Fund's total annual operating expense ratio (gross) is 1.02%. Rafferty Asset Management, LLC has contractually agreed to waive all or a portion of its management fee and/or reimburse the Fund for other expenses through September 1, 2024 to the extent the Total Annual Operating Expenses exceed 0.95% (excluding, as applicable, among other expenses, taxes, swap financing and related costs, acquired fund fees and expenses, dividends or interest on short positions, other interest expenses, brokerage commissions and extraordinary expenses). The performance table and graph do not reflect the deduction of taxes that a shareholder would pay on Fund distributions or the redemption of Fund shares. For the Fund's most recent month end performance please visit www.direxion.com.
A fund that meets its daily target over a period of time will not necessarily produce the returns that might be expected in light of the returns of its index or benchmark for that period. Differences may result from the compounding effect of market fluctuation and the use of leverage. The pursuit of daily goals may result in daily, leveraged compounding, which means that the return of an index over a period of time greater than one day multiplied by a fund's specified multiple (300%) will not generally equal a fund's performance over that same period.
This chart illustrates the performance of a hypothetical $10,000 investment made on the Fund's inception and is not intended to imply any future performance. Shares of Direxion Shares are bought and sold at market price (not NAV) and are not individually redeemed from the Fund. Performance reflects reinvestment of all dividend and capital gains distributions. During this period, some of the Fund's fees were waived and/or expenses reimbursed; otherwise, the Fund's performance would have been lower.
The Consumer Discretionary Select Sector Index is provided by S&P Dow Jones Indices and includes domestic companies from the consumer discretionary sector which includes the following industries: media; retail (specialty, multiline, internet & catalog); hotels, restaurants & leisure; textiles, apparel & luxury goods; household durables; automobiles; automobile components; distributors; leisure equipment & products; and diversified consumer services. Investors cannot invest directly in an index, although they can invest in its underlying securities.
Market Exposure
The Fund seeks daily exposure of 300% of its NAV through a combination of equities and derivatives. "Market Exposure" includes the value of total investments (including the contract value of any derivatives) and excludes any short-term investments and cash equivalents divided by Net Assets.
1 Commencement of operations.
2 As of October 31, 2022.
DIREXION ANNUAL REPORT
28
Direxion Daily Dow Jones Internet Bull 3X Shares
Performance Summary (Unaudited)
November 7, 20191 - October 31, 2022

| | | Average Annual Total Return2 | |
| | | 1 Year | | Since Inception | |
Direxion Daily Dow Jones Internet Bull 3X
Shares (NAV) | | | -91.32 | % | | | -33.04 | % | |
Direxion Daily Dow Jones Internet Bull 3X
Shares (Market Price) | | | -91.32 | % | | | -32.98 | % | |
Dow Jones Internet Composite Index | | | -47.01 | % | | | -0.70 | % | |
The performance data quoted represents past performance; past performance does not guarantee future results; the investment return and principal value of an investment will fluctuate; an investor's shares, when redeemed, may be worth more or less than their original cost; current performance may be lower or higher than the performance quoted. Returns for performance under one year are cumulative, not annualized. As stated in the current prospectus, the Fund's total annual operating expense ratio (gross) is 0.98%. Rafferty Asset Management, LLC has contractually agreed to waive all or a portion of its management fee and/or reimburse the Fund for other expenses through September 1, 2024 to the extent the Total Annual Operating Expenses exceed 0.95% (excluding, as applicable, among other expenses, taxes, swap financing and related costs, acquired fund fees and expenses, dividends or interest on short positions, other interest expenses, brokerage commissions and extraordinary expenses). The performance table and graph do not reflect the deduction of taxes that a shareholder would pay on Fund distributions or the redemption of Fund shares. For the Fund's most recent month end performance please visit www.direxion.com.
A fund that meets its daily target over a period of time will not necessarily produce the returns that might be expected in light of the returns of its index or benchmark for that period. Differences may result from the compounding effect of market fluctuation and the use of leverage. The pursuit of daily goals may result in daily, leveraged compounding, which means that the return of an index over a period of time greater than one day multiplied by a fund's specified multiple (300%) will not generally equal a fund's performance over that same period.
This chart illustrates the performance of a hypothetical $10,000 investment made on the Fund's inception and is not intended to imply any future performance. Shares of Direxion Shares are bought and sold at market price (not NAV) and are not individually redeemed from the Fund. Performance reflects reinvestment of all dividend and capital gains distributions. During this period, some of the Fund's fees were waived and/or expenses reimbursed; otherwise, the Fund's performance would have been lower.
The Dow Jones Internet Composite Index is provided by S&P Dow Jones Indices and includes companies that generate at least 50% of their annual sales/revenue from the internet as determined by the Index Provider. Additionally, each stock must have a minimum of three months' trading history and a three month average market capitalization of at least $100 million. The Index consists of 40 stocks that are included in two different sectors, internet commerce and internet services. Investors cannot invest directly in an index, although they can invest in its underlying securities.
Market Exposure
The Fund seeks daily exposure of 300% of its NAV through a combination of equities and derivatives. "Market Exposure" includes the value of total investments (including the contract value of any derivatives) and excludes any short-term investments and cash equivalents divided by Net Assets.
1 Commencement of operations.
2 As of October 31, 2022.
DIREXION ANNUAL REPORT
29
Direxion Daily Dow Jones Internet Bear 3X Shares
Performance Summary (Unaudited)
November 7, 20191 - October 31, 2022

| | | Average Annual Total Return2 | |
| | | 1 Year | | Since Inception | |
Direxion Daily Dow Jones Internet Bear 3X
Shares (NAV) | | | 165.69 | % | | | -46.63 | % | |
Direxion Daily Dow Jones Internet Bear 3X
Shares (Market Price) | | | 165.78 | % | | | -46.61 | % | |
Dow Jones Internet Composite Index | | | -47.01 | % | | | -0.70 | % | |
The performance data quoted represents past performance; past performance does not guarantee future results; the investment return and principal value of an investment will fluctuate; an investor's shares, when redeemed, may be worth more or less than their original cost; current performance may be lower or higher than the performance quoted. Returns for performance under one year are cumulative, not annualized. As stated in the current prospectus, the Fund's total annual operating expense ratio (gross) is 1.62%. Rafferty Asset Management, LLC has contractually agreed to waive all or a portion of its management fee and/or reimburse the Fund for other expenses through September 1, 2024 to the extent the Total Annual Operating Expenses exceed 0.95% (excluding, as applicable, among other expenses, taxes, swap financing and related costs, acquired fund fees and expenses, dividends or interest on short positions, other interest expenses, brokerage commissions and extraordinary expenses). The performance table and graph do not reflect the deduction of taxes that a shareholder would pay on Fund distributions or the redemption of Fund shares. For the Fund's most recent month end performance please visit www.direxion.com.
A fund that meets its daily target over a period of time will not necessarily produce the returns that might be expected in light of the returns of its index or benchmark for that period. Differences may result from the compounding effect of market fluctuation, the use of leverage and a Bear Fund's inverse correlation. The pursuit of daily goals may result in daily, leveraged compounding, which means that the return of an index over a period of time greater than one day multiplied by a fund's specified inverse multiple (-300%) will not generally equal a fund's performance over that same period.
This chart illustrates the performance of a hypothetical $10,000 investment made on the Fund's inception and is not intended to imply any future performance. Shares of Direxion Shares are bought and sold at market price (not NAV) and are not individually redeemed from the Fund. Performance reflects reinvestment of all dividend and capital gains distributions. During this period, some of the Fund's fees were waived and/or expenses reimbursed; otherwise, the Fund's performance would have been lower.
The Dow Jones Internet Composite Index is provided by S&P Dow Jones Indices and includes companies that generate at least 50% of their annual sales/revenue from the internet as determined by the Index Provider. Additionally, each stock must have a minimum of three months' trading history and a three month average market capitalization of at least $100 million. The Index consists of 40 stocks that are included in two different sectors, internet commerce and internet services. Investors cannot invest directly in an index, although they can invest in its underlying securities.
Market Exposure
The Fund seeks daily exposure of -300% of its NAV through derivatives. "Market Exposure" includes the value of total investments (including the contract value of any derivatives) and excludes any short-term investments and cash equivalents divided by Net Assets.
1 Commencement of operations.
2 As of October 31, 2022.
DIREXION ANNUAL REPORT
30
Direxion Daily Financial Bull 3X Shares
Performance Summary (Unaudited)
October 31, 2012 - October 31, 2022

| | Average Annual Total Return1 | |
| | 1 Year | | 3 Years | | 5 Years | | 10 Years | |
Direxion Daily Financial Bull 3X
Shares (NAV) | | | -48.61 | % | | | -2.34 | % | | | 4.95 | % | | | 23.80 | % | |
Direxion Daily Financial Bull 3X
Shares (Market Price) | | | -48.64 | % | | | -2.34 | % | | | 4.95 | % | | | 23.79 | % | |
Financial Select Sector Index | | | -14.05 | % | | | 8.09 | % | | | 7.26 | % | | | 12.43 | % | |
Russell 1000® Financials 40 Act 15/22.5
Daily Capped Index | | | -13.69 | % | | | 8.39 | % | | | 7.44 | % | | | 12.60 | % | |
Russell 1000® Index – Financials | | | -13.72 | % | | | 10.68 | % | | | 10.49 | % | | | 13.67 | % | |
The performance data quoted represents past performance; past performance does not guarantee future results; the investment return and principal value of an investment will fluctuate; an investor's shares, when redeemed, may be worth more or less than their original cost; current performance may be lower or higher than the performance quoted. Returns for performance under one year are cumulative, not annualized. As stated in the current prospectus, the Fund's total annual operating expense ratio (gross) is 0.92%. Rafferty Asset Management, LLC has contractually agreed to waive all or a portion of its management fee and/or reimburse the Fund for other expenses through September 1, 2024 to the extent the Total Annual Operating Expenses exceed 0.95% (excluding, as applicable, among other expenses, taxes, swap financing and related costs, acquired fund fees and expenses, dividends or interest on short positions, other interest expenses, brokerage commissions and extraordinary expenses). The performance table and graph do not reflect the deduction of taxes that a shareholder would pay on Fund distributions or the redemption of Fund shares. For the Fund's most recent month end performance please visit www.direxion.com.
A fund that meets its daily target over a period of time will not necessarily produce the returns that might be expected in light of the returns of its index or benchmark for that period. Differences may result from the compounding effect of market fluctuation and the use of leverage. The pursuit of daily goals may result in daily, leveraged compounding, which means that the return of an index over a period of time greater than one day multiplied by a fund's specified multiple (300%) will not generally equal a fund's performance over that same period.
This chart illustrates the performance of a hypothetical $10,000 investment made on the Fund's inception and is not intended to imply any future performance. Shares of Direxion Shares are bought and sold at market price (not NAV) and are not individually redeemed from the Fund. Performance reflects reinvestment of all dividend and capital gains distributions. During this period, some of the Fund's fees were waived and/or expenses reimbursed; otherwise, the Fund's performance would have been lower.
The Financial Select Sector Index is provided by S&P Dow Jones Indices and includes securities of companies from the following industries: Banks; Thrifts & Mortgage Finance; Diversified Financial Services; Consumer Finance; Capital Markets; Insurance; and Mortgage Real Estate Investment Trusts (REITs). Investors cannot invest directly in an index, although they can invest in its underlying securities.
Market Exposure
The Fund seeks daily exposure of 300% of its NAV through a combination of equities and derivatives. "Market Exposure" includes the value of total investments (including the contract value of any derivatives) and excludes any short-term investments and cash equivalents divided by Net Assets.
1 As of October 31, 2022.
DIREXION ANNUAL REPORT
31
Direxion Daily Financial Bear 3X Shares
Performance Summary (Unaudited)
October 31, 2012 - October 31, 2022
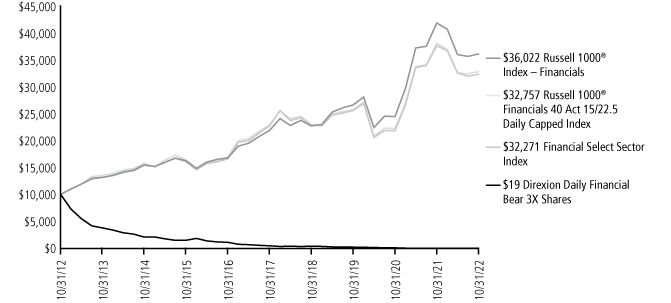
| | Average Annual Total Return1 | |
| | 1 Year | | 3 Years | | 5 Years | | 10 Years | |
Direxion Daily Financial Bear 3X
Shares (NAV) | | | 11.84 | % | | | -57.17 | % | | | -47.78 | % | | | -46.60 | % | |
Direxion Daily Financial Bear 3X
Shares (Market Price) | | | 11.68 | % | | | -57.17 | % | | | -47.79 | % | | | -46.60 | % | |
Financial Select Sector Index | | | -14.05 | % | | | 8.09 | % | | | 7.26 | % | | | 12.43 | % | |
Russell 1000® Financials 40 Act 15/22.5
Daily Capped Index | | | -13.69 | % | | | 8.39 | % | | | 7.44 | % | | | 12.60 | % | |
Russell 1000® Index – Financials | | | -13.72 | % | | | 10.68 | % | | | 10.49 | % | | | 13.67 | % | |
The performance data quoted represents past performance; past performance does not guarantee future results; the investment return and principal value of an investment will fluctuate; an investor's shares, when redeemed, may be worth more or less than their original cost; current performance may be lower or higher than the performance quoted. Returns for performance under one year are cumulative, not annualized. As stated in the current prospectus, the Fund's total annual operating expense ratio (gross) is 1.01%. Rafferty Asset Management, LLC has contractually agreed to waive all or a portion of its management fee and/or reimburse the Fund for other expenses through September 1, 2024 to the extent the Total Annual Operating Expenses exceed 0.95% (excluding, as applicable, among other expenses, taxes, swap financing and related costs, acquired fund fees and expenses, dividends or interest on short positions, other interest expenses, brokerage commissions and extraordinary expenses). The performance table and graph do not reflect the deduction of taxes that a shareholder would pay on Fund distributions or the redemption of Fund shares. For the Fund's most recent month end performance please visit www.direxion.com.
A fund that meets its daily target over a period of time will not necessarily produce the returns that might be expected in light of the returns of its index or benchmark for that period. Differences may result from the compounding effect of market fluctuation, the use of leverage and a Bear Fund's inverse correlation. The pursuit of daily goals may result in daily, leveraged compounding, which means that the return of an index over a period of time greater than one day multiplied by a fund's specified inverse multiple (-300%) will not generally equal a fund's performance over that same period.
This chart illustrates the performance of a hypothetical $10,000 investment made on the Fund's inception and is not intended to imply any future performance. Shares of Direxion Shares are bought and sold at market price (not NAV) and are not individually redeemed from the Fund. Performance reflects reinvestment of all dividend and capital gains distributions. During this period, some of the Fund's fees were waived and/or expenses reimbursed; otherwise, the Fund's performance would have been lower.
The Financial Select Sector Index is provided by S&P Dow Jones Indices and includes securities of companies from the following industries: Banks; Thrifts & Mortgage Finance; Diversified Financial Services; Consumer Finance; Capital Markets; Insurance; and Mortgage Real Estate Investment Trusts (REITs). Investors cannot invest directly in an index, although they can invest in its underlying securities.
Market Exposure
The Fund seeks daily exposure of -300% of its NAV through derivatives. "Market Exposure" includes the value of total investments (including the contract value of any derivatives) and excludes any short-term investments and cash equivalents divided by Net Assets.
1 As of October 31, 2022.
DIREXION ANNUAL REPORT
32
Direxion Daily Healthcare Bull 3X Shares
Performance Summary (Unaudited)
October 31, 2012 - October 31, 2022

| | | Average Annual Total Return2 | |
| | | 1 Year | | 3 Years | | 5 Years | | 10 Years | |
Direxion Daily Healthcare Bull 3X
Shares (NAV) | | | -11.85 | % | | | 23.56 | % | | | 20.29 | % | | | 32.72 | % | |
Direxion Daily Healthcare Bull 3X
Shares (Market Price) | | | -11.80 | % | | | 23.59 | % | | | 20.33 | % | | | 32.72 | % | |
Health Care Select Sector Index | | | 0.81 | % | | | 14.08 | % | | | 12.40 | % | | | 14.78 | % | |
The performance data quoted represents past performance; past performance does not guarantee future results; the investment return and principal value of an investment will fluctuate; an investor's shares, when redeemed, may be worth more or less than their original cost; current performance may be lower or higher than the performance quoted. Returns for performance under one year are cumulative, not annualized. As stated in the current prospectus, the Fund's total annual operating expense ratio (gross) is 0.97%. Rafferty Asset Management, LLC has contractually agreed to waive all or a portion of its management fee and/or reimburse the Fund for other expenses through September 1, 2024 to the extent the Total Annual Operating Expenses exceed 0.95% (excluding, as applicable, among other expenses, taxes, swap financing and related costs, acquired fund fees and expenses, dividends or interest on short positions, other interest expenses, brokerage commissions and extraordinary expenses). The performance table and graph do not reflect the deduction of taxes that a shareholder would pay on Fund distributions or the redemption of Fund shares. For the Fund's most recent month end performance please visit www.direxion.com.
A fund that meets its daily target over a period of time will not necessarily produce the returns that might be expected in light of the returns of its index or benchmark for that period. Differences may result from the compounding effect of market fluctuation and the use of leverage. The pursuit of daily goals may result in daily, leveraged compounding, which means that the return of an index over a period of time greater than one day multiplied by a fund's specified multiple (300%) will not generally equal a fund's performance over that same period.
This chart illustrates the performance of a hypothetical $10,000 investment made on the Fund's inception and is not intended to imply any future performance. Shares of Direxion Shares are bought and sold at market price (not NAV) and are not individually redeemed from the Fund. Performance reflects reinvestment of all dividend and capital gains distributions. During this period, some of the Fund's fees were waived and/or expenses reimbursed; otherwise, the Fund's performance would have been lower.
The Health Care Select Sector Index includes companies from the following industries: pharmaceuticals; health care providers & services; health care equipment & supplies; biotechnology; life sciences tools & services; and health care technology. Investors cannot invest directly in an index, although they can invest in its underlying securities.
Market Exposure
The Fund seeks daily exposure of 300% of its NAV through a combination of equities and derivatives. "Market Exposure" includes the value of total investments (including the contract value of any derivatives) and excludes any short-term investments and cash equivalents divided by Net Assets.
1 As of October 31, 2022.
DIREXION ANNUAL REPORT
33
Direxion Daily Homebuilders & Supplies Bull 3X Shares
Performance Summary (Unaudited)
August 19, 20151 - October 31, 2022

| | | Average Annual Total Return2 | |
| | | 1 Year | | 3 Years | | 5 Years | | Since Inception | |
Direxion Daily Homebuilders & Supplies
Bull 3X Shares (NAV) | | | -68.50 | % | | | -28.03 | % | | | -17.89 | % | | | -5.43 | % | |
Direxion Daily Homebuilders & Supplies
Bull 3X Shares (Market Price) | | | -68.47 | % | | | -27.99 | % | | | -17.89 | % | | | -5.42 | % | |
Dow Jones U.S. Select Home
Construction Index | | | -20.91 | % | | | 9.13 | % | | | 8.25 | % | | | 10.31 | % | |
The performance data quoted represents past performance; past performance does not guarantee future results; the investment return and principal value of an investment will fluctuate; an investor's shares, when redeemed, may be worth more or less than their original cost; current performance may be lower or higher than the performance quoted. Returns for performance under one year are cumulative, not annualized. As stated in the current prospectus, the Fund's total annual operating expense ratio (gross) is 0.96%. Rafferty Asset Management, LLC has contractually agreed to waive all or a portion of its management fee and/or reimburse the Fund for other expenses through September 1, 2024 to the extent the Total Annual Operating Expenses exceed 0.95% (excluding, as applicable, among other expenses, taxes, swap financing and related costs, acquired fund fees and expenses, dividends or interest on short positions, other interest expenses, brokerage commissions and extraordinary expenses). The performance table and graph do not reflect the deduction of taxes that a shareholder would pay on Fund distributions or the redemption of Fund shares. For the Fund's most recent month end performance please visit www.direxion.com.
A fund that meets its daily target over a period of time will not necessarily produce the returns that might be expected in light of the returns of its index or benchmark for that period. Differences may result from the compounding effect of market fluctuation and the use of leverage. The pursuit of daily goals may result in daily, leveraged compounding, which means that the return of an index over a period of time greater than one day multiplied by a fund's specified multiple (300%) will not generally equal a fund's performance over that same period.
This chart illustrates the performance of a hypothetical $10,000 investment made on the Fund's inception and is not intended to imply any future performance. Shares of Direxion Shares are bought and sold at market price (not NAV) and are not individually redeemed from the Fund. Performance reflects reinvestment of all dividend and capital gains distributions. During this period, some of the Fund's fees were waived and/or expenses reimbursed; otherwise, the Fund's performance would have been lower.
The Dow Jones U.S. Select Home Construction Index measures U.S. companies in the home construction sector that provide a wide range of products and services related to homebuilding, including home construction and products, sellers and suppliers if building materials, furnishings and fixtures and also home improvement retailers. Investors cannot invest directly in an index, although they can invest in its underlying securities.
Market Exposure
The Fund seeks daily exposure of 300% of its NAV through a combination of equities and derivatives. "Market Exposure" includes the value of total investments (including the contract value of any derivatives) and excludes any short-term investments and cash equivalents divided by Net Assets.
1 Commencement of operations.
2 As of October 31, 2022.
DIREXION ANNUAL REPORT
34
Direxion Daily Industrials Bull 3X Shares
Performance Summary (Unaudited)
May 3, 20171 - October 31, 2022

| | | Average Annual Total Return2 | |
| | | 1 Year | | 3 Years | | 5 Years | | Since Inception | |
Direxion Daily Industrials Bull 3X
Shares (NAV) | | | -35.71 | % | | | -3.56 | % | | | -0.38 | % | | | 3.58 | % | |
Direxion Daily Industrials Bull 3X
Shares (Market Price) | | | -35.66 | % | | | -3.49 | % | | | -0.42 | % | | | 3.59 | % | |
Industrials Select Sector Index | | | -8.19 | % | | | 8.25 | % | | | 7.76 | % | | | 8.66 | % | |
The performance data quoted represents past performance; past performance does not guarantee future results; the investment return and principal value of an investment will fluctuate; an investor's shares, when redeemed, may be worth more or less than their original cost; current performance may be lower or higher than the performance quoted. Returns for performance under one year are cumulative, not annualized. As stated in the current prospectus, the Fund's total annual operating expense ratio (gross) is 0.98%. Rafferty Asset Management, LLC has contractually agreed to waive all or a portion of its management fee and/or reimburse the Fund for other expenses through September 1, 2024 to the extent the Total Annual Operating Expenses exceed 0.95% (excluding, as applicable, among other expenses, taxes, swap financing and related costs, acquired fund fees and expenses, dividends or interest on short positions, other interest expenses, brokerage commissions and extraordinary expenses). The performance table and graph do not reflect the deduction of taxes that a shareholder would pay on Fund distributions or the redemption of Fund shares. For the Fund's most recent month end performance please visit www.direxion.com.
A fund that meets its daily target over a period of time will not necessarily produce the returns that might be expected in light of the returns of its index or benchmark for that period. Differences may result from the compounding effect of market fluctuation and the use of leverage. The pursuit of daily goals may result in daily, leveraged compounding, which means that the return of an index over a period of time greater than one day multiplied by a fund's specified multiple (300%) will not generally equal a fund's performance over that same period.
This chart illustrates the performance of a hypothetical $10,000 investment made on the Fund's inception and is not intended to imply any future performance. Shares of Direxion Shares are bought and sold at market price (not NAV) and are not individually redeemed from the Fund. Performance reflects reinvestment of all dividend and capital gains distributions. During this period, some of the Fund's fees were waived and/or expenses reimbursed; otherwise, the Fund's performance would have been lower.
The Industrials Select Sector Index is provided by S&P Dow Jones Indices and includes domestic companies from the industrials sector which includes the following industries: aerospace and defense; industry conglomerates; and machinery. Investors cannot invest directly in an index, although they can invest in its underlying securities.
Market Exposure
The Fund seeks daily exposure of 300% of its NAV through a combination of equities and derivatives. "Market Exposure" includes the value of total investments (including the contract value of any derivatives) and excludes any short-term investments and cash equivalents divided by Net Assets.
1 Commencement of operations.
2 As of October 31, 2022.
DIREXION ANNUAL REPORT
35
Direxion Daily Pharmaceutical & Medical Bull 3X Shares
Performance Summary (Unaudited)
November 15, 20171 - October 31, 2022

| | | Average Annual Total Return2 | |
| | | 1 Year | | 3 Years | | Since Inception | |
Direxion Daily Pharmaceutical &
Medical Bull 3X Shares (NAV) | | | -43.75 | % | | | -13.35 | % | | | -16.34 | % | |
Direxion Daily Pharmaceutical &
Medical Bull 3X Shares (Market Price) | | | -43.68 | % | | | -13.14 | % | | | -16.29 | % | |
S&P Pharmaceuticals Select
Industry Index | | | -14.61 | % | | | 10.22 | % | | | 10.47 | % | |
The performance data quoted represents past performance; past performance does not guarantee future results; the investment return and principal value of an investment will fluctuate; an investor's shares, when redeemed, may be worth more or less than their original cost; current performance may be lower or higher than the performance quoted. Returns for performance under one year are cumulative, not annualized. As stated in the current prospectus, the Fund's total annual operating expense ratio (gross) is 1.09%. Rafferty Asset Management, LLC has contractually agreed to waive all or a portion of its management fee and/or reimburse the Fund for other expenses through September 1, 2024 to the extent the Total Annual Operating Expenses exceed 0.95% (excluding, as applicable, among other expenses, taxes, swap financing and related costs, acquired fund fees and expenses, dividends or interest on short positions, other interest expenses, brokerage commissions and extraordinary expenses). The performance table and graph do not reflect the deduction of taxes that a shareholder would pay on Fund distributions or the redemption of Fund shares. For the Fund's most recent month end performance please visit www.direxion.com.
A fund that meets its daily target over a period of time will not necessarily produce the returns that might be expected in light of the returns of its index or benchmark for that period. Differences may result from the compounding effect of market fluctuation and the use of leverage. The pursuit of daily goals may result in daily, leveraged compounding, which means that the return of an index over a period of time greater than one day multiplied by a fund's specified multiple (300%) will not generally equal a fund's performance over that same period.
This chart illustrates the performance of a hypothetical $10,000 investment made on the Fund's inception and is not intended to imply any future performance. Shares of Direxion Shares are bought and sold at market price (not NAV) and are not individually redeemed from the Fund. Performance reflects reinvestment of all dividend and capital gains distributions. During this period, some of the Fund's fees were waived and/or expenses reimbursed; otherwise, the Fund's performance would have been lower.
The S&P Pharmaceuticals Select Industry Index is a modified equal-weighted index that is designed to measure performance of the stocks comprising the S&P Total Market Index that are classified in the Global Industry Classification Standard (GICS) pharmaceuticals subindustry. Investors cannot invest directly in an index, although they can invest in its underlying securities.
Market Exposure
The Fund seeks daily exposure of 300% of its NAV through a combination of equities and derivatives. "Market Exposure" includes the value of total investments (including the contract value of any derivatives) and excludes any short-term investments and cash equivalents divided by Net Assets.
1 Commencement of operations.
2 As of October 31, 2022.
DIREXION ANNUAL REPORT
36
Direxion Daily Real Estate Bull 3X Shares
Performance Summary (Unaudited)
October 31, 2012 - October 31, 2022

| | Average Annual Total Return1 | |
| | 1 Year | | 3 Years | | 5 Years | | 10 Years | |
Direxion Daily Real Estate Bull 3X
Shares (NAV) | | | -60.04 | % | | | -28.97 | % | | | -11.75 | % | | | 2.73 | % | |
Direxion Daily Real Estate Bull 3X
Shares (Market Price) | | | -60.06 | % | | | -29.21 | % | | | -11.88 | % | | | 2.67 | % | |
Real Estate Select Sector Index | | | -20.65 | % | | | 1.15 | % | | | 6.08 | % | | | 8.08 | % | |
MSCI U.S. IMI Real Estate 25/50 Index | | | -21.33 | % | | | -0.71 | % | | | 4.38 | % | | | N/A | | |
The performance data quoted represents past performance; past performance does not guarantee future results; the investment return and principal value of an investment will fluctuate; an investor's shares, when redeemed, may be worth more or less than their original cost; current performance may be lower or higher than the performance quoted. Returns for performance under one year are cumulative, not annualized. As stated in the current prospectus, the Fund's total annual operating expense ratio (gross) is 0.96%. Rafferty Asset Management, LLC has contractually agreed to waive all or a portion of its management fee and/or reimburse the Fund for other expenses through September 1, 2024 to the extent the Total Annual Operating Expenses exceed 0.95% (excluding, as applicable, among other expenses, taxes, swap financing and related costs, acquired fund fees and expenses, dividends or interest on short positions, other interest expenses, brokerage commissions and extraordinary expenses). The performance table and graph do not reflect the deduction of taxes that a shareholder would pay on Fund distributions or the redemption of Fund shares. For the Fund's most recent month end performance please visit www.direxion.com.
A fund that meets its daily target over a period of time will not necessarily produce the returns that might be expected in light of the returns of its index or benchmark for that period. Differences may result from the compounding effect of market fluctuation and the use of leverage. The pursuit of daily goals may result in daily, leveraged compounding, which means that the return of an index over a period of time greater than one day multiplied by a fund's specified multiple (300%) will not generally equal a fund's performance over that same period.
This chart illustrates the performance of a hypothetical $10,000 investment made on the Fund's inception and is not intended to imply any future performance. Shares of Direxion Shares are bought and sold at market price (not NAV) and are not individually redeemed from the Fund. Performance reflects reinvestment of all dividend and capital gains distributions. During this period, some of the Fund's fees were waived and/or expenses reimbursed; otherwise, the Fund's performance would have been lower.
The Real Estate Select Sector Index is provided by S&P Dow Jones Indices (the "Index Provider") and includes securities of companies from the following industries: real estate management and development and real estate investment trusts ("REITs"), excluding mortgage REITs. Investors cannot invest directly in an index, although they can invest in its underlying securities.
Market Exposure
The Fund seeks daily exposure of 300% of its NAV through a combination of equities and derivatives. "Market Exposure" includes the value of total investments (including the contract value of any derivatives) and excludes any short-term investments and cash equivalents divided by Net Assets.
1 As of October 31, 2022.
DIREXION ANNUAL REPORT
37
Direxion Daily Real Estate Bear 3X Shares
Performance Summary (Unaudited)
October 31, 2012 - October 31, 2022

| | Average Annual Total Return1 | |
| | 1 Year | | 3 Years | | 5 Years | | 10 Years | |
Direxion Daily Real Estate Bear 3X
Shares (NAV) | | | 47.82 | % | | | -38.18 | % | | | -35.17 | % | | | -35.06 | % | |
Direxion Daily Real Estate Bear 3X
Shares (Market Price) | | | 48.38 | % | | | -38.16 | % | | | -35.69 | % | | | -35.06 | % | |
Real Estate Select Sector Index | | | -20.65 | % | | | 1.15 | % | | | 6.08 | % | | | 8.08 | % | |
MSCI U.S. IMI Real Estate 25/50 Index | | | -21.33 | % | | | -0.71 | % | | | 4.38 | % | | | N/A | | |
The performance data quoted represents past performance; past performance does not guarantee future results; the investment return and principal value of an investment will fluctuate; an investor's shares, when redeemed, may be worth more or less than their original cost; current performance may be lower or higher than the performance quoted. Returns for performance under one year are cumulative, not annualized. As stated in the current prospectus, the Fund's total annual operating expense ratio (gross) is 1.21%. Rafferty Asset Management, LLC has contractually agreed to waive all or a portion of its management fee and/or reimburse the Fund for other expenses through September 1, 2024 to the extent the Total Annual Operating Expenses exceed 0.95% (excluding, as applicable, among other expenses, taxes, swap financing and related costs, acquired fund fees and expenses, dividends or interest on short positions, other interest expenses, brokerage commissions and extraordinary expenses). The performance table and graph do not reflect the deduction of taxes that a shareholder would pay on Fund distributions or the redemption of Fund shares. For the Fund's most recent month end performance please visit www.direxion.com.
A fund that meets its daily target over a period of time will not necessarily produce the returns that might be expected in light of the returns of its index or benchmark for that period. Differences may result from the compounding effect of market fluctuation, the use of leverage and a Bear Fund's inverse correlation. The pursuit of daily goals may result in daily, leveraged compounding, which means that the return of an index over a period of time greater than one day multiplied by a fund's specified inverse multiple (-300%) will not generally equal a fund's performance over that same period.
This chart illustrates the performance of a hypothetical $10,000 investment made on the Fund's inception and is not intended to imply any future performance. Shares of Direxion Shares are bought and sold at market price (not NAV) and are not individually redeemed from the Fund. Performance reflects reinvestment of all dividend and capital gains distributions. During this period, some of the Fund's fees were waived and/or expenses reimbursed; otherwise, the Fund's performance would have been lower.
The Real Estate Select Sector Index is provided by S&P Dow Jones Indices (the "Index Provider") and includes securities of companies from the following industries: real estate management and development and real estate investment trusts ("REITs"), excluding mortgage REITs. Investors cannot invest directly in an index, although they can invest in its underlying securities.
Market Exposure
The Fund seeks daily exposure of -300% of its NAV through derivatives. "Market Exposure" includes the value of total investments (including the contract value of any derivatives) and excludes any short-term investments and cash equivalents divided by Net Assets.
1 As of October 31, 2022.
DIREXION ANNUAL REPORT
38
Direxion Daily Regional Banks Bull 3X Shares
Performance Summary (Unaudited)
August 19, 20151 - October 31, 2022
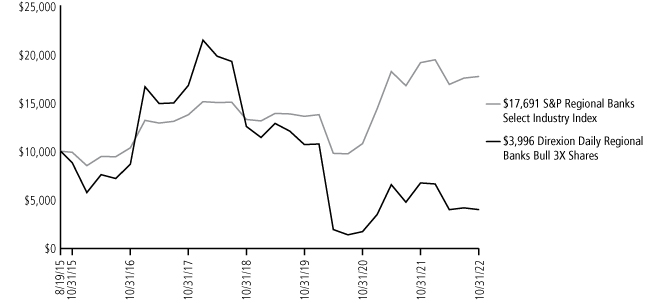
| | | Average Annual Total Return2 | |
| | | 1 Year | | 3 Years | | 5 Years | | Since Inception | |
Direxion Daily Regional Banks Bull 3X
Shares (NAV) | | | -40.71 | % | | | -27.96 | % | | | -24.94 | % | | | -11.96 | % | |
Direxion Daily Regional Banks Bull 3X
Shares (Market Price) | | | -40.72 | % | | | -27.97 | % | | | -25.01 | % | | | -11.96 | % | |
S&P Regional Banks Select Industry Index | | | -7.46 | % | | | 9.18 | % | | | 5.16 | % | | | 8.24 | % | |
The performance data quoted represents past performance; past performance does not guarantee future results; the investment return and principal value of an investment will fluctuate; an investor's shares, when redeemed, may be worth more or less than their original cost; current performance may be lower or higher than the performance quoted. Returns for performance under one year are cumulative, not annualized. As stated in the current prospectus, the Fund's total annual operating expense ratio (gross) is 0.92%. Rafferty Asset Management, LLC has contractually agreed to waive all or a portion of its management fee and/or reimburse the Fund for other expenses through September 1, 2024 to the extent the Total Annual Operating Expenses exceed 0.95% (excluding, as applicable, among other expenses, taxes, swap financing and related costs, acquired fund fees and expenses, dividends or interest on short positions, other interest expenses, brokerage commissions and extraordinary expenses). The performance table and graph do not reflect the deduction of taxes that a shareholder would pay on Fund distributions or the redemption of Fund shares. For the Fund's most recent month end performance please visit www.direxion.com.
A fund that meets its daily target over a period of time will not necessarily produce the returns that might be expected in light of the returns of its index or benchmark for that period. Differences may result from the compounding effect of market fluctuation and the use of leverage. The pursuit of daily goals may result in daily, leveraged compounding, which means that the return of an index over a period of time greater than one day multiplied by a fund's specified multiple (300%) will not generally equal a fund's performance over that same period.
This chart illustrates the performance of a hypothetical $10,000 investment made on the Fund's inception and is not intended to imply any future performance. Shares of Direxion Shares are bought and sold at market price (not NAV) and are not individually redeemed from the Fund. Performance reflects reinvestment of all dividend and capital gains distributions. During this period, some of the Fund's fees were waived and/or expenses reimbursed; otherwise, the Fund's performance would have been lower.
The S&P Regional Banks Select Industry Index is a modified equal-weighted index that is designed to measure performance of the stocks comprising the S&P Total Market Index that are classified in the Global Industry Classification Standard (GICS) regional banks sub-industry. Investors cannot invest directly in an index, although they can invest in its underlying securities.
Market Exposure
The Fund seeks daily exposure of 300% of its NAV through a combination of equities and derivatives. "Market Exposure" includes the value of total investments (including the contract value of any derivatives) and excludes any short-term investments and cash equivalents divided by Net Assets.
1 Commencement of operations.
2 As of October 31, 2022.
DIREXION ANNUAL REPORT
39
Direxion Daily Retail Bull 3X Shares
Performance Summary (Unaudited)
October 31, 2012 - October 31, 2022
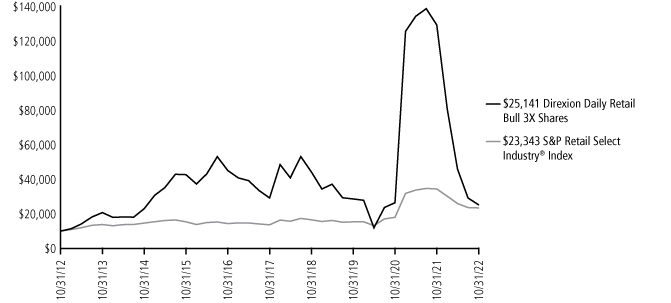
| | | Average Annual Total Return1 | |
| | | 1 Year | | 3 Years | | 5 Years | | 10 Years | |
Direxion Daily Retail Bull 3X
Shares (NAV) | | | -80.48 | % | | | -4.11 | % | | | -2.87 | % | | | 9.66 | % | |
Direxion Daily Retail Bull 3X
Shares (Market Price) | | | -80.48 | % | | | -3.97 | % | | | -2.83 | % | | | 9.67 | % | |
S&P Retail Select Industry® Index | | | -31.90 | % | | | 15.05 | % | | | 11.40 | % | | | 8.85 | % | |
The performance data quoted represents past performance; past performance does not guarantee future results; the investment return and principal value of an investment will fluctuate; an investor's shares, when redeemed, may be worth more or less than their original cost; current performance may be lower or higher than the performance quoted. Returns for performance under one year are cumulative, not annualized. As stated in the current prospectus, the Fund's total annual operating expense ratio (gross) is 0.98%. Rafferty Asset Management, LLC has contractually agreed to waive all or a portion of its management fee and/or reimburse the Fund for other expenses through September 1, 2024 to the extent the Total Annual Operating Expenses exceed 0.95% (excluding, as applicable, among other expenses, taxes, swap financing and related costs, acquired fund fees and expenses, dividends or interest on short positions, other interest expenses, brokerage commissions and extraordinary expenses). The performance table and graph do not reflect the deduction of taxes that a shareholder would pay on Fund distributions or the redemption of Fund shares. For the Fund's most recent month end performance please visit www.direxion.com.
A fund that meets its daily target over a period of time will not necessarily produce the returns that might be expected in light of the returns of its index or benchmark for that period. Differences may result from the compounding effect of market fluctuation and the use of leverage. The pursuit of daily goals may result in daily, leveraged compounding, which means that the return of an index over a period of time greater than one day multiplied by a fund's specified multiple (300%) will not generally equal a fund's performance over that same period.
This chart illustrates the performance of a hypothetical $10,000 investment made on the Fund's inception and is not intended to imply any future performance. Shares of Direxion Shares are bought and sold at market price (not NAV) and are not individually redeemed from the Fund. Performance reflects reinvestment of all dividend and capital gains distributions. During this period, some of the Fund's fees were waived and/or expenses reimbursed; otherwise, the Fund's performance would have been lower.
The S&P Retail Select Industry Index is a modified equal-weighted index that is designed to measure performance of the stocks comprising the S&P Total Market Index that are classified in the Global Industry Classification Standard (GICS) retail sub-industry. Investors cannot invest directly in an index, although they can invest in its underlying securities.
Market Exposure
The Fund seeks daily exposure of 300% of its NAV through a combination of equities and derivatives. "Market Exposure" includes the value of total investments (including the contract value of any derivatives) and excludes any short-term investments and cash equivalents divided by Net Assets.
1 As of October 31, 2022.
DIREXION ANNUAL REPORT
40
Direxion Daily S&P 500® High Beta Bull 3X Shares
Performance Summary (Unaudited)
November 7, 20191 - October 31, 2022

| | | Average Annual Total Return2 | |
| | | 1 Year | | Since Inception | |
Direxion Daily S&P 500® High Beta Bull 3X
Shares (NAV) | | | -66.20 | % | | | -10.30 | % | |
Direxion Daily S&P 500® High Beta Bull 3X
Shares (Market Price) | | | -66.18 | % | | | -10.26 | % | |
S&P 500® High Beta Index | | | -19.77 | % | | | 15.03 | % | |
The performance data quoted represents past performance; past performance does not guarantee future results; the investment return and principal value of an investment will fluctuate; an investor's shares, when redeemed, may be worth more or less than their original cost; current performance may be lower or higher than the performance quoted. Returns for performance under one year are cumulative, not annualized. As stated in the current prospectus, the Fund's total annual operating expense ratio (gross) is 0.98%. Rafferty Asset Management, LLC has contractually agreed to waive all or a portion of its management fee and/or reimburse the Fund for other expenses through September 1, 2024 to the extent the Total Annual Operating Expenses exceed 0.95% (excluding, as applicable, among other expenses, taxes, swap financing and related costs, acquired fund fees and expenses, dividends or interest on short positions, other interest expenses, brokerage commissions and extraordinary expenses). The performance table and graph do not reflect the deduction of taxes that a shareholder would pay on Fund distributions or the redemption of Fund shares. For the Fund's most recent month end performance please visit www.direxion.com.
A fund that meets its daily target over a period of time will not necessarily produce the returns that might be expected in light of the returns of its index or benchmark for that period. Differences may result from the compounding effect of market fluctuation and the use of leverage. The pursuit of daily goals may result in daily, leveraged compounding, which means that the return of an index over a period of time greater than one day multiplied by a fund's specified multiple (300%) will not generally equal a fund's performance over that same period.
This chart illustrates the performance of a hypothetical $10,000 investment made on the Fund's inception and is not intended to imply any future performance. Shares of Direxion Shares are bought and sold at market price (not NAV) and are not individually redeemed from the Fund. Performance reflects reinvestment of all dividend and capital gains distributions. During this period, some of the Fund's fees were waived and/or expenses reimbursed; otherwise, the Fund's performance would have been lower.
The S&P 500® High Beta Index is provided by S&P Dow Jones Indices (the "Index Provider"). The Index Provider selects 100 securities to include in the Index from the S&P 500® Index that have the highest sensitivity to market movements, or "beta" over the past 12 months as determined by the Index Provider. Securities with the highest beta are generally the most volatile securities of the S&P 500® Index. The Index is reviewed and rebalanced quarterly. Investors cannot invest directly in an index, although they can invest in its underlying securities.
Market Exposure
The Fund seeks daily exposure of 300% of its NAV through a combination of equities and derivatives. "Market Exposure" includes the value of total investments (including the contract value of any derivatives) and excludes any short-term investments and cash equivalents divided by Net Assets.
1 Commencement of operations.
2 As of October 31, 2022.
DIREXION ANNUAL REPORT
41
Direxion Daily S&P 500® High Beta Bear 3X Shares
Performance Summary (Unaudited)
November 7, 20191 - October 31, 2022

| | | Average Annual Total Return2 | |
| | | 1 Year | | Since Inception | |
Direxion Daily S&P 500® High Beta Bear 3X
Shares (NAV) | | | -4.86 | % | | | -74.31 | % | |
Direxion Daily S&P 500® High Beta Bear 3X
Shares (Market Price) | | | -4.53 | % | | | -74.29 | % | |
S&P 500® High Beta Index | | | -19.77 | % | | | 15.03 | % | |
The performance data quoted represents past performance; past performance does not guarantee future results; the investment return and principal value of an investment will fluctuate; an investor's shares, when redeemed, may be worth more or less than their original cost; current performance may be lower or higher than the performance quoted. Returns for performance under one year are cumulative, not annualized. As stated in the current prospectus, the Fund's total annual operating expense ratio (gross) is 1.09%. Rafferty Asset Management, LLC has contractually agreed to waive all or a portion of its management fee and/or reimburse the Fund for other expenses through September 1, 2024 to the extent the Total Annual Operating Expenses exceed 0.95% (excluding, as applicable, among other expenses, taxes, swap financing and related costs, acquired fund fees and expenses, dividends or interest on short positions, other interest expenses, brokerage commissions and extraordinary expenses). The performance table and graph do not reflect the deduction of taxes that a shareholder would pay on Fund distributions or the redemption of Fund shares. For the Fund's most recent month end performance please visit www.direxion.com.
A fund that meets its daily target over a period of time will not necessarily produce the returns that might be expected in light of the returns of its index or benchmark for that period. Differences may result from the compounding effect of market fluctuation, the use of leverage, and a Bear Fund's inverse correlation. The pursuit of daily goals may result in daily, leveraged compounding, which means that the return of an index over a period of time greater than one day multiplied by a fund's specified multiple (-300%) will not generally equal a fund's performance over that same period.
This chart illustrates the performance of a hypothetical $10,000 investment made on the Fund's inception and is not intended to imply any future performance. Shares of Direxion Shares are bought and sold at market price (not NAV) and are not individually redeemed from the Fund. Performance reflects reinvestment of all dividend and capital gains distributions. During this period, some of the Fund's fees were waived and/or expenses reimbursed; otherwise, the Fund's performance would have been lower.
The S&P 500® High Beta Index is provided by S&P Dow Jones Indices (the "Index Provider"). The Index Provider selects 100 securities to include in the Index from the S&P 500® Index that have the highest sensitivity to market movements, or "beta" over the past 12 months as determined by the Index Provider. Securities with the highest beta are generally the most volatile securities of the S&P 500® Index. The Index is reviewed and rebalanced quarterly. Investors cannot invest directly in an index, although they can invest in its underlying securities.
Market Exposure
The Fund seeks daily exposure of -300% of its NAV through derivatives. "Market Exposure" includes the value of total investments (including the contract value of any derivatives) and excludes any short-term investments and cash equivalents divided by Net Assets.
1 Commencement of operations.
2 As of October 31, 2022.
DIREXION ANNUAL REPORT
42
Direxion Daily S&P Biotech Bull 3X Shares
Performance Summary (Unaudited)
May 28, 20151 - October 31, 2022

| | | Average Annual Total Return2 | |
| | | 1 Year | | 3 Years | | 5 Years | | Since Inception | |
Direxion Daily S&P Biotech Bull 3X
Shares (NAV) | | | -86.07 | % | | | -41.56 | % | | | -37.16 | % | | | -33.77 | % | |
Direxion Daily S&P Biotech Bull 3X
Shares (Market Price) | | | -86.07 | % | | | -41.52 | % | | | -37.17 | % | | | -33.75 | % | |
S&P Biotechnology Select Industry Index | | | -34.03 | % | | | 0.42 | % | | | -0.20 | % | | | 0.73 | % | |
The performance data quoted represents past performance; past performance does not guarantee future results; the investment return and principal value of an investment will fluctuate; an investor's shares, when redeemed, may be worth more or less than their original cost; current performance may be lower or higher than the performance quoted. Returns for performance under one year are cumulative, not annualized. As stated in the current prospectus, the Fund's total annual operating expense ratio (gross) is 0.96%. Rafferty Asset Management, LLC has contractually agreed to waive all or a portion of its management fee and/or reimburse the Fund for other expenses through September 1, 2024 to the extent the Total Annual Operating Expenses exceed 0.95% (excluding, as applicable, among other expenses, taxes, swap financing and related costs, acquired fund fees and expenses, dividends or interest on short positions, other interest expenses, brokerage commissions and extraordinary expenses). The performance table and graph do not reflect the deduction of taxes that a shareholder would pay on Fund distributions or the redemption of Fund shares. For the Fund's most recent month end performance please visit www.direxion.com.
A fund that meets its daily target over a period of time will not necessarily produce the returns that might be expected in light of the returns of its index or benchmark for that period. Differences may result from the compounding effect of market fluctuation and the use of leverage. The pursuit of daily goals may result in daily, leveraged compounding, which means that the return of an index over a period of time greater than one day multiplied by a fund's specified multiple (300%) will not generally equal a fund's performance over that same period.
This chart illustrates the performance of a hypothetical $10,000 investment made on the Fund's inception and is not intended to imply any future performance. Shares of Direxion Shares are bought and sold at market price (not NAV) and are not individually redeemed from the Fund. Performance reflects reinvestment of all dividend and capital gains distributions. During this period, some of the Fund's fees were waived and/or expenses reimbursed; otherwise, the Fund's performance would have been lower.
The S&P Biotechnology Select Industry Index is provided by Standard & Poor's and includes domestic companies from the biotechnology industry. The Index is designed to measure the performance of the biotechnology sub-industry based on the Global Industry Classification Standards (GICS). Investors cannot invest directly in an index, although they can invest in its underlying securities.
Market Exposure
The Fund seeks daily exposure of 300% of its NAV through a combination of equities and derivatives. "Market Exposure" includes the value of total investments (including the contract value of any derivatives) and excludes any short-term investments and cash equivalents divided by Net Assets.
1 Commencement of operations.
2 As of October 31, 2022.
DIREXION ANNUAL REPORT
43
Direxion Daily S&P Biotech Bear 3X Shares
Performance Summary (Unaudited)
May 28, 20151 - October 31, 2022
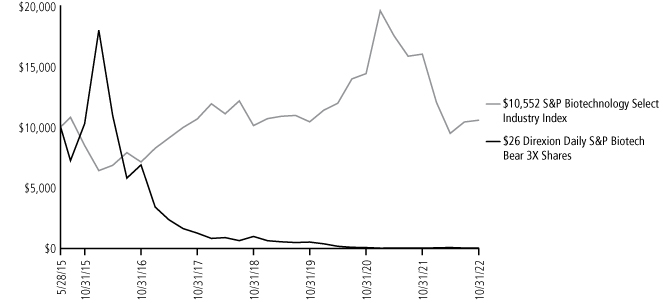
| | | Average Annual Total Return2 | |
| | | 1 Year | | 3 Years | | 5 Years | | Since Inception | |
Direxion Daily S&P Biotech Bear 3X
Shares (NAV) | | | -5.39 | % | | | -63.25 | % | | | -54.04 | % | | | -55.15 | % | |
Direxion Daily S&P Biotech Bear 3X
Shares (Market Price) | | | -5.44 | % | | | -63.25 | % | | | -54.04 | % | | | -55.15 | % | |
S&P Biotechnology Select Industry Index | | | -34.03 | % | | | 0.42 | % | | | -0.20 | % | | | 0.73 | % | |
The performance data quoted represents past performance; past performance does not guarantee future results; the investment return and principal value of an investment will fluctuate; an investor's shares, when redeemed, may be worth more or less than their original cost; current performance may be lower or higher than the performance quoted. Returns for performance under one year are cumulative, not annualized. As stated in the current prospectus, the Fund's total annual operating expense ratio (gross) is 1.01%. Rafferty Asset Management, LLC has contractually agreed to waive all or a portion of its management fee and/or reimburse the Fund for other expenses through September 1, 2024 to the extent the Total Annual Operating Expenses exceed 0.95% (excluding, as applicable, among other expenses, taxes, swap financing and related costs, acquired fund fees and expenses, dividends or interest on short positions, other interest expenses, brokerage commissions and extraordinary expenses). The performance table and graph do not reflect the deduction of taxes that a shareholder would pay on Fund distributions or the redemption of Fund shares. For the Fund's most recent month end performance please visit www.direxion.com.
A fund that meets its daily target over a period of time will not necessarily produce the returns that might be expected in light of the returns of its index or benchmark for that period. Differences may result from the compounding effect of market fluctuation, the use of leverage, and a Bear Fund's inverse correlation. The pursuit of daily goals may result in daily, leveraged compounding, which means that the return of an index over a period of time greater than one day multiplied by a fund's specified multiple (-300%) will not generally equal a fund's performance over that same period.
This chart illustrates the performance of a hypothetical $10,000 investment made on the Fund's inception and is not intended to imply any future performance. Shares of Direxion Shares are bought and sold at market price (not NAV) and are not individually redeemed from the Fund. Performance reflects reinvestment of all dividend and capital gains distributions. During this period, some of the Fund's fees were waived and/or expenses reimbursed; otherwise, the Fund's performance would have been lower.
The S&P Biotechnology Select Industry Index is provided by Standard & Poor's and includes domestic companies from the biotechnology industry. The Index is designed to measure the performance of the biotechnology sub-industry based on the Global Industry Classification Standards (GICS). Investors cannot invest directly in an index, although they can invest in its underlying securities.
Market Exposure
The Fund seeks daily exposure of -300% of its NAV through derivatives. "Market Exposure" includes the value of total investments (including the contract value of any derivatives) and excludes any short-term investments and cash equivalents divided by Net Assets.
1 Commencement of operations.
2 As of October 31, 2022.
DIREXION ANNUAL REPORT
44
Direxion Daily Semiconductor Bull 3X Shares
Performance Summary (Unaudited)
October 31, 2012 - October 31, 2022

| | Average Annual Total Return1 | |
| | | 1 Year | | 3 Years | | 5 Years | | 10 Years | |
Direxion Daily Semiconductor Bull 3X
Shares (NAV) | | | -81.24 | % | | | -12.13 | % | | | -1.62 | % | | | 37.43 | % | |
Direxion Daily Semiconductor Bull 3X
Shares (Market Price) | | | -81.18 | % | | | -12.05 | % | | | -1.55 | % | | | 37.49 | % | |
ICE Semiconductor Index | | | -30.18 | % | | | 15.00 | % | | | 13.81 | % | | | 21.60 | % | |
The performance data quoted represents past performance; past performance does not guarantee future results; the investment return and principal value of an investment will fluctuate; an investor's shares, when redeemed, may be worth more or less than their original cost; current performance may be lower or higher than the performance quoted. Returns for performance under one year are cumulative, not annualized. As stated in the current prospectus, the Fund's total annual operating expense ratio (gross) is 0.90%. Rafferty Asset Management, LLC has contractually agreed to waive all or a portion of its management fee and/or reimburse the Fund for other expenses through September 1, 2024 to the extent the Total Annual Operating Expenses exceed 0.95% (excluding, as applicable, among other expenses, taxes, swap financing and related costs, acquired fund fees and expenses, dividends or interest on short positions, other interest expenses, brokerage commissions and extraordinary expenses). The performance table and graph do not reflect the deduction of taxes that a shareholder would pay on Fund distributions or the redemption of Fund shares. For the Fund's most recent month end performance please visit www.direxion.com.
A fund that meets its daily target over a period of time will not necessarily produce the returns that might be expected in light of the returns of its index or benchmark for that period. Differences may result from the compounding effect of market fluctuation and the use of leverage. The pursuit of daily goals may result in daily, leveraged compounding, which means that the return of an index over a period of time greater than one day multiplied by a fund's specified multiple (300%) will not generally equal a fund's performance over that same period.
This chart illustrates the performance of a hypothetical $10,000 investment made on the Fund's inception and is not intended to imply any future performance. Shares of Direxion Shares are bought and sold at market price (not NAV) and are not individually redeemed from the Fund. Performance reflects reinvestment of all dividend and capital gains distributions. During this period, some of the Fund's fees were waived and/or expenses reimbursed; otherwise, the Fund's performance would have been lower.
The ICE Semiconductor Index is a rules-based, modified float-adjusted market capitalization-weighted index that tracks the performance of the thirty largest U.S. listed semiconductor companies. Semiconductor companies are defined as those classified within the Semiconductors Industry of the ICE Uniform Sector Classification schema. This includes companies that either manufacture materials that have electrical conductivity (semiconductors) to be used in electronic applications or utilize LED and OLED technology. This also includes companies that provide services or equipment associated with semiconductors such as packaging and testing. The Index is rebalanced quarterly and reconstituted annually. Investors cannot invest directly in an index, although they can invest in its underlying securities.
Market Exposure
The Fund seeks daily exposure of 300% of its NAV through a combination of equities and derivatives. "Market Exposure" includes the value of total investments (including the contract value of any derivatives) and excludes any short-term investments and cash equivalents divided by Net Assets.
1 As of October 31, 2022.
DIREXION ANNUAL REPORT
45
Direxion Daily Semiconductor Bear 3X Shares
Performance Summary (Unaudited)
October 31, 2012 - October 31, 2022

| | Average Annual Total Return1 | |
| | | 1 Year | | 3 Years | | 5 Years | | 10 Years | |
Direxion Daily Semiconductor Bear 3X
Shares (NAV) | | | 3.57 | % | | | -74.66 | % | | | -68.45 | % | | | -66.49 | % | |
Direxion Daily Semiconductor Bear 3X
Shares (Market Price) | | | 3.29 | % | | | -74.67 | % | | | -68.47 | % | | | -66.50 | % | |
ICE Semiconductor Index | | | -30.18 | % | | | 15.00 | % | | | 13.81 | % | | | 21.60 | % | |
The performance data quoted represents past performance; past performance does not guarantee future results; the investment return and principal value of an investment will fluctuate; an investor's shares, when redeemed, may be worth more or less than their original cost; current performance may be lower or higher than the performance quoted. Returns for performance under one year are cumulative, not annualized. As stated in the current prospectus, the Fund's total annual operating expense ratio (gross) is 1.01%. Rafferty Asset Management, LLC has contractually agreed to waive all or a portion of its management fee and/or reimburse the Fund for other expenses through September 1, 2024 to the extent the Total Annual Operating Expenses exceed 0.95% (excluding, as applicable, among other expenses, taxes, swap financing and related costs, acquired fund fees and expenses, dividends or interest on short positions, other interest expenses, brokerage commissions and extraordinary expenses). The performance table and graph do not reflect the deduction of taxes that a shareholder would pay on Fund distributions or the redemption of Fund shares. For the Fund's most recent month end performance please visit www.direxion.com.
A fund that meets its daily target over a period of time will not necessarily produce the returns that might be expected in light of the returns of its index or benchmark for that period. Differences may result from the compounding effect of market fluctuation, the use of leverage and a Bear Fund's inverse correlation. The pursuit of daily goals may result in daily, leveraged compounding, which means that the return of an index over a period of time greater than one day multiplied by a fund's specified inverse multiple (-300%) will not generally equal a fund's performance over that same period.
This chart illustrates the performance of a hypothetical $10,000 investment made on the Fund's inception and is not intended to imply any future performance. Shares of Direxion Shares are bought and sold at market price (not NAV) and are not individually redeemed from the Fund. Performance reflects reinvestment of all dividend and capital gains distributions. During this period, some of the Fund's fees were waived and/or expenses reimbursed; otherwise, the Fund's performance would have been lower.
The ICE Semiconductor Index is a rules-based, modified float-adjusted market capitalization-weighted index that tracks the performance of the thirty largest U.S. listed semiconductor companies. Semiconductor companies are defined as those classified within the Semiconductors Industry of the ICE Uniform Sector Classification schema. This includes companies that either manufacture materials that have electrical conductivity (semiconductors) to be used in electronic applications or utilize LED and OLED technology. This also includes companies that provide services or equipment associated with semiconductors such as packaging and testing. The Index is rebalanced quarterly and reconstituted annually. Investors cannot invest directly in an index, although they can invest in its underlying securities.
Market Exposure
The Fund seeks daily exposure of -300% of its NAV through derivatives. "Market Exposure" includes the value of total investments (including the contract value of any derivatives) and excludes any short-term investments and cash equivalents divided by Net Assets.
1 As of October 31, 2022.
DIREXION ANNUAL REPORT
46
Direxion Daily Technology Bull 3X Shares
Performance Summary (Unaudited)
October 31, 2012 - October 31, 2022

| | | Average Annual Total Return1 | |
| | | 1 Year | | 3 Years | | 5 Years | | 10 Years | |
Direxion Daily Technology Bull 3X
Shares (NAV) | | | -63.77 | % | | | 12.07 | % | | | 19.43 | % | | | 36.00 | % | |
Direxion Daily Technology Bull 3X
Shares (Market Price) | | | -63.68 | % | | | 12.09 | % | | | 19.43 | % | | | 35.99 | % | |
Technology Select Sector Index | | | -20.08 | % | | | 16.52 | % | | | 16.74 | % | | | 17.99 | % | |
The performance data quoted represents past performance; past performance does not guarantee future results; the investment return and principal value of an investment will fluctuate; an investor's shares, when redeemed, may be worth more or less than their original cost; current performance may be lower or higher than the performance quoted. Returns for performance under one year are cumulative, not annualized. As stated in the current prospectus, the Fund's total annual operating expense ratio (gross) is 0.94%. Rafferty Asset Management, LLC has contractually agreed to waive all or a portion of its management fee and/or reimburse the Fund for other expenses through September 1, 2024 to the extent the Total Annual Operating Expenses exceed 0.95% (excluding, as applicable, among other expenses, taxes, swap financing and related costs, acquired fund fees and expenses, dividends or interest on short positions, other interest expenses, brokerage commissions and extraordinary expenses). The performance table and graph do not reflect the deduction of taxes that a shareholder would pay on Fund distributions or the redemption of Fund shares. For the Fund's most recent month end performance please visit www.direxion.com.
A fund that meets its daily target over a period of time will not necessarily produce the returns that might be expected in light of the returns of its index or benchmark for that period. Differences may result from the compounding effect of market fluctuation and the use of leverage. The pursuit of daily goals may result in daily, leveraged compounding, which means that the return of an index over a period of time greater than one day multiplied by a fund's specified multiple (300%) will not generally equal a fund's performance over that same period.
This chart illustrates the performance of a hypothetical $10,000 investment made on the Fund's inception and is not intended to imply any future performance. Shares of Direxion Shares are bought and sold at market price (not NAV) and are not individually redeemed from the Fund. Performance reflects reinvestment of all dividend and capital gains distributions. During this period, some of the Fund's fees were waived and/or expenses reimbursed; otherwise, the Fund's performance would have been lower.
The Technology Select Sector Index is provided by Standard & Poor's and includes domestic companies from the following industries: computers & peripherals; software; diversified telecommunications services; communications equipment; semiconductors & semiconductors equipment; internet software and energy equipment & services; IT services; electronic equipment, instruments & components; wireless telecommunications services; and office electronics. Each of the component securities of the Index is a constituent company of the S&P 500® Index. The performance of Technology Select Sector Index does not reflect the deduction of fees associated with the Fund, such as investment management fees. Investors cannot invest directly in an index, although they can invest in its underlying securities.
Market Exposure
The Fund seeks daily exposure of 300% of its NAV through a combination of equities and derivatives. "Market Exposure" includes the value of total investments (including the contract value of any derivatives) and excludes any short-term investments and cash equivalents divided by Net Assets.
1 As of October 31, 2022.
DIREXION ANNUAL REPORT
47
Direxion Daily Technology Bear 3X Shares
Performance Summary (Unaudited)
October 31, 2012 - October 31, 2022
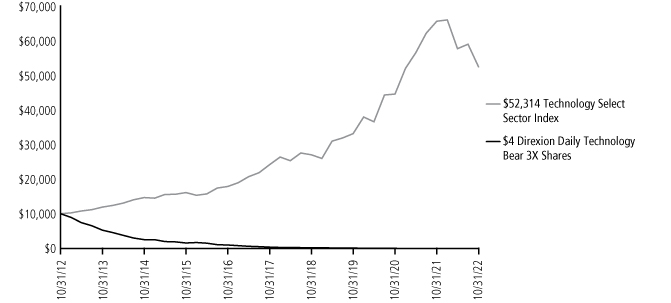
| | | Average Annual Total Return1 | |
| | | 1 Year | | 3 Years | | 5 Years | | 10 Years | |
Direxion Daily Technology Bear 3X
Shares (NAV) | | | 12.97 | % | | | -64.67 | % | | | -58.92 | % | | | -53.87 | % | |
Direxion Daily Technology Bear 3X
Shares (Market Price) | | | 12.87 | % | | | -64.67 | % | | | -58.92 | % | | | -53.88 | % | |
Technology Select Sector Index | | | -20.08 | % | | | 16.52 | % | | | 16.74 | % | | | 17.99 | % | |
The performance data quoted represents past performance; past performance does not guarantee future results; the investment return and principal value of an investment will fluctuate; an investor's shares, when redeemed, may be worth more or less than their original cost; current performance may be lower or higher than the performance quoted. Returns for performance under one year are cumulative, not annualized. As stated in the current prospectus, the Fund's total annual operating expense ratio (gross) is 1.01%. Rafferty Asset Management, LLC has contractually agreed to waive all or a portion of its management fee and/or reimburse the Fund for other expenses through September 1, 2024 to the extent the Total Annual Operating Expenses exceed 0.95% (excluding, as applicable, among other expenses, taxes, swap financing and related costs, acquired fund fees and expenses, dividends or interest on short positions, other interest expenses, brokerage commissions and extraordinary expenses). The performance table and graph do not reflect the deduction of taxes that a shareholder would pay on Fund distributions or the redemption of Fund shares. For the Fund's most recent month end performance please visit www.direxion.com.
A fund that meets its daily target over a period of time will not necessarily produce the returns that might be expected in light of the returns of its index or benchmark for that period. Differences may result from the compounding effect of market fluctuation, the use of leverage and a Bear Fund's inverse correlation. The pursuit of daily goals may result in daily, leveraged compounding, which means that the return of an index over a period of time greater than one day multiplied by a fund's specified inverse multiple (-300%) will not generally equal a fund's performance over that same period.
This chart illustrates the performance of a hypothetical $10,000 investment made on the Fund's inception and is not intended to imply any future performance. Shares of Direxion Shares are bought and sold at market price (not NAV) and are not individually redeemed from the Fund. Performance reflects reinvestment of all dividend and capital gains distributions. During this period, some of the Fund's fees were waived and/or expenses reimbursed; otherwise, the Fund's performance would have been lower.
The Technology Select Sector Index is provided by Standard & Poor's and includes domestic companies from the following industries: computers & peripherals; software; diversified telecommunications services; communications equipment; semiconductors & semiconductors equipment; internet software and energy equipment & services; IT services; electronic equipment, instruments & components; wireless telecommunications services; and office electronics. Each of the component securities of the Index is a constituent company of the S&P 500® Index. The performance of Technology Select Sector Index does not reflect the deduction of fees associated with the Fund, such as investment management fees. Investors cannot invest directly in an index, although they can invest in its underlying securities.
Market Exposure
The Fund seeks daily exposure of -300% of its NAV through derivatives. "Market Exposure" includes the value of total investments (including the contract value of any derivatives) and excludes any short-term investments and cash equivalents divided by Net Assets.
1 As of October 31, 2022.
DIREXION ANNUAL REPORT
48
Direxion Daily Transportation Bull 3X Shares
Performance Summary (Unaudited)
May 3, 20171 - October 31, 2022

| | Average Annual Total Return2 | |
| | 1 Year | | 3 Years | | 5 Years | | Since Inception | |
Direxion Daily Transportation Bull 3X
Shares (NAV) | | | -54.39 | % | | | -3.84 | % | | | -3.45 | % | | | -0.22 | % | |
Direxion Daily Transportation Bull 3X
Shares (Market Price) | | | -54.46 | % | | | -3.85 | % | | | -3.62 | % | | | -0.33 | % | |
S&P Transportation Select Industry FMC
Capped Index | | | -20.36 | % | | | 6.14 | % | | | 6.61 | % | | | 7.22 | % | |
Dow Jones Transportation Average | | | -13.48 | % | | | 10.44 | % | | | 8.38 | % | | | 8.99 | % | |
The performance data quoted represents past performance; past performance does not guarantee future results; the investment return and principal value of an investment will fluctuate; an investor's shares, when redeemed, may be worth more or less than their original cost; current performance may be lower or higher than the performance quoted. Returns for performance under one year are cumulative, not annualized. As stated in the current prospectus, the Fund's total annual operating expense ratio (gross) is 0.98%. Rafferty Asset Management, LLC has contractually agreed to waive all or a portion of its management fee and/or reimburse the Fund for other expenses through September 1, 2024 to the extent the Total Annual Operating Expenses exceed 0.95% (excluding, as applicable, among other expenses, taxes, swap financing and related costs, acquired fund fees and expenses, dividends or interest on short positions, other interest expenses, brokerage commissions and extraordinary expenses). The performance table and graph do not reflect the deduction of taxes that a shareholder would pay on Fund distributions or the redemption of Fund shares. For the Fund's most recent month end performance please visit www.direxion.com.
A fund that meets its daily target over a period of time will not necessarily produce the returns that might be expected in light of the returns of its index or benchmark for that period. Differences may result from the compounding effect of market fluctuation and the use of leverage. The pursuit of daily goals may result in daily, leveraged compounding, which means that the return of an index over a period of time greater than one day multiplied by a fund's specified multiple (300%) will not generally equal a fund's performance over that same period.
This chart illustrates the performance of a hypothetical $10,000 investment made on the Fund's inception and is not intended to imply any future performance. Shares of Direxion Shares are bought and sold at market price (not NAV) and are not individually redeemed from the Fund. Performance reflects reinvestment of all dividend and capital gains distributions. During this period, some of the Fund's fees were waived and/or expenses reimbursed; otherwise, the Fund's performance would have been lower.
The S&P Transportation Select Industry FMC Capped Index (SPTSCUT) is provided by S&P Dow Jones Indices and is designed to measure stocks in the S&P Total Market Index that are included in the GICS transportation sub-industry. Investors cannot invest directly in an index, although they can invest in its underlying securities.
Market Exposure
The Fund seeks daily exposure of 300% of its NAV through a combination of equities and derivatives. "Market Exposure" includes the value of total investments (including the contract value of any derivatives) and excludes any short-term investments and cash equivalents divided by Net Assets.
1 Commencement of operations.
2 As of October 31, 2022.
DIREXION ANNUAL REPORT
49
Direxion Daily Utilities Bull 3X Shares
Performance Summary (Unaudited)
May 3, 20171 - October 31, 2022

| | | Average Annual Total Return2 | |
| | | 1 Year | | 3 Years | | 5 Years | | Since Inception | |
Direxion Daily Utilities Bull 3X
Shares (NAV) | | | -8.50 | % | | | -11.55 | % | | | 1.16 | % | | | 5.17 | % | |
Direxion Daily Utilities Bull 3X
Shares (Market Price) | | | -8.56 | % | | | -11.68 | % | | | 1.06 | % | | | 5.04 | % | |
Utilities Select Sector Index | | | 2.88 | % | | | 4.64 | % | | | 7.44 | % | | | 8.40 | % | |
The performance data quoted represents past performance; past performance does not guarantee future results; the investment return and principal value of an investment will fluctuate; an investor's shares, when redeemed, may be worth more or less than their original cost; current performance may be lower or higher than the performance quoted. Returns for performance under one year are cumulative, not annualized. As stated in the current prospectus, the Fund's total annual operating expense ratio (gross) is 1.04%. Rafferty Asset Management, LLC has contractually agreed to waive all or a portion of its management fee and/or reimburse the Fund for other expenses through September 1, 2024 to the extent the Total Annual Operating Expenses exceed 0.95% (excluding, as applicable, among other expenses, taxes, swap financing and related costs, acquired fund fees and expenses, dividends or interest on short positions, other interest expenses, brokerage commissions and extraordinary expenses). The performance table and graph do not reflect the deduction of taxes that a shareholder would pay on Fund distributions or the redemption of Fund shares. For the Fund's most recent month end performance please visit www.direxion.com.
A fund that meets its daily target over a period of time will not necessarily produce the returns that might be expected in light of the returns of its index or benchmark for that period. Differences may result from the compounding effect of market fluctuation and the use of leverage. The pursuit of daily goals may result in daily, leveraged compounding, which means that the return of an index over a period of time greater than one day multiplied by a fund's specified multiple (300%) will not generally equal a fund's performance over that same period.
This chart illustrates the performance of a hypothetical $10,000 investment made on the Fund's inception and is not intended to imply any future performance. Shares of Direxion Shares are bought and sold at market price (not NAV) and are not individually redeemed from the Fund. Performance reflects reinvestment of all dividend and capital gains distributions. During this period, some of the Fund's fees were waived and/or expenses reimbursed; otherwise, the Fund's performance would have been lower.
The Utilities Select Sector Index is provided by Standard & Poor's and includes domestic companies from the following industries: electric utilities, multi-utilities, water utilities, independent power producers and energy trades, and gas utilities. Each of the component securities of the Index is a constituent company of the S&P 500® Index. The performance of Utilities Select Sector Index does not reflect the deduction of fees associated with the Fund, such as investment management fees. Investors cannot invest directly in an index, although they can invest in its underlying securities.
Market Exposure
The Fund seeks daily exposure of 300% of its NAV through a combination of equities and derivatives. "Market Exposure" includes the value of total investments (including the contract value of any derivatives) and excludes any short-term investments and cash equivalents divided by Net Assets.
1 Commencement of operations.
2 As of October 31, 2022.
DIREXION ANNUAL REPORT
50
Direxion Daily 7-10 Year Treasury Bull 3X Shares
Performance Summary (Unaudited)
October 31, 2012 - October 31, 2022

| | | Average Annual Total Return1 | |
| | | 1 Year | | 3 Years | | 5 Years | | 10 Years | |
Direxion Daily 7-10 Year Treasury
Bull 3X Shares (NAV) | | | -44.91 | % | | | -16.50 | % | | | -6.25 | % | | | -2.06 | % | |
Direxion Daily 7-10 Year Treasury
Bull 3X Shares (Market Price) | | | -44.95 | % | | | -16.49 | % | | | -6.27 | % | | | -2.07 | % | |
ICE U.S. Treasury 7-10 Year Bond Index | | | -16.32 | % | | | -4.41 | % | | | -0.63 | % | | | 0.47 | % | |
The performance data quoted represents past performance; past performance does not guarantee future results; the investment return and principal value of an investment will fluctuate; an investor's shares, when redeemed, may be worth more or less than their original cost; current performance may be lower or higher than the performance quoted. Returns for performance under one year are cumulative, not annualized. As stated in the current prospectus, the Fund's total annual operating expense ratio (gross) is 1.18%. Rafferty Asset Management, LLC has contractually agreed to waive all or a portion of its management fee and/or reimburse the Fund for other expenses through September 1, 2024 to the extent the Total Annual Operating Expenses exceed 0.95% (excluding, as applicable, among other expenses, taxes, swap financing and related costs, acquired fund fees and expenses, dividends or interest on short positions, other interest expenses, brokerage commissions and extraordinary expenses). The performance table and graph do not reflect the deduction of taxes that a shareholder would pay on Fund distributions or the redemption of Fund shares. For the Fund's most recent month end performance please visit www.direxion.com.
A fund that meets its daily target over a period of time will not necessarily produce the returns that might be expected in light of the returns of its index or benchmark for that period. Differences may result from the compounding effect of market fluctuation and the use of leverage. The pursuit of daily goals may result in daily, leveraged compounding, which means that the return of an index over a period of time greater than one day multiplied by a fund's specified multiple (300%) will not generally equal a fund's performance over that same period.
This chart illustrates the performance of a hypothetical $10,000 investment made on the Fund's inception and is not intended to imply any future performance. Shares of Direxion Shares are bought and sold at market price (not NAV) and are not individually redeemed from the Fund. Performance reflects reinvestment of all dividend and capital gains distributions. During this period, some of the Fund's fees were waived and/or expenses reimbursed; otherwise, the Fund's performance would have been lower.
The ICE U.S. Treasury 7-10 Year Bond Index is a market value weighted index that includes publicly issued U.S. Treasury securities that have a remaining maturity of greater than seven years and less than or equal to ten years. The performance of the ICE U.S. Treasury 7-10 Year Bond Index does not reflect the deduction of fees associated with the Fund, such as investment management fees. Investors cannot invest directly in an index, although they can invest in its underlying securities.
Market Exposure
The Fund seeks daily exposure of 300% of its NAV through a combination of equities and derivatives. "Market Exposure" includes the value of total investments (including the contract value of any derivatives) and excludes any short-term investments and cash equivalents divided by Net Assets.
1 As of October 31, 2022.
DIREXION ANNUAL REPORT
51
Direxion Daily 7-10 Year Treasury Bear 3X Shares
Performance Summary (Unaudited)
October 31, 2012 - October 31, 2022

| | | Average Annual Total Return1 | |
| | | 1 Year | | 3 Years | | 5 Years | | 10 Years | |
Direxion Daily 7-10 Year Treasury
Bear 3X Shares (NAV) | | | 63.15 | % | | | 10.50 | % | | | 0.71 | % | | | -4.58 | % | |
Direxion Daily 7-10 Year Treasury
Bear 3X Shares (Market Price) | | | 62.80 | % | | | 10.50 | % | | | 0.69 | % | | | -4.59 | % | |
ICE U.S. Treasury 7-10 Year Bond Index | | | -16.32 | % | | | -4.41 | % | | | -0.63 | % | | | 0.47 | % | |
The performance data quoted represents past performance; past performance does not guarantee future results; the investment return and principal value of an investment will fluctuate; an investor's shares, when redeemed, may be worth more or less than their original cost; current performance may be lower or higher than the performance quoted. Returns for performance under one year are cumulative, not annualized. As stated in the current prospectus, the Fund's total annual operating expense ratio (gross) is 1.17%. Rafferty Asset Management, LLC has contractually agreed to waive all or a portion of its management fee and/or reimburse the Fund for other expenses through September 1, 2024 to the extent the Total Annual Operating Expenses exceed 0.95% (excluding, as applicable, among other expenses, taxes, swap financing and related costs, acquired fund fees and expenses, dividends or interest on short positions, other interest expenses, brokerage commissions and extraordinary expenses). The performance table and graph do not reflect the deduction of taxes that a shareholder would pay on Fund distributions or the redemption of Fund shares. For the Fund's most recent month end performance please visit www.direxion.com.
A fund that meets its daily target over a period of time will not necessarily produce the returns that might be expected in light of the returns of its index or benchmark for that period. Differences may result from the compounding effect of market fluctuation, the use of leverage and a Bear Fund's inverse correlation. The pursuit of daily goals may result in daily, leveraged compounding, which means that the return of an index over a period of time greater than one day multiplied by a fund's specified inverse multiple (-300%) will not generally equal a fund's performance over that same period.
This chart illustrates the performance of a hypothetical $10,000 investment made on the Fund's inception and is not intended to imply any future performance. Shares of Direxion Shares are bought and sold at market price (not NAV) and are not individually redeemed from the Fund. Performance reflects reinvestment of all dividend and capital gains distributions. During this period, some of the Fund's fees were waived and/or expenses reimbursed; otherwise, the Fund's performance would have been lower.
The ICE U.S. Treasury 7-10 Year Bond Index is a market value weighted index that includes publicly issued U.S. Treasury securities that have a remaining maturity of greater than seven years and less than or equal to ten years. The performance of the ICE U.S. Treasury 7-10 Year Bond Index does not reflect the deduction of fees associated with the Fund, such as investment management fees. Investors cannot invest directly in an index, although they can invest in its underlying securities.
Market Exposure
The Fund seeks daily exposure of -300% of its NAV through derivatives. "Market Exposure" includes the value of total investments (including the contract value of any derivatives) and excludes any short-term investments and cash equivalents divided by Net Assets.
1 As of October 31, 2022.
DIREXION ANNUAL REPORT
52
Direxion Daily 20+ Year Treasury Bull 3X Shares
Performance Summary (Unaudited)
October 31, 2012 - October 31, 2022

| | | Average Annual Total Return1 | |
| | | 1 Year | | 3 Years | | 5 Years | | 10 Years | |
Direxion Daily 20+ Year Treasury Bull 3X
Shares (NAV) | | | -74.89 | % | | | -37.33 | % | | | -18.58 | % | | | -8.78 | % | |
Direxion Daily 20+ Year Treasury Bull 3X
Shares (Market Price) | | | -75.10 | % | | | -37.45 | % | | | -18.69 | % | | | -8.85 | % | |
ICE U.S. Treasury 20+ Year Bond Index | | | -33.65 | % | | | -10.56 | % | | | -3.04 | % | | | -0.11 | % | |
The performance data quoted represents past performance; past performance does not guarantee future results; the investment return and principal value of an investment will fluctuate; an investor's shares, when redeemed, may be worth more or less than their original cost; current performance may be lower or higher than the performance quoted. Returns for performance under one year are cumulative, not annualized. As stated in the current prospectus, the Fund's total annual operating expense ratio (gross) is 1.00%. Rafferty Asset Management, LLC has contractually agreed to waive all or a portion of its management fee and/or reimburse the Fund for other expenses through September 1, 2024 to the extent the Total Annual Operating Expenses exceed 0.95% (excluding, as applicable, among other expenses, taxes, swap financing and related costs, acquired fund fees and expenses, dividends or interest on short positions, other interest expenses, brokerage commissions and extraordinary expenses). The performance table and graph do not reflect the deduction of taxes that a shareholder would pay on Fund distributions or the redemption of Fund shares. For the Fund's most recent month end performance please visit www.direxion.com.
A fund that meets its daily target over a period of time will not necessarily produce the returns that might be expected in light of the returns of its index or benchmark for that period. Differences may result from the compounding effect of market fluctuation and the use of leverage. The pursuit of daily goals may result in daily, leveraged compounding, which means that the return of an index over a period of time greater than one day multiplied by a fund's specified multiple (300%) will not generally equal a fund's performance over that same period.
This chart illustrates the performance of a hypothetical $10,000 investment made on the Fund's inception and is not intended to imply any future performance. Shares of Direxion Shares are bought and sold at market price (not NAV) and are not individually redeemed from the Fund. Performance reflects reinvestment of all dividend and capital gains distributions. During this period, some of the Fund's fees were waived and/or expenses reimbursed; otherwise, the Fund's performance would have been lower.
The ICE U.S. Treasury 20+ Year Bond Index is a market value weighted index that includes publicly issued U.S. Treasury securities that have a remaining maturity of greater than 20 years. The performance of the ICE U.S. Treasury 20+ Year Bond Index does not reflect the deduction of fees associated with the Fund, such as investment management fees. Investors cannot invest directly in an index, although they can invest in its underlying securities.
Market Exposure
The Fund seeks daily exposure of 300% of its NAV through a combination of equities and derivatives. "Market Exposure" includes the value of total investments (including the contract value of any derivatives) and excludes any short-term investments and cash equivalents divided by Net Assets
1 As of October 31, 2022.
DIREXION ANNUAL REPORT
53
Direxion Daily 20+ Year Treasury Bear 3X Shares
Performance Summary (Unaudited)
October 31, 2012 - October 31, 2022

| | | Average Annual Total Return1 | |
| | | 1 Year | | 3 Years | | 5 Years | | 10 Years | |
Direxion Daily 20+ Year Treasury
Bear 3X Shares (NAV) | | | 177.78 | % | | | 14.31 | % | | | -3.15 | % | | | -11.17 | % | |
Direxion Daily 20+ Year Treasury
Bear 3X Shares (Market Price) | | | 179.16 | % | | | 14.56 | % | | | -3.06 | % | | | -11.15 | % | |
ICE U.S. Treasury 20+ Year Bond Index | | | -33.65 | % | | | -10.56 | % | | | -3.04 | % | | | -0.11 | % | |
The performance data quoted represents past performance; past performance does not guarantee future results; the investment return and principal value of an investment will fluctuate; an investor's shares, when redeemed, may be worth more or less than their original cost; current performance may be lower or higher than the performance quoted. Returns for performance under one year are cumulative, not annualized. As stated in the current prospectus, the Fund's total annual operating expense ratio (gross) is 0.93%. Rafferty Asset Management, LLC has contractually agreed to waive all or a portion of its management fee and/or reimburse the Fund for other expenses through September 1, 2024 to the extent the Total Annual Operating Expenses exceed 0.95% (excluding, as applicable, among other expenses, taxes, swap financing and related costs, acquired fund fees and expenses, dividends or interest on short positions, other interest expenses, brokerage commissions and extraordinary expenses). The performance table and graph do not reflect the deduction of taxes that a shareholder would pay on Fund distributions or the redemption of Fund shares. For the Fund's most recent month end performance please visit www.direxion.com.
A fund that meets its daily target over a period of time will not necessarily produce the returns that might be expected in light of the returns of its index or benchmark for that period. Differences may result from the compounding effect of market fluctuation, the use of leverage and a Bear Fund's inverse correlation. The pursuit of daily goals may result in daily, leveraged compounding, which means that the return of an index over a period of time greater than one day multiplied by a fund's specified inverse multiple (-300%) will not generally equal a fund's performance over that same period.
This chart illustrates the performance of a hypothetical $10,000 investment made on the Fund's inception and is not intended to imply any future performance. Shares of Direxion Shares are bought and sold at market price (not NAV) and are not individually redeemed from the Fund. Performance reflects reinvestment of all dividend and capital gains distributions. During this period, some of the Fund's fees were waived and/or expenses reimbursed; otherwise, the Fund's performance would have been lower.
The ICE U.S. Treasury 20+ Year Bond Index is a market value weighted index that includes publicly issued U.S. Treasury securities that have a remaining maturity of greater than 20 years. The performance of the ICE U.S. Treasury 20+ Year Bond Index does not reflect the deduction of fees associated with the Fund, such as investment management fees. Investors cannot invest directly in an index, although they can invest in its underlying securities.
Market Exposure
The Fund seeks daily exposure of -300% of its NAV through derivatives. "Market Exposure" includes the value of total investments (including the contract value of any derivatives) and excludes any short-term investments and cash equivalents divided by Net Assets.
1 As of October 31, 2022.
DIREXION ANNUAL REPORT
54
Expense Example (Unaudited)
October 31, 2022
As a shareholder of the Direxion Shares ETF Trust, you incur two types of costs: (1) transaction costs, for purchasing and selling shares and exchange fees; and (2) ongoing costs, including management fees; and other Fund expenses. This example is intended to help you understand your ongoing costs (in dollars) of investing in a fund and to compare these costs with the ongoing costs of investing in other mutual funds.
The example is based on initial investments of $1,000 invested at the beginning of the period and held the entire period (May 1, 2022 to October 31, 2022).
Actual Expenses
The first line under each Fund in the following table provides information about actual account values and actual expenses. You may use the information in this line, together with the amount you invested, to estimate the expenses that you paid over the period. Simply divide your account value by $1,000 (for example, an $8,600 account value divided by $1,000 = 8.6), then multiply the result by the number in the first line for your Fund under the heading entitled "Expenses Paid During Period May 1, 2022 to October 31, 2022" to estimate the expenses you paid on your account during this period.
Hypothetical Example for Comparison Purposes
The second line of the following table below provides information about hypothetical account values and hypothetical expenses based on each Fund's actual expense ratio and an assumed rate of return of 5% per year before expenses, which is not the Fund's actual return. The hypothetical account values and expenses may not be used to estimate the actual ending account balance or expenses you paid for the period. You may use this information to compare the ongoing costs of investing in your Fund and other funds. To do so, compare this 5% hypothetical example with the 5% hypothetical examples that appear in the shareholder reports of the other funds.
Please note that the expenses shown in the table are meant to highlight your ongoing costs only and do not reflect any transactional costs, such as brokerage commissions paid on purchases and sales of Fund shares. Therefore, the second line under each Fund in the table is useful in comparing ongoing Fund costs only, and will not help you determine the relative total costs of owning different funds. In addition, if these transactional costs were included, your costs would have been higher.
Expense Example (Unaudited)
October 31, 2022
| | | Annualized
Expense Ratio | | Beginning
Account Value
May 1, 2022 | | Ending
Account Value
October 31, 2022 | | Expenses
Paid During
Period* | |
Direxion Daily Mid Cap Bull 3X Shares | |
Based on actual fund return | | | 1.01 | % | | $ | 1,000.00 | | | $ | 817.50 | | | $ | 4.63 | | |
Based on hypothetical 5% return | | | 1.01 | % | | | 1,000.00 | | | | 1,020.11 | | | | 5.14 | | |
Direxion Daily S&P 500® Bull 3X Shares | |
Based on actual fund return | | | 0.99 | % | | | 1,000.00 | | | | 740.20 | | | | 4.34 | | |
Based on hypothetical 5% return | | | 0.99 | % | | | 1,000.00 | | | | 1,020.21 | | | | 5.04 | | |
Direxion Daily S&P 500® Bear 3X Shares | |
Based on actual fund return | | | 1.15 | % | | | 1,000.00 | | | | 1,004.90 | | | | 5.81 | | |
Based on hypothetical 5% return | | | 1.15 | % | | | 1,000.00 | | | | 1,019.41 | | | | 5.85 | | |
Direxion Daily Small Cap Bull 3X Shares | |
Based on actual fund return | | | 1.00 | % | | | 1,000.00 | | | | 845.80 | | | | 4.65 | | |
Based on hypothetical 5% return | | | 1.00 | % | | | 1,000.00 | | | | 1,020.16 | | | | 5.09 | | |
Direxion Daily Small Cap Bear 3X Shares | |
Based on actual fund return | | | 1.06 | % | | | 1,000.00 | | | | 797.70 | | | | 4.80 | | |
Based on hypothetical 5% return | | | 1.06 | % | | | 1,000.00 | | | | 1,019.86 | | | | 5.40 | | |
DIREXION ANNUAL REPORT
55
Expense Example (Unaudited)
October 31, 2022
| | | Annualized
Expense Ratio | | Beginning
Account Value
May 1, 2022 | | Ending
Account Value
October 31, 2022 | | Expenses
Paid During
Period* | |
Direxion Daily FTSE China Bull 3X Shares | |
Based on actual fund return | | | 0.99 | % | | $ | 1,000.00 | | | $ | 247.70 | | | $ | 3.11 | | |
Based on hypothetical 5% return | | | 0.99 | % | | | 1,000.00 | | | | 1,020.21 | | | | 5.04 | | |
Direxion Daily FTSE China Bear 3X Shares | |
Based on actual fund return | | | 1.12 | % | | | 1,000.00 | | | | 2,254.00 | | | | 9.19 | | |
Based on hypothetical 5% return | | | 1.12 | % | | | 1,000.00 | | | | 1,019.56 | | | | 5.70 | | |
Direxion Daily FTSE Europe Bull 3X Shares | |
Based on actual fund return | | | 0.98 | % | | | 1,000.00 | | | | 587.50 | | | | 3.92 | | |
Based on hypothetical 5% return | | | 0.98 | % | | | 1,000.00 | | | | 1,020.26 | | | | 4.99 | | |
Direxion Daily MSCI Emerging Markets Bull 3X Shares | |
Based on actual fund return | | | 0.99 | % | | | 1,000.00 | | | | 483.00 | | | | 3.70 | | |
Based on hypothetical 5% return | | | 0.99 | % | | | 1,000.00 | | | | 1,020.21 | | | | 5.04 | | |
Direxion Daily MSCI Emerging Markets Bear 3X Shares | |
Based on actual fund return | | | 1.20 | % | | | 1,000.00 | | | | 1,648.30 | | | | 8.01 | | |
Based on hypothetical 5% return | | | 1.20 | % | | | 1,000.00 | | | | 1,019.16 | | | | 6.11 | | |
Direxion Daily MSCI Mexico Bull 3X Shares | |
Based on actual fund return | | | 1.00 | % | | | 1,000.00 | | | | 1,020.80 | | | | 5.09 | | |
Based on hypothetical 5% return | | | 1.00 | % | | | 1,000.00 | | | | 1,020.16 | | | | 5.09 | | |
Direxion Daily MSCI South Korea Bull 3X Shares | |
Based on actual fund return | | | 0.97 | % | | | 1,000.00 | | | | 407.60 | | | | 3.44 | | |
Based on hypothetical 5% return | | | 0.97 | % | | | 1,000.00 | | | | 1,020.32 | | | | 4.94 | | |
Direxion Daily Aerospace & Defense Bull 3X Shares | |
Based on actual fund return | | | 1.02 | % | | | 1,000.00 | | | | 1,013.40 | | | | 5.18 | | |
Based on hypothetical 5% return | | | 1.02 | % | | | 1,000.00 | | | | 1,020.06 | | | | 5.19 | | |
Direxion Daily Consumer Discretionary Bull 3X Shares | |
Based on actual fund return | | | 1.17 | % | | | 1,000.00 | | | | 552.00 | | | | 4.58 | | |
Based on hypothetical 5% return | | | 1.17 | % | | | 1,000.00 | | | | 1,019.31 | | | | 5.96 | | |
Direxion Daily Dow Jones Internet Bull 3X Shares | |
Based on actual fund return | | | 1.01 | % | | | 1,000.00 | | | | 426.90 | | | | 3.63 | | |
Based on hypothetical 5% return | | | 1.01 | % | | | 1,000.00 | | | | 1,020.11 | | | | 5.14 | | |
Direxion Daily Dow Jones Internet Bear 3X Shares | |
Based on actual fund return | | | 1.08 | % | | | 1,000.00 | | | | 1,039.20 | | | | 5.55 | | |
Based on hypothetical 5% return | | | 1.08 | % | | | 1,000.00 | | | | 1,019.76 | | | | 5.50 | | |
Direxion Daily Financial Bull 3X Shares | |
Based on actual fund return | | | 0.97 | % | | | 1,000.00 | | | | 888.70 | | | | 4.62 | | |
Based on hypothetical 5% return | | | 0.97 | % | | | 1,000.00 | | | | 1,020.32 | | | | 4.94 | | |
Direxion Daily Financial Bear 3X Shares | |
Based on actual fund return | | | 1.10 | % | | | 1,000.00 | | | | 821.30 | | | | 5.05 | | |
Based on hypothetical 5% return | | | 1.10 | % | | | 1,000.00 | | | | 1,019.66 | | | | 5.60 | | |
Direxion Daily Healthcare Bull 3X Shares | |
Based on actual fund return | | | 1.01 | % | | | 1,000.00 | | | | 985.70 | | | | 5.06 | | |
Based on hypothetical 5% return | | | 1.01 | % | | | 1,000.00 | | | | 1,020.11 | | | | 5.14 | | |
Direxion Daily Homebuilders & Supplies Bull 3X Shares | |
Based on actual fund return | | | 1.05 | % | | | 1,000.00 | | | | 721.20 | | | | 4.56 | | |
Based on hypothetical 5% return | | | 1.05 | % | | | 1,000.00 | | | | 1,019.91 | | | | 5.35 | | |
Direxion Daily Industrials Bull 3X Shares | |
Based on actual fund return | | | 1.00 | % | | | 1,000.00 | | | | 883.40 | | | | 4.75 | | |
Based on hypothetical 5% return | | | 1.00 | % | | | 1,000.00 | | | | 1,020.16 | | | | 5.09 | | |
Direxion Daily Pharmaceutical & Medical Bull 3X Shares | |
Based on actual fund return | | | 1.04 | % | | | 1,000.00 | | | | 945.30 | | | | 5.10 | | |
Based on hypothetical 5% return | | | 1.04 | % | | | 1,000.00 | | | | 1,019.96 | | | | 5.30 | | |
Direxion Daily Real Estate Bull 3X Shares | |
Based on actual fund return | | | 1.00 | % | | | 1,000.00 | | | | 449.30 | | | | 3.65 | | |
Based on hypothetical 5% return | | | 1.00 | % | | | 1,000.00 | | | | 1,020.16 | | | | 5.09 | | |
DIREXION ANNUAL REPORT
56
Expense Example (Unaudited)
October 31, 2022
| | | Annualized
Expense Ratio | | Beginning
Account Value
May 1, 2022 | | Ending
Account Value
October 31, 2022 | | Expenses
Paid During
Period* | |
Direxion Daily Real Estate Bear 3X Shares | |
Based on actual fund return | | | 1.02 | % | | $ | 1,000.00 | | | $ | 1,599.10 | | | $ | 6.68 | | |
Based on hypothetical 5% return | | | 1.02 | % | | | 1,000.00 | | | | 1,020.06 | | | | 5.19 | | |
Direxion Daily Regional Banks Bull 3X Shares | |
Based on actual fund return | | | 1.01 | % | | | 1,000.00 | | | | 1,001.40 | | | | 5.10 | | |
Based on hypothetical 5% return | | | 1.01 | % | | | 1,000.00 | | | | 1,020.11 | | | | 5.14 | | |
Direxion Daily Retail Bull 3X Shares | |
Based on actual fund return | | | 1.05 | % | | | 1,000.00 | | | | 549.90 | | | | 4.10 | | |
Based on hypothetical 5% return | | | 1.05 | % | | | 1,000.00 | | | | 1,019.91 | | | | 5.35 | | |
Direxion Daily S&P 500® High Beta Bull 3X Shares | |
Based on actual fund return | | | 1.08 | % | | | 1,000.00 | | | | 619.30 | | | | 4.41 | | |
Based on hypothetical 5% return | | | 1.08 | % | | | 1,000.00 | | | | 1,019.76 | | | | 5.50 | | |
Direxion Daily S&P 500® High Beta Bear 3X Shares | |
Based on actual fund return | | | 1.25 | % | | | 1,000.00 | | | | 807.10 | | | | 5.69 | | |
Based on hypothetical 5% return | | | 1.25 | % | | | 1,000.00 | | | | 1,018.90 | | | | 6.36 | | |
Direxion Daily S&P Biotech Bull 3X Shares | |
Based on actual fund return | | | 1.26 | % | | | 1,000.00 | | | | 913.80 | | | | 6.08 | | |
Based on hypothetical 5% return | | | 1.26 | % | | | 1,000.00 | | | | 1,018.85 | | | | 6.41 | | |
Direxion Daily S&P Biotech Bear 3X Shares | |
Based on actual fund return | | | 1.04 | % | | | 1,000.00 | | | | 351.30 | | | | 3.54 | | |
Based on hypothetical 5% return | | | 1.04 | % | | | 1,000.00 | | | | 1,019.96 | | | | 5.30 | | |
Direxion Daily Semiconductor Bull 3X Shares | |
Based on actual fund return | | | 0.99 | % | | | 1,000.00 | | | | 403.30 | | | | 3.50 | | |
Based on hypothetical 5% return | | | 0.99 | % | | | 1,000.00 | | | | 1,020.21 | | | | 5.04 | | |
Direxion Daily Semiconductor Bear 3X Shares | |
Based on actual fund return | | | 1.16 | % | | | 1,000.00 | | | | 1,056.40 | | | | 6.01 | | |
Based on hypothetical 5% return | | | 1.16 | % | | | 1,000.00 | | | | 1,019.36 | | | | 5.90 | | |
Direxion Daily Technology Bull 3X Shares | |
Based on actual fund return | | | 1.06 | % | | | 1,000.00 | | | | 614.60 | | | | 4.31 | | |
Based on hypothetical 5% return | | | 1.06 | % | | | 1,000.00 | | | | 1,019.86 | | | | 5.40 | | |
Direxion Daily Technology Bear 3X Shares | |
Based on actual fund return | | | 1.14 | % | | | 1,000.00 | | | | 994.80 | | | | 5.73 | | |
Based on hypothetical 5% return | | | 1.14 | % | | | 1,000.00 | | | | 1,019.46 | | | | 5.80 | | |
Direxion Daily Transportation Bull 3X Shares | |
Based on actual fund return | | | 0.97 | % | | | 1,000.00 | | | | 621.40 | | | | 3.96 | | |
Based on hypothetical 5% return | | | 0.97 | % | | | 1,000.00 | | | | 1,020.32 | | | | 4.94 | | |
Direxion Daily Utilities Bull 3X Shares | |
Based on actual fund return | | | 1.25 | % | | | 1,000.00 | | | | 761.60 | | | | 5.55 | | |
Based on hypothetical 5% return | | | 1.25 | % | | | 1,000.00 | | | | 1,018.90 | | | | 6.36 | | |
Direxion Daily 7-10 Year Treasury Bull 3X Shares | |
Based on actual fund return | | | 0.96 | % | | | 1,000.00 | | | | 764.10 | | | | 4.27 | | |
Based on hypothetical 5% return | | | 0.96 | % | | | 1,000.00 | | | | 1,020.37 | | | | 4.89 | | |
Direxion Daily 7-10 Year Treasury Bear 3X Shares | |
Based on actual fund return | | | 1.04 | % | | | 1,000.00 | | | | 1,236.70 | | | | 5.86 | | |
Based on hypothetical 5% return | | | 1.04 | % | | | 1,000.00 | | | | 1,019.96 | | | | 5.30 | | |
Direxion Daily 20+ Year Treasury Bull 3X Shares | |
Based on actual fund return | | | 0.93 | % | | | 1,000.00 | | | | 491.30 | | | | 3.50 | | |
Based on hypothetical 5% return | | | 0.93 | % | | | 1,000.00 | | | | 1,020.52 | | | | 4.74 | | |
Direxion Daily 20+ Year Treasury Bear 3X Shares | |
Based on actual fund return | | | 1.09 | % | | | 1,000.00 | | | | 1,670.00 | | | | 7.34 | | |
Based on hypothetical 5% return | | | 1.09 | % | | | 1,000.00 | | | | 1,019.71 | | | | 5.55 | | |
* Expenses are equal to the Fund's annualized expense ratio, multiplied by the average account value over the period, multiplied by 184 days (the number of days in the period of May 1, 2022 to October 31, 2022), then divided by 365.
DIREXION ANNUAL REPORT
57
Allocation of Portfolio Holdings (Unaudited)
October 31, 2022
| | | Cash* | | Common
Stocks | | Investment
Companies | | Swaps | | Total | |
Direxion Daily Mid Cap Bull 3X Shares | | | 33 | % | | | — | | | | 59 | % | | | 8 | % | | | 100 | % | |
Direxion Daily S&P 500® Bull 3X Shares | | | 22 | % | | | 75 | % | | | — | | | | 3 | % | | | 100 | % | |
Direxion Daily S&P 500® Bear 3X Shares | | | 91 | % | | | — | | | | — | | | | 9 | % | | | 100 | % | |
Direxion Daily Small Cap Bull 3X Shares | | | 27 | % | | | — | | | | 64 | % | | | 9 | % | | | 100 | % | |
Direxion Daily Small Cap Bear 3X Shares | | | 106 | % | | | — | | | | — | | | | (6 | )% | | | 100 | % | |
Direxion Daily FTSE China Bull 3X Shares | | | 102 | % | | | — | | | | 68 | % | | | (70 | )% | | | 100 | % | |
Direxion Daily FTSE China Bear 3X Shares | | | 68 | % | | | — | | | | — | | | | 32 | % | | | 100 | % | |
Direxion Daily FTSE Europe Bull 3X Shares | | | 70 | % | | | — | | | | 36 | % | | | (6 | )% | | | 100 | % | |
Direxion Daily MSCI Emerging Markets Bull 3X Shares | | | 140 | % | | | — | | | | 5 | % | | | (45 | )% | | | 100 | % | |
Direxion Daily MSCI Emerging Markets Bear 3X Shares | | | 75 | % | | | — | | | | — | | | | 25 | % | | | 100 | % | |
Direxion Daily MSCI Mexico Bull 3X Shares | | | 41 | % | | | — | | | | 36 | % | | | 23 | % | | | 100 | % | |
Direxion Daily MSCI South Korea Bull 3X Shares | | | 63 | % | | | — | | | | 44 | % | | | (7 | )% | | | 100 | % | |
Direxion Daily Aerospace & Defense Bull 3X Shares | | | 16 | % | | | 63 | % | | | — | | | | 21 | % | | | 100 | % | |
Direxion Daily Consumer Discretionary Bull 3X Shares | | | 21 | % | | | 79 | % | | | — | | | | 0 | %** | | | 100 | % | |
Direxion Daily Dow Jones Internet Bull 3X Shares | | | 45 | % | | | 67 | % | | | — | | | | (12 | )% | | | 100 | % | |
Direxion Daily Dow Jones Internet Bear 3X Shares | | | 65 | % | | | — | | | | — | | | | 35 | % | | | 100 | % | |
Direxion Daily Financial Bull 3X Shares | | | 34 | % | | | 58 | % | | | — | | | | 8 | % | | | 100 | % | |
Direxion Daily Financial Bear 3X Shares | | | 113 | % | | | — | | | | — | | | | (13 | )% | | | 100 | % | |
Direxion Daily Healthcare Bull 3X Shares | | | 28 | % | | | 62 | % | | | — | | | | 10 | % | | | 100 | % | |
Direxion Daily Homebuilders & Supplies Bull 3X Shares | | | 35 | % | | | 59 | % | | | — | | | | 6 | % | | | 100 | % | |
Direxion Daily Industrials Bull 3X Shares | | | 25 | % | | | 63 | % | | | — | | | | 12 | % | | | 100 | % | |
Direxion Daily Pharmaceutical & Medical Bull 3X Shares | | | 32 | % | | | 63 | % | | | — | | | | 5 | % | | | 100 | % | |
Direxion Daily Real Estate Bull 3X Shares | | | 23 | % | | | 68 | % | | | — | | | | 9 | % | | | 100 | % | |
Direxion Daily Real Estate Bear 3X Shares | | | 100 | % | | | — | | | | — | | | | 0 | %** | | | 100 | % | |
Direxion Daily Regional Banks Bull 3X Shares | | | 24 | % | | | 65 | % | | | — | | | | 11 | % | | | 100 | % | |
Direxion Daily Retail Bull 3X Shares | | | 36 | % | | | 56 | % | | | — | | | | 8 | % | | | 100 | % | |
Direxion Daily S&P 500® High Beta Bull 3X Shares | | | 22 | % | | | 70 | % | | | — | | | | 8 | % | | | 100 | % | |
Direxion Daily S&P 500® High Beta Bear 3X Shares | | | 80 | % | | | — | | | | — | | | | 20 | % | | | 100 | % | |
Direxion Daily S&P Biotech Bull 3X Shares | | | 33 | % | | | 58 | % | | | — | | | | 9 | % | | | 100 | % | |
Direxion Daily S&P Biotech Bear 3X Shares | | | 100 | % | | | — | | | | — | | | | 0 | %** | | | 100 | % | |
Direxion Daily Semiconductor Bull 3X Shares | | | 51 | % | | | 72 | % | | | — | | | | (23 | )% | | | 100 | % | |
Direxion Daily Semiconductor Bear 3X Shares | | | 75 | % | | | — | | | | — | | | | 25 | % | | | 100 | % | |
Direxion Daily Technology Bull 3X Shares | | | 40 | % | | | 68 | % | | | — | | | | (8 | )% | | | 100 | % | |
Direxion Daily Technology Bear 3X Shares | | | 74 | % | | | — | | | | — | | | | 26 | % | | | 100 | % | |
Direxion Daily Transportation Bull 3X Shares | | | 51 | % | | | 57 | % | | | — | | | | (8 | )% | | | 100 | % | |
Direxion Daily Utilities Bull 3X Shares | | | 28 | % | | | 67 | % | | | — | | | | 5 | % | | | 100 | % | |
Direxion Daily 7-10 Year Treasury Bull 3X Shares | | | 43 | % | | | — | | | | 74 | % | | | (17 | )% | | | 100 | % | |
Direxion Daily 7-10 Year Treasury Bear 3X Shares | | | 89 | % | | | — | | | | — | | | | 11 | % | | | 100 | % | |
Direxion Daily 20+ Year Treasury Bull 3X Shares | | | 80 | % | | | — | | | | 60 | % | | | (40 | )% | | | 100 | % | |
Direxion Daily 20+ Year Treasury Bear 3X Shares | | | 78 | % | | | — | | | | — | | | | 22 | % | | | 100 | % | |
Allocation of Portfolio Holdings reflects percentages of net assets.
* Cash, cash equivalents and other assets less liabilities.
** Less than 0.5%.
DIREXION ANNUAL REPORT
58
Direxion Daily Mid Cap Bull 3X Shares
Schedule of Investments
October 31, 2022
Shares | | | | Fair Value | |
INVESTMENT COMPANIES - 59.4% | | | |
| | 117,160 | | | iShares Core S&P Mid-Cap ETF (a) | | $ | 28,414,815 | | |
| | | | | TOTAL INVESTMENT
COMPANIES
(Cost $27,866,243) | | $ | 28,414,815 | | |
SHORT TERM INVESTMENTS - 40.2% | | | |
Money Market Funds - 40.2% | | | |
| | 12,474,494 | | | Dreyfus Government Cash
Management Institutional
Shares, 2.91% (b) | | $ | 12,474,494 | | |
| | 6,714,708 | | | Goldman Sachs Financial Square
Treasury Instruments Fund
Institutional Shares, 3.10% (b) | | | 6,714,708 | | |
| | | | | TOTAL SHORT TERM
INVESTMENTS
(Cost $19,189,202) | | $ | 19,189,202 | | |
| | | | | TOTAL INVESTMENTS
(Cost $47,055,445) - 99.6% (c) | | $ | 47,604,017 | | |
| | | | | Other Assets in Excess of
Liabilities - 0.4% | | | 196,591 | | |
| | | | | TOTAL NET ASSETS - 100.0% | | $ | 47,800,608 | | |
Percentages are stated as a percent of net assets.
The geographic location of all investments is United States unless otherwise indicated.
(a) Shareholders may obtain the financial statements of these investment companies at www.sec.gov.
(b) Represents annualized seven-day yield at October 31, 2022.
(c) All or a portion of these securities have been segregated as collateral for swap contracts. Total value of securities segregated amounted to $31,757,167.
Long Total Return Swap Contracts
October 31, 2022
Terms of Payments
to be Received at
Termination | | Terms of Payments
to be Paid at
Termination | | Counterparty | | Termination
Date | | Contracts | | Notional
Amount | | Unrealized
Appreciation
(Depreciation) | |
Total return of S&P
MidCap 400® Index | | 3.3400% representing
1 month SOFR rate + spread | | J.P. Morgan | | 12/6/2022 | | | 16,480 | | | $ | 38,151,164 | | | $ | 1,855,131 | | |
Total return of S&P
MidCap 400® Index | | 3.3400% representing
1 month SOFR rate + spread | | Citibank N.A. | | 12/13/2022 | | | 9,654 | | | | 23,589,479 | | | | (146,127 | ) | |
Total return of S&P
MidCap 400® Index | | 3.4900% representing
1 month SOFR rate + spread | | Bank of America
Merrill Lynch | | 12/13/2022 | | | 8,541 | | | | 20,137,655 | | | | 571,972 | | |
Total return of S&P
MidCap 400® Index | | 3.5800% representing
1 month SOFR rate + spread | | UBS Securities LLC | | 12/14/2022 | | | 12,585 | | | | 28,972,857 | | | | 1,606,934 | | |
| | | | | | | | | | | $ | 110,851,155 | | | $ | 3,887,910 | | |
The accompanying notes are an integral part of these financial statements.
DIREXION ANNUAL REPORT
59
Direxion Daily S&P 500® Bull 3X Shares
Schedule of Investments
October 31, 2022
Shares | | | | Fair Value | |
COMMON STOCKS - 74.6% | | | |
Accommodation - 0.3% | | | |
| | 12,539 | | | Caesars Entertainment Inc. (a) | | $ | 548,330 | | |
| | 15,995 | | | Hilton Worldwide Holdings, Inc. | | | 2,163,484 | | |
| | 41,728 | | | Host Hotels & Resorts, Inc. | | | 787,825 | | |
| | 19,132 | | | Las Vegas Sands Corp. (a) | | | 727,207 | | |
| | 16,094 | | | Marriott International, Inc.
Class A | | | 2,576,810 | | |
| | 19,059 | | | MGM Resorts International | | | 677,929 | | |
| | | | 7,481,585 | | |
Administrative and Support Services - 1.8% | | | |
| | 5,164 | | | Allegion PLC ADR (Ireland) | | | 541,032 | | |
| | 87,933 | | | Amcor PLC ADR
(United Kingdom) | | | 1,018,264 | | |
| | 24,294 | | | Automatic Data
Processing, Inc. | | | 5,871,860 | | |
| | 2,399 | | | Booking Holdings, Inc. (a) | | | 4,484,882 | | |
| | 6,923 | | | Broadridge Financial
Solutions, Inc. | | | 1,038,865 | | |
| | 7,113 | | | Equifax, Inc. | | | 1,205,938 | | |
| | 2,318 | | | FactSet Research System, Inc. | | | 986,286 | | |
| | 4,371 | | | FleetCor Technologies, Inc. (a) | | | 813,531 | | |
| | 4,593 | | | Gartner, Inc. (a) | | | 1,386,719 | | |
| | 17,048 | | | Iron Mountain, Inc. | | | 853,593 | | |
| | 8,300 | | | Live Nation Entertainment,
Inc. (a) | | | 660,763 | | |
| | 9,325 | | | Moody's Corp. | | | 2,469,913 | | |
| | 6,417 | | | Robert Half International, Inc. | | | 490,644 | | |
| | 13,500 | | | Rollins, Inc. | | | 568,080 | | |
| | 95,566 | | | Visa, Inc. Class A | | | 19,797,453 | | |
| | 21,974 | | | Waste Management, Inc. | | | 3,480,022 | | |
| | | | 45,667,845 | | |
Air Transportation - 0.2% | | | |
| | 7,457 | | | Alaska Air Group, Inc. (a) | | | 331,538 | | |
| | 37,959 | | | American Airlines Group,
Inc. (a) | | | 538,259 | | |
| | 37,473 | | | Delta Air Lines, Inc. (a) | | | 1,271,459 | | |
| | 34,669 | | | Southwest Airlines Co. (a) | | | 1,260,218 | | |
| | 19,074 | | | United Continental
Holdings, Inc. (a) | | | 821,708 | | |
| | | | 4,223,182 | | |
Ambulatory Health Care Services - 0.2% | | | |
| | 3,183 | | | DaVita, Inc. (a) | | | 232,391 | | |
| | 5,249 | | | Laboratory Corp. of America
Holdings | | | 1,164,543 | | |
| | 3,376 | | | Molina Healthcare, Inc. (a) | | | 1,211,512 | | |
| | 6,808 | | | Quest Diagnostics, Inc. | | | 977,969 | | |
| | 70,872 | | | Viatris, Inc. | | | 717,933 | | |
| | | | 4,304,348 | | |
Amusement, Gambling, and Recreation Industries - 0.5% | | | |
| | 16,189 | | | Global Payments, Inc. | | | 1,849,755 | | |
| | 106,455 | | | The Walt Disney Co. (a) | | | 11,341,716 | | |
| | 6,035 | | | Wynn Resorts Ltd. (a) | | | 385,636 | | |
| | | | 13,577,107 | | |
Shares | | | | Fair Value | |
Apparel Manufacturing - 0.0% (†) | | | |
| | 2,498 | | | Ralph Lauren Corp. | | $ | 231,540 | | |
| | 19,246 | | | VF Corp. | | | 543,699 | | |
| | | | 775,239 | | |
Beverage and Tobacco Product Manufacturing - 1.9% | | | |
| | 105,196 | | | Altria Group, Inc. | | | 4,867,419 | | |
| | 227,479 | | | Coca-Cola Co. | | | 13,614,618 | | |
| | 9,390 | | | Constellation Brands, Inc.
Class A | | | 2,320,081 | | |
| | 49,571 | | | Keurig Dr Pepper, Inc. | | | 1,925,338 | | |
| | 10,988 | | | Molson Coors Brewing Co.
Class B | | | 554,125 | | |
| | 22,472 | | | Monster Beverage Corp. (a) | | | 2,106,076 | | |
| | 80,675 | | | PepsiCo, Inc. | | | 14,648,966 | | |
| | 90,586 | | | Philip Morris International, Inc. | | | 8,320,324 | | |
| | | | 48,356,947 | | |
Broadcasting (except Internet) - 0.1% | | | |
| | 14,684 | | | Dish Network Corp. (a) | | | 218,939 | | |
| | 17,862 | | | FOX Corp. Class A | | | 515,676 | | |
| | 8,252 | | | FOX Corp. Class B | | | 224,454 | | |
| | 29,594 | | | ViacomCBS, Inc. Class B | | | 542,162 | | |
| | 129,061 | | | Warner Bros Discovery, Inc. (a) | | | 1,677,793 | | |
| | | | 3,179,024 | | |
Broadcasting and Content Providers - 0.4% | | | |
| | 6,465 | | | Charter Communications,
Inc. (a) | | | 2,376,663 | | |
| | 257,324 | | | Comcast Corp. Class A | | | 8,167,464 | | |
| | | | 10,544,127 | | |
Building Material and Garden Equipment and Supplies Dealers - 1.0% | | | |
| | 37,313 | | | Lowe's Companies, Inc. | | | 7,274,169 | | |
| | 3,109 | | | Snap-on, Inc. | | | 690,353 | | |
| | 60,073 | | | The Home Depot, Inc. | | | 17,789,418 | | |
| | | | 25,753,940 | | |
Chemical Manufacturing - 6.2% | | | |
| | 103,345 | | | AbbVie, Inc. | | | 15,129,708 | | |
| | 12,962 | | | Air Products & Chemicals, Inc. | | | 3,245,685 | | |
| | 6,931 | | | Albemarle Corp. | | | 1,939,779 | | |
| | 31,290 | | | Amgen, Inc. | | | 8,459,251 | | |
| | 8,408 | | | Biogen, Inc. (a) | | | 2,383,164 | | |
| | 2,387 | | | Bio-Techne Corp. | | | 707,173 | | |
| | 124,754 | | | Bristol-Myers Squibb Co. | | | 9,664,692 | | |
| | 10,527 | | | Catalent, Inc. (a) | | | 691,940 | | |
| | 5,827 | | | Celanese Corp. | | | 560,091 | | |
| | 11,710 | | | CF Industries Holdings, Inc. | | | 1,244,305 | | |
| | 14,181 | | | Church & Dwight Co., Inc. | | | 1,051,238 | | |
| | 7,142 | | | Clorox Co. | | | 1,043,018 | | |
| | 48,702 | | | Colgate-Palmolive Co. | | | 3,596,156 | | |
| | 29,199 | | | DuPont de Nemours, Inc. | | | 1,670,183 | | |
| | 7,133 | | | Eastman Chemical Co. | | | 547,886 | | |
| | 14,454 | | | Ecolab, Inc. | | | 2,270,290 | | |
| | 46,088 | | | Eli Lilly and Company | | | 16,688,004 | | |
| | 7,356 | | | FMC Corp. | | | 874,628 | | |
| | 73,261 | | | Gilead Sciences, Inc. | | | 5,748,058 | | |
| | 10,771 | | | Incyte Corp. (a) | | | 800,716 | | |
The accompanying notes are an integral part of these financial statements.
DIREXION ANNUAL REPORT
60
Direxion Daily S&P 500® Bull 3X Shares
Schedule of Investments, continued
October 31, 2022
Shares | | | | Fair Value | |
Chemical Manufacturing (continued) | | | |
| | 14,917 | | | International Flavors &
Fragrances, Inc. | | $ | 1,456,048 | | |
| | 19,703 | | | Kimberly-Clark Corp. | | | 2,452,235 | | |
| | 29,110 | | | Linde PLC ADR (Ireland) | | | 8,655,858 | | |
| | 14,842 | | | LyondellBasell Industries N.V.
Class A ADR (Netherlands) | | | 1,134,671 | | |
| | 148,121 | | | Merck & Co., Inc. | | | 14,989,845 | | |
| | 20,161 | | | Mosaic Co. | | | 1,083,654 | | |
| | 14,844 | | | Organon & Co. | | | 388,616 | | |
| | 327,928 | | | Pfizer, Inc. | | | 15,265,048 | | |
| | 13,766 | | | PPG Industries, Inc. | | | 1,571,802 | | |
| | 139,596 | | | Procter & Gamble Co. | | | 18,799,393 | | |
| | 6,338 | | | Regeneron Pharmaceuticals,
Inc. (a) | | | 4,745,577 | | |
| | 8,415 | | | Sealed Air Corp. | | | 400,722 | | |
| | 14,959 | | | Vertex Pharmaceuticals, Inc. (a) | | | 4,667,208 | | |
| | 4,340 | | | West Pharmaceutical Services,
Inc. | | | 998,634 | | |
| | 27,332 | | | Zoetis, Inc. | | | 4,121,119 | | |
| | | | 159,046,395 | | |
Clothing and Clothing Accessories Stores - 0.2% | | | |
| | 13,286 | | | Bath & Body Works, Inc. | | | 443,486 | | |
| | 68,407 | | | TJX Companies, Inc. | | | 4,932,145 | | |
| | | | 5,375,631 | | |
Clothing, Clothing Accessories, Shoe, and Jewelry Retailers - 0.1% | | | |
| | 20,384 | | | Ross Stores, Inc. | | | 1,950,545 | | |
Computer and Electronic Product Manufacturing - 14.4% | | | |
| | 2,570 | | | Abiomed, Inc. (a) | | | 647,846 | | |
| | 94,389 | | | Advanced Micro Devices,
Inc. (a) | | | 5,669,003 | | |
| | 17,448 | | | Agilent Technologies, Inc. | | | 2,413,931 | | |
| | 350,415 | | | Alphabet, Inc. Class A (a) | | | 33,117,722 | | |
| | 313,325 | | | Alphabet, Inc. Class C (a) | | | 29,659,344 | | |
| | 13,417 | | | AMETEK, Inc. | | | 1,739,648 | | |
| | 34,684 | | | Amphenol Corp. Class A | | | 2,630,088 | | |
| | 30,337 | | | Analog Devices, Inc. | | | 4,326,663 | | |
| | 882,877 | | | Apple, Inc. | | | 135,380,359 | | |
| | 14,411 | | | Arista Networks, Inc. (a) | | | 1,741,713 | | |
| | 1,246 | | | Bio-Rad Laboratories, Inc. (a) | | | 438,231 | | |
| | 23,570 | | | Broadcom, Inc. | | | 11,080,728 | | |
| | 242,008 | | | Cisco Systems, Inc. | | | 10,994,423 | | |
| | 38,283 | | | Danaher Corp. | | | 9,634,683 | | |
| | 7,866 | | | Enphase Energy, Inc. (a) | | | 2,414,862 | | |
| | 38,171 | | | Fortinet, Inc. (a) | | | 2,181,854 | | |
| | 20,751 | | | Fortive Corp. | | | 1,325,989 | | |
| | 14,627 | | | Hologic, Inc. (a) | | | 991,711 | | |
| | 53,198 | | | HP, Inc. | | | 1,469,329 | | |
| | 4,882 | | | IDEXX Laboratories, Inc. (a) | | | 1,755,958 | | |
| | 9,187 | | | Illumina, Inc. (a) | | | 2,102,169 | | |
| | 239,945 | | | Intel Corp. | | | 6,821,636 | | |
| | 52,785 | | | International Business
Machines Corp. | | | 7,299,638 | | |
| | 10,593 | | | Keysight Technologies, Inc. (a) | | | 1,844,771 | | |
| | 11,228 | | | L3 Harris Technologies, Inc. | | | 2,767,365 | | |
Shares | | | | Fair Value | |
Computer and Electronic Product Manufacturing (continued) | | | |
| | 32,232 | | | Microchip Technology, Inc. | | $ | 1,990,004 | | |
| | 64,433 | | | Micron Technology, Inc. | | | 3,485,825 | | |
| | 2,539 | | | Monolithic Power Systems, Inc. | | | 861,864 | | |
| | 9,678 | | | Motorola Solutions, Inc. | | | 2,416,693 | | |
| | 12,827 | | | NetApp, Inc. | | | 888,526 | | |
| | 8,417 | | | Northrop Grumman Corp. | | | 4,621,017 | | |
| | 146,334 | | | NVIDIA Corp. (a) | | | 19,750,700 | | |
| | 15,347 | | | NXP Semiconductors NV ADR
(Netherlands) | | | 2,241,890 | | |
| | 25,332 | | | ON Semiconductor Corp. (a) | | | 1,556,145 | | |
| | 24,518 | | | Otis Worldwide Corp. | | | 1,731,952 | | |
| | 7,362 | | | PerkinElmer, Inc. | | | 983,416 | | |
| | 6,033 | | | Qorvo, Inc. (a) | | | 519,321 | | |
| | 65,576 | | | Qualcomm, Inc. | | | 7,715,672 | | |
| | 86,180 | | | Raytheon Technologies Corp. | | | 8,171,588 | | |
| | 6,173 | | | Roper Technologies, Inc. | | | 2,558,955 | | |
| | 11,387 | | | Seagate Technology Holdings
PLC ADR (Ireland) | | | 565,478 | | |
| | 9,419 | | | Skyworks Solutions, Inc. | | | 810,128 | | |
| | 3,179 | | | SolarEdge Technologies, Inc. (a) | | | 731,265 | | |
| | 9,076 | | | Teradyne, Inc. | | | 738,333 | | |
| | 53,385 | | | Texas Instruments, Inc. | | | 8,575,233 | | |
| | 22,875 | | | Thermo Fisher Scientific, Inc. | | | 11,757,064 | | |
| | 14,448 | | | Trimble, Inc. (a) | | | 869,192 | | |
| | 3,555 | | | Waters Corp. (a) | | | 1,063,549 | | |
| | 18,336 | | | Western Digital Corp. (a) | | | 630,208 | | |
| | 3,064 | | | Zebra Technologies Corp.
Class A (a) | | | 867,786 | | |
| | | | 366,551,468 | | |
Computing Infrastructure Providers, Data Processing, Web Hosting, and Related Services - 0.2% | | | |
| | 37,350 | | | Fiserv, Inc. (a) | | | 3,837,339 | | |
Construction of Buildings - 0.1% | | | |
| | 18,457 | | | D.R. Horton, Inc. | | | 1,418,974 | | |
| | 14,917 | | | Lennar Corp. Class A | | | 1,203,802 | | |
| | 92 | | | NVR, Inc. (a) | | | 389,873 | | |
| | 13,539 | | | PulteGroup, Inc. | | | 541,425 | | |
| | | | 3,554,074 | | |
Couriers and Messengers - 0.4% | | | |
| | 13,912 | | | FedEx Corp. | | | 2,229,815 | | |
| | 42,778 | | | United Parcel Service, Inc.
Class B | | | 7,176,865 | | |
| | | | 9,406,680 | | |
Credit Intermediation and Related Activities - 4.1% | | | |
| | 35,025 | | | American Express Co. | | | 5,199,461 | | |
| | 408,522 | | | Bank of America Corp. | | | 14,723,133 | | |
| | 42,960 | | | Bank of New York Mellon
Corp. | | | 1,809,046 | | |
| | 113,228 | | | Citigroup, Inc. | | | 5,192,636 | | |
| | 28,936 | | | Citizens Financial Group, Inc. | | | 1,183,482 | | |
| | 7,671 | | | Comerica, Inc. | | | 540,805 | | |
| | 15,950 | | | Discover Financial Services | | | 1,666,137 | | |
| | 35,510 | | | Fidelity National Information
Services, Inc. | | | 2,946,975 | | |
| | 40,123 | | | Fifth Third Bancorp | | | 1,431,990 | | |
The accompanying notes are an integral part of these financial statements.
DIREXION ANNUAL REPORT
61
Direxion Daily S&P 500® Bull 3X Shares
Schedule of Investments, continued
October 31, 2022
Shares | | | | Fair Value | |
Credit Intermediation and Related Activities (continued) | | | |
| | 10,705 | | | First Republic Bank | | $ | 1,285,671 | | |
| | 84,310 | | | Huntington Bancshares, Inc. | | | 1,279,826 | | |
| | 171,348 | | | JPMorgan Chase & Co. | | | 21,569,286 | | |
| | 54,517 | | | KeyCorp | | | 974,219 | | |
| | 10,198 | | | M&T Bank Corp. | | | 1,717,037 | | |
| | 49,855 | | | MasterCard, Inc. Class A | | | 16,361,414 | | |
| | 12,157 | | | Northern Trust Corp. | | | 1,025,443 | | |
| | 23,889 | | | PNC Financial Services Group,
Inc. | | | 3,865,957 | | |
| | 54,581 | | | Regions Financial Corp. | | | 1,198,053 | | |
| | 3,701 | | | Signature Bank | | | 586,720 | | |
| | 21,457 | | | State Street Corp. | | | 1,587,818 | | |
| | 3,445 | | | SVB Financial Group (a) | | | 795,657 | | |
| | 28,129 | | | Synchrony Financial | | | 1,000,267 | | |
| | 77,528 | | | Truist Financial Corp. | | | 3,472,479 | | |
| | 79,041 | | | U.S. Bancorp | | | 3,355,290 | | |
| | 221,718 | | | Wells Fargo & Co. | | | 10,196,811 | | |
| | 8,847 | | | Zions Bancorp | | | 459,513 | | |
| | | | 105,425,126 | | |
Data Processing, Hosting and Related Services - 0.1% | | | |
| | 23,121 | | | CoStar Group, Inc. (a) | | | 1,912,569 | | |
Electrical Equipment, Appliance, and Component Manufacturing - 0.3% | | | |
| | 7,566 | | �� | A.O. Smith Corp. | | | 414,465 | | |
| | 34,516 | | | Emerson Electric Co. | | | 2,989,086 | | |
| | 3,728 | | | Generac Holdings, Inc. (a) | | | 432,113 | | |
| | 6,746 | | | Rockwell Automation, Inc. | | | 1,722,254 | | |
| | 18,766 | | | TE Connectivity Ltd. ADR
(Switzerland) | | | 2,293,768 | | |
| | 3,143 | | | Whirlpool Corp. | | | 434,488 | | |
| | | | 8,286,174 | | |
Electronics and Appliance Stores - 0.0% (†) | | | |
| | 11,769 | | | Best Buy Co., Inc. | | | 805,117 | | |
Fabricated Metal Product Manufacturing - 0.2% | | | |
| | 18,415 | | | Ball Corp. | | | 909,517 | | |
| | 15,306 | | | Nucor Corp. | | | 2,010,902 | | |
| | 9,592 | | | Pentair PLC ADR (Ireland) | | | 411,976 | | |
| | 8,738 | | | Stanley Black & Decker, Inc. | | | 685,846 | | |
| | | | 4,018,241 | | |
Food and Beverage Stores - 0.1% | | | |
| | 37,996 | | | Kroger Co. | | | 1,796,831 | | |
Food Manufacturing - 0.8% | | | |
| | 32,741 | | | Archer-Daniels-Midland Co. | | | 3,175,222 | | |
| | 11,805 | | | Campbell Soup Co. | | | 624,602 | | |
| | 34,771 | | | General Mills, Inc. | | | 2,836,618 | | |
| | 16,888 | | | Hormel Foods Corp. | | | 784,448 | | |
| | 14,919 | | | Kellogg Co. | | | 1,146,078 | | |
| | 8,372 | | | Lamb Weston Holdings, Inc. | | | 721,834 | | |
| | 14,664 | | | McCormick & Co, Inc. | | | 1,153,177 | | |
| | 80,089 | | | Mondelez International, Inc. | | | 4,923,872 | | |
| | 8,563 | | | The Hershey Co. | | | 2,044,587 | | |
| | 6,211 | | | The J.M. Smucker Co. | | | 935,749 | | |
| | 46,508 | | | The Kraft Heinz Co. | | | 1,789,163 | | |
| | 16,882 | | | Tyson Foods, Inc. Class A | | | 1,153,885 | | |
| | | | 21,289,235 | | |
Shares | | | | Fair Value | |
Food Services and Drinking Places - 1.0% | | | |
| | 1,734 | | | Chipotle Mexican Grill, Inc. (a) | | $ | 2,598,104 | | |
| | 5,004 | | | Cintas Corp. | | | 2,139,460 | | |
| | 7,122 | | | Darden Restaurants, Inc. | | | 1,019,443 | | |
| | 2,034 | | | Domino's Pizza, Inc. (a) | | | 675,776 | | |
| | 42,946 | | | McDonald's Corp. | | | 11,709,657 | | |
| | 67,090 | | | Starbucks Corp. | | | 5,809,323 | | |
| | 16,600 | | | Yum! Brands, Inc. | | | 1,962,950 | | |
| | | | 25,914,713 | | |
Funds, Trusts, and Other Financial Vehicles - 0.1% | | | |
| | 8,988 | | | Garmin Ltd. ADR (Switzerland) | | | 791,304 | | |
| | 13,207 | | | T. Rowe Price Group, Inc. | | | 1,402,055 | | |
| | | | 2,193,359 | | |
Gasoline Stations - 0.7% | | | |
| | 105,198 | | | Chevron Corp. | | | 19,030,318 | | |
General Merchandise Retailers - 2.7% | | | |
| | 518,003 | | | Amazon.com, Inc. (a) | | | 53,064,227 | | |
| | 25,931 | | | Costco Wholesale Corp. | | | 13,004,396 | | |
| | 12,403 | | | Dollar Tree, Inc. (a) | | | 1,965,876 | | |
| | 32,120 | | | eBay, Inc. | | | 1,279,661 | | |
| | | | 69,314,160 | | |
General Merchandise Stores - 0.8% | | | |
| | 13,249 | | | Dollar General Corp. | | | 3,379,158 | | |
| | 27,108 | | | Target Corp. | | | 4,452,489 | | |
| | 83,237 | | | Wal-Mart Stores, Inc. | | | 11,847,122 | | |
| | | | 19,678,769 | | |
Health and Personal Care Stores - 0.4% | | | |
| | 76,648 | | | CVS Health Corp. | | | 7,258,566 | | |
| | 3,064 | | | Ulta Salon, Cosmetics &
Fragrance, Inc. (a) | | | 1,284,950 | | |
| | 41,915 | | | Walgreens Boots Alliance, Inc. | | | 1,529,897 | | |
| | | | 10,073,413 | | |
Hospitals - 0.1% | | | |
| | 12,588 | | | HCA Healthcare, Inc. | | | 2,737,512 | | |
| | 3,792 | | | Universal Health Services, Inc.
Class B | | | 439,379 | | |
| | | | 3,176,891 | | |
Insurance Carriers and Related Activities - 5.0% | | | |
| | 33,507 | | | Aflac, Inc. | | | 2,181,641 | | |
| | 15,866 | | | Allstate Corp. | | | 2,003,082 | | |
| | 44,463 | | | American International
Group, Inc. | | | 2,534,391 | | |
| | 12,404 | | | AON PLC ADR
(United Kingdom) | | | 3,491,602 | | |
| | 21,600 | | | Arch Capital Group Ltd. ADR (a) | | | 1,242,000 | | |
| | 12,306 | | | Arthur J. Gallagher & Co. | | | 2,302,206 | | |
| | 3,106 | | | Assurant, Inc. | | | 421,981 | | |
| | 105,341 | | | Berkshire Hathaway, Inc.
Class B (a) | | | 31,085,076 | | |
| | 13,697 | | | Brown & Brown, Inc. | | | 805,247 | | |
| | 33,399 | | | Centene Corp. (a) | | | 2,843,257 | | |
| | 24,380 | | | Chubb Limited ADR
(Switzerland) | | | 5,239,018 | | |
| | 17,826 | | | Cigna Corp. | | | 5,758,868 | | |
| | 9,385 | | | Cincinnati Financial Corp. | | | 969,658 | | |
The accompanying notes are an integral part of these financial statements.
DIREXION ANNUAL REPORT
62
Direxion Daily S&P 500® Bull 3X Shares
Schedule of Investments, continued
October 31, 2022
Shares | | | | Fair Value | |
Insurance Carriers and Related Activities (continued) | | | |
| | 14,066 | | | Elevance Health, Inc. | | $ | 7,690,867 | | |
| | 2,387 | | | Everest Re Group Ltd. ADR | | | 770,189 | | |
| | 5,258 | | | Globe Life, Inc. | | | 607,404 | | |
| | 18,917 | | | Hartford Financial Services
Group, Inc. | | | 1,369,780 | | |
| | 7,410 | | | Humana, Inc. | | | 4,135,373 | | |
| | 9,005 | | | Lincoln National Corp. | | | 485,099 | | |
| | 11,763 | | | Loews Corp. | | | 670,726 | | |
| | 29,144 | | | Marsh & McLennan
Companies, Inc. | | | 4,706,465 | | |
| | 39,097 | | | MetLife, Inc. | | | 2,862,291 | | |
| | 13,542 | | | Principal Financial Group, Inc. | | | 1,193,456 | | |
| | 34,104 | | | Progressive Corp. | | | 4,378,954 | | |
| | 21,761 | | | Prudential Financial, Inc. | | | 2,289,040 | | |
| | 13,856 | | | Travelers Companies, Inc. | | | 2,555,878 | | |
| | 54,689 | | | UnitedHealth Group, Inc. | | | 30,360,598 | | |
| | 11,955 | | | W.R. Berkley Corp. | | | 889,213 | | |
| | 6,436 | | | Willis Towers Watson PLC
ADR (Ireland) (a) | | | 1,404,400 | | |
| | | | 127,247,760 | | |
Leather and Allied Product Manufacturing - 0.3% | | | |
| | 73,717 | | | NIKE, Inc. Class B | | | 6,832,092 | | |
| | 14,718 | | | Tapestry, Inc. | | | 466,266 | | |
| | | | 7,298,358 | | |
Machinery Manufacturing - 1.6% | | | |
| | 50,826 | | | Applied Materials, Inc. | | | 4,487,428 | | |
| | 59,025 | | | Baker Hughes Co. | | | 1,632,631 | | |
| | 49,203 | | | Carrier Global Corp. | | | 1,956,311 | | |
| | 30,881 | | | Caterpillar, Inc. | | | 6,684,501 | | |
| | 8,265 | | | Cummins, Inc. | | | 2,020,875 | | |
| | 16,219 | | | Deere & Co. | | | 6,419,805 | | |
| | 64,059 | | | General Electric Co. | | | 4,984,431 | | |
| | 4,386 | | | IDEX Corp. | | | 975,052 | | |
| | 23,544 | | | Ingersoll Rand, Inc. | | | 1,188,972 | | |
| | 8,008 | | | Lam Research Corp. | | | 3,241,478 | | |
| | 1,276 | | | Mettler-Toledo International,
Inc. (a) | | | 1,614,051 | | |
| | 3,132 | | | Nordson Corp. | | | 704,700 | | |
| | 7,563 | | | Parker Hannifin Corp. | | | 2,197,959 | | |
| | 13,502 | | | Trane Technologies PLC ADR
(Ireland) | | | 2,155,324 | | |
| | 10,607 | | | Xylem, Inc. | | | 1,086,475 | | |
| | | | 41,349,993 | | |
Management of Companies and Enterprises - 0.5% | | | |
| | 102,305 | | | Abbott Laboratories | | | 10,122,057 | | |
| | 22,454 | | | Capital One Financial Corp. | | | 2,380,573 | | |
| | 57,698 | | | Carnival Corp. ADR (Panama) (a) | | | 522,744 | | |
| | 24,620 | | | Norwegian Cruise Line
Holdings Ltd. ADR (a) | | | 415,832 | | |
| | | | 13,441,206 | | |
Merchant Wholesalers, Durable Goods - 0.5% | | | |
| | 12,515 | | | Copart, Inc. (a) | | | 1,439,475 | | |
| | 33,569 | | | Fastenal Co. | | | 1,622,390 | | |
| | 7,597 | | | Fortune Brands Home &
Security, Inc. | | | 458,251 | | |
| | 7,927 | | | Henry Schein, Inc. (a) | | | 542,682 | | |
Shares | | | | Fair Value | |
Merchant Wholesalers, Durable Goods (continued) | | | |
| | 2,411 | | | Huntington Ingalls
Industries, Inc. | | $ | 619,796 | | |
| | 40,296 | | | Johnson Controls
International PLC ADR
(Ireland) | | | 2,330,721 | | |
| | 8,284 | | | KLA-Tencor Corp. | | | 2,621,472 | | |
| | 15,274 | | | LKQ Corp. | | | 849,845 | | |
| | 3,091 | | | Mohawk Industries, Inc. (a) | | | 292,872 | | |
| | 2,398 | | | Pool Corp. | | | 729,544 | | |
| | 2,567 | | | W.W. Grainger, Inc. | | | 1,500,026 | | |
| | 14,843 | | | WestRock Co. | | | 505,553 | | |
| | | | 13,512,627 | | |
Merchant Wholesalers, Nondurable Goods - 0.7% | | | |
| | 9,024 | | | AmerisourceBergen Corp. | | | 1,418,753 | | |
| | 10,712 | | | Brown Forman Corp. Class B | | | 728,416 | | |
| | 15,933 | | | Cardinal Health, Inc. | | | 1,209,315 | | |
| | 28,024 | | | ConAgra Brands, Inc. | | | 1,028,481 | | |
| | 16,513 | | | Illinois Tool Works, Inc. | | | 3,526,021 | | |
| | 8,369 | | | McKesson Corp. | | | 3,258,638 | | |
| | 29,770 | | | Sysco Corp. | | | 2,576,891 | | |
| | 13,780 | | | The Sherwin Williams Co. | | | 3,100,913 | | |
| | | | 16,847,428 | | |
Mining (except Oil and Gas) - 0.3% | | | |
| | 83,553 | | | Freeport-McMoRan Copper &
Gold, Inc. | | | 2,647,795 | | |
| | 3,683 | | | Martin Marietta Materials, Inc. | | | 1,237,414 | | |
| | 46,382 | | | Newmont Mining Corp. | | | 1,962,886 | | |
| | 7,731 | | | Vulcan Materials Co. | | | 1,265,565 | | |
| | | | 7,113,660 | | |
Miscellaneous Manufacturing - 2.9% | | | |
| | 32,283 | | | 3M Co. | | | 4,060,879 | | |
| | 4,270 | | | Align Technology, Inc. (a) | | | 829,661 | | |
| | 29,509 | | | Baxter International, Inc. | | | 1,603,814 | | |
| | 16,618 | | | Becton, Dickinson & Co. | | | 3,921,350 | | |
| | 83,674 | | | Boston Scientific Corp. (a) | | | 3,607,186 | | |
| | 12,583 | | | Dentsply Sirona, Inc. | | | 387,808 | | |
| | 22,932 | | | DexCom, Inc. (a) | | | 2,769,727 | | |
| | 8,346 | | | Dover Corp. | | | 1,090,739 | | |
| | 36,171 | | | Edwards Lifesciences Corp. (a) | | | 2,619,866 | | |
| | 13,542 | | | Estee Lauder Companies, Inc.
Class A | | | 2,715,036 | | |
| | 7,623 | | | Hasbro, Inc. | | | 497,401 | | |
| | 20,871 | | | Intuitive Surgical, Inc. (a) | | | 5,144,075 | | |
| | 153,594 | | | Johnson & Johnson | | | 26,720,748 | | |
| | 77,573 | | | Medtronic PLC ADR (Ireland) | | | 6,775,226 | | |
| | 8,570 | | | ResMed, Inc. | | | 1,917,023 | | |
| | 5,840 | | | Steris PLC ADR (Ireland) | | | 1,007,867 | | |
| | 19,685 | | | Stryker Corp. | | | 4,512,589 | | |
| | 2,736 | | | Teleflex, Inc. | | | 587,036 | | |
| | 12,405 | | | Textron, Inc. | | | 848,998 | | |
| | 2,957 | | | The Cooper Companies, Inc. | | | 808,414 | | |
| | 12,295 | | | Zimmer Biomet Holdings, Inc. | | | 1,393,638 | | |
| | | | 73,819,081 | | |
Miscellaneous Store Retailers - 0.1% | | | |
| | 6,472 | | | Tractor Supply Co. | | | 1,422,351 | | |
The accompanying notes are an integral part of these financial statements.
DIREXION ANNUAL REPORT
63
Direxion Daily S&P 500® Bull 3X Shares
Schedule of Investments, continued
October 31, 2022
Shares | | | | Fair Value | |
Motion Picture and Sound Recording Industries - 0.3% | | | |
| | 26,014 | | | Netflix, Inc. (a) | | $ | 7,592,966 | | |
| | 9,079 | | | Take-Two Interactive
Software, Inc. (a) | | | 1,075,680 | | |
| | | | 8,668,646 | | |
Motor Vehicle and Parts Dealers - 0.3% | | | |
| | 3,599 | | | Advance Auto Parts, Inc. | | | 683,522 | | |
| | 1,181 | | | AutoZone, Inc. (a) | | | 2,991,331 | | |
| | 9,351 | | | CarMax, Inc. (a) | | | 589,207 | | |
| | 3,720 | | | O'Reilly Automotive, Inc. (a) | | | 3,114,272 | | |
| | | | 7,378,332 | | |
National Security and International Affairs - 0.0% (†) | | | |
| | 7,995 | | | Leidos Holdings, Inc. | | | 812,212 | | |
Nonmetallic Mineral Product Manufacturing - 0.1% | | | |
| | 44,471 | | | Corning, Inc. | | | 1,430,632 | | |
Nonstore Retailers - 0.0% (†) | | | |
| | 7,408 | | | Etsy, Inc. (a) | | | 695,685 | | |
Oil and Gas Extraction - 0.8% | | | |
| | 19,068 | | | APA Corp. | | | 866,831 | | |
| | 46,478 | | | Coterra Energy, Inc. | | | 1,446,860 | | |
| | 38,192 | | | Devon Energy Corp. | | | 2,954,151 | | |
| | 48,614 | | | Dominion Energy, Inc. | | | 3,401,522 | | |
| | 34,247 | | | EOG Resources, Inc. | | | 4,675,401 | | |
| | 21,596 | | | EQT Corp. | | | 903,577 | | |
| | 39,653 | | | Marathon Oil Corp. | | | 1,207,434 | | |
| | 43,542 | | | Occidental Petroleum Corp. | | | 3,161,149 | | |
| | 28,066 | | | Phillips 66 | | | 2,927,003 | | |
| | | | 21,543,928 | | |
Paper Manufacturing - 0.0% (†) | | | |
| | 5,500 | | | Packaging Corp of America | | | 661,155 | | |
Performing Arts, Spectator Sports, and Related Industries - 0.2% | | | |
| | 41,622 | | | Activision Blizzard, Inc. | | | 3,030,082 | | |
| | 15,424 | | | Electronic Arts, Inc. | | | 1,942,807 | | |
| | | | 4,972,889 | | |
Petroleum and Coal Products Manufacturing - 1.7% | | | |
| | 74,328 | | | ConocoPhillips | | | 9,372,018 | | |
| | 243,489 | | | Exxon Mobil Corp. | | | 26,981,016 | | |
| | 29,137 | | | Marathon Petroleum Corp. | | | 3,310,546 | | |
| | 23,055 | | | Valero Energy Corp. | | | 2,894,555 | | |
| | | | 42,558,135 | | |
Pipeline Transportation - 0.1% | | | |
| | 71,190 | | | Williams Companies, Inc. | | | 2,330,049 | | |
Plastics and Rubber Products Manufacturing - 0.0% (†) | | | |
| | 4,723 | | | Avery Dennison Corp. | | | 800,784 | | |
| | 21,991 | | | Newell Rubbermaid, Inc. | | | 303,696 | | |
| | | | 1,104,480 | | |
Primary Metal Manufacturing - 0.0% (†) | | | |
| | 21,580 | | | Howmet Aerospace, Inc. (a) | | | 767,169 | | |
Professional, Scientific, and Technical Services - 2.2% | | | |
| | 37,006 | | | Accenture PLC Class A
ADR (Ireland) | | | 10,506,003 | | |
| | 7,857 | | | CDW Corp. | | | 1,357,768 | | |
Shares | | | | Fair Value | |
Professional, Scientific, and Technical Services (continued) | | | |
| | 3,032 | | | Charles River Laboratories
International, Inc. (a) | | $ | 643,542 | | |
| | 30,267 | | | Cognizant Technology
Solutions Corp. Class A | | | 1,884,121 | | |
| | 13,419 | | | DXC Technology Co. (a) | | | 385,796 | | |
| | 23,257 | | | Eaton Corp PLC ADR (Ireland) | | | 3,490,178 | | |
| | 3,339 | | | EPAM Systems, Inc. (a) | | | 1,168,650 | | |
| | 7,770 | | | Extra Space Storage, Inc. | | | 1,378,709 | | |
| | 3,467 | | | F5 Networks, Inc. (a) | | | 495,469 | | |
| | 21,172 | | | International Paper Co. | | | 711,591 | | |
| | 22,828 | | | Interpublic Group of
Companies, Inc. | | | 680,046 | | |
| | 10,836 | | | IQVIA Holdings, Inc. (a) | | | 2,271,984 | | |
| | 4,277 | | | Jack Henry & Associates, Inc. | | | 851,380 | | |
| | 7,553 | | | Jacobs Solutions, Inc. | | | 870,257 | | |
| | 18,912 | | | Juniper Networks, Inc. | | | 578,707 | | |
| | 16,549 | | | Match Group, Inc. (a) | | | 714,917 | | |
| | 133,274 | | | Meta Platforms, Inc. (a) | | | 12,415,806 | | |
| | 19,667 | | | Moderna, Inc. (a) | | | 2,956,540 | | |
| | 11,976 | | | Omnicom Group, Inc. | | | 871,254 | | |
| | 18,702 | | | Paychex, Inc. | | | 2,212,634 | | |
| | 2,764 | | | Paycom Software, Inc. (a) | | | 956,344 | | |
| | 11,878 | | | ServiceNow, Inc. (a) | | | 4,997,550 | | |
| | 2,728 | | | Teledyne Technologies, Inc. (a) | | | 1,085,689 | | |
| | 5,470 | | | VeriSign, Inc. (a) | | | 1,096,516 | | |
| | 9,136 | | | Verisk Analytics, Inc. Class A | | | 1,670,335 | | |
| | | | 56,251,786 | | |
Publishing Industries - 4.9% | | | |
| | 27,343 | | | Adobe Systems, Inc. (a) | | | 8,708,745 | | |
| | 5,141 | | | ANSYS, Inc. (a) | | | 1,136,984 | | |
| | 12,646 | | | Autodesk, Inc. (a) | | | 2,710,038 | | |
| | 15,978 | | | Cadence Design Systems,
Inc. (a) | | | 2,418,909 | | |
| | 16,560 | | | Intuit, Inc. | | | 7,079,400 | | |
| | 435,792 | | | Microsoft Corp. | | | 101,160,397 | | |
| | 8,933 | | | Synopsys, Inc. (a) | | | 2,613,349 | | |
| | | | 125,827,822 | | |
Publishing Industries (except Internet) - 0.9% | | | |
| | 9,353 | | | Akamai Technologies, Inc. (a) | | | 826,150 | | |
| | 8,935 | | | Ceridian HCM Holding, Inc. (a) | | | 591,408 | | |
| | 75,799 | | | Hewlett Packard Enterprise Co. | | | 1,081,652 | | |
| | 22,572 | | | News Corp. Class A | | | 380,790 | | |
| | 7,012 | | | News Corp. Class B | | | 120,116 | | |
| | 34,621 | | | NortonLifeLock, Inc. (a) | | | 780,011 | | |
| | 88,732 | | | Oracle Corp. | | | 6,927,307 | | |
| | 6,167 | | | PTC, Inc. (a) | | | 726,658 | | |
| | 58,136 | | | Salesforce.com, Inc. (a) | | | 9,452,332 | | |
| | 2,453 | | | Tyler Technologies, Inc. (a) | | | 793,128 | | |
| | | | 21,679,552 | | |
Rail Transportation - 0.4% | | | |
| | 125,145 | | | CSX Corp. | | | 3,636,714 | | |
| | 36,565 | | | Union Pacific Corp. | | | 7,208,424 | | |
| | | | 10,845,138 | | |
The accompanying notes are an integral part of these financial statements.
DIREXION ANNUAL REPORT
64
Direxion Daily S&P 500® Bull 3X Shares
Schedule of Investments, continued
October 31, 2022
Shares | | | | Fair Value | |
Real Estate - 1.7% | | | |
| | 8,761 | | | Alexandria Real Estate
Equities, Inc. | | $ | 1,272,973 | | |
| | 27,207 | | | American Tower Corp. | | | 5,637,018 | | |
| | 8,208 | | | AvalonBay Communities, Inc. | | | 1,437,385 | | |
| | 8,329 | | | Boston Properties, Inc. | | | 605,518 | | |
| | 6,213 | | | Camden Property Trust | | | 717,912 | | |
| | 18,778 | | | CBRE Group, Inc. Class A (a) | | | 1,332,111 | | |
| | 25,312 | | | Crown Castle International
Corp. | | | 3,373,077 | | |
| | 16,747 | | | Digital Realty Trust, Inc. | | | 1,678,887 | | |
| | 19,730 | | | Equity Residential | | | 1,243,385 | | |
| | 3,772 | | | Essex Property Trust, Inc. | | | 838,289 | | |
| | 4,275 | | | Federal Realty Investment Trust | | | 423,140 | | |
| | 31,520 | | | Healthpeak Properties, Inc. | | | 747,970 | | |
| | 33,884 | | | Invitation Homes, Inc. | | | 1,073,784 | | |
| | 36,161 | | | Kimco Realty Corp. | | | 773,122 | | |
| | 6,739 | | | Mid-America Apartment
Communities, Inc. | | | 1,061,056 | | |
| | 53,940 | | | Prologis, Inc. | | | 5,973,855 | | |
| | 9,327 | | | Public Storage | | | 2,889,038 | | |
| | 36,061 | | | Realty Income Corp. | | | 2,245,519 | | |
| | 8,957 | | | Regency Centers Corp. | | | 541,988 | | |
| | 19,093 | | | Simon Property Group, Inc. | | | 2,080,755 | | |
| | 17,829 | | | UDR, Inc. | | | 708,881 | | |
| | 23,380 | | | Ventas, Inc. | | | 914,860 | | |
| | 56,191 | | | VICI Properties, Inc. | | | 1,799,236 | | |
| | 9,441 | | | Vornado Realty Trust | | | 222,713 | | |
| | 27,053 | | | Welltower, Inc. | | | 1,651,315 | | |
| | 43,283 | | | Weyerhaeuser Co. | | | 1,338,743 | | |
| | | | 42,582,530 | | |
Rental and Leasing Services - 0.1% | | | |
| | 4,075 | | | United Rentals, Inc. (a) | | | 1,286,518 | | |
Securities, Commodity Contracts, and Other Financial Investments and Related Activities - 2.0% | | | |
| | 6,381 | | | Ameriprise Financial, Inc. | | | 1,972,495 | | |
| | 8,835 | | | BlackRock, Inc. | | | 5,706,615 | | |
| | 6,178 | | | CBOE Holdings, Inc. | | | 769,161 | | |
| | 89,247 | | | Charles Schwab Corp. | | | 7,110,309 | | |
| | 20,944 | | | CME Group, Inc. | | | 3,629,595 | | |
| | 41,984 | | | Dow, Inc. | | | 1,962,332 | | |
| | 16,582 | | | Franklin Resources, Inc. | | | 388,848 | | |
| | 20,050 | | | Goldman Sachs Group, Inc. | | | 6,907,426 | | |
| | 32,634 | | | IntercontinentalExchange, Inc. | | | 3,118,831 | | |
| | 26,567 | | | Invesco Ltd. ADR | | | 407,006 | | |
| | 2,194 | | | MarketAxess Holdings, Inc. (a) | | | 535,424 | | |
| | 78,213 | | | Morgan Stanley | | | 6,426,762 | | |
| | 4,661 | | | MSCI, Inc. Class A | | | 2,185,356 | | |
| | 19,772 | | | NASDAQ OMX Group, Inc. | | | 1,230,609 | | |
| | 11,365 | | | Raymond James Financial, Inc. | | | 1,342,661 | | |
| | 19,902 | | | S&P Global, Inc. | | | 6,393,518 | | |
| | | | 50,086,948 | | |
Specialty Trade Contractors - 0.0% (†) | | | |
| | 8,346 | | | Quanta Services, Inc. | | | 1,185,466 | | |
Support Activities for Agriculture and Forestry - 0.1% | | | |
| | 41,994 | | | Corteva, Inc. | | | 2,743,888 | | |
Shares | | | | Fair Value | |
Support Activities for Mining - 0.6% | | | |
| | 10,278 | | | Diamondback Energy, Inc. | | $ | 1,614,777 | | |
| | 53,008 | | | Halliburton Co. | | | 1,930,551 | | |
| | 16,296 | | | Hess Corp. | | | 2,299,040 | | |
| | 14,003 | | | Pioneer Natural Resources Co. | | | 3,590,509 | | |
| | 82,615 | | | Schlumberger Ltd. ADR
(Curaco) | | | 4,298,458 | | |
| | 13,234 | | | Targa Resources Corp. | | | 904,809 | | |
| | | | 14,638,144 | | |
Support Activities for Transportation - 0.3% | | | |
| | 7,166 | | | C.H. Robinson Worldwide, Inc. | | | 700,261 | | |
| | 8,857 | | | Expedia, Inc. (a) | | | 827,864 | | |
| | 9,540 | | | Expeditors International of
Washington, Inc. | | | 933,489 | | |
| | 4,871 | | | J.B. Hunt Transport
Services, Inc. | | | 833,282 | | |
| | 13,772 | | | Norfolk Southern Corp. | | | 3,140,980 | | |
| | | | 6,435,876 | | |
Telecommunications - 1.3% | | | |
| | 416,439 | | | AT&T, Inc. | | | 7,591,683 | | |
| | 5,274 | | | Equinix, Inc. | | | 2,987,405 | | |
| | 55,690 | | | Lumen Technologies, Inc. | | | 409,878 | | |
| | 67,629 | | | PayPal Holdings, Inc. (a) | | | 5,652,432 | | |
| | 6,371 | | | SBA Communications Corp. | | | 1,719,533 | | |
| | 35,156 | | | T-Mobile US, Inc. (a) | | | 5,328,243 | | |
| | 245,271 | | | Verizon Communications, Inc. | | | 9,165,777 | | |
| | | | 32,854,951 | | |
Transportation Equipment Manufacturing - 2.8% | | | |
| | 15,887 | | | Aptiv PLC ADR
(United Kingdom) (a) | | | 1,446,829 | | |
| | 32,629 | | | Boeing Co. (a) | | | 4,649,959 | | |
| | 13,850 | | | BorgWarner, Inc. | | | 519,790 | | |
| | 230,756 | | | Ford Motor Co. | | | 3,085,208 | | |
| | 13,155 | | | General Dynamics Corp. | | | 3,286,119 | | |
| | 85,156 | | | General Motors Co. | | | 3,342,373 | | |
| | 39,359 | | | Honeywell International, Inc. | | | 8,030,023 | | |
| | 13,798 | | | Lockheed Martin Corp. | | | 6,715,211 | | |
| | 20,290 | | | Paccar, Inc. | | | 1,964,681 | | |
| | 155,528 | | | Tesla Motors, Inc. (a) | | | 35,388,841 | | |
| | 3,055 | | | TransDigm Group, Inc. | | | 1,758,947 | | |
| | 10,664 | | | Wabtec Corp. | | | 994,738 | | |
| | | | 71,182,719 | | |
Truck Transportation - 0.1% | | | |
| | 5,323 | | | Old Dominion Freight Line, Inc. | | | 1,461,696 | | |
Utilities - 2.2% | | | |
| | 39,064 | | | AES Corp. | | | 1,021,914 | | |
| | 14,682 | | | Alliant Energy Corp. | | | 765,960 | | |
| | 15,086 | | | Ameren Corp. | | | 1,229,811 | | |
| | 30,013 | | | American Electric Power Co.,
Inc. | | | 2,638,743 | | |
| | 10,682 | | | American Water Works Co.,
Inc. | | | 1,552,522 | | |
| | 8,218 | | | Atmos Energy Corp. | | | 875,628 | | |
| | 36,714 | | | CenterPoint Energy, Inc. | | | 1,050,387 | | |
| | 17,019 | | | CMS Energy Corp. | | | 970,934 | | |
| | 20,731 | | | Consolidated Edison, Inc. | | | 1,823,499 | | |
| | 19,077 | | | Constellation Energy Corp. | | | 1,803,540 | | |
The accompanying notes are an integral part of these financial statements.
DIREXION ANNUAL REPORT
65
Direxion Daily S&P 500® Bull 3X Shares
Schedule of Investments, continued
October 31, 2022
Shares | | | | Fair Value | |
Utilities (continued) | | | |
| | 11,340 | | | DTE Energy Co. | | $ | 1,271,327 | | |
| | 44,945 | | | Duke Energy Corp. | | | 4,187,975 | | |
| | 22,286 | | | Edison International | | | 1,338,051 | | |
| | 11,901 | | | Entergy Corp. | | | 1,275,073 | | |
| | 13,417 | | | Evergy, Inc. | | | 820,181 | | |
| | 20,270 | | | Eversource Energy | | | 1,546,196 | | |
| | 57,874 | | | Exelon Corp. | | | 2,233,358 | | |
| | 31,694 | | | FirstEnergy Corp. | | | 1,195,181 | | |
| | 115,847 | | | Kinder Morgan, Inc. | | | 2,099,148 | | |
| | 114,817 | | | NextEra Energy, Inc. | | | 8,898,317 | | |
| | 23,729 | | | NiSource, Inc. | | | 609,598 | | |
| | 13,774 | | | NRG Energy, Inc. | | | 611,566 | | |
| | 26,096 | | | ONEOK, Inc. | | | 1,548,015 | | |
| | 93,976 | | | PG&E Corp. (a) | | | 1,403,062 | | |
| | 6,540 | | | Pinnacle West Capital Corp. | | | 439,553 | | |
| | 42,974 | | | PPL Corp. | | | 1,138,381 | | |
| | 29,145 | | | Public Service Enterprise
Group, Inc. | | | 1,634,160 | | |
| | 18,404 | | | Sempra Energy | | | 2,777,900 | | |
| | 62,115 | | | Southern Co. | | | 4,067,290 | | |
| | 18,431 | | | WEC Energy Group, Inc. | | | 1,683,303 | | |
| | 31,976 | | | Xcel Energy, Inc. | | | 2,081,957 | | |
| | | | 56,592,530 | | |
Waste Management and Remediation Services - 0.1% | | | |
| | 11,990 | | | Republic Services, Inc. | | | 1,590,114 | | |
Water Transportation - 0.0% (†) | | | |
| | 12,717 | | | Royal Caribbean Cruises Ltd.
ADR (Liberia) (a) | | | 678,833 | | |
Wholesale Electronic Markets and Agents and Brokers - 0.1% | | | |
| | 8,281 | | | Genuine Parts Co. | | | 1,472,859 | | |
Wood Product Manufacturing - 0.0% (†) | | | |
| | 13,214 | | | Masco Corp. | | | 611,412 | | |
| | | | | TOTAL COMMON STOCKS
(Cost $1,842,980,614) | | $ | 1,901,484,950 | | |
SHORT TERM INVESTMENTS - 28.9% | | | |
Money Market Funds - 28.9% | | | |
| | 379,089,825 | | | Dreyfus Government Cash
Management Institutional
Shares, 2.91% (b) | | $ | 379,089,825 | | |
| | 104,629,645 | | | Dreyfus Treasury Securities
Cash Management
Institutional Shares,
3.01% (b) | | | 104,629,645 | | |
| | 72,875,355 | | | Goldman Sachs Financial
Square Government Fund
Institutional Shares,
3.07% (b) | | | 72,875,355 | | |
Shares | | | | Fair Value | |
Money Market Funds (continued) | |
| | 178,438,827 | | | Goldman Sachs Financial
Square Treasury Instruments
Fund Institutional Shares,
3.10% (b) | | $ | 178,438,827 | | |
| | | TOTAL SHORT TERM
INVESTMENTS
(Cost $735,033,652) | | $ | 735,033,652 | | |
| | | TOTAL INVESTMENTS
(Cost $2,578,014,266) -
103.5% (c) | | $ | 2,636,518,602 | | |
| | | Liabilities in Excess of
Other Assets - (3.5)% | | | (89,890,887 | ) | |
| | | TOTAL NET ASSETS - 100.0% | | $ | 2,546,627,715 | | |
Percentages are stated as a percent of net assets.
(†) Less than 0.005%.
The geographic location of all investments is United States unless otherwise indicated.
(a) Non-income producing security.
(b) Represents annualized seven-day yield at October 31, 2022.
(c) All or a portion of these securities have been segregated as collateral for swap contracts. Total value of securities segregated amounted to $1,742,714,625.
ADR - American Depository Receipt
The accompanying notes are an integral part of these financial statements.
DIREXION ANNUAL REPORT
66
Direxion Daily S&P 500® Bull 3X Shares
Long Total Return Swap Contracts
October 31, 2022
Terms of Payments
to be Received at
Termination | | Terms of Payments
to be Paid at
Termination | | Counterparty | | Termination
Date | | Contracts | | Notional
Amount | | Unrealized
Appreciation
(Depreciation) | |
Total return of
S&P 500® Index | | 3.5100% representing
1 month SOFR rate + spread | | Barclays | | 12/7/2022 | | | 234,570 | | | $ | 876,928,015 | | | $ | 29,471,067 | | |
Total return of
S&P 500® Index | | 3.2900% representing
1 month SOFR rate + spread | | Citibank N.A. | | 12/13/2022 | | | 291,923 | | | | 1,148,419,813 | | | | (20,250,165 | ) | |
Total return of
S&P 500® Index | | 3.4900% representing
1 month SOFR rate + spread | | Bank of America
Merrill Lynch | | 12/13/2022 | | | 160,000 | | | | 620,144,745 | | | | (2,820,802 | ) | |
Total return of
S&P 500® Index | | 3.6100% representing
1 month SOFR rate + spread | | UBS Securities LLC | | 12/14/2022 | | | 160,036 | | | | 605,604,932 | | | | 12,510,889 | | |
Total return of
S&P 500® Index | | 3.6900% representing
1 month SOFR rate + spread | | BNP Paribas | | 12/15/2022 | | | 235,000 | | | | 892,825,685 | | | | 14,117,818 | | |
Total return of
S&P 500® Index | | 3.3900% representing
1 month SOFR rate + spread | | J.P. Morgan | | 2/10/2023 | | | 178,214 | | | | 664,958,330 | | | | 23,956,077 | | |
Total return of
S&P 500® Index | | 3.5400% representing
1 month SOFR rate + spread | | Goldman Sachs | | 12/6/2023 | | | 222,348 | | | | 853,154,545 | | | | 7,488,466 | | |
| | | | | | | | | | | $ | 5,662,036,065 | | | $ | 64,473,350 | | |
The accompanying notes are an integral part of these financial statements.
DIREXION ANNUAL REPORT
67
Direxion Daily S&P 500® Bear 3X Shares
Schedule of Investments
October 31, 2022
Shares | | | | Fair Value | |
SHORT TERM INVESTMENTS - 116.1% | | | |
Money Market Funds - 116.1% | | | |
| | 525,222,896 | | | Dreyfus Government Cash
Management Institutional
Shares, 2.91% (a) | | $ | 525,222,896 | | |
| | 119,037,102 | | | Dreyfus Treasury Securities
Cash Management
Institutional Shares,
3.01% (a) | | | 119,037,102 | | |
| | 128,264,053 | | | Goldman Sachs Financial
Square Government
Fund Institutional Shares,
3.07% (a) | | | 128,264,053 | | |
| | 257,983,799 | | | Goldman Sachs Financial
Square Treasury
Instruments Fund
Institutional Shares,
3.10% (a) | | | 257,983,799 | | |
| | | | | TOTAL SHORT TERM
INVESTMENTS
(Cost $1,030,507,850) (b) | | $ | 1,030,507,850 | | |
| | | | | TOTAL INVESTMENTS
(Cost $1,030,507,850) -
116.1% | | $ | 1,030,507,850 | | |
| | | | | Liabilities in Excess of
Other Assets - (16.1)% | | | (142,796,818 | ) | |
| | | | | TOTAL NET ASSETS - 100.0% | | $ | 887,711,032 | | |
Percentages are stated as a percent of net assets.
The geographic location of all investments is United States unless otherwise indicated.
(a) Represents annualized seven-day yield at October 31, 2022.
(b) All or a portion of these securities have been segregated as collateral for swap contracts. Total value of securities segregated amounted to $576,634,147.
Short Total Return Swap Contracts
October 31, 2022
Terms of Payments
to be Received at
Termination | | Terms of Payments
to be Paid at
Termination | | Counterparty | | Termination
Date | | Contracts | | Notional
Amount | | Unrealized
Appreciation
(Depreciation) | |
3.1400% representing 1 month
SOFR rate + spread | | Total return of S&P
500® Index | | J.P. Morgan | | 12/6/2022 | | | 83,776 | | | $ | 320,156,909 | | | $ | (3,933,681 | ) | |
3.3700% representing 1 month
SOFR rate + spread | | Total return of S&P
500® Index | | Barclays | | 12/7/2022 | | | 129,311 | | | | 476,583,965 | | | | (23,586,877 | ) | |
3.3400% representing 1 month
SOFR rate + spread | | Total return of S&P
500® Index | | Goldman Sachs | | 12/9/2022 | | | 107,749 | | | | 439,242,176 | | | | 23,007,730 | | |
3.0900% representing 1 month
SOFR rate + spread | | Total return of S&P
500® Index | | Citibank N.A. | | 12/13/2022 | | | 50,173 | | | | 206,685,104 | | | | 12,667,408 | | |
3.2900% representing 1 month
SOFR rate + spread | | Total return of S&P
500® Index | | Bank of America
Merrill Lynch | | 12/13/2022 | | | 150,635 | | | | 612,511,557 | | | | 30,135,000 | | |
3.3600% representing 1 month
SOFR rate + spread | | Total return of S&P
500® Index | | UBS Securities LLC | | 12/14/2022 | | | 90,553 | | | | 374,727,305 | | | | 25,094,939 | | |
3.0800% representing 1 month
SOFR rate + spread | | Total return of S&P
500® Index | | BNP Paribas | | 12/15/2022 | | | 75,611 | | | | 306,354,940 | | | | 14,283,223 | | |
| | | | | | | | | | | $ | 2,736,261,956 | | | $ | 77,667,742 | | |
The accompanying notes are an integral part of these financial statements.
DIREXION ANNUAL REPORT
68
Direxion Daily Small Cap Bull 3X Shares
Schedule of Investments
October 31, 2022
Shares | | | | Fair Value | |
INVESTMENT COMPANIES - 63.8% | | | |
| | 4,238,047 | | | iShares Russell 2000 ETF (a)(b) | | $ | 776,961,157 | | |
| | | | | TOTAL INVESTMENT
COMPANIES
(Cost $781,423,495) | | $ | 776,961,157 | | |
SHORT TERM INVESTMENTS - 51.3% | | | |
Money Market Funds - 51.3% | | | |
| | 416,856,832 | | | Dreyfus Government Cash
Management Institutional
Shares, 2.91% (c)(d) | | $ | 416,856,832 | | |
| | 208,205,600 | | | Goldman Sachs Financial
Square Treasury
Instruments Fund
Institutional Shares,
3.10% (c) | | | 208,205,600 | | |
| | | | | TOTAL SHORT TERM
INVESTMENTS
(Cost $625,062,432) | | $ | 625,062,432 | | |
| | | | | TOTAL INVESTMENTS
(Cost $1,406,485,927) -
115.1% (e) | | $ | 1,402,023,589 | | |
| | | | | Liabilities in Excess of
Other Assets - (15.1)% | | | (184,560,788 | ) | |
| | | | | TOTAL NET ASSETS - 100.0% | | $ | 1,217,462,801 | | |
Percentages are stated as a percent of net assets.
The geographic location of all investments is United States unless otherwise indicated.
(a) Shareholders may obtain the financial statements of these investment companies at www.sec.gov.
(b) A portion of this security represents a security on loan.
(c) Represents annualized seven-day yield at October 31, 2022.
(d) All or a portion of this security represents an investment of securities lending collateral.
(e) All or a portion of these securities have been segregated as collateral for swap contracts. Total value of securities segregated amounted to $903,964,905.
Long Total Return Swap Contracts
October 31, 2022
Terms of Payments
to be Received at
Termination | | Terms of Payments
to be Paid at
Termination | | Counterparty | | Termination
Date | | Contracts | | Notional
Amount | | Unrealized
Appreciation
(Depreciation) | |
Total return of
Russell 2000® Index | | 3.3400% representing
1 month SOFR rate + spread | | J.P. Morgan | | 12/6/2022 | | | 119,346 | | | $ | 227,336,826 | | | $ | (7,863,248 | ) | |
Total return of
Russell 2000® Index | | 3.3900% representing
1 month SOFR rate + spread | | Barclays | | 12/7/2022 | | | 274,391 | | | | 482,149,890 | | | | 23,585,387 | | |
Total return of
Russell 2000® Index | | 3.2800% representing
1 month SOFR rate + spread | | Citibank N.A. | | 12/13/2022 | | | 288,843 | | | | 501,163,484 | | | | 31,222,391 | | |
Total return of
Russell 2000® Index | | 2.7900% representing
1 month SOFR rate + spread | | Bank of America
Merrill Lynch | | 12/13/2022 | | | 376,783 | | | | 659,950,141 | | | | 35,014,630 | | |
Total return of
Russell 2000® Index | | 3.6500% representing
1 month SOFR rate + spread | | UBS Securities LLC | | 12/14/2022 | | | 187,823 | | | | 322,519,044 | | | | 23,326,310 | | |
Total return of
Russell 2000® Index | | 3.3800% representing
1 month SOFR rate + spread | | BNP Paribas | | 12/15/2022 | | | 309,782 | | | | 560,385,859 | | | | 9,803,049 | | |
| | | | | | | | | | | $ | 2,753,505,244 | | | $ | 115,088,519 | | |
The accompanying notes are an integral part of these financial statements.
DIREXION ANNUAL REPORT
69
Direxion Daily Small Cap Bear 3X Shares
Schedule of Investments
October 31, 2022
Shares | | | | Fair Value | |
SHORT TERM INVESTMENTS - 105.0% | | | |
Money Market Funds - 105.0% | | | |
| | 359,595,629 | | | Dreyfus Government Cash
Management Institutional
Shares, 2.91% (a) | | $ | 359,595,629 | | |
| | 54,630,000 | | | Goldman Sachs Financial
Square Government Fund
Institutional Shares,
3.07% (a) | | | 54,630,000 | | |
| | 160,166,049 | | | Goldman Sachs Financial
Square Treasury Instruments
Fund Institutional Shares,
3.10% (a) | | | 160,166,049 | | |
| | | | | TOTAL SHORT TERM
INVESTMENTS
(Cost $574,391,678) (b) | | $ | 574,391,678 | | |
| | | | | TOTAL INVESTMENTS
(Cost $574,391,678) -
105.0% | | $ | 574,391,678 | | |
| | | | | Liabilities in Excess of
Other Assets - (5.0)% | | | (27,226,513 | ) | |
| | | | | TOTAL NET ASSETS - 100.0% | | $ | 547,165,165 | | |
Percentages are stated as a percent of net assets.
The geographic location of all investments is United States unless otherwise indicated.
(a) Represents annualized seven-day yield at October 31, 2022.
(b) All or a portion of these securities have been segregated as collateral for swap contracts. Total value of securities segregated amounted to $331,195,685.
Short Total Return Swap Contracts
October 31, 2022
Terms of Payments
to be Received at
Termination | | Terms of Payments
to be Paid at
Termination | | Counterparty | | Termination
Date | | Contracts | | Notional
Amount | | Unrealized
Appreciation
(Depreciation) | |
3.0400% representing 1 month
SOFR rate + spread | | Total return of
Russell 2000® Index | | J.P. Morgan | | 12/6/2022 | | | 83,806 | | | $ | 153,519,848 | | | $ | (926,559 | ) | |
2.9900% representing 1 month
SOFR rate + spread | | Total return of
Russell 2000® Index | | Citibank N.A. | | 12/13/2022 | | | 211,911 | | | | 391,951,647 | | | | 1,382,280 | | |
2.5900% representing 1 month
SOFR rate + spread | | Total return of
Russell 2000® Index | | Bank of America
Merrill Lynch | | 12/13/2022 | | | 150,576 | | | | 270,078,039 | | | | (7,724,980 | ) | |
3.3100% representing 1 month
SOFR rate + spread | | Total return of
Russell 2000® Index | | UBS Securities LLC | | 12/14/2022 | | | 132,301 | | | | 231,632,440 | | | | (12,245,805 | ) | |
3.1800% representing 1 month
SOFR rate + spread | | Total return of
Russell 2000® Index | | BNP Paribas | | 12/15/2022 | | | 187,854 | | | | 346,674,065 | | | | 662,785 | | |
2.9900% representing 1 month
SOFR rate + spread | | Total return of
Russell 2000® Index | | Barclays | | 10/18/2023 | | | 122,345 | | | | 214,216,367 | | | | (11,471,112 | ) | |
| | | | | | | | | | | $ | 1,608,072,406 | | | $ | (30,323,391 | ) | |
The accompanying notes are an integral part of these financial statements.
DIREXION ANNUAL REPORT
70
Direxion Daily FTSE China Bull 3X Shares
Schedule of Investments
October 31, 2022
Shares | | | | Fair Value | |
INVESTMENT COMPANIES - 68.3% | | | |
| | 7,087,127 | | | iShares China Large-Cap ETF (a) | | $ | 148,475,311 | | |
| | | | | TOTAL INVESTMENT
COMPANIES
(Cost $177,421,335) | | $ | 148,475,311 | | |
SHORT TERM INVESTMENTS - 121.0% | | | |
Money Market Funds - 121.0% | | | |
| | 191,577,340 | | | Dreyfus Government Cash
Management Institutional
Shares, 2.91% (b) | | $ | 191,577,340 | | |
| | 22,310,000 | | | Goldman Sachs Financial
Square Government Fund
Institutional Shares,
3.07% (b) | | | 22,310,000 | | |
| | 49,196,104 | | | Goldman Sachs Financial
Square Treasury
Instruments Fund
Institutional Shares,
3.10% (b) | | | 49,196,104 | | |
| | | | | TOTAL SHORT TERM
INVESTMENTS
(Cost $263,083,444) | | $ | 263,083,444 | | |
| | | | | TOTAL INVESTMENTS
(Cost $440,504,779) -
189.3% (c) | | $ | 411,558,755 | | |
| | | | | Liabilities in Excess of
Other Assets - (89.3)% | | | (194,201,513 | ) | |
| | | | | TOTAL NET ASSETS - 100.0% | | $ | 217,357,242 | | |
Percentages are stated as a percent of net assets.
The geographic location of all investments is United States unless otherwise indicated.
(a) Shareholders may obtain the financial statements of these investment companies at www.sec.gov.
(b) Represents annualized seven-day yield at October 31, 2022.
(c) All or a portion of these securities have been segregated as collateral for swap contracts. Total value of securities segregated amounted to $327,317,308.
Long Total Return Swap Contracts
October 31, 2022
Terms of Payments
to be Received at
Termination | | Terms of Payments
to be Paid at
Termination | | Counterparty | | Termination
Date | | Contracts | | Notional
Amount | | Unrealized
Depreciation | |
Total return of iShares
China Large-Cap ETF | | 3.7900% representing
1 month SOFR rate + spread | | Barclays | | 12/7/2022 | | | 3,239,594 | | | $ | 91,586,775 | | | $ | (24,238,986 | ) | |
Total return of iShares
China Large-Cap ETF | | 3.5400% representing
1 month SOFR rate + spread | | Bank of America
Merrill Lynch | | 12/13/2022 | | | 6,526,688 | | | | 177,293,625 | | | | (41,234,531 | ) | |
Total return of iShares
China Large-Cap ETF | | 3.3200% representing
1 month SOFR rate + spread | | UBS Securities LLC | | 12/14/2022 | | | 10,572,930 | | | | 259,867,981 | | | | (38,833,464 | ) | |
Total return of iShares
China Large-Cap ETF | | 3.4300% representing
1 month SOFR rate + spread | | BNP Paribas | | 12/15/2022 | | | 3,699,548 | | | | 123,929,990 | | | | (47,741,555 | ) | |
| | | | | | | | | | | $ | 652,678,371 | | | $ | (152,048,536 | ) | |
The accompanying notes are an integral part of these financial statements.
DIREXION ANNUAL REPORT
71
Direxion Daily FTSE China Bear 3X Shares
Schedule of Investments
October 31, 2022
Shares | | | | Fair Value | |
SHORT TERM INVESTMENTS - 106.8% | | | |
Money Market Funds - 106.8% | | | |
| | 136,290,030 | | | Dreyfus Government Cash
Management Institutional
Shares, 2.91% (a) | | $ | 136,290,030 | | |
| | 14,810,000 | | | Dreyfus Treasury Securities
Cash Management
Institutional Shares,
3.01% (a) | | | 14,810,000 | | |
| | 29,401,321 | | | Goldman Sachs Financial
Square Treasury Instruments
Fund Institutional Shares,
3.10% (a) | | | 29,401,321 | | |
| | | | | TOTAL SHORT TERM
INVESTMENTS
(Cost $180,501,351) (b) | | $ | 180,501,351 | | |
| | | | | TOTAL INVESTMENTS
(Cost $180,501,351) -
106.8% | | $ | 180,501,351 | | |
| | | | | Liabilities in Excess of
Other Assets - (6.8)% | | | (11,553,297 | ) | |
| | | | | TOTAL NET ASSETS - 100.0% | | $ | 168,948,054 | | |
Percentages are stated as a percent of net assets.
The geographic location of all investments is United States unless otherwise indicated.
(a) Represents annualized seven-day yield at October 31, 2022.
(b) All or a portion of these securities have been segregated as collateral for swap contracts. Total value of securities segregated amounted to $117,126,620.
Short Total Return Swap Contracts
October 31, 2022
Terms of Payments
to be Received at
Termination | | Terms of Payments
to be Paid at
Termination | | Counterparty | | Termination
Date | | Contracts | | Notional
Amount | | Unrealized
Appreciation | |
3.3400% representing 1 month
SOFR rate + spread | | Total return of iShares
China Large-Cap ETF | | Bank of America
Merrill Lynch | | 12/13/2022 | | | 3,618,911 | | | $ | 116,420,366 | | | $ | 41,576,669 | | |
2.5400% representing 1 month
SOFR rate + spread | | Total return of iShares
China Large-Cap ETF | | Goldman Sachs | | 11/27/2023 | | | 3,000,000 | | | | 64,580,312 | | | | 1,762,028 | | |
3.0500% representing 1 month
SOFR rate + spread | | Total return of iShares
China Large-Cap ETF | | UBS Securities LLC | | 12/13/2023 | | | 13,125,641 | | | | 282,595,051 | | | | 7,784,629 | | |
3.0400% representing 1 month
SOFR rate + spread | | Total return of iShares
China Large-Cap ETF | | BNP Paribas | | 10/28/2024 | | | 4,449,859 | | | | 96,191,664 | | | | 2,990,101 | | |
| | | | | | | | | | | $ | 559,787,393 | | | $ | 54,113,427 | | |
The accompanying notes are an integral part of these financial statements.
DIREXION ANNUAL REPORT
72
Direxion Daily FTSE Europe Bull 3X Shares
Schedule of Investments
October 31, 2022
Shares | | | | Fair Value | |
INVESTMENT COMPANIES - 35.6% | | | |
| | 127,862 | | | Vanguard FTSE Europe ETF (a)(b) | | $ | 6,398,215 | | |
| | | | | TOTAL INVESTMENT
COMPANIES
(Cost $7,175,989) | | $ | 6,398,215 | | |
SHORT TERM INVESTMENTS - 93.6% | | | |
Money Market Funds - 93.6% | | | |
| | 11,256,243 | | | Dreyfus Government Cash
Management Institutional
Shares, 2.91% (c)(d) | | $ | 11,256,243 | | |
| | 980,242 | | | Dreyfus Treasury Securities
Cash Management
Institutional Shares, 3.01% (c) | | | 980,242 | | |
| | 4,578,883 | | | Goldman Sachs Financial
Square Treasury Instruments
Fund Institutional Shares,
3.10% (c) | | | 4,578,883 | | |
| | | | | TOTAL SHORT TERM
INVESTMENTS
(Cost $16,815,368) | | $ | 16,815,368 | | |
| | | | | TOTAL INVESTMENTS
(Cost $23,991,357) -
129.2% (e) | | $ | 23,213,583 | | |
| | | | | Liabilities in Excess of
Other Assets - (29.2)% | | | (5,248,395 | ) | |
| | | | | TOTAL NET ASSETS - 100.0% | | $ | 17,965,188 | | |
Percentages are stated as a percent of net assets.
The geographic location of all investments is United States unless otherwise indicated.
(a) Shareholders may obtain the financial statements of these investment companies at www.sec.gov.
(b) A portion of this security represents a security on loan.
(c) Represents annualized seven-day yield at October 31, 2022.
(d) All or a portion of this security represents an investment of securities lending collateral.
(e) All or a portion of these securities have been segregated as collateral for swap contracts. Total value of securities segregated amounted to $12,267,696.
Long Total Return Swap Contracts
October 31, 2022
Terms of Payments
to be Received at
Termination | | Terms of Payments
to be Paid at
Termination | | Counterparty | | Termination
Date | | Contracts | | Notional
Amount | | Unrealized
Appreciation
(Depreciation) | |
Total return of Vanguard
FTSE Europe ETF | | 3.4900% representing
1 month SOFR rate + spread | | J.P. Morgan | | 12/6/2022 | | | 221,881 | | | $ | 10,371,416 | | | $ | 705,399 | | |
Total return of Vanguard
FTSE Europe ETF | | 3.5400% representing
1 month SOFR rate + spread | | Citibank N.A. | | 12/13/2022 | | | 236,696 | | | | 13,093,887 | | | | (1,187,780 | ) | |
Total return of Vanguard
FTSE Europe ETF | | 3.7800% representing
1 month SOFR rate + spread | | UBS Securities LLC | | 12/14/2022 | | | 150,748 | | | | 7,842,907 | | | | (332,143 | ) | |
Total return of Vanguard
FTSE Europe ETF | | 3.3300% representing
1 month SOFR rate + spread | | BNP Paribas | | 12/15/2022 | | | 240,935 | | | | 12,419,084 | | | | (402,487 | ) | |
Total return of Vanguard
FTSE Europe ETF | | 3.0400% representing
1 month SOFR rate + spread | | Goldman Sachs | | 10/23/2023 | | | 98,944 | | | | 4,885,734 | | | | 51,891 | | |
| | | | | | | | | | | $ | 48,613,028 | | | $ | (1,165,120 | ) | |
The accompanying notes are an integral part of these financial statements.
DIREXION ANNUAL REPORT
73
Direxion Daily MSCI Emerging Markets Bull 3X Shares
Schedule of Investments
October 31, 2022
Shares | | | | Fair Value | |
INVESTMENT COMPANIES - 5.0% | | | |
| | 72,233 | | | iShares MSCI Emerging
Markets ETF (a) | | $ | 2,469,646 | | |
| | | | | TOTAL INVESTMENT
COMPANIES
(Cost $2,826,731) | | $ | 2,469,646 | | |
SHORT TERM INVESTMENTS - 140.0% | | | |
Money Market Funds - 140.0% | | | |
| | 28,860,054 | | | Dreyfus Government Cash
Management Institutional
Shares, 2.91% (b) | | $ | 28,860,054 | | |
| | 40,248,686 | | | Goldman Sachs Financial
Square Treasury Instruments
Fund Institutional Shares,
3.10% (b) | | | 40,248,686 | | |
| | 130 | | | JPMorgan 100%
U.S. Treasury Securities
Money Market Fund
Institutional Shares,
2.98% (b) | | | 130 | | |
| | | | | TOTAL SHORT TERM
INVESTMENTS
(Cost $69,108,870) | | $ | 69,108,870 | | |
| | | | | TOTAL INVESTMENTS
(Cost $71,935,601) -
145.0% (c) | | $ | 71,578,516 | | |
| | | | | Liabilities in Excess of
Other Assets - (45.0)% | | | (22,211,453 | ) | |
| | | | | TOTAL NET ASSETS - 100.0% | | $ | 49,367,063 | | |
Percentages are stated as a percent of net assets.
The geographic location of all investments is United States unless otherwise indicated.
(a) Shareholders may obtain the financial statements of these investment companies at www.sec.gov.
(b) Represents annualized seven-day yield at October 31, 2022.
(c) All or a portion of these securities have been segregated as collateral for swap contracts. Total value of securities segregated amounted to $51,042,476.
Long Total Return Swap Contracts
October 31, 2022
Terms of Payments
to be Received at
Termination | | Terms of Payments
to be Paid at
Termination | | Counterparty | | Termination
Date | | Contracts | | Notional
Amount | | Unrealized
Depreciation | |
Total return of iShares
MSCI Emerging
Markets ETF | |
3.3900% representing
1 month SOFR rate + spread | | J.P. Morgan | | 12/6/2022 | | | 2,568,624 | | | $ | 99,044,447 | | | $ | (11,611,398 | ) | |
Total return of iShares
MSCI Emerging
Markets ETF | |
3.3500% representing
1 month SOFR rate + spread | | Citibank N.A. | | 12/13/2022 | | | 500,000 | | | | 24,614,922 | | | | (7,637,060 | ) | |
Total return of iShares
MSCI Emerging
Markets ETF | |
3.3700% representing
1 month SOFR rate + spread | | UBS
Securities LLC | | 12/14/2022 | | | 1,190,872 | | | | 43,536,145 | | | | (2,919,844 | ) | |
| | | | | | | | | | | $ | 167,195,514 | | | $ | (22,168,302 | ) | |
The accompanying notes are an integral part of these financial statements.
DIREXION ANNUAL REPORT
74
Direxion Daily MSCI Emerging Markets Bear 3X Shares
Schedule of Investments
October 31, 2022
Shares | | | | Fair Value | |
SHORT TERM INVESTMENTS - 100.7% | |
Money Market Funds - 100.7% | |
| | 37,950,770 | | | Dreyfus Government Cash
Management Institutional
Shares, 2.91% (a) | | $ | 37,950,770 | | |
| | 18,913,282 | | | Goldman Sachs Financial
Square Treasury Instruments
Fund Institutional Shares,
3.10% (a) | | | 18,913,282 | | |
| | | TOTAL SHORT TERM
INVESTMENTS
(Cost $56,864,052) (b) | | $ | 56,864,052 | | |
| | | TOTAL INVESTMENTS
(Cost $56,864,052) - 100.7% | | $ | 56,864,052 | | |
| | | Liabilities in Excess of
Other Assets - (0.7)% | | | (410,889 | ) | |
| | | TOTAL NET ASSETS - 100.0% | | $ | 56,453,163 | | |
Percentages are stated as a percent of net assets.
The geographic location of all investments is United States unless otherwise indicated.
(a) Represents annualized seven-day yield at October 31, 2022.
(b) All or a portion of these securities have been segregated as collateral for swap contracts. Total value of securities segregated amounted to $30,086,014.
Short Total Return Swap Contracts
October 31, 2022
Terms of Payments
to be Received at
Termination | | Terms of Payments
to be Paid at
Termination | | Counterparty | | Termination
Date | | Contracts | | Notional
Amount | | Unrealized
Appreciation | |
3.0400% representing
1 month SOFR rate + spread | | Total return of iShares
MSCI Emerging Markets ETF | | Citibank N.A. | | 12/13/2022 | | | 500,000 | | | $ | 25,040,000 | | | $ | 7,641,378 | | |
2.7400% representing
1 month SOFR rate + spread | | Total return of iShares
MSCI Emerging Markets ETF | | J.P. Morgan | | 10/16/2023 | | | 2,221,480 | | | | 81,950,397 | | | | 6,272,431 | | |
3.0200% representing
1 month SOFR rate + spread | | Total return of iShares
MSCI Emerging Markets ETF | | UBS Securities
LLC | | 12/13/2023 | | | 2,232,072 | | | | 76,494,641 | | | | 278,960 | | |
| | | | | | | | | | | | | $ | 183,485,038 | | | $ | 14,192,769 | | |
The accompanying notes are an integral part of these financial statements.
DIREXION ANNUAL REPORT
75
Direxion Daily MSCI Mexico Bull 3X Shares
Schedule of Investments
October 31, 2022
Shares | | | | Fair Value | |
INVESTMENT COMPANIES - 35.7% | | | |
| | 82,328 | | | iShares MSCI Mexico ETF (a) | | $ | 4,163,327 | | |
| | | | | TOTAL INVESTMENT
COMPANIES
(Cost $3,989,723) | | $ | 4,163,327 | | |
SHORT TERM INVESTMENTS - 58.8% | | | |
Money Market Funds - 58.8% | | | |
| | 4,896,314 | | | Dreyfus Government Cash
Management Institutional
Shares, 2.91% (b) | | $ | 4,896,314 | | |
| | 1,640,000 | | | Goldman Sachs Financial
Square Government Fund
Institutional Shares,
3.07% (b) | | | 1,640,000 | | |
| | 310,001 | | | Goldman Sachs Financial
Square Treasury Instruments
Fund Institutional Shares,
3.10% (b) | | | 310,001 | | |
| | | | | TOTAL SHORT TERM
INVESTMENTS
(Cost $6,846,315) | | $ | 6,846,315 | | |
| | | | | TOTAL INVESTMENTS
(Cost $10,836,038) - 94.5% (c) | | $ | 11,009,642 | | |
| | | | | Other Assets in Excess of
Liabilities - 5.5% | | | 639,976 | | |
| | | | | TOTAL NET ASSETS - 100.0% | | $ | 11,649,618 | | |
Percentages are stated as a percent of net assets.
The geographic location of all investments is United States unless otherwise indicated.
(a) Shareholders may obtain the financial statements of these investment companies at www.sec.gov.
(b) Represents annualized seven-day yield at October 31, 2022.
(c) All or a portion of these securities have been segregated as collateral for swap contracts. Total value of securities segregated amounted to $4,745,023.
Long Total Return Swap Contracts
October 31, 2022
Terms of Payments
to be Received at
Termination | | Terms of Payments
to be Paid at
Termination | | Counterparty | | Termination
Date | | Contracts | | Notional
Amount | | Unrealized
Appreciation | |
Total return of iShares
MSCI Mexico ETF | | 3.5900% representing
1 month SOFR rate + spread | | UBS Securities LLC | | 12/14/2022 | | | 366,501 | | | $ | 16,757,484 | | | $ | 1,711,108 | | |
Total return of iShares
MSCI Mexico ETF | | 3.7900% representing
1 month SOFR rate + spread | | Barclays | | 9/27/2023 | | | 157,905 | | | | 7,129,634 | | | | 836,170 | | |
Total return of iShares
MSCI Mexico ETF | | 2.5400% representing
1 month SOFR rate + spread | | J.P. Morgan | | 12/6/2023 | | | 84,376 | | | | 4,162,803 | | | | 102,965 | | |
| | | | | | | | | | | $ | 28,049,921 | | | $ | 2,650,243 | | |
The accompanying notes are an integral part of these financial statements.
DIREXION ANNUAL REPORT
76
Direxion Daily MSCI South Korea Bull 3X Shares
Schedule of Investments
October 31, 2022
Shares | | | | Fair Value | |
INVESTMENT COMPANIES - 43.7% | | | |
| | 169,676 | | | iShares MSCI South Korea ETF (a) | | $ | 8,790,914 | | |
| | | | | TOTAL INVESTMENT
COMPANIES
(Cost $9,190,100) | | $ | 8,790,914 | | |
SHORT TERM INVESTMENTS - 63.6% | | | |
Money Market Funds - 63.6% | | | |
| | 4,160,339 | | | Dreyfus Government Cash
Management Institutional
Shares, 2.91% (b) | | $ | 4,160,339 | | |
| | 8,610,974 | | | Goldman Sachs Financial
Square Treasury Instruments
Fund Institutional Shares,
3.10% (b) | | | 8,610,974 | | |
| | | | | TOTAL SHORT TERM
INVESTMENTS
(Cost $12,771,313) | | $ | 12,771,313 | | |
| | | | | TOTAL INVESTMENTS
(Cost $21,961,413) -
107.3% (c) | | $ | 21,562,227 | | |
| | | | | Liabilities in Excess of
Other Assets - (7.3)% | | | (1,468,328 | ) | |
| | | | | TOTAL NET ASSETS - 100.0% | | $ | 20,093,899 | | |
Percentages are stated as a percent of net assets.
The geographic location of all investments is United States unless otherwise indicated.
(a) Shareholders may obtain the financial statements of these investment companies at www.sec.gov.
(b) Represents annualized seven-day yield at October 31, 2022.
(c) All or a portion of these securities have been segregated as collateral for swap contracts. Total value of securities segregated amounted to $15,219,289.
Long Total Return Swap Contracts
October 31, 2022
Terms of Payments
to be Received at
Termination | | Terms of Payments
to be Paid at
Termination | | Counterparty | | Termination
Date | | Contracts | | Notional
Amount | | Unrealized
Depreciation | |
Total return of iShares
MSCI South Korea ETF | | 3.4900% representing
1 month SOFR rate + spread | | J.P. Morgan | | 12/6/2022 | | | 461,461 | | | $ | 24,332,047 | | | $ | (548,253 | ) | |
Total return of iShares
MSCI South Korea ETF | | 3.4900% representing
1 month SOFR rate + spread | | Citibank N.A. | | 12/13/2022 | | | 525,336 | | | | 28,016,563 | | | | (888,675 | ) | |
Total return of iShares
MSCI South Korea ETF | | 3.5400% representing
1 month SOFR rate + spread | | Bank of America
Merrill Lynch | | 12/13/2022 | | | 7,042 | | | | 400,418 | | | | (39,030 | ) | |
| | | | | | | | | | | $ | 52,749,028 | | | $ | (1,475,958 | ) | |
The accompanying notes are an integral part of these financial statements.
DIREXION ANNUAL REPORT
77
Direxion Daily Aerospace & Defense Bull 3X Shares
Schedule of Investments
October 31, 2022
Shares | | | | Fair Value | |
COMMON STOCKS - 63.0% | | | |
Computer and Electronic Product
Manufacturing - 20.9% | | | |
| | 28,830 | | | Aerojet Rocketdyne Holdings,
Inc. (a) | | $ | 1,396,813 | | |
| | 22,358 | | | L3 Harris Technologies, Inc. | | | 5,510,576 | | |
| | 21,990 | | | Mercury Computer Systems, Inc. (a) | | | 1,064,316 | | |
| | 11,041 | | | Moog, Inc. Class A | | | 935,725 | | |
| | 10,690 | | | Northrop Grumman Corp. | | | 5,868,917 | | |
| | 272,702 | | | Raytheon Technologies Corp. | | | 25,857,604 | | |
| | | | 40,633,951 | | |
Credit Intermediation and Related Activities - 0.1% | | | |
| | 17,450 | | | Smith & Wesson Brands, Inc. | | | 197,011 | | |
Electrical Equipment, Appliance, and Component
Manufacturing - 1.9% | | | |
| | 25,745 | | | Axon Enterprise, Inc. (a) | | | 3,744,353 | | |
Fabricated Metal Product Manufacturing - 3.9% | | | |
| | 34,777 | | | BWX Technologies, Inc. | | | 1,981,593 | | |
| | 14,640 | | | Curtiss-Wright Corp. | | | 2,457,031 | | |
| | 11,030 | | | RBC Bearings, Inc. (a) | | | 2,796,436 | | |
| | 6,738 | | | Sturm, Ruger & Co, Inc. | | | 378,204 | | |
| | | | 7,613,264 | | |
Merchant Wholesalers, Durable Goods - 3.1% | | | |
| | 32,070 | | | Hexcel Corp. | | | 1,786,299 | | |
| | 15,233 | | | Huntington Ingalls Industries, Inc. | | | 3,915,947 | | |
| | 10,679 | | | Kaman Corp. | | | 342,796 | | |
| | | | 6,045,042 | | |
Miscellaneous Manufacturing - 2.8% | | | |
| | 80,653 | | | Textron, Inc. | | | 5,519,891 | | |
Primary Metal Manufacturing - 2.6% | | | |
| | 140,959 | | | Howmet Aerospace, Inc. (a) | | | 5,011,092 | | |
Professional, Scientific, and Technical Services - 0.6% | | | |
| | 28,293 | | | Maxar Technologies, Inc. | | | 632,065 | | |
| | 12,636 | | | Parsons Corp. (a) | | | 592,376 | | |
| | | | 1,224,441 | | |
Securities, Commodity Contracts, and Other Financial
Investments and Related Activities - 0.4% | | | |
| | 82,263 | | | Rocket Lab USA, Inc. (a) | | | 418,719 | | |
| | 85,821 | | | Virgin Galactic Holdings, Inc. (a)(b) | | | 396,493 | | |
| | | | 815,212 | | |
Textile Mills - 0.1% | | | |
| | 1,937 | | | National Presto Industries, Inc. | | | 136,539 | | |
Transportation Equipment Manufacturing - 26.6% | | | |
| | 12,826 | | | AAR Corp. (a) | | | 568,448 | | |
| | 9,527 | | | AeroVironment, Inc. (a) | | | 871,721 | | |
| | 53,189 | | | Archer Aviation, Inc. (a) | | | 151,589 | | |
| | 63,932 | | | Boeing Co. (a) | | | 9,110,949 | | |
| | 22,889 | | | General Dynamics Corp. | | | 5,717,672 | | |
| | 24,520 | | | HEICO Corp. | | | 3,121,396 | | |
| | 14,093 | | | HEICO Corp. Class A | | | 2,292,086 | | |
| | 48,019 | | | Kratos Defense & Security
Solutions, Inc. (a) | | | 532,051 | | |
| | 43,583 | | | Lockheed Martin Corp. | | | 21,210,974 | | |
| | 40,087 | | | Spirit AeroSystems Holdings, Inc. | | | 928,415 | | |
Shares | | | | Fair Value | |
Transportation Equipment Manufacturing (continued) | | | |
| | 8,478 | | | TransDigm Group, Inc. | | $ | 4,881,293 | | |
| | 24,769 | | | Triumph Group, Inc. (a) | | | 224,159 | | |
| | 22,938 | | | Woodward, Inc. | | | 2,103,415 | | |
| | | | 51,714,168 | | |
| | | | | TOTAL COMMON STOCKS
(Cost $117,874,352) | | $ | 122,654,964 | | |
SHORT TERM INVESTMENTS - 37.8% | | | |
Money Market Funds - 37.8% | | | |
| | 29,805,961 | | | Dreyfus Government Cash
Management Institutional
Shares, 2.91% (c)(d) | | $ | 29,805,961 | | |
| | 1 | | | Goldman Sachs Financial
Square Government Fund
Institutional Shares, 3.07% (c) | | | 1 | | |
| | 43,911,062 | | | Goldman Sachs Financial Square
Treasury Instruments Fund
Institutional Shares, 3.10% (c) | | | 43,911,062 | | |
| | | | | TOTAL SHORT TERM
INVESTMENTS
(Cost $73,717,024) | | $ | 73,717,024 | | |
| | | | | TOTAL INVESTMENTS
(Cost $191,591,376) -
100.8% (e) | | $ | 196,371,988 | | |
| | | | | Liabilities in Excess of
Other Assets - (0.8)% | | | (1,591,833 | ) | |
| | | | | TOTAL NET ASSETS - 100.0% | | $ | 194,780,155 | | |
Percentages are stated as a percent of net assets.
The geographic location of all investments is United States unless otherwise indicated.
(a) Non-income producing security.
(b) A portion of this security represents a security on loan.
(c) Represents annualized seven-day yield at October 31, 2022.
(d) All or a portion of this security represents an investment of securities lending collateral.
(e) All or a portion of these securities have been segregated as collateral for swap contracts. Total value of securities segregated amounted to $128,152,404.
The accompanying notes are an integral part of these financial statements.
DIREXION ANNUAL REPORT
78
Direxion Daily Aerospace & Defense Bull 3X Shares
Long Total Return Swap Contracts
October 31, 2022
Terms of Payments
to be Received at
Termination | | Terms of Payments
to be Paid at
Termination | | Counterparty | | Termination
Date | | Contracts | | Notional
Amount | | Unrealized
Appreciation | |
Total return of Dow Jones
U.S. Select Aerospace &
Defense Index | |
3.4900% representing
1 month SOFR rate + spread | | J.P. Morgan | | 12/6/2022 | | | 7,490 | | | $ | 183,466,824 | | | $ | 18,785,726 | | |
Total return of Dow Jones
U.S. Select Aerospace &
Defense Index | |
3.4900% representing
1 month SOFR rate + spread | | Citibank N.A. | | 12/13/2022 | | | 6,356 | | | | 153,435,087 | | | | 18,555,294 | | |
Total return of Dow Jones
U.S. Select Aerospace &
Defense Index | |
3.8300% representing
1 month SOFR rate + spread | | BNP Paribas | | 12/15/2022 | | | 3,183 | | | | 82,777,524 | | | | 3,305,404 | | |
| | | | | | | | | | | $ | 419,679,435 | | | $ | 40,646,424 | | |
The accompanying notes are an integral part of these financial statements.
DIREXION ANNUAL REPORT
79
Direxion Daily Consumer Discretionary Bull 3X Shares
Schedule of Investments
October 31, 2022
Shares | | | | Fair Value | |
COMMON STOCKS - 78.9% | | | |
Accommodation - 3.0% | | | |
| | 1,401 | | | Caesars Entertainment Inc. (a) | | $ | 61,266 | | |
| | 1,792 | | | Hilton Worldwide Holdings, Inc. | | | 242,386 | | |
| | 2,146 | | | Las Vegas Sands Corp. (a) | | | 81,569 | | |
| | 1,803 | | | Marriott International, Inc. Class A | | | 288,678 | | |
| | 2,133 | | | MGM Resorts International | | | 75,871 | | |
| | | | 749,770 | | |
Administrative and Support Services - 2.0% | | | |
| | 260 | | | Booking Holdings, Inc. (a) | | | 486,065 | | |
Amusement, Gambling, and Recreation Industries - 0.2% | | | |
| | 676 | | | Wynn Resorts Ltd. (a) | | | 43,196 | | |
Apparel Manufacturing - 0.4% | | | |
| | 281 | | | Ralph Lauren Corp. | | | 26,046 | | |
| | 2,158 | | | VF Corp. | | | 60,963 | | |
| | | | 87,009 | | |
Building Material and Garden Equipment and Supplies Dealers - 7.3% | | | |
| | 4,177 | | | Lowe's Companies, Inc. | | | 814,306 | | |
| | 3,318 | | | The Home Depot, Inc. | | | 982,560 | | |
| | | | 1,796,866 | | |
Clothing and Clothing Accessories Stores - 3.3% | | | |
| | 1,491 | | | Bath & Body Works, Inc. | | | 49,769 | | |
| | 2,287 | | | Ross Stores, Inc. | | | 218,843 | | |
| | 7,657 | | | TJX Companies, Inc. | | | 552,070 | | |
| | | | 820,682 | | |
Construction of Buildings - 1.8% | | | |
| | 2,066 | | | D.R. Horton, Inc. | | | 158,834 | | |
| | 1,666 | | | Lennar Corp. Class A | | | 134,446 | | |
| | 20 | | | NVR, Inc. (a) | | | 84,755 | | |
| | 1,514 | | | PulteGroup, Inc. | | | 60,545 | | |
| | | | 438,580 | | |
Electrical Equipment, Appliance, and Component Manufacturing - 0.2% | | | |
| | 356 | | | Whirlpool Corp. | | | 49,213 | | |
Electronics and Appliance Stores - 0.4% | | | |
| | 1,310 | | | Best Buy Co., Inc. | | | 89,617 | | |
Food Services and Drinking Places - 9.7% | | | |
| | 182 | | | Chipotle Mexican Grill, Inc. (a) | | | 272,696 | | |
| | 801 | | | Darden Restaurants, Inc. | | | 114,655 | | |
| | 235 | | | Domino's Pizza, Inc. (a) | | | 78,076 | | |
| | 3,833 | | | McDonald's Corp. | | | 1,045,106 | | |
| | 7,499 | | | Starbucks Corp. | | | 649,339 | | |
| | 1,859 | | | Yum! Brands, Inc. | | | 219,827 | | |
| | | | 2,379,699 | | |
Funds, Trusts, and Other Financial Vehicles - 0.4% | | | |
| | 1,008 | | | Garmin Ltd. ADR (Switzerland) | | | 88,744 | | |
General Merchandise Stores - 4.4% | | | |
| | 1,484 | | | Dollar General Corp. | | | 378,494 | | |
| | 1,379 | | | Dollar Tree, Inc. (a) | | | 218,571 | | |
| | 3,030 | | | Target Corp. | | | 497,678 | | |
| | | | 1,094,743 | | |
Shares | | | | Fair Value | |
Health and Personal Care Stores - 0.6% | | | |
| | 338 | | | Ulta Salon, Cosmetics &
Fragrance, Inc. (a) | | $ | 141,747 | | |
Leather and Allied Product Manufacturing - 3.3% | | | |
| | 8,258 | | | NIKE, Inc. Class B | | | 765,352 | | |
| | 1,646 | | | Tapestry, Inc. | | | 52,145 | | |
| | | | 817,497 | | |
Management of Companies and Enterprises - 0.4% | | | |
| | 6,451 | | | Carnival Corp. ADR (Panama) (a) | | | 58,446 | | |
| | 2,754 | | | Norwegian Cruise Line
Holdings Ltd. ADR (a) | | | 46,515 | | |
| | | | 104,961 | | |
Merchant Wholesalers, Durable Goods - 0.8% | | | |
| | 1,704 | | | LKQ Corp. | | | 94,810 | | |
| | 345 | | | Mohawk Industries, Inc. (a) | | | 32,689 | | |
| | 259 | | | Pool Corp. | | | 78,796 | | |
| | | | 206,295 | | |
Miscellaneous Manufacturing - 0.2% | | | |
| | 848 | | | Hasbro, Inc. | | | 55,332 | | |
Miscellaneous Store Retailers - 0.6% | | | |
| | 725 | | | Tractor Supply Co. | | | 159,333 | | |
Motor Vehicle and Parts Dealers - 3.3% | | | |
| | 396 | | | Advance Auto Parts, Inc. | | | 75,208 | | |
| | 127 | | | AutoZone, Inc. (a) | | | 321,676 | | |
| | 1,040 | | | CarMax, Inc. (a) | | | 65,530 | | |
| | 416 | | | O'Reilly Automotive, Inc. (a) | | | 348,263 | | |
| | | | 810,677 | | |
Nonstore Retailers - 16.7% | | | |
| | 38,145 | | | Amazon.com, Inc. (a) | | | 3,907,574 | | |
| | 3,590 | | | eBay, Inc. | | | 143,026 | | |
| | 828 | | | Etsy, Inc. (a) | | | 77,757 | | |
| | | | 4,128,357 | | |
Plastics and Rubber Products Manufacturing - 0.1% | | | |
| | 2,460 | | | Newell Rubbermaid, Inc. | | | 33,973 | | |
Support Activities for Transportation - 0.4% | | | |
| | 993 | | | Expedia, Inc. (a) | | | 92,816 | | |
Transportation Equipment Manufacturing - 18.4% | | | |
| | 1,770 | | | Aptiv PLC ADR (United Kingdom) (a) | | | 161,194 | | |
| | 1,548 | | | BorgWarner, Inc. | | | 58,097 | | |
| | 25,811 | | | Ford Motor Co. | | | 345,093 | | |
| | 9,529 | | | General Motors Co. | | | 374,013 | | |
| | 15,774 | | | Tesla Motors, Inc. (a) | | | 3,589,216 | | |
| | | | 4,527,613 | | |
Water Transportation - 0.3% | | | |
| | 1,434 | | | Royal Caribbean Cruises Ltd.
ADR (Liberia) (a) | | | 76,547 | | |
Wholesale Electronic Markets and Agents
and Brokers - 0.7% | | | |
| | 924 | | | Genuine Parts Co. | | | 164,343 | | |
| | | | | TOTAL COMMON STOCKS
(Cost $21,036,000) | | $ | 19,443,675 | | |
The accompanying notes are an integral part of these financial statements.
DIREXION ANNUAL REPORT
80
Direxion Daily Consumer Discretionary Bull 3X Shares
Schedule of Investments, continued
October 31, 2022
Shares | | | | Fair Value | |
SHORT TERM INVESTMENTS - 24.8% | |
Money Market Funds - 24.8% | |
| | 5,165,616 | | | Dreyfus Government Cash
Management Institutional
Shares, 2.91% (b) | | $ | 5,165,616 | | |
| | 957,828 | | | Goldman Sachs Financial Square
Treasury Instruments Fund
Institutional Shares, 3.10% (b) | | | 957,828 | | |
| | | TOTAL SHORT TERM
INVESTMENTS
(Cost $6,123,444) | | $ | 6,123,444 | | |
| | | TOTAL INVESTMENTS
(Cost $27,159,444) - 103.7% (c) | | $ | 25,567,119 | | |
| | | Liabilities in Excess of
Other Assets - (3.7)% | | | (914,302 | ) | |
| | | TOTAL NET ASSETS - 100.0% | | $ | 24,652,817 | | |
Percentages are stated as a percent of net assets.
The geographic location of all investments is United States unless otherwise indicated.
(a) Non-income producing security.
(b) Represents annualized seven-day yield at October 31, 2022.
(c) All or a portion of these securities have been segregated as collateral for swap contracts. Total value of securities segregated amounted to $19,367,779.
ADR - American Depository Receipt
Long Total Return Swap Contracts
October 31, 2022
Terms of Payments
to be Received at
Termination | | Terms of Payments
to be Paid at
Termination | | Counterparty | | Termination
Date | | Contracts | | Notional
Amount | | Unrealized
Appreciation
(Depreciation) | |
Total return of Consumer
Discretionary Select
Sector Index | |
3.4900% representing
1 month SOFR rate + spread | | J.P. Morgan | | 12/6/2022 | | | 11,029 | | | $ | 16,404,049 | | | $ | (402,137 | ) | |
Total return of Consumer
Discretionary Select
Sector Index | |
3.6400% representing
1 month SOFR rate + spread | | Bank of America
Merrill Lynch | | 12/13/2022 | | | 2,922 | | | | 4,517,937 | | | | (297,959 | ) | |
Total return of Consumer
Discretionary Select
Sector Index | |
3.6400% representing
1 month SOFR rate + spread | | UBS Securities LLC | | 12/13/2022 | | | 23,516 | | | | 33,453,884 | | | | 587,560 | | |
| | | | | | | | | | | $ | 54,375,870 | | | $ | (112,536 | ) | |
The accompanying notes are an integral part of these financial statements.
DIREXION ANNUAL REPORT
81
Direxion Daily Dow Jones Internet Bull 3X Shares
Schedule of Investments
October 31, 2022
Shares | | | | Fair Value | |
COMMON STOCKS - 67.4% | | | |
Administrative and Support Services - 2.2% | | | |
| | 25,150 | | | Cloudflare, Inc. (a) | | $ | 1,416,448 | | |
| | 28,954 | | | Teladoc Health, Inc. (a) | | | 858,196 | | |
| | | | 2,274,644 | | |
Computer and Electronic Product Manufacturing - 12.5% | | | |
| | 37,828 | | | Alphabet, Inc. Class A (a) | | | 3,575,124 | | |
| | 33,825 | | | Alphabet, Inc. Class C (a) | | | 3,201,875 | | |
| | 16,122 | | | Arista Networks, Inc. (a) | | | 1,948,505 | | |
| | 90,421 | | | Cisco Systems, Inc. | | | 4,107,826 | | |
| | | | 12,833,330 | | |
Data Processing, Hosting and Related Services - 2.1% | | | |
| | 20,147 | | | Airbnb, Inc. (a) | | | 2,153,916 | | |
Electronics and Appliance Stores - 0.8% | | | |
| | 24,960 | | | Smartsheet, Inc. (a) | | | 871,603 | | |
Motion Picture and Sound Recording Industries - 3.9% | | | |
| | 13,752 | | | Netflix, Inc. (a) | | | 4,013,934 | | |
Nonstore Retailers - 8.5% | | | |
| | 58,584 | | | Amazon.com, Inc. (a) | | | 6,001,345 | | |
| | 39,940 | | | eBay, Inc. | | | 1,591,210 | | |
| | 12,844 | | | Etsy, Inc. (a) | | | 1,206,180 | | |
| | | | 8,798,735 | | |
Other Information Services - 1.4% | | | |
| | 58,950 | | | Pinterest, Inc. (a) | | | 1,450,170 | | |
Professional, Scientific, and Technical Services - 14.8% | | | |
| | 22,964 | | | Ciena Corp. (a) | | | 1,099,975 | | |
| | 17,237 | | | GoDaddy, Inc. (a) | | | 1,385,855 | | |
| | 40,990 | | | Juniper Networks, Inc. | | | 1,254,294 | | |
| | 25,985 | | | Match Group, Inc. (a) | | | 1,122,552 | | |
| | 32,649 | | | Meta Platforms, Inc. (a) | | | 3,041,581 | | |
| | 39,779 | | | Nutanix, Inc. (a) | | | 1,089,945 | | |
| | 19,013 | | | Okta, Inc. (a) | | | 1,067,009 | | |
| | 113,139 | | | Snap, Inc. (a) | | | 1,121,207 | | |
| | 13,652 | | | Snowflake, Inc. (a) | | | 2,188,416 | | |
| | 12,280 | | | Workday, Inc. (a) | | | 1,913,470 | | |
| | | | 15,284,304 | | |
Publishing Industries (except Internet) - 13.6% | | | |
| | 15,669 | | | Akamai Technologies, Inc. (a) | | | 1,384,043 | | |
| | 30,069 | | | Box, Inc. (a) | | | 873,504 | | |
| | 13,501 | | | Coupa Software, Inc. (a) | | | 718,658 | | |
| | 18,348 | | | Datadog, Inc. (a) | | | 1,477,197 | | |
| | 22,772 | | | DocuSign, Inc. (a) | | | 1,099,888 | | |
| | 44,014 | | | Dropbox, Inc. (a) | | | 957,305 | | |
| | 52,453 | | | Fastly, Inc. (a) | | | 445,326 | | |
| | 24,356 | | | Salesforce.com, Inc. (a) | | | 3,960,042 | | |
| | 10,312 | | | Veeva Systems, Inc. (a) | | | 1,731,797 | | |
| | 30,042 | | | ZoomInfo Technologies, Inc. (a) | | | 1,337,770 | | |
| | | | 13,985,530 | | |
Real Estate - 1.3% | | | |
| | 143,188 | | | Opendoor Technologies, Inc. (a) | | | 370,857 | | |
| | 8,096 | | | Zillow Group, Inc. Class A (a) | | | 250,409 | | |
| | 22,751 | | | Zillow Group, Inc. Class C (a) | | | 702,096 | | |
| | | | 1,323,362 | | |
Shares | | | | Fair Value | |
Securities, Commodity Contracts, and Other Financial Investments and Related Activities - 0.7% | | | |
| | 54,628 | | | CommScope Holding Co., Inc. (a) | | $ | 723,275 | | |
Support Activities for Transportation - 1.3% | | | |
| | 14,166 | | | Expedia, Inc. (a) | | | 1,324,096 | | |
Telecommunications - 4.3% | | | |
| | 34,301 | | | PayPal Holdings, Inc. (a) | | | 2,866,878 | | |
| | 19,269 | | | Zoom Video Communications,
Inc. (a) | | | 1,607,805 | | |
| | | | 4,474,683 | | |
| | | | | TOTAL COMMON STOCKS
(Cost $75,816,615) | | $ | 69,511,582 | | |
SHORT TERM INVESTMENTS - 44.8% | | | |
Money Market Funds - 44.8% | | | |
| | 18,941,514 | | | Dreyfus Government Cash
Management Institutional
Shares, 2.91% (b) | | $ | 18,941,514 | | |
| | 27,240,490 | | | Goldman Sachs Financial Square
Treasury Instruments Fund
Institutional Shares, 3.10% (b) | | | 27,240,490 | | |
| | | | | TOTAL SHORT TERM
INVESTMENTS
(Cost $46,182,004) | | $ | 46,182,004 | | |
| | | | | TOTAL INVESTMENTS
(Cost $121,998,619) -
112.2% (c) | | $ | 115,693,586 | | |
| | | | | Liabilities in Excess of
Other Assets - (12.2)% | | | (12,593,241 | ) | |
| | | | | TOTAL NET ASSETS - 100.0% | | $ | 103,100,345 | | |
Percentages are stated as a percent of net assets.
The geographic location of all investments is United States unless otherwise indicated.
(a) Non-income producing security.
(b) Represents annualized seven-day yield at October 31, 2022.
(c) All or a portion of these securities have been segregated as collateral for swap contracts. Total value of securities segregated amounted to $96,083,541.
The accompanying notes are an integral part of these financial statements.
DIREXION ANNUAL REPORT
82
Direxion Daily Dow Jones Internet Bull 3X Shares
Long Total Return Swap Contracts
October 31, 2022
Terms of Payments
to be Received at
Termination | | Terms of Payments
to be Paid at
Termination | | Counterparty | | Termination
Date | | Contracts | | Notional
Amount | | Unrealized
Appreciation
(Depreciation) | |
Total return of Dow Jones
Internet Composite Index | | 3.4900% representing
1 month SOFR rate + spread | | J.P. Morgan | | 12/6/2022 | | | 32,399 | | | $ | 18,576,531 | | | $ | 384,213 | | |
Total return of Dow Jones
Internet Composite Index | | 3.4400% representing
1 month SOFR rate + spread | | Citibank N.A. | | 12/13/2022 | | | 122,511 | | | | 71,876,180 | | | | (178,473 | ) | |
Total return of Dow Jones
Internet Composite Index | |
3.1400% representing
1 month SOFR rate + spread | | Bank of
America
Merrill Lynch | | 12/13/2022 | | | 142,787 | | | | 91,520,935 | | | | (8,125,451 | ) | |
Total return of Dow Jones
Internet Composite Index | | 3.6400% representing
1 month SOFR rate + spread | | UBS
Securities LLC | | 12/14/2022 | | | 111,257 | | | | 69,365,411 | | | | (4,649,078 | ) | |
| | | | | | | | | | | $ | 251,339,057 | | | $ | (12,568,789 | ) | |
The accompanying notes are an integral part of these financial statements.
DIREXION ANNUAL REPORT
83
Direxion Daily Dow Jones Internet Bear 3X Shares
Schedule of Investments
October 31, 2022
Shares | | | | Fair Value | |
SHORT TERM INVESTMENTS - 98.7% | |
Money Market Funds - 98.7% | |
| | 27,730,976 | | | Dreyfus Government Cash
Management Institutional
Shares, 2.91% (a) | | $ | 27,730,976 | | |
| | 27,738,908 | | | Goldman Sachs Financial Square
Treasury Instruments Fund
Institutional Shares, 3.10% (a) | | | 27,738,908 | | |
| | | TOTAL SHORT TERM
INVESTMENTS
(Cost $55,469,884) (b) | | $ | 55,469,884 | | |
| | | TOTAL INVESTMENTS
(Cost $55,469,884) - 98.7% | | $ | 55,469,884 | | |
| | | Other Assets in Excess of
Liabilities - 1.3% | | | 712,881 | | |
| | | TOTAL NET ASSETS - 100.0% | | $ | 56,182,765 | | |
Percentages are stated as a percent of net assets.
The geographic location of all investments is United States unless otherwise indicated.
(a) Represents annualized seven-day yield at October 31, 2022.
(b) All or a portion of these securities have been segregated as collateral for swap contracts. Total value of securities segregated amounted to $38,196,589.
Short Total Return Swap Contracts
October 31, 2022
Terms of Payments
to be Received at
Termination | | Terms of Payments
to be Paid at
Termination | | Counterparty | | Termination
Date | | Contracts | | Notional
Amount | | Unrealized
Appreciation | |
3.1400% representing
1 month SOFR rate + spread | | Total return of
Dow Jones Internet
Composite Index | | Citibank N.A. | | 12/13/2022 | | | 54,557 | | | $ | 33,409,458 | | | $ | 1,477,039 | | |
2.9400% representing
1 month SOFR rate + spread | | Total return of
Dow Jones Internet
Composite Index | | Bank of America
Merrill Lynch | | 12/13/2022 | | | 127,401 | | | | 84,604,564 | | | | 10,286,449 | | |
3.4400% representing
1 month SOFR rate + spread | | Total return of
Dow Jones Internet
Composite Index | | UBS
Securities LLC | | 12/14/2022 | | | 105,485 | | | | 69,559,773 | | | | 8,061,563 | | |
| | | | | | | | | | | | | $ | 187,573,795 | | | $ | 19,825,051 | | |
The accompanying notes are an integral part of these financial statements.
DIREXION ANNUAL REPORT
84
Direxion Daily Financial Bull 3X Shares
Schedule of Investments
October 31, 2022
Shares | | | | Fair Value | |
COMMON STOCKS - 57.9% | | | |
Administrative and Support Services - 0.9% | | | |
| | 11,162 | | | FactSet Research System, Inc. | | $ | 4,749,319 | | |
| | 46,383 | | | Moody's Corp. | | | 12,285,465 | | |
| | | | 17,034,784 | | |
Credit Intermediation and Related Activities - 22.9% | | | |
| | 176,282 | | | American Express Co. | | | 26,169,063 | | |
| | 2,054,588 | | | Bank of America Corp. | | | 74,047,352 | | |
| | 216,126 | | | Bank of New York Mellon
Corp. | | | 9,101,066 | | |
| | 569,211 | | | Citigroup, Inc. | | | 26,104,017 | | |
| | 145,671 | | | Citizens Financial Group, Inc. | | | 5,957,944 | | |
| | 38,455 | | | Comerica, Inc. | | | 2,711,078 | | |
| | 80,283 | | | Discover Financial Services | | | 8,386,362 | | |
| | 201,673 | | | Fifth Third Bancorp | | | 7,197,709 | | |
| | 53,708 | | | First Republic Bank | | | 6,450,331 | | |
| | 423,873 | | | Huntington Bancshares, Inc. | | | 6,434,392 | | |
| | 861,901 | | | JPMorgan Chase & Co. | | | 108,496,098 | | |
| | 274,108 | | | KeyCorp | | | 4,898,310 | | |
| | 51,616 | | | M&T Bank Corp. | | | 8,690,586 | | |
| | 61,241 | | | Northern Trust Corp. | | | 5,165,678 | | |
| | 120,546 | | | PNC Financial Services
Group, Inc. | | | 19,507,959 | | |
| | 274,626 | | | Regions Financial Corp. | | | 6,028,041 | | |
| | 18,500 | | | Signature Bank | | | 2,932,805 | | |
| | 108,046 | | | State Street Corp. | | | 7,995,404 | | |
| | 17,366 | | | SVB Financial Group (a) | | | 4,010,851 | | |
| | 141,590 | | | Synchrony Financial | | | 5,034,940 | | |
| | 389,833 | | | Truist Financial Corp. | | | 17,460,620 | | |
| | 397,379 | | | U.S. Bancorp | | | 16,868,739 | | |
| | 1,114,788 | | | Wells Fargo & Co. | | | 51,269,100 | | |
| | 44,228 | | | Zions Bancorp | | | 2,297,202 | | |
| | | | 433,215,647 | | |
Funds, Trusts, and Other Financial Vehicles - 0.4% | | | |
| | 66,330 | | | T. Rowe Price Group, Inc. | | | 7,041,593 | | |
Insurance Carriers and Related Activities - 20.3% | | | |
| | 169,014 | | | Aflac, Inc. | | | 11,004,502 | | |
| | 79,443 | | | Allstate Corp. | | | 10,029,679 | | |
| | 223,489 | | | American International
Group, Inc. | | | 12,738,873 | | |
| | 61,982 | | | AON PLC ADR
(United Kingdom) | | | 17,447,313 | | |
| | 110,000 | | | Arch Capital Group Ltd.
ADR (a) | | | 6,325,000 | | |
| | 61,821 | | | Arthur J. Gallagher & Co. | | | 11,565,473 | | |
| | 15,632 | | | Assurant, Inc. | | | 2,123,763 | | |
| | 530,453 | | | Berkshire Hathaway, Inc.
Class B (a) | | | 156,531,376 | | |
| | 68,914 | | | Brown & Brown, Inc. | | | 4,051,454 | | |
| | 122,745 | | | Chubb Limited ADR
(Switzerland) | | | 26,376,673 | | |
| | 46,788 | | | Cincinnati Financial Corp. | | | 4,834,136 | | |
| | 11,585 | | | Everest Re Group Ltd. ADR | | | 3,738,016 | | |
| | 26,631 | | | Globe Life, Inc. | | | 3,076,413 | | |
Shares | | | | Fair Value | |
Insurance Carriers and Related Activities (continued) | | | |
| | 94,973 | | | Hartford Financial Services
Group, Inc. | | $ | 6,876,995 | | |
| | 45,523 | | | Lincoln National Corp. | | | 2,452,324 | | |
| | 58,772 | | | Loews Corp. | | | 3,351,179 | | |
| | 146,661 | | | Marsh & McLennan
Companies, Inc. | | | 23,684,285 | | |
| | 196,915 | | | MetLife, Inc. | | | 14,416,147 | | |
| | 68,115 | | | Principal Financial Group, Inc. | | | 6,002,975 | | |
| | 171,910 | | | Progressive Corp. | | | 22,073,244 | | |
| | 109,337 | | | Prudential Financial, Inc. | | | 11,501,159 | | |
| | 69,737 | | | Travelers Companies, Inc. | | | 12,863,687 | | |
| | 60,036 | | | W.R. Berkley Corp. | | | 4,465,478 | | |
| | 32,328 | | | Willis Towers Watson PLC
ADR (Ireland) (a) | | | 7,054,293 | | |
| | | | 384,584,437 | | |
Management of Companies and Enterprises - 0.6% | | | |
| | 112,806 | | | Capital One Financial Corp. | | | 11,959,692 | | |
Securities, Commodity Contracts, and Other Financial Investments and Related Activities - 12.8% | | | |
| | 31,788 | | | Ameriprise Financial, Inc. | | | 9,826,307 | | |
| | 44,318 | | | BlackRock, Inc. | | | 28,625,439 | | |
| | 31,174 | | | CBOE Holdings, Inc. | | | 3,881,163 | | |
| | 448,779 | | | Charles Schwab Corp. | | | 35,754,223 | | |
| | 105,639 | | | CME Group, Inc. | | | 18,307,239 | | |
| | 83,487 | | | Franklin Resources, Inc. | | | 1,957,770 | | |
| | 100,329 | | | Goldman Sachs Group, Inc. | | | 34,564,344 | | |
| | 164,125 | | | IntercontinentalExchange, Inc. | | | 15,685,426 | | |
| | 133,696 | | | Invesco Ltd. ADR | | | 2,048,223 | | |
| | 11,054 | | | MarketAxess Holdings, Inc. (a) | | | 2,697,618 | | |
| | 393,570 | | | Morgan Stanley | | | 32,339,647 | | |
| | 23,655 | | | MSCI, Inc. Class A | | | 11,090,883 | | |
| | 99,620 | | | NASDAQ OMX Group, Inc. | | | 6,200,349 | | |
| | 57,083 | | | Raymond James Financial, Inc. | | | 6,743,786 | | |
| | 100,138 | | | S&P Global, Inc. | | | 32,169,332 | | |
| | | | 241,891,749 | | |
| | | | | TOTAL COMMON STOCKS
(Cost $1,048,273,830) | | $ | 1,095,727,902 | | |
SHORT TERM INVESTMENTS - 42.3% | | | |
Money Market Funds - 42.3% | | | |
| | 530,183,035 | | | Dreyfus Government Cash
Management Institutional
Shares, 2.91% (b) | | $ | 530,183,035 | | |
| | 159,605,582 | | | Dreyfus Treasury Securities
Cash Management
Institutional Shares,
3.01% (b) | | | 159,605,582 | | |
| | 79,721,671 | | | Goldman Sachs Financial
Square Government Fund
Institutional Shares,
3.07% (b) | | | 79,721,671 | | |
The accompanying notes are an integral part of these financial statements.
DIREXION ANNUAL REPORT
85
Direxion Daily Financial Bull 3X Shares
Schedule of Investments, continued
October 31, 2022
Shares | | | | Fair Value | |
Money Market Funds (continued) | |
| | 31,379,343 | | | Goldman Sachs Financial
Square Treasury Instruments
Fund Institutional Shares,
3.10% (b) | | $ | 31,379,343 | | |
| | | TOTAL SHORT TERM
INVESTMENTS
(Cost $800,889,631) | | $ | 800,889,631 | | |
| | | TOTAL INVESTMENTS
(Cost $1,849,163,461) -
100.2% (c) | | $ | 1,896,617,533 | | |
| | | Liabilities in Excess of Other
Assets - (0.2)% | | | (4,394,503 | ) | |
| | | TOTAL NET ASSETS - 100.0% | | $ | 1,892,223,030 | | |
Percentages are stated as a percent of net assets.
The geographic location of all investments is United States unless otherwise indicated.
(a) Non-income producing security.
(b) Represents annualized seven-day yield at October 31, 2022.
(c) All or a portion of these securities have been segregated as collateral for swap contracts. Total value of securities segregated amounted to $1,486,664,005.
ADR - American Depository Receipt
Long Total Return Swap Contracts
October 31, 2022
Terms of Payments
to be Received at
Termination | | Terms of Payments
to be Paid at
Termination | | Counterparty | | Termination
Date | | Contracts | | Notional
Amount | | Unrealized
Appreciation | |
Total return of Financials
Select Sector Index | | 3.6900% representing
1 month SOFR
rate + spread | | Citibank N.A. | | 12/13/2022 | | | 1,367,000 | | | $ | 552,541,936 | | | $ | 17,533,698 | | |
Total return of Financials
Select Sector Index | | 3.7400% representing
1 month SOFR
rate + spread | | Bank of America
Merrill Lynch | | 12/13/2022 | | | 1,233,997 | | | | 494,498,611 | | | | 20,457,003 | | |
Total return of Financials
Select Sector Index | | 3.7100% representing
1 month SOFR
rate + spread | | UBS Securities
LLC | | 12/14/2022 | | | 989,754 | | | | 410,752,775 | | | | 2,129,981 | | |
Total return of Financials
Select Sector Index | | 3.9300% representing
1 month SOFR
rate + spread | | BNP Paribas | | 12/15/2022 | | | 1,975,000 | | | | 812,787,782 | | | | 10,084,987 | | |
Total return of Financials
Select Sector Index | | 3.5900% representing
1 month SOFR
rate + spread | | Barclays | | 7/31/2023 | | | 2,269,663 | | | | 919,357,894 | | | | 27,500,116 | | |
Total return of Financials
Select Sector Index | | 3.5400% representing
1 month SOFR
rate + spread | | J.P. Morgan | | 8/29/2023 | | | 1,201,188 | | | | 469,279,242 | | | | 32,375,100 | | |
Total return of Financials
Select Sector Index | | 3.5900% representing
1 month SOFR
rate + spread | | Goldman Sachs | | 8/30/2023 | | | 1,923,028 | | | | 761,185,144 | | | | 41,996,606 | | |
| | | | | | | | | | | $ | 4,420,403,384 | | | $ | 152,077,491 | | |
The accompanying notes are an integral part of these financial statements.
DIREXION ANNUAL REPORT
86
Direxion Daily Financial Bear 3X Shares
Schedule of Investments
October 31, 2022
Shares | | | | Fair Value | |
SHORT TERM INVESTMENTS - 110.3% | | | |
Money Market Funds - 110.3% | | | |
| | 80,179,349 | | | Dreyfus Government Cash
Management Institutional
Shares, 2.91% (a) | | $ | 80,179,349 | | |
| | 21,519,251 | | | Dreyfus Treasury Securities Cash
Management Institutional
Shares, 3.01% (a) | | | 21,519,251 | | |
| | 108,691,423 | | | Goldman Sachs Financial
Square Treasury Instruments
Fund Institutional Shares,
3.10% (a) | | | 108,691,423 | | |
| | | | | TOTAL SHORT TERM
INVESTMENTS
(Cost $210,390,023) (b) | | $ | 210,390,023 | | |
| | | | | TOTAL INVESTMENTS
(Cost $210,390,023) -
110.3% | | $ | 210,390,023 | | |
| | | | | Liabilities in Excess of
Other Assets - (10.3)% | | | (19,700,020 | ) | |
| | | | | TOTAL NET ASSETS - 100.0% | | $ | 190,690,003 | | |
Percentages are stated as a percent of net assets.
The geographic location of all investments is United States unless otherwise indicated.
(a) Represents annualized seven-day yield at October 31, 2022.
(b) All or a portion of these securities have been segregated as collateral for swap contracts. Total value of securities segregated amounted to $145,472,921.
Short Total Return Swap Contracts
October 31, 2022
Terms of Payments
to be Received at
Termination | | Terms of Payments
to be Paid at
Termination | | Counterparty | | Termination
Date | | Contracts | | Notional
Amount | | Unrealized
Depreciation | |
3.5400% representing
1 month SOFR rate + spread | | Total return of Financials
Select Sector Index | | Bank of America
Merrill Lynch | | 12/13/2022 | | | 662,048 | | | $ | 256,651,858 | | | $ | (19,721,401 | ) | |
3.4300% representing
1 month SOFR rate + spread | | Total return of Financials
Select Sector Index | | UBS Securities LLC | | 12/14/2022 | | | 217,527 | | | | 90,301,984 | | | | (397,242 | ) | |
3.2900% representing
1 month SOFR rate + spread | | Total return of Financials
Select Sector Index | | J.P. Morgan | | 8/29/2023 | | | 209,866 | | | | 83,870,852 | | | | (3,726,926 | ) | |
3.2900% representing
1 month SOFR rate + spread | | Total return of Financials
Select Sector Index | | Goldman Sachs | | 8/30/2023 | | | 279,204 | | | | 114,898,366 | | | | (1,676,616 | ) | |
| | | | | | | | | | | | | $ | 545,723,060 | | | $ | (25,522,185 | ) | |
The accompanying notes are an integral part of these financial statements.
DIREXION ANNUAL REPORT
87
Direxion Daily Healthcare Bull 3X Shares
Schedule of Investments
October 31, 2022
Shares | | | | Fair Value | |
COMMON STOCKS - 61.8% | | | |
Ambulatory Health Care Services - 0.9% | | | |
| | 1,355 | | | DaVita, Inc. (a) | | $ | 98,928 | | |
| | 2,198 | | | Laboratory Corp. of America
Holdings | | | 487,648 | | |
| | 1,413 | | | Molina Healthcare, Inc. (a) | | | 507,069 | | |
| | 2,835 | | | Quest Diagnostics, Inc. | | | 407,248 | | |
| | 29,489 | | | Viatris, Inc. | | | 298,724 | | |
| | | | 1,799,617 | | |
Chemical Manufacturing - 22.4% | | | |
| | 42,998 | | | AbbVie, Inc. | | | 6,294,907 | | |
| | 13,008 | | | Amgen, Inc. | | | 3,516,713 | | |
| | 3,529 | | | Biogen, Inc. (a) | | | 1,000,260 | | |
| | 953 | | | Bio-Techne Corp. | | | 282,336 | | |
| | 51,928 | | | Bristol-Myers Squibb Co. | | | 4,022,862 | | |
| | 4,359 | | | Catalent, Inc. (a) | | | 286,517 | | |
| | 19,179 | | | Eli Lilly and Company | | | 6,944,524 | | |
| | 30,481 | | | Gilead Sciences, Inc. | | | 2,391,539 | | |
| | 4,490 | | | Incyte Corp. (a) | | | 333,787 | | |
| | 61,607 | | | Merck & Co., Inc. | | | 6,234,629 | | |
| | 6,186 | | | Organon & Co. | | | 161,950 | | |
| | 136,488 | | | Pfizer, Inc. | | | 6,353,516 | | |
| | 2,607 | | | Regeneron Pharmaceuticals,
Inc. (a) | | | 1,951,991 | | |
| | 6,237 | | | Vertex Pharmaceuticals, Inc. (a) | | | 1,945,944 | �� | |
| | 1,801 | | | West Pharmaceutical Services,
Inc. | | | 414,410 | | |
| | 11,385 | | | Zoetis, Inc. | | | 1,716,630 | | |
| | | | 43,852,515 | | |
Computer and Electronic Product Manufacturing - 6.7% | | | |
| | 1,105 | | | Abiomed, Inc. (a) | | | 278,548 | | |
| | 7,265 | | | Agilent Technologies, Inc. | | | 1,005,113 | | |
| | 521 | | | Bio-Rad Laboratories, Inc. (a) | | | 183,241 | | |
| | 15,922 | | | Danaher Corp. | | | 4,007,090 | | |
| | 6,070 | | | Hologic, Inc. (a) | | | 411,546 | | |
| | 2,024 | | | IDEXX Laboratories, Inc. (a) | | | 727,992 | | |
| | 3,820 | | | Illumina, Inc. (a) | | | 874,092 | | |
| | 3,068 | | | PerkinElmer, Inc. | | | 409,824 | | |
| | 9,528 | | | Thermo Fisher Scientific, Inc. | | | 4,897,106 | | |
| | 1,456 | | | Waters Corp. (a) | | | 435,592 | | |
| | | | 13,230,144 | | |
Health and Personal Care Stores - 1.5% | | | |
| | 31,928 | | | CVS Health Corp. | | | 3,023,581 | | |
Hospitals - 0.7% | | | |
| | 5,235 | | | HCA Healthcare, Inc. | | | 1,138,456 | | |
| | 1,598 | | | Universal Health Services, Inc.
Class B | | | 185,160 | | |
| | | | 1,323,616 | | |
Insurance Carriers and Related Activities - 10.8% | | | |
| | 13,901 | | | Centene Corp. (a) | | | 1,183,392 | | |
| | 7,420 | | | Cigna Corp. | | | 2,397,105 | | |
Shares | | | | Fair Value | |
Insurance Carriers and Related Activities (continued) | | | |
| | 5,836 | | | Elevance Health, Inc. | | $ | 3,190,950 | | |
| | 3,078 | | | Humana, Inc. | | | 1,717,770 | | |
| | 22,747 | | | UnitedHealth Group, Inc. | | | 12,627,997 | | |
| | | | 21,117,214 | | |
Machinery Manufacturing - 0.4% | | | |
| | 548 | | | Mettler-Toledo International,
Inc. (a) | | | 693,182 | | |
Management of Companies and Enterprises - 2.1% | | | |
| | 42,588 | | | Abbott Laboratories | | | 4,213,657 | | |
Merchant Wholesalers, Durable Goods - 0.1% | | | |
| | 3,310 | | | Henry Schein, Inc. (a) | | | 226,603 | | |
Merchant Wholesalers, Nondurable Goods - 1.3% | | | |
| | 3,781 | | | AmerisourceBergen Corp. | | | 594,449 | | |
| | 6,626 | | | Cardinal Health, Inc. | | | 502,913 | | |
| | 3,496 | | | McKesson Corp. | | | 1,361,238 | | |
| | | | 2,458,600 | | |
Miscellaneous Manufacturing - 13.7% | | | |
| | 1,767 | | | Align Technology, Inc. (a) | | | 343,328 | | |
| | 12,247 | | | Baxter International, Inc. | | | 665,624 | | |
| | 6,935 | | | Becton, Dickinson & Co. | | | 1,636,452 | | |
| | 34,816 | | | Boston Scientific Corp. (a) | | | 1,500,918 | | |
| | 5,240 | | | Dentsply Sirona, Inc. | | | 161,497 | | |
| | 9,547 | | | DexCom, Inc. (a) | | | 1,153,087 | | |
| | 15,075 | | | Edwards Lifesciences Corp. (a) | | | 1,091,882 | | |
| | 8,684 | | | Intuitive Surgical, Inc. (a) | | | 2,140,345 | | |
| | 63,940 | | | Johnson & Johnson | | | 11,123,642 | | |
| | 32,314 | | | Medtronic PLC ADR (Ireland) | | | 2,822,305 | | |
| | 3,561 | | | ResMed, Inc. | | | 796,560 | | |
| | 2,432 | | | Steris PLC ADR (Ireland) | | | 419,715 | | |
| | 8,188 | | | Stryker Corp. | | | 1,877,017 | | |
| | 1,141 | | | Teleflex, Inc. | | | 244,813 | | |
| | 1,200 | | | The Cooper Companies, Inc. | | | 328,068 | | |
| | 5,103 | | | Zimmer Biomet Holdings, Inc. | | | 578,425 | | |
| | | | 26,883,678 | | |
Professional, Scientific, and Technical Services - 1.2% | | | |
| | 1,236 | | | Charles River Laboratories
International, Inc. (a) | | | 262,341 | | |
| | 4,535 | | | IQVIA Holdings, Inc. (a) | | | 950,853 | | |
| | 8,182 | | | Moderna, Inc. (a) | | | 1,230,000 | | |
| | | | 2,443,194 | | |
| | | | | TOTAL COMMON STOCKS
(Cost $124,812,127) | | $ | 121,265,601 | | |
SHORT TERM INVESTMENTS - 36.9% | | | |
Money Market Funds - 36.9% | | | |
| | 33,310,671 | | | Dreyfus Government Cash
Management Institutional
Shares, 2.91% (b) | | $ | 33,310,671 | | |
| | 2,871 | | | Goldman Sachs Financial
Square Government Fund
Institutional Shares, 3.07% (b) | | | 2,871 | | |
The accompanying notes are an integral part of these financial statements.
DIREXION ANNUAL REPORT
88
Direxion Daily Healthcare Bull 3X Shares
Schedule of Investments, continued
October 31, 2022
Shares | | | | Fair Value | |
Money Market Funds (continued) | |
| | 38,928,961 | | | Goldman Sachs Financial
Square Treasury Instruments
Fund Institutional Shares,
3.10% (b) | | $ | 38,928,961 | | |
| | | TOTAL SHORT TERM
INVESTMENTS
(Cost $72,242,503) | | $ | 72,242,503 | | |
| | | TOTAL INVESTMENTS
(Cost $197,054,630) -
98.7% (c) | | $ | 193,508,104 | | |
| | | Other Assets in Excess of
Liabilities - 1.3% | | | 2,522,191 | | |
| | | TOTAL NET ASSETS - 100.0% | | $ | 196,030,295 | | |
Percentages are stated as a percent of net assets.
The geographic location of all investments is United States unless otherwise indicated.
(a) Non-income producing security.
(b) Represents annualized seven-day yield at October 31, 2022.
(c) All or a portion of these securities have been segregated as collateral for swap contracts. Total value of securities segregated amounted to $156,918,094.
ADR - American Depository Receipt
Long Total Return Swap Contracts
October 31, 2022
Terms of Payments
to be Received at
Termination | | Terms of Payments
to be Paid at
Termination | | Counterparty | | Termination
Date | | Contracts | | Notional
Amount | | Unrealized
Appreciation | |
Total return of
Health Care Select
Sector Index | |
3.4900% representing
1 month SOFR rate + spread | | J.P. Morgan | | 12/6/2022 | | | 53,864 | | | $ | 69,011,714 | | | $ | 3,074,266 | | |
Total return of
Health Care Select
Sector Index | |
3.6400% representing
1 month SOFR rate + spread | | Barclays | | 12/7/2022 | | | 69,025 | | | | 89,700,944 | | | | 2,504,487 | | |
Total return of
Health Care Select
Sector Index | |
3.6400% representing
1 month SOFR rate + spread | | Bank of America
Merrill Lynch | | 12/13/2022 | | | 130,000 | | | | 166,015,200 | | | | 7,724,386 | | |
Total return of
Health Care Select
Sector Index | |
3.6800% representing
1 month SOFR rate + spread | | UBS Securities LLC | | 12/14/2022 | | | 95,211 | | | | 121,778,286 | | | | 5,704,589 | | |
| | | | | | | | | | | $ | 446,506,144 | | | $ | 19,007,728 | | |
The accompanying notes are an integral part of these financial statements.
DIREXION ANNUAL REPORT
89
Direxion Daily Homebuilders & Supplies Bull 3X Shares
Schedule of Investments
October 31, 2022
Shares | | | | Fair Value | |
COMMON STOCKS - 58.9% | | | |
Building Material and Garden Equipment
and Supplies Dealers - 5.2% | | | |
| | 17,224 | | | Lowe's Companies, Inc. | | $ | 3,357,819 | | |
| | 11,658 | | | The Home Depot, Inc. | | | 3,452,283 | | |
| | | | 6,810,102 | | |
Construction of Buildings - 34.3% | | | |
| | 14,767 | | | Beazer Homes USA, Inc. (a) | | | 167,015 | | |
| | 14,428 | | | Century Communities, Inc. | | | 642,190 | | |
| | 158,837 | | | D.R. Horton, Inc. | | | 12,211,389 | | |
| | 13,644 | | | Green Brick Partners , Inc. (a) | | | 315,586 | | |
| | 42,439 | | | KB Home | | | 1,223,092 | | |
| | 7,315 | | | Lennar Corp. | | | 477,084 | | |
| | 128,086 | | | Lennar Corp. Class A | | | 10,336,540 | | |
| | 10,290 | | | LGI Homes, Inc. (a) | | | 947,194 | | |
| | 28,598 | | | M.D.C Holdings, Inc. | | | 871,095 | | |
| | 13,942 | | | M/I Homes, Inc. (a) | | | 578,454 | | |
| | 18,368 | | | Meritage Homes Corp. (a) | | | 1,398,907 | | |
| | 1,548 | | | NVR, Inc. (a) | | | 6,560,037 | | |
| | 116,283 | | | PulteGroup, Inc. | | | 4,650,157 | | |
| | 57,095 | | | Taylor Morrison Home Corp. (a) | | | 1,503,882 | | |
| | 53,713 | | | Toll Brothers, Inc. | | | 2,313,956 | | |
| | 51,056 | | | TRI Pointe Group, Inc. (a) | | | 855,188 | | |
| | | | 45,051,766 | | |
Fabricated Metal Product Manufacturing - 0.6% | | | |
| | 9,164 | | | PGT Innovations, Inc. (a) | | | 195,285 | | |
| | 6,596 | | | Simpson Manufacturing
Company, Inc. | | | 563,826 | | |
| | | | 759,111 | | |
Furniture and Related Product Manufacturing - 0.1% | | | |
| | 2,538 | | | American Woodmark Corp. (a) | | | 115,098 | | |
Furniture, Home Furnishings, Electronics, and
Appliance Retailers - 1.0% | | | |
| | 3,483 | | | Ethan Allen Interiors, Inc. | | | 89,130 | | |
| | 16,210 | | | Floor & Decor Holdings, Inc. (a) | | | 1,189,328 | | |
| | | | 1,278,458 | | |
Machinery Manufacturing - 0.1% | | | |
| | 15,511 | | | Hayward Holdings, Inc. (a) | | | 143,477 | | |
Management of Companies and Enterprises - 0.2% | | | |
| | 16,742 | | | AZEK Company, Inc. (a) | | | 293,153 | | |
Merchant Wholesalers, Durable Goods - 5.4% | | | |
| | 7,748 | | | Beacon Roofing Supply, Inc. (a) | | | 436,600 | | |
| | 23,857 | | | Builders FirstSource, Inc. (a) | | | 1,471,023 | | |
| | 19,766 | | | Fortune Brands Home &
Security, Inc. | | | 1,192,285 | | |
| | 20,270 | | | Leggett & Platt, Inc. | | | 684,112 | | |
| | 4,929 | | | Lennox International, Inc. | | | 1,151,267 | | |
| | 4,482 | | | Lumber Liquidators Holdings,
Inc. (a) | | | 37,290 | | |
| | 8,058 | | | Mohawk Industries, Inc. (a) | | | 763,495 | | |
| | 5,076 | | | Watsco, Inc. | | | 1,375,393 | | |
| | | | 7,111,465 | | |
Merchant Wholesalers, Nondurable Goods - 2.5% | | | |
| | 14,531 | | | The Sherwin Williams Co. | | | 3,269,911 | | |
Shares | | | | Fair Value | |
Nonmetallic Mineral Product Manufacturing - 1.6% | | | |
| | 5,758 | | | Eagle Materials, Inc. | | $ | 704,261 | | |
| | 14,711 | | | Owens Corning | | | 1,259,409 | | |
| | 5,089 | | | Quanex Building Products Corp. | | | 112,772 | | |
| | | | 2,076,442 | | |
Specialty Trade Contractors - 2.9% | | | |
| | 11,840 | | | Installed Building Products, Inc. | | | 1,018,240 | | |
| | 16,266 | | | TopBuild Corp. (a) | | | 2,767,497 | | |
| | | | 3,785,737 | | |
Wood Product Manufacturing - 5.0% | | | |
| | 4,155 | | | Cavco Industries, Inc. (a) | | | 941,814 | | |
| | 12,878 | | | JELD-WEN Holding, Inc. (a) | | | 136,635 | | |
| | 11,292 | | | Louisiana-Pacific Corp. | | | 639,692 | | |
| | 34,470 | | | Masco Corp. | | | 1,594,927 | | |
| | 3,403 | | | Masonite International Corp.
ADR (a) | | | 243,417 | | |
| | 26,574 | | | Skyline Champion Corp. (a) | | | 1,546,872 | | |
| | 16,855 | | | Trex Company, Inc. (a) | | | 810,557 | | |
| | 9,417 | | | UFP Industries, Inc. | | | 670,773 | | |
| | | | 6,584,687 | | |
| | | | | TOTAL COMMON STOCKS
(Cost $82,024,122) | | $ | 77,279,407 | | |
SHORT TERM INVESTMENTS - 42.4% | | | |
Money Market Funds - 42.4% | | | |
| | 30,039,289 | | | Dreyfus Government Cash
Management Institutional
Shares, 2.91% (b) | | $ | 30,039,289 | | |
| | 748,880 | | | Goldman Sachs Financial
Square Government Fund
Institutional Shares, 3.07% (b) | | | 748,880 | | |
| | 24,834,251 | | | Goldman Sachs Financial
Square Treasury Instruments
Fund Institutional Shares,
3.10% (b) | | | 24,834,251 | | |
| | | | | TOTAL SHORT TERM
INVESTMENTS
(Cost $55,622,420) | | $ | 55,622,420 | | |
| | | | | TOTAL INVESTMENTS
(Cost $137,646,542) -
101.3% (c) | | $ | 132,901,827 | | |
| | | | | Liabilities in Excess of
Other Assets - (1.3)% | | | (1,757,136 | ) | |
| | | | | TOTAL NET ASSETS - 100.0% | | $ | 131,144,691 | | |
Percentages are stated as a percent of net assets.
The geographic location of all investments is United States unless otherwise indicated.
(a) Non-income producing security.
(b) Represents annualized seven-day yield at October 31, 2022.
(c) All or a portion of these securities have been segregated as collateral for swap contracts. Total value of securities segregated amounted to $98,748,185.
ADR - American Depository Receipt
The accompanying notes are an integral part of these financial statements.
DIREXION ANNUAL REPORT
90
Direxion Daily Homebuilders & Supplies Bull 3X Shares
Long Total Return Swap Contracts
October 31, 2022
Terms of Payments
to be Received at
Termination | | Terms of Payments
to be Paid at
Termination | | Counterparty | | Termination
Date | | Contracts | | Notional
Amount | | Unrealized
Appreciation | |
Total return of Dow
Jones U.S. Select Home
Construction Index | | 3.5400% representing
1 month SOFR rate + spread | | Barclays | | 12/7/2022 | | | 7,706 | | | $ | 74,839,190 | | | $ | 2,441,245 | | |
Total return of Dow
Jones U.S. Select Home
Construction Index | | 3.4900% representing
1 month SOFR rate + spread | | Citibank N.A. | | 12/13/2022 | | | 10,933 | | | | 108,707,445 | | | | 903,348 | | |
Total return of Dow
Jones U.S. Select Home
Construction Index | | 3.5900% representing
1 month SOFR rate + spread | | Bank of America
Merrill Lynch | | 12/13/2022 | | | 9,875 | | | | 94,530,181 | | | | 4,426,410 | | |
Total return of Dow
Jones U.S. Select Home
Construction Index | | 3.8300% representing
1 month SOFR rate + spread | | BNP Paribas | | 12/15/2022 | | | 2,937 | | | | 28,843,806 | | | | 563,842 | | |
| | | | | | | | | | | $ | 306,920,622 | | | $ | 8,334,845 | | |
The accompanying notes are an integral part of these financial statements.
DIREXION ANNUAL REPORT
91
Direxion Daily Industrials Bull 3X Shares
Schedule of Investments
October 31, 2022
Shares | | | | Fair Value | |
COMMON STOCKS - 62.8% | | | |
Administrative and Support Services - 2.5% | | | |
| | 388 | | | Allegion PLC ADR (Ireland) | | $ | 40,651 | | |
| | 540 | | | Equifax, Inc. | | | 91,551 | | |
| | 483 | | | Robert Half International, Inc. | | | 36,930 | | |
| | 1,020 | | | Rollins, Inc. | | | 42,922 | | |
| | 1,659 | | | Waste Management, Inc. | | | 262,736 | | |
| | | | 474,790 | | |
Air Transportation - 1.7% | | | |
| | 559 | | | Alaska Air Group, Inc. (a) | | | 24,853 | | |
| | 2,867 | | | American Airlines Group, Inc. (a) | | | 40,654 | | |
| | 2,829 | | | Delta Air Lines, Inc. (a) | | | 95,988 | | |
| | 2,617 | | | Southwest Airlines Co. (a) | | | 95,128 | | |
| | 1,442 | | | United Continental
Holdings, Inc. (a) | | | 62,121 | | |
| | | | 318,744 | | |
Building Material and Garden Equipment and
Supplies Dealers - 0.3% | | | |
| | 234 | | | Snap-on, Inc. | | | 51,960 | | |
Computer and Electronic Product Manufacturing - 8.2% | | | |
| | 1,013 | | | AMETEK, Inc. | | | 131,345 | | |
| | 1,569 | | | Fortive Corp. | | | 100,259 | | |
| | 844 | | | L3 Harris Technologies, Inc. | | | 208,021 | | |
| | 641 | | | Northrop Grumman Corp. | | | 351,915 | | |
| | 1,853 | | | Otis Worldwide Corp. | | | 130,896 | | |
| | 6,513 | | | Raytheon Technologies Corp. | | | 617,563 | | |
| | | | 1,539,999 | | |
Couriers and Messengers - 3.8% | | | |
| | 1,055 | | | FedEx Corp. | | | 169,095 | | |
| | 3,228 | | | United Parcel Service, Inc. Class B | | | 541,562 | | |
| | | | 710,657 | | |
Electrical Equipment, Appliance, and Component Manufacturing - 2.2% | | | |
| | 568 | | | A.O. Smith Corp. | | | 31,115 | | |
| | 2,609 | | | Emerson Electric Co. | | | 225,939 | | |
| | 282 | | | Generac Holdings, Inc. (a) | | | 32,687 | | |
| | 510 | | | Rockwell Automation, Inc. | | | 130,203 | | |
| | | | 419,944 | | |
Fabricated Metal Product Manufacturing - 0.4% | | | |
| | 726 | | | Pentair PLC ADR (Ireland) | | | 31,182 | | |
| | 653 | | | Stanley Black & Decker, Inc. | | | 51,254 | | |
| | | | 82,436 | | |
Food Services and Drinking Places - 0.9% | | | |
| | 379 | | | Cintas Corp. | | | 162,041 | | |
Machinery Manufacturing - 12.2% | | | |
| | 3,713 | | | Carrier Global Corp. | | | 147,629 | | |
| | 2,328 | | | Caterpillar, Inc. | | | 503,919 | | |
| | 622 | | | Cummins, Inc. | | | 152,085 | | |
| | 1,227 | | | Deere & Co. | | | 485,671 | | |
| | 4,837 | | | General Electric Co. | | | 376,367 | | |
| | 333 | | | IDEX Corp. | | | 74,029 | | |
| | 1,779 | | | Ingersoll Rand, Inc. | | | 89,840 | | |
| | 238 | | | Nordson Corp. | | | 53,550 | | |
| | 567 | | | Parker Hannifin Corp. | | | 164,782 | | |
Shares | | | | Fair Value | |
Machinery Manufacturing (continued) | | | |
| | 1,023 | | | Trane Technologies PLC ADR
(Ireland) | | $ | 163,301 | | |
| | 795 | | | Xylem, Inc. | | | 81,432 | | |
| | | | 2,292,605 | | |
Merchant Wholesalers, Durable Goods - 3.2% | | | |
| | 944 | | | Copart, Inc. (a) | | | 108,579 | | |
| | 2,536 | | | Fastenal Co. | | | 122,565 | | |
| | 570 | | | Fortune Brands Home &
Security, Inc. | | | 34,382 | | |
| | 177 | | | Huntington Ingalls Industries, Inc. | | | 45,501 | | |
| | 3,039 | | | Johnson Controls International
PLC ADR (Ireland) | | | 175,776 | | |
| | 199 | | | W.W. Grainger, Inc. | | | 116,286 | | |
| | | | 603,089 | | |
Merchant Wholesalers, Nondurable Goods - 1.4% | | | |
| | 1,243 | | | Illinois Tool Works, Inc. | | | 265,418 | | |
Miscellaneous Manufacturing - 2.4% | | | |
| | 2,443 | | | 3M Co. | | | 307,305 | | |
| | 634 | | | Dover Corp. | | | 82,857 | | |
| | 933 | | | Textron, Inc. | | | 63,855 | | |
| | | | 454,017 | | |
National Security and International Affairs - 0.3% | | | |
| | 602 | | | Leidos Holdings, Inc. | | | 61,157 | | |
Primary Metal Manufacturing - 0.3% | | | |
| | 1,631 | | | Howmet Aerospace, Inc. (a) | | | 57,982 | | |
Professional, Scientific, and Technical Services - 2.4% | | | |
| | 1,757 | | | Eaton Corp PLC ADR (Ireland) | | | 263,673 | | |
| | 563 | | | Jacobs Solutions, Inc. | | | 64,869 | | |
| | 693 | | | Verisk Analytics, Inc. Class A | | | 126,701 | | |
| | | | 455,243 | | |
Rail Transportation - 4.3% | | | |
| | 9,446 | | | CSX Corp. | | | 274,501 | | |
| | 2,755 | | | Union Pacific Corp. | | | 543,120 | | |
| | | | 817,621 | | |
Real Estate - 0.8% | | | |
| | 1,746 | | | CoStar Group, Inc. (a) | | | 144,429 | | |
Rental and Leasing Services - 0.5% | | | |
| | 308 | | | United Rentals, Inc. (a) | | | 97,239 | | |
Specialty Trade Contractors - 0.5% | | | |
| | 630 | | | Quanta Services, Inc. | | | 89,485 | | |
Support Activities for Transportation - 2.2% | | | |
| | 547 | | | C.H. Robinson Worldwide, Inc. | | | 53,453 | | |
| | 722 | | | Expeditors International of
Washington, Inc. | | | 70,648 | | |
| | 365 | | | J.B. Hunt Transport Services, Inc. | | | 62,441 | | |
| | 1,036 | | | Norfolk Southern Corp. | | | 236,280 | | |
| | | | 422,822 | | |
Transportation Equipment Manufacturing - 10.9% | | | |
| | 2,463 | | | Boeing Co. (a) | | | 351,002 | | |
| | 992 | | | General Dynamics Corp. | | | 247,802 | | |
| | 2,972 | | | Honeywell International, Inc. | | | 606,347 | | |
| | 1,040 | | | Lockheed Martin Corp. | | | 506,147 | | |
| | 1,534 | | | Paccar, Inc. | | | 148,537 | | |
| | 227 | | | TransDigm Group, Inc. | | | 130,698 | | |
| | 802 | | | Wabtec Corp. | | | 74,811 | | |
| | | | 2,065,344 | | |
The accompanying notes are an integral part of these financial statements.
DIREXION ANNUAL REPORT
92
Direxion Daily Industrials Bull 3X Shares
Schedule of Investments, continued
October 31, 2022
Shares | | | | Fair Value | |
Truck Transportation - 0.6% | | | |
| | 404 | | | Old Dominion Freight Line, Inc. | | $ | 110,938 | | |
Waste Management and Remediation Services - 0.6% | | | |
| | 906 | | | Republic Services, Inc. | | | 120,154 | | |
Wood Product Manufacturing - 0.2% | | | |
| | 994 | | | Masco Corp. | | | 45,992 | | |
| | | | | TOTAL COMMON STOCKS
(Cost $13,576,066) | | $ | 11,864,106 | | |
SHORT TERM INVESTMENTS - 36.6% | | | |
Money Market Funds - 36.6% | | | |
| | 1,633,260 | | | Dreyfus Government Cash
Management Institutional
Shares, 2.91% (b) | | $ | 1,633,260 | | |
| | 2,210,000 | | | Goldman Sachs Financial Square
Government Fund Institutional
Shares, 3.07% (b) | | | 2,210,000 | | |
| | 3,059,826 | | | Goldman Sachs Financial Square
Treasury Instruments Fund
Institutional Shares, 3.10% (b) | | | 3,059,826 | | |
| | | | | TOTAL SHORT TERM
INVESTMENTS
(Cost $6,903,086) | | $ | 6,903,086 | | |
| | | | | TOTAL INVESTMENTS
(Cost $20,479,152) - 99.4% (c) | | $ | 18,767,192 | | |
| | | | | Other Assets in Excess of
Liabilities - 0.6% | | | 105,721 | | |
| | | | | TOTAL NET ASSETS - 100.0% | | $ | 18,872,913 | | |
Percentages are stated as a percent of net assets.
The geographic location of all investments is United States unless otherwise indicated.
(a) Non-income producing security.
(b) Represents annualized seven-day yield at October 31, 2022.
(c) All or a portion of these securities have been segregated as collateral for swap contracts. Total value of securities segregated amounted to $12,732,324.
ADR - American Depository Receipt
Long Total Return Swap Contracts
October 31, 2022
Terms of Payments
to be Received at
Termination | | Terms of Payments
to be Paid at
Termination | | Counterparty | | Termination
Date | | Contracts | | Notional
Amount | | Unrealized
Appreciation | |
Total return of
Industrials Select
Sector Index | | 3.3900% representing
1 month SOFR rate + spread | |
Barclays | | 12/7/2022 | | | 14,549 | | | $ | 12,437,449 | | | $ | 1,366,786 | | |
Total return of
Industrials Select
Sector Index | | 3.6400% representing
1 month SOFR rate + spread | | Citibank N.A. | | 12/13/2022 | | | 10,320 | | | | 9,610,305 | | | | 179,531 | | |
Total return of
Industrials Select
Sector Index | | 3.4900% representing
1 month SOFR rate + spread | | J.P. Morgan | | 12/6/2023 | | | 22,211 | | | | 20,319,011 | | | | 757,436 | | |
| | | | | | | | | | | $ | 42,366,765 | | | $ | 2,303,753 | | |
The accompanying notes are an integral part of these financial statements.
DIREXION ANNUAL REPORT
93
Direxion Daily Pharmaceutical & Medical Bull 3X Shares
Schedule of Investments
October 31, 2022
Shares | | | | Fair Value | |
COMMON STOCKS - 63.1% | | | |
Administrative and Support Services - 2.1% | | | |
| | 5,641 | | | Royalty Pharma PLC ADR (United
Kingdom) | | $ | 238,727 | | |
Ambulatory Health Care Services - 3.9% | | | |
| | 3,964 | | | Axsome Therapeutics, Inc. (a) | | | 178,975 | | |
| | 24,910 | | | Viatris, Inc. | | | 252,338 | | |
| | | | 431,313 | | |
Chemical Manufacturing - 47.4% | | | |
| | 4,306 | | | Aclaris Therapeutics, Inc. (a) | | | 67,217 | | |
| | 6,021 | | | Amphastar Pharmaceuticals, Inc. (a) | | | 186,049 | | |
| | 958 | | | ANI Pharmaceuticals, Inc. (a) | | | 36,969 | | |
| | 3,509 | | | Bristol-Myers Squibb Co. | | | 271,842 | | |
| | 4,786 | | | Cara Therapeutics, Inc. (a) | | | 44,988 | | |
| | 7,503 | | | Cassava Sciences, Inc. (a) | | | 273,409 | | |
| | 2,564 | | | Catalent, Inc. (a) | | | 168,532 | | |
| | 3,340 | | | Collegium Pharmaceutical, Inc. (a) | | | 59,920 | | |
| | 8,658 | | | Corcept Therapeutics, Inc. (a) | | | 247,619 | | |
| | 16,407 | | | Elanco Animal Health, Inc. (a) | | | 216,408 | | |
| | 775 | | | Eli Lilly and Company | | | 280,620 | | |
| | 9,120 | | | Esperion Therapeutics, Inc. (a) | | | 74,146 | | |
| | 6,710 | | | Evolus, Inc. (a) | | | 57,438 | | |
| | 5,236 | | | Harmony Biosciences Holdings,
Inc. (a) | | | 272,272 | | |
| | 11,318 | | | Innoviva, Inc. (a) | | | 153,472 | | |
| | 4,732 | | | Intra-Cellular Therapies, Inc. (a) | | | 216,110 | | |
| | 1,612 | | | Jazz Pharmaceuticals PLC
(Ireland) (a) | | | 231,790 | | |
| | 2,818 | | | Merck & Co., Inc. | | | 285,182 | | |
| | 33,701 | | | Nektar Therapeutics (a) | | | 126,716 | | |
| | 4,570 | | | NGM Biopharmaceuticals, Inc. (a) | | | 24,404 | | |
| | 8,250 | | | Organon & Co. | | | 215,985 | | |
| | 4,415 | | | Pacira Pharmaceuticals, Inc. (a) | | | 228,520 | | |
| | 6,286 | | | Perrigo Co. PLC ADR (Ireland) | | | 253,200 | | |
| | 5,144 | | | Pfizer, Inc. | | | 239,453 | | |
| | 3,381 | | | Pliant Therapeutics, Inc. (a) | | | 84,085 | | |
| | 3,874 | | | Prestige Consumer Healthcare,
Inc. (a) | | | 211,056 | | |
| | 2,326 | | | Relmada Therapeutics, Inc. (a) | | | 14,863 | | |
| | 4,910 | | | Revance Therapeutics, Inc. (a) | | | 109,542 | | |
| | 17,769 | | | SIGA Technologies, Inc. | | | 163,297 | | |
| | 3,894 | | | Supernus Pharmaceuticals, Inc. (a) | | | 133,447 | | |
| | 6,739 | | | Theravance Biopharma,
Inc. ADR (a) | | | 67,188 | | |
| | 1,670 | | | Ventyx Biosciences, Inc. (a) | | | 54,058 | | |
| | 1,498 | | | Zoetis, Inc. | | | 225,868 | | |
| | | | 5,295,665 | | |
Health and Personal Care Stores - 0.5% | | | |
| | 1,478 | | | CinCor Pharma, Inc. (a) | | | 49,720 | | |
Merchant Wholesalers, Nondurable Goods - 2.6% | | | |
| | 6,611 | | | Amylxy Pharmaceuticals, Inc. (a) | | | 235,814 | | |
| | 5,969 | | | Atea Pharmaceuticals, Inc. (a) | | | 35,814 | | |
| | 1,410 | | | Phibro Animal Health Corp. | | | 20,713 | | |
| | | | 292,341 | | |
Miscellaneous Manufacturing - 2.3% | | | |
| | 1,486 | | | Johnson & Johnson | | | 258,519 | | |
Shares | | | | Fair Value | |
Professional, Scientific, and Technical Services - 4.0% | | | |
| | 4,923 | | | Arvinas, Inc. (a) | | $ | 244,722 | | |
| | 6,332 | | | Reata Pharmaceuticals, Inc. (a)(b) | | | 203,891 | | |
| | | | 448,613 | | |
Securities, Commodity Contracts, and Other Financial Investments and Related Activities - 0.3% | | | |
| | 14,883 | | | Nuvation Bio, Inc. (a) | | | 32,743 | | |
| | | | | TOTAL COMMON STOCKS
(Cost $7,478,341) | | $ | 7,047,641 | | |
SHORT TERM INVESTMENTS - 38.6% | | | |
Money Market Funds - 38.6% | | | |
| | 2,166,394 | | | Dreyfus Government Cash
Management Institutional
Shares, 2.91% (c)(d) | | $ | 2,166,394 | | |
| | 370,594 | | | Goldman Sachs Financial Square
Government Fund Institutional
Shares, 3.07% (c) | | | 370,594 | | |
| | 1,771,960 | | | Goldman Sachs Financial Square
Treasury Instruments Fund
Institutional Shares, 3.10% (c) | | | 1,771,960 | | |
| | | | | TOTAL SHORT TERM
INVESTMENTS
(Cost $4,308,948) | | $ | 4,308,948 | | |
| | | | | TOTAL INVESTMENTS
(Cost $11,787,289) -
101.7% (e) | | $ | 11,356,589 | | |
| | | | | Liabilities in Excess of
Other Assets - (1.7)% | | | (183,566 | ) | |
| | | | | TOTAL NET ASSETS - 100.0% | | $ | 11,173,023 | | |
Percentages are stated as a percent of net assets.
The geographic location of all investments is United States unless otherwise indicated.
(a) Non-income producing security.
(b) A portion of this security represents a security on loan.
(c) Represents annualized seven-day yield at October 31, 2022.
(d) All or a portion of this security represents an investment of securities lending collateral.
(e) All or a portion of these securities have been segregated as collateral for swap contracts. Total value of securities segregated amounted to $7,586,591.
ADR - American Depository Receipt
The accompanying notes are an integral part of these financial statements.
DIREXION ANNUAL REPORT
94
Direxion Daily Pharmaceutical & Medical Bull 3X Shares
Long Total Return Swap Contracts
October 31, 2022
Terms of Payments
to be Received at
Termination | | Terms of Payments
to be Paid at
Termination | | Counterparty | | Termination
Date | | Contracts | | Notional
Amount | | Unrealized
Appreciation
(Depreciation) | |
Total return of
S&P Pharmaceuticals
Select Industry Index | | 3.6400% representing
1 month SOFR rate + spread | | Barclays | | 12/7/2022 | | | 1,822 | | | $ | 8,256,687 | | | $ | 537,410 | | |
Total return of
S&P Pharmaceuticals
Select Industry Index | | 3.3900% representing
1 month SOFR rate + spread | | Citibank N.A. | | 12/13/2022 | | | 1,622 | | | | 8,038,135 | | | | (201,806 | ) | |
Total return of
S&P Pharmaceuticals
Select Industry Index | | 3.6800% representing
1 month SOFR rate + spread | | UBS
Securities LLC | | 12/14/2022 | | | 2,003 | | | | 9,446,340 | | | | 266,526 | | |
| | | | | | | | | | | $ | 25,741,162 | | | $ | 602,130 | | |
The accompanying notes are an integral part of these financial statements.
DIREXION ANNUAL REPORT
95
Direxion Daily Real Estate Bull 3X Shares
Schedule of Investments
October 31, 2022
Shares | | | | Fair Value | |
COMMON STOCKS - 68.4% | | | |
Accommodation - 1.0% | | | |
| | 26,877 | | | Host Hotels & Resorts, Inc. | | $ | 507,438 | | |
Administrative and Support Services - 1.2% | | | |
| | 10,932 | | | Iron Mountain, Inc. | | | 547,365 | | |
Professional, Scientific, and Technical
Services - 1.9% | | | |
| | 5,031 | | | Extra Space Storage, Inc. | | | 892,700 | | |
Real Estate - 57.9% | | | |
| | 5,585 | | | Alexandria Real Estate Equities, Inc. | | | 811,500 | | |
| | 17,511 | | | American Tower Corp. | | | 3,628,104 | | |
| | 5,255 | | | AvalonBay Communities, Inc. | | | 920,256 | | |
| | 5,365 | | | Boston Properties, Inc. | | | 390,036 | | |
| | 4,009 | | | Camden Property Trust | | | 463,240 | | |
| | 12,076 | | | CBRE Group, Inc. Class A (a) | | | 856,671 | | |
| | 16,284 | | | Crown Castle International Corp. | | | 2,170,006 | | |
| | 10,808 | | | Digital Realty Trust, Inc. | | | 1,083,502 | | |
| | 12,731 | | | Equity Residential | | | 802,308 | | |
| | 2,450 | | | Essex Property Trust, Inc. | | | 544,488 | | |
| | 2,739 | | | Federal Realty Investment Trust | | | 271,106 | | |
| | 20,288 | | | Healthpeak Properties, Inc. | | | 481,434 | | |
| | 21,804 | | | Invitation Homes, Inc. | | | 690,969 | | |
| | 23,259 | | | Kimco Realty Corp. | | | 497,277 | | |
| | 4,339 | | | Mid-America Apartment
Communities, Inc. | | | 683,176 | | |
| | 34,713 | | | Prologis, Inc. | | | 3,844,465 | | |
| | 5,944 | | | Public Storage | | | 1,841,154 | | |
| | 23,217 | | | Realty Income Corp. | | | 1,445,723 | | |
| | 5,793 | | | Regency Centers Corp. | | | 350,534 | | |
| | 12,308 | | | Simon Property Group, Inc. | | | 1,341,326 | | |
| | 11,484 | | | UDR, Inc. | | | 456,604 | | |
| | 15,030 | | | Ventas, Inc. | | | 588,124 | | |
| | 36,216 | | | VICI Properties, Inc. | | | 1,159,636 | | |
| | 6,056 | | | Vornado Realty Trust | | | 142,861 | | |
| | 17,422 | | | Welltower, Inc. | | | 1,063,439 | | |
| | 27,836 | | | Weyerhaeuser Co. | | | 860,967 | | |
| | | | 27,388,906 | | |
Telecommunications - 6.4% | | | |
| | 3,425 | | | Equinix, Inc. | | | 1,940,057 | | |
| | 4,053 | | | SBA Communications Corp. | | | 1,093,905 | | |
| | | | 3,033,962 | | |
| | | | | TOTAL COMMON STOCKS
(Cost $37,558,137) | | $ | 32,370,371 | | |
Shares | | | | Fair Value | |
SHORT TERM INVESTMENTS - 30.6% | |
Money Market Funds - 30.6% | |
| | 1,231,384 | | | Dreyfus Government Cash
Management Institutional
Shares, 2.91% (b) | | $ | 1,231,384 | | |
| | 13,224,845 | | | Goldman Sachs Financial Square
Treasury Instruments Fund
Institutional Shares, 3.10% (b) | | | 13,224,845 | | |
| | | TOTAL SHORT TERM
INVESTMENTS
(Cost $14,456,229) | | $ | 14,456,229 | | |
| | | TOTAL INVESTMENTS
(Cost $52,014,366) - 99.0% (c) | | $ | 46,826,600 | | |
| | | Other Assets in Excess of
Liabilities - 1.0% | | | 441,447 | | |
| | | TOTAL NET ASSETS - 100.0% | | $ | 47,268,047 | | |
Percentages are stated as a percent of net assets.
The geographic location of all investments is United States unless otherwise indicated.
(a) Non-income producing security.
(b) Represents annualized seven-day yield at October 31, 2022.
(c) All or a portion of these securities have been segregated as collateral for swap contracts. Total value of securities segregated amounted to $41,130,032.
Long Total Return Swap Contracts
October 31, 2022
Terms of Payments
to be Received at
Termination | | Terms of Payments
to be Paid at
Termination | | Counterparty | | Termination
Date | | Contracts | | Notional
Amount | | Unrealized
Appreciation | |
Total return of Real Estate
Select Sector Index | | 3.0900% representing
1 month SOFR rate + spread | | Bank of America
Merrill Lynch | | 12/13/2022 | | | 349,604 | | | $ | 59,956,090 | | | $ | 2,981,927 | | |
Total return of Real Estate
Select Sector Index | | 3.2900% representing
1 month SOFR rate + spread | | J.P. Morgan | | 12/6/2023 | | | 257,790 | | | | 45,275,138 | | | | 1,131,255 | | |
| | | | | | | | | | | $ | 105,231,228 | | | $ | 4,113,182 | | |
The accompanying notes are an integral part of these financial statements.
DIREXION ANNUAL REPORT
96
Direxion Daily Real Estate Bear 3X Shares
Schedule of Investments
October 31, 2022
Shares | | | | Fair Value | |
SHORT TERM INVESTMENTS - 103.9% | |
Money Market Funds - 103.9% | |
| | 95,562,540 | | | Dreyfus Government Cash
Management Institutional
Shares, 2.91% (a) | | $ | 95,562,540 | | |
| | 117,921,914 | | | Goldman Sachs Financial
Square Treasury Instruments
Fund Institutional Shares,
3.10% (a) | | | 117,921,914 | | |
| | | TOTAL SHORT TERM
INVESTMENTS
(Cost $213,484,454) (b) | | $ | 213,484,454 | | |
| | | TOTAL INVESTMENTS
(Cost $213,484,454) -
103.9% | | $ | 213,484,454 | | |
| | | Liabilities in Excess of Other
Assets - (3.9)% | | | (8,051,071 | ) | |
| | | TOTAL NET ASSETS - 100.0% | | $ | 205,433,383 | | |
Percentages are stated as a percent of net assets.
The geographic location of all investments is United States unless otherwise indicated.
(a) Represents annualized seven-day yield at October 31, 2022.
(b) All or a portion of these securities have been segregated as collateral for swap contracts. Total value of securities segregated amounted to $137,560,369.
Short Total Return Swap Contracts
October 31, 2022
Terms of Payments
to be Received at
Termination | | Terms of Payments
to be Paid at
Termination | | Counterparty | | Termination
Date | | Contracts | | Notional
Amount | | Unrealized
Appreciation
(Depreciation) | |
2.8900% representing
1 month SOFR rate + spread | | Total return of Real Estate
Select Sector Index | | Bank of America
Merrill Lynch | | 12/13/2022 | | | 1,109,691 | | | $ | 186,833,448 | | | $ | (12,945,381 | ) | |
2.9400% representing
1 month SOFR rate + spread | | Total return of Real Estate
Select Sector Index | | UBS Securities
LLC | | 12/14/2022 | | | 643,568 | | | | 130,703,339 | | | | 14,605,246 | | |
2.7900% representing
1 month SOFR rate + spread | | Total return of Real Estate
Select Sector Index | | J.P. Morgan | | 12/6/2023 | | | 1,667,413 | | | | 298,905,314 | | | | (1,479,066 | ) | |
| | | | | | | | | | | | | $ | 616,442,101 | | | $ | 180,799 | | |
The accompanying notes are an integral part of these financial statements.
DIREXION ANNUAL REPORT
97
Direxion Daily Regional Banks Bull 3X Shares
Schedule of Investments
October 31, 2022
Shares | | | | Fair Value | |
COMMON STOCKS - 65.3% | | | |
Credit Intermediation and Related Activities - 59.5% | | | |
| | 2,978 | | | 1st Source Corp. | | $ | 173,200 | | |
| | 4,805 | | | Amerant Bancorp, Inc. | | | 144,630 | | |
| | 17,964 | | | Ameris Bancorp | | | 925,326 | | |
| | 78,739 | | | Associated Banc-Corp | | | 1,917,295 | | |
| | 19,051 | | | Atlantic Union Bankshares Corp. | | | 658,022 | | |
| | 9,416 | | | BancFirst Corp. | | | 902,241 | | |
| | 9,843 | | | Bank of Hawaii Corp. | | | 747,576 | | |
| | 2,238 | | | Bank of Marin Bancorp | | | 80,792 | | |
| | 42,309 | | | Bank OZK | | | 1,818,441 | | |
| | 39,063 | | | BankUnited, Inc. | | | 1,404,315 | | |
| | 9,345 | | | Banner Corp. | | | 698,539 | | |
| | 15,248 | | | Berkshire Hills Bancorp, Inc. (a) | | | 446,004 | | |
| | 12,839 | | | BOK Financial Corp. | | | 1,414,729 | | |
| | 19,036 | | | Brookline Bancorp, Inc. | | | 261,745 | | |
| | 60,756 | | | Cadence Bank | | | 1,679,903 | | |
| | 2,144 | | | Camden National Corp. | | | 93,307 | | |
| | 17,217 | | | Cathay General Bancorp | | | 785,095 | | |
| | 75,491 | | | Citizens Financial Group, Inc. | | | 3,087,582 | | |
| | 3,330 | | | City Holding Co. | | | 335,830 | | |
| | 47,974 | | | Columbia Banking System, Inc. | | | 1,605,690 | | |
| | 34,209 | | | Comerica, Inc. | | | 2,411,735 | | |
| | 23,211 | | | Commerce Bancshares, Inc. | | | 1,644,267 | | |
| | 11,852 | | | Community Bank System, Inc. | | | 739,920 | | |
| | 2,398 | | | Community Trust Bancorp, Inc. | | | 113,401 | | |
| | 7,402 | | | ConnectOne Bancorp, Inc. | | | 185,420 | | |
| | 21,989 | | | Customers Bancorp, Inc. (a) | | | 740,809 | | |
| | 50,737 | | | CVB Financial Corp. | | | 1,457,167 | | |
| | 7,221 | | | Dime Community Bancshares, Inc. | | | 249,341 | | |
| | 11,504 | | | Eagle Bancorp, Inc. | | | 520,901 | | |
| | 38,444 | | | East West Bancorp, Inc. | | | 2,751,437 | | |
| | 35,568 | | | Eastern Bankshares, Inc. | | | 681,839 | | |
| | 5,156 | | | Enterprise Financial Services Corp. | | | 275,691 | | |
| | 132,031 | | | F.N.B. Corp. | | | 1,907,848 | | |
| | 8,924 | | | FB Financial Corp. | | | 374,451 | | |
| | 80,943 | | | Fifth Third Bancorp | | | 2,888,856 | | |
| | 2,315 | | | Financial Institutions, Inc. | | | 55,166 | | |
| | 8,655 | | | First Bancorp | | | 385,753 | | |
| | 106,956 | | | First BanCorp ADR | | | 1,688,835 | | |
| | 4,255 | | | First Bancshares, Inc. | | | 139,309 | | |
| | 9,360 | | | First Busey Corp. | | | 247,198 | | |
| | 3,417 | | | First Citizens BancShares, Inc.
Class A | | | 2,809,184 | | |
| | 26,644 | | | First Commonwealth Financial
Corp. | | | 382,075 | | |
| | 19,264 | | | First Financial Bancorp | | | 502,212 | | |
| | 22,875 | | | First Financial Bankshares, Inc. | | | 880,459 | | |
| | 2,982 | | | First Financial Corp. | | | 144,597 | | |
| | 37,671 | | | First Hawaiian, Inc. | | | 963,624 | | |
| | 124,474 | | | First Horizon National Corp. | | | 3,050,858 | | |
| | 10,194 | | | First Merchants Corp. (a) | | | 457,711 | | |
| | 18,553 | | | First Republic Bank | | | 2,228,215 | | |
| | 6,059 | | | Flushing Finanicial Corp. | | | 119,362 | | |
| | 68,168 | | | Fulton Financial Corp. | | | 1,242,703 | | |
| | 20,568 | | | Glacier Bancorp, Inc. | | | 1,178,135 | | |
| | 2,270 | | | Great Southern Bancorp, Inc. | | | 140,695 | | |
| | 20,389 | | | Hancock Holding Co. | | | 1,139,133 | | |
Shares | | | | Fair Value | |
Credit Intermediation and Related
Activities (continued) | | | |
| | 8,042 | | | Hanmi Financial Corp. Class A | | $ | 215,365 | | |
| | 10,119 | | | HarborOne Bancorp, Inc. | | | 154,112 | | |
| | 6,233 | | | Heartland Financial USA, Inc. | | | 307,412 | | |
| | 7,803 | | | Heritage Commerce Corp. | | | 111,583 | | |
| | 10,743 | | | Heritage Financial Corp. | | | 361,932 | | |
| | 36,633 | | | Hilltop Holdings, Inc. | | | 1,060,525 | | |
| | 8,546 | | | HomeStreet, Inc. | | | 221,854 | | |
| | 44,224 | | | Hope Bancorp, Inc. | | | 600,120 | | |
| | 6,218 | | | Horizon Bancorp, Inc. | | | 92,710 | | |
| | 204,586 | | | Huntington Bancshares, Inc. | | | 3,105,616 | | |
| | 12,786 | | | Independent Bank Corp.
(Massachusetts) | | | 1,112,510 | | |
| | 4,778 | | | Independent Bank Corp.
(Michigan) | | | 110,515 | | |
| | 10,543 | | | Independent Bank Group, Inc. | | | 665,158 | | |
| | 12,165 | | | International Bancshares Corp. | | | 603,384 | | |
| | 155,031 | | | KeyCorp | | | 2,770,404 | | |
| | 9,202 | | | Lakeland Bancorp, Inc. | | | 171,617 | | |
| | 6,850 | | | Lakeland Financial Corp. | | | 566,153 | | |
| | 18,133 | | | Live Oak Bancshares, Inc. | | | 588,779 | | |
| | 15,419 | | | M&T Bank Corp. | | | 2,596,097 | | |
| | 1,987 | | | Mercantile Bank Corp. | | | 69,446 | | |
| | 15,726 | | | Meta Financial Group, Inc. | | | 660,964 | | |
| | 6,071 | | | Metropolitan Bank Holding
Corp. (a) | | | 400,686 | | |
| | 3,711 | | | Midland States Bancorp, Inc. | | | 104,056 | | |
| | 9,179 | | | NBT Bancorp, Inc. | | | 434,993 | | |
| | 2,086 | | | Nicolet Bankshares, Inc. (a) | | | 159,141 | | |
| | 47,476 | | | Northwest Bancshares, Inc. | | | 714,989 | | |
| | 14,943 | | | OceanFirst Financial Corp. | | | 337,413 | | |
| | 16,188 | | | OFG Bancorp ADR | | | 451,321 | | |
| | 102,802 | | | Old National Bancorp | | | 2,010,807 | | |
| | 13,988 | | | Old Second Bancorp, Inc. | | | 223,808 | | |
| | 4,100 | | | Origin Bancorp, Inc. | | | 169,453 | | |
| | 20,485 | | | Pacific Premier Bancorp, Inc. | | | 745,859 | | |
| | 72,824 | | | PacWest Bancorp | | | 1,810,405 | | |
| | 1,666 | | | Park National Corp. | | | 245,735 | | |
| | 2,917 | | | Peapack-Gladstone Financial Corp. | | | 115,426 | | |
| | 5,236 | | | Peoples Bancorp, Inc. | | | 158,494 | | |
| | 24,561 | | | Pinnacle Financial Partners, Inc. | | | 2,038,317 | | |
| | 17,603 | | | PNC Financial Services Group, Inc. | | | 2,848,693 | | |
| | 34,564 | | | Popular, Inc. ADR | | | 2,444,366 | | |
| | 4,169 | | | Preferred Bank | | | 320,471 | | |
| | 6,327 | | | Premier Financial Corp. | | | 182,534 | | |
| | 29,166 | | | Prosperity Bancshares, Inc. | | | 2,087,411 | | |
| | 130,250 | | | Regions Financial Corp. | | | 2,858,988 | | |
| | 14,274 | | | Renasant Corp. | | | 576,241 | | |
| | 7,812 | | | S&T Bancorp, Inc. | | | 295,372 | | |
| | 7,320 | | | Sandy Spring Bancorp, Inc. | | | 259,421 | | |
| | 17,889 | | | Seacoast Banking Corp. of Florida | | | 552,770 | | |
| | 15,745 | | | Signature Bank | | | 2,496,055 | | |
| | 30,498 | | | Silvergate Capital Corp. (a) | | | 1,731,066 | | |
| | 39,557 | | | Simmons First National Corp. (a) | | | 944,226 | | |
| | 4,953 | | | Southside Bancshares, Inc. | | | 169,591 | | |
| | 5,326 | | | Stellar Bancorp, Inc. | | | 174,906 | | |
The accompanying notes are an integral part of these financial statements.
DIREXION ANNUAL REPORT
98
Direxion Daily Regional Banks Bull 3X Shares
Schedule of Investments, continued
October 31, 2022
Shares | | | | Fair Value | |
Credit Intermediation and Related
Activities (continued) | | | |
| | 6,840 | | | SVB Financial Group (a) | | $ | 1,579,766 | | |
| | 54,813 | | | Synovus Financial Corp. | | | 2,184,298 | | |
| | 27,682 | | | Texas Capital Bancshares, Inc. (a) | | | 1,660,920 | | |
| | 22,627 | | | The Bancorp, Inc. (a) | | | 624,053 | | |
| | 2,135 | | | Tompkins Financial Corp. | | | 176,863 | | |
| | 8,372 | | | Towne Bank | | | 275,774 | | |
| | 6,341 | | | TriCo Bancshares | | | 367,207 | | |
| | 10,067 | | | Triumph Bancorp, Inc. (a) | | | 518,451 | | |
| | 59,671 | | | Truist Financial Corp. | | | 2,672,664 | | |
| | 15,283 | | | Trustmark Corp. | | | 558,899 | | |
| | 11,550 | | | UMB Financial Corp. | | | 961,191 | | |
| | 35,024 | | | United Bankshares, Inc. | | | 1,483,266 | | |
| | 29,820 | | | United Community Banks, Inc. | | | 1,148,070 | | |
| | 4,462 | | | Univest Corp. of Pennsylvania | | | 125,561 | | |
| | 136,574 | | | Valley National Bancorp | | | 1,621,133 | | |
| | 19,526 | | | Washington Federal, Inc. | | | 755,656 | | |
| | 3,566 | | | Washington Trust Bancorp, Inc. | | | 172,951 | | |
| | 56,244 | | | Webster Financial Corp. | | | 3,051,799 | | |
| | 10,319 | | | WesBanco, Inc. | | | 417,300 | | |
| | 7,437 | | | Westamerica Bancorp | | | 466,523 | | |
| | 35,340 | | | Western Alliance Bancorp | | | 2,373,788 | | |
| | 27,279 | | | Wintrust Financial Corp. | | | 2,553,860 | | |
| | 49,307 | | | Zions Bancorp | | | 2,561,006 | | |
| | | | 126,398,838 | | |
Management of Companies and Enterprises - 5.7% | | | |
| | 18,254 | | | Banc of California, Inc. | | | 304,477 | | |
| | 8,092 | | | Byline Bancorp, Inc. | | | 187,087 | | |
| | 7,624 | | | Central Pacific Financial Corp. | | | 156,445 | | |
| | 17,419 | | | Cullen/Frost Bankers, Inc. | | | 2,700,816 | | |
| | 12,307 | | | First Foundation, Inc. | | | 196,420 | | |
| | 39,892 | | | First Interstate BancSystem, Inc. | | | 1,819,474 | | |
| | 71,082 | | | Home Bancshares, Inc. | | | 1,811,880 | | |
| | 7,003 | | | National Bank Holdings Corp. | | | 306,871 | | |
| | 8,349 | | | ServisFirst Bancshares, Inc. | | | 628,930 | | |
| | 20,831 | | | South State Corp. | | | 1,883,747 | | |
| | 72,774 | | | Umpqua Holdings Corp. | | | 1,446,747 | | |
| | 20,759 | | | Veritex Holdings, Inc. | | | 655,569 | | |
| | | | 12,098,463 | | |
Securities, Commodity Contracts, and Other Financial Investments and Related Activities - 0.1% | | | |
| | 5,706 | | | CrossFirst Bankshares, Inc. (a) | | | 79,370 | | |
| | 4,442 | | | QCR Holdings, Inc. | | | 225,254 | | |
| | | | 304,624 | | |
| | | | | TOTAL COMMON STOCKS
(Cost $149,708,598) | | $ | 138,801,925 | | |
SHORT TERM INVESTMENTS - 33.5% | | | |
Money Market Funds - 33.5% | | | |
| | 34,262,169 | | | Dreyfus Government Cash
Management Institutional
Shares, 2.91% (b) | | $ | 34,262,169 | | |
| | 10,918 | | | Goldman Sachs Financial
Square Government Fund
Institutional Shares,
3.07% (b) | | | 10,918 | | |
Shares | | | | Fair Value | |
Money Market Funds (continued) | |
| | 36,820,200 | | | Goldman Sachs Financial
Square Treasury Instruments
Fund Institutional Shares,
3.10% (b) | | $ | 36,820,200 | | |
| | | TOTAL SHORT TERM
INVESTMENTS
(Cost $71,093,287) | | $ | 71,093,287 | | |
| | | TOTAL INVESTMENTS
(Cost $220,801,885) -
98.8% (c) | | $ | 209,895,212 | | |
| | | Other Assets in Excess of
Liabilities - 1.2% | | | 2,537,351 | | |
| | | TOTAL NET ASSETS - 100.0% | | $ | 212,432,563 | | |
Percentages are stated as a percent of net assets.
The geographic location of all investments is United States unless otherwise indicated.
(a) Non-income producing security.
(b) Represents annualized seven-day yield at October 31, 2022.
(c) All or a portion of these securities have been segregated as collateral for swap contracts. Total value of securities segregated amounted to $153,460,236.
ADR - American Depository Receipt
The accompanying notes are an integral part of these financial statements.
DIREXION ANNUAL REPORT
99
Direxion Daily Regional Banks Bull 3X Shares
Long Total Return Swap Contracts
October 31, 2022
Terms of Payments
to be Received at
Termination | | Terms of Payments
to be Paid at
Termination | | Counterparty | | Termination
Date | | Contracts | | Notional
Amount | | Unrealized
Appreciation | |
Total return of S&P
Regional Banks
Select Industry Index | |
3.5400% representing
1 month SOFR rate + spread | | Barclays | | 12/7/2022 | | | 59,248 | | | $ | 112,895,178 | | | $ | 6,165,769 | | |
Total return of S&P
Regional Banks
Select Industry Index | |
3.6400% representing
1 month SOFR rate + spread | | Bank of America
Merrill Lynch | | 12/13/2022 | | | 40,000 | | | | 77,545,200 | | | | 2,878,625 | | |
Total return of S&P
Regional Banks
Select Industry Index | |
3.5800% representing
1 month SOFR rate + spread | | UBS Securities LLC | | 12/14/2022 | | | 92,068 | | | | 172,091,962 | | | | 12,704,590 | | |
Total return of S&P
Regional Banks
Select Industry Index | |
3.5900% representing
1 month SOFR rate + spread | | J.P. Morgan | | 9/11/2023 | | | 56,826 | | | | 111,769,471 | | | | 2,253,265 | | |
| | | | | | | | | | | $ | 474,301,811 | | | $ | 24,002,249 | | |
The accompanying notes are an integral part of these financial statements.
DIREXION ANNUAL REPORT
100
Direxion Daily Retail Bull 3X Shares
Schedule of Investments
October 31, 2022
Shares | | | | Fair Value | |
COMMON STOCKS - 56.0% | | | |
Administrative and Support Services - 0.6% | | | |
| | 12,485 | | | Revolve Group, Inc. (a)(b) | | $ | 299,640 | | |
Clothing and Clothing Accessories Stores - 13.5% | | | |
| | 20,806 | | | Abercrombie & Fitch Co. Class A (a) | | | 365,769 | | |
| | 6,804 | | | Academy Sports & Outdoors Inc. | | | 299,580 | | |
| | 31,528 | | | American Eagle Outfitters, Inc. | | | 358,158 | | |
| | 8,500 | | | Bath & Body Works, Inc. | | | 283,730 | | |
| | 4,802 | | | Boot Barn Holdings, Inc. (a) | | | 272,754 | | |
| | 13,108 | | | Caleres, Inc. | | | 358,242 | | |
| | 62,637 | | | Chicos FAS, Inc. (a) | | | 368,306 | | |
| | 8,234 | | | Childrens Place Retail Stores, Inc. (a) | | | 333,312 | | |
| | 19,390 | | | Designer Brands, Inc. (a) | | | 295,310 | | |
| | 33,943 | | | Gap, Inc. | | | 382,538 | | |
| | 6,051 | | | Genesco, Inc. (a) | | | 284,639 | | |
| | 19,527 | | | Guess?, Inc. | | | 331,568 | | |
| | 17,370 | | | Nordstrom, Inc. | | | 353,306 | | |
| | 3,602 | | | Ross Stores, Inc. | | | 344,675 | | |
| | 9,723 | | | Shoe Carnival, Inc. | | | 233,158 | | |
| | 5,307 | | | Signet Jewelers Ltd. ADR | | | 346,229 | | |
| | 9,886 | | | The Buckle, Inc. | | | 388,816 | | |
| | 5,061 | | | TJX Companies, Inc. | | | 364,898 | | |
| | 15,108 | | | Urban Outfitters, Inc. (a) | | | 360,477 | | |
| | 9,768 | | | Victoria's Secret & Co. (a) | | | 367,277 | | |
| | 9,343 | | | Zumiez, Inc. (a) | | | 209,563 | | |
| | | | 6,902,305 | | |
Electronics and Appliance Stores - 1.2% | | | |
| | 4,421 | | | Best Buy Co., Inc. | | | 302,441 | | |
| | 11,653 | | | GameStop Corp. Class A (a)(b) | | | 329,896 | | |
| | | | 632,337 | | |
Food and Beverage Stores - 3.2% | | | |
| | 11,341 | | | Albertsons Companies, Inc. Class A | | | 232,604 | | |
| | 8,802 | | | Grocery Outlet Holding Corp. (a) | | | 304,285 | | |
| | 2,978 | | | Ingles Markets, Inc. | | | 281,034 | | |
| | 6,490 | | | Kroger Co. | | | 306,912 | | |
| | 11,007 | | | Sprouts Farmers Market, Inc. (a) | | | 324,706 | | |
| | 1,883 | | | Weis Markets, Inc. | | | 176,381 | | |
| | | | 1,625,922 | | |
Food Services and Drinking Places - 1.2% | | | |
| | 1,526 | | | Casey's General Stores, Inc. | | | 355,116 | | |
| | 6,485 | | | Wayfair, Inc. (a)(b) | | | 245,911 | | |
| | | | 601,027 | | |
Gasoline Stations - 0.3% | | | |
| | 2,341 | | | TravelCenters of America Inc. (a) | | | 148,841 | | |
General Merchandise Stores - 8.4% | | | |
| | 14,674 | | | Big Lots, Inc. | | | 276,898 | | |
| | 4,271 | | | BJ's Wholesale Club Holdings,
Inc. (a) | | | 330,575 | | |
| | 2,250 | | | Burlington Stores, Inc. (a) | | | 321,660 | | |
| | 629 | | | Costco Wholesale Corp. | | | 315,443 | | |
| | 1,073 | | | Dillard's, Inc. Class A | | | 352,792 | | |
| | 1,364 | | | Dollar General Corp. | | | 347,888 | | |
| | 2,337 | | | Dollar Tree, Inc. (a) | | | 370,415 | | |
| | 2,359 | | | Five Below, Inc. (a) | | | 345,240 | | |
| | 10,970 | | | Kohl's Corp. | | | 328,552 | | |
Shares | | | | Fair Value | |
General Merchandise Stores (continued) | | | |
| | 18,507 | | | Macy's, Inc. | | $ | 385,871 | | |
| | 3,700 | | | PriceSmart, Inc. | | | 236,689 | | |
| | 1,940 | | | Target Corp. | | | 318,645 | | |
| | 2,462 | | | Wal-Mart Stores, Inc. | | | 350,416 | | |
| | | | 4,281,084 | | |
Health and Personal Care Stores - 2.3% | | | |
| | 12,575 | | | Petmed Express, Inc. | | | 268,099 | | |
| | 44,165 | | | Rite Aid Corp. (a) | | | 230,541 | | |
| | 758 | | | Ulta Salon, Cosmetics &
Fragrance, Inc. (a) | | | 317,882 | | |
| | 9,305 | | | Walgreens Boots Alliance, Inc. | | | 339,633 | | |
| | | | 1,156,155 | | |
Lessors of Nonfinancial Intangible Assets (except Copyrighted Works) - 0.1% | | | |
| | 277 | | | Winmark Corp. | | | 69,704 | | |
Machinery Manufacturing - 1.3% | | | |
| | 22,480 | | | Leslie's, Inc. (a) | | | 315,619 | | |
| | 5,770 | | | Xometry, Inc. (a) | | | 346,546 | | |
| | | | 662,165 | | |
Merchant Wholesalers, Durable Goods - 0.4% | | | |
| | 2,860 | | | America's Car-Mart, Inc. (a) | | | 195,509 | | |
Merchant Wholesalers, Nondurable Goods - 0.5% | | | |
| | 8,781 | | | Foot Locker, Inc. | | | 278,358 | | |
Miscellaneous Manufacturing - 1.1% | | | |
| | 9,160 | | | National Vision Holdings, Inc. (a) | | | 339,287 | | |
| | 21,742 | | | Petco Health & Wellness Co.,
Inc. (a) | | | 228,943 | | |
| | | | 568,230 | | |
Miscellaneous Store Retailers - 3.3% | | | |
| | 9,361 | | | Chewy, Inc. (a)(b) | | | 362,552 | | |
| | 5,780 | | | Ollie's Bargain Outlet Holdings,
Inc. (a) | | | 323,680 | | |
| | 22,850 | | | Sally Beauty Holdings, Inc. (a) | | | 290,423 | | |
| | 9,206 | | | The ODP Corp. (a) | | | 364,281 | | |
| | 1,679 | | | Tractor Supply Co. | | | 368,994 | | |
| | | | 1,709,930 | | |
Motor Vehicle and Parts Dealers - 8.3% | | | |
| | 1,865 | | | Advance Auto Parts, Inc. | | | 354,201 | | |
| | 1,976 | | | Asbury Automotive Group, Inc. (a) | | | 311,714 | | |
| | 2,873 | | | AutoNation, Inc. (a) | | | 305,429 | | |
| | 154 | | | AutoZone, Inc. (a) | | | 390,063 | | |
| | 3,702 | | | CarMax, Inc. (a) | | | 233,263 | | |
| | 23,947 | | | CarParts.com, Inc. (a) | | | 112,072 | | |
| | 9,197 | | | Carvana Co. (a)(b) | | | 124,435 | | |
| | 35,583 | | | EVgo, Inc. (a)(b) | | | 263,670 | | |
| | 1,978 | | | Group 1 Automotive, Inc. | | | 342,194 | | |
| | 9,503 | | | MarineMax, Inc. (a) | | | 307,042 | | |
| | 1,163 | | | Murphy USA, Inc. | | | 365,775 | | |
| | 469 | | | O'Reilly Automotive, Inc. (a) | | | 392,633 | | |
| | 2,185 | | | OneWater Marine. Inc. (a) | | | 72,105 | | |
| | 3,043 | | | Penske Automotive Group, Inc. | | | 339,660 | | |
| | 7,111 | | | Sonic Automotive, Inc. | | | 332,439 | | |
| | | | 4,246,695 | | |
The accompanying notes are an integral part of these financial statements.
DIREXION ANNUAL REPORT
101
Direxion Daily Retail Bull 3X Shares
Schedule of Investments, continued
October 31, 2022
Shares | | | | Fair Value | |
Nonstore Retailers - 3.8% | | | |
| | 2,526 | | | Amazon.com, Inc. (a) | | | 258,763 | | |
| | 5,235 | | | DoorDash, Inc. (a) | | | 227,880 | | |
| | 7,471 | | | eBay, Inc. | | | 297,645 | | |
| | 3,052 | | | Etsy, Inc. (a) | | | 286,613 | | |
| | 11,729 | | | Overstock.com, Inc. (a) | | | 272,699 | | |
| | 60,832 | | | Stitch Fix, Inc. (a) | | | 243,328 | | |
| | 21,112 | | | Warby Parker, Inc. (a)(b) | | | 338,848 | | |
| | | | 1,925,776 | | |
Printing and Related Support Activities - 0.1% | | | |
| | 6,540 | | | Arko Corp. | | | 67,035 | | |
Professional, Scientific, and Technical Services - 1.5% | | | |
| | 261,251 | | | ContextLogic, Inc. (a) | | | 204,560 | | |
| | 9,183 | | | Franchise Group, Inc. | | | 278,704 | | |
| | 110,859 | | | Qurate Retail, Inc. (a) | | | 259,410 | | |
| | | | 742,674 | | |
Publishing Industries (except Internet) - 0.8% | | | |
| | 22,138 | | | Poshmark, Inc. (a) | | | 395,385 | | |
Rental and Leasing Services - 0.5% | | | |
| | 12,766 | | | Rent-A-Center, Inc. | | | 266,171 | | |
Repair and Maintenance - 0.9% | | | |
| | 5,668 | | | Liquidity Services, Inc. (a) | | | 97,376 | | |
| | 7,165 | | | Monro Muffler Brake, Inc. | | | 342,129 | | |
| | | | 439,505 | | |
Sporting Goods, Hobby, Musical Instrument, and Book Stores - 2.2% | | | |
| | 11,104 | | | Camping World Holdings, Inc. (a) | | | 309,024 | | |
| | 2,892 | | | Dick's Sporting Goods, Inc. | | | 328,994 | | |
| | 5,213 | | | Hibbett Sports, Inc. | | | 325,395 | | |
| | 16,264 | | | Sportsman's Warehouse Holdings,
Inc. (a) | | | 146,051 | | |
| | | | 1,109,464 | | |
Truck Transportation - 0.5% | | | |
| | 1,312 | | | Lithia Motors, Inc. Class A | | | 259,973 | | |
| | | | | TOTAL COMMON STOCKS
(Cost $28,762,329) | | $ | 28,583,885 | | |
Shares | | | | Fair Value | |
SHORT TERM INVESTMENTS - 33.9% | | | |
Money Market Funds - 33.9% | | | |
| | 9,534,232 | | | Dreyfus Government Cash
Management Institutional
Shares, 2.91% (c)(d) | | $ | 9,534,232 | | |
| | 1 | | | Goldman Sachs Financial Square
Government Fund Institutional
Shares, 3.07% (c) | | | 1 | | |
| | 7,737,953 | | | Goldman Sachs Financial Square
Treasury Instruments Fund
Institutional Shares, 3.10% (c) | | | 7,737,953 | | |
| | | | | TOTAL SHORT TERM
INVESTMENTS
(Cost $17,272,186) | | $ | 17,272,186 | | |
| | | | | TOTAL INVESTMENTS
(Cost $46,034,515) -
89.9% (e) | | $ | 45,856,071 | | |
| | | | | Other Assets in Excess of
Liabilities - 10.1% | | | 5,163,553 | | |
| | | | | TOTAL NET ASSETS - 100.0% | | $ | 51,019,624 | | |
Percentages are stated as a percent of net assets.
The geographic location of all investments is United States unless otherwise indicated.
(a) Non-income producing security.
(b) A portion of this security represents a security on loan.
(c) Represents annualized seven-day yield at October 31, 2022.
(d) All or a portion of this security represents an investment of securities lending collateral.
(e) All or a portion of these securities have been segregated as collateral for swap contracts. Total value of securities segregated amounted to $36,613,030.
ADR - American Depository Receipt
Long Total Return Swap Contracts
October 31, 2022
Terms of Payments
to be Received at
Termination | | Terms of Payments
to be Paid at
Termination | | Counterparty | | Termination
Date | | Contracts | | Notional
Amount | | Unrealized
Appreciation | |
Total return of S&P
Retail Select
Industry® Index | |
3.4400% representing
1 month SOFR rate + spread | | J.P. Morgan | | 12/6/2022 | | | 10,045 | | | $ | 63,817,803 | | | $ | 2,264,612 | | |
Total return of S&P
Retail Select
Industry® Index | |
3.3900% representing
1 month SOFR rate + spread | | Citibank N.A. | | 12/13/2022 | | | 4,217 | | | | 27,435,417 | | | | 347,773 | | |
Total return of S&P
Retail Select
Industry® Index | |
3.6300% representing
1 month SOFR rate + spread | | UBS Securities LLC | | 12/14/2022 | | | 4,595 | | | | 28,820,117 | | | | 1,420,713 | | |
| | | | | | | | | | | $ | 120,073,337 | | | $ | 4,033,098 | | |
The accompanying notes are an integral part of these financial statements.
DIREXION ANNUAL REPORT
102
Direxion Daily S&P 500® High Beta Bull 3X Shares
Schedule of Investments
October 31, 2022
Shares | | | | Fair Value | |
COMMON STOCKS - 69.7% | | | |
Accommodation - 2.6% | | | |
| | 15,184 | | | Caesars Entertainment Inc. (a) | | $ | 663,996 | | |
| | 14,640 | | | Las Vegas Sands Corp. (a) | | | 556,467 | | |
| | 16,081 | | | MGM Resorts International | | | 572,001 | | |
| | | | 1,792,464 | | |
Administrative and Support Services - 1.2% | | | |
| | 1,578 | | | Gartner, Inc. (a) | | | 476,430 | | |
| | 4,789 | | | Live Nation Entertainment, Inc. (a) | | | 381,252 | | |
| | | | 857,682 | | |
Air Transportation - 2.5% | | | |
| | 39,798 | | | American Airlines Group, Inc. (a) | | | 564,336 | | |
| | 14,739 | | | Delta Air Lines, Inc. (a) | | | 500,094 | | |
| | 15,143 | | | United Continental Holdings,
Inc. (a) | | | 652,360 | | |
| | | | 1,716,790 | | |
Amusement, Gambling, and Recreation Industries - 0.8% | | | |
| | 9,050 | | | Wynn Resorts Ltd. (a) | | | 578,295 | | |
Apparel Manufacturing - 0.7% | | | |
| | 5,174 | | | Ralph Lauren Corp. | | | 479,578 | | |
Broadcasting and Content Providers - 1.2% | | | |
| | 23,995 | | | Dish Network Corp. (a) | | | 357,765 | | |
| | 34,985 | | | Warner Bros Discovery, Inc. (a) | | | 454,805 | | |
| | | | 812,570 | | |
Chemical Manufacturing - 0.9% | | | |
| | 2,150 | | | Albemarle Corp. | | | 601,721 | | |
Clothing, Clothing Accessories, Shoe, and Jewelry Retailers - 0.7% | | | |
| | 13,866 | | | Bath & Body Works, Inc. | | | 462,847 | | |
Computer and Electronic Product Manufacturing - 16.6% | | | |
| | 1,902 | | | Abiomed, Inc. (a) | | | 479,456 | | |
| | 7,715 | | | Advanced Micro Devices, Inc. (a) | | | 463,363 | | |
| | 3,918 | | | Alphabet, Inc. Class C (a) | | | 370,878 | | |
| | 2,680 | | | Apple, Inc. | | | 410,951 | | |
| | 4,249 | | | Arista Networks, Inc. (a) | | | 513,534 | | |
| | 832 | | | Broadcom, Inc. | | | 391,140 | | |
| | 2,404 | | | Enphase Energy, Inc. (a) | | | 738,028 | | |
| | 11,718 | | | Fortinet, Inc. (a) | | | 669,801 | | |
| | 2,251 | | | Illumina, Inc. (a) | | | 515,074 | | |
| | 2,706 | | | Keysight Technologies, Inc. (a) | | | 471,250 | | |
| | 7,956 | | | Microchip Technology, Inc. | | | 491,204 | | |
| | 8,893 | | | Micron Technology, Inc. | | | 481,111 | | |
| | 1,357 | | | Monolithic Power Systems, Inc. | | | 460,634 | | |
| | 4,630 | | | NVIDIA Corp. (a) | | | 624,911 | | |
| | 2,954 | | | NXP Semiconductors NV ADR
(Netherlands) | | | 431,520 | | |
| | 10,539 | | | ON Semiconductor Corp. (a) | | | 647,411 | | |
| | 4,793 | | | Qorvo, Inc. (a) | | | 412,581 | | |
| | 3,690 | | | Qualcomm, Inc. | | | 434,165 | | |
| | 4,433 | | | Skyworks Solutions, Inc. | | | 381,282 | | |
| | 1,875 | | | SolarEdge Technologies, Inc. (a) | | | 431,306 | | |
| | 6,074 | | | Teradyne, Inc. | | | 494,120 | | |
| | 7,362 | | | Trimble, Inc. (a) | | | 442,898 | | |
| | 9,454 | | | Western Digital Corp. (a) | | | 324,934 | | |
| | 1,566 | | | Zebra Technologies Corp. Class A (a) | | | 443,523 | | |
| | | | 11,525,075 | | |
Shares | | | | Fair Value | |
Construction of Buildings - 1.9% | | | |
| | 5,809 | | | D.R. Horton, Inc. | | $ | 446,596 | | |
| | 5,356 | | | Lennar Corp. Class A | | | 432,229 | | |
| | 10,380 | | | PulteGroup, Inc. | | | 415,096 | | |
| | | | 1,293,921 | | |
Credit Intermediation and Related Activities - 1.8% | | | |
| | 3,075 | | | Signature Bank | | | 487,480 | | |
| | 6,258 | | | State Street Corp. | | | 463,092 | | |
| | 1,384 | | | SVB Financial Group (a) | | | 319,648 | | |
| | | | 1,270,220 | | |
Electrical Equipment, Appliance, and Component Manufacturing - 0.4% | | | |
| | 2,447 | | | Generac Holdings, Inc. (a) | | | 283,632 | | |
Food Services and Drinking Places - 0.6% | | | |
| | 285 | | | Chipotle Mexican Grill, Inc. (a) | | | 427,024 | | |
Funds, Trusts, and Other Financial Vehicles - 0.6% | | | |
| | 3,729 | | | T. Rowe Price Group, Inc. | | | 395,871 | | |
General Merchandise Retailers - 1.5% | | | |
| | 4,109 | | | Amazon.com, Inc. (a) | | | 420,926 | | |
| | 6,842 | | | Etsy, Inc. (a) | | | 642,532 | | |
| | | | 1,063,458 | | |
Health and Personal Care Retailers - 0.7% | | | |
| | 1,244 | | | Ulta Salon, Cosmetics &
Fragrance, Inc. (a) | | | 521,696 | | |
Insurance Carriers and Related Activities - 0.8% | | | |
| | 10,350 | | | Lincoln National Corp. | | | 557,555 | | |
Leather and Allied Product Manufacturing - 0.7% | | | |
| | 14,991 | | | Tapestry, Inc. | | | 474,915 | | |
Machinery Manufacturing - 1.5% | | | |
| | 5,918 | | | Applied Materials, Inc. | | | 522,500 | | |
| | 1,256 | | | Lam Research Corp. | | | 508,404 | | |
| | | | 1,030,904 | | |
Management of Companies and Enterprises - 2.3% | | | |
| | 69,286 | | | Carnival Corp. ADR (a) | | | 627,731 | | |
| | 55,871 | | | Norwegian Cruise Line Holdings
Ltd. ADR (a) | | | 943,661 | | |
| | | | 1,571,392 | | |
Merchant Wholesalers, Durable Goods - 1.3% | | | |
| | 3,557 | | | Copart, Inc. (a) | | | 409,126 | | |
| | 1,658 | | | KLA-Tencor Corp. | | | 524,674 | | |
| | | | 933,800 | | |
Mining (except Oil and Gas) - 0.7% | | | |
| | 15,876 | | | Freeport-McMoRan Copper &
Gold, Inc. | | | 503,110 | | |
Miscellaneous Manufacturing - 2.9% | | | |
| | 1,945 | | | Align Technology, Inc. (a) | | | 377,914 | | |
| | 6,128 | | | DexCom, Inc. (a) | | | 740,140 | | |
| | 1,829 | | | Estee Lauder Companies, Inc.
Class A | | | 366,696 | | |
| | 2,207 | | | Intuitive Surgical, Inc. (a) | | | 543,959 | | |
| | | | 2,028,709 | | |
Motion Picture and Sound Recording Industries - 1.0% | | | |
| | 2,356 | | | Netflix, Inc. (a) | | | 687,669 | | |
The accompanying notes are an integral part of these financial statements.
DIREXION ANNUAL REPORT
103
Direxion Daily S&P 500® High Beta Bull 3X Shares
Schedule of Investments, continued
October 31, 2022
Shares | | | | Fair Value | |
Motor Vehicle and Parts Dealers - 0.4% | | | |
| | 4,594 | | | CarMax, Inc. (a) | | $ | 289,468 | | |
Oil and Gas Extraction - 1.0% | | | |
| | 15,452 | | | APA Corp. | | | 702,448 | | |
Professional, Scientific, and Technical Services - 5.4% | | | |
| | 2,097 | | | Charles River Laboratories
International, Inc. (a) | | | 445,088 | | |
| | 17,478 | | | DXC Technology Co. (a) | | | 502,493 | | |
| | 1,456 | | | EPAM Systems, Inc. (a) | | | 509,600 | | |
| | 9,540 | | | Match Group, Inc. (a) | | | 412,128 | | |
| | 3,555 | | | Meta Platforms, Inc. (a) | | | 331,184 | | |
| | 2,925 | | | Moderna, Inc. (a) | | | 439,715 | | |
| | 1,703 | | | Paycom Software, Inc. (a) | | | 589,238 | | |
| | 1,256 | | | ServiceNow, Inc. (a) | | | 528,449 | | |
| | | | 3,757,895 | | |
Publishing Industries - 6.9% | | | |
| | 1,214 | | | Adobe Systems, Inc. (a) | | | 386,659 | | |
| | 1,917 | | | ANSYS, Inc. (a) | | | 423,964 | | |
| | 2,612 | | | Autodesk, Inc. (a) | | | 559,752 | | |
| | 2,981 | | | Cadence Design Systems, Inc. (a) | | | 451,293 | | |
| | 9,280 | | | Ceridian HCM Holding, Inc. (a) | | | 614,243 | | |
| | 1,281 | | | Intuit, Inc. | | | 547,627 | | |
| | 3,876 | | | PTC, Inc. (a) | | | 456,709 | | |
| | 2,988 | | | Salesforce.com, Inc. (a) | | | 485,819 | | |
| | 1,467 | | | Synopsys, Inc. (a) | | | 429,171 | | |
| | 1,230 | | | Tyler Technologies, Inc. (a) | | | 397,696 | | |
| | | | 4,752,933 | | |
Rental and Leasing Services - 0.7% | | | |
| | 1,467 | | | United Rentals, Inc. (a) | | | 463,147 | | |
Securities, Commodity Contracts, and Other Financial Investments and Related Activities - 3.3% | | | |
| | 1,698 | | | Ameriprise Financial, Inc. | | | 524,886 | | |
| | 15,846 | | | Franklin Resources, Inc. | | | 371,589 | | |
| | 26,733 | | | Invesco Ltd. ADR | | | 409,550 | | |
| | 977 | | | MSCI, Inc. Class A | | | 458,076 | | |
| | 4,246 | | | Raymond James Financial, Inc. | | | 501,622 | | |
| | | | 2,265,723 | | |
Support Activities for Transportation - 0.6% | | | |
| | 4,416 | | | Expedia, Inc. (a) | | | 412,764 | | |
Telecommunications - 0.8% | | | |
| | 6,278 | | | PayPal Holdings, Inc. (a) | | | 524,715 | | |
Transportation Equipment Manufacturing - 3.5% | | | |
| | 5,427 | | | Aptiv PLC ADR (Ireland) (a) | | | 494,237 | | |
| | 2,826 | | | Boeing Co. (a) | | | 402,734 | | |
| | 34,668 | | | Ford Motor Co. | | | 463,511 | | |
| | 13,333 | | | General Motors Co. | | | 523,320 | | |
| | 2,398 | | | Tesla Motors, Inc. (a) | | | 545,641 | | |
| | | | 2,429,443 | | |
Water Transportation - 1.2% | | | |
| | 15,502 | | | Royal Caribbean Cruises Ltd. ADR
(Liberia) (a) | | | 827,497 | | |
| | | | | TOTAL COMMON STOCKS
(Cost $51,238,605) | | $ | 48,296,931 | | |
Shares | | | | Fair Value | |
SHORT TERM INVESTMENTS - 31.0% | | | |
Money Market Funds - 31.0% | | | |
| | 9,285,515 | | | Dreyfus Government Cash
Management Institutional
Shares, 2.91% (b) | | $ | 9,285,515 | | |
| | 3,703,562 | | | Goldman Sachs Financial Square
Government Fund Institutional
Shares, 3.07% (b) | | | 3,703,562 | | |
| | 8,441,673 | | | Goldman Sachs Financial Square
Treasury Instruments Fund
Institutional Shares, 3.10% (b) | | | 8,441,673 | | |
| | | | | TOTAL SHORT TERM
INVESTMENTS
(Cost $21,430,750) | | $ | 21,430,750 | | |
| | | | | TOTAL INVESTMENTS
(Cost $72,669,355) -
100.7% (c) | | $ | 69,727,681 | | |
| | | | | Liabilities in Excess of Other
Assets - (0.7)% | | | (493,116 | ) | |
| | | | | TOTAL NET ASSETS - 100.0% | | $ | 69,234,565 | | |
Percentages are stated as a percent of net assets.
The geographic location of all investments is United States unless otherwise indicated.
(a) Non-income producing security.
(b) Represents annualized seven-day yield at October 31, 2022.
(c) All or a portion of these securities have been segregated as collateral for swap contracts. Total value of securities segregated amounted to $54,204,510.
ADR - American Depository Receipt
The accompanying notes are an integral part of these financial statements.
DIREXION ANNUAL REPORT
104
Direxion Daily S&P 500® High Beta Bull 3X Shares
Long Total Return Swap Contracts
October 31, 2022
Terms of Payments
to be Received at
Termination | | Terms of Payments
to be Paid at
Termination | | Counterparty | | Termination
Date | | Contracts | | Notional
Amount | | Unrealized
Appreciation
(Depreciation) | |
Total return of
S&P 500®
High Beta Index | |
3.4900% representing
1 month SOFR rate + spread | | Barclays | | 12/7/2022 | | | 5,182 | | | $ | 72,411,081 | | | $ | 3,640,069 | | |
Total return of
S&P 500®
High Beta Index | |
3.5400% representing
1 month SOFR rate + spread | | Citibank N.A. | | 12/13/2022 | | | 60 | | | | 1,107,355 | | | | (233,162 | ) | |
Total return of
S&P 500®
High Beta Index | |
3.5900% representing
1 month SOFR rate + spread | | Bank of America
Merrill Lynch | | 12/13/2022 | | | 3,222 | | | | 46,076,294 | | | | 1,287,370 | | |
Total return of
S&P 500®
High Beta Index | |
3.2200% representing
1 month SOFR rate + spread | | UBS Securities LLC | | 12/14/2022 | | | 2,366 | | | | 33,717,934 | | | | 946,728 | | |
| | | | | | | | | | | $ | 153,312,664 | | | $ | 5,641,005 | | |
The accompanying notes are an integral part of these financial statements.
DIREXION ANNUAL REPORT
105
Direxion Daily S&P 500® High Beta Bear 3X Shares
Schedule of Investments
October 31, 2022
Shares | | | | Fair Value | |
SHORT TERM INVESTMENTS - 98.9% | | | |
Money Market Funds - 98.9% | | | |
| | 41,609,254 | | | Dreyfus Government Cash
Management Institutional
Shares, 2.91% (a) | | $ | 41,609,254 | | |
| | 12,621,045 | | | Goldman Sachs Financial Square
Government Fund Institutional
Shares, 3.07% (a) | | | 12,621,045 | | |
| | 11,479,835 | | | Goldman Sachs Financial Square
Treasury Instruments Fund
Institutional Shares, 3.10% (a) | | | 11,479,835 | | |
| | | | | TOTAL SHORT TERM
INVESTMENTS
(Cost $65,710,134) (b) | | $ | 65,710,134 | | |
| | | | | TOTAL INVESTMENTS
(Cost $65,710,134) - 98.9% | | $ | 65,710,134 | | |
| | | | | Other Assets in Excess of
Liabilities - 1.1% | | | 717,542 | | |
| | | | | TOTAL NET ASSETS - 100.0% | | $ | 66,427,676 | | |
Percentages are stated as a percent of net assets.
The geographic location of all investments is United States unless otherwise indicated.
(a) Represents annualized seven-day yield at October 31, 2022.
(b) All or a portion of these securities have been segregated as collateral for swap contracts. Total value of securities segregated amounted to $32,588,776.
Short Total Return Swap Contracts
October 31, 2022
Terms of Payments
to be Received at
Termination | | Terms of Payments
to be Paid at
Termination | | Counterparty | | Termination
Date | | Contracts | | Notional
Amount | | Unrealized
Appreciation
(Depreciation) | |
2.7900% representing
1 month SOFR rate + spread | | Total return of S&P 500®
High Beta Index | | J.P. Morgan | | 12/6/2022 | | | 1,463 | | | $ | 21,257,158 | | | $ | (224,591 | ) | |
3.2400% representing
1 month SOFR rate + spread | | Total return of S&P 500®
High Beta Index | | Barclays | | 12/7/2022 | | | 4,321 | | | | 75,047,832 | | | | 11,993,507 | | |
3.0100% representing
1 month SOFR rate + spread | | Total return of S&P 500®
High Beta Index | | UBS Securities LLC | | 12/14/2022 | | | 3,739 | | | | 56,367,864 | | | | 1,666,861 | | |
3.2900% representing
1 month SOFR rate + spread | | Total return of S&P 500®
High Beta Index | | Bank of America
Merrill Lynch | | 12/13/2023 | | | 4,017 | | | | 58,881,676 | | | | (104,559 | ) | |
| | | | | | | | | | | | | $ | 211,554,530 | | | $ | 13,331,218 | | |
The accompanying notes are an integral part of these financial statements.
DIREXION ANNUAL REPORT
106
Direxion Daily S&P Biotech Bull 3X Shares
Schedule of Investments
October 31, 2022
Shares | | | | Fair Value | |
COMMON STOCKS - 58.3% | | | |
Administrative and Support Services - 0.3% | | | |
| | 155,579 | | | Day One
Biopharmaceuticals (a)(b) | | $ | 3,288,940 | | |
Ambulatory Health Care Services - 1.4% | | | |
| | 313,930 | | | CareDx, Inc. (a) | | | 6,250,346 | | |
| | 61,552 | | | Keros Therapeutics, Inc. (a) | | | 3,098,528 | | |
| | 140,799 | | | Natera, Inc. (a) | | | 6,611,921 | | |
| | 109,514 | | | Y-mAbs Therapeutics, Inc. (a) | | | 395,345 | | |
| | | | 16,356,140 | | |
Apparel Manufacturing - 0.2% | | | |
| | 461,410 | | | Sana Biotechnology, Inc. (a) | | | 2,676,178 | | |
Chemical Manufacturing - 39.3% | | | |
| | 139,203 | | | 2seventy bio, Inc. (a) | | | 2,210,544 | | |
| | 52,599 | | | AbbVie, Inc. | | | 7,700,494 | | |
| | 428,625 | | | Acadia Pharmaceuticals Inc. (a) | | | 6,870,859 | | |
| | 141,308 | | | Adicet Bio, Inc. (a) | | | 2,330,169 | | |
| | 623,460 | | | ADMA Biologics, Inc. (a) | | | 1,758,157 | | |
| | 146,233 | | | Agios Pharmaceuticals, Inc. (a) | | | 4,027,257 | | |
| | 237,089 | | | Alaunos Therapeutics, Inc. (a)(b) | | | 272,652 | | |
| | 310,494 | | | Alkermes PLC ADR (Ireland) (a) | | | 7,048,214 | | |
| | 33,320 | | | Alnylam Pharmaceuticals,
Inc. (a) | | | 6,905,903 | | |
| | 322,800 | | | Altimmune, Inc. (a) | | | 4,047,912 | | |
| | 30,072 | | | Amgen, Inc. | | | 8,129,965 | | |
| | 652,295 | | | Amicus Therapeutics, Inc. (a) | | | 6,522,950 | | |
| | 99,609 | | | Arcellx, Inc. (a) | | | 2,338,819 | | |
| | 198,705 | | | Arcturus Therapeutics
Holdings, Inc. (a) | | | 3,517,078 | | |
| | 245,858 | | | Arcus Biosciences Inc. (a) | | | 6,264,462 | | |
| | 187,014 | | | Arcutis Biotherapeutics, Inc. (a) | | | 3,306,408 | | |
| | 187,317 | | | Avid Bioservices, Inc. (a) | | | 3,173,150 | | |
| | 129,496 | | | Beam Therapeutics, Inc. (a) | | | 5,705,594 | | |
| | 553,873 | | | BioCryst Pharmaceuticals,
Inc. (a) | | | 7,394,205 | | |
| | 35,161 | | | Biogen, Inc. (a) | | | 9,966,034 | | |
| | 80,248 | | | BioMarin Pharmaceutical,
Inc. (a) | | | 6,951,884 | | |
| | 1,043,546 | | | bluebird bio, Inc. (a) | | | 6,543,033 | | |
| | 97,930 | | | Blueprint Medicines Corp. (a) | | | 5,076,691 | | |
| | 521,514 | | | BridgeBio Pharma, Inc. (a) | | | 5,439,391 | | |
| | 141,080 | | | Caribou Biosciences, Inc. (a) | | | 1,374,119 | | |
| | 435,127 | | | Catalyst Pharmaceuticals,
Inc. (a) | | | 6,035,211 | | |
| | 223,354 | | | Celldex Therapeutics, Inc. (a) | | | 7,846,426 | | |
| | 153,888 | | | Chinook Therapeutics, Inc. (a) | | | 3,347,064 | | |
| | 225,127 | | | Cogent Biosciences, Inc. (a) | | | 3,072,984 | | |
| | 289,091 | | | Coherus BioSciences, Inc. (a) | | | 2,515,092 | | |
| | 81,082 | | | Crinetics Pharmaceuticals,
Inc. (a) | | | 1,496,774 | | |
| | 1,175,223 | | | CTI BioPharma Corp. (a) | | | 5,758,593 | | |
| | 217,284 | | | Deciphera Pharmaceuticals,
Inc. (a) | | | 3,524,346 | | |
| | 222,923 | | | Denali Therapeutics, Inc. (a) | | | 6,393,432 | | |
| | 33,297 | | | Design Therapeutics, Inc. (a) | | | 520,099 | | |
| | 61,650 | | | Eagle Pharmaceuticals, Inc. (a) | | | 1,940,125 | | |
| | 252,522 | | | Emergent Biosolutions, Inc. (a) | | | 5,267,609 | | |
Shares | | | | Fair Value | |
Chemical Manufacturing (continued) | | | |
| | 68,576 | | | Enanta Pharmaceuticals,
Inc. (a) | | $ | 3,093,463 | | |
| | 94,475 | | | ERASCA, Inc. (a)(b) | | | 771,861 | | |
| | 244,893 | | | FibroGen, Inc. (a) | | | 3,986,858 | | |
| | 147,878 | | | G1 Therapeutics, Inc. (a) | | | 1,576,379 | | |
| | 593,469 | | | Geron Corp. (a) | | | 1,317,501 | | |
| | 114,160 | | | Gilead Sciences, Inc. | | | 8,956,994 | | |
| | 246,588 | | | Gossamer Bio, Inc. (a) | | | 2,737,127 | | |
| | 179,759 | | | Halozyme Therapeutics, Inc. (a) | | | 8,594,278 | | |
| | 647,709 | | | Heron Therapeutics, Inc. (a) | | | 2,493,680 | | |
| | 112,773 | | | Horizon Therapeutics PLC
ADR (Ireland) (a) | | | 7,028,013 | | |
| | 434,730 | | | ImmunityBio, Inc. (a)(b) | | | 2,391,015 | | |
| | 1,018,599 | | | Immunogen, Inc. (a) | | | 6,050,478 | | |
| | 103,145 | | | Incyte Corp. (a) | | | 7,667,799 | | |
| | 300,056 | | | Insmed, Inc. (a) | | | 5,196,970 | | |
| | 115,560 | | | Intellia Therapeutics, Inc. (a) | | | 6,099,257 | | |
| | 242,504 | | | Intercept Pharmaceuticals,
Inc. (a) | | | 3,363,530 | | |
| | 159,044 | | | Ionis Pharmaceuticals, Inc. (a) | | | 7,029,745 | | |
| | 677,210 | | | Ironwood Pharmaceuticals,
Inc. Class A (a) | | | 7,408,677 | | |
| | 135,416 | | | iTeos Therapeutics, Inc. (a) | | | 2,637,904 | | |
| | 29,767 | | | Karuna Therapeutics, Inc. (a) | | | 6,529,094 | | |
| | 718,117 | | | Karyopharm Therapeutics,
Inc. (a) | | | 3,418,237 | | |
| | 56,179 | | | Krystal Biotech, Inc. (a) | | | 4,297,693 | | |
| | 38,992 | | | Ligand Pharmaceuticals, Inc. (a) | | | 3,417,649 | | |
| | 70,857 | | | Madrigal Pharmaceuticals,
Inc. (a) | | | 5,018,093 | | |
| | 1,564,896 | | | MannKind Corp. (a) | | | 5,289,348 | | |
| | 229,845 | | | Mersana Therapeutics Inc. (a) | | | 1,806,582 | | |
| | 62,985 | | | Mirum Pharmaceuticals, Inc. (a) | | | 1,420,312 | | |
| | 101,540 | | | Morphic Holding, Inc. (a) | | | 2,844,135 | | |
| | 174,377 | | | Myovant Sciences, Ltd. ADR
(United Kingdom) (a) | | | 4,662,841 | | |
| | 184,053 | | | Myriad Genetics, Inc. (a) | | | 3,817,259 | | |
| | 70,043 | | | Neurocrine Biosciences, Inc. (a) | | | 8,063,350 | | |
| | 234,822 | | | Novavax, Inc. (a)(b) | | | 5,229,486 | | |
| | 311,018 | | | PMV Pharmaceuticals, Inc. (a) | | | 3,828,632 | | |
| | 102,106 | | | Prometheus Biosciences, Inc. (a) | | | 5,362,607 | | |
| | 114,652 | | | Prothena Corp. PLC (a) | | | 7,044,219 | | |
| | 138,937 | | | PTC Therapeutics, Inc. (a) | | | 5,254,597 | | |
| | 76,561 | | | RAPT Therapeutics, Inc. (a) | | | 1,670,561 | | |
| | 10,278 | | | Regeneron Pharmaceuticals,
Inc. (a) | | | 7,695,653 | | |
| | 125,798 | | | REGENXBIO, Inc. (a) | | | 2,977,639 | | |
| | 79,688 | | | Replimune Group Inc. (a) | | | 1,463,072 | | |
| | 281,901 | | | Rhythm Pharmaceuticals,
Inc. (a) | | | 7,095,448 | | |
| | 243,647 | | | Rocket Pharmaceuticals, Inc. (a) | | | 4,546,453 | | |
| | 177,397 | | | Sage Therapeutics, Inc. (a) | | | 6,680,771 | | |
| | 433,776 | | | Sangamo Therapeutics, Inc. (a) | | | 1,904,277 | | |
| | 63,052 | | | Sarepta Therapeutics, Inc. (a) | | | 7,189,189 | | |
| | 47,788 | | | Seagen, Inc. (a) | | | 6,076,722 | | |
| | 219,933 | | | Seres Therapeutics, Inc. (a) | | | 1,948,606 | | |
| | 262,739 | | | SpringWorks Therapeutics,
Inc. (a) | | | 6,308,363 | | |
The accompanying notes are an integral part of these financial statements.
DIREXION ANNUAL REPORT
107
Direxion Daily S&P Biotech Bull 3X Shares
Schedule of Investments, continued
October 31, 2022
Shares | | | | Fair Value | |
Chemical Manufacturing (continued) | | | |
| | 157,375 | | | Syndax Pharmaceuticals Inc. (a) | | $ | 3,613,330 | | |
| | 831,341 | | | TG Therapeutics, Inc. (a) | | | 4,838,405 | | |
| | 221,126 | | | Travere Therapeutics, Inc. (a) | | | 4,794,012 | | |
| | 169,077 | | | Twist Bioscience Corp. (a) | | | 5,550,798 | | |
| | 151,260 | | | Ultragenyx Pharmaceutical,
Inc. (a) | | | 6,119,980 | | |
| | 226,323 | | | uniQure N.V. ADR
(Netherlands) (a) | | | 4,214,134 | | |
| | 33,299 | | | United Therapeutics Corp. (a) | | | 7,676,418 | | |
| | 147,388 | | | Vanda Pharmaceuticals, Inc. (a) | | | 1,543,152 | | |
| | 371,627 | | | Veracyte, Inc. (a) | | | 7,473,419 | | |
| | 151,670 | | | Vericel Corp. (a) | | | 4,076,890 | | |
| | 25,505 | | | Vertex Pharmaceuticals, Inc. (a) | | | 7,957,560 | | |
| | 62,196 | | | Viridian Therapeutics, Inc. (a)(b) | | | 1,237,700 | | |
| | 122,976 | | | Xencor, Inc. (a) | | | 3,443,328 | | |
| | | | 456,395,242 | | |
Merchant Wholesalers, Nondurable Goods - 1.4% | | | |
| | 573,518 | | | Atara Biotherapeutics, Inc. (a) | | | 2,672,594 | | |
| | 121,145 | | | C4 Therapeutics, Inc. (a) | | | 1,165,415 | | |
| | 372,925 | | | Protagonist Therapeutics
Inc. (a) | | | 3,020,692 | | |
| | 210,808 | | | Relay Therapeutics, Inc. (a) | | | 4,684,154 | | |
| | 197,554 | | | Zentalis Pharmaceuticals,
Inc. (a) | | | 4,956,630 | | |
| | | | 16,499,485 | | |
Miscellaneous Manufacturing - 1.3% | | | |
| | 30,613 | | | Anika Therapeutics, Inc. (a) | | | 870,021 | | |
| | 1,996,820 | | | Inovio Pharmaceuticals, Inc. (a) | | | 4,313,131 | | |
| | 175,336 | | | MiMedx Group, Inc. (a) | | | 518,995 | | |
| | 88,005 | | | Mirati Therapeutics, Inc. (a) | | | 5,924,497 | | |
| | 2,079,157 | | | Ocugen, Inc. (a)(b) | | | 3,576,150 | | |
| | | | 15,202,794 | | |
Pharmaceuticals, Biotechnology & Life Sciences - 0.1% | | | |
| | 24,726 | | | Biohaven, Ltd. (a)(b) | | | 409,710 | | |
Professional, Scientific, and Technical Services - 12.8% | | | |
| | 1,499,415 | | | Agenus, Inc. (a) | | | 3,763,532 | | |
| | 201,155 | | | Alector, Inc. (a) | | | 1,850,626 | | |
| | 494,332 | | | Allogene Therapeutics, Inc. (a) | | | 5,091,620 | | |
| | 83,419 | | | AnaptysBio, Inc. (a) | | | 2,406,638 | | |
| | 295,546 | | | Anavex Life Sciences Corp. (a) | | | 3,596,795 | | |
| | 110,245 | | | Apellis Pharmaceuticals, Inc. (a) | | | 6,668,720 | | |
| | 193,145 | | | Arrowhead Pharmaceuticals,
Inc. (a) | | | 6,723,377 | | |
| | 71,020 | | | Avidity Biosciences, Inc. (a) | | | 1,014,166 | | |
| | 111,287 | | | Crispr Therapeutics AG ADR
(Switzerland) (a) | | | 5,824,761 | | |
| | 136,750 | | | Cytokinetics, Inc. (a) | | | 5,970,505 | | |
| | 639,360 | | | Dynavax Technologies
Corp. (a)(b) | | | 7,320,672 | | |
| | 470,648 | | | Editas Medicine, Inc. (a) | | | 5,906,632 | | |
| | 183,240 | | | Exact Sciences Corp. (a) | | | 6,373,087 | | |
| | 416,199 | | | Exelixis, Inc. (a) | | | 6,900,579 | | |
| | 264,917 | | | Fate Therapeutics, Inc. (a) | | | 5,542,064 | | |
| | 120,596 | | | IDEAYA Biosciences, Inc. (a) | | | 2,036,866 | | |
| | 142,966 | | | Inhibrx, Inc. (a) | | | 4,600,646 | | |
| | 400,849 | | | Iveric Bio, Inc. (a) | | | 9,588,308 | | |
| | 262,944 | | | Kezar Life Sciences, Inc. (a) | | | 1,976,024 | | |
Shares | | | | Fair Value | |
Professional, Scientific, and Technical Services (continued) | | | |
| | 303,142 | | | Kura Oncology, Inc. (a) | | $ | 4,704,764 | | |
| | 193,046 | | | Kymera Therapeutics, Inc. (a) | | | 5,857,016 | | |
| | 221,875 | | | Lyell Immunopharma, Inc. (a)(b) | | | 1,304,625 | | |
| | 52,361 | | | Moderna, Inc. (a) | | | 7,871,429 | | |
| | 173,413 | | | Nkarta, Inc. (a) | | | 2,186,738 | | |
| | 140,808 | | | Nurix Therapeutics, Inc. (a) | | | 1,792,486 | | |
| | 185,411 | | | Recursion Pharmaceuticals,
Inc. (a) | | | 1,956,086 | | |
| | 287,903 | | | Revolution Medicines, Inc. (a) | | | 5,832,915 | | |
| | 3,143,375 | | | Sorrento Therapeutics Inc. (a) | | | 4,935,099 | | |
| | 100,322 | | | Vaxcyte, Inc. (a) | | | 4,375,042 | | |
| | 192,283 | | | Verve Therapeutics, Inc. (a)(b) | | | 7,249,069 | | |
| | 332,959 | | | Vir Biotechnology, Inc. (a) | | | 7,318,439 | | |
| | | | 148,539,326 | | |
Securities, Commodity Contracts, and Other Financial Investments and Related Activities - 0.8% | | | |
| | 162,573 | | | Cerevel Therapeutics
Holdings, Inc. (a) | | | 4,545,541 | | |
| | 629,148 | | | EQRx, Inc. (a)(b) | | | 3,233,821 | | |
| | 159,746 | | | POINT Biopharma Global
Inc. (a) | | | 1,490,430 | | |
| | | | 9,269,792 | | |
Specialty Trade Contractors - 0.2% | | | |
| | 1,134,068 | | | Vaxart, Inc. (a)(b) | | | 1,893,894 | | |
Support Activities for Transportation - 0.5% | | | |
| | 665,203 | | | Iovance Biotherapeutics, Inc. (a) | | | 6,212,996 | | |
| | | | | TOTAL COMMON STOCKS
(Cost $677,368,268) | | $ | 676,744,497 | | |
SHORT TERM INVESTMENTS - 45.8% | | | |
Money Market Funds - 45.8% | | | |
| | 372,864,904 | | | Dreyfus Government Cash
Management Institutional
Shares, 2.91% (c)(d) | | $ | 372,864,904 | | |
| | 72,549,696 | | | Dreyfus Treasury Securities
Cash Management
Institutional Shares,
3.01% (c) | | | 72,549,696 | | |
| | 46,480,000 | | | Goldman Sachs Financial
Square Government Fund
Institutional Shares,
3.07% (c) | | | 46,480,000 | | |
| | 38,828,910 | | | Goldman Sachs Financial
Square Treasury
Instruments Fund
Institutional Shares,
3.10% (c) | | | 38,828,910 | | |
| | | | | TOTAL SHORT TERM
INVESTMENTS
(Cost $530,723,510) | | $ | 530,723,510 | | |
| | | | | TOTAL INVESTMENTS
(Cost $1,208,091,778) -
104.1% (e) | | $ | 1,207,468,007 | | |
| | | | | Liabilities in Excess of
Other Assets - (4.1)% | | | (47,621,190 | ) | |
| | | | | TOTAL NET ASSETS - 100.0% | | $ | 1,159,846,817 | | |
The accompanying notes are an integral part of these financial statements.
DIREXION ANNUAL REPORT
108
Direxion Daily S&P Biotech Bull 3X Shares
Schedule of Investments, continued
October 31, 2022
Percentages are stated as a percent of net assets.
The geographic location of all investments is United States unless otherwise indicated.
(a) Non-income producing security.
(b) A portion of this security represents a security on loan.
(c) Represents annualized seven-day yield at October 31, 2022.
(d) All or a portion of this security represents an investment of securities lending collateral.
(e) All or a portion of these securities have been segregated as collateral for swap contracts. Total value of securities segregated amounted to $881,689,588.
ADR - American Depository Receipt
Long Total Return Swap Contracts
October 31, 2022
Terms of Payments
to be Received at
Termination | | Terms of Payments
to be Paid at
Termination | | Counterparty | | Termination
Date | | Contracts | | Notional
Amount | | Unrealized
Appreciation
(Depreciation) | |
Total return of
S&P Biotechnology
Select Industry Index | |
3.2900% representing
1 month SOFR rate + spread | | J.P. Morgan | | 12/6/2022 | | | 32,028 | | | $ | 201,863,091 | | | $ | 1,444,155 | | |
Total return of
S&P Biotechnology
Select Industry Index | |
3.1700% representing
1 month SOFR rate + spread | | Citibank N.A. | | 12/13/2022 | | | 91,173 | | | | 551,676,350 | | | | 29,629,455 | | |
Total return of
S&P Biotechnology
Select Industry Index | |
2.8400% representing
1 month SOFR rate + spread | | Bank of America
Merrill Lynch | | 12/13/2022 | | | 40,000 | | | | 199,946,727 | | | | 53,975,206 | | |
Total return of
S&P Biotechnology
Select Industry Index | |
3.8100% representing
1 month SOFR rate + spread | | UBS Securities LLC | | 12/14/2022 | | | 70,391 | | | | 441,740,229 | | | | 7,058,616 | | |
Total return of
S&P Biotechnology
Select Industry Index | |
3.5400% representing
1 month SOFR rate + spread | | BNP Paribas | | 12/15/2022 | | | 50,000 | | | | 321,003,188 | | | | (2,593,769 | ) | |
Total return of
S&P Biotechnology
Select Industry Index | |
3.9900% representing
1 month SOFR rate + spread | | Barclays | | 4/4/2023 | | | 91,192 | | | | 607,906,354 | | | | (29,118,850 | ) | |
Total return of
S&P Biotechnology
Select Industry Index | |
3.5400% representing
1 month SOFR rate + spread | | Goldman Sachs | | 7/18/2023 | | | 64,000 | | | | 362,246,499 | | | | 43,826,662 | | |
| | | | | | | | | | | $ | 2,686,382,438 | | | $ | 104,221,475 | | |
The accompanying notes are an integral part of these financial statements.
DIREXION ANNUAL REPORT
109
Direxion Daily S&P Biotech Bear 3X Shares
Schedule of Investments
October 31, 2022
Shares | | | | Fair Value | |
SHORT TERM INVESTMENTS - 105.9% | | | |
Money Market Funds - 105.9% | | | |
| | 91,665,163 | | | Dreyfus Government Cash
Management Institutional
Shares, 2.91% (a) | | $ | 91,665,163 | | |
| | 28,119,022 | | | Dreyfus Treasury Securities
Cash Management
Institutional Shares, 3.01% (a) | | | 28,119,022 | | |
| | 28,190,000 | | | Goldman Sachs Financial
Square Government Fund
Institutional Shares, 3.07% (a) | | | 28,190,000 | | |
| | 53,289,561 | | | Goldman Sachs Financial Square
Treasury Instruments Fund
Institutional Shares, 3.10% (a) | | | 53,289,561 | | |
| | | | | TOTAL SHORT TERM
INVESTMENTS
(Cost $201,263,746) (b) | | $ | 201,263,746 | | |
| | | | | TOTAL INVESTMENTS
(Cost $201,263,746) -
105.9% | | $ | 201,263,746 | | |
| | | | | Liabilities in Excess of Other
Assets - (5.9)% | | | (11,288,978 | ) | |
| | | | | TOTAL NET ASSETS - 100.0% | | $ | 189,974,768 | | |
Percentages are stated as a percent of net assets.
The geographic location of all investments is United States unless otherwise indicated.
(a) Represents annualized seven-day yield at October 31, 2022.
(b) All or a portion of these securities have been segregated as collateral for swap contracts. Total value of securities segregated amounted to $124,068,723.
Short Total Return Swap Contracts
October 31, 2022
Terms of Payments
to be Received at
Termination | | Terms of Payments
to be Paid at
Termination | | Counterparty | | Termination
Date | | Contracts | | Notional
Amount | | Unrealized
Appreciation
(Depreciation) | |
2.8900% representing
1 month SOFR rate + spread | | Total return of
S&P Biotechnology
Select Industry Index | | J.P. Morgan | | 12/6/2022 | | | 15,925 | | | $ | 110,171,379 | | | $ | 8,889,722 | | |
3.2900% representing
1 month SOFR rate + spread | | Total return of
S&P Biotechnology
Select Industry Index | | Barclays | | 12/7/2022 | | | 21,619 | | | | 141,425,494 | | | | 3,994,272 | | |
2.8900% representing
1 month SOFR rate + spread | | Total return of
S&P Biotechnology
Select Industry Index | | Citibank N.A. | | 12/13/2022 | | | 15,055 | | | | 94,864,811 | | | | (1,152,085 | ) | |
2.6400% representing
1 month SOFR rate + spread | | Total return of
S&P Biotechnology
Select Industry Index | | Bank of America
Merrill Lynch | | 12/13/2022 | | | 4,943 | | | | 25,698,756 | | | | (5,716,010 | ) | |
3.2600% representing
1 month SOFR rate + spread | | Total return of
S&P Biotechnology
Select Industry Index | | UBS Securities LLC | | 12/14/2022 | | | 16,674 | | | | 109,556,036 | | | | 3,249,952 | | |
3.2400% representing
1 month SOFR rate + spread | | Total return of
S&P Biotechnology
Select Industry Index | | Goldman Sachs | | 7/31/2023 | | | 15,000 | | | | 86,296,754 | | | | (8,816,375 | ) | |
| | | | | | | | | | | | | $ | 568,013,230 | | | $ | 449,476 | | |
The accompanying notes are an integral part of these financial statements.
DIREXION ANNUAL REPORT
110
Direxion Daily Semiconductor Bull 3X Shares
Schedule of Investments
October 31, 2022
Shares | | | | Fair Value | |
COMMON STOCKS - 72.4% | | | |
Computer and Electronic Product Manufacturing - 58.2% | | | |
| | 1,993,112 | | | Advanced Micro Devices,
Inc. (a) | | $ | 119,706,307 | | |
| | 726,511 | | | Analog Devices, Inc. | | | 103,614,999 | | |
| | 466,694 | | | Broadcom, Inc. | | | 219,402,183 | | |
| | 3,440,788 | | | Intel Corp. | | | 97,821,603 | | |
| | 522,293 | | | Lattice Semiconductor
Corp. (a) | | | 25,336,433 | | |
| | 2,243,302 | | | Marvell Technology, Inc. | | | 89,014,223 | | |
| | 1,814,579 | | | Microchip Technology, Inc. | | | 112,032,107 | | |
| | 2,018,849 | | | Micron Technology, Inc. | | | 109,219,731 | | |
| | 220,944 | | | MKS Instruments, Inc. | | | 18,150,550 | | |
| | 169,299 | | | Monolithic Power Systems,
Inc. | | | 57,468,545 | | |
| | 1,375,780 | | | NVIDIA Corp. (a) | | | 185,689,027 | | |
| | 679,333 | | | NXP Semiconductors NV
ADR (Netherlands) | | | 99,236,965 | | |
| | 1,657,648 | | | ON Semiconductor Corp. (a) | | | 101,829,317 | | |
| | 396,672 | | | Qorvo, Inc. (a) | | | 34,145,526 | | |
| | 1,297,779 | | | Qualcomm, Inc. | | | 152,696,677 | | |
| | 616,334 | | | Skyworks Solutions, Inc. | | | 53,010,887 | | |
| | 1,092,181 | | | STMicroelectronics NV ADR
(Netherlands) | | | 33,988,673 | | |
| | 1,328,134 | | | Taiwan Semiconductor
Manufacturing Co. Ltd.
(Taiwan) ADR | | | 81,746,648 | | |
| | 614,520 | | | Teradyne, Inc. | | | 49,991,202 | | |
| | 1,396,685 | | | Texas Instruments, Inc. | | | 224,349,511 | | |
| | 2,995,590 | | | United Microelectronics
Corp. ADR (Taiwan) (b) | | | 17,763,849 | | |
| | 472,467 | | | Wolfspeed, Inc. (a) | | | 37,206,776 | | |
| | | | 2,023,421,739 | | |
Credit Intermediation and Related Activities - 0.4% | | | |
| | 2,615,914 | | | ASE Technology Holding
Co., Ltd. ADR (Taiwan) | | | 13,315,002 | | |
Electrical Equipment, Appliance, and Component Manufacturing - 0.4% | | | |
| | 149,765 | | | Synaptics, Inc. (a) | | | 13,269,179 | | |
Machinery Manufacturing - 8.7% | | | |
| | 1,177,932 | | | Applied Materials, Inc. | | | 103,999,616 | | |
| | 204,828 | | | ASML Holding NV ADR
(Netherlands) | | | 96,764,844 | | |
| | 249,395 | | | Lam Research Corp. | | | 100,950,108 | | |
| | | | 301,714,568 | | |
Merchant Wholesalers, Durable Goods - 4.3% | | | |
| | 567,669 | | | Entegris, Inc. | | | 45,038,858 | | |
| | 325,124 | | | KLA-Tencor Corp. | | | 102,885,490 | | |
| | | | 147,924,348 | | |
Primary Metal Manufacturing - 0.4% | | | |
| | 137,521 | | | Silicon Laboratories, Inc. (a) | | | 15,803,914 | | |
| | | | | TOTAL COMMON STOCKS
(Cost $2,585,877,599) | | $ | 2,515,448,750 | | |
Shares | | | | Fair Value | |
SHORT TERM INVESTMENTS - 63.4% | | | |
Money Market Funds - 63.4% | | | |
| | 1,061,884,995 | | | Dreyfus Government Cash
Management
Institutional
Shares, 2.91% (c)(d) | | $ | 1,061,884,995 | | |
| | 444,020,000 | | | Dreyfus Treasury Securities
Cash Management
Institutional Shares,
3.01% (c) | | | 444,020,000 | | |
| | 144,960,000 | | | Goldman Sachs Financial
Square Government Fund
Institutional Shares,
3.07% (c) | | | 144,960,000 | | |
| | 553,323,107 | | | Goldman Sachs Financial
Square Treasury
Instruments Fund
Institutional Shares,
3.10% (c) | | | 553,323,107 | | |
| | | | | TOTAL SHORT TERM
INVESTMENTS
(Cost $2,204,188,102) | | $ | 2,204,188,102 | | |
| | | | | TOTAL INVESTMENTS
(Cost $4,790,065,701) -
135.8% (e) | | $ | 4,719,636,852 | | |
| | | | | Liabilities in Excess of
Other Assets - (35.8)% | | | (1,245,564,582 | ) | |
| | | | | TOTAL NET ASSETS -
100.0% | | $ | 3,474,072,270 | | |
Percentages are stated as a percent of net assets.
The geographic location of all investments is United States unless otherwise indicated.
(a) Non-income producing security.
(b) A portion of this security represents a security on loan.
(c) Represents annualized seven-day yield at October 31, 2022.
(d) All or a portion of this security represents an investment of securities lending collateral.
(e) All or a portion of these securities have been segregated as collateral for swap contracts. Total value of securities segregated amounted to $3,221,730,540.
ADR - American Depository Receipt
The accompanying notes are an integral part of these financial statements.
DIREXION ANNUAL REPORT
111
Direxion Daily Semiconductor Bull 3X Shares
Long Total Return Swap Contracts
October 31, 2022
Terms of Payments
to be Received at
Termination | | Terms of Payments
to be Paid at
Termination | | Counterparty | | Termination
Date | | Contracts | | Notional
Amount | | Unrealized
Appreciation
(Depreciation) | |
Total return of ICE
Semiconductor Index | | 3.8900% representing
1 month SOFR rate + spread | | Goldman Sachs | | 11/16/2022 | | | 2,809,771 | | | $ | 1,544,612,737 | | | $ | 14,120,151 | | |
Total return of ICE
Semiconductor Index | | 3.8200% representing
1 month SOFR rate + spread | | Barclays | | 12/7/2022 | | | 1,896,110 | | | | 1,216,158,231 | | | | (168,978,420 | ) | |
Total return of ICE
Semiconductor Index | | 3.4900% representing
1 month SOFR rate + spread | | Citibank N.A. | | 12/13/2022 | | | 2,020,603 | | | | 1,331,557,171 | | | | (214,149,480 | ) | |
Total return of ICE
Semiconductor Index | | 3.6400% representing
1 month SOFR rate + spread | | Bank of America
Merrill Lynch | | 12/13/2022 | | | 1,934,793 | | | | 1,325,166,422 | | | | (255,875,812 | ) | |
Total return of ICE
Semiconductor Index | | 3.7900% representing
1 month SOFR rate + spread | | UBS Securities LLC | | 12/14/2022 | | | 1,443,564 | | | | 936,013,486 | | | | (138,967,957 | ) | |
Total return of ICE
Semiconductor Index | | 3.9300% representing
1 month SOFR rate + spread | | BNP Paribas | | 12/15/2022 | | | 1,677,684 | | | | 1,017,683,114 | | | | (91,730,636 | ) | |
Total return of ICE
Semiconductor Index | | 3.3400% representing
1 month SOFR rate + spread | | J.P. Morgan | | 12/6/2023 | | | 2,455,363 | | | | 1,316,262,307 | | | | 46,788,719 | | |
| | | | | | | | | | | $ | 8,687,453,468 | | | $ | (808,793,435 | ) | |
The accompanying notes are an integral part of these financial statements.
DIREXION ANNUAL REPORT
112
Direxion Daily Semiconductor Bear 3X Shares
Schedule of Investments
October 31, 2022
Shares | | | | Fair Value | |
SHORT TERM INVESTMENTS - 93.5% | | | |
Money Market Funds - 93.5% | | | |
| | 254,869,523 | | | Dreyfus Government Cash
Management Institutional
Shares, 2.91% (a) | | $ | 254,869,523 | | |
| | 66,848,238 | | | Dreyfus Treasury Securities
Cash Management
Institutional Shares, 3.01% (a) | | | 66,848,238 | | |
| | 45,473,247 | | | Goldman Sachs Financial
Square Government Fund
Institutional Shares, 3.07% (a) | | | 45,473,247 | | |
| | 185,540,273 | | | Goldman Sachs Financial
Square Treasury Instruments
Fund Institutional Shares,
3.10% (a) | | | 185,540,273 | | |
| | | | | TOTAL SHORT TERM
INVESTMENTS
(Cost $552,731,281) (b) | | $ | 552,731,281 | | |
| | | | | TOTAL INVESTMENTS
(Cost $552,731,281) - 93.5% | | $ | 552,731,281 | | |
| | | | | Other Assets in Excess of
Liabilities - 6.5% | | | 38,239,668 | | |
| | | | | TOTAL NET ASSETS - 100.0% | | $ | 590,970,949 | | |
Percentages are stated as a percent of net assets.
The geographic location of all investments is United States unless otherwise indicated.
(a) Represents annualized seven-day yield at October 31, 2022.
(b) All or a portion of these securities have been segregated as collateral for swap contracts. Total value of securities segregated amounted to $387,351,277.
Short Total Return Swap Contracts
October 31, 2022
Terms of Payments
to be Received at
Termination | | Terms of Payments
to be Paid at
Termination | | Counterparty | | Termination
Date | | Contracts | | Notional
Amount | | Unrealized
Appreciation
(Depreciation) | |
3.3700% representing
1 month SOFR rate + spread | | Total return of ICE
Semiconductor Index | | Barclays | | 12/7/2022 | | | 400,269 | | | $ | 229,061,941 | | | $ | 7,377,084 | | |
3.1900% representing
1 month SOFR rate + spread | | Total return of ICE
Semiconductor Index | | Citibank N.A. | | 12/13/2022 | | | 344,486 | | | | 232,227,866 | | | | 41,537,915 | | |
3.4400% representing
1 month SOFR rate + spread | | Total return of ICE
Semiconductor Index | | Bank of America
Merrill Lynch | | 12/13/2022 | | | 277,876 | | | | 191,801,079 | | | | 38,055,359 | | |
3.4400% representing
1 month SOFR rate + spread | | Total return of ICE
Semiconductor Index | | UBS Securities
LLC | | 12/14/2022 | | | 489,687 | | | | 297,481,924 | | | | 26,354,843 | | |
3.0800% representing
1 month SOFR rate + spread | | Total return of ICE
Semiconductor Index | | BNP Paribas | | 12/15/2022 | | | 447,941 | | | | 301,873,092 | | | | 53,944,558 | | |
2.8900% representing
1 month SOFR rate + spread | | Total return of ICE
Semiconductor Index | | J.P. Morgan | | 12/6/2023 | | | 632,587 | | | | 333,192,455 | | | | (18,107,850 | ) | |
3.1900% representing
1 month SOFR rate + spread | | Total return of ICE
Semiconductor Index | | Goldman Sachs | | 12/6/2023 | | | 599,217 | | | | 331,384,079 | | | | (1,485,602 | ) | |
| | | | | | | | | | | | | $ | 1,917,022,436 | | | $ | 147,676,307 | | |
The accompanying notes are an integral part of these financial statements.
DIREXION ANNUAL REPORT
113
Direxion Daily Technology Bull 3X Shares
Schedule of Investments
October 31, 2022
Shares | | | | Fair Value | |
COMMON STOCKS - 67.6% | | | |
Administrative and Support Services - 4.1% | | | |
| | 46,832 | | | Automatic Data Processing,
Inc. | | $ | 11,319,293 | | |
| | 13,213 | | | Broadridge Financial
Solutions, Inc. | | | 1,982,743 | | |
| | 8,454 | | | FleetCor Technologies, Inc. (a) | | | 1,573,459 | | |
| | 8,911 | | | Gartner, Inc. (a) | | | 2,690,409 | | |
| | 184,194 | | | Visa, Inc. Class A | | | 38,157,629 | | |
| | | | 55,723,533 | | |
Amusement, Gambling, and Recreation Industries - 0.3% | | | |
| | 31,238 | | | Global Payments, Inc. | | | 3,569,254 | | |
Computer and Electronic Product Manufacturing - 32.6% | | | |
| | 181,867 | | | Advanced Micro Devices,
Inc. (a) | | | 10,922,932 | | |
| | 67,023 | | | Amphenol Corp. Class A | | | 5,082,354 | | |
| | 58,560 | | | Analog Devices, Inc. | | | 8,351,827 | | |
| | 1,452,478 | | | Apple, Inc. | | | 222,722,977 | | |
| | 27,782 | | | Arista Networks, Inc. (a) | | | 3,357,733 | | |
| | 45,510 | | | Broadcom, Inc. | | | 21,395,161 | | |
| | 466,546 | | | Cisco Systems, Inc. | | | 21,195,185 | | |
| | 15,243 | | | Enphase Energy, Inc. (a) | | | 4,679,601 | | |
| | 73,743 | | | Fortinet, Inc. (a) | | | 4,215,150 | | |
| | 102,529 | | | HP, Inc. | | | 2,831,851 | | |
| | 462,601 | | | Intel Corp. | | | 13,151,746 | | |
| | 101,756 | | | International Business
Machines Corp. | | | 14,071,837 | | |
| | 20,280 | | | Keysight Technologies, Inc. (a) | | | 3,531,762 | | |
| | 62,247 | | | Microchip Technology, Inc. | | | 3,843,130 | | |
| | 124,289 | | | Micron Technology, Inc. | | | 6,724,035 | | |
| | 5,007 | | | Monolithic Power Systems,
Inc. | | | 1,699,626 | | |
| | 18,807 | | | Motorola Solutions, Inc. | | | 4,696,296 | | |
| | 24,750 | | | NetApp, Inc. | | | 1,714,433 | | |
| | 282,092 | | | NVIDIA Corp. (a) | | | 38,073,957 | | |
| | 29,598 | | | NXP Semiconductors NV ADR
(Netherlands) | | | 4,323,676 | | |
| | 48,792 | | | ON Semiconductor Corp. (a) | | | 2,997,293 | | |
| | 11,638 | | | Qorvo, Inc. (a) | | | 1,001,799 | | |
| | 126,486 | | | Qualcomm, Inc. | | | 14,882,343 | | |
| | 11,941 | | | Roper Technologies, Inc. | | | 4,950,022 | | |
| | 21,997 | | | Seagate Technology Holdings
PLC ADR (Ireland) | | | 1,092,371 | | |
| | 18,075 | | | Skyworks Solutions, Inc. | | | 1,554,631 | | |
| | 6,259 | | | SolarEdge Technologies, Inc. (a) | | | 1,439,758 | | |
| | 17,658 | | | Teradyne, Inc. | | | 1,436,478 | | |
| | 102,933 | | | Texas Instruments, Inc. | | | 16,534,128 | | |
| | 27,890 | | | Trimble, Inc. (a) | | | 1,677,862 | | |
| | 35,282 | | | Western Digital Corp. (a) | | | 1,212,642 | | |
| | 5,838 | | | Zebra Technologies Corp.
Class A (a) | | | 1,653,438 | | |
| | | | 447,018,034 | | |
Computing Infrastructure Providers, Data Processing, Web Hosting, and Related Services - 0.5% | | | |
| | 72,057 | | | Fiserv, Inc. (a) | | | 7,403,136 | | |
Shares | | | | Fair Value | |
Credit Intermediation and Related Activities - 2.7% | | | |
| | 68,490 | | | Fidelity National Information
Services, Inc. | | $ | 5,683,985 | | |
| | 96,108 | | | MasterCard, Inc. Class A | | | 31,540,724 | | |
| | | | 37,224,709 | | |
Electrical Equipment, Appliance, and Component Manufacturing - 0.3% | | | |
| | 36,030 | | | TE Connectivity Ltd. ADR
(Switzerland) | | | 4,403,947 | | |
Machinery Manufacturing - 1.1% | | | |
| | 98,022 | | | Applied Materials, Inc. | | | 8,654,362 | | |
| | 15,428 | | | Lam Research Corp. | | | 6,244,946 | | |
| | | | 14,899,308 | | |
Merchant Wholesalers, Durable Goods - 0.4% | | | |
| | 15,974 | | | KLA-Tencor Corp. | | | 5,054,972 | | |
Nonmetallic Mineral Product Manufacturing - 0.2% | | | |
| | 85,729 | | | Corning, Inc. | | | 2,757,902 | | |
Professional, Scientific, and Technical Services - 3.9% | | | |
| | 71,268 | | | Accenture PLC Class A ADR
(Ireland) | | | 20,232,985 | | |
| | 15,223 | | | CDW Corp. | | | 2,630,687 | | |
| | 58,322 | | | Cognizant Technology
Solutions Corp. Class A | | | 3,630,544 | | |
| | 25,894 | | | DXC Technology Co. (a) | | | 744,452 | | |
| | 6,485 | | | EPAM Systems, Inc. (a) | | | 2,269,750 | | |
| | 6,710 | | | F5 Networks, Inc. (a) | | | 958,926 | | |
| | 8,202 | | | Jack Henry & Associates, Inc. | | | 1,632,690 | | |
| | 36,366 | | | Juniper Networks, Inc. | | | 1,112,800 | | |
| | 36,074 | | | Paychex, Inc. | | | 4,267,915 | | |
| | 5,468 | | | Paycom Software, Inc. (a) | | | 1,891,928 | | |
| | 22,748 | | | ServiceNow, Inc. (a) | | | 9,570,994 | | |
| | 5,287 | | | Teledyne Technologies, Inc. (a) | | | 2,104,120 | | |
| | 10,491 | | | VeriSign, Inc. (a) | | | 2,103,026 | | |
| | | | 53,150,817 | | |
Publishing Industries - 17.7% | | | |
| | 52,750 | | | Adobe Systems, Inc. (a) | | | 16,800,875 | | |
| | 9,794 | | | ANSYS, Inc. (a) | | | 2,166,041 | | |
| | 24,472 | | | Autodesk, Inc. (a) | | | 5,244,350 | | |
| | 30,857 | | | Cadence Design Systems,
Inc. (a) | | | 4,671,441 | | |
| | 31,789 | | | Intuit, Inc. | | | 13,589,798 | | |
| | 840,220 | | | Microsoft Corp. | | | 195,040,269 | | |
| | 17,217 | | | Synopsys, Inc. (a) | | | 5,036,833 | | |
| | | | 242,549,607 | | |
Publishing Industries (except Internet) - 3.0% | | | |
| | 17,895 | | | Akamai Technologies, Inc. (a) | | | 1,580,665 | | |
| | 17,226 | | | Ceridian HCM Holding, Inc. (a) | | | 1,140,189 | | |
| | 146,386 | | | Hewlett Packard Enterprise
Co. | | | 2,088,928 | | |
| | 66,718 | | | NortonLifeLock, Inc. (a) | | | 1,503,157 | | |
| | 171,140 | | | Oracle Corp. | | | 13,360,900 | | |
| | 11,915 | | | PTC, Inc. (a) | | | 1,403,944 | | |
| | 112,097 | | | Salesforce.com, Inc. (a) | | | 18,225,851 | | |
| | 4,684 | | | Tyler Technologies, Inc. (a) | | | 1,514,478 | | |
| | | | 40,818,112 | | |
The accompanying notes are an integral part of these financial statements.
DIREXION ANNUAL REPORT
114
Direxion Daily Technology Bull 3X Shares
Schedule of Investments, continued
October 31, 2022
Shares | | | | Fair Value | |
Telecommunications - 0.8% | | | |
| | 130,266 | | | PayPal Holdings, Inc. (a) | | $ | 10,887,632 | | |
| | | | | TOTAL COMMON STOCKS
(Cost $886,605,633) | | $ | 925,460,963 | | |
SHORT TERM INVESTMENTS - 45.8% | | | |
Money Market Funds - 45.8% | | | |
| | 282,221,691 | | | Dreyfus Government Cash
Management Institutional
Shares, 2.91% (b) | | $ | 282,221,691 | | |
| | 159,519,613 | | | Dreyfus Treasury Securities
Cash Management
Institutional Shares,
3.01% (b) | | | 159,519,613 | | |
| | 55,330,000 | | | Goldman Sachs Financial
Square Government Fund
Institutional Shares,
3.07% (b) | | | 55,330,000 | | |
| | 129,971,147 | | | Goldman Sachs Financial
Square Treasury
Instruments Fund
Institutional Shares,
3.10% (b) | | | 129,971,147 | | |
| | | | | TOTAL SHORT TERM
INVESTMENTS
(Cost $627,042,451) | | $ | 627,042,451 | | |
| | | | | TOTAL INVESTMENTS
(Cost $1,513,648,084) -
113.4% (c) | | $ | 1,552,503,414 | | |
| | | | | Liabilities in Excess of Other
Assets - (13.4)% | | | (183,708,474 | ) | |
| | | | | TOTAL NET ASSETS - 100.0% | | $ | 1,368,794,940 | | |
Percentages are stated as a percent of net assets.
The geographic location of all investments is United States unless otherwise indicated.
(a) Non-income producing security.
(b) Represents annualized seven-day yield at October 31, 2022.
(c) All or a portion of these securities have been segregated as collateral for swap contracts. Total value of securities segregated amounted to $1,161,748,832.
ADR - American Depository Receipt
Long Total Return Swap Contracts
October 31, 2022
Terms of Payments
to be Received at
Termination | | Terms of Payments
to be Paid at
Termination | | Counterparty | | Termination
Date | | Contracts | | Notional
Amount | | Unrealized
Appreciation
(Depreciation) | |
Total return of Technology
Select Sector Index | | 3.4900% representing
1 month SOFR rate + spread | | J.P. Morgan | | 12/6/2022 | | | 315,604 | | | $ | 398,865,676 | | | $ | 5,740,904 | | |
Total return of Technology
Select Sector Index | | 3.6300% representing
1 month SOFR rate + spread | | Barclays | | 12/7/2022 | | | 253,717 | | | | 313,977,140 | | | | 12,481,428 | | |
Total return of Technology
Select Sector Index | | 3.5400% representing
1 month SOFR rate + spread | | Goldman Sachs | | 12/9/2022 | | | 490,000 | | | | 661,869,463 | | | | (35,161,297 | ) | |
Total return of Technology
Select Sector Index | | 3.7100% representing
1 month SOFR rate + spread | | Citibank N.A. | | 12/13/2022 | | | 302,539 | | | | 388,272,843 | | | | 374,876 | | |
Total return of Technology
Select Sector Index | | 3.6400% representing
1 month SOFR rate + spread | | Bank of America
Merrill Lynch | | 12/13/2022 | | | 387,626 | | | | 549,572,274 | | | | (53,783,598 | ) | |
Total return of Technology
Select Sector Index | | 3.6900% representing
1 month SOFR rate + spread | | UBS Securities LLC | | 12/14/2022 | | | 492,188 | | | | 675,811,154 | | | | (43,775,776 | ) | |
Total return of Technology
Select Sector Index | | 3.8300% representing
1 month SOFR rate + spread | | BNP Paribas | | 12/15/2022 | | | 227,886 | | | | 293,538,085 | | | | (1,451,497 | ) | |
| | | | | | | | | | | $ | 3,281,906,635 | | | $ | (115,574,960 | ) | |
The accompanying notes are an integral part of these financial statements.
DIREXION ANNUAL REPORT
115
Direxion Daily Technology Bear 3X Shares
Schedule of Investments
October 31, 2022
Shares | | | | Fair Value | |
SHORT TERM INVESTMENTS - 92.5% | | | |
Money Market Funds - 92.5% | | | |
| | 58,876,978 | | | Dreyfus Government Cash
Management Institutional
Shares, 2.91% (a) | | $ | 58,876,978 | | |
| | 27,450,592 | | | Dreyfus Treasury Securities Cash
Management Institutional
Shares, 3.01% (a) | | | 27,450,592 | | |
| | 12,802,088 | | | Goldman Sachs Financial Square
Government Fund
Institutional Shares, 3.07% (a) | | | 12,802,088 | | |
| | 48,387,587 | | | Goldman Sachs Financial Square
Treasury Instruments Fund
Institutional Shares, 3.10% (a) | | | 48,387,587 | | |
| | | | | TOTAL SHORT TERM
INVESTMENTS
(Cost $147,517,245) (b) | | $ | 147,517,245 | | |
| | | | | TOTAL INVESTMENTS
(Cost $147,517,245) - 92.5% | | $ | 147,517,245 | | |
| | | | | Other Assets in Excess of
Liabilities - 7.5% | | | 12,017,263 | | |
| | | | | TOTAL NET ASSETS - 100.0% | | $ | 159,534,508 | | |
Percentages are stated as a percent of net assets.
The geographic location of all investments is United States unless otherwise indicated.
(a) Represents annualized seven-day yield at October 31, 2022.
(b) All or a portion of these securities have been segregated as collateral for swap contracts. Total value of securities segregated amounted to $100,383,180.
Short Total Return Swap Contracts
October 31, 2022
Terms of Payments
to be Received at
Termination | | Terms of Payments
to be Paid at
Termination | | Counterparty | | Termination
Date | | Contracts | | Notional
Amount | | Unrealized
Appreciation | |
3.0400% representing
1 month SOFR rate + spread | | Total return of Technology
Select Sector Index | | J.P. Morgan | | 12/6/2022 | | | 28,400 | | | $ | 36,894,645 | | | $ | 409,600 | | |
3.2700% representing
1 month SOFR rate + spread | | Total return of Technology
Select Sector Index | | Barclays | | 12/7/2022 | | | 58,918 | | | | 77,721,199 | | | | 1,960,910 | | |
3.2900% representing
1 month SOFR rate + spread | | Total return of Technology
Select Sector Index | | Citibank N.A. | | 12/13/2022 | | | 76,773 | | | | 106,880,983 | | | | 8,413,647 | | |
3.4400% representing
1 month SOFR rate + spread | | Total return of Technology
Select Sector Index | | Bank of America
Merrill Lynch | | 12/13/2022 | | | 56,518 | | | | 84,084,982 | | | | 11,707,581 | | |
3.4300% representing
1 month SOFR rate + spread | | Total return of Technology
Select Sector Index | | UBS Securities
LLC | | 12/14/2022 | | | 46,617 | | | | 67,047,316 | | | | 7,310,263 | | |
3.0800% representing
1 month SOFR rate + spread | | Total return of Technology
Select Sector Index | | BNP Paribas | | 12/15/2022 | | | 6,697 | | | | 8,962,662 | | | | 378,880 | | |
3.2400% representing
1 month SOFR rate + spread | | Total return of Technology
Select Sector Index | | Goldman Sachs | | 5/12/2023 | | | 97,633 | | | | 137,050,677 | | | | 11,841,827 | | |
| | | | | | | | | $ | 518,642,464 | | | $ | 42,022,708 | | |
The accompanying notes are an integral part of these financial statements.
DIREXION ANNUAL REPORT
116
Direxion Daily Transportation Bull 3X Shares
Schedule of Investments
October 31, 2022
Shares | | | | Fair Value | |
COMMON STOCKS - 57.4% | | | |
Administrative and Support Services - 0.5% | | | |
| | 3,118 | | | GXO Logistics, Inc. (a) | | $ | 113,932 | | |
Air Transportation - 9.4% | | | |
| | 3,332 | | | Alaska Air Group, Inc. (a) | | | 148,141 | | |
| | 406 | | | Allegiant Travel Co. (a) | | | 30,470 | | |
| | 17,082 | | | American Airlines Group, Inc. (a) | | | 242,223 | | |
| | 678 | | | Atlas Air Worldwide Holdings,
Inc. (a) | | | 68,573 | | |
| | 16,855 | | | Delta Air Lines, Inc. (a) | | | 571,890 | | |
| | 973 | | | Frontier Group Holdings, Inc. (a) | | | 12,756 | | |
| | 1,351 | | | Hawaiian Holdings, Inc. (a) | | | 19,495 | | |
| | 8,513 | | | JetBlue Airways Corp. (a) | | | 68,445 | | |
| | 1,330 | | | Skywest, Inc. (a) | | | 23,514 | | |
| | 15,597 | | | Southwest Airlines Co. (a) | | | 566,951 | | |
| | 2,861 | | | Spirit Airlines, Inc. (a) | | | 62,942 | | |
| | 8,590 | | | United Continental Holdings,
Inc. (a) | | | 370,057 | | |
| | | | 2,185,457 | | |
Couriers and Messengers - 12.6% | | | |
| | 1,525 | | | Air Transport Services Group,
Inc. (a) | | | 44,530 | | |
| | 3,227 | | | FedEx Corp. | | | 517,223 | | |
| | 14,149 | | | United Parcel Service, Inc. Class B | | | 2,373,778 | | |
| | | | 2,935,531 | | |
Management of Companies and Enterprises - 0.1% | | | |
| | 856 | | | Sun Country Airlines Holdings,
Inc. (a) | | | 13,936 | | |
Professional, Scientific, and Technical Services - 0.1% | | | |
| | 3,584 | | | Tusimple Holdings, Inc. (a) | | | 12,293 | | |
Rail Transportation - 14.0% | | | |
| | 30,318 | | | CSX Corp. | | | 881,041 | | |
| | 12,073 | | | Union Pacific Corp. | | | 2,380,071 | | |
| | | | 3,261,112 | | |
Rental and Leasing Services - 2.2% | | | |
| | 258 | | | AMERCO | | | 148,399 | | |
| | 758 | | | Avis Budget Group, Inc. (a) | | | 179,237 | | |
| | 4,736 | | | Hertz Global Holdings, Inc. (a) | | | 87,142 | | |
| | 1,346 | | | Ryder System, Inc. | | | 108,367 | | |
| | | | 523,145 | | |
Securities, Commodity Contracts, and Other Financial Investments and Related Activities - 0.2% | | | |
| | 7,506 | | | Joby Aviation, Inc. (a) | | | 36,179 | | |
| | 4,494 | | | Wheels Up Experience Inc. (a) | | | 7,954 | | |
| | | | 44,133 | | |
Support Activities for Transportation - 9.0% | | | |
| | 3,256 | | | C.H. Robinson Worldwide, Inc. | | | 318,176 | | |
| | 1,586 | | | Daseke, Inc. (a) | | | 9,453 | | |
| | 4,301 | | | Expeditors International of
Washington, Inc. | | | 420,853 | | |
| | 706 | | | Forward Air Corp. | | | 74,744 | | |
| | 893 | | | Hub Group, Inc. (a) | | | 69,297 | | |
| | 2,184 | | | J.B. Hunt Transport Services, Inc. | | | 373,617 | | |
| | 1,025 | | | Matson, Inc. | | | 75,419 | | |
Shares | | | | Fair Value | |
Support Activities for Transportation (continued) | | | |
| | 2,675 | | | Norfolk Southern Corp. | | $ | 610,087 | | |
| | 3,025 | | | XPO Logistics, Inc. (a) | | | 156,514 | | |
| | | | 2,108,160 | | |
Transit and Ground Passenger Transportation - 3.0% | | | |
| | 8,051 | | | Lyft, Inc. (a) | | | 117,867 | | |
| | 21,666 | | | Uber Technologies, Inc. (a) | | | 575,665 | | |
| | | | 693,532 | | |
Truck Transportation - 5.1% | | | |
| | 645 | | | ArcBest Corp. | | | 51,232 | | |
| | 1,224 | | | Heartland Express, Inc. | | | 18,213 | | |
| | 4,224 | | | Knight-Swift Transportation
Holdings, Inc. Class A | | | 202,879 | | |
| | 1,512 | | | Marten Transport Ltd. | | | 28,380 | | |
| | 2,409 | | | Old Dominion Freight Line, Inc. | | | 661,511 | | |
| | 694 | | | Saia, Inc. (a) | | | 138,009 | | |
| | 974 | | | Schneider National, Inc. | | | 21,662 | | |
| | 1,550 | | | Werner Enterprises, Inc. | | | 60,760 | | |
| | | | 1,182,646 | | |
Warehousing and Storage - 0.6% | | | |
| | 957 | | | Landstar System, Inc. | | | 149,503 | | |
Water Transportation - 0.6% | | | |
| | 252 | | | Eagle Bulk Shipping, Inc. ADR
(Marshall Islands) | | | 12,192 | | |
| | 978 | | | Genco Shipping & Trading, Ltd. | | | 13,105 | | |
| | 1,574 | | | Kirby Corp. (a) | | | 109,786 | | |
| | | | 135,083 | | |
| | | | | TOTAL COMMON STOCKS
(Cost $15,599,640) | | $ | 13,358,463 | | |
SHORT TERM INVESTMENTS - 53.6% | | | |
Money Market Funds - 53.6% | | | |
| | 7,769,975 | | | Dreyfus Government Cash
Management Institutional
Shares, 2.91% (b) | | $ | 7,769,975 | | |
| | 4,678,956 | | | Goldman Sachs Financial Square
Treasury Instruments Fund
Institutional Shares, 3.10% (b) | | | 4,678,956 | | |
| | | | | TOTAL SHORT TERM
INVESTMENTS
(Cost $12,448,931) | | $ | 12,448,931 | | |
| | | | | TOTAL INVESTMENTS
(Cost $28,048,571) -
111.0% (c) | | $ | 25,807,394 | | |
| | | | | Liabilities in Excess of
Other Assets - (11.0)% | | | (2,564,884 | ) | |
| | | | | TOTAL NET ASSETS - 100.0% | | $ | 23,242,510 | | |
Percentages are stated as a percent of net assets.
The geographic location of all investments is United States unless otherwise indicated.
(a) Non-income producing security.
(b) Represents annualized seven-day yield at October 31, 2022.
The accompanying notes are an integral part of these financial statements.
DIREXION ANNUAL REPORT
117
Direxion Daily Transportation Bull 3X Shares
Schedule of Investments, continued
October 31, 2022
(c) All or a portion of these securities have been segregated as collateral for swap contracts. Total value of securities segregated amounted to $19,698,291.
ADR - American Depository Receipt
Long Total Return Swap Contracts
October 31, 2022
Terms of Payments to be
Received at Termination | | Terms of Payments
to be Paid at
Termination | | Counterparty | | Termination
Date | | Contracts | | Notional
Amount | | Unrealized
Appreciation
(Depreciation) | |
Total return of S&P
Transportation Select
Industry FMC Capped Index | | 3.5400% representing
1 month SOFR
rate + spread | | Citibank N.A. | | 12/13/2022 | | | 5,702 | | | $ | 29,946,754 | | | $ | (2,524,587 | ) | |
Total return of S&P
Transportation Select
Industry FMC Capped Index | | 3.6800% representing
1 month SOFR
rate + spread | | UBS Securities
LLC | | 12/14/2022 | | | 5,969 | | | | 28,059,955 | | | | 755,230 | | |
| | | | | | | | | | | $ | 58,006,709 | | | $ | (1,769,357 | ) | |
The accompanying notes are an integral part of these financial statements.
DIREXION ANNUAL REPORT
118
Direxion Daily Utilities Bull 3X Shares
Schedule of Investments
October 31, 2022
Shares | | | | Fair Value | |
COMMON STOCKS - 67.0% | | | |
Oil and Gas Extraction - 4.0% | | | |
| | 12,662 | | | Dominion Energy, Inc. | | $ | 885,960 | | |
Utilities - 63.0% | | | |
| | 10,159 | | | AES Corp. | | | 265,759 | | |
| | 3,815 | | | Alliant Energy Corp. | | | 199,029 | | |
| | 3,929 | | | Ameren Corp. | | | 320,292 | | |
| | 7,813 | | | American Electric Power Co., Inc. | | | 686,919 | | |
| | 2,765 | | | American Water Works Co., Inc. | | | 401,865 | | |
| | 2,127 | | | Atmos Energy Corp. | | | 226,632 | | |
| | 9,576 | | | CenterPoint Energy, Inc. | | | 273,969 | | |
| | 4,412 | | | CMS Energy Corp. | | | 251,705 | | |
| | 5,393 | | | Consolidated Edison, Inc. | | | 474,368 | | |
| | 4,970 | | | Constellation Energy Corp. | | | 469,864 | | |
| | 2,947 | | | DTE Energy Co. | | | 330,388 | | |
| | 11,710 | | | Duke Energy Corp. | | | 1,091,138 | | |
| | 5,798 | | | Edison International | | | 348,112 | | |
| | 3,091 | | | Entergy Corp. | | | 331,170 | | |
| | 3,490 | | | Evergy, Inc. | | | 213,344 | | |
| | 5,269 | | | Eversource Energy | | | 401,919 | | |
| | 15,085 | | | Exelon Corp. | | | 582,130 | | |
| | 8,256 | | | FirstEnergy Corp. | | | 311,334 | | |
| | 29,883 | | | NextEra Energy, Inc. | | | 2,315,932 | | |
| | 6,173 | | | NiSource, Inc. | | | 158,584 | | |
| | 3,577 | | | NRG Energy, Inc. | | | 158,819 | | |
| | 24,488 | | | PG&E Corp. (a) | | | 365,606 | | |
| | 1,719 | | | Pinnacle West Capital Corp. | | | 115,534 | | |
| | 11,199 | | | PPL Corp. | | | 296,662 | | |
| | 7,587 | | | Public Service Enterprise Group, Inc. | | | 425,403 | | |
| | 4,781 | | | Sempra Energy | | | 721,644 | | |
| | 16,167 | | | Southern Co. | | | 1,058,615 | | |
| | 4,797 | | | WEC Energy Group, Inc. | | | 438,110 | | |
| | 8,319 | | | Xcel Energy, Inc. | | | 541,650 | | |
| | | | 13,776,496 | | |
| | | | | TOTAL COMMON STOCKS
(Cost $14,540,783) | | $ | 14,662,456 | | |
Shares | | | | Fair Value | |
SHORT TERM INVESTMENTS - 30.6% | | | |
Money Market Funds - 30.6% | | | |
| | 4,862,587 | | | Dreyfus Government Cash
Management Institutional
Shares, 2.91% (b) | | $ | 4,862,587 | | |
| | 514,690 | | | Goldman Sachs Financial Square
Government Fund
Institutional Shares, 3.07% (b) | | | 514,690 | | |
| | 1,321,988 | | | Goldman Sachs Financial Square
Treasury Instruments Fund
Institutional Shares, 3.10% (b) | | | 1,321,988 | | |
| | | | | TOTAL SHORT TERM
INVESTMENTS
(Cost $6,699,265) | | $ | 6,699,265 | | |
| | | | | TOTAL INVESTMENTS
(Cost $21,240,048) -
97.6% (c) | | $ | 21,361,721 | | |
| | | | | Other Assets in Excess of
Liabilities - 2.4% | | | 520,904 | | |
| | | | | TOTAL NET ASSETS - 100.0% | | $ | 21,882,625 | | |
Percentages are stated as a percent of net assets.
The geographic location of all investments is United States unless otherwise indicated.
(a) Non-income producing security.
(b) Represents annualized seven-day yield at October 31, 2022.
(c) All or a portion of these securities have been segregated as collateral for swap contracts. Total value of securities segregated amounted to $17,410,092.
Long Total Return Swap Contracts
October 31, 2022
Terms of Payments
to be Received at
Termination | | Terms of Payments
to be Paid at
Termination | | Counterparty | | Termination
Date | | Contracts | | Notional
Amount | | Unrealized
Appreciation
(Depreciation) | |
Total return of Utilities
Select Sector Index | | 3.5900% representing
1 month SOFR
rate + spread | | Barclays | | 12/7/2022 | | | 12,476 | | | $ | 8,478,207 | | | $ | 4,633 | | |
Total return of Utilities
Select Sector Index | | 3.4400% representing
1 month SOFR
rate + spread | | UBS Securities
LLC | | 12/14/2022 | | | 52,539 | | | | 34,201,453 | | | | 1,301,525 | | |
Total return of Utilities
Select Sector Index | | 3.4900% representing
1 month SOFR
rate + spread | | J.P. Morgan | | 9/11/2023 | | | 10,380 | | | | 7,155,482 | | | | (140,578 | ) | |
| | | | | | | | | | | $ | 49,835,142 | | | $ | 1,165,580 | | |
The accompanying notes are an integral part of these financial statements.
DIREXION ANNUAL REPORT
119
Direxion Daily 7-10 Year Treasury Bull 3X Shares
Schedule of Investments
October 31, 2022
Shares | | | | Fair Value | |
INVESTMENT COMPANIES - 73.6% | | | |
| | 189,337 | | | iShares 7-10 Year Treasury
Bond ETF (a)(b) | | $ | 17,875,306 | | |
| | | | | TOTAL INVESTMENT COMPANIES
(Cost $19,502,241) | | $ | 17,875,306 | | |
SHORT TERM INVESTMENTS - 43.5% | | | |
Money Market Funds - 43.5% | | | |
| | 4,751,582 | | | Dreyfus Government Cash
Management Institutional
Shares, 2.91% (c)(d) | | $ | 4,751,582 | | |
| | 260,067 | | | Goldman Sachs Financial Square
Government Fund Institutional
Shares, 3.07% (c) | | | 260,067 | | |
| | 5,553,416 | | | Goldman Sachs Financial Square
Treasury Instruments Fund
Institutional Shares, 3.10% (c) | | | 5,553,416 | | |
| | | | | TOTAL SHORT TERM
INVESTMENTS
(Cost $10,565,065) | | $ | 10,565,065 | | |
| | | | | TOTAL INVESTMENTS
(Cost $30,067,306) -
117.1% (e) | | $ | 28,440,371 | | |
| | | | | Liabilities in Excess of
Other Assets - (17.1)% | | | (4,158,635 | ) | |
| | | | | TOTAL NET ASSETS - 100.0% | | $ | 24,281,736 | | |
Percentages are stated as a percent of net assets.
The geographic location of all investments is United States unless otherwise indicated.
(a) Shareholders may obtain the financial statements of these investment companies at www.sec.gov.
(b) A portion of this security represents a security on loan.
(c) Represents annualized seven-day yield at October 31, 2022.
(d) All or a portion of this security represents an investment of securities lending collateral.
(e) All or a portion of these securities have been segregated as collateral for swap contracts. Total value of securities segregated amounted to $23,143,431.
Long Total Return Swap Contracts
October 31, 2022
Terms of Payments
to be Received at
Termination | | Terms of Payments
to be Paid at
Termination | | Counterparty | | Termination
Date | | Contracts | | Notional
Amount | | Unrealized
Depreciation | |
Total return of iShares
7-10 Year Treasury Bond
ETF | | 3.3400% representing
1 month SOFR
rate + spread | | Barclays | | 12/7/2022 | | | 29,594 | | | $ | 2,884,839 | | | $ | (96,909 | ) | |
Total return of iShares
7-10 Year Treasury Bond
ETF | | 3.1900% representing
1 month SOFR
rate + spread | | Bank of
America
Merrill Lynch | | 12/13/2022 | | | 217,785 | | | | 22,593,216 | | | | (2,056,237 | ) | |
Total return of iShares
7-10 Year Treasury Bond
ETF | | 2.4500% representing
1 month SOFR
rate + spread | | BNP Paribas | | 12/15/2022 | | | 155,455 | | | | 15,330,385 | | | | (660,723 | ) | |
Total return of iShares
7-10 Year Treasury Bond
ETF | | 3.2400% representing
1 month SOFR
rate + spread | | J.P. Morgan | | 2/10/2023 | | | 179,417 | | | | 18,167,591 | | | | (1,267,033 | ) | |
| | | | | | | | | | | $ | 58,976,031 | | | $ | (4,080,902 | ) | |
The accompanying notes are an integral part of these financial statements.
DIREXION ANNUAL REPORT
120
Direxion Daily 7-10 Year Treasury Bear 3X Shares
Schedule of Investments
October 31, 2022
Shares | | | | Fair Value | |
SHORT TERM INVESTMENTS - 98.4% | | | |
Money Market Funds - 98.4% | | | |
| | 38,206,208 | | | Dreyfus Government Cash
Management Institutional
Shares, 2.91% (a) | | $ | 38,206,208 | | |
| | 7,170,066 | | | Goldman Sachs Financial Square
Government Fund Institutional
Shares, 3.07% (a) | | | 7,170,066 | | |
| | 9,851,048 | | | Goldman Sachs Financial Square
Treasury Instruments Fund
Institutional Shares, 3.10% (a) | | | 9,851,048 | | |
| | | | | TOTAL SHORT TERM
INVESTMENTS
(Cost $55,227,322) (b) | | $ | 55,227,322 | | |
| | | | | TOTAL INVESTMENTS
(Cost $55,227,322) - 98.4% | | $ | 55,227,322 | | |
| | | | | Other Assets in Excess of
Liabilities - 1.6% | | | 908,126 | | |
| | | | | TOTAL NET ASSETS - 100.0% | | $ | 56,135,448 | | |
Percentages are stated as a percent of net assets.
The geographic location of all investments is United States unless otherwise indicated.
(a) Represents annualized seven-day yield at October 31, 2022.
(b) All or a portion of these securities have been segregated as collateral for swap contracts. Total value of securities segregated amounted to $34,842,179.
Short Total Return Swap Contracts
October 31, 2022
Terms of Payments
to be Received at
Termination | | Terms of Payments
to be Paid at
Termination | | Counterparty | | Termination
Date | | Contracts | | Notional
Amount | | Unrealized
Appreciation | |
2.0900% representing
1 month SOFR
rate + spread | | Total return of iShares
7-10 Year Treasury
Bond ETF | | J.P. Morgan | | 12/6/2022 | | | 244,160 | | | $ | 24,983,457 | | | $ | 1,915,134 | | |
2.9500% representing
1 month SOFR
rate + spread | | Total return of iShares
7-10 Year Treasury
Bond ETF | | Barclays | | 12/7/2022 | | | 376,651 | | | | 37,680,762 | | | | 2,151,254 | | |
2.9900% representing
1 month SOFR
rate + spread | | Total return of iShares
7-10 Year Treasury
Bond ETF | | Bank of
America
Merrill Lynch | | 12/13/2022 | | | 198,437 | | | | 20,689,042 | | | | 1,984,989 | | |
2.1500% representing
1 month SOFR
rate + spread | | Total return of iShares
7-10 Year Treasury
Bond ETF | | BNP Paribas | | 12/7/2023 | | | 964,549 | | | | 91,293,987 | | | | 264,229 | | |
| | | | | | | | | | | | | $ | 174,647,248 | | | $ | 6,315,606 | | |
The accompanying notes are an integral part of these financial statements.
DIREXION ANNUAL REPORT
121
Direxion Daily 20+ Year Treasury Bull 3X Shares
Schedule of Investments
October 31, 2022
Shares | | | | Fair Value | |
INVESTMENT COMPANIES - 60.1% | | | |
| | 2,731,800 | | | iShares 20+ Year Treasury
Bond ETF (a) | | $ | 262,553,298 | | |
| | | | | TOTAL INVESTMENT
COMPANIES
(Cost $290,083,413) | | $ | 262,553,298 | | |
SHORT TERM INVESTMENTS - 80.7% | | | |
Money Market Funds - 80.7% | | | |
| | 167,226,431 | | | Dreyfus Government Cash
Management Institutional
Shares, 2.91% (b) | | $ | 167,226,431 | | |
| | 11,876,083 | | | Dreyfus Treasury Securities
Cash Management
Institutional Shares,
3.01% (b) | | | 11,876,083 | | |
| | 173,738,166 | | | Goldman Sachs Financial
Square Treasury Instruments
Fund Institutional Shares,
3.10% (b) | | | 173,738,166 | | |
| | | | | TOTAL SHORT TERM
INVESTMENTS
(Cost $352,840,680) | | $ | 352,840,680 | | |
| | | | | TOTAL INVESTMENTS
(Cost $642,924,093) -
140.8% (c) | | $ | 615,393,978 | | |
| | | | | Liabilities in Excess of
Other Assets - (40.8)% | | | (178,208,658 | ) | |
| | | | | TOTAL NET ASSETS - 100.0% | | $ | 437,185,320 | | |
Percentages are stated as a percent of net assets.
The geographic location of all investments is United States unless otherwise indicated.
(a) Shareholders may obtain the financial statements of these investment companies at www.sec.gov.
(b) Represents annualized seven-day yield at October 31, 2022.
(c) All or a portion of these securities have been segregated as collateral for swap contracts. Total value of securities segregated amounted to $531,179,469.
Long Total Return Swap Contracts
October 31, 2022
Terms of Payments
to be Received at
Termination | | Terms of Payments
to be Paid at
Termination | | Counterparty | | Termination
Date | | Contracts | | Notional
Amount | | Unrealized
Depreciation | |
Total return of iShares
20+ Year Treasury Bond
ETF | | 3.2200% representing
1 month SOFR
rate + spread | | Citibank N.A. | | 12/13/2022 | | | 4,043,778 | | | $ | 412,212,910 | | | $ | (24,014,883 | ) | |
Total return of iShares
20+ Year Treasury Bond
ETF | | 2.8400% representing
1 month SOFR
rate + spread | | Bank of
America
Merrill Lynch | | 12/13/2022 | | | 1,135,766 | | | | 169,359,029 | | | | (59,641,954 | ) | |
Total return of iShares
20+ Year Treasury Bond
ETF | | 3.0100% representing
1 month SOFR
rate + spread | | UBS Securities
LLC | | 12/14/2022 | | | 1,789,667 | | | | 209,879,251 | | | | (37,845,236 | ) | |
Total return of iShares
20+ Year Treasury Bond
ETF | | 3.3500% representing
1 month SOFR
rate + spread | | BNP Paribas | | 12/15/2022 | | | 2,201,177 | | | | 238,554,647 | | | | (27,507,982 | ) | |
Total return of iShares
20+ Year Treasury Bond
ETF | | 3.3400% representing
1 month SOFR
rate + spread | | J.P. Morgan | | 2/10/2023 | | | 1,213,831 | | | | 141,831,088 | | | | (25,179,820 | ) | |
Total return of iShares
20+ Year Treasury Bond
ETF | | 2.9400% representing
1 month SOFR
rate + spread | | Goldman Sachs | | 10/31/2023 | | | 531,476 | | | | 53,095,854 | | | | (1,991,184 | ) | |
| | | | | | | | | | | $ | 1,224,932,779 | | | $ | (176,181,059 | ) | |
The accompanying notes are an integral part of these financial statements.
DIREXION ANNUAL REPORT
122
Direxion Daily 20+ Year Treasury Bear 3X Shares
Schedule of Investments
October 31, 2022
Shares | | | | Fair Value | |
SHORT TERM INVESTMENTS - 98.5% | | | |
Money Market Funds - 98.5% | | | |
| | 390,960,555 | | | Dreyfus Government Cash
Management Institutional
Shares, 2.91% (a) | | $ | 390,960,555 | | |
| | 93,668,668 | | | Dreyfus Treasury Securities
Cash Management
Institutional Shares,
3.01% (a) | | | 93,668,668 | | |
| | 193,508,776 | | | Goldman Sachs Financial
Square Treasury Instruments
Fund Institutional Shares,
3.10% (a) | | | 193,508,776 | | |
| | | | | TOTAL SHORT TERM
INVESTMENTS
(Cost $678,137,999) (b) | | $ | 678,137,999 | | |
| | | | | TOTAL INVESTMENTS
(Cost $678,137,999) -
98.5% | | $ | 678,137,999 | | |
| | | | | Other Assets in Excess of
Liabilities - 1.5% | | | 10,511,659 | | |
| | | | | TOTAL NET ASSETS - 100.0% | | $ | 688,649,658 | | |
Percentages are stated as a percent of net assets.
The geographic location of all investments is United States unless otherwise indicated.
(a) Represents annualized seven-day yield at October 31, 2022.
(b) All or a portion of these securities have been segregated as collateral for swap contracts. Total value of securities segregated amounted to $413,665,393.
Short Total Return Swap Contracts
October 31, 2022
Terms of Payments
to be Received at
Termination | | Terms of Payments
to be Paid at
Termination | | Counterparty | | Termination
Date | | Contracts | | Notional
Amount | | Unrealized
Appreciation
(Depreciation) | |
2.8400% representing
1 month SOFR
rate + spread | | Total return of iShares
20+ Year Treasury
Bond ETF | | J.P. Morgan | | 12/6/2022 | | | 3,916,442 | | | $ | 401,574,636 | | | $ | 25,303,332 | | |
2.9400% representing
1 month SOFR
rate + spread | | Total return of iShares
20+ Year Treasury
Bond ETF | | Citibank N.A. | | 12/13/2022 | | | 3,942,012 | | | | 387,955,243 | | | | 9,700,956 | | |
2.5400% representing
1 month SOFR
rate + spread | | Total return of iShares
20+ Year Treasury
Bond ETF | | Bank of America
Merrill Lynch | | 12/13/2022 | | | 1,755,876 | | | | 206,075,970 | | | | 36,551,746 | | |
2.4900% representing
1 month SOFR
rate + spread | | Total return of iShares
20+ Year Treasury
Bond ETF | | UBS
Securities LLC | | 12/14/2022 | | | 3,479,970 | | | | 373,459,725 | | | | 39,027,515 | | |
3.1300% representing
1 month SOFR
rate + spread | | Total return of iShares
20+ Year Treasury
Bond ETF | | BNP Paribas | | 12/15/2022 | | | 3,869,855 | | | | 416,067,889 | | | | 44,707,733 | | |
2.7400% representing
1 month SOFR
rate + spread | | Total return of iShares
20+ Year Treasury
Bond ETF | | Goldman Sachs | | 12/6/2023 | | | 4,531,909 | | | | 429,108,483 | | | | (6,461,655 | ) | |
| | | | | | | | | | | | | $ | 2,214,241,946 | | | $ | 148,829,627 | | |
The accompanying notes are an integral part of these financial statements.
DIREXION ANNUAL REPORT
123
Statements of Assets and Liabilities
October 31, 2022
| | | Direxion Daily
Mid Cap
Bull 3X Shares | | Direxion Daily
S&P 500®
Bull 3X Shares | | Direxion Daily
S&P 500®
Bear 3X Shares | | Direxion Daily
Small Cap
Bull 3X Shares | |
Assets: | |
Investments, at fair value (including
securities loaned*) (Note 2) | | $ | 47,604,017 | | | $ | 2,636,518,602 | | | $ | 1,030,507,850 | | | $ | 1,402,023,589 | | |
Cash | | | 410,000 | | | | 14,090,000 | | | | — | | | | 17,173,067 | | |
Receivable for Fund shares sold | | | — | | | | 3,484,917 | | | | 2,265,946 | | | | 1,723 | | |
Dividend and interest receivable | | | 41,863 | | | | 3,638,309 | | | | 2,227,315 | | | | 1,087,191 | | |
Due from broker for swap contracts | | | 8,780 | | | | 2,842,299 | | | | 11,565,400 | | | | — | | |
Unrealized appreciation on swap contracts | | | 4,034,037 | | | | 87,544,317 | | | | 105,188,300 | | | | 122,951,767 | | |
Prepaid expenses and other assets | | | 20,708 | | | | 27,728 | | | | 36,337 | | | | 66,918 | | |
Total Assets | | | 52,119,405 | | | | 2,748,146,172 | | | | 1,151,791,148 | | | | 1,543,304,255 | | |
Liabilities: | |
Collateral for securities loaned (Note 2) | | | — | | | | — | | | | — | | | | 195,572,197 | | |
Payable for Fund shares redeemed | | | — | | | | 36,515,036 | | | | 115,239,017 | | | | 7,656,573 | | |
Payable for investments purchased | | | — | | | | 1,251,154 | | | | — | | | | — | | |
Unrealized depreciation on swap contracts | | | 146,127 | | | | 23,070,967 | | | | 27,520,558 | | | | 7,863,248 | | |
Due to Adviser, net (Note 6) | | | 25,067 | | | | 1,453,053 | | | | 612,008 | | | | 702,816 | | |
Due to broker for swap contracts | | | 4,112,340 | | | | 137,796,544 | | | | 120,273,382 | | | | 113,541,816 | | |
Accrued expenses and other liabilities | | | 35,263 | | | | 1,431,703 | | | | 435,151 | | | | 504,804 | | |
Total Liabilities | | | 4,318,797 | | | | 201,518,457 | | | | 264,080,116 | | | | 325,841,454 | | |
Net Assets | | $ | 47,800,608 | | | $ | 2,546,627,715 | | | $ | 887,711,032 | | | $ | 1,217,462,801 | | |
Net Assets Consist of: | |
Capital stock | | $ | 63,574,709 | | | $ | 3,528,613,331 | | | $ | 3,491,368,374 | | | $ | 2,176,265,973 | | |
Total distributable loss | | | (15,774,101 | ) | | | (981,985,616 | ) | | | (2,603,657,342 | ) | | | (958,803,172 | ) | |
Net Assets | | $ | 47,800,608 | | | $ | 2,546,627,715 | | | $ | 887,711,032 | | | $ | 1,217,462,801 | | |
Calculation of Net Asset Value Per
Share: | |
Net assets | | $ | 47,800,608 | | | $ | 2,546,627,715 | | | $ | 887,711,032 | | | $ | 1,217,462,801 | | |
Shares outstanding (unlimited shares
of beneficial interest authorized,
par value) | | | 1,300,132 | | | | 38,600,002 | | | | 39,176,918 | | | | 31,800,002 | | |
Net assets value, redemption price
and offering price per share | | $ | 36.77 | | | $ | 65.97 | | | $ | 22.66 | | | $ | 38.28 | | |
Cost of Investments | | $ | 47,055,445 | | | $ | 2,578,014,266 | | | $ | 1,030,507,850 | | | $ | 1,406,485,927 | | |
* Securities loaned with values of $–, $–, $– and $191,556,238, respectively. See Note 2.
The accompanying notes are an integral part of these financial statements.
DIREXION ANNUAL REPORT
124
Statements of Assets and Liabilities
October 31, 2022
| | | Direxion Daily
Small Cap
Bear 3X Shares | | Direxion Daily
FTSE China
Bull 3X Shares | | Direxion Daily
FTSE China
Bear 3X Shares | | Direxion Daily
FTSE Europe
Bull 3X Shares | |
Assets: | |
Investments, at fair value (including
securities loaned*) (Note 2) | | $ | 574,391,678 | | | $ | 411,558,755 | | | $ | 180,501,351 | | | $ | 23,213,583 | | |
Cash | | | — | | | | — | | | | 2,270,000 | | | | — | | |
Receivable for Fund shares sold | | | 27,478,944 | | | | — | | | | 1,717 | | | | — | | |
Dividend and interest receivable | | | 1,255,803 | | | | 597,691 | | | | 347,005 | | | | 35,749 | | |
Due from broker for swap contracts | | | — | | | | 5,618,283 | | | | 24,148,462 | | | | — | | |
Unrealized appreciation on swap contracts | | | 2,045,065 | | | | — | | | | 54,113,427 | | | | 757,290 | | |
Prepaid expenses and other assets | | | 4,884 | | | | 7,548 | | | | 18,584 | | | | 27,693 | | |
Total Assets | | | 605,176,374 | | | | 417,782,277 | | | | 261,400,546 | | | | 24,034,315 | | |
Liabilities: | |
Collateral for securities loaned (Note 2) | | | — | | | | — | | | | — | | | | 3,934,708 | | |
Payable for Fund shares redeemed | | | 11,314,898 | | | | 1,144,687 | | | | 26,875,133 | | | | — | | |
Unrealized depreciation on swap contracts | | | 32,368,456 | | | | 152,048,536 | | | | — | | | | 1,922,410 | | |
Due to Adviser, net (Note 6) | | | 333,362 | | | | 157,455 | | | | 93,845 | | | | 9,093 | | |
Due to broker for swap contracts | | | 13,857,340 | | | | 46,891,972 | | | | 65,439,462 | | | | 186,884 | | |
Accrued expenses and other liabilities | | | 137,153 | | | | 182,385 | | | | 44,052 | | | | 16,032 | | |
Total Liabilities | | | 58,011,209 | | | | 200,425,035 | | | | 92,452,492 | | | | 6,069,127 | | |
Net Assets | | $ | 547,165,165 | | | $ | 217,357,242 | | | $ | 168,948,054 | | | $ | 17,965,188 | | |
Net Assets Consist of: | |
Capital stock | | $ | 4,264,707,587 | | | $ | 1,231,808,051 | | | $ | 153,946,933 | | | $ | 49,309,337 | | |
Total distributable earnings (loss) | | | (3,717,542,422 | ) | | | (1,014,450,809 | ) | | | 15,001,121 | | | | (31,344,149 | ) | |
Net Assets | | $ | 547,165,165 | | | $ | 217,357,242 | | | $ | 168,948,054 | | | $ | 17,965,188 | | |
Calculation of Net Asset Value Per
Share: | |
Net assets | | $ | 547,165,165 | | | $ | 217,357,242 | | | $ | 168,948,054 | | | $ | 17,965,188 | | |
Shares outstanding (unlimited shares
of beneficial interest authorized,
par value) | | | 16,922,797 | | | | 10,892,767 | | | | 4,427,337 | | | | 1,400,001 | | |
Net assets value, redemption price
and offering price per share | | $ | 32.33 | | | $ | 19.95 | | | $ | 38.16 | | | $ | 12.83 | | |
Cost of Investments | | $ | 574,391,678 | | | $ | 440,504,779 | | | $ | 180,501,351 | | | $ | 23,991,357 | | |
* Securities loaned with values of $–, $–, $– and $3,853,807, respectively. See Note 2.
The accompanying notes are an integral part of these financial statements.
DIREXION ANNUAL REPORT
125
Statements of Assets and Liabilities
October 31, 2022
| | | Direxion Daily
MSCI
Emerging
Markets
Bull 3X Shares | | Direxion Daily
MSCI
Emerging
Markets
Bear 3X Shares | | Direxion Daily
MSCI Mexico
Bull 3X Shares | | Direxion Daily
MSCI
South Korea
Bull 3X Shares | |
Assets: | |
Investments, at fair value (Note 2) | | $ | 71,578,516 | | | $ | 56,864,052 | | | $ | 11,009,642 | | | $ | 21,562,227 | | |
Dividend and interest receivable | | | 181,477 | | | | 148,281 | | | | 15,921 | | | | 30,859 | | |
Due from broker for swap contracts | | | 812,625 | | | | — | | | | 923 | | | | — | | |
Unrealized appreciation on swap contracts | | | — | | | | 14,192,769 | | | | 2,650,243 | | | | — | | |
Prepaid expenses and other assets | | | 31,011 | | | | 16,147 | | | | 14,548 | | | | 22,617 | | |
Total Assets | | | 72,603,629 | | | | 71,221,249 | | | | 13,691,277 | | | | 21,615,703 | | |
Liabilities: | |
Payable for Fund shares redeemed | | | — | | | | 1,037,876 | | | | — | | | | — | | |
Unrealized depreciation on swap contracts | | | 22,168,302 | | | | — | | | | — | | | | 1,475,958 | | |
Due to Adviser, net (Note 6) | | | 31,907 | | | | 37,729 | | | | 4,476 | | | | 8,408 | | |
Due to broker for swap contracts | | | 980,117 | | | | 13,646,600 | | | | 2,020,923 | | | | 15,915 | | |
Accrued expenses and other liabilities | | | 56,240 | | | | 45,881 | | | | 16,260 | | | | 21,523 | | |
Total Liabilities | | | 23,236,566 | | | | 14,768,086 | | | | 2,041,659 | | | | 1,521,804 | | |
Net Assets | | $ | 49,367,063 | | | $ | 56,453,163 | | | $ | 11,649,618 | | | $ | 20,093,899 | | |
Net Assets Consist of: | |
Capital stock | | $ | 335,524,157 | | | $ | 368,049,034 | | | $ | 10,422,844 | | | $ | 63,725,692 | | |
Total distributable earnings (loss) | | | (286,157,094 | ) | | | (311,595,871 | ) | | | 1,226,774 | | | | (43,631,793 | ) | |
Net Assets | | $ | 49,367,063 | | | $ | 56,453,163 | | | $ | 11,649,618 | | | $ | 20,093,899 | | |
Calculation of Net Asset Value Per
Share: | |
Net assets | | $ | 49,367,063 | | | $ | 56,453,163 | | | $ | 11,649,618 | | | $ | 20,093,899 | | |
Shares outstanding (unlimited shares
of beneficial interest authorized,
par value) | | | 2,281,598 | | | | 2,695,232 | | | | 133,205 | | | | 3,350,001 | | |
Net assets value, redemption price
and offering price per share | | $ | 21.64 | | | $ | 20.95 | | | $ | 87.46 | | | $ | 6.00 | | |
Cost of Investments | | $ | 71,935,601 | | | $ | 56,864,052 | | | $ | 10,836,038 | | | $ | 21,961,413 | | |
The accompanying notes are an integral part of these financial statements.
DIREXION ANNUAL REPORT
126
Statements of Assets and Liabilities
October 31, 2022
| | | Direxion Daily
Aerospace &
Defense
Bull 3X Shares | | Direxion Daily
Consumer
Discretionary
Bull 3X Shares | | Direxion Daily
Dow Jones
Internet
Bull 3X Shares | | Direxion Daily
Dow Jones
Internet
Bear 3X Shares | |
Assets: | |
Investments, at fair value (including
securities loaned*) (Note 2) | | $ | 196,371,988 | | | $ | 25,567,119 | | | $ | 115,693,586 | | | $ | 55,469,884 | | |
Cash | | | 345,997 | | | | — | | | | — | | | | — | | |
Receivable for Fund shares sold | | | 130,573 | | | | — | | | | — | | | | 1,832,994 | | |
Receivable for investments sold | | | — | | | | — | | | | 393,167 | | | | — | | |
Dividend and interest receivable | | | 164,481 | | | | 21,323 | | | | 127,652 | | | | 138,629 | | |
Due from broker for swap contracts | | | — | | | | 32,067 | | | | 2,258,993 | | | | 429,319 | | |
Unrealized appreciation on swap contracts | | | 40,646,424 | | | | 587,560 | | | | 384,213 | | | | 19,825,051 | | |
Prepaid expenses and other assets | | | 43,286 | | | | 36,025 | | | | 19,923 | | | | 7,498 | | |
Total Assets | | | 237,702,749 | | | | 26,244,094 | | | | 118,877,534 | | | | 77,703,375 | | |
Liabilities: | |
Collateral for securities loaned (Note 2) | | | 366,616 | | | | — | | | | — | | | | — | | |
Payable for Fund shares redeemed | | | — | | | | — | | | | 88,515 | | | | 3,822,003 | | |
Payable for investments purchased | | | 345,997 | | | | — | | | | — | | | | — | | |
Unrealized depreciation on swap contracts | | | — | | | | 700,096 | | | | 12,953,002 | | | | — | | |
Due to Adviser, net (Note 6) | | | 100,714 | | | | 23,069 | | | | 53,120 | | | | 39,338 | | |
Due to broker for swap contracts | | | 42,028,659 | | | | 848,491 | | | | 2,600,866 | | | | 17,622,000 | | |
Accrued expenses and other liabilities | | | 80,608 | | | | 19,621 | | | | 81,686 | | | | 37,269 | | |
Total Liabilities | | | 42,922,594 | | | | 1,591,277 | | | | 15,777,189 | | | | 21,520,610 | | |
Net Assets | | $ | 194,780,155 | | | $ | 24,652,817 | | | $ | 103,100,345 | | | $ | 56,182,765 | | |
Net Assets Consist of: | |
Capital stock | | $ | 189,904,134 | | | $ | 56,797,019 | | | $ | 359,896,894 | | | $ | 59,277,294 | | |
Total distributable earnings (loss) | | | 4,876,021 | | | | (32,144,202 | ) | | | (256,796,549 | ) | | | (3,094,529 | ) | |
Net Assets | | $ | 194,780,155 | | | $ | 24,652,817 | | | $ | 103,100,345 | | | $ | 56,182,765 | | |
Calculation of Net Asset Value Per
Share: | |
Net assets | | $ | 194,780,155 | | | $ | 24,652,817 | | | $ | 103,100,345 | | | $ | 56,182,765 | | |
Shares outstanding (unlimited shares
of beneficial interest authorized,
par value) | | | 10,750,001 | | | | 1,050,001 | | | | 14,300,001 | | | | 1,469,952 | | |
Net assets value, redemption price
and offering price per share | | $ | 18.12 | | | $ | 23.48 | | | $ | 7.21 | | | $ | 38.22 | | |
Cost of Investments | | $ | 191,591,376 | | | $ | 27,159,444 | | | $ | 121,998,619 | | | $ | 55,469,884 | | |
* Securities loaned with values of $345,683, $–, $– and $–, respectively. See Note 2.
The accompanying notes are an integral part of these financial statements.
DIREXION ANNUAL REPORT
127
Statements of Assets and Liabilities
October 31, 2022
| | | Direxion Daily
Financial
Bull 3X Shares | | Direxion Daily
Financial
Bear 3X Shares | | Direxion Daily
Healthcare
Bull 3X Shares | | Direxion Daily
Homebuilders &
Supplies
Bull 3X Shares | |
Assets: | |
Investments, at fair value (Note 2) | | $ | 1,896,617,533 | | | $ | 210,390,023 | | | $ | 193,508,104 | | | $ | 132,901,827 | | |
Cash | | | 33,820,000 | | | | — | | | | 2,850,000 | | | | 2,400,000 | | |
Receivable for Fund shares sold | | | 222,008 | | | | 8,044,901 | | | | — | | | | — | | |
Dividend and interest receivable | | | 2,617,836 | | | | 469,879 | | | | 273,250 | | | | 136,614 | | |
Due from broker for swap contracts | | | 1,355,390 | | | | 1,609,518 | | | | — | | | | 99,306 | | |
Unrealized appreciation on swap contracts | | | 152,077,491 | | | | — | | | | 19,007,728 | | | | 8,334,845 | | |
Prepaid expenses and other assets | | | 100,462 | | | | 8,959 | | | | 18,993 | | | | 55,022 | | |
Total Assets | | | 2,086,810,720 | | | | 220,523,280 | | | | 215,658,075 | | | | 143,927,614 | | |
Liabilities: | |
Payable for Fund shares redeemed | | | 4,285,754 | | | | — | | | | — | | | | — | | |
Payable for investments purchased | | | 6,325,990 | | | | — | | | | — | | | | — | | |
Unrealized depreciation on swap contracts | | | — | | | | 25,522,185 | | | | — | | | | — | | |
Due to Adviser, net (Note 6) | | | 1,209,923 | | | | 134,331 | | | | 118,488 | | | | 75,308 | | |
Due to broker for swap contracts | | | 181,890,399 | | | | 4,093,146 | | | | 19,411,958 | | | | 12,631,781 | | |
Accrued expenses and other liabilities | | | 875,624 | | | | 83,615 | | | | 97,334 | | | | 75,834 | | |
Total Liabilities | | | 194,587,690 | | | | 29,833,277 | | | | 19,627,780 | | | | 12,782,923 | | |
Net Assets | | $ | 1,892,223,030 | | | $ | 190,690,003 | | | $ | 196,030,295 | | | $ | 131,144,691 | | |
Net Assets Consist of: | |
Capital stock | | $ | 2,341,046,092 | | | $ | 3,323,072,311 | | | $ | 216,281,673 | | | $ | 250,523,050 | | |
Total distributable loss | | | (448,823,062 | ) | | | (3,132,382,308 | ) | | | (20,251,378 | ) | | | (119,378,359 | ) | |
Net Assets | | $ | 1,892,223,030 | | | $ | 190,690,003 | | | $ | 196,030,295 | | | $ | 131,144,691 | | |
Calculation of Net Asset Value Per
Share: | |
Net assets | | $ | 1,892,223,030 | | | $ | 190,690,003 | | | $ | 196,030,295 | | | $ | 131,144,691 | | |
Shares outstanding (unlimited shares
of beneficial interest authorized,
par value) | | | 25,699,289 | | | | 9,303,350 | | | | 1,800,008 | | | | 5,000,000 | | |
Net assets value, redemption price
and offering price per share | | $ | 73.63 | | | $ | 20.50 | | | $ | 108.91 | | | $ | 26.23 | | |
Cost of Investments | | $ | 1,849,163,461 | | | $ | 210,390,023 | | | $ | 197,054,630 | | | $ | 137,646,542 | | |
The accompanying notes are an integral part of these financial statements.
DIREXION ANNUAL REPORT
128
Statements of Assets and Liabilities
October 31, 2022
| | | Direxion Daily
Industrials
Bull 3X Shares | | Direxion Daily
Pharmaceutical &
Medical
Bull 3X Shares | | Direxion Daily
Real Estate
Bull 3X Shares | | Direxion Daily
Real Estate
Bear 3X Shares | |
Assets: | |
Investments, at fair value (including
securities loaned*) (Note 2) | | $ | 18,767,192 | | | $ | 11,356,589 | | | $ | 46,826,600 | | | $ | 213,484,454 | | |
Cash | | | 45,587 | | | | — | | | | 1,450,000 | | | | — | | |
Receivable for Fund shares sold | | | — | | | | — | | | | 64,896 | | | | 6,032,232 | | |
Dividend and interest receivable | | | 23,960 | | | | 15,351 | | | | 50,273 | | | | 526,133 | | |
Due from broker for swap contracts | | | 17,759 | | | | 13,390 | | | | 283 | | | | 321,887 | | |
Unrealized appreciation on swap contracts | | | 2,303,753 | | | | 803,936 | | | | 4,113,182 | | | | 14,605,246 | | |
Prepaid expenses and other assets | | | 52,088 | | | | 61,601 | | | | 82,058 | | | | 12,818 | | |
Total Assets | | | 21,210,339 | | | | 12,250,867 | | | | 52,587,292 | | | | 234,982,770 | | |
Liabilities: | |
Collateral for securities loaned (Note 2) | | | — | | | | 52,307 | | | | — | | | | — | | |
Payable for investments purchased | | | 45,587 | | | | — | | | | — | | | | — | | |
Unrealized depreciation on swap contracts | | | — | | | | 201,806 | | | | — | | | | 14,424,448 | | |
Due to Adviser, net (Note 6) | | | 10,671 | | | | 4,309 | | | | 49,141 | | | | 173,131 | | |
Due to broker for swap contracts | | | 2,260,845 | | | | 803,939 | | | | 5,227,625 | | | | 14,896,870 | | |
Accrued expenses and other liabilities | | | 20,323 | | | | 15,483 | | | | 42,479 | | | | 54,938 | | |
Total Liabilities | | | 2,337,426 | | | | 1,077,844 | | | | 5,319,245 | | | | 29,549,387 | | |
Net Assets | | $ | 18,872,913 | | | $ | 11,173,023 | | | $ | 47,268,047 | | | $ | 205,433,383 | | |
Net Assets Consist of: | |
Capital stock | | $ | 23,087,902 | | | $ | 20,284,473 | | | $ | 74,558,776 | | | $ | 311,506,779 | | |
Total distributable loss | | | (4,214,989 | ) | | | (9,111,450 | ) | | | (27,290,729 | ) | | | (106,073,396 | ) | |
Net Assets | | $ | 18,872,913 | | | $ | 11,173,023 | | | $ | 47,268,047 | | | $ | 205,433,383 | | |
Calculation of Net Asset Value Per
Share: | |
Net assets | | $ | 18,872,913 | | | $ | 11,173,023 | | | $ | 47,268,047 | | | $ | 205,433,383 | | |
Shares outstanding (unlimited shares
of beneficial interest authorized,
par value) | | | 650,001 | | | | 1,100,001 | | | | 4,800,000 | | | | 3,384,045 | | |
Net assets value, redemption price
and offering price per share | | $ | 29.04 | | | $ | 10.16 | | | $ | 9.85 | | | $ | 60.71 | | |
Cost of Investments | | $ | 20,479,152 | | | $ | 11,787,289 | | | $ | 52,014,366 | | | $ | 213,484,454 | | |
* Securities loaned with values of $–, $51,141, $– and $–, respectively. See Note 2.
The accompanying notes are an integral part of these financial statements.
DIREXION ANNUAL REPORT
129
Statements of Assets and Liabilities
October 31, 2022
| | | Direxion Daily
Regional Banks
Bull 3X Shares | | Direxion Daily
Retail
Bull 3X Shares | | Direxion Daily
S&P 500®
High Beta
Bull 3X Shares | | Direxion Daily
S&P 500®
High Beta
Bear 3X Shares | |
Assets: | |
Investments, at fair value (including
securities loaned*) (Note 2) | | $ | 209,895,212 | | | $ | 45,856,071 | | | $ | 69,727,681 | | | $ | 65,710,134 | | |
Cash | | | 2,000,000 | | | | 539,000 | | | | 1,020,000 | | | | — | | |
Receivable for Fund shares sold | | | — | | | | — | | | | — | | | | 1,682,335 | | |
Dividend and interest receivable | | | 215,988 | | | | 130,077 | | | | 49,734 | | | | 173,765 | | |
Due from broker for swap contracts | | | 14,917 | | | | 1,420,000 | | | | 104,549 | | | | — | | |
Unrealized appreciation on swap contracts | | | 24,002,249 | | | | 4,033,098 | | | | 5,874,167 | | | | 13,660,368 | | |
Prepaid expenses and other assets | | | 100,855 | | | | 64,522 | | | | 46,361 | | | | 11,458 | | |
Total Assets | | | 236,229,221 | | | | 52,042,768 | | | | 76,822,492 | | | | 81,238,060 | | |
Liabilities: | |
Collateral for securities loaned (Note 2) | | | — | | | | 411,412 | | | | — | | | | — | | |
Payable for Fund shares redeemed | | | — | | | | — | | | | 21,438 | | | | 1,261,751 | | |
Unrealized depreciation on swap contracts | | | — | | | | — | | | | 233,162 | | | | 329,150 | | |
Due to Adviser, net (Note 6) | | | 120,592 | | | | 28,558 | | | | 36,978 | | | | 47,351 | | |
Due to broker for swap contracts | | | 23,602,041 | | | | 554,396 | | | | 7,260,259 | | | | 13,135,108 | | |
Accrued expenses and other liabilities | | | 74,025 | | | | 28,778 | | | | 36,090 | | | | 37,024 | | |
Total Liabilities | | | 23,796,658 | | | | 1,023,144 | | | | 7,587,927 | | | | 14,810,384 | | |
Net Assets | | $ | 212,432,563 | | | $ | 51,019,624 | | | $ | 69,234,565 | | | $ | 66,427,676 | | |
Net Assets Consist of: | |
Capital stock | | $ | 280,398,531 | | | $ | 147,093,276 | | | $ | 114,357,707 | | | $ | 172,669,952 | | |
Total distributable loss | | | (67,965,968 | ) | | | (96,073,652 | ) | | | (45,123,142 | ) | | | (106,242,276 | ) | |
Net Assets | | $ | 212,432,563 | | | $ | 51,019,624 | | | $ | 69,234,565 | | | $ | 66,427,676 | | |
Calculation of Net Asset Value Per
Share: | |
Net assets | | $ | 212,432,563 | | | $ | 51,019,624 | | | $ | 69,234,565 | | | $ | 66,427,676 | | |
Shares outstanding (unlimited shares
of beneficial interest authorized,
par value) | | | 7,098,590 | | | | 6,271,105 | | | | 2,714,370 | | | | 7,706,828 | | |
Net assets value, redemption price
and offering price per share | | $ | 29.93 | | | $ | 8.14 | | | $ | 25.51 | | | $ | 8.62 | | |
Cost of Investments | | $ | 220,801,885 | | | $ | 46,034,515 | | | $ | 72,669,355 | | | $ | 65,710,134 | | |
* Securities loaned with values of $–, $426,126, $– and $–, respectively. See Note 2.
The accompanying notes are an integral part of these financial statements.
DIREXION ANNUAL REPORT
130
Statements of Assets and Liabilities
October 31, 2022
| | | Direxion Daily
S&P Biotech
Bull 3X Shares | | Direxion Daily
S&P Biotech
Bear 3X Shares | | Direxion Daily
Semiconductor
Bull 3X Shares | | Direxion Daily
Semiconductor
Bear 3X Shares | |
Assets: | |
Investments, at fair value (including
securities loaned*) (Note 2) | | $ | 1,207,468,007 | | | $ | 201,263,746 | | | $ | 4,719,636,852 | | | $ | 552,731,281 | | |
Cash | | | 23,410,000 | | | | — | | | | — | | | | — | | |
Receivable for Fund shares sold | | | 1,113 | | | | 1,210 | | | | — | | | | 58,609,241 | | |
Dividend and interest receivable | | | 1,278,390 | | | | 474,524 | | | | 7,097,244 | | | | 1,363,139 | | |
Due from broker for swap contracts | | | — | | | | 4,529,118 | | | | 101,183,856 | | | | 126,425 | | |
Unrealized appreciation on swap contracts | | | 135,934,094 | | | | 16,133,946 | | | | 60,908,870 | | | | 167,269,759 | | |
Prepaid expenses and other assets | | | 216,844 | | | | 21,685 | | | | 29,653 | | | | 15,431 | | |
Total Assets | | | 1,368,308,448 | | | | 222,424,229 | | | | 4,888,856,475 | | | | 780,115,276 | | |
Liabilities: | |
Collateral for securities loaned (Note 2) | | | 3,481,470 | | | | — | | | | 14,375,196 | | | | — | | |
Payable for Fund shares redeemed | | | 3,711,462 | | | | 4,035,247 | | | | 14,525,528 | | | | 2,790,916 | | |
Payable for investments purchased | | | 630,850 | | | | — | | | | 195,848,911 | | | | — | | |
Unrealized depreciation on swap contracts | | | 31,712,619 | | | | 15,684,470 | | | | 869,702,305 | | | | 19,593,452 | | |
Due to Adviser, net (Note 6) | | | 735,922 | | | | 118,181 | | | | 2,169,985 | | | | 373,048 | | |
Due to broker for swap contracts | | | 167,540,109 | | | | 12,509,046 | | | | 314,759,380 | | | | 166,166,400 | | |
Accrued expenses and other liabilities | | | 649,199 | | | | 102,517 | | | | 3,402,900 | | | | 220,511 | | |
Total Liabilities | | | 208,461,631 | | | | 32,449,461 | | | | 1,414,784,205 | | | | 189,144,327 | | |
Net Assets | | $ | 1,159,846,817 | | | $ | 189,974,768 | | | $ | 3,474,072,270 | | | $ | 590,970,949 | | |
Net Assets Consist of: | |
Capital stock | | $ | 2,657,847,314 | | | $ | 534,648,966 | | | $ | 9,396,086,426 | | | $ | 978,981,930 | | |
Total distributable loss | | | (1,498,000,497 | ) | | | (344,674,198 | ) | | | (5,922,014,156 | ) | | | (388,010,981 | ) | |
Net Assets | | $ | 1,159,846,817 | | | $ | 189,974,768 | | | $ | 3,474,072,270 | | | $ | 590,970,949 | | |
Calculation of Net Asset Value Per
Share: | |
Net assets | | $ | 1,159,846,817 | | | $ | 189,974,768 | | | $ | 3,474,072,270 | | | $ | 590,970,949 | | |
Shares outstanding (unlimited shares
of beneficial interest authorized,
par value) | | | 156,261,600 | | | | 9,416,024 | | | | 390,950,060 | | | | 9,923,440 | | |
Net assets value, redemption price
and offering price per share | | $ | 7.42 | | | $ | 20.18 | | | $ | 8.89 | | | $ | 59.55 | | |
Cost of Investments | | $ | 1,208,091,778 | | | $ | 201,263,746 | | | $ | 4,790,065,701 | | | $ | 552,731,281 | | |
* Securities loaned with values of $3,436,058, $–, $14,018,774 and $–, respectively. See Note 2.
The accompanying notes are an integral part of these financial statements.
DIREXION ANNUAL REPORT
131
Statements of Assets and Liabilities
October 31, 2022
| | | Direxion Daily
Technology
Bull 3X Shares | | Direxion Daily
Technology
Bear 3X Shares | | Direxion Daily
Transportation
Bull 3X Shares | | Direxion Daily
Utilities
Bull 3X Shares | |
Assets: | |
Investments, at fair value (Note 2) | | $ | 1,552,503,414 | | | $ | 147,517,245 | | | $ | 25,807,394 | | | $ | 21,361,721 | | |
Cash | | | — | | | | — | | | | — | | | | 990,000 | | |
Receivable for Fund shares sold | | | 1,667,593 | | | | 12,107,095 | | | | — | | | | — | | |
Dividend and interest receivable | | | 1,659,457 | | | | 460,397 | | | | 29,467 | | | | 19,324 | | |
Due from broker for swap contracts | | | 662,982 | | | | 1,853,808 | | | | — | | | | — | | |
Unrealized appreciation on swap contracts | | | 18,597,208 | | | | 42,022,708 | | | | 755,230 | | | | 1,306,158 | | |
Prepaid expenses and other assets | | | 81,873 | | | | 19,718 | | | | 39,085 | | | | 30,627 | | |
Total Assets | | | 1,575,172,527 | | | | 203,980,971 | | | | 26,631,176 | | | | 23,707,830 | | |
Liabilities: | |
Payable for Fund shares redeemed | | | 5,425,708 | | | | 4,198,007 | | | | — | | | | 27,463 | | |
Unrealized depreciation on swap contracts | | | 134,172,168 | | | | — | | | | 2,524,587 | | | | 140,578 | | |
Due to Adviser, net (Note 6) | | | 911,780 | | | | 132,084 | | | | 10,792 | | | | 8,182 | | |
Due to broker for swap contracts | | | 64,983,432 | | | | 40,029,346 | | | | 833,385 | | | | 1,630,000 | | |
Accrued expenses and other liabilities | | | 884,499 | | | | 87,026 | | | | 19,902 | | | | 18,982 | | |
Total Liabilities | | | 206,377,587 | | | | 44,446,463 | | | | 3,388,666 | | | | 1,825,205 | | |
Net Assets | | $ | 1,368,794,940 | | | $ | 159,534,508 | | | $ | 23,242,510 | | | $ | 21,882,625 | | |
Net Assets Consist of: | |
Capital stock | | $ | 2,630,456,460 | | | $ | 422,281,830 | | | $ | 30,524,514 | | | $ | 23,574,607 | | |
Total distributable loss | | | (1,261,661,520 | ) | | | (262,747,322 | ) | | | (7,282,004 | ) | | | (1,691,982 | ) | |
Net Assets | | $ | 1,368,794,940 | | | $ | 159,534,508 | | | $ | 23,242,510 | | | $ | 21,882,625 | | |
Calculation of Net Asset Value Per
Share: | |
Net assets | | $ | 1,368,794,940 | | | $ | 159,534,508 | | | $ | 23,242,510 | | | $ | 21,882,625 | | |
Shares outstanding (unlimited shares
of beneficial interest authorized,
par value) | | | 53,300,000 | | | | 3,800,260 | | | | 1,050,001 | | | | 750,001 | | |
Net assets value, redemption price
and offering price per share | | $ | 25.68 | | | $ | 41.98 | | | $ | 22.14 | | | $ | 29.18 | | |
Cost of Investments | | $ | 1,513,648,084 | | | $ | 147,517,245 | | | $ | 28,048,571 | | | $ | 21,240,048 | | |
The accompanying notes are an integral part of these financial statements.
DIREXION ANNUAL REPORT
132
Statements of Assets and Liabilities
October 31, 2022
| | | Direxion Daily
7-10 Year
Treasury
Bull 3X Shares | | Direxion Daily
7-10 Year
Treasury
Bear 3X Shares | | Direxion Daily
20+ Year
Treasury
Bull 3X Shares | | Direxion Daily
20+ Year
Treasury
Bear 3X Shares | |
Assets: | |
Investments, at fair value (including
securities loaned*) (Note 2) | | $ | 28,440,371 | | | $ | 55,227,322 | | | $ | 615,393,978 | | | $ | 678,137,999 | | |
Cash | | | — | | | | — | | | | — | | | | 1,220,000 | | |
Receivable for Fund shares sold | | | — | | | | — | | | | 3,583,559 | | | | 15,756,574 | | |
Dividend and interest receivable | | | 25,135 | | | | 143,134 | | | | 718,249 | | | | 1,509,352 | | |
Due from broker for swap contracts | | | 62,895 | | | | 646,537 | | | | 1,527,160 | | | | 299,384 | | |
Unrealized appreciation on swap contracts | | | — | | | | 6,315,606 | | | | — | | | | 155,291,282 | | |
Prepaid expenses and other assets | | | 6,948 | | | | 8,939 | | | | 5,186 | | | | 5,568 | | |
Total Assets | | | 28,535,349 | | | | 62,341,538 | | | | 621,228,132 | | | | 852,220,159 | | |
Liabilities: | |
Collateral for securities loaned (Note 2) | | | 1 | | | | — | | | | — | | | | — | | |
Payable for Fund shares redeemed | | | — | | | | — | | | | — | | | | 7,793,780 | | |
Unrealized depreciation on swap contracts | | | 4,080,902 | | | | — | | | | 176,181,059 | | | | 6,461,655 | | |
Due to Adviser, net (Note 6) | | | 21,738 | | | | 47,023 | | | | 253,903 | | | | 419,381 | | |
Due to broker for swap contracts | | | 118,865 | | | | 6,120,729 | | | | 7,359,666 | | | | 148,625,914 | | |
Accrued expenses and other liabilities | | | 32,107 | | | | 38,338 | | | | 248,184 | | | | 269,771 | | |
Total Liabilities | | | 4,253,613 | | | | 6,206,090 | | | | 184,042,812 | | | | 163,570,501 | | |
Net Assets | | $ | 24,281,736 | | | $ | 56,135,448 | | | $ | 437,185,320 | | | $ | 688,649,658 | | |
Net Assets Consist of: | |
Capital stock | | $ | 39,159,693 | | | $ | 98,530,169 | | | $ | 991,838,666 | | | $ | 1,249,424,189 | | |
Total distributable loss | | | (14,877,957 | ) | | | (42,394,721 | ) | | | (554,653,346 | ) | | | (560,774,531 | ) | |
Net Assets | | $ | 24,281,736 | | | $ | 56,135,448 | | | $ | 437,185,320 | | | $ | 688,649,658 | | |
Calculation of Net Asset Value Per
Share: | |
Net assets | | $ | 24,281,736 | | | $ | 56,135,448 | | | $ | 437,185,320 | | | $ | 688,649,658 | | |
Shares outstanding (unlimited shares
of beneficial interest authorized,
par value) | | | 850,000 | | | | 3,950,000 | | | | 62,350,000 | | | | 4,324,261 | | |
Net assets value, redemption price
and offering price per share | | $ | 28.57 | | | $ | 14.21 | | | $ | 7.01 | | | $ | 159.25 | | |
Cost of Investments | | $ | 30,067,306 | | | $ | 55,227,322 | | | $ | 642,924,093 | | | $ | 678,137,999 | | |
* Securities loaned with values of $1,119,112, $–, $– and $–, respectively. See Note 2.
The accompanying notes are an integral part of these financial statements.
DIREXION ANNUAL REPORT
133
Statements of Operations
For the Year Ended October 31, 2022
| | | Direxion Daily
Mid Cap
Bull 3X Shares | | Direxion Daily
S&P 500®
Bull 3X Shares | | Direxion Daily
S&P 500®
Bear 3X Shares | | Direxion Daily
Small Cap
Bull 3X Shares | |
Investment Income: | |
Dividend income | | $ | 651,558 | | | $ | 23,416,653 | | | $ | — | | | $ | 10,994,434 | | |
Interest income | | | 181,444 | | | | 9,186,197 | | | | 7,075,976 | | | | 4,527,030 | | |
Securities lending income | | | 492 | | | | — | | | | — | | | | 546,572 | | |
Total investment income | | | 833,494 | | | | 32,602,850 | | | | 7,075,976 | | | | 16,068,036 | | |
Expenses: | |
Investment advisory fees (Note 6) | | | 486,179 | | | | 21,313,999 | | | | 4,156,940 | | | | 10,420,649 | | |
Licensing fees | | | 51,859 | | | | 2,273,493 | | | | 443,407 | | | | 833,652 | | |
Fund servicing fees | | | 24,772 | | | | 1,044,779 | | | | 206,007 | | | | 511,099 | | |
Interest expense | | | 19,704 | | | | 883,739 | | | | 713,561 | | | | 374,800 | | |
Management service fees (Note 6) | | | 16,068 | | | | 704,094 | | | | 137,583 | | | | 344,199 | | |
Professional fees | | | 15,070 | | | | 230,123 | | | | 51,199 | | | | 117,914 | | |
Reports to shareholders | | | 10,230 | | | | 453,474 | | | | 91,468 | | | | 221,416 | | |
Pricing fees | | | 6,001 | | | | 6,001 | | | | 6,001 | | | | 6,001 | | |
Exchange listing fees | | | 5,439 | | | | 6,947 | | | | 5,439 | | | | 5,439 | | |
Trustees' fees and expenses | | | 2,046 | | | | 90,885 | | | | 18,422 | | | | 44,378 | | |
Insurance fees | | | 1,390 | | | | 61,110 | | | | 12,158 | | | | 29,868 | | |
Other | | | 2,399 | | | | 176,948 | | | | 44,317 | | | | 125,564 | | |
Total Expenses | | | 641,157 | | | | 27,245,592 | | | | 5,886,502 | | | | 13,034,979 | | |
Recoupment of expenses to Adviser (Note 6) | | | 2,977 | | | | 13,055 | | | | 103,161 | | | | 17,632 | | |
Less: Reimbursement of expenses from Adviser
(Note 6) | | | (8,604 | ) | | | (13,055 | ) | | | (10,643 | ) | | | (17,406 | ) | |
Less: Investment advisory fees waived (Note 6) | | | — | | | | (1,262,799 | ) | | | — | | | | — | | |
Net Expenses | | | 635,530 | | | | 25,982,793 | | | | 5,979,020 | | | | 13,035,205 | | |
Net investment income | | | 197,964 | | | | 6,620,057 | | | | 1,096,956 | | | | 3,032,831 | | |
Net realized and unrealized gain (loss) on
investments: | |
Net realized gain (loss) on: | |
Investment securities | | | (4,013,718 | ) | | | (212,059,789 | ) | | | — | | | | (283,386,882 | ) | |
In-kind redemptions | | | 3,661,005 | | | | 88,927,501 | | | | — | | | | 46,128,542 | | |
Swap contracts | | | (11,815,331 | ) | | | (590,652,464 | ) | | | (1,820,867 | ) | | | (858,201,681 | ) | |
Net realized loss | | | (12,168,044 | ) | | | (713,784,752 | ) | | | (1,820,867 | ) | | | (1,095,460,021 | ) | |
Change in net unrealized appreciation (depreciation) on: | |
Investment securities | | | (8,782,402 | ) | | | (202,190,589 | ) | | | — | | | | (14,799,799 | ) | |
Swap contracts | | | (19,428,767 | ) | | | (723,953,351 | ) | | | 157,306,258 | | | | (20,424,743 | ) | |
Change in net unrealized appreciation (depreciation) | | | (28,211,169 | ) | | | (926,143,940 | ) | | | 157,306,258 | | | | (35,224,542 | ) | |
Net realized and unrealized gain (loss) | | | (40,379,213 | ) | | | (1,639,928,692 | ) | | | 155,485,391 | | | | (1,130,684,563 | ) | |
Net increase (decrease) in net assets resulting
from operations | | $ | (40,181,249 | ) | | $ | (1,633,308,635 | ) | | $ | 156,582,347 | | | $ | (1,127,651,732 | ) | |
The accompanying notes are an integral part of these financial statements.
DIREXION ANNUAL REPORT
134
Statements of Operations
For the Year Ended October 31, 2022
| | | Direxion Daily
Small Cap
Bear 3X Shares | | Direxion Daily
FTSE China
Bull 3X Shares | | Direxion Daily
FTSE China
Bear 3X Shares | | Direxion Daily
FTSE Europe
Bull 3X Shares | |
Investment Income: | |
Dividend income | | $ | — | | | $ | 5,501,849 | | | $ | — | | | $ | 492,548 | | |
Interest income | | | 4,361,082 | | | | 2,376,297 | | | | 1,069,226 | | | | 108,417 | | |
Securities lending income | | | — | | | | 3,060 | | | | — | | | | 12,377 | | |
Total investment income | | | 4,361,082 | | | | 7,881,206 | | | | 1,069,226 | | | | 613,342 | | |
Expenses: | |
Investment advisory fees (Note 6) | | | 3,167,763 | | | | 3,371,544 | | | | 695,258 | | | | 215,139 | | |
Interest expense | | | 334,783 | | | | 84,903 | | | | 99,978 | | | | 4,631 | | |
Licensing fees | | | 253,421 | | | | 391,549 | | | | 80,742 | | | | 9,369 | | |
Fund servicing fees | | | 156,685 | | | | 166,358 | | | | 35,263 | | | | 11,490 | | |
Management service fees (Note 6) | | | 104,748 | | | | 111,431 | | | | 23,005 | | | | 7,108 | | |
Reports to shareholders | | | 68,569 | | | | 72,387 | | | | 15,281 | | | | 4,498 | | |
Professional fees | | | 41,725 | | | | 44,106 | | | | 16,878 | | | | 12,261 | | |
Trustees' fees and expenses | | | 13,765 | | | | 14,509 | | | | 3,078 | | | | 899 | | |
Insurance fees | | | 9,172 | | | | 9,639 | | | | 2,032 | | | | 614 | | |
Exchange listing fees | | | 6,347 | | | | 9,966 | | | | 5,439 | | | | 5,439 | | |
Pricing fees | | | 6,001 | | | | 6,001 | | | | 6,001 | | | | 6,001 | | |
Excise tax | | | — | | | | — | | | | — | | | | 5,042 | | |
Other | | | 11,780 | | | | 64,169 | | | | 2,294 | | | | 1,132 | | |
Total Expenses | | | 4,174,759 | | | | 4,346,562 | | | | 985,249 | | | | 283,623 | | |
Recoupment of expenses to Adviser (Note 6) | | | 3,683 | | | | 58,394 | | | | 1,312 | | | | 4,734 | | |
Less: Reimbursement of expenses from Adviser
(Note 6) | | | — | | | | (49,431 | ) | | | (5,923 | ) | | | (6,174 | ) | |
Net Expenses | | | 4,178,442 | | | | 4,355,525 | | | | 980,638 | | | | 282,183 | | |
Net investment income | | | 182,640 | | | | 3,525,681 | | | | 88,588 | | | | 331,159 | | |
Net realized and unrealized gain (loss) on
investments: | |
Net realized gain (loss) on: | |
Investment securities | | | — | | | | (190,963,950 | ) | | | — | | | | (2,463,020 | ) | |
In-kind redemptions | | | — | | | | 22,410,379 | | | | — | | | | (202,714 | ) | |
Swap contracts | | | 111,315,116 | | | | (539,796,240 | ) | | | 68,000,459 | | | | (13,278,294 | ) | |
Net realized gain (loss) | | | 111,315,116 | | | | (708,349,811 | ) | | | 68,000,459 | | | | (15,944,028 | ) | |
Change in net unrealized appreciation (depreciation) on: | |
Investment securities | | | — | | | | (24,341,906 | ) | | | — | | | | (1,538,116 | ) | |
Swap contracts | | | 35,918,628 | | | | (103,161,480 | ) | | | 61,784,025 | | | | (10,744,508 | ) | |
Change in net unrealized appreciation (depreciation) | | | 35,918,628 | | | | (127,503,386 | ) | | | 61,784,025 | | | | (12,282,624 | ) | |
Net realized and unrealized gain (loss) | | | 147,233,744 | | | | (835,853,197 | ) | | | 129,784,484 | | | | (28,226,652 | ) | |
Net increase (decrease) in net assets resulting
from operations | | $ | 147,416,384 | | | $ | (832,327,516 | ) | | $ | 129,873,072 | | | $ | (27,895,493 | ) | |
The accompanying notes are an integral part of these financial statements.
DIREXION ANNUAL REPORT
135
Statements of Operations
For the Year Ended October 31, 2022
| | | Direxion Daily
MSCI
Emerging
Markets
Bull 3X Shares | | Direxion Daily
MSCI
Emerging
Markets
Bear 3X Shares | | Direxion Daily
MSCI
Mexico
Bull 3X Shares | | Direxion Daily
MSCI
South Korea
Bull 3X Shares | |
Investment Income: | |
Dividend income | | $ | 1,124,110 | | | $ | — | | | $ | 173,943 | | | $ | 383,524 | | |
Interest income | | | 735,404 | | | | 415,621 | | | | 55,062 | | | | 123,755 | | |
Securities lending income | | | 296 | | | | — | | | | 50,724 | | | | 163 | | |
Total investment income | | | 1,859,810 | | | | 415,621 | | | | 279,729 | | | | 507,442 | | |
Expenses: | |
Investment advisory fees (Note 6) | | | 822,916 | | | | 283,286 | | | | 93,321 | | | | 219,287 | | |
Licensing fees | | | 105,542 | | | | 67,522 | | | | 4,977 | | | | 23,391 | | |
Fund servicing fees | | | 41,205 | | | | 14,977 | | | | 5,592 | | | | 11,703 | | |
Management service fees (Note 6) | | | 27,169 | | | | 9,381 | | | | 3,086 | | | | 7,246 | | |
Professional fees | | | 18,476 | | | | 12,838 | | | | 10,961 | | | | 12,288 | | |
Reports to shareholders | | | 17,309 | | | | 6,202 | | | | 1,990 | | | | 4,575 | | |
Interest expense | | | 13,917 | | | | 56,983 | | | | 3,338 | | | | 1,968 | | |
Pricing fees | | | 6,001 | | | | 6,001 | | | | 6,001 | | | | 6,001 | | |
Exchange listing fees | | | 5,439 | | | | 5,439 | | | | 5,438 | | | | 5,439 | | |
Trustees' fees and expenses | | | 3,459 | | | | 1,248 | | | | 397 | | | | 896 | | |
Insurance fees | | | 2,346 | | | | 822 | | | | 258 | | | | 626 | | |
Other | | | 4,727 | | | | 1,028 | | | | 447 | | | | 1,959 | | |
Total Expenses | | | 1,068,506 | | | | 465,727 | | | | 135,806 | | | | 295,379 | | |
Recoupment of expenses to Adviser (Note 6) | | | 5,484 | | | | 185 | | | | — | | | | — | | |
Less: Reimbursement of expenses from Adviser
(Note 6) | | | (17,713 | ) | | | (50,097 | ) | | | (14,262 | ) | | | (15,648 | ) | |
Net Expenses | | | 1,056,277 | | | | 415,815 | | | | 121,544 | | | | 279,731 | | |
Net investment income (loss) | | | 803,533 | | | | (194 | ) | | | 158,185 | | | | 227,711 | | |
Net realized and unrealized gain (loss) on
investments: | |
Net realized gain (loss) on: | |
Investment securities | | | (10,744,235 | ) | | | — | | | | (152,975 | ) | | | (5,886,889 | ) | |
In-kind redemptions | | | (423,018 | ) | | | — | | | | (353,420 | ) | | | 3,767 | | |
Swap contracts | | | (112,921,742 | ) | | | 21,149,834 | | | | 3,141,711 | | | | (32,858,734 | ) | |
Net realized gain (loss) | | | (124,088,995 | ) | | | 21,149,834 | | | | 2,635,316 | | | | (38,741,856 | ) | |
Change in net unrealized appreciation (depreciation) on: | |
Investment securities | | | 6,163,081 | | | | — | | | | 176,773 | | | | 492,458 | | |
Swap contracts | | | (12,352,541 | ) | | | 12,129,823 | | | | (2,541,568 | ) | | | 3,353,381 | | |
Change in net unrealized appreciation (depreciation) | | | (6,189,460 | ) | | | 12,129,823 | | | | (2,364,795 | ) | | | 3,845,839 | | |
Net realized and unrealized gain (loss) | | | (130,278,455 | ) | | | 33,279,657 | | | | 270,521 | | | | (34,896,017 | ) | |
Net increase (decrease) in net assets resulting
from operations | | $ | (129,474,922 | ) | | $ | 33,279,463 | | | $ | 428,706 | | | $ | (34,668,306 | ) | |
The accompanying notes are an integral part of these financial statements.
DIREXION ANNUAL REPORT
136
Statements of Operations
For the Year Ended October 31, 2022
| | | Direxion Daily
Aerospace &
Defense
Bull 3X Shares | | Direxion Daily
Consumer
Discretionary
Bull 3X Shares | | Direxion Daily
Dow Jones
Internet
Bull 3X Shares | | Direxion Daily
Dow Jones
Internet
Bear 3X Shares | |
Investment Income: | |
Dividend income | | $ | 2,105,540 | | | $ | 218,208 | | | $ | 216,131 | | | $ | — | | |
Interest income | | | 529,758 | | | | 87,959 | | | | 523,816 | | | | 515,543 | | |
Securities lending income | | | 3,780 | | | | 9 | | | | 438 | | | | — | | |
Total investment income | | | 2,639,078 | | | | 306,176 | | | | 740,385 | | | | 515,543 | | |
Expenses: | |
Investment advisory fees (Note 6) | | | 1,693,020 | | | | 295,726 | | | | 943,476 | | | | 250,086 | | |
Licensing fees | | | 180,587 | | | | 30,769 | | | | 100,638 | | | | 26,676 | | |
Fund servicing fees | | | 83,841 | | | | 15,440 | | | | 47,183 | | | | 13,387 | | |
Interest expense | | | 79,275 | | | | 32,511 | | | | 33,491 | | | | 35,758 | | |
Management service fees (Note 6) | | | 55,915 | | | | 9,772 | | | | 31,166 | | | | 8,297 | | |
Reports to shareholders | | | 35,990 | | | | 6,179 | | | | 20,256 | | | | 5,645 | | |
Professional fees | | | 27,420 | | | | 13,106 | | | | 19,834 | | | | 12,407 | | |
Trustees' fees and expenses | | | 7,211 | | | | 1,235 | | | | 4,071 | | | | 1,141 | | |
Pricing fees | | | 6,001 | | | | 6,001 | | | | 6,001 | | | | 6,001 | | |
Exchange listing fees | | | 5,439 | | | | 5,439 | | | | 5,439 | | | | 5,438 | | |
Insurance fees | | | 4,844 | | | | 844 | | | | 2,708 | | | | 733 | | |
Other | | | 7,781 | | | | 2,593 | | | | 32,298 | | | | 4,226 | | |
Total Expenses | | | 2,187,324 | | | | 419,615 | | | | 1,246,561 | | | | 369,795 | | |
Recoupment of expenses to Adviser (Note 6) | | | 5,317 | | | | 11,647 | | | | 13,316 | | | | 1,725 | | |
Less: Reimbursement of expenses from Adviser
(Note 6) | | | (2,545 | ) | | | (24,164 | ) | | | (31,317 | ) | | | (18,987 | ) | |
Net Expenses | | | 2,190,096 | | | | 407,098 | | | | 1,228,560 | | | | 352,533 | | |
Net investment income (loss) | | | 448,982 | | | | (100,922 | ) | | | (488,175 | ) | | | 163,010 | | |
Net realized and unrealized gain (loss) on
investments: | |
Net realized gain (loss) on: | |
Investment securities | | | (22,949,032 | ) | | | (9,281,502 | ) | | | (70,706,534 | ) | | | — | | |
In-kind redemptions | | | 18,583,197 | | | | 1,056,151 | | | | 10,018,789 | | | | — | | |
Swap contracts | | | (20,929,522 | ) | | | (22,013,596 | ) | | | (192,620,179 | ) | | | (5,074,902 | ) | |
Net realized loss | | | (25,295,357 | ) | | | (30,238,947 | ) | | | (253,307,924 | ) | | | (5,074,902 | ) | |
Change in net unrealized appreciation (depreciation) on: | |
Investment securities | | | 2,636,565 | | | | (4,258,604 | ) | | | (9,164,030 | ) | | | — | | |
Swap contracts | | | 11,627,268 | | | | (16,877,513 | ) | | | (33,552,842 | ) | | | 20,263,013 | | |
Change in net unrealized appreciation (depreciation) | | | 14,263,833 | | | | (21,136,117 | ) | | | (42,716,872 | ) | | | 20,263,013 | | |
Net realized and unrealized gain (loss) | | | (11,031,524 | ) | | | (51,375,064 | ) | | | (296,024,796 | ) | | | 15,188,111 | | |
Net increase (decrease) in net assets resulting
from operations | | $ | (10,582,542 | ) | | $ | (51,475,986 | ) | | $ | (296,512,971 | ) | | $ | 15,351,121 | | |
The accompanying notes are an integral part of these financial statements.
DIREXION ANNUAL REPORT
137
Statements of Operations
For the Year Ended October 31, 2022
| | | Direxion Daily
Financial
Bull 3X Shares | | Direxion Daily
Financial
Bear 3X Shares | | Direxion Daily
Healthcare
Bull 3X Shares | | Direxion Daily
Homebuilders &
Supplies
Bull 3X Shares | |
Investment Income: | |
Dividend income | | $ | 37,211,643 | | | $ | — | | | $ | 2,262,622 | | | $ | 1,590,513 | | |
(net of foreign withholding tax of $5,554,
$—, $— and $—, respectively) | |
Interest income | | | 6,492,660 | | | | 1,619,402 | | | | 587,859 | | | | 537,535 | | |
Securities lending income | | | 40,751 | | | | — | | | | — | | | | 14 | | |
Total investment income | | | 43,745,054 | | | | 1,619,402 | | | | 2,850,481 | | | | 2,128,062 | | |
Expenses: | |
Investment advisory fees (Note 6) | | | 19,168,898 | | | | 1,118,668 | | | | 1,602,231 | | | | 1,654,627 | | |
Licensing fees | | | 1,546,109 | | | | 90,764 | | | | 163,751 | | | | 176,494 | | |
Fund servicing fees | | | 938,364 | | | | 56,055 | | | | 79,491 | | | | 81,761 | | |
Management service fees (Note 6) | | | 632,982 | | | | 37,005 | | | | 52,938 | | | | 54,616 | | |
Interest expense | | | 446,367 | | | | 129,722 | | | | 60,979 | | | | 90,484 | | |
Reports to shareholders | | | 404,957 | | | | 24,387 | | | | 34,278 | | | | 34,125 | | |
Professional fees | | | 207,977 | | | | 21,159 | | | | 26,547 | | | | 27,671 | | |
Trustees' fees and expenses | | | 81,046 | | | | 4,902 | | | | 6,878 | | | | 6,803 | | |
Insurance fees | | | 54,795 | | | | 3,249 | | | | 4,597 | | | | 4,717 | | |
Exchange listing fees | | | 7,249 | | | | 5,741 | | | | 5,439 | | | | 5,439 | | |
Pricing fees | | | 6,001 | | | | 6,001 | | | | 6,001 | | | | 6,001 | | |
Other | | | 90,749 | | | | 7,335 | | | | 7,363 | | | | 9,225 | | |
Total Expenses | | | 23,585,494 | | | | 1,504,988 | | | | 2,050,493 | | | | 2,151,963 | | |
Recoupment of expenses to Adviser (Note 6) | | | 38,893 | | | | 44,901 | | | | 41,060 | | | | 3,805 | | |
Less: Reimbursement of expenses from Adviser
(Note 6) | | | (38,893 | ) | | | (3,187 | ) | | | (1,081 | ) | | | (3,805 | ) | |
Less: Investment advisory fees waived (Note 6) | | | (833,779 | ) | | | — | | | | — | | | | — | | |
Net Expenses | | | 22,751,715 | | | | 1,546,702 | | | | 2,090,472 | | | | 2,151,963 | | |
Net investment income (loss) | | | 20,993,339 | | | | 72,700 | | | | 760,009 | | | | (23,901 | ) | |
Net realized and unrealized gain (loss) on
investments: | |
Net realized gain (loss) on: | |
Investment securities | | | (261,510,442 | ) | | | — | | | | (6,855,945 | ) | | | (50,486,366 | ) | |
In-kind redemptions | | | 180,035,926 | | | | — | | | | 18,141,666 | | | | 18,835,736 | | |
Swap contracts | | | (277,080,997 | ) | | | 14,512,157 | | | | 11,808,344 | | | | (33,861,317 | ) | |
Net realized gain (loss) | | | (358,555,513 | ) | | | 14,512,157 | | | | 23,094,065 | | | | (65,511,947 | ) | |
Change in net unrealized appreciation (depreciation) on: | |
Investment securities | | | (349,578,819 | ) | | | — | | | | (17,585,723 | ) | | | (12,555,174 | ) | |
Swap contracts | | | (987,302,061 | ) | | | 3,952,927 | | | | (39,918,064 | ) | | | (120,188,219 | ) | |
Change in net unrealized appreciation (depreciation) | | | (1,336,880,880 | ) | | | 3,952,927 | | | | (57,503,787 | ) | | | (132,743,393 | ) | |
Net realized and unrealized gain (loss) | | | (1,695,436,393 | ) | | | 18,465,084 | | | | (34,409,722 | ) | | | (198,255,340 | ) | |
Net increase (decrease) in net assets resulting
from operations | | $ | (1,674,443,054 | ) | | $ | 18,537,784 | | | $ | (33,649,713 | ) | | $ | (198,279,241 | ) | |
The accompanying notes are an integral part of these financial statements.
DIREXION ANNUAL REPORT
138
Statements of Operations
For the Year Ended October 31, 2022
| | | Direxion Daily
Industrials
Bull 3X Shares | | Direxion Daily
Pharmaceutical &
Medical
Bull 3X Shares | | Direxion Daily
Real Estate
Bull 3X Shares | | Direxion Daily
Real Estate
Bear 3X Shares | |
Investment Income: | |
Dividend income | | $ | 342,500 | | | $ | 132,528 | | | $ | 1,859,903 | | | $ | — | | |
Interest income | | | 75,741 | | | | 45,867 | | | | 212,597 | | | | 1,223,989 | | |
Securities lending income | | | 2 | | | | 40,590 | | | | 167 | | | | — | | |
Total investment income | | | 418,243 | | | | 218,985 | | | | 2,072,667 | | | | 1,223,989 | | |
Expenses: | |
Investment advisory fees (Note 6) | | | 241,792 | | | | 133,506 | | | | 699,286 | | | | 520,890 | | |
Licensing fees | | | 25,535 | | | | 20,000 | | | | 68,620 | | | | 52,567 | | |
Fund servicing fees | | | 12,781 | | | | 7,517 | | | | 35,150 | | | | 26,853 | | |
Professional fees | | | 12,513 | | | | 11,397 | | | | 17,345 | | | | 15,085 | | |
Management service fees (Note 6) | | | 7,987 | | | | 4,412 | | | | 23,103 | | | | 17,288 | | |
Interest expense | | | 6,911 | | | | 6,161 | | | | 24,561 | | | | 43,218 | | |
Pricing fees | | | 6,001 | | | | 6,001 | | | | 6,001 | | | | 6,001 | | |
Exchange listing fees | | | 5,439 | | | | 5,439 | | | | 5,439 | | | | 5,439 | | |
Reports to shareholders | | | 5,003 | | | | 2,828 | | | | 14,658 | | | | 11,674 | | |
Trustees' fees and expenses | | | 997 | | | | 555 | | | | 2,930 | | | | 2,360 | | |
Insurance fees | | | 689 | | | | 381 | | | | 1,989 | | | | 1,572 | | |
Other | | | 1,218 | | | | 678 | | | | 3,616 | | | | 15,392 | | |
Total Expenses | | | 326,866 | | | | 198,875 | | | | 902,698 | | | | 718,339 | | |
Recoupment of expenses to Adviser (Note 6) | | | 4,165 | | | | 330 | | | | 34,235 | | | | 36,419 | | |
Less: Reimbursement of expenses from Adviser
(Note 6) | | | (17,849 | ) | | | (23,937 | ) | | | (26,610 | ) | | | (51,746 | ) | |
Net Expenses | | | 313,182 | | | | 175,268 | | | | 910,323 | | | | 703,012 | | |
Net investment income | | | 105,061 | | | | 43,717 | | | | 1,162,344 | | | | 520,977 | | |
Net realized and unrealized gain (loss) on
investments: | |
Net realized gain (loss) on: | |
Investment securities | | | (1,075,877 | ) | | | (3,619,478 | ) | | | (7,209,128 | ) | | | — | | |
In-kind redemptions | | | (253,543 | ) | | | 2,974,408 | | | | 6,332,458 | | | | — | | |
Swap contracts | | | 137,873 | | | | (5,852,092 | ) | | | 739,861 | | | | 24,704,385 | | |
Net realized gain (loss) | | | (1,191,547 | ) | | | (6,497,162 | ) | | | (136,809 | ) | | | 24,704,385 | | |
Change in net unrealized appreciation (depreciation) on: | |
Investment securities | | | (1,236,770 | ) | | | (788,250 | ) | | | (12,676,795 | ) | | | — | | |
Swap contracts | | | (12,064,262 | ) | | | 248,917 | | | | (51,070,274 | ) | | | 5,287,833 | | |
Change in net unrealized appreciation (depreciation) | | | (13,301,032 | ) | | | (539,333 | ) | | | (63,747,069 | ) | | | 5,287,833 | | |
Net realized and unrealized gain (loss) | | | (14,492,579 | ) | | | (7,036,495 | ) | | | (63,883,878 | ) | | | 29,992,218 | | |
Net increase (decrease) in net assets resulting from
operations | | $ | (14,387,518 | ) | | $ | (6,992,778 | ) | | $ | (62,721,534 | ) | | $ | 30,513,195 | | |
The accompanying notes are an integral part of these financial statements.
DIREXION ANNUAL REPORT
139
Statements of Operations
For the Year Ended October 31, 2022
| | | Direxion Daily
Regional
Banks
Bull 3X Shares | | Direxion Daily
Retail
Bull 3X Shares | | Direxion Daily
S&P 500®
High Beta
Bull 3X Shares | | Direxion Daily
S&P 500®
High Beta
Bear 3X Shares | |
Investment Income: | |
Dividend income | | $ | 5,309,788 | | | $ | 1,082,154 | | | $ | 503,498 | | | $ | — | | |
(net of foreign withholding tax of $18,277, $—,
$1,578 and $—, respectively) | |
Interest income | | | 705,240 | | | | 192,671 | | | | 179,804 | | | | 584,397 | | |
Securities lending income | | | 67 | | | | 91,653 | | | | 29 | | | | — | | |
Total investment income | | | 6,015,095 | | | | 1,366,478 | | | | 683,331 | | | | 584,397 | | |
Expenses: | |
Investment advisory fees (Note 6) | | | 2,413,726 | | | | 597,258 | | | | 600,182 | | | | 345,380 | | |
Interest expense | | | 143,846 | | | | 27,420 | | | | 45,173 | | | | 89,243 | | |
Licensing fees | | | 128,756 | | | | 31,897 | | | | 64,019 | | | | 36,841 | | |
Fund servicing fees | | | 118,965 | | | | 30,136 | | | | 30,348 | | | | 18,031 | | |
Management service fees (Note 6) | | | 79,693 | | | | 19,729 | | | | 19,835 | | | | 11,444 | | |
Reports to shareholders | | | 50,948 | | | | 12,317 | | | | 12,638 | | | | 7,643 | | |
Professional fees | | | 34,885 | | | | 16,336 | | | | 16,259 | | | | 13,392 | | |
Trustees' fees and expenses | | | 10,194 | | | | 2,456 | | | | 2,529 | | | | 1,540 | | |
Insurance fees | | | 6,891 | | | | 1,704 | | | | 1,719 | | | | 1,018 | | |
Pricing fees | | | 6,001 | | | | 6,001 | | | | 6,001 | | | | 6,001 | | |
Exchange listing fees | | | 5,439 | | | | 5,439 | | | | 5,439 | | | | 5,439 | | |
Other | | | 11,356 | | | | 8,624 | | | | 3,568 | | | | 4,018 | | |
Total Expenses | | | 3,010,700 | | | | 759,317 | | | | 807,710 | | | | 539,990 | | |
Recoupment of expenses to Adviser (Note 6) | | | 1,603 | | | | 30,339 | | | | 5,972 | | | | 824 | | |
Less: Reimbursement of expenses from Adviser
(Note 6) | | | — | | | | (6,204 | ) | | | (8,279 | ) | | | (14,090 | ) | |
Net Expenses | | | 3,012,303 | | | | 783,452 | | | | 805,403 | | | | 526,724 | | |
Net investment income (loss) | | | 3,002,792 | | | | 583,026 | | | | (122,072 | ) | | | 57,673 | | |
Net realized and unrealized gain (loss) on
investments: | |
Net realized gain (loss) on: | |
Investment securities | | | (44,273,155 | ) | | | (39,154,557 | ) | | | (15,488,537 | ) | | | — | | |
In-kind redemptions | | | 18,345,608 | | | | 7,270,291 | | | | 9,355,302 | | | | — | | |
Swap contracts | | | (3,587,853 | ) | | | (76,891,230 | ) | | | (21,435,484 | ) | | | (11,036,973 | ) | |
Net realized loss | | | (29,515,400 | ) | | | (108,775,496 | ) | | | (27,568,719 | ) | | | (11,036,973 | ) | |
Change in net unrealized appreciation (depreciation) on: | |
Investment securities | | | (19,869,187 | ) | | | (506,792 | ) | | | (6,291,227 | ) | | | — | | |
Swap contracts | | | (113,983,166 | ) | | | (28,058,574 | ) | | | (34,172,062 | ) | | | 21,185,720 | | |
Change in net unrealized appreciation (depreciation) | | | (133,852,353 | ) | | | (28,565,366 | ) | | | (40,463,289 | ) | | | 21,185,720 | | |
Net realized and unrealized gain (loss) | | | (163,367,753 | ) | | | (137,340,862 | ) | | | (68,032,008 | ) | | | 10,148,747 | | |
Net increase (decrease) in net assets resulting
from operations | | $ | (160,364,961 | ) | | $ | (136,757,836 | ) | | $ | (68,154,080 | ) | | $ | 10,206,420 | | |
The accompanying notes are an integral part of these financial statements.
DIREXION ANNUAL REPORT
140
Statements of Operations
For the Year Ended October 31, 2022
| | | Direxion Daily
S&P Biotech
Bull 3X Shares | | Direxion Daily
S&P Biotech
Bear 3X Shares | | Direxion Daily
Semiconductor
Bull 3X Shares | | Direxion Daily
Semiconductor
Bear 3X Shares | |
Investment Income: | |
Dividend income | | $ | 887,982 | | | $ | — | | | $ | 43,458,278 | | | $ | — | | |
(net of foreign withholding tax of $—, $—,
$1,305,696 and $—, respectively) | |
Interest income | | | 4,190,096 | | | | 1,712,635 | | | | 19,421,609 | | | | 4,712,806 | | |
Securities lending income | | | 200,811 | | | | — | | | | 750,079 | | | | — | | |
Total investment income | | | 5,278,889 | | | | 1,712,635 | | | | 63,629,966 | | | | 4,712,806 | | |
Expenses: | |
Investment advisory fees (Note 6) | | | 6,820,801 | | | | 778,785 | | | | 35,214,855 | | | | 2,353,094 | | |
Interest expense | | | 1,390,685 | | | | 72,728 | | | | 3,704,239 | | | | 616,786 | | |
Licensing fees | | | 727,552 | | | | 83,070 | | | | 1,431,308 | | | | 94,851 | | |
Fund servicing fees | | | 336,071 | | | | 39,484 | | | | 1,859,382 | | | | 117,197 | | |
Management service fees (Note 6) | | | 225,509 | | | | 25,790 | | | | 1,163,487 | | | | 77,910 | | |
Reports to shareholders | | | 147,358 | | | | 17,320 | | | | 755,713 | | | | 52,110 | | |
Professional fees | | | 79,255 | | | | 17,603 | | | | 370,366 | | | | 33,023 | | |
Trustees' fees and expenses | | | 29,610 | | | | 3,493 | | | | 151,658 | | | | 10,501 | | |
Insurance fees | | | 19,748 | | | | 2,285 | | | | 100,836 | | | | 6,903 | | |
Exchange listing fees | | | 6,947 | | | | 5,439 | | | | 9,966 | | | | 6,947 | | |
Pricing fees | | | 6,001 | | | | 6,001 | | | | 6,001 | | | | 6,001 | | |
Other | | | 185,343 | | | | 16,894 | | | | 696,180 | | | | 12,647 | | |
Total Expenses | | | 9,974,880 | | | | 1,068,892 | | | | 45,463,991 | | | | 3,387,970 | | |
Recoupment of expenses to Adviser (Note 6) | | | 74,013 | | | | 2,783 | | | | 180 | | | | 17,740 | | |
Less: Reimbursement of expenses from Adviser
(Note 6) | | | (72,629 | ) | | | (12,487 | ) | | | (180 | ) | | | (72 | ) | |
Less: Investment advisory fees waived (Note 6) | | | — | | | | — | | | | (5,933,599 | ) | | | — | | |
Net Expenses | | | 9,976,264 | | | | 1,059,188 | | | | 39,530,392 | | | | 3,405,638 | | |
Net investment income (loss) | | | (4,697,375 | ) | | | 653,447 | | | | 24,099,574 | | | | 1,307,168 | | |
Net realized and unrealized gain (loss) on
investments: | |
Net realized gain (loss) on: | |
Investment securities | | | (568,486,679 | ) | | | — | | | | (2,138,862,172 | ) | | | — | | |
In-kind redemptions | | | 180,323,813 | | | | — | | | | 653,480,305 | | | | — | | |
Swap contracts | | | (1,168,236,477 | ) | | | (16,969,252 | ) | | | (3,786,200,893 | ) | | | 221,587,899 | | |
Net realized gain (loss) | | | (1,556,399,343 | ) | | | (16,969,252 | ) | | | (5,271,582,760 | ) | | | 221,587,899 | | |
Change in net unrealized appreciation (depreciation) on: | |
Investment securities | | | 69,768,909 | | | | — | | | | (175,749,715 | ) | | | — | | |
Swap contracts | | | 129,702,430 | | | | (274,321 | ) | | | (1,361,879,213 | ) | | | 165,141,018 | | |
Change in net unrealized appreciation (depreciation) | | | 199,471,339 | | | | (274,321 | ) | | | (1,537,628,928 | ) | | | 165,141,018 | | |
Net realized and unrealized gain (loss) | | | (1,356,928,004 | ) | | | (17,243,573 | ) | | | (6,809,211,688 | ) | | | 386,728,917 | | |
Net increase (decrease) in net assets resulting
from operations | | $ | (1,361,625,379 | ) | | $ | (16,590,126 | ) | | $ | (6,785,112,114 | ) | | $ | 388,036,085 | | |
The accompanying notes are an integral part of these financial statements.
DIREXION ANNUAL REPORT
141
Statements of Operations
For the Year Ended October 31, 2022
| | | Direxion Daily
Technology
Bull 3X Shares | | Direxion Daily
Technology
Bear 3X Shares | | Direxion Daily
Transportation
Bull 3X Shares | | Direxion Daily
Utilities
Bull 3X Shares | |
Investment Income: | |
Dividend income | | $ | 14,461,020 | | | $ | — | | | $ | 283,315 | | | $ | 463,756 | | |
(net of foreign withholding tax of $18,273, $—,
$— and $—, respectively) | |
Interest income | | | 5,703,733 | | | | 1,680,626 | | | | 151,024 | | | | 65,452 | | |
Securities lending income | | | 8,423 | | | | — | | | | 105 | | | | — | | |
Total investment income | | | 20,173,176 | | | | 1,680,626 | | | | 434,444 | | | | 529,208 | | |
Expenses: | |
Investment advisory fees (Note 6) | | | 16,995,055 | | | | 906,041 | | | | 350,079 | | | | 170,503 | | |
Licensing fees | | | 1,746,724 | | | | 88,109 | | | | 37,441 | | | | 22,089 | | |
Interest expense | | | 848,794 | | | | 161,695 | | | | 6,257 | | | | 29,692 | | |
Fund servicing fees | | | 831,386 | | | | 45,730 | | | | 18,058 | | | | 9,334 | | |
Management service fees (Note 6) | | | 561,080 | | | | 29,998 | | | | 11,565 | | | | 5,637 | | |
Reports to shareholders | | | 356,289 | | | | 20,145 | | | | 7,269 | | | | 3,571 | | |
Professional fees | | | 188,747 | | | | 18,807 | | | | 13,690 | | | | 11,760 | | |
Trustees' fees and expenses | | | 71,249 | | | | 4,060 | | | | 1,450 | | | | 710 | | |
Insurance fees | | | 48,462 | | | | 2,644 | | | | 996 | | | | 488 | | |
Exchange listing fees | | | 6,947 | | | | 5,439 | | | | 5,439 | | | | 5,439 | | |
Pricing fees | | | 6,001 | | | | 6,001 | | | | 6,001 | | | | 6,001 | | |
Other | | | 126,279 | | | | 6,888 | | | | 1,845 | | | | 804 | | |
Total Expenses | | | 21,787,013 | | | | 1,295,557 | | | | 460,090 | | | | 266,028 | | |
Recoupment of expenses to Adviser (Note 6) | | | 95,167 | | | | 13,791 | | | | 1,709 | | | | 1,345 | | |
Less: Reimbursement of expenses from Adviser
(Note 6) | | | (95,167 | ) | | | — | | | | (12,108 | ) | | | (21,711 | ) | |
Less: Investment advisory fees waived (Note 6) | | | (516,007 | ) | | | — | | | | — | | | | — | | |
Net Expenses | | | 21,271,006 | | | | 1,309,348 | | | | 449,691 | | | | 245,662 | | |
Net investment income (loss) | | | (1,097,830 | ) | | | 371,278 | | | | (15,247 | ) | | | 283,546 | | |
Net realized and unrealized gain (loss) on
investments: | |
Net realized gain (loss) on: | |
Investment securities | | | (328,895,313 | ) | | | — | | | | (1,063,544 | ) | | | (1,402,777 | ) | |
In-kind redemptions | | | 97,558,925 | | | | — | | | | 2,036,035 | | | | 1,854,431 | | |
Swap contracts | | | (507,775,156 | ) | | | (12,493,515 | ) | | | 2,141,311 | | | | 5,806,005 | | |
Net realized gain (loss) | | | (739,111,544 | ) | | | (12,493,515 | ) | | | 3,113,802 | | | | 6,257,659 | | |
Change in net unrealized appreciation (depreciation) on: | |
Investment securities | | | (277,167,246 | ) | | | — | | | | (3,563,690 | ) | | | (374,438 | ) | |
Swap contracts | | | (1,093,334,613 | ) | | | 64,453,561 | | | | (28,310,885 | ) | | | (3,296,083 | ) | |
Change in net unrealized appreciation (depreciation) | | | (1,370,501,859 | ) | | | 64,453,561 | | | | (31,874,575 | ) | | | (3,670,521 | ) | |
Net realized and unrealized gain (loss) | | | (2,109,613,403 | ) | | | 51,960,046 | | | | (28,760,773 | ) | | | 2,587,138 | | |
Net increase (decrease) in net assets resulting
from operations | | $ | (2,110,711,233 | ) | | $ | 52,331,324 | | | $ | (28,776,020 | ) | | $ | 2,870,684 | | |
The accompanying notes are an integral part of these financial statements.
DIREXION ANNUAL REPORT
142
Statements of Operations
For the Year Ended October 31, 2022
| | | Direxion Daily
7-10 Year
Treasury
Bull 3X Shares | | Direxion Daily
7-10 Year
Treasury
Bear 3X Shares | | Direxion Daily
20+ Year
Treasury
Bull 3X Shares | | Direxion Daily
20+ Year
Treasury
Bear 3X Shares | |
Investment Income: | |
Dividend income | | $ | 231,506 | | | $ | — | | | $ | 4,382,096 | | | $ | — | | |
Interest income | | | 87,514 | | | | 471,212 | | | | 2,122,637 | | | | 5,099,895 | | |
Securities lending income | | | 3,999 | | | | — | | | | 69,687 | | | | — | | |
Total investment income | | | 323,019 | | | | 471,212 | | | | 6,574,420 | | | | 5,099,895 | | |
Expenses: | |
Investment advisory fees (Note 6) | | | 168,027 | | | | 336,883 | | | | 2,700,753 | | | | 3,567,416 | | |
Licensing fees | | | 11,968 | | | | 15,610 | | | | 109,756 | | | | 144,202 | | |
Professional fees | | | 11,701 | | | | 13,358 | | | | 37,744 | | | | 45,505 | | |
Fund servicing fees | | | 9,273 | | | | 17,606 | | | | 133,511 | | | | 176,678 | | |
Pricing fees | | | 6,001 | | | | 6,001 | | | | 6,001 | | | | 6,001 | | |
Management service fees (Note 6) | | | 5,559 | | | | 11,157 | | | | 89,261 | | | | 118,027 | | |
Exchange listing fees | | | 5,439 | | | | 5,439 | | | | 5,439 | | | | 5,439 | | |
Reports to shareholders | | | 3,615 | | | | 7,399 | | | | 58,011 | | | | 78,167 | | |
Interest expense | | | 1,212 | | | | 25,644 | | | | 21,581 | | | | 632,859 | | |
Trustees' fees and expenses | | | 731 | | | | 1,489 | | | | 11,646 | | | | 15,733 | | |
Insurance fees | | | 484 | | | | 978 | | | | 7,794 | | | | 10,353 | | |
Excise tax | | | — | | | | — | | | | 9,560 | | | | — | | |
Other | | | 1,998 | | | | 1,717 | | | | 64,623 | | | | 12,422 | | |
Total Expenses | | | 226,008 | | | | 443,281 | | | | 3,255,680 | | | | 4,812,802 | | |
Recoupment of expenses to Adviser (Note 6) | | | 9,347 | | | | 12,243 | | | | — | | | | 377 | | |
Less: Reimbursement of expenses from Adviser
(Note 6) | | | (21,306 | ) | | | (3,162 | ) | | | — | | | | — | | |
Net Expenses | | | 214,049 | | | | 452,362 | | | | 3,255,680 | | | | 4,813,179 | | |
Net investment income | | | 108,970 | | | | 18,850 | | | | 3,318,740 | | | | 286,716 | | |
Net realized and unrealized gain (loss) on
investments: | |
Net realized gain (loss) on: | |
Investment securities | | | (1,410,556 | ) | | | — | | | | (74,395,998 | ) | | | — | | |
In-kind redemptions | | | 123,485 | | | | — | | | | (244,191 | ) | | | — | | |
Swap contracts | | | (6,916,431 | ) | | | 14,428,932 | | | | (226,486,031 | ) | | | 324,325,126 | | |
Net realized gain (loss) | | | (8,203,502 | ) | | | 14,428,932 | | | | (301,126,220 | ) | | | 324,325,126 | | |
Change in net unrealized appreciation (depreciation) on: | |
Investment securities | | | (1,890,859 | ) | | | — | | | | (30,395,053 | ) | | | — | | |
Swap contracts | | | (3,426,183 | ) | | | 5,753,324 | | | | (174,402,921 | ) | | | 177,391,380 | | |
Change in net unrealized appreciation (depreciation) | | | (5,317,042 | ) | | | 5,753,324 | | | | (204,797,974 | ) | | | 177,391,380 | | |
Net realized and unrealized gain (loss) | | | (13,520,544 | ) | | | 20,182,256 | | | | (505,924,194 | ) | | | 501,716,506 | | |
Net increase (decrease) in net assets resulting
from operations | | $ | (13,411,574 | ) | | $ | 20,201,106 | | | $ | (502,605,454 | ) | | $ | 502,003,222 | | |
The accompanying notes are an integral part of these financial statements.
DIREXION ANNUAL REPORT
143
Statements of Changes in Net Assets
| | | Direxion Daily Mid Cap
Bull 3X Shares | | Direxion Daily S&P 500®
Bull 3X Shares | |
| | | Year Ended
October 31, 2022 | | Year Ended
October 31, 2021 | | Year Ended
October 31, 2022 | | Year Ended
October 31, 2021 | |
Operations: | |
Net investment income (loss) | | $ | 197,964 | | | $ | (135,385 | ) | | $ | 6,620,057 | | | $ | 3,060,678 | | |
Net realized gain (loss) | | | (12,168,044 | ) | | | 52,535,684 | | | | (713,784,752 | ) | | | 1,133,614,295 | | |
Change in net unrealized appreciation
(depreciation) | | | (28,211,169 | ) | | | 21,208,162 | | | | (926,143,940 | ) | | | 888,896,794 | | |
Net increase (decrease) in net assets resulting
from operations | | | (40,181,249 | ) | | | 73,608,461 | | | | (1,633,308,635 | ) | | | 2,025,571,767 | | |
Distributions to shareholders: | |
Net distributions to shareholders | | | — | | | | (21,998 | ) | | | (5,786,419 | ) | | | (3,773,589 | ) | |
Total distributions | | | — | | | | (21,998 | ) | | | (5,786,419 | ) | | | (3,773,589 | ) | |
Capital share transactions: | |
Proceeds from shares sold | | | 15,988,184 | | | | 128,362,135 | | | | 5,901,080,779 | | | | 2,500,709,959 | | |
Cost of shares redeemed | | | (18,593,897 | ) | | | (151,461,798 | ) | | | (5,065,561,898 | ) | | | (2,506,169,335 | ) | |
Transaction fees (Note 4) | | | 3,395 | | | | 42,359 | | | | 1,453,652 | | | | 677,169 | | |
Net increase (decrease) in net assets resulting
from capital transactions | | | (2,602,318 | ) | | | (23,057,304 | ) | | | 836,972,533 | | | | (4,782,207 | ) | |
Total increase (decrease) in net assets | | | (42,783,567 | ) | | | 50,529,159 | | | | (802,122,521 | ) | | | 2,017,015,971 | | |
Net assets: | |
Beginning of year | | | 90,584,175 | | | | 40,055,016 | | | | 3,348,750,236 | | | | 1,331,734,265 | | |
End of year | | $ | 47,800,608 | | | $ | 90,584,175 | | | $ | 2,546,627,715 | | | $ | 3,348,750,236 | | |
Changes in shares outstanding | |
Shares outstanding, beginning of year | | | 1,350,132 | | | | 1,750,132 | | | | 25,700,002 | | | | 27,700,002 | | |
Shares sold | | | 300,000 | | | | 2,100,000 | | | | 70,600,000 | | | | 25,750,000 | | |
Shares repurchased | | | (350,000 | ) | | | (2,500,000 | ) | | | (57,700,000 | ) | | | (27,750,000 | ) | |
Shares outstanding, end of year | | | 1,300,132 | | | | 1,350,132 | | | | 38,600,002 | | | | 25,700,002 | | |
The accompanying notes are an integral part of these financial statements.
DIREXION ANNUAL REPORT
144
Statements of Changes in Net Assets
| | | Direxion Daily S&P 500®
Bear 3X Shares | | Direxion Daily Small Cap
Bull 3X Shares | |
| | | Year Ended
October 31, 2022 | | Year Ended
October 31, 2021 | | Year Ended
October 31, 2022 | | Year Ended
October 31, 2021 | |
Operations: | |
Net investment income (loss) | | $ | 1,096,956 | | | $ | (4,213,941 | ) | | $ | 3,032,831 | | | $ | (4,538,713 | ) | |
Net realized gain (loss) | | | (1,820,867 | ) | | | (586,097,391 | ) | | | (1,095,460,021 | ) | | | 1,755,128,786 | | |
Change in net unrealized appreciation
(depreciation) | | | 157,306,258 | | | | (3,130,432 | ) | | | (35,224,542 | ) | | | (257,844,793 | ) | |
Net increase (decrease) in net assets resulting
from operations | | | 156,582,347 | | | | (593,441,764 | ) | | | (1,127,651,732 | ) | | | 1,492,745,280 | | |
Distributions to shareholders: | |
Net distributions to shareholders | | | — | | | | — | | | | (1,367,545 | ) | | | (244,821 | ) | |
Total distributions | | | — | | | | — | | | | (1,367,545 | ) | | | (244,821 | ) | |
Capital share transactions: | |
Proceeds from shares sold | | | 2,964,867,622 | | | | 1,028,436,193 | | | | 3,879,258,584 | | | | 4,816,936,112 | | |
Cost of shares redeemed | | | (2,622,881,335 | ) | | | (850,068,957 | ) | | | (3,033,085,709 | ) | | | (5,642,498,260 | ) | |
Transaction fees (Note 4) | | | 785,779 | | | | 251,069 | | | | 790,344 | | | | 1,378,149 | | |
Net increase (decrease) in net assets resulting
from capital transactions | | | 342,772,066 | | | | 178,618,305 | | | | 846,963,219 | | | | (824,183,999 | ) | |
Total increase (decrease) in net assets | | | 499,354,413 | | | | (414,823,459 | ) | | | (282,056,058 | ) | | | 668,316,460 | | |
Net assets: | |
Beginning of year | | | 388,356,619 | | | | 803,180,078 | | | | 1,499,518,859 | | | | 831,202,399 | | |
End of year | | $ | 887,711,032 | | | $ | 388,356,619 | | | $ | 1,217,462,801 | | | $ | 1,499,518,859 | | |
Changes in shares outstanding | |
Shares outstanding, beginning of year | | | 20,676,918 | | | | 13,170,389 | | | | 16,100,002 | | | | 25,950,002 | | |
Shares sold | | | 130,200,000 | | | | 36,235,000 | | | | 68,400,000 | | | | 57,550,000 | | |
Shares repurchased | | | (111,700,000 | ) | | | (28,728,471 | ) | | | (52,700,000 | ) | | | (67,400,000 | ) | |
Shares outstanding, end of year | | | 39,176,918 | | | | 20,676,918 | | | | 31,800,002 | | | | 16,100,002 | | |
The accompanying notes are an integral part of these financial statements.
DIREXION ANNUAL REPORT
145
Statements of Changes in Net Assets
| | | Direxion Daily Small Cap
Bear 3X Shares | | Direxion Daily FTSE China
Bull 3X Shares1 | |
| | | Year Ended
October 31, 2022 | | Year Ended
October 31, 2021 | | Year Ended
October 31, 2022 | | Year Ended
October 31, 2021 | |
Operations: | |
Net investment income (loss) | | $ | 182,640 | | | $ | (3,552,520 | ) | | $ | 3,525,681 | | | $ | 627,787 | | |
Net realized gain (loss) | | | 111,315,116 | | | | (670,785,693 | ) | | | (708,349,811 | ) | | | (45,594,428 | ) | |
Change in net unrealized appreciation
(depreciation) | | | 35,918,628 | | | | 69,207,089 | | | | (127,503,386 | ) | | | (77,709,442 | ) | |
Net increase (decrease) in net assets resulting
from operations | | | 147,416,384 | | | | (605,131,124 | ) | | | (832,327,516 | ) | | | (122,676,083 | ) | |
Distributions to shareholders: | |
Net distributions to shareholders | | | — | | | | — | | | | (1,246,902 | ) | | | (2,107,263 | ) | |
Total distributions | | | — | | | | — | | | | (1,246,902 | ) | | | (2,107,263 | ) | |
Capital share transactions: | |
Proceeds from shares sold | | | 2,072,458,147 | | | | 1,608,299,076 | | | | 938,956,467 | | | | 653,990,404 | | |
Cost of shares redeemed | | | (2,178,146,093 | ) | | | (1,044,500,159 | ) | | | (370,386,970 | ) | | | (307,890,142 | ) | |
Transaction fees (Note 4) | | | 653,444 | | | | 313,275 | | | | 74,418 | | | | 61,578 | | |
Net increase (decrease) in net assets resulting
from capital transactions | | | (105,034,502 | ) | | | 564,112,192 | | | | 568,643,915 | | | | 346,161,840 | | |
Total increase (decrease) in net assets | | | 42,381,882 | | | | (41,018,932 | ) | | | (264,930,503 | ) | | | 221,378,494 | | |
Net assets: | |
Beginning of year | | | 504,783,283 | | | | 545,802,215 | | | | 482,287,745 | | | | 260,909,251 | | |
End of year | | $ | 547,165,165 | | | $ | 504,783,283 | | | $ | 217,357,242 | | | $ | 482,287,745 | | |
Changes in shares outstanding | |
Shares outstanding, beginning of year | | | 18,772,797 | | | | 4,386,447 | | | | 2,155,001 | | | | 777,501 | | |
Shares sold | | | 60,600,000 | | | | 44,750,000 | | | | 13,580,000 | | | | 2,230,000 | | |
Shares repurchased | | | (62,450,000 | ) | | | (30,363,650 | ) | | | (4,842,234 | ) | | | (852,500 | ) | |
Shares outstanding, end of year | | | 16,922,797 | | | | 18,772,797 | | | | 10,892,767 | | | | 2,155,001 | | |
1 Effective May 31, 2022, the Fund had a 1:20 reverse stock split. Share amounts for all periods have been adjusted to give effect to the 1:20 stock split.
The accompanying notes are an integral part of these financial statements.
DIREXION ANNUAL REPORT
146
Statements of Changes in Net Assets
| | | Direxion Daily FTSE China
Bear 3X Shares | | Direxion Daily FTSE Europe
Bull 3X Shares | |
| | | Year Ended
October 31, 2022 | | Year Ended
October 31, 2021 | | Year Ended
October 31, 2022 | | Year Ended
October 31, 2021 | |
Operations: | |
Net investment income (loss) | | $ | 88,588 | | | $ | (372,304 | ) | | $ | 331,159 | | | $ | 200,327 | | |
Net realized gain (loss) | | | 68,000,459 | | | | (10,622,978 | ) | | | (15,944,028 | ) | | | 17,484,871 | | |
Change in net unrealized appreciation
(depreciation) | | | 61,784,025 | | | | 989,076 | | | | (12,282,624 | ) | | | 9,686,143 | | |
Net increase (decrease) in net assets resulting
from operations | | | 129,873,072 | | | | (10,006,206 | ) | | | (27,895,493 | ) | | | 27,371,341 | | |
Distributions to shareholders: | |
Net distributions to shareholders | | | — | | | | — | | | | (316,935 | ) | | | (180,543 | ) | |
Total distributions | | | — | | | | — | | | | (316,935 | ) | | | (180,543 | ) | |
Capital share transactions: | |
Proceeds from shares sold | | | 486,188,664 | | | | 78,432,377 | | | | 19,998,922 | | | | 22,922,512 | | |
Cost of shares redeemed | | | (513,549,364 | ) | | | (46,687,356 | ) | | | (21,749,479 | ) | | | (15,949,307 | ) | |
Transaction fees (Note 4) | | | 205,413 | | | | 14,006 | | | | 4,350 | | | | 3,190 | | |
Net increase (decrease) in net assets resulting
from capital transactions | | | (27,155,287 | ) | | | 31,759,027 | | | | (1,746,207 | ) | | | 6,976,395 | | |
Total increase (decrease) in net assets | | | 102,717,785 | | | | 21,752,821 | | | | (29,958,635 | ) | | | 34,167,193 | | |
Net assets: | |
Beginning of year | | | 66,230,269 | | | | 44,477,448 | | | | 47,923,823 | | | | 13,756,630 | | |
End of year | | $ | 168,948,054 | | | $ | 66,230,269 | | | $ | 17,965,188 | | | $ | 47,923,823 | | |
Changes in shares outstanding | |
Shares outstanding, beginning of year | | | 3,927,337 | | | | 2,127,337 | | | | 1,250,001 | | | | 950,001 | | |
Shares sold | | | 30,550,000 | | | | 4,750,000 | | | | 1,000,000 | | | | 750,000 | | |
Shares repurchased | | | (30,050,000 | ) | | | (2,950,000 | ) | | | (850,000 | ) | | | (450,000 | ) | |
Shares outstanding, end of year | | | 4,427,337 | | | | 3,927,337 | | | | 1,400,001 | | | | 1,250,001 | | |
The accompanying notes are an integral part of these financial statements.
DIREXION ANNUAL REPORT
147
Statements of Changes in Net Assets
| | | Direxion Daily MSCI Emerging
Markets Bull 3X Shares | | Direxion Daily MSCI Emerging
Markets Bear 3X Shares | |
| | | Year Ended
October 31, 2022 | | Year Ended
October 31, 2021 | | Year Ended
October 31, 2022 | | Year Ended
October 31, 2021 | |
Operations: | |
Net investment income (loss) | | $ | 803,533 | | | $ | (354,003 | ) | | $ | (194 | ) | | $ | (251,680 | ) | |
Net realized gain (loss) | | | (124,088,995 | ) | | | 131,372,215 | | | | 21,149,834 | | | | (39,406,431 | ) | |
Change in net unrealized appreciation
(depreciation) | | | (6,189,460 | ) | | | (74,133,925 | ) | | | 12,129,823 | | | | 20,478,769 | | |
Net increase (decrease) in net assets resulting
from operations | | | (129,474,922 | ) | | | 56,884,287 | | | | 33,279,463 | | | | (19,179,342 | ) | |
Distributions to shareholders: | |
Net distributions to shareholders | | | — | | | | (206,560 | ) | | | — | | | | — | | |
Return of capital | | | — | | | | (107,122 | ) | | | — | | | | — | | |
Total distributions | | | — | | | | (313,682 | ) | | | — | | | | — | | |
Capital share transactions: | |
Proceeds from shares sold | | | 84,616,572 | | | | 324,420,412 | | | | 60,339,424 | | | | 33,446,137 | | |
Cost of shares redeemed | | | (74,971,504 | ) | | | (348,366,324 | ) | | | (63,788,096 | ) | | | (26,403,874 | ) | |
Transaction fees (Note 4) | | | 15,888 | | | | 77,355 | | | | 31,918 | | | | 7,921 | | |
Net increase (decrease) in net assets resulting
from capital transactions | | | 9,660,956 | | | | (23,868,557 | ) | | | (3,416,754 | ) | | | 7,050,184 | | |
Total increase (decrease) in net assets | | | (119,813,966 | ) | | | 32,702,048 | | | | 29,862,709 | | | | (12,129,158 | ) | |
Net assets: | |
Beginning of year | | | 169,181,029 | | | | 136,478,981 | | | | 26,590,454 | | | | 38,719,612 | | |
End of year | | $ | 49,367,063 | | | $ | 169,181,029 | | | $ | 56,453,163 | | | $ | 26,590,454 | | |
Changes in shares outstanding | |
Shares outstanding, beginning of year | | | 2,081,598 | | | | 2,281,598 | | | | 2,945,232 | | | | 2,245,232 | | |
Shares sold | | | 1,700,000 | | | | 3,400,000 | | | | 4,350,000 | | | | 3,750,000 | | |
Shares repurchased | | | (1,500,000 | ) | | | (3,600,000 | ) | | | (4,600,000 | ) | | | (3,050,000 | ) | |
Shares outstanding, end of year | | | 2,281,598 | | | | 2,081,598 | | | | 2,695,232 | | | | 2,945,232 | | |
The accompanying notes are an integral part of these financial statements.
DIREXION ANNUAL REPORT
148
Statements of Changes in Net Assets
| | | Direxion Daily MSCI Mexico
Bull 3X Shares | | Direxion Daily MSCI South Korea
Bull 3X Shares | |
| | | Year Ended
October 31, 2022 | | Year Ended
October 31, 2021 | | Year Ended
October 31, 2022 | | Year Ended
October 31, 2021 | |
Operations: | |
Net investment income (loss) | | $ | 158,185 | | | $ | (9,268 | ) | | $ | 227,711 | | | $ | (388,753 | ) | |
Net realized gain (loss) | | | 2,635,316 | | | | 10,591,335 | | | | (38,741,856 | ) | | | 29,885,775 | | |
Change in net unrealized appreciation
(depreciation) | | | (2,364,795 | ) | | | 3,847,835 | | | | 3,845,839 | | | | (14,275,709 | ) | |
Net increase (decrease) in net assets resulting
from operations | | | 428,706 | | | | 14,429,902 | | | | (34,668,306 | ) | | | 15,221,313 | | |
Distributions to shareholders: | |
Net distributions to shareholders | | | (148,179 | ) | | | (64,079 | ) | | | (227,711 | ) | | | (4,680 | ) | |
Return of capital | | | — | | | | — | | | | (87,142 | ) | | | — | | |
Total distributions | | | (148,179 | ) | | | (64,079 | ) | | | (314,853 | ) | | | (4,680 | ) | |
Capital share transactions: | |
Proceeds from shares sold | | | 3,561,223 | | | | 25,536,886 | | | | 42,506,823 | | | | 75,569,158 | | |
Cost of shares redeemed | | | (7,418,820 | ) | | | (35,344,974 | ) | | | (34,458,616 | ) | | | (69,600,086 | ) | |
Transaction fees (Note 4) | | | 1,483 | | | | 7,337 | | | | 6,958 | | | | 15,623 | | |
Net increase (decrease) in net assets resulting
from capital transactions | | | (3,856,114 | ) | | | (9,800,751 | ) | | | 8,055,165 | | | | 5,984,695 | | |
Total increase (decrease) in net assets | | | (3,575,587 | ) | | | 4,565,072 | | | | (26,927,994 | ) | | | 21,201,328 | | |
Net assets: | |
Beginning of year | | | 15,225,205 | | | | 10,660,133 | | | | 47,021,893 | | | | 25,820,565 | | |
End of year | | $ | 11,649,618 | | | $ | 15,225,205 | | | $ | 20,093,899 | | | $ | 47,021,893 | | |
Changes in shares outstanding | |
Shares outstanding, beginning of year | | | 183,205 | | | | 333,205 | | | | 1,800,001 | | | | 1,550,001 | | |
Shares sold | | | 50,000 | | | | 350,000 | | | | 3,450,000 | | | | 2,150,000 | | |
Shares repurchased | | | (100,000 | ) | | | (500,000 | ) | | | (1,900,000 | ) | | | (1,900,000 | ) | |
Shares outstanding, end of year | | | 133,205 | | | | 183,205 | | | | 3,350,001 | | | | 1,800,001 | | |
The accompanying notes are an integral part of these financial statements.
DIREXION ANNUAL REPORT
149
Statements of Changes in Net Assets
| | | Direxion Daily Aerospace & Defense
Bull 3X Shares | | Direxion Daily Consumer
Discretionary Bull 3X Shares | |
| | | Year Ended
October 31, 2022 | | Year Ended
October 31, 2021 | | Year Ended
October 31, 2022 | | Year Ended
October 31, 2021 | |
Operations: | |
Net investment income (loss) | | $ | 448,982 | | | $ | (540,442 | ) | | $ | (100,922 | ) | | $ | (185,943 | ) | |
Net realized gain (loss) | | | (25,295,357 | ) | | | 168,762,655 | | | | (30,238,947 | ) | | | 15,397,015 | | |
Change in net unrealized appreciation
(depreciation) | | | 14,263,833 | | | | 59,144,914 | | | | (21,136,117 | ) | | | 13,770,294 | | |
Net increase (decrease) in net assets resulting
from operations | | | (10,582,542 | ) | | | 227,367,127 | | | | (51,475,986 | ) | | | 28,981,366 | | |
Distributions to shareholders: | |
Net distributions to shareholders | | | (5,900,582 | ) | | | (229,995 | ) | | | — | | | | — | | |
Total distributions | | | (5,900,582 | ) | | | (229,995 | ) | | | — | | | | — | | |
Capital share transactions: | |
Proceeds from shares sold | | | 124,137,695 | | | | 214,752,628 | | | | 33,900,420 | | | | 72,277,777 | | |
Cost of shares redeemed | | | (193,807,810 | ) | | | (360,564,439 | ) | | | (13,037,902 | ) | | | (58,658,316 | ) | |
Transaction fees (Note 4) | | | 43,247 | | | | 79,628 | | | | 2,775 | | | | 15,590 | | |
Net increase (decrease) in net assets resulting
from capital transactions | | | (69,626,868 | ) | | | (145,732,183 | ) | | | 20,865,293 | | | | 13,635,051 | | |
Total increase (decrease) in net assets | | | (86,109,992 | ) | | | 81,404,949 | | | | (30,610,693 | ) | | | 42,616,417 | | |
Net assets: | |
Beginning of year | | | 280,890,147 | | | | 199,485,198 | | | | 55,263,510 | | | | 12,647,093 | | |
End of year | | $ | 194,780,155 | | | $ | 280,890,147 | | | $ | 24,652,817 | | | $ | 55,263,510 | | |
Changes in shares outstanding | |
Shares outstanding, beginning of year | | | 13,650,001 | | | | 22,500,001 | | | | 600,001 | | | | 350,001 | | |
Shares sold | | | 6,850,000 | | | | 11,050,000 | | | | 750,000 | | | | 1,050,000 | | |
Shares repurchased | | | (9,750,000 | ) | | | (19,900,000 | ) | | | (300,000 | ) | | | (800,000 | ) | |
Shares outstanding, end of year | | | 10,750,001 | | | | 13,650,001 | | | | 1,050,001 | | | | 600,001 | | |
The accompanying notes are an integral part of these financial statements.
DIREXION ANNUAL REPORT
150
Statements of Changes in Net Assets
| | | Direxion Daily Dow Jones
Internet Bull 3X Shares | | Direxion Daily Dow Jones
Internet Bear 3X Shares | |
| | | Year Ended
October 31, 2022 | | Year Ended
October 31, 2021 | | Year Ended
October 31, 2022 | | Year Ended
October 31, 2021 | |
Operations: | |
Net investment income (loss) | | $ | (488,175 | ) | | $ | (566,916 | ) | | $ | 163,010 | | | $ | (41,828 | ) | |
Net realized gain (loss) | | | (253,307,924 | ) | | | 26,861,803 | | | | (5,074,902 | ) | | | (4,367,139 | ) | |
Change in net unrealized appreciation
(depreciation) | | | (42,716,872 | ) | | | 14,428,445 | | | | 20,263,013 | | | | (402,322 | ) | |
Net increase (decrease) in net assets resulting
from operations | | | (296,512,971 | ) | | | 40,723,332 | | | | 15,351,121 | | | | (4,811,289 | ) | |
Distributions to shareholders: | |
Net distributions to shareholders | | | (7,017,671 | ) | | | — | | | | (26,648 | ) | | | — | | |
Total distributions | | | (7,017,671 | ) | | | — | | | | (26,648 | ) | | | — | | |
Capital share transactions: | |
Proceeds from shares sold | | | 402,775,715 | | | | 70,705,044 | | | | 180,515,545 | | | | 23,601,785 | | |
Cost of shares redeemed | | | (96,132,641 | ) | | | (45,569,213 | ) | | | (144,304,284 | ) | | | (19,497,618 | ) | |
Transaction fees (Note 4) | | | 19,522 | | | | 9,114 | | | | 43,291 | | | | 5,849 | | |
Net increase in net assets resulting from
capital transactions | | | 306,662,596 | | | | 25,144,945 | | | | 36,254,552 | | | | 4,110,016 | | |
Total increase (decrease) in net assets | | | 3,131,954 | | | | 65,868,277 | | | | 51,579,025 | | | | (701,273 | ) | |
Net assets: | |
Beginning of year | | | 99,968,391 | | | | 34,100,114 | | | | 4,603,740 | | | | 5,305,013 | | |
End of year | | $ | 103,100,345 | | | $ | 99,968,391 | | | $ | 56,182,765 | | | $ | 4,603,740 | | |
Changes in shares outstanding | |
Shares outstanding, beginning of year | | | 1,150,001 | | | | 750,001 | | | | 319,952 | | | | 119,952 | | |
Shares sold | | | 20,800,000 | | | | 950,000 | | | | 5,150,000 | | | | 1,200,000 | | |
Shares repurchased | | | (7,650,000 | ) | | | (550,000 | ) | | | (4,000,000 | ) | | | (1,000,000 | ) | |
Shares outstanding, end of year | | | 14,300,001 | | | | 1,150,001 | | | | 1,469,952 | | | | 319,952 | | |
The accompanying notes are an integral part of these financial statements.
DIREXION ANNUAL REPORT
151
Statements of Changes in Net Assets
| | | Direxion Daily Financial
Bull 3X Shares | | Direxion Daily Financial
Bear 3X Shares | |
| | | Year Ended
October 31, 2022 | | Year Ended
October 31, 2021 | | Year Ended
October 31, 2022 | | Year Ended
October 31, 2021 | |
Operations: | |
Net investment income (loss) | | $ | 20,993,339 | | | $ | 16,030,738 | | | $ | 72,700 | | | $ | (1,362,726 | ) | |
Net realized gain (loss) | | | (358,555,513 | ) | | | 2,012,752,205 | | | | 14,512,157 | | | | (303,582,709 | ) | |
Change in net unrealized appreciation
(depreciation) | | | (1,336,880,880 | ) | | | 1,480,370,317 | | | | 3,952,927 | | | | (11,913,059 | ) | |
Net increase (decrease) in net assets resulting
from operations | | | (1,674,443,054 | ) | | | 3,509,153,260 | | | | 18,537,784 | | | | (316,858,494 | ) | |
Distributions to shareholders: | |
Net distributions to shareholders | | | (19,073,316 | ) | | | (15,325,240 | ) | | | — | | | | — | | |
Total distributions | | | (19,073,316 | ) | | | (15,325,240 | ) | | | — | | | | — | | |
Capital share transactions: | |
Proceeds from shares sold | | | 1,546,073,426 | | | | 5,161,128,021 | | | | 559,923,134 | | | | 398,984,737 | | |
Cost of shares redeemed | | | (1,542,877,671 | ) | | | (6,422,197,997 | ) | | | (518,160,627 | ) | | | (223,626,675 | ) | |
Transaction fees (Note 4) | | | 383,657 | | | | 1,763,706 | | | | 155,449 | | | | 67,021 | | |
Net increase (decrease) in net assets resulting
from capital transactions | | | 3,579,412 | | | | (1,259,306,270 | ) | | | 41,917,956 | | | | 175,425,083 | | |
Total increase (decrease) in net assets | | | (1,689,936,958 | ) | | | 2,234,521,750 | | | | 60,455,740 | | | | (141,433,411 | ) | |
Net assets: | |
Beginning of year | | | 3,582,159,988 | | | | 1,347,638,238 | | | | 130,234,263 | | | | 271,667,674 | | |
End of year | | $ | 1,892,223,030 | | | $ | 3,582,159,988 | | | $ | 190,690,003 | | | $ | 130,234,263 | | |
Changes in shares outstanding | |
Shares outstanding, beginning of year | | | 24,799,289 | | | | 40,099,289 | | | | 7,103,350 | | | | 2,302,858 | | |
Shares sold | | | 15,650,000 | | | | 46,650,000 | | | | 25,050,000 | | | | 12,056,250 | | |
Shares repurchased | | | (14,750,000 | ) | | | (61,950,000 | ) | | | (22,850,000 | ) | | | (7,255,758 | ) | |
Shares outstanding, end of year | | | 25,699,289 | | | | 24,799,289 | | | | 9,303,350 | | | | 7,103,350 | | |
The accompanying notes are an integral part of these financial statements.
DIREXION ANNUAL REPORT
152
Statements of Changes in Net Assets
| | | Direxion Daily Healthcare
Bull 3X Shares | | Direxion Daily Homebuilders &
Supplies Bull 3X Shares | |
| | | Year Ended
October 31, 2022 | | Year Ended
October 31, 2021 | | Year Ended
October 31, 2022 | | Year Ended
October 31, 2021 | |
Operations: | |
Net investment income (loss) | | $ | 760,009 | | | $ | (75,184 | ) | | $ | (23,901 | ) | | $ | (1,515,752 | ) | |
Net realized gain (loss) | | | 23,094,065 | | | | 54,685,501 | | | | (65,511,947 | ) | | | 372,704,652 | | |
Change in net unrealized appreciation
(depreciation) | | | (57,503,787 | ) | | | 62,130,778 | | | | (132,743,393 | ) | | | (51,515,019 | ) | |
Net increase (decrease) in net assets resulting
from operations | | | (33,649,713 | ) | | | 116,741,095 | | | | (198,279,241 | ) | | | 319,673,881 | | |
Distributions to shareholders: | |
Net distributions to shareholders | | | (597,569 | ) | | | (11,571 | ) | | | — | | | | — | | |
Total distributions | | | (597,569 | ) | | | (11,571 | ) | | | — | | | | — | | |
Capital share transactions: | |
Proceeds from shares sold | | | 106,529,364 | | | | 175,977,018 | | | | 222,149,836 | | | | 512,015,723 | | |
Cost of shares redeemed | | | (130,393,496 | ) | | | (141,667,303 | ) | | | (275,864,016 | ) | | | (808,927,828 | ) | |
Transaction fees (Note 4) | | | 26,079 | | | | 37,353 | | | | 62,717 | | | | 172,184 | | |
Net increase (decrease) in net assets resulting
from capital transactions | | | (23,838,053 | ) | | | 34,347,068 | | | | (53,651,463 | ) | | | (296,739,921 | ) | |
Total increase (decrease) in net assets | | | (58,085,335 | ) | | | 151,076,592 | | | | (251,930,704 | ) | | | 22,933,960 | | |
Net assets: | |
Beginning of year | | | 254,115,630 | | | | 103,039,038 | | | | 383,075,395 | | | | 360,141,435 | | |
End of year | | $ | 196,030,295 | | | $ | 254,115,630 | | | $ | 131,144,691 | | | $ | 383,075,395 | | |
Changes in shares outstanding | |
Shares outstanding, beginning of year | | | 2,050,008 | | | | 1,850,008 | | | | 4,600,000 | | | | 9,100,000 | | |
Shares sold | | | 900,000 | | | | 1,600,000 | | | | 4,850,000 | | | | 7,950,000 | | |
Shares repurchased | | | (1,150,000 | ) | | | (1,400,000 | ) | | | (4,450,000 | ) | | | (12,450,000 | ) | |
Shares outstanding, end of year | | | 1,800,008 | | | | 2,050,008 | | | | 5,000,000 | | | | 4,600,000 | | |
The accompanying notes are an integral part of these financial statements.
DIREXION ANNUAL REPORT
153
Statements of Changes in Net Assets
| | | Direxion Daily Industrials
Bull 3X Shares | | Direxion Daily Pharmaceutical &
Medical Bull 3X Shares | |
| | | Year Ended
October 31, 2022 | | Year Ended
October 31, 2021 | | Year Ended
October 31, 2022 | | Year Ended
October 31, 2021 | |
Operations: | |
Net investment income (loss) | | $ | 105,061 | | | $ | (7,674 | ) | | $ | 43,717 | | | $ | (71,169 | ) | |
Net realized gain (loss) | | | (1,191,547 | ) | | | 24,981,429 | | | | (6,497,162 | ) | | | 5,837,097 | | |
Change in net unrealized appreciation
(depreciation) | | | (13,301,032 | ) | | | 11,063,801 | | | | (539,333 | ) | | | (2,492,865 | ) | |
Net increase (decrease) in net assets resulting
from operations | | | (14,387,518 | ) | | | 36,037,556 | | | | (6,992,778 | ) | | | 3,273,063 | | |
Distributions to shareholders: | |
Net distributions to shareholders | | | (94,102 | ) | | | (108,281 | ) | | | (36,713 | ) | | | — | | |
Total distributions | | | (94,102 | ) | | | (108,281 | ) | | | (36,713 | ) | | | — | | |
Capital share transactions: | |
Proceeds from shares sold | | | 3,972,857 | | | | 82,313,226 | | | | 25,410,241 | | | | 32,589,756 | | |
Cost of shares redeemed | | | (34,145,073 | ) | | | (71,373,229 | ) | | | (38,908,274 | ) | | | (15,202,514 | ) | |
Transaction fees (Note 4) | | | 6,829 | | | | 14,275 | | | | 7,782 | | | | 3,040 | | |
Net increase (decrease) in net assets resulting
from capital transactions | | | (30,165,387 | ) | | | 10,954,272 | | | | (13,490,251 | ) | | | 17,390,282 | | |
Total increase (decrease) in net assets | | | (44,647,007 | ) | | | 46,883,547 | | | | (20,519,742 | ) | | | 20,663,345 | | |
Net assets: | |
Beginning of year | | | 63,519,920 | | | | 16,636,373 | | | | 31,692,765 | | | | 11,029,420 | | |
End of year | | $ | 18,872,913 | | | $ | 63,519,920 | | | $ | 11,173,023 | | | $ | 31,692,765 | | |
Changes in shares outstanding | |
Shares outstanding, beginning of year | | | 1,400,001 | | | | 900,001 | | | | 1,750,001 | | | | 700,001 | | |
Shares sold | | | 100,000 | | | | 2,200,000 | | | | 1,750,000 | | | | 1,700,000 | | |
Shares repurchased | | | (850,000 | ) | | | (1,700,000 | ) | | | (2,400,000 | ) | | | (650,000 | ) | |
Shares outstanding, end of year | | | 650,001 | | | | 1,400,001 | | | | 1,100,001 | | | | 1,750,001 | | |
The accompanying notes are an integral part of these financial statements.
DIREXION ANNUAL REPORT
154
Statements of Changes in Net Assets
| | | Direxion Daily Real Estate
Bull 3X Shares | | Direxion Daily Real Estate
Bear 3X Shares | |
| | | Year Ended
October 31, 2022 | | Year Ended
October 31, 2021 | | Year Ended
October 31, 2022 | | Year Ended
October 31, 2021 | |
Operations: | |
Net investment income (loss) | | $ | 1,162,344 | | | $ | 1,402,465 | | | $ | 520,977 | | | $ | (201,300 | ) | |
Net realized gain (loss) | | | (136,809 | ) | | | 41,310,998 | | | | 24,704,385 | | | | (22,402,448 | ) | |
Change in net unrealized appreciation
(depreciation) | | | (63,747,069 | ) | | | 65,355,299 | | | | 5,287,833 | | | | (8,904,990 | ) | |
Net increase (decrease) in net assets resulting
from operations | | | (62,721,534 | ) | | | 108,068,762 | | | | 30,513,195 | | | | (31,508,738 | ) | |
Distributions to shareholders: | |
Net distributions to shareholders | | | (6,886,474 | ) | | | (1,224,013 | ) | | | — | | | | — | | |
Total distributions | | | (6,886,474 | ) | | | (1,224,013 | ) | | | — | | | | — | | |
Capital share transactions: | |
Proceeds from shares sold | | | 35,165,502 | | | | 66,811,598 | | | | 252,540,741 | | | | 17,697,060 | | |
Cost of shares redeemed | | | (66,006,865 | ) | | | (75,626,541 | ) | | | (97,576,159 | ) | | | (11,548,737 | ) | |
Transaction fees (Note 4) | | | 13,531 | | | | 15,436 | | | | 29,260 | | | | 3,464 | | |
Net increase (decrease) in net assets resulting
from capital transactions | | | (30,827,832 | ) | | | (8,799,507 | ) | | | 154,993,842 | | | | 6,151,787 | | |
Total increase (decrease) in net assets | | | (100,435,840 | ) | | | 98,045,242 | | | | 185,507,037 | | | | (25,356,951 | ) | |
Net assets: | |
Beginning of year | | | 147,703,887 | | | | 49,658,645 | | | | 19,926,346 | | | | 45,283,297 | | |
End of year | | $ | 47,268,047 | | | $ | 147,703,887 | | | $ | 205,433,383 | | | $ | 19,926,346 | | |
Changes in shares outstanding | |
Shares outstanding, beginning of year | | | 5,650,000 | | | | 5,500,000 | | | | 485,144 | | | | 295,144 | | |
Shares sold | | | 2,450,000 | | | | 3,950,000 | | | | 4,650,000 | | | | 305,000 | | |
Shares repurchased | | | (3,300,000 | ) | | | (3,800,000 | ) | | | (1,751,099 | ) | | | (115,000 | ) | |
Shares outstanding, end of year | | | 4,800,000 | | | | 5,650,000 | | | | 3,384,045 | | | | 485,144 | | |
The accompanying notes are an integral part of these financial statements.
DIREXION ANNUAL REPORT
155
Statements of Changes in Net Assets
| | | Direxion Daily Regional Banks
Bull 3X Shares | | Direxion Daily Retail
Bull 3X Shares | |
| | | Year Ended
October 31, 2022 | | Year Ended
October 31, 2021 | | Year Ended
October 31, 2022 | | Year Ended
October 31, 2021 | |
Operations: | |
Net investment income (loss) | | $ | 3,002,792 | | | $ | 2,677,128 | | | $ | 583,026 | | | $ | (261,661 | ) | |
Net realized gain (loss) | | | (29,515,400 | ) | | | 211,191,068 | | | | (108,775,496 | ) | | | 102,853,900 | | |
Change in net unrealized appreciation
(depreciation) | | | (133,852,353 | ) | | | 112,168,678 | | | | (28,565,366 | ) | | | 18,381,113 | | |
Net increase (decrease) in net assets resulting
from operations | | | (160,364,961 | ) | | | 326,036,874 | | | | (136,757,836 | ) | | | 120,973,352 | | |
Distributions to shareholders: | |
Net distributions to shareholders | | | (2,874,970 | ) | | | (2,850,169 | ) | | | (473,179 | ) | | | (14,673 | ) | |
Total distributions | | | (2,874,970 | ) | | | (2,850,169 | ) | | | (473,179 | ) | | | (14,673 | ) | |
Capital share transactions: | |
Proceeds from shares sold | | | 256,508,930 | | | | 730,879,440 | | | | 137,251,024 | | | | 207,606,767 | | |
Cost of shares redeemed | | | (322,182,252 | ) | | | (724,336,451 | ) | | | (77,856,410 | ) | | | (222,257,385 | ) | |
Transaction fees (Note 4) | | | 69,762 | | | | 149,812 | | | | 17,045 | | | | 45,752 | | |
Net increase (decrease) in net assets resulting
from capital transactions | | | (65,603,560 | ) | | | 6,692,801 | | | | 59,411,659 | | | | (14,604,866 | ) | |
Total increase (decrease) in net assets | | | (228,843,491 | ) | | | 329,879,506 | | | | (77,819,356 | ) | | | 106,353,813 | | |
Net assets: | |
Beginning of year | | | 441,276,054 | | | | 111,396,548 | | | | 128,838,980 | | | | 22,485,167 | | |
End of year | | $ | 212,432,563 | | | $ | 441,276,054 | | | $ | 51,019,624 | | | $ | 128,838,980 | | |
Changes in shares outstanding | |
Shares outstanding, beginning of year | | | 8,648,590 | | | | 8,448,590 | | | | 3,071,105 | | | | 2,621,100 | | |
Shares sold | | | 5,800,000 | | | | 19,750,000 | | | | 7,500,000 | | | | 7,000,005 | | |
Shares repurchased | | | (7,350,000 | ) | | | (19,550,000 | ) | | | (4,300,000 | ) | | | (6,550,000 | ) | |
Shares outstanding, end of year | | | 7,098,590 | | | | 8,648,590 | | | | 6,271,105 | | | | 3,071,105 | | |
The accompanying notes are an integral part of these financial statements.
DIREXION ANNUAL REPORT
156
Statements of Changes in Net Assets
| | | Direxion Daily S&P 500® High
Beta Bull 3X Shares | | Direxion Daily S&P 500® High
Beta Bear 3X Shares | |
| | | Year Ended
October 31, 2022 | | Year Ended
October 31, 2021 | | Year Ended
October 31, 2022 | | Year Ended
October 31, 2021 | |
Operations: | |
Net investment income (loss) | | $ | (122,072 | ) | | $ | (23,080 | ) | | $ | 57,673 | | | $ | (234,512 | ) | |
Net realized gain (loss) | | | (27,568,719 | ) | | | 67,638,919 | | | | (11,036,973 | ) | | | (67,826,311 | ) | |
Change in net unrealized appreciation
(depreciation) | | | (40,463,289 | ) | | | 37,925,359 | | | | 21,185,720 | | | | (4,975,326 | ) | |
Net increase (decrease) in net assets resulting
from operations | | | (68,154,080 | ) | | | 105,541,198 | | | | 10,206,420 | | | | (73,036,149 | ) | |
Distributions to shareholders: | |
Net distributions to shareholders | | | — | | | | (82,925 | ) | | | — | | | | — | | |
Total distributions | | | — | | | | (82,925 | ) | | | — | | | | — | | |
Capital share transactions: | |
Proceeds from shares sold | | | 128,760,161 | | | | 179,861,640 | | | | 168,513,712 | | | | 59,847,121 | | |
Cost of shares redeemed | | | (101,920,791 | ) | | | (204,633,680 | ) | | | (135,959,210 | ) | | | (15,971,059 | ) | |
Transaction fees (Note 4) | | | 20,511 | | | | 47,873 | | | | 40,788 | | | | 4,611 | | |
Net increase (decrease) in net assets resulting
from capital transactions | | | 26,859,881 | | | | (24,724,167 | ) | | | 32,595,290 | | | | 43,880,673 | | |
Total increase (decrease) in net assets | | | (41,294,199 | ) | | | 80,734,106 | | | | 42,801,710 | | | | (29,155,476 | ) | |
Net assets: | |
Beginning of year | | | 110,528,764 | | | | 29,794,658 | | | | 23,625,966 | | | | 52,781,442 | | |
End of year | | $ | 69,234,565 | | | $ | 110,528,764 | | | $ | 66,427,676 | | | $ | 23,625,966 | | |
Changes in shares outstanding | |
Shares outstanding, beginning of year | | | 1,464,370 | | | | 2,064,370 | | | | 2,606,828 | | | | 522,500 | | |
Shares sold | | | 3,800,000 | | | | 3,050,000 | | | | 18,500,000 | | | | 2,830,000 | | |
Shares repurchased | | | (2,550,000 | ) | | | (3,650,000 | ) | | | (13,400,000 | ) | | | (745,672 | ) | |
Shares outstanding, end of year | | | 2,714,370 | | | | 1,464,370 | | | | 7,706,828 | | | | 2,606,828 | | |
The accompanying notes are an integral part of these financial statements.
DIREXION ANNUAL REPORT
157
Statements of Changes in Net Assets
| | | Direxion Daily S&P Biotech
Bull 3X Shares | | Direxion Daily S&P Biotech
Bear 3X Shares | |
| | | Year Ended
October 31, 2022 | | Year Ended
October 31, 2021 | | Year Ended
October 31, 2022 | | Year Ended
October 31, 2021 | |
Operations: | |
Net investment income (loss) | | $ | (4,697,375 | ) | | $ | (5,000,005 | ) | | $ | 653,447 | | | $ | (691,848 | ) | |
Net realized gain (loss) | | | (1,556,399,343 | ) | | | 100,727,902 | | | | (16,969,252 | ) | | | (95,689,771 | ) | |
Change in net unrealized appreciation
(depreciation) | | | 199,471,339 | | | | (182,049,076 | ) | | | (274,321 | ) | | | 10,819,563 | | |
Net decrease in net assets resulting from
operations | | | (1,361,625,379 | ) | | | (86,321,179 | ) | | | (16,590,126 | ) | | | (85,562,056 | ) | |
Distributions to shareholders: | |
Net distributions to shareholders | | | — | | | | — | | | | — | | | | — | | |
Total distributions | | | — | | | | — | | | | — | | | | — | | |
Capital share transactions: | |
Proceeds from shares sold | | | 3,442,750,306 | | | | 2,438,065,093 | | | | 1,423,731,319 | | | | 618,832,012 | | |
Cost of shares redeemed | | | (1,694,450,607 | ) | | | (1,871,640,964 | ) | | | (1,264,813,343 | ) | | | (549,727,565 | ) | |
Transaction fees (Note 4) | | | 376,244 | | | | 395,183 | | | | 379,444 | | | | 164,556 | | |
Net increase in net assets resulting from
capital transactions | | | 1,748,675,943 | | | | 566,819,312 | | | | 159,297,420 | | | | 69,269,003 | | |
Total increase (decrease) in net assets | | | 387,050,564 | | | | 480,498,133 | | | | 142,707,294 | | | | (16,293,053 | ) | |
Net assets: | |
Beginning of year | | | 772,796,253 | | | | 292,298,120 | | | | 47,267,474 | | | | 63,560,527 | | |
End of year | | $ | 1,159,846,817 | | | $ | 772,796,253 | | | $ | 189,974,768 | | | $ | 47,267,474 | | |
Changes in shares outstanding | |
Shares outstanding, beginning of year | | | 14,511,600 | | | | 5,461,600 | | | | 2,216,024 | | | | 1,166,024 | | |
Shares sold | | | 295,550,000 | | | | 35,300,000 | | | | 50,250,000 | | | | 26,950,000 | | |
Shares repurchased | | | (153,800,000 | ) | | | (26,250,000 | ) | | | (43,050,000 | ) | | | (25,900,000 | ) | |
Shares outstanding, end of year | | | 156,261,600 | | | | 14,511,600 | | | | 9,416,024 | | | | 2,216,024 | | |
The accompanying notes are an integral part of these financial statements.
DIREXION ANNUAL REPORT
158
Statements of Changes in Net Assets
| | | Direxion Daily Semiconductor
Bull 3X Shares | | Direxion Daily Semiconductor
Bear 3X Shares1 | |
| | | Year Ended
October 31, 2022 | | Year Ended
October 31, 2021 | | Year Ended
October 31, 2022 | | Year Ended
October 31, 2021 | |
Operations: | |
Net investment income (loss) | | $ | 24,099,574 | | | $ | (364,352 | ) | | $ | 1,307,168 | | | $ | (954,077 | ) | |
Net realized gain (loss) | | | (5,271,582,760 | ) | | | 2,854,167,978 | | | | 221,587,899 | | | | (134,480,560 | ) | |
Change in net unrealized appreciation
(depreciation) | | | (1,537,628,928 | ) | | | 177,364,539 | | | | 165,141,018 | | | | (6,837,423 | ) | |
Net increase (decrease) in net assets resulting
from operations | | | (6,785,112,114 | ) | | | 3,031,168,165 | | | | 388,036,085 | | | | (142,272,060 | ) | |
Distributions to shareholders: | |
Net distributions to shareholders | | | (18,952,312 | ) | | | (2,155,338 | ) | | | — | | | | — | | |
Total distributions | | | (18,952,312 | ) | | | (2,155,338 | ) | | | — | | | | — | | |
Capital share transactions: | |
Proceeds from shares sold | | | 14,029,647,329 | | | | 7,073,156,222 | | | | 4,367,830,060 | | | | 909,892,171 | | |
Cost of shares redeemed | | | (7,908,295,563 | ) | | | (7,267,499,520 | ) | | | (4,311,606,686 | ) | | | (716,193,908 | ) | |
Transaction fees (Note 4) | | | 1,685,971 | | | | 1,585,045 | | | | 1,293,464 | | | | 214,858 | | |
Net increase (decrease) in net assets resulting
from capital transactions | | | 6,123,037,737 | | | | (192,758,253 | ) | | | 57,516,838 | | | | 193,913,121 | | |
Total increase (decrease) in net assets | | | (681,026,689 | ) | | | 2,836,254,574 | | | | 445,552,923 | | | | 51,641,061 | | |
Net assets: | |
Beginning of year | | | 4,155,098,959 | | | | 1,318,844,385 | | | | 145,418,026 | | | | 93,776,965 | | |
End of year | | $ | 3,474,072,270 | | | $ | 4,155,098,959 | | | $ | 590,970,949 | | | $ | 145,418,026 | | |
Changes in shares outstanding | |
Shares outstanding, beginning of year | | | 87,250,060 | | | | 79,500,060 | | | | 2,530,107 | | | | 250,107 | | |
Shares sold | | | 644,650,000 | | | | 191,950,000 | | | | 91,435,000 | | | | 10,035,000 | | |
Shares repurchased | | | (340,950,000 | ) | | | (184,200,000 | ) | | | (84,041,667 | ) | | | (7,755,000 | ) | |
Shares outstanding, end of year | | | 390,950,060 | | | | 87,250,060 | | | | 9,923,440 | | | | 2,530,107 | | |
1 Effective March 28, 2022, the Fund had a 1:10 reverse stock split. Share amounts for all periods have been adjusted to give effect to the 1:10 stock split.
The accompanying notes are an integral part of these financial statements.
DIREXION ANNUAL REPORT
159
Statements of Changes in Net Assets
| | | Direxion Daily Technology
Bull 3X Shares | | Direxion Daily Technology
Bear 3X Shares | |
| | | Year Ended
October 31, 2022 | | Year Ended
October 31, 2021 | | Year Ended
October 31, 2022 | | Year Ended
October 31, 2021 | |
Operations: | |
Net investment income (loss) | | $ | (1,097,830 | ) | | $ | (6,583,994 | ) | | $ | 371,278 | | | $ | (596,741 | ) | |
Net realized gain (loss) | | | (739,111,544 | ) | | | 1,514,493,652 | | | | (12,493,515 | ) | | | (69,922,392 | ) | |
Change in net unrealized appreciation
(depreciation) | | | (1,370,501,859 | ) | | | 701,562,052 | | | | 64,453,561 | | | | (17,326,206 | ) | |
Net increase (decrease) in net assets resulting
from operations | | | (2,110,711,233 | ) | | | 2,209,471,710 | | | | 52,331,324 | | | | (87,845,339 | ) | |
Distributions to shareholders: | |
Net distributions to shareholders | | | (11,889,234 | ) | | | (10,258,380 | ) | | | — | | | | — | | |
Total distributions | | | (11,889,234 | ) | | | (10,258,380 | ) | | | — | | | | — | | |
Capital share transactions: | |
Proceeds from shares sold | | | 1,140,561,864 | | | | 2,343,364,226 | | | | 822,314,776 | | | | 158,795,876 | | |
Cost of shares redeemed | | | (710,702,242 | ) | | | (3,042,099,387 | ) | | | (782,288,457 | ) | | | (84,069,407 | ) | |
Transaction fees (Note 4) | | | 176,439 | | | | 793,128 | | | | 234,672 | | | | 25,220 | | |
Net increase (decrease) in net assets resulting
from capital transactions | | | 430,036,061 | | | | (697,942,033 | ) | | | 40,260,991 | | | | 74,751,689 | | |
Total increase (decrease) in net assets | | | (1,692,564,406 | ) | | | 1,501,271,297 | | | | 92,592,315 | | | | (13,093,650 | ) | |
Net assets: | |
Beginning of year | | | 3,061,359,346 | | | | 1,560,088,049 | | | | 66,942,193 | | | | 80,035,843 | | |
End of year | | $ | 1,368,794,940 | | | $ | 3,061,359,346 | | | $ | 159,534,508 | | | $ | 66,942,193 | | |
Changes in shares outstanding | |
Shares outstanding, beginning of year | | | 43,050,000 | | | | 61,000,000 | | | | 1,801,485 | | | | 541,485 | | |
Shares sold | | | 24,750,000 | | | | 42,250,000 | | | | 20,300,000 | | | | 2,500,000 | | |
Shares repurchased | | | (14,500,000 | ) | | | (60,200,000 | ) | | | (18,301,225 | ) | | | (1,240,000 | ) | |
Shares outstanding, end of year | | | 53,300,000 | | | | 43,050,000 | | | | 3,800,260 | | | | 1,801,485 | | |
The accompanying notes are an integral part of these financial statements.
DIREXION ANNUAL REPORT
160
Statements of Changes in Net Assets
| | | Direxion Daily Transportation
Bull 3X Shares | | Direxion Daily Utilities
Bull 3X Shares | |
| | | Year Ended
October 31, 2022 | | Year Ended
October 31, 2021 | | Year Ended
October 31, 2022 | | Year Ended
October 31, 2021 | |
Operations: | |
Net investment income (loss) | | $ | (15,247 | ) | | $ | (199,808 | ) | | $ | 283,546 | | | $ | 236,892 | | |
Net realized gain | | | 3,113,802 | | | | 43,911,743 | | | | 6,257,659 | | | | 5,877,480 | | |
Change in net unrealized appreciation
(depreciation) | | | (31,874,575 | ) | | | 15,345,107 | | | | (3,670,521 | ) | | | 1,911,538 | | |
Net increase (decrease) in net assets resulting
from operations | | | (28,776,020 | ) | | | 59,057,042 | | | | 2,870,684 | | | | 8,025,910 | | |
Distributions to shareholders: | |
Net distributions to shareholders | | | — | | | | (19,756 | ) | | | (363,008 | ) | | | (257,434 | ) | |
Total distributions | | | — | | | | (19,756 | ) | | | (363,008 | ) | | | (257,434 | ) | |
Capital share transactions: | |
Proceeds from shares sold | | | 15,083,398 | | | | 125,784,768 | | | | 20,912,861 | | | | 39,128,496 | | |
Cost of shares redeemed | | | (52,875,378 | ) | | | (133,936,425 | ) | | | (38,819,781 | ) | | | (24,343,117 | ) | |
Transaction fees (Note 4) | | | 12,464 | | | | 33,237 | | | | 7,764 | | | | 4,869 | | |
Net increase (decrease) in net assets resulting
from capital transactions | | | (37,779,516 | ) | | | (8,118,420 | ) | | | (17,899,156 | ) | | | 14,790,248 | | |
Total increase (decrease) in net assets | | | (66,555,536 | ) | | | 50,918,866 | | | | (15,391,480 | ) | | | 22,558,724 | | |
Net assets: | |
Beginning of year | | | 89,798,046 | | | | 38,879,180 | | | | 37,274,105 | | | | 14,715,381 | | |
End of year | | $ | 23,242,510 | | | $ | 89,798,046 | | | $ | 21,882,625 | | | $ | 37,274,105 | | |
Changes in shares outstanding | |
Shares outstanding, beginning of year | | | 1,850,001 | | | | 2,150,001 | | | | 1,150,001 | | | | 550,001 | | |
Shares sold | | | 350,000 | | | | 3,250,000 | | | | 700,000 | | | | 1,400,000 | | |
Shares repurchased | | | (1,150,000 | ) | | | (3,550,000 | ) | | | (1,100,000 | ) | | | (800,000 | ) | |
Shares outstanding, end of year | | | 1,050,001 | | | | 1,850,001 | | | | 750,001 | | | | 1,150,001 | | |
The accompanying notes are an integral part of these financial statements.
DIREXION ANNUAL REPORT
161
Statements of Changes in Net Assets
| | | Direxion Daily 7-10 Year Treasury
Bull 3X Shares | | Direxion Daily 7-10 Year Treasury
Bear 3X Shares | |
| | | Year Ended
October 31, 2022 | | Year Ended
October 31, 2021 | | Year Ended
October 31, 2022 | | Year Ended
October 31, 2021 | |
Operations: | |
Net investment income (loss) | | $ | 108,970 | | | $ | (80,812 | ) | | $ | 18,850 | | | $ | (146,678 | ) | |
Net realized gain (loss) | | | (8,203,502 | ) | | | (520,359 | ) | | | 14,428,932 | | | | (865,095 | ) | |
Change in net unrealized appreciation
(depreciation) | | | (5,317,042 | ) | | | (2,605,011 | ) | | | 5,753,324 | | | | 1,481,064 | | |
Net increase (decrease) in net assets resulting
from operations | | | (13,411,574 | ) | | | (3,206,182 | ) | | | 20,201,106 | | | | 469,291 | | |
Distributions to shareholders: | |
Net distributions to shareholders | | | — | | | | (1,553,448 | ) | | | — | | | | — | | |
Return of capital | | | — | | | | (167,130 | ) | | | — | | | | — | | |
Total distributions | | | — | | | | (1,720,578 | ) | | | — | | | | — | | |
Capital share transactions: | |
Proceeds from shares sold | | | 19,813,138 | | | | 13,941,367 | | | | 48,953,433 | | | | 22,674,915 | | |
Cost of shares redeemed | | | (5,460,055 | ) | | | (5,211,721 | ) | | | (42,655,103 | ) | | | (403,393 | ) | |
Transaction fees (Note 4) | | | 1,424 | | | | 1,564 | | | | 12,797 | | | | 121 | | |
Net increase in net assets resulting from
capital transactions | | | 14,354,507 | | | | 8,731,210 | | | | 6,311,127 | | | | 22,271,643 | | |
Total increase in net assets | | | 942,933 | | | | 3,804,450 | | | | 26,512,233 | | | | 22,740,934 | | |
Net assets: | |
Beginning of year | | | 23,338,803 | | | | 19,534,353 | | | | 29,623,215 | | | | 6,882,281 | | |
End of year | | $ | 24,281,736 | | | $ | 23,338,803 | | | $ | 56,135,448 | | | $ | 29,623,215 | | |
Changes in shares outstanding | |
Shares outstanding, beginning of year | | | 450,000 | | | | 300,000 | | | | 3,400,000 | | | | 850,000 | | |
Shares sold | | | 550,000 | | | | 250,000 | | | | 4,300,000 | | | | 2,600,000 | | |
Shares repurchased | | | (150,000 | ) | | | (100,000 | ) | | | (3,750,000 | ) | | | (50,000 | ) | |
Shares outstanding, end of year | | | 850,000 | | | | 450,000 | | | | 3,950,000 | | | | 3,400,000 | | |
The accompanying notes are an integral part of these financial statements.
DIREXION ANNUAL REPORT
162
Statements of Changes in Net Assets
| | | Direxion Daily 20+ Year Treasury
Bull 3X Shares | | Direxion Daily 20+ Year Treasury
Bear 3X Shares | |
| | | Year Ended
October 31, 2022 | | Year Ended
October 31, 2021 | | Year Ended
October 31, 2022 | | Year Ended
October 31, 2021 | |
Operations: | |
Net investment income (loss) | | $ | 3,318,740 | | | $ | 301,350 | | | $ | 286,716 | | | $ | (1,956,090 | ) | |
Net realized gain (loss) | | | (301,126,220 | ) | | | (46,606,271 | ) | | | 324,325,126 | | | | (547,287 | ) | |
Change in net unrealized appreciation
(depreciation) | | | (204,797,974 | ) | | | (6,075,258 | ) | | | 177,391,380 | | | | (28,182,740 | ) | |
Net increase (decrease) in net assets resulting
from operations | | | (502,605,454 | ) | | | (52,380,179 | ) | | | 502,003,222 | | | | (30,686,117 | ) | |
Distributions to shareholders: | |
Net distributions to shareholders | | | (2,244,754 | ) | | | (5,652,475 | ) | | | — | | | | — | | |
Return of capital | | | — | | | | (42,707 | ) | | | — | | | | — | | |
Total distributions | | | (2,244,754 | ) | | | (5,695,182 | ) | | | — | | | | — | | |
Capital share transactions: | |
Proceeds from shares sold | | | 706,074,203 | | | | 277,352,616 | | | | 348,379,936 | | | | 406,312,058 | | |
Cost of shares redeemed | | | (123,804,932 | ) | | | (142,461,318 | ) | | | (487,348,808 | ) | | | (149,346,363 | ) | |
Transaction fees (Note 4) | | | 31,440 | | | | 40,022 | | | | 281,810 | | | | 43,697 | | |
Net increase (decrease) in net assets resulting
from capital transactions | | | 582,300,711 | | | | 134,931,320 | | | | (138,687,062 | ) | | | 257,009,392 | | |
Total increase in net assets | | | 77,450,503 | | | | 76,855,959 | | | | 363,316,160 | | | | 226,323,275 | | |
Net assets: | |
Beginning of year | | | 359,734,817 | | | | 282,878,858 | | | | 325,333,498 | | | | 99,010,223 | | |
End of year | | $ | 437,185,320 | | | $ | 359,734,817 | | | $ | 688,649,658 | | | $ | 325,333,498 | | |
Changes in shares outstanding | |
Shares outstanding, beginning of year | | | 12,800,000 | | | | 7,900,000 | | | | 5,674,261 | | | | 1,774,261 | | |
Shares sold | | | 58,350,000 | | | | 9,850,000 | | | | 3,900,000 | | | | 6,200,000 | | |
Shares repurchased | | | (8,800,000 | ) | | | (4,950,000 | ) | | | (5,250,000 | ) | | | (2,300,000 | ) | |
Shares outstanding, end of year | | | 62,350,000 | | | | 12,800,000 | | | | 4,324,261 | | | | 5,674,261 | | |
The accompanying notes are an integral part of these financial statements.
DIREXION ANNUAL REPORT
163
Financial Highlights
October 31, 2022
| | | | | RATIOS TO AVERAGE NET ASSETS7 | | | |
| | | Net Asset
Value,
Beginning
of Year/
Period | | Net
Investment
Income
(Loss)1,2 | | Net
Investment
Income
(Loss)1,3 | | Net Realized
and Unrealized
Gain (Loss)
on Investments4 | | Net Increase
(Decrease) in
Net Asset
Value Resulting
from Operations | | Dividends
from Net
Investment
Income | | Distributions
from
Realized
Capital Gains | | Distributions
from
Return
of Capital | | Total
Distributions | | Net
Asset
Value,
End of
Year/
Period | | Total
Return5 | | Net
Assets,
End of
Year/
Period
(000's
omitted) | | Net
Expenses2,6 | | Total
Expenses2 | | Net Investment
Income (Loss)
after Expense
Reimbursement2 | | Net
Expenses3,6 | | Total
Expenses3 | | Net Investment
Income (Loss)
after Expense
Reimbursement3 | | Portfolio
Turnover
Rate8 | |
Direxion Daily Mid Cap Bull 3X Shares | |
For the Year Ended October 31, 2022 | | $ | 67.09 | | | $ | 0.15 | | | $ | 0.17 | | | $ | (30.47 | ) | | $ | (30.32 | ) | | $ | — | | | $ | — | | | $ | — | | | $ | — | | | $ | 36.77 | | | | -45.19 | % | | $ | 47,801 | | | | 0.98 | % | | | 0.99 | % | | | 0.31 | % | | | 0.95 | % | | | 0.96 | % | | | 0.34 | % | | | 54 | % | |
| For the Year Ended October 31, 2021 | | | 22.89 | | | | (0.08 | ) | | | (0.07 | ) | | | 44.29 | | | | 44.21 | | | | (0.01 | ) | | | — | | | | — | | | | (0.01 | ) | | | 67.09 | | | | 193.19 | % | | | 90,584 | | | | 0.96 | % | | | 0.95 | % | | | (0.14 | )% | | | 0.95 | % | | | 0.94 | % | | | (0.13 | )% | | | 33 | % | |
| For the Year Ended October 31, 2020 | | | 42.25 | | | | 0.06 | | | | 0.08 | | | | (19.24 | ) | | | (19.18 | ) | | | (0.17 | ) | | | — | | | | (0.01 | ) | | | (0.18 | ) | | | 22.89 | | | | -45.61 | % | | | 40,055 | | | | 1.00 | % | | | 1.06 | % | | | 0.25 | % | | | 0.95 | % | | | 1.01 | % | | | 0.30 | % | | | 91 | % | |
| For the Year Ended October 31, 2019 | | | 38.45 | | | | 0.30 | | | | 0.35 | | | | 3.84 | | | | 4.14 | | | | (0.34 | ) | | | — | | | | — | | | | (0.34 | ) | | | 42.25 | | | | 11.04 | % | | | 46,481 | | | | 1.08 | % | | | 1.12 | % | | | 0.75 | % | | | 0.95 | % | | | 0.99 | % | | | 0.88 | % | | | 23 | % | |
| For the Year Ended October 31, 2018 | | | 42.92 | | | | 0.22 | | | | 0.29 | | | | (3.42 | ) | | | (3.20 | ) | | | (0.10 | ) | | | (1.17 | ) | | | — | | | | (1.27 | ) | | | 38.45 | | | | -7.90 | % | | | 57,678 | | | | 1.10 | % | | | 1.13 | % | | | 0.46 | % | | | 0.95 | % | | | 0.98 | % | | | 0.61 | % | | | 39 | % | |
Direxion Daily S&P 500® Bull 3X Shares | |
| For the Year Ended October 31, 2022 | | | 130.30 | | | | 0.22 | | | | 0.25 | | | | (64.36 | ) | | | (64.14 | ) | | | (0.19 | ) | | | — | | | | — | | | | (0.19 | ) | | | 65.97 | | | | -49.27 | % | | | 2,546,628 | | | | 0.91 | % | | | 0.96 | % | | | 0.23 | % | | | 0.88 | % | | | 0.93 | % | | | 0.26 | % | | | 113 | % | |
| For the Year Ended October 31, 2021 | | | 48.08 | | | | 0.13 | | | | 0.14 | | | | 82.25 | | | | 82.38 | | | | (0.16 | ) | | | — | | | | — | | | | (0.16 | ) | | | 130.30 | | | | 171.57 | % | | | 3,348,750 | | | | 0.91 | % | | | 0.93 | % | | | 0.14 | % | | | 0.90 | % | | | 0.92 | % | | | 0.15 | % | | | 28 | % | |
| For the Year Ended October 31, 2020 | | | 55.25 | | | | 0.16 | | | | 0.20 | | | | (7.02 | ) | | | (6.86 | ) | | | (0.31 | ) | | | — | | | | — | | | | (0.31 | ) | | | 48.08 | | | | -12.54 | % | | | 1,331,734 | | | | 1.03 | % | | | 1.04 | % | | | 0.34 | % | | | 0.95 | % | | | 0.96 | % | | | 0.42 | % | | | 223 | % | |
| For the Year Ended October 31, 2019 | | | 43.04 | | | | 0.45 | | | | 0.56 | | | | 12.26 | | | | 12.71 | | | | (0.50 | ) | | | — | | | | — | | | | (0.50 | ) | | | 55.25 | | | | 29.95 | % | | | 947,851 | | | | 1.19 | % | | | 1.19 | % | | | 0.98 | % | | | 0.95 | % | | | 0.95 | % | | | 1.22 | % | | | 86 | % | |
| For the Year Ended October 31, 2018 | | | 40.86 | | | | 0.31 | | | | 0.34 | | | | 3.71 | | | | 4.02 | | | | (0.24 | ) | | | (1.60 | ) | | | — | | | | (1.84 | ) | | | 43.04 | | | | 9.74 | % | | | 992,232 | | | | 1.00 | % | | | 1.00 | % | | | 0.68 | % | | | 0.95 | % | | | 0.95 | % | | | 0.73 | % | | | 95 | % | |
Direxion Daily S&P 500® Bear 3X Shares | |
| For the Year Ended October 31, 2022 | | | 18.78 | | | | 0.04 | | | | 0.07 | | | | 3.84 | | | | 3.88 | | | | — | | | | — | | | | — | | | | — | | | | 22.66 | | | | 20.66 | % | | | 887,711 | | | | 1.08 | % | | | 1.06 | % | | | 0.20 | % | | | 0.95 | % | | | 0.93 | % | | | 0.33 | % | | | 0 | % | |
| For the Year Ended October 31, 2021 | | | 61.00 | | | | (0.27 | ) | | | (0.27 | ) | | | (41.95 | ) | | | (42.22 | ) | | | — | | | | — | | | | — | | | | — | | | | 18.78 | | | | -69.21 | % | | | 388,357 | | | | 0.95 | % | | | 0.92 | % | | | (0.92 | )% | | | 0.95 | % | | | 0.92 | % | | | (0.92 | )% | | | 0 | % | |
| For the Year Ended October 31, 2020 | | | 160.60 | | | | (0.40 | ) | | | (0.40 | ) | | | (98.60 | ) | | | (99.00 | ) | | | (0.40 | ) | | | — | | | | (0.20 | ) | | | (0.60 | ) | | | 61.00 | | | | -61.87 | % | | | 803,180 | | | | 0.96 | % | | | 0.99 | % | | | (0.45 | )% | | | 0.95 | % | | | 0.98 | % | | | (0.44 | )% | | | 0 | % | |
| For the Year Ended October 31, 2019 | | | 259.20 | | | | 2.90 | | | | 2.90 | | | | (98.60 | ) | | | (95.70 | ) | | | (2.90 | ) | | | — | | | | — | | | | (2.90 | ) | | | 160.60 | | | | -37.21 | % | | | 488,984 | | | | 0.96 | % | | | 0.96 | % | | | 1.44 | % | | | 0.95 | % | | | 0.95 | % | | | 1.45 | % | | | 0 | % | |
| For the Year Ended October 31, 2018 | | | 339.40 | | | | 1.80 | | | | 1.80 | | | | (81.20 | ) | | | (79.40 | ) | | | (0.80 | ) | | | — | | | | — | | | | (0.80 | ) | | | 259.20 | | | | -23.38 | % | | | 267,114 | | | | 0.95 | % | | | 0.96 | % | | | 0.68 | % | | | 0.94 | % | | | 0.95 | % | | | 0.69 | % | | | 1 | % | |
Direxion Daily Small Cap Bull 3X Shares | |
| For the Year Ended October 31, 2022 | | | 93.14 | | | | 0.11 | | | | 0.13 | | | | (54.92 | ) | | | (54.81 | ) | | | (0.05 | ) | | | — | | | | — | | | | (0.05 | ) | | | 38.28 | | | | -58.86 | % | | | 1,217,463 | | | | 0.94 | % | | | 0.94 | % | | | 0.22 | % | | | 0.91 | % | | | 0.91 | % | | | 0.25 | % | | | 114 | % | |
| For the Year Ended October 31, 2021 | | | 32.03 | | | | (0.23 | ) | | | (0.22 | ) | | | 61.35 | | | | 61.12 | | | | (0.01 | ) | | | — | | | | — | | | | (0.01 | ) | | | 93.14 | | | | 190.83 | % | | | 1,499,519 | | | | 0.91 | % | | | 0.91 | % | | | (0.28 | )% | | | 0.90 | % | | | 0.90 | % | | | (0.27 | )% | | | 62 | % | |
| For the Year Ended October 31, 2020 | | | 59.64 | | | | 0.02 | | | | 0.05 | | | | (27.47 | ) | | | (27.45 | ) | | | (0.12 | ) | | | — | | | | (0.04 | ) | | | (0.16 | ) | | | 32.03 | | | | -46.16 | % | | | 831,202 | | | | 1.03 | % | | | 1.01 | % | | | 0.06 | % | | | 0.95 | % | | | 0.93 | % | | | 0.14 | % | | | 76 | % | |
| For the Year Ended October 31, 2019 | | | 61.79 | | | | 0.32 | | | | 0.46 | | | | (2.17 | ) | | | (1.85 | ) | | | (0.30 | ) | | | — | | | | — | | | | (0.30 | ) | | | 59.64 | | | | -2.88 | % | | | 730,592 | | | | 1.18 | % | | | 1.17 | % | | | 0.56 | % | | | 0.95 | % | | | 0.94 | % | | | 0.79 | % | | | 53 | % | |
| For the Year Ended October 31, 2018 | | | 66.18 | | | | 0.20 | | | | 0.31 | | | | (4.47 | ) | | | (4.27 | ) | | | (0.12 | ) | | | — | | | | — | | | | (0.12 | ) | | | 61.79 | | | | -6.49 | % | | | 883,562 | | | | 1.10 | % | | | 1.12 | % | | | 0.26 | % | | | 0.95 | % | | | 0.97 | % | | | 0.41 | % | | | 51 | % | |
Direxion Daily Small Cap Bear 3X Shares | |
| For the Year Ended October 31, 2022 | | | 26.89 | | | | 0.01 | | | | 0.04 | | | | 5.43 | | | | 5.44 | | | | — | | | | — | | | | — | | | | — | | | | 32.33 | | | | 20.23 | % | | | 547,165 | | | | 0.99 | % | | | 0.99 | % | | | 0.04 | % | | | 0.91 | % | | | 0.91 | % | | | 0.12 | % | | | 0 | % | |
| For the Year Ended October 31, 2021 | | | 124.40 | | | | (0.33 | ) | | | (0.33 | ) | | | (97.18 | ) | | | (97.51 | ) | | | — | | | | — | | | | — | | | | — | | | | 26.89 | | | | -78.38 | % | | | 504,783 | | | | 0.94 | % | | | 0.90 | % | | | (0.91 | )% | | | 0.94 | % | | | 0.90 | % | | | (0.91 | )% | | | 0 | % | |
| For the Year Ended October 31, 2020 | | | 345.52 | | | | (0.88 | ) | | | (0.88 | ) | | | (218.88 | ) | | | (219.76 | ) | | | (0.96 | ) | | | — | | | | (0.40 | ) | | | (1.36 | ) | | | 124.40 | | | | -63.86 | % | | | 545,802 | | | | 0.97 | % | | | 0.97 | % | | | (0.46 | )% | | | 0.95 | % | | | 0.95 | % | | | (0.44 | )% | | | 0 | % | |
| For the Year Ended October 31, 2019 | | | 462.40 | | | | 5.44 | | | | 5.60 | | | | (116.64 | ) | | | (111.20 | ) | | | (5.68 | ) | | | — | | | | — | | | | (5.68 | ) | | | 345.52 | | | | -24.30 | % | | | 321,403 | | | | 0.99 | % | | | 0.99 | % | | | 1.36 | % | | | 0.95 | % | | | 0.95 | % | | | 1.40 | % | | | 0 | % | |
| For the Year Ended October 31, 2018 | | | 532.00 | | | | 3.20 | | | | 3.20 | | | | (70.80 | ) | | | (67.60 | ) | | | (2.00 | ) | | | — | | | | — | | | | (2.00 | ) | | | 462.40 | | | | -12.65 | % | | | 282,984 | | | | 0.95 | % | | | 0.96 | % | | | 0.73 | % | | | 0.95 | % | | | 0.96 | % | | | 0.73 | % | | | 0 | % | |
Direxion Daily FTSE China Bull 3X Shares11 | |
| For the Year Ended October 31, 2022 | | | 223.80 | | | | 0.70 | | | | 0.71 | | | | (204.20 | ) | | | (203.50 | ) | | | (0.35 | ) | | | — | | | | — | | | | (0.35 | ) | | | 19.95 | | | | -91.06 | % | | | 217,357 | | | | 0.97 | % | | | 0.97 | % | | | 0.78 | % | | | 0.95 | % | | | 0.95 | % | | | 0.80 | % | | | 102 | % | |
| For the Year Ended October 31, 2021 | | | 335.60 | | | | 0.60 | | | | 0.60 | | | | (109.60 | ) | | | (109.00 | ) | | | (2.80 | ) | | | — | | | | — | | | | (2.80 | ) | | | 223.80 | | | | -32.82 | % | | | 482,288 | | | | 0.95 | % | | | 0.93 | % | | | 0.17 | % | | | 0.95 | % | | | 0.93 | % | | | 0.17 | % | | | 50 | % | |
| For the Year Ended October 31, 2020 | | | 361.00 | | | | 3.00 | | | | 3.20 | | | | (24.80 | ) | | | (21.80 | ) | | | (3.20 | ) | | | — | | | | (0.40 | ) | | | (3.60 | ) | | | 335.60 | | | | -6.03 | % | | | 260,909 | | | | 0.99 | % | | | 1.01 | % | | | 0.96 | % | | | 0.95 | % | | | 0.97 | % | | | 1.00 | % | | | 264 | % | |
| For the Year Ended October 31, 2019 | | | 357.00 | | | | 4.40 | | | | 4.80 | | | | 4.00 | | | | 8.40 | | | | (4.40 | ) | | | — | | | | — | | | | (4.40 | ) | | | 361.00 | | | | 2.23 | % | | | 329,403 | | | | 1.05 | % | | | 1.07 | % | | | 1.12 | % | | | 0.95 | % | | | 0.97 | % | | | 1.22 | % | | | 142 | % | |
| For the Year Ended October 31, 2018 | | | 653.20 | | | | 9.60 | | | | 10.00 | | | | (295.60 | ) | | | (286.00 | ) | | | (10.20 | ) | | | — | | | | — | | | | (10.20 | ) | | | 357.00 | | | | -44.39 | % | | | 307,058 | | | | 1.02 | % | | | 1.05 | % | | | 1.63 | % | | | 0.95 | % | | | 0.98 | % | | | 1.70 | % | | | 158 | % | |
Direxion Daily FTSE China Bear 3X Shares | |
| For the Year Ended October 31, 2022 | | | 16.86 | | | | 0.02 | | | | 0.03 | | | | 21.28 | | | | 21.30 | | | | — | | | | — | | | | — | | | | — | | | | 38.16 | | | | 126.33 | % | | | 168,948 | | | | 1.06 | % | | | 1.06 | % | | | 0.09 | % | | | 0.95 | % | | | 0.95 | % | | | 0.20 | % | | | 0 | % | |
| For the Year Ended October 31, 2021 | | | 20.91 | | | | (0.14 | ) | | | (0.14 | ) | | | (3.91 | ) | | | (4.05 | ) | | | — | | | | — | | | | — | | | | — | | | | 16.86 | | | | -19.37 | % | | | 66,230 | | | | 0.95 | % | | | 0.98 | % | | | (0.93 | )% | | | 0.95 | % | | | 0.98 | % | | | (0.93 | )% | | | 0 | % | |
| For the Year Ended October 31, 2020 | | | 49.94 | | | | (0.05 | ) | | | (0.04 | ) | | | (28.78 | ) | | | (28.83 | ) | | | (0.11 | ) | | | — | | | | (0.09 | ) | | | (0.20 | ) | | | 20.91 | | | | -57.94 | % | | | 44,477 | | | | 0.98 | % | | | 1.03 | % | | | (0.14 | )% | | | 0.95 | % | | | 1.00 | % | | | (0.11 | )% | | | 0 | % | |
| For the Year Ended October 31, 2019 | | | 71.04 | | | | 0.65 | | | | 0.71 | | | | (21.04 | ) | | | (20.39 | ) | | | (0.71 | ) | | | — | | | | — | | | | (0.71 | ) | | | 49.94 | | | | -28.74 | % | | | 78,771 | | | | 1.05 | % | | | 1.09 | % | | | 1.27 | % | | | 0.95 | % | | | 0.99 | % | | | 1.37 | % | | | 0 | % | |
| For the Year Ended October 31, 2018 | | | 65.30 | | | | 0.39 | | | | 0.43 | | | | 5.52 | | | | 5.91 | | | | (0.17 | ) | | | — | | | | — | | | | (0.17 | ) | | | 71.04 | | | | 9.14 | % | | | 80,084 | | | | 1.02 | % | | | 1.08 | % | | | 0.69 | % | | | 0.95 | % | | | 1.01 | % | | | 0.76 | % | | | 0 | % | |
Direxion Daily FTSE Europe Bull 3X Shares | |
| For the Year Ended October 31, 2022 | | | 38.34 | | | | 0.28 | | | | 0.29 | | | | (25.53 | ) | | | (25.25 | ) | | | (0.26 | ) | | | — | | | | — | | | | (0.26 | ) | | | 12.83 | | | | -66.00 | % | | | 17,965 | | | | 0.98 | % | | | 0.99 | % | | | 1.16 | % | | | 0.95 | % | | | 0.96 | % | | | 1.19 | % | | | 0 | % | |
| For the Year Ended October 31, 2021 | | | 14.48 | | | | 0.15 | | | | 0.15 | | | | 23.85 | | | | 24.00 | | | | (0.14 | ) | | | — | | | | — | | | | (0.14 | ) | | | 38.34 | | | | 165.99 | % | | | 47,924 | | | | 0.96 | % | | | 0.93 | % | | | 0.45 | % | | | 0.95 | % | | | 0.92 | % | | | 0.46 | % | | | 51 | % | |
| For the Year Ended October 31, 2020 | | | 29.27 | | | | 0.09 | | | | 0.11 | | | | (14.74 | ) | | | (14.65 | ) | | | (0.14 | ) | | | — | | | | — | | | | (0.14 | ) | | | 14.48 | | | | -50.09 | % | | | 13,757 | | | | 1.03 | % | | | 1.09 | % | | | 0.43 | % | | | 0.95 | % | | | 1.01 | % | | | 0.51 | % | | | 101 | % | |
| For the Year Ended October 31, 2019 | | | 24.54 | | | | 0.36 | | | | 0.42 | | | | 4.79 | | | | 5.15 | | | | (0.42 | ) | | | — | | | | — | | | | (0.42 | ) | | | 29.27 | | | | 21.25 | % | | | 27,804 | | | | 1.18 | % | | | 1.20 | % | | | 1.41 | % | | | 0.95 | % | | | 0.97 | % | | | 1.64 | % | | | 111 | % | |
| For the Year Ended October 31, 2018 | | | 36.99 | | | | 0.54 | | | | 0.56 | | | | (12.34 | ) | | | (11.80 | ) | | | (0.65 | ) | | | — | | | | — | | | | (0.65 | ) | | | 24.54 | | | | -32.39 | % | | | 46,632 | | | | 1.00 | % | | | 0.98 | % | | | 1.52 | % | | | 0.95 | % | | | 0.93 | % | | | 1.57 | % | | | 54 | % | |
The accompanying notes are an integral part of these financial statements.
DIREXION ANNUAL REPORT
164
Financial Highlights
October 31, 2022
| | | | | RATIOS TO AVERAGE NET ASSETS7 | | | |
| | | Net Asset
Value,
Beginning
of Year/
Period | | Net
Investment
Income
(Loss)1,2 | | Net
Investment
Income
(Loss)1,3 | | Net Realized
and Unrealized
Gain (Loss)
on Investments4 | | Net Increase
(Decrease) in
Net Asset
Value Resulting
from Operations | | Dividends
from Net
Investment
Income | | Distributions
from
Realized
Capital Gains | | Distributions
from
Return
of Capital | | Total
Distributions | | Net
Asset
Value,
End of
Year/
Period | | Total
Return5 | | Net
Assets,
End of
Year/
Period
(000's
omitted) | | Net
Expenses2,6 | | Total
Expenses2 | | Net Investment
Income (Loss)
after Expense
Reimbursement2 | | Net
Expenses3,6 | | Total
Expenses3 | | Net Investment
Income (Loss)
after Expense
Reimbursement3 | | Portfolio
Turnover
Rate8 | |
Direxion Daily MSCI Emerging Markets Bull 3X Shares | |
For the Year Ended October 31, 2022 | | $ | 81.27 | | | $ | 0.37 | | | $ | 0.38 | | | $ | (60.00 | ) | | $ | (59.63 | ) | | $ | — | | | $ | — | | | $ | — | | | $ | — | | | $ | 21.64 | | | | -73.37 | % | | $ | 49,367 | | | | 0.96 | % | | | 0.97 | % | | | 0.74 | % | | | 0.95 | % | | | 0.96 | % | | | 0.75 | % | | | 262 | % | |
| For the Year Ended October 31, 2021 | | | 59.82 | | | | (0.15 | ) | | | (0.14 | ) | | | 21.73 | | | | 21.58 | | | | (0.09 | ) | | | — | | | | (0.04 | ) | | | (0.13 | ) | | | 81.27 | | | | 36.04 | % | | | 169,181 | | | | 0.96 | % | | | 0.94 | % | | | (0.16 | )% | | | 0.95 | % | | | 0.93 | % | | | (0.15 | )% | | | 87 | % | |
| For the Year Ended October 31, 2020 | | | 73.05 | | | | 0.27 | | | | 0.31 | | | | (13.07 | ) | | | (12.80 | ) | | | (0.43 | ) | | | — | | | | — | | | | (0.43 | ) | | | 59.82 | | | | -16.88 | % | | | 136,479 | | | | 1.02 | % | | | 1.04 | % | | | 0.46 | % | | | 0.95 | % | | | 0.97 | % | | | 0.53 | % | | | 192 | % | |
| For the Year Ended October 31, 2019 | | | 62.74 | | | | 0.90 | | | | 0.96 | | | | 10.28 | | | | 11.18 | | | | (0.87 | ) | | | — | | | | — | | | | (0.87 | ) | | | 73.05 | | | | 17.72 | % | | | 188,596 | | | | 1.04 | % | | | 1.06 | % | | | 1.24 | % | | | 0.95 | % | | | 0.97 | % | | | 1.33 | % | | | 66 | % | |
| For the Year Ended October 31, 2018 | | | 115.85 | | | | 1.02 | | | | 1.05 | | | | (53.34 | ) | | | (52.32 | ) | | | (0.77 | ) | | | — | | | | (0.02 | ) | | | (0.79 | ) | | | 62.74 | | | | -45.51 | % | | | 202,745 | | | | 0.98 | % | | | 0.99 | % | | | 0.94 | % | | | 0.95 | % | | | 0.96 | % | | | 0.97 | % | | | 136 | % | |
Direxion Daily MSCI Emerging Markets Bear 3X Shares | |
| For the Year Ended October 31, 2022 | | | 9.03 | | | | (0.00 | )9 | | | 0.02 | | | | 11.92 | | | | 11.92 | | | | — | | | | — | | | | — | | | | — | | | | 20.95 | | | | 132.00 | % | | | 56,453 | | | | 1.10 | % | | | 1.23 | % | | | 0.00 | % | | | 0.95 | % | | | 1.08 | % | | | 0.15 | % | | | 0 | % | |
| For the Year Ended October 31, 2021 | | | 17.25 | | | | (0.08 | ) | | | (0.08 | ) | | | (8.14 | ) | | | (8.22 | ) | | | — | | | | — | | | | — | | | | — | | | | 9.03 | | | | -47.65 | % | | | 26,590 | | | | 0.95 | % | | | 1.17 | % | | | (0.93 | )% | | | 0.95 | % | | | 1.17 | % | | | (0.93 | )% | | | 0 | % | |
| For the Year Ended October 31, 2020 | | | 42.02 | | | | (0.04 | ) | | | (0.03 | ) | | | (24.56 | ) | | | (24.60 | ) | | | (0.11 | ) | | | — | | | | (0.06 | ) | | | (0.17 | ) | | | 17.25 | | | | -58.79 | % | | | 38,720 | | | | 0.98 | % | | | 1.08 | % | | | (0.12 | )% | | | 0.95 | % | | | 1.05 | % | | | (0.09 | )% | | | 0 | % | |
| For the Year Ended October 31, 2019 | | | 64.78 | | | | 0.63 | | | | 0.67 | | | | (22.66 | ) | | | (22.03 | ) | | | (0.73 | ) | | | — | | | | — | | | | (0.73 | ) | | | 42.02 | | | | -34.15 | % | | | 62,837 | | | | 1.02 | % | | | 1.08 | % | | | 1.32 | % | | | 0.95 | % | | | 1.01 | % | | | 1.39 | % | | | 0 | % | |
| For the Year Ended October 31, 2018 | | | 50.55 | | | | 0.30 | | | | 0.32 | | | | 14.09 | | | | 14.39 | | | | (0.16 | ) | | | — | | | | — | | | | (0.16 | ) | | | 64.78 | | | | 28.60 | % | | | 90,383 | | | | 0.99 | % | | | 1.03 | % | | | 0.64 | % | | | 0.95 | % | | | 0.99 | % | | | 0.68 | % | | | 0 | % | |
Direxion Daily MSCI Mexico Bull 3X Shares | |
| For the Year Ended October 31, 2022 | | | 83.10 | | | | 1.05 | | | | 1.07 | | | | 4.13 | | | | 5.18 | | | | (0.82 | ) | | | — | | | | — | | | | (0.82 | ) | | | 87.46 | | | | 6.35 | % | | | 11,650 | | | | 0.98 | % | | | 1.09 | % | | | 1.27 | % | | | 0.95 | % | | | 1.06 | % | | | 1.30 | % | | | 25 | % | |
| For the Year Ended October 31, 2021 | | | 31.99 | | | | (0.03 | ) | | | (0.02 | ) | | | 51.33 | | | | 51.30 | | | | (0.19 | ) | | | — | | | | — | | | | (0.19 | ) | | | 83.10 | | | | 160.49 | % | | | 15,225 | | | | 0.96 | % | | | 0.99 | % | | | (0.04 | )% | | | 0.95 | % | | | 0.98 | % | | | (0.03 | )% | | | 180 | % | |
| For the Year Ended October 31, 2020 | | | 130.32 | | | | 0.08 | | | | 0.12 | | | | (97.90 | ) | | | (97.82 | ) | | | (0.42 | ) | | | — | | | | (0.09 | ) | | | (0.51 | ) | | | 31.99 | | | | -75.36 | % | | | 10,660 | | | | 1.03 | % | | | 1.26 | % | | | 0.18 | % | | | 0.95 | % | | | 1.18 | % | | | 0.26 | % | | | 188 | % | |
| For the Year Ended October 31, 2019 | | | 128.28 | | | | 2.04 | | | | 2.16 | | | | 2.28 | | | | 4.32 | | | | (2.28 | ) | | | — | | | | — | | | | (2.28 | ) | | | 130.32 | | | | 3.42 | % | | | 11,400 | | | | 1.05 | % | | | 1.20 | % | | | 1.69 | % | | | 0.95 | % | | | 1.10 | % | | | 1.79 | % | | | 325 | % | |
| For the Year Ended October 31, 2018 | | | 261.96 | | | | 3.48 | | | | 3.48 | | | | (130.56 | ) | | | (127.08 | ) | | | (6.60 | ) | | | — | | | | — | | | | (6.60 | ) | | | 128.28 | | | | -49.66 | % | | | 4,809 | | | | 0.96 | % | | | 1.13 | % | | | 1.50 | % | | | 0.95 | % | | | 1.12 | % | | | 1.51 | % | | | 140 | % | |
Direxion Daily MSCI South Korea Bull 3X Shares | |
| For the Year Ended October 31, 2022 | | | 26.12 | | | | 0.11 | | | | 0.11 | | | | (20.04 | ) | | | (19.93 | ) | | | (0.14 | ) | | | — | | | | (0.05 | ) | | | (0.19 | ) | | | 6.00 | | | | -76.86 | % | | | 20,094 | | | | 0.96 | % | | | 1.01 | % | | | 0.78 | % | | | 0.95 | % | | | 1.00 | % | | | 0.79 | % | | | 27 | % | |
| For the Year Ended October 31, 2021 | | | 16.66 | | | | (0.27 | ) | | | (0.27 | ) | | | 9.73 | | | | 9.46 | | | | (0.00 | )10 | | | — | | | | — | | | | (0.00 | )10 | | | 26.12 | | | | 56.80 | % | | | 47,022 | | | | 0.96 | % | | | 0.97 | % | | | (0.73 | )% | | | 0.95 | % | | | 0.96 | % | | | (0.72 | )% | | | 97 | % | |
| For the Year Ended October 31, 2020 | | | 21.32 | | | | (0.00 | )10 | | | 0.01 | | | | (4.47 | ) | | | (4.47 | ) | | | (0.19 | ) | | | — | | | | — | | | | (0.19 | ) | | | 16.66 | | | | -21.27 | % | | | 25,821 | | | | 1.01 | % | | | 1.15 | % | | | (0.02 | )% | | | 0.95 | % | | | 1.09 | % | | | 0.04 | % | | | 327 | % | |
| For the Year Ended October 31, 2019 | | | 24.13 | | | | 0.16 | | | | 0.18 | | | | (2.78 | ) | | | (2.62 | ) | | | (0.19 | ) | | | — | | | | — | | | | (0.19 | ) | | | 21.32 | | | | -10.93 | % | | | 25,580 | | | | 1.04 | % | | | 1.10 | % | | | 0.71 | % | | | 0.95 | % | | | 1.01 | % | | | 0.80 | % | | | 149 | % | |
| For the Year Ended October 31, 2018 | | | 60.22 | | | | 0.36 | | | | 0.39 | | | | (34.01 | ) | | | (33.65 | ) | | | (0.60 | ) | | | (1.84 | ) | | | — | | | | (2.44 | ) | | | 24.13 | | | | -58.26 | % | | | 22,924 | | | | 1.03 | % | | | 1.16 | % | | | 0.76 | % | | | 0.95 | % | | | 1.08 | % | | | 0.84 | % | | | 96 | % | |
Direxion Daily Aerospace & Defense Bull 3X Shares | |
| For the Year Ended October 31, 2022 | | | 20.58 | | | | 0.04 | | | | 0.04 | | | | (2.12 | ) | | | (2.08 | ) | | | (0.04 | ) | | | (0.34 | ) | | | — | | | | (0.38 | ) | | | 18.12 | | | | -10.07 | % | | | 194,780 | | | | 0.98 | % | | | 0.97 | % | | | 0.19 | % | | | 0.94 | % | | | 0.93 | % | | | 0.23 | % | | | 77 | % | |
| For the Year Ended October 31, 2021 | | | 8.87 | | | | (0.03 | ) | | | (0.03 | ) | | | 11.75 | | | | 11.72 | | | | (0.01 | ) | | | — | | | | — | | | | (0.01 | ) | | | 20.58 | | | | 132.19 | % | | | 280,890 | | | | 0.96 | % | | | 0.93 | % | | | (0.17 | )% | | | 0.95 | % | | | 0.92 | % | | | (0.16 | )% | | | 64 | % | |
| For the Year Ended October 31, 2020 | | | 55.54 | | | | 0.01 | | | | (0.01 | ) | | | (46.58 | ) | | | (46.57 | ) | | | (0.06 | ) | | | — | | | | (0.04 | ) | | | (0.10 | ) | | | 8.87 | | | | -83.86 | % | | | 199,485 | | | | 0.99 | % | | | 1.02 | % | | | 0.07 | % | | | 0.95 | % | | | 0.98 | % | | | 0.11 | % | | | 159 | % | |
| For the Year Ended October 31, 2019 | | | 42.15 | | | | 0.30 | | | | 0.46 | | | | 13.43 | | | | 13.73 | | | | (0.34 | ) | | | — | | | | — | | | | (0.34 | ) | | | 55.54 | | | | 32.78 | % | | | 52,759 | | | | 1.30 | % | | | 1.34 | % | | | 0.63 | % | | | 0.95 | % | | | 0.99 | % | | | 0.98 | % | | | 54 | % | |
| For the Year Ended October 31, 2018 | | | 40.03 | | | | 0.20 | | | | 0.27 | | | | 2.81 | | | | 3.01 | | | | (0.26 | ) | | | (0.63 | ) | | | — | | | | (0.89 | ) | | | 42.15 | | | | 7.39 | % | | | 56,900 | | | | 1.09 | % | | | 1.11 | % | | | 0.40 | % | | | 0.95 | % | | | 0.97 | % | | | 0.54 | % | | | 39 | % | |
Direxion Daily Consumer Discretionary Bull 3X Shares | |
| For the Year Ended October 31, 2022 | | | 92.11 | | | | (0.12 | ) | | | (0.08 | ) | | | (68.51 | ) | | | (68.63 | ) | | | — | | | | — | | | | — | | | | — | | | | 23.48 | | | | -74.51 | % | | | 24,653 | | | | 1.03 | % | | | 1.06 | % | | | (0.25 | )% | | | 0.95 | % | | | 0.98 | % | | | (0.17 | )% | | | 149 | % | |
| For the Year Ended October 31, 2021 | | | 36.13 | | | | (0.33 | ) | | | (0.33 | ) | | | 56.31 | | | | 55.98 | | | | — | | | | — | | | | — | | | | — | | | | 92.11 | | | | 154.94 | % | | | 55,264 | | | | 0.96 | % | | | 0.99 | % | | | (0.54 | )% | | | 0.95 | % | | | 0.98 | % | | | (0.53 | )% | | | 18 | % | |
| For the Year Ended October 31, 2020 | | | 31.74 | | | | (0.06 | ) | | | (0.05 | ) | | | 4.52 | | | | 4.46 | | | | (0.07 | ) | | | — | | | | — | | | | (0.07 | ) | | | 36.13 | | | | 14.26 | % | | | 12,647 | | | | 1.00 | % | | | 1.46 | % | | | (0.20 | )% | | | 0.95 | % | | | 1.41 | % | | | (0.15 | )% | | | 101 | % | |
For the Period November 29, 20189 through
October 31, 2019 | | | 25.00 | | | | 0.15 | | | | 0.18 | | | | 6.79 | | | | 6.94 | | | | (0.17 | ) | | | — | | | | (0.03 | ) | | | (0.20 | ) | | | 31.74 | | | | 27.83 | % | | | 6,347 | | | | 1.08 | % | | | 2.18 | % | | | 0.55 | % | | | 0.95 | % | | | 2.05 | % | | | 0.68 | % | | | 66 | % | |
Direxion Daily Dow Jones Internet Bull 3X Shares | |
| For the Year Ended October 31, 2022 | | | 86.93 | | | | (0.07 | ) | | | (0.06 | ) | | | (76.60 | ) | | | (76.67 | ) | | | — | | | | (3.05 | ) | | | — | | | | (3.05 | ) | | | 7.21 | | | | -91.32 | % | | | 103,100 | | | | 0.98 | % | | | 0.99 | % | | | (0.39 | )% | | | 0.95 | % | | | 0.96 | % | | | (0.36 | )% | | | 55 | % | |
| For the Year Ended October 31, 2021 | | | 45.47 | | | | (0.62 | ) | | | (0.62 | ) | | | 42.08 | | | | 41.46 | | | | — | | | | — | | | | — | | | | — | | | | 86.93 | | | | 91.18 | % | | | 99,968 | | | | 0.96 | % | | | 0.96 | % | | | (0.81 | )% | | | 0.95 | % | | | 0.95 | % | | | (0.80 | )% | | | 65 | % | |
For the Period November 7, 20199 through
October 31, 2020 | | | 25.00 | | | | (0.25 | ) | | | (0.24 | ) | | | 20.74 | | | | 20.49 | | | | (0.02 | ) | | | — | | | | — | | | | (0.02 | ) | | | 45.47 | | | | 81.99 | % | | | 34,100 | | | | 0.97 | % | | | 1.14 | % | | | (0.66 | )% | | | 0.95 | % | | | 1.12 | % | | | (0.64 | )% | | | 123 | % | |
Direxion Daily Dow Jones Internet Bear 3X Shares | |
| For the Year Ended October 31, 2022 | | | 14.39 | | | | 0.17 | | | | 0.20 | | | | 23.67 | | | | 23.84 | | | | (0.01 | ) | | | — | | | | — | | | | (0.01 | ) | | | 38.22 | | | | 165.69 | % | | | 56,183 | | | | 1.06 | % | | | 1.11 | % | | | 0.49 | % | | | 0.95 | % | | | 1.00 | % | | | 0.60 | % | | | 0 | % | |
| For the Year Ended October 31, 2021 | | | 44.23 | | | | (0.18 | ) | | | (0.18 | ) | | | (29.66 | ) | | | (29.84 | ) | | | — | | | | — | | | | — | | | | — | | | | 14.39 | | | | -67.47 | % | | | 4,604 | | | | 0.95 | % | | | 1.56 | % | | | (0.93 | )% | | | 0.95 | % | | | 1.56 | % | | | (0.93 | )% | | | 0 | % | |
For the Period November 7, 20199 through
October 31, 2020 | | | 250.00 | | | | (0.24 | ) | | | (0.23 | ) | | | (204.96 | ) | | | (205.20 | ) | | | (0.28 | ) | | | — | | | | (0.29 | ) | | | (0.57 | ) | | | 44.23 | | | | -82.26 | % | | | 5,305 | | | | 0.96 | % | | | 2.14 | % | | | (0.30 | )% | | | 0.95 | % | | | 2.13 | % | | | (0.29 | )% | | | 0 | % | |
The accompanying notes are an integral part of these financial statements.
DIREXION ANNUAL REPORT
165
Financial Highlights
October 31, 2022
| | | | | RATIOS TO AVERAGE NET ASSETS7 | | | |
| | | Net Asset
Value,
Beginning
of Year/
Period | | Net
Investment
Income
(Loss)1,2 | | Net
Investment
Income
(Loss)1,3 | | Net Realized
and Unrealized
Gain (Loss)
on Investments4 | | Net Increase
(Decrease) in
Net Asset
Value Resulting
from Operations | | Dividends
from Net
Investment
Income | | Distributions
from
Realized
Capital Gains | | Distributions
from
Return
of Capital | | Total
Distributions | | Net
Asset
Value,
End of
Year/
Period | | Total
Return5 | | Net
Assets,
End of
Year/
Period
(000's
omitted) | | Net
Expenses2,6 | | Total
Expenses2 | | Net Investment
Income (Loss)
after Expense
Reimbursement2 | | Net
Expenses3,6 | | Total
Expenses3 | | Net Investment
Income (Loss)
after Expense
Reimbursement3 | | Portfolio
Turnover
Rate8 | |
Direxion Daily Financial Bull 3X Shares | |
For the Year Ended October 31, 2022 | | $ | 144.45 | | | $ | 0.81 | | | $ | 0.83 | | | $ | (70.93 | ) | | $ | (70.12 | ) | | $ | (0.70 | ) | | $ | — | | | $ | — | | | $ | (0.70 | ) | | $ | 73.63 | | | | -48.61 | % | | $ | 1,892,223 | | | | 0.89 | % | | | 0.93 | % | | | 0.82 | % | | | 0.87 | % | | | 0.91 | % | | | 0.84 | % | | | 109 | % | |
| For the Year Ended October 31, 2021 | | | 33.61 | | | | 0.52 | | | | 0.53 | | | | 110.82 | | | | 111.34 | | | | (0.50 | ) | | | — | | | | — | | | | (0.50 | ) | | | 144.45 | | | | 332.26 | % | | | 3,582,160 | | | | 0.86 | % | | | 0.91 | % | | | 0.56 | % | | | 0.85 | % | | | 0.90 | % | | | 0.57 | % | | | 70 | % | |
| For the Year Ended October 31, 2020 | | | 80.94 | | | | 0.32 | | | | 0.36 | | | | (47.34 | ) | | | (47.02 | ) | | | (0.31 | ) | | | — | | | | — | | | | (0.31 | ) | | | 33.61 | | | | -58.07 | % | | | 1,347,638 | | | | 1.03 | % | | | 1.03 | % | | | 0.73 | % | | | 0.94 | % | | | 0.94 | % | | | 0.82 | % | | | 247 | % | |
| For the Year Ended October 31, 2019 | | | 58.65 | | | | 0.68 | | | | 0.88 | | | | 22.25 | | | | 22.93 | | | | (0.64 | ) | | | — | | | | (0.00 | )10 | | | (0.64 | ) | | | 80.94 | | | | 39.44 | % | | | 1,339,498 | | | | 1.26 | % | | | 1.25 | % | | | 1.04 | % | | | 0.95 | % | | | 0.94 | % | | | 1.35 | % | | | 29 | % | |
| For the Year Ended October 31, 2018 | | | 60.31 | | | | 0.60 | | | | 0.67 | | | | (1.70 | ) | | | (1.10 | ) | | | (0.56 | ) | | | — | | | | — | | | | (0.56 | ) | | | 58.65 | | | | -1.98 | % | | | 1,627,513 | | | | 1.04 | % | | | 1.05 | % | | | 0.89 | % | | | 0.94 | % | | | 0.95 | % | | | 0.99 | % | | | 73 | % | |
Direxion Daily Financial Bear 3X Shares | |
| For the Year Ended October 31, 2022 | | | 18.33 | | | | 0.01 | | | | 0.03 | | | | 2.16 | | | | 2.17 | | | | — | | | | — | | | | — | | | | — | | | | 20.50 | | | | 11.84 | % | | | 190,690 | | | | 1.04 | % | | | 1.01 | % | | | 0.05 | % | | | 0.95 | % | | | 0.92 | % | | | 0.14 | % | | | 0 | % | |
| For the Year Ended October 31, 2021 | | | 118.00 | | | | (0.33 | ) | | | (0.33 | ) | | | (99.34 | ) | | | (99.67 | ) | | | — | | | | — | | | | — | | | | — | | | | 18.33 | | | | -84.47 | % | | | 130,234 | | | | 0.95 | % | | | 0.92 | % | | | (0.93 | )% | | | 0.95 | % | | | 0.92 | % | | | (0.93 | )% | | | 0 | % | |
| For the Year Ended October 31, 2020 | | | 261.76 | | | | (0.88 | ) | | | (0.80 | ) | | | (141.92 | ) | | | (142.80 | ) | | | (0.64 | ) | | | — | | | | (0.32 | ) | | | (0.96 | ) | | | 118.00 | | | | -54.76 | % | | | 271,668 | | | | 0.96 | % | | | 0.98 | % | | | (0.48 | )% | | | 0.95 | % | | | 0.97 | % | | | (0.47 | )% | | | 0 | % | |
| For the Year Ended October 31, 2019 | | | 449.20 | | | | 4.72 | | | | 4.88 | | | | (187.52 | ) | | | (182.80 | ) | | | (4.64 | ) | | | — | | | | — | | | | (4.64 | ) | | | 261.76 | | | | -40.98 | % | | | 175,801 | | | | 0.99 | % | | | 1.00 | % | | | 1.37 | % | | | 0.95 | % | | | 0.96 | % | | | 1.41 | % | | | 0 | % | |
| For the Year Ended October 31, 2018 | | | 538.40 | | | | 2.80 | | | | 2.80 | | | | (90.40 | ) | | | (87.60 | ) | | | (1.60 | ) | | | — | | | | — | | | | (1.60 | ) | | | 449.20 | | | | -16.26 | % | | | 141,799 | | | | 0.95 | % | | | 0.96 | % | | | 0.69 | % | | | 0.95 | % | | | 0.96 | % | | | 0.69 | % | | | 0 | % | |
Direxion Daily Healthcare Bull 3X Shares | |
| For the Year Ended October 31, 2022 | | | 123.96 | | | | 0.40 | | | | 0.44 | | | | (15.12 | ) | | | (14.72 | ) | | | (0.33 | ) | | | — | | | | — | | | | (0.33 | ) | | | 108.91 | | | | -11.85 | % | | | 196,030 | | | | 0.98 | % | | | 0.96 | % | | | 0.35 | % | | | 0.95 | % | | | 0.93 | % | | | 0.38 | % | | | 16 | % | |
| For the Year Ended October 31, 2021 | | | 55.70 | | | | (0.04 | ) | | | (0.04 | ) | | | 68.31 | | | | 68.27 | | | | (0.01 | ) | | | — | | | | — | | | | (0.01 | ) | | | 123.96 | | | | 122.57 | % | | | 254,116 | | | | 0.96 | % | | | 0.94 | % | | | (0.05 | )% | | | 0.95 | % | | | 0.93 | % | | | (0.04 | )% | | | 2 | % | |
| For the Year Ended October 31, 2020 | | | 58.15 | | | | 0.12 | | | | 0.16 | | | | (2.44 | ) | | | (2.32 | ) | | | (0.13 | ) | | | — | | | | — | | | | (0.13 | ) | | | 55.70 | | | | -3.85 | % | | | 103,039 | | | | 1.01 | % | | | 1.04 | % | | | 0.20 | % | | | 0.95 | % | | | 0.98 | % | | | 0.26 | % | | | 228 | % | |
| For the Year Ended October 31, 2019 | | | 53.02 | | | | 0.40 | | | | 0.46 | | | | 5.16 | | | | 5.56 | | | | (0.43 | ) | | | — | | | | — | | | | (0.43 | ) | | | 58.15 | | | | 10.61 | % | | | 139,550 | | | | 1.07 | % | | | 1.08 | % | | | 0.75 | % | | | 0.95 | % | | | 0.96 | % | | | 0.87 | % | | | 16 | % | |
| For the Year Ended October 31, 2018 | | | 44.17 | | | | 0.20 | | | | 0.25 | | | | 8.94 | | | | 9.14 | | | | (0.27 | ) | | | (0.02 | ) | | | — | | | | (0.29 | ) | | | 53.02 | | | | 20.69 | % | | | 151,104 | | | | 1.06 | % | | | 1.07 | % | | | 0.40 | % | | | 0.95 | % | | | 0.96 | % | | | 0.51 | % | | | 43 | % | |
Direxion Daily Homebuilders & Supplies Bull 3X Shares | |
| For the Year Ended October 31, 2022 | | | 83.28 | | | | (0.01 | ) | | | 0.02 | | | | (57.04 | ) | | | (57.05 | ) | | | — | | | | — | | | | — | | | | — | | | | 26.23 | | | | -68.50 | % | | | 131,145 | | | | 0.97 | % | | | 0.97 | % | | | (0.01 | )% | | | 0.93 | % | | | 0.93 | % | | | 0.03 | % | | | 98 | % | |
| For the Year Ended October 31, 2021 | | | 39.58 | | | | (0.25 | ) | | | (0.24 | ) | | | 43.95 | | | | 43.70 | | | | — | | | | — | | | | — | | | | — | | | | 83.28 | | | | 110.41 | % | | | 383,075 | | | | 0.96 | % | | | 0.94 | % | | | (0.37 | )% | | | 0.94 | % | | | 0.92 | % | | | (0.35 | )% | | | 95 | % | |
| For the Year Ended October 31, 2020 | | | 70.39 | | | | (0.12 | ) | | | (0.10 | ) | | | (30.69 | ) | | | (30.81 | ) | | | (0.00 | )10 | | | — | | | | — | | | | (0.00 | )10 | | | 39.58 | | | | -43.74 | % | | | 360,141 | | | | 1.01 | % | | | 1.02 | % | | | (0.34 | )% | | | 0.95 | % | | | 0.96 | % | | | (0.28 | )% | | | 134 | % | |
| For the Year Ended October 31, 2019 | | | 28.33 | | | | 0.15 | | | | 0.22 | | | | 42.09 | | | | 42.24 | | | | (0.17 | ) | | | — | | | | (0.01 | ) | | | (0.18 | ) | | | 70.39 | | | | 149.83 | % | | | 66,870 | | | | 1.12 | % | | | 1.17 | % | | | 0.34 | % | | | 0.95 | % | | | 1.00 | % | | | 0.51 | % | | | 24 | % | |
| For the Year Ended October 31, 2018 | | | 71.69 | | | | 0.05 | | | | 0.08 | | | | (42.24 | ) | | | (42.19 | ) | | | (0.02 | ) | | | (1.15 | ) | | | — | | | | (1.17 | ) | | | 28.33 | | | | -59.92 | % | | | 39,667 | | | | 0.99 | % | | | 1.03 | % | | | 0.09 | % | | | 0.95 | % | | | 0.99 | % | | | 0.13 | % | | | 38 | % | |
Direxion Daily Industrials Bull 3X Shares | |
| For the Year Ended October 31, 2022 | | | 45.37 | | | | 0.12 | | | | 0.13 | | | | (16.33 | ) | | | (16.21 | ) | | | (0.12 | ) | | | — | | | | — | | | | (0.12 | ) | | | 29.04 | | | | -35.71 | % | | | 18,873 | | | | 0.97 | % | | | 1.01 | % | | | 0.33 | % | | | 0.95 | % | | | 0.99 | % | | | 0.35 | % | | | 20 | % | |
| For the Year Ended October 31, 2021 | | | 18.48 | | | | (0.00 | )10 | | | (0.00 | )10 | | | 26.96 | | | | 26.96 | | | | (0.03 | ) | | | (0.04 | ) | | | — | | | | (0.07 | ) | | | 45.37 | | | | 146.14 | % | | | 63,520 | | | | 0.96 | % | | | 0.96 | % | | | (0.01 | )% | | | 0.95 | % | | | 0.95 | % | | | 0.00 | % | | | 3 | % | |
| For the Year Ended October 31, 2020 | | | 32.94 | | | | 0.05 | | | | 0.06 | | | | (14.36 | ) | | | (14.31 | ) | | | (0.15 | ) | | | — | | | | — | | | | (0.15 | ) | | | 18.48 | | | | -43.33 | % | | | 16,636 | | | | 0.97 | % | | | 1.44 | % | | | 0.27 | % | | | 0.95 | % | | | 1.42 | % | | | 0.29 | % | | | 103 | % | |
| For the Year Ended October 31, 2019 | | | 26.25 | | | | 0.37 | | | | 0.39 | | | | 6.75 | | | | 7.12 | | | | (0.43 | ) | | | — | | | | — | | | | (0.43 | ) | | | 32.94 | | | | 27.57 | % | | | 3,294 | | | | 1.03 | % | | | 1.84 | % | | | 1.25 | % | | | 0.95 | % | | | 1.76 | % | | | 1.33 | % | | | 228 | % | |
| For the Year Ended October 31, 2018 | | | 30.93 | | | | 0.22 | | | | 0.25 | | | | (4.54 | ) | | | (4.32 | ) | | | (0.27 | ) | | | (0.09 | ) | | | — | | | | (0.36 | ) | | | 26.25 | | | | -14.26 | % | | | 3,937 | | | | 1.05 | % | | | 1.58 | % | | | 0.62 | % | | | 0.95 | % | | | 1.48 | % | | | 0.72 | % | | | 26 | % | |
Direxion Daily Pharmaceutical & Medical Bull 3X Shares | |
| For the Year Ended October 31, 2022 | | | 18.11 | | | | 0.03 | | | | 0.04 | | | | (7.95 | ) | | | (7.92 | ) | | | (0.03 | ) | | | — | | | | — | | | | (0.03 | ) | | | 10.16 | | | | -43.75 | % | | | 11,173 | | | | 0.98 | % | | | 1.11 | % | | | 0.25 | % | | | 0.95 | % | | | 1.08 | % | | | 0.28 | % | | | 189 | % | |
| For the Year Ended October 31, 2021 | | | 15.76 | | | | (0.09 | ) | | | (0.08 | ) | | | 2.44 | | | | 2.35 | | | | — | | | | — | | | | — | | | | — | | | | 18.11 | | | | 14.91 | % | | | 31,693 | | | | 0.95 | % | | | 1.07 | % | | | (0.39 | )% | | | 0.95 | % | | | 1.07 | % | | | (0.39 | )% | | | 115 | % | |
| For the Year Ended October 31, 2020 | | | 15.66 | | | | (0.06 | ) | | | (0.04 | ) | | | 0.16 | | | | 0.10 | | | | (0.00 | )10 | | | — | | | | — | | | | (0.00 | )10 | | | 15.76 | | | | 0.64 | % | | | 11,029 | | | | 1.03 | % | | | 1.38 | % | | | (0.34 | )% | | | 0.95 | % | | | 1.30 | % | | | (0.26 | )% | | | 165 | % | |
| For the Year Ended October 31, 2019 | | | 26.53 | | | | 0.12 | | | | 0.12 | | | | (10.80 | ) | | | (10.68 | ) | | | (0.18 | ) | | | — | | | | (0.01 | ) | | | (0.19 | ) | | | 15.66 | | | | -40.41 | % | | | 8,611 | | | | 0.97 | % | | | 1.43 | % | | | 0.72 | % | | | 0.95 | % | | | 1.41 | % | | | 0.74 | % | | | 246 | % | |
For the Period November 15, 20179 through
October 31, 2018 | | | 25.00 | | | | 0.08 | | | | 0.09 | | | | 1.56 | | | | 1.64 | | | | (0.10 | ) | | | — | | | | (0.01 | ) | | | (0.11 | ) | | | 26.53 | | | | 6.49 | % | | | 3,979 | | | | 0.98 | % | | | 2.01 | % | | | 0.30 | % | | | 0.95 | % | | | 1.98 | % | | | 0.33 | % | | | 152 | % | |
Direxion Daily Real Estate Bull 3X Shares | |
| For the Year Ended October 31, 2022 | | | 26.14 | | | | 0.25 | | | | 0.26 | | | | (15.16 | ) | | | (14.91 | ) | | | (0.25 | ) | | | (1.13 | ) | | | — | | | | (1.38 | ) | | | 9.85 | | | | -60.04 | % | | | 47,268 | | | | 0.98 | % | | | 0.97 | % | | | 1.24 | % | | | 0.95 | % | | | 0.94 | % | | | 1.27 | % | | | 84 | % | |
| For the Year Ended October 31, 2021 | | | 9.03 | | | | 0.22 | | | | 0.22 | | | | 17.08 | | | | 17.30 | | | | (0.19 | ) | | | — | | | | — | | | | (0.19 | ) | | | 26.14 | | | | 192.60 | % | | | 147,704 | | | | 0.96 | % | | | 0.94 | % | | | 1.18 | % | | | 0.95 | % | | | 0.93 | % | | | 1.19 | % | | | 20 | % | |
| For the Year Ended October 31, 2020 | | | 30.84 | | | | 0.19 | | | | 0.19 | | | | (21.40 | ) | | | (21.21 | ) | | | (0.17 | ) | | | (0.40 | ) | | | (0.03 | ) | | | (0.60 | ) | | | 9.03 | | | | -69.35 | % | | | 49,659 | | | | 1.01 | % | | | 1.08 | % | | | 1.40 | % | | | 0.95 | % | | | 1.02 | % | | | 1.46 | % | | | 123 | % | |
| For the Year Ended October 31, 2019 | | | 19.59 | | | | 0.54 | | | | 0.59 | | | | 11.20 | | | | 11.74 | | | | (0.49 | ) | | | — | | | | — | | | | (0.49 | ) | | | 30.84 | | | | 60.83 | % | | | 53,969 | | | | 1.14 | % | | | 1.22 | % | | | 2.21 | % | | | 0.95 | % | | | 1.03 | % | | | 2.40 | % | | | 72 | % | |
| For the Year Ended October 31, 2018 | | | 21.70 | | | | 0.50 | | | | 0.53 | | | | (2.01 | ) | | | (1.51 | ) | | | (0.48 | ) | | | — | | | | (0.12 | ) | | | (0.60 | ) | | | 19.59 | | | | -7.13 | % | | | 40,163 | | | | 1.09 | % | | | 1.12 | % | | | 2.55 | % | | | 0.95 | % | | | 0.98 | % | | | 2.69 | % | | | 149 | % | |
The accompanying notes are an integral part of these financial statements.
DIREXION ANNUAL REPORT
166
Financial Highlights
October 31, 2022
| | | | | RATIOS TO AVERAGE NET ASSETS7 | | | |
| | | Net Asset
Value,
Beginning
of Year/
Period | | Net
Investment
Income
(Loss)1,2 | | Net
Investment
Income
(Loss)1,3 | | Net Realized
and Unrealized
Gain (Loss)
on Investments4 | | Net Increase
(Decrease) in
Net Asset
Value Resulting
from Operations | | Dividends
from Net
Investment
Income | | Distributions
from
Realized
Capital Gains | | Distributions
from
Return
of Capital | | Total
Distributions | | Net
Asset
Value,
End of
Year/
Period | | Total
Return5 | | Net
Assets,
End of
Year/
Period
(000's
omitted) | | Net
Expenses2,6 | | Total
Expenses2 | | Net Investment
Income (Loss)
after Expense
Reimbursement2 | | Net
Expenses3,6 | | Total
Expenses3 | | Net Investment
Income (Loss)
after Expense
Reimbursement3 | | Portfolio
Turnover
Rate8 | |
Direxion Daily Real Estate Bear 3X Shares | |
For the Year Ended October 31, 2022 | | $ | 41.07 | | | $ | 0.37 | | | $ | 0.40 | | | $ | 19.27 | | | $ | 19.64 | | | $ | — | | | $ | — | | | $ | — | | | $ | — | | | $ | 60.71 | | | | 47.82 | % | | $ | 205,433 | | | | 1.01 | % | | | 1.03 | % | | | 0.75 | % | | | 0.95 | % | | | 0.97 | % | | | 0.81 | % | | | 0 | % | |
| For the Year Ended October 31, 2021 | | | 153.40 | | | | (0.64 | ) | | | (0.64 | ) | | | (111.69 | ) | | | (112.33 | ) | | | — | | | | — | | | | — | | | | — | | | | 41.07 | | | | -73.23 | % | | | 19,926 | | | | 0.95 | % | | | 1.17 | % | | | (0.93 | )% | | | 0.95 | % | | | 1.17 | % | | | (0.93 | )% | | | 0 | % | |
| For the Year Ended October 31, 2020 | | | 257.60 | | | | (1.10 | ) | | | (1.10 | ) | | | (102.20 | ) | | | (103.30 | ) | | | (0.60 | ) | | | — | | | | (0.30 | ) | | | (0.90 | ) | | | 153.40 | | | | -40.31 | % | | | 45,283 | | | | 0.96 | % | | | 1.14 | % | | | (0.60 | )% | | | 0.95 | % | | | 1.13 | % | | | (0.59 | )% | | | 0 | % | |
| For the Year Ended October 31, 2019 | | | 502.00 | | | | 5.00 | | | | 5.00 | | | | (244.60 | ) | | | (239.60 | ) | | | (4.80 | ) | | | — | | | | — | | | | (4.80 | ) | | | 257.60 | | | | -47.94 | % | | | 15,495 | | | | 0.97 | % | | | 1.28 | % | | | 1.41 | % | | | 0.95 | % | | | 1.26 | % | | | 1.43 | % | | | 0 | % | |
| For the Year Ended October 31, 2018 | | | 564.00 | | | | 4.00 | | | | 4.00 | | | | (64.50 | ) | | | (60.50 | ) | | | (1.50 | ) | | | — | | | | — | | | | (1.50 | ) | | | 502.00 | | | | -10.68 | % | | | 19,156 | | | | 0.99 | % | | | 1.36 | % | | | 0.71 | % | | | 0.95 | % | | | 1.32 | % | | | 0.75 | % | | | 0 | % | |
Direxion Daily Regional Banks Bull 3X Shares | |
| For the Year Ended October 31, 2022 | | | 51.02 | | | | 0.37 | | | | 0.39 | | | | (21.10 | ) | | | (20.73 | ) | | | (0.36 | ) | | | — | | | | — | | | | (0.36 | ) | | | 29.93 | | | | -40.71 | % | | | 212,433 | | | | 0.93 | % | | | 0.93 | % | | | 0.94 | % | | | 0.89 | % | | | 0.89 | % | | | 0.98 | % | | | 138 | % | |
| For the Year Ended October 31, 2021 | | | 13.19 | | | | 0.28 | | | | 0.28 | | | | 37.83 | | | | 38.11 | | | | (0.28 | ) | | | — | | | | — | | | | (0.28 | ) | | | 51.02 | | | | 290.09 | % | | | 441,276 | | | | 0.91 | % | | | 0.89 | % | | | 0.70 | % | | | 0.90 | % | | | 0.88 | % | | | 0.71 | % | | | 147 | % | |
| For the Year Ended October 31, 2020 | | | 83.12 | | | | 0.21 | | | | 0.21 | | | | (69.69 | ) | | | (69.48 | ) | | | (0.45 | ) | | | — | | | | — | | | | (0.45 | ) | | | 13.19 | | | | -83.83 | % | | | 111,397 | | | | 0.97 | % | | | 1.00 | % | | | 1.64 | % | | | 0.95 | % | | | 0.98 | % | | | 1.66 | % | | | 331 | % | |
| For the Year Ended October 31, 2019 | | | 99.44 | | | | 1.40 | | | | 1.44 | | | | (16.30 | ) | | | (14.90 | ) | | | (1.42 | ) | | | — | | | | — | | | | (1.42 | ) | | | 83.12 | | | | -14.83 | % | | | 20,780 | | | | 0.99 | % | | | 1.07 | % | | | 1.64 | % | | | 0.95 | % | | | 1.03 | % | | | 1.68 | % | | | 81 | % | |
| For the Year Ended October 31, 2018 | | | 133.96 | | | | 1.24 | | | | 1.34 | | | | (34.54 | ) | | | (33.30 | ) | | | (1.22 | ) | | | — | | | | — | | | | (1.22 | ) | | | 99.44 | | | | -25.20 | % | | | 29,835 | | | | 1.02 | % | | | 1.04 | % | | | 0.79 | % | | | 0.95 | % | | | 0.97 | % | | | 0.86 | % | | | 76 | % | |
Direxion Daily Retail Bull 3X Shares | |
| For the Year Ended October 31, 2022 | | | 41.95 | | | | 0.13 | | | | 0.13 | | | | (33.83 | ) | | | (33.70 | ) | | | (0.11 | ) | | | — | | | | — | | | | (0.11 | ) | | | 8.14 | | | | -80.48 | % | | | 51,020 | | | | 0.98 | % | | | 0.95 | % | | | 0.74 | % | | | 0.95 | % | | | 0.92 | % | | | 0.77 | % | | | 83 | % | |
| For the Year Ended October 31, 2021 | | | 8.58 | | | | (0.09 | ) | | | (0.08 | ) | | | 33.46 | | | | 33.37 | | | | (0.00 | )10 | | | — | | | | — | | | | (0.00 | )10 | | | 41.95 | | | | 389.07 | % | | | 128,839 | | | | 0.97 | % | | | 0.92 | % | | | (0.24 | )% | | | 0.95 | % | | | 0.90 | % | | | (0.22 | )% | | | 112 | % | |
| For the Year Ended October 31, 2020 | | | 9.43 | | | | 0.01 | | | | 0.01 | | | | (0.82 | ) | | | (0.81 | ) | | | (0.02 | ) | | | — | | | | (0.02 | ) | | | (0.04 | ) | | | 8.58 | | | | -7.65 | % | | | 22,485 | | | | 0.99 | % | | | 1.17 | % | | | 0.12 | % | | | 0.95 | % | | | 1.13 | % | | | 0.16 | % | | | 171 | % | |
| For the Year Ended October 31, 2019 | | | 14.76 | | | | 0.13 | | | | 0.13 | | | | (5.34 | ) | | | (5.21 | ) | | | (0.12 | ) | | | — | | | | — | | | | (0.12 | ) | | | 9.43 | | | | -35.35 | % | | | 12,967 | | | | 1.01 | % | | | 1.16 | % | | | 1.15 | % | | | 0.95 | % | | | 1.10 | % | | | 1.21 | % | | | 84 | % | |
| For the Year Ended October 31, 2018 | | | 9.80 | | | | 0.08 | | | | 0.11 | | | | 4.98 | | | | 5.06 | | | | (0.10 | ) | | | — | | | | — | | | | (0.10 | ) | | | 14.76 | | | | 51.66 | % | | | 31,367 | | | | 1.09 | % | | | 1.15 | % | | | 0.59 | % | | | 0.95 | % | | | 1.01 | % | | | 0.73 | % | | | 81 | % | |
Direxion Daily S&P 500® High Beta Bull 3X Shares | |
| For the Year Ended October 31, 2022 | | | 75.48 | | | | (0.07 | ) | | | (0.04 | ) | | | (49.90 | ) | | | (49.97 | ) | | | — | | | | — | | | | — | | | | — | | | | 25.51 | | | | -66.20 | % | | | 69,235 | | | | 1.01 | % | | | 1.01 | % | | | (0.16 | )% | | | 0.95 | % | | | 0.95 | % | | | (0.10 | )% | | | 144 | % | |
| For the Year Ended October 31, 2021 | | | 14.43 | | | | (0.01 | ) | | | (0.01 | ) | | | 61.10 | | | | 61.09 | | | | (0.04 | ) | | | — | | | | — | | | | (0.04 | ) | | | 75.48 | | | | 423.32 | % | | | 110,529 | | | | 0.96 | % | | | 0.97 | % | | | (0.02 | )% | | | 0.95 | % | | | 0.96 | % | | | (0.01 | )% | | | 151 | % | |
For the Period November 7, 20199 through
October 31, 2020 | | | 35.71 | | | | — | | | | — | | | | (21.14 | ) | | | (21.14 | ) | | | (0.04 | ) | | | — | | | | (0.10 | ) | | | (0.14 | ) | | | 14.43 | | | | -59.13 | % | | | 29,795 | | | | 0.97 | % | | | 1.16 | % | | | (0.03 | )% | | | 0.95 | % | | | 1.14 | % | | | (0.01 | )% | | | 245 | % | |
Direxion Daily S&P 500® High Beta Bear 3X Shares | |
| For the Year Ended October 31, 2022 | | | 9.06 | | | | 0.01 | | | | 0.03 | | | | (0.45 | ) | | | (0.44 | ) | | | — | | | | — | | | | — | | | | — | | | | 8.62 | | | | -4.86 | % | | | 66,428 | | | | 1.14 | % | | | 1.17 | % | | | 0.13 | % | | | 0.95 | % | | | 0.98 | % | | | 0.32 | % | | | 0 | % | |
| For the Year Ended October 31, 2021 | | | 101.00 | | | | (0.15 | ) | | | (0.15 | ) | | | (91.79 | ) | | | (91.94 | ) | | | — | | | | — | | | | — | | | | — | | | | 9.06 | | | | -91.03 | % | | | 23,626 | | | | 0.95 | % | | | 1.03 | % | | | (0.93 | )% | | | 0.95 | % | | | 1.03 | % | | | (0.93 | )% | | | 0 | % | |
For the Period November 7, 20199 through
October 31, 2020 | | | 500.00 | | | | (1.00 | ) | | | (1.00 | ) | | | (397.20 | ) | | | (398.20 | ) | | | (0.40 | ) | | | — | | | | (0.40 | ) | | | (0.80 | ) | | | 101.00 | | | | -79.76 | % | | | 52,781 | | | | 0.96 | % | | | 1.10 | % | | | (0.79 | )% | | | 0.95 | % | | | 1.09 | % | | | (0.78 | )% | | | 0 | % | |
Direxion Daily S&P Biotech Bull 3X Shares | |
| For the Year Ended October 31, 2022 | | | 53.25 | | | | (0.06 | ) | | | (0.04 | ) | | | (45.77 | ) | | | (45.83 | ) | | | — | | | | — | | | | — | | | | — | | | | 7.42 | | | | -86.07 | % | | | 1,159,847 | | | | 1.09 | % | | | 1.09 | % | | | (0.51 | )% | | | 0.94 | % | | | 0.94 | % | | | (0.36 | )% | | | 148 | % | |
| For the Year Ended October 31, 2021 | | | 53.52 | | | | (0.57 | ) | | | (0.57 | ) | | | 0.30 | | | | (0.27 | ) | | | — | | | | — | | | | — | | | | — | | | | 53.25 | | | | -0.50 | % | | | 772,796 | | | | 0.95 | % | | | 0.93 | % | | | (0.82 | )% | | | 0.94 | % | | | 0.92 | % | | | (0.81 | )% | | | 169 | % | |
| For the Year Ended October 31, 2020 | | | 37.18 | | | | (0.23 | ) | | | (0.19 | ) | | | 16.58 | | | | 16.35 | | | | (0.01 | ) | | | — | | | | (0.00 | )10 | | | (0.01 | ) | | | 53.52 | | | | 43.96 | % | | | 292,298 | | | | 1.04 | % | | | 1.05 | % | | | (0.48 | )% | | | 0.95 | % | | | 0.96 | % | | | (0.39 | )% | | | 137 | % | |
| For the Year Ended October 31, 2019 | | | 49.33 | | | | 0.24 | | | | 0.25 | | | | (12.14 | ) | | | (11.90 | ) | | | (0.25 | ) | | | — | | | | — | | | | (0.25 | ) | | | 37.18 | | | | -24.17 | % | | | 487,452 | | | | 0.98 | % | | | 0.98 | % | | | 0.53 | % | | | 0.95 | % | | | 0.95 | % | | | 0.56 | % | | | 114 | % | |
| For the Year Ended October 31, 2018 | | | 76.45 | | | | 0.15 | | | | 0.31 | | | | (27.03 | ) | | | (26.88 | ) | | | (0.11 | ) | | | (0.13 | ) | | | — | | | | (0.24 | ) | | | 49.33 | | | | -35.28 | % | | | 592,472 | | | | 1.14 | % | | | 1.15 | % | | | 0.18 | % | | | 0.95 | % | | | 0.96 | % | | | 0.37 | % | | | 510 | % | |
Direxion Daily S&P Biotech Bear 3X Shares | |
| For the Year Ended October 31, 2022 | | | 21.33 | | | | 0.17 | | | | 0.18 | | | | (1.32 | ) | | | (1.15 | ) | | | — | | | | — | | | | — | | | | — | | | | 20.18 | | | | -5.39 | % | | | 189,975 | | | | 1.02 | % | | | 1.03 | % | | | 0.63 | % | | | 0.95 | % | | | 0.96 | % | | | 0.70 | % | | | 0 | % | |
| For the Year Ended October 31, 2021 | | | 54.51 | | | | (0.20 | ) | | | (0.20 | ) | | | (32.98 | ) | | | (33.18 | ) | | | — | | | | — | | | | — | | | | — | | | | 21.33 | | | | -60.87 | % | | | 47,267 | | | | 0.95 | % | | | 0.95 | % | | | (0.93 | )% | | | 0.95 | % | | | 0.95 | % | | | (0.93 | )% | | | 0 | % | |
| For the Year Ended October 31, 2020 | | | 408.20 | | | | (0.09 | ) | | | (0.04 | ) | | | (352.33 | ) | | | (352.42 | ) | | | (0.71 | ) | | | — | | | | (0.56 | ) | | | (1.27 | ) | | | 54.51 | | | | -86.59 | % | | | 63,561 | | | | 0.99 | % | | | 1.03 | % | | | (0.07 | )% | | | 0.95 | % | | | 0.99 | % | | | (0.03 | )% | | | 0 | % | |
| For the Year Ended October 31, 2019 | | | 783.40 | | | | 5.80 | | | | 6.20 | | | | (373.20 | ) | | | (367.40 | ) | | | (7.80 | ) | | | — | | | | — | | | | (7.80 | ) | | | 408.20 | | | | -47.16 | % | | | 82,336 | | | | 1.05 | % | | | 1.07 | % | | | 1.29 | % | | | 0.95 | % | | | 0.97 | % | | | 1.39 | % | | | 0 | % | |
| For the Year Ended October 31, 2018 | | | 1,008.00 | | | | 4.60 | | | | 5.00 | | | | (226.20 | ) | | | (221.60 | ) | | | (3.00 | ) | | | — | | | | — | | | | (3.00 | ) | | | 783.40 | | | | -21.81 | % | | | 56,196 | | | | 1.00 | % | | | 1.02 | % | | | 0.74 | % | | | 0.95 | % | | | 0.97 | % | | | 0.79 | % | | | 0 | % | |
Direxion Daily Semiconductor Bull 3X Shares | |
| For the Year Ended October 31, 2022 | | | 47.62 | | | | 0.12 | | | | 0.14 | | | | (38.77 | ) | | | (38.65 | ) | | | (0.08 | ) | | | — | | | | — | | | | (0.08 | ) | | | 8.89 | | | | -81.24 | % | | | 3,474,072 | | | | 0.85 | % | | | 0.97 | % | | | 0.51 | % | | | 0.77 | % | | | 0.89 | % | | | 0.59 | % | | | 241 | % | |
| For the Year Ended October 31, 2021 | | | 16.59 | | | | (0.00 | )10 | | | (0.00 | )10 | | | 31.05 | | | | 31.05 | | | | (0.02 | ) | | | — | | | | — | | | | (0.02 | ) | | | 47.62 | | | | 187.22 | % | | | 4,155,099 | | | | 0.83 | % | | | 0.90 | % | | | (0.01 | )% | | | 0.82 | % | | | 0.89 | % | | | 0.00 | % | | | 170 | % | |
| For the Year Ended October 31, 2020 | | | 13.21 | | | | 0.02 | | | | 0.03 | | | | 3.39 | | | | 3.41 | | | | (0.03 | ) | | | — | | | | — | | | | (0.03 | ) | | | 16.59 | | | | 25.88 | % | | | 1,318,844 | | | | 1.06 | % | | | 1.06 | % | | | 0.13 | % | | | 0.94 | % | | | 0.94 | % | | | 0.25 | % | | | 230 | % | |
| For the Year Ended October 31, 2019 | | | 6.70 | | | | 0.07 | | | | 0.10 | | | | 6.51 | | | | 6.58 | | | | (0.07 | ) | | | — | | | | — | | | | (0.07 | ) | | | 13.21 | | | | 98.82 | % | | | 634,080 | | | | 1.35 | % | | | 1.35 | % | | | 0.74 | % | | | 0.93 | % | | | 0.93 | % | | | 1.16 | % | | | 92 | % | |
| For the Year Ended October 31, 2018 | | | 9.87 | | | | 0.05 | | | | 0.07 | | | | (3.16 | ) | | | (3.11 | ) | | | (0.06 | ) | | | — | | | | — | | | | (0.06 | ) | | | 6.70 | | | | -31.68 | % | | | 582,998 | | | | 1.10 | % | | | 1.09 | % | | | 0.56 | % | | | 0.94 | % | | | 0.93 | % | | | 0.72 | % | | | 101 | % | |
The accompanying notes are an integral part of these financial statements.
DIREXION ANNUAL REPORT
167
Financial Highlights
October 31, 2022
| | | | | RATIOS TO AVERAGE NET ASSETS7 | | | |
| | | Net Asset
Value,
Beginning
of Year/
Period | | Net
Investment
Income
(Loss)1,2 | | Net
Investment
Income
(Loss)1,3 | | Net Realized
and Unrealized
Gain (Loss)
on Investments4 | | Net Increase
(Decrease) in
Net Asset
Value Resulting
from Operations | | Dividends
from Net
Investment
Income | | Distributions
from
Realized
Capital Gains | | Distributions
from
Return
of Capital | | Total
Distributions | | Net
Asset
Value,
End of
Year/
Period | | Total
Return5 | | Net
Assets,
End of
Year/
Period
(000's
omitted) | | Net
Expenses2,6 | | Total
Expenses2 | | Net Investment
Income (Loss)
after Expense
Reimbursement2 | | Net
Expenses3,6 | | Total
Expenses3 | | Net Investment
Income (Loss)
after Expense
Reimbursement3 | | Portfolio
Turnover
Rate8 | |
Direxion Daily Semiconductor Bear 3X Shares12 | |
For the Year Ended October 31, 2022 | | $ | 57.50 | | | $ | 0.20 | | | $ | 0.29 | | | $ | 1.85 | | | $ | 2.05 | | | $ | — | | | $ | — | | | $ | — | | | $ | — | | | $ | 59.55 | | | | 3.57 | % | | $ | 590,971 | | | | 1.09 | % | | | 1.08 | % | | | 0.41 | % | | | 0.89 | % | | | 0.88 | % | | | 0.61 | % | | | 0 | % | |
| For the Year Ended October 31, 2021 | | | 374.90 | | | | (0.80 | ) | | | (0.80 | ) | | | (316.60 | ) | | | (317.40 | ) | | | — | | | | — | | | | — | | | | — | | | | 57.50 | | | | -84.66 | % | | | 145,418 | | | | 0.95 | % | | | 0.91 | % | | | (0.93 | )% | | | 0.95 | % | | | 0.91 | % | | | (0.93 | )% | | | 0 | % | |
| For the Year Ended October 31, 2020 | | | 3,681.60 | | | | (0.20 | ) | | | 0.10 | | | | (3,292.40 | ) | | | (3,292.60 | ) | | | (10.20 | ) | | | — | | | | (3.90 | ) | | | (14.10 | ) | | | 374.90 | | | | -89.76 | % | | | 93,777 | | | | 0.98 | % | | | 1.00 | % | | | (0.02 | )% | | | 0.95 | % | | | 0.97 | % | | | 0.01 | % | | | 0 | % | |
| For the Year Ended October 31, 2019 | | | 15,996.00 | | | | 92.40 | | | | 96.00 | | | | (12,285.60 | ) | | | (12,193.20 | ) | | | (121.20 | ) | | | — | | | | — | | | | (121.20 | ) | | | 3,681.60 | | | | -76.67 | % | | | 237,361 | | | | 1.02 | % | | | 1.01 | % | | | 1.45 | % | | | 0.95 | % | | | 0.94 | % | | | 1.52 | % | | | 0 | % | |
| For the Year Ended October 31, 2018 | | | 19,500.00 | | | | 96.00 | | | | 108.00 | | | | (3,552.00 | ) | | | (3,456.00 | ) | | | (48.00 | ) | | | — | | | | — | | | | (48.00 | ) | | | 15,996.00 | | | | -17.63 | % | | | 65,459 | | | | 0.97 | % | | | 0.98 | % | | | 0.73 | % | | | 0.95 | % | | | 0.96 | % | | | 0.75 | % | | | 0 | % | |
Direxion Daily Technology Bull 3X Shares | |
| For the Year Ended October 31, 2022 | | | 71.11 | | | | (0.02 | ) | | | (0.01 | ) | | | (45.13 | ) | | | (45.15 | ) | | | — | | | | (0.28 | ) | | | — | | | | (0.28 | ) | | | 25.68 | | | | -63.77 | % | | | 1,368,795 | | | | 0.94 | % | | | 0.96 | % | | | (0.05 | )% | | | 0.90 | % | | | 0.92 | % | | | (0.01 | )% | | | 96 | % | |
| For the Year Ended October 31, 2021 | | | 25.58 | | | | (0.14 | ) | | | (0.14 | ) | | | 45.86 | | | | 45.72 | | | | — | | | | (0.19 | ) | | | — | | | | (0.19 | ) | | | 71.11 | | | | 179.53 | % | | | 3,061,359 | | | | 0.91 | % | | | 0.93 | % | | | (0.29 | )% | | | 0.90 | % | | | 0.92 | % | | | (0.28 | )% | | | 25 | % | |
| For the Year Ended October 31, 2020 | | | 18.44 | | | | (0.02 | ) | | | — | | | | 7.19 | | | | 7.17 | | | | (0.03 | ) | | | — | | | | — | | | | (0.03 | ) | | | 25.58 | | | | 38.98 | % | | | 1,560,088 | | | | 1.06 | % | | | 1.06 | % | | | (0.11 | )% | | | 0.95 | % | | | 0.95 | % | | | 0.00 | % | | | 376 | % | |
| For the Year Ended October 31, 2019 | | | 12.55 | | | | 0.04 | | | | 0.09 | | | | 5.91 | | | | 5.95 | | | | (0.05 | ) | | | — | | | | — | | | | (0.05 | ) | | | 18.44 | | | | 47.55 | % | | | 774,641 | | | | 1.36 | % | | | 1.36 | % | | | 0.27 | % | | | 0.95 | % | | | 0.95 | % | | | 0.68 | % | | | 47 | % | |
| For the Year Ended October 31, 2018 | | | 10.76 | | | | 0.04 | | | | 0.07 | | | | 1.80 | | | | 1.84 | | | | (0.05 | ) | | | — | | | | — | | | | (0.05 | ) | | | 12.55 | | | | 16.99 | % | | | 671,151 | | | | 1.17 | % | | | 1.17 | % | | | 0.29 | % | | | 0.95 | % | | | 0.95 | % | | | 0.51 | % | | | 41 | % | |
Direxion Daily Technology Bear 3X Shares | |
| For the Year Ended October 31, 2022 | | | 37.16 | | | | 0.12 | | | | 0.17 | | | | 4.70 | | | | 4.82 | | | | — | | | | — | | | | — | | | | — | | | | 41.98 | | | | 12.97 | % | | | 159,535 | | | | 1.08 | % | | | 1.07 | % | | | 0.31 | % | | | 0.95 | % | | | 0.94 | % | | | 0.44 | % | | | 0 | % | |
| For the Year Ended October 31, 2021 | | | 147.80 | | | | (0.57 | ) | | | (0.57 | ) | | | (110.07 | ) | | | (110.64 | ) | | | — | | | | — | | | | — | | | | — | | | | 37.16 | | | | -74.86 | % | | | 66,942 | | | | 0.95 | % | | | 0.95 | % | | | (0.93 | )% | | | 0.95 | % | | | 0.95 | % | | | (0.93 | )% | | | 0 | % | |
| For the Year Ended October 31, 2020 | | | 957.00 | | | | (0.50 | ) | | | (0.40 | ) | | | (805.00 | ) | | | (805.50 | ) | | | (2.30 | ) | | | — | | | | (1.40 | ) | | | (3.70 | ) | | | 147.80 | | | | -84.47 | % | | | 80,036 | | | | 0.96 | % | | | 1.03 | % | | | (0.18 | )% | | | 0.95 | % | | | 1.02 | % | | | (0.17 | )% | | | 0 | % | |
| For the Year Ended October 31, 2019 | | | 2,218.00 | | | | 22.00 | | | | 22.00 | | | | (1,260.00 | ) | | | (1,238.00 | ) | | | (23.00 | ) | | | — | | | | — | | | | (23.00 | ) | | | 957.00 | | | | -56.25 | % | | | 59,340 | | | | 0.98 | % | | | 1.03 | % | | | 1.53 | % | | | 0.95 | % | | | 1.00 | % | | | 1.56 | % | | | 0 | % | |
| For the Year Ended October 31, 2018 | | | 3,680.00 | | | | 20.00 | | | | 21.00 | | | | (1,470.00 | ) | | | (1,450.00 | ) | | | (12.00 | ) | | | — | | | | — | | | | (12.00 | ) | | | 2,218.00 | | | | -39.38 | % | | | 33,349 | | | | 0.96 | % | | | 1.05 | % | | | 0.85 | % | | | 0.95 | % | | | 1.04 | % | | | 0.86 | % | | | 0 | % | |
Direxion Daily Transportation Bull 3X Shares | |
| For the Year Ended October 31, 2022 | | | 48.54 | | | | (0.01 | ) | | | (0.01 | ) | | | (26.39 | ) | | | (26.40 | ) | | | — | | | | — | | | | — | | | | — | | | | 22.14 | | | | -54.39 | % | | | 23,243 | | | | 0.96 | % | | | 0.98 | % | | | (0.03 | )% | | | 0.95 | % | | | 0.97 | % | | | (0.02 | )% | | | 54 | % | |
| For the Year Ended October 31, 2021 | | | 18.08 | | | | (0.09 | ) | | | (0.09 | ) | | | 30.56 | | | | 30.47 | | | | (0.01 | ) | | | — | | | | — | | | | (0.01 | ) | | | 48.54 | | | | 168.57 | % | | | 89,798 | | | | 0.96 | % | | | 0.95 | % | | | (0.24 | )% | | | 0.95 | % | | | 0.94 | % | | | (0.23 | )% | | | 49 | % | |
| For the Year Ended October 31, 2020 | | | 25.01 | | | | (0.02 | ) | | | (0.01 | ) | | | (6.85 | ) | | | (6.87 | ) | | | (0.06 | ) | | | — | | | | — | | | | (0.06 | ) | | | 18.08 | | | | -27.42 | % | | | 38,879 | | | | 0.96 | % | | | 1.13 | % | | | (0.10 | )% | | | 0.95 | % | | | 1.12 | % | | | (0.09 | )% | | | 128 | % | |
| For the Year Ended October 31, 2019 | | | 27.12 | | | | 0.23 | | | | 0.24 | | | | (2.06 | ) | | | (1.83 | ) | | | (0.28 | ) | | | — | | | | — | | | | (0.28 | ) | | | 25.01 | | | | -6.66 | % | | | 3,751 | | | | 0.99 | % | | | 1.57 | % | | | 0.92 | % | | | 0.95 | % | | | 1.53 | % | | | 0.96 | % | | | 74 | % | |
| For the Year Ended October 31, 2018 | | | 29.44 | | | | 0.19 | | | | 0.19 | | | | 0.66 | | | | 0.85 | | | | (0.24 | ) | | | (2.93 | ) | | | — | | | | (3.17 | ) | | | 27.12 | | | | 1.13 | % | | | 10,849 | | | | 0.95 | % | | | 1.37 | % | | | 0.57 | % | | | 0.95 | % | | | 1.37 | % | | | 0.57 | % | | | 0 | % | |
Direxion Daily Utilities Bull 3X Shares | |
| For the Year Ended October 31, 2022 | | | 32.41 | | | | 0.46 | | | | 0.51 | | | | (3.10 | ) | | | (2.64 | ) | | | (0.51 | ) | | | (0.08 | ) | | | — | | | | (0.59 | ) | | | 29.18 | | | | -8.50 | % | | | 21,883 | | | | 1.08 | % | | | 1.17 | % | | | 1.25 | % | | | 0.95 | % | | | 1.04 | % | | | 1.38 | % | | | 63 | % | |
| For the Year Ended October 31, 2021 | | | 26.76 | | | | 0.31 | | | | 0.31 | | | | 5.70 | | | | 6.01 | | | | (0.36 | ) | | | — | | | | — | | | | (0.36 | ) | | | 32.41 | | | | 22.72 | % | | | 37,274 | | | | 0.96 | % | | | 1.03 | % | | | 1.04 | % | | | 0.95 | % | | | 1.02 | % | | | 1.05 | % | | | 69 | % | |
| For the Year Ended October 31, 2020 | | | 45.80 | | | | 0.40 | | | | 0.42 | | | | (17.58 | ) | | | (17.18 | ) | | | (0.50 | ) | | | (1.34 | ) | | | (0.02 | ) | | | (1.86 | ) | | | 26.76 | | | | -38.38 | % | | | 14,715 | | | | 1.01 | % | | | 1.28 | % | | | 1.44 | % | | | 0.95 | % | | | 1.22 | % | | | 1.50 | % | | | 80 | % | |
| For the Year Ended October 31, 2019 | | | 27.81 | | | | 0.65 | | | | 0.68 | | | | 18.04 | | | | 18.69 | | | | (0.70 | ) | | | — | | | | — | | | | (0.70 | ) | | | 45.80 | | | | 67.76 | %13 | | | 16,029 | | | | 1.04 | % | | | 1.58 | % | | | 1.76 | % | | | 0.95 | % | | | 1.49 | % | | | 1.85 | % | | | 72 | % | |
| For the Year Ended October 31, 2018 | | | 31.13 | | | | 0.53 | | | | 0.54 | | | | (3.31 | ) | | | (2.78 | ) | | | (0.54 | ) | | | — | | | | — | | | | (0.54 | ) | | | 27.81 | | | | -8.72 | % | | | 4,172 | | | | 0.96 | % | | | 1.45 | % | | | 2.15 | % | | | 0.95 | % | | | 1.44 | % | | | 2.16 | % | | | 44 | % | |
Direxion Daily 7-10 Year Treasury Bull 3X Shares | |
| For the Year Ended October 31, 2022 | | | 51.86 | | | | 0.20 | | | | 0.20 | | | | (23.49 | ) | | | (23.29 | ) | | | — | | | | — | | | | — | | | | — | | | | 28.57 | | | | -44.91 | % | | | 24,282 | | | | 0.96 | % | | | 1.01 | % | | | 0.48 | % | | | 0.95 | % | | | 1.00 | % | | | 0.49 | % | | | 0 | % | |
| For the Year Ended October 31, 2021 | | | 65.11 | | | | (0.22 | ) | | | (0.22 | ) | | | (7.29 | ) | | | (7.51 | ) | | | — | | | | (5.18 | ) | | | (0.56 | ) | | | (5.74 | ) | | | 51.86 | | | | -12.64 | % | | | 23,339 | | | | 0.95 | % | | | 1.06 | % | | | (0.40 | )% | | | 0.95 | % | | | 1.06 | % | | | (0.40 | )% | | | 6 | % | |
| For the Year Ended October 31, 2020 | | | 54.00 | | | | (0.06 | ) | | | (0.04 | ) | | | 11.35 | | | | 11.29 | | | | (0.18 | ) | | | — | | | | — | | | | (0.18 | ) | | | 65.11 | | | | 20.96 | % | | | 19,534 | | | | 0.99 | % | | | 1.15 | % | | | (0.10 | )% | | | 0.95 | % | | | 1.11 | % | | | (0.06 | )% | | | 76 | % | |
| For the Year Ended October 31, 2019 | | | 38.83 | | | | 0.52 | | | | 0.57 | | | | 15.18 | | | | 15.70 | | | | (0.53 | ) | | | — | | | | — | | | | (0.53 | ) | | | 54.00 | | | | 40.66 | % | | | 21,600 | | | | 1.05 | % | | | 1.28 | % | | | 1.09 | % | | | 0.95 | % | | | 1.18 | % | | | 1.19 | % | | | 97 | % | |
| For the Year Ended October 31, 2018 | | | 44.25 | | | | 0.31 | | | | 0.34 | | | | (5.41 | ) | | | (5.10 | ) | | | (0.32 | ) | | | — | | | | — | | | | (0.32 | ) | | | 38.83 | | | | -11.54 | % | | | 5,824 | | | | 1.01 | % | | | 1.57 | % | | | 0.76 | % | | | 0.95 | % | | | 1.51 | % | | | 0.82 | % | | | 0 | % | |
Direxion Daily 7-10 Year Treasury Bear 3X Shares | |
| For the Year Ended October 31, 2022 | | | 8.71 | | | | (0.00 | )10 | | | 0.01 | | | | 5.50 | | | | 5.50 | | | | — | | | | — | | | | — | | | | — | | | | 14.21 | | | | 63.15 | % | | | 56,135 | | | | 1.01 | % | | | 0.99 | % | | | 0.04 | % | | | 0.95 | % | | | 0.93 | % | | | 0.10 | % | | | 0 | % | |
| For the Year Ended October 31, 2021 | | | 8.10 | | | | (0.08 | ) | | | (0.08 | ) | | | 0.69 | | | | 0.61 | | | | — | | | | — | | | | — | | | | — | | | | 8.71 | | | | 7.53 | % | | | 29,623 | | | | 0.95 | % | | | 1.12 | % | | | (0.93 | )% | | | 0.95 | % | | | 1.12 | % | | | (0.93 | )% | | | 0 | % | |
| For the Year Ended October 31, 2020 | | | 10.58 | | | | (0.01 | ) | | | (0.01 | ) | | | (2.43 | ) | | | (2.44 | ) | | | (0.03 | ) | | | — | | | | (0.01 | ) | | | (0.04 | ) | | | 8.10 | | | | -23.08 | % | | | 6,882 | | | | 0.95 | % | | | 1.40 | % | | | (0.09 | )% | | | 0.95 | % | | | 1.40 | % | | | (0.09 | )% | | | 0 | % | |
| For the Year Ended October 31, 2019 | | | 15.53 | | | | 0.18 | | | | 0.18 | | | | (4.95 | ) | | | (4.77 | ) | | | (0.18 | ) | | | — | | | | — | | | | (0.18 | ) | | | 10.58 | | | | -30.84 | % | | | 11,109 | | | | 0.97 | % | | | 1.18 | % | | | 1.41 | % | | | 0.95 | % | | | 1.16 | % | | | 1.43 | % | | | 0 | % | |
| For the Year Ended October 31, 2018 | | | 14.01 | | | | 0.07 | | | | 0.08 | | | | 1.47 | | | | 1.54 | | | | (0.02 | ) | | | — | | | | — | | | | (0.02 | ) | | | 15.53 | | | | 11.01 | % | | | 20,189 | | | | 1.05 | % | | | 1.15 | % | | | 0.45 | % | | | 0.95 | % | | | 1.05 | % | | | 0.55 | % | | | 0 | % | |
Direxion Daily 20+ Year Treasury Bull 3X Shares | |
| For the Year Ended October 31, 2022 | | | 28.10 | | | | 0.14 | | | | 0.14 | | | | (21.15 | ) | | | (21.01 | ) | | | (0.08 | ) | | | — | | | | — | | | | (0.08 | ) | | | 7.01 | | | | -74.89 | % | | | 437,185 | | | | 0.91 | % | | | 0.91 | % | | | 0.92 | % | | | 0.90 | % | | | 0.90 | % | | | 0.93 | % | | | 8 | % | |
| For the Year Ended October 31, 2021 | | | 35.81 | | | | 0.03 | | | | 0.03 | | | | (7.01 | ) | | | (6.98 | ) | | | (0.03 | ) | | | (0.69 | ) | | | (0.01 | ) | | | (0.73 | ) | | | 28.10 | | | | -19.90 | % | | | 359,735 | | | | 0.88 | % | | | 0.88 | % | | | 0.11 | % | | | 0.88 | % | | | 0.88 | % | | | 0.11 | % | | | 33 | % | |
| For the Year Ended October 31, 2020 | | | 29.39 | | | | 0.08 | | | | 0.10 | | | | 6.49 | | | | 6.57 | | | | (0.15 | ) | | | — | | | | — | | | | (0.15 | ) | | | 35.81 | | | | 22.38 | % | | | 282,879 | | | | 0.98 | % | | | 0.98 | % | | | 0.22 | % | | | 0.93 | % | | | 0.93 | % | | | 0.27 | % | | | 67 | % | |
| For the Year Ended October 31, 2019 | | | 15.76 | | | | 0.29 | | | | 0.34 | | | | 13.63 | | | | 13.92 | | | | (0.29 | ) | | | — | | | | — | | | | (0.29 | ) | | | 29.39 | | | | 88.98 | % | | | 189,539 | | | | 1.12 | % | | | 1.12 | % | | | 1.25 | % | | | 0.92 | % | | | 0.92 | % | | | 1.46 | % | | | 66 | % | |
| For the Year Ended October 31, 2018 | | | 20.77 | | | | 0.25 | | | | 0.26 | | | | (5.00 | ) | | | (4.75 | ) | | | (0.26 | ) | | | — | | | | — | | | | (0.26 | ) | | | 15.76 | | | | -23.07 | % | | | 100,873 | | | | 0.97 | % | | | 0.95 | % | | | 1.31 | % | | | 0.94 | % | | | 0.92 | % | | | 1.34 | % | | | 0 | % | |
The accompanying notes are an integral part of these financial statements.
DIREXION ANNUAL REPORT
168
Financial Highlights
October 31, 2022
| | | | | RATIOS TO AVERAGE NET ASSETS7 | | | |
| | | Net Asset
Value,
Beginning
of Year/
Period | | Net
Investment
Income
(Loss)1,2 | | Net
Investment
Income
(Loss)1,3 | | Net Realized
and Unrealized
Gain (Loss)
on Investments4 | | Net Increase
(Decrease) in
Net Asset
Value Resulting
from Operations | | Dividends
from Net
Investment
Income | | Distributions
from
Realized
Capital Gains | | Distributions
from
Return
of Capital | | Total
Distributions | | Net
Asset
Value,
End of
Year/
Period | | Total
Return5 | | Net
Assets,
End of
Year/
Period
(000's
omitted) | | Net
Expenses2,6 | | Total
Expenses2 | | Net Investment
Income (Loss)
after Expense
Reimbursement2 | | Net
Expenses3,6 | | Total
Expenses3 | | Net Investment
Income (Loss)
after Expense
Reimbursement3 | | Portfolio
Turnover
Rate8 | |
Direxion Daily 20+ Year Treasury Bear 3X Shares | |
For the Year Ended October 31, 2022 | | $ | 57.33 | | | $ | 0.05 | | | $ | 0.17 | | | $ | 101.87 | | | $ | 101.92 | | | $ | — | | | $ | — | | | $ | — | | | $ | — | | | $ | 159.25 | | | | 177.78 | % | | $ | 688,650 | | | | 1.01 | % | | | 1.01 | % | | | 0.06 | % | | | 0.88 | % | | | 0.88 | % | | | 0.19 | % | | | 0 | % | |
| For the Year Ended October 31, 2021 | | | 55.80 | | | | (0.55 | ) | | | (0.55 | ) | | | 2.08 | | | | 1.53 | | | | — | | | | — | | | | — | | | | — | | | | 57.33 | | | | 2.74 | % | | | 325,333 | | | | 0.88 | % | | | 0.88 | % | | | (0.86 | )% | | | 0.88 | % | | | 0.88 | % | | | (0.86 | )% | | | 0 | % | |
| For the Year Ended October 31, 2020 | | | 107.20 | | | | (0.06 | ) | | | (0.05 | ) | | | (50.93 | ) | | | (50.99 | ) | | | (0.28 | ) | | | — | | | | (0.13 | ) | | | (0.41 | ) | | | 55.80 | | | | -47.66 | % | | | 99,010 | | | | 0.90 | % | | | 0.90 | % | | | (0.09 | )% | | | 0.89 | % | | | 0.89 | % | | | (0.08 | )% | | | 0 | % | |
| For the Year Ended October 31, 2019 | | | 228.50 | | | | 2.10 | | | | 2.40 | | | | (121.20 | ) | | | (119.10 | ) | | | (2.20 | ) | | | — | | | | — | | | | (2.20 | ) | | | 107.20 | | | | -52.34 | % | | | 123,239 | | | | 1.10 | % | | | 1.10 | % | | | 1.32 | % | | | 0.91 | % | | | 0.91 | % | | | 1.51 | % | | | 0 | % | |
| For the Year Ended October 31, 2018 | | | 191.40 | | | | 1.10 | | | | 1.20 | | | | 36.60 | | | | 37.70 | | | | (0.60 | ) | | | — | | | | — | | | | (0.60 | ) | | | 228.50 | | | | 19.71 | % | | | 345,100 | | | | 0.99 | % | | | 0.99 | % | | | 0.54 | % | | | 0.90 | % | | | 0.90 | % | | | 0.63 | % | | | 0 | % | |
1 Net investment income (loss) per share represents net investment income divided by the daily average shares of beneficial interest outstanding throughout each period.
2 Includes interest expense and extraordinary expenses, which comprise of tax and litigation expenses.
3 Excludes interest expense and extraordinary expenses which comprise of excise tax and litigation expenses.
4 Due to the timing of sales and redemptions of capital shares, the net realized and realized gain (loss) per share is not in accordance with the Fund's changes in net realized and unrealized gain (loss) on investments, in-kind redemptions, futures, and swaps for the year/period.
5 Total return is calculated assuming an initial investment made at the net asset value at the beginning of the year/period, reinvestment of all dividends and distributions at net asset value during the year/period and redemption on the last day of the period. Total return calculated for a period of less than one year is not annualized. The total return would have been lower if certain expenses had not been reimbursed/waived or recouped by the Adviser.
6 Net expenses include effects of any reimbursement/waiver or recoupment.
7 For periods less than a year, these ratios are annualized.
8 Portfolio turnover rate is not annualized and excludes the value of portfolio securities received or delivered as a result of in-kind creations or redemptions of the Fund's capital shares. Portfolio turnover rate does not include effects of turnover of the swap and future contracts portfolio. Short-term securities with maturities less than or equal to 365 days are also excluded from portfolio turnover calculation.
9 Commencement of operations.
10 Between $(0.005) and $0.005.
11 Effective May 31, 2022, the Fund had a 1:20 reverse stock split. Share amounts for all periods have been adjusted to give effect to the 1:20 stock split.
12 Effective March 28, 2022, the Fund had a 1:10 reverse stock split. Share amounts for all periods have been adjusted to give effect to the 1:10 stock split.
13 The Fund's total return includes voluntary reimbursement by the Adviser for a realized loss on a trading error. Had this reimbursement not been made to the Fund, total return would have been 1.94% lower.
The accompanying notes are an integral part of these financial statements.
DIREXION ANNUAL REPORT
169
Direxion Shares ETF Trust
Notes to the Financial Statements
October 31, 2022
1. ORGANIZATION
The Direxion Shares ETF Trust (the "Trust") is a Delaware statutory trust formed on April 23, 2008 and is registered with the Securities and Exchange Commission ("SEC") as an open-end management investment company under the Investment Company Act of 1940, as amended (the "1940 Act"). The Trust is a registered investment company that has 87 separate series (each, a "Fund" and together the "Funds"). 40 of these Funds are included in this report:
Bull Funds | | Bear Funds | |
Direxion Daily Mid Cap Bull 3X Shares | | | |
Direxion Daily S&P 500® Bull 3X Shares | | Direxion Daily S&P 500® Bear 3X Shares | |
Direxion Daily Small Cap Bull 3X Shares | | Direxion Daily Small Cap Bear 3X Shares | |
Direxion Daily FTSE China Bull 3X Shares | | Direxion Daily FTSE China Bear 3X Shares | |
Direxion Daily FTSE Europe Bull 3X Shares | | | |
Direxion Daily MSCI Emerging Markets Bull 3X Shares | | Direxion Daily MSCI Emerging Markets Bear 3X Shares | |
Direxion Daily MSCI Mexico Bull 3X Shares | | | |
Direxion Daily MSCI South Korea Bull 3X Shares | | | |
Direxion Daily Aerospace & Defense Bull 3X Shares | | | |
Direxion Daily Consumer Discretionary Bull 3X Shares | | | |
Direxion Daily Dow Jones Internet Bull 3X Shares | | Direxion Daily Dow Jones Internet Bear 3X Shares | |
Direxion Daily Financial Bull 3X Shares | | Direxion Daily Financial Bear 3X Shares | |
Direxion Daily Healthcare Bull 3X Shares | | | |
Direxion Daily Homebuilders & Supplies Bull 3X Shares | | | |
Direxion Daily Industrials Bull 3X Shares | | | |
Direxion Daily Pharmaceutical & Medical Bull 3X Shares | | | |
Direxion Daily Real Estate Bull 3X Shares* | | Direxion Daily Real Estate Bear 3X Shares* | |
Direxion Daily Regional Banks Bull 3X Shares | | | |
Direxion Daily Retail Bull 3X Shares | | | |
Direxion Daily S&P 500® High Beta Bull 3X Shares | | Direxion Daily S&P High Beta Bear 3X Shares | |
Direxion Daily S&P 500® Biotech Bull 3X Shares | | Direxion Daily S&P Biotech Bear 3X Shares | |
Direxion Daily Semiconductor Bull 3X Shares | | Direxion Daily Semiconductor Bear 3X Shares | |
Direxion Daily Technology Bull 3X Shares | | Direxion Daily Technology Bear 3X Shares | |
Direxion Daily Transportation Bull 3X Shares | | | |
Direxion Daily Utilities Bull 3X Shares | | | |
Direxion Daily 7-10 Year Treasury Bull 3X Shares | | Direxion Daily 7-10 Year Treasury Bear 3X Shares | |
Direxion Daily 20+ Year Treasury Bull 3X Shares | | Direxion Daily 20+ Year Treasury Bear 3X Shares | |
* Effective February 28, 2022, Direxion Daily MSCI Real Estate Bull 3X Shares and Direxion Daily MSCI Real Estate Bear 3X Shares changed their names to Direxion Daily Real Estate Bull 3X Shares and Direxion Daily Real Estate Bear 3X Shares, respectively.
The Trust has evaluated the structure, objective and activities of the Funds and determined that they meet the characteristics of an investment company. As such, these financial statements have applied the guidance as set forth in the Accounting Standards Codification ("ASC") 946, Financial Services – Investment Companies.
Rafferty Asset Management, LLC (the "Adviser") has registered as a commodity pool operator ("CPO") and the Funds are considered commodity pools under the Commodity Exchange Act (the "CEA"). Accordingly, the Adviser is subject to registration and regulation as a CPO under the CEA and must comply with various regulatory requirements under the CEA and the rules and regulations of the Commodity Futures Trading Commission and the National Futures Association, including investor protection requirements, antifraud provisions, disclosure requirements and reporting and recordkeeping requirements.
Each Fund's investment objective is to seek daily investment results, before fees and expenses, that correspond to the performance of a particular index or benchmark. The Funds with the word "Bull" in their name attempt to provide investment results that correlate positively to the return of an index or benchmark. The Funds with the word "Bear" in their
DIREXION ANNUAL REPORT
170
name attempt to provide investment results that correlate negatively to the return of an index or benchmark. The correlations sought by the Bull Funds are a multiple of 300% of the return of the target index or benchmark and a multiple of -300% of the return of the target index or benchmark for the Bear Funds.
Funds | | Index or Benchmark | | Daily Target | |
Direxion Daily Mid Cap Bull 3X Shares | | S&P Mid Cap 400® Index | | | 300 | % | |
Direxion Daily S&P 500® Bull 3X Shares | | | | | 300 | % | |
Direxion Daily S&P 500® Bear 3X Shares | | S&P 500® Index | | | -300 | % | |
Direxion Daily Small Cap Bull 3X Shares | | | | | 300 | % | |
Direxion Daily Small Cap Bear 3X Shares | | Russell 2000® Index | | | -300 | % | |
Direxion Daily FTSE China Bull 3X Shares | | | | | 300 | % | |
Direxion Daily FTSE China Bear 3X Shares | | FTSE China 50 Index | | | -300 | % | |
Direxion Daily FTSE Europe Bull 3X Shares | | FTSE Developed Europe All Cap Index | | | 300 | % | |
Direxion Daily MSCI Emerging Markets Bull 3X Shares | | | | | 300 | % | |
Direxion Daily MSCI Emerging Markets Bear 3X Shares | | MSCI Emerging Markets IndexSM | | | -300 | % | |
Direxion Daily MSCI Mexico Bull 3X Shares | | MSCI Mexico IMI 25/50 Index | | | 300 | % | |
Direxion Daily MSCI South Korea Bull 3X Shares | | MSCI Korea 25/50 Index | | | 300 | % | |
Direxion Daily Aerospace & Defense Bull 3X Shares | | Dow Jones U.S. Select Aerospace & Defense Index | | | 300 | % | |
Direxion Daily Consumer Discretionary Bull 3X Shares | | Consumer Discretionary Select Sector Index | | | 300 | % | |
Direxion Daily Dow Jones Internet Bull 3X Shares | | | | | 300 | % | |
Direxion Daily Dow Jones Internet Bear 3X Shares | | Dow Jones Internet Composite Index | | | -300 | % | |
Direxion Daily Financial Bull 3X Shares | | | | | 300 | % | |
Direxion Daily Financial Bear 3X Shares | | Financials Select Sector Index2,3 | | | -300 | % | |
Direxion Daily Healthcare Bull 3X Shares | | Health Care Select Sector Index | | | 300 | % | |
Direxion Daily Homebuilders & Supplies Bull 3X Shares | | Dow Jones U.S. Select Home Construction Index | | | 300 | % | |
Direxion Daily Industrials Bull 3X Shares | | Industrial Select Sector Index | | | 300 | % | |
Direxion Daily Pharmaceutical & Medical Bull 3X Shares | | S&P Pharmaceuticals Select Industry Index | | | 300 | % | |
Direxion Daily Real Estate Bull 3X Shares | | | | | 300 | % | |
Direxion Daily Real Estate Bear 3X Shares | | Real Estate Select Sector Index1 | | | -300 | % | |
Direxion Daily Regional Banks Bull 3X Shares | | S&P Regional Banks Select Industry Index | | | 300 | % | |
Direxion Daily Retail Bull 3X Shares | | S&P Retail Select Industry® Index | | | 300 | % | |
Direxion Daily S&P 500® High Beta Bull 3X Shares | | | | | 300 | % | |
Direxion Daily S&P 500® High Beta Bear 3X Shares | | S&P 500® High Beta Index | | | -300 | % | |
Direxion Daily S&P Biotech Bull 3X Shares | | | | | 300 | % | |
Direxion Daily S&P Biotech Bear 3X Shares | | S&P Biotechnology Select Industry Index | | | -300 | % | |
Direxion Daily Semiconductor Bull 3X Shares | | | | | 300 | % | |
Direxion Daily Semiconductor Bear 3X Shares | | ICE Semiconductor Index | | | -300 | % | |
Direxion Daily Technology Bull 3X Shares | | | | | 300 | % | |
Direxion Daily Technology Bear 3X Shares | | Technology Select Sector Index | | | -300 | % | |
Direxion Daily Transportation Bull 3X Shares | | S&P Transportation Select Industry FMC Capped Index4 | | | 300 | % | |
Direxion Daily Utilities Bull 3X Shares | | Utilities Select Sector Index | | | 300 | % | |
Direxion Daily 7-10 Year Treasury Bull 3X Shares | | | | | 300 | % | |
Direxion Daily 7-10 Year Treasury Bear 3X Shares | | ICE U.S. Treasury 7-10 Year Bond Index | | | -300 | % | |
Direxion Daily 20+ Year Treasury Bull 3X Shares | | | | | 300 | % | |
Direxion Daily 20+ Year Treasury Bear 3X Shares | | ICE U.S. Treasury 20+ Year Bond Index | | | -300 | % | |
1 Effective February 28, 2022, Direxion Daily Real Estate Bull 3X Shares and Direxion Daily Real Estate Bear 3X Shares changed their benchmark index from MSCI U.S. IMI Real Estate 25/50 Index to Real Estate Select Sector Index.
DIREXION ANNUAL REPORT
171
2 Effective February 28, 2022, Direxion Daily Financial Bull 3X Shares and Direxion Daily Financial Bear 3X Shares changed their benchmark index from Russell 1000 Index – Financials to Russell 1000 Financials 40 Act 15/22.5 Daily Capped Index.
3 Effective August 1, 2022, Direxion Daily Financial Bull 3X Shares and Direxion Daily Financial Bear 3X Shares changed their benchmark index from Russell 1000 Financials 40 Act 15/22.5 Daily Capped Index to Financials Select Sector Index.
4 Effective August 1, 2022, Direxion Daily Transportation Bull 3X Shares changed its benchmark index from Dow Jones Transportation AverageTM to S&P Transportation Select Industry FMC Capped Index.
2. SIGNIFICANT ACCOUNTING POLICIES
The following is a summary of significant accounting policies consistently followed by the Funds in the preparation of their financial statements. These policies are in conformity with U.S. generally accepted accounting principles ("GAAP").
a) Investment Valuation – The Net Asset Value ("NAV") per share of each Fund is determined daily, as of the close of regular trading on the New York Stock Exchange ("NYSE") (normally at 4:00 p.m. Eastern time), each day the NYSE is open for business. On days that the Securities Industry and Financial Markets Association ("SIFMA") recommends that the bond markets close all day, Direxion Daily 7-10 Year Treasury Bull 3X Shares, Direxion Daily 7-10 Year Treasury Bear 3X Shares, Direxion Daily 20+ Year Treasury Bull 3X Shares and Direxion Daily 20+ Year Treasury Bear 3X Shares (the "Fixed Income Funds") do not calculate their NAVs, even if the NYSE is open for business. Similarly, on days that SIFMA recommends that the bond markets close early, each of the Fixed Income Funds calculate its NAV as of the time of the recommended close, usually 2:00 p.m. Eastern time, rather than the close of regular trading on the NYSE. A security listed or traded on an exchange, domestic or foreign, is valued at its last sales price on the principal exchange on which it is traded prior to the time when assets are valued. If no sale is reported at that time, the mean of the last bid and asked prices is used. Securities primarily traded on the NASDAQ® Global Market ("NASDAQ") for which market quotations are readily available are valued using the NASDAQ® Official Closing Price ("NOCP") provided by NASDAQ each business day. Over the Counter ("OTC") securities held by a Fund will be valued at the last sales price or, if no sales price is reported, the mean of the last bid and asked price is used. The portfolio securities of a Fund that are listed on national exchanges are valued at the last sales price of such securities; if no sales price is reported, the mean of the last bid and asked price is used. Swap contracts are valued using the closing price of the underlying reference entity or the closing value of the underlying reference index. The Funds valued their investments in money market funds based on their daily net asset values. Futures contracts are valued at settlement price established on the exchange on which they are traded, if that settlement price reflects trading prior to the Valuation Time. If the settlement price established by the exchange reflects trading after the Valuation Time, then the last sales price prior to Valuation time will be used. Securities, swap or future contracts are fair valued as determined by the Adviser under the supervision of the Board of Trustees (the "Board") in the following scenarios: a) reliable market quotations are not readily available; b) the Funds' pricing service does not provide a valuation for such securities; c) the Funds' pricing service provides valuation that in the judgment of the Adviser does not represent fair value; or d) the Fund or Adviser believes the market price is stale.
b) Swap Contracts – Each Fund may enter into equity swap contacts. Standard equity swap contracts are between two parties that agree to exchange the returns (or differentials in rates of return) earned or realized on particular predetermined investments or instruments. The gross amount to be exchanged is calculated with respect to a "notional amount" (i.e. the return on or increase in value of a particular dollar amount invested in a "basket" of securities representing a particular index or industry sector). Each Fund enters into master netting agreements with counterparties to mitigate counterparty credit risk in derivative contracts. A Fund does not offset fair value amounts for derivatives contracts and related cash collateral on the Statement of Assets and Liabilities arising from derivative contracts executed with the same counterparties under such master netting agreements. The Fund's obligations are accrued daily and offset by any amounts owed to the Fund.
In a "long" equity swap agreement, the counterparty will generally agree to pay the Fund the amount, if any, by which the notional amount of the swap contract would have increased in value if the Fund had been invested in the particular securities, plus dividends that would have been received on those securities. The Fund will agree to pay the counterparty a floating rate of interest (e.g., a LIBOR based rate) on the notional amount of the swap contract plus the amount, if any, by which the notional amount would have decreased in value had it been invested in such securities plus, in certain instances, commissions or trading spreads on the notional amounts. Thus, the return on the swap contract should be the gain or loss on the notional amount plus dividends on the securities less the interest and commission paid by the Fund on the notional
DIREXION ANNUAL REPORT
172
amount. Payments may be made at the conclusion of the contract or periodically during its term. In certain instances, market factors such as the interest rate environment and the demand to borrow the securities underlying the swap agreement can cause a scenario in which the counterparty will pay the Fund interest. These swap contracts do not include the delivery of securities by the Funds to the counterparty. The net amount of the excess, if any, of the Fund's obligations owed over its entitlement with respect to each swap is accrued on a daily basis and an amount of cash or liquid assets having an aggregate net asset value at least equal to such accrued excess is maintained in a segregated account by the Fund's custodian. Until a swap contract is settled in cash, the gain or loss on the notional amount plus dividends on the securities less the interest paid by the Fund on the notional amount are recorded as "unrealized gains or losses on swaps" and when cash is exchanged, the gain or loss is recorded as "realized gains or losses on swaps."
Each Fund may enter into swap contracts that provide the opposite return of the underlying benchmark or security ("short" the index or security). The operations are similar to that of the swaps disclosed above except that the counterparty pays interest to the Fund on the notional amount outstanding and the dividends on the underlying securities reduce the return of the swap. However, in certain instances, market factors such as the interest rate environment and the demand to borrow the securities underlying the swap agreement can cause a scenario in which the Fund will pay the counterparty interest. These amounts are netted with any unrealized appreciation or depreciation to determine the value of the swap. The Funds will typically enter into equity swap agreements to obtain leverage in order to meet their objectives.
Accounting Standards Update No. 2013-01 "Disclosures about Offsetting Assets and Liabilities" ("ASU 2013-01"), requires entities to disclose (i) gross and net information about both instruments and transactions eligible for offset in the financial statements, and (ii) instruments and transactions subject to an agreement similar to a master netting agreement. ASU 2013-01 is limited in scope to recognized derivative instruments accounted for under ASC 815 "Derivatives and Hedging", to the extent they are offset in the financial statements or subject to an enforceable master netting arrangement or similar agreement.
In order to better define its contractual rights and to secure rights that will help a Fund mitigate its counterparty risk, a Fund may enter into an International Swaps and Derivatives Association, Inc. Master Agreement ("ISDA Master Agreement") or similar agreement with its counterparties. An ISDA Master Agreement is a bilateral agreement between a Fund and a counterparty that governs OTC derivatives, including swap contracts, and typically contains, among other things, collateral posting terms, netting and rights of set-off provisions in the event of a default and/or termination event. Under an ISDA Master Agreement, a Fund may, under certain circumstances, offset with the counterparty certain derivative financial instruments' payables and receivables to create a single net payment. The provisions of the ISDA Master Agreement typically permit a single net payment in the event of a default (close-out netting) or similar event, including the bankruptcy or insolvency of the counterparty.
Collateral requirements generally differ by type of derivative. Collateral terms are contract-specific for OTC derivatives (e.g. swaps). Generally, for transactions traded under an ISDA Master Agreement, the collateral requirements are calculated by netting the marked-to-market amount for each transaction under such agreement and comparing that amount to the value of any collateral currently pledged by a Fund and the counterparty. Generally, the amount of collateral due from or to the counterparty must exceed a minimum transfer amount threshold before a transfer is required to be made. To the extent amounts due to a Fund from its derivative counterparties are not fully collateralized, contractually or otherwise, the Fund bears the risk of loss from counterparty non-performance.
For financial reporting purposes, the Funds elect to not offset assets and liabilities subject to an ISDA Master Agreement, if any, in the Statements of Assets and Liabilities. Therefore, all qualifying transactions are presented on a gross basis in the Statements of Assets and Liabilities. As of October 31, 2022, the impact of netting of assets and liabilities and the offsetting of collateral pledged or received based on contractual netting/set-off provisions in the ISDA Master Agreement are detailed in the following tables.
In the event of the counterparty's default, bankruptcy or any other event for which the counterparty cannot meet its obligations, a Fund bears the risk of loss equal to the amount of the daily appreciation owed to the Fund. This obligation represents the daily gain accrued to the Fund from the close of business day prior to this event to the day on which this event occurs and the counterparty can no longer meet its obligations. A Fund will enter into swap agreements only with large, well-capitalized and established financial institutions. The creditworthiness of each of the firms that is a party to a swap agreement is monitored by the Adviser. Shareholders may obtain swap counterparty financial statements at www.sec.gov. Swap contracts are subject to credit risk. Credit risk occurs when the financial condition of an issuer of a security or instrument may cause it to default or become unable to pay interest or principal due on the security. The
DIREXION ANNUAL REPORT
173
counterparty to a swap contract might default on its obligations. In addition, the Funds have agreements with certain counterparties with which it trades swap contracts that contain credit risk-related contingent features that could be triggered subject to certain circumstances. Such circumstances include agreed upon net asset value and performance-based thresholds. The maximum exposure to the Funds in regard to potential counterparty default and credit-risk related contingent features at October 31, 2022 is detailed in the following tables. If such credit risk-related contingencies were triggered, the counterparties would have the option to terminate any positions open under the master netting agreement.
Description: Swap Contract
Counterparty: Bank of America Merrill Lynch
| | | | | Assets:
Gross Amounts not
offset in the Statement
of Asset and Liabilities | | | | | | Liabilities:
Gross Amounts not
offset in the Statement
of Asset and Liabilities | | | |
Fund Name | | Gross
Amounts of
Recognized
Assets | | Financial
Instruments | | Collateral
Received | | Net
Amount2 | | Gross
Amounts of
Recognized
Liabilities | | Financial
Instruments | | Collateral
Pledged | | Net
Amount | |
Direxion Daily
Mid Cap
Bull 3X Shares | | $ | 571,972 | | | $ | — | | | $ | 571,9721 | | | $ | — | | | $ | — | | | $ | — | | | $ | — | | | $ | — | | |
Direxion Daily
S&P 500®
Bull 3X Shares | | | — | | | | — | | | | — | | | | — | | | | 2,820,802 | | | | — | | | | 2,820,8021 | | | | — | | |
Direxion Daily
S&P 500®
Bear 3X Shares | | | 30,135,000 | | | | — | | | | 19,560,000 | | | | 10,575,000 | | | | — | | | | — | | | | — | | | | — | | |
Direxion Daily
Small Cap
Bull 3X Shares | | | 35,014,630 | | | | — | | | | 35,014,6301 | | | | — | | | | — | | | | — | | | | — | | | | — | | |
Direxion Daily
Small Cap
Bear 3X Shares | | | — | | | | — | | | | — | | | | — | | | | 7,724,980 | | | | — | | | | 7,724,9801 | | | | — | | |
Direxion Daily
FTSE China
Bull 3X Shares | | | — | | | | — | | | | — | | | | — | | | | 41,234,531 | | | | — | | | | 41,234,5311 | | | | — | | |
Direxion Daily
FTSE China
Bear 3X Shares | | | 41,576,669 | | | | — | | | | 39,431,000 | | | | 2,145,669 | | | | — | | | | — | | | | — | | | | — | | |
Direxion Daily
MSCI South
Korea Bull
3X Shares | | | — | | | | — | | | | — | | | | — | | | | 39,030 | | | | — | | | | 39,0301 | | | | — | | |
Direxion Daily
Consumer
Discretionary
Bull 3X Shares | | | — | | | | — | | | | — | | | | — | | | | 297,959 | | | | — | | | | 297,9591 | | | | — | | |
Direxion Daily
Dow Jones
Internet Bull
3X Shares | | | — | | | | — | | | | — | | | | — | | | | 8,125,451 | | | | — | | | | 8,125,4511 | | | | — | | |
Direxion Daily
Dow Jones
Internet Bear
3X Shares | | | 10,286,449 | | | | — | | | | 9,200,000 | | | | 1,086,449 | | | | — | | | | — | | | | — | | | | — | | |
Direxion Daily
Financial Bull
3X Shares | | | 20,457,003 | | | | — | | | | 20,457,0031 | | | | — | | | | — | | | | — | | | | — | | | | — | | |
Direxion Daily
Financial Bear
3X Shares | | | — | | | | — | | | | — | | | | — | | | | 19,721,401 | | | | — | | | | 19,721,4011 | | | | — | | |
Direxion Daily
Healthcare
Bull 3X Shares | | | 7,724,386 | | | | — | | | | 7,724,3861 | | | | — | | | | — | | | | — | | | | — | | | | — | | |
DIREXION ANNUAL REPORT
174
| | | | | Assets:
Gross Amounts not
offset in the Statement
of Asset and Liabilities | | | | | | Liabilities:
Gross Amounts not
offset in the Statement
of Asset and Liabilities | | | |
Fund Name | | Gross
Amounts of
Recognized
Assets | | Financial
Instruments | | Collateral
Received | | Net
Amount2 | | Gross
Amounts of
Recognized
Liabilities | | Financial
Instruments | | Collateral
Pledged | | Net
Amount | |
Direxion Daily
Homebuilders &
Supplies Bull
3X Shares | | $ | 4,426,410 | | | $ | — | | | $ | 4,426,4101 | | | $ | — | | | $ | — | | | $ | — | | | $ | — | | | $ | — | | |
Direxion Daily
Real Estate
Bull 3X Shares | | | 2,981,927 | | | | — | | | | 2,981,9271 | | | | — | | | | — | | | | — | | | | — | | | | — | | |
Direxion Daily
Real Estate
Bear 3X Shares | | | — | | | | — | | | | — | | | | — | | | | 12,945,381 | | | | — | | | | 12,945,3811 | | | | — | | |
Direxion Daily
Regional Banks
Bull 3X Shares | | | 2,878,625 | | | | — | | | | 2,820,000 | | | | 58,625 | | | | — | | | | — | | | | — | | | | — | | |
Direxion Daily
S&P 500® High
Beta Bull
3X Shares | | | 1,287,370 | | | | — | | | | 1,287,3701 | | | | — | | | | — | | | | — | | | | — | | | | — | | |
Direxion Daily
S&P 500® High
Beta Bear
3X Shares | | | — | | | | — | | | | — | | | | — | | | | 104,559 | | | | — | | | | 104,5591 | | | | — | | |
Direxion Daily
S&P Biotech
Bull 3X Shares | | | 53,975,206 | | | | — | | | | 53,975,2061 | | | | — | | | | — | | | | — | | | | — | | | | — | | |
Direxion Daily
S&P Biotech
Bear 3X Shares | | | — | | | | — | | | | — | | | | — | | | | 5,716,010 | | | | — | | | | 5,716,0101 | | | | — | | |
Direxion Daily
Semiconductor
Bull 3X Shares | | | — | | | | — | | | | — | | | | — | | | | 255,875,812 | | | | — | | | | 255,875,8121 | | | | — | | |
Direxion Daily
Semiconductor
Bear 3X Shares | | | 38,055,359 | | | | — | | | | 34,540,000 | | | | 3,515,359 | | | | — | | | | — | | | | — | | | | — | | |
Direxion Daily
Technology
Bull 3X Shares | | | — | | | | — | | | | — | | | | — | | | | 53,783,598 | | | | — | | | | 53,783,5981 | | | | — | | |
Direxion Daily
Technology
Bear 3X Shares | | | 11,707,581 | | | | — | | | | 10,720,000 | | | | 987,581 | | | | — | | | | — | | | | — | | | | — | | |
Direxion Daily
7-10 Year
Treasury Bull
3X Shares | | | — | | | | — | | | | — | | | | — | | | | 2,056,237 | | | | — | | | | 2,056,2371 | | | | — | | |
Direxion Daily
7-10 Year
Treasury Bear
3X Shares | | | 1,984,989 | | | | — | | | | 1,880,000 | | | | 104,989 | | | | — | | | | — | | | | — | | | | — | | |
Direxion Daily
20+ Year
Treasury Bull
3X Shares | | | — | | | | — | | | | — | | | | — | | | | 59,641,954 | | | | — | | | | 59,641,9541 | | | | — | | |
Direxion Daily
20+ Year
Treasury Bear
3X Shares | | | 36,551,746 | | | | — | | | | 35,330,000 | | | | 1,221,746 | | | | — | | | | — | | | | — | | | | — | | |
1 The amount of collateral shown has been limited such that the net amount cannot be less than zero.
2 The amount shown is the maximum credit exposure of the Fund for the corresponding counterparty.
DIREXION ANNUAL REPORT
175
Description: Swap Contract
Counterparty: BNP Paribas
| | | | | Assets:
Gross Amounts not
offset in the Statement
of Asset and Liabilities | | | | | | Liabilities:
Gross Amounts not
offset in the Statement
of Asset and Liabilities | | | |
Fund Name | | Gross
Amounts of
Recognized
Assets | | Financial
Instruments | | Collateral
Received | | Net
Amount2 | | Gross
Amounts of
Recognized
Liabilities | | Financial
Instruments | | Collateral
Pledged | | Net
Amount | |
Direxion Daily
S&P 500®
Bull 3X Shares | | $ | 14,117,818 | | | $ | — | | | $ | 14,117,8181 | | | $ | — | | | $ | — | | | $ | — | | | $ | — | | | $ | — | | |
Direxion Daily
S&P 500®
Bear 3X Shares | | | 14,283,223 | | | | — | | | | 11,106,885 | | | | 3,176,338 | | | | — | | | | — | | | | — | | | | — | | |
Direxion Daily
Small Cap
Bull 3X Shares | | | 9,803,049 | | | | — | | | | 9,803,0491 | | | | — | | | | — | | | | — | | | | — | | | | — | | |
Direxion Daily
Small Cap
Bear 3X Shares | | | 662,785 | | | | — | | | | 620,000 | | | | 42,785 | | | | — | | | | — | | | | — | | | | — | | |
Direxion Daily
FTSE China
Bull 3X Shares | | | — | | | | — | | | | — | | | | — | | | | 47,741,555 | | | | — | | | | 47,741,5551 | | | | — | | |
Direxion Daily
FTSE China
Bear 3X Shares | | | 2,990,101 | | | | — | | | | — | | | | 2,990,101 | | | | — | | | | — | | | | — | | | | — | | |
Direxion Daily
FTSE Europe
Bull 3X Shares | | | — | | | | — | | | | — | | | | — | | | | 402,487 | | | | — | | | | 402,4871 | | | | — | | |
Direxion Daily
Aerospace &
Defense Bull
3X Shares | | | 3,305,404 | | | | — | | | | 3,305,4041 | | | | — | | | | — | | | | — | | | | — | | | | — | | |
Direxion Daily
Financial
Bull 3X Shares | | | 10,084,987 | | | | — | | | | 10,084,9871 | | | | — | | | | — | | | | — | | | | — | | | | — | | |
Direxion Daily
Homebuilders &
Supplies Bull
3X Shares | | | 563,842 | | | | — | | | | 563,8421 | | | | — | | | | — | | | | — | | | | — | | | | — | | |
Direxion Daily
S&P Biotech
Bull 3X Shares | | | — | | | | — | | | | — | | | | — | | | | 2,593,769 | | | | — | | | | 2,593,7691 | | | | — | | |
Direxion Daily
Semiconductor
Bull 3X Shares | | | — | | | | — | | | | — | | | | — | | | | 91,730,636 | | | | — | | | | 91,730,6361 | | | | — | | |
Direxion Daily
Semiconductor
Bear 3X Shares | | | 53,944,558 | | | | — | | | | 48,280,000 | | | | 5,664,558 | | | | — | | | | — | | | | — | | | | — | | |
Direxion Daily
Technology
Bull 3X Shares | | | — | | | | — | | | | — | | | | — | | | | 1,451,497 | | | | — | | | | 1,451,4971 | | | | — | | |
Direxion Daily
Technology
Bear 3X Shares | | | 378,880 | | | | — | | | | 270,000 | | | | 108,880 | | | | — | | | | — | | | | — | | | | — | | |
Direxion Daily
7-10 Year
Treasury Bull
3X Shares | | | — | | | | — | | | | — | | | | — | | | | 660,723 | | | | — | | | | 660,7231 | | | | — | | |
Direxion Daily
7-10 Year
Treasury Bear
3X Shares | | | 264,229 | | | | — | | | | — | | | | 264,229 | | | | — | | | | — | | | | — | | | | — | | |
DIREXION ANNUAL REPORT
176
| | | | | Assets:
Gross Amounts not
offset in the Statement
of Asset and Liabilities | | | | | | Liabilities:
Gross Amounts not
offset in the Statement
of Asset and Liabilities | | | |
Fund Name | | Gross
Amounts of
Recognized
Assets | | Financial
Instruments | | Collateral
Received | | Net
Amount2 | | Gross
Amounts of
Recognized
Liabilities | | Financial
Instruments | | Collateral
Pledged | | Net
Amount | |
Direxion Daily
20+ Year
Treasury Bull
3X Shares | | $ | — | | | $ | — | | | $ | — | | | $ | — | | | $ | 27,507,982 | | | $ | — | | | $ | 27,507,9821 | | | $ | — | | |
Direxion Daily
20+ Year
Treasury Bear
3X Shares | | | 44,707,733 | | | | — | | | | 42,010,000 | | | | 2,697,733 | | | | — | | | | — | | | | — | | | | — | | |
1 The amount of collateral shown has been limited such that the net amount cannot be less than zero.
2 The amount shown is the maximum credit exposure of the Fund for the corresponding counterparty.
Description: Swap Contract
Counterparty: Barclays
| | | | | Assets:
Gross Amounts not
offset in the Statement
of Asset and Liabilities | | | | | | Liabilities:
Gross Amounts not
offset in the Statement
of Asset and Liabilities | | | |
Fund Name | | Gross
Amounts of
Recognized
Assets | | Financial
Instruments | | Collateral
Received | | Net
Amount2 | | Gross
Amounts of
Recognized
Liabilities | | Financial
Instruments | | Collateral
Pledged | | Net
Amount | |
Direxion Daily
S&P 500®
Bull 3X Shares | | $ | 29,471,067 | | | $ | — | | | $ | 29,471,0671 | | | $ | — | | | $ | — | | | $ | — | | | $ | — | | | $ | — | | |
Direxion Daily
S&P 500®
Bear 3X Shares | | | — | | | | — | | | | — | | | | — | | | | 23,586,877 | | | | — | | | | 23,586,8771 | | | | — | | |
Direxion Daily
Small Cap
Bull 3X Shares | | | 23,585,387 | | | | — | | | | 21,670,000 | | | | 1,915,387 | | | | — | | | | — | | | | — | | | | — | | |
Direxion Daily
Small Cap
Bear 3X Shares | | | — | | | | — | | | | — | | | | — | | | | 11,471,112 | | | | — | | | | 11,471,1121 | | | | — | | |
Direxion Daily
FTSE China
Bull 3X Shares | | | — | | | | — | | | | — | | | | — | | | | 24,238,986 | | | | — | | | | 24,238,9861 | | | | — | | |
Direxion Daily
MSCI Mexico
Bull 3X Shares | | | 836,170 | | | | — | | | | 600,000 | | | | 236,170 | | | | — | | | | — | | | | — | | | | — | | |
Direxion Daily
Financial Bull
3X Shares | | | 27,500,116 | | | | — | | | | 27,500,1161 | | | | — | | | | — | | | | — | | | | — | | | | — | | |
Direxion Daily
Healthcare
Bull 3X Shares | | | 2,504,487 | | | | — | | | | 2,504,4871 | | | | — | | | | — | | | | — | | | | — | | | | — | | |
Direxion Daily
Homebuilders &
Supplies Bull
3X Shares | | | 2,441,245 | | | | — | | | | 2,441,2451 | | | | — | | | | — | | | | — | | | | — | | | | — | | |
Direxion Daily
Industrials Bull
3X Shares | | | 1,366,786 | | | | — | | | | 1,366,7861 | | | | — | | | | — | | | | — | | | | — | | | | — | | |
DIREXION ANNUAL REPORT
177
| | | | | Assets:
Gross Amounts not
offset in the Statement
of Asset and Liabilities | | | | | | Liabilities:
Gross Amounts not
offset in the Statement
of Asset and Liabilities | | | |
Fund Name | | Gross
Amounts of
Recognized
Assets | | Financial
Instruments | | Collateral
Received | | Net
Amount2 | | Gross
Amounts of
Recognized
Liabilities | | Financial
Instruments | | Collateral
Pledged | | Net
Amount | |
Direxion Daily
Pharmaceutical &
Medical Bull
3X Shares | | $ | 537,410 | | | $ | — | | | $ | 500,000 | | | $ | 37,410 | | | $ | — | | | $ | — | | | $ | — | | | $ | — | | |
Direxion Daily
Regional Banks
Bull 3X Shares | | | 6,165,769 | | | | — | | | | 6,070,000 | | | | 95,769 | | | | — | | | | — | | | | — | | | | — | | |
Direxion Daily
S&P 500®
High Beta
Bull 3X Shares | | | 3,640,069 | | | | — | | | | 3,640,0691 | | | | — | | | | — | | | | — | | | | — | | | | — | | |
Direxion Daily
S&P 500®
High Beta
Bear 3X Shares | | | 11,993,507 | | | | — | | | | 11,460,000 | | | | 533,507 | | | | — | | | | — | | | | — | | | | — | | |
Direxion Daily
S&P Biotech
Bull 3X Shares | | | — | | | | — | | | | — | | | | — | | | | 29,118,850 | | | | — | | | | 29,118,8501 | | | | — | | |
Direxion Daily
S&P Biotech
Bear 3X Shares | | | 3,994,272 | | | | — | | | | 1,170,000 | | | | 2,824,272 | | | | — | | | | — | | | | — | | | | — | | |
Direxion Daily
Semiconductor
Bull 3X Shares | | | — | | | | — | | | | — | | | | — | | | | 168,978,420 | | | | — | | | | 168,978,4201 | | | | — | | |
Direxion Daily
Semiconductor
Bear 3X Shares | | | 7,377,084 | | | | — | | | | 2,310,000 | | | | 5,067,084 | | | | — | | | | — | | | | — | | | | — | | |
Direxion Daily
Technology
Bull 3X Shares | | | 12,481,428 | | | | — | | | | 12,481,4281 | | | | — | | | | — | | | | — | | | | — | | | | — | | |
Direxion Daily
Technology
Bear 3X Shares | | | 1,960,910 | | | | — | | | | 300,000 | | | | 1,660,910 | | | | — | | | | — | | | | — | | | | — | | |
Direxion Daily
Utilities
Bull 3X Shares | | | 4,633 | | | | — | | | | — | | | | 4,633 | | | | — | | | | — | | | | — | | | | — | | |
Direxion Daily
7-10 Year
Treasury Bull
3X Shares | | | — | | | | — | | | | — | | | | — | | | | 96,909 | | | | — | | | | 96,9091 | | | | — | | |
Direxion Daily
7-10 Year
Treasury Bear
3X Shares | | | 2,151,254 | | | | — | | | | 1,790,000 | | | | 361,254 | | | | — | | | | — | | | | — | | | | — | | |
1 The amount of collateral shown has been limited such that the net amount cannot be less than zero.
2 The amount shown is the maximum credit exposure of the Fund for the corresponding counterparty.
DIREXION ANNUAL REPORT
178
Description: Swap Contract
Counterparty: Citibank N.A.
| | | | | Assets:
Gross Amounts not
offset in the Statement
of Asset and Liabilities | | | | | | Liabilities:
Gross Amounts not
offset in the Statement
of Asset and Liabilities | | | |
Fund Name | | Gross
Amounts of
Recognized
Assets | | Financial
Instruments | | Collateral
Received | | Net
Amount2 | | Gross
Amounts of
Recognized
Liabilities | | Financial
Instruments | | Collateral
Pledged | | Net
Amount | |
Direxion Daily
Mid Cap
Bull 3X Shares | | $ | — | | | $ | — | | | $ | — | | | $ | — | | | $ | 146,127 | | | $ | — | | | $ | 146,1271 | | | $ | — | | |
Direxion Daily
S&P 500®
Bull 3X Shares | | | — | | | | — | | | | — | | | | — | | | | 20,250,165 | | | | — | | | | 20,250,1651 | | | | — | | |
Direxion Daily
S&P 500®
Bear 3X Shares | | | 12,667,408 | | | | — | | | | 9,305,000 | | | | 3,362,408 | | | | — | | | | — | | | | — | | | | — | | |
Direxion Daily
Small Cap
Bull 3X Shares | | | 31,222,391 | | | | — | | | | 19,124,000 | | | | 12,098,391 | | | | — | | | | — | | | | — | | | | — | | |
Direxion Daily
Small Cap
Bear 3X Shares | | | 1,382,280 | | | | — | | | | 1,382,2801 | | | | — | | | | — | | | | — | | | | — | | | | — | | |
Direxion Daily
FTSE Europe
Bull 3X Shares | | | — | | | | — | | | | — | | | | — | | | | 1,187,780 | | | | — | | | | 1,187,7801 | | | | — | | |
Direxion Daily
MSCI Emerging
Markets Bull
3X Shares | | | — | | | | — | | | | — | | | | — | | | | 7,637,060 | | | | — | | | | 7,637,0601 | | | | — | | |
Direxion Daily
MSCI Emerging
Markets Bear
3X Shares | | | 7,641,378 | | | | — | | | | 7,589,646 | | | | 51,732 | | | | — | | | | — | | | | — | | | | — | | |
Direxion Daily
MSCI South
Korea Bull
3X Shares | | | — | | | | — | | | | — | | | | — | | | | 888,675 | | | | — | | | | 888,6751 | | | | — | | |
Direxion Daily
Aerospace &
Defense Bull
3X Shares | | | 18,555,294 | | | | — | | | | 18,555,2941 | | | | — | | | | — | | | | — | | | | — | | | | — | | |
Direxion Daily
Dow Jones
Internet Bull
3X Shares | | | — | | | | — | | | | — | | | | — | | | | 178,473 | | | | — | | | | 178,4731 | | | | — | | |
Direxion Daily
Dow Jones
Internet Bear
3X Shares | | | 1,477,039 | | | | — | | | | 1,252,000 | | | | 225,039 | | | | — | | | | — | | | | — | | | | — | | |
Direxion Daily
Financial Bull
3X Shares | | | 17,533,698 | | | | — | | | | 15,819,001 | | | | 1,714,697 | | | | — | | | | — | | | | — | | | | — | | |
Direxion Daily
Homebuilders &
Supplies Bull
3X Shares | | | 903,348 | | | | — | | | | 903,3481 | | | | — | | | | — | | | | — | | | | — | | | | — | | |
Direxion Daily
Industrials
Bull 3X Shares | | | 179,531 | | | | — | | | | — | | | | 179,531 | | | | — | | | | — | | | | — | | | | — | | |
DIREXION ANNUAL REPORT
179
| | | | | Assets:
Gross Amounts not
offset in the Statement
of Asset and Liabilities | | | | | | Liabilities:
Gross Amounts not
offset in the Statement
of Asset and Liabilities | | | |
Fund Name | | Gross
Amounts of
Recognized
Assets | | Financial
Instruments | | Collateral
Received | | Net
Amount2 | | Gross
Amounts of
Recognized
Liabilities | | Financial
Instruments | | Collateral
Pledged | | Net
Amount | |
Direxion Daily
Pharmaceutical &
Medical Bull
3X Shares | | $ | — | | | $ | — | | | $ | — | | | $ | — | | | $ | 201,806 | | | $ | — | | | $ | 201,8061 | | | $ | — | | |
Direxion Daily
Retail Bull
3X Shares | | | 347,773 | | | | — | | | | 347,7731 | | | | — | | | | — | | | | — | | | | — | | | | — | | |
Direxion Daily
S&P 500®
High Beta
Bull 3X Shares | | | — | | | | — | | | | — | | | | — | | | | 233,162 | | | | — | | | | 233,1621 | | | | — | | |
Direxion Daily
S&P Biotech
Bull 3X Shares | | | 29,629,455 | | | | — | | | | 27,093,000 | | | | 2,536,455 | | | | — | | | | — | | | | — | | | | — | | |
Direxion Daily
S&P Biotech
Bear 3X Shares | | | — | | | | — | | | | — | | | | — | | | | 1,152,085 | | | | — | | | | 1,152,0851 | | | | — | | |
Direxion Daily
Semiconductor
Bull 3X Shares | | | — | | | | — | | | | — | | | | — | | | | 214,149,480 | | | | — | | | | 214,149,4801 | | | | — | | |
Direxion Daily
Semiconductor
Bear 3X Shares | | | 41,537,915 | | | | — | | | | 37,186,019 | | | | 4,351,896 | | | | — | | | | — | | | | — | | | | — | | |
Direxion Daily
Technology
Bull 3X Shares | | | 374,876 | | | | — | | | | 374,8761 | | | | — | | | | — | | | | — | | | | — | | | | — | | |
Direxion Daily
Technology
Bear 3X Shares | | | 8,413,647 | | | | — | | | | 7,615,539 | | | | 798,108 | | | | — | | | | — | | | | — | | | | — | | |
Direxion Daily
Transportation
Bull 3X Shares | | | — | | | | — | | | | — | | | | — | | | | 2,524,587 | | | | — | | | | 2,524,5871 | | | | — | | |
Direxion Daily
20+ Year
Treasury Bull
3X Shares | | | — | | | | — | | | | — | | | | — | | | | 24,014,883 | | | | — | | | | 24,014,8831 | | | | — | | |
Direxion Daily
20+ Year
Treasury Bear
3X Shares | | | 9,700,956 | | | | — | | | | 6,809,001 | | | | 2,891,955 | | | | — | | | | — | | | | — | | | | — | | |
1 The amount of collateral shown has been limited such that the net amount cannot be less than zero.
2 The amount shown is the maximum credit exposure of the Fund for the corresponding counterparty.
DIREXION ANNUAL REPORT
180
Description: Swap Contract
Counterparty: Goldman Sachs
| | | | | Assets:
Gross Amounts not
offset in the Statement
of Asset and Liabilities | | | | | | Liabilities:
Gross Amounts not
offset in the Statement
of Asset and Liabilities | | | |
Fund Name | | Gross
Amounts of
Recognized
Assets | | Financial
Instruments | | Collateral
Received | | Net
Amount2 | | Gross
Amounts of
Recognized
Liabilities | | Financial
Instruments | | Collateral
Pledged | | Net
Amount | |
Direxion Daily
S&P 500®
Bull 3X Shares | | $ | 7,488,466 | | | $ | — | | | $ | 7,488,4661 | | | $ | — | | | $ | — | | | $ | — | | | $ | — | | | $ | — | | |
Direxion Daily
S&P 500®
Bear 3X Shares | | | 23,007,730 | | | | — | | | | 10,370,000 | | | | 12,637,730 | | | | — | | | | — | | | | — | | | | — | | |
Direxion Daily
FTSE China
Bear 3X Shares | | | 1,762,028 | | | | — | | | | — | | | | 1,762,028 | | | | — | | | | — | | | | — | | | | — | | |
Direxion Daily
FTSE Europe
Bull 3X Shares | | | 51,891 | | | | — | | | | — | | | | 51,891 | | | | — | | | | — | | | | — | | | | — | | |
Direxion Daily
Financial
Bull 3X Shares | | | 41,996,606 | | | | — | | | | 41,996,6061 | | | | — | | | | — | | | | — | | | | — | | | | — | | |
Direxion Daily
Financial
Bear 3X Shares | | | — | | | | — | | | | — | | | | — | | | | 1,676,616 | | | | — | | | | 1,676,6161 | | | | — | | |
Direxion Daily
S&P Biotech
Bull 3X Shares | | | 43,826,662 | | | | — | | | | 43,826,6621 | | | | — | | | | — | | | | — | | | | — | | | | — | | |
Direxion Daily
S&P Biotech
Bear 3X Shares | | | — | | | | — | | | | — | | | | — | | | | 8,816,375 | | | | — | | | | 8,816,3751 | | | | — | | |
Direxion Daily
Semiconductor
Bull 3X Shares | | | 14,120,151 | | | | — | | | | 14,120,1511 | | | | — | | | | — | | | | — | | | | — | | | | — | | |
Direxion Daily
Semiconductor
Bear 3X Shares | | | — | | | | — | | | | — | | | | — | | | | 1,485,602 | | | | — | | | | 1,485,6021 | | | | — | | |
Direxion Daily
Technology
Bull 3X Shares | | | — | | | | — | | | | — | | | | — | | | | 35,161,297 | | | | — | | | | 35,161,2971 | | | | — | | |
Direxion Daily
Technology
Bear 3X Shares | | | 11,841,827 | | | | — | | | | 10,110,000 | | | | 1,731,827 | | | | — | | | | — | | | | — | | | | — | | |
Direxion Daily
20+ Year
Treasury Bull
3X Shares | | | — | | | | — | | | | — | | | | — | | | | 1,991,184 | | | | — | | | | 1,991,1841 | | | | — | | |
Direxion Daily
20+ Year
Treasury Bear
3X Shares | | | — | | | | — | | | | — | | | | — | | | | 6,461,655 | | | | — | | | | 6,461,6551 | | | | — | | |
1 The amount of collateral shown has been limited such that the net amount cannot be less than zero.
2 The amount shown is the maximum credit exposure of the Fund for the corresponding counterparty.
DIREXION ANNUAL REPORT
181
Description: Swap Contract
Counterparty: J.P. Morgan
| | | | | Assets:
Gross Amounts not
offset in the Statement
of Asset and Liabilities | | | | | | Liabilities:
Gross Amounts not
offset in the Statement
of Asset and Liabilities | | | |
Fund Name | | Gross
Amounts of
Recognized
Assets | | Financial
Instruments | | Collateral
Received | | Net
Amount2 | | Gross
Amounts of
Recognized
Liabilities | | Financial
Instruments | | Collateral
Pledged | | Net
Amount | |
Direxion Daily
Mid Cap
Bull 3X Shares | | $ | 1,855,131 | | | $ | — | | | $ | 1,855,1311 | | | $ | — | | | $ | — | | | $ | — | | | $ | — | | | $ | — | | |
Direxion Daily
S&P 500®
Bull 3X Shares | | | 23,956,077 | | | | — | | | | 23,956,0771 | | | | — | | | | — | | | | — | | | | — | | | | — | | |
Direxion Daily
S&P 500®
Bear 3X Shares | | | — | | | | — | | | | — | | | | — | | | | 3,933,681 | | | | — | | | | 3,933,6811 | | | | — | | |
Direxion Daily
Small Cap
Bull 3X Shares | | | — | | | | — | | | | — | | | | — | | | | 7,863,248 | | | | — | | | | 7,863,2481 | | | | — | | |
Direxion Daily
Small Cap
Bear 3X Shares | | | — | | | | — | | | | — | | | | — | | | | 926,559 | | | | — | | | | 926,5591 | | | | — | | |
Direxion Daily
FTSE Europe
Bull 3X Shares | | | 705,399 | | | | — | | | | 705,3991 | | | | — | | | �� | — | | | | — | | | | — | | | | — | | |
Direxion Daily
MSCI Emerging
Markets Bull
3X Shares | | | — | | | | — | | | | — | | | | — | | | | 11,611,398 | | | | — | | | | 11,611,3981 | | | | — | | |
Direxion Daily
MSCI Emerging
Markets Bear
3X Shares | | | 6,272,431 | | | | — | | | | 6,049,116 | | | | 223,315 | | | | — | | | | — | | | | — | | | | — | | |
Direxion Daily
MSCI Mexico
Bull 3X Shares | | | 102,965 | | | | — | | | | — | | | | 102,965 | | | | — | | | | — | | | | — | | | | — | | |
Direxion Daily
MSCI South
Korea Bull
3X Shares | | | — | | | | — | | | | — | | | | — | | | | 548,253 | | | | — | | | | 548,2531 | | | | — | | |
Direxion Daily
Aerospace &
Defense Bull
3X Shares | | | 18,785,726 | | | | — | | | | 18,785,7261 | | | | — | | | | — | | | | — | | | | — | | | | — | | |
Direxion Daily
Consumer
Discretionary
Bull 3X Shares | | | — | | | | — | | | | — | | | | — | | | | 402,137 | | | | — | | | | 402,1371 | | | | — | | |
Direxion Daily
Dow Jones
Internet Bull
3X Shares | | | 384,213 | | | | — | | | | 384,2131 | | | | — | | | | — | | | | — | | | | — | | | | — | | |
Direxion Daily
Financial Bull
3X Shares | | | 32,375,100 | | | | — | | | | 32,375,1001 | | | | — | | | | — | | | | — | | | | — | | | | — | | |
Direxion Daily
Financial Bear
3X Shares | | | — | | | | — | | | | — | | | | — | | | | 3,726,926 | | | | — | | | | 3,726,9261 | | | | — | | |
Direxion Daily
Healthcare
Bull 3X Shares | | | 3,074,266 | | | | — | | | | 3,074,2661 | | | | — | | | | — | | | | — | | | | — | | | | — | | |
DIREXION ANNUAL REPORT
182
| | | | | Assets:
Gross Amounts not
offset in the Statement
of Asset and Liabilities | | | | | | Liabilities:
Gross Amounts not
offset in the Statement
of Asset and Liabilities | | | |
Fund Name | | Gross
Amounts of
Recognized
Assets | | Financial
Instruments | | Collateral
Received | | Net
Amount2 | | Gross
Amounts of
Recognized
Liabilities | | Financial
Instruments | | Collateral
Pledged | | Net
Amount | |
Direxion Daily
Industrials Bull
3X Shares | | $ | 757,436 | | | $ | — | | | $ | 757,4361 | | | $ | — | | | $ | — | | | $ | — | | | $ | — | | | $ | — | | |
Direxion Daily
Real Estate
Bull 3X Shares | | | 1,131,255 | | | | — | | | | 1,131,2551 | | | | — | | | | — | | | | — | | | | — | | | | — | | |
Direxion Daily
Real Estate
Bear 3X Shares | | | — | | | | — | | | | — | | | | — | | | | 1,479,066 | | | | — | | | | 1,479,0661 | | | | — | | |
Direxion Daily
Regional
Banks Bull
3X Shares | | | 2,253,265 | | | | — | | | | 2,162,041 | | | | 91,224 | | | | — | | | | — | | | | — | | | | — | | |
Direxion Daily
Retail Bull
3X Shares | | | 2,264,612 | | | | — | | | | 1,750,000 | | | | 514,612 | | | | — | | | | — | | | | — | | | | — | | |
Direxion Daily
S&P 500®
High Beta
Bear 3X Shares | | | — | | | | — | | | | — | | | | — | | | | 224,591 | | | | — | | | | 224,5911 | | | | — | | |
Direxion Daily
S&P Biotech
Bull 3X Shares | | | 1,444,155 | | | | — | | | | 1,444,1551 | | | | — | | | | — | | | | — | | | | — | | | | — | | |
Direxion Daily
S&P Biotech
Bear 3X Shares | | | 8,889,722 | | | | — | | | | 6,809,928 | | | | 2,079,794 | | | | — | | | | — | | | | — | | | | — | | |
Direxion Daily
Semiconductor
Bull 3X Shares | | | 46,788,719 | | | | — | | | | 46,788,7191 | | | | — | | | | — | | | | — | | | | — | | | | — | | |
Direxion Daily
Semiconductor
Bear 3X Shares | | | — | | | | — | | | | — | | | | — | | | | 18,107,850 | | | | — | | | | 18,107,8501 | | | | — | | |
Direxion Daily
Technology
Bull 3X Shares | | | 5,740,904 | | | | — | | | | 5,740,9041 | | | | — | | | | — | | | | — | | | | — | | | | — | | |
Direxion Daily
Technology
Bear 3X Shares | | | 409,600 | | | | — | | | | — | | | | 409,600 | | | | — | | | | — | | | | — | | | | — | | |
Direxion Daily
Utilities Bull
3X Shares | | | — | | | | — | | | | — | | | | — | | | | 140,578 | | | | — | | | | 140,5781 | | | | — | | |
Direxion Daily
7-10 Year
Treasury Bull
3X Shares | | | — | | | | — | | | | — | | | | — | | | | 1,267,033 | | | | — | | | | 1,267,0331 | | | | — | | |
Direxion Daily
7-10 Year
Treasury Bear
3X Shares | | | 1,915,134 | | | | — | | | | 1,849,000 | | | | 66,134 | | | | — | | | | — | | | | — | | | | — | | |
Direxion Daily
20+ Year
Treasury Bull
3X Shares | | | — | | | | — | | | | — | | | | — | | | | 25,179,820 | | | | — | | | | 25,179,8201 | | | | — | | |
Direxion Daily
20+ Year
Treasury Bear
3X Shares | | | 25,303,332 | | | | — | | | | 22,936,331 | | | | 2,367,001 | | | | — | | | | — | | | | — | | | | — | | |
1 The amount of collateral shown has been limited such that the net amount cannot be less than zero.
2 The amount shown is the maximum credit exposure of the Fund for the corresponding counterparty.
DIREXION ANNUAL REPORT
183
Description: Swap Contract
Counterparty: UBS Securities LLC
| | | | | Assets:
Gross Amounts not
offset in the Statement
of Asset and Liabilities | | | | | | Liabilities:
Gross Amounts not
offset in the Statement
of Asset and Liabilities | | | |
Fund Name | | Gross
Amounts of
Recognized
Assets | | Financial
Instruments | | Collateral
Received | | Net
Amount2 | | Gross
Amounts of
Recognized
Liabilities | | Financial
Instruments | | Collateral
Pledged | | Net
Amount | |
Direxion Daily
Mid Cap
Bull 3X Shares | | $ | 1,606,934 | | | $ | — | | | $ | 1,606,9341 | | | $ | — | | | $ | — | | | $ | — | | | $ | — | | | $ | — | | |
Direxion Daily
S&P 500®
Bull 3X Shares | | | 12,510,889 | | | | — | | | | 12,510,8891 | | | | — | | | | — | | | | — | | | | — | | | | — | | |
Direxion Daily
S&P 500®
Bear 3X Shares | | | 25,094,939 | | | | — | | | | 21,780,000 | | | | 3,314,939 | | | | — | | | | — | | | | — | | | | — | | |
Direxion Daily
Small Cap
Bull 3X Shares | | | 23,326,310 | | | | — | | | | 23,326,3101 | | | | — | | | | — | | | | — | | | | — | | | | — | | |
Direxion Daily
Small Cap
Bear 3X Shares | | | — | | | | — | | | | — | | | | — | | | | 12,245,805 | | | | — | | | | 12,245,8051 | | | | — | | |
Direxion Daily
FTSE China
Bull 3X Shares | | | — | | | | — | | | | — | | | | — | | | | 38,833,464 | | | | — | | | | 38,833,4641 | | | | — | | |
Direxion Daily
FTSE China
Bear 3X Shares | | | 7,784,629 | | | | — | | | | — | | | | 7,784,629 | | | | — | | | | — | | | | — | | | | — | | |
Direxion Daily
FTSE Europe
Bull 3X Shares | | | — | | | | — | | | | — | | | | — | | | | 332,143 | | | | — | | | | 332,1431 | | | | — | | |
Direxion Daily
MSCI Emerging
Markets Bull
3X Shares | | | — | | | | — | | | | — | | | | — | | | | 2,919,844 | | | | — | | | | 2,919,8441 | | | | — | | |
Direxion Daily
MSCI Emerging
Markets Bear
3X Shares | | | 278,960 | | | | — | | | | — | | | | 278,960 | | | | — | | | | — | | | | — | | | | — | | |
Direxion Daily
MSCI Mexico
Bull 3X Shares | | | 1,711,108 | | | | — | | | | 1,420,000 | | | | 291,108 | | | | — | | | | — | | | | — | | | | — | | |
Direxion Daily
Consumer
Discretionary
Bull 3X Shares | | | 587,560 | | | | — | | | | 587,5601 | | | | — | | | | — | | | | — | | | | — | | | | — | | |
Direxion Daily
Dow Jones
Internet Bull
3X Shares | | | — | | | | — | | | | — | | | | — | | | | 4,649,078 | | | | — | | | | 4,649,0781 | | | | — | | |
Direxion Daily
Dow Jones
Internet Bear
3X Shares | | | 8,061,563 | | | | — | | | | 7,170,000 | | | | 891,563 | | | | — | | | | — | | | | — | | | | — | | |
Direxion Daily
Financial Bull
3X Shares | | | 2,129,981 | | | | — | | | | 2,129,9811 | | | | — | | | | — | | | | — | | | | — | | | | — | | |
Direxion Daily
Financial Bear
3X Shares | | | — | | | | — | | | | — | | | | — | | | | 397,242 | | | | — | | | | 397,2421 | | | | — | | |
Direxion Daily
Healthcare
Bull 3X Shares | | | 5,704,589 | | | | — | | | | 5,704,5891 | | | | — | | | | — | | | | — | | | | — | | | | — | | |
DIREXION ANNUAL REPORT
184
| | | | | Assets:
Gross Amounts not
offset in the Statement
of Asset and Liabilities | | | | | | Liabilities:
Gross Amounts not
offset in the Statement
of Asset and Liabilities | | | |
Fund Name | | Gross
Amounts of
Recognized
Assets | | Financial
Instruments | | Collateral
Received | | Net
Amount2 | | Gross
Amounts of
Recognized
Liabilities | | Financial
Instruments | | Collateral
Pledged | | Net
Amount | |
Direxion Daily
Pharmaceutical &
Medical Bull
3X Shares | | $ | 266,526 | | | $ | — | | | $ | 266,5261 | | | $ | — | | | $ | — | | | $ | — | | | $ | — | | | $ | — | | |
Direxion Daily
Real Estate
Bear 3X Shares | | | 14,605,246 | | | | — | | | | 14,340,000 | | | | 265,246 | | | | — | | | | — | | | | — | | | | — | | |
Direxion Daily
Regional Banks
Bull 3X Shares | | | 12,704,590 | | | | — | | | | 12,550,000 | | | | 154,590 | | | | — | | | | — | | | | — | | | | — | | |
Direxion Daily
Retail Bull
3X Shares | | | 1,420,713 | | | | — | | | | 1,420,7131 | | | | — | | | | — | | | | — | | | | — | | | | — | | |
Direxion Daily
S&P 500®
High Beta
Bull 3X Shares | | | 946,728 | | | | — | | | | 946,7281 | | | | — | | | | — | | | | — | | | | — | | | | — | | |
Direxion Daily
S&P 500®
High Beta
Bear 3X Shares | | | 1,666,861 | | | | — | | | | 1,220,000 | | | | 446,861 | | | | — | | | | — | | | | — | | | | — | | |
Direxion Daily
S&P Biotech
Bull 3X Shares | | | 7,058,616 | | | | — | | | | 7,058,6161 | | | | — | | | | — | | | | — | | | | — | | | | — | | |
Direxion Daily
S&P Biotech
Bear 3X Shares | | | 3,249,952 | | | | — | | | | — | | | | 3,249,952 | | | | — | | | | — | | | | — | | | | — | | |
Direxion Daily
Semiconductor
Bull 3X Shares | | | — | | | | — | | | | — | | | | — | | | | 138,967,957 | | | | — | | | | 138,967,9571 | | | | — | | |
Direxion Daily
Semiconductor
Bear 3X Shares | | | 26,354,843 | | | | — | | | | 20,160,000 | | | | 6,194,843 | | | | — | | | | — | | | | — | | | | — | | |
Direxion Daily
Technology
Bull 3X Shares | | | — | | | | — | | | | — | | | | — | | | | 43,775,776 | | | | — | | | | 43,775,7761 | | | | — | | |
Direxion Daily
Technology
Bear 3X Shares | | | 7,310,263 | | | | — | | | | 7,310,2631 | | | | — | | | | — | | | | — | | | | — | | | | — | | |
Direxion Daily
Transportation
Bull 3X Shares | | | 755,230 | | | | — | | | | 755,2301 | | | | — | | | | — | | | | — | | | | — | | | | — | | |
Direxion Daily
Utilities Bull
3X Shares | | | 1,301,525 | | | | — | | | | 1,301,5251 | | | | — | | | | — | | | | — | | | | — | | | | — | | |
Direxion Daily
20+ Year
Treasury Bull
3X Shares | | | — | | | | — | | | | — | | | | — | | | | 37,845,236 | | | | — | | | | 37,845,2361 | | | | — | | |
Direxion Daily
20+ Year
Treasury Bear
3X Shares | | | 39,027,515 | | | | — | | | | 36,610,000 | | | | 2,417,515 | | | | — | | | | — | | | | — | | | | — | | |
1 The amount of collateral shown has been limited such that the net amount cannot be less than zero.
2 The amount shown is the maximum credit exposure of the Fund for the corresponding counterparty.
DIREXION ANNUAL REPORT
185
c) Futures Contracts – Each Fund may purchase and sell futures contracts. A Fund may use futures contracts to gain exposure to, or hedge against, changes in the values of commodities, equities, interest rates or foreign currencies. Upon entering into a contract, the Fund deposits and maintains as collateral such initial margin as required by the exchange on which the transaction is effected. Pursuant to the contract, the Fund agrees to receive from or pay to the broker an amount of cash equal to the daily fluctuation in value of the contract. Such receipts or payments are known as "variation margin" and are recorded by the Fund as unrealized gains and losses. When the contract is closed, the Fund records a realized gain or loss equal to the difference between the value of the contract at the time it was opened and the value at the time it was closed. As collateral for futures contracts, the Fund is required under the 1940 Act to maintain assets consisting of cash, cash equivalents or liquid securities. This collateral is required to be adjusted daily to reflect the market value of the purchase obligation for long futures contracts or the market value of the instrument underlying the contract, but not less than the market price at which the futures contract was established, for short futures contracts.
d) Risks of Futures Contracts, Options on Futures Contracts and Short Positions – The risks inherent in the use of options, futures contracts, options on futures contracts and short positions include 1) adverse changes in the fair value of such instruments; 2) imperfect correlation between the price of options and futures contracts and options thereon and movements in the price of the underlying securities, index or futures contracts; 3) the possible absence of a liquid secondary market for any particular instrument at any time; 4) the possible need to defer closing out certain positions to avoid adverse tax consequences; and 5) the possible non-performance by the counterparty under the terms of the contract. The Funds designate cash, cash equivalents and liquid securities as collateral for written options, futures contracts, options on futures contracts and short positions. The Funds were not invested in any type of options during the period ended October 31, 2022.
e) Risks of Investing in Foreign Securities – Investments in foreign securities involve greater risks than investing in domestic securities. As a result, the Funds' returns and net asset values may be affected to a large degree by fluctuations in currency exchange rates, political, diplomatic or economic conditions and regulatory requirements in other countries. The laws, accounting and financial reporting standards in foreign countries may require less disclosure than required in the U.S., and therefore there may be less public information available about foreign companies. Investments in foreign emerging markets present a greater risk than investing in foreign issuers in general. The risk of political or social upheaval is greater in emerging markets. In addition, there may be risks of an economy's dependence on revenues from particular commodities, currency transfer restrictions, a limited number of potential buyers for such securities and delays and disruption in securities settlement procedures.
f) Security Transactions – Investment transactions are recorded on the trade date. The Funds determine the gain or loss realized from the investment transactions by comparing the identified cost, which is the same basis used for U.S. Federal income tax purposes, with the net sales proceeds.
g) Securities Lending – The Funds may lend its investment securities to approved brokers, dealers and other financial institutions. The borrower pledges and maintains with the Fund collateral consisting of cash, an irrevocable letter of credit issued by an approved bank, or securities issued or guaranteed by the U.S. government. The collateral received by each Fund is required to have a value of at least 102% of the current value of the loaned securities. During the term of the loan, each Fund is entitled to all distributions made on or in respect of the loaned securities but does not receive interest income on securities received as collateral. Loans of securities are terminable at any time and the borrower, after notice, is required to return borrowed securities within the standard time period for settlement of securities transactions.
As of October 31, 2022, all securities on loan were collateralized by cash and/or U.S. government obligations. The cash received as collateral for securities on loan was invested in money market funds, whose maturities are overnight and continuous, and is disclosed in the Schedules of Investments. The securities on loan in each Fund are also disclosed in the Schedule of Investments. The total value of securities loaned and the value of the invested cash collateral are disclosed in the Statements of Assets and Liabilities. Non-cash collateral consists of U.S. Treasury securities and is not disclosed on the Statements of Assets and Liabilities as its held by the lending agent on behalf of the Funds, and the Funds do not have the ability to sell, reinvest or pledge those securities. Income earned by the Funds from securities lending is disclosed in the Statements of Operations.
The risks of securities lending include the risk that the borrower may not provide additional collateral when required or may not return the securities when due. To mitigate these risks, the Funds are contractually indemnified with the securities
DIREXION ANNUAL REPORT
186
lending agent. Furthermore, the Funds require the value of the securities loaned to be computed daily at the close of the market and additional collateral be furnished if required.
As of October 31, 2022, the market value of the securities loaned and the payable on collateral received for securities lending were as follows:
Funds | | Market Value
of Securities
Loaned | | Cash
Collateral
Received | | Non-Cash
Collateral
Received | | Total
Collateral
Received | |
Direxion Daily Small Cap Bull 3X Shares | | $ | 191,556,238 | | | $ | 195,572,197 | | | $ | — | | | $ | 195,572,197 | | |
Direxion Daily FTSE Europe Bull 3X Shares | | | 3,853,807 | | | | 3,934,708 | | | | — | | | | 3,934,708 | | |
Direxion Daily Aerospace & Defense Bull 3X Shares | | | 345,683 | | | | 366,616 | | | | — | | | | 366,616 | | |
Direxion Daily Pharmaceutical & Medical Bull 3X Shares | | | 51,141 | | | | 52,307 | | | | — | | | | 52,307 | | |
Direxion Daily Retail Bull 3X Shares | | | 426,126 | | | | 411,412 | | | | 25,270 | | | | 436,682 | | |
Direxion Daily S&P Biotech Bull 3X Shares | | | 3,436,058 | | | | 3,481,470 | | | | 183,811 | | | | 3,665,281 | | |
Direxion Daily Semiconductor Bull 3X Shares | | | 14,018,774 | | | | 14,375,196 | | | | — | | | | 14,375,196 | | |
Direxion Daily 7-10 Year Treasury Bull 3X Shares | | | 1,119,112 | | | | 1 | | | | 1,142,174 | | | | 1,142,175 | | |
h) Federal Income Taxes – Each Fund intends to make the requisite distributions of income and capital gains to comply with the requirements of Subchapter M of the Internal Revenue Code of 1986, as amended, necessary to qualify as a regulated investment company. Therefore, no provision for U.S. Federal income tax has been made by the Funds.
The Funds may be subject to a nondeductible 4% U.S. excise tax calculated as a percentage of certain undistributed amounts of net investment income and net capital gains. Certain Funds paid this excise tax during the period ended October 31, 2022, which is disclosed on the Statements of Operations.
i) Income and Expenses – Interest income, including amortization of premiums and discounts, is recognized on an accrual basis. Distributions are recorded on the ex-dividend date. Certain Funds paid this excise tax during the period ended October 31, 2022.
The Funds are charged for those expenses that are directly attributable to each series, such as advisory fees and registration costs. Expenses that are not directly attributable to a series are generally allocated among the Trust's series in proportion to their respective average daily net assets.
j) Distributions to Shareholders – Each Fund pays dividends from net investment income and distributes net realized capital gains, if any, at least annually. Income and capital gain distributions are determined in accordance with U.S. Federal income tax regulations, which may differ from GAAP. Certain Funds also utilize earnings and profits distributed to shareholders on redemptions of shares as part of the dividends paid deduction. Distributions to shareholders are recorded on the ex-dividend date.
k) Guarantees and Indemnifications – In the ordinary course of business, the Funds enter into contracts that contain a variety of indemnification provisions pursuant to which the Funds agree to indemnify third parties upon occurrence of specified events. The Funds' maximum exposure relating to these indemnification agreements is unknown. However, the Funds have not had prior claims or losses in connection with these provisions and believe the risk of loss is remote.
l) Use of Estimates – The preparation of financial statements in conformity with GAAP requires management to make estimates and assumptions that affect the reported amounts of assets and liabilities and disclosure of contingent assets and liabilities at the date of the financial statements and the reported amounts of revenues and expenses during the reporting period. Actual results could differ from those estimates.
3. INCOME TAX AND DISTRIBUTION INFORMATION
The tax character of distributions paid during the periods ended October 31, 2022 and October 31, 2021, are listed below.
The tax character of distributions to shareholders made during the periods may differ from their ultimate characterization for U.S. Federal income tax purposes.
DIREXION ANNUAL REPORT
187
| | | Year Ended
October 31, 2022 | | Year Ended
October 31, 2021 | |
| | | Distributions Paid From: | | Distributions Paid From: | |
Funds | | Ordinary
Income | | Long Term
Capital Gains | | Return
of Capital | | Ordinary
Income | | Long Term
Capital Gains | | Return
of Capital | |
Direxion Daily Mid Cap
Bull 3X Shares | | $ | — | | | $ | — | | | $ | — | | | $ | 21,998 | | | $ | — | | | $ | — | | |
Direxion Daily S&P 500®
Bull 3X Shares | | | 5,786,419 | | | | — | | | | — | | | | 3,773,589 | | | | — | | | | — | | |
Direxion Daily S&P 500®
Bear 3X Shares | | | — | | | | — | | | | — | | | | — | | | | — | | | | — | | |
Direxion Daily Small Cap
Bull 3X Shares | | | 1,367,545 | | | | — | | | | — | | | | 244,821 | | | | — | | | | — | | |
Direxion Daily Small Cap
Bear 3X Shares | | | — | | | | — | | | | — | | | | — | | | | — | | | | — | | |
Direxion Daily FTSE China
Bull 3X Shares | | | 1,246,902 | | | | — | | | | — | | | | 2,107,263 | | | | — | | | | — | | |
Direxion Daily FTSE China
Bear 3X Shares | | | — | | | | — | | | | — | | | | — | | | | — | | | | — | | |
Direxion Daily FTSE Europe
Bull 3X Shares | | | 316,935 | | | | — | | | | — | | | | 180,543 | | | | — | | | | — | | |
Direxion Daily MSCI Emerging
Markets Bull 3X Shares | | | — | | | | — | | | | — | | | | 206,560 | | | | — | | | | 107,122 | | |
Direxion Daily MSCI Emerging
Markets Bear 3X Shares | | | — | | | | — | | | | — | | | | — | | | | — | | | | — | | |
Direxion Daily MSCI Mexico
Bull 3X Shares | | | 148,179 | | | | — | | | | — | | | | 64,079 | | | | — | | | | — | | |
Direxion Daily MSCI South Korea
Bull 3X Shares | | | 227,711 | | | | — | | | | 87,142 | | | | 4,680 | | | | — | | | | — | | |
Direxion Daily Aerospace &
Defense Bull 3X Shares | | | 5,900,582 | | | | — | | | | — | | | | 229,995 | | | | — | | | | — | | |
Direxion Daily Consumer
Discretionary Bull 3X Shares | | | — | | | | — | | | | — | | | | — | | | | — | | | | — | | |
Direxion Daily Dow Jones
Internet Bull 3X Shares | | | 7,017,671 | | | | — | | | | — | | | | — | | | | — | | | | — | | |
Direxion Daily Dow Jones
Internet Bear 3X Shares | | | 26,648 | | | | — | | | | — | | | | — | | | | — | | | | — | | |
Direxion Daily Financial
Bull 3X Shares | | | 19,073,316 | | | | — | | | | — | | | | 15,325,240 | | | | — | | | | — | | |
Direxion Daily Financial
Bear 3X Shares | | | — | | | | — | | | | — | | | | — | | | | — | | | | — | | |
Direxion Daily Healthcare
Bull 3X Shares | | | 597,569 | | | | — | | | | — | | | | 11,571 | | | | — | | | | — | | |
Direxion Daily Homebuilders &
Supplies Bull 3X Shares | | | — | | | | — | | | | — | | | | — | | | | — | | | | — | | |
Direxion Daily Industrials
Bull 3X Shares | | | 94,102 | | | | — | | | | — | | | | 108,281 | | | | — | | | | — | | |
Direxion Daily Pharmaceutical &
Medical Bull 3X Shares | | | 36,713 | | | | — | | | | — | | | | — | | | | — | | | | — | | |
Direxion Daily Real Estate
Bull 3X Shares | | | 6,886,474 | | | | — | | | | — | | | | 1,224,013 | | | | — | | | | — | | |
Direxion Daily Real Estate
Bear 3X Shares | | | — | | | | — | | | | — | | | | — | | | | — | | | | — | | |
Direxion Daily Regional Banks
Bull 3X Shares | | | 2,874,970 | | | | — | | | | — | | | | 2,850,169 | | | | — | | | | — | | |
Direxion Daily Retail Bull 3X Shares | | | 473,179 | | | | — | | | | — | | | | 14,673 | | | | — | | | | — | | |
Direxion Daily S&P 500® High Beta
Bull 3X Shares | | | — | | | | — | | | | — | | | | 82,925 | | | | — | | | | — | | |
Direxion Daily S&P 500® High Beta
Bear 3X Shares | | | — | | | | — | | | | — | | | | — | | | | — | | | | — | | |
DIREXION ANNUAL REPORT
188
| | | Year Ended
October 31, 2022 | | Year Ended
October 31, 2021 | |
| | | Distributions Paid From: | | Distributions Paid From: | |
Funds | | Ordinary
Income | | Long Term
Capital Gains | | Return
of Capital | | Ordinary
Income | | Long Term
Capital Gains | | Return
of Capital | |
Direxion Daily S&P Biotech
Bull 3X Shares | | $ | — | | | $ | — | | | $ | — | | | $ | — | | | $ | — | | | $ | — | | |
Direxion Daily S&P Biotech
Bear 3X Shares | | | — | | | | — | | | | — | | | | — | | | | — | | | | — | | |
Direxion Daily Semiconductor
Bull 3X Shares | | | 18,952,312 | | | | — | | | | — | | | | 2,155,338 | | | | — | | | | — | | |
Direxion Daily Semiconductor
Bear 3X Shares | | | — | | | | — | | | | — | | | | — | | | | — | | | | — | | |
Direxion Daily Technology
Bull 3X Shares | | | 11,889,234 | | | | — | | | | — | | | | 10,258,380 | | | | — | | | | — | | |
Direxion Daily Technology
Bear 3X Shares | | | — | | | | — | | | | — | | | | — | | | | — | | | | — | | |
Direxion Daily Transportation
Bull 3X Shares | | | — | | | | — | | | | — | | | | 19,756 | | | | — | | | | — | | |
Direxion Daily Utilities
Bull 3X Shares | | | 363,008 | | | | — | | | | — | | | | 257,434 | | | | — | | | | — | | |
Direxion Daily 7-10 Year Treasury
Bull 3X Shares | | | — | | | | — | | | | — | | | | 1,553,448 | | | | — | | | | 167,130 | | |
Direxion Daily 7-10 Year Treasury
Bear 3X Shares | | | — | | | | — | | | | — | | | | — | | | | — | | | | — | | |
Direxion Daily 20+ Year Treasury
Bull 3X Shares | | | 2,244,754 | | | | — | | | | — | | | | 5,652,475 | | | | — | | | | 42,707 | | |
Direxion Daily 20+ Year Treasury
Bear 3X Shares | | | — | | | | — | | | | — | | | | — | | | | — | | | | — | | |
At October 31, 2022, the components of accumulated earnings/losses of the Funds on a tax basis were as follows:
| Funds | | Net Unrealized
Appreciation/
(Depreciation) | | Undistributed
Ordinary
Income (Loss) | | Undistributed
Capital
Gain (Loss) | | Other
Accumulated
Earnings (Losses)1 | | Total
Accumulated
Earnings (Losses) | |
Direxion Daily Mid Cap
Bull 3X Shares | | $ | (15,809,870 | ) | | $ | 35,769 | | | $ | — | | | $ | — | | | $ | (15,774,101 | ) | |
Direxion Daily S&P 500®
Bull 3X Shares | | | (982,789,056 | ) | | | 809,840 | | | | — | | | | (6,400 | ) | | | (981,985,616 | ) | |
Direxion Daily S&P 500®
Bear 3X Shares | | | (130,026,007 | ) | | | — | | | | — | | | | (2,473,631,335 | ) | | | (2,603,657,342 | ) | |
Direxion Daily Small Cap
Bull 3X Shares | | | (607,584,814 | ) | | | 1,663,421 | | | | — | | | | (352,881,779 | ) | | | (958,803,172 | ) | |
Direxion Daily Small Cap
Bear 3X Shares | | | (265,017,174 | ) | | | — | | | | — | | | | (3,452,525,248 | ) | | | (3,717,542,422 | ) | |
Direxion Daily FTSE China
Bull 3X Shares | | | (684,243,393 | ) | | | 450,862 | | | | — | | | | (330,658,278 | ) | | | (1,014,450,809 | ) | |
Direxion Daily FTSE China
Bear 3X Shares | | | 30,032,672 | | | | — | | | | — | | | | (15,031,551 | ) | | | 15,001,121 | | |
Direxion Daily FTSE Europe
Bull 3X Shares | | | (12,301,218 | ) | | | 63,887 | | | | — | | | | (19,106,818 | ) | | | (31,344,149 | ) | |
Direxion Daily MSCI Emerging
Markets Bull 3X Shares | | | (99,944,773 | ) | | | — | | | | — | | | | (186,212,321 | ) | | | (286,157,094 | ) | |
Direxion Daily MSCI Emerging
Markets Bear 3X Shares | | | 7,345,241 | | | | — | | | | — | | | | (318,941,112 | ) | | | (311,595,871 | ) | |
Direxion Daily MSCI Mexico
Bull 3X Shares | | | 1,216,768 | | | | 10,006 | | | | — | | | | — | | | | 1,226,774 | | |
Direxion Daily MSCI South
Korea Bull 3X Shares | | | (23,639,927 | ) | | | — | | | | — | | | | (19,991,866 | ) | | | (43,631,793 | ) | |
DIREXION ANNUAL REPORT
189
| Funds | | Net Unrealized
Appreciation/
(Depreciation) | | Undistributed
Ordinary
Income (Loss) | | Undistributed
Capital
Gain (Loss) | | Other
Accumulated
Earnings (Losses)1 | | Total
Accumulated
Earnings (Losses) | |
Direxion Daily Aerospace &
Defense Bull 3X Shares | | $ | 9,970,993 | | | $ | 1,383 | | | $ | — | | | $ | (5,096,355 | ) | | $ | 4,876,021 | | |
Direxion Daily Consumer
Discretionary Bull 3X Shares | | | (15,990,608 | ) | | | — | | | | — | | | | (16,153,594 | ) | | | (32,144,202 | ) | |
Direxion Daily Dow Jones
Internet Bull 3X Shares | | | (155,451,604 | ) | | | — | | | | — | | | | (101,344,945 | ) | | | (256,796,549 | ) | |
Direxion Daily Dow Jones
Internet Bear 3X Shares | | | (3,195,016 | ) | | | 100,487 | | | | — | | | | — | | | | (3,094,529 | ) | |
Direxion Daily Financial
Bull 3X Shares | | | (94,887,824 | ) | | | 7,929,725 | | | | — | | | | (361,864,963 | ) | | | (448,823,062 | ) | |
Direxion Daily Financial
Bear 3X Shares | | | (38,095,971 | ) | | | — | | | | — | | | | (3,094,286,337 | ) | | | (3,132,382,308 | ) | |
Direxion Daily Healthcare
Bull 3X Shares | | | (20,413,818 | ) | | | 162,440 | | | | — | | | | — | | | | (20,251,378 | ) | |
Direxion Daily Homebuilders &
Supplies Bull 3X Shares | | | (119,378,359 | ) | | | — | | | | — | | | | — | | | | (119,378,359 | ) | |
Direxion Daily Industrials
Bull 3X Shares | | | (4,225,948 | ) | | | 10,959 | | | | — | | | | — | | | | (4,214,989 | ) | |
Direxion Daily Pharmaceutical &
Medical Bull 3X Shares | | | (3,871,470 | ) | | | 21,428 | | | | — | | | | (5,261,408 | ) | | | (9,111,450 | ) | |
Direxion Daily Real Estate
Bull 3X Shares | | | (27,290,729 | ) | | | — | | | | — | | | | — | | | | (27,290,729 | ) | |
Direxion Daily Real Estate
Bear 3X Shares | | | (12,101,576 | ) | | | 337,583 | | | | — | | | | (94,309,403 | ) | | | (106,073,396 | ) | |
Direxion Daily Regional Banks
Bull 3X Shares | | | (68,093,790 | ) | | | 127,822 | | | | — | | | | — | | | | (67,965,968 | ) | |
Direxion Daily Retail
Bull 3X Shares | | | (55,402,957 | ) | | | 109,847 | | | | — | | | | (40,780,542 | ) | | | (96,073,652 | ) | |
Direxion Daily S&P 500®
High Beta Bull 3X Shares | | | (45,123,142 | ) | | | — | | | | — | | | | — | | | | (45,123,142 | ) | |
Direxion Daily S&P 500®
High Beta Bear 3X Shares | | | (199,033 | ) | | | — | | | | — | | | | (106,043,243 | ) | | | (106,242,276 | ) | |
Direxion Daily S&P Biotech
Bull 3X Shares | | | (717,227,736 | ) | | | — | | | | — | | | | (780,772,761 | ) | | | (1,498,000,497 | ) | |
Direxion Daily S&P Biotech
Bear 3X Shares | | | (99,244,371 | ) | | | 132,796 | | | | — | | | | (245,562,623 | ) | | | (344,674,198 | ) | |
Direxion Daily Semiconductor
Bull 3X Shares | | | (5,687,559,552 | ) | | | 5,147,262 | | | | — | | | | (239,601,866 | ) | | | (5,922,014,156 | ) | |
Direxion Daily Semiconductor
Bear 3X Shares | | | 67,452,062 | | | | 496,283 | | | | — | | | | (455,959,326 | ) | | | (388,010,981 | ) | |
Direxion Daily Technology
Bull 3X Shares | | | (1,261,661,520 | ) | | | — | | | | — | | | | — | | | | (1,261,661,520 | ) | |
Direxion Daily Technology
Bear 3X Shares | | | (361,187 | ) | | | — | | | | — | | | | (262,386,135 | ) | | | (262,747,322 | ) | |
Direxion Daily Transportation
Bull 3X Shares | | | (6,811,940 | ) | | | — | | | | — | | | | (470,064 | ) | | | (7,282,004 | ) | |
Direxion Daily Utilities
Bull 3X Shares | | | (1,691,982 | ) | | | — | | | | — | | | | — | | | | (1,691,982 | ) | |
Direxion Daily 7-10 Year
Treasury Bull 3X Shares | | | (10,952,005 | ) | | | 33,455 | | | | — | | | | (3,959,407 | ) | | | (14,877,957 | ) | |
Direxion Daily 7-10 Year
Treasury Bear 3X Shares | | | 4,956,400 | | | | — | | | | — | | | | (47,351,121 | ) | | | (42,394,721 | ) | |
Direxion Daily 20+ Year
Treasury Bull 3X Shares | | | (492,076,892 | ) | | | 1,083,546 | | | | — | | | | (63,660,000 | ) | | | (554,653,346 | ) | |
Direxion Daily 20+ Year
Treasury Bear 3X Shares | | | 127,636,244 | | | | — | | | | — | | | | (688,410,775 | ) | | | (560,774,531 | ) | |
1 Other Accumulated Earnings (Losses) consist of capital loss carryover, qualified late year losses and organizational costs.
DIREXION ANNUAL REPORT
190
At October 31, 2022, the aggregate gross unrealized appreciation and depreciation of investments for U.S Federal income tax purposes were as follows:
Funds | | Tax Cost of
Investments | | Gross
Unrealized
Appreciation | | Gross
Unrealized
Depreciation | | Net Unrealized
Appreciation
(Depreciation) | |
Direxion Daily Mid Cap Bull 3X Shares | | $ | 67,301,797 | | | $ | 5,196,767 | | | $ | (21,006,637 | ) | | $ | (15,809,870 | ) | |
Direxion Daily S&P 500® Bull 3X Shares | | | 3,683,781,007 | | | | 185,494,220 | | | | (1,168,283,276 | ) | | | (982,789,056 | ) | |
Direxion Daily S&P 500® Bear 3X Shares | | | 1,238,201,599 | | | | 105,188,300 | | | | (235,214,307 | ) | | | (130,026,007 | ) | |
Direxion Daily Small Cap Bull 3X Shares | | | 2,124,696,921 | | | | 142,764,529 | | | | (750,349,343 | ) | | | (607,584,814 | ) | |
Direxion Daily Small Cap Bear 3X Shares | | | 809,085,462 | | | | 2,045,065 | | | | (267,062,239 | ) | | | (265,017,174 | ) | |
Direxion Daily FTSE China Bull 3X Shares | | | 943,753,610 | | | | — | | | | (684,243,393 | ) | | | (684,243,393 | ) | |
Direxion Daily FTSE China Bear 3X Shares | | | 204,582,107 | | | | 54,113,427 | | | | (24,080,755 | ) | | | 30,032,672 | | |
Direxion Daily FTSE Europe Bull 3X Shares | | | 34,349,681 | | | | 849,877 | | | | (13,151,095 | ) | | | (12,301,218 | ) | |
Direxion Daily MSCI Emerging Markets Bull 3X Shares | | | 149,354,986 | | | | — | | | | (99,944,773 | ) | | | (99,944,773 | ) | |
Direxion Daily MSCI Emerging Markets Bear 3X Shares | | | 63,711,580 | | | | 14,192,769 | | | | (6,847,528 | ) | | | 7,345,241 | | |
Direxion Daily MSCI Mexico Bull 3X Shares | | | 12,443,118 | | | | 2,823,848 | | | | (1,607,080 | ) | | | 1,216,768 | | |
Direxion Daily MSCI South Korea Bull 3X Shares | | | 43,726,196 | | | | 224,061 | | | | (23,863,988 | ) | | | (23,639,927 | ) | |
Direxion Daily Aerospace & Defense Bull 3X Shares | | | 227,047,419 | | | | 52,486,778 | | | | (42,515,785 | ) | | | 9,970,993 | | |
Direxion Daily Consumer Discretionary Bull 3X Shares | | | 41,445,190 | | | | 1,282,017 | | | | (17,272,625 | ) | | | (15,990,608 | ) | |
Direxion Daily Dow Jones Internet Bull 3X Shares | | | 258,576,401 | | | | 2,859,685 | | | | (158,311,289 | ) | | | (155,451,604 | ) | |
Direxion Daily Dow Jones Internet Bear 3X Shares | | | 78,489,951 | | | | 19,825,051 | | | | (23,020,067 | ) | | | (3,195,016 | ) | |
Direxion Daily Financial Bull 3X Shares | | | 2,143,582,848 | | | | 238,267,084 | | | | (333,154,908 | ) | | | (94,887,824 | ) | |
Direxion Daily Financial Bear 3X Shares | | | 222,963,809 | | | | — | | | | (38,095,971 | ) | | | (38,095,971 | ) | |
Direxion Daily Healthcare Bull 3X Shares | | | 232,929,650 | | | | 28,466,727 | | | | (48,880,545 | ) | | | (20,413,818 | ) | |
Direxion Daily Homebuilders & Supplies Bull 3X Shares | | | 260,615,030 | | | | 9,403,932 | | | | (128,782,291 | ) | | | (119,378,359 | ) | |
Direxion Daily Industrials Bull 3X Shares | | | 25,296,893 | | | | 2,646,718 | | | | (6,872,666 | ) | | | (4,225,948 | ) | |
Direxion Daily Pharmaceutical & Medical Bull 3X Shares | | | 15,830,189 | | | | 1,368,314 | | | | (5,239,784 | ) | | | (3,871,470 | ) | |
Direxion Daily Real Estate Bull 3X Shares | | | 78,230,511 | | | | 4,550,519 | | | | (31,841,248 | ) | | | (27,290,729 | ) | |
Direxion Daily Real Estate Bear 3X Shares | | | 225,766,828 | | | | 14,605,246 | | | | (26,706,822 | ) | | | (12,101,576 | ) | |
Direxion Daily Regional Banks Bull 3X Shares | | | 301,991,253 | | | | 29,862,556 | | | | (97,956,346 | ) | | | (68,093,790 | ) | |
Direxion Daily Retail Bull 3X Shares | | | 105,292,126 | | | | 6,399,486 | | | | (61,802,443 | ) | | | (55,402,957 | ) | |
Direxion Daily S&P 500® High Beta Bull 3X Shares | | | 120,491,828 | | | | 7,851,485 | | | | (52,974,627 | ) | | | (45,123,142 | ) | |
Direxion Daily S&P 500® High Beta Bear 3X Shares | | | 79,240,386 | | | | 13,660,368 | | | | (13,859,401 | ) | | | (199,033 | ) | |
Direxion Daily S&P Biotech Bull 3X Shares | | | 2,028,917,220 | | | | 184,315,661 | | | | (901,543,397 | ) | | | (717,227,736 | ) | |
Direxion Daily S&P Biotech Bear 3X Shares | | | 300,957,593 | | | | 16,133,946 | | | | (115,378,317 | ) | | | (99,244,371 | ) | |
Direxion Daily Semiconductor Bull 3X Shares | | | 9,598,402,969 | | | | 100,207,518 | | | | (5,787,767,070 | ) | | | (5,687,559,552 | ) | |
Direxion Daily Semiconductor Bear 3X Shares | | | 632,955,526 | | | | 167,269,759 | | | | (99,817,697 | ) | | | 67,452,062 | | |
Direxion Daily Technology Bull 3X Shares | | | 2,698,589,974 | | | | 93,499,715 | | | | (1,355,161,235 | ) | | | (1,261,661,520 | ) | |
Direxion Daily Technology Bear 3X Shares | | | 189,901,140 | | | | 42,022,708 | | | | (42,383,895 | ) | | | (361,187 | ) | |
Direxion Daily Transportation Bull 3X Shares | | | 30,849,977 | | | | 1,017,542 | | | | (7,829,482 | ) | | | (6,811,940 | ) | |
Direxion Daily Utilities Bull 3X Shares | | | 24,219,283 | | | | 1,858,184 | | | | (3,550,166 | ) | | | (1,691,982 | ) | |
Direxion Daily 7-10 Year Treasury Bull 3X Shares | | | 35,311,475 | | | | 43,029 | | | | (10,995,034 | ) | | | (10,952,005 | ) | |
Direxion Daily 7-10 Year Treasury Bear 3X Shares | | | 56,586,528 | | | | 6,315,606 | | | | (1,359,206 | ) | | | 4,956,400 | | |
Direxion Daily 20+ Year Treasury Bull 3X Shares | | | 931,289,812 | | | | 1,125,665 | | | | (493,202,557 | ) | | | (492,076,892 | ) | |
Direxion Daily 20+ Year Treasury Bear 3X Shares | | | 699,331,382 | | | | 155,291,282 | | | | (27,655,038 | ) | | | 127,636,244 | | |
The difference between the book cost of investments and the tax cost of investments is primarily attributable to tax deferral of losses on wash sales.
On the Statements of Assets and Liabilities, the following adjustments were made for permanent tax differences between accounting for total distributable earnings and capital stock under GAAP and tax reporting:
| Funds | | Total Distributable
Earnings (Loss) | | Capital Stock | |
Direxion Daily Mid Cap Bull 3X Shares | | $ | (5,989,659 | ) | | $ | 5,989,659 | | |
Direxion Daily S&P 500® Bull 3X Shares | | | (339,547,243 | ) | | | 339,547,243 | | |
Direxion Daily S&P 500® Bear 3X Shares | | | 2,141,628 | | | | (2,141,628 | ) | |
Direxion Daily Small Cap Bull 3X Shares | | | 88,132,463 | | | | (88,132,463 | ) | |
Direxion Daily Small Cap Bear 3X Shares | | | 2,681,917 | | | | (2,681,917 | ) | |
Direxion Daily FTSE China Bull 3X Shares | | | 102,812,312 | | | | (102,812,312 | ) | |
DIREXION ANNUAL REPORT
191
| Funds | | Total Distributable
Earnings (Loss) | | Capital Stock | |
Direxion Daily FTSE China Bear 3X Shares | | $ | 222,115 | | | $ | (222,115 | ) | |
Direxion Daily FTSE Europe Bull 3X Shares | | | 979,158 | | | | (979,158 | ) | |
Direxion Daily MSCI Emerging Markets Bull 3X Shares | | | 5,973,471 | | | | (5,973,471 | ) | |
Direxion Daily MSCI Emerging Markets Bear 3X Shares | | | 204,132 | | | | (204,132 | ) | |
Direxion Daily MSCI Mexico Bull 3X Shares | | | (2,903,258 | ) | | | 2,903,258 | | |
Direxion Daily MSCI South Korea Bull 3X Shares | | | 3,387,533 | | | | (3,387,533 | ) | |
Direxion Daily Aerospace & Defense Bull 3X Shares | | | (7,441,385 | ) | | | 7,441,385 | | |
Direxion Daily Consumer Discretionary Bull 3X Shares | | | 387,201 | | | | (387,201 | ) | |
Direxion Daily Dow Jones Internet Bull 3X Shares | | | 19,576,077 | | | | (19,576,077 | ) | |
Direxion Daily Dow Jones Internet Bear 3X Shares | | | (8,684,466 | ) | | | 8,684,466 | | |
Direxion Daily Financial Bull 3X Shares | | | (132,724,877 | ) | | | 132,724,877 | | |
Direxion Daily Financial Bear 3X Shares | | | 935,005 | | | | (935,005 | ) | |
Direxion Daily Healthcare Bull 3X Shares | | | (54,041,733 | ) | | | 54,041,733 | | |
Direxion Daily Homebuilders & Supplies Bull 3X Shares | | | (40,241,875 | ) | | | 40,241,875 | | |
Direxion Daily Industrials Bull 3X Shares | | | (2,740,027 | ) | | | 2,740,027 | | |
Direxion Daily Pharmaceutical & Medical Bull 3X Shares | | | (294,087 | ) | | | 294,087 | | |
Direxion Daily Real Estate Bull 3X Shares | | | (20,097,827 | ) | | | 20,097,827 | | |
Direxion Daily Real Estate Bear 3X Shares | | | — | | | | — | | |
Direxion Daily Regional Banks Bull 3X Shares | | | (34,386,053 | ) | | | 34,386,053 | | |
Direxion Daily Retail Bull 3X Shares | | | 11,994,835 | | | | (11,994,835 | ) | |
Direxion Daily S&P 500® High Beta Bull 3X Shares | | | (13,443,712 | ) | | | 13,443,712 | | |
Direxion Daily S&P 500® High Beta Bear 3X Shares | | | 118,205 | | | | (118,205 | ) | |
Direxion Daily S&P Biotech Bull 3X Shares | | | 101,707,703 | | | | (101,707,703 | ) | |
Direxion Daily S&P Biotech Bear 3X Shares | | | — | | | | — | | |
Direxion Daily Semiconductor Bull 3X Shares | | | 334,727,718 | | | | (334,727,718 | ) | |
Direxion Daily Semiconductor Bear 3X Shares | | | — | | | | — | | |
Direxion Daily Technology Bull 3X Shares | | | (264,435,622 | ) | | | 264,435,622 | | |
Direxion Daily Technology Bear 3X Shares | | | 116,600 | | | | (116,600 | ) | |
Direxion Daily Transportation Bull 3X Shares | | | (1,610,194 | ) | | | 1,610,194 | | |
Direxion Daily Utilities Bull 3X Shares | | | (8,225,572 | ) | | | 8,225,572 | | |
Direxion Daily 7-10 Year Treasury Bull 3X Shares | | | (123,485 | ) | | | 123,485 | | |
Direxion Daily 7-10 Year Treasury Bear 3X Shares | | | 116,773 | | | | (116,773 | ) | |
Direxion Daily 20+ Year Treasury Bull 3X Shares | | | 10,213,927 | | | | (10,213,927 | ) | |
Direxion Daily 20+ Year Treasury Bear 3X Shares | | | 1,507,827 | | | | (1,507,827 | ) | |
GAAP requires that certain components of net assets relating to permanent differences be reclassified between financial and tax reporting. These reclassifications have no effect on net assets or net asset value per share. For the year ended October 31, 2022, the permanent differences primarily relate to tax treatment of redemptions in-kind, net operating losses and the utilization of earnings and profits distributed to shareholders on redemption of shares.
In order to meet certain U.S. excise tax distribution requirements, the Funds are required to measure and distribute annually net capital gains realized during a twelve month period ending October 31 and net investment income earned during a twelve month period ending December 31. In connection with this, the Funds are permitted for tax purposes to defer into their next fiscal year qualified late year losses. Qualified late ordinary losses are generally losses incurred between January 1 and the end of their fiscal year, October 31, 2022.
At October 31, 2022, the Funds deferred, on a tax basis, qualified late year losses of:
| | Ordinary Late
Year Loss
Deferral | |
Direxion Daily Consumer Discretionary Bull 3X Shares | | $ | 58,267 | | |
Direxion Daily Dow Jones Internet Bull 3X Shares | | | 294,260 | | |
Direxion Daily S&P Biotech Bull 3X Shares | | | 3,439,848 | | |
DIREXION ANNUAL REPORT
192
Under current law, the Funds may carry forward net capital losses indefinitely to use to offset capital gains realized in future years and their character is retained as either short-term and/or long-term.
At October 31, 2022, for U.S. Federal income tax purposes, the following Funds had capital loss carryforwards available to offset future capital gains through the year indicated:
| Funds | | Utilized in
Current Year | | Unlimited ST | | Unlimited LT | |
Direxion Daily Mid Cap Bull 3X Shares | | $ | — | | | $ | — | | | $ | — | | |
Direxion Daily S&P 500® Bull 3X Shares | | | — | | | | — | | | | — | | |
Direxion Daily S&P 500® Bear 3X Shares | | | — | | | | 2,470,297,255 | | | | 3,329,426 | | |
Direxion Daily Small Cap Bull 3X Shares | | | — | | | | 352,879,795 | | | | — | | |
Direxion Daily Small Cap Bear 3X Shares | | | — | | | | 3,452,523,190 | | | | — | | |
Direxion Daily FTSE China Bull 3X Shares | | | — | | | | 325,605,746 | | | | 5,052,532 | | |
Direxion Daily FTSE China Bear 3X Shares | | | (81,197,814 | ) | | | 15,031,551 | | | | — | | |
Direxion Daily FTSE Europe Bull 3X Shares | | | — | | | | 19,106,818 | | | | — | | |
Direxion Daily MSCI Emerging Markets Bull 3X Shares | | | — | | | | 125,175,993 | | | | 61,036,328 | | |
Direxion Daily MSCI Emerging Markets Bear 3X Shares | | | (15,109,098 | ) | | | 318,941,112 | | | | — | | |
Direxion Daily MSCI Mexico Bull 3X Shares | | | — | | | | — | | | | — | | |
Direxion Daily MSCI South Korea Bull 3X Shares | | | — | | | | 19,991,866 | | | | — | | |
Direxion Daily Aerospace & Defense Bull 3X Shares | | | — | | | | 338,823 | | | | 4,757,532 | | |
Direxion Daily Consumer Discretionary Bull 3X Shares | | | — | | | | 14,952,956 | | | | 1,142,371 | | |
Direxion Daily Dow Jones Internet Bull 3X Shares | | | — | | | | 101,050,685 | | | | — | | |
Direxion Daily Dow Jones Internet Bear 3X Shares | | | (6,603,182 | ) | | | — | | | | — | | |
Direxion Daily Financial Bull 3X Shares | | | — | | | | 332,947,655 | | | | 28,914,473 | | |
Direxion Daily Financial Bear 3X Shares | | | — | | | | 3,094,283,146 | | | | — | | |
Direxion Daily Healthcare Bull 3X Shares | | | — | | | | — | | | | — | | |
Direxion Daily Homebuilders & Supplies Bull 3X Shares | | | — | | | | — | | | | — | | |
Direxion Daily Industrials Bull 3X Shares | | | — | | | | — | | | | — | | |
Direxion Daily Pharmaceutical & Medical Bull 3X Shares | | | — | | | | 5,008,593 | | | | 252,815 | | |
Direxion Daily Real Estate Bull 3X Shares | | | — | | | | — | | | | — | | |
Direxion Daily Real Estate Bear 3X Shares | | | (25,333,762 | ) | | | 94,309,403 | | | | — | | |
Direxion Daily Regional Banks Bull 3X Shares | | | — | | | | — | | | | — | | |
Direxion Daily Retail Bull 3X Shares | | | — | | | | 35,636,417 | | | | 5,144,125 | | |
Direxion Daily S&P 500® High Beta Bull 3X Shares | | | — | | | | — | | | | — | | |
Direxion Daily S&P 500® High Beta Bear 3X Shares | | | — | | | | 106,043,243 | | | | — | | |
Direxion Daily S&P Biotech Bull 3X Shares | | | — | | | | 716,192,022 | | | | 61,140,891 | | |
Direxion Daily S&P Biotech Bear 3X Shares | | | (43,877,769 | ) | | | 245,562,623 | | | | — | | |
Direxion Daily Semiconductor Bull 3X Shares | | | — | | | | 236,225,383 | | | | 3,376,483 | | |
Direxion Daily Semiconductor Bear 3X Shares | | | (301,474,455 | ) | | | 455,959,326 | | | | — | | |
Direxion Daily Technology Bull 3X Shares | | | — | | | | — | | | | — | | |
Direxion Daily Technology Bear 3X Shares | | | — | | | | 262,385,958 | | | | — | | |
Direxion Daily Transportation Bull 3X Shares | | | — | | | | 470,064 | | | | — | | |
Direxion Daily Utilities Bull 3X Shares | | | — | | | | — | | | | — | | |
Direxion Daily 7-10 Year Treasury Bull 3X Shares | | | — | | | | 3,267,148 | | | | 692,259 | | |
Direxion Daily 7-10 Year Treasury Bear 3X Shares | | | (13,715,213 | ) | | | 47,351,121 | | | | — | | |
Direxion Daily 20+ Year Treasury Bull 3X Shares | | | — | | | | 60,511,910 | | | | 3,148,090 | | |
Direxion Daily 20+ Year Treasury Bear 3X Shares | | | (280,830,679 | ) | | | 688,410,775 | | | | — | | |
The Funds follow authoritative financial reporting rules regarding recognition and measurement of tax positions taken or expected to be taken on a tax return. The Funds have reviewed all open tax years and concluded that there is no effect to the Funds' financial positions or results of operations and no tax liability resulting from unrecognized tax benefits relating to uncertain income tax position taken or expected to be taken on a tax return. The Funds recognize interest and penalties, if any, related to unrecognized tax benefits as income tax expense in the Statements of Operations. During this period, the Funds did not incur any interest or penalties. Open tax years are those years that are open for examination by the relevant income taxing authority. As of October 31, 2022, open U.S. Federal and state income tax years include the tax years ended October 31, 2019 through October 31, 2022. The Funds have no examination in progress. The Funds are also not aware of any tax positions for which it is reasonably possible that the total amounts of unrecognized tax expense will significantly change in the next twelve months.
DIREXION ANNUAL REPORT
193
4. CREATION AND REDEMPTION TRANSACTIONS AND TRANSACTION FEES
Each Fund issues and redeems shares on a continuous basis at NAV only in large blocks of shares called "Creation Units." A Creation Unit consists of 50,000 shares. Creation Units of the Bull Funds are issued and redeemed in cash and/or in-kind for securities included in the relevant underlying index. Creation Units of the Bear Funds are issued and redeemed for cash. Investors such as market makers, large investors and institutions who wish to deal in Creation Units directly with a Fund must have entered into an authorized participant agreement with the principal underwriter and the transfer agent, or purchase through a dealer that has entered into such an agreement. Transactions in shares for each Fund include both cash and in-kind transactions and are disclosed in detail in the Statements of Changes in Net Assets.
Transaction fees are imposed to cover the costs associated with the issuance and redemption of Creation Units. There is a fixed and a variable component to the total transaction fee. A fixed transaction fee is paid to the transfer agent and is applicable to each creation or redemption transaction, regardless of the number of Creation Units purchased or redeemed. In addition, a variable transaction fee equal to a percentage of the value of each Creation Unit purchased or redeemed is applicable to each creation or redemption transaction and is paid to the Fund. Not all Funds will have a transaction fee associated with capital share activity for the year. Transaction fees received by each Fund are presented in the Capital Share Transaction section of the Statements of Changes in Net Assets.
5. INVESTMENT TRANSACTIONS
The table below presents each Fund's investment transactions during the period ended October 31, 2022 represent the aggregate purchases of investments excluding the cost of in-kind purchases, short-term investment purchases, swaps and futures contracts. Sales represent the aggregate sales of investments excluding proceeds from in-kind sales, short-term investments, swap and future contracts.
Purchases in-kind are the aggregate of all in-kind purchases and sales in-kind are the aggregate of all proceeds from in-kind sales. The transactions for each of these categories are as follows:
Funds | | Purchases | | Sales | | Purchases
In-Kind | | Sales
In-Kind | |
Direxion Daily Mid Cap Bull 3X Shares | | $ | 23,728,174 | | | $ | 42,363,249 | | | $ | 10,489,941 | | | $ | 15,160,702 | | |
Direxion Daily S&P 500® Bull 3X Shares | | | 2,299,150,091 | | | | 5,888,800,421 | | | | 4,118,950,135 | | | | 658,259,602 | | |
Direxion Daily S&P 500® Bear 3X Shares | | | — | | | | — | | | | — | | | | — | | |
Direxion Daily Small Cap Bull 3X Shares | | | 1,036,493,900 | | | | 1,763,824,925 | | | | 2,012,168,494 | | | | 1,177,827,705 | | |
Direxion Daily Small Cap Bear 3X Shares | | | — | | | | — | | | | — | | | | — | | |
Direxion Daily FTSE China Bull 3X Shares | | | 265,124,500 | | | | 803,227,542 | | | | 950,757,592 | | | | 363,317,607 | | |
Direxion Daily FTSE China Bear 3X Shares | | | — | | | | — | | | | — | | | | — | | |
Direxion Daily FTSE Europe Bull 3X Shares | | | — | | | | 5,953,027 | | | | 17,249,740 | | | | 21,926,161 | | |
Direxion Daily MSCI Emerging Markets Bull 3X Shares | | | 56,516,075 | | | | 124,451,272 | | | | 53,978,393 | | | | 66,817,741 | | |
Direxion Daily MSCI Emerging Markets Bear 3X Shares | | | — | | | | — | | | | — | | | | — | | |
Direxion Daily MSCI Mexico Bull 3X Shares | | | 12,954,435 | | | | 1,105,250 | | | | — | | | | 7,476,048 | | |
Direxion Daily MSCI South Korea Bull 3X Shares | | | 3,836,052 | | | | 14,562,776 | | | | 37,837,735 | | | | 33,739,677 | | |
Direxion Daily Aerospace & Defense Bull 3X Shares | | | 114,970,612 | | | | 153,886,654 | | | | 112,372,132 | | | | 148,112,854 | | |
Direxion Daily Consumer Discretionary Bull 3X Shares | | | 39,239,693 | | | | 45,711,133 | | | | 23,897,797 | | | | 10,976,134 | | |
Direxion Daily Dow Jones Internet Bull 3X Shares | | | 50,816,862 | | | | 286,124,451 | | | | 401,663,354 | | | | 93,082,232 | | |
Direxion Daily Dow Jones Internet Bear 3X Shares | | | — | | | | — | | | | — | | | | — | | |
Direxion Daily Financial Bull 3X Shares | | | 1,917,583,761 | | | | 3,196,142,331 | | | | 1,352,760,597 | | | | 785,421,142 | | |
Direxion Daily Financial Bear 3X Shares | | | — | | | | — | | | | — | | | | — | | |
Direxion Daily Healthcare Bull 3X Shares | | | 22,972,933 | | | | 34,021,794 | | | | 94,478,493 | | | | 130,058,735 | | |
Direxion Daily Homebuilders & Supplies Bull 3X Shares | | | 143,088,527 | | | | 207,249,890 | | | | 157,316,350 | | | | 190,616,277 | | |
Direxion Daily Industrials Bull 3X Shares | | | 11,101,797 | | | | 3,964,042 | | | | 2,046,653 | | | | 34,259,056 | | |
Direxion Daily Pharmaceutical & Medical Bull 3X Shares | | | 22,319,262 | | | | 21,450,587 | | | | 25,333,818 | | | | 38,332,026 | | |
Direxion Daily Real Estate Bull 3X Shares | | | 49,449,442 | | | | 76,584,207 | | | | 30,939,086 | | | | 62,851,507 | | |
Direxion Daily Real Estate Bear 3X Shares | | | — | | | | — | | | | — | | | | — | | |
Direxion Daily Regional Banks Bull 3X Shares | | | 372,463,317 | | | | 276,987,120 | | | | 238,563,588 | | | | 266,557,528 | | |
Direxion Daily Retail Bull 3X Shares | | | 47,002,083 | | | | 145,455,736 | | | | 129,748,224 | | | | 61,582,131 | | |
Direxion Daily S&P 500® High Beta Bull 3X Shares | | | 81,024,200 | | | | 115,064,908 | | | | 127,401,346 | | | | 99,515,883 | | |
Direxion Daily S&P 500® High Beta Bear 3X Shares | | | — | | | | — | | | | — | | | | — | | |
DIREXION ANNUAL REPORT
194
Funds | | Purchases | | Sales | | Purchases
In-Kind | | Sales
In-Kind | |
Direxion Daily S&P Biotech Bull 3X Shares | | $ | 881,118,867 | | | $ | 1,748,861,284 | | | $ | 2,626,152,436 | | | $ | 1,279,867,088 | | |
Direxion Daily S&P Biotech Bear 3X Shares | | | — | | | | — | | | | — | | | | — | | |
Direxion Daily Semiconductor Bull 3X Shares | | | 7,804,387,703 | | | | 12,500,345,578 | | | | 12,976,023,916 | | | | 6,496,327,675 | | |
Direxion Daily Semiconductor Bear 3X Shares | | | — | | | | — | | | | — | | | | — | | |
Direxion Daily Technology Bull 3X Shares | | | 1,427,086,311 | | | | 2,492,910,397 | | | | 1,027,203,150 | | | | 367,350,629 | | |
Direxion Daily Technology Bear 3X Shares | | | — | | | | — | | | | — | | | | — | | |
Direxion Daily Transportation Bull 3X Shares | | | 11,860,484 | | | | 11,088,494 | | | | 11,005,083 | | | | 32,629,907 | | |
Direxion Daily Utilities Bull 3X Shares | | | 21,838,791 | | | | 9,447,143 | | | | 21,077,168 | | | | 38,913,929 | | |
Direxion Daily 7-10 Year Treasury Bull 3X Shares | | | — | | | | 6,364,704 | | | | 14,239,331 | | | | 2,127,476 | | |
Direxion Daily 7-10 Year Treasury Bear 3X Shares | | | — | | | | — | | | | — | | | | — | | |
Direxion Daily 20+ Year Treasury Bull 3X Shares | | | 17,777,850 | | | | 275,568,440 | | | | 455,041,437 | | | | 57,778,817 | | |
Direxion Daily 20+ Year Treasury Bear 3X Shares | | | — | | | | — | | | | — | | | | — | | |
There were no purchases or sales of long-term U.S. Government securities in the Funds during the period ended October 31, 2022.
6. INVESTMENT ADVISORY AND OTHER AGREEMENTS
Under an Investment Advisory Agreement between the Adviser and the Trust, on behalf of each Fund, the Adviser provides a continuous investment program for each Fund's assets in accordance with its investment objectives, policies and limitations, and oversees the day-to-day operations of each Fund, subject to the supervision of the Trustees. Pursuant to the Advisory Agreement, each Fund pays the Adviser 0.75% at an annual rate based on its average daily net assets.
The Adviser has agreed to waive a portion of its fees based upon the specific breakpoints listed in the table below based on each Fund's daily net assets. For the period ended October 31, 2022, the Adviser waived its fee in certain Funds.
Net Asset Range | | Advisory Fee Limit | |
| $0 – $1,500,000,000 | | | 0.75 | % | |
| $1,500,000,000 – $2,000,000,000 | | | 0.70 | % | |
| $2,000,000,000 – $2,500,000,000 | | | 0.65 | % | |
| $2,500,000,000 – $3,000,000,000 | | | 0.60 | % | |
| $3,000,000,000 – $3,500,000,000 | | | 0.55 | % | |
| $3,500,000,000 – $4,000,000,000 | | | 0.50 | % | |
| $4,000,000,000 – $4,500,000,000 | | | 0.45 | % | |
Greater than $4,500,000,000 | | | 0.40 | % | |
Additionally, the Trust has entered into a Management Services Agreement with the Adviser. Under the Management Services Agreement, the Trust pays the Adviser management service fees of 0.026% on the first $10,000,000,000 of the Trust's daily net assets and 0.024% on assets in excess of $10,000,000,000. This fee compensates the Adviser for performing certain management, administration and compliance functions related to the Trust. This fee is allocated to each Fund based on each Fund's respective average daily net assets.
Each Fund is responsible for its own operating expenses. The Adviser has contractually agreed to waive its fees and/or reimburse each Fund's operating expenses to the extent that they exceed 0.95% of each Fund's respective average daily net assets at least until September 1, 2024. Any expense waiver is subject to recoupment by the Adviser, as applicable, within the following three years if overall expenses fall below these percentage limitations.
The table below presents amounts that the Adviser recouped, reimbursed and the amounts available for potential recoupment by the Adviser.
| | | | | | | Potential Recoupment
Amounts Expiring: | | Total Potential | |
| | | Expenses
Recouped | | Expenses
Reimbursed | | October 31,
2023 | | October 31,
2024 | | October 31,
2025 | | Recoupment
Amount | |
Direxion Daily Mid Cap Bull 3X Shares | | $ | 2,977 | | | $ | 8,604 | | | $ | 27,314 | | | $ | 1,507 | | | $ | 8,604 | | | $ | 37,425 | | |
DIREXION ANNUAL REPORT
195
| | | | | | | Potential Recoupment
Amounts Expiring: | | Total Potential | |
| | | Expenses
Recouped | | Expenses
Reimbursed | | October 31,
2023 | | October 31,
2024 | | October 31,
2025 | | Recoupment
Amount | |
Direxion Daily S&P 500® Bull 3X Shares | | $ | 13,055 | | | $ | 13,055 | | | $ | — | | | $ | — | | | $ | — | | | $ | — | | |
Direxion Daily S&P 500® Bear 3X Shares | | | 103,161 | | | | 10,643 | | | | 99,942 | | | | 1,315 | | | | 10,643 | | | | 111,900 | | |
Direxion Daily Small Cap Bull 3X Shares | | | 17,632 | | | | 17,406 | | | | — | | | | — | | | | — | | | | — | | |
Direxion Daily Small Cap Bear 3X Shares | | | 3,683 | | | | — | | | | — | | | | — | | | | — | | | | — | | |
Direxion Daily FTSE China Bull 3X Shares | | | 58,394 | | | | 49,431 | | | | 66,062 | | | | 379 | | | | 49,431 | | | | 115,872 | | |
Direxion Daily FTSE China Bear 3X Shares | | | 1,312 | | | | 5,923 | | | | 34,795 | | | | 11,460 | | | | 5,923 | | | | 52,178 | | |
Direxion Daily FTSE Europe Bull 3X Shares | | | 4,734 | | | | 6,174 | | | | 1,774 | | | | 1,054 | | | | 6,174 | | | | 9,002 | | |
Direxion Daily MSCI Emerging Markets
Bull 3X Shares | | | 5,484 | | | | 17,713 | | | | 40,267 | | | | 939 | | | | 17,713 | | | | 58,919 | | |
Direxion Daily MSCI Emerging Markets
Bear 3X Shares | | | 185 | | | | 50,097 | | | | 54,120 | | | | 58,889 | | | | 50,097 | | | | 163,106 | | |
Direxion Daily MSCI Mexico
Bull 3X Shares | | | — | | | | 14,262 | | | | 22,485 | | | | 6,726 | | | | 14,262 | | | | 43,473 | | |
Direxion Daily MSCI South Korea
Bull 3X Shares | | | — | | | | 15,648 | | | | 31,386 | | | | 4,769 | | | | 15,648 | | | | 51,803 | | |
Direxion Daily Aerospace & Defense
Bull 3X Shares | | | 5,317 | | | | 2,545 | | | | — | | | | — | | | | — | | | | — | | |
Direxion Daily Consumer Discretionary
Bull 3X Shares | | | 11,647 | | | | 24,164 | | | | 43,606 | | | | 18,769 | | | | 24,164 | | | | 86,539 | | |
Direxion Daily Dow Jones Internet
Bull 3X Shares | | | 13,316 | | | | 31,317 | | | | 11,557 | | | | 4,118 | | | | 31,317 | | | | 46,992 | | |
Direxion Daily Dow Jones Internet
Bear 3X Shares | | | 1,725 | | | | 18,987 | | | | 33,681 | | | | 27,407 | | | | 18,987 | | | | 80,075 | | |
Direxion Daily Financial Bull 3X Shares | | | 38,893 | | | | 38,893 | | | | — | | | | — | | | | — | | | | — | | |
Direxion Daily Financial Bear 3X Shares | | | 44,901 | | | | 3,187 | | | | 19,103 | | | | 4,546 | | | | 3,187 | | | | 26,836 | | |
Direxion Daily Healthcare Bull 3X Shares | | | 41,060 | | | | 1,081 | | | | 6,955 | | | | 384 | | | | 1,081 | | | | 8,420 | | |
Direxion Daily Homebuilders & Supplies
Bull 3X Shares | | | 3,805 | | | | 3,805 | | | | — | | | | — | | | | — | | | | — | | |
Direxion Daily Industrials Bull 3X Shares | | | 4,165 | | | | 17,849 | | | | 43,942 | | | | 5,072 | | | | 17,849 | | | | 66,863 | | |
Direxion Daily Pharmaceutical & Medical
Bull 3X Shares | | | 330 | | | | 23,937 | | | | 45,404 | | | | 21,940 | | | | 23,937 | | | | 91,281 | | |
Direxion Daily Real Estate Bull 3X Shares | | | 34,235 | | | | 26,610 | | | | 40,574 | | | | 2,655 | | | | 26,610 | | | | 69,839 | | |
Direxion Daily Real Estate Bear 3X Shares | | | 36,419 | | | | 51,746 | | | | 62,433 | | | | 48,415 | | | | 51,746 | | | | 162,594 | | |
Direxion Daily Regional Banks
Bull 3X Shares | | | 1,603 | | | | — | | | | — | | | | — | | | | — | | | | — | | |
Direxion Daily Retail Bull 3X Shares | | | 30,339 | | | | 6,204 | | | | — | | | | — | | | | 1,835 | | | | 1,835 | | |
Direxion Daily S&P 500® High Beta
Bull 3X Shares | | | 5,972 | | | | 8,279 | | | | 30,656 | | | | 8,528 | | | | 8,279 | | | | 47,463 | | |
Direxion Daily S&P 500® High Beta
Bear 3X Shares | | | 824 | | | | 14,090 | | | | 34,799 | | | | 19,907 | | | | 14,090 | | | | 68,796 | | |
Direxion Daily S&P Biotech
Bull 3X Shares | | | 74,013 | | | | 72,629 | | | | — | | | | — | | | | — | | | | — | | |
Direxion Daily S&P Biotech
Bear 3X Shares | | | 2,783 | | | | 12,487 | | | | 39,815 | | | | 2,825 | | | | 12,487 | | | | 55,127 | | |
Direxion Daily Semiconductor
Bull 3X Shares | | | 180 | | | | 180 | | | | — | | | | — | | | | — | | | | — | | |
Direxion Daily Semiconductor
Bear 3X Shares | | | 17,740 | | | | 72 | | | | — | | | | — | | | | — | | | | — | | |
Direxion Daily Technology
Bull 3X Shares | | | 95,167 | | | | 95,167 | | | | — | | | | — | | | | — | | | | — | | |
Direxion Daily Technology
Bear 3X Shares | | | 13,791 | | | | — | | | | 37,209 | | | | 2,677 | | | | — | | | | 39,886 | | |
Direxion Daily Transportation
Bull 3X Shares | | | 1,709 | | | | 12,108 | | | | 34,483 | | | | 3,328 | | | | 12,108 | | | | 49,919 | | |
Direxion Daily Utilities Bull 3X Shares | | | 1,345 | | | | 21,711 | | | | 38,650 | | | | 17,028 | | | | 21,711 | | | | 77,389 | | |
Direxion Daily 7-10 Year Treasury
Bull 3X Shares | | | 9,347 | | | | 21,306 | | | | 33,178 | | | | 21,335 | | | | 21,306 | | | | 75,819 | | |
DIREXION ANNUAL REPORT
196
| | | | | | | Potential Recoupment
Amounts Expiring: | | Total Potential | |
| | | Expenses
Recouped | | Expenses
Reimbursed | | October 31,
2023 | | October 31,
2024 | | October 31,
2025 | | Recoupment
Amount | |
Direxion Daily 7-10 Year Treasury
Bear 3X Shares | | $ | 12,243 | | | $ | 3,162 | | | $ | 38,575 | | | $ | 26,014 | | | $ | 3,162 | | | $ | 67,751 | | |
Direxion Daily 20+ Year Treasury
Bull 3X Shares | | | — | | | | — | | | | — | | | | — | | | | — | | | | — | | |
Direxion Daily 20+ Year Treasury
Bear 3X Shares | | | 377 | | | | — | | | | — | | | | — | | | | — | | | | — | | |
The net amounts receivable (payable) arising from the Investment Advisory Agreement, Management Services Agreement and waiver of any expenses as of October 31, 2022 is presented on the Statement of Assets and Liabilities as Due from (to) Adviser, net.
The Board has adopted a Distribution and Service Plan (the "Plan") pursuant to Rule 12b-1 under the Investment Company Act of 1940. In accordance with the Plan, each Fund is authorized to charge an amount up to 0.25% of its average daily net assets each year for certain distribution-related activities and shareholder services. No 12b-1 fees were charged by any Fund.
7. FAIR VALUE MEASUREMENTS
The Funds follow authoritative fair value accounting standards which establish an authoritative definition of fair value and set out a hierarchy for measuring fair value. These standards require additional disclosures about the various inputs and valuation techniques used to develop the measurements of fair value and a discussion in changes of valuation techniques and related inputs during the period. These inputs are summarized in the three broad levels below:
Level 1 – Quoted prices in active markets for identical securities
Level 2 – Evaluated price based on other significant observable inputs (including quoted prices for similar securities in active markets, quoted prices for identical or similar securities in inactive markets, interest rates, prepayment speeds, credit risk, etc.)
Level 3 – Significant unobservable inputs (including the Fund's own assumptions in determining fair value of investments)
The inputs or methodology used for valuing securities are not an indication of the credit risk associated with investing in those securities.
The following is a summary of the inputs used to value the Funds' net assets as of October 31, 2022:
| | | Asset Class | | Liability Class | |
| | | Level 1 | | Level 2 | | Level 2 | |
Funds | | Investment
Companies | | Common
Stocks | | Short Term
Investments | | Total Return
Swap
Contracts* | | Total Return
Swap
Contracts* | |
Direxion Daily Mid Cap
Bull 3X Shares | | $ | 28,414,815 | | | $ | — | | | $ | 19,189,202 | | | $ | 4,034,037 | | | $ | (146,127 | ) | |
Direxion Daily S&P 500®
Bull 3X Shares | | | — | | | | 1,901,484,950 | | | | 735,033,652 | | | | 87,544,317 | | | | (23,070,967 | ) | |
Direxion Daily S&P 500®
Bear 3X Shares | | | — | | | | — | | | | 1,030,507,850 | | | | 105,188,300 | | | | (27,520,558 | ) | |
Direxion Daily Small Cap
Bull 3X Shares | | | 776,961,157 | | | | — | | | | 625,062,432 | | | | 122,951,767 | | | | (7,863,248 | ) | |
Direxion Daily Small Cap
Bear 3X Shares | | | — | | | | — | | | | 574,391,678 | | | | 2,045,065 | | | | (32,368,456 | ) | |
Direxion Daily FTSE China
Bull 3X Shares | | | 148,475,311 | | | | — | | | | 263,083,444 | | | | — | | | | (152,048,536 | ) | |
Direxion Daily FTSE China
Bear 3X Shares | | | — | | | | — | | | | 180,501,351 | | | | 54,113,427 | | | | — | | |
DIREXION ANNUAL REPORT
197
| | | Asset Class | | Liability Class | |
| | | Level 1 | | Level 2 | | Level 2 | |
Funds | | Investment
Companies | | Common
Stocks | | Short Term
Investments | | Total Return
Swap
Contracts* | | Total Return
Swap
Contracts* | |
Direxion Daily FTSE Europe
Bull 3X Shares | | $ | 6,398,215 | | | $ | — | | | $ | 16,815,368 | | | $ | 757,290 | | | $ | (1,922,410 | ) | |
Direxion Daily MSCI
Emerging Markets
Bull 3X Shares | | | 2,469,646 | | | | — | | | | 69,108,870 | | | | — | | | | (22,168,302 | ) | |
Direxion Daily MSCI
Emerging Markets
Bear 3X Shares | | | — | | | | — | | | | 56,864,052 | | | | 14,192,769 | | | | — | | |
Direxion Daily MSCI Mexico
Bull 3X Shares | | | 4,163,327 | | | | — | | | | 6,846,315 | | | | 2,650,243 | | | | — | | |
Direxion Daily MSCI South
Korea Bull 3X Shares | | | 8,790,914 | | | | — | | | | 12,771,313 | | | | — | | | | (1,475,958 | ) | |
Direxion Daily Aerospace &
Defense Bull 3X Shares | | | — | | | | 122,654,964 | | | | 73,717,024 | | | | 40,646,424 | | | | — | | |
Direxion Daily Consumer
Discretionary Bull
3X Shares | | | — | | | | 19,443,675 | | | | 6,123,444 | | | | 587,560 | | | | (700,096 | ) | |
Direxion Daily Dow Jones
Internet Bull 3X Shares | | | — | | | | 69,511,582 | | | | 46,182,004 | | | | 384,213 | | | | (12,953,002 | ) | |
Direxion Daily Dow Jones
Internet Bear 3X Shares | | | — | | | | — | | | | 55,469,884 | | | | 19,825,051 | | | | — | | |
Direxion Daily Financial
Bull 3X Shares | | | — | | | | 1,095,727,902 | | | | 800,889,631 | | | | 152,077,491 | | | | — | | |
Direxion Daily Financial
Bear 3X Shares | | | — | | | | — | | | | 210,390,023 | | | | — | | | | (25,522,185 | ) | |
Direxion Daily Healthcare
Bull 3X Shares | | | — | | | | 121,265,601 | | | | 72,242,503 | | | | 19,007,728 | | | | — | | |
Direxion Daily Homebuilders &
Supplies Bull 3X Shares | | | — | | | | 77,279,407 | | | | 55,622,420 | | | | 8,334,845 | | | | — | | |
Direxion Daily Industrials
Bull 3X Shares | | | — | | | | 11,864,106 | | | | 6,903,086 | | | | 2,303,753 | | | | — | | |
Direxion Daily
Pharmaceutical & Medical
Bull 3X Shares | | | — | | | | 7,047,641 | | | | 4,308,948 | | | | 803,936 | | | | (201,806 | ) | |
Direxion Daily Real Estate
Bull 3X Shares | | | — | | | | 32,370,371 | | | | 14,456,229 | | | | 4,113,182 | | | | — | | |
Direxion Daily Real Estate
Bear 3X Shares | | | — | | | | — | | | | 213,484,454 | | | | 14,605,246 | | | | (14,424,447 | ) | |
Direxion Daily Regional
Banks Bull 3X Shares | | | — | | | | 138,801,925 | | | | 71,093,287 | | | | 24,002,249 | | | | — | | |
Direxion Daily Retail
Bull 3X Shares | | | — | | | | 28,583,885 | | | | 17,272,186 | | | | 4,033,098 | | | | — | | |
Direxion Daily S&P 500®
High Beta Bull 3X Shares | | | | | 48,296,931 | | | | 21,430,750 | | | | 5,874,167 | | | | (233,162 | ) | |
Direxion Daily S&P 500®
High Beta Bear 3X Shares | | | — | | | | — | | | | 65,710,134 | | | | 13,660,368 | | | | (329,150 | ) | |
Direxion Daily S&P Biotech
Bull 3X Shares | | | — | | | | 676,744,497 | | | | 530,723,510 | | | | 135,934,094 | | | | (31,712,619 | ) | |
Direxion Daily S&P Biotech
Bear 3X Shares | | | — | | | | — | | | | 201,263,746 | | | | 16,133,946 | | | | (15,684,470 | ) | |
Direxion Daily Semiconductor
Bull 3X Shares | | | — | | | | 2,515,448,750 | | | | 2,204,188,102 | | | | 60,908,870 | | | | (869,702,305 | ) | |
Direxion Daily Semiconductor
Bear 3X Shares | | | — | | | | — | | | | 552,731,281 | | | | 167,269,759 | | | | (19,593,452 | ) | |
Direxion Daily Technology
Bull 3X Shares | | | — | | | | 925,460,963 | | | | 627,042,451 | | | | 18,597,208 | | | | (134,172,168 | ) | |
DIREXION ANNUAL REPORT
198
| | | Asset Class | | Liability Class | |
| | | Level 1 | | Level 2 | | Level 2 | |
Funds | | Investment
Companies | | Common
Stocks | | Short Term
Investments | | Total Return
Swap
Contracts* | | Total Return
Swap
Contracts* | |
Direxion Daily Technology
Bear 3X Shares | | $ | — | | | $ | — | | | $ | 147,517,245 | | | $ | 42,022,708 | | | $ | — | | |
Direxion Daily Transportation
Bull 3X Shares | | | — | | | | 13,358,463 | | | | 12,448,931 | | | | 755,230 | | | | (2,524,587 | ) | |
Direxion Daily Utilities
Bull 3X Shares | | | — | | | | 14,662,456 | | | | 6,699,265 | | | | 1,306,158 | | | | (140,578 | ) | |
Direxion Daily 7-10 Year
Treasury Bull 3X Shares | | | 17,875,306 | | | | — | | | | 10,565,065 | | | | — | | | | (4,080,902 | ) | |
Direxion Daily 7-10 Year
Treasury Bear 3X Shares | | | — | | | | — | | | | 55,227,322 | | | | 6,315,606 | | | | — | | |
Direxion Daily 20+ Year
Treasury Bull 3X Shares | | | 262,553,298 | | | | — | | | | 352,840,680 | | | | — | | | | (176,181,059 | ) | |
Direxion Daily 20+ Year
Treasury Bear 3X Shares | | | — | | | | — | | | | 678,137,999 | | | | 155,291,282 | | | | (6,461,655 | ) | |
For further detail on each asset class, see each Fund's Schedule of Investments.
* Total return swap contracts are valued at the unrealized appreciation/(depreciation).
The Funds also follow authoritative accounting standards, which require additional disclosure regarding fair value measurements. Specifically, these standards require reporting entities to disclose a) the input and valuation techniques used to measure fair value for both recurring and nonrecurring fair value measurements, for Level 2 or Level 3 positions, b) transfers between all levels on a gross basis (i.e. transfers out must be disclosed separately from transfers in) as well as the reason(s) for the transfers and c) purchases and sales on a gross basis in the Level 3 rollforward rather than as one net number. Additionally, reporting entities are required to disclose quantitative information about unobservable inputs used in the fair value measurements categorized within Level 3 of the fair value hierarchy.
8. VALUATION OF DERIVATIVE INSTRUMENTS
The Funds follow authoritative standards of accounting for derivative instruments, which establish disclosure requirements for derivative instruments. These standards improve financial reporting for derivative instruments by requiring enhanced disclosures that enable investors to understand how and why a fund uses derivative instruments, how derivative instruments are accounted for and how derivative instruments affect a fund's financial position and results of operations.
The Funds use derivative instruments as part of their principal investment strategy to achieve their investment objective. For additional discussion on the risks associated with derivative instruments refer to Note 2. As of October 31, 2022, the Funds were invested in swap contracts. At April 30, 2022, the fair value of derivative instruments, by primary risk, were as follows:
| | | Asset Derivatives1 | |
Fund | | Equity Risk | | Interest Rate Risk | | Total | |
Direxion Daily Mid Cap Bull 3X Shares | | $ | 4,034,037 | | | $ | — | | | $ | 4,034,037 | | |
Direxion Daily S&P 500® Bull 3X Shares | | | 87,544,317 | | | | — | | | | 87,544,317 | | |
Direxion Daily S&P 500® Bear 3X Shares | | | 105,188,300 | | | | — | | | | 105,188,300 | | |
Direxion Daily Small Cap Bull 3X Shares | | | 122,951,767 | | | | — | | | | 122,951,767 | | |
Direxion Daily Small Cap Bear 3X Shares | | | 2,045,065 | | | | — | | | | 2,045,065 | | |
Direxion Daily FTSE China Bear 3X Shares | | | 54,113,427 | | | | — | | | | 54,113,427 | | |
Direxion Daily FTSE Europe Bull 3X Shares | | | 757,290 | | | | — | | | | 757,290 | | |
Direxion Daily MSCI Emerging Markets Bear 3X Shares | | | 14,192,769 | | | | — | | | | 14,192,769 | | |
Direxion Daily MSCI Mexico Bull 3X Shares | | | 2,650,243 | | | | — | | | | 2,650,243 | | |
Direxion Daily Aerospace & Defense Bull 3X Shares | | | 40,646,424 | | | | — | | | | 40,646,424 | | |
Direxion Daily Consumer Discretionary Bull 3X Shares | | | 587,560 | | | | — | | | | 587,560 | | |
Direxion Daily Dow Jones Internet Bull 3X Shares | | | 384,213 | | | | — | | | | 384,213 | | |
DIREXION ANNUAL REPORT
199
| | | Asset Derivatives1 | |
Fund | | Equity Risk | | Interest Rate Risk | | Total | |
Direxion Daily Dow Jones Internet Bear 3X Shares | | $ | 19,825,051 | | | $ | — | | | $ | 19,825,051 | | |
Direxion Daily Financial Bull 3X Shares | | | 152,077,491 | | | | — | | | | 152,077,491 | | |
Direxion Daily Healthcare Bull 3X Shares | | | 19,007,728 | | | | — | | | | 19,007,728 | | |
Direxion Daily Homebuilders & Supplies Bull 3X Shares | | | 8,334,845 | | | | — | | | | 8,334,845 | | |
Direxion Daily Industrials Bull 3X Shares | | | 2,303,753 | | | | — | | | | 2,303,753 | | |
Direxion Daily Pharmaceutical & Medical Bull 3X Shares | | | 803,936 | | | | — | | | | 803,936 | | |
Direxion Daily Real Estate Bull 3X Shares | | | 4,113,182 | | | | — | | | | 4,113,182 | | |
Direxion Daily Real Estate Bear 3X Shares | | | 14,605,246 | | | | — | | | | 14,605,246 | | |
Direxion Daily Regional Banks Bull 3X Shares | | | 24,002,249 | | | | — | | | | 24,002,249 | | |
Direxion Daily Retail Bull 3X Shares | | | 4,033,098 | | | | — | | | | 4,033,098 | | |
Direxion Daily S&P 500® High Beta Bull 3X Shares | | | 5,874,167 | | | | — | | | | 5,874,167 | | |
Direxion Daily S&P 500® High Beta Bear 3X Shares | | | 13,660,368 | | | | — | | | | 13,660,368 | | |
Direxion Daily S&P Biotech Bull 3X Shares | | | 135,934,094 | | | | — | | | | 135,934,094 | | |
Direxion Daily S&P Biotech Bear 3X Shares | | | 16,133,946 | | | | — | | | | 16,133,946 | | |
Direxion Daily Semiconductor Bull 3X Shares | | | 60,908,870 | | | | — | | | | 60,908,870 | | |
Direxion Daily Semiconductor Bear 3X Shares | | | 167,269,759 | | | | — | | | | 167,269,759 | | |
Direxion Daily Technology Bull 3X Shares | | | 18,597,208 | | | | — | | | | 18,597,208 | | |
Direxion Daily Technology Bear 3X Shares | | | 42,022,708 | | | | — | | | | 42,022,708 | | |
Direxion Daily Transportation Bull 3X Shares | | | 755,230 | | | | — | | | | 755,230 | | |
Direxion Daily Utilities Bull 3X Shares | | | 1,306,158 | | | | — | | | | 1,306,158 | | |
Direxion Daily 7-10 Year Treasury Bear 3X Shares | | | — | | | | 6,315,606 | | | | 6,315,606 | | |
Direxion Daily 20+ Year Treasury Bear 3X Shares | | | — | | | | 155,291,282 | | | | 155,291,282 | | |
1 Statements of Assets and Liabilities location: Unrealized appreciation on swap contracts.
| | | Liability Derivatives2 | |
Fund | | Equity Risk | | Interest Rate Risk | | Total | |
Direxion Daily Mid Cap Bull 3X Shares | | $ | 146,127 | | | $ | — | | | $ | 146,127 | | |
Direxion Daily S&P 500® Bull 3X Shares | | | 23,070,967 | | | | — | | | | 23,070,967 | | |
Direxion Daily S&P 500® Bear 3X Shares | | | 27,520,558 | | | | — | | | | 27,520,558 | | |
Direxion Daily Small Cap Bull 3X Shares | | | 7,863,248 | | | | — | | | | 7,863,248 | | |
Direxion Daily Small Cap Bear 3X Shares | | | 32,368,456 | | | | — | | | | 32,368,456 | | |
Direxion Daily FTSE China Bull 3X Shares | | | 152,048,536 | | | | — | | | | 152,048,536 | | |
Direxion Daily FTSE Europe Bull 3X Shares | | | 1,922,410 | | | | — | | | | 1,922,410 | | |
Direxion Daily MSCI Emerging Markets Bull 3X Shares | | | 22,168,302 | | | | — | | | | 22,168,302 | | |
Direxion Daily MSCI South Korea Bull 3X Shares | | | 1,475,958 | | | | — | | | | 1,475,958 | | |
Direxion Daily Consumer Discretionary Bull 3X Shares | | | 700,096 | | | | — | | | | 700,096 | | |
Direxion Daily Dow Jones Internet Bull 3X Shares | | | 12,953,002 | | | | — | | | | 12,953,002 | | |
Direxion Daily Financial Bear 3X Shares | | | 25,522,185 | | | | — | | | | 25,522,185 | | |
Direxion Daily Pharmaceutical & Medical Bull 3X Shares | | | 201,806 | | | | — | | | | 201,806 | | |
Direxion Daily Real Estate Bear 3X Shares | | | 14,424,447 | | | | — | | | | 14,424,447 | | |
Direxion Daily S&P 500® High Beta Bull 3X Shares | | | 233,162 | | | | — | | | | 233,162 | | |
Direxion Daily S&P 500® High Beta Bear 3X Shares | | | 329,150 | | | | — | | | | 329,150 | | |
Direxion Daily S&P Biotech Bull 3X Shares | | | 31,712,619 | | | | — | | | | 31,712,619 | | |
Direxion Daily S&P Biotech Bear 3X Shares | | | 15,684,470 | | | | — | | | | 15,684,470 | | |
Direxion Daily Semiconductor Bull 3X Shares | | | 869,702,305 | | | | — | | | | 869,702,305 | | |
Direxion Daily Semiconductor Bear 3X Shares | | | 19,593,452 | | | | — | | | | 19,593,452 | | |
Direxion Daily Technology Bull 3X Shares | | | 134,172,168 | | | | — | | | | 134,172,168 | | |
Direxion Daily Transportation Bull 3X Shares | | | 2,524,587 | | | | — | | | | 2,524,587 | | |
Direxion Daily Utilities Bull 3X Shares | | | 140,578 | | | | — | | | | 140,578 | | |
Direxion Daily 7-10 Year Treasury Bull 3X Shares | | | — | | | | 4,080,902 | | | | 4,080,902 | | |
Direxion Daily 20+ Year Treasury Bull 3X Shares | | | — | | | | 176,181,059 | | | | 176,181,059 | | |
Direxion Daily 20+ Year Treasury Bear 3X Shares | | | — | | | | 6,461,655 | | | | 6,461,655 | | |
2 Statements of Assets and Liabilities location: Unrealized depreciation on swap contracts.
DIREXION ANNUAL REPORT
200
Transactions in derivative instruments during the period ended October 31, 2022 by primary risk, were as follows:
| | | | | Net Realized Gain (Loss)1 | | Net Unrealized
Appreciation (Depreciation)2 | |
Fund | | | | Equity Risk | | Interest Rate Risk | | Equity Risk | | Interest Rate Risk | |
Direxion Daily Mid Cap
Bull 3X Shares | | Swap Contracts | | $ | (11,815,331 | ) | | $ | — | | | $ | (19,428,767 | ) | | $ | — | | |
Direxion Daily S&P 500®
Bull 3X Shares | | Swap Contracts | | | (590,652,464 | ) | | | — | | | | (723,953,351 | ) | | | — | | |
Direxion Daily S&P 500®
Bear 3X Shares | | Swap Contracts | | | (1,820,867 | ) | | | — | | | | 157,306,258 | | | | — | | |
Direxion Daily Small Cap
Bull 3X Shares | | Swap Contracts | | | (858,201,681 | ) | | | — | | | | (20,424,743 | ) | | | — | | |
Direxion Daily Small Cap
Bear 3X Shares | | Swap Contracts | | | 111,315,116 | | | | — | | | | 35,918,628 | | | | — | | |
Direxion Daily FTSE China
Bull 3X Shares | | Swap Contracts | | | (539,796,240 | ) | | | — | | | | (103,161,480 | ) | | | — | | |
Direxion Daily FTSE China
Bear 3X Shares | | Swap Contracts | | | 68,000,459 | | | | — | | | | 61,784,025 | | | | — | | |
Direxion Daily FTSE Europe
Bull 3X Shares | | Swap Contracts | | | (13,278,294 | ) | | | — | | | | (10,744,508 | ) | | | — | | |
Direxion Daily MSCI Emerging
Markets Bull 3X Shares | | Swap Contracts | | | (112,921,742 | ) | | | — | | | | (12,352,541 | ) | | | — | | |
Direxion Daily MSCI Emerging
Markets Bear 3X Shares | | Swap Contracts | | | 21,149,834 | | | | — | | | | 12,129,823 | | | | — | | |
Direxion Daily MSCI Mexico
Bull 3X Shares | | Swap Contracts | | | 3,141,711 | | | | — | | | | (2,541,568 | ) | | | — | | |
Direxion Daily MSCI South
Korea Bull 3X Shares | | Swap Contracts | | | (32,858,734 | ) | | | — | | | | 3,353,381 | | | | — | | |
Direxion Daily Aerospace &
Defense Bull 3X Shares | | Swap Contracts | | | (20,929,522 | ) | | | — | | | | 11,627,268 | | | | — | | |
Direxion Daily Consumer
Discretionary Bull 3X Shares | | Swap Contracts | | | (22,013,596 | ) | | | — | | | | (16,877,513 | ) | | | — | | |
Direxion Daily Dow Jones
Internet Bull 3X Shares | | Swap Contracts | | | (192,620,179 | ) | | | — | | | | (33,552,842 | ) | | | — | | |
Direxion Daily Dow Jones
Internet Bear 3X Shares | | Swap Contracts | | | (5,074,902 | ) | | | — | | | | 20,263,013 | | | | — | | |
Direxion Daily Financial
Bull 3X Shares | | Swap Contracts | | | (277,080,997 | ) | | | — | | | | (987,302,061 | ) | | | — | | |
Direxion Daily Financial
Bear 3X Shares | | Swap Contracts | | | 14,512,157 | | | | — | | | | 3,952,927 | | | | — | | |
Direxion Daily Healthcare
Bull 3X Shares | | Swap Contracts | | | 11,808,344 | | | | — | | | | (39,918,064 | ) | | | — | | |
Direxion Daily Homebuilders &
Supplies Bull 3X Shares | | Swap Contracts | | | (33,861,317 | ) | | | — | | | | (120,188,219 | ) | | | — | | |
Direxion Daily Industrials
Bull 3X Shares | | Swap Contracts | | | 137,873 | | | | — | | | | (12,064,262 | ) | | | — | | |
Direxion Daily Pharmaceutical &
Medical Bull 3X Shares | | Swap Contracts | | | (5,852,092 | ) | | | — | | | | 248,917 | | | | — | | |
DIREXION ANNUAL REPORT
201
| | | | | Net Realized Gain (Loss)1 | | Net Unrealized
Appreciation (Depreciation)2 | |
Fund | | | | Equity Risk | | Interest Rate Risk | | Equity Risk | | Interest Rate Risk | |
Direxion Daily Real Estate
Bull 3X Shares | | Swap Contracts | | $ | 739,862 | | | $ | — | | | $ | (51,070,274 | ) | | $ | — | | |
Direxion Daily Real Estate
Bear 3X Shares | | Swap Contracts | | | 24,704,385 | | | | — | | | | 5,287,833 | | | | — | | |
Direxion Daily Regional Banks
Bull 3X Shares | | Swap Contracts | | | (3,587,853 | ) | | | — | | | | (113,983,166 | ) | | | — | | |
Direxion Daily Retail
Bull 3X Shares | | Swap Contracts | | | (76,891,230 | ) | | | — | | | | (28,058,574 | ) | | | — | | |
Direxion Daily S&P 500® High
Beta Bull 3X Shares | | Swap Contracts | | | (21,435,484 | ) | | | — | | | | (34,172,062 | ) | | | — | | |
Direxion Daily S&P 500® High
Beta Bear 3X Shares | | Swap Contracts | | | (11,036,973 | ) | | | — | | | | 21,185,720 | | | | — | | |
Direxion Daily S&P Biotech
Bull 3X Shares | | Swap Contracts | | | (1,168,236,477 | ) | | | — | | | | 129,702,430 | | | | — | | |
Direxion Daily S&P Biotech
Bear 3X Shares | | Swap Contracts | | | (16,969,252 | ) | | | — | | | | (274,321 | ) | | | — | | |
Direxion Daily Semiconductor
Bull 3X Shares | | Swap Contracts | | | (3,786,200,893 | ) | | | — | | | | (1,361,879,213 | ) | | | — | | |
Direxion Daily Semiconductor
Bear 3X Shares | | Swap Contracts | | | 221,587,899 | | | | — | | | | 165,141,018 | | | | — | | |
Direxion Daily Technology
Bull 3X Shares | | Swap Contracts | | | (507,775,156 | ) | | | — | | | | (1,093,334,613 | ) | | | — | | |
Direxion Daily Technology
Bear 3X Shares | | Swap Contracts | | | (12,493,515 | ) | | | — | | | | 64,453,561 | | | | — | | |
Direxion Daily Transportation
Bull 3X Shares | | Swap Contracts | | | 2,141,311 | | | | — | | | | (28,310,885 | ) | | | — | | |
Direxion Daily Utilities
Bull 3X Shares | | Swap Contracts | | | 5,806,005 | | | | — | | | | (3,296,083 | ) | | | — | | |
Direxion Daily 7-10 Year
Treasury Bull 3X Shares | | Swap Contracts | | | — | | | | (6,916,431 | ) | | | — | | | | (3,426,183 | ) | |
Direxion Daily 7-10 Year
Treasury Bear 3X Shares | | Swap Contracts | | | — | | | | 14,428,932 | | | | — | | | | 5,753,324 | | |
Direxion Daily 20+ Year
Treasury Bull 3X Shares | | Swap Contracts | | | — | | | | (226,486,031 | ) | | | — | | | | (174,402,921 | ) | |
Direxion Daily 20+ Year
Treasury Bear 3X Shares | | Swap Contracts | | | — | | | | 324,325,126 | | | | — | | | | 177,391,380 | | |
1 Statements of Operations location: Net realized gain (loss) on swap contracts.
2 Statements of Operations location: Change in net unrealized appreciation (depreciation) on swap contracts.
For the period ended October 31, 2022, the volume of the derivatives held by the Funds was as follows:
| | | Quarterly Average Gross Notional Amounts | |
| | | Long Total Return
Swap Contracts | | Short Total Return
Swap Contracts | |
Direxion Daily Mid Cap Bull 3X Shares | | $ | 150,193,579 | | | $ | — | | |
Direxion Daily S&P 500® Bull 3X Shares | | | 6,480,881,592 | | | | — | | |
Direxion Daily S&P 500® Bear 3X Shares | | | — | | | | 1,652,984,765 | | |
Direxion Daily Small Cap Bull 3X Shares | | | 3,342,523,662 | | | | — | | |
DIREXION ANNUAL REPORT
202
| | | Quarterly Average Gross Notional Amounts | |
| | | Long Total Return
Swap Contracts | | Short Total Return
Swap Contracts | |
Direxion Daily Small Cap Bear 3X Shares | | $ | — | | | $ | 1,304,353,325 | | |
Direxion Daily FTSE China Bull 3X Shares | | | 1,074,383,243 | | | | — | | |
Direxion Daily FTSE China Bear 3X Shares | | | — | | | | 307,386,463 | | |
Direxion Daily FTSE Europe Bull 3X Shares | | | 78,152,150 | | | | — | | |
Direxion Daily MSCI Emerging Markets Bull 3X Shares | | | 321,323,170 | | | | — | | |
Direxion Daily MSCI Emerging Markets Bear 3X Shares | | | — | | | | 119,759,713 | | |
Direxion Daily MSCI Mexico Bull 3X Shares | | | 31,317,607 | | | | — | | |
Direxion Daily MSCI South Korea Bull 3X Shares | | | 80,864,859 | | | | — | | |
Direxion Daily Aerospace & Defense Bull 3X Shares | | | 495,839,630 | | | | — | | |
Direxion Daily Consumer Discretionary Bull 3X Shares | | | 89,816,035 | | | | — | | |
Direxion Daily Dow Jones Internet Bull 3X Shares | | | 293,653,385 | | | | — | | |
Direxion Daily Dow Jones Internet Bear 3X Shares | | | — | | | | 96,828,554 | | |
Direxion Daily Financial Bull 3X Shares | | | 5,898,296,036 | | | | — | | |
Direxion Daily Financial Bear 3X Shares | | | — | | | | 435,401,577 | | |
Direxion Daily Healthcare Bull 3X Shares | | | 498,525,092 | | | | — | | |
Direxion Daily Homebuilders & Supplies Bull 3X Shares | | | 532,151,797 | | | | — | | |
Direxion Daily Industrials Bull 3X Shares | | | 79,293,598 | | | | — | | |
Direxion Daily Pharmaceutical & Medical Bull 3X Shares | | | 45,638,683 | | | | — | | |
Direxion Daily Real Estate Bull 3X Shares | | | 221,124,396 | | | | — | | |
Direxion Daily Real Estate Bear 3X Shares | | | — | | | | 220,397,601 | | |
Direxion Daily Regional Banks Bull 3X Shares | | | 735,157,177 | | | | — | | |
Direxion Daily Retail Bull 3X Shares | | | 184,827,790 | | | | — | | |
Direxion Daily S&P 500® High Beta Bull 3X Shares | | | 185,411,314 | | | | — | | |
Direxion Daily S&P 500® High Beta Bear 3X Shares | | | — | | | | 134,523,541 | | |
Direxion Daily S&P Biotech Bull 3X Shares | | | 2,166,525,202 | | | | — | | |
Direxion Daily S&P Biotech Bear 3X Shares | | | — | | | | 306,500,634 | | |
Direxion Daily Semiconductor Bull 3X Shares | | | 10,750,298,967 | | | | — | | |
Direxion Daily Semiconductor Bear 3X Shares | | | — | | | | 960,512,204 | | |
Direxion Daily Technology Bull 3X Shares | | | 5,267,371,175 | | | | — | | |
Direxion Daily Technology Bear 3X Shares | | | — | | | | 335,222,686 | | |
Direxion Daily Transportation Bull 3X Shares | | | 125,434,908 | | | | — | | |
Direxion Daily Utilities Bull 3X Shares | | | 56,277,396 | | | | — | | |
Direxion Daily 7-10 Year Treasury Bull 3X Shares | | | 54,127,968 | | | | — | | |
Direxion Daily 7-10 Year Treasury Bear 3X Shares | | | — | | | | 142,456,333 | | |
Direxion Daily 20+ Year Treasury Bull 3X Shares | | | 966,893,956 | | | | — | | |
Direxion Daily 20+ Year Treasury Bear 3X Shares | | | — | | | | 1,513,624,141 | | |
The Funds utilize this volume of derivatives in order to obtain leverage in order to meet the investment objectives of 300% or -300% daily performance of their respective indices.
9. PRINCIPAL RISKS
Below are some of the principal risks of investing in the Funds. Please refer to the Funds' prospectus for a full discussion.
Counterparty Risk – A Fund will be subject to credit risk with respect to the amount it expects to receive from counterparties to financial instruments entered into by the Fund. The Funds' counterparties are generally required to post collateral to the Funds to the extent of the Funds' daily exposure to such counterparties. However, to the extent any such collateral is insufficient, the Funds will be exposed to counterparty risk as described in this paragraph. In addition, there may be a delay associated with realization by the Funds of the collateral posted by such counterparties in the event of counterparty default or bankruptcy. A Fund may be negatively impacted if a counterparty becomes bankrupt or otherwise fails to perform its obligations due to financial difficulties. A Fund may experience significant delays in obtaining any recovery in a bankruptcy or other reorganization proceeding, and a Fund may obtain only limited recovery or may obtain no recovery in such circumstances.
DIREXION ANNUAL REPORT
203
Sector Concentration Risk – The risk of concentrating investments in a limited number of issuers in a particular industry is that a Fund will be more susceptible to the risks associated with that industry than a Fund that does not concentrate its investments.
Daily Index Correlation/Tracking Risk – A number of factors may affect a Fund's ability to achieve a high degree of correlation with its benchmark, and there can be no guarantee that a Fund will achieve a high degree of correlation. A failure to achieve a high degree of correlation may prevent a Fund from achieving its investment objective. A number of factors may adversely affect a Fund's correlation with its benchmark, including fees, expenses, transaction costs, costs associated with the use of leveraged investment techniques, income items, accounting standards, and disruptions or illiquidity in the markets for the securities or financial instruments in which the Fund invests. A Fund may not have investment exposure to all securities in its underlying benchmark index, or its weighting of investment exposure to such stocks or industries may be different from that of the index. In addition, a Fund may invest in securities or financial instruments not included in the index underlying its benchmark. A Fund may be subject to large movements of assets into and out of the Fund, potentially resulting in the Fund being over- or under-exposed to its benchmark. Activities surrounding annual index reconstitutions and other index rebalancing or reconstitution events may hinder the Funds' ability to meet their daily investment objective on that day. Each Fund seeks to rebalance its portfolio daily to keep leverage consistent with its daily investment objective.
Certain Funds are "leveraged" funds in the sense that they have investment objectives to match a multiple of the performance of an index on a given day. These Funds are subject to all of the correlation risks described above. In addition, there is a special form of correlation risk that derives from these Funds' use of leverage, which is that for periods greater than one day, the use of leverage tends to cause the performance of a Fund to be either greater than or less than the index performance times the stated multiple in the fund objective, before accounting for fees and fund expenses. In general, given a particular index return, increased volatility of the index will cause a decrease in the performance relative to the index performance times the stated fund multiple.
Derivatives Risk – The Fund's investments in derivatives may pose risks in addition to, and greater than, those associated with directly investing in securities or other investments, including risk related to the market, leverage, imperfect daily correlations with underlying investments or the Fund's other portfolio holdings, higher price volatility, lack of availability, counterparty risk, liquidity, valuation and legal restrictions.
In addition, the Fund's investments in derivatives are subject to the following risks:
• Swap Agreements. Swap agreements are entered into primarily with major global financial institutions for a specified period which may range from one day to more than one year. In a standard swap transaction, two parties agree to exchange the return (or differentials in rates of return) earned or realized on particular predetermined reference assets or underlying securities or instruments. The gross return to be exchanged or swapped between the parties is calculated based on a notional amount or the return on or change in value of a particular dollar amount invested in a basket of securities representing a particular index or an ETF that seeks to track an index. Swaps are subject to counterparty, valuation and leveraging risks.
• Futures Contracts. Futures contracts are typically exchange-traded contracts that call for the future delivery of an asset at a certain price and date, or cash settlement of the terms of the contract. There may be an imperfect correlation between the changes in market value of the securities held by the Fund and the prices of futures contracts. Futures contracts are subject to liquidity risks; there may not be a liquid secondary market for the futures contracts and the Fund may not be able to enter into a closing transaction. Exchanges may also limit the number of positions that can be held or controlled by the Fund or the Adviser, thus limiting the ability of the Fund to implement its leveraged investment strategy. Futures markets are highly volatile and the use of futures may increase the Fund's volatility. Futures contracts are also subject to leverage risk.
Foreign Securities Risk – Investments in foreign securities directly or indirectly through investments in exchange traded funds which track foreign securities involve greater risks than investing in domestic securities. As a result, the Funds' returns and net asset values may be affected to a large degree by fluctuations in currency exchange rates, political, diplomatic or economic conditions and regulatory requirements in other countries. The laws, accounting and financial reporting standards in foreign countries may require less disclosure than required in the U.S., and therefore there may be less public information
DIREXION ANNUAL REPORT
204
available about foreign companies. Investments in foreign emerging markets present a greater risk than investing in foreign issuers in general. The risk of political or social upheaval is greater in emerging markets. In addition, there may be risks of an economy's dependence on revenues from particular commodities, currency transfer restrictions, a limited number of potential buyers for such securities and delays and disruption in securities settlement procedures.
Leverage Risk – Leverage offers a means of magnifying market movements into larger changes in an investment's value and provides greater investment exposure than an unleveraged investment. Swap and future agreements may be used to create leverage. Each Fund employs leveraged investment techniques to achieve its investment objective.
Liquidity Risk – In certain circumstances, such as the disruption of the orderly markets for the securities or financial instruments in which a Fund invests, a Fund might not be able to dispose of certain holdings quickly or at prices that represent fair market value in the judgment of the Adviser. Additionally, certain counterparties may have the ability to demand repayment at any time, thereby exposing the Fund to the risk that it may be required to liquidate investments at an inopportune time. This may prevent a Fund from limiting losses, realizing gains or from achieving a high correlation or inverse correlation with its underlying index.
Market Disruption Risk – Geopolitical and other events, including public health crises and natural disasters, have recently led to increased market volatility and significant market losses. Significant market volatility and market downturns may limit a Fund's ability to sell securities and the Fund's sales may exacerbate the market volatility and downturn. Under such circumstances, a Fund may have difficulty achieving its investment objective for one or more trading days, which may adversely impact the Fund's returns on those days and periods inclusive of those days. Alternatively, the Fund may incur higher costs in order to achieve its investment objective and may be forced to purchase and sell securities (including other ETFs' shares) at market prices that do not represent their fair value (including in the case of an ETF, its net asset value) or at times that result in differences between the price the Fund receives for the security and the market closing price of the security. Under those circumstances, the Fund's ability to track its index is likely to be adversely affected, the market price of Fund shares may reflect a greater premium or discount to net asset value, and bid-ask spreads in the Fund's shares may widen, resulting in increased transaction costs for secondary market purchasers and sellers. The Fund may also incur additional tracking error due to the use of other securities that are not perfectly correlated to the Fund's index.
The recent pandemic spread of the novel coronavirus known as COVID-19 has proven to be a market disrupting event. The impact of this virus, like other pandemics that may arise in the future, has negatively affected and may continue to negatively affect the economies of many nations, companies and the global securities and commodities markets, including by reducing liquidity in the markets. Adverse effects may be more pronounced for developing or emerging market countries that have less established health care systems. How long such events will last and whether they will continue or recur cannot be predicted.
10. ADDITIONAL INFORMATION
On March 28, 2022 and May 31, 2022, shares of the following Funds were adjusted to reflect a reverse stock split. The effect of the reverse stock split was to decrease the number of shares outstanding and increase the net asset value. The reverse stock split has no impact on the net assets of the Fund or the value of a shareholder's investment in the Fund. A summary of the reverse stock split is as follows:
Funds | | Effective Date | | Rate | | Net Asset
Value Before
Split | | Net Asset
Value After
Split | | Shares
Outstanding
Before Split | | Shares
Outstanding
After Split | |
Direxion Daily Semiconductor
Bear 3X Shares | | 3/28/22 | | | 1 | :10 | | $ | 3.50 | | | $ | 35.00 | | | | 74,251,071 | | | | 7,425,107 | | |
Direxion Daily FTSE China
Bull 3X Shares | | 5/31/22 | | | 1 | :20 | | | 3.86 | | | | 77.20 | | | | 118,900,013 | | | | 5,945,001 | | |
DIREXION ANNUAL REPORT
205
11. SUBSEQUENT EVENTS
Management has performed an evaluation of subsequent events through the date the financial statements were issued and has determined that no items require recognition or disclosure besides those noted below.
On December 19, 2022, certain Funds declared income distributions with an ex-date of December 20, 2022 and payable date of December 28, 2022. The specific Funds and per share amounts of the distributions are listed below.
Funds | | Per Share
Income
Distribution | |
Direxion Daily Mid Cap Bull 3X Shares | | $ | 0.03837 | | |
Direxion Daily S&P 500® Bull 3X Shares | | | 0.12356 | | |
Direxion Daily Small Cap Bull 3X Shares | | | 0.09902 | | |
Direxion Daily FTSE China Bull 3X Shares | | | 0.45608 | | |
Direxion Daily FTSE Europe Bull 3X Shares | | | 0.08167 | | |
Direxion Daily MSCI Mexico Bull 3X Shares | | | 0.75266 | | |
Direxion Daily MSCI South Korea Bull 3X Shares | | | 0.03624 | | |
Direxion Daily Aerospace & Defense Bull 3X Shares | | | 0.05093 | | |
Direxion Daily Dow Jones Internet Bear 3X Shares | | | 0.06204 | | |
Direxion Daily Financial Bull 3X Shares | | | 0.32590 | | |
Direxion Daily Financial Bear 3X Shares | | | 0.00094 | | |
Direxion Daily Healthcare Bull 3X Shares | | | 0.14407 | | |
Direxion Daily Industrials Bull 3X Shares | | | 0.11136 | | |
Direxion Daily Pharmaceutical & Medical Bull 3X Shares | | | 0.03171 | | |
Direxion Daily Real Estate Bull 3X Shares | | | 0.01437 | | |
Direxion Daily Real Estate Bear 3X Shares | | | 0.20557 | | |
Direxion Daily Regional Banks Bull 3X Shares | | | 0.04747 | | |
Direxion Daily Retail Bull 3X Shares | | | 0.01781 | | |
Direxion Daily S&P 500® High Beta Bear 3X Shares | | | 0.00273 | | |
Direxion Daily S&P Biotech Bear 3X Shares | | | 0.09179 | | |
Direxion Daily Semiconductor Bull 3X Shares | | | 0.03789 | | |
Direxion Daily Semiconductor Bear 3X Shares | | | 0.07413 | | |
Direxion Daily Technology Bull 3X Shares | | | 0.04921 | | |
Direxion Daily Utilities Bull 3X Shares | | | 0.01521 | | |
Direxion Daily 7-10 Year Treasury Bull 3X Shares | | | 0.16369 | | |
Direxion Daily 7-10 Year Treasury Bear 3X Shares | | | 0.01185 | | |
Direxion Daily 20+ Year Treasury Bull 3X Shares | | | 0.04709 | | |
DIREXION ANNUAL REPORT
206
Direxion Shares ETF Trust
Report of Independent Registered Public Accounting Firm
To the Shareholders of Direxion Daily Mid Cap Bull 3X Shares, Direxion Daily S&P 500® Bull 3X Shares, Direxion Daily S&P 500® Bear 3X Shares, Direxion Daily Small Cap Bull 3X Shares, Direxion Daily Small Cap Bear 3X Shares, Direxion Daily FTSE China Bull 3X Shares, Direxion Daily FTSE China Bear 3X Shares, Direxion Daily FTSE Europe Bull 3X Shares, Direxion Daily MSCI Emerging Markets Bull 3X Shares, Direxion Daily MSCI Emerging Markets Bear 3X Shares, Direxion Daily MSCI Mexico Bull 3X Shares, Direxion Daily MSCI South Korea Bull 3X Shares, Direxion Daily Aerospace & Defense Bull 3X Shares, Direxion Daily Consumer Discretionary Bull 3X Shares, Direxion Daily Dow Jones Internet Bull 3X Shares, Direxion Daily Dow Jones Internet Bear 3X Shares, Direxion Daily Financial Bull 3X Shares, Direxion Daily Financial Bear 3X Shares, Direxion Daily Healthcare Bull 3X Shares, Direxion Daily Homebuilders & Supplies Bull 3X Shares, Direxion Daily Industrials Bull 3X Shares, Direxion Daily Pharmaceutical & Medical Bull 3X Shares, Direxion Daily Real Estate Bull 3X Shares (formerly Direxion Daily MSCI Real Estate Bull 3X Shares), Direxion Daily Real Estate Bear 3X Shares (formerly Direxion Daily MSCI Real Estate Bear 3X Shares), Direxion Daily Regional Banks Bull 3X Shares, Direxion Daily Retail Bull 3X Shares, Direxion Daily S&P 500® High Beta Bull 3X Shares, Direxion Daily S&P 500® High Beta Bear 3X Shares, Direxion Daily S&P Biotech Bull 3X Shares, Direxion Daily S&P Biotech Bear 3X Shares, Direxion Daily Semiconductor Bull 3X Shares, Direxion Daily Semiconductor Bear 3X Shares, Direxion Daily Technology Bull 3X Shares, Direxion Daily Technology Bear 3X Shares, Direxion Daily Transportation Bull 3X Shares, Direxion Daily Utilities Bull 3X Shares, Direxion Daily 7-10 Year Treasury Bull 3X Shares, Direxion Daily 7-10 Year Treasury Bear 3X Shares, Direxion Daily 20+ Year Treasury Bull 3X Shares, Direxion Daily 20+ Year Treasury Bear 3X Shares and the Board of Trustees of Direxion Shares ETF Trust.
Opinion on the Financial Statements
We have audited the accompanying statements of assets and liabilities of Direxion Daily Mid Cap Bull 3X Shares, Direxion Daily S&P 500® Bull 3X Shares, Direxion Daily S&P 500® Bear 3X Shares, Direxion Daily Small Cap Bull 3X Shares, Direxion Daily Small Cap Bear 3X Shares, Direxion Daily FTSE China Bull 3X Shares, Direxion Daily FTSE China Bear 3X Shares, Direxion Daily FTSE Europe Bull 3X Shares, Direxion Daily MSCI Emerging Markets Bull 3X Shares, Direxion Daily MSCI Emerging Markets Bear 3X Shares, Direxion Daily MSCI Mexico Bull 3X Shares, Direxion Daily MSCI South Korea Bull 3X Shares, Direxion Daily Aerospace & Defense Bull 3X Shares, Direxion Daily Consumer Discretionary Bull 3X Shares, Direxion Daily Dow Jones Internet Bull 3X Shares, Direxion Daily Dow Jones Internet Bear 3X Shares, Direxion Daily Financial Bull 3X Shares, Direxion Daily Financial Bear 3X Shares, Direxion Daily Healthcare Bull 3X Shares, Direxion Daily Homebuilders & Supplies Bull 3X Shares, Direxion Daily Industrials Bull 3X Shares, Direxion Daily Pharmaceutical & Medical Bull 3X Shares, Direxion Daily Real Estate Bull 3X Shares (formerly Direxion Daily MSCI Real Estate Bull 3X Shares), Direxion Daily Real Estate Bear 3X Shares (formerly Direxion Daily MSCI Real Estate Bear 3X Shares), Direxion Daily Regional Banks Bull 3X Shares, Direxion Daily Retail Bull 3X Shares, Direxion Daily S&P 500® High Beta Bull 3X Shares, Direxion Daily S&P 500® High Beta Bear 3X Shares, Direxion Daily S&P Biotech Bull 3X Shares, Direxion Daily S&P Biotech Bear 3X Shares, Direxion Daily Semiconductor Bull 3X Shares, Direxion Daily Semiconductor Bear 3X Shares, Direxion Daily Technology Bull 3X Shares, Direxion Daily Technology Bear 3X Shares, Direxion Daily Transportation Bull 3X Shares, Direxion Daily Utilities Bull 3X Shares, Direxion Daily 7-10 Year Treasury Bull 3X Shares, Direxion Daily 7-10 Year Treasury Bear 3X Shares, Direxion Daily 20+ Year Treasury Bull 3X Shares and Direxion Daily 20+ Year Treasury Bear 3X Shares (collectively referred to as the "Funds"), (40 of the funds constituting Direxion Shares ETF Trust (the "Trust")), including the schedules of investments, as of October 31, 2022, and the related statements of operations and changes in net assets, and the financial highlights for each of the periods indicated in the table below and the related notes (collectively referred to as the "financial statements"). In our opinion, the financial statements present fairly, in all material respects, the financial position of each of the Funds (40 of the funds constituting Direxion Shares ETF Trust) at October 31, 2022, and the results of their operations, changes in net assets and financial highlights for each of the periods indicated in the table below, in conformity with U.S. generally accepted accounting principles.
DIREXION ANNUAL REPORT
207
Direxion Shares ETF Trust
Report of Independent Registered Public Accounting Firm
Individual fund constituting
the Direxion Shares ETF Trust | | Statement of
Operations | | Statements of
Changes in
Net Assets | | Financial Highlights | |
Direxion Daily Mid Cap Bull 3X Shares
Direxion Daily S&P 500® Bull 3X Shares
Direxion Daily S&P 500® Bear 3X Shares
Direxion Daily Small Cap Bull 3X Shares
Direxion Daily Small Cap Bear 3X Shares
Direxion Daily FTSE China Bull 3X Shares
Direxion Daily FTSE China Bear 3X Shares
Direxion Daily FTSE Europe Bull 3X Shares
Direxion Daily MSCI Emerging Markets Bull 3X Shares
Direxion Daily MSCI Emerging Markets Bear 3X Shares
Direxion Daily MSCI Mexico Bull 3X Shares
Direxion Daily MSCI South Korea Bull 3X Shares
Direxion Daily Aerospace & Defense Bull 3X Shares
Direxion Daily Financial Bull 3X Shares
Direxion Daily Financial Bear 3X Shares
Direxion Daily Healthcare Bull 3X Shares
Direxion Daily Homebuilders & Supplies Bull 3X Shares
Direxion Daily Industrials Bull 3X Shares
Direxion Daily Real Estate Bull 3X Shares (formerly Direxion Daily MSCI Real Estate Bull 3X Shares)
Direxion Daily Real Estate Bear 3X Shares (formerly Direxion Daily MSCI Real Estate Bear 3X Shares)
Direxion Daily Regional Banks Bull 3X Shares
Direxion Daily Retail Bull 3X Shares
Direxion Daily S&P Biotech Bull 3X Shares
Direxion Daily S&P Biotech Bear 3X Shares
Direxion Daily Semiconductor Bull 3X Shares
Direxion Daily Semiconductor Bear 3X Shares
Direxion Daily Technology Bull 3X Shares
Direxion Daily Technology Bear 3X Shares
Direxion Daily Transportation Bull 3X Shares
Direxion Daily Utilities Bull 3X Shares
Direxion Daily 7-10 Year Treasury Bull 3X Shares
Direxion Daily 7-10 Year Treasury Bear 3X Shares
Direxion Daily 20+ Year Treasury Bull 3X Shares
Direxion Daily 20+ Year Treasury Bear 3X Shares | | For the year ended October 31, 2022 | | For each of the two years in the period ended October 31, 2022 | | For each of the five years in the period ended October 31, 2022 | |
Direxion Daily Pharmaceutical & Medical Bull 3X Shares | | For the year ended October 31, 2022 | | For each of the two years in the period ended October 31, 2022 | | For each of the four years in the period ended October 31, 2022 and the period from November 15, 2017 (commencement of operations) through October 31, 2018 | |
Direxion Daily Consumer Discretionary Bull 3X Shares | | For the year ended October 31, 2022 | | For each of the two years in the period ended October 31, 2022 | | For each of the three years in the period ended October 31, 2022 and the period from November 29, 2018 (commencement of operations) through October 31, 2019 | |
DIREXION ANNUAL REPORT
208
Direxion Shares ETF Trust
Report of Independent Registered Public Accounting Firm
Individual fund constituting
the Direxion Shares ETF Trust | | Statement of
Operations | | Statements of
Changes in
Net Assets | | Financial Highlights | |
Direxion Daily Dow Jones Internet Bull 3X Shares
Direxion Daily Dow Jones Internet Bear 3X Shares
Direxion Daily S&P 500® High Beta Bull 3X Shares
Direxion Daily S&P 500® High Beta Bear 3X Shares | | For the year ended October 31, 2022 | | For each of the two years in the period ended October 31, 2022 | | For each of the two years ended October 31, 2022 and the period from November 7, 2019 (commencement of operations) through October 31, 2020 | |
Basis for Opinion
These financial statements are the responsibility of the Trust's management. Our responsibility is to express an opinion on each of the Funds' financial statements based on our audits. We are a public accounting firm registered with the Public Company Accounting Oversight Board (United States) ("PCAOB") and are required to be independent with respect to the Trust in accordance with the U.S. federal securities laws and the applicable rules and regulations of the Securities and Exchange Commission and the PCAOB.
We conducted our audits in accordance with the standards of the PCAOB. Those standards require that we plan and perform the audit to obtain reasonable assurance about whether the financial statements are free of material misstatement, whether due to error or fraud. The Trust is not required to have, nor were we engaged to perform, an audit of the Trust's internal control over financial reporting. As part of our audits, we are required to obtain an understanding of internal control over financial reporting but not for the purpose of expressing an opinion on the effectiveness of the Trust's internal control over financial reporting. Accordingly, we express no such opinion.
Our audits included performing procedures to assess the risks of material misstatement of the financial statements, whether due to error or fraud, and performing procedures that respond to those risks. Such procedures included examining, on a test basis, evidence regarding the amounts and disclosures in the financial statements. Our procedures included confirmation of securities owned as of October 31, 2022, by correspondence with the custodian, brokers and others; when replies were not received from brokers and others, we performed other auditing procedures. Our audits also included evaluating the accounting principles used and significant estimates made by management, as well as evaluating the overall presentation of the financial statements. We believe that our audits provide a reasonable basis for our opinion.
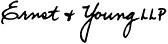
We have served as the auditor of one or more of the Direxion investment companies since 2001.
Minneapolis, Minnesota
December 22, 2022
DIREXION ANNUAL REPORT
209
Direxion Shares ETF Trust
Supplemental Information (Unaudited)
Federal Tax Status of Dividends Declared during the Tax Year
For Federal income tax purposes, dividends from short-term capital gains are classified as ordinary income. The percentage of ordinary income distribution designated as qualifying for the corporate dividend received deduction ("DRD"), the individual qualified dividend rate ("QDI"), the qualified interest income rate ("QII"), and the qualified short-term gain rate ("QSTG") is presented below.
Funds | | DRD | | QDI | | QII | | QSTG | |
Direxion Daily Mid Cap Bull 3X Shares | | | 0.00 | % | | | 0.00 | % | | | 0.00 | % | | | 0.00 | % | |
Direxion Daily S&P 500® Bull 3X Shares | | | 8.88 | % | | | 8.88 | % | | | 0.00 | % | | | 0.00 | % | |
Direxion Daily S&P 500® Bear 3X Shares | | | 0.00 | % | | | 0.00 | % | | | 0.00 | % | | | 0.00 | % | |
Direxion Daily Small Cap Bull 3X Shares | | | 100.00 | % | | | 100.00 | % | | | 0.00 | % | | | 0.00 | % | |
Direxion Daily Small Cap Bear 3X Shares | | | 0.00 | % | | | 0.00 | % | | | 0.00 | % | | | 0.00 | % | |
Direxion Daily FTSE China Bull 3X Shares | | | 100.00 | % | | | 100.00 | % | | | 0.00 | % | | | 0.00 | % | |
Direxion Daily FTSE China Bear 3X Shares | | | 0.00 | % | | | 0.00 | % | | | 0.00 | % | | | 0.00 | % | |
Direxion Daily FTSE Europe Bull 3X Shares | | | 100.00 | % | | | 100.00 | % | | | 0.00 | % | | | 0.00 | % | |
Direxion Daily MSCI Emerging Markets Bull 3X Shares | | | 0.00 | % | | | 0.00 | % | | | 0.00 | % | | | 0.00 | % | |
Direxion Daily MSCI Emerging Markets Bear 3X Shares | | | 0.00 | % | | | 0.00 | % | | | 0.00 | % | | | 0.00 | % | |
Direxion Daily MSCI Mexico Bull 3X Shares | | | 5.09 | % | | | 5.09 | % | | | 0.00 | % | | | 0.00 | % | |
Direxion Daily MSCI South Korea Bull 3X Shares | | | 100.00 | % | | | 100.00 | % | | | 0.00 | % | | | 0.00 | % | |
Direxion Daily Aerospace & Defense Bull 3X Shares | | | 11.09 | % | | | 11.09 | % | | | 0.00 | % | | | 92.42 | % | |
Direxion Daily Consumer Discretionary Bull 3X Shares | | | 0.00 | % | | | 0.00 | % | | | 0.00 | % | | | 0.00 | % | |
Direxion Daily Dow Jones Internet Bull 3X Shares | | | 0.53 | % | | | 0.53 | % | | | 0.00 | % | | | 100.00 | % | |
Direxion Daily Dow Jones Internet Bear 3X Shares | | | 0.00 | % | | | 0.00 | % | | | 0.00 | % | | | 0.00 | % | |
Direxion Daily Financial Bull 3X Shares | | | 67.16 | % | | | 67.16 | % | | | 0.00 | % | | | 31.48 | % | |
Direxion Daily Financial Bear 3X Shares | | | 0.00 | % | | | 0.00 | % | | | 0.00 | % | | | 0.00 | % | |
Direxion Daily Healthcare Bull 3X Shares | | | 5.65 | % | | | 5.65 | % | | | 0.00 | % | | | 0.00 | % | |
Direxion Daily Homebuilders & Supplies Bull 3X Shares | | | 0.00 | % | | | 0.00 | % | | | 0.00 | % | | | 0.00 | % | |
Direxion Daily Industrials Bull 3X Shares | | | 10.27 | % | | | 10.27 | % | | | 0.00 | % | | | 0.00 | % | |
Direxion Daily Pharmaceutical & Medical Bull 3X Shares | | | 100.00 | % | | | 100.00 | % | | | 0.00 | % | | | 0.00 | % | |
Direxion Daily Real Estate Bull 3X Shares | | | 15.77 | % | | | 15.77 | % | | | 0.00 | % | | | 93.33 | % | |
Direxion Daily Real Estate Bear 3X Shares | | | 0.00 | % | | | 0.00 | % | | | 0.00 | % | | | 0.00 | % | |
Direxion Daily Regional Banks Bull 3X Shares | | | 13.05 | % | | | 13.05 | % | | | 0.00 | % | | | 0.00 | % | |
Direxion Daily Retail Bull 3X Shares | | | 100.00 | % | | | 100.00 | % | | | 0.00 | % | | | 0.00 | % | |
Direxion Daily S&P 500® High Beta Bull 3X Shares | | | 0.00 | % | | | 0.00 | % | | | 0.00 | % | | | 0.00 | % | |
Direxion Daily S&P 500® High Beta Bear 3X Shares | | | 0.00 | % | | | 0.00 | % | | | 0.00 | % | | | 0.00 | % | |
Direxion Daily S&P Biotech Bull 3X Shares | | | 0.00 | % | | | 0.00 | % | | | 0.00 | % | | | 0.00 | % | |
Direxion Daily S&P Biotech Bear 3X Shares | | | 0.00 | % | | | 0.00 | % | | | 0.00 | % | | | 0.00 | % | |
Direxion Daily Semiconductor Bull 3X Shares | | | 100.00 | % | | | 100.00 | % | | | 0.00 | % | | | 0.00 | % | |
Direxion Daily Semiconductor Bear 3X Shares | | | 0.00 | % | | | 0.00 | % | | | 0.00 | % | | | 0.00 | % | |
Direxion Daily Technology Bull 3X Shares | | | 1.15 | % | | | 1.15 | % | | | 0.00 | % | | | 100.00 | % | |
Direxion Daily Technology Bear 3X Shares | | | 0.00 | % | | | 0.00 | % | | | 0.00 | % | | | 0.00 | % | |
Direxion Daily Transportation Bull 3X Shares | | | 0.00 | % | | | 0.00 | % | | | 0.00 | % | | | 0.00 | % | |
Direxion Daily Utilities Bull 3X Shares | | | 9.93 | % | | | 9.93 | % | | | 0.00 | % | | | 21.62 | % | |
Direxion Daily 7-10 Year Treasury Bull 3X Shares | | | 0.00 | % | | | 0.00 | % | | | 0.00 | % | | | 0.00 | % | |
Direxion Daily 7-10 Year Treasury Bear 3X Shares | | | 0.00 | % | | | 0.00 | % | | | 0.00 | % | | | 0.00 | % | |
Direxion Daily 20+ Year Treasury Bull 3X Shares | | | 100.00 | % | | | 100.00 | % | | | 0.00 | % | | | 0.00 | % | |
Direxion Daily 20+ Year Treasury Bear 3X Shares | | | 0.00 | % | | | 0.00 | % | | | 0.00 | % | | | 0.00 | % | |
The Funds are designating as long-term capital gain dividends, pursuant to Internal Revenue Code Section 852(b)(3), the amount necessary to reduce the earnings and profits of the Funds related to net capital gain to zero for the tax year ending October 31, 2022. To the extent necessary to fully distribute such capital gain, the Funds also designate earnings and profits distributed to shareholders on the redemption of shares.
DIREXION ANNUAL REPORT
210
Direxion Shares ETF Trust
Supplemental Information (Unaudited)
Householding
In an effort to decrease costs, the Funds intend to reduce the number of duplicate prospectuses, Annual and Semi-Annual Reports, proxy statements and other similar documents you receive by sending only one copy of each to those addresses shared by two or more accounts and to shareholders we reasonably believe are from the same family or household. Householding begins once you have signed your account application. After such time, if you would like to discontinue householding for your accounts, please call toll-free at (800) 851-0511 to request individual copies of these documents. Once the Funds receive notice to stop householding, we will begin sending individual copies thirty days after receiving your request. This policy does not apply to account statements.
DIREXION ANNUAL REPORT
211
Direxion Shares ETF Trust
Board Review of Investment Advisory Agreement (Unaudited)
Consistent with the Investment Company Act of 1940, as amended (the "1940 Act"), the Board of Trustees (the "Board") of the Direxion Shares ETF Trust (the "ETF Trust") annually considers the renewal of the Investment Advisory Agreement (the "Agreement") between Rafferty Asset Management, LLC (the "Adviser") and the ETF Trust, on behalf of the Direxion Daily Mid Cap Bull 3X Shares, Direxion Daily S&P 500® Bull 3X Shares, Direxion Daily S&P 500® Bear 3X Shares, Direxion Daily Small Cap Bull 3X Shares, Direxion Daily Small Cap Bear 3X Shares, Direxion Daily FTSE China Bull 3X Shares, Direxion Daily FTSE China Bear 3X Shares, Direxion Daily FTSE Europe Bull 3X Shares, Direxion Daily MSCI Emerging Markets Bull 3X Shares, Direxion Daily MSCI Emerging Markets Bear 3X Shares, Direxion Daily MSCI Mexico Bull 3X Shares, Direxion Daily MSCI South Korea Bull 3X Shares, Direxion Daily Aerospace & Defense Bull 3X Shares, Direxion Daily Consumer Discretionary Bull 3X Shares, Direxion Daily Dow Jones Internet Bull 3X Shares, Direxion Daily Dow Jones Internet Bear 3X Shares, Direxion Daily Financial Bull 3X Shares, Direxion Daily Financial Bear 3X Shares, Direxion Daily Healthcare Bull 3X Shares, Direxion Daily Homebuilders & Supplies Bull 3X Shares, Direxion Daily Industrials Bull 3X Shares, Direxion Daily Pharmaceutical & Medical Bull 3X Shares, Direxion Daily Real Estate Bull 3X Shares, Direxion Daily Real Estate Bear 3X Shares, Direxion Daily Regional Banks Bull 3X Shares, Direxion Daily Retail Bull 3X Shares, Direxion Daily S&P 500® High Beta Bull 3X Shares, Direxion Daily S&P 500® High Beta Bear 3X Shares, Direxion Daily S&P Biotech Bull 3X Shares, Direxion Daily S&P Biotech Bear 3X Shares, Direxion Daily Semiconductor Bull 3X Shares, Direxion Daily Semiconductor Bear 3X Shares, Direxion Daily Technology Bull 3X Shares, Direxion Daily Technology Bear 3X Shares, Direxion Daily Transportation Bull 3X Shares, Direxion Daily Utilities Bull 3X Shares, Direxion Daily 7-10 Year Treasury Bull 3X Shares, Direxion Daily 7-10 Year Treasury Bear 3X Shares, Direxion Daily 20+ Year Treasury Bull 3X Shares, and the Direxion Daily 20+ Year Treasury Bear 3X Shares, each a series of the ETF Trust. The Agreement is initially approved for a two-year period and must be renewed yearly thereafter to remain in effect. Each series of the ETF Trust is referred to herein as a "Fund" and collectively as the "Funds."
At a meeting held on August 18, 2022, the Board, including the trustees who are not "interested persons" of the ETF Trust as defined in the 1940 Act (the "Independent Trustees"), unanimously approved the renewal of the Agreement, on behalf of the Funds. The Independent Trustees had previously considered information pertaining to the renewal of the Agreement outside the presence of the Adviser's representatives and Fund management in executive sessions held on August 4, 2022 and August 18, 2022.
In considering whether to renew the Agreement, the Board requested, and the Adviser provided, information that the Board and Adviser believed to be reasonably necessary to evaluate the Agreement. Among other information, the Board obtained and reviewed the following:
• Detailed information regarding the advisory services provided by the Adviser to the Funds;
• The investment objectives of the Funds, which require daily rebalancing and the utilization of complex financial instruments that are not typical of traditional index tracking exchange-traded funds;
• The level of attention and services required by the Adviser due to the frequent and large trading activity in the Funds;
• The Adviser's Form ADV;
• Information regarding the professional qualifications of those employees primarily responsible for providing services to the Funds;
• Information regarding each component of the contractual advisory fee rates for the prior fiscal year;
• Information regarding advisory fees earned and waivers made by the Adviser in connection with providing services to the Funds for the prior fiscal year or since inception, if shorter;
• Information regarding fees paid to the Adviser under, and an evaluation of the services provided per, the Management Services Agreement for the prior fiscal year as separate and distinct from the fees paid and the services provided under the Agreement;
• Performance information;
• Comparative industry fee data, including peer group comparisons;
• Information regarding the consolidated financial condition of the Adviser and the profitability of each Fund to the Adviser; and
• Information regarding how the Adviser monitors the Funds' compliance with regulatory requirements and ETF Trust procedures.
DIREXION ANNUAL REPORT
212
Direxion Shares ETF Trust
Board Review of Investment Advisory Agreement (Unaudited)
The Board considered that, with respect to most Funds, they had also received information relevant to their annual review of the Agreement since the Fund's inception and, most recently, throughout the past year at regular Board meetings in connection with their oversight of the Funds, including information bearing on the Funds' service provider arrangements and performance results. In addition, the Board received a memorandum from counsel regarding its responsibilities with respect to the approval of the Agreement and participated in a question and answer session with representatives of the Adviser. The Board carefully evaluated the relevant information and the Independent Trustees were advised by legal counsel with respect to their deliberations.
The Board did not identify any particular information that was most relevant to its consideration to approve the Agreement and each Trustee may have afforded different weight or importance to different factors. For each Fund, the Board considered, among other matters, the following factors to the extent applicable: (1) the nature, extent, and quality of the services provided; (2) the investment performance; (3) the profitability of the Fund and the advisory business to the Adviser; (4) the extent to which economies of scale might be realized as the Fund grows and whether fee levels reflect these economies of scale, if any, for the benefit of the Fund's shareholders; (5) comparisons of services and fees with contracts entered into by the Adviser with other clients (such as institutional investors), if any; and (6) other benefits derived or anticipated to be derived by the Adviser from its relationship with the Fund.
Nature, Extent and Quality of Services Provided. The Board reviewed, among other matters, the Adviser's business, assets under management, financial resources and capitalization, quality and quantity of personnel, investment and related experience, the variety and complexity of its investment strategies, brokerage practices, the adequacy of its compliance systems and processes, and its reinvestment in each of these areas of the business. The Board reviewed the scope of services provided, and to be provided by the Adviser, under the Agreement and noted there would be no significant differences between the scope of services provided by the Adviser in the past year and those to be provided in the upcoming year. The Board also considered the Adviser's representation to the Board that it would continue to provide investment and related services that are of materially the same quality as the services that have been provided to the Funds in the past, and it considered whether those services remain appropriate in scope and extent in light of the Funds' operations, the competitive landscape of the investment company business and investor needs.
The Board focused on the quality of the Adviser's personnel and operations and the systems and processes required to manage the Funds effectively, noting that such personnel, systems and processes may not be present at other investment advisers. The Board considered, as applicable: (1) the Adviser's success in achieving each Fund's daily leveraged investment objective; (2) differences between managing leveraged and non-leveraged portfolios, which include developing index optimization and representative sampling investment strategies as well as specialized skills for trading complex financial instruments; (3) information regarding the Adviser's management of derivatives trading activities on behalf of the Funds, including the selection of swap counterparties and the negotiation of favorable derivatives contract terms; (4) the Adviser's ability to manage the Funds in a tax efficient manner, which is more challenging for leveraged than non-leveraged funds; and (5) the size, professional experience and skills of the Adviser's portfolio management staff and the Adviser's ability to recruit, train, and retain personnel with the relevant experience and expertise necessary to manage the Funds. The Board considered that the Adviser oversees all aspects of the operation of the Funds, including oversight of the Funds' service providers, and provides compliance services to the Funds.
Comparison of Advisory Services and Fees. The Board considered the fairness and reasonableness of the investment advisory fee rate payable to the Adviser by each Fund in light of the investment advisory services provided by the Adviser. In this regard, the Board also considered the ability of investors to achieve independently the investment objective of the Funds and the costs to investors of seeking to do so by utilizing a margin account or other means. In this regard, the Board reviewed information provided by the Adviser comparing the cost of ownership for shareholders to replicate the Funds' leveraged or inverse investment strategies by other means. The Board noted that an independent consultant had reviewed the cost comparison information and determined the methodology used to be comprehensive and to constitute a sound and objective approach to conducting the cost comparison analysis. The Board concluded that it would be time- and resource-intensive for an investor to implement independently any Fund's investment strategy. The Board also concluded that doing so would likely be cost-prohibitive. From this perspective, the Board noted the cost effectiveness for investors of employing the Funds to achieve their stated investment objectives.
DIREXION ANNUAL REPORT
213
Direxion Shares ETF Trust
Board Review of Investment Advisory Agreement (Unaudited)
The Board further considered the fairness and reasonableness of the investment advisory fee rate payable to the Adviser by each Fund in light of fee rates paid by other investment companies offering strategies similar in nature to the Fund. In this regard, the Board reviewed information prepared by the Adviser, using data provided by Morningstar, Inc., to compare the Funds' actual advisory fee rates, and gross and net total expenses with those of other funds with common key characteristics, such as asset size, investment objective or industry focus ("Peer Group"). The Board noted the difficulty in compiling a broad and diverse Peer Group because, by design, each Fund is unique and, therefore, few (if any) fund complexes have funds with substantially similar investment objectives and operations. They noted that an independent consultant had reviewed the Adviser's peer selection methodology and each Fund's resulting peers and determined that the methodology was reasonable and well within industry standards.
The Board noted that the comparison reports included the contractual advisory fee and net and gross total expense ratios for each Fund and each Peer Group fund. The Board considered that the Adviser had agreed to limit the total expenses of the Funds (subject to certain exclusions) for the next year by contractually agreeing to pay certain expenses of the Funds under a separate Operating Expense Limitation Agreement. Additionally, the Board considered that the Adviser had agreed to limit its Investment Advisory Fees at various net asset levels for the Funds under the Advisory Fee Waiver Agreement.
Performance of the Funds. The Board focused on the correlation of each Fund's return to the model performance return for the periods ending June 30, 2022 and June 30, 2021 or since inception if a Fund did not have two full years of operations. In this regard, the Board considered each Fund's daily returns versus model returns ("Tracking Difference"), the standard deviation of the Tracking Differences ("Tracking Error"), and a tracking analysis provided by the Adviser. The Board also reviewed the total return of each Fund for the one-year or, if shorter, since inception period ended June 30, 2022. The Board considered reports provided to it in anticipation of the meeting, as well as performance reports provided at regular Board meetings throughout the year. The Board noted that the correlation of returns for each Fund to its model performance was generally within expected ranges during the reviewed periods. The Board considered that, given the investment objectives of the Funds, the correlation of each such Fund's performance with the model performance and/or Tracking Error were more meaningful indicia of the quality of the Adviser's management than a Fund's total return.
Costs of Services Provided to the Funds and Profits Realized by the Adviser. The Board reviewed information regarding the profitability of the Adviser based on the fee rates payable under the Agreement. The Board considered the profitability of each Fund and the overall profitability of the Adviser, as reflected in the Adviser's profitability analysis, as well as information provided by the Adviser concerning the methodology used to allocate various expenses. The Board also considered significant drivers of cost for the Adviser including, but not limited to, intellectual capital, the dedication of personnel resources to daily portfolio management activities, such as creation and redemption activity and the daily rebalancing of the portfolio to maintain each Fund's daily investment objective, regulatory compliance, and entrepreneurial risk. The Board further considered a report on other investment advisers' profitability, which was compiled using publicly available information. The Board recognized that it is difficult to compare profitability among investment advisory firms because certain information is not publicly available. Further, to the extent such information is available with respect to certain advisers, the Board acknowledged that it is often affected by numerous factors, including the nature of a firm's fund shareholder base, the structure of the adviser and its tax status, the types of funds it manages, its business mix, assumptions regarding allocations and the reporting of operating profits and net income net (rather than gross) of distribution and marketing expenses.
Economies of Scale. The Board considered the current breakpoints included in the Advisory Fee Waiver Agreement, which provide for reduced advisory fee rates for each Fund when the assets of each Fund reach certain levels. The Board also considered the Adviser's explanation as to why these breakpoints appropriately reflect the Funds' economies of scale.
Other Benefits. The Board considered indirect and "fall-out" benefits that the Adviser or its affiliates may derive from their relationship to the Funds. Such benefits include the Adviser's ability to leverage its investment management personnel or infrastructure to manage other accounts. In this regard, the Board noted that the Funds pay a fee to the Adviser under the Management Services Agreement.
Conclusion. Based on, but not limited to, the above considerations, the Board, including the Independent Trustees, determined that the Agreement for the Funds was fair and reasonable in light of the nature, extent and quality of the services to be performed, the fee rates to be paid, the Adviser's expenses and such other matters as the Board considered relevant in the exercise of its business judgment. Accordingly, the Board concluded that the continuation of the Agreement was in the best interests of the shareholders of the Funds. On this basis, the Board unanimously voted in favor of the renewal of the Agreement.
DIREXION ANNUAL REPORT
214
Direxion Shares ETF Trust
Board Review of Liquidity Risk Management Program (Unaudited)
Consistent with Rule 22e-4 under the Investment Company Act of 1940, as amended (the "Liquidity Rule"), the Direxion Shares ETF Trust (the "Trust"), on behalf of each series of the Trust (the "Funds"), established a liquidity risk management program (the "Liquidity Program") to assess and manage each Fund's liquidity risk, which is the risk that a Fund is unable to meet investor redemption requests without significantly diluting the remaining investors' interests in the Fund.
At its November 18, 2022 meeting, the Board of Trustees (the "Board") of the Trust reviewed the Liquidity Program. The Board has appointed Rafferty Asset Management, LLC, the investment advisor to the Funds, as the Liquidity Program administrator. At the meeting, Rafferty Asset Management, LLC provided the Board with a written report that addressed the operation of the Funds' Liquidity Program and assessed the adequacy and effectiveness of the implementation of the Liquidity Program (the "Report"). The Report covered the period from November 1, 2021 through October 31, 2022 (the "Report Period"). The Report noted the following:
• The Liquidity Program supported each Fund's ability to meet redemption requests timely;
• The Liquidity Program supported Rafferty Asset Management, LLC's management of each Fund's liquidity, including during periods of market volatility and net redemptions;
• No material liquidity issues were identified during the report period;
• There was one material change to the Liquidity Program during the Report Period to adjust each Fund's liquidity parameters to reflect more accurately each Fund's redemption activity; and
• The Liquidity Program operated adequately during the report period.
The Report also described the Liquidity Program's liquidity classification methodology for categorizing a Fund's investment (including derivative transactions) into one of four liquidity buckets as required by the Liquidity Rule. The Report stated that the Liquidity Program is operating as intended and is effective in implementing the requirements of the Liquidity Rule.
There can be no assurance that the Liquidity Program will achieve its objectives in the future. Please refer to your Fund's prospectus for more information regarding the Fund's exposure to liquidity risk and other risks.
DIREXION ANNUAL REPORT
215
Direxion Shares ETF Trust
Trustees and Officers (Unaudited)
The business affairs of the Funds are managed by or under the direction of the Board of Trustees. Information pertaining to the Trustees and Officers of the Funds is set below. The report includes additional information about the Funds' Trustees and Officers and is available without charge, upon request by calling 1-800-851-0511.
Interested Trustee
Name, Address and
Age | | Position(s)
Held with
Fund | | Term of Office
and Length of
Time Served | | Principal Occupation(s)
During Past Five Years | | # of Portfolios
in Direxion
Family of
Investment
Companies
Overseen
by Trustee(3) | | Other Trusteeships/
Directorships Held by
Trustee During Past
Five Years | |
Daniel D. O'Neill(1)
Age: 54 | |
Chairman of the Board of Trustees | |
Lifetime of Trust until removal or resignation; Since 2008 | |
Chief Executive Officer, Rafferty Asset Management, LLC, from 2021 – September 2022; Managing Director, Rafferty Asset Management, LLC, January 1999 – January 2019. | | |
144 | | |
None. | |
Angela Brickl(2)
Age: 46 | |
Trustee | |
Lifetime of Trust until removal or resignation; Since 2022 | |
President, Rafferty Asset Management, LLC, from September 2022; Chief Operating Officer, Rafferty Asset Management, LLC, May 2021 – September 2022; General Counsel, Rafferty Asset Management LLC, since October 2010; Chief Compliance Officer, Rafferty Asset Management, LLC, since September 2012. | | |
144 | | |
None. | |
Independent Trustees
Name, Address and
Age | | Position(s)
Held with
Fund | | Term of Office
and Length of
Time Served | | Principal Occupation(s)
During Past Five Years | | # of Portfolios
in Direxion
Family of
Investment
Companies
Overseen
by Trustee(2) | | Other Trusteeships/
Directorships Held by
Trustee During Past
Five Years | |
David L. Driscoll
Age: 53 | |
Trustee | |
Lifetime of Trust until removal or resignation; Since 2014 | |
Partner, King Associates, LLP, since 2004; Board Advisor, University Common Real Estate, since 2012; Principal, Grey Oaks LLP since 2003; Member, Kendrick LLC, since 2006. | | |
144 | | |
None. | |
(1) Mr. O'Neill is affiliated with Rafferty and Direxion. Mr. O'Neill owns a beneficial interest in Rafferty.
(2) Ms. Brickl is affiliated with Rafferty because she serves as an officer of Rafferty.
(3) The Direxion Family of Investment Companies consists of the Direxion Shares ETF Trust which, as of the date of this report, offers for sale to the public 87 of the 134 funds registered with the SEC and the Direxion Funds which, as of the date of this report, offers for sale to the public 10 funds registered with the SEC.
DIREXION ANNUAL REPORT
216
Direxion Shares ETF Trust
Trustees and Officers (Unaudited)
Name, Address and
Age | | Position(s)
Held with
Fund | | Term of Office
and Length of
Time Served | | Principal Occupation(s)
During Past Five Years | | # of Portfolios
in Direxion
Family of
Investment
Companies
Overseen
by Trustee(2) | | Other Trusteeships/
Directorships Held by
Trustee During Past
Five Years | |
Jacob C. Gaffey
Age: 74 | |
Trustee | |
Lifetime of Trust until removal or resignation; Since 2014 | |
Managing Director of Loomis & Co. since 2012; Partner, Bay Capital Advisors, LLC 2008 – 2012. | |
144 | |
None. | |
Henry W. Mulholland
Age: 59 | |
Trustee | |
Lifetime of Trust until removal or resignation; Since 2017 | |
Grove Hill Partners LLC, since 2016 as Managing Partner; Bank of America Merrill Lynch, 1990 – 2015, most recently as Managing Director and Head of Equities for Americas. | |
144 | |
None. | |
Kathleen M. Berkery
Age: 55 | |
Trustee | |
Lifetime of Trust until removal or resignation; Since 2019 | |
Chief Financial Officer, Student Sponsor Partners, since November 2021; Senior Manager – Trusts & Estates, Rynkar, Vail & Barrett, LLC, since 2018; Financial Advisor, Lee, Nolan & Koroghlian Life Planning Group, 2010 – 2017. | |
144 | |
None. | |
Carlyle Peake
Age: 51 | |
Trustee | |
Lifetime of Trust until removal or resignation; Since 2022 | |
Head of US & LATAM Debt Syndicate, BBVA Securities, Inc., since 2011. | |
144 | |
None. | |
Mary Jo Collins
Age: 66 | |
Trustee | |
Lifetime of Trust until removal or resignation; Since 2022 | |
Managing Director, Imperial Capital LLC, since 2020; Director, Royal Bank of Canada, 2014 – 2020. | |
144 | |
None. | |
(2) Ms. Brickl is affiliated with Rafferty because she serves as an officer of Rafferty.
DIREXION ANNUAL REPORT
217
Direxion Shares ETF Trust
Trustees and Officers (Unaudited)
The officers of the Trust conduct and supervise its daily business. Unless otherwise noted, an individual's business address is 1301 Avenue of the Americas, 28th Floor, New York, New York 10019. As of the date of this report, the officers of the Trust, their ages, their business address and their principal occupations during the past five years are as follows:
Principal Officers of the Trust
Name, Address and
Age | | Position(s)
Held with
Fund | | Term of Office
and Length of
Time Served | | Principal Occupation(s)
During Past Five Years | | # of Portfolios
in Direxion
Family of
Investment
Companies
Overseen
by Trustee(2) | | Other Trusteeships/
Directorships Held by
Trustee During Past
Five Years | |
Angela Brickl
Age: 46 | |
President
Chief Compliance Officer | |
One Year; Since 2022
One Year; Since 2018 | |
President, Rafferty Asset Management, LLC, from September 2022; Chief Operating Officer, Rafferty Asset Management, LLC, May 2021 – September 2022; General Counsel, Rafferty Asset Management LLC, since October 2010; Chief Compliance Officer, Rafferty Asset Management, LLC, since September 2012. | |
N/A | |
N/A | |
Patrick J. Rudnick
Age: 49 | |
Principal Executive Officer | |
One Year; Since 2018 | |
Senior Vice President, since March 2013, Rafferty Asset Management, LLC; Senior Vice President, since November 2017, Direxion Advisors, LLC. | |
N/A | |
N/A | |
Corey Noltner
Age: 33 | |
Principal Financial Officer | |
One Year; Since 2021 | |
Senior Business Analyst, Rafferty Asset Management, LLC, since October 2015. | |
N/A | |
N/A | |
Alyssa Sherman
Age: 33 | |
Secretary | |
One Year; Since 2022 | |
Associate General Counsel, Rafferty Asset Management, LLC, since April 2021; Associate, K&L Gates LLP, September 2015 – March 2021. | |
N/A | |
N/A | |
(1) Ms. Brickl serves on the Board of Trustees of the Direxion Funds and Direxion Shares ETF Trust.
(2) The Direxion Family of Investment Companies consists of the Direxion Shares ETF Trust which, as of the date of this SAI, offers for sale to the public 87 of the 134 funds registered with the SEC and the Direxion Funds which, as of the date of this SAI, offers for sale to the public 10 funds registered with the SEC.
DIREXION ANNUAL REPORT
218

ANNUAL REPORT OCTOBER 31, 2021
1301 Avenue of the Americas (6th Ave.), 28th Floor New York, New York 10019 (800) 851-0511 www.direxioninvestments.com
Investment Advisers
Rafferty Asset Management, LLC
Direxion Advisors, LLC
1301 Avenue of the Americas (6th Ave.), 28th Floor
New York, NY 10019
Administrator
U.S. Bancorp Fund Services, LLC
P.O. Box 1993
Milwaukee, WI 53201-1993
Transfer Agent, Custodian & Index Receipt Agent
The Bank of New York Mellon
101 Barclay Street
New York, New York 10286
Independent Registered Public Accounting Firm
Ernst & Young LLP
700 Nicollet Mall, Suite 500
Minneapolis, MN 55402
Distributor
Foreside Fund Services, LLC
Three Canal Plaza, Suite 100
Portland, Maine 01401
www.foreside.com
The Trust's Proxy Voting Policies are available without charge by calling 1-800-851-0511, or by accessing the SEC's website, at www.sec.gov.
The actual voting records relating to portfolio securities during the most recent period ended June 30 (starting with the year ended June 30, 2005) is available without charge by calling 1-800-851-0511 or by accessing the SEC's website at www.sec.gov.
Each Fund's premium/discount information is available free of charge on the Funds' websites or by calling (800) 851-8511 or (833) 547-4417.
The Trust files complete schedule of portfolio holdings with the SEC for its first and third fiscal quarters on Part F of Form N-PORT. The Funds' Part F of Form N-PORT (and Form N-Q prior to April 30, 2019) is available on the SEC's website at www.sec.gov.
This report has been prepared for shareholders and may be distributed to others only if preceded or accompanied by a current prospectus.
THIS PAGE INTENTIONALLY LEFT BLANK
220
THIS PAGE INTENTIONALLY LEFT BLANK
221
THIS PAGE INTENTIONALLY LEFT BLANK
222
At the Direxion Funds, we are committed to protecting your privacy. To open and service your Direxion accounts, we collect and maintain certain nonpublic personal information about you, such as your address, phone number, social security number, purchases, sales, account balances, bank account information and other personal financial information. We collect this information from the following sources:
• Account applications or other forms on which you provide information,
• Mail, e-mail, the telephone and our website, and
• Your transactions and account inquiries with us.
We safeguard the personal information that you have entrusted to us in the following ways:
• As a general policy, only those employees who maintain your account and respond to your requests for additional services have access to your account information.
• We maintain physical, electronic, and procedural safeguards to insure the security of your personal information and to prevent unauthorized access to your information.
We do not disclose any nonpublic personal information about you or our former shareholders to anyone, except as permitted or required by law. In the course of conducting business and maintaining your account we may share shareholder information, as allowed by law, with our affiliated companies and with other service providers, including financial intermediaries, custodians, transfer agents and marketing consultants. Those companies are contractually bound to use that information only for the services for which we hired them. They are not permitted to use or share our shareholders' nonpublic personal information for any other purpose. There also may be times when we provide information to federal, state or local authorities as required by law.
In the event that you hold fund shares of Direxion through a financial intermediary, including, but not limited to, a broker-dealer, bank, or trust company, the privacy policy of your financial intermediary would govern how your nonpublic personal information would be shared with nonaffiliated third parties.
For questions about our policy, please contact us at (800) 851-0511.
This page is not a part of the Annual Report.
DIREXION ANNUAL REPORT


DIREXION SHARES ETF TRUST
ANNUAL REPORT OCTOBER 31, 2022
1301 Avenue of the Americas (6th Ave.), 28th Floor New York, New York 10019 www.direxioninvestments.com
Direxion Auspice Broad Commodity Strategy ETF (Consolidated)
Direxion Breakfast Commodities Strategy ETF (Consolidated)
Direxion Hydrogen ETF
Direxion Moonshot Innovators ETF
Direxion mRNA ETF
Direxion Nanotechnology ETF
Direxion NASDAQ-100® Equal Weighted Index Shares
Direxion Work From Home ETF
You can find a Fund's prospectus, reports to shareholders, and other information about the Fund online at http://www.direxioninvestments.com/regulatory-documents. You can also get this information at no cost by calling (800) 851-0511 or by sending an email request to info@direxionfunds.com.
| Letter to Shareholders (Unaudited) | | | 4 | | |
| Performance Summary (Unaudited) | | | 10 | | |
| Expense Example (Unaudited) | | | 18 | | |
| Allocation of Portfolio Holdings (Unaudited) | | | 20 | | |
| Schedules of Investments | | | 21 | | |
| Statements of Assets and Liabilities | | | 30 | | |
| Statements of Operations | | | 32 | | |
| Statements of Changes in Net Assets | | | 34 | | |
| Financial Highlights | | | 38 | | |
| Notes to the Financial Statements | | | 39 | | |
Report of Independent Registered Public
Accounting Firm | | | 51 | | |
| Supplemental Information (Unaudited) | | | 53 | | |
Board Review of Investment Advisory
Agreement (Unaudited) | | | 54 | | |
Board Review of Liquidity Risk
Management Program (Unaudited) | | | 59 | | |
| Trustees and Officers (Unaudited) | | | 60 | | |
Help Preserve the Environment – Go Green!
Go paperless with Direxion e-Delivery – a service allowing shareholders to reduce clutter with full online access to regulatory documents. Begin the preservation process with e-delivery.
With Direxion e-Delivery, you can:
• Receive email notifications when your most recent shareholder communications are available for review.
• Access prospectuses, annual reports and semi-annual reports online.
It's easy to enroll:
1. Visit www.direxioninvestments.com/edelivery
2. Follow the simple enrollment instructions
If you have questions about Direxion e-Delivery services, contact one of our shareholder representatives at 800-851-0511.


Letter to Shareholders (Unaudited)
Dear Shareholders,
This Annual Report for the Direxion Shares exchange traded funds (the "ETFs") covers the period from November 1, 2021 to October 31, 2022 (the "Annual Period").
Market Review:
Signs of broad-based inflation began in the fall of 2021, leading to a shaky global equity market environment. At the time, most experts predicted inflation levels were transitory, quelling investor concerns temporarily. Equity markets began to pick up through December, ending the year on a high. However, it soon became clear the widespread inflation was not going anywhere and the Federal Reserve announced an acceleration of monetary policy that was implemented through a series of interest rate hikes to combat inflation. Simultaneously, the highly contagious Covid-19 Omicron variant spread across the world and, despite high vaccination rates, breakthrough infections were at an all-time high. However, by the end of the Annual Period, Covid was far less of a concern for investors. Just as markets were looking up again, with the S&P 500 posting its first monthly gain in March 2022, Russia invaded Ukraine, and the effects of the invasion rippled across equity markets, as energy prices surged and fears of wider-spread conflict grew. In response, the United States and other western nations imposed extreme economic sanctions on Russia. Markets were very volatile on the heels of the Russian invasion, and the first two quarters of 2022 saw a shrinking U.S. GDP. June earnings reports were surprisingly strong, despite a mid-month S&P low. Despite these numbers, July was a strong month, but this positive sentiment did not last long. A hawkish speech from Federal Reserve Chair, Jerome Powell, in August negatively impacted markets around the world. September was another rough month for equities, with both the S&P 500 and NASDAQ dropping roughly 10%. Global markets fared no better, as the UK entered a recession, and China faced mass protests and unrest. October saw a modest increase in stocks as the Federal Reserve indicated it will pull back on its aggressive tightening in the near future after positive third quarter readings, but overall sentiment was still generally low. Investors are pivoting towards more risk-off investments in an attempt to navigate historic inflation levels, geopolitical conflict and high interest rates, although traditional safe haven investments, such as commodities, are less appealing than they have been in the past.
The U.S. bond market was in consistent decline for the majority of the Annual Period, oftentimes diverging from trends in the equities markets. In the fall, treasuries and international bonds were experiencing the worst performance of the Annual Period, as concerns over rising interest rates and inflation began. As inflation worsened and proved to be less transitory than initially predicted, central banks around the world pivoted towards more hawkish policies. In December, the Federal Reserve announced there would be three or four rate hikes throughout 2022, as well as a tapering of U.S. treasury asset purchases. In late February, the Russian invasion of Ukraine rippled through the global financial system, including fixed income markets. The U.S. Treasury yield curve started to flatten as the 10 – 20 year bond spread grew and became inverted. While bonds have typically been considered a way to hedge a portfolio against equities, this strategy has not typically held true in the current market environment. After the positive indication that the Federal Reserve is starting to get a handle on inflation, the global bond market saw a slight rebound, but the yield curve remained inverted at the end of the Annual Period, which remains a concern for many investors.
Factors Affecting the ETFs Performance:
Benchmark Performance – The performance of each ETF's benchmark index, and the factors and market conditions implicitly affecting that index, are the primary factors driving ETF performance. The market conditions that affected the benchmark indexes during the past year are described in the Market Review section above.
Fees, Expenses, and Transaction Costs – Fees and expenses are listed in each ETF's prospectus and may be higher than many traditional index funds' fees, which cause a greater negative impact on ETF performance. Transaction costs are not included in the expense ratio of the ETFs.
DIREXION ANNUAL REPORT
4
The ETFs Performance Review:
The following discussion relates to the performance of the ETFs for the Annual Period. The performance of the ETFs for the Annual Period is important primarily for understanding whether the ETFs meet their investment goals. All ETF returns are NAV (net asset value) returns.
Non-Leveraged ETFs
The Direxion Auspice Broad Commodity Strategy ETF seeks investment results, before fees and expenses, that track the Auspice Broad Commodity Index over a complete market cycle. The Auspice Broad Commodity Index seeks to capture the majority of the commodity upside returns, while seeking to mitigate downside risk. The Auspice Broad Commodity Index will use a quantitative methodology to track either long or flat positions in a diversified portfolio of 12 different commodity futures contracts, or "components", which cover the energy, metal, and agricultural sectors. It attempts to incorporate dynamic risk management and contract rolling methods. For the Annual Period, the Auspice Broad Commodity Index returned 6.21%, while the Direxion Auspice Broad Commodity Strategy ETF returned 6.09%.
Until the last few months of the Annual Period, commodities had rallied in an otherwise bear market, primarily due to inflation. In particular, the energy and agriculture holdings of the Direxion Auspice Broad Commodity Strategy ETF performed well. Heating oil futures were up 58.69% and natural gas futures were up 55.64% over the Annual Period. The performance for metals was less positive, with silver down 20.59%, gold down 8.47%, and copper down 21.33%. The Direxion Auspice Broad Commodity Strategy ETF had relatively strong performance despite overall market volatility, largely due to the favorable commodity environment in the beginning-to-middle of 2022.
The Direxion Breakfast Commodities Strategy ETF seeks investment results, before fees and expenses, that track the S&P GSCI Dynamic Roll Breakfast (OJ 5% Capped) Index. The S&P GSCI Dynamic Roll Breakfast (OJ 5% Capped) Index measures the performance of tradeable commodities considered to be breakfast foods (corn, coffee, lean hogs, sugar, Chicago wheat and orange juice) by investing in monthly futures contracts for such commodities. The Index is world production weighted and designed to reflect the relative significance of each of the commodities to the world economy, except for orange juice which is capped at 5%. The Index is rebalanced annually and employs a flexible monthly futures rolling strategy. Since the Fund's inception on June 1, 2022, the S&P GSCI Dynamic Roll Breakfast (OJ 5% Capped) Index returned -9.04%, while the Direxion Breakfast Commodities Strategy ETF returned -8.19%.
The Direxion Breakfast Commodities Strategy ETF opened during the commodity rally. Soon after, the commodity market began to fall as many headwinds hit the space, including the Russia-Ukraine conflict, widespread droughts and labor shortages, just to name a few. Lean Hogs, Corn, Orange Juice and Sugar have had positive returns since the fund's inception, while Coffee and Wheat have fallen.
The Direxion Hydrogen ETF seeks investment results, before fees and expenses, that track the Indxx Hydrogen Economy Index. The Indxx Hydrogen Economy Index tracks the performance of companies that provide goods and/or services related to the Hydrogen Industry, including hydrogen generation and storage, fuel cells, hydrogen stations, and hydrogen-based vehicles. The Index includes domestic securities as well as securities listed on various foreign markets, including among others, Japan and South Korea. The Index is reconstituted annually and rebalanced quarterly. For the Annual Period, the Indxx Hydrogen Economy Index returned -45.79%, while the Direxion Hydrogen ETF returned -45.57%.
Kaori Heat Treatment was the top performer, while ITM Power Plc brought up the rear for the Direxion Hydrogen ETF. Two of the biggest names in the hydrogen industry, Plug Power (PLUG) and Bloom Energy (BE), experienced significant losses during the Annual Period. However, hydrogen is gaining momentum as an important source for the global energy transition, especially after the passage of the Inflation Reduction Act, which includes provisions for hydrogen tax credits.
The Direxion Moonshot Innovators ETF seeks investment results, before fees and expenses, that track the S&P Kensho Moonshots Index. The S&P Kensho Moonshots Index is comprised of 50 U.S. companies that pursue innovative technologies that have the potential to disrupt existing technologies and/or industries (i.e., moonshot innovators) and are considered to
DIREXION ANNUAL REPORT
5
have the highest "early-stage composite innovation scores" which is determined based off a natural language processing review of the constituent company's latest annual regulatory filing for the use of words and phrases that are related to innovation. The Index is modified equal-weighted, reconstituted annually, and rebalanced semi-annually. For the Annual Period, the S&P Kensho Moonshots Index returned -60.92%, while the Direxion Moonshot Innovators ETF returned -60.64%.
Some more well-known names, such as Yelp and Roblox, experienced losses during the Annual Period. Adeia Inc. and Innoviz Technologies were the top performers for the Direxion Moonshot Innovators ETF this Annual Period. Overall, tech names have had difficulties recently, and IT companies make up roughly 50% of the portfolio.
The Direxion mRNA ETF seeks investment results, before fees and expenses, that track the BITA Messenger RNA Technology Index. The BITA Messenger RNA Technology Index provides exposure to the performance of companies, publicly listed in the United States, Canada and Europe, that are leading the development and application of messenger RNA ("mRNA") technology. mRNA is a single-stranded ribonucleic acid ("RNA") molecule that is complementary to one of the DNA strands of a gene. mRNA plays a vital role in protein synthesis in the human body, and mRNA technologies leverage this vital role to enable targeted cells to produce proteins that enable the body to fight or prevent a given disease. As an example, mRNA technology is the basis for certain COVID-19 vaccines. Eligible companies must meet certain conditions as specified by the Index Provider as well as market capitalization and liquidity requirements. Index constituents are weighted based on a modified free float market capitalization and reconstituted and rebalanced quarterly. Since the Fund's inception on December 9, 2021, the BITA Messenger RNA Technology Index returned -43.11%, while the Direxion mRNA ETF returned -43.20%.
The top performer for the Direxion mRNA ETF during the Annual Period was Vertex Pharmaceuticals (VRTX), which returned 68.28% and has a portfolio weight of 7.37%, which is one of the highest weighted stocks in the Direxion mRNA ETF. Well-known bio tech companies Moderna (MRNA) and Bio N Tech (BNTX) experienced similar losses of -55.4% and -49.1%, respectively. Curevac (CVAC) was the worst performer, losing -82.71% this Annual Period, with a weight of 4.01%.
The Direxion Nanotechnology ETF seeks investment results, before fees and expenses, that track the S&P Kensho Extended Nanotechnology Index. The S&P Kensho Extended Nanotechnology Index, a subsector index within the S&P Kensho New Economy Index Series, is designed to measure the performance of U.S. listed securities, including depositary receipts, of companies involved in the nanotechnology industry. The Index Provider defines nanotechnology as the creation and/or manipulation of matter at the molecular (or smaller) level. The Index includes companies that produce nanomaterials or provide systems, products and services that allow for construction, measurement, simulation or manipulation of nanomaterials. Since the Fund's inception on November 23, 2021, the S&P Kensho Extended Nanotechnology Index returned -35.25%, while the Direxion Nanotechnology ETF returned -35.44%.
Liquidia Corp (LQDA), Cabot Corp (CBT), and Alnylam Pharmaceuticals (ALNY) were the top performers for the Direxion Nanotechnology ETF this Annual period. However, many other names in the healthcare sector, which makes up nearly 70% of the Direxion Nanotechnology ETF, did not fare as well. Well-known Moderna (MRNA) returned -55.41% and Bio N Tech (BNTX) returned -49.15% during the period, each with a portfolio weight of roughly 3%. Bruker Corp. (BRKR) is the top holding, making up 11.47% of the portfolio, and lost -23.64% this period.
The Direxion NASDAQ-100® Equal Weighted Index Shares seeks investment results, before fees and expenses, that track the NASDAQ-100® Equal Weighted Index. The NASDAQ-100® Equal Weighted Index is the equal weighted version of the NASDAQ-100 Index® which includes approximately 100 of the largest domestic and international non-financial companies listed on the NASDAQ® Stock Market based on market capitalization selected by NASDAQ, Inc., the index provider. Equal weighting is a method of weighting index stocks whereby the same exposure is provided to both the smallest and largest companies included in the Index. The Index is rebalanced quarterly and reconstituted annually. For the Annual Period, the NASDAQ-100® Equal Weighted Index returned -23.58%, while the Direxion NASDAQ-100® Equal Weighted Index Shares returned -23.78%.
The top performers for the Direxion NASDAQ-100® Equal Weighted Index Shares during this period were largely biotech name,s including Amgen (AMGN) and Vertex Pharmaceuticals (VRTX) returning 33.15% and 68.28%, respectively. The IT sector had a rough year, with names like Netflix, Docusign, and Meta losing -60% to -70% each.
DIREXION ANNUAL REPORT
6
The Direxion Work From Home ETF seeks investment results, before fees and expenses, that track the Solactive Remote Work Index. The Solactive Remote Work Index is comprised of U.S. listed securities and ADRs of companies that provide products and services in at least one of the following business segments that facilitate the ability of people to work from home: remote communications, cyber security, online project and document management, and cloud computing technologies ("WFH Industries"). The Index consists of 40 companies, namely, the top 10 ranked companies in each of the four WFH Industries. The Index is equal weighted at each semi-annual reconstitution and rebalance date. For the Annual Period, the Solactive Remote Work Index returned -42.95%, while the Direxion Work From Home ETF returned -43.00%.
IBM was the top performer for the Direxion Work From Home ETF during the Annual Period, returning 20.60%. Names such as Agora and RingCentral were among bottom performers, falling -88.27% and -85.93%, respectively. Names in the IT sector make up 86.99% of the Direxion Work From Home ETF, and tech generally had a rough year.
Index Volatility:
The Annual Period was extremely volatile, leaving investors without a clear strategy, and no clear sector winner. Typically defensive stocks were not immune to the volatility, and the market cycles were moving unpredictably. The VIX Index, a measure of volatility and market sentiment, averaged 25.20 during the Annual Period, with a high of 36.45 in early March 2022, whereas the average for the previous five years was 20.94.
Index | | Return | | Volatility | |
Auspice Broad Commodity Index | | | 6.09 | % | | | 12.14 | % | |
S&P GSCI Dynamic Roll Breakfast (OJ 5% Capped) Index1 | | | -9.04 | % | | | 20.23 | % | |
Indxx Hydrogen Economy Index | | | -45.79 | % | | | 34.81 | % | |
S&P Kensho Moonshots Index | | | -60.92 | % | | | 55.61 | % | |
BITA Messenger RNA Technology Index2 | | | -43.11 | % | | | 47.45 | % | |
S&P Kensho Extended Nanotechnology Index3 | | | -35.25 | % | | | 47.33 | % | |
NASDAQ-100® Equal Weighted Index | | | -23.58 | % | | | 29.06 | % | |
Solactive Remote Work Index | | | -42.95 | % | | | 36.66 | % | |
1 June 1, 2022 through October 31, 2022
2 December 9, 2021 through October 31, 2022
3 November 23, 2021 through October 31, 2022
As always, we thank you for using the Direxion Shares ETFs and we look forward to our mutual success.
Best Regards,

| | 
| |
Patrick Rudnick | | Corey Noltner | |
Principal Executive Officer | | Principal Financial Officer | |
An investor should carefully consider a Fund's investment objective, risks, charges, and expenses before investing. A Fund's prospectus and summary prospectus contain this and other information about the Direxion Shares. To obtain a Fund's prospectus and summary prospectus call 866-476-7523 or visit our website at direxion.com. A Fund's prospectus and summary prospectus should be read carefully before investing.
The performance data quoted represents past performance. Past performance does not guarantee future results. The investment return and principal value of an investment will fluctuate. An investor's shares, when redeemed,
DIREXION ANNUAL REPORT
7
may be worth more or less than their original cost. Current performance may be lower or higher than the performance quoted. Returns for performance under one year are cumulative, not annualized. For the most recent month-end performance please visit the Fund's website at direxion.com.
Short-term performance, in particular, is not a good indication of the Fund's future performance, and an investment should not be made based solely on returns. Because of ongoing market volatility, Fund performance may be subject to substantial short-term changes. For additional information, see the Fund's prospectus.
Shares of the Direxion Shares are bought and sold at market price (not NAV) and are not individually redeemed from a Fund. Market Price returns are based upon the midpoint of the bid/ask spread at 4:00 pm EST (when NAV is normally calculated) and do not represent the returns you would receive if you traded shares at other times. Brokerage commissions will reduce returns. Fund returns assume that dividends and capital gains distributions have been reinvested in the Fund at NAV.
SOFR (Secured Overnight Financing Rate) is a broad measure of the cost of borrowing cash overnight collateralized by Treasury securities. Futures Contract: an agreement traded on an organized exchange to buy or sell assets, especially commodities or shares, at a fixed price but to be delivered and paid for later.
Direxion Auspice Broad Commodity Strategy ETF and Direxion Breakfast Commodities Strategy ETF – Commodities and futures generally are volatile and are not suitable for all investors. The value of a commodity-linked derivative investment typically is based upon the price movements of a physical commodity and may be affected by changes in overall market movements, volatility of the underlying index, changes in interest rates, or factors affecting a particular industry or commodity, such as drought, floods, weather, embargoes, tariffs and international economic, political and regulatory developments. Commodity linked derivatives also may be subject to credit and interest rate risks that in general affect the values of debt securities. A Fund's investments in derivatives may pose risks in addition to, and greater than, those associated with directly investing in securities or other investments, including risk related to leverage, imperfect correlations with underlying investments or a Fund's other portfolio holdings, higher price volatility, lack of availability, counterparty risk, liquidity, valuation and legal restrictions. The use of derivatives is a highly specialized activity that involves investment techniques and risks different from those associated with ordinary portfolio securities transactions. Futures contracts are typically exchange traded contracts that call for the future delivery of an asset at a certain price and date, or cash settlement of the terms of the contract. Futures markets are highly volatile and the use of futures may increase the volatility of a Fund. There may be an imperfect correlation between the changes in market value of the securities held by a Fund and the prices of futures contracts. There may not be a liquid secondary market for the futures contracts.
Under amended regulations promulgated by the U.S. Commodities Futures Trading Commission ("CFTC"), a Fund and its Subsidiary are considered commodity pools, and therefore each is subject to regulation under the Commodity Exchange Act and CFTC rules. The Adviser is registered as a commodity pool operator ("CPO") and will manage the Funds and Subsidiaries in accordance with CFTC rules, as well as the rules that apply to registered investment companies, which includes registering both each Fund and its Subsidiary as commodity pools. Registration as a commodity pool subjects the registrant to additional laws, regulations and enforcement policies, all of which may potentially increase compliance costs and may affect the operations and financial performance of each Fund or its Subsidiary. Additionally, a Subsidiary's positions in futures contracts may have to be liquidated at disadvantageous times or prices to prevent a Fund from exceeding any applicable position limits established by the CFTC. Such actions may subject the Fund to substantial losses.
Direxion Shares ETF Risks – An investment in the ETFs involves risk, including the possible loss of principal. The ETFs are subject to certain risks, including imperfect index correlation and market price variance, that may decrease performance. As non-diversified funds, the ETFs may invest in a relatively small number of issuers and, as a result, be subject to greater risk of loss with respect to its portfolio securities. An ETF may concentrate its investments in certain industries or sectors, which can increase volatility. The ETFs may experience greater fluctuation in its net asset value as compared to other investments. These ETFs may be appropriate for investors
DIREXION ANNUAL REPORT
8
with a long-term investment time horizon, who primarily seek capital growth, and who are able to tolerate periods of prolonged price declines. Please read each ETF's prospectus for a more complete description of the investment risks. There is no guarantee that an ETF will achieve its investment objective. The views of this letter were those of the Adviser as of October 31, 2022 and may not necessarily reflect its views on the date this letter is first published or anytime thereafter. These views are intended to help shareholders in understanding the ETFs' present investment methodology and do not constitute investment advice.
Distributed by: Foreside Fund Services, LLC
DIREXION ANNUAL REPORT
9
Direxion Auspice Broad Commodity Strategy ETF (Consolidated)
Performance Summary (Unaudited)
March 30, 20171 - October 31, 2022

| | | Average Annual Total Return2 | |
| | | 1 Year | | 3 Year | | 5 Year | | Since Inception | |
Direxion Auspice Broad Commodity Strategy ETF (Consolidated)
(NAV) | | | 6.21 | % | | | 14.01 | % | | | 8.63 | % | | | 6.75 | % | |
Direxion Auspice Broad Commodity Strategy ETF (Consolidated)
(Market Price) | | | 5.86 | % | | | 13.97 | % | | | 8.57 | % | | | 6.72 | % | |
Auspice Broad Commodity Index | | | 6.09 | % | | | 14.09 | % | | | 7.81 | % | | | 5.78 | % | |
The performance data quoted represents past performance; past performance does not guarantee future results; the investment return and principal value of an investment will fluctuate; an investor's shares, when redeemed, may be worth more or less than their original cost; current performance may be lower or higher than the performance quoted. As stated in the current prospectus, the Fund's total annual fund operating expense ratio is 0.70%. Rafferty Asset Management, LLC has contractually agreed to pay all expenses of the Fund other than the following: management fees, Rule 12b-1 distribution fees and/or service fees, taxes, swap financing and related costs, dividends or interest on short positions, other interest expenses, brokerage commissions, expenses incurred in connection with any merger or reorganization, acquired fund fees and expenses, and extraordinary expenses. The performance table and graph do not reflect the deduction of taxes that a shareholder would pay on Fund distributions or the redemption of Fund shares. For the Fund's most recent month end performance please visit www.direxion.com.
This chart illustrates the performance of a hypothetical $10,000 investment made on the Fund's inception and is not intended to imply any future performance. Shares of Direxion Shares are bought and sold at market price (not NAV) and are not individually redeemed from the Fund. Performance reflects reinvestment of all dividend and capital gains distributions.
The Auspice Broad Commodity Index is a tactical long strategy that focuses on Momentum and Term Structure to track either long or flat positions in a diversified portfolio of commodity futures which cover the energy, metal, and agricultural sectors. The index incorporates dynamic risk management and contract rolling methods. The index is available in total return (collateralized) and excess return (non-collateralized) versions. Investors cannot invest directly in an index, although they can invest in its underlying securities.
Market Exposure
The Fund seeks daily exposure of 100% of its NAV through derivatives. "Market Exposure" includes the value of total investments (including the contract value of any derivatives) and excludes any short-term investments and cash equivalents, if any, divided by Net Assets.
1 Commencement of operations.
2 As of October 31, 2022.
DIREXION ANNUAL REPORT
10
Direxion Breakfast Commodities Strategy ETF (Consolidated)
Performance Summary (Unaudited)
June 1, 20221 - October 31, 2022

| | Total Return2 | |
| | Since Inception | |
Direxion Breakfast Commodities Strategy ETF (Consolidated) (NAV) | | | -8.19 | % | |
Direxion Breakfast Commodities Strategy ETF (Consolidated) (Market Price) | | | -8.23 | % | |
S&P GSCI Dynamic Roll Breakfast (OJ 5% Capped) Index | | | -9.04 | % | |
The performance data quoted represents past performance; past performance does not guarantee future results; the investment return and principal value of an investment will fluctuate; an investor's shares, when redeemed, may be worth more or less than their original cost; current performance may be lower or higher than the performance quoted. As stated in the current prospectus, the Fund's total annual fund operating expense ratio is 0.70%. Rafferty Asset Management, LLC has contractually agreed to pay all expenses of the Fund other than following: management fees, Rule 12b-1 distribution fees and/or service fees, taxes, swap financing and related costs, dividends or interest on short positions, other interest expenses, brokerage commissions, expenses incurred in connection with any merger or reorganization, acquired fund fees and expenses, and extraordinary expenses. The performance table and graph do not reflect the deduction of taxes that a shareholder would pay on Fund distributions or the redemption of Fund shares. For the Fund's most recent month end performance please visit www.direxion.com.
This chart illustrates the performance of a hypothetical $10,000 investment made on the Fund's inception and is not intended to imply any future performance. Shares of Direxion Shares are bought and sold at market price (not NAV) and are not individually redeemed from the Fund. Performance reflects reinvestment of all dividend and capital gains distributions.
The S&P GSCI Dynamic Roll Breakfast (OJ 5% Capped) Index measures the performance of tradeable commodities considered to be breakfast foods (corn, coffee, lean hogs, sugar, Chicago wheat and orange juice) by investing in monthly futures contracts for such commodities. The Index is world production weighted and designed to reflect the relative significance of each of the commodities to the world economy, except for orange juice is capped at 5%. Investors cannot invest directly in an index, although they can invest in its underlying securities.
Market Exposure
The Fund seeks daily exposure of 100% of its NAV through derivatives. "Market Exposure" includes the value of total investments (including the contract value of any derivatives) and excludes any short-term investments and cash equivalents, if any, divided by Net Assets.
1 Commencement of operations.
2 As of October 31, 2022.
DIREXION ANNUAL REPORT
11
Direxion Hydrogen ETF
Performance Summary (Unaudited)
March 25, 20211 - October 31, 2022

| | | Average Annual Total Return2 | |
| | | 1 Year | | Since Inception | |
Direxion Hydrogen ETF (NAV) | | | -45.57 | % | | | -32.69 | % | |
Direxion Hydrogen ETF (Market Price) | | | -45.84 | % | | | -32.64 | % | |
Indxx Hydrogen Economy Index | | | -45.79 | % | | | -30.48 | % | |
The performance data quoted represents past performance; past performance does not guarantee future results; the investment return and principal value of an investment will fluctuate; an investor's shares, when redeemed, may be worth more or less than their original cost; current performance may be lower or higher than the performance quoted. As stated in the current prospectus, the Fund's total annual fund operating expense ratio is 0.45%. Rafferty Asset Management, LLC has contractually agreed to pay all expenses of the Fund other than following: management fees, Rule 12b-1 distribution fees and/or service fees, taxes, swap financing and related costs, dividends or interest on short positions, other interest expenses, brokerage commissions, expenses incurred in connection with any merger or reorganization, acquired fund fees and expenses, and extraordinary expenses. The performance table and graph do not reflect the deduction of taxes that a shareholder would pay on Fund distributions or the redemption of Fund shares. For the Fund's most recent month end performance please visit www.direxion.com.
This chart illustrates the performance of a hypothetical $10,000 investment made on the Fund's inception and is not intended to imply any future performance. Shares of Direxion Shares are bought and sold at market price (not NAV) and are not individually redeemed from the Fund. Performance reflects reinvestment of all dividend and capital gains distributions.
The Indxx Hydrogen Economy Index tracks the performance of companies that provide goods and/or services related to the Hydrogen Industry, including hydrogen generation and storage, fuel cells, hydrogen stations, and hydrogen-based vehicles. The Index will include domestic securities as well as securities listed on various foreign markets, including among others, Japan and South Korea. The Index is reconstituted annually and rebalanced quarterly. Investors cannot invest directly in an index, although they can invest in its underlying securities.
Market Exposure
The Fund seeks daily exposure of 100% of its NAV through equities. "Market Exposure" includes the value of total investments (including the contract value of any derivatives) and excludes any short-term investments and cash equivalents, if any, divided by Net Assets.
1 Commencement of operations.
2 As of October 31, 2022.
DIREXION ANNUAL REPORT
12
Direxion Moonshot Innovators ETF
Performance Summary (Unaudited)
November 12, 20201 - October 31, 2022

| | | Average Annual Total Return2 | |
| | | 1 Year | | Since Inception | |
Direxion Moonshot Innovators ETF (NAV) | | | -60.64 | % | | | -27.31 | % | |
Direxion Moonshot Innovators ETF (Market Price) | | | -60.61 | % | | | -27.31 | % | |
S&P Kensho Moonshots Index | | | -60.92 | % | | | -27.79 | % | |
The performance data quoted represents past performance; past performance does not guarantee future results; the investment return and principal value of an investment will fluctuate; an investor's shares, when redeemed, may be worth more or less than their original cost; current performance may be lower or higher than the performance quoted. As stated in the current prospectus, the Fund's total annual fund operating expense ratio is 0.65%. Rafferty Asset Management, LLC has contractually agreed to pay all expenses of the Fund other than following: management fees, Rule 12b-1 distribution fees and/or service fees, taxes, swap financing and related costs, dividends or interest on short positions, other interest expenses, brokerage commissions, expenses incurred in connection with any merger or reorganization, acquired fund fees and expenses, and extraordinary expenses. The performance table and graph do not reflect the deduction of taxes that a shareholder would pay on Fund distributions or the redemption of Fund shares. For the Fund's most recent month end performance please visit www.direxion.com.
This chart illustrates the performance of a hypothetical $10,000 investment made on the Fund's inception and is not intended to imply any future performance. Shares of Direxion Shares are bought and sold at market price (not NAV) and are not individually redeemed from the Fund. Performance reflects reinvestment of all dividend and capital gains distributions.
The S&P Kensho Moonshots Index is comprised of 50 U.S. companies that pursue innovative technologies that have the potential to disrupt existing technologies and/or industries (i.e., moonshot innovators) and are considered to have the highest "early-stage composite innovation scores" which is determined based off a natural language processing review of the constituent company's latest annual regulatory filing for the use of words and phrases that are related to innovation. The Index is modified equal-weighted, reconstituted annually, and rebalanced semi-annually. Investors cannot invest directly in an index, although they can invest in its underlying securities.
Market Exposure
The Fund seeks daily exposure of 100% of its NAV through equities. "Market Exposure" includes the value of total investments (including the contract value of any derivatives) and excludes any short-term investments and cash equivalents, if any, divided by Net Assets.
1 Commencement of operations.
2 As of October 31, 2022.
DIREXION ANNUAL REPORT
13
Direxion mRNA ETF
Performance Summary (Unaudited)
December 9, 20211 - October 31, 2022
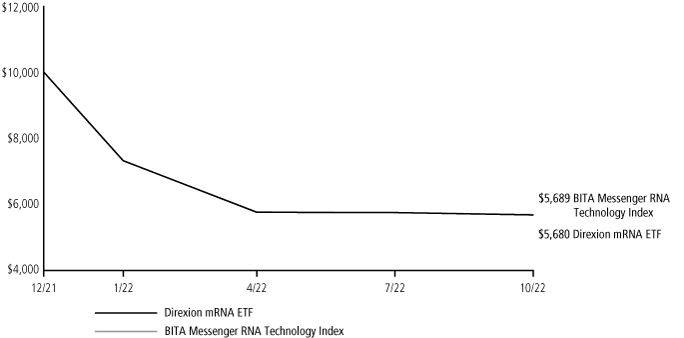
| | | Total Return2 | |
| | | Since Inception | |
Direxion mRNA ETF (NAV) | | | -43.20 | % | |
Direxion mRNA ETF (Market Price) | | | -43.17 | % | |
BITA Messenger RNA Technology Index | | | -43.11 | % | |
The performance data quoted represents past performance; past performance does not guarantee future results; the investment return and principal value of an investment will fluctuate; an investor's shares, when redeemed, may be worth more or less than their original cost; current performance may be lower or higher than the performance quoted. As stated in the current prospectus, the Fund's total annual fund operating expense ratio is 0.65%. Rafferty Asset Management, LLC has contractually agreed to pay all expenses of the Fund other than following: management fees, Rule 12b-1 distribution fees and/or service fees, taxes, swap financing and related costs, dividends or interest on short positions, other interest expenses, brokerage commissions, expenses incurred in connection with any merger or reorganization, acquired fund fees and expenses, and extraordinary expenses. The performance table and graph do not reflect the deduction of taxes that a shareholder would pay on Fund distributions or the redemption of Fund shares. For the Fund's most recent month end performance please visit www.direxion.com.
This chart illustrates the performance of a hypothetical $10,000 investment made on the Fund's inception and is not intended to imply any future performance. Shares of Direxion Shares are bought and sold at market price (not NAV) and are not individually redeemed from the Fund. Performance reflects reinvestment of all dividend and capital gains distributions.
BITA Messenger RNA Technology Index provides exposure to the performance of companies, publicly listed in the United States, Canada and Europe, that are leading the development and application of messenger RNA ("mRNA") technology. Investors cannot invest directly in an index, although they can invest in its underlying securities.
Market Exposure
The Fund seeks daily exposure of 100% of its NAV through equities. "Market Exposure" includes the value of total investments (including the contract value of any derivatives) and excludes any short-term investments and cash equivalents, if any, divided by Net Assets.
1 Commencement of operations.
2 As of October 31, 2022.
DIREXION ANNUAL REPORT
14
Direxion Nanotechnology ETF
Performance Summary (Unaudited)
November 23, 20211 - October 31, 2022

| | | Total Return2 | |
| | | Since Inception | |
Direxion Nanotechnology ETF (NAV) | | | -35.44 | % | |
Direxion Nanotechnology ETF (Market Price) | | | -35.45 | % | |
S&P Kensho Extended Nanotechnology Index | | | -35.25 | % | |
The performance data quoted represents past performance; past performance does not guarantee future results; the investment return and principal value of an investment will fluctuate; an investor's shares, when redeemed, may be worth more or less than their original cost; current performance may be lower or higher than the performance quoted. As stated in the current prospectus, the Fund's total annual fund operating expense ratio is 0.65%. Rafferty Asset Management, LLC has contractually agreed to pay all expenses of the Fund other than following: management fees, Rule 12b-1 distribution fees and/or service fees, taxes, swap financing and related costs, dividends or interest on short positions, other interest expenses, brokerage commissions, expenses incurred in connection with any merger or reorganization, acquired fund fees and expenses, and extraordinary expenses. The performance table and graph do not reflect the deduction of taxes that a shareholder would pay on Fund distributions or the redemption of Fund shares. For the Fund's most recent month end performance please visit www.direxion.com.
This chart illustrates the performance of a hypothetical $10,000 investment made on the Fund's inception and is not intended to imply any future performance. Shares of Direxion Shares are bought and sold at market price (not NAV) and are not individually redeemed from the Fund. Performance reflects reinvestment of all dividend and capital gains distributions.
S&P Kensho Extended Nanotechnology Index is provided by S&P Dow Jones Indices LLC (the "Index Provider") and is designed to measure the performance of U.S.-listed securities, including depositary receipts, of companies involved in the nanotechnology industry. Investors cannot invest directly in an index, although they can invest in its underlying securities.
Market Exposure
The Fund seeks daily exposure of 100% of its NAV through equities. "Market Exposure" includes the value of total investments (including the contract value of any derivatives) and excludes any short-term investments and cash equivalents, if any, divided by Net Assets.
1 Commencement of operations.
2 As of October 31, 2022.
DIREXION ANNUAL REPORT
15
Direxion NASDAQ-100® Equal Weighted Index Shares
Performance Summary (Unaudited)
October 31, 2012 - October 31, 2022

| | | Average Annual Total Return1 | |
| | | 1 Year | | 3 Years | | 5 Years | | 10 Years | |
Direxion NASDAQ-100® Equal Weighted Index Shares (NAV) | | | -23.78 | % | | | 9.51 | % | | | 10.31 | % | | | 14.44 | % | |
Direxion NASDAQ-100® Equal Weighted Index Shares (Market Price) | | | -23.68 | % | | | 9.53 | % | | | 10.33 | % | | | 14.44 | % | |
NASDAQ-100® Equal Weighted Index | | | -23.58 | % | | | 9.88 | % | | | 10.69 | % | | | 14.85 | % | |
The performance data quoted represents past performance; past performance does not guarantee future results; the investment return and principal value of an investment will fluctuate; an investor's shares, when redeemed, may be worth more or less than their original cost; current performance may be lower or higher than the performance quoted. As stated in the current prospectus, the Fund's total annual fund operating expense ratio is 0.35%. Rafferty Asset Management, LLC has contractually agreed to pay all expenses of the Fund other than following: management fees, Rule 12b-1 distribution fees and/or service fees, taxes, swap financing and related costs, dividends or interest on short positions, other interest expenses, brokerage commissions, expenses incurred in connection with any merger or reorganization, acquired fund fees and expenses, and extraordinary expenses. The performance table and graph do not reflect the deduction of taxes that a shareholder would pay on Fund distributions or the redemption of Fund shares. For the Fund's most recent month end performance please visit www.direxion.com.
This chart illustrates the performance of a hypothetical $10,000 investment made on the Fund's inception and is not intended to imply any future performance. Shares of Direxion Shares are bought and sold at market price (not NAV) and are not individually redeemed from the Fund. Performance reflects reinvestment of all dividend and capital gains distributions.
The NASDAQ-100® Equal Weighted Index includes 100 of the largest non-financial securities listed on NASDAQ®, but instead of being weighted by market capitalization, each of the constituents is initially set at 1.00%. The Index is reviewed and adjusted annually in December, but replacements may be made any time throughout the year. The Index is rebalanced quarterly in March, June, September and December. Investors cannot invest directly in an index, although they can invest in its underlying securities.
Market Exposure
The Fund seeks daily exposure of 100% of its NAV through equities. "Market Exposure" includes the value of total investments (including the contract value of any derivatives) and excludes any short-term investments and cash equivalents, if any, divided by Net Assets.
1 As of October 31, 2022.
DIREXION ANNUAL REPORT
16
Direxion Work From Home ETF
Performance Summary (Unaudited)
June 25, 20201 - October 31, 2022

| | | Average Annual Total Return2 | |
| | | 1 Year | | Since Inception | |
Direxion Work From Home ETF (NAV) | | | -43.00 | % | | | -4.67 | % | |
Direxion Work From Home ETF (Market Price) | | | -42.98 | % | | | -4.69 | % | |
Solactive Remote Work Index | | | -42.95 | % | | | -4.52 | % | |
The performance data quoted represents past performance; past performance does not guarantee future results; the investment return and principal value of an investment will fluctuate; an investor's shares, when redeemed, may be worth more or less than their original cost; current performance may be lower or higher than the performance quoted. As stated in the current prospectus, the Fund's total annual fund operating expense ratio is 0.45%. Rafferty Asset Management, LLC has contractually agreed to pay all expenses of the Fund other than following: management fees, Rule 12b-1 distribution fees and/or service fees, taxes, swap financing and related costs, dividends or interest on short positions, other interest expenses, brokerage commissions, expenses incurred in connection with any merger or reorganization, acquired fund fees and expenses, and extraordinary expenses. The performance table and graph do not reflect the deduction of taxes that a shareholder would pay on Fund distributions or the redemption of Fund shares. For the Fund's most recent month end performance please visit www.direxion.com.
This chart illustrates the performance of a hypothetical $10,000 investment made on the Fund's inception and is not intended to imply any future performance. Shares of Direxion Shares are bought and sold at market price (not NAV) and are not individually redeemed from the Fund. Performance reflects reinvestment of all dividend and capital gains distributions.
The Solactive Remote Work Index is comprised of U.S. listed securities and American Depository Receipts of companies that provide products and services in at least one of the following business segments that facilitate the ability of people to work from home: remote communications, cyber security, online project and document management, and cloud computing technologies ("WFH Industries"). The Index consists of 40 companies, namely, the top 10 ranked companies in each of the four WFH Industries. The Index is equal weighted at each semi-annual reconstitution and rebalance date. Investors cannot invest directly in an index, although they can invest in its underlying securities.
Market Exposure
The Fund seeks daily exposure of 100% of its NAV through equities. "Market Exposure" includes the value of total investments (including the contract value of any derivatives) and excludes any short-term investments and cash equivalents, if any, divided by Net Assets.
1 Commencement of operations.
2 As of October 31, 2022.
DIREXION ANNUAL REPORT
17
Expense Example (Unaudited)
October 31, 2022
As a shareholder of the Funds, you incur two types of costs: (1) transaction costs, for purchasing and selling shares and exchange fees; and (2) ongoing costs, including management fees; and other Fund expenses. This example is intended to help you understand your ongoing costs (in dollars) of investing in a fund and to compare these costs with the ongoing costs of investing in other funds.
The example is based on initial investments of $1,000 invested at the beginning of the period and held the entire period (May 1, 2022 to October 31, 2022).
Actual expenses
The first line under each Fund in the table provides information about actual account values and actual expenses. You may use the information in this line, together with the amount you invested, to estimate the expenses that you paid over the period. Simply divide your account value by $1,000 (for example, an $8,600 account value divided by $1,000 = 8.6), then multiply the result by the number in the first line for your Fund under the heading entitled "Expenses Paid During Period May 1, 2022 to October 31, 2022" to estimate the expenses you paid on your account during this period.
Hypothetical example for comparison purposes
The second line of the table below provides information about hypothetical account values and hypothetical expenses based on each Fund's actual expense ratio and an assumed rate of return of 5% per year before expenses, which is not the Fund's actual return. The hypothetical account values and expenses may not be used to estimate the actual ending account balance or expenses you paid for the period. You may use this information to compare the ongoing costs of investing in your Fund and other funds. To do so, compare this 5% hypothetical example with the 5% hypothetical examples that appear in the shareholder reports of the other funds.
Please note that the expenses shown in the table are meant to highlight your ongoing costs only and do not reflect any transactional costs, such as brokerage commissions paid on purchases and sales of Fund shares. Therefore, the second line under each Fund in the table is useful in comparing ongoing Fund costs only, and will not help you determine the relative total costs of owning different funds. In addition, if these transactional costs were included, your costs would have been higher.
DIREXION ANNUAL REPORT
18
Expense Example (Unaudited)
October 31, 2022
| | | Annualized
Expense Ratio | | Beginning
Account Value
May 1, 2022 | | Ending
Account Value
October 31, 2022 | | Expenses Paid
During Period
May 1, 2022 to
October 31, 2022* | |
Direxion Auspice Broad Commodity Strategy ETF (Consolidated) | |
Based on actual fund return | | | 0.86 | % | | $ | 1,000.00 | | | $ | 918.50 | | | $ | 4.16 | | |
Based on hypothetical 5% return | | | 0.86 | % | | | 1,000.00 | | | | 1,020.87 | | | | 4.38 | | |
Direxion Breakfast Commodities Strategy ETF (Consolidated)1 | |
Based on actual fund return | | | 0.70 | % | | | 1,000.00 | | | | 918.10 | | | | 2.81 | | |
Based on hypothetical 5% return | | | 0.70 | % | | | 1,000.00 | | | | 1,018.02 | | | | 2.96 | | |
Direxion Hydrogen ETF | |
Based on actual fund return | | | 0.45 | % | | | 1,000.00 | | | | 765.80 | | | | 2.00 | | |
Based on hypothetical 5% return | | | 0.45 | % | | | 1,000.00 | | | | 1,022.94 | | | | 2.29 | | |
Direxion Moonshot Innovators ETF | |
Based on actual fund return | | | 0.65 | % | | | 1,000.00 | | | | 826.40 | | | | 2.99 | | |
Based on hypothetical 5% return | | | 0.65 | % | | | 1,000.00 | | | | 1,021.93 | | | | 3.31 | | |
Direxion mRNA ETF | |
Based on actual fund return | | | 0.65 | % | | | 1,000.00 | | | | 986.10 | | | | 3.25 | | |
Based on hypothetical 5% return | | | 0.65 | % | | | 1,000.00 | | | | 1,021.93 | | | | 3.31 | | |
Direxion Nanotechnology ETF | |
Based on actual fund return | | | 0.65 | % | | | 1,000.00 | | | | 1,064.60 | | | | 3.38 | | |
Based on hypothetical 5% return | | | 0.65 | % | | | 1,000.00 | | | | 1,021.93 | | | | 3.31 | | |
Direxion NASDAQ-100® Equal Weighted Index Shares | |
Based on actual fund return | | | 0.35 | % | | | 1,000.00 | | | | 928.00 | | | | 1.70 | | |
Based on hypothetical 5% return | | | 0.35 | % | | | 1,000.00 | | | | 1,023.44 | | | | 1.79 | | |
Direxion Work From Home ETF | |
Based on actual fund return | | | 0.45 | % | | | 1,000.00 | | | | 774.50 | | | | 2.01 | | |
Based on hypothetical 5% return | | | 0.45 | % | | | 1,000.00 | | | | 1,022.94 | | | | 2.29 | | |
* Expenses are equal to the Fund's annualized expense ratio, multiplied by the average account value over the period, multiplied by 184 days (the number of days in the period of May 1, 2022 to October 31, 2022), then divided by 365.
1 Expenses are equal to the Fund's annualized expense ratio, multiplied by the average account value over the period from June 1, 2022 (commencement of operations) to October 31, 2022, multiplied by 153 days (the number of days since commencement of operations to October 31, 2022), then divided by 365.
DIREXION ANNUAL REPORT
19
Allocation of Portfolio Holdings (Unaudited)
October 31, 2022
| | | Cash* | | Common
Stocks | | Futures | | Total | |
Direxion Auspice Broad Commodity Strategy ETF (Consolidated) | | | 100 | % | | | — | | | | — | | | | 100 | % | |
Direxion Breakfast Commodities Strategy ETF (Consolidated) | | | 100 | % | | | — | | | | 0 | %** | | | 100 | % | |
Direxion Hydrogen ETF | | | 1 | % | | | 99 | % | | | — | | | | 100 | % | |
Direxion Moonshot Innovators ETF | | | 1 | % | | | 99 | % | | | — | | | | 100 | % | |
Direxion mRNA ETF | | | 0 | %** | | | 100 | % | | | — | | | | 100 | % | |
Direxion Nanotechnology ETF | | | 0 | %** | | | 100 | % | | | — | | | | 100 | % | |
Direxion NASDAQ-100® Equal Weighted Index Shares | | | 0 | %** | | | 100 | % | | | — | | | | 100 | % | |
Direxion Work From Home ETF | | | 0 | %** | | | 100 | % | | | — | | | | 100 | % | |
* Cash and other assets less liabilities.
** Percentage is less than 0.5%.
DIREXION ANNUAL REPORT
20
Direxion Auspice Broad Commodity Strategy ETF (Consolidated)
Schedule of Investments
October 31, 2022
Shares | | | | Fair Value | |
SHORT TERM INVESTMENTS - 101.3% | |
Money Market Funds - 101.3% | |
| | 301,128,639 | | | Dreyfus Government Cash
Management Institutional
Shares, 2.91% (a) | | $ | 301,128,639 | | |
| | | TOTAL SHORT TERM
INVESTMENTS
(Cost $301,128,639) | | $ | 301,128,639 | | |
| | | TOTAL INVESTMENTS
(Cost $301,128,639) - 101.3% | | $ | 301,128,639 | | |
| | | Liabilities in Excess of
Other Assets - (1.3)% | | | (3,840,833 | ) | |
| | | TOTAL NET ASSETS - 100.0% | | $ | 297,287,806 | | |
Percentages are stated as a percent of net assets.
The geographic location of all investments is United States unless otherwise indicated.
(a) Represents annualized seven-day yield at October 31, 2022.
The accompanying notes are an integral part of these financial statements.
DIREXION ANNUAL REPORT
21
Direxion Breakfast Commodities Strategy ETF (Consolidated)
Schedule of Investments
October 31, 2022
Shares | | | | Fair Value | |
SHORT TERM INVESTMENTS - 91.3% | |
Money Market Funds - 91.3% | |
| | 6,273,596 | | | Dreyfus Government Cash
Management Institutional
Shares, 2.91% (a) | | $ | 6,273,596 | | |
| | | TOTAL SHORT TERM
INVESTMENTS (Cost $6,273,596) | | $ | 6,273,596 | | |
| | | TOTAL INVESTMENTS
(Cost $6,273,596) - 91.3% | | $ | 6,273,596 | | |
| | | Other Assets in Excess of
Liabilities - 8.7% (b) | | | 596,427 | | |
| | | TOTAL NET ASSETS - 100.0% | | $ | 6,870,023 | | |
Percentages are stated as a percent of net assets.
The geographic location of all investments is United States unless otherwise indicated.
(a) Represents annualized seven-day yield at October 31, 2022.
(b) $492,562 of cash is pledged as collateral for futures contracts.
Long Futures Contracts
October 31, 2022
Reference Entity | | Expiration
Date | | Number of
Contracts | | Notional
Amount | | Variation
Margin
Receivable/
(Payable), net | | Unrealized
Appreciation
(Depreciation) | |
Coffee C | | 5/18/2023 | | | 5 | | | $ | 324,281 | | | $ | 11,437 | | | $ | (60,675 | ) | |
Corn | | 12/14/2023 | | | 89 | | | | 2,784,588 | | | | 21,138 | | | | (18,721 | ) | |
Frozen Concentrate Orange Juice | | 1/10/2023 | | | 13 | | | | 392,145 | | | | 1,657 | | | | 26,884 | | |
Lean Hogs | | 12/14/2022 | | | 24 | | | | 815,280 | | | | (11,280 | ) | | | 7,310 | | |
Sugar #11 | | 4/28/2023 | | | 36 | | | | 681,005 | | | | 9,677 | | | | (69,049 | ) | |
Wheat | | 7/14/2023 | | | 40 | | | | 1,807,500 | | | | 84,500 | | | | 147,600 | | |
| | | | | | | $ | 6,804,799 | | | $ | 117,129 | | | $ | 33,349 | | |
All futures contracts held by Direxion BKT Fund Ltd. See Note 1.
The accompanying notes are an integral part of these financial statements.
DIREXION ANNUAL REPORT
22
Direxion Hydrogen ETF
Schedule of Investments
October 31, 2022
Shares | | | | Fair Value | |
COMMON STOCKS - 99.0% | | | |
Chemical Manufacturing - 42.1% | | | |
| | 14,072 | | | Air Liquide S.A. (France) | | $ | 1,840,032 | | |
| | 3,921 | | | Air Products & Chemicals, Inc. | | | 981,819 | | |
| | 52,997 | | | Doosan Fuel Cell Co., Ltd
(South Korea) (a) | | | 1,013,843 | | |
| | 520,629 | | | ITM Power (United Kingdom) (a)(b) | | | 495,483 | | |
| | 3,281 | | | Linde PLC (Ireland) ADR | | | 975,605 | | |
| | 27,063 | | | McPhy Energy SAS (France) (a)(b) | | | 307,598 | | |
| | 1,496,312 | | | Nel ASA (Norway) (a) | | | 1,828,500 | | |
| | 57,298 | | | Nippon Sanso Holdings Corp.
(Japan) | | | 914,393 | | |
| | 845,137 | | | PTT Global Chemical PCL
(Thailand) | | | 965,934 | | |
| | | 9,323,207 | | |
Computer and Electronic Product
Manufacturing - 8.5% | | | |
| | 100,767 | | | Bloom Energy Corp. (a) | | | 1,885,351 | | |
Electrical Equipment, Appliance, and Component Manufacturing - 12.4% | | | |
| | 64,956 | | | Chung-Hsin Electric & Machinery
Manufacturing Corp. (Taiwan) | | | 99,584 | | |
| | 2,894 | | | Hyosung Heavy Industries
(South Korea) (a) | | | 116,617 | | |
| | 101,989 | | | Plug Power, Inc. (a) | | | 1,629,784 | | |
| | 61,132 | | | PowerCell Sweden AB
(Sweden) (a)(b) | | | 672,148 | | |
| | 6,495 | | | SFC Energy AG (Germany) (a)(b) | | | 119,913 | | |
| | 3,882 | | | VARTA AG (Germany) (b) | | | 104,245 | | |
| | | | 2,742,291 | | |
Merchant Wholesalers, Durable Goods - 0.5% | | | |
| | 4,084 | | | Hyster-Yale Materials Handling, Inc. | | | 119,089 | | |
Miscellaneous Manufacturing - 0.5% | | | |
| | 53,568 | | | Hexagon Purus Holding AS
(Norway) (a) | | | 103,871 | | |
Oil and Gas Extraction - 18.2% | | | |
| | 30,166 | | | BP Plc (United Kingdom) ADR (a) | | | 1,003,925 | | |
| | 102,805 | | | CIMC Enric Holdings Limited
(Hong Kong) | | | 100,187 | | |
| | 293,081 | | | ENEOS Holdings, Inc. (Japan) | | | 965,796 | | |
| | 43,624 | | | Idemitsu Kosan Co., Ltd (Japan) | | | 953,867 | | |
| | 17,853 | | | Shell Plc (United Kingdom) ADR (a) | | | 993,162 | | |
| | | | 4,016,937 | | |
Primary Metal Manufacturing - 0.5% | | | |
| | 30,352 | | | Kaori Heat Treatment Co., Ltd.
(Taiwan) | | | 110,208 | | |
Transportation Equipment Manufacturing - 6.9% | | | |
| | 270,177 | | | Ballard Power Systems, Inc.
(Canada) ADR (a)(b) | | | 1,531,904 | | |
Shares | | | | Fair Value | |
Utilities - 9.4% | | | |
| | 1,008,214 | | | AFC Energy Plc
(United Kingdom) (a) | | $ | 246,090 | | |
| | 144,274 | | | Ceres Power Holdings Plc
(United Kingdom) (a)(b) | | | 544,505 | | |
| | 311,189 | | | FuelCell Energy, Inc. (a) | | | 970,910 | | |
| | 4,538 | | | Korea Gas Corp. (South Korea) | | | 110,865 | | |
| | 15,602 | | | S-Fuelcell Co., Ltd (South Korea) | | | 219,608 | | |
| | | 2,091,978 | | |
| | | | | TOTAL COMMON STOCKS
(Cost $35,743,613) | | $ | 21,924,836 | | |
SHORT TERM INVESTMENTS - 17.7% | | | |
Money Market Funds - 17.7% | | | |
| | 3,905,853 | | | Dreyfus Government Cash
Management Institutional
Shares, 2.91% (c)(d) | | $ | 3,905,853 | | |
| | | | | TOTAL SHORT TERM
INVESTMENTS
(Cost $3,905,853) | | $ | 3,905,853 | | |
| | | | | TOTAL INVESTMENTS
(Cost $39,649,466) - 116.7% | | $ | 25,830,689 | | |
| | | | | Liabilities in Excess of
Other Assets - (16.7%) | | | (3,692,014 | ) | |
| | | | | TOTAL NET ASSETS - 100.0% | | $ | 22,138,675 | | |
Percentages are stated as a percent of net assets.
The geographic location of all investments is United States unless otherwise indicated.
(a) Non-income producing security.
(b) A portion of this security represents a security on loan.
(c) Represents annualized seven-day yield at October 31, 2022.
(d) All or a portion of this security represents an investment of securities lending collateral.
ADR - American Depository Receipt
The accompanying notes are an integral part of these financial statements.
DIREXION ANNUAL REPORT
23
Direxion Moonshot Innovators ETF
Schedule of Investments
October 31, 2022
Shares | | | | Fair Value | |
COMMON STOCKS - 99.5% | | | |
Administrative and Support Services - 5.3% | | | |
| | 26,146 | | | Roblox Corp. (a) | | $ | 1,169,772 | | |
| | 37,014 | | | SentinelOne, Inc. (a) | | | 845,400 | | |
| | | | 2,015,172 | | |
Ambulatory Health Care Services - 2.2% | | | |
| | 325,057 | | | Invitae Corp. (a)(b) | | | 838,647 | | |
Chemical Manufacturing - 8.0% | | | |
| | 58,094 | | | Arcturus Therapeutics
Holdings, Inc. (a) | | | 1,028,264 | | |
| | 100,579 | | | BridgeBio Pharma, Inc. (a) | | | 1,049,039 | | |
| | 17,590 | | | Intellia Therapeutics, Inc. (a) | | | 928,400 | | |
| | | | 3,005,703 | | |
Computer and Electronic Product
Manufacturing - 12.1% | | | |
| | 13,235 | | | Ambarella Inc. ADR (a) | | | 724,352 | | |
| | 145,420 | | | Indie Semiconductor, Inc. (a) | | | 1,137,184 | | |
| | 226,912 | | | MicroVision, Inc. (a)(b) | | | 830,498 | | |
| | 289,944 | | | Nano Dimension Ltd. ADR (Israel) (a) | | | 719,061 | | |
| | 109,474 | | | Ondas Holdings, Inc. (a)(b) | | | 437,896 | | |
| | 140,421 | | | Vuzix Corp. (a)(b) | | | 702,105 | | |
| | | | 4,551,096 | | |
Construction of Buildings - 0.3% | | | |
| | 114,105 | | | Xos, Inc. (a) | | | 128,939 | | |
Electronics and Appliance Stores - 1.5% | | | |
| | 43,982 | | | UiPath, Inc. (a) | | | 556,372 | | |
Food Services and Drinking Places - 3.2% | | | |
| | 31,759 | | | Yelp, Inc. (a) | | | 1,219,863 | | |
Management of Companies and Enterprises - 1.3% | | | |
| | 66,671 | | | CureVac N.V. ADR (Netherlands) (a) | | | 485,365 | | |
Merchant Wholesalers, Nondurable Goods - 1.7% | | | |
| | 133,629 | | | Atara Biotherapeutics, Inc. (a) | | | 622,711 | | |
Miscellaneous Manufacturing - 2.8% | | | |
| | 481,750 | | | Inovio Pharmaceuticals, Inc. (a) | | | 1,040,580 | | |
Motion Picture and Sound Recording Industries - 1.8% | | | |
| | 62,130 | | | ADEIA, Inc. | | | 694,613 | | |
Nonstore Retailers - 1.8% | | | |
| | 136,146 | | | Jumia Technologies AG ADR
(Germany) (a) | | | 675,284 | | |
Oil and Gas Extraction - 2.3% | | | |
| | 816,876 | | | Meta Materials, Inc. (a) | | | 865,888 | | |
Printing and Related Support Activities - 2.2% | | | |
| | 102,331 | | | Fisker, Inc. (a)(b) | | | 833,998 | | |
Professional, Scientific, and Technical Services - 13.7% | | | |
| | 46,070 | | | Asana, Inc. (a) | | | 949,042 | | |
| | 56,325 | | | Avidity Biosciences, Inc. (a) | | | 804,321 | | |
| | 79,726 | | | Local Bounti Corp. (a)(b) | | | 235,989 | | |
| | 9,661 | | | Okta, Inc. (a) | | | 542,175 | | |
| | 97,353 | | | Sarcos Technology and
Robotics Corp. (a) | | | 196,653 | | |
| | 42,524 | | | Squarespace, Inc. (a) | | | 944,458 | | |
| | 109,360 | | | Tusimple Holdings, Inc. (a) | | | 375,105 | | |
| | 21,177 | | | Unity Software, Inc. (a) | | | 624,721 | | |
| | 135,362 | | | Vimeo, Inc. (a) | | | 514,376 | | |
| | | | 5,186,840 | | |
Shares | | | | Fair Value | |
Publishing Industries (except Internet) - 3.3% | | | |
| | 48,851 | | | C3.ai, Inc. (a) | | $ | 640,437 | | |
| | 71,657 | | | Fastly, Inc. (a) | | | 608,368 | | |
| | | | 1,248,805 | | |
Securities, Commodity Contracts, and Other Financial Investments and Related Activities - 36.0% | | | |
| | 240,651 | | | Aeva Technologies, Inc. (a) | | | 481,302 | | |
| | 345,482 | | | AEye, Inc. (a) | | | 300,742 | | |
| | 428,953 | | | Aurora Innovation, Inc. (a) | | | 883,643 | | |
| | 243,762 | | | Benson Hill, Inc. (a) | | | 826,353 | | |
| | 293,566 | | | Butterfly Network, Inc. (a)(b) | | | 1,438,473 | | |
| | 406,671 | | | Desktop Metal, Inc. (a)(b) | | | 1,028,878 | | |
| | 336,707 | | | Ginkgo Bioworks Holdings, Inc.
Class A (a)(b) | | | 919,210 | | |
| | 258,079 | | | Hyliion Holdings Corp. (a) | | | 735,525 | | |
| | 282,105 | | | Hyzon Motors, Inc. (a) | | | 538,821 | | |
| | 236,034 | | | Inoviz Technologies Ltd. ADR
(Israel) (a) | | | 1,182,530 | | |
| | 757,591 | | | Latch, Inc. (a) | | | 1,015,172 | | |
| | 536,808 | | | Ouster, Inc. (a) | | | 671,010 | | |
| | 155,133 | | | Pear Therapeutics, Inc. (a) | | | 426,616 | | |
| | 192,899 | | | Planet Labs PBC (a) | | | 1,012,720 | | |
| | 131,492 | | | Roivant Sciences Ltd. ADR (a)(b) | | | 675,869 | | |
| | 831,337 | | | Velodyne Lidar, Inc. (a) | | | 820,945 | | |
| | 141,477 | | | Virgin Galactic Holdings, Inc. (a)(b) | | | 653,624 | | |
| | | | 13,611,433 | | |
| | | | | TOTAL COMMON STOCKS
(Cost $66,014,382) | | $ | 37,581,309 | | |
SHORT TERM INVESTMENTS - 16.7% | | | |
Money Market Funds - 16.7% | | | |
| | 6,325,075 | | | Dreyfus Government Cash
Management Institutional
Shares, 2.91% (c)(d) | | $ | 6,325,075 | | |
| | | | | TOTAL SHORT TERM
INVESTMENTS
(Cost $6,325,075) | | $ | 6,325,075 | | |
| | | | | TOTAL INVESTMENTS
(Cost $72,339,457) - 116.2% | | $ | 43,906,384 | | |
| | | | | Liabilities in Excess of
Other Assets - (16.2)% | | | (6,134,585 | ) | |
| | | | | TOTAL NET ASSETS - 100.0% | | $ | 37,771,799 | | |
Percentages are stated as a percent of net assets.
The geographic location of all investments is United States unless otherwise indicated.
(a) Non-income producing security.
(b) A portion of this security represents a security on loan.
(c) Represents annualized seven-day yield at October 31, 2022.
(d) All or a portion of this security represents an investment of securities lending collateral.
ADR - American Depository Receipt
The accompanying notes are an integral part of these financial statements.
DIREXION ANNUAL REPORT
24
Direxion mRNA ETF
Schedule of Investments
October 31, 2022
Shares | | | | Fair Value | |
COMMON STOCKS - 99.8% | | | |
Chemical Manufacturing - 58.5% | | | |
| | 746 | | | Alnylam Pharmaceuticals, Inc. (a) | | $ | 154,616 | | |
| | 81,701 | | | Arbutus Biopharma Corp. ADR
(Canada) (a) | | | 191,180 | | |
| | 9,187 | | | Arcturus Therapeutics
Holdings, Inc. (a) | | | 162,610 | | |
| | 1,286 | | | BeiGene Ltd. ADR (a) | | | 217,192 | | |
| | 2,786 | | | Intellia Therapeutics, Inc. (a) | | | 147,045 | | |
| | 3,398 | | | Ionis Pharmaceuticals, Inc. (a) | | | 150,192 | | |
| | 7,905 | | | Maravai LifeSciences
Holdings, Inc. (a) | | | 131,223 | | |
| | 7,393 | | | PepGen, Inc. (a) | | | 90,786 | | |
| | 32,241 | | | Sangamo Therapeutics, Inc. (a) | | | 141,538 | | |
| | 2,180 | | | Sarepta Therapeutics, Inc. (a) | | | 248,564 | | |
| | 12,474 | | | Stoke Therapeutics, Inc. (a) | | | 185,239 | | |
| | 822 | | | Vertex Pharmaceuticals, Inc. (a) | | | 256,464 | | |
| | | | 2,076,649 | | |
Management of Companies and Enterprises - 4.2% | | | |
| | 20,292 | | | CureVac N.V. ADR (Netherlands) (a) | | | 147,726 | | |
Merchant Wholesalers, Durable Goods - 3.9% | | | |
| | 12,268 | | | Dyne Therapeutics, Inc. (a) | | | 139,855 | | |
| | | Professional, Scientific, and Technical Services - 33.2% | |
| | 4,568 | | | Arrowhead Pharmaceuticals, Inc. (a) | | | 159,012 | | |
| | 9,527 | | | Avidity Biosciences, Inc. (a) | | | 136,046 | | |
| | 1,802 | | | BioNTech SE ADR (Germany) | | | 248,027 | | |
| | 50,816 | | | Gritstone bio, Inc. (a) | | | 163,627 | | |
| | 2,034 | | | Moderna, Inc. (a) | | | 305,771 | | |
| | 106,882 | | | Sorrento Therapeutics Inc. (a) | | | 167,805 | | |
| | | | 1,180,288 | | |
| | | | | TOTAL COMMON STOCKS
(Cost $4,051,204) | | $ | 3,544,518 | | |
SHORT TERM INVESTMENTS - 0.0% (†) | | | |
Money Market Funds - 0.0% (†) | | | |
| | 91 | | | Dreyfus Government Cash
Management Institutional
Shares, 2.91% (b) | | $ | 91 | | |
| | | | | TOTAL SHORT TERM
INVESTMENTS
(Cost $91) | | $ | 91 | | |
| | | | | TOTAL INVESTMENTS
(Cost $4,051,295) - 99.8% | | $ | 3,544,609 | | |
| | | | | Other Assets in Excess of
Liabilities - 0.2% | | | 5,675 | | |
| | | | | TOTAL NET ASSETS - 100.0% | | $ | 3,550,284 | | |
Percentages are stated as a percent of net assets.
The geographic location of all investments is United States unless otherwise indicated.
(†) Less than 0.05%.
(a) Non-income producing security.
(b) Represents annualized seven-day yield at October 31, 2022.
ADR - American Depository Receipt
The accompanying notes are an integral part of these financial statements.
DIREXION ANNUAL REPORT
25
Direxion Nanotechnology ETF
Schedule of Investments
October 31, 2022
Shares | | | | Fair Value | |
COMMON STOCKS - 99.9% | | | |
Chemical Manufacturing - 31.8% | | | |
| | 1,280 | | | Aadi Bioscience, Inc. (a) | | $ | 16,531 | | |
| | 1,909 | | | Alkermes PLC ADR (Ireland) (a) | | | 43,334 | | |
| | 219 | | | Alnylam Pharmaceuticals, Inc. (a) | | | 45,390 | | |
| | 5,630 | | | Arcturus Therapeutics
Holdings, Inc. (a) | | | 99,651 | | |
| | 3,407 | | | Beam Therapeutics, Inc. (a) | | | 150,113 | | |
| | 664 | | | Cabot Corp. | | | 48,791 | | |
| | 3,897 | | | Generation Bio Co. (a) | | | 19,953 | | |
| | 880 | | | Intellia Therapeutics, Inc. (a) | | | 46,446 | | |
| | 304 | | | Jazz Pharmaceuticals PLC ADR
(Ireland) (a) | | | 43,712 | | |
| | | | 513,921 | | |
Computer and Electronic Product
Manufacturing - 39.2% | | | |
| | 378 | | | AMETEK, Inc. | | | 49,012 | | |
| | 58,210 | | | Bionano Genomics, Inc. (a)(b) | | | 136,211 | | |
| | 2,972 | | | Bruker Corp. | | | 183,788 | | |
| | 167 | | | Danaher Corp. | | | 42,029 | | |
| | 521 | | | Lumentum Holdings, Inc. (a) | | | 38,788 | | |
| | 25,724 | | | Nano Dimension Ltd. ADR (Israel) (a) | | | 63,796 | | |
| | 334 | | | NVE Corp. | | | 20,711 | | |
| | 2,998 | | | Seer, Inc. (a) | | | 23,474 | | |
| | 83 | | | Thermo Fisher Scientific, Inc. | | | 42,660 | | |
| | 6,269 | | | Vuzix Corp. (a)(b) | | | 31,345 | | |
| | | | 631,814 | | |
Machinery Manufacturing - 5.7% | | | |
| | 226 | | | IDEX Corp. | | | 50,242 | | |
| | 104 | | | Lam Research Corp. | | | 42,097 | | |
| | | | 92,339 | | |
Merchant Wholesalers, Durable Goods - 2.6% | | | |
| | 133 | | | KLA-Tencor Corp. | | | 42,088 | | |
Merchant Wholesalers, Nondurable Goods - 1.7% | | | |
| | 5,100 | | | PDS Biotechnology Corp. (a) | | | 26,724 | | |
Miscellaneous Manufacturing - 1.5% | | | |
| | 1,761 | | | AngioDynamics, Inc. (a) | | | 24,813 | | |
Oil and Gas Extraction - 5.0% | | | |
| | 76,319 | | | Meta Materials, Inc. (a) | | | 80,898 | | |
Professional, Scientific, and Technical Services - 9.1% | | | |
| | 322 | | | BioNTech SE ADR (Germany) | | | 44,320 | | |
| | 10,836 | | | Liquidia Technologies, Inc. (a) | | | 52,988 | | |
| | 334 | | | Moderna, Inc. (a) | | | 50,210 | | |
| | | | 147,518 | | |
Securities, Commodity Contracts, and Other Financial Investments and Related Activities - 3.3% | | | |
| | 10,243 | | | Roivant Sciences Ltd. ADR (a) | | | 52,649 | | |
| | | | | TOTAL COMMON STOCKS
(Cost $2,012,813) | | $ | 1,612,764 | | |
Shares | | | | Fair Value | |
SHORT TERM INVESTMENTS - 0.1% | |
Money Market Funds - 0.1% | |
| | 144,050 | | | Dreyfus Government Cash
Management Institutional
Shares, 2.91% (c)(d) | | $ | 144,050 | | |
| | | TOTAL SHORT TERM
INVESTMENTS
(Cost $144,050) | | $ | 144,050 | | |
| | | TOTAL INVESTMENTS
(Cost $2,156,863) - 108.9% | | $ | 1,756,814 | | |
| | | Liabilities in Excess of
Other Assets - (8.9)% | | | (142,921 | ) | |
| | | TOTAL NET ASSETS - 100.0% | | $ | 1,613,893 | | |
Percentages are stated as a percent of net assets.
The geographic location of all investments is United States unless otherwise indicated.
(a) Non-income producing security.
(b) A portion of this security represents a security on loan.
(c) Represents annualized seven-day yield at October 31, 2022.
(d) All or a portion of this security represents an investment of securities lending collateral.
ADR - American Depository Receipt
The accompanying notes are an integral part of these financial statements.
DIREXION ANNUAL REPORT
26
Direxion NASDAQ-100® Equal Weighted Index Shares
Schedule of Investments
October 31, 2022
Shares | | | | Fair Value | |
COMMON STOCKS - 99.9% | | | |
Accommodation - 1.0% | | | |
| | 45,305 | | | Marriott International, Inc.
Class A | | $ | 7,253,784 | | |
Administrative and Support Services - 2.9% | | | |
| | 28,895 | | | Atlassian Corp. (a) | | | 5,857,884 | | |
| | 30,040 | | | Automatic Data Processing, Inc. | | | 7,260,668 | | |
| | 3,740 | | | Booking Holdings, Inc. (a) | | | 6,991,855 | | |
| | | | 20,110,407 | | |
Apparel Manufacturing - 1.0% | | | |
| | 21,061 | | | Lululemon Athletica, Inc. (a) | | | 6,929,911 | | |
Beverage and Tobacco Product Manufacturing - 3.2% | | | |
| | 188,825 | | | Keurig Dr Pepper, Inc. | | | 7,333,963 | | |
| | 80,452 | | | Monster Beverage Corp. (a) | | | 7,539,962 | | |
| | 42,035 | | | PepsiCo, Inc. | | | 7,632,715 | | |
| | | | 22,506,640 | | |
Broadcasting and Content Providers - 2.9% | | | |
| | 18,589 | | | Charter Communications, Inc. (a) | | | 6,833,688 | | |
| | 203,313 | | | Comcast Corp. Class A | | | 6,453,155 | | |
| | 1,175,650 | | | Sirius XM Holdings, Inc. (b) | | | 7,100,926 | | |
| | | | 20,387,769 | | |
Chemical Manufacturing - 7.8% | | | |
| | 30,365 | | | Amgen, Inc. | | | 8,209,178 | | |
| | 120,907 | | | AstraZeneca PLC ADR
(United Kingdom) | | | 7,110,540 | | |
| | 33,701 | | | Biogen, Inc. (a) | | | 9,552,211 | | |
| | 106,991 | | | Gilead Sciences, Inc. | | | 8,394,514 | | |
| | 9,881 | | | Regeneron Pharmaceuticals, Inc. (a) | | | 7,398,399 | | |
| | 49,417 | | | Seagen, Inc. (a) | | | 6,283,866 | | |
| | 24,227 | | | Vertex Pharmaceuticals, Inc. (a) | | | 7,558,824 | | |
| | | | 54,507,532 | | |
Clothing, Clothing Accessories, Shoe, and Jewelry Retailers - 1.0% | | | |
| | 77,777 | | | Ross Stores, Inc. | | | 7,442,481 | | |
Computer and Electronic Product Manufacturing - 17.6% | | | |
| | 91,734 | | | Advanced Micro Devices, Inc. (a) | | | 5,509,544 | | |
| | 34,137 | | | Alphabet, Inc. Class A (a) | | | 3,226,288 | | |
| | 33,864 | | | Alphabet, Inc. Class C (a) | | | 3,205,566 | | |
| | 47,007 | | | Analog Devices, Inc. | | | 6,704,138 | | |
| | 46,574 | | | Apple, Inc. | | | 7,141,657 | | |
| | 13,968 | | | Broadcom, Inc. | | | 6,566,636 | | |
| | 162,093 | | | Cisco Systems, Inc. | | | 7,363,885 | | |
| | 139,203 | | | Fortinet, Inc. (a) | | | 7,956,843 | | |
| | 20,489 | | | IDEXX Laboratories, Inc. (a) | | | 7,369,483 | | |
| | 35,123 | | | Illumina, Inc. (a) | | | 8,036,845 | | |
| | 240,035 | | | Intel Corp. | | | 6,824,195 | | |
| | 151,426 | | | Marvell Technology, Inc. | | | 6,008,584 | | |
| | 106,828 | | | Microchip Technology, Inc. | | | 6,595,561 | | |
| | 132,803 | | | Micron Technology, Inc. | | | 7,184,642 | | |
| | 53,179 | | | NVIDIA Corp. (a) | | | 7,177,570 | | |
| | 43,883 | | | NXP Semiconductors NV ADR
(Netherlands) | | | 6,410,429 | | |
Shares | | | | Fair Value | |
Computer and Electronic Product
Manufacturing (continued) | | | |
| | 56,172 | | | Qualcomm, Inc. | | $ | 6,609,198 | | |
| | 70,270 | | | Skyworks Solutions, Inc. | | | 6,043,923 | | |
| | 42,470 | | | Texas Instruments, Inc. | | | 6,821,956 | | |
| | | | 122,756,943 | | |
Computing Infrastructure Providers, Data Processing, Web Hosting, and Related Services - 1.0% | | | |
| | 67,741 | | | Fiserv, Inc. (a) | | | 6,959,710 | | |
Food Manufacturing - 2.1% | | | |
| | 116,395 | | | Mondelez International, Inc. | | | 7,155,965 | | |
| | 202,207 | | | The Kraft Heinz Co. | | | 7,778,903 | | |
| | | | 14,934,868 | | |
Food Services and Drinking Places - 2.0% | | | |
| | 17,358 | | | Cintas Corp. | | | 7,421,413 | | |
| | 76,866 | | | Starbucks Corp. | | | 6,655,827 | | |
| | | | 14,077,240 | | |
General Merchandise Retailers - 6.4% | | | |
| | 56,817 | | | Amazon.com, Inc. (a) | | | 5,820,334 | | |
| | 13,922 | | | Costco Wholesale Corp. | | | 6,981,883 | | |
| | 49,455 | | | Dollar Tree, Inc. (a) | | | 7,838,618 | | |
| | 167,110 | | | eBay, Inc. | | | 6,657,662 | | |
| | 126,759 | | | JD.com, Inc. ADR (China) | | | 4,726,843 | | |
| | 7,636 | | | MercadoLibre, Inc. (a) | | | 6,884,770 | | |
| | 106,886 | | | Pinduoduo, Inc. ADR (China) (a) | | | 5,860,559 | | |
| | | | 44,770,669 | | |
Health and Personal Care Stores - 1.1% | | | |
| | 204,804 | | | Walgreens Boots Alliance, Inc. | | | 7,475,346 | | |
Machinery Manufacturing - 3.0% | | | |
| | 78,976 | | | Applied Materials, Inc. | | | 6,972,791 | | |
| | 15,021 | | | ASML Holding NV ADR
(Netherlands) | | | 7,096,221 | | |
| | 17,151 | | | Lam Research Corp. | | | 6,942,382 | | |
| | | | 21,011,394 | | |
Merchant Wholesalers, Durable Goods - 3.0% | | | |
| | 63,747 | | | Copart, Inc. (a) | | | 7,332,180 | | |
| | 148,190 | | | Fastenal Co. | | | 7,162,023 | | |
| | 20,918 | | | KLA-Tencor Corp. | | | 6,619,501 | | |
| | | | 21,113,704 | | |
Miscellaneous Manufacturing - 3.3% | | | |
| | 28,185 | | | Align Technology, Inc. (a) | | | 5,476,346 | | |
| | 77,907 | | | DexCom, Inc. (a) | | | 9,409,607 | | |
| | 34,026 | | | Intuitive Surgical, Inc. (a) | | | 8,386,388 | | |
| | | | 23,272,341 | | |
Motion Picture and Sound Recording Industries - 1.2% | | | |
| | 29,229 | | | Netflix, Inc. (a) | | | 8,531,361 | | |
Motor Vehicle and Parts Dealers - 1.2% | | | |
| | 10,120 | | | O'Reilly Automotive, Inc. (a) | | | 8,472,160 | | |
Performing Arts, Spectator Sports, and Related Industries - 2.0% | | | |
| | 92,326 | | | Activision Blizzard, Inc. | | | 6,721,333 | | |
| | 57,659 | | | Electronic Arts, Inc. | | | 7,262,727 | | |
| | | | 13,984,060 | | |
The accompanying notes are an integral part of these financial statements.
DIREXION ANNUAL REPORT
27
Direxion NASDAQ-100® Equal Weighted Index Shares
Schedule of Investments, continued
October 31, 2022
Shares | | | | Fair Value | |
Professional, Scientific, and Technical Services - 11.2% | | | |
| | 56,743 | | | Baidu, Inc. ADR (China) (a) | | $ | 4,344,812 | | |
| | 112,840 | | | Cognizant Technology
Solutions Corp. Class A | | | 7,024,290 | | |
| | 126,759 | | | Match Group, Inc. (a) | | | 5,475,989 | | |
| | 47,977 | | | Meta Platforms, Inc. (a) | | | 4,469,537 | | |
| | 50,956 | | | Moderna, Inc. (a) | | | 7,660,215 | | |
| | 118,940 | | | Okta, Inc. (a) | | | 6,674,913 | | |
| | 40,316 | | | Palto Alto Networks, Inc. (a) | | | 6,917,822 | | |
| | 58,425 | | | Paychex, Inc. | | | 6,912,262 | | |
| | 40,099 | | | VeriSign, Inc. (a) | | | 8,038,246 | | |
| | 38,056 | | | Verisk Analytics, Inc. Class A | | | 6,957,778 | | |
| | 46,088 | | | Workday, Inc. (a) | | | 7,181,432 | | |
| | 41,410 | | | Zscaler, Inc. (a) | | | 6,381,281 | | |
| | | | 78,038,577 | | |
Publishing Industries - 10.5% | | | |
| | 23,434 | | | Adobe Systems, Inc. (a) | | | 7,463,729 | | |
| | 29,154 | | | ANSYS, Inc. (a) | | | 6,447,699 | | |
| | 35,999 | | | Autodesk, Inc. (a) | | | 7,714,586 | | |
| | 42,726 | | | Cadence Design Systems, Inc. (a) | | | 6,468,289 | | |
| | 41,043 | | | CrowdStrike Holdings, Inc. (a) | | | 6,616,132 | | |
| | 76,917 | | | Datadog, Inc. (a) | | | 6,192,588 | | |
| | 124,048 | | | DocuSign, Inc. (a) | | | 5,991,518 | | |
| | 16,593 | | | Intuit, Inc. | | | 7,093,507 | | |
| | 28,678 | | | Microsoft Corp. | | | 6,657,024 | | |
| | 77,306 | | | Splunk, Inc. (a) | | | 6,424,902 | | |
| | 22,337 | | | Synopsys, Inc. (a) | | | 6,534,689 | | |
| | | | 73,604,663 | | |
Rail Transportation - 1.0% | | | |
| | 238,000 | | | CSX Corp. | | | 6,916,280 | | |
Rental and Leasing Services - 0.9% | | | |
| | 59,104 | | | Airbnb, Inc. (a) | | | 6,318,809 | | |
Securities, Commodity Contracts, and Other Financial Investments and Related Activities - 0.9% | | | |
| | 433,785 | | | Lucid Group, Inc. (a)(b) | | | 6,198,788 | | |
Specialty Trade Contractors - 0.7% | | | |
| | 84,858 | | | NetEase.com, Inc. ADR (China) (a) | | | 4,719,802 | | |
Telecommunications - 3.0% | | | |
| | 74,666 | | | PayPal Holdings, Inc. (a) | | | 6,240,584 | | |
| | 50,151 | | | T-Mobile US, Inc. (a) | | | 7,600,886 | | |
| | 89,205 | | | Zoom Video Communications,
Inc. (a) | | | 7,443,265 | | |
| | | | 21,284,735 | | |
Transportation Equipment Manufacturing - 3.1% | | | |
| | 39,575 | | | Honeywell International, Inc. | | | 8,074,091 | | |
| | 82,436 | | | Paccar, Inc. | | | 7,982,278 | | |
| | 23,137 | | | Tesla Motors, Inc. (a) | | | 5,264,593 | | |
| | | | 21,320,962 | | |
Truck Transportation - 1.1% | | | |
| | 27,629 | | | Old Dominion Freight Line, Inc. | | | 7,586,923 | | |
Shares | | | | Fair Value | |
Utilities - 3.8% | | | |
| | 69,935 | | | American Electric Power Co., Inc. | | $ | 6,148,685 | | |
| | 82,022 | | | Constellation Energy Corp. | | | 7,754,360 | | |
| | 162,439 | | | Exelon Corp. | | | 6,268,521 | | |
| | 94,974 | | | Xcel Energy, Inc. | | | 6,183,757 | | |
| | | | 26,355,323 | | |
| | | | | TOTAL COMMON STOCKS
(Cost $806,517,465) | | $ | 698,843,182 | | |
SHORT TERM INVESTMENTS - 1.9% | | | |
Money Market Funds - 1.9% | | | |
| | 13,201,004 | | | Dreyfus Government Cash
Management Institutional
Shares, 2.91% (c)(d) | | $ | 13,201,004 | | |
| | | | | TOTAL SHORT TERM
INVESTMENTS
(Cost $13,201,004) | | $ | 13,201,004 | | |
| | | | | TOTAL INVESTMENTS
(Cost $819,718,469) - 101.8% | | $ | 712,044,186 | | |
| | | | | Liabilities in Excess of
Other Assets - (1.8)% | | | (12,368,168 | ) | |
| | | | | TOTAL NET ASSETS - 100.0% | | $ | 699,676,018 | | |
Percentages are stated as a percent of net assets.
The geographic location of all investments is United States unless otherwise indicated.
(a) Non-income producing security.
(b) A portion of this security represents a security on loan.
(c) Represents annualized seven-day yield at October 31, 2022.
(d) All or a portion of this security represents an investment of securities lending collateral.
ADR - American Depository Receipt
The accompanying notes are an integral part of these financial statements.
DIREXION ANNUAL REPORT
28
Direxion Work From Home ETF
Schedule of Investments
October 31, 2022
Shares | | | | Fair Value | |
COMMON STOCKS - 99.7% | | | |
Administrative and Support Services - 6.7% | | | |
| | 11,654 | | | Alibaba Group Holding Ltd. ADR (a) | | $ | 740,961 | | |
| | 4,485 | | | Atlassian Corp. (a) | | | 909,244 | | |
| | 41,085 | | | SentinelOne, Inc. (a) | | | 938,382 | | |
| | | | 2,588,587 | | |
Computer and Electronic Product Manufacturing - 21.0% | | | |
| | 9,647 | | | Alphabet, Inc. Class A (a) | | | 911,738 | | |
| | 520,142 | | | Avaya Holdings Corp. (a)(b) | | | 821,824 | | |
| | 2,090 | | | Broadcom, Inc. | | | 982,551 | | |
| | 23,454 | | | Cisco Systems, Inc. | | | 1,065,515 | | |
| | 20,929 | | | Fortinet, Inc. (a) | | | 1,196,302 | | |
| | 8,268 | | | International Business
Machines Corp. | | | 1,143,382 | | |
| | 22,581 | | | Marvell Technology, Inc. | | | 896,014 | | |
| | 14,935 | | | NetApp, Inc. | | | 1,034,547 | | |
| | | | 8,051,873 | | |
Data Processing, Hosting and Related Services - 5.0% | | | |
| | 24,647 | | | RingCentral, Inc. (a) | | | 875,461 | | |
| | 9,132 | | | VMware, Inc. | | | 1,027,624 | | |
| | | | 1,903,085 | | |
Electronics and Appliance Stores - 2.9% | | | |
| | 31,519 | | | Smartsheet, Inc. (a) | | | 1,100,644 | | |
Management of Companies and Enterprises - 3.0% | | | |
| | 60,718 | | | America Movil SAB de CV
Series L ADR (Mexico) | | | 1,142,106 | | |
Nonstore Retailers - 2.2% | | | |
| | 8,155 | | | Amazon.com, Inc. (a) | | | 835,398 | | |
Professional, Scientific, and Technical Services - 23.3% | | | |
| | 6,583 | | | Meta Platforms, Inc. (a) | | | 613,272 | | |
| | 46,991 | | | Nutanix, Inc. (a) | | | 1,287,553 | | |
| | 17,256 | | | Okta, Inc. (a) | | | 968,407 | | |
| | 5,866 | | | Palto Alto Networks, Inc. (a) | | | 1,006,547 | | |
| | 221,825 | | | Rackspace Technology, Inc. (a)(b) | | | 1,142,399 | | |
| | 2,377 | | | ServiceNow, Inc. (a) | | | 1,000,099 | | |
| | 91,896 | | | Sprinklr, Inc. (a) | | | 850,038 | | |
| | 6,370 | | | Workday, Inc. (a) | | | 992,573 | | |
| | 7,148 | | | Zscaler, Inc. (a) | | | 1,101,507 | | |
| | | | 8,962,395 | | |
Publishing Industries (except Internet) - 30.4% | | | |
| | 2,781 | | | Adobe Systems, Inc. (a) | | | 885,748 | | |
| | 263,972 | | | Agora, Inc. ADR (a) | | | 736,482 | | |
| | 40,316 | | | Box, Inc. (a) | | | 1,171,180 | | |
| | 6,140 | | | CrowdStrike Holdings, Inc. (a) | | | 989,768 | | |
| | 7,410 | | | CyberArk Software Ltd. ADR
(Israel) (a) | | | 1,162,703 | | |
| | 19,149 | | | DocuSign, Inc. (a) | | | 924,897 | | |
| | 1,291,133 | | | Exela Technologies, Inc. (a) | | | 306,644 | | |
| | 4,091 | | | Microsoft Corp. | | | 949,644 | | |
| | 14,175 | | | Oracle Corp. | | | 1,106,642 | | |
| | 22,596 | | | Progress Software Corp. | | | 1,153,074 | | |
| | 6,889 | | | Salesforce.com, Inc. (a) | | | 1,120,082 | | |
| | 15,551 | | | Twilio, Inc. (a) | | | 1,156,528 | | |
| | | | 11,663,392 | | |
Shares | | | | Fair Value | |
Telecommunications - 5.2% | | | |
| | 219,977 | | | 8x8, Inc. (a) | | $ | 930,503 | | |
| | 13,032 | | | Zoom Video Communications,
Inc. (a) | | | 1,087,390 | | |
| | | | 2,017,893 | | |
| | | | | TOTAL COMMON STOCKS
(Cost $58,862,058) | | $ | 38,265,373 | | |
SHORT TERM INVESTMENTS - 1.7% | | | |
Money Market Funds - 1.7% | | | |
| | 654,039 | | | Dreyfus Government Cash
Management Institutional
Shares, 2.91% (c)(d) | | $ | 654,039 | | |
| | | | | TOTAL SHORT TERM
INVESTMENTS
(Cost $654,039) | | $ | 654,039 | | |
| | | | | TOTAL INVESTMENTS
(Cost $59,516,097) - 101.4% | | $ | 38,919,412 | | |
| | | | | Liabilities in Excess of
Other Assets - (1.4)% | | | (548,614 | ) | |
| | | | | TOTAL NET ASSETS - 100.0% | | $ | 38,370,798 | | |
Percentages are stated as a percent of net assets.
The geographic location of all investments is United States unless otherwise indicated.
(a) Non-income producing security.
(b) A portion of this security represents a security on loan.
(c) Represents annualized seven-day yield at October 31, 2022.
(d) All or a portion of this security represents an investment of securities lending collateral.
ADR - American Depository Receipt
The accompanying notes are an integral part of these financial statements.
DIREXION ANNUAL REPORT
29
Statements of Assets and Liabilities
October 31, 2022
| | | Direxion Auspice
Broad Commodity
Strategy ETF
(Consolidated) | | Direxion Breakfast
Commodities
Strategy ETF
(Consolidated) | | Direxion
Hydrogen ETF | | Direxion
Moonshot
Innovators ETF | |
Assets: | |
Investments, at fair value (including
securities loaned*) (Note 2) | | $ | 301,128,639 | | | $ | 6,273,596 | | | $ | 25,830,689 | | | $ | 43,906,384 | | |
Cash held in foreign currency, at value | | | — | | | | — | | | | 1 | | | | — | | |
Receivable for investments sold | | | — | | | | — | | | | 4,453,680 | | | | — | | |
Deposit at broker for futures contracts | | | — | | | | 492,562 | | | | — | | | | — | | |
Dividend and interest receivable | | | 730,826 | | | | 15,182 | | | | 64,088 | | | | 23,863 | | |
Tax reclaim receivable | | | — | | | | — | | | | 14,301 | | | | — | | |
Variation margin receivable, net | | | — | | | | 117,129 | | | | — | | | | — | | |
Prepaid expenses and other assets | | | 89,602 | | | | — | | | | — | | | | — | | |
Total Assets | | | 301,949,067 | | | | 6,898,469 | | | | 30,362,759 | | | | 43,930,247 | | |
Liabilities: | |
Collateral for securities loaned (Note 2) | | | — | | | | — | | | | 3,681,644 | | | | 6,137,963 | | |
Payable for Fund shares redeemed | | | 4,480,099 | | | | — | | | | — | | | | — | | |
Payable for investments purchased | | | — | | | | — | | | | 4,533,952 | | | | — | | |
Due to Adviser (Note 6) | | | 129,401 | | | | 2,904 | | | | 7,545 | | | | 18,909 | | |
Due to broker for futures contracts | | | — | | | | 24,381 | | | | — | | | | — | | |
Accrued operating services fees (Note 6) | | | 51,761 | | | | 1,161 | | | | 943 | | | | 1,576 | | |
Total Liabilities | | | 4,661,261 | | | | 28,446 | | | | 8,224,084 | | | | 6,158,448 | | |
Net Assets | | $ | 297,287,806 | | | $ | 6,870,023 | | | $ | 22,138,675 | | | $ | 37,771,799 | | |
Net Assets Consist of: | |
Capital stock | | $ | 290,276,682 | | | $ | 6,824,850 | | | $ | 41,409,164 | | | $ | 169,869,372 | | |
Total distributable earnings (loss) | | | 7,011,124 | | | | 45,173 | | | | (19,270,489 | ) | | | (132,097,573 | ) | |
Net Assets | | $ | 297,287,806 | | | $ | 6,870,023 | | | $ | 22,138,675 | | | $ | 37,771,799 | | |
Calculation of Net Asset Value Per Share: | |
Net assets | | $ | 297,287,806 | | | $ | 6,870,023 | | | $ | 22,138,675 | | | $ | 37,771,799 | | |
Shares outstanding (unlimited shares
of beneficial interest authorized,
par value) | | | 9,950,001 | | | | 300,001 | | | | 1,700,002 | | | | 2,875,001 | | |
Net assets value, redemption price
and offering price per share | | $ | 29.88 | | | $ | 22.90 | | | $ | 13.02 | | | $ | 13.14 | | |
Cost of Investments | | $ | 301,128,639 | | | $ | 6,273,596 | | | $ | 39,649,466 | | | $ | 72,339,457 | | |
* Securities loaned with values of $–, $–, $3,717,220 and $5,903,311, respectively. See Note 2.
The accompanying notes are an integral part of these financial statements.
DIREXION ANNUAL REPORT
30
Statements of Assets and Liabilities
October 31, 2022
| | | Direxion
mRNA ETF | | Direxion
Nanotechnology
ETF | | Direxion
NASDAQ-100®
Equal Weighted
Index Shares | | Direxion
Work From
Home ETF | |
Assets: | |
Investments, at fair value (including
securities loaned*) (Note 2) | | $ | 3,544,609 | | | $ | 1,756,814 | | | $ | 712,044,186 | | | $ | 38,919,412 | | |
Receivable for investments sold | | | 111,409 | | | | — | | | | — | | | | — | | |
Dividend and interest receivable | | | 7 | | | | 504 | | | | 166,010 | | | | 44,198 | | |
Tax reclaim receivable | | | 440 | | | | 60 | | | | — | | | | — | | |
Total Assets | | | 3,656,465 | | | | 1,757,378 | | | | 712,210,196 | | | | 38,963,610 | | |
Liabilities: | |
Collateral for securities loaned (Note 2) | | | — | | | | 142,643 | | | | 12,332,927 | | | | 578,552 | | |
Payable for investments purchased | | | 104,311 | | | | — | | | | — | | | | — | | |
Due to Adviser (Note 6) | | | 1,726 | | | | 777 | | | | 172,501 | | | | 12,675 | | |
Accrued operating services fees (Note 6) | | | 144 | | | | 65 | | | | 28,750 | | | | 1,585 | | |
Total Liabilities | | | 106,181 | | | | 143,485 | | | | 12,534,178 | | | | 592,812 | | |
Net Assets | | $ | 3,550,284 | | | $ | 1,613,893 | | | $ | 699,676,018 | | | $ | 38,370,798 | | |
Net Assets Consist of: | |
Capital stock | | $ | 5,418,958 | | | $ | 2,499,372 | | | $ | 825,297,494 | | | $ | 63,615,329 | | |
Total distributable loss | | | (1,868,674 | ) | | | (885,479 | ) | | | (125,621,476 | ) | | | (25,244,531 | ) | |
Net Assets | | $ | 3,550,284 | | | $ | 1,613,893 | | | $ | 699,676,018 | | | $ | 38,370,798 | | |
Calculation of Net Asset Value Per Share: | |
Net assets | | $ | 3,550,284 | | | $ | 1,613,893 | | | $ | 699,676,018 | | | $ | 38,370,798 | | |
Shares outstanding (unlimited shares
of beneficial interest authorized,
par value) | | | 250,001 | | | | 100,001 | | | | 10,950,002 | | | | 875,001 | | |
Net assets value, redemption price
and offering price per share | | $ | 14.20 | | | $ | 16.14 | | | $ | 63.90 | | | $ | 43.85 | | |
Cost of Investments | | $ | 4,051,295 | | | $ | 2,156,863 | | | $ | 819,718,469 | | | $ | 59,516,097 | | |
* Securities loaned with values of $–, $132,007, $12,864,473 and $564,151, respectively. See Note 2.
The accompanying notes are an integral part of these financial statements.
DIREXION ANNUAL REPORT
31
Statements of Operations
For the Year Ended October 31, 2022
| | | Direxion Auspice
Broad Commodity
Strategy ETF
(Consolidated) | | Direxion Breakfast
Commodities
Strategy ETF
(Consolidated)1 | | Direxion
Hydrogen ETF | | Direxion
Moonshot
Innovators ETF | |
Investment Income: | |
Dividend income (net of foreign
withholding tax of $—, $—,
$61,328 and $—, respectively) | | $ | — | | | $ | — | | | $ | 386,108 | | | $ | 82,811 | | |
Interest income | | | 3,050,423 | | | | 49,295 | | | | 1,642 | | | | 1,392 | | |
Securities lending income | | | — | | | | — | | | | 139,766 | | | | 800,492 | | |
Foreign currency income | | | — | | | | — | | | | 3 | | | | — | | |
Total investment income | | | 3,050,423 | | | | 49,295 | | | | 527,519 | | | | 884,695 | | |
Expenses: | |
Investment advisory fees (Note 6) | | | 1,687,406 | | | | 13,292 | | | | 129,840 | | | | 411,830 | | |
Operating services fees (Note 6) | | | 674,962 | | | | 5,316 | | | | 16,230 | | | | 34,319 | | |
Excise tax | | | 576,794 | | | | — | | | | — | | | | — | | |
Total Expenses | | | 2,939,162 | | | | 18,608 | | | | 146,070 | | | | 446,149 | | |
Net investment income | | | 111,261 | | | | 30,687 | | | | 381,449 | | | | 438,546 | | |
Net realized and unrealized gain
(loss) on investments: | |
Net realized gain (loss) on: | |
Investment securities | | | — | | | | — | | | | (5,243,620 | ) | | | (74,884,626 | ) | |
Foreign currency translation | | | — | | | | — | | | | (76,530 | ) | | | — | | |
In-kind redemptions | | | — | | | | — | | | | (160,863 | ) | | | (9,024,041 | ) | |
Futures contracts | | | 27,202,526 | | | | (461,604 | ) | | | — | | | | — | | |
Net realized gain (loss) | | | 27,202,526 | | | | (461,604 | ) | | | (5,481,013 | ) | | | (83,908,667 | ) | |
Change in net unrealized
appreciation (depreciation) on:
Investment securities | | | — | | | | — | | | | (15,185,112 | ) | | | 7,934,248 | | |
Foreign currency translation | | | — | | | | — | | | | (2,416 | ) | | | — | | |
Futures contracts | | | (15,322,256 | ) | | | 33,349 | | | | — | | | | — | | |
Change in net unrealized appreciation
(depreciation) | | | (15,322,256 | ) | | | 33,349 | | | | (15,187,528 | ) | | | 7,934,248 | | |
Net realized and unrealized gain (loss) | | | 11,880,270 | | | | (428,255 | ) | | | (20,668,541 | ) | | | (75,974,419 | ) | |
Net increase (decrease) in net assets
resulting from operations | | $ | 11,991,531 | | | $ | (397,568 | ) | | $ | (20,287,092 | ) | | $ | (75,535,873 | ) | |
1 Represents the period from June 1, 2022 (commencement of operations) to October 31, 2022.
The accompanying notes are an integral part of these financial statements.
DIREXION ANNUAL REPORT
32
Statements of Operations
For the Year Ended October 31, 2022
| | | Direxion
mRNA ETF2 | | Direxion
Nanotechnology
ETF1 | | Direxion
NASDAQ-100®
Equal Weighted
Index Shares | | Direxion
Work From
Home ETF | |
Investment Income: | |
Dividend income (net of foreign
withholding tax of $617, $79,
$26,612 and $—, respectively) | | $ | 3,253 | | | $ | 5,377 | | | $ | 6,091,021 | | | $ | 1,003,045 | | |
Interest income | | | 55 | | | | 19 | | | | 7,830 | | | | 1,085 | | |
Securities lending income | | | 12,316 | | | | 4,917 | | | | 558,842 | | | | 17,496 | | |
Total investment income | | | 15,624 | | | | 10,313 | | | | 6,657,693 | | | | 1,021,626 | | |
Expenses: | |
Investment advisory fees (Note 6) | | | 18,843 | | | | 10,122 | | | | 1,813,827 | | | | 274,253 | | |
Operating services fees (Note 6) | | | 1,570 | | | | 844 | | | | 302,305 | | | | 34,281 | | |
Total Expenses | | | 20,413 | | | | 10,966 | | | | 2,116,132 | | | | 308,534 | | |
Net investment income (loss) | | | (4,789 | ) | | | (653 | ) | | | 4,541,561 | | | | 713,092 | | |
Net realized and unrealized gain
(loss) on investments: | |
Net realized gain (loss) on: | |
Investment securities | | | (1,358,364 | ) | | | (485,430 | ) | | | (25,375,389 | ) | | | (5,159,199 | ) | |
In-kind redemptions | | | — | | | | — | | | | 109,152,483 | | | | 3,232,484 | | |
Net realized gain (loss) | | | (1,358,364 | ) | | | (485,430 | ) | | | 83,777,094 | | | | (1,926,715 | ) | |
Change in net unrealized
appreciation (depreciation) on:
Investment securities | | | (506,686 | ) | | | (400,049 | ) | | | (227,222,717 | ) | | | (37,909,503 | ) | |
Change in net unrealized appreciation
(depreciation) | | | (506,686 | ) | | | (400,049 | ) | | | (227,222,717 | ) | | | (37,909,503 | ) | |
Net realized and unrealized loss | | | (1,865,050 | ) | | | (885,479 | ) | | | (143,445,623 | ) | | | (39,836,218 | ) | |
Net decrease in net assets
resulting from operations | | $ | (1,869,839 | ) | | $ | (886,132 | ) | | $ | (138,904,062 | ) | | $ | (39,123,126 | ) | |
1 Represents the period from November 23, 2021 (commencement of operations) to October 31, 2022.
2 Represents the period from December 9, 2021 (commencement of operations) to October 31, 2022.
The accompanying notes are an integral part of these financial statements.
DIREXION ANNUAL REPORT
33
Statements of Changes in Net Assets
| | | Direxion Auspice Broad Commodity
Strategy ETF (Consolidated) | | Direxion Breakfast
Commodities Strategy
ETF (Consolidated) | |
| | |
Year Ended
October 31, 2022 | |
Year Ended
October 31, 2021 | | For the Period
June 1, 20221
through
October 31, 2022 | |
Operations: | |
Net investment income (loss) | | $ | 111,261 | | | $ | (985,938 | ) | | $ | 30,687 | | |
Net realized gain (loss) | | | 27,202,526 | | | | 26,159,862 | | | | (461,604 | ) | |
Change in net unrealized appreciation (depreciation) | | | (15,322,256 | ) | | | 14,721,431 | | | | 33,349 | | |
Net increase (decrease) in net assets resulting from operations | | | 11,991,531 | | | | 39,895,355 | | | | (397,568 | ) | |
Distributions to shareholders: | |
Net distributions to shareholders | | | (45,900,192 | ) | | | — | | | | (15,661 | ) | |
Total distributions | | | (45,900,192 | ) | | | — | | | | (15,661 | ) | |
Capital share transactions: | |
Proceeds from shares sold | | | 189,709,720 | | | | 184,462,965 | | | | 7,283,024 | | |
Cost of shares redeemed | | | (112,074,283 | ) | | | (14,894,665 | ) | | | — | | |
Transaction fees (Note 4) | | | 130,092 | | | | 21,425 | | | | 228 | | |
Net increase in net assets resulting from capital transactions | | | 77,765,529 | | | | 169,589,725 | | | | 7,283,252 | | |
Total increase in net assets | | | 43,856,868 | | | | 209,485,080 | | | | 6,870,023 | | |
Net assets: | |
Beginning of year/period | | | 253,430,938 | | | | 43,945,858 | | | | — | | |
End of year/period | | $ | 297,287,806 | | | $ | 253,430,938 | | | $ | 6,870,023 | | |
Changes in shares outstanding | |
Shares outstanding, beginning of year/period | | | 7,750,001 | | | | 1,900,001 | | | | — | | |
Shares sold | | | 5,850,000 | | | | 6,350,000 | | | | 300,001 | | |
Shares repurchased | | | (3,650,000 | ) | | | (500,000 | ) | | | — | | |
Shares outstanding, end of year/period | | | 9,950,001 | | | | 7,750,001 | | | | 300,001 | | |
1 Commencement of operations.
The accompanying notes are an integral part of these financial statements.
DIREXION ANNUAL REPORT
34
Statements of Changes in Net Assets
| | | Direxion Hydrogen ETF | | Direxion Moonshot Innovators ETF | |
| | | Year Ended
October 31, 2022 | | For the Period
March 25, 20211
through
October 31, 2021 | | Year Ended
October 31, 2022 | | For the Period
November 12, 20201
through
October 31, 2021 | |
Operations: | |
Net investment income | | $ | 381,449 | | | $ | 237,351 | | | $ | 438,546 | | | $ | 1,076,890 | | |
Net realized loss | | | (5,481,013 | ) | | | (509,003 | ) | | | (83,908,667 | ) | | | (22,705,046 | ) | |
Change in net unrealized appreciation
(depreciation) | | | (15,187,528 | ) | | | 1,365,039 | | | | 7,934,248 | | | | (36,367,321 | ) | |
Net increase (decrease) in net assets resulting
from operations | | | (20,287,092 | ) | | | 1,093,387 | | | | (75,535,873 | ) | | | (57,995,477 | ) | |
Distributions to shareholders: | |
Net distributions to shareholders | | | (399,661 | ) | | | (127,435 | ) | | | (953,134 | ) | | | (680,526 | ) | |
Return of capital | | | (15,230 | ) | | | — | | | | (193,011 | ) | | | — | | |
Total distributions | | | (414,891 | ) | | | (127,435 | ) | | | (1,146,145 | ) | | | (680,526 | ) | |
Capital share transactions: | |
Proceeds from shares sold | | | 14,001,030 | | | | 40,248,269 | | | | 17,599,599 | | | | 383,639,876 | | |
Cost of shares redeemed | | | (12,374,593 | ) | | | — | | | | (54,961,093 | ) | | | (173,148,562 | ) | |
Net increase (decrease) in net assets resulting
from capital transactions | | | 1,626,437 | | | | 40,248,269 | | | | (37,361,494 | ) | | | 210,491,314 | | |
Total increase (decrease) in net assets | | | (19,075,546 | ) | | | 41,214,221 | | | | (114,043,512 | ) | | | 151,815,311 | | |
Net assets: | |
Beginning of year/period | | | 41,214,221 | | | | — | | | | 151,815,311 | | | | — | | |
End of year/period | | $ | 22,138,675 | | | $ | 41,214,221 | | | $ | 37,771,799 | | | $ | 151,815,311 | | |
Changes in shares outstanding | |
Shares outstanding, beginning of year/period | | | 1,700,002 | | | | — | | | | 4,500,001 | | | | — | | |
Shares sold | | | 650,000 | | | | 1,700,002 | | | | 900,000 | | | | 9,325,001 | | |
Shares repurchased | | | (650,000 | ) | | | — | | | | (2,525,000 | ) | | | (4,825,000 | ) | |
Shares outstanding, end of year/period | | | 1,700,002 | | | | 1,700,002 | | | | 2,875,001 | | | | 4,500,001 | | |
1 Commencement of operations.
The accompanying notes are an integral part of these financial statements.
DIREXION ANNUAL REPORT
35
Statements of Changes in Net Assets
| | | Direxion
mRNA ETF | | Direxion
Nanotechnology ETF | |
| | | For the Period
December 9, 20211
through
October 31, 2022 | | For the Period
November 23, 20211
through
October 31, 2022 | |
Operations: | |
Net investment loss | | $ | (4,789 | ) | | $ | (653 | ) | |
Net realized loss | | | (1,358,364 | ) | | | (485,430 | ) | |
Change in net unrealized depreciation | | | (506,686 | ) | | | (400,049 | ) | |
Net decrease in net assets resulting from operations | | | (1,869,839 | ) | | | (886,132 | ) | |
Distributions to shareholders: | |
Net distributions to shareholders | | | — | | | | — | | |
Total distributions | | | — | | | | — | | |
Capital share transactions: | |
Proceeds from shares sold | | | 5,419,623 | | | | 2,500,025 | | |
Cost of shares redeemed | | | — | | | | — | | |
Transaction fees (Note 4) | | | 500 | | | | — | | |
Net increase in net assets resulting from capital transactions | | | 5,420,123 | | | | 2,500,025 | | |
Total increase in net assets | | | 3,550,284 | | | | 1,613,893 | | |
Net assets: | |
Beginning of period | | | — | | | | — | | |
End of period | | $ | 3,550,284 | | | $ | 1,613,893 | | |
Changes in shares outstanding | |
Shares outstanding, beginning of period | | | — | | | | — | | |
Shares sold | | | 250,001 | | | | 100,001 | | |
Shares repurchased | | | — | | | | — | | |
Shares outstanding, end of period | | | 250,001 | | | | 100,001 | | |
1 Commencement of operations.
The accompanying notes are an integral part of these financial statements.
DIREXION ANNUAL REPORT
36
Statements of Changes in Net Assets
| | | Direxion NASDAQ-100®
Equal Weighted Index Shares | | Direxion Work From Home ETF | |
| | | Year Ended
October 31, 2022 | | Year Ended
October 31, 2021 | | Year Ended
October 31, 2022 | | Year Ended
October 31, 2021 | |
Operations: | |
Net investment income | | $ | 4,541,561 | | | $ | 1,862,366 | | | $ | 713,092 | | | $ | 410,492 | | |
Net realized gain (loss) | | | 83,777,094 | | | | 41,329,702 | | | | (1,926,715 | ) | | | 35,124,597 | | |
Change in net unrealized appreciation
(depreciation) | | | (227,222,717 | ) | | | 71,501,564 | | | | (37,909,503 | ) | | | 16,725,812 | | |
Net increase (decrease) in net assets resulting
from operations | | | (138,904,062 | ) | | | 114,693,632 | | | | (39,123,126 | ) | | | 52,260,901 | | |
Distributions to shareholders: | |
Net distributions to shareholders | | | (18,877,170 | ) | | | (2,011,608 | ) | | | (723,713 | ) | | | (1,572,820 | ) | |
Total distributions | | | (18,877,170 | ) | | | (2,011,608 | ) | | | (723,713 | ) | | | (1,572,820 | ) | |
Capital share transactions: | |
Proceeds from shares sold | | | 995,342,941 | | | | 96,387,917 | | | | 1,987,577 | | | | 31,133,230 | | |
Cost of shares redeemed | | | (570,149,865 | ) | | | (51,005,012 | ) | | | (34,259,716 | ) | | | (104,409,325 | ) | |
Net increase (decrease) in net assets resulting
from capital transactions | | | 425,193,076 | | | | 45,382,905 | | | | (32,272,139 | ) | | | (73,276,095 | ) | |
Total increase (decrease) in net assets | | | 267,411,844 | | | | 158,064,929 | | | | (72,118,978 | ) | | | (22,588,014 | ) | |
Net assets: | |
Beginning of year | | | 432,264,174 | | | | 274,199,245 | | | | 110,489,776 | | | | 133,077,790 | | |
End of year | | $ | 699,676,018 | | | $ | 432,264,174 | | | $ | 38,370,798 | | | $ | 110,489,776 | | |
Changes in shares outstanding | |
Shares outstanding, beginning of year | | | 4,950,002 | | | | 4,350,002 | | | | 1,425,001 | | | | 2,475,001 | | |
Shares sold | | | 14,200,000 | | | | 1,250,000 | | | | 25,000 | | | | 475,000 | | |
Shares repurchased | | | (8,200,000 | ) | | | (650,000 | ) | | | (575,000 | ) | | | (1,525,000 | ) | |
Shares outstanding, end of year | | | 10,950,002 | | | | 4,950,002 | | | | 875,001 | | | | 1,425,001 | | |
The accompanying notes are an integral part of these financial statements.
DIREXION ANNUAL REPORT
37
Financial Highlights
October 31, 2022
| | | | | RATIOS TO AVERAGE NET ASSETS5 | | | |
| | | Net Asset
Value,
Beginning
of Year/
Period | | Net
Investment
Income
(Loss)1 | | Net
Investment
Income
(Loss)1,2 | | Net Realized
and Unrealized
Gain (Loss)
on Investments3 | | Net Increase
(Decrease) in
Net Asset
Value Resulting
from Operations | | Dividends
from Net
Investment
Income | | Distributions
from
Realized
Capital Gains | | Distributions
from
Return
of Capital | | Total
Distributions | | Net
Asset
Value,
End of
Year/
Period | | Total
Return4 | | Net
Assets,
End of
Year/
Period
(000's
omitted) | | Net
Expenses6 | | Total
Expenses | | Net Investment
Income (Loss)
After Expense
Reimbursement | | Net
Expenses2,6 | | Total
Expenses2 | | Net Investment
Income (Loss)
After Expense
Reimbursement2 | | Portfolio
Turnover
Rate7 | |
Direxion Auspice Broad Commodity Strategy ETF (Consolidated) | |
For the Year Ended October 31, 2022 | | $ | 32.70 | | | $ | 0.01 | | | $ | 0.06 | | | $ | 1.85 | | | $ | 1.86 | | | $ | (4.68 | ) | | $ | — | | | $ | — | | | $ | (4.68 | ) | | $ | 29.88 | | | | 6.21 | % | | $ | 297,288 | | | | 0.87 | % | | | 0.87 | % | | | 0.03 | % | | | 0.70 | % | | | 0.70 | % | | | 0.20 | % | | | 0 | % | |
| For the Year Ended October 31, 2021 | | | 23.13 | | | | (0.20 | ) | | | (0.20 | ) | | | 9.77 | | | | 9.57 | | | | — | | | | — | | | | — | | | | — | | | | 32.70 | | | | 41.37 | % | | | 253,431 | | | | 0.70 | % | | | 0.70 | % | | | (0.67 | )% | | | 0.70 | % | | | 0.70 | % | | | (0.67 | )% | | | 0 | % | |
| For the Year Ended October 31, 2020 | | | 23.53 | | | | (0.02 | ) | | | (0.02 | ) | | | (0.29 | ) | | | (0.31 | ) | | | (0.06 | ) | | | — | | | | (0.03 | ) | | | (0.09 | ) | | | 23.13 | | | | -1.31 | % | | | 43,946 | | | | 0.70 | % | | | 0.70 | % | | | (0.10 | )% | | | 0.70 | % | | | 0.70 | % | | | (0.10 | )% | | | 0 | % | |
| For the Year Ended October 31, 2019 | | | 24.58 | | | | 0.35 | | | | 0.35 | | | | (0.77 | ) | | | (0.42 | ) | | | (0.63 | ) | | | — | | | | — | | | | (0.63 | ) | | | 23.53 | | | | -1.72 | % | | | 42,360 | | | | 0.70 | % | | | 0.79 | % | | | 1.47 | % | | | 0.70 | % | | | 0.79 | % | | | 1.47 | % | | | 0 | % | |
| For the Year Ended October 31, 2018 | | | 23.82 | | | | 0.20 | | | | 0.20 | | | | 0.72 | | | | 0.92 | | | | (0.16 | ) | | | — | | | | — | | | | (0.16 | ) | | | 24.58 | | | | 3.84 | % | | | 52,847 | | | | 0.70 | % | | | 0.84 | % | | | 0.80 | % | | | 0.70 | % | | | 0.84 | % | | | 0.80 | % | | | 0 | % | |
Direxion Breakfast Commodities Strategy ETF (Consolidated) | |
| For the Period June 1, 20228 through October 31, 2022 | | | 25.00 | | | | 0.11 | | | | 0.11 | | | | (2.16 | ) | | | (2.05 | ) | | | (0.05 | ) | | | — | | | | — | | | | (0.05 | ) | | | 22.90 | | | | -8.19 | % | | | 6,870 | | | | 0.70 | % | | | 0.70 | % | | | 1.15 | % | | | 0.70 | % | | | 0.70 | % | | | 1.15 | % | | | 0 | % | |
Direxion Hydrogen ETF | |
| For the Year Ended October 31, 2022 | | | 24.24 | | | | 0.21 | | | | 0.21 | | | | (11.21 | ) | | | (11.00 | ) | | | (0.21 | ) | | | — | | | | (0.01 | ) | | | (0.22 | ) | | | 13.02 | | | | -45.57 | % | | | 22,139 | | | | 0.45 | % | | | 0.45 | % | | | 1.18 | % | | | 0.45 | % | | | 0.45 | % | | | 1.18 | % | | | 37 | % | |
| For the Period March 25, 20218 through October 31, 2021 | | | 24.00 | | | | 0.16 | | | | 0.16 | | | | 0.16 | | | | 0.32 | | | | (0.08 | ) | | | — | | | | — | | | | (0.08 | ) | | | 24.24 | | | | 1.37 | % | | | 41,214 | | | | 0.45 | % | | | 0.45 | % | | | 1.21 | % | | | 0.45 | % | | | 0.45 | % | | | 1.21 | % | | | 55 | % | |
Direxion Moonshot Innovators ETF | |
| For the Year Ended October 31, 2022 | | | 33.74 | | | | 0.13 | | | | 0.13 | | | | (20.43 | ) | | | (20.30 | ) | | | (0.25 | ) | | | — | | | | (0.05 | ) | | | (0.30 | ) | | | 13.14 | | | | -60.64 | % | | | 37,772 | | | | 0.65 | % | | | 0.65 | % | | | 0.64 | % | | | 0.65 | % | | | 0.65 | % | | | 0.64 | % | | | 120 | % | |
| For the Period November 12, 20208 through October 31, 2021 | | | 25.00 | | | | 0.27 | �� | | | 0.27 | | | | 8.61 | | | | 8.88 | | | | (0.14 | ) | | | — | | | | — | | | | (0.14 | ) | | | 33.74 | | | | 35.54 | % | | | 151,815 | | | | 0.65 | % | | | 0.65 | % | | | 0.76 | % | | | 0.65 | % | | | 0.65 | % | | | 0.76 | % | | | 87 | % | |
Direxion mRNA ETF | |
| For the Period December 9, 20218 through October 31, 2022 | | | 25.00 | | | | (0.02 | ) | | | (0.02 | ) | | | (10.78 | ) | | | (10.80 | ) | | | — | | | | — | | | | — | | | | — | | | | 14.20 | | | | -43.20 | % | | | 3,550 | | | | 0.65 | % | | | 0.65 | % | | | (0.15 | )% | | | 0.65 | % | | | 0.65 | % | | | (0.15 | )% | | | 85 | % | |
Direxion Nanotechnology ETF | |
| For the Period November 23, 20218 through October 31, 2022 | | | 25.00 | | | | (0.01 | ) | | | (0.01 | ) | | | (8.85 | ) | | | (8.86 | ) | | | — | | | | — | | | | — | | | | — | | | | 16.14 | | | | -35.44 | % | | | 1,614 | | | | 0.65 | % | | | 0.65 | % | | | (0.04 | )% | | | 0.65 | % | | | 0.65 | % | | | (0.04 | )% | | | 78 | % | |
Direxion NASDAQ-100® Equal Weighted Index Shares | |
| For the Year Ended October 31, 2022 | | | 87.33 | | | | 0.53 | | | | 0.53 | | | | (20.59 | ) | | | (20.06 | ) | | | (0.50 | ) | | | (2.87 | ) | | | — | | | | (3.37 | ) | | | 63.90 | | | | -23.78 | % | | | 699,676 | | | | 0.35 | % | | | 0.35 | % | | | 0.75 | % | | | 0.35 | % | | | 0.35 | % | | | 0.75 | % | | | 34 | % | |
| For the Year Ended October 31, 2021 | | | 63.03 | | | | 0.39 | | | | 0.39 | | | | 24.33 | | | | 24.72 | | | | (0.39 | ) | | | (0.03 | ) | | | — | | | | (0.42 | ) | | | 87.33 | | | | 39.30 | % | | | 432,264 | | | | 0.35 | % | | | 0.35 | % | | | 0.49 | % | | | 0.35 | % | | | 0.35 | % | | | 0.49 | % | | | 30 | % | |
| For the Year Ended October 31, 2020 | | | 51.32 | | | | 0.38 | | | | 0.38 | | | | 11.72 | | | | 12.10 | | | | (0.39 | ) | | | — | | | | — | | | | (0.39 | ) | | | 63.03 | | | | 23.69 | % | | | 274,199 | | | | 0.35 | % | | | 0.35 | % | | | 0.67 | % | | | 0.35 | % | | | 0.35 | % | | | 0.67 | % | | | 35 | % | |
| For the Year Ended October 31, 2019 | | | 43.27 | | | | 0.39 | | | | 0.39 | | | | 8.04 | | | | 8.43 | | | | (0.38 | ) | | | — | | | | — | | | | (0.38 | ) | | | 51.32 | | | | 19.59 | % | | | 215,563 | | | | 0.35 | % | | | 0.44 | % | | | 0.82 | % | | | 0.35 | % | | | 0.44 | % | | | 0.82 | % | | | 28 | % | |
| For the Year Ended October 31, 2018 | | | 41.90 | | | | 0.31 | | | | 0.31 | | | | 1.37 | | | | 1.68 | | | | (0.31 | ) | | | — | | | | — | | | | (0.31 | ) | | | 43.27 | | | | 3.98 | % | | | 179,574 | | | | 0.35 | % | | | 0.49 | % | | | 0.68 | % | | | 0.35 | % | | | 0.49 | % | | | 0.68 | % | | | 27 | % | |
Direxion Work From Home ETF | |
| For the Year Ended October 31, 2022 | | | 77.54 | | | | 0.63 | | | | 0.63 | | | | (33.78 | ) | | | (33.15 | ) | | | (0.54 | ) | | | — | | | | — | | | | (0.54 | ) | | | 43.85 | | | | -43.00 | % | | | 38,371 | | | | 0.45 | % | | | 0.45 | % | | | 1.04 | % | | | 0.45 | % | | | 0.45 | % | | | 1.04 | % | | | 45 | % | |
| For the Year Ended October 31, 2021 | | | 53.77 | | | | 0.22 | | | | 0.22 | | | | 24.24 | | | | 24.46 | | | | (0.27 | ) | | | (0.42 | ) | | | — | | | | (0.69 | ) | | | 77.54 | | | | 45.69 | % | | | 110,490 | | | | 0.45 | % | | | 0.45 | % | | | 0.31 | % | | | 0.45 | % | | | 0.45 | % | | | 0.31 | % | | | 35 | % | |
| For the Period June 25, 20208 through October 31, 2020 | | | 50.00 | | | | 0.15 | | | | 0.15 | | | | 3.65 | | | | 3.80 | | | | (0.03 | ) | | | — | | | | — | | | | (0.03 | ) | | | 53.77 | | | | 7.60 | % | | | 133,078 | | | | 0.45 | % | | | 0.45 | % | | | 0.81 | % | | | 0.45 | % | | | 0.45 | % | | | 0.81 | % | | | 32 | % | |
1 Net investment income (loss) per share represents net investment income divided by the daily average shares of beneficial interest outstanding throughout each period.
2 Excludes interest expense and extraordinary expenses which comprise of tax and litigation expenses.
3 Due to the timing of sales and redemptions of capital shares, the net realized and unrealized gain (loss) per share will not equal the Fund's changes in net realized and unrealized gain (loss) on investments, in-kind redemptions, futures and swaps for the period.
4 Total return is calculated assuming an initial investment made at the net asset value at the beginning of the period, reinvestment of all dividends and distributions at net asset value during the period and redemption on the last day of the period. Total return calculated for a period of less than one year is not annualized.
For the years October 31, 2018 through October 31, 2019 the total return would have been lower if certain expenses had not been reimbursed/waived by the investment advisor.
5 For periods less than a year, these ratios are annualized.
6 For the years ended October 31, 2018 through October 31, 2019, net expenses include affects of any reimbursement/waiver or recoupment.
7 Portfolio turnover rate is not annualized and excludes the value of portfolio securities received or delivered as a result of in-kind creations or redemptions of the Fund's capital shares. Portfolio turnover rate does not include effects of turnover of the swap and future contracts portfolio. Short-term securities with maturities less than or equal to 365 days are also excluded from portfolio turnover calculation.
8 Commencement of operations.
The accompanying notes are an integral part of these financial statements.
DIREXION ANNUAL REPORT
38
Direxion Shares ETF Trust
Notes to the Financial Statements
October 31, 2022
1. ORGANIZATION
The Direxion Shares ETF Trust (the "Trust") is a Delaware statutory trust formed on April 23, 2008 and is registered with the Securities and Exchange Commission ("SEC") as an open-end management investment company under the Investment Company Act of 1940, as amended (the "1940 Act"). The Trust is a registered investment company that has 87 separate series (each, a "Fund" and together the "Funds"). Eight of these Funds are included in this report:
Direxion Auspice Broad Commodity Strategy ETF (Consolidated) | | Direxion mRNA ETF | |
Direxion Breakfast Commodities Strategy ETF (Consolidated) | | Direxion Nanotechnology ETF | |
Direxion Hydrogen ETF | | Direxion NASDAQ-100® Equal Weighted Index Shares | |
Direxion Moonshot Innovators ETF | | Direxion Work From Home ETF | |
The Trust has evaluated the structure, objective and activities of the Funds and determined that they meet the characteristics of an investment company. As such, these financial statements have applied the guidance as set forth in the Accounting Standards Codifications ("ASC") 946, Financial Services-Investment Companies.
Rafferty Asset Management, LLC ("Rafferty") serves as investment adviser to the Funds. Rafferty has registered as a commodity pool operator ("CPO") and the Direxion Auspice Broad Commodity Strategy ETF (Consolidated) and Direxion Breakfast Commodities Strategy ETF (Consolidated) are considered commodity pools under the Commodity Exchange Act (the "CEA"). Accordingly, Rafferty is subject to registration and regulation as a CPO under the CEA and must comply with various regulatory requirements under the CEA and the rules and regulations of the Commodity Futures Trading Commission and the National Futures Association, including investor protection requirements, antifraud provisions, disclosure requirements and reporting and recordkeeping requirements.
Each Fund seeks investment results, before fees and expenses, that track the performance of the underlying index as listed below:
Funds | | Index or Benchmark | |
Direxion Auspice Broad Commodity Strategy ETF (Consolidated) | | Auspice Broad Commodity Index | |
Direxion Breakfast Commodities Strategy ETF (Consolidated) | | S&P GSCI Dynamic Roll Breakfast
(OJ 5% Capped) Index | |
Direxion Hydrogen ETF | | Indxx Hydrogen Economy Index | |
Direxion Moonshot Innovators ETF | | S&P Kensho Moonshots Index | |
Direxion mRNA ETF | | BITA Messenger RNA Technology Index | |
Direxion Nanotechnology ETF | | S&P Kensho Extended Nanotechnology Index | |
Direxion NASDAQ-100® Equal Weighted Index Shares | | NASDAQ-100® Equal Weighted Index | |
Direxion Work From Home ETF | | Solactive Remote Work Index | |
The Direxion Auspice Broad Commodity Strategy ETF (Consolidated) primarily invests in commodity and financial futures contracts directly and/or indirectly through its wholly-owned subsidiary, Direxion BCS Fund Ltd. ("BCS Fund"), in order to track the returns of the Auspice Broad Commodity Index within the limitation of the U.S. federal tax requirements applicable to regulated investment companies.
The Direxion Breakfast Commodities Strategy ETF (Consolidated) primarily invests in tradeable commodity futures contracts directly and/or indirectly through its wholly-owned subsidiary, Direxion BKT Fund Ltd. ("BKT Fund"), in order to track the returns of the S&P GSCI Dynamic Roll Breakfast (OJ 5% Capped) Index within the limitation of the U.S. federal tax requirements applicable to regulated investment companies.
DIREXION ANNUAL REPORT
39
2. SIGNIFICANT ACCOUNTING POLICIES
The following is a summary of significant accounting policies consistently followed by the Funds in the preparation of their financial statements. These policies are in conformity with U.S. generally accepted accounting principles ("GAAP").
a) Investment Valuation – The Net Asset Value ("NAV") per share of each Fund is determined daily, as of the close of regular trading on the New York Stock Exchange ("NYSE") (normally at 4:00 p.m. Eastern time ("Valuation Time")), each day the NYSE is open for business. A security listed or traded on an exchange, domestic or foreign, is valued at its last sales price on the principal exchange on which it is traded prior to the time when assets are valued. If no sale is reported at that time, the mean of the last bid and asked prices is used. Securities primarily traded on the NASDAQ® Global Market ("NASDAQ") for which market quotations are readily available are valued using the NASDAQ® Official Closing Price ("NOCP") provided by NASDAQ each business day. Over-the-counter ("OTC") securities held by a Fund are valued at the last sales price or, if no sales price is reported, the mean of the last bid and asked price is used. The portfolio securities of a Fund that are listed on national exchanges are valued at the last sales price of such securities or; if no sales price is reported, the mean of the last bid and asked price is used. Swap contracts are valued using the closing price of the underlying reference entity or the closing value of the underlying reference index. The Funds valued their investments in money market funds based on their daily net asset values. If the settlement price established by the exchange reflects trading after the Valuation Time, then the last sales price prior to Valuation Time will be used. Securities and swap contracts are fair valued as determined by the Rafferty under the supervision of the Board of Trustees (the "Board") in the following scenarios: a) reliable market quotations are not readily available; b) the Funds' pricing service does not provide a valuation for such securities; c) the Funds' pricing service provides a valuation that in the judgment of the Rafferty does not represent fair value; or d) the Fund or Rafferty believes the market price is stale.
b) Futures Contracts – Each Fund may purchase and sell futures contracts. A Fund may use futures contracts to gain exposure to, or hedge against, changes in the values of commodities, equities, interest rates or foreign currencies. Upon entering into a contract, the Fund deposits and maintains as collateral such initial margin as required by the exchange on which the transaction is effected. Pursuant to the contract, the Fund agrees to receive from or pay to the broker an amount of cash equal to the daily fluctuation in value of the contract. Such receipts or payments are known as "variation margin" and are recorded by the Fund as unrealized gains and losses. When the contract is closed, the Fund records a realized gain or loss equal to the difference between the value of the contract at the time it was opened and the value at the time it was closed. As collateral for futures contracts, the Fund is required under the 1940 Act to maintain assets consisting of cash, cash equivalents or liquid securities. This collateral is required to be adjusted daily to reflect the market value of the purchase obligation for long futures contracts or the market value of the instrument underlying the contract, but not less than the market price at which the futures contract was established, for short futures contracts. The Direxion Breakfast Commodities Strategy ETF (Consolidated) was invested in futures contracts as of the period ended October 31, 2022.
c) Risks of Futures Contracts, Options on Futures Contracts and Short Positions – The risks inherent in the use of options, futures contracts, options on futures contracts and short positions include 1) adverse changes in the fair value of such instruments; 2) imperfect correlation between the price of options and futures contracts and options thereon and movements in the price of the underlying securities, index or futures contracts; 3) the possible absence of a liquid secondary market for any particular instrument at any time; 4) the possible need to defer closing out certain positions to avoid adverse tax consequences; and 5) the possible non-performance by the counterparty under the terms of the contract. The Funds designate cash, cash equivalents and liquid securities as collateral for written options, futures contracts, options on futures contracts and short positions. The Funds were not invested in any type of options during the period ended October 31, 2022.
d) Risks of Investing in Foreign Securities – Investments in foreign securities involve greater risks than investing in domestic securities. As a result, the Funds' returns and net asset values may be affected to a large degree by fluctuations in currency exchange rates, political, diplomatic or economic conditions and regulatory requirements in other countries. The laws, accounting and financial reporting standards in foreign countries may require less disclosure than required in the U.S., and therefore there may be less public information available about foreign companies. Investments in foreign emerging markets present a greater risk than investing in foreign issuers in general. The risk of political or social upheaval is greater in emerging markets. In addition, there may be risks of an economy's dependence on revenues from particular commodities, currency transfer restrictions, a limited number of potential buyers for such securities and delays and disruption in securities settlement procedures.
DIREXION ANNUAL REPORT
40
e) Foreign Currency Translation – The accounting records of the Funds are maintained in U.S. dollars. The fair value of foreign securities, currency holdings, and other assets and liabilities is recorded in the books and records of the Funds after translation to U.S. dollars based on the exchange rates on that day. The cost of each security is determined using historical exchange rates. Income and withholding taxes are translated at prevailing exchange rates when earned or incurred. The Funds do not isolate that portion of realized or unrealized gains or losses resulting from changes in the foreign exchange rate on investments from fluctuations arising from changes in the market prices of the securities. Such gains and losses are included with the net realized and unrealized gain or loss on investments. Net realized gains and losses on foreign currency transactions represent net realized exchange gains or losses on disposition of foreign currencies, currency gains and losses realized between the trade and settlement dates on securities transactions and the difference between the amount of investment income and foreign withholding taxes recorded on the Fund's books and the U.S. dollar equivalent amounts actually received or paid. Net unrealized appreciation and depreciation of assets and liabilities in foreign currencies arise from changes in the value of assets and liabilities other than investments at the period end, resulting from changes in the exchange rate.
f) Basis for Consolidation – The Direxion Auspice Broad Commodity Strategy ETF may invest up to 25% of its total assets in the Direxion BCS Fund Ltd. ("BCS Fund"). The BCS Fund, which is organized under the laws of the Cayman Islands, is wholly-owned and controlled by the Direxion Auspice Broad Commodity Strategy ETF. The BCS Fund acts as an investment vehicle to facilitate entering into certain investments for the Direxion Auspice Broad Commodity Strategy ETF consistent with the Fund's investment objectives and policies specified in its prospectus and statement of additional information and within the limitation of the U.S. federal tax requirements applicable to regulated investment companies. As of October 31, 2022, the net assets of the Direxion Auspice Broad Commodity Strategy ETF were $297,287,806, of which $51,767,212, or approximately 17.4%, represented the Direxion Auspice Broad Commodity Strategy ETF's ownership of all issued shares and voting rights of the BCS Fund. All intercompany balances, revenues and expenses have been eliminated in consolidation.
The Direxion Breakfast Commodities Strategy ETF may invest up to 25% of its total assets in the Direxion BKT Fund Ltd. ("BKT Fund"). The BKT Fund, which is organized under the laws of the Cayman Islands, is wholly-owned and controlled by the Direxion Breakfast Commodities Strategy ETF. The BKT Fund acts as an investment vehicle to facilitate entering into certain investments for the Direxion Breakfast Commodities Strategy ETF consistent with the Fund's investment objectives and policies specified in its prospectus and statement of additional information and within the limitation of the U.S. federal tax requirements applicable to regulated investment companies. As of October 31, 2022, the net assets of the Direxion Breakfast Commodities Strategy ETF were $6,870,023 of which $712,948 or approximately 10.4%, represented the Direxion Breakfast Commodities Strategy ETF's ownership of all issued shares and voting rights of the BKT Fund. All intercompany balances, revenues and expenses have been eliminated in consolidation.
g) Risks of Investing Commodity-Linked Derivatives – The Direxion Auspice Broad Commodity Strategy ETF and Direxion Breakfast Commodities Strategy ETF, through their investment in their respective subsidiary, may hold commodity-linked derivatives. Commodity-linked derivatives provide exposure, which may include long and/or short exposure, to the investment returns of physical commodities that trade in the commodities markets without investing directly in physical commodities. The value of a commodity-linked derivative investment typically is based upon the price movements of a physical commodity (such as heating oil, precious metals, livestock, or agricultural products), a commodity futures contract or commodity index, or some other readily measurable economic variable. The value of commodity-linked derivative instruments may be affected by changes in overall market movements, volatility of the underlying benchmark, changes in interest rates, or factors affecting a particular industry or commodity, such as drought, floods, weather, livestock disease, embargoes, tariffs and international economic, political and regulatory developments. The value of commodity-linked derivatives will rise or fall in response to changes in the underlying commodity or related index. Investments in commodity-linked derivatives may be subject to greater volatility than non-derivative based investments. A highly liquid secondary market may not exist for certain commodity-linked derivatives, and there can be no assurance that one will develop. The Direxion Auspice Broad Commodity Strategy ETF and Direxion Breakfast Commodities Strategy ETF held commodity-linked derivatives during the period ended October 31, 2022.
h) Security Transactions – Investment transactions are recorded on the trade date. The Funds determine the gain or loss realized from investment transactions by comparing the identified cost, which is the same basis used for U.S. Federal income tax purposes, with the net sales proceeds.
DIREXION ANNUAL REPORT
41
i) Securities Lending – Each Fund may lend up to 331/3% of the value of the securities in their portfolios to approved brokers, dealers and other financial institutions. The borrower pledges and maintains with the Fund collateral consisting of cash, cash equivalents, or securities issued or guaranteed by the U.S. government. The collateral received by each Fund is required to have a value of at least 102% of the current value of the loaned securities. During the term of the loan, each Fund is entitled to all distributions made on or in respect of the loaned securities but does not receive interest income on securities received as collateral. Each Fund receives compensation for lending its securities from interest or dividends earned on the cash, cash equivalents or U.S. Government securities held as collateral, net of fee rebates paid to borrower and net of fees paid to the lending agent. The amount of fees depends on a number of factors including the security type and the length of the loan. In addition, a Fund will receive a fee from the borrower for non-cash collateral equal to a percentage of the market value of the loaned securities. Loans of securities are terminable at any time and the borrower, after notice, is required to return borrowed securities within the standard time period for settlement of securities transactions. No more than 99% of the value of any security may be on loan at any time.
As of October 31, 2022, all securities on loan were collateralized by cash and/or U.S. government obligations. The cash received as collateral for securities on loan was invested in money market funds, whose maturities are overnight and continuous, and is disclosed in the Schedules of Investments. The securities on loan in each Fund are also disclosed in the Schedule of Investments. The total value of securities loaned and the value of the invested cash collateral are disclosed in the Statements of Assets and Liabilities. Non-cash collateral consists of U.S. Treasury securities and is not disclosed on the Statements of Assets and Liabilities as its held by the lending agent on behalf of the Funds, and the Funds do not have the ability to sell, reinvest or pledge those securities. Income earned by the Funds from securities lending is disclosed in the Statements of Operations.
The risks of securities lending include the risk that the borrower may not provide additional collateral when required or may not return the securities when due. To mitigate these risks, the Funds are contractually indemnified with the securities lending agent. Furthermore, the Funds require the value of the securities loaned to be computed daily at the close of the market and additional collateral be furnished, if required.
As of October 31, 2022, the market value of the securities loaned and the related cash and non-cash collateral received for securities lending were as follows:
Funds | | Market Value of
Securities Loaned | | Cash Collateral
Received | | Non-Cash
Collateral Received | | Total
Collateral Received | |
Direxion Hydrogen ETF | | $ | 3,717,220 | | | $ | 3,681,644 | | | $ | 191,969 | | | $ | 3,873,613 | | |
Direxion Moonshot Innovators ETF | | | 5,903,311 | | | | 6,137,963 | | | | — | | | | 6,137,963 | | |
Direxion Nanotechnology ETF | | | 132,007 | | | | 142,643 | | | | — | | | | 142,643 | | |
Direxion NASDAQ-100® Equal Weighted
Index Shares | | | 12,864,473 | | | | 12,332,927 | | | | 1,055,504 | | | | 13,388,431 | | |
Direxion Work From Home ETF | | | 564,151 | | | | 578,552 | | | | — | | | | 578,552 | | |
j) Federal Income Taxes – Each Fund intends to make the requisite distributions of income and capital gains to comply with the requirements of Subchapter M of the Internal Revenue Code of 1986, as amended, necessary to qualify as a regulated investment company. Therefore, no provision for U.S. Federal income tax has been made by the Funds.
The Funds may be subject to a nondeductible 4% U.S. excise tax calculated as a percentage of certain undistributed amounts of net investment income and net capital gains. The Direxion Auspice Broad Commodity Strategy ETF (Consolidated) paid this excise tax during the year ended October 31, 2022.
k) Income and Expenses – Interest income, including amortization of premiums and discounts, is recognized on an accrual basis. Distributions are recorded on the ex-dividend date.
The Funds are charged for those expenses that are directly attributable to each series, such as advisory fees. Expenses that are not directly attributable to a series are generally allocated among the Trust's series in proportion to their respective average daily net assets. Expenses are charged to the Funds daily. Expenses are computed based on each Fund's respective average daily net assets. For additional discussion on expenses, refer to Note 6.
DIREXION ANNUAL REPORT
42
l) Distributions to Shareholders – Each Fund pays dividends from net investment income and distributes net realized capital gains, if any, at least annually. Income and capital gain distributions are determined in accordance with U.S. Federal income tax regulations, which may differ from GAAP. Certain Funds also utilize earnings and profits distributed to shareholders on redemptions of shares as part of the dividends paid deduction. Distributions to shareholders are recorded on the ex-dividend date.
m) Guarantees and Indemnifications – In the ordinary course of business, the Funds enter into contracts that contain a variety of indemnification provisions pursuant to which the Funds agree to indemnify third parties upon the occurrence of specified events. The Funds' maximum exposure relating to these indemnification agreements is unknown. However, the Funds have not had prior claims or losses in connection with these provisions and believe the risk of loss is remote.
n) Use of Estimates – The preparation of financial statements in conformity with GAAP requires management to make estimates and assumptions that affect the reported amounts of assets and liabilities and disclosure of contingent assets and liabilities at the date of the financial statements and the reported amounts of revenues and expenses during the reporting period. Actual results could differ from those estimates.
3. INCOME TAX AND DISTRIBUTION INFORMATION
The tax character of distributions paid during the periods ended October 31, 2022 and October 31, 2021 are presented in the following table. The tax character of distributions to shareholders made during the periods may differ from their ultimate characterization for U.S. Federal income tax purposes.
| | | Year/Period Ended
October 31, 2022 | | Year/Period Ended
October 31, 2021 | |
| | | Distributions Paid From: | | Distributions Paid From: | |
Funds | | Ordinary
Income | | Long Term
Capital Gains | | Return
of Capital | | Ordinary
Income | | Long Term
Capital Gains | | Return
of Capital | |
Direxion Auspice Broad
Commodity Strategy ETF
(Consolidated) | | $ | 45,900,192 | | | $ | — | | | $ | — | | | $ | — | | | $ | — | | | $ | — | | |
Direxion Breakfast
Commodities Strategy ETF
(Consolidated)3 | | | 15,661 | | | | — | | | | — | | | | — | | | | — | | | | — | | |
Direxion Hydrogen ETF | | | 399,661 | | | | — | | | | 15,230 | | | | 127,435 | | | | — | | | | — | | |
Direxion Moonshot
Innovators ETF | | | 953,134 | | | | — | | | | 193,011 | | | | 680,526 | | | | — | | | | — | | |
Direxion mRNA ETF2 | | | — | | | | — | | | | — | | | | — | | | | — | | | | — | | |
Direxion Nanotechnology ETF1 | | | — | | | | — | | | | — | | | | — | | | | — | | | | — | | |
Direxion NASDAQ-100® Equal
Weighted Index Shares | | | 17,776,653 | | | | 1,100,517 | | | | — | | | | 2,011,608 | | | | — | | | | — | | |
Direxion Work From Home ETF | | | 723,713 | | | | — | | | | — | | | | 1,572,820 | | | | — | | | | — | | |
1 Commenced operations on November 23, 2021.
2 Commenced operations on December 9, 2021.
3 Commenced operations on June 1, 2022
At October 31, 2022, the components of accumulated earnings/(losses) on a tax-basis were as follows:
| Funds | | Net
Unrealized
Appreciation
(Depreciation) | | Undistributed
Ordinary
Income | | Undistributed
Capital Gain | | Other
Accumulated
Earnings (Losses)1 | | Total
Accumulated
Earnings (Losses) | |
Direxion Auspice Broad Commodity
Strategy ETF (Consolidated) | | $ | — | | | $ | 7,014,632 | | | $ | — | | | $ | (3,508 | ) | | $ | 7,011,124 | | |
Direxion Breakfast Commodities
Strategy ETF (Consolidated) | | | 33,349 | | | | 11,824 | | | | — | | | | — | | | | 45,173 | | |
Direxion Hydrogen ETF | | | (15,237,274 | ) | | | — | | | | — | | | | (4,033,215 | ) | | | (19,270,489 | ) | |
DIREXION ANNUAL REPORT
43
| Funds | | Net
Unrealized
Appreciation
(Depreciation) | | Undistributed
Ordinary
Income | | Undistributed
Capital Gain | | Other
Accumulated
Earnings (Losses)1 | | Total
Accumulated
Earnings (Losses) | |
Direxion Moonshot Innovators ETF | | $ | (28,680,156 | ) | | $ | — | | | $ | — | | | $ | (103,417,417 | ) | | $ | (132,097,573 | ) | |
Direxion mRNA ETF | | | (1,068,488 | ) | | | — | | | | — | | | | (800,186 | ) | | | (1,868,674 | ) | |
Direxion Nanotechnology ETF | | | (405,272 | ) | | | — | | | | — | | | | (480,207 | ) | | | (885,479 | ) | |
Direxion NASDAQ-100® Equal
Weighted Index Shares | | | (125,840,211 | ) | | | 218,735 | | | | — | | | | — | | | | (125,621,476 | ) | |
Direxion Work From Home ETF | | | (21,138,172 | ) | | | 46,336 | | | | — | | | | (4,152,695 | ) | | | (25,244,531 | ) | |
1 Other Accumulated Earnings (Losses) consist of capital loss carryover, qualified late year losses and organizational costs.
At October 31, 2022, the aggregate gross unrealized appreciation and depreciation of investments for U.S. Federal income tax purposes were as follows:
| Funds | | Tax Cost of
Investments | | Gross
Unrealized
Appreciation | | Gross
Unrealized
Depreciation | | Net
Unrealized
Appreciation
(Depreciation) | |
Direxion Auspice Broad Commodity Strategy ETF
(Consolidated) | | $ | 301,128,639 | | | $ | — | | | $ | — | | | $ | — | | |
Direxion Breakfast Commodities Strategy ETF (Consolidated) | | | 6,273,596 | | | | 33,349 | | | | — | | | | 33,349 | | |
Direxion Hydrogen ETF | | | 41,064,251 | | | | 166,668 | | | | (15,403,942 | ) | | | (15,237,274 | ) | |
Direxion Moonshot Innovators ETF | | | 72,586,540 | | | | 1,297,689 | | | | (29,977,845 | ) | | | (28,680,156 | ) | |
Direxion mRNA ETF | | | 4,613,097 | | | | 367,222 | | | | (1,435,710 | ) | | | (1,068,488 | ) | |
Direxion Nanotechnology ETF | | | 2,019,443 | | | | 120,159 | | | | (525,431 | ) | | | (405,272 | ) | |
Direxion NASDAQ-100® Equal Weighted Index Shares | | | 837,884,397 | | | | 28,431,099 | | | | (154,271,310 | ) | | | (125,840,211 | ) | |
Direxion Work From Home ETF | | | 60,057,584 | | | | 3,512,861 | | | | (24,651,033 | ) | | | (21,138,172 | ) | |
The difference between the book cost of investments and the tax cost of investments is primarily attributable to tax deferral of losses on wash sales and basis adjustments on investments in real estate investment trusts ("REITs").
On the Statements of Assets and Liabilities, the following adjustments were made for permanent tax differences between accounting for total distributable earnings and capital stock under GAAP and tax reporting:
| Funds | | Total Distributable
Earnings (Loss) | | Capital Stock | |
Direxion Auspice Broad Commodity Strategy ETF (Consolidated) | | $ | (14,745,461 | ) | | $ | 14,745,461 | | |
Direxion Breakfast Commodities Strategy ETF (Consolidated) | | | 458,402 | | | | (458,402 | ) | |
Direxion Hydrogen ETF | | | 450,312 | | | | (450,312 | ) | |
Direxion Moonshot Innovators ETF | | | 14,156,416 | | | | (14,156,416 | ) | |
Direxion mRNA ETF | | | 1,165 | | | | (1,165 | ) | |
Direxion Nanotechnology ETF | | | 653 | | | | (653 | ) | |
Direxion NASDAQ-100® Equal Weighted Index Shares | | | (99,306,646 | ) | | | 99,306,646 | | |
Direxion Work From Home ETF | | | (2,179,743 | ) | | | 2,179,743 | | |
GAAP requires that certain components of net assets relating to permanent differences be reclassified between financial and tax reporting. These reclassifications have no effect on net assets or net asset value per share. For the year ended October 31, 2022, the permanent differences primarily relate to tax treatment of redemptions in-kind, non-deductible excise tax paid, net operating losses and the utilization of earnings and profits distributed to shareholders on redemption of shares.
In order to meet certain U.S. excise tax distribution requirements, each Fund is required to measure and distribute annually net capital gains realized during a twelve month period ending October 31 and net investment income earned during a twelve month period ending December 31. In connection with this, these Funds are permitted for tax purposes to defer into their next fiscal year qualified late year losses. Qualified late year ordinary losses are generally losses incurred between January 1 and the end of their fiscal year, October 31, 2022.
DIREXION ANNUAL REPORT
44
At October 31, 2022, these Funds deferred, on a tax basis, qualified late year losses of:
Funds | | Ordinary Late
Year Loss
Deferral | |
Direxion Moonshot Innovators ETF | | $ | 48,023 | | |
Direxion mRNA ETF | | | 3,624 | | |
Under current law, each Fund may carry forward net capital losses indefinitely to use to offset capital gains realized in future years and their character is retained as either short-term and/or long-term.
At October 31, 2022, for U.S. Federal income tax purposes, the following Funds had capital loss carryforwards available to offset future capital gains:
| Funds | | Utilized in
Current Year | | Unlimited ST | | Unlimited LT | |
Direxion Auspice Broad Commodity Strategy ETF (Consolidated) | | $ | — | | | $ | — | | | $ | — | | |
Direxion Breakfast Commodities Strategy ETF (Consolidated) | | | — | | | | — | | | | — | | |
Direxion Hydrogen ETF | | | — | | | | 3,853,746 | | | | 179,469 | | |
Direxion Moonshot Innovators ETF | | | — | | | | 54,710,113 | | | | 48,659,281 | | |
Direxion mRNA ETF | | | — | | | | 796,562 | | | | — | | |
Direxion Nanotechnology ETF | | | — | | | | 480,207 | | | | — | | |
Direxion NASDAQ-100® Equal Weighted Index Shares | | | — | | | | — | | | | — | | |
Direxion Work From Home ETF | | | — | | | | 2,614,600 | | | | 1,538,095 | | |
The Funds follow authoritative financial reporting rules regarding recognition and measurement of tax positions taken or expected to be taken on a tax return. Management has reviewed all open tax years and concluded that there is no effect to the Funds' financial positions or results of operations and no tax liability was required to be recorded resulting from unrecognized tax benefits relating to uncertain income tax position taken or expected to be taken on a tax return. The Funds recognize interest and penalties, if any, related to unrecognized tax benefits as income tax expense in the Statements of Operations. During this period, the Funds did not incur any interest or penalties. Open tax years are those years that are open for examination by the relevant income taxing authority. As of October 31, 2022, open U.S. Federal and state income tax years include the tax years ended October 31, 2019 through October 31, 2022. The Funds have no examinations in progress. The Funds are also not aware of any tax positions for which it is reasonably possible that the total amounts of unrecognized tax expense will significantly change in the next twelve months.
4. CREATION AND REDEMPTION TRANSACTIONS AND TRANSACTION FEES
Each Fund issues and redeems shares on a continuous basis at NAV only in large blocks of shares called "Creation Units." The number of shares in a Creation Unit for each respective Fund is as follows:
Fund | | Number of shares
per Creation Unit | |
Direxion Auspice Broad Commodity Strategy ETF (Consolidated) | | | 50,000 | shares | |
Direxion Breakfast Commodities Strategy ETF (Consolidated) | | | 50,000 | shares | |
Direxion Hydrogen ETF | | | 50,000 | shares | |
Direxion Moonshot Innovators ETF | | | 25,000 | shares | |
Direxion mRNA ETF | | | 25,000 | shares | |
Direxion Nanotechnology ETF | | | 25,000 | shares | |
Direxion NASDAQ-100® Equal Weighted Index Shares | | | 50,000 | shares | |
Direxion Work From Home ETF | | | 25,000 | shares | |
Creation Units of the Funds are issued and redeemed in cash and/or in-kind for securities included in the relevant underlying index. Investors such as market makers, large investors and institutions who wish to deal in Creation Units directly with a Fund must have entered into an authorized participant agreement with the principal underwriter and the transfer agent, or purchase through a dealer that has entered into such an agreement. Transactions in shares for each Fund include both cash and in-kind transactions and are disclosed in detail in the Statements of Changes in Net Assets.
DIREXION ANNUAL REPORT
45
Transaction fees are imposed to cover the costs associated with the issuance and redemption of Creation Units. There is a fixed and a variable component to the total transaction fee. A fixed transaction fee is paid to the transfer agent and is applicable to each creation or redemption transaction, regardless of the number of Creation Units purchased or redeemed. In addition, a variable transaction fee equal to a percentage of the value of each Creation Unit purchased or redeemed is applicable to each creation or redemption transaction and is paid to the Fund. Not all Funds will have a transaction fee associated with capital share activity for the year. Transaction fees received by each Fund are presented in the Capital Share Transaction section of the Statements of Changes in Net Assets.
5. INVESTMENT TRANSACTIONS
The table below presents each Fund's investment transactions during the period ended October 31, 2022. Purchases represent the aggregate purchases of investments excluding the cost of in-kind purchases, short-term investment purchases, swaps and futures contracts. Sales represent the aggregate sales of investments excluding proceeds from in-kind sales, short-term investments, swaps and futures contracts. Purchases in-kind are the aggregate of all in-kind purchases and sales in-kind are the aggregate of all proceeds from in-kind sales. The transactions for each of these categories are as follows:
Funds | | Purchases | | Sales | | Purchases
In-Kind | | Sales
In-Kind | |
Direxion Auspice Broad Commodity Strategy ETF
(Consolidated) | | $ | — | | | $ | — | | | $ | — | | | $ | — | | |
Direxion Breakfast Commodities Strategy ETF
(Consolidated)3 | | | — | | | | — | | | | — | | | | — | | |
Direxion Hydrogen ETF | | | 11,840,181 | | | | 11,977,716 | | | | 12,814,889 | | | | 11,171,222 | | |
Direxion Moonshot Innovators ETF | | | 84,568,999 | | | | 84,828,990 | | | | 17,613,034 | | | | 54,964,586 | | |
Direxion mRNA ETF2 | | | 5,443,184 | | | | 2,687,941 | | | | 2,919,589 | | | | — | | |
Direxion Nanotechnology ETF1 | | | 3,848,043 | | | | 1,305,958 | | | | — | | | | — | | |
Direxion NASDAQ-100® Equal Weighted Index Shares | | | 208,323,922 | | | | 222,980,434 | | | | 995,217,738 | | | | 570,119,233 | | |
Direxion Work From Home ETF | | | 33,558,178 | | | | 31,248,481 | | | | 1,986,927 | | | | 34,248,048 | | |
1 Represents the period from November 23, 2021 (commencement of operations) to October 31, 2022.
2 Represents the period from December 9, 2021 (commencement of operations) to October 31, 2022.
3 Represents the period from June 1, 2022 (commencement of operations) to October 31, 2022.
There were no purchases or sales of long-term U.S. Government securities in the Funds during the period ended October 31, 2022.
6. INVESTMENT ADVISORY AND OTHER AGREEMENTS
Under an Investment Advisory Agreement between each Adviser and the Trust, on behalf of each Fund, the Adviser provides a continuous investment program for each Fund's assets in accordance with its investment objectives, policies and limitations, and oversees the day-to-day operations of each Fund, subject to the supervision of the Trustees. Pursuant to the Advisory Agreement, each Fund pays their respective Adviser an investment advisory fees at an annual rate based on its average daily net assets. These rates are as follows:
Direxion Auspice Broad Commodity Strategy ETF (Consolidated) | | | 0.50 | % | |
Direxion Breakfast Commodities Strategy ETF (Consolidated) | | | 0.50 | % | |
Direxion Hydrogen ETF | | | 0.40 | % | |
Direxion Moonshot Innovators ETF | | | 0.60 | % | |
Direxion mRNA ETF | | | 0.60 | % | |
Direxion Nanotechnology ETF | | | 0.60 | % | |
Direxion NASDAQ-100® Equal Weighted Index Shares | | | 0.30 | % | |
Direxion Work From Home ETF | | | 0.40 | % | |
Additionally, the Trust has entered into a Management Services Agreement with Rafferty. Under the Management Services Agreement, the Trust pays Rafferty management service fees of 0.026% on the first $10,000,000,000 of the Trust's daily
DIREXION ANNUAL REPORT
46
net assets and 0.024% on assets in excess of $10,000,000,000. This fee compensates Rafferty for performing certain management, administration and compliance functions related to the Trust.
The Funds have entered into an Operating Services Agreement. Under the Operating Services Agreement, Rafferty will pay all the expenses (with certain exceptions such as management fees, Rule 12b-1 fees and swap financing and related costs) of the Funds in exchange for a fee calculated based on the following rates multiplied by the respective average daily net assets of each Fund.
Direxion Auspice Broad Commodity Strategy ETF (Consolidated) | | | 0.20 | % | |
Direxion Breakfast Commodities Strategy ETF (Consolidated) | | | 0.20 | % | |
Direxion Hydrogen ETF | | | 0.05 | % | |
Direxion Moonshot Innovators ETF | | | 0.05 | % | |
Direxion mRNA ETF | | | 0.05 | % | |
Direxion Nanotechnology ETF | | | 0.05 | % | |
Direxion NASDAQ-100® Equal Weighted Index Shares | | | 0.05 | % | |
Direxion Work From Home ETF | | | 0.05 | % | |
The Board has adopted a Distribution and Service Plan (the "Plan") pursuant to Rule 12b-1 under the Investment Company Act of 1940. In accordance with the Plan, each Fund is authorized to charge an amount up to 0.25% of its average daily net assets each year for certain distribution-related activities and shareholder services. No 12b-1 fees were charged by any Fund.
7. FAIR VALUE MEASUREMENTS
The Funds follow authoritative fair valuation accounting standards, which establish an authoritative definition of fair value and set out a hierarchy for measuring fair value. These standards require additional disclosures about the various inputs and valuation techniques used to develop the measurements of fair value and a discussion of changes in valuation techniques and related inputs during the period. These inputs are summarized in the three broad levels below:
Level 1 – Quoted prices in active markets for identical securities
Level 2 – Evaluated price based on other significant observable inputs (including quoted prices for similar securities, in active markets, quoted prices for identical or similar securities in inactive markets, interest rates, prepayment speeds, credit risk, etc.)
Level 3 – Significant unobservable inputs (including the Fund's own assumptions in determining the fair value of investments)
The inputs or methodology used for valuing securities are not necessarily an indication of the risk associated with investing in those securities.
The following is a summary of the inputs used to value the Funds' investments at October 31, 2022:
| | | Asset Class | |
| | | Level 1 | |
| Funds | | Common
Stocks | | Short Term
Investments | | Futures
Contracts* | |
Direxion Auspice Broad Commodity Strategy ETF (Consolidated) | | $ | — | | | $ | 301,128,639 | | | $ | — | | |
Direxion Breakfast Commodities Strategy ETF (Consolidated) | | | — | | | | 6,273,596 | | | | 33,349 | | |
Direxion Hydrogen ETF | | | 21,924,836 | | | | 3,905,853 | | | | — | | |
Direxion Moonshot Innovators ETF | | | 37,581,309 | | | | 6,325,075 | | | | — | | |
Direxion mRNA ETF | | | 3,544,518 | | | | 91 | | | | — | | |
Direxion Nanotechnology ETF | | | 1,612,764 | | | | 144,050 | | | | — | | |
Direxion NASDAQ-100® Equal Weighted Index Shares | | | 698,843,182 | | | | 13,201,004 | | | | — | | |
Direxion Work From Home ETF | | | 38,265,373 | | | | 654,039 | | | | — | | |
For further detail on each asset class, see each Fund's Schedule of Investments.
* Futures contracts and total return swap contracts are valued at the unrealized appreciation/(depreciation).
The Funds also follow authoritative accounting standards, which require additional disclosure regarding fair value measurements. Specifically, these standards require reporting entities to disclose a) the input and valuation techniques used
DIREXION ANNUAL REPORT
47
to measure fair value for both recurring and nonrecurring fair value measurements, for Level 2 or Level 3 positions, b) transfers between all levels (including Level 1 and Level 2) on a gross basis (i.e. transfers out must be disclosed separately from transfers in) as well as the reason(s) for the transfers and c) purchases and sales on a gross basis in the Level 3 rollforward rather than as one net number. Additionally, reporting entities are required to disclose quantitative information about unobservable inputs used in the fair value measurements categorized within Level 3 of the fair value hierarchy.
8. VALUATION OF DERIVATIVE INSTRUMENTS
The Funds follow authoritative standards of accounting for derivative instruments, which establish disclosure requirements for derivative instruments. These standards improve financial reporting for derivative instruments by requiring enhanced disclosures that enable investors to understand how and why a fund uses derivative instruments, how derivative instruments are accounted for and how derivative instruments affect a fund's financial position and results of operations.
Certain Funds use derivative instruments as part of their principal investment strategy to achieve their investment objective. For additional discussion on the risks associated with derivative instruments refer to Note 2. As of October 31, 2022, certain Funds were invested in futures contracts. At October 31, 2022, the fair values of derivative instruments, by primary risk, were as follows:
| | | Asset Derivatives | |
Futures Contracts*
Fund | | Commodity Risk | | Total | |
Direxion Breakfast Commodities Strategy ETF (Consolidated) | | $ | 33,349 | | | $ | 33,349 | | |
* Cumulative appreciation(depreciation) of futures contracts as reported in the Schedule of Investments.
Only current day's variation margin, if any, is reported in the Statements of Assets and Liabilities.
Transactions in derivative instruments during the period ended October 31, 2022, by primary risk, were as follows:
| | | | | Net Realized
Gain (Loss)1 | | Net Unrealized
Appreciation
(Depreciation)2 | |
Fund | | | | Commodity Risk | | Commodity Risk | |
Direxion Auspice Broad Commodity Strategy ETF (Consolidated) | | Futures Contracts | | $ | 27,202,526 | | | $ | (15,322,256 | ) | |
Direxion Breakfast Commodities Strategy ETF (Consolidated) | | Futures Contracts | | | (461,604 | ) | | | 33,349 | | |
1 Statements of Operations location: Net realized gain (loss) on futures contracts.
2 Statements of Operations location: Change in net unrealized appreciation (depreciation) on futures contracts.
For the period ended October 31, 2022, the volume of the derivatives held by the Funds was as follows:
| | | Quarterly Average Gross
Notional Amounts | |
| | | Long Futures
Contracts | |
Direxion Auspice Broad Commodity Strategy ETF (Consolidated) | | $ | 151,829,474 | | |
Direxion Breakfast Commodities Strategy ETF (Consolidated) | | | 4,430,439 | | |
The Funds utilize this volume of derivatives in order to meet the investment objectives of each respective Fund.
9. PRINCIPAL RISKS
Below are some of the principal risks of investing in the Funds. Please refer to the Funds' prospectus for a full discussion.
Sector Concentration Risk – The risk of concentrating investments in a limited number of issuers in a particular industry is that a Fund will be more susceptible to the risks associated with that industry than a Fund that does not concentrate its investments.
DIREXION ANNUAL REPORT
48
Daily Index Correlation/Tracking Risk – A number of factors may affect a Fund's ability to achieve a high degree of correlation with its benchmark, and there can be no guarantee that a Fund will achieve a high degree of correlation. A failure to achieve a high degree of correlation may prevent a Fund from achieving its investment objective. A number of factors may adversely affect a Fund's correlation with its benchmark, including fees, expenses, transaction costs, costs associated with the use of leveraged investment techniques, income items, accounting standards, and disruptions or illiquidity in the markets for the securities or financial instruments in which the Fund invests. A Fund may not have investment exposure to all securities in its underlying benchmark index, or its weighting of investment exposure to such stocks or industries may be different from that of the index. In addition, a Fund may invest in securities or financial instruments not included in the index underlying its benchmark. A Fund may be subject to large movements of assets into and out of the Fund, potentially resulting in the Fund being over- or under-exposed to its benchmark. Activities surrounding annual index reconstitutions and other index rebalancing or reconstitution events may hinder the Funds' ability to meet their daily investment objective on that day. Each Fund seeks to rebalance its portfolio daily to keep leverage consistent with its daily investment objective.
Derivatives Risk – The Fund's investments in derivatives may pose risks in addition to, and greater than, those associated with directly investing in securities or other investments, including risk related to the market, leverage, imperfect daily correlations with underlying investments or the Fund's other portfolio holdings, higher price volatility, lack of availability, counterparty risk, liquidity, valuation and legal restrictions.
In addition, the Fund's investments in derivatives are subject to the following risks:
• Futures Contracts. Futures contracts are typically exchange-traded contracts that call for the future delivery of an asset at a certain price and date, or cash settlement of the terms of the contract. There may be an imperfect correlation between the changes in market value of the securities held by the Fund and the prices of futures contracts. Futures contracts are subject to liquidity risks; there may not be a liquid secondary market for the futures contracts and the Fund may not be able to enter into a closing transaction. Exchanges may also limit the number of positions that can be held or controlled by the Fund or the Adviser, thus limiting the ability of the Fund to implement its leveraged investment strategy. Futures markets are highly volatile and the use of futures may increase the Fund's volatility. Futures contracts are also subject to leverage risk.
Foreign Securities Risk – Investments in foreign securities directly or indirectly through investments in exchange traded funds which track foreign securities involve greater risks than investing in domestic securities. As a result, the Funds' returns and net asset values may be affected to a large degree by fluctuations in currency exchange rates, political, diplomatic or economic conditions and regulatory requirements in other countries. The laws, accounting and financial reporting standards in foreign countries may require less disclosure than required in the U.S., and therefore there may be less public information available about foreign companies. Investments in foreign emerging markets present a greater risk than investing in foreign issuers in general. The risk of political or social upheaval is greater in emerging markets. In addition, there may be risks of an economy's dependence on revenues from particular commodities, currency transfer restrictions, a limited number of potential buyers for such securities and delays and disruption in securities settlement procedures.
Currency Exchange Rate Risk – Changes in foreign currency exchange rates will affect the value of the Fund's investments in securities denominated in a country's currency. Generally, when the U.S. Dollar rises in value against a foreign currency, an investment in that country loses value because that currency is worth fewer U.S. Dollars. Devaluation of a currency by a country's government or banking authority also will have a significant impact on the value of any investments denominated in that currency. If the Fund is exposed to a limited number of currencies, any change in the value of these currencies could have a material impact on the Fund's net asset value.
Liquidity Risk – In certain circumstances, such as the disruption of the orderly markets for the securities or financial instruments in which a Fund invests, a Fund might not be able to dispose of certain holdings quickly or at prices that represent fair market value in the judgment of the Adviser. Additionally, certain counterparties may have the ability to demand repayment at any time, thereby exposing the Fund to the risk that it may be required to liquidate investments at an inopportune time. This may prevent a Fund from limiting losses, realizing gains or from achieving a high correlation or inverse correlation with its underlying index.
DIREXION ANNUAL REPORT
49
Market Disruption Risk – Geopolitical and other events, including public health crises and natural disasters, have recently led to increased market volatility and significant market losses. Significant market volatility and market downturns may limit a Fund's ability to sell securities and the Fund's sales may exacerbate the market volatility and downturn. Under such circumstances, a Fund may have difficulty achieving its investment objective for one or more trading days, which may adversely impact the Fund's returns on those days and periods inclusive of those days. Alternatively, the Fund may incur higher costs in order to achieve its investment objective and may be forced to purchase and sell securities (including other ETFs' shares) at market prices that do not represent their fair value (including in the case of an ETF, its net asset value) or at times that result in differences between the price the Fund receives for the security and the market closing price of the security. Under those circumstances, the Fund's ability to track its index is likely to be adversely affected, the market price of Fund shares may reflect a greater premium or discount to net asset value, and bid-ask spreads in the Fund's shares may widen, resulting in increased transaction costs for secondary market purchasers and sellers. The Fund may also incur additional tracking error due to the use of other securities that are not perfectly correlated to the Fund's index.
The recent pandemic spread of the novel coronavirus known as COVID-19 has proven to be a market disrupting event. The impact of this virus, like other pandemics that may arise in the future, has negatively affected and may continue to negatively affect the economies of many nations, companies and the global securities and commodities markets, including by reducing liquidity in the markets. Adverse effects may be more pronounced for developing or emerging market countries that have less established health care systems. How long such events will last and whether they will continue or recur cannot be predicted.
10. SUBSEQUENT EVENTS
Management has performed an evaluation of subsequent events through the date of the financial statements were issued and has determined that no items require recognition or disclosure besides those noted below.
On December 19, 2022, certain Funds declared income distributions with an ex-date of December 20, 2022 and payable date of December 28, 2022. The specific Funds and per share amounts of the distributions are listed below.
Funds | | Per Share
Income
Distribution | |
Direxion Auspice Broad Commodity Strategy ETF (Consolidated) | | $ | 0.86080 | | |
Direxion Breakfast Commodities Strategy ETF (Consolidated) | | | 0.13600 | | |
Direxion Hydrogen ETF | | | 0.02056 | | |
Direxion Nanotechnology ETF | | | 0.00358 | | |
Direxion NASDAQ-100® Equal Weighted Index Shares | | | 0.25014 | | |
Direxion Work From Home ETF | | | 0.08898 | | |
DIREXION ANNUAL REPORT
50
Direxion Shares ETF Trust
Report of Independent Registered Public Accounting Firm
To the Shareholders of Direxion Auspice Broad Commodity Strategy ETF (Consolidated), Direxion Breakfast Commodities Strategy ETF (Consolidated), Direxion Hydrogen ETF, Direxion Moonshot Innovators ETF, Direxion mRNA ETF, Direxion Nanotechnology ETF, Direxion NASDAQ-100® Equal Weighted Index Shares, Direxion Work From Home ETF and the Board of Trustees of Direxion Shares ETF Trust.
Opinion on the Financial Statements
We have audited the accompanying statements of assets and liabilities of Direxion Auspice Broad Commodity Strategy ETF (Consolidated), Direxion Breakfast Commodities Strategy ETF (Consolidated), Direxion Hydrogen ETF, Direxion Moonshot Innovators ETF, Direxion mRNA ETF, Direxion Nanotechnology ETF, Direxion NASDAQ-100® Equal Weighted Index Shares and Direxion Work From Home ETF (collectively referred to as the "Funds") (eight of the funds constituting Direxion Shares ETF Trust (the "Trust")), including the schedules of investments, as of October 31, 2022, and the related statements of operations and changes in net assets and the financial highlights for each of the periods indicated in the table below and the related notes (collectively referred to as the "financial statements"). In our opinion, the financial statements present fairly, in all material respects, the financial position of each of the Funds (eight of the funds constituting Direxion Shares ETF Trust) at October 31, 2022, and the results of their operations, changes in net assets and financial highlights for each of the periods indicated in the table below, in conformity with U.S. generally accepted accounting principles.
Individual fund constituting the Direxion Shares
ETF Trust | | Statement of
operations | | Statements of
changes in net assets | | Financial highlights | |
Direxion Auspice Broad Commodity Strategy ETF (Consolidated)
Direxion NASDAQ-100® Equal Weighted Index Shares | | For the year ended October 31, 2022 | | For each of the two years in the period ended October 31, 2022 | | For each of the five years in the period ended October 31, 2022 | |
Direxion Work From Home ETF | | For the year ended October 31, 2022 | | For each of the two years in the period ended October 31, 2022 | | For each of the two years in the period ended October 31, 2022 and the period from June 25, 2020 (commencement of operations) through October 31, 2020 | |
Direxion Hydrogen ETF | | For the year ended October 31, 2022 | | For the year ended October 31, 2022 and the period from March 25, 2021 (commencement of operations) through October 31, 2021 | |
Direxion Moonshot Innovators ETF | | For the year ended October 31, 2022 | | For the year ended October 31, 2022 and the period from November 12, 2020 (commencement of operations) through October 31, 2021 | |
Direxion Breakfast Commodities Strategy ETF (Consolidated) | | For the period from June 1, 2022 (commencement of operations) through October 31, 2022 | |
Direxion mRNA ETF | | For the period from December 9, 2021 (commencement of operations) through October 31, 2022 | |
Direxion Nanotechnology ETF | | For the period from November 23, 2021 (commencement of operations) through October 31, 2022 | |
DIREXION ANNUAL REPORT
51
Direxion Shares ETF Trust
Report of Independent Registered Public Accounting Firm
Basis for Opinion
These financial statements are the responsibility of the Trust's management. Our responsibility is to express an opinion on each of the Funds' financial statements based on our audits. We are a public accounting firm registered with the Public Company Accounting Oversight Board (United States) ("PCAOB") and are required to be independent with respect to the Trust in accordance with the U.S. federal securities laws and the applicable rules and regulations of the Securities and Exchange Commission and the PCAOB.
We conducted our audits in accordance with the standards of the PCAOB. Those standards require that we plan and perform the audit to obtain reasonable assurance about whether the financial statements are free of material misstatement, whether due to error or fraud. The Trust is not required to have, nor were we engaged to perform, an audit of the Trust's internal control over financial reporting. As part of our audits we are required to obtain an understanding of internal control over financial reporting but not for the purpose of expressing an opinion on the effectiveness of the Trust's internal control over financial reporting. Accordingly, we express no such opinion.
Our audits included performing procedures to assess the risks of material misstatement of the financial statements, whether due to error or fraud, and performing procedures that respond to those risks. Such procedures included examining, on a test basis, evidence regarding the amounts and disclosures in the financial statements. Our procedures included confirmation of securities owned as of October 31, 2022, by correspondence with the custodian, broker and others; when replies were not received from brokers and others, we performed other auditing procedures. Our audits also included evaluating the accounting principles used and significant estimates made by management, as well as evaluating the overall presentation of the financial statements. We believe that our audits provide a reasonable basis for our opinion.
We have served as the auditor of one or more of the Direxion investment companies since 2001.
Minneapolis, Minnesota
December 22, 2022
DIREXION ANNUAL REPORT
52
Direxion Shares ETF Trust
Supplemental Information (Unaudited)
Federal Tax Status of Dividends Declared during the Tax Year
For Federal income tax purposes, dividends from short-term capital gains are classified as ordinary income. The percentage of ordinary income distribution designated as qualifying for the corporate dividend received deduction ("DRD"), the individual qualified dividend rate ("QDI"), the qualified interest income rate ("QII"), and the qualified short-term gain rate ("QSTG") is presented below.
Funds | | DRD | | QDI | | QII | | QSTG | |
Direxion Auspice Broad Commodity Strategy ETF (Consolidated) | | | 0.00 | % | | | 0.00 | % | | | 0.00 | % | | | 0.00 | % | |
Direxion Breakfast Commodities Strategy ETF (Consolidated) | | | 0.00 | % | | | 0.00 | % | | | 0.00 | % | | | 0.00 | % | |
Direxion Hydrogen ETF | | | 10.95 | % | | | 10.95 | % | | | 0.00 | % | | | 0.00 | % | |
Direxion Moonshot Innovators ETF | | | 13.48 | % | | | 13.48 | % | | | 0.00 | % | | | 0.00 | % | |
Direxion mRNA ETF | | | 0.00 | % | | | 0.00 | % | | | 0.00 | % | | | 0.00 | % | |
Direxion Nanotechnology ETF | | | 0.00 | % | | | 0.00 | % | | | 0.00 | % | | | 0.00 | % | |
Direxion NASDAQ-100® Equal Weighted Index Shares | | | 39.63 | % | | | 39.63 | % | | | 0.00 | % | | | 75.26 | % | |
Direxion Work From Home ETF | | | 92.90 | % | | | 92.90 | % | | | 0.00 | % | | | 0.00 | % | |
The Funds are designating as long-term capital gain dividends, pursuant to Internal Revenue Code Section 852(b)(3), the amount necessary to reduce the earnings and profits of the Funds related to net capital gain to zero for the tax year ended October 31, 2022. To the extent necessary to fully distribute such capital gain, the Funds also designate earnings and profits distributed to shareholders on the redemption of shares.
Pursuant to Internal Revenue Code Section 853, the Direxion Hydrogen ETF elects to pass-through to shareholders the credit for taxes paid for foreign countries, which may be less than the actual amount paid for financial statement purposes. For the tax year ended October 31, 2022, the amount of Foreign Source Income is $0.23948309 per share and the amount of Foreign Tax Passthrough is $0.03607525 per share.
Householding
In an effort to decrease costs, the Funds intend to reduce the number of duplicate prospectuses, Annual and Semi-Annual Reports, proxy statements and other similar documents you receive by sending only one copy of each to those addresses shared by two or more accounts and to shareholders we reasonably believe are from the same family or household. Householding begins once you have signed your account application. After such time, if you would like to discontinue householding for your accounts, please call toll-free at (800) 851-0511 to request individual copies of these documents. Once the Funds receive notice to stop householding, we will begin sending individual copies thirty days after receiving your request. This policy does not apply to account statements.
DIREXION ANNUAL REPORT
53
Direxion Shares ETF Trust
Board Review of Investment Advisory Agreement (Unaudited)
Provided below is a summary of certain of the factors the Board of Trustees (the "Board") of the Direxion Shares ETF Trust (the "Trust"), including the trustees who are not "interested persons" as defined in the Investment Company Act of 1940, (the "Independent Trustees"), considered in approving the Investment Advisory Agreement (the "Agreement") between Rafferty Asset Management, LLC (the "Adviser") and the Trust, on behalf of the Direxion Breakfast Commodities Strategy ETF at the February 9, 2022 meeting, a series of the Trust (the "Fund"). The Board, including the trustees who are not "interested persons" of the Trust as defined in the Investment Company Act of 1940 Act, as amended (the "Independent Trustees"), unanimously approved the Agreement on behalf of the Fund. The Board, including the Independent Trustees, determined that the terms of the Agreement for the Fund were fair and reasonable and in the best interests of shareholders.
The Board did not identify any particular information that was most relevant to its consideration to approve the Agreement and each Trustee may have afforded different weight or importance to different factors. The Board considered, among others, the following factors to the extent applicable: (1) the nature, extent, and quality of the services to be provided; (2) the projected profitability to the Adviser based upon its services to be provided to the Fund; (3) the extent to which economies of scale might be realized as the Fund grows; (4) whether fee levels reflect these economies of scale, if any, for the benefit of the Fund's shareholders; (5) comparisons of services and fees with contracts entered into by the Adviser with other clients (such as institutional investors), if any; and (6) other benefits anticipated to be derived and identified by the Adviser from its relationship with the Fund.
Nature, Extent and Quality of Services Provided. The Board considered the nature, extent and quality of the services to be provided under the Agreement by the Adviser. Based on written materials received, a presentation from senior representatives of the Adviser and a discussion with the Adviser about its personnel, operations and financial condition, the Board considered the quality of the services provided by the Adviser under the Agreement. In this regard, the Board considered information regarding the experience, qualifications and professional background of the portfolio managers and other personnel at the Adviser with principal responsibility for the Fund, as well as the capacity and integrity of the Adviser's senior management and staff. The Board noted that the Adviser has provided services to the Trust since its inception date and has developed an expertise in managing funds with investment strategies similar to the Fund. The Board considered the Adviser's representation that it has the financial resources and appropriate staffing to manage the Fund and to meet its fee waiver and expense obligations thereto. The Board considered that the Adviser will oversee all aspects of the operation of the Fund, including oversight of the Fund's service providers, and provide compliance services to the Fund. The Board observed that because the Fund had not commenced operations, it did not have any prior performance history. Under the totality of the circumstances, the Board determined that, in the exercise of its business judgment, the nature, extent and quality of the services to be provided by the Adviser to the Fund under the Agreement were fair and reasonable.
Costs of Services Provided to the Fund and Profits Realized. The Board considered the fairness and reasonableness of the investment advisory fee rate to be paid to the Adviser by the Fund, including in light of the investment advisory services to be provided by the Adviser. The Board considered the fees to be paid to the Adviser on an annual basis, including as limited by the Operating Services Agreement. The Board considered the proposed advisory fee rate and net expense ratio for the Fund was similar to those of comparable exchange-traded funds and to those of similar series of the Trust.
The Board further considered the overall profitability of the Adviser's investment business and, because the Fund had not commenced operations and the Adviser had no profit data related to the Fund, the Board considered the break-even analysis provided by the Adviser for the Fund. The Board considered the significant drivers of cost for the Adviser including, but not limited to, intellectual capital, portfolio rebalancing, regulatory compliance, and entrepreneurial risk. Based on these considerations, the Board determined that, in the exercise of its business judgment, the costs of the services to be provided and any profits that may be realized under the Agreement was not excessive.
Economies of Scale. The Board considered whether economies of scale may be realized by the Fund as it grows larger and the extent to which any such economies of scale are reflected in contractual fee rates. Noting that the Fund had not yet commenced operations and did not yet have any assets, the Board concluded that economies of scale were not a material factor for the Board to consider in approving the Agreement.
Other Benefits. The Board considered the Adviser's representation that its relationship with the Fund may enable it to attract assets to the other funds. The Board also considered that the Adviser's overall business with brokerage firms may allow it to negotiate lower commission rates and get better execution for all of its portfolio trades. Based on these and
DIREXION ANNUAL REPORT
54
Direxion Shares ETF Trust
Board Review of Investment Advisory Agreement (Unaudited)
other considerations, the Board determined that such benefits to the Adviser would likely not be material and, overall, would be reasonable.
Conclusion. The Board did not identify any single factor as being of paramount importance, and different Trustees may have given different weight to different factors. The Board reviewed a memorandum from counsel discussing the legal standards applicable to its consideration of the Agreement. Based on its review, including consideration of each of the factors referenced above, and its consideration of information received throughout the year from the Adviser, the Board determined, in the exercise of its business judgment, that the advisory arrangements, as outlined in the Agreement, were fair and reasonable in light of the services performed, or to be performed, expenses incurred, or to be incurred and such other matters as the Board considered relevant.
DIREXION ANNUAL REPORT
55
Direxion Shares ETF Trust
Board Review of Investment Advisory Agreement (Unaudited)
Consistent with the Investment Company Act of 1940, as amended (the "1940 Act"), the Board of Trustees (the "Board") of the Direxion Shares ETF Trust (the "ETF Trust") annually considers the renewal of the Investment Advisory Agreement (the "Agreement") between Rafferty Asset Management, LLC (the "Adviser") and the ETF Trust, on behalf of the Direxion Auspice Broad Commodity Strategy ETF, along with its wholly owned subsidiary, the Direxion BCS Fund, Ltd., Direxion Hydrogen ETF, Direxion Moonshot Innovators ETF, Direxion NASDAQ-100® Equal Weighted Index Shares and the Direxion Work From Home ETF, each a series of the ETF Trust. The Agreement is initially approved for a two-year period and must be renewed yearly thereafter to remain in effect. Each series of the ETF Trust is referred to herein as a "Fund" and collectively as the "Funds."
At a meeting held on August 18, 2022, the Board, including the trustees who are not "interested persons" of the Trust as defined in the 1940 Act (the "Independent Trustees"), unanimously approved the renewal of the Agreement on behalf of the Funds. The Independent Trustees had previously considered information pertaining to the renewal of the Agreement outside the presence of the Adviser's representatives and Fund management in executive sessions held on August 4, 2022 and August 18, 2022.
In considering whether to renew the Agreement, the Board requested, and the Adviser provided, information that the Board and Adviser believed to be reasonably necessary to evaluate the Agreement. Among other information, the Board obtained and reviewed the following:
• Detailed information regarding the advisory services provided by the Adviser to the Funds;
• The Adviser's Form ADV;
• Information regarding the professional qualifications of those employees primarily responsible for providing services to the Funds;
• Information regarding each component of the contractual advisory fee rates for the prior fiscal year;
• Information regarding advisory fees earned and waivers made by the Adviser in connection with providing services to the Funds for the prior fiscal year or since inception, if shorter;
• Information regarding fees paid to the Adviser under, and an evaluation of the services provided per, the Management Services Agreement for the prior fiscal year as separate and distinct from the fees paid and the services provided under the Agreement;
• Performance information;
• Comparative industry fee data, including peer group comparisons;
• Information regarding the consolidated financial condition of the Adviser and the profitability of each Fund to the Adviser;
• Information regarding how the Adviser monitors the Funds' compliance with regulatory requirements and ETF Trust procedures.
The Board considered that, with respect to most Funds, they had also received information relevant to their annual review of the Agreement since the Fund's inception and, most recently, throughout the past year at regular Board meetings in connection with their oversight of the Funds, including information bearing on the Funds' service provider arrangements and performance results. In addition, the Board received a memorandum from counsel regarding its responsibilities with respect to the approval of the Agreement and participated in a question and answer session with representatives of the Adviser. The Board carefully evaluated the relevant information and the Independent Trustees were advised by legal counsel with respect to their deliberations.
The Board did not identify any particular information that was most relevant to its consideration to approve the Agreement and each Trustee may have afforded different weight or importance to different factors. For each Fund, the Board considered, among other matters, the following factors to the extent applicable: (1) the nature, extent, and quality of the services provided; (2) the investment performance; (3) the profitability of the Fund and the advisory business to the Adviser; (4) the extent to which economies of scale might be realized as the Fund grows and whether fee levels reflect these economies of scale, if any, for the benefit of the Fund's shareholders; (5) comparisons of services and fees with contracts entered into by the Adviser with other clients (such as institutional investors), if any; and (6) other benefits derived or anticipated to be derived by the Adviser from its relationship with the Fund.
DIREXION ANNUAL REPORT
56
Direxion Shares ETF Trust
Board Review of Investment Advisory Agreement (Unaudited)
Nature, Extent and Quality of Services Provided. The Board reviewed, among other matters, the Adviser's business, assets under management, financial resources and capitalization, quality and quantity of personnel, investment and related experience, the variety and complexity of its investment strategies, brokerage practices, the adequacy of its compliance systems and processes, and its reinvestment in each of these areas of the business. The Board reviewed the scope of services provided, and to be provided by the Adviser under the Agreement and noted there would be no significant differences between the scope of services provided by the Adviser in the past year and those to be provided in the upcoming year. The Board also considered the Adviser's representation to the Board that it would continue to provide investment and related services that are of materially the same quality as the services that have been provided to the Funds in the past, and it considered whether those services remain appropriate in scope and extent in light of the Funds' operations, the competitive landscape of the investment company business and investor needs.
The Board focused on the quality of the Adviser's personnel and operations and the systems and processes required to manage the Funds effectively, noting that such personnel, systems and processes may not be present at other investment advisers. The Board considered, as applicable: (1) the Adviser's success in achieving each Fund's investment objective; (2) differences between managing leveraged and non-leveraged portfolios, which include developing index optimization and representative sampling investment strategies as well as specialized skills for trading complex financial instruments; (3) the Adviser's ability to manage the Funds in a tax efficient manner; and (4) the size, professional experience and skills of the Adviser's portfolio management staff and the Adviser's ability to recruit, train and retain personnel with the relevant experience and expertise necessary to manage the Funds. The Board considered that the Adviser oversees all aspects of the operation of the relevant Funds, including oversight of the Funds' service providers, and provides compliance services to the Funds.
Comparison of Advisory Services and Fees. The Board considered the fairness and reasonableness of the investment advisory fee rate payable to the Adviser by each Fund in light of the investment advisory services provided by the Adviser. The Board further considered the fairness and reasonableness of the investment advisory fee rate payable to the Adviser by each Fund in light of fee rates paid by other investment companies offering strategies similar in nature to the Fund. In this regard, the Board reviewed information prepared by the Adviser, using data provided by Morningstar, Inc., to compare the Funds' actual advisory fee rates, and gross and net total expenses with those of other funds with common key characteristics, such as asset size, investment objective or industry focus ("Peer Group"). The Board noted the difficulty in compiling a broad and diverse Peer Group because, by design, each Fund is unique and, therefore, few (if any) fund complexes have funds with substantially similar investment objectives and operations. They noted that an independent consultant had reviewed the Adviser's peer selection methodology and each Fund's resulting peers and determined that the methodology was reasonable and well within industry standards.
The Board noted that the comparison reports included the contractual advisory fee and net and gross total expense ratios for each Fund and each Peer Group fund. The Board considered that the Adviser had agreed to limit the total expenses of the Funds (subject to certain exclusions) for the next year by contractually agreeing to pay certain expenses of the Funds under a separate Operating Services Agreement.
Performance of the Funds. The Board focused on the correlation of each Fund's return to the model performance return, for the periods ending June 30, 2022 and June 30, 2021 or since inception if a Fund did not have two full years of operations. In this regard, the Board considered each Fund's daily returns versus model returns ("Tracking Difference"), the standard deviation of the Tracking Differences ("Tracking Error"), and a tracking analysis provided by the Adviser. The Board also reviewed the total return of each Fund for the one-year or, if shorter, since inception period ended June 30, 2022. The Board considered reports provided to it in anticipation of the meeting, as well as performance reports provided at regular Board meetings throughout the year. The Board noted that the correlation of returns for each Fund to its model performance was generally within expected ranges during the reviewed periods. The Board considered that, given the investment objectives of the Funds, the correlation of each such Fund's performance with the model performance and/or Tracking Error were more meaningful indicia of the quality of the Adviser's management than a Fund's total return.
Costs of Services Provided to the Funds and Profits Realized by the Adviser. The Board reviewed information regarding the profitability of the Adviser based on the fee rates payable under the Agreement. The Board considered the profitability of each Fund and the overall profitability of the Adviser, as reflected in the Adviser's profitability analysis, as well as information provided by the Adviser concerning the methodology used to allocate various expenses. The Board also
DIREXION ANNUAL REPORT
57
Direxion Shares ETF Trust
Board Review of Investment Advisory Agreement (Unaudited)
considered significant drivers of cost for the Adviser including, but not limited to, intellectual capital, the dedication of personnel resources to portfolio management activities, regulatory compliance, and entrepreneurial risk. The Board further considered a report on other investment advisers' profitability, which was compiled using publicly available information. The Board recognized that it is difficult to compare profitability among investment advisory firms because certain information is not publicly available. Further, to the extent such information is available with respect to certain advisers, the Board acknowledged that it is often affected by numerous factors, including the nature of a firm's fund shareholder base, the structure of the adviser and its tax status, the types of funds it manages, its business mix, assumptions regarding allocations and the reporting of operating profits and net income net (rather than gross) of distribution and marketing expenses.
Economies of Scale. The Board considered the asset levels of the Funds and the fact that the size of the Funds is relatively low and assets may fluctuate significantly, and that these facts make economies of scale elusive.
Other Benefits. The Board considered indirect and "fall-out" benefits that the Adviser or its affiliates may derive from their relationship to the Funds. Such benefits include the Adviser's ability to leverage its investment management personnel or infrastructure to manage other accounts. In this regard, the Board noted that the Funds pay a fee to the Adviser under the Management Services Agreement.
Conclusion. Based on, but not limited to, the above considerations, the Board, including the Independent Trustees, determined that the Agreement for the Funds is fair and reasonable in light of the nature, extent and quality of the services to be performed, the fee rates to be paid, the Adviser's expenses and such other matters as the Board considered relevant in the exercise of its business judgment. Accordingly, the Board concluded that the continuation of the Agreement was in the best interests of the shareholders of the Funds. On this basis, the Board unanimously voted in favor of the renewal of the Agreement.
DIREXION ANNUAL REPORT
58
Direxion Shares ETF Trust
Board Review of Liquidity Risk Management Program (Unaudited)
Consistent with Rule 22e-4 under the Investment Company Act of 1940, as amended (the "Liquidity Rule"), the Direxion Shares ETF Trust (the "Trust"), on behalf of each series of the Trust (the "Funds"), established a liquidity risk management program (the "Liquidity Program") to assess and manage each Fund's liquidity risk, which is the risk that a Fund is unable to meet investor redemption requests without significantly diluting the remaining investors' interests in the Fund.
At its November 18, 2022 meeting, the Board of Trustees (the "Board") of the Trust reviewed the Liquidity Program. The Board has appointed Rafferty Asset Management, LLC, the investment advisor to the Funds, as the Liquidity Program administrator. At the meeting, Rafferty Asset Management, LLC provided the Board with a written report that addressed the operation of the Funds' Liquidity Program and assessed the adequacy and effectiveness of the implementation of the Liquidity Program (the "Report"). The Report covered the period from November 1, 2021 through October 31, 2022 (the "Report Period"). The Report noted the following:
• The Liquidity Program supported each Fund's ability to meet redemption requests timely;
• The Liquidity Program supported Rafferty Asset Management, LLC's management of each Fund's liquidity, including during periods of market volatility and net redemptions;
• No material liquidity issues were identified during the report period;
• There was one material change to the Liquidity Program during the Report Period to adjust each Fund's liquidity parameters to reflect more accurately each Fund's redemption activity; and
• The Liquidity Program operated adequately during the report period.
The Report also described the Liquidity Program's liquidity classification methodology for categorizing a Fund's investment (including derivative transactions) into one of four liquidity buckets as required by the Liquidity Rule. The Report stated that the Liquidity Program is operating as intended and is effective in implementing the requirements of the Liquidity Rule.
There can be no assurance that the Liquidity Program will achieve its objectives in the future. Please refer to your Fund's prospectus for more information regarding the Fund's exposure to liquidity risk and other risks.
DIREXION ANNUAL REPORT
59
Direxion Shares ETF Trust
Trustees and Officers (Unaudited)
The business affairs of the Funds are managed by or under the direction of the Board of Trustees. Information pertaining to the Trustees and Officers of the Funds is set below. The report includes additional information about the Funds' Trustees and Officers and is available without charge, upon request by calling 1-800-851-0511.
Interested Trustee
Name, Address and
Age | | Position(s)
Held with
Fund | | Term of Office
and Length of
Time Served | | Principal Occupation(s)
During Past Five Years | | # of Portfolios
in Direxion
Family of
Investment
Companies
Overseen
by Trustee(3) | | Other Trusteeships/
Directorships Held by
Trustee During Past
Five Years | |
Daniel D. O'Neill(1)
Age: 54 | |
Chairman of the Board of Trustees | |
Lifetime of Trust until removal or resignation; Since 2008 | |
Chief Executive Officer, Rafferty Asset Management, LLC, from 2021 – September 2022; Managing Director, Rafferty Asset Management, LLC, January 1999 – January 2019. | | |
144 | | |
None. | |
Angela Brickl(2)
Age: 46 | |
Trustee | |
Lifetime of Trust until removal or resignation; Since 2022 | |
President, Rafferty Asset Management, LLC, from September 2022; Chief Operating Officer, Rafferty Asset Management, LLC, May 2021 – September 2022; General Counsel, Rafferty Asset Management LLC, since October 2010; Chief Compliance Officer, Rafferty Asset Management, LLC, since September 2012. | | |
144 | | |
None. | |
Independent Trustees
Name, Address and
Age | | Position(s)
Held with
Fund | | Term of Office
and Length of
Time Served | | Principal Occupation(s)
During Past Five Years | | # of Portfolios
in Direxion
Family of
Investment
Companies
Overseen
by Trustee(2) | | Other Trusteeships/
Directorships Held by
Trustee During Past
Five Years | |
David L. Driscoll
Age: 53 | |
Trustee | |
Lifetime of Trust until removal or resignation; Since 2014 | |
Partner, King Associates, LLP, since 2004; Board Advisor, University Common Real Estate, since 2012; Principal, Grey Oaks LLP since 2003; Member, Kendrick LLC, since 2006. | | |
144 | | |
None. | |
(1) Mr. O'Neill is affiliated with Rafferty and Direxion. Mr. O'Neill owns a beneficial interest in Rafferty.
(2) Ms. Brickl is affiliated with Rafferty because she serves as an officer of Rafferty.
(3) The Direxion Family of Investment Companies consists of the Direxion Shares ETF Trust which, as of the date of this report, offers for sale to the public 87 of the 134 funds registered with the SEC and the Direxion Funds which, as of the date of this report, offers for sale to the public 10 funds registered with the SEC.
DIREXION ANNUAL REPORT
60
Direxion Shares ETF Trust
Trustees and Officers (Unaudited)
Name, Address and
Age | | Position(s)
Held with
Fund | | Term of Office
and Length of
Time Served | | Principal Occupation(s)
During Past Five Years | | # of Portfolios
in Direxion
Family of
Investment
Companies
Overseen
by Trustee(2) | | Other Trusteeships/
Directorships Held by
Trustee During Past
Five Years | |
Jacob C. Gaffey
Age: 74 | |
Trustee | |
Lifetime of Trust until removal or resignation; Since 2014 | |
Managing Director of Loomis & Co. since 2012; Partner, Bay Capital Advisors, LLC 2008 – 2012. | |
144 | |
None. | |
Henry W. Mulholland
Age: 59 | |
Trustee | |
Lifetime of Trust until removal or resignation; Since 2017 | |
Grove Hill Partners LLC, since 2016 as Managing Partner; Bank of America Merrill Lynch, 1990 – 2015, most recently as Managing Director and Head of Equities for Americas. | |
144 | |
None. | |
Kathleen M. Berkery
Age: 55 | |
Trustee | |
Lifetime of Trust until removal or resignation; Since 2019 | |
Chief Financial Officer, Student Sponsor Partners, since November 2021; Senior Manager – Trusts & Estates, Rynkar, Vail & Barrett, LLC, since 2018; Financial Advisor, Lee, Nolan & Koroghlian Life Planning Group, 2010 – 2017. | |
144 | |
None. | |
Carlyle Peake
Age: 51 | |
Trustee | |
Lifetime of Trust until removal or resignation; Since 2022 | |
Head of US & LATAM Debt Syndicate, BBVA Securities, Inc., since 2011. | |
144 | |
None. | |
Mary Jo Collins
Age: 66 | |
Trustee | |
Lifetime of Trust until removal or resignation; Since 2022 | |
Managing Director, Imperial Capital LLC, since 2020; Director, Royal Bank of Canada, 2014 – 2020. | |
144 | |
None. | |
(2) The Direxion Family of Investment Companies consists of the Direxion Shares ETF Trust which, as of the date of this report, offers for sale to the public 87 of the 134 funds registered with the SEC and the Direxion Funds which, as of the date of this report, offers for sale to the public 10 funds registered with the SEC.
DIREXION ANNUAL REPORT
61
Direxion Shares ETF Trust
Trustees and Officers (Unaudited)
The officers of the Trust conduct and supervise its daily business. Unless otherwise noted, an individual's business address is 1301 Avenue of the Americas, 28th Floor, New York, New York 10019. As of the date of this report, the officers of the Trust, their ages, their business address and their principal occupations during the past five years are as follows:
Principal Officers of the Trust
Name, Address and
Age | | Position(s)
Held with
Fund | | Term of Office
and Length of
Time Served | | Principal Occupation(s)
During Past Five Years | | # of Portfolios
in Direxion
Family of
Investment
Companies
Overseen
by Trustee(2) | | Other Trusteeships/
Directorships Held by
Trustee During Past
Five Years | |
Angela Brickl
Age: 46 | |
President
Chief Compliance Officer | |
One Year; Since 2022
One Year; Since 2018 | |
President, Rafferty Asset Management, LLC, from September 2022; Chief Operating Officer, Rafferty Asset Management, LLC, May 2021 – September 2022; General Counsel, Rafferty Asset Management LLC, since October 2010; Chief Compliance Officer, Rafferty Asset Management, LLC, since September 2012. | |
N/A | |
N/A | |
Patrick J. Rudnick
Age: 49 | |
Principal Executive Officer | |
One Year; Since 2018 | |
Senior Vice President, since March 2013, Rafferty Asset Management, LLC; Senior Vice President, since November 2017, Direxion Advisors, LLC. | |
N/A | |
N/A | |
Corey Noltner
Age: 33 | |
Principal Financial Officer | |
One Year; Since 2021 | |
Senior Business Analyst, Rafferty Asset Management, LLC, since October 2015. | |
N/A | |
N/A | |
Alyssa Sherman
Age: 33 | |
Secretary | |
One Year; Since 2022 | |
Associate General Counsel, Rafferty Asset Management, LLC, since April 2021; Associate, K&L Gates LLP, September 2015 – March 2021. | |
N/A | |
N/A | |
(1) Ms. Brickl serves on the Board of Trustees of the Direxion Funds and Direxion Shares ETF Trust.
(2) The Direxion Family of Investment Companies consists of the Direxion Shares ETF Trust which, as of the date of this SAI, offers for sale to the public 87 of the 134 funds registered with the SEC and the Direxion Funds which, as of the date of this SAI, offers for sale to the public 10 funds registered with the SEC.
DIREXION ANNUAL REPORT
62

ANNUAL REPORT OCTOBER 31, 2022
1301 Avenue of the Americas (6th Ave.), 28th Floor New York, New York 10019 (800) 851-0511 www.direxioninvestments.com
Investment Advisers
Rafferty Asset Management, LLC
Direxion Advisors, LLC
1301 Avenue of the Americas (6th Ave.), 28th Floor
New York, NY 10019
Administrator
U.S. Bancorp Fund Services, LLC
P.O. Box 1993
Milwaukee, WI 53201-1993
Transfer Agent, Custodian & Index Receipt Agent
The Bank of New York Mellon
101 Barclay Street
New York, New York 10286
Independent Registered Public Accounting Firm
Ernst & Young LLP
700 Nicollet Mall, Suite 500
Minneapolis, MN 55402
Distributor
Foreside Fund Services, LLC
3 Canal Plaza, Suite 100
Portland, Maine 04101
www.foreside.com
The Trust's Proxy Voting Policies are available without charge by calling 1-800-851-0511, or by accessing the SEC's website, at www.sec.gov.
The actual voting records relating to portfolio securities during the most recent period ended June 30 (starting with the year ended June 30, 2005) is available without charge by calling 1-800-851-0511 or by accessing the SEC's website at www.sec.gov.
Each Fund's premium/discount information is available free of charge on the Funds' websites or by calling (800) 851-8511 or (833) 547-4417.
The Trust files complete schedule of portfolio holdings with the SEC for its first and third fiscal quarters on Part F of Form N-PORT. The Funds' Part F of Form N-PORT (and Form N-Q prior to April 30, 2019) is available on the SEC's website at www.sec.gov.
This report has been prepared for shareholders and may be distributed to others only if preceded or accompanied by a current prospectus.
THIS PAGE INTENTIONALLY LEFT BLANK
64
THIS PAGE INTENTIONALLY LEFT BLANK
65
THIS PAGE INTENTIONALLY LEFT BLANK
66
At the Direxion Funds, we are committed to protecting your privacy. To open and service your Direxion accounts, we collect and maintain certain nonpublic personal information about you, such as your address, phone number, social security number, purchases, sales, account balances, bank account information and other personal financial information. We collect this information from the following sources:
• Account applications or other forms on which you provide information,
• Mail, e-mail, the telephone and our website, and
• Your transactions and account inquiries with us.
We safeguard the personal information that you have entrusted to us in the following ways:
• As a general policy, only those employees who maintain your account and respond to your requests for additional services have access to your account information.
• We maintain physical, electronic, and procedural safeguards to insure the security of your personal information and to prevent unauthorized access to your information.
We do not disclose any nonpublic personal information about you or our former shareholders to anyone, except as permitted or required by law. In the course of conducting business and maintaining your account we may share shareholder information, as allowed by law, with our affiliated companies and with other service providers, including financial intermediaries, custodians, transfer agents and marketing consultants. Those companies are contractually bound to use that information only for the services for which we hired them. They are not permitted to use or share our shareholders' nonpublic personal information for any other purpose. There also may be times when we provide information to federal, state or local authorities as required by law.
In the event that you hold fund shares of Direxion through a financial intermediary, including, but not limited to, a broker-dealer, bank, or trust company, the privacy policy of your financial intermediary would govern how your nonpublic personal information would be shared with nonaffiliated third parties.
For questions about our policy, please contact us at (800) 851-0511.
This page is not a part of the Annual Report.
DIREXION ANNUAL REPORT

(b) Not applicable
Item 2. Code of Ethics.
The registrant has adopted a code of ethics that applies to the registrant’s principal executive officer and principal financial officer. The registrant has not made any amendments to its code of ethics during the period covered by this report. The registrant has not granted any waivers from any provisions of the code of ethics during the period covered by this report. A copy of the registrant’s Code of Ethics is filed herewith.
Item 3. Audit Committee Financial Expert.
The registrant’s board of trustees has determined that there is at least one audit committee financial expert serving on its audit committee. Kathleen M. Berkery is the “audit committee financial expert” and is considered to be “independent” as each term is defined in Item 3 of Form N-CSR.
Item 4. Principal Accountant Fees and Services.
The registrant has engaged its principal accountant to perform audit services, audit-related services, tax services and other services during the past two fiscal years. “Audit services” refer to performing an audit of the registrant's annual financial statements or services that are normally provided by the accountant in connection with statutory and regulatory filings or engagements for those fiscal years. “Audit-related services” refer to the assurance and related services by the principal accountant that are reasonably related to the performance of the audit. “Tax services” refer to professional services rendered by the principal accountant for tax compliance, tax advice, and tax planning. There were no “Other services” provided by the principal accountant. The following table details the aggregate fees billed or expected to be billed for each of the last two fiscal years for audit fees, audit-related fees, tax fees and other fees by the principal accountant. The table presents aggregate fees billed to the registrant and reflected in the financial statements of the report to shareholders.
| | | FYE 10/31/2022 | | | FYE 10/31/2021 | |
| (a) Audit Fees | | $ | 1,495,000 | | | $ | 1,337,879 | |
| (b) Audit-Related Fees | | $ | 0 | | | $ | 0 | |
| (c) Tax Fees | | $ | 573,588 | | | $ | 442,250 | |
| (d) All Other Fees | | $ | 0 | | | $ | 0 | |
(e)(1) The audit committee has adopted pre-approval policies and procedures that require the audit committee to pre-approve all audit and non-audit services of the registrant, including services provided to any entity affiliated with the registrant.
(e)(2) The percentages of fees billed by Ernst & Young LLP applicable to non-audit services pursuant to waiver of pre-approval requirement were as follows:
| | | FYE 10/31/2022 | | | FYE 10/31/2021 | |
| Audit-Related Fees | | | 0 | % | | | 0 | % |
| Tax Fees | | | 0 | % | | | 0 | % |
| All Other Fees | | | 0 | % | | | 0 | % |
(f) All of the principal accountant’s hours spent on auditing the registrant’s financial statements were attributed to work performed by full-time permanent employees of the principal accountant.
(g) The following table indicates the non-audit fees billed or expected to be billed by the registrant’s accountant for services to the registrant and to the registrant’s investment adviser (and any other controlling entity, etc.—not sub-adviser) for the last two years.
| Non-Audit Related Fees | | FYE 10/31/2022 | | FYE 10/31/2021 |
| Registrant | | None | | None |
| Registrant’s Investment Adviser | | None | | None |
(h) The audit committee of the board of trustees has considered whether the provision of non-audit services that were rendered to the registrant's investment adviser is compatible with maintaining the principal accountant's independence and has concluded that the provision of such non-audit services by the accountant has not compromised the accountant’s independence.
(i) Not applicable
(j) Not applicable
Item 5. Audit Committee of Listed Registrants.
Not applicable to registrants who are not listed issuers (as defined in Rule 10A-3 under the Securities Exchange Act of 1934).
Item 6. Schedule of Investments.
| (a) | Schedule of Investments is included as part of the report to shareholders filed under Item 1 of this Form. |
Item 7. Disclosure of Proxy Voting Policies and Procedures for Closed-End Management Investment Companies.
Not applicable to open-end investment companies.
Item 8. Portfolio Managers of Closed-End Management Investment Companies.
Not applicable to open-end investment companies.
Item 9. Purchases of Equity Securities by Closed-End Management Investment Company and Affiliated Purchasers.
Not applicable to open-end investment companies.
Item 10. Submission of Matters to a Vote of Security Holders.
There have been no material changes to the procedures by which shareholders may recommend nominees to the registrant’s board of directors/trustees.
Item 11. Controls and Procedures.
| (a) | The Registrant’s Principal Executive Officer and Principal Financial Officer have reviewed the Registrant's disclosure controls and procedures (as defined in Rule 30a-3(c) under the Investment Company Act of 1940 (the “Act”)) as of a date within 90 days of the filing of this report, as required by Rule 30a-3(b) under the Act and Rules 13a-15(b) or 15d-15(b) under the Securities Exchange Act of 1934. Based on their review, such officers have concluded that the disclosure controls and procedures are effective in ensuring that information required to be disclosed in this report is appropriately recorded, processed, summarized and reported and made known to them by others within the Registrant and by the Registrant’s service provider. |
| (b) | There were no changes in the Registrant's internal control over financial reporting (as defined in Rule 30a-3(d) under the Act) that occurred during the second fiscal half-year of the period covered by this report that has materially affected, or is reasonably likely to materially affect, the Registrant's internal control over financial reporting. |
Item 12. Disclosure of Securities Lending Activities for Closed-End Management Investment Companies.
Not applicable to open-end investment companies.
Item 13. Exhibits.
(2) A separate certification for each principal executive officer and principal financial officer pursuant to Section 302 of the Sarbanes-Oxley Act of 2002. Filed herewith.
(3) Any written solicitation to purchase securities under Rule 23c-1 under the Act sent or given during the period covered by the report by or on behalf of the registrant to 10 or more persons. Not applicable to open-end investment companies.
(4) Change in the registrant’s independent public accountant. There was no change in the registrant’s independent public accountant for the period covered by this report.
SIGNATURES
Pursuant to the requirements of the Securities Exchange Act of 1934 and the Investment Company Act of 1940, the registrant has duly caused this report to be signed on its behalf by the undersigned, thereunto duly authorized.
| | (Registrant) | Direxion Shares ETF Trust | |
| | By (Signature and Title) | /s/ Patrick J. Rudnick | |
| | | Patrick J. Rudnick, Principal Executive Officer | |
Pursuant to the requirements of the Securities Exchange Act of 1934 and the Investment Company Act of 1940, this report has been signed below by the following persons on behalf of the registrant and in the capacities and on the dates indicated.
| | By (Signature and Title) | /s/ Patrick J. Rudnick | |
| | | Patrick J. Rudnick, Principal Executive Officer | |
| | By (Signature and Title) | /s/ Corey Noltner | |
| | | Corey Noltner, Principal Financial Officer | |

