Exhibit 99.1
PENASCO PETROLEUM, INC.
Estimated Future Reserves and Revenues
as of July 31, 2010
Oil and Gas Properties
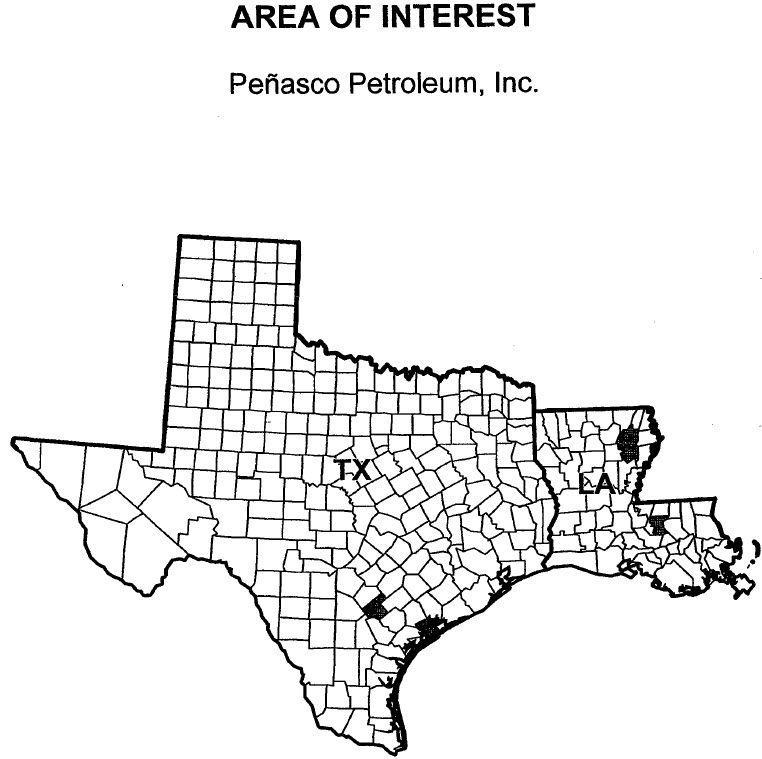
Franklin & Richland Parishes, Louisiana
Calhoun & Karnes Counties, Texas
SEC Guideline Case
| AUSTIN | | HOUSTUH | ||||
| 3345 See Cave.Road | 1001 Mckinney | |||||
| Suite 201 | Suite 420 | |||||
| Austin,Texas 78746 USA | Houston, Texas 77002 USA | |||||
| Tel 512.732.9812 | Tel 713.559.9950 | |||||
| Fax: 512.732.9816 | Fax 713.559.9959 |
www.lonquist.com
September 29,2010
Mr. Jeremy Driver
Strategic American Oil Corporation
600 Leopard Street, Suite 2015
Corpus Christi, Texas 78401
| Re: | Penasco Petroleum, Inc. |
| Year End Reserve Report | |
| Franklin and Richland Parishes, Louisiana | |
| Calhoun and Karnes Counties, Texas | |
| SEC Guideline Case as of July 31, 2010 |
Dear Mr. Driver:
Pursuant to your request, Lonquist & Co., LLC ("L&Co"), has estimated the future oil and gas Reserves and projected the associated future revenues net to the interests owned by Penasco Petroleum, Inc. ("Penasco ") as of July 31, 2010. Assets located in Franklin and Richland Parishes, Louisiana and Calhoun and Karnes Counties, Texas are included in this report. As shown in the following table, 100% of the value is associated with the Proved Developed Producing ("PDP") and Proved Developed Non Producing ("PDNP") Reserves.
Our conclusions, as of July 31, 2010, are summarized below:
| Net to Penasco Petroleum, Inc. | ||||||||||||||||||||||
| Proved Developed | Proved | Total | Total | Total | Grand | |||||||||||||||||
| SEC Guideline Case as of July 31. 2010 | Producing | Non-Producinga | Undeveloped | Proved | Probable | Possible | Totalb | |||||||||||||||
| Estimated Future Net Oil/Condensate, bbl | 59,214 | 37,934 | 0 | 97,148 | 0 | 0 | 97,148 | |||||||||||||||
| Estimated Future Net Gas, MMcf | 122.6 | 40.7 | 0 | 163.2 | 0 | 0 | 163.2 | |||||||||||||||
| Total Future Gross Revenue,$ | 4,807,376 | 2,960,284 | 0 | 7,767,660 | 0 | 0 | 7,767,660 | |||||||||||||||
| Estimated Future Production Taxes,$ | 259.974 | 215,215 | 0 | 475,189 | 0 | 0 | 475,189 | |||||||||||||||
| Estimated Future Operating Expenses, $ | 2,959,776 | 970,370 | 0 | 3,930,146 | 0 | 0 | 3,930,146 | |||||||||||||||
| Estimated Future Capital Costs, $ | 0 | 150,000 | 0 | 150,000 | 0 | 0 | 150,000 | |||||||||||||||
| Estimated Future Net Revenue ("FNR"), $ | 1,587,626 | 1,624,699 | 0 | 3,212,325 | 0 | 0 | 3,212,325 | |||||||||||||||
| Discounted FNR at 10%,$ | 1,164,258 | 584,371 | 0 | 1,748,629 | 0 | 0 | 1,748,629 | |||||||||||||||
Discounted FNR at 15%, $ | 1,028,602 | 372,767 | 0 | 1,401,569 | 0 | 0 | 1,401,569 | |||||||||||||||
| Estimated Net Revenues by Year, $ | ||||||||||||||||||||||
| 2010 | 148,341 | 0 | 0 | 146,341 | 0 | 0 | 146,341 | |||||||||||||||
| 2011 | 297,810 | 0 | 0 | 297,810 | 0 | 0 | 297,810 | |||||||||||||||
| 2012 | 246,835 | 0 | 0 | 246,835 | 0 | 0 | 246,835 | |||||||||||||||
| Subtotal | 690,986 | 0 | 0 | 690,986 | 0 | 0 | 690,986 | |||||||||||||||
| Thereafter | 896,640 | 1,624,699 | 0 | 2,521,339 | 0 | 0 | 2,521,339 | |||||||||||||||
| Total | 1,587,626 | 1,624,699 | 0 | 3,212,325 | 0 | 0 | 3,212,325 | |||||||||||||||
| Estimated Net Production Rate -2010 | ||||||||||||||||||||||
| Oil/Conensate, B/D | 23.9 | 0 | 0 | 23.9 | 0 | 0 | 23.9 | |||||||||||||||
| Gas, Mcf/D | 40.4 | 0 | 0 | 40.4 | 0 | 0 | 40.4 | |||||||||||||||
aColumn indudes the Proved Non-Producing, shut-in and behind-pipe classifications
bTotals might not add due to computer rounding.
Penasco Petroleum, Inc.- Year End Reserve Report
SEC Guideline Case as of July 31, 2010
September 29, 2010
Page 2 of 5
Purpose of Report
This report has been prepared to provide the management of Penasco Petroleum, Inc. with a projection of estimated remaining Reserves and projected future net revenues as of July 31, 2010. This report conforms to U.S. Security and Exchange Commission ("SEC") year-end reporting requirements. These estimates have not been adjusted for risk.
Standards of Practice
This report has been prepared in accordance with our understanding of the Securities and Exchange Commission, SX Reg.§ 210.4-10, dated November 18, 1981 as amended September 19, 1989, requiring adherence to definitions of "Proved" oil and gas Reserves. The SEC oil and gas Reserve definitions are attached hereto.
Reserve Estimates
Reserve estimates were determined by extrapolation of historical production data for those producing properties where sufficient information was available to suggest decline trends. Reserves were adjusted incorporating water production history. Reserves were assigned to the remaining producing properties and any non-producing assets were determined by analogy to offset wells producing from similar formations, or by volumetric analysis. Reserves assigned by analogy and volumetric analysis were subject to greater revision than Reserves projected which used established performance trends.
As of July 31, 2010, the Proved net remaining Reserves were estimated to be 97,148 barrels of oil and 163.2 MMcf of gas. The net present value, discounted at 10%, of the Proved Reserves was $1,748,629. Of the total PDP revenue, 91.5% was derived from oil production. The total net remaining Reserves when
converted to BOE at a 6:1 conversion rate was 124,355 barrels. The Reserve life index ("R/P") for the PDP Reserves was estimated to be 7.1 years based on a 6:1 conversion rate.
Notable Properties
Welder, Patrick H.Lease, Calhoun County, Texas
The Welder, Patrick H. lease is located in Calhoun County, Texas, approximately 120 miles southwest of Houston; TX near Port Lavaca, and is operated by Carter E & P, LLC. The Frio Sands are of Oligocene age. Vertical stacking of barrier sands produced the sequences of multiple stacked reservoirs of the Frio plays. Despite stratigraphic complexities, many of the stacked reservoirs are in communication and have a common oil-water contact. Field structures, simple rollover anticlines and domes are commonly fault bounded.
The Welder lease produces from the Barge Canal field in the Frio Sands formation. The two active wells in this lease are the Welder, Patrick H. No. 3L (Frio 5,940 ft) well and the No. 5U (Frio 5,490 ft) well. The Welder, Patrick H. No. 1 is a salt water disposal ("SWD") well, with behind-pipe Reserves in the Frio 5,880 ft sand. The Welder, Patrick H. No. 5 well is expected to be completed uphole when the Frio 5,490 ft. zone is depleted. When the Welder, Patrick H. No. 5 is depleted, the well will be converted to a SWD well, and the Welder, Patrick H. No. 1 well will then be recompleted uphole in the Frio 5,880 ft sand.
Volumetrics are based on open hole logs and production performance is based on analogous well production. The Welder, Patrick H. No. 3 well currently produces approximately seven barrels of oil per day from the Frio Sand, Barge Canal field and the Welder, Patrick H. No.5 well produces approximately two barrels of oil per day from the Frio Sand, Barge Canal field. As of July 31, 2010, the estimated net remaining Reserves for the Welder, Patrick H. lease were 63,600 barrels of oil and 155.7 MMcf of gas. The future net revenue, discounted at 10%, was $1,094,181, which represents 62.6% of the total discounted future net revenue.
Penasco Petroleum, Inc.- Year End Reserve Report
SEC Guideline Case as of July 31, 2010
September 29, 2010
Page 3 of 5
Holt, J.E. -A- Lease, Franklin Parish, Louisiana
The Holt, J.E. -A- lease is located in Franklin Parish, Louisiana approximately 120 miles west of Shreveport, LA operated by Tradestar Energy, Inc. The Holt, J.E. -A- wells produce from the KNY (Tuscaloosa) sand in the South Delhi Field. The Lower Tuscaloosa Sand is the oldest Upper Cretaceous age fonnation. The Tuscaloosa Sand is subdivided into three distinct units, from deepest to shallowest; the Massive Sand, the "A" & "B" Sands, and the Pilot Sand. The KNY Sand is part of the "A" & "B" Sand. The "A" & "B" Sand is lenticular in nature. The Holt. J.E. -A-lease shows signs of being a typical long life water drive oil lease.
The Holt, J.E. -A- No. 4 & 10 are in a Unit lease. The Holt, J.E. -A- No. 4 well is shut-in ("SI"), and the No. 10 well is currently producing approximately seven barrels of oil per day. A point of clarification concerning the historical production data should be noted. State production records indicate the Holt, J.E. -A- No.4 well had equal production to the Holt, J.E. -A- No. 10, however the production was reported on a Unit lease basis and only the Holt, J.E. -A- No. 10 well produces and accounts for all production on the lease. The Holt, J.E. -A- Nos. 22 & 24 wells began producing, respectively, in August and November of 2009 after a workover due to tubing wear issues. The Holt, J.E. -A- No. 22 is producing three barrels of oil per day and the Holt -A- No. 24 is producing two barrels of oil per day. The Holt, J.E. -A- No. 15 is a SWD well and has no Reserves assigned to the well. As of July 31, 2010, the estimated net remaining Reserves for the Holt, J.E. -A- Lease were 20,980 barrels of oil, and the future net revenue, discounted at 10%, was $421,178, representing 24.1% ofthe total discounted future net revenue.
Dixon Lease, Franklin Parish,Louisiana
The Dixon lease is located in Franklin Parish, Louisiana, approximately 120 miles west of Shreveport, LA, and is operated by Tradestar Energy, Inc. The Dixon No. 1 well produces from the KNY (Tuscaloosa) Sand in the South Delhi Field. The Lower Tuscaloosa Sand is the oldest Upper Cretaceous age formation. The Tuscaloosa Sand is subdivided into three distinct units, from deepest to shallowest; the Massive Sand, the "A" & "B" Sands, and the Pilot Sand. The KNY Sand is part of the "A" & "B" Sand. The "A" & "B" Sand is lenticular in nature.
The Dixon No. 1 is currently producing about eight barrels of oil per day. As of July 31, 2010, the estimated net remaining Reserves for the Dixon No. 1 were 8,140 barrels of oil, and the future net revenue, discounted at 10%, was $171,921, representing 9.8% of the total discounted future net revenue.
Product Prices
The base product prices of $76.51 per barrel and $4.51 per MMbtu utilized herein are the average closing NYMEX (Cushing, OK WTI) spot oil and gas prices of the first trading day of each month from August 2009 to July 2010, as reported by the Energy lnfonnation Administration. As required by SEC regulations, no price escalations were included in this report. Realized product prices in this report reflect adjustments for heating content, premiums and product differentials based on revenue statements provided. The realized product prices presented in the cash flows do not reflect deductions for transportation costs. These costs, where applicable, were included as operating expenses.
Penasco Petroleum, Inc.- Year End Reserve Report
SEC Guideline Case as of July 31, 2010
September 29, 2010
Page 4 of 5
Operating Costs
Direct lease operating expenses were input as dollars per month into the economic models. These data were supplied by Penasco. Where applicable, lease operating costs were adjusted for non-recurring costs. Operating costs were not escalated in this report. Compression charges, saltwater disposal and gas lift were included on a cost per unit basis.
Severance and ad valorem taxes were deducted as a percentage of gross revenues or as a charge per unit of production. The individual well projections of oil and gas ceased when the operating expenses exceeded the gross revenues.
Capital Expenditures
Capital costs were furnished to us by Penasco, and were based on authorizations for expenditure for the proposed work or actual costs for similar projects.
Values Not Considered
In all cases, we have attempted to account for all deductions from gross revenues except for the following:
| ● | Federal Income Taxes |
| ● | Depreciation, depletion, and/or amortization, if any |
| ● | Costs in excess of revenues of uneconomic leases |
| ● | Plugging and abandonment costs in excess of salvage value |
| ● | Environmental restoration costs, if any |
| ● | Product price hedges, if any |
No value has been assigned to non-producing acreage or to acreage held by production.
Report qualifications
Estimates of future revenues were based on projections of recoverable hydrocarbons, rates of production, timing of recompletions and drilling, proration by state and federal agencies, operating costs, direct taxes, and product prices. Any unusual combination of the many factors, including weather, political risk or acts of terrorism could result in future receipts being considerably less or more than those estimated herein.
THE REVENUES AND PRESENT WORTH OF FUTURE NET REVENUES ARE NOT REPRESENTED TO BE MARKET VALUES EITHER FOR THE INDIVIDUAL PROPERTIES OR IN A TOTAL PROPERTY BASIS.
The Reserves and revenues for specific properties should be considered in context with the overall report.
Penasco Petroleum, Inc.- Year End Reserve Report
SEC Guideline Case as of July 31, 2010
September 29, 2010
Page 5 of 5
Data Sources
Data including basic well information, realized product prices; operating costs, initial test rates, and ownership interests were supplied by Pel'lasco Petroleum, Inc. lonquist & Co., LLC accepted these data as correct.
Historical production data were obtained from Penasco and public sources, such as Las$er Production Data Service$, HPDI, LLC, Drillinglnfo.com, aild IHS Ene(gy Oata Services. This production data wa·s generally updated though June 2010. Lonquist & Co., \..LC retains the digital database for all properties and certain other hard copy information W1ich we believe pertinent. We have not in pected the properties evaluated in this report, nor have we conducted independent well tests.
Independent Evaluation
Neither Lonquist & Co., LLC nor any of its employees have any interest or ownership in the subject property. and neither our employment nor compensation is contingent on our findings herein.

OIL AND GAS RESERVE DEFINITIONS
The Securities and Exchange Commission, SX Reg.§ 210.4-10 dated November 18, 1981 as amended September 19, 1989 requires adherence to the following definitions of "Proved" oil and gas reserves:
Definitions:
(2) Proved oil and gas reserves. Proved oil and gas reserves are the estimated quantities of crude oil, natural gas, and natural gas liquids which geological and engineering data demonstrate with reasonable certainty to be recoverable in future years from known reservoirs under existing economic and operating conditions, i.e., prices and costs as of the date the estimate is made. Prices include consideration of changes in existing prices provided only by contractual arrangements, but not on escalations based upon future conditions.
(i) Reservoirs are considered proved if economic producibility is supported by either actual production or conclusive formation test. The area of a reservoir considered proved includes (A) that portion delineated by drilling and defined by gas-oil and/or oil-water contacts, if any; and (B) the immediately adjoining portions not yet drilled, but which can be reasonably judged as economically productive on the basis of available geological and engineering data. In the absence of information on fluid contacts, the lowest known structural occurrence of hydrocarbons controls the lower proved limit ofthe reservoir.
(ii) Reserves which can be produced economically through application of improved recovery techniques (such as fluid injection) are included in the "proved" classification when successful testing by a pilot project, or the operation of an installed program in the reservoir, provides support for the engineering analysis on which the project or program was based.
(iii) Estimates of proved reserves do not include the following: (A) oil that may become available from known reservoirs but is classified separately as "indicated additional reserves"; (B) crude oil, natural gas, and natural gas liquids, the recovery of which is subject to reasonable doubt because of uncertainty as to geology, reservoir characteristics, or economic factors; (C) crude oil, natural gas, and natural gas liquids, that may occur in undrilled prospects; and (D) crude oil, natural gas, and natural gas liquids, that may be recovered from oil shales, coal, gilsonite and other such sources.
(3) Proved developed oil and gas reserves. Proved developed oil and gas reserves are reserves that can be expected to be recovered through existing wells with existing equipment and operating methods. Additional oil and gas expected to be obtained through the application of fluid injection or other improved recovery techniques for supplementing the natural forces and mechanisms of primary recovery should be included as "proved developed reserves" only after testing by a pilot project or after the operation of an installed program has confirmed through production response that increased recovery will be achieved.
(4) Proved undeveloped reserves. Proved undeveloped oil and gas reserves are reserves that are expected to be recovered from new wells on undrilled acreage, or from existing wells where a relatively major expenditure is required for recompletion. Reserves on undrilled acreage shall be limited to those drilling units offsetting productive units that are reasonably certain of production when drilled. Proved reserves for other undrilled units can be claimed only where it can be demonstrated with certainty that there is continuity of production from the existing productive formation. Under no circumstances should estimates, for proved undeveloped reserves be attributable to any acreage or which an application of fluid injection or other improved recovery technique is contemplated, unless such techniques have been proved effective by actual tests in the area and in the same reservoir.
Amended SEC guidelines Reg. § 210.4-10 definitions (Modernization of Oil and Gas Reporting; Final Rule; January 14, 2009):
(17) Possible reserves. Possible reserves are those additional reserves that are less certain to be recovered than probable reserves.
(i) When deterministic methods are used, the total quantities ultimately recovered from a project have a low probability of exceeding proved plus probable plus possible reserves. When probabilistic methods are used, there should be at least a 10 percent probability that the total quantities ultimately recovered will equal or exceed the estimated proved plus probable plus possible reserves estimates.
(ii) Possible reserves may be assigned to areas of a reservoir adjacent to probable reserves where data control and interpretations of available data are progressively less certain. Frequently, this will be in areas where geoscience and engineering data are unable to define clearly the area and vertical limits of commercial production from the reservoir by defined project.
(18) Probable reserves. Probable reserves are those additional reserves that are less certain to be recovered than proved reserves, but which, together with proved reserves, are as likely as not to be recovered.
(i) When deterministic methods are used, that the actual remaining quantities recovered will exceed the sum of the estimated proved plus probable plus reserves. When probabilistic methods are used, there should be at least a 50 percent probability that the quantities actually recovered will equal or exceed the proved plus probable reserves estimates.
(ii) Probable reserves may be assigned to areas of a reservoir adjacent to proved reserves where data control or interpretations of available data are less certain, even if the interpreted reservoir continuity of structure or productivity does not meet the reasonable certainty criterion. Probable reserves may be assigned to areas that are structurally higher than the proved area if these areas are in communication with the proved reservoir.