    Exhibit 99.2 |
 2 © 2013 Cole Real Estate Investments, Inc. All Rights Reserved. In addition to historical information, this presentation contains forward-looking statements within the meaning of Section 27A of the Securities Act of 1933, as amended, and Section 21E of the Securities Exchange Act of 1934, as amended. These forward- looking statements, which are based on current expectations, estimates and projections about the industry and markets in which Cole operates, include beliefs of and assumptions made by Cole’s management, and involve risks and uncertainties that could significantly affect the financial results of Cole. Words such as “may,” “expects,” “anticipates,” “intends,” “plans,” “believes,” “projects,” “seeks,” “estimates,” “would,” “could” and “should” and variations of such words and similar expressions are intended to identify such forward-looking statements, which generally are not historical in nature. Such forward-looking statements include, but are not limited to, statements about the benefits of the business combination transaction with Cole Holdings Corporation, future financial and operating results, and the company’s plans, objectives, expectations and intentions. All statements that address operating performance, events or developments that we expect or anticipate will occur in the future are forward-looking statements. These statements are not guarantees of future performance and involve certain risks, uncertainties and assumptions that are difficult to predict. Although we believe the expectations reflected in any forward-looking statements are based on reasonable assumptions, we can give no assurance that our expectations will be attained and therefore, actual outcomes and results may differ materially from what is expressed or forecasted in such forward-looking statements. Some of the factors that could cause actual results to differ materially from any forward-looking statements include, among others, (i) changes in national, international, regional and local economic conditions, (ii) changes in financial markets, interest rates, credit spreads, and foreign currency exchange rates, (iii) changes in real estate conditions, (iv) continued ability to source new investments, (v) risks associated with acquisitions, (vi) construction costs that may exceed estimates, and construction delays, (vii) lease-up risks, rent relief, and inability to obtain new tenants upon the expiration or termination of existing leases, (viii) maintenance of real estate investment trust status, (ix) legal matters, (x) availability of financing and capital generally, (xi) inability to obtain financing or refinance existing debt and the potential need to fund tenant improvements or other capital expenditures out of operating cash flows, (xii) changes in demand for properties, and (xiii) additional risks and factors discussed in reports filed by the Company with the SEC from time to time. Cole does not make any undertaking with respect to updating any forward looking statements appearing in this presentation. Forward-Looking Statements |
 3 © 2013 Cole Real Estate Investments, Inc. All Rights Reserved. Disclosures The properties pictured have been acquired by Cole. Corporate tenants may also occupy numerous properties that are not owned by Cole or Cole-sponsored programs. Cole is not affiliated or associated with, is not endorsed by, does not endorse, and is not sponsored by or a sponsor of the tenants or the joint venture partners shown, or of their products or services pictured or mentioned. The names, logos and all related product and service names, design marks and slogans are the trademarks or service marks of their respective companies. Tenants, Trademarks and Logos |
 4 © 2013 Cole Real Estate Investments, Inc. All Rights Reserved. 1,014 349 MILLION SQUARE FEET OWNED (2) 44 99.1% OCCUPANCY BASED ON SQUARE FEET (2) 48 INVESTMENT GRADE TENANTS (5) SINGLE-TENANT ACQUISITIONS 1 YEARS IN A ROW (4) INVESTMENT PROGRAMS OFFERED SINCE 1979 100 + $60M $120M 34 YEARS COMMERCIAL REAL ESTATE EXPERIENCE NORMALIZED EBITDA CONTRIBUTION ANNUALIZED FROM Q2 (7) 10 PROPERTIES OWNED (2) PROPERTIES MANAGED (8 ) AVERAGE MONTHLY CAPITAL RAISE (6) GROSS ASSETS (1) 55% PRIVATE CAPITAL 7.5 BILLION 12.2 YEARS WEIGHTED AVERAGE REMAINING LEASE TERM (3) STATES (2) $ 365 PROFESSIONALS 16 MILLION SQUARE FEET MANAGED (8) Cole Real Estate Investments by the Numbers REAL ESTATE • Market leading net lease REIT • First-class management team • Valuable private capital fees Data as of 6/30/2013. For notes, see “About the Data”. 3 CURRENTLY FUNDRAISING # |
 5 © 2013 Cole Real Estate Investments, Inc. All Rights Reserved. Best-in-Class Management Platform with a Proven Team of Professionals JEFF HOLLAND, CFA PRESIDENT AND CHIEF OPERATING OFFICER 16 YEARS OF EXPERIENCE BlackRock | Raymond James McKinsey & Company THOMAS W. ROBERTS HEAD OF REAL ESTATE INVESTMENTS 25 YEARS OF EXPERIENCE Opus West | Koll Company DAVID LYNN, Ph.D. HEAD OF INVESTMENT STRATEGY & RESEARCH 25 YEARS OF EXPERIENCE ING Clarion | AIG Global Real Estate AvalonBay Communities AARON HALFACRE, CFA HEAD OF STRATEGIC RELATIONS 15 YEARS OF EXPERIENCE BlackRock Real Estate Green Street Advisors STEPHAN KELLER CHIEF FINANCIAL OFFICER 20 YEARS OF EXPERIENCE UBS CHONG P. HUAN HEAD OF TECHNOLOGY & INFRASTRUCTURE 20 YEARS OF EXPERIENCE Citi | AIG | New York Life MARC NEMER CHIEF EXECUTIVE OFFICER 15 YEARS OF EXPERIENCE Latham & Watkins | Skadden Arps CHRISTOPHER H. COLE EXECUTIVE CHAIRMAN 34 YEARS OF EXPERIENCE Founder, Cole Real Estate Investments JEAN CALLAHAN HEAD OF HUMAN RESOURCES 21 YEARS OF EXPERIENCE Booz Allen Hamilton KIMBERLY SMITH GENERAL COUNSEL 25 YEARS OF EXPERIENCE ING | Sutherland, Asbill & Brennan REAL ESTATE INVESTMENTS REAL ESTATE OPERATIONS CORPORATE PRIVATE CAPITAL Sales, Shareholder Services, Investor & Broker Dealer Relationships, and Other Support Functions Investment Strategy & Research, Acquisitions, Underwriting, Dispositions and Legal & Risk Management Real Estate Finance, Property Management, Leasing and Property Marketing Legal, Accounting, Human Resources, Information Technology, Facilities Management and Administrative 72 PROFESSIONALS 59 PROFESSIONALS 108 PROFESSIONALS 126 PROFESSIONALS KIRK McALLASTER, CPA HEAD OF REAL ESTATE FUNDS 21 YEARS OF EXPERIENCE Deloitte | Coopers & Lybrand |
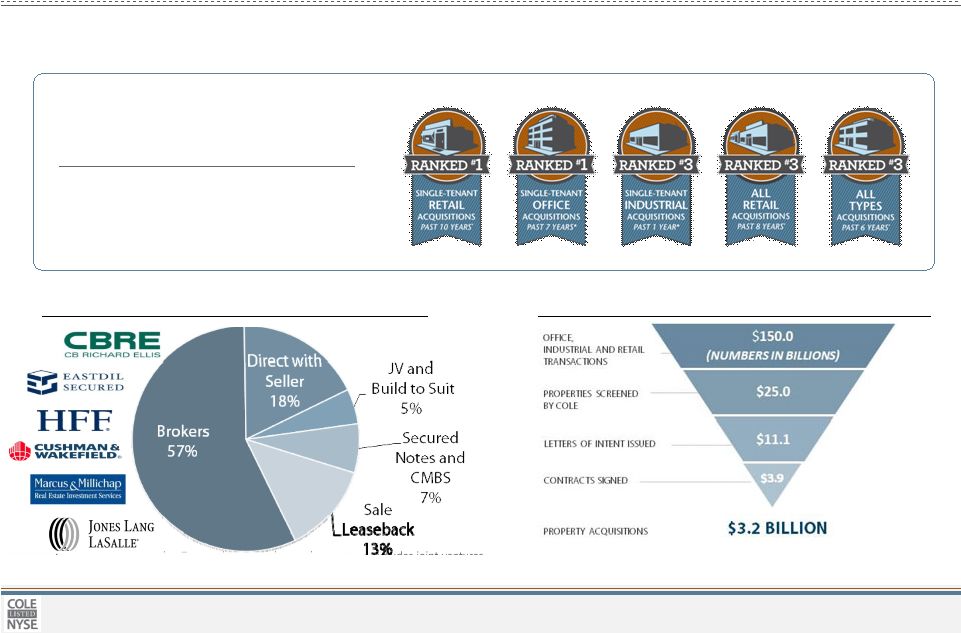 6 © 2013 Cole Real Estate Investments, Inc. All Rights Reserved. 1. Source: Real Capital Analytics. Transactions closed or under contract, excludes joint ventures. As of 6/30/2013. 2. Broker relationships listed are a sample set and not exhaustive of all broker relationships. Deal sourcing chart and underwriting funnel include all owned and managed property acquisitions in 2012. We Have Created an Industry Leading Platform BILLION OF TOTAL ACQUISITION HISTORY $14 ALL SINGLE-TENANT ACQUISITIONS PAST TEN YEARS (1) # 1 We’ve maintained leadership in the market by combining our best-in-class management, integrated investment philosophy and disciplined process Delivering diverse deal sourcing (2) And disciplined acquisition results (2) |
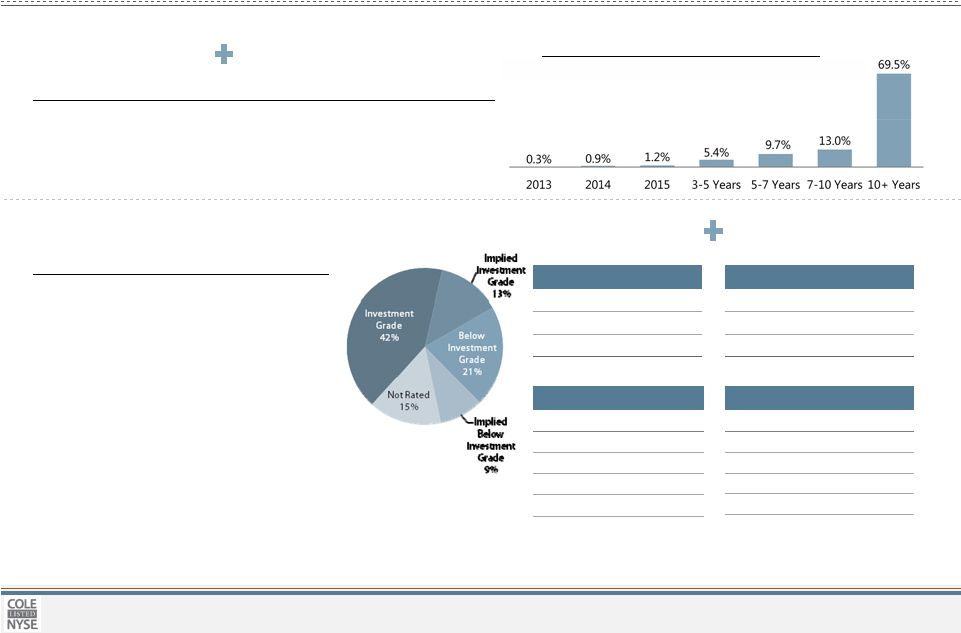 7 © 2013 Cole Real Estate Investments, Inc. All Rights Reserved. » 42% of Cole's annual rent is derived from tenants rated investment grade and another 13% from tenants with an implied rating of investment grade » Cole performs extensive upfront credit analysis and ongoing credit monitoring for all tenants » Implied investment grade ratings are based on Moody’s Credit Edge or Moody’s KMV in conjunction with current financial statements Cole’s business has maintained high portfolio occupancy and one of the longest weighted average remaining lease terms of all net lease peers, providing highly visible, predictable cash flows Market-Leading Lease Duration and Substantial Investment Grade Tenancy 12.2 Years Weighted Average Lease Term (1) Lease Expiration Profile (1) 55% Investment Grade Tenants (2) Example Tenant Implied Rating Publix AA Cracker Barrel AA- Tractor Supply AA- Aaron’s Rents A Ulta A+ Rating % of Total AAA to AA- 8.2% A+ to A- 12.6% BBB+ to BBB- 21.6% 42.4% Implied Rating % of Total AAA to AA- 3.8% A+ to A- 2.3% BBB+ to BBB- 7.1% 13.2% Example Tenant Rating Wells Fargo AA- Amazon AA- Wal-Mart AA Target A+ Home Depot A- 42% Investment Grade 13% Implied Investment Grade 99.1% Portfolio Occupancy 1. Lease Expiration shows certain information regarding the lease expirations of Cole’s real estate portfolio, including consolidated joint ventures, as of June 30, 2013, based on annualized rental revenue, during each of the next ten years and thereafter, excluding unconsolidated JVs and CMBS/Secured notes receivable. 2. Credit ratings based on annualized rental revenue from tenants with credit ratings of BBB- or higher. Tenant credit rating may reflect the credit rating of the parent company or a guarantor. Credit ratings exclude unconsolidated JVs and CMBS/Secured notes receivable. Moody’s Credit Edge was used to determine implied credit rating for public non-rated tenants. Moody’s KMV was used to determine implied credit rating for private non-rated tenants. Data for implied ratings as of July 29, 2013. Example tenants are from the Cole portfolio. |
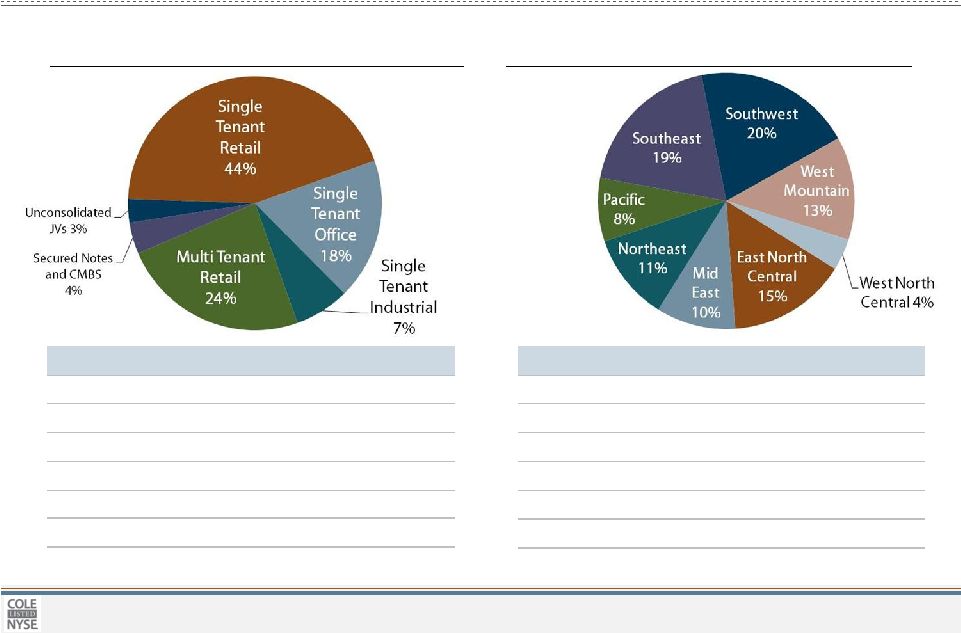 © 2013 Cole Real Estate Investments, Inc. All Rights Reserved. Geographic Diversity Investment Type Diversity Well Diversified by Investment Type and Geography PROPERTY TYPE PROPERTIES SQUARE FEET ST Retail 886 17.7mm ST Office and Industrial 55 15.2mm MT Retail – Power Center 36 8.5mm MT Retail – Grocery 13 1.3mm MT Retail – Anchored 24 1.3mm Total 1,014 44.0mm Tables and charts show certain information regarding the tenant and industry diversification of Cole’s real estate portfolio, including consolidated joint ventures, as of June 30, 2013, based on annualized rental revenue. TOP 10 STATES BY % OF ANNUALIZED RENTAL REVENUE Texas 16.9 Georgia 5.1 Arizona 8.6 Michigan 3.8 California 7.1 New Jersey 3.6 Florida 7.0 Ohio 3.2 Illinois 5.4 Virginia 3.2 Total 63.9 8 |
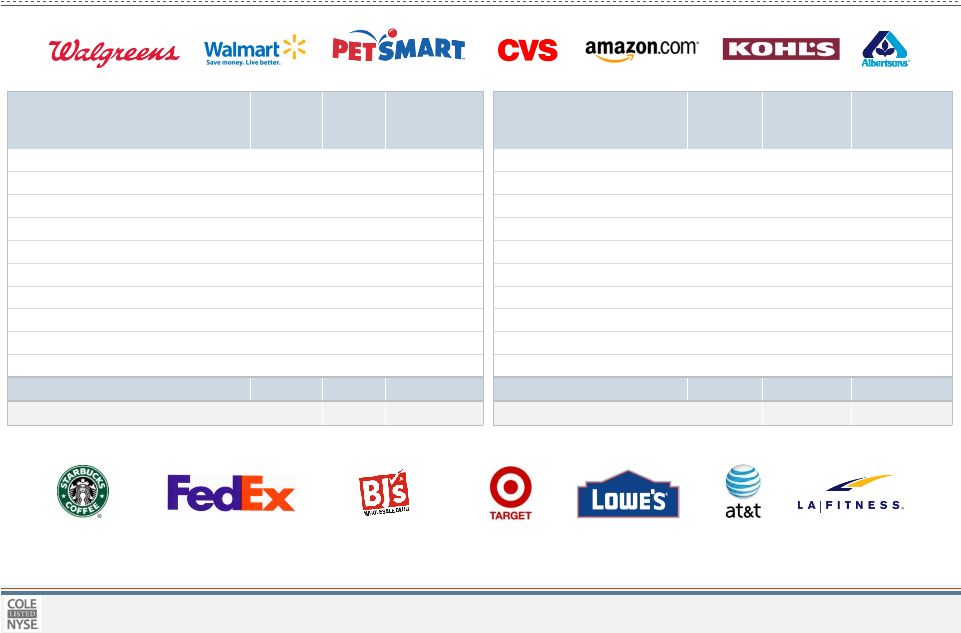 © 2013 Cole Real Estate Investments, Inc. All Rights Reserved. Tables and charts show certain information regarding the tenant and industry diversification of Cole’s real estate portfolio, including consolidated joint ventures, as of June 30, 2013, based on annualized rental revenue. Trade names shown are those of tenants of properties owned by Cole. Cole is not affiliated or associated with, is not endorsed by, does not endorse, and is not sponsored by or a sponsor of the tenants or of their products or services pictured or mentioned. The names, logos and all related product and service names, design marks and slogans are the trademarks or service marks of their respective companies. Tables show certain information regarding the tenant and industry diversification of Cole’s real estate portfolio, including consolidated joint ventures, as of March 31, 2013, based on annualized rental revenue. TOP 10 TENANTS NUMBER OF LEASES % OF ANNUAL RENT WTD. AVG. REMAINING LEASE TERM WALGREENS 73 4.8% 17.9 YRS ALBERTSON'S 34 4.2% 16.8 YRS PETSMART 42 4.2% 8.3 YRS CVS 54 3.6% 18.1 YRS BJ'S WHOLESALE CLUB 3 3.4% 17.7 YRS WAL-MART 9 2.7% 11.0 YRS APOLLO GROUP 1 2.6% 17.8 YRS L.A. FITNESS 17 2.5% 11.0 YRS AMAZON 3 2.5% 13.3 YRS HOME DEPOT 12 2.3% 14.9 YRS TOP 10 TOTAL 248 32.8% TOTAL NUMBER OF TENANTS 567 TOP 10 INDUSTRIES NUMBER OF LEASES % OF ANNUAL RENT WTD. AVG. REMAINING LEASE TERM GROCERY 75 9.1% 15.3 YRS DRUGSTORE 127 8.4% 18.0 YRS DISCOUNT STORE 228 7.8% 10.1 YRS FULL SERVICE RESTAURANT 189 6.8% 14.6 YRS HOME AND GARDEN 69 5.5% 13.4 YRS PET SUPPLIES 49 4.5% 8.2 YRS WAREHOUSE CLUB 7 4.3% 16.2 YRS HEALTHCARE 58 4.0% 11.2 YRS FINANCIAL SERVICES 61 3.5% 12.0 YRS LIMITED SERVICE RESTAURANT 133 3.3% 11.3 YRS TOP 10 TOTAL 996 57.2% TOTAL NUMBER OF INDUSTRIES 36 High Quality, Diversified Tenant Base Comprised of Industry Leaders . 9 |
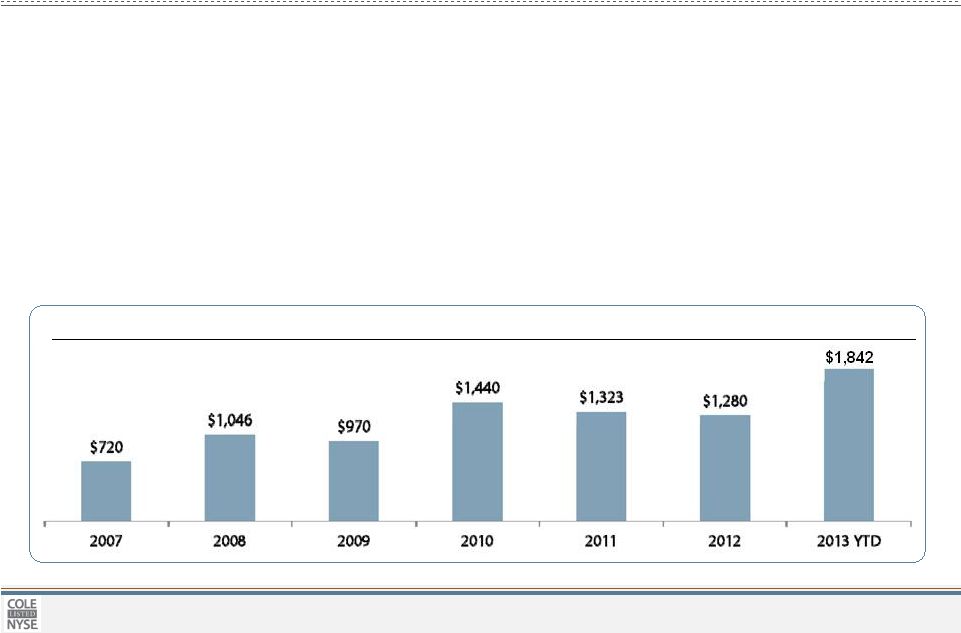 © 2013 Cole Real Estate Investments, Inc. All Rights Reserved. Private Capital Business with Proven Ability to Raise Cycle-Resistant Capital Capital Raise History (1) Cole’s private capital management business, Cole Capital™ , has raised over $8.6 billion of capital since 2007 (1) Disciplined Recurring • Our past results demonstrate the recurring, repeatable nature of our revenue • The sequencing of each new offering provides consistency across the three fee categories • Transaction activity associated with a continuous pipeline from our private capital business allows us to maintain industry relevance and sustain our market intelligence when others cannot • Our disciplined investment strategy and proven ability to acquire accretive assets provides an opportunity to attract a long-term investor base that values year-in, year-out execution 10 1. Cole Real Estate Investments. Data as of August 30, 2013. Excludes capital raise pursuant to the REITs’ distribution reinvestment plans. |
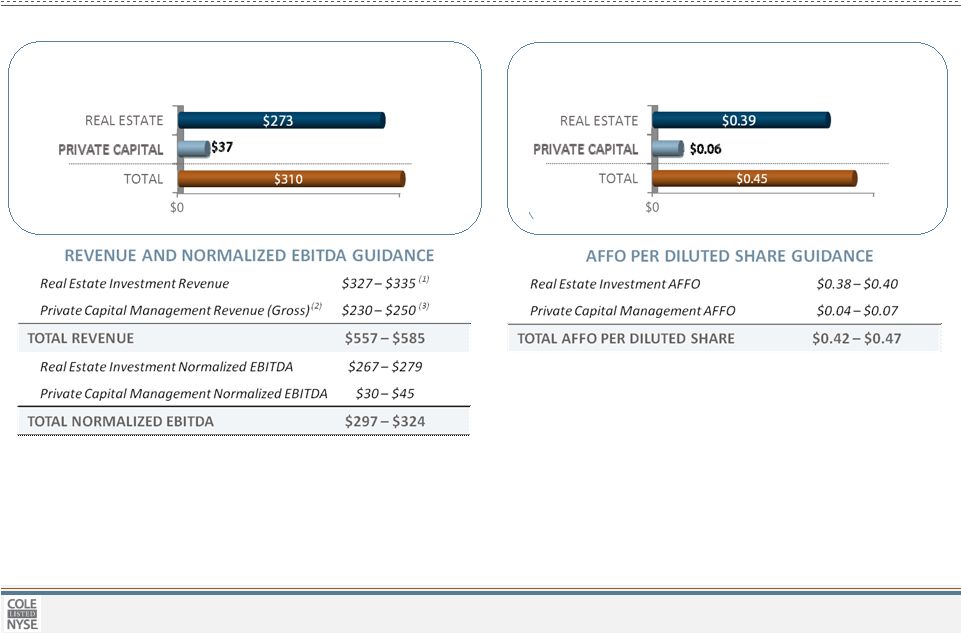 © 2013 Cole Real Estate Investments, Inc. All Rights Reserved. Note: All dollars in millions, except per share data; All US GAAP except Normalized EBITDA and AFFO. See “About the Data” for a description of the Non-GAAP financial measures and accompanying Supplemental Financial Information for GAAP reconciliation. 2H2013E AFFO and NORMALIZED EBITDA compositions are based on the mid point of the respective financial ranges. 2H13E AFFO PER DILUTED SHARE COMPOSITION 2H13E NORMALIZED EBITDA COMPOSITION ($mm) Increased 2013 Second Half Guidance 1. Real Estate Investment Revenue includes $9 million from estimated Interest income on real estate related investments. Estimates assume $550 million of net acquisitions in the second half at a 7.3% cap rate and include the potential impact of the $250 million tender offer and up to $250 million of share repurchases. Funding sources for investment activity will come from a combination of property dispositions, CMBS sales, cash on balance sheet and/or the use of the credit facility with a target total debt to gross assets ratio not to exceed 50%. 2. Private Capital Management Revenue (Gross) is presented before reallowed fees and commissions. On a net basis Adjusted Revenues are estimated to be $66 - $78 million. 3. Includes the impact of CCPTII’s merger with Spirit Realty Capital, Inc., which closed on July 17, 2013. Assumes $1.67 billion of capital raised in 2H13 within Cole’s private capital management business, Cole Capital™, raised predominantly across Cole Corporate Income Trust, Inc., a single-tenant office and industrial portfolio, and Cole Credit Property Trust IV, Inc., a single and multi-tenant retail portfolio. 11 |
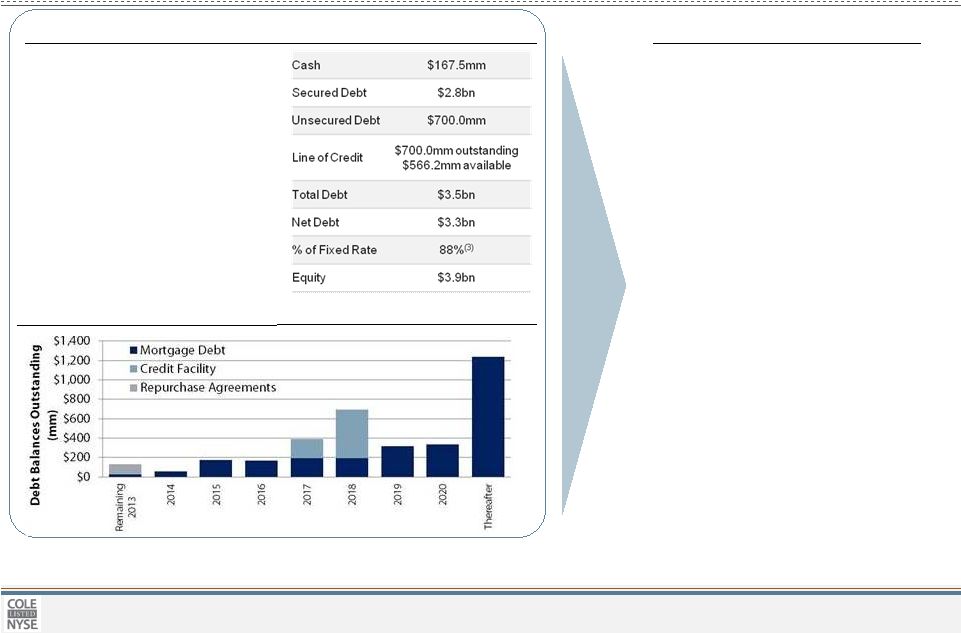 © 2013 Cole Real Estate Investments, Inc. All Rights Reserved. • Optimize cost of capital • Increase flexibility • Reduce leverage • Transition to unsecured debt exposure • Achieve investment grade rating • Diversify funding sources Key Balance Sheet Metrics and Capital Structure (1) 1. Data as of June 30, 2013. Additionally, investors should review the Supplemental Financial Information for the second quarter of 2013 furnished on Form 8-K on 8/5/2013 for additional information. 2. Gross Book Value of unencumbered properties includes $1.9 billion of assets pledged to the credit facility as of June 30, 2013. 3. Includes the credit facility’s term loan of $500.0 million and $473.0 million of variable rate debt each subject to interest rate swap agreements. • 39% Debt to Enterprise Value • 47% Debt to Gross Real Estate and Related Assets • 5.4x Net Debt to Normalized EBITDA Ratio • 3.2x Interest Coverage Ratio • 4.22% Weighted average cost of debt • 6.0 Weighted average years to maturity • Gross Book Value of Unencumbered Properties $2.0bn (2) A Strong Balance Sheet with Embedded Opportunity Debt Maturity Profile Capital Structure Objectives 12 |
 13 © 2013 Cole Real Estate Investments, Inc. All Rights Reserved. Why Cole? » Active portfolio management to monetize gains and redeploy capital » Yield enhancement through property type diversification » Future deal pipeline and yield potential via joint ventures » Embedded annual rental increases » Best-in-class platform built for size and scale » Proven ability to source and acquire high-quality accretive assets » Disciplined acquisition results via rigorous underwriting and credit discipline » Proactive risk management to protect and enhance NOI Our focus is on growing AFFO per share while maintaining a balanced risk profile » Valuable fee revenue provides diversified income growth » Ability to raise cycle-resistant capital capturing growing income investor trends » Continuously developing new products and distribution relationships |
 14 © 2013 Cole Real Estate Investments, Inc. All Rights Reserved. About the Data Slide Notes: “Cole Real Estate Investments by the Numbers” The depicted pie chart graphically illustrates the composition of metrics associated with the owned assets (COLE REIT) and managed assets (PRIVATE CAPITAL) with the ratio shown being reflective of their respective contributions to total annual AFFO. 1. Based on total gross real estate assets net of gross intangible lease assets, including investments in notes receivable, marketable securities and net investment in unconsolidated entities, as applicable. 2. Statistics exclude properties owned through unconsolidated joint ventures, as applicable. 3. Weighted Average Remaining Lease Term is based on annualized straight-line rental revenue. 4. Source: Real Capital Analytics. Transactions closed or under contract, excludes joint ventures. As of 6/30/2013. 5. 55% investment grade includes 13% related to tenants with an implied rating of investment grade. Credit ratings based on annualized rental revenue from tenants with credit ratings of BBB- or higher. Tenant credit rating may reflect the credit rating of the parent company or a guarantor. Credit ratings exclude unconsolidated JVs and CMBS/Secured notes receivable. Moody’s Credit Edge was used to determine implied credit rating for public non-rated tenants. Moody’s KMV was used to determine implied credit rating for private non-rated tenants. Data for implied ratings as of July 29, 2013. Example tenants are from the Cole portfolio. 6. Cole raised over $6.9b in capital over the last 56 months, or approximately $122mm each month. Average monthly capital raise for 2012 and 2013 was $107mm and $230mm, respectively (as of August 30, 2013). 7. Based upon an annualized second quarter Normalized EBITDA of $15.0mm for the private capital management segment. See “About the Data” for a description of the Non-GAAP financial measures and accompanying Supplemental Financial Information for GAAP reconciliation. 8. Includes Cole Credit Property Trust IV, Inc., Cole Corporate Income Trust, Inc., Cole Real Estate Income Strategy (Daily NAV), Inc., Cole Credit Property Trust, Inc. (“CCPT”), and tenant-in-common and Delaware statutory trust programs. Excludes Cole Credit Property Trust II which merged with Spirit Realty Capital, Inc. on July 17, 2013. |
 15 © 2013 Cole Real Estate Investments, Inc. All Rights Reserved. About the Data (continued) Supplemental Information The supplemental financial information package for the second quarter ended June 30, 2013 and the Company's Form 10-Q report for the same period, were filed on August 5, 2013 and are available on Cole's website at www.colereit.com. Non-GAAP Financial Measures FFO and AFFO Funds From Operations (“FFO”) is a non-GAAP financial performance measure defined by the National Association of Real Estate Investment Trusts (“NAREIT”) and widely recognized by investors and analysts as one measure of operating performance of a real estate company. The FFO calculation excludes items such as real estate depreciation and amortization, gains and losses on the sale of depreciable real estate and impairments of depreciable real estate. Depreciation and amortization as applied in accordance with GAAP implicitly assumes that the value of real estate assets diminishes predictably over time. Since real estate values have historically risen or fallen with market conditions, it is management’s view, and we believe the view of many industry investors and analysts, that the presentation of operating results for real estate companies by using the historical cost accounting method alone is insufficient. In addition, FFO excludes gains and losses from the sale of depreciable real estate and impairment charges on depreciable real estate, which we believe provides management and investors with a helpful additional measure of the performance of our real estate portfolio, as it allows for comparisons, year to year, that reflect the impact on operations from trends in items such as occupancy rates, rental rates, operating costs, general and administrative expenses, and interest costs. We compute FFO in accordance with NAREIT’s definition. In addition to FFO, we use Adjusted Funds From Operations (“AFFO”) as a non-GAAP supplemental financial performance measure to evaluate the operating performance of our real estate portfolio. AFFO, as defined by our company, excludes from FFO merger, acquisition, and listing related costs, amortization and write off of deferred financing costs, straight-line rent adjustments, above and below market lease intangibles amortization, realized loss on derivatives and debt prepayment fees, gain on sale of marketable securities, other amortization or accretion, other gains, adjustments for discontinued operations and our proportionate share of adjustments for unconsolidated joint ventures, all of which are required to be expensed or recorded as additions to revenue or other income in accordance with GAAP. In evaluating the performance of our portfolio over time, management employs business models and analyses that differentiate the costs to acquire investments from the investments’ revenues and expenses. Management believes that excluding the items noted above from AFFO provides investors with supplemental performance information that is consistent with the performance models and analysis used by management, and provides investors a view of the performance of our portfolio over time, including after the Company ceases to acquire properties on a frequent and regular basis. AFFO also allows for a comparison of the performance of our portfolio with other REITs that are not currently engaging in acquisitions and mergers, as well as a comparison of our performance with that of other REITs, as AFFO, or an equivalent measure, is routinely reported by REITs, and we believe often used by analysts and investors for comparison purposes. For all of these reasons, we believe FFO and AFFO, in addition to net income and cash flows from operating activities, as defined by GAAP, are helpful supplemental performance measures and useful in understanding the various ways in which our management evaluates the performance of our real estate portfolio over time. However, not all REITs calculate FFO and AFFO the same way, so comparisons with other REITs may not be meaningful. FFO and AFFO should not be considered as alternatives to net income or to cash flows from operating activities, and are not intended to be used as a liquidity measure indicative of cash flow available to fund our cash needs. |
 16 © 2013 Cole Real Estate Investments, Inc. All Rights Reserved. About the Data (continued) Non-GAAP Financial Measures continued EBITDA and Normalized EBITDA Normalized EBITDA as disclosed represents EBITDA, or earnings before interest, taxes, depreciation and amortization, modified to include other adjustments to GAAP net income for merger, acquisition, and listing related expenses which are considered non-recurring and gain/losses in real estate and derivatives which are not considered fundamental attributes of our business plans and do not affect our overall long-term operating performance. We exclude these items from Normalized EBITDA as they are not the primary drivers in our decision making process. In addition, our assessment of our operations is focused on long-term sustainability and not on such non-cash items, which may cause short term fluctuations in net income but have no impact on cash flows. We believe that Normalized EBITDA is a useful supplemental measure to investors and analysts for assessing the performance of our business segments, although it does not represent net income that is computed in accordance with GAAP. Therefore, Normalized EBITDA should not be considered as an alternative to net income or as an indicator of our financial performance. We use Normalized EBITDA as one measure of our operating performance when we formulate corporate goals and evaluate the effectiveness of our strategies. Normalized EBITDA may not be comparable to similarly titled measures of other companies. Adjusted Revenue Adjusted Revenue is a non-GAAP financial measure that represents revenue on a GAAP basis adjusted to eliminate revenue recorded as reimbursement revenue in accordance with GAAP. Included within Offering Fee Revenue and Management Fee Revenue is revenue related to expense reimbursements for offering costs and certain general and administrative costs incurred by the Company, included in general and administrative expense of the Company, which is reimbursed by the managed REITs. We believe that excluding the items noted above from revenue provides investors with supplemental performance information that is consistent with the performance models and analysis used by management. Adjusted Revenues should not be considered as an alternative to revenue or cash flows from operating activities computed on a GAAP basis as a measure of our profitability. Adjusted Revenues may not be comparable to similarly titled measures of other companies. GAAP Reconciliations A reconciliation of net income to FFO, AFFO and Normalized EBITDA and a reconciliation of revenue to adjusted revenue are provided in the Supplemental Financial Information for the second quarter of 2013 accompanying this presentation. Lease Yield Lease yield is calculated as the average annual rental income, adjusted for any rent concessions or abatements, for the in-place leases over the non- cancellable lease term at the respective property divided by the property purchase price, exclusive of acquisition costs. In general, our properties are subject to long-term triple net or double net leases, and the future costs associated with the double net leases are unpredictable and may reduce the yield. |