UNITED STATES
SECURITIES AND EXCHANGE COMMISSION
Washington, D.C. 20549
FORM 6-K
Report of Foreign Issuer
Pursuant To Rule 13a-16 Or 15d-16 of the
Securities Exchange Act of 1934
For the month of May 2022
Commission File Number: 333-251238
|
COSAN S.A.
(Exact name of registrant as specified in its charter)
N/A
(Translation of registrant’s name into English)
|
Av. Brigadeiro Faria Lima, 4100, – 16th floor
São Paulo, SP 04538-132 Brazil
(Address of principal executive offices)
Indicate by check mark whether the registrant files or will file annual reports under cover of Form 20-F or Form 40‑F:
Form 20-F ☒ Form 40-F ☐
Indicate by check mark if the registrant is submitting the Form 6-K in paper as permitted by Regulation S-T Rule 101(b)(1):
Yes ☐ No ☒
Indicate by check mark if the registrant is submitting the Form 6-K in paper as permitted by Regulation S-T Rule 101(b)(7):
Yes ☐ No ☒
Earnings Release COSAN S.A. 1st Quarter of 2022 São Paulo, May 13, 2022 - COSAN S.A. (B3: CSAN3; NYSE: CSAN) announces today its results for the first quarter (January, February and March) of 2022 (1Q22). The results are presented on a consolidated basis, in conformity with the accounting practices adopted in Brazil and International Financial Reporting Standards (IFRS). The comparisons made in this report consider 1Q22 vs. 1Q21, except where otherwise indicated. 1Q22 Executive Summary Executive Summary - Cosan Pro forma1 1Q22 1Q21 Chg. % 4Q21 Chg. %BRL mln (Jan-Mar) (Jan-Mar) 1Q22/1Q21 (Oct-Dec) 1Q22/4Q21 Net Revenue 34,719.8 22,511.9 54.2% 34,352.8 1.1% Adjusted EBITDA2 2,700.1 2,575.6 4.8% 2,762.4 -2.3% Raízen (50%) 889.9 1,042.3 -14.6% 1,679.9 -47.0% Compass Gás & Energia 702.6 578.0 21.6% 608.0 15.5% Moove 173.4 188.0 -7.7% 109.6 58.2% Rumo 1,002.0 832.1 20.4% 419.2 n/a Cosan Investments3 18.4 - n/a 46.1 -60.1% Cosan Corporate4 (81.7) (76.9) 6.2% (103.0) -20.7% Eliminations (4.4) 12.2 n/a 2.6 n/a Net Income 510.2 827.7 -38.4% 1,277.4 -60.1% Adjusted Net Income2 236.1 764.6 -69.1% 411.2 -42.6% Cash Generated (Used)5 (1,868.7) (3,765.4) -50.4% 694.4 n/a Leverage6 2.0x 3.0x -1.0x 2.1x -0.1x Note 1: Considers the consolidation of 50% of Raízen S.A.. Note 2: Adjusted EBITDA and Net Income exclude non-recurring effects, as detailed on page 13 of this report. Note 3: As from 1Q22, the results of Cosan Investimentos comprise Radar, Payly, Trizy and Porto São Luis, as well as other corporate expenses of the segment. In 4Q21, the results consider only the months of November and December 2021 for Radar. Note 4: EBITDA of Cosan Corporate before equity income (loss). Up to 4Q21, it included Payly, Trizy and other expenses of Cosan Investimentos. Note 5: Free Cash Flow to Equity (FCFE) before dividend payments. Note 6: Net Debt/EBITDA LTM adjusted by lease liabilities (IFRS 16). Adjusted EBITDA in 1Q22 achieved R$2.7 billion, 5% higher than in 1Q21. The better operational performance of Rumo, driven by higher transported volumes, and of Compass, supported by continued improvement at Comgás and the consolidation of Sulgás, offset the lower sales volume of Renewables and Sugar in 1Q22, the period ending the 2021/22 crop year for Raízen. Note that the consistent execution amid the challenging scenario led Raízen to reach a record adjusted EBITDA of R$10.7 billion in the crop year (+20% on a pro forma basis). Net income came to R$510 million (-38%) in the quarter, reflecting the higher financial expenses at all Cosan businesses, which followed the rise in interest rates. Free cash flow to equity (FCFE) was negative by R$1.9 billion, however improving 50%, mainly due to the funding operations at Compass and higher operating cash flow at Raízen, despite the cash expenditures related to the acquisition of Sulgás by Compass and payment of the second installment for acquisition of the Port of São Luís by Cosan Investimentos. At March 31st, 2022, the leverage ratio decreased to 2.0x (-1.0x) net debt/EBITDA LTM (ex-IFRS16), explained by significant EBITDA growth in the last 12 months driven mainly by the better performances of Raízen and Compass and by non-recurring effects at Cosan Corporate related to Raízen’s IPO, the acquisition of Biosev and the gain from a bargain purchase at Radar. EARNINGS CONFERENCE CALL May 16, 2022 (Monday) Portuguese (simultaneous translation into English) Time: 2:00 p.m. (Brasília) | 1:00 p.m. (New York) HD Webinar BR: click here (Code 1484) HD Webinar EN: click here (Code 9971) BR: +55 (11) 4935-1146 | USA: +1 (914) 359-2483 INVESTOR RELATIONS E-mail: ri@cosan.com Telephone: +55 11 3897-9797 Website: www.cosan.com.br/en/ CSAN B3 Listed NM NYSE
Earnings Release COSAN S.A. 1st Quarter of 2022 A. Message from the CEO With the start of a new year, new challenges and new opportunities arise. 2022 began intense, with high volatility in the international scenario aggravated by the war in Ukraine. The sharp fluctuations in macroeconomic indicators and commodity prices adversely affected our markets, which required greater focus and agility from our teams. Once again, we overcame adversities with a consistent execution in each one of our businesses, while pursuing our long-term strategy. Whithin this context, we delivered robust results in our entire portfolio, reaching EBITDA1 of R$2.7 billion (+5%) in the quarter. Raízen ended the crop year with record-high results, supported by the better prices captured in Renewables & Sugar and by strong sales volume growth in fuels. This was a memorable year due to several important achievements: the company's listing on the B3, the successful merger of Biosev, significant progress in the profitable Renewables agenda, expansion of the Marketing & Services platform, among many others. Well done, Raízen team. And I am certain that they will continue to lead the transition to a cleaner energy matrix while reshaping the future of energy. Compass delivered robust performance, driven by continued progress at Comgás in its plan to expand the client base and capture operating efficiency gains, consolidating itself as a reference utility company in Brazil, with an NPS2 of 62. We also took over the control of Sulgás in January, and since then have consolidated its results into our financial statements. We remain focused on integrating the asset and have identified innumerous opportunities to create even more value for our clients in Rio Grande do Sul. Lastly, work on the São Paulo Regasification Terminal continues to advance in line with planning and will soon be added to our Gas & Energy platform. Moove delivered solid figures, in line with expectations for the year. As a global reference in lubricants, we keep focused on expanding our international footprint by growing in countries where we already operate while also pursuing new expansion opportunities. Rumo delivered significant EBITDA growth that set a new record for a first quarter. We maximized our commercial strategy and registered significant increase in transported volumes, which benefitted from the earlier than usual soybean harvest. As a result, we captured relevant market share gains in our main markets. Lastly, we celebrated important progress in our regulatory agenda by receiving preliminary authorization for extending the rail network to Lucas do Rio Verde and Cuiabá. Being able to share with you each quarter our continued progress is a great source of pride. We are facing challenging times, which reinforced our decision to adopt more conservative guidelines for the Group's investments in the year. But that will not prevent us from moving forward on our journey of growth and creating value for all stakeholders. In line with our responsible capital allocation process, in April, we approved the payment of over R$800 million in dividends. We also prioritize the safety and development of our people and operations, seeking the highest governance levels for the strategic direction of our portfolio. Supported by our diverse, qualified and committed teams, we continue to build paths towards sustainable development. Looking forward to seeing you on Cosan Day! Warm regards. Luis Henrique Guimarães Chief Executive Officer, Cosan Note 1: Pro forma EBITDA, i.e., includes 50% of Raízen, adjusted by the non-recurring items listed on page 13 Note 2: Net Promoter Score Note 3:Terminal de Regasificação de São Paulo
Earnings Release COSAN S.A. 1st Quarter of 2022 B. EESG Highlights Publication of Cosan Sustainability Report 2021 In April, Cosan published its Sustainability Report 2021, which highlights the advances in its EESG journey. The report was prepared in accordance with the standards of the Global Reporting Initiative (GRI) and incorporates the indicators of the Sustainability Accounting Standards Board (SASB) as well as recommendations from the Task Force on Climate-Related Financial Disclosures (TCFD). Publication of Compass Sustainability Report 2021 In May, the second Compass Gás & Energia Sustainability Report was published, which reflects the achievements and evolutions obtained in 2021 in its businesses and in the Environmental, Social and Governance Flags and Goals assumed in alignment with the Sustainable Development Goals (SDG) of the United Nations (UN). Cosan’s Group Adherence to UN Global Compact In 2022, we celebrated the adhesion of all companies in our portfolio as signatories of the Global Compact, an initiative proposed by the UN to encourage companies to adopt policies of corporate social responsibility and sustainability. The movement is a dialogue between companies, unions, non-governmental organizations and other partners for the development of a more inclusive and sustainable global market. Issue of Sustainability-Linked Debentures by Raízen In April, Raízen announced conclusion of its first issue of Sustainability-Linked Debentures (SLD) associated with ESG targets, which raised R$1.2 billion. The proceeds will be used for investments aligned with Raízen’s expansion plan, which include increasing the supply of more renewable, sustainable and cleaner energy and reinforcing its leadership in the transition and decarbonization of the global energy matrix. Evolution of Rumo's ESG Risk performance at Sustainalytics This year, Sustainalytics reassessed Rumo's ESG risk rating, which evolved from high to medium performance risk. Sustainalytics ESG Risk Ratings measure a company's exposure to material, industry-specific ESG risks and how well a company is managing those risks. For more information and the latest Cosan Sustainability Report, visit: https://www.cosan.com.br/en/sustainability/
Earnings Release COSAN S.A. 1st Quarter of 2022 C. Results by Business Unit The business units comprising Cosan’s portfolio and a brief description of their market segments follow. Raízen: A joint venture created by Cosan and Shell in 2011, Raízen is redefining the future of energy. With an integrated and unique ecosystem, it operates from the production and processing of sugarcane to the production and marketing of sugar and renewable energy, including even the distribution of fuels and operations in the convenience and proximity store segment. Since August 2021, Raízen’s shares are listed on the São Paulo Stock Exchange (B3) under the ticker "RAIZ4". The Renewables business comprises the production, sourcing, marketing and trading of ethanol; production and marketing of bioenergy; resale and trading of electricity; and production and marketing of renewable products (solar energy and biogas). Meanwhile, the Sugar business involves the production, sourcing, marketing and trading of sugar. Marketing & Services encompasses fuel distribution and the convenience and proximity store operations in Brazil, Argentina and more recently in Paraguay, under the Shell brand. In Brazil, we operate in the proximity segment under the brands Shell Select and OXXO, in partnership with FEMSA Comércio, through JV Grupo NÓS. In Argentina, the segment also includes oil refining and the marketing of lubricants and other specialty products. The Financial Statements and Earnings Release of Raízen are available at: ri.raizen.com.br/en/ Compass Gás & Energia: Launched in 2020, Compass is a Gas & Power platform specializing in creating options for an increasingly less regulated natural gas market. It offers client-centered services and solutions to expand access to natural gas in safely, efficiently and competitively, which contributes to a more secure energy matrix, economic development and expansion of Brazil’s infrastructure. In the natural gas distribution segment, Compass has Comgás, Brazil’s largest piped gas distributor, and Sulgás, a natural gas distributor in the state of Rio Grande do Sul. Compass’ portfolio also includes projects in the Natural Gas and Energy sectors, such as the São Paulo LNG Regasification Terminal (TRSP). The Financial Statements and Earnings Release of Compass are available at: compassbr.com/en/ Moove: A global reference in lubricants, Moove produces and distributes products under the Mobil and Comma brands, with operations in Brazil and other countries in South America (Argentina, Bolivia, Uruguay and Paraguay), as well as in Europe (United Kingdom, Spain, Portugal and France) and the United States. It markets lubricants and other products for applications in the automotive and industrial segments, and also is an importer and distributor of base oils in the Brazilian market. Rumo: Brazil’s largest independent rail logistics operator, connecting the country’s main agricultural commodity producing regions to the country’s main ports. It also operates in port loading and goods storage at terminals. Through Brado, Rumo also offers container operations in both the domestic and international markets. Rumo has been listed under the ticker "RAIL3" since 2015 on the Novo Mercado, the listing segment of the São Paulo Stock Exchange (B3) with the highest corporate governance standards. The Financial Statements and Earnings Release of Rumo are available at: ri.rumolog.com/en/ Cosan Investimentos the Company’s vehicle for new businesses and innovation, with investments in projects adjacent to its current portfolio. The following assets are part of Cosan Investimentos’ current portfolio: 50% interest in Radar, which operates in agricultural land management; Port of São Luís in Maranhão; investments in the Climate Tech Fund managed by Fifth Wall, one of the largest venture capital firms specializing in technological innovation; Trizy, a startup developing a marketplace for logistic technologies; and Payly, a fintech offering credit to small and midsized entrepreneurs operating in our ecosystem. Cosan Corporate: segment representing Cosan’s corporate structure, which includes expenses with consulting services, personnel, and various lawsuits, as well as other investments.
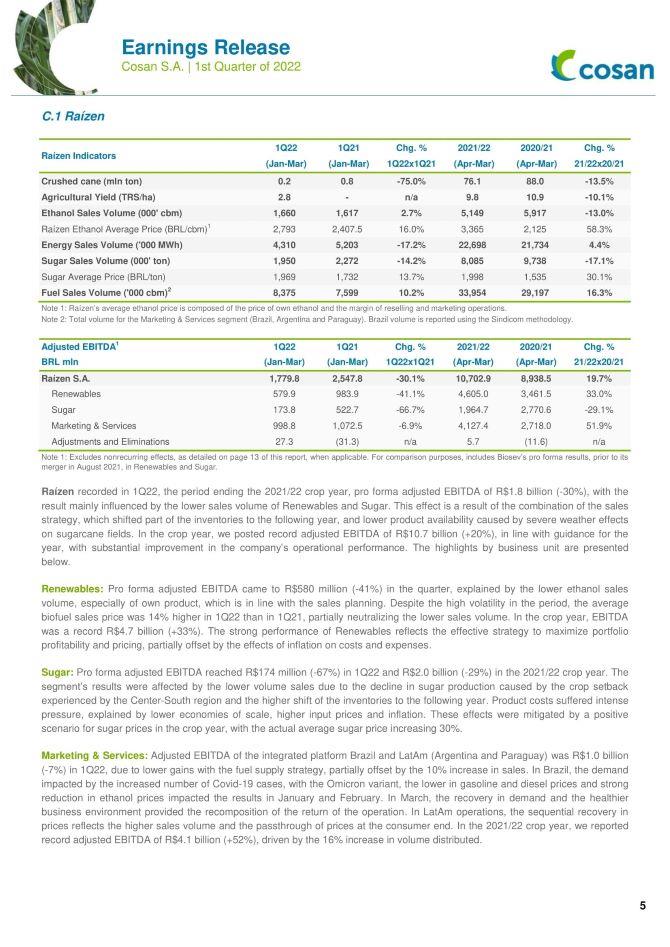
Earnings Release COSAN S.A. 1st Quarter of 2022 C.1 Raízen Raízen Indicators 1Q22 1Q21 Chg. % 2021/22 2020/21 Chg. % (Jan-Mar) (Jan-Mar) 1Q22x1Q21 (Apr-Mar) (Apr-Mar) 21/22x20/21 Crushed cane (mln ton) 0.2 0.8 -75.0% 76.1 88.0 -13.5% Agricultural Yield (TRS/ha) 2.8 - n/a 9.8 10.9 -10.1% Ethanol Sales Volume (000' cbm) 1,660 1,617 2.7% 5,149 5,917 -13.0% Raízen Ethanol Average Price (BRL/cbm)1 2,793 2,407.5 16.0% 3,365 2,125 58.3% Energy Sales Volume ('000 MWh) 4,310 5,203 -17.2% 22,698 21,734 4.4% Sugar Sales Volume (000' ton) 1,950 2,272 -14.2% 8,085 9,738 -17.1% Sugar Average Price (BRL/ton) 1,969 1,732 13.7% 1,998 1,535 30.1% Fuel Sales Volume ('000 cbm)2 8,375 7,599 10.2% 33,954 29,197 16.3% Note 1: Raízen’s average ethanol price is composed of the price of own ethanol and the margin of reselling and marketing operations. Note 2: Total volume for the Marketing & Services segment (Brazil, Argentina and Paraguay). Brazil volume is reported using the Sindicom methodology. Adjusted EBITDA1 1Q22 1Q21 Chg. % 2021/22 2020/21 Chg. % BRL mln (Jan-Mar) (Jan-Mar) 1Q22x1Q21 (Apr-Mar) (Apr-Mar) 21/22x20/21 Raízen S.A. 1,779.8 2,547.8 -30.1% 10,702.9 8,938.5 19.7% Renewables 579.9 983.9 -41.1% 4,605.0 3,461.5 33.0% Sugar 173.8 522.7 -66.7% 1,964.7 2,770.6 -29.1% Marketing & Services 998.8 1,072.5 -6.9% 4,127.4 2,718.0 51.9% Adjustments and Eliminations 27.3 (31.3) n/a 5.7 (11.6) n/a Note 1: Excludes nonrecurring effects, as detailed on page 13 of this report, when applicable. For comparison purposes, includes Biosev’s pro forma results, prior to its merger in August 2021, in Renewables and Sugar. Raízen recorded in 1Q22, the period ending the 2021/22 crop year, pro forma adjusted EBITDA of R$1.8 billion (-30%), with the result mainly influenced by the lower sales volume of Renewables and Sugar. This effect is a result of the combination of the sales strategy, which shifted part of the inventories to the following year, and lower product availability caused by severe weather effects on sugarcane fields. In the crop year, we posted record adjusted EBITDA of R$10.7 billion (+20%), in line with guidance for the year, with substantial improvement in the company’s operational performance. The highlights by business unit are presented below. Renewables: Pro forma adjusted EBITDA came to R$580 million (-41%) in the quarter, explained by the lower ethanol sales volume, especially of own product, which is in line with the sales planning. Despite the high volatility in the period, the average biofuel sales price was 14% higher in 1Q22 than in 1Q21, partially neutralizing the lower sales volume. In the crop year, EBITDA was a record R$4.7 billion (+33%). The strong performance of Renewables reflects the effective strategy to maximize portfolio profitability and pricing, partially offset by the effects of inflation on costs and expenses. Sugar: Pro forma adjusted EBITDA reached R$174 million (-67%) in 1Q22 and R$2.0 billion (-29%) in the 2021/22 crop year. The segment’s results were affected by the lower volume sales due to the decline in sugar production caused by the crop setback experienced by the Center-South region and the higher shift of the inventories to the following year. Product costs suffered intense pressure, explained by lower economies of scale, higher input prices and inflation. These effects were mitigated by a positive scenario for sugar prices in the crop year, with the actual average sugar price increasing 30%. Marketing & Services: Adjusted EBITDA of the integrated platform Brazil and LatAm (Argentina and Paraguay) was R$1.0 billion (-7%) in 1Q22, due to lower gains with the fuel supply strategy, partially offset by the 10% increase in sales. In Brazil, the demand impacted by the increased number of Covid-19 cases, with the Omicron variant, the lower in gasoline and diesel prices and strong reduction in ethanol prices impacted the results in January and February. In March, the recovery in demand and the healthier business environment provided the recomposition of the return of the operation. In LatAm operations, the sequential recovery in prices reflects the higher sales volume and the passthrough of prices at the consumer end. In the 2021/22 crop year, we reported record adjusted EBITDA of R$4.1 billion (+52%), driven by the 16% increase in volume distributed.
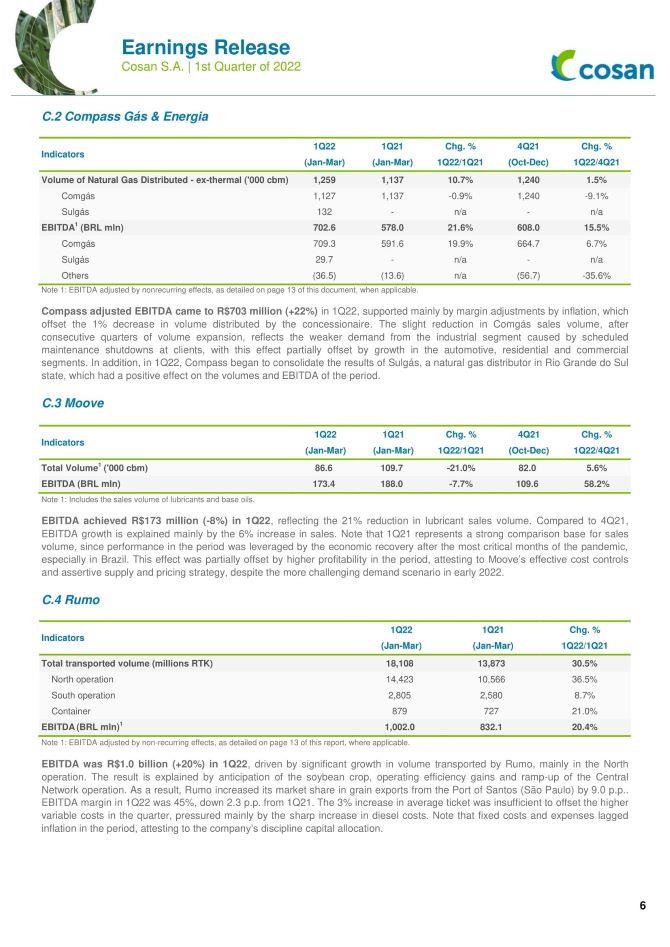
Earnings Release COSAN S.A. 1st Quarter of 2022 C.2 Compass Gás & Energia Indicators 1Q22 1Q21 Chg. % 4Q21 Chg. % (Jan-Mar) (Jan-Mar) 1Q22/1Q21 (Oct-Dec) 1Q22/4Q21 Volume of Natural Gas Distributed - ex-thermal ('000 cbm) 1,259 1,137 10.7% 1,240 1.5% Comgás 1,127 1,137 -0.9% 1,240 -9.1% Sulgás 132 - n/a - n/a EBITDA1 (BRL mln) 702.6 578.0 21.6% 608.0 15.5% Comgás 709.3 591.6 19.9% 664.7 6.7% Sulgás 29.7 - n/a - n/a Others (36.5) (13.6) n/a (56.7) -35.6% Note 1: EBITDA adjusted by nonrecurring effects, as detailed on page 13 of this document, when applicable. Compass adjusted EBITDA came to R$703 million (+22%) in 1Q22, supported mainly by margin adjustments by inflation, which offset the 1% decrease in volume distributed by the concessionaire. The slight reduction in Comgás sales volume, after consecutive quarters of volume expansion, reflects the weaker demand from the industrial segment caused by scheduled maintenance shutdowns at clients, with this effect partially offset by growth in the automotive, residential and commercial segments. In addition, in 1Q22, Compass began to consolidate the results of Sulgás, a natural gas distributor in Rio Grande do Sul state, which had a positive effect on the volumes and EBITDA of the period. C.3 Moove Indicators 1Q22 1Q21 Chg. % 4Q21 Chg. % (Jan-Mar) (Jan-Mar) 1Q22/1Q21 (Oct-Dec) 1Q22/4Q21 Total Volume1 ('000 cbm) 86.6 109.7 -21.0% 82.0 5.6% EBITDA (BRL mln) 173.4 188.0 -7.7% 109.6 58.2% Note 1: Includes the sales volume of lubricants and base oils. EBITDA achieved R$173 million (-8%) in 1Q22, reflecting the 21% reduction in lubricant sales volume. Compared to 4Q21, EBITDA growth is explained mainly by the 6% increase in sales. Note that 1Q21 represents a strong comparison base for sales volume, since performance in the period was leveraged by the economic recovery after the most critical months of the pandemic, especially in Brazil. This effect was partially offset by higher profitability in the period, attesting to Moove’s effective cost controls and assertive supply and pricing strategy, despite the more challenging demand scenario in early 2022. C.4 Rumo Indicators 1Q22 1Q21 Chg. % (Jan-Mar) (Jan-Mar) 1Q22/1Q21 Total transported volume (millions RTK) 18,108 13,873 30.5% North operation 14,423 10,566 36.5% South operation 2,805 2,580 8.7% Container 879 727 21.0% EBITDA (BRL mln)1 1,002.0 832.1 20.4% Note 1: EBITDA adjusted by non-recurring effects, as detailed on page 13 of this report, where applicable. EBITDA was R$1.0 billion (+20%) in 1Q22, driven by significant growth in volume transported by Rumo, mainly in the North operation. The result is explained by anticipation of the soybean crop, operating efficiency gains and ramp-up of the Central Network operation. As a result, Rumo increased its market share in grain exports from the Port of Santos (São Paulo) by 9.0 p.p.. EBITDA margin in 1Q22 was 45%, down 2.3 p.p. from 1Q21. The 3% increase in average ticket was insufficient to offset the higher variable costs in the quarter, pressured mainly by the sharp increase in diesel costs. Note that fixed costs and expenses lagged inflation in the period, attesting to the company’s discipline capital allocation.
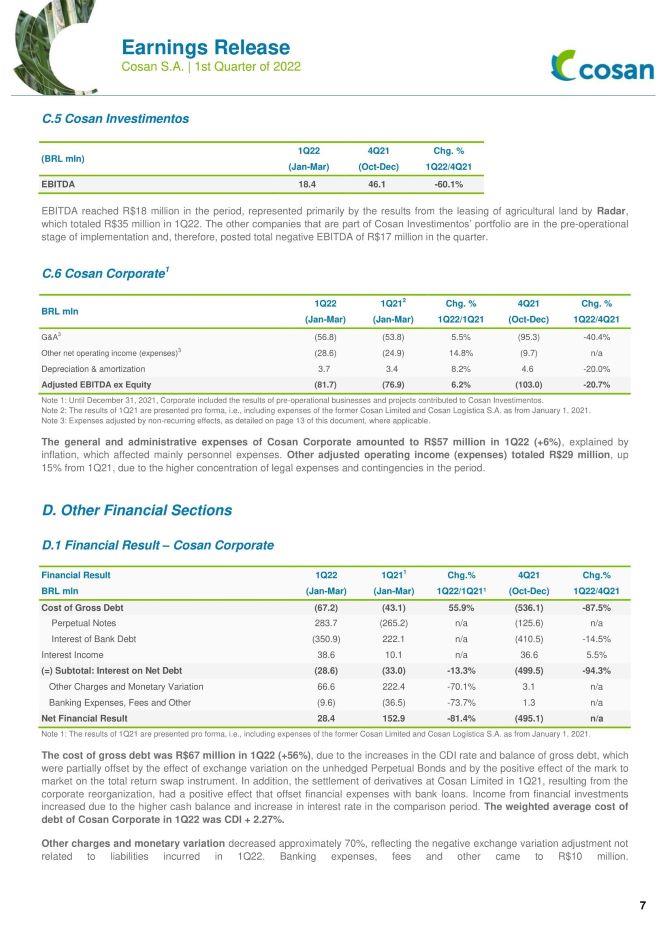
Earnings Release COSAN S.A. 1st Quarter of 2022 C.5 Cosan Investimentos (BRL mln) 1Q22 4Q21 Chg. % (Jan-Mar) (Oct-Dec) 1Q22/4Q21 EBITDA 18.4 46.1 -60.1% EBITDA reached R$18 million in the period, represented primarily by the results from the leasing of agricultural land by Radar, which totaled R$35 million in 1Q22. The other companies that are part of Cosan Investimentos’ portfolio are in the pre-operational stage of implementation and, therefore, posted total negative EBITDA of R$17 million in the quarter. C.6 Cosan Corporate1 BRL mln 1Q22 1Q212 Chg. % 4Q21 Chg. % (Jan-Mar) (Jan-Mar) 1Q22/1Q21 (Oct-Dec) 1Q22/4Q21 G&A3 (56.8) (53.8) 5.5% (95.3) -40.4% Other net operating income (expenses)3 (28.6) (24.9) 14.8% (9.7) n/a Depreciation & amortization 3.7 3.4 8.2% 4.6 -20.0% Adjusted EBITDA ex Equity (81.7) (76.9) 6.2% (103.0) -20.7% Note 1: Until December 31, 2021, Corporate included the results of pre-operational businesses and projects contributed to Cosan Investimentos. Note 2: The results of 1Q21 are presented pro forma, i.e., including expenses of the former Cosan Limited and Cosan Logística S.A. as from January 1, 2021. Note 3: Expenses adjusted by non-recurring effects, as detailed on page 13 of this document, where applicable. The general and administrative expenses of Cosan Corporate amounted to R$57 million in 1Q22 (+6%), explained by inflation, which affected mainly personnel expenses. Other adjusted operating income (expenses) totaled R$29 million, up 15% from 1Q21, due to the higher concentration of legal expenses and contingencies in the period. D. Other Financial Sections D.1 Financial Result – Cosan Corporate Financial Result 1Q22 1Q211 Chg.% 4Q21 Chg.% BRL mln (Jan-Mar) (Jan-Mar) 1Q22/1Q21¹ (Oct-Dec) 1Q22/4Q21 Cost of Gross Debt (67.2) (43.1) 55.9% (536.1) -87.5% Perpetual Notes 283.7 (265.2) n/a (125.6) n/a Interest of Bank Debt (350.9) 222.1 n/a (410.5) -14.5% Interest Income 38.6 10.1 n/a 36.6 5.5% (=) Subtotal: Interest on Net Debt (28.6) (33.0) -13.3% (499.5) -94.3% Other Charges and Monetary Variation 66.6 222.4 -70.1% 3.1 n/a Banking Expenses, Fees and Other (9.6) (36.5) -73.7% 1.3 n/a Net Financial Result 28.4 152.9 -81.4% (495.1) n/a Note 1: The results of 1Q21 are presented pro forma, i.e., including expenses of the former Cosan Limited and Cosan Logística S.A. as from January 1, 2021. The cost of gross debt was R$67 million in 1Q22 (+56%), due to the increases in the CDI rate and balance of gross debt, which were partially offset by the effect of exchange variation on the unhedged Perpetual Bonds and by the positive effect of the mark to market on the total return swap instrument. In addition, the settlement of derivatives at Cosan Limited in 1Q21, resulting from the corporate reorganization, had a positive effect that offset financial expenses with bank loans. Income from financial investments increased due to the higher cash balance and increase in interest rate in the comparison period. The weighted average cost of debt of Cosan Corporate in 1Q22 was CDI + 2.27%. Other charges and monetary variation decreased approximately 70%, reflecting the negative exchange variation adjustment not related to liabilities incurred in 1Q22. Banking expenses, fees and other came to R$10 million.
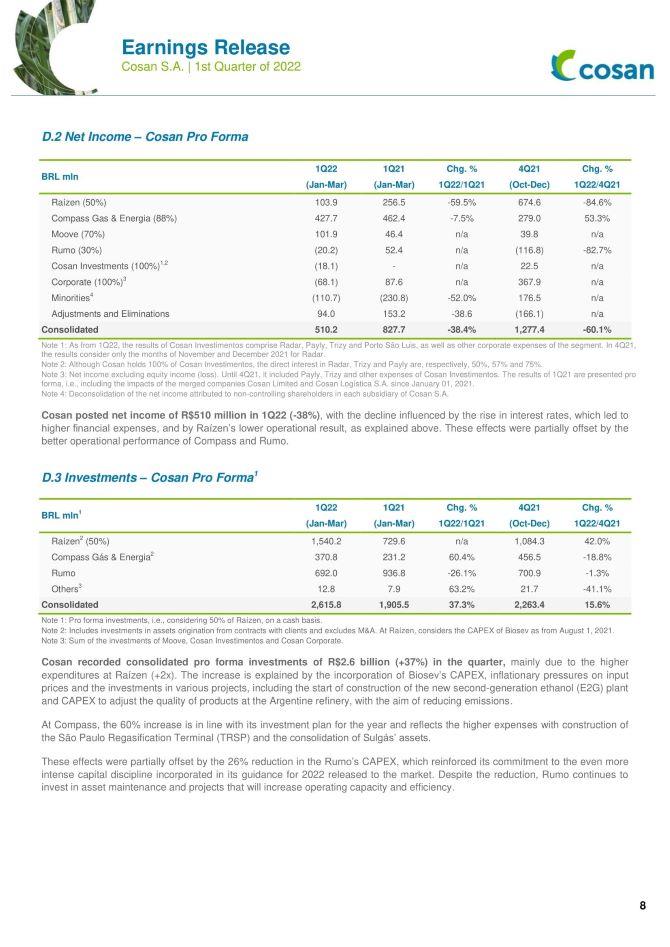
Earnings Release COSAN S.A. 1st Quarter of 2022 D.2 Net Income – Cosan Pro Forma BRL mln 1Q22 1Q21 Chg. % 4Q21 Chg. % (Jan-Mar) (Jan-Mar) 1Q22/1Q21 (Oct-Dec) 1Q22/4Q21 Raízen (50%) 103.9 256.5 -59.5% 674.6 -84.6% Compass Gas & Energia (88%) 427.7 462.4 -7.5% 279.0 53.3% Moove (70%) 101.9 46.4 n/a 39.8 n/a Rumo (30%) (20.2) 52.4 n/a (116.8) -82.7% Cosan Investments (100%)1,2 (18.1) - n/a 22.5 n/a Corporate (100%)3 (68.1) 87.6 n/a 367.9 n/a Minorities4 (110.7) (230.8) -52.0% 176.5 n/a Adjustments and Eliminations 94.0 153.2 -38.6 (166.1) n/a Consolidated 510.2 827.7 -38.4% 1,277.4 -60.1% Note 1: As from 1Q22, the results of Cosan Investimentos comprise Radar, Payly, Trizy and Porto São Luis, as well as other corporate expenses of the segment. In 4Q21, the results consider only the months of November and December 2021 for Radar. Note 2: Although Cosan holds 100% of Cosan Investimentos, the direct interest in Radar, Trizy and Payly are, respectively, 50%, 57% and 75%. Note 3: Net income excluding equity income (loss). Until 4Q21, it included Payly, Trizy and other expenses of Cosan Investimentos. The results of 1Q21 are presented pro forma, i.e., including the impacts of the merged companies Cosan Limited and Cosan Logística S.A. since January 01, 2021. Note 4: Deconsolidation of the net income attributed to non-controlling shareholders in each subsidiary of Cosan S.A. Cosan posted net income of R$510 million in 1Q22 (-38%), with the decline influenced by the rise in interest rates, which led to higher financial expenses, and by Raízen’s lower operational result, as explained above. These effects were partially offset by the better operational performance of Compass and Rumo. D.3 Investments – Cosan Pro Forma1 BRL mln1 1Q22 1Q21 Chg. % 4Q21 Chg. % (Jan-Mar) (Jan-Mar) 1Q22/1Q21 (Oct-Dec) 1Q22/4Q21 Raízen2 (50%) 1,540.2 729.6 n/a 1,084.3 42.0% Compass Gás & Energia2 370.8 231.2 60.4% 456.5 -18.8% Rumo 692.0 936.8 -26.1% 700.9 -1.3% Others3 12.8 7.9 63.2% 21.7 -41.1% Consolidated 2,615.8 1,905.5 37.3% 2,263.4 15.6% Note 1: Pro forma investments, i.e., considering 50% of Raízen, on a cash basis. Note 2: Includes investments in assets origination from contracts with clients and excludes M&A. At Raízen, considers the CAPEX of Biosev as from August 1, 2021. Note 3: Sum of the investments of Moove, Cosan Investimentos and Cosan Corporate. Cosan recorded consolidated pro forma investments of R$2.6 billion (+37%) in the quarter, mainly due to the higher expenditures at Raízen (+2x). The increase is explained by the incorporation of Biosev’s CAPEX, inflationary pressures on input prices and the investments in various projects, including the start of construction of the new second-generation ethanol (E2G) plant and CAPEX to adjust the quality of products at the Argentine refinery, with the aim of reducing emissions. At Compass, the 60% increase is in line with its investment plan for the year and reflects the higher expenses with construction of the São Paulo Regasification Terminal (TRSP) and the consolidation of Sulgás’ assets. These effects were partially offset by the 26% reduction in the Rumo’s CAPEX, which reinforced its commitment to the even more intense capital discipline incorporated in its guidance for 2022 released to the market. Despite the reduction, Rumo continues to invest in asset maintenance and projects that will increase operating capacity and efficiency.
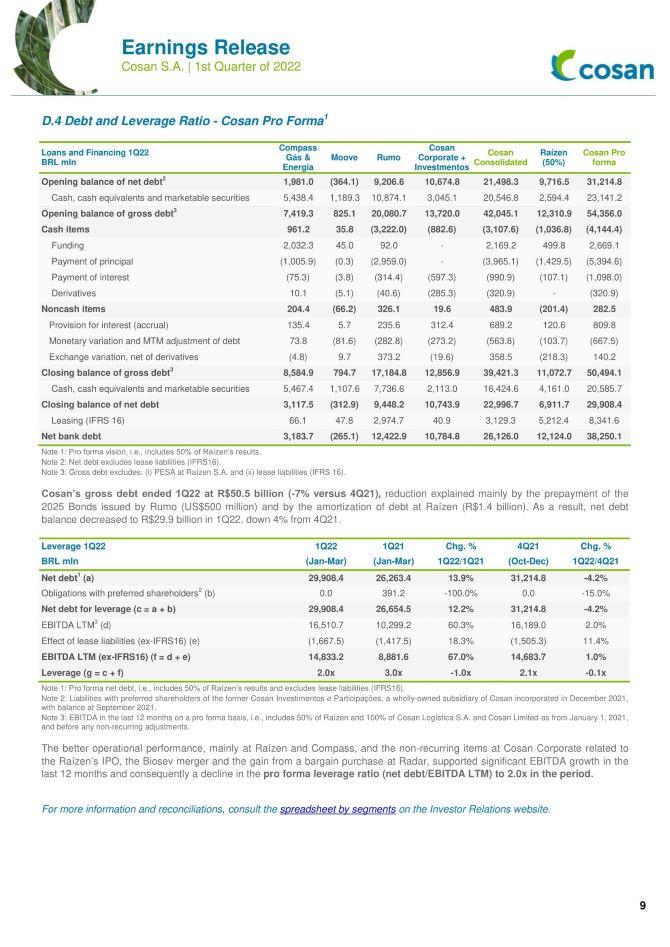
Earnings Release COSAN S.A. 1st Quarter of 2022 D.4 Debt and Leverage Ratio - Cosan Pro Forma1 Loans and Financing 1Q22 BRL mln Compass Gás & Energia Moove Rumo Cosan Corporate + Investmentos Cosan Consolidated Raízen (50%) Cosan Pro forma Opening balance of net debt2 1,981.0 (364.1) 9,206.6 10,674.8 21,498.3 9,716.5 31,214.8 Cash, cash equivalents and marketable securities 5,438.4 1,189.3 10,874.1 3,045.1 20,546.8 2,594.4 23,141.2 Opening balance of gross debt3 7,419.3 825.1 20,080.7 13,720.0 42,045.1 12,310.9 54,356.0 Cash items 961.2 35.8 (3,222.0) (882.6) (3,107.6) (1,036.8) (4,144.4) Funding 2,032.3 45.0 92.0 - 2,169.2 499.8 2,669.1 Payment of principal (1,005.9) (0.3) (2,959.0) - (3,965.1) (1,429.5) (5,394.6) Payment of interest (75.3) (3.8) (314.4) (597.3) (990.9) (107.1) (1,098.0) Derivatives 10.1 (5.1) (40.6) (285.3) (320.9) - (320.9) Noncash items 204.4 (66.2) 326.1 19.6 483.9 (201.4) 282.5 Provision for interest (accrual) 135.4 5.7 235.6 312.4 689.2 120.6 809.8 Monetary variation and MTM adjustment of debt 73.8 (81.6) (282.8) (273.2) (563.8) (103.7) (667.5) Exchange variation, net of derivatives (4.8) 9.7 373.2 (19.6) 358.5 (218.3) 140.2 Closing balance of gross debt3 8,584.9 794.7 17,184.8 12,856.9 39,421.3 11,072.7 50,494.1 Cash, cash equivalents and marketable securities 5,467.4 1,107.6 7,736.6 2,113.0 16,424.6 4,161.0 20,585.7 Closing balance of net debt 3,117.5 (312.9) 9,448.2 10,743.9 22,996.7 6,911.7 29,908.4 Leasing (IFRS 16) 66.1 47.8 2,974.7 40.9 3,129.3 5,212.4 8,341.6 Net bank debt 3,183.7 (265.1) 12,422.9 10,784.8 26,126.0 12,124.0 38,250.1 Note 1: Pro forma vision, i.e., includes 50% of Raízen’s results. Note 2: Net debt excludes lease liabilities (IFRS16). Note 3: Gross debt excludes: (i) PESA at Raízen S.A. and (ii) lease liabilities (IFRS 16). Cosan’s gross debt ended 1Q22 at R$50.5 billion (-7% versus 4Q21), reduction explained mainly by the prepayment of the 2025 Bonds issued by Rumo (US$500 million) and by the amortization of debt at Raízen (R$1.4 billion). As a result, net debt balance decreased to R$29.9 billion in 1Q22, down 4% from 4Q21. Leverage 1Q22 1Q22 1Q21 Chg. % 4Q21 Chg. % BRL mln (Jan-Mar) (Jan-Mar) 1Q22/1Q21 (Oct-Dec) 1Q22/4Q21 Net debt1 (a) 29,908.4 26,263.4 13.9% 31,214.8 -4.2% Obligations with preferred shareholders2 (b) 0.0 391.2 -100.0% 0.0 -15.0% Net debt for leverage (c = a + b) 29,908.4 26,654.5 12.2% 31,214.8 -4.2% EBITDA LTM3 (d) 16,510.7 10,299.2 60.3% 16,189.0 2.0% Effect of lease liabilities (ex-IFRS16) (e) (1,667.5) (1,417.5) 18.3% (1,505.3) 11.4% EBITDA LTM (ex-IFRS16) (f = d + e) 14,833.2 8,881.6 67.0% 14,683.7 1.0% Leverage (g = c + f) 2.0x 3.0x -1.0x 2.1x -0.1x Note 1: Pro forma net debt, i.e., includes 50% of Raízen’s results and excludes lease liabilities (IFRS16). Note 2: Liabilities with preferred shareholders of the former Cosan Investimentos e Participações, a wholly-owned subsidiary of Cosan incorporated in December 2021, with balance at September 2021. Note 3: EBITDA in the last 12 months on a pro forma basis, i.e., includes 50% of Raízen and 100% of Cosan Logística S.A. and Cosan Limited as from January 1, 2021, and before any non-recurring adjustments. The better operational performance, mainly at Raízen and Compass, and the non-recurring items at Cosan Corporate related to the Raízen’s IPO, the Biosev merger and the gain from a bargain purchase at Radar, supported significant EBITDA growth in the last 12 months and consequently a decline in the pro forma leverage ratio (net debt/EBITDA LTM) to 2.0x in the period. For more information and reconciliations, consult the spreadsheet by segments on the Investor Relations website.
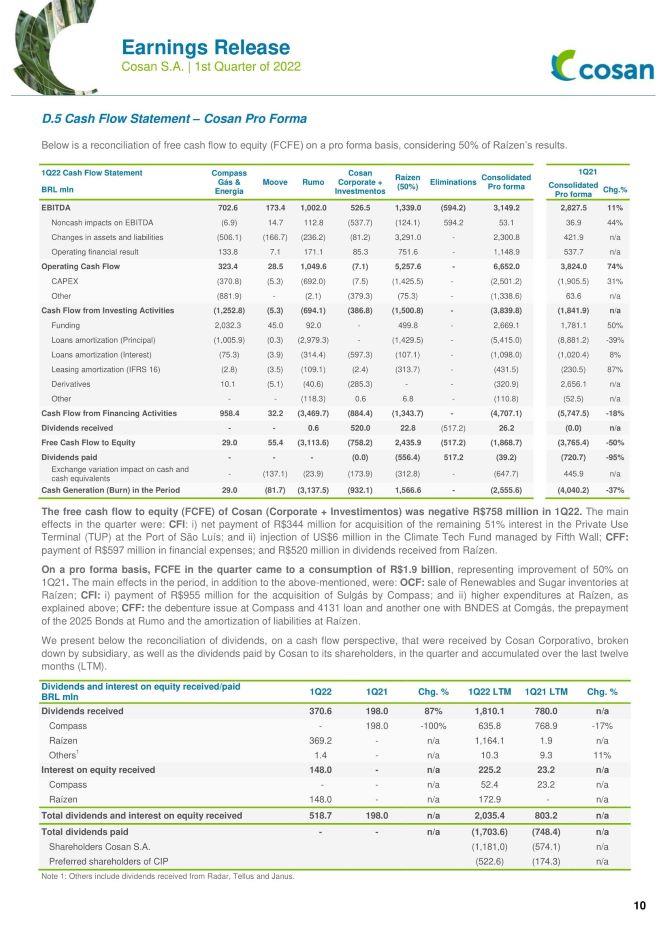
Earnings Release COSAN S.A. 1st Quarter of 2022 D.5 Cash Flow Statement – Cosan Pro Forma Below is a reconciliation of free cash flow to equity (FCFE) on a pro forma basis, considering 50% of Raízen’s results. 1Q22 Cash Flow Statement Compass Gás & Energia Moove Rumo Cosan Corporate + Investmentos Raízen (50%) Eliminations Consolidated Pro forma 1Q21 BRL mln Consolidated Pro forma Chg.% EBITDA 702.6 173.4 1,002.0 526.5 1,339.0 (594.2) 3,149.2 2,827.5 11% Noncash impacts on EBITDA (6.9) 14.7 112.8 (537.7) (124.1) 594.2 53.1 36.9 44% Changes in assets and liabilities (506.1) (166.7) (236.2) (81.2) 3,291.0 - 2,300.8 421.9 n/a Operating financial result 133.8 7.1 171.1 85.3 751.6 - 1,148.9 537.7 n/a Operating Cash Flow 323.4 28.5 1,049.6 (7.1) 5,257.6 0.0 6,652.0 3,824.0 74% CAPEX (370.8) (5.3) (692.0) (7.5) (1,425.5) - (2,501.2) (1,905.5) 31% Other (881.9) - (2.1) (379.3) (75.3) - (1,338.6) 63.6 n/a Cash Flow from Investing Activities (1,252.8) (5.3) (694.1) (386.8) (1,500.8) - (3,839.8) (1,841.9) n/a Funding 2,032.3 45.0 92.0 - 499.8 - 2,669.1 1,781.1 50% Loans amortization (Principal) (1,005.9) (0.3) (2,979.3) - (1,429.5) - (5,415.0) (8,881.2) -39% Loans amortization (Interest) (75.3) (3.9) (314.4) (597.3) (107.1) - (1,098.0) (1,020.4) 8% Leasing amortization (IFRS 16) (2.8) (3.5) (109.1) (2.4) (313.7) - (431.5) (230.5) 87% Derivatives 10.1 (5.1) (40.6) (285.3) - - (320.9) 2,656.1 n/a Other (0.0) 0.0 (118.3) 0.6 6.8 (0.0) (110.8) (52.5) n/a Cash Flow from Financing Activities 958.4 32.2 (3,469.7) (884.4) (1,343.7) - (4,707.1) (5,747.5) -18% Dividends received 0.0 - 0.6 520.0 22.8 (517.2) 26.2 (0.0) n/a Free Cash Flow to Equity 29.0 55.4 (3,113.6) (758.2) 2,435.9 (517.2) (1,868.7) (3,765.4) -50% Dividends paid - - - (0.0) (556.4) 517.2 (39.2) (720.7) -95% Exchange variation impact on cash and cash equivalents - (137.1) (23.9) (173.9) (312.8) 0.0 (647.7) 445.9 n/a Cash Generation (Burn) in the Period 29.0 (81.7) (3,137.5) (932.1) 1,566.6 0.0 (2,555.6) (4,040.2) -37% The free cash flow to equity (FCFE) of Cosan (Corporate + Investimentos) was negative R$758 million in 1Q22. The main effects in the quarter were: CFI: i) net payment of R$344 million for acquisition of the remaining 51% interest in the Private Use Terminal (TUP) at the Port of São Luís; and ii) injection of US$6 million in the Climate Tech Fund managed by Fifth Wall; CFF: payment of R$597 million in financial expenses; and R$520 million in dividends received from Raízen. On a pro forma basis, FCFE in the quarter came to a consumption of R$1.9 billion, representing improvement of 50% on 1Q21. The main effects in the period, in addition to the above-mentioned, were: OCF: sale of Renewables and Sugar inventories at Raízen; CFI: i) payment of R$955 million for the acquisition of Sulgás by Compass; and ii) higher expenditures at Raízen, as explained above; CFF: the debenture issue at Compass and 4131 loan and another one with BNDES at Comgás, the prepayment of the 2025 Bonds at Rumo and the amortization of liabilities at Raízen. We present below the reconciliation of dividends, on a cash flow perspective, that were received by Cosan Corporativo, broken down by subsidiary, as well as the dividends paid by Cosan to its shareholders, in the quarter and accumulated over the last twelve months (LTM). Dividends and interest on equity received/paid BRL mln 1Q22 1Q21 Chg. % 1Q22 LTM 1Q21 LTM Chg. % Dividends received 370.6 198.0 87% 1,810.1 780.0 n/a Compass - 198.0 -100% 635.8 768.9 -17% Raízen 369.2 - n/a 1,164.1 1.9 n/a Others1 1.4 - n/a 10.3 9.3 11% Interest on equity received 148.0 - n/a 225.2 23.2 n/a Compass - - n/a 52.4 23.2 n/a Raízen 148.0 - n/a 172.9 - n/a Total dividends and interest on equity received 518.7 198.0 n/a 2,035.4 803.2 n/a Total dividends paid - - n/a (1,703.6) (748.4) n/a Shareholders Cosan S.A. (1,181,0) (574.1) n/a Preferred shareholders of CIP (522.6) (174.3) n/a Note 1: Others include dividends received from Radar, Tellus and Janus.
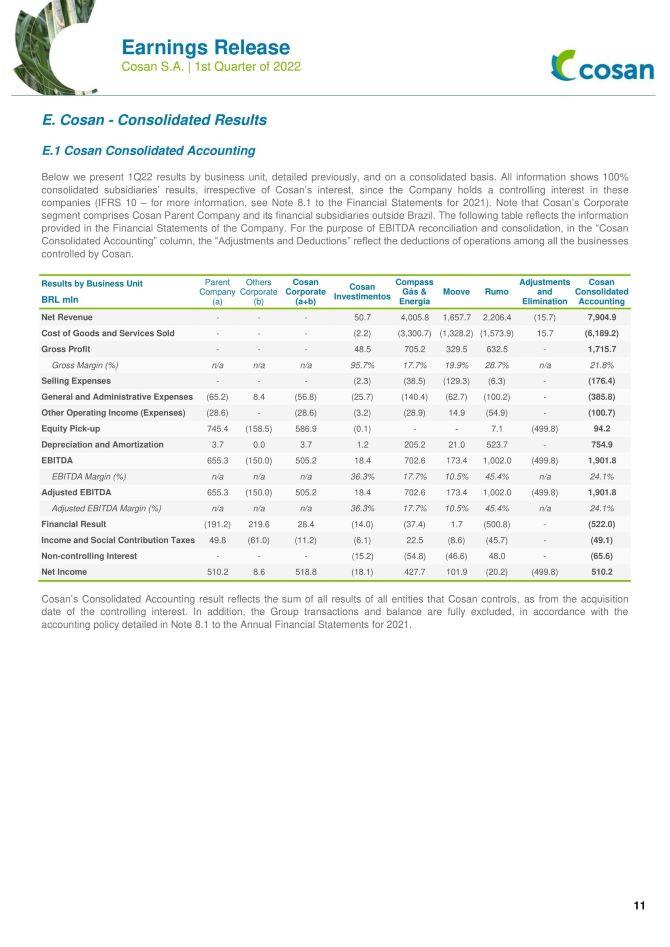
Earnings Release COSAN S.A. 1st Quarter of 2022 E. Cosan - Consolidated Results E.1 Cosan Consolidated Accounting Below we present 1Q22 results by business unit, detailed previously, and on a consolidated basis. All information shows 100% consolidated subsidiaries’ results, irrespective of Cosan’s interest, since the Company holds a controlling interest in these companies (IFRS 10 – for more information, see Note 8.1 to the Financial Statements for 2021). Note that Cosan’s Corporate segment comprises Cosan Parent Company and its financial subsidiaries outside Brazil. The following table reflects the information provided in the Financial Statements of the Company. For the purpose of EBITDA reconciliation and consolidation, in the “Cosan Consolidated Accounting” column, the “Adjustments and Deductions” reflect the deductions of operations among all the businesses controlled by Cosan. Results by Business Unit Parent Company (a) Others Corporate (b) Cosan Corporate (a+b) Cosan Investimentos Compass Gás & Energia Moove Rumo Adjustments and Elimination Cosan Consolidated Accounting BRL mln Net Revenue - - - 50.7 4,005.8 1,657.7 2,206.4 (15.7) 7,904.9 Cost of Goods and Services Sold - - - (2.2) (3,300.7) (1,328.2) (1,573.9) 15.7 (6,189.2) Gross Profit - - - 48.5 705.2 329.5 632.5 - 1,715.7 Gross Margin (%) n/a n/a n/a 95.7% 17.7% 19.9% 28.7% n/a 21.8% Selling Expenses - - - (2.3) (38.5) (129.3) (6.3) - (176.4) General and Administrative Expenses (65.2) 8.4 (56.8) (25.7) (140.4) (62.7) (100.2) - (385.8) Other Operating Income (Expenses) (28.6) - (28.6) (3.2) (28.9) 14.9 (54.9) - (100.7) Equity Pick-up 745.4 (158.5) 586.9 (0.1) - - 7.1 (499.8) 94.2 Depreciation and Amortization 3.7 0.0 3.7 1.2 205.2 21.0 523.7 - 754.9 EBITDA 655.3 (150.0) 505.2 18.4 702.6 173.4 1,002.0 (499.8) 1,901.8 EBITDA Margin (%) n/a n/a n/a 36.3% 17.7% 10.5% 45.4% n/a 24.1% Adjusted EBITDA 655.3 (150.0) 505.2 18.4 702.6 173.4 1,002.0 (499.8) 1,901.8 Adjusted EBITDA Margin (%) n/a n/a n/a 36.3% 17.7% 10.5% 45.4% n/a 24.1% Financial Result (191.2) 219.6 28.4 (14.0) (37.4) 1.7 (500.8) - (522.0) Income and Social Contribution Taxes 49.8 (61.0) (11.2) (6.1) 22.5 (8.6) (45.7) - (49.1) Non-controlling Interest - 0.0 0.0 (15.2) (54.8) (46.6) 48.0 - (65.6) Net Income 510.2 8.6 518.8 (18.1) 427.7 101.9 (20.2) (499.8) 510.2 Cosan’s Consolidated Accounting result reflects the sum of all results of all entities that Cosan controls, as from the acquisition date of the controlling interest. In addition, the Group transactions and balance are fully excluded, in accordance with the accounting policy detailed in Note 8.1 to the Annual Financial Statements for 2021.
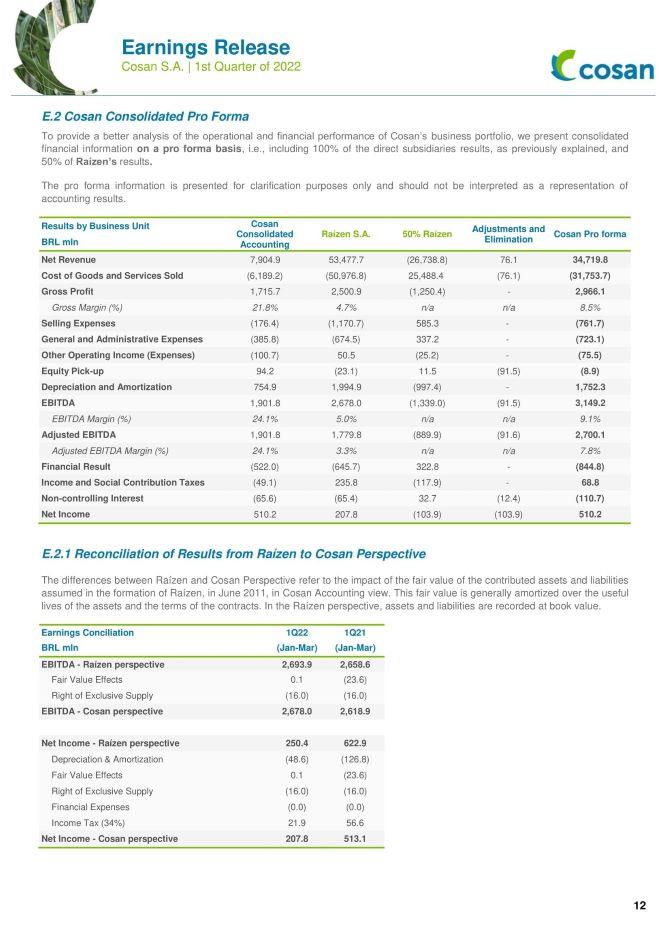
Earnings Release COSAN S.A. 1st Quarter of 2022 E.2 Cosan Consolidated Pro Forma To provide a better analysis of the operational and financial performance of Cosan’s business portfolio, we present consolidated financial information on a pro forma basis, i.e., including 100% of the direct subsidiaries results, as previously explained, and 50% of Raízen’s results. The pro forma information is presented for clarification purposes only and should not be interpreted as a representation of accounting results. Results by Business Unit Cosan Consolidated Accounting Raízen S.A. 50% Raízen Adjustments and Elimination Cosan Pro forma BRL mln Net Revenue 7,904.9 53,477.7 (26,738.8) 76.1 34,719.8 Cost of Goods and Services Sold (6,189.2) (50,976.8) 25,488.4 (76.1) (31,753.7) Gross Profit 1,715.7 2,500.9 (1,250.4) - 2,966.1 Gross Margin (%) 21.8% 4.7% n/a n/a 8.5% Selling Expenses (176.4) (1,170.7) 585.3 - (761.7) General and Administrative Expenses (385.8) (674.5) 337.2 - (723.1) Other Operating Income (Expenses) (100.7) 50.5 (25.2) - (75.5) Equity Pick-up 94.2 (23.1) 11.5 (91.5) (8.9) Depreciation and Amortization 754.9 1,994.9 (997.4) - 1,752.3 EBITDA 1,901.8 2,678.0 (1,339.0) (91.5) 3,149.2 EBITDA Margin (%) 24.1% 5.0% n/a n/a 9.1% Adjusted EBITDA 1,901.8 1,779.8 (889.9) (91.6) 2,700.1 Adjusted EBITDA Margin (%) 24.1% 3.3% n/a n/a 7.8% Financial Result (522.0) (645.7) 322.8 - (844.8) Income and Social Contribution Taxes (49.1) 235.8 (117.9) - 68.8 Non-controlling Interest (65.6) (65.4) 32.7 (12.4) (110.7) Net Income 510.2 207.8 (103.9) (103.9) 510.2 E.2.1 Reconciliation of Results from Raízen to Cosan Perspective The differences between Raízen and Cosan Perspective refer to the impact of the fair value of the contributed assets and liabilities assumed in the formation of Raízen, in June 2011, in Cosan Accounting view. This fair value is generally amortized over the useful lives of the assets and the terms of the contracts. In the Raízen perspective, assets and liabilities are recorded at book value. Earnings Conciliation 1Q22 1Q21 BRL mln (Jan-Mar) (Jan-Mar) EBITDA - Raízen perspective 2,693.9 2,658.6 Fair Value Effects 0.1 (23.6) Right of Exclusive Supply (16.0) (16.0) EBITDA - Cosan perspective 2,678.0 2,618.9 Net Income - Raízen perspective 250.4 622.9 Depreciation & Amortization (48.6) (126.8)Fair Value Effects 0.1 (23.6) Right of Exclusive Supply (16.0) (16.0) Financial Expenses (0.0) (0.0) Income Tax (34%) 21.9 56.6 Net Income - Cosan perspective 207.8 513.1
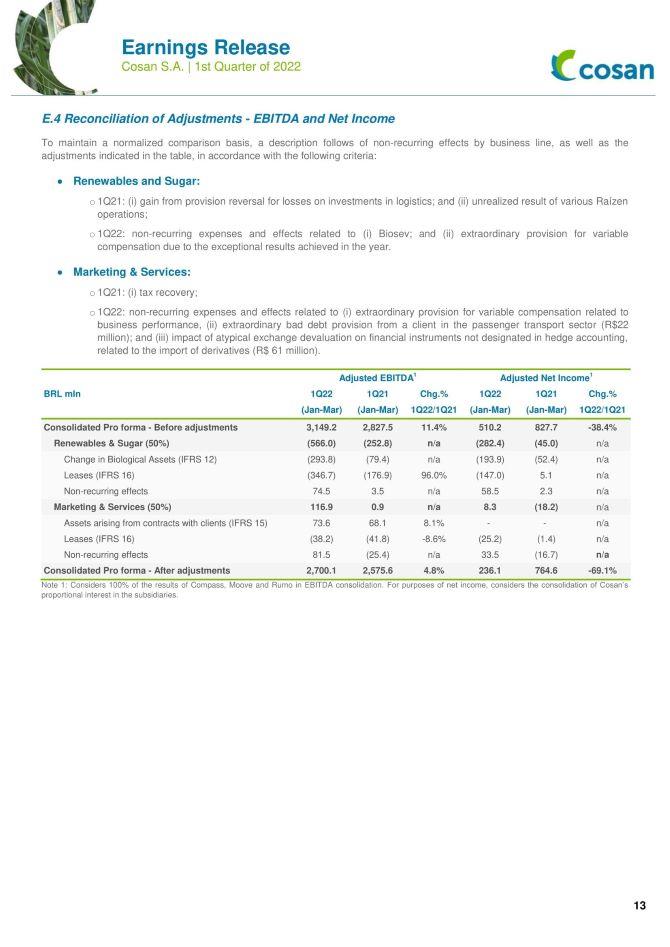
Earnings Release COSAN S.A. 1st Quarter of 2022 E.4 Reconciliation of Adjustments - EBITDA and Net Income To maintain a normalized comparison basis, a description follows of non-recurring effects by business line, as well as the adjustments indicated in the table, in accordance with the following criteria: • Renewables and Sugar: o 1Q21: (i) gain from provision reversal for losses on investments in logistics; and (ii) unrealized result of various Raízen operations; o 1Q22: non-recurring expenses and effects related to (i) Biosev; and (ii) extraordinary provision for variable compensation due to the exceptional results achieved in the year. • Marketing & Services: o 1Q21: (i) tax recovery; o 1Q22: non-recurring expenses and effects related to (i) extraordinary provision for variable compensation related to business performance, (ii) extraordinary bad debt provision from a client in the passenger transport sector (R$22 million); and (iii) impact of atypical exchange devaluation on financial instruments not designated in hedge accounting, related to the import of derivatives (R$ 61 million). Adjusted EBITDA1 Adjusted Net Income1 BRL mln 1Q22 1Q21 Chg.% 1Q22 1Q21 Chg.% (Jan-Mar) (Jan-Mar) 1Q22/1Q21 (Jan-Mar) (Jan-Mar) 1Q22/1Q21 Consolidated Pro forma - Before adjustments 3,149.2 2,827.5 11.4% 510.2 827.7 -38.4% Renewables & Sugar (50%) (566.0) (252.8) n/a (282.4) (45.0) n/a Change in Biological Assets (IFRS 12) (293.8) (79.4) n/a (193.9) (52.4) n/a Leases (IFRS 16) (346.7) (176.9) 96.0% (147.0) 5.1 n/a Non-recurring effects 74.5 3.5 n/a 58.5 2.3 n/a Marketing & Services (50%) 116.9 0.9 n/a 8.3 (18.2) n/a Assets arising from contracts with clients (IFRS 15) 73.6 68.1 8.1% - - n/a Leases (IFRS 16) (38.2) (41.8) -8.6% (25.2) (1.4) n/a Non-recurring effects 81.5 (25.4) n/a 33.5 (16.7) n/a Consolidated Pro forma - After adjustments 2,700.1 2,575.6 4.8% 236.1 764.6 -69.1% Note 1: Considers 100% of the results of Compass, Moove and Rumo in EBITDA consolidation. For purposes of net income, considers the consolidation of Cosan’s proportional interest in the subsidiaries.
Earnings Release COSAN S.A. 1st Quarter of 2022 F. Relevant matters and Events after the reporting period Relevant matters announced by the Company and its subsidiaries up to the publication date of this document follow. Sale by Compass of interest in Gaspetro natural gas distributors In March, Compass announced the execution of a Commitment to Purchase and Sell Shares for the sale of its potential interest in up to seven natural gas distributors, in which Gaspetro holds a non-controlling interest. In March, Compass announced the execution of a binding instrument for the sale of its potential interest in five other natural gas distributors. The effectiveness of these movements, as well as conclusion of the acquisition of 51% of Gaspetro’s capital stock by Compass, are subject to fulfillment of various conditions precedent including, but not limited to, approval by the competent bodies. Issue of Debentures by Cosan In April, the Board of Directors of Cosan approved the issue of unsecured, non-convertible debentures in up to two series, by the Company, in the aggregate amount of R$1.5 billion. The issue was settled on May 6, 2022. 2029 Consent Bond of Cosan In April, Cosan requested that the holders of the 2029 Bonds authorize the change in ownership of said bonds to one of its subsidiaries outside Brazil, since Cosan Limited (issuer of the securities) was merged by the Company after the ownership reorganization concluded in March 2021. The proposal, which aims to create a more efficient structure, was approved by the majority of holders on April 29, 2022. Advances in Raízen's energy transition agenda Raízen announced in March the start of the construction of its second biogas plant, which is the first dedicated to the production of renewable natural gas (biomethane). Investment is estimated at around approximately R$300 million and the plant will be built near the Costa Pinto Bioenergy Park, in Piracicaba, São Paulo, where the E2G plant is located. Opening is schedule for 2023. In May, 2022, it was approved the construction of the 3rd and 4th Second Generation Ethanol Plants (E2G), both in the state of São Paulo. Around R$ 2 billion will be invested to build the two new plants, adding a capacity of approximately 164,000 cbm of biofuel per year. The plants are expected to start operating in 2024. Annual and Extraordinary Shareholders Meeting In April, the Company held its Annual and Extraordinary Shareholders Meeting, when shareholders approved, among other matters, the financial statements of Cosan for the fiscal year of 2021, elected the Audit Board and approved an increase in the capital stock, without the issue of any new shares, by converting the balances existing in the Legal Reserve and Statutory Reserve accounts, and an increase in the authorized capital. Dividends The Annual and Extraordinary Shareholders Meeting, held in April, approved the distribution of approximately R$800 million, corresponding to R$0.428110850 per common share, to be paid on May 20, 2022. Conclusion of Acquisition of Lubricant Business by Raízen In May, Raízen announced conclusion of the acquisition of the lubricant business of Shell Brasil Petróleo Ltda. The acquisition’s conclusion will enable Raízen to expand its offering of premium products to over 50,000 industrial and commercial clients, as well as 50 million consumers served annually by its network. New Share Buyback Program A new share buyback program for common shares issued by the Company was approved in May, considering a maximum of 110,000,000 shares that can be repurchased in a period of 18 months. Filing of 20-F Form On May 13, the Company filed with the U.S. Securities and Exchange Commission (SEC) the annual 2021 20-F Form of Cosan. The document will be available on the Company’s Investor Relations website (https://www.cosan.com.br/en/cvm-and-sec-publications/registration-reference-and-20-f-form/).
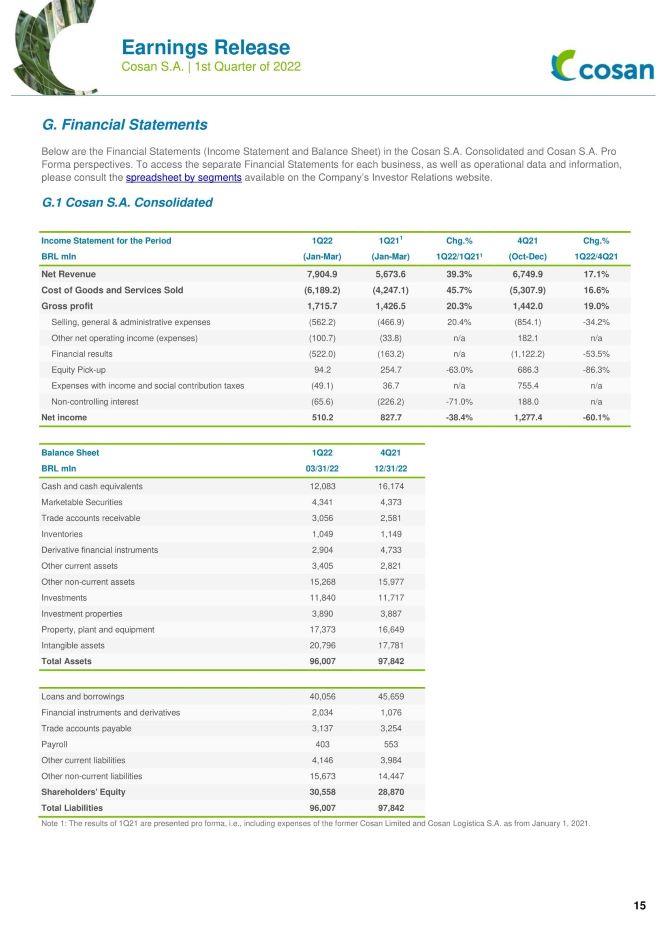
Earnings Release COSAN S.A. 1st Quarter of 2022 G. Financial Statements Below are the Financial Statements (Income Statement and Balance Sheet) in the Cosan S.A. Consolidated and Cosan S.A. Pro Forma perspectives. To access the separate Financial Statements for each business, as well as operational data and information, please consult the spreadsheet by segments available on the Company’s Investor Relations website. G.1 Cosan S.A. Consolidated Income Statement for the Period 1Q22 1Q211 Chg.% 4Q21 Chg.% BRL mln (Jan-Mar) (Jan-Mar) 1Q22/1Q21¹ (Oct-Dec) 1Q22/4Q21 Net Revenue 7,904.9 5,673.6 39.3% 6,749.9 17.1% Cost of Goods and Services Sold (6,189.2) (4,247.1) 45.7% (5,307.9) 16.6% Gross profit 1,715.7 1,426.5 20.3% 1,442.0 19.0% Selling, general & administrative expenses (562.2) (466.9) 20.4% (854.1) -34.2% Other net operating income (expenses) (100.7) (33.8) n/a 182.1 n/a Financial results (522.0) (163.2) n/a (1,122.2) -53.5% Equity Pick-up 94.2 254.7 -63.0% 686.3 -86.3% Expenses with income and social contribution taxes (49.1) 36.7 n/a 755.4 n/a Non-controlling interest (65.6) (226.2) -71.0% 188.0 n/a Net income 510.2 827.7 -38.4% 1,277.4 -60.1% Balance Sheet 1Q22 4Q21 BRL mln 03/31/22 12/31/22 Cash and cash equivalents 12,083 16,174 Marketable Securities 4,341 4,373 Trade accounts receivable 3,056 2,581 Inventories 1,049 1,149 Derivative financial instruments 2,904 4,733 Other current assets 3,405 2,821 Other non-current assets 15,268 15,977 Investments 11,840 11,717 Investment properties 3,890 3,887 Property, plant and equipment 17,373 16,649 Intangible assets 20,796 17,781 Total Assets 96,007 97,842 Loans and borrowings 40,056 45,659 Financial instruments and derivatives 2,034 1,076 Trade accounts payable 3,137 3,254 Payroll 403 553 Other current liabilities 4,146 3,984 Other non-current liabilities 15,673 14,447 Shareholders' Equity 30,558 28,870 Total Liabilities 96,007 97,842 Note 1: The results of 1Q21 are presented pro forma, i.e., including expenses of the former Cosan Limited and Cosan Logística S.A. as from January 1, 2021
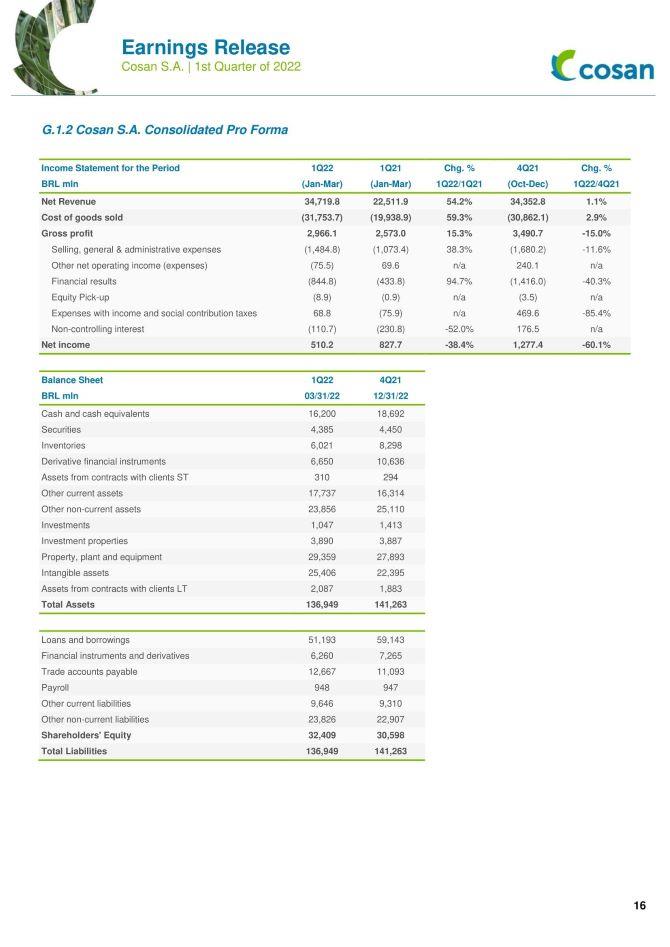
Earnings Release COSAN S.A. 1st Quarter of 2022 G.1.2 Cosan S.A. Consolidated Pro Forma Income Statement for the Period 1Q22 1Q21 Chg. % 4Q21 Chg. % BRL mln (Jan-Mar) (Jan-Mar) 1Q22/1Q21 (Oct-Dec) 1Q22/4Q21 Net Revenue 34,719.8 22,511.9 54.2% 34,352.8 1.1% Cost of goods sold (31,753.7) (19,938.9) 59.3% (30,862.1) 2.9% Gross profit 2,966.1 2,573.0 15.3% 3,490.7 -15.0% Selling, general & administrative expenses (1,484.8) (1,073.4) 38.3% (1,680.2) -11.6% Other net operating income (expenses) (75.5) 69.6 n/a 240.1 n/a Financial results (844.8) (433.8) 94.7% (1,416.0) -40.3% Equity Pick-up (8.9) (0.9) n/a (3.5) n/a Expenses with income and social contribution taxes 68.8 (75.9) n/a 469.6 -85.4% Non-controlling interest (110.7) (230.8) -52.0% 176.5 n/a Net income 510.2 827.7 -38.4% 1,277.4 -60.1% Balance Sheet 1Q22 4Q21 BRL mln 03/31/22 12/31/22 Cash and cash equivalents 16,200 18,692 Securities 4,385 4,450 Inventories 6,021 8,298 Derivative financial instruments 6,650 10,636 Assets from contracts with clients ST 310 294 Other current assets 17,737 16,314 Other non-current assets 23,856 25,110 Investments 1,047 1,413 Investment properties 3,890 3,887 Property, plant and equipment 29,359 27,893 Intangible assets 25,406 22,395 Assets from contracts with clients LT 2,087 1,883 Total Assets 136,949 141,263 Loans and borrowings 51,193 59,143 Financial instruments and derivatives 6,260 7,265 Trade accounts payable 12,667 11,093 Payroll 948 947 Other current liabilities 9,646 9,310 Other non-current liabilities 23,826 22,907 Shareholders' Equity 32,409 30,598 Total Liabilities 136,949 141,263
SIGNATURES
Pursuant to the requirements of the Securities Exchange Act of 1934, the registrant has duly caused this report to be signed on its behalf by the undersigned, thereunto duly authorized.
Date: May 13, 2022
COSAN S.A. | |
By: | /s/ Ricardo Lewin |
| Name: Ricardo Lewin |
| Title: Chief Financial Officer |