UNITED STATES
SECURITIES AND EXCHANGE COMMISSION
Washington, D.C. 20549
FORM 6-K
Report of Foreign Issuer
Pursuant To Rule 13a-16 Or 15d-16 of the
Securities Exchange Act of 1934
For the month of April 2024
Commission File Number: 333-251238
|
COSAN S.A.
(Exact name of registrant as specified in its charter)
N/A
(Translation of registrant’s name into English)
|
Av. Brigadeiro Faria Lima, 4100, – 16th floor
São Paulo, SP 04538-132 Brazil
(Address of principal executive offices)
Indicate by check mark whether the registrant files or will file annual reports under cover of Form 20-F or Form 40‑F:
Form 20-F ☒ Form 40-F ☐
Indicate by check mark if the registrant is submitting the Form 6-K in paper as permitted by Regulation S-T Rule 101(b)(1):
Yes ☐ No ☒
Indicate by check mark if the registrant is submitting the Form 6-K in paper as permitted by Regulation S-T Rule 101(b)(7):
Yes ☐ No ☒
 |
Cosan S.A.
2023 Management Report
Cosan S.A. (“Cosan” or “Company”) submits for consideration of its shareholders the Management Report concerning the activities performed in fiscal year 2023. The result is presented in accordance with the accounting practices adopted in Brazil and the International Financial Reporting Standards (IFRS). Except where otherwise stated, all comparisons in this report are of 2023 with 2022.
The Company also provides a detailed version of its Financial Statements and earnings release on its website: www.cosan.com.br/en.
1. Message from the CEO
We ended 2023 with a significant growth of EBITDA under management and net income, supported by the performance of the businesses, reinforcing the quality of our assets and resilience of our portfolio. Investments were in line with the plans for the year, allocated to the structural projects of the portfolio, as well as the efficient maintenance of our operations.
Rumo’s result was boosted by the increase in transportation capacity and higher consolidated average tariff, reaching record volumes and demonstrating the growing competitiveness of the rail modal. The Lucas do Rio Verde project – extension of the railway network in Mato Grosso, one of the main regions of Brazil in grain production – will enable a major expansion in Rumo’s addressable market.
At Compass, the record number of new connections, consolidation of Commit’s natural gas distribution companies, as well as the start of operations under the Edge brand, with the sale of the first LNG shipments, offset the decline in the volume of natural gas distributed, affected by the lower industrial production and higher temperatures. Furthermore, in 2023 the company created a JV among Compass and Orizon to invest in a biomethane purification plant in Paulínia (São Paulo) and executed a long-term biomethane supply agreement between Compass and São Martinho.
Moove had its best year ever, driven by the higher sales and healthy margins, reflecting Moove’s leading position in the market of synthetic lubricants and ongoing improvement of its business model. Its strong international footprint is also a highlight, with significant results achieved in 2023 with the successful integration of Petrochoice.
At Radar, the value of agricultural properties portfolio we invested reflects the high-quality portfolio and the strong commodity cycle.
Raízen achieved an important recovery of the agricultural productivity of its sugarcane fields, setting a record for crushing in the crop year. The better sugar prices and strong fuel distribution margins drove the company’s EBITDA, offsetting the effects of the challenging scenario for ethanol. In addition, I highlight the progress in our renewable’s agenda, with the launch of the 2nd Second-Generation Ethanol (2GE) plant in Bonfim, with twice the production capacity of the 1st plant.
We kicked off an intense debt management process at Cosan, with successful funding transactions in the domestic and international markets. This process has lengthened our debt amortization schedule to better support the current cycle of major investments of our portfolio, ensuring competitive costs. In 2023 and early 2024, we consolidated our exposure to Vale, increasing our direct stake because of the unwind of the collar financing structure. This movement aims to capture Vale’s dividends in full while adequate our capital structure. We ended the year with leverage within adequate levels and, as of this quarter, we will report the interest coverage ratio, a metric that complements the perspective for liquidity of Cosan Corporate.
Finally on capital allocation, we remain attentive to opportunities to repurchase shares of Cosan itself, executing Total Return Swaps worth approximately R$300 million during the year. Finally, we distributed R$800 million to our shareholders as dividends.
Nelson Gomes
CEO of Cosan
|
2. Annual Results
Cosan Consolidated
The following table shows the consolidated accounting result of 2023 for Cosan and its business units. Except for Raízen (company co-controlled by Cosan), all other information reflects the consolidation of 100% of subsidiaries’ results, irrespective of Cosan’s interest. For more information, see Note 9 “Investments in Subsidiaries and Associated Companies” to the individual and consolidated Financial Statements of December 31, 2023 (“Financial Statements”).
Note that Cosan (corporate segment) represents the reconciliation of the corporate structure of Cosan, offshore financial companies and other expenses, as detailed in Note 1 to the Financial Statements. The following table reflects the complete information provided in the Financial Statements of the Company.
Income Statement for the Period | 2023 | 2022 | Change |
BRL mln | (Jan-Dec) | (Jan-Dec) | 2023 x 2022 |
Net revenue | 39,469 | 39,323 | 0% |
Cost of goods and services sold | (28,550) | (30,557) | (7%) |
Gross profit | 10,919 | 8,766 | 25% |
Selling, general & administrative expenses | (3,879) | (3,034) | 28% |
Other net operating income (expenses) | 3,924 | 1,752 | n/a |
Financial results | (7,897) | (5,158) | 53% |
Equity pick-up | 2,046 | 327 | n/a |
Expenses with income and social contribution taxes | (274) | 118 | n/a |
Discontinued operation | 45 | 50 | (9%) |
Non-controlling interest | (3,790) | (1,645) | n/a |
Profit (loss) attributable to owners of the Company | 1,094 | 1,176 | (7%) |
Information by segment:
Results by Business Unit | Raízen | Compass | Moove | Rumo | Radar | Cosan Corporate | Deconsolidation of Joint Ventures | Elimination between | Consolidated |
BRL mln | |||||||||
Net revenue | 221,693 | 17,767 | 10,079 | 10,938 | 743 | 3 | (221,693) | (61) | 39,469 |
Cost of goods and services sold | (202,927) | (14,256) | (7,360) | (6,838) | (153) | (4) | 202,927 | 61 | (28,550) |
Gross profit | 18,767 | 3,511 | 2,719 | 4,099 | 590 | (1) | (18,767) | - | 10,919 |
Selling, general & administrative expenses | (8,589) | (952) | (1,791) | (601) | (74) | (461) | 8,589 | - | (3,879) |
Other net operating income (expenses) | 1,968 | 607 | - | (101) | 2,254 | 1,164 | (1,968) | - | 3,924 |
Financial results | (5,963) | (731) | (319) | (2,555) | 31 | (4,322) | 5,963 | - | (7,897) |
Equity pick-up | (220) | 179 | - | 77 | 20 | 4,342 | 220 | (2,571) | 2,046 |
Expenses with income and social contribution taxes | (1,937) | (859) | (332) | (197) | (148) | 1,262 | 1,937 | - | (274) |
Discontinued operation | - | 45 | - | - | - | 16 | - | (16) | 45 |
Non-controlling interest | (163) | (390) | (83) | (503) | (1,904) | (910) | 163 | - | (3,790) |
Profit (loss) attributable to owners of the Company | 3,864 | 1,411 | 194 | 219 | 768 | 1,090 | (3,864) | (2,587) | 1,094 |
(1) Although Raízen S.A. is a joint venture whose results are registered under the equity pickup method and not consolidated proportionally, the Management continues to analyze information by segment. The reconciliation of these segments is presented in the “Deconsolidation of shared-control company” column.
|
Below are the material changes to the statements of income:
Net Revenue
Cosan’s consolidated net revenue was R$39.5 billion in 2023, practically stable in relation to 2022. Below are the main variations in revenues by segment:
At Rumo, net revenue was R$10.9 billion in 2023 (+11%). Revenue increased for all operations of the company: North Operation, South Operation and Container Operation.
Compass’ net revenue was R$17.8 billion in 2023 (-10%), partly due to the lower distributed volume, reflecting the slowdown in industrial activity in the year, affected by the lower volumes consumed by the ceramics, glass and steel industries, as well as reduction in residential consumption due to high temperatures registered in 2023 vs. 2022.
At Moove, net revenue was R$10.1 billion in 2023 (+12%), thanks to the strong sales of lubricants and better mix of products sold. Note that 2023 was the first full year of operation of Tirreno and Petrochoice, after their acquisition.
At Radar, net revenue was R$743 million in 2023, compared to R$835 million in 2022.
Operating Cost
The cost of goods and services sold by Cosan’s subsidiaries totaled R$28.6 billion in the fiscal year ended December 31, 2023, (-7%). Such reduction is explained as follows:
At Compass, the cost of gas, transportation and others decreased from R$16.4 billion in 2022 to R$14.3 billion in 2023, driven by the cost of the molecule, composed by exchange rate and Brent oil price. The reduction is also explained by the lower sales volume. The construction cost of the gas distribution network increased from R$1.2 billion in 2022 to R$1.5 billion in 2023. Finally, costs decreased due to the discontinuation of all energy agreements, with effect of R$0.3 billion.
Gross Profit
With these results, Cosan delivered gross profit of R$11.0 billion in 2023 (+25%), mainly due to the segments of Rumo, reflecting an increase in operating revenue from transportation, and Moove, due to the higher sales volume and healthy margins.
Selling, General & Administrative Expenses and Other Revenues
Selling, general and administrative expenses and other revenues totaled R$45.9 million in 2023, an increase over 2022, due to: (i) dividends received from Vale S.A., in the amount of R$1.3 billion; (ii) realization of deferred revenue, with an effect of R$923 million on operational result; (iii) change in the fair value of properties for investment, creating an impact of R$2.3 billion.
Financial Result
In 2023, Cosan’s net financial result was an expense of R$7.9 billion, as against expense of R$5.2 billion in 2022. The increase reflects: (i) interest amounts, inflation adjustment and exchange variation of debts linked to the acquisition of Vale’s assets, in the amount of R$599 million; (ii) cost of bank transactions with derivatives, with a negative effect in the amount of R$555 million; (iii) result from derivatives and fair value of securities linked to the investment in Vale’s stock, in the amount of R$881 million; (iv) update of financial investment in listed entities, without any PIS and COFINS effects, which at December 31, 2023 totaled loss of R$3.3 billion.
|
Equity Pick-up
At December 31, 2023, equity pick-up came to R$2.0 billion, compared to R$327 million in 2022. This variation is mainly due to: (i) On November 30, 2023, the Company obtained sufficient evidence of its capacity to exert significant influence on Vale. On December 01, 2023, the Company began to account for the investment in Vale under the equity pick-up method (see more details on Note 1.1 “Equity Interest in Vale S.A.” of the Financial Statements of December 31, 2023); and (ii) Raízen calculated and recognized, on December 31, 2023, PIS and COFINS credits amounting to R$3.7 billion in connection with Supplementary Law 192/22 and R$1.5 billion in connection with Supplementary Law 194/22, totaling R$5.2 billion, with an impact of R$1.6 billion of equity pick-up in the period, net of income and social contribution taxes.
Income and Social Contribution Taxes
Income and social contribution taxes in the fiscal year ended December 31, 2023 amounted to an expense of R$274 million vs. a revenue of R$118 million in the previous year. In December 2023, the effective tax rate was 5.37%. The main effects were due to: (i) dividends received from Vale (R$254 million); (ii) benefit from adhesion to the government’s Zero Litigation program (R$23 million); (iii) rate difference (R$805 million); (iv) provision for non-realization of the benefit related to Brazil’s federative pact (-R$307 million); and (v) increase of R$551 million compared to the same period of the previous year in equity pickup constituting the balance of R$673 million.
Net Income
Cosan ended 2023 with net income of R$1.1 billion, practically stable in relation to 2022, which represented a strong comparison base due to the significant appreciation of Vale’s shares in 4Q22.
3. Proposal for Retention of Earnings
In the fiscal year ended December 31, 2023, the Management proposed that net income be allocated as follows: R$274 million to the minimum mandatory dividends, complementary dividends in the amount of R$566 million and the remainder of R$254 million allocated to the profit reserve. Such allocation will be submitted for approval or alteration at the Shareholders Meeting of the Company.
4. Human Capital
In 2023, we took a significant step in enhancing our Entrepreneurial Culture. We evolved our agenda of Diversity, Equity & Inclusion, ensuring a safe workplace where all voices are heard and respected, intensifying our focus on caring for our people.
We made progress in increasing female participation in senior leadership positions. Our Board of Directors currently consists of two women and seven men, and of them identifies as LGBTQIAPN+. Therefore, in 2023, we received the Women on Board (WOB) seal, an initiative that recognizes and values women's participation in the organizational sphere. We also saw an increase in female representation in our employee base, with 58% of women, 36% of whom hold senior management positions.
As part of our purpose, we seek to empower people and businesses to their fullest potential and, in this sense, our teams find various development opportunities and career alternatives within our ecosystem, enabling growth alongside our portfolio.
The safety and well-being of all individuals are priorities for Cosan. We pursue the goal of zero accidents daily in Cosan and in our investees, investing in training, technology and promoting best practices to ensure a safe workplace. Together, we offer our employees comprehensive health benefits, reflecting our commitment to caring for and supporting the physical and mental health of our team.
|
5. Capital Market & Corporate Governance
Cosan is a publicly traded company and its shares have been traded on the B3 - Brasil, Bolsa, Balcão, under the ticker CSAN3, since 2005, in the Novo Mercado listing segment, which features companies that undertake to adhere to the best corporate governance practices.
Since March 2021, the Company has level II American Depositary Shares (ADS) listed on the New York Stock Exchange (NYSE), under the ticker CSAN, which represents compliance with an additional regulatory layer, evidencing the strength of the policies and practices adopted by Cosan and its businesses.
Cosan’s capital stock is divided into 1,874,070,932 registered, book-entry common shares without par value and with voting rights, in compliance with B3’s Novo Mercado segment. Rubens Ometto Silveira Mello is Cosan’s controlling shareholder.
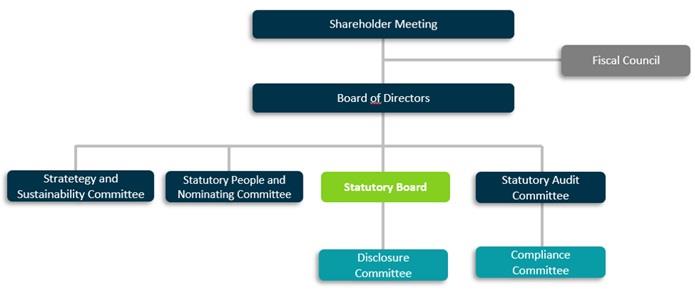
In recent years, the Company has strengthened its corporate governance and now has a robust framework, through which strategies and action plans are extensively discussed by competent professionals and adequately disseminated to all levels of the team.
To support the Company's management, Committees that mostly report directly to the Board of Directors have been established. In addition, Cosan has a robust risk management structure to identify events that may negatively impact the sustainability of its business.
Governance Structure
6. Commitment to Sustainability
Our role in sustainability includes managing material ESG aspects for the Company and across the portfolio (Governance, Climate Change, Diversity, Social Impact, and Safety), as well as engaging investees in these areas. We incorporate climate risks into our risk matrix and decision-making analyses. As such, we advanced in our agenda of continuous monitoring and performance metrics together with our investees, in order to act with greater transparency in reporting information to our stakeholders and interested parties, which is reflected in the performance of the indices and ratings of which Cosan and its investees are components.
We also dedicated our efforts to disseminate the strategy, advance in the implementation of governance and management of the “ESG Vision 2030,” contributing to the value creation process and achievement of commitments across our portfolio. For the next cycles, we will maintain our commitment to leverage the sustainable development of society, central pillar of our business strategy.
For more information, refer to Note 3.3 “Accounting impacts related to environmental, social and governance (ESG) initiatives” to the Financial Statements for fiscal year ended December 31, 2023.
To learn more about Cosan’s sustainability practices, visit www.cosan.com.br/en/sustainability/.
|
7. Relationship with Independent Auditor
The Company has a Policy on Engaging Independent Auditor and Non-Audit Services (“Policy”) to establish the rules related to engaging independent auditors and audit firms, including the guidelines and procedures to ensure the independence of independent auditors and third-party consultants providing audit and non-audit services to the Company, its subsidiaries, joint venture and associated companies. The policy is available at https://www.cosan.com.br/en/about-cosan/bylaw-policies-and-code-of-ethics/.
Per the Notice to the Market disclosed on December 22, 2023, Cosan’s independent auditor was changed. The audit firm Ernst & Young Auditores Independentes S.S (“EY”) was responsible for reviewing the Companys’s Interim Financial Statements for the periods ended March 31, 2023, June 30, 2023, and September 30, 2023, while BDO RCS Auditores Independentes (“BDO”) was in charge of auditing the Company’s Financial Statements ended on December 31, 2023.
We inform that EY was engaged to provided non-audit services, with the sum of EY’s fees representing 16% of its total fees for reviewing the Company’s Interim Financial Statements for the periods ended March 31, 2023, June 30, 2023, and September 30, 2023, which did not affect the principle of independence established in the Policy. Such services refer mainly to:
| (i) | revision of tax compliance of Company subsidiaries; and |
| (ii) | works related to audit, such as revision of prospects, due diligence activities and other procedures previously agreed and approved by the Company’s Audit Committee. |
Based on the aforementioned independence principle, EY has stated that all work conducted and concluded until November 30, 2023 (the date of the change of independent auditor) was not compromised in terms of independence and objectivity required for the services provided to the Company. Also, based on the aforementioned independence principle, BDO has stated that all work conducted from December 1, 2023, onwards and concluded until the present moment was not compromised in terms of independence and objectivity required for the services provided to the Company.
During the fiscal year ended December 31, 2023, the independent auditors provided no other non-audit services other than those mentioned above.
8. Acknowledgements
Cosan’s Management thanks its shareholders, clients, suppliers and financial institutions for their collaboration and trust, and especially its employees for their dedication and commitment. For a detailed analysis of Cosan’s 2023 results, please access our website: www.cosan.com.br/en/.www.cosan.com.br/en/.
CONTENT
 |
(Convenience translation into English from the original previously issued in Portuguese)
INDEPENDENT AUDITOR’S REPORT ON THE INDIVIDUAL AND CONSOLIDATED FINANCIAL STATEMENTS
To the
Shareholders, Board Members and Management of
Cosan S.A.
São Paulo - SP
Qualified opinion on the individual and consolidated financial statements
We have audited the individual and consolidated financial statements of Cosan S.A. (“Company”), identified as parent company and consolidated, respectively, which comprise the statement of financial position as at December 31, 2023, and the respective statements of income, comprehensive income, changes in equity and cash flows for the year then ended, as well as the corresponding notes to the financial statements, including material accounting policies and other explanatory information.
In our opinion, except for the possible effects of the matter described in the following section of this report “Basis for qualified opinion on the individual and consolidated financial statements”, the accompanying financial statements present fairly, in all material respects, the individual and consolidated financial position of the Company as at December 31, 2023, its individual and consolidated financial performance and its individual and consolidated cash flows for the year then ended in accordance with Brazilian accounting practices and International Financial Reporting Standards (IFRS) issued by the International Accounting Standards Board (IASB).
Basis for qualified opinion on the individual and consolidated financial statements
Moove – unaudited relevant subsidiaries
As disclosed in Notes 4, 4.4 and 9.1 to the individual and consolidated financial statements, the Company has recorded investment in the subsidiary Moove Lubricants Holdings (“Moove”), which is reported as business segment, including legal entities located in the United States of America and in the United Kingdom, jointly material in the context of our audit. Until the date of conclusion of our work, the aforementioned legal entities did not have their audits concluded, neither by us or other independent auditors. Under this circumstance, we were unable to obtain appropriate and sufficient audit evidence on the accounting balances for those legal entities. Consequently, we were unable to determine whether or not there was need for adjustments and/or reclassifications that could impact those accounting balances related to these legal entities, as at December 31, 2023, in the items of the individual and consolidated statement of financial position, as well as in the individual and consolidated financial statements as a whole.
We conducted our audit in accordance with Brazilian and International Standards on Auditing (ISAs). Our responsibilities under those standards are further described in the “Auditor’s Responsibilities for the Audit of the Individual and Consolidated Financial Statements” section of our report. We are independent of the Company and its controlled companies in accordance with the relevant ethical principles established in the Code of Ethics for Professional Accountants and in the professional standards issued by the Brazilian Federal Council of Accounting (CFC), and we have fulfilled our other ethical responsibilities in accordance with these standards. We believe that the audit evidence we have obtained is sufficient and appropriate to provide a basis for our qualified audit opinion.
Key audit matters
Key audit matters are those matters that, in our professional judgment, were of most significance in our audit of the financial statements for the current year. These matters were addressed in the context of our audit of the individual and consolidated financial statements as a whole and in forming our opinion thereon and, accordingly, we do not provide a separate opinion on them.
|
In addition to the matters described on section “Basis for qualified opinion on the individual and consolidated financial statements”, we determined that these matters are the key audit matters to be communicated in our report.
Assessment on the recoverability of deferred Income and Social Contribution tax assets (“deferred taxes assets”)
As disclosed in Note 15 to the individual and consolidated financial statements, as at December 31, 2023, the Company and its subsidiaries have recorded the amount of R$ 5,609,030 thousand under “Deferred taxes” arising from Income and Social Contribution tax losses, as well as nondeductible and/or taxable temporary differences, whose balance substantially originates from the Parent company, in the amount of R$ 2,478,911 thousand, and from the subsidiary Rumo S.A. in the amounts of R$ 1,869,877 thousand.
Management assesses at least annually the risk of impairment losses for this asset, which requires significant judgement to assess the probability of realization of future taxable income, considering, among other aspects, long-term forecasts and existence of events that might be out of the Company’s control, i.e., favorable conditions for the realization of capital market transactions, receipts of dividends and interest on equity capital, the future of certain subsidiaries and associated companies, climate events that might influence agricultural production, and global geopolitical crisis that may cause impact on agricultural products exports, both of which directly affecting volume forecasts and, consequently, net revenue of controlled companies, which are components of the deferred taxes recoverability framework.
Due to the forementioned aspects, the materiality of the amounts involved and considering that any changes to the economic assumptions used by the Company, including the Company’s and its subsidiaries’ business conditions, might result in significant effects on the forecasts for future taxable income and, as consequence, in material impacts on the consolidated financial statements, we consider this to be a key audit matter.
Audit response
Our audit procedures included, among others:
| § | Understanding of relevant internal control environment related to deferred tax assets and liabilities, including internal controls over the analysis of the realization of such taxes; |
| § | Application of group audit procedures, evaluating the risks involved and procedures performed by the auditors of significant components on the accounting and financial information of these components that relate to the Company’s consolidated financial statements, including the preparation and submission of audit instructions to the component engagement team members and oversight and monitoring by the Company’s audit team; |
| § | Review of the reasonability of the model adopted by Management to elaborate future taxable income forecasts, including understanding relevant risks and evaluating the main assumptions and criteria applied, as well as evaluating the representations of which of such assumptions are comprised in the long-term strategic planning approved by Management. |
| § | Review of arithmetic calculations on the recognition and measurement of deferred tax assets and liabilities; |
| § | Review of the disclosures made by the Company in its financial statements. |
Based on the results of the audit procedures described above, we believe that the criteria and assumptions adopted by Management to determine the realization value of deferred taxes are reasonable, considering the applicable accounting practices and reasonableness of the supporting documentation on projections, maintained by Management, to corroborate its conclusion.
|
Measurement of fair value of investment properties
According with Note 11.5 to the individual and consolidated financial statements, as at December 31, 2023, the Company and its subsidiaries have recorded under “Investment properties” the amount of R$ 15,976,126 thousand, which originated revenue from change to fair value in income, as at December 31, 2023, of R$ 2,259,924 thousand, as disclosed in Note 21 to the individual and consolidated financial statements.
The methodologies and frameworks applied to determine fair value included Management hiring external evaluators to, by means of their database, compare properties under scrutiny with similar assets to determine the realization fair value of these Company’s investment properties.
Considering the forementioned aspects, the significance of the amounts involved relative to the whole of assets, to equity and to the effects of changes in fair value of properties in income, and also to uncertainties inherent to estimates of fair value, we consider this to be a key audit matter.
Audit response
Our audit procedures included, among others:
| § | Understanding of the relevant internal control environment referring to investment properties, which includes internal controls that relate to the hiring of external specialists, the determination of assumptions for the calculation of fair value and the review of the result presented in the properties valuation reports. |
| § | Application of group audit procedures, evaluating the risks involved and procedures performed by the auditors of significant components on the accounting and financial information of these components that relate to the Company’s consolidated financial statements, including the preparation and submission of audit instructions to the component engagement team members and oversight and monitoring by the Company’s audit team; |
| § | Application of document testing to a sample of base assets to measure fair value; |
| § | Involvement of our specialists to: (i) evaluating the reasonability of the framework adopted to determine the fair value of investment properties, including the understanding of significand assumptions and criteria applied; (ii) evaluating the geographical size registered to the properties’ title, as well as the mandatory legally-enforced environmental protection areas of each property; |
| § | Review of the arithmetic calculations on the recognition and measurement of deferred tax assets; |
| § | Review of the disclosures made by the Company in its financial statements. |
Based on the results of the audit procedures described above, we believe that the criteria and assumptions adopted by Management to determine the fair value of the investment properties are reasonable, considering the applicable accounting practices and reasonableness of the projections supporting documentation, maintained by Management, to corroborate its conclusion.
|
Public concession contracts for distribution of piped gas
As disclosed in Note 11.2(a) and 11.3 to the individual and consolidated financial statements, the Company has recorded in public concession intangible asset and contract assets from gas distribution services the respective amounts of R$ 12,307,964 thousand and R$ 1,041,421 thousand, which represent, substantially, expenses on infrastructure for this concession at the subsidiary Compass Gás e Energia S.A.
The investments in expansion and improvement of the concession infrastructure for the distribution of piped gas are accounted for as contract assets while under construction. From the effective beginning of operations, investments are divided between “Intangible assets”, due to their returns relying on the usage of a public service, by means of the consumption of piped gas by consumers, and “Financial assets”, for investments made and not amortized until the completion of the concession contract, since there is an unconditional right to receive cash or other financial asset directly from the Granting Authority.
The definition of which expenses are eligible and should be capitalized during the construction process as infrastructure costs involves significand complexity and judgement from the Company’s Management.
For the forementioned aspects and given the significance of the amounts involved, we consider this to be a key audit matter.
Audit response
Our audit procedures included, among others:
| § | Application of group audit procedures, evaluating the risks involved and procedures performed by the auditors of components on the accounting information of this component that relate to the Company’s consolidated financial statements, including the preparation and submission of audit instructions to the component engagement team members and oversight and monitoring by the Company’s audit team; |
| § | Understanding of the relevant design and processes implemented by the Company on measurement and recognition of amounts accounted for as contract assets and intangible assets, including their classification as an asset qualifiable for capitalization; |
| § | Assessment of the type of those investments on the implemented infrastructure; |
| § | Application of document testing, by sampling, on: (i) materials and services applied in construction work, as well as the allocation of workforce working hours and evaluation of whether their classification was appropriate; and (ii) additions, amortization and capitalization of interest; |
| § | Evaluation of accounting classifications between contract assets and right-related intangible assets of this concession, considering the periods and stages of construction work; |
| § | Review of the accounting policies established by the Company for such accounts and their applicability as per the accounting standards in effect; |
| § | Amortization testing of the right-related intangible assets of the concession, recognized throughout 2023; |
| § | Review of the disclosures made by the Company in its financial statements. |
Based on the outcome of the audit procedures hereby described, we considered the criteria and policies applied to the capitalization and amortization of public concession infrastructure assets related to gas distribution services prepared by Management to be reasonable, as well as the respective disclosures in the Notes to the individual and consolidated financial statements, as a whole.
|
Capitalization of expenses incurred in the construction of infrastructure assets of railway concession
As disclosed in Note 11.1(a) to the individual and consolidated financial statements, as at December 31, 2023, the Company has recorded under property, plant and equipment assets related to railway concession infrastructure from the subsidiary Rumo S.A., which is comprised by locomotives and cars, in the amount of R$ 4,831,568 thousand, and permanent way, in the amount of R$ 8,341,835 thousand, totaling R$ 13,173,403. The expenses capitalized on those assets directly related to the railway concession infrastructure are relevant and fundamental for the maintenance of the infrastructure used to render railway transportation services.
The classification of expenses incurred between capital goods (Capital expenditure – Capex) and operating expenses (Operational Expenditure – Opex) involves the setting up of IT systems, communication and assessment between areas of different specialty fields within the subsidiary Rumo S.A., to align the definition of the type of expense for those incurred with the purpose of replacing or renewing parts and pieces necessary for the asset to achieve the intended operating condition, criteria to allocate the workforce directly attributable to the construction of this asset, and also the adoption of processes and controls appropriately designed and continually operated by Management to mitigate the possibility of misallocation of those such expenses between construction in progress, under property, plant and equipment, and operating expenses recognized in income.
Due to the mentioned aspects, the significance of the amounts involved and the risk of undue capitalization regarding assets directly related to the railway concession infrastructure, we consider this to be a key audit matter.
Audit response
Our audit procedures included, among others:
| § | Application of group audit procedures, evaluating the risks involved and procedures performed by the auditors of components on the accounting information of this component that relate to the Company’s consolidated financial statements, including the preparation and submission of audit instructions to the component engagement team members and oversight and monitoring by the Company’s audit team; |
| § | General understanding of the control environment to allocate expenses to either Capex or Opex; |
| § | Meeting with Management to understand and validate concepts based on Technical Pronouncement CPC 27 – Fixed assets; |
| § | Meeting with Projects area representatives to understand, among others, budgeting, allocation of expenses and the actual development of certain projects; |
| § | Research on news related to determinate projects recorded as construction in progress; |
| § | Understanding of determinate IT systems used in processes associated to expenses on construction in progress |
| § | Application of document testing, by sampling, on additions to property, plant and equipment recorded under “construction in progress”; |
| § | Obtaining of evidences, by sampling, on the actual development of certain construction in progress; |
| § | Review of the disclosures made by the Company in its financial statements. |
Based on the procedures applied, we considered the assumptions used for the allocation of expenses incurred in the construction of assets recorded under Construction in progress to be appropriate, based on sample testing, as well as the disclosures in the financial statements, taken as a whole.
|
Provision for legal claims
As disclosed in Note 16, the Company and its subsidiaries are party to legal and administrative proceedings at tax, civil, environmental, regulatory and labor levels, which arise from the normal course of its business. As at December 31, 2023, the Company and its subsidiaries have tax and civil, environmental and regulatory matters being discussed at several procedural levels, in the total amount of R$ 15,703,294 thousand and R$ 7,166,011 thousand, respectively, of which R$ 813,732 thousand and R$ 512,979 thousand, respectively, are provisioned, referring to proceedings with probable outflow of funds, according to the evaluation of Management based on the opinion of its legal counselors.
The definition of the amounts provisioned and disclosed depends on Management’s critical judgment in relation to the probability of loss highlighted in the ongoing legal discussions, as a result of the interpretations of the current legislation, judicial decisions and evolution of the jurisprudence. Additionally, considering the relevance of the amounts involved and the complexity of the legal and regulatory environment, any changes in the assumptions adopted for determining the loss prognosis may have a material impact on the Company's individual and consolidated financial statements.
Due to the significance of the amounts involved in contingencies classified as of possible loss, the increased number of court claims the Company is party to and the complexity of the judgements made by Management in the process of measuring those contingencies, we consider this to be a key audit matter.
Audit response
Our audit procedures included, among others:
| § | Meetings with key-personnel from the Company’s legal department; |
| § | Understanding and assessment of the internal control environment related to the cycle of identification, recognition, measurement and disclosure of contingent liabilities; |
| § | Application of group audit procedures, evaluating the risks involved and procedures performed by the auditors of significant components on the accounting information of these components that relate to the Company’s consolidated financial statements, including the preparation and submission of audit instructions to the component engagement team members and oversight and monitoring by the Company’s audit team; |
| § | Evaluation of the methodology, assumptions and criteria used by the Company, including adjustments, for the recognition, measurement and disclosure of contingencies in the financial statements; |
| § | Obtaining of external confirmation letters from the legal counselors in charge of the proceedings, aiming to confirm: (i) the existence of the proceedings and their current status; (ii) the respective assessment of loss involved and the applicable legal grounds; |
| § | Involvement of our tax specialists to evaluate the type, grounds and/or defense thesis, and occasional changes to loss probability classification for the certain relevant tax proceedings considered as possible loss, that include complex judgement and subjectivity in the evaluations; |
| § | Regarding the tax aspects of income taxes, our evaluation included: (i) meetings with Management to understand the existing internal controls to identify and monitor uncertain tax treatments; (ii) criteria adopted for the recognition and measurement of tax liabilities, if applicable; |
| § | Review of the disclosures made by the Company in its financial statements. |
|
Based on the procedures applied, we considered acceptable the assumptions used by Management to measure the provisions for contingencies and their disclosure in the context of the financial statements taken as a whole.
Other matters
Prior-year financial statements audited by other independent auditor
The individual and consolidated financial statements for the year ended December 31, 2022, originally prepared prior to the reclassifications disclosed in Note 3.4 to the individual and consolidated financial statements, were examined by other independent auditor, whose report thereon, dated February 28, 2023, was unmodified. As part of our audit of the individual and consolidated financial statements of 2023, we have also examined the reclassifications described in Note 3.4, which were made to change corresponding values relative to the individual and consolidated financial statements of 2022. In our opinion, such reclassifications are appropriate and were correctly made. We were not engaged to audit, review or apply any other procedures on the Company’s individual and consolidated financial statements for the year ended December 31, 2022, and, accordingly, we do not issue an opinion or provide any form of assurance on the individual and consolidated financial statements for 2022 taken as a whole.
Statements of value added
The individual and consolidated statements of value added, prepared under the responsibility of the Company’s Management for the year ended December 31, 2023, and presented as supplemental information for IFRS purposes, were submitted to audit procedures along with the audit of the Company’s financial statements. In order to form an opinion, we have checked whether these statements are reconciled with the financial statements and accounting records as applicable, and whether its form and contents meet the criteria established in Technical Pronouncement NBC TG 09 - Statement of Value Added. In our opinion, except for the matters mentioned under section “Basis for qualified opinion on the individual and consolidated financial statements”, the statements of value added were properly prepared, in all material respects, in accordance with the criteria established in that Technical pronouncement, and are consistent with the individual and consolidated financial statements taken as a whole.
Other information accompanying the individual and consolidated financial statements and auditor’s report
The Company’s Management is responsible for the other information that comprises the Management Report.
Our opinion on the individual and consolidated financial statements does not cover the Management Report and we do not express any form of audit conclusion thereon.
|
In connection with our audit of the individual and consolidated financial statements, our responsibility is to read the Management Report and, in doing so, consider whether the report is materially inconsistent with the financial statements or our knowledge obtained in the audit, or otherwise appears to be materially misstated. If, based on the work we have performed, we conclude that there is a material misstatement of this Management Report, we are required to report that fact. We have nothing to report in this regard.
Responsibilities of Management and those charged with governance for the individual and consolidated financial statements
Management is responsible for the preparation and fair presentation of the individual and consolidated financial statements in accordance with Brazilian accounting practices and IFRS issued by IASB, and for such internal control as management determines is necessary to enable the preparation of financial statements that are free from material misstatement, whether due to fraud or error.
In preparing the individual and consolidated financial statements, Management is responsible for assessing the Company’s ability to continue as a going concern, disclosing, as applicable, matters related to going concern and using the going concern basis of accounting unless Management either intends to liquidate the Company and its subsidiaries or to cease operations, or has no realistic alternative but to do so.
Those charged with governance are responsible for overseeing the Company’s and its subsidiaries’ financial reporting process.
Auditor’s responsibilities for the audit of the individual and consolidated financial statements
Our objectives are to obtain reasonable assurance about whether the individual and consolidated financial statements as a whole are free from material misstatement, whether due to fraud or error, and to issue an auditor’s report that includes our opinion. Reasonable assurance is a high level of assurance but is not a guarantee that an audit conducted in accordance with Brazilian and International Standards on Auditing (ISA) will always detect a material misstatement when it exists. Misstatements can arise from fraud or error and are considered material if, individually or in the aggregate, they could reasonably be expected to influence the economic decisions of users taken on the basis of these financial statements.
As part of an audit in accordance with Brazilian standards and ISAs, we exercise professional judgment and maintain professional skepticism throughout the audit. We also:
|
| § | Identify and assess the risks of material misstatement of the individual and consolidated financial statements, whether due to fraud or error, design and perform audit procedures responsive to those risks, and obtain audit evidence that is sufficient and appropriate to provide a basis for our opinion. The risk of not detecting a material misstatement resulting from fraud is higher than for one resulting from error, as fraud may involve collusion, forgery, intentional omissions, misrepresentations, or the override of internal controls; |
| § | Obtain an understanding of internal controls relevant to the audit in order to design audit procedures that are appropriate in the circumstances, but not for the purpose of expressing an opinion on the effectiveness of the Company’s and its subsidiaries' internal controls; |
| § | Evaluate the appropriateness of accounting policies used and the reasonableness of accounting estimates and disclosures made by Management; |
| § | Conclude on the appropriateness of Management’s use of the going concern basis of accounting and, based on the audit evidence obtained, whether material uncertainty exists related to events or conditions that may cast significant doubt on the Company’s and its subsidiaries’ ability to continue as a going concern. If we conclude that material uncertainty exists, we are required to draw attention in our auditor’s report to the related disclosures in the individual and consolidated financial statements or, if such disclosures are inadequate, to modify our opinion. Our conclusions are based on the audit evidence obtained up to the date of our auditor’s report. However, future events or conditions may cause the Company and its subsidiaries to cease to continue as a going concern; |
| § | Evaluate the overall presentation, structure and content of the financial statements, including the disclosures, and whether the individual and consolidated financial statements represent the underlying transactions and events in a manner that achieves fair presentation; |
| § | Obtain sufficient and appropriate audit evidence regarding the financial information of the entities or business activities within the group to express an opinion on the consolidated financial statements. We are responsible for the direction, supervision and performance of the audit. We remain solely responsible for our audit opinion. |
|
We communicate with those charged with governance regarding, among other matters, the planned scope and timing of the audit and significant audit findings, including any significant deficiencies in internal controls that we identify during our audit.
We also provide those charged with governance with a statement that we have complied with relevant ethical requirements regarding independence, and that we have informed them of all relationships and other matters that may reasonably be thought to bear on our independence, and where applicable, related safeguards.
Of the matters communicated to those charged with governance, we determine those that were of most significance for the audit of the financial statements for the current year and which are therefore the key audit matters. We describe these matters in our auditor’s report unless law or regulation precludes public disclosure about the matter or when, in extremely rare circumstances, we determine that a matter should not be communicated in our report because the adverse consequences of doing so would reasonably be expected to outweigh the public interest benefits of such communication.
The accompanying individual and consolidated financial statements have been translated into English for the convenience of readers outside Brazil.
São Paulo, April 26, 2024
|
BDO RCS Auditores Independentes SS Ltda. CRC 2 SP 013846/O-1 |
|
|
Luiz Gustavo Pereira dos Santos |
Accountant CRC 1 SP 258849/O-9 |
(In thousands of Reais)
|
|
| Parent Company |
| Consolidated | ||||
| Note |
| 12/31/2023 |
| 12/31/2022 |
| 12/31/2023 |
| 12/31/2022 |
Assets |
|
|
|
|
|
|
|
|
|
Cash and cash equivalents | 5.2 |
| 1,769,976 |
| 1,348,461 |
| 14,658,481 |
| 13,301,716 |
Restricted cash | 5.3 |
| — |
| — |
| 7,860 |
| 8,024 |
Marketable securities | 5.3 |
| 705,777 |
| 724,050 |
| 3,407,955 |
| 2,422,470 |
Trade receivables | 5.7 |
| — |
| — |
| 3,330,488 |
| 3,769,908 |
Derivative financial instruments | 5.6 |
| 54,935 |
| — |
| 202,399 |
| 1,086,698 |
Inventories | 7 |
| — |
| — |
| 1,792,714 |
| 1,869,059 |
Receivables from related parties | 5.8 |
| 173,351 |
| 381,547 |
| 251,471 |
| 235,541 |
Income tax receivable |
|
| 508,268 |
| 272,130 |
| 888,942 |
| 560,789 |
Other current tax receivable | 6 |
| 8,346 |
| 8,366 |
| 745,856 |
| 1,324,203 |
Dividend receivable | 17 |
| 319,135 |
| 609,456 |
| 255,777 |
| 161,147 |
Sectorial financial assets | 5.10 |
| — |
| — |
| 207,005 |
| 148,955 |
Other financial assets |
|
| — |
| — |
| 690 |
| 88,961 |
Other current assets |
|
| 177,001 |
| 119,266 |
| 722,386 |
| 560,080 |
|
|
| 3,716,789 |
| 3,463,276 |
| 26,472,024 |
| 25,537,551 |
Current assets held for sale | 8 |
| 2,998 |
| — |
| 2,138,165 |
| 40,383 |
Current assets |
|
| 3,719,787 |
| 3,463,276 |
| 28,610,189 |
| 25,577,934 |
|
|
|
|
|
|
|
|
|
|
Trade receivables | 5.7 |
| — |
| — |
| 114,148 |
| 157,634 |
Marketable securities | 5.3 |
| — |
| — |
| 96,006 |
| 19,677,296 |
Restricted cash | 5.3 |
| 81,621 |
| 35,039 |
| 195,392 |
| 131,909 |
Deferred tax assets | 15 |
| 2,478,911 |
| 1,857,620 |
| 5,609,030 |
| 4,474,124 |
Receivables from related parties | 5.8 |
| 174,745 |
| 355,793 |
| 88,620 |
| 241,001 |
Income tax receivable |
|
| — |
| — |
| 432,360 |
| 434,886 |
Other non-current tax receivable | 6 |
| 33,639 |
| 31,774 |
| 1,132,703 |
| 1,074,923 |
Judicial deposits | 16 |
| 403,489 |
| 360,563 |
| 895,901 |
| 814,444 |
Derivative financial instruments | 5.6 |
| 102,881 |
| 1,368,809 |
| 2,344,400 |
| 3,065,054 |
Sectorial financial assets | 5.10 |
| — |
| — |
| 341,695 |
| 193,378 |
Other non-current assets |
|
| 71,250 |
| 62,432 |
| 216,694 |
| 201,811 |
Other financial assets |
|
| — |
| — |
| 2,423 |
| 277 |
Investments in associates | 9.1 |
| 35,741,778 |
| 31,230,371 |
| 17,611,369 |
| 2,913,943 |
Investment in joint ventures | 10 |
| 1,320,592 |
| 1,266,926 |
| 11,742,442 |
| 11,221,356 |
Property, plant and equipment | 11.1 |
| 39,817 |
| 46,044 |
| 21,239,974 |
| 18,948,436 |
Intangible assets and goodwill | 11.2 |
| 6,863 |
| 2,247 |
| 22,650,287 |
| 22,121,942 |
Contract asset | 11.3 |
| — |
| — |
| 1,052,105 |
| 1,118,715 |
Right-of-use assets | 11.4 |
| 22,200 |
| 23,032 |
| 9,513,518 |
| 8,012,869 |
Investment property | 11.5 |
| — |
| — |
| 15,976,126 |
| 14,103,060 |
Non-current assets |
|
| 40,477,786 |
| 36,640,650 |
| 111,255,193 |
| 108,907,058 |
|
|
|
|
|
|
|
|
|
|
Total assets |
|
| 44,197,573 |
| 40,103,926 |
| 139,865,382 |
| 134,484,992 |
The accompanying notes are an integral part of these financial statements.
Statement of financial position
(In thousands of Reais)
|
|
| Parent Company |
| Consolidated | ||||
| Note |
| 12/31/2023 |
| 12/31/2022 |
| 12/31/2023 |
| 12/31/2022 |
Liabilities |
|
|
|
|
|
|
|
|
|
Loans, borrowings and debentures | 5.4 |
| 800,987 |
| 802,549 |
| 4,882,398 |
| 4,542,205 |
Leases | 5.5 |
| 8,959 |
| 7,676 |
| 733,063 |
| 550,529 |
Derivative financial instruments | 5.6 |
| 364,747 |
| — |
| 1,250,520 |
| 1,039,357 |
Trade payables | 5.9 |
| 2,431 |
| 115,146 |
| 3,920,273 |
| 4,318,362 |
Employee benefits payables |
|
| 61,926 |
| 49,301 |
| 829,329 |
| 659,521 |
Income tax payables |
|
| 2,716 |
| 7,876 |
| 445,934 |
| 204,387 |
Other taxes payable | 14 |
| 226,556 |
| 141,216 |
| 673,718 |
| 760,041 |
Dividends payable | 17 |
| 276,065 |
| 279,979 |
| 549,054 |
| 892,006 |
Concessions payable | 13 |
| — |
| — |
| 250,971 |
| 256,759 |
Related party payables | 5.8 |
| 198,899 |
| 1,237,490 |
| 322,160 |
| 387,736 |
Sectorial financial liabilities | 5.10 |
| — |
| — |
| 70,013 |
| 67,419 |
Other financial liabilities | 5 |
| — |
| — |
| 476,895 |
| 924,562 |
Other current liabilities |
|
| 593,643 |
| 543,084 |
| 1,516,084 |
| 1,195,329 |
|
|
| 2,536,929 |
| 3,184,317 |
| 15,920,412 |
| 15,798,213 |
Liabilities related to assets held for sale | 8 |
| — |
| — |
| 238,393 |
| — |
Current liabilities |
|
| 2,536,929 |
| 3,184,317 |
| 16,158,805 |
| 15,798,213 |
Loans, borrowings, and debentures | 5.4 |
| 12,695,337 |
| 4,673,079 |
| 52,022,256 |
| 48,445,011 |
Leases | 5.5 |
| 20,584 |
| 22,689 |
| 4,542,731 |
| 2,981,629 |
Derivative financial instruments | 5.6 |
| 281,238 |
| 618,947 |
| 2,164,625 |
| 4,251,575 |
Trade payables | 5.9 |
| — |
| — |
| 264,252 |
| 61,489 |
Other taxes payable | 14 |
| 158,857 |
| 148,620 |
| 163,242 |
| 153,688 |
Provision for legal proceedings | 16 |
| 401,093 |
| 349,357 |
| 1,714,403 |
| 1,801,186 |
Concessions payable | 13 |
| — |
| — |
| 3,314,402 |
| 3,094,651 |
Investments with unsecured liabilities | 9.1 |
| 146,276 |
| 146,473 |
| — |
| — |
Related party payables | 5.8 |
| 6,449,968 |
| 9,221,407 |
| 1,078 |
| — |
Post-employment benefits | 23 |
| 313 |
| 312 |
| 617,647 |
| 575,840 |
Deferred tax liabilities | 15 |
| — |
| — |
| 5,225,433 |
| 5,469,368 |
Sectorial financial liabilities | 5.10 |
| — |
| — |
| 1,740,685 |
| 1,549,197 |
Deferred revenue |
|
| — |
| — |
| 19,129 |
| 624,801 |
Other financial liabilities | 5 |
| — |
| — |
| — |
| 29,985 |
Other non-current liabilities |
|
| 551,671 |
| 1,085,558 |
| 935,514 |
| 1,478,960 |
Non-current liabilities |
|
| 20,705,337 |
| 16,266,442 |
| 72,725,397 |
| 70,517,380 |
Total liabilities |
|
| 23,242,266 |
| 19,450,759 |
| 88,884,202 |
| 86,315,593 |
|
|
|
|
|
|
|
|
|
|
Shareholders' equity |
|
|
|
|
|
|
|
|
|
Share capital |
|
| 8,682,544 |
| 8,402,544 |
| 8,682,544 |
| 8,402,544 |
Treasury shares |
|
| (93,917) |
| (107,140) |
| (93,917) |
| (107,140) |
Additional paid-in capital |
|
| 2,561,964 |
| 2,319,928 |
| 2,561,964 |
| 2,319,928 |
Accumulated other comprehensive income |
|
| 314,325 |
| 567,546 |
| 314,325 |
| 567,546 |
Retained earnings |
|
| 9,490,391 |
| 9,470,289 |
| 9,490,391 |
| 9,470,289 |
Equity attributable to: |
|
|
|
|
|
|
|
|
|
Owners of the Company |
|
| 20,955,307 |
| 20,653,167 |
| 20,955,307 |
| 20,653,167 |
Non-controlling interests | 9.3 |
| — |
| — |
| 30,025,873 |
| 27,516,232 |
Total shareholders' equity |
|
| 20,955,307 |
| 20,653,167 |
| 50,981,180 |
| 48,169,399 |
Total liabilities and shareholders' equity |
|
| 44,197,573 |
| 40,103,926 |
| 139,865,382 |
| 134,484,992 |
The accompanying notes are an integral part of these individual and consolidated financial statements.
(In thousands of Reais, except earnings per share)
|
|
| Parent Company |
| Consolidated | ||||
| Note |
| 12/31/2023 |
| 12/31/2022 (Restated) (i) |
| 12/31/2023 |
| 12/31/2022 (Restated) (i) |
Net sales | 19 |
| — |
| — |
| 39,468,497 |
| 39,322,786 |
Cost of sales | 20 |
| — |
| — |
| (28,549,896) |
| (30,556,819) |
Gross profit |
|
| — |
| — |
| 10,918,601 |
| 8,765,967 |
|
|
|
|
|
|
|
|
|
|
Selling expenses | 20 |
| — |
| — |
| (1,350,570) |
| (1,276,279) |
General and administrative expenses | 20 |
| (437,390) |
| (300,262) |
| (2,527,974) |
| (1,758,067) |
Other incomes (expenses), net | 21 |
| (69,256) |
| 137,397 |
| 3,924,377 |
| 1,752,222 |
Operating expenses |
|
| (506,646) |
| (162,865) |
| 45,833 |
| (1,282,124) |
|
|
|
|
|
|
|
|
|
|
Profit (loss) before equity in earnings of investees and financial results |
|
| (506,646) |
| (162,865) |
| 10,964,434 |
| 7,483,843 |
|
|
|
|
|
|
|
|
|
|
Interest in earnings of associates | 9.1 |
| 2,236,069 |
| 3,909,579 |
| 350,399 |
| 418,897 |
Interest in earnings of joint ventures | 10 |
| 192,472 |
| (333,622) |
| 1,695,945 |
| (92,179) |
Equity in earnings of investees |
|
| 2,428,541 |
| 3,575,957 |
| 2,046,344 |
| 326,718 |
|
|
|
|
|
|
|
|
|
|
Financial expense |
|
| (1,934,520) |
| (1,970,687) |
| (11,337,430) |
| (4,706,535) |
Financial income |
|
| 829,235 |
| 277,734 |
| 3,028,134 |
| 5,777,521 |
Foreign exchange, net |
|
| 712,582 |
| 649,899 |
| 1,777,438 |
| 260,746 |
Net effect of derivatives |
|
| (1,098,745) |
| (2,299,389) |
| (1,365,169) |
| (6,489,668) |
Financial results, net | 22 |
| (1,491,448) |
| (3,342,443) |
| (7,897,027) |
| (5,157,936) |
|
|
|
|
|
|
|
|
|
|
Profit before income taxes |
|
| 430,447 |
| 70,649 |
| 5,113,751 |
| 2,652,625 |
|
|
|
|
|
|
|
|
|
|
Income taxes | 15 |
|
|
|
|
|
|
|
|
Current |
|
| 30,562 |
| — |
| (1,645,063) |
| (1,246,990) |
Deferred |
|
| 617,728 |
| 1,088,203 |
| 1,370,637 |
| 1,365,394 |
|
|
| 648,290 |
| 1,088,203 |
| (274,426) |
| 118,404 |
|
|
|
|
|
|
|
|
|
|
Profit for the year from continuing operations |
|
| 1,078,737 |
| 1,158,852 |
| 4,839,325 |
| 2,771,029 |
Profit for the year from discontinued operations, net of tax | 8 |
| 15,654 |
| 17,180 |
| 45,419 |
| 49,846 |
Profit for the year |
|
| 1,094,391 |
| 1,176,032 |
| 4,884,744 |
| 2,820,875 |
|
|
|
|
|
|
|
|
|
|
Profit attributable to: |
|
|
|
|
|
|
|
|
|
Owners of the Company |
|
| 1,094,391 |
| 1,176,032 |
| 1,094,391 |
| 1,176,032 |
Non-controlling interests |
|
| — |
| — |
| 3,790,353 |
| 1,644,843 |
|
|
| 1,094,391 |
| 1,176,032 |
| 4,884,744 |
| 2,820,875 |
|
|
|
|
|
|
|
|
|
|
Earnings per share of continuing operations | 18 |
|
|
|
|
|
|
|
|
Basic |
|
|
|
|
|
| R$0.5778 |
| R$0.6200 |
Diluted |
|
|
|
|
|
| R$0.5751 |
| R$0.6173 |
|
|
|
|
|
|
|
|
|
|
Earnings per share of discontinued operations | 18 |
|
|
|
|
|
|
|
|
Basic |
|
|
|
|
|
| R$0.0084 |
| R$0.0092 |
Diluted |
|
|
|
|
|
| R$0.0084 |
| R$0.0092 |
(i) For additional information see notes 3.4 and 8.
The accompanying notes are an integral part of these individual and consolidated financial statements.
(In thousands of Reais)
| Parent Company | Consolidated | |||||
| 12/31/2023 |
| 12/31/2022 | 12/31/2023 |
| 12/31/2022 | |
Profit for the year | 1,094,391 |
| 1,176,032 | 4,884,744 |
| 2,820,875 | |
Other comprehensive income: |
|
|
|
|
|
| |
Items that can be reclassified subsequently, to profit or loss: |
|
|
|
|
|
| |
Foreign currency translation differences | (109,134) |
| 1,032,232 | (172,501) |
| 917,548 | |
Gain (loss) on cash flow hedge | (92,491) |
| 58 | (125,233) |
| 723 | |
Change in fair value of financial assets, net of taxes | — |
| 11,144 | — |
| 22,395 | |
| (201,625) |
| 1,043,434 | (297,734) |
| 940,666 | |
|
|
|
|
|
|
| |
Items that cannot be reclassified to profit or loss: |
|
|
|
|
|
| |
Actuarial gains losses with defined benefit plan | (51,596) |
| 45,721 | (71,550) |
| 80,330 | |
Deferred taxes | — |
| — | 24,327 |
| (27,312) | |
| (51,596) |
| 45,721 | (47,223) |
| 53,018 | |
|
|
|
|
|
|
| |
Comprehensive income from continuing operations | 825,516 |
| 2,248,007 | 4,494,368 |
| 3,764,713 | |
Comprehensive income from discontinued operations | 15,654 |
| 17,180 | 45,419 |
| 49,846 | |
Total comprehensive income for the year | 841,170 |
| 2,265,187 | 4,539,787 |
| 3,814,559 | |
|
|
|
|
|
|
| |
Comprehensive income attributable to: |
|
|
|
|
|
| |
Owners of the Company | 841,170 |
| 2,265,187 | 841,170 |
| 2,265,187 | |
Non-controlling interest | — |
| — | 3,698,617 |
| 1,549,372 | |
| 841,170 |
| 2,265,187 | 4,539,787 |
| 3,814,559 | |
The accompanying notes are an integral part of these individual and consolidated financial statements.
Statement of changes in equity
(In thousands of Reais)
|
|
|
|
| Capital reserve |
|
|
| Profit reserve |
|
|
|
|
|
|
|
| |||||||||
|
| Share capital |
| Treasury share |
| Corporate transactions - Law 6404 |
| Capital transactions |
| Accumulated other comprehensive loss |
| Legal |
| Statutory reserve |
| Profit to be realized |
| Retained earnings |
| Accumulated profits |
| Equity attributable to controlling shareholders |
| Non-controlling interest |
| Total equity |
On January 1, 2022 |
| 6,365,853 |
| (69,064) |
| 737 |
| (1,690,972) |
| (521,609) |
| 348,753 |
| 9,872,037 |
| 171,021 |
| 264,181 |
| — |
| 14,740,937 |
| 14,129,085 |
| 28,870,022 |
Net income for the year |
| — |
| — |
| — |
| — |
| — |
| — |
| — |
| — |
| — |
| 1,176,032 |
| 1,176,032 |
| 1,644,843 |
| 2,820,875 |
Other comprehensive income (note 17) |
|
|
|
|
|
|
|
|
|
|
|
|
|
|
|
|
|
|
|
|
|
|
|
|
|
|
Gain from cash flow hedge accounting |
| — |
| — |
| — |
| — |
| 58 |
| — |
| — |
| — |
| — |
| — |
| 58 |
| 665 |
| 723 |
Foreign currency translation differences |
| — |
| — |
| — |
| — |
| 1,032,232 |
| — |
| — |
| — |
| — |
| — |
| 1,032,232 |
| (114,684) |
| 917,548 |
Actuarial gain on defined benefit plan, net of tax |
| — |
| — |
| — |
| — |
| 45,721 |
| — |
| — |
| — |
| — |
| — |
| 45,721 |
| 7,297 |
| 53,018 |
Change in fair value of financial assets |
| — |
| — |
| — |
| — |
| 11,144 |
| — |
| — |
| — |
| — |
| — |
| 11,144 |
| 11,251 |
| 22,395 |
Total comprehensive income for the year |
| — |
| — |
| — |
| — |
| 1,089,155 |
| — |
| — |
| — |
| — |
| 1,176,032 |
| 2,265,187 |
| 1,549,372 |
| 3,814,559 |
Transactions with owners of the Company contributions and distributions: |
|
|
|
|
|
|
|
|
|
|
|
|
|
|
|
|
|
|
|
|
|
|
|
|
|
|
Capital increase |
| 2,036,691 |
| — |
| — |
| — |
| — |
| (348,753) |
| (1,423,757) |
| — |
| (264,181) |
| — |
| — |
| 7,889,251 |
| 7,889,251 |
Sale of treasury shares |
| — |
| 1,752 |
| — |
| 618 |
| — |
| — |
| — |
| — |
| — |
| — |
| 2,370 |
| — |
| 2,370 |
Share based payments |
| — |
| 19,678 |
| — |
| (30,930) |
| — |
| — |
| — |
| — |
| — |
| — |
| (11,252) |
| 5,636 |
| (5,616) |
Dividends |
| — |
| — |
| — |
| — |
| — |
| — |
| (45,736) |
| — |
| — |
| (279,308) |
| (325,044) |
| (912,735) |
| (1,237,779) |
Legal reserve |
| — |
| — |
| — |
| — |
| — |
| 58,802 |
| — |
| — |
| — |
| (58,802) |
| — |
| — |
| — |
Statutory reserve |
| — |
| — |
| — |
| — |
| — |
| — |
| 837,922 |
| — |
| — |
| (837,922) |
| — |
| — |
| — |
Acquisition of treasury shares |
| — |
| (59,506) |
| — |
| — |
| — |
| — |
| — |
| — |
| — |
| — |
| (59,506) |
| — |
| (59,506) |
Business combination |
| — |
| — |
| — |
| — |
| — |
| — |
| — |
| — |
| — |
| — |
| — |
| 10,062,503 |
| 10,062,503 |
Employee share schemes - value of employee services |
| — |
| — |
| — |
| 55,391 |
| — |
| — |
| — |
| — |
| — |
| — |
| 55,391 |
| 7,003 |
| 62,394 |
Total contributions and distributions |
| 2,036,691 |
| (38,076) |
| — |
| 25,079 |
| — |
| (289,951) |
| (631,571) |
| — |
| (264,181) |
| (1,176,032) |
| (338,041) |
| 17,051,658 |
| 16,713,617 |
|
|
|
|
|
|
|
|
|
|
|
|
|
|
|
|
|
|
|
|
|
|
|
|
|
|
|
Transactions with owners of the Company: |
|
|
|
|
|
|
|
|
|
|
|
|
|
|
|
|
|
|
|
|
|
|
|
|
|
|
Acquisition of non-controlling interest |
| — |
| — |
| — |
| — |
| — |
| — |
| — |
| — |
| — |
| — |
| — |
| (1,092,374) |
| (1,092,374) |
Change of shareholding interest in subsidiary |
| — |
| — |
| — |
| 3,985,084 |
| — |
| — |
| — |
| — |
| — |
| — |
| 3,985,084 |
| (4,121,509) |
| (136,425) |
Total transactions with owners of the Company |
| — |
| — |
| — |
| 3,985,084 |
| — |
| — |
| — |
| — |
| — |
| — |
| 3,985,084 |
| (5,213,883) |
| (1,228,799) |
Total transactions with owners of the Company contributions and distributions: |
| 2,036,691 |
| (38,076) |
| — |
| 4,010,163 |
| — |
| (289,951) |
| (631,571) |
| — |
| (264,181) |
| (1,176,032) |
| 3,647,043 |
| 11,837,775 |
| 15,484,818 |
On December 31, 2022 |
| 8,402,544 |
| (107,140) |
| 737 |
| 2,319,191 |
| 567,546 |
| 58,802 |
| 9,240,466 |
| 171,021 |
| — |
| — |
| 20,653,167 |
| 27,516,232 |
| 48,169,399 |
The accompanying notes are an integral part of these individual and consolidated financial statements.
Statement of changes in equity
(In thousands of Reais)
|
|
|
|
|
| Capital reserve |
|
|
| Profit reserve |
|
|
|
|
|
|
|
| ||||||||
|
| Share capital |
| Treasury share |
| Corporate transactions - Law 6404 |
| Capital transactions |
| Accumulated other comprehensive loss |
| Legal |
| Statutory reserve |
| Unrealized profit |
| Retained earnings |
| Accumulated profits |
| Equity attributable to controlling shareholders |
| Interest of non-controlling shareholders |
| Total equity |
On January 1, 2023 |
| 8,402,544 |
| (107,140) |
| 737 |
| 2,319,191 |
| 567,546 |
| 58,802 |
| 9,240,466 |
| 171,021 |
| — |
| — |
| 20,653,167 |
| 27,516,232 |
| 48,169,399 |
Net income for the year |
| — |
| — |
| — |
| — |
| — |
| — |
| — |
| — |
| — |
| 1,094,391 |
| 1,094,391 |
| 3,790,353 |
| 4,884,744 |
Other comprehensive income (note 17) |
|
|
|
|
|
|
|
|
|
|
|
|
|
|
|
|
|
|
|
|
|
|
|
|
|
|
Loss from cash flow hedge accounting |
| — |
| — |
| — |
| — |
| (92,491) |
| — |
| — |
| — |
| — |
| — |
| (92,491) |
| (32,742) |
| (125,233) |
Foreign currency translation differences |
| — |
| — |
| — |
| — |
| (109,134) |
| — |
| — |
| — |
| — |
| — |
| (109,134) |
| (63,367) |
| (172,501) |
Actuarial gain (loss) on defined benefit plan, net of tax |
| — |
| — |
| — |
| — |
| (51,596) |
| — |
| — |
| — |
| — |
| — |
| (51,596) |
| 4,373 |
| (47,223) |
Total comprehensive income (loss) for the year |
| — |
| — |
| — |
| — |
| (253,221) |
| — |
| — |
| — |
| — |
| 1,094,391 |
| 841,170 |
| 3,698,617 |
| 4,539,787 |
Transactions with owners of the Company contributions and distributions: |
|
|
|
|
|
|
|
|
|
|
|
|
|
|
|
|
|
|
|
|
|
|
|
|
|
|
Capital increase (note 17) |
| 280,000 |
| — |
| — |
| — |
| — |
| — |
| (280,000) |
| — |
| — |
| — |
| — |
| — |
| — |
Funds from capital increase and decrease in subsidiary (note 9.2) |
| — |
| — |
| — |
| — |
| — |
| — |
| — |
| — |
| — |
| — |
| — |
| 6,657 |
| 6,657 |
Gain from capital increase in a subsidiary |
| — |
| — |
| — |
| 60,348 |
| — |
| — |
| — |
| — |
| — |
| — |
| 60,348 |
| 10,830 |
| 71,178 |
Share based payments |
| — |
| 13,223 |
| — |
| (40,113) |
| — |
| — |
| — |
| — |
| — |
| — |
| (26,890) |
| (79,565) |
| (106,455) |
Write-off of interest in subsidiary |
| — |
| — |
| — |
| — |
| — |
| — |
| — |
| — |
| — |
| — |
| — |
| (22,280) |
| (22,280) |
Dividends and allocation of results (i) |
| — |
| — |
| — |
| — |
| — |
| — |
| (349,670) |
| (171,021) |
| 820,793 |
| (820,793) |
| (520,691) |
| (1,581,323) |
| (2,102,014) |
Mandatory minimum dividends |
| — |
| — |
| — |
| — |
| — |
| — |
| — |
| — |
| — |
| (273,598) |
| (273,598) |
| - |
| (273,598) |
Business combination |
| — |
| — |
| — |
| — |
| — |
| — |
| — |
| — |
| — |
| — |
| — |
| 237,460 |
| 237,460 |
Employee share schemes - value of employee services |
| — |
| — |
| — |
| 135,653 |
| — |
| — |
| — |
| — |
| — |
| — |
| 135,653 |
| 50,664 |
| 186,317 |
Total contributions and distributions |
| 280,000 |
| 13,223 |
| — |
| 155,888 |
| — |
| — |
| (629,670) |
| (171,021) |
| 820,793 |
| (1,094,391) |
| (625,178) |
| (1,377,557) |
| (2,002,735) |
Transactions with owners of the Company: |
|
|
|
|
|
|
|
|
|
|
|
|
|
|
|
|
|
|
|
|
|
|
|
|
|
|
Gain on dividends from subsidiary |
| — |
| — |
| — |
| 79,825 |
| — |
| — |
| — |
| — |
| — |
| — |
| 79,825 |
| 188,581 |
| 268,406 |
Change of shareholding interest in subsidiary (note 9.1) |
| — |
| — |
| — |
| 6,323 |
| — |
| — |
| — |
| — |
| — |
| — |
| 6,323 |
| — |
| 6,323 |
Total transactions with owners of the Company |
| — |
| — |
| — |
| 86,148 |
| — |
| — |
| — |
| — |
| — |
| — |
| 86,148 |
| 188,581 |
| 274,729 |
Total transactions with owners of the Company contributions and distributions: |
| 280,000 |
| 13,223 |
| — |
| 242,036 |
| — |
| — |
| (629,670) |
| (171,021) |
| 820,793 |
| (1,094,391) |
| (539,030) |
| (1,188,976) |
| (1,728,006) |
On December 31, 2023 |
| 8,682,544 |
| (93,917) |
| 737 |
| 2,561,227 |
| 314,325 |
| 58,802 |
| 8,610,796 |
| — |
| 820,793 |
| — |
| 20,955,307 |
| 30,025,873 |
| 50,981,180 |
The accompanying notes are an integral part of these individual and consolidated financial statements.
(i) The allocation of the statutory reserve for the year 2023 will be held after the Ordinary General Meeting.
(In thousands of Reais)
|
|
| Parent Company | Consolidated | |||||
| Note |
| 12/31/2023 |
| 12/31/2022 (Restated) (i) |
| 12/31/2023 |
| 12/31/2022 (Restated) (i) |
Cash flows from operating activities |
|
|
|
|
|
|
|
|
|
Profit before income taxes |
|
| 430,447 |
| 70,649 |
| 5,113,751 |
| 2,652,625 |
Adjustments for: |
|
|
|
|
|
|
|
|
|
Depreciation and amortization | 20 |
| 14,401 |
| 13,936 |
| 3,364,943 |
| 3,014,480 |
Interest in earnings of associates | 9.1 |
| (2,236,069) |
| (3,909,579) |
| (350,399) |
| (418,897) |
Interest in earnings of joint ventures | 10 |
| (192,472) |
| 333,622 |
| (1,695,945) |
| 92,179 |
Loss (gain) on disposed assets | 21 |
| (13,563) |
| 2,323 |
| 17,016 |
| 13,035 |
Share based payment | 24 |
| 109,467 |
| 41,832 |
| 207,713 |
| 99,088 |
Change in fair value of investment properties | 11.5 |
| — |
| — |
| (2,259,924) |
| (1,311,691) |
Legal proceedings provision | 21 |
| 86,619 |
| 41,463 |
| 204,158 |
| 370,764 |
Interest, derivatives, monetary and foreign exchange, net |
|
| 1,589,201 |
| 3,396,305 |
| 9,379,506 |
| 6,521,930 |
Bargain purchase gain (loss) | 21 |
| — |
| (99,341) |
| — |
| (99,341) |
Sectorial financial assets and liabilities, net | 5.10 |
| — |
| — |
| (110,125) |
| 339,854 |
(Gain) loss on energy derivative transactions |
|
| — |
| — |
| — |
| (248,123) |
Provisions for employee benefits |
|
| 58,522 |
| 26,682 |
| 419,241 |
| 380,967 |
Allowance for expected credit losses |
|
| — |
| — |
| 74,706 |
| 28,463 |
Tax credit recovery |
|
| — |
| — |
| (33,384) |
| (110,541) |
Results from the sale of investments | 21 |
| — |
| (54,707) |
| — |
| (988,077) |
Deferred revenue |
|
| — |
| — |
| (597,998) |
| (5,366) |
Revenue from finance investment |
|
| — |
| — |
| (1,284,647) |
| (32,493) |
Other |
|
| (49,502) |
| (79,854) |
| 278,427 |
| 381,572 |
|
|
| (202,949) |
| (216,669) |
| 12,727,039 |
| 10,680,428 |
Variation in: |
|
|
|
|
|
|
|
|
|
Trade receivable |
|
| — |
| — |
| 573,737 |
| (6,327) |
Inventories |
|
| — |
| — |
| (83,166) |
| (423,430) |
Other taxes, net |
|
| 66,903 |
| 17,286 |
| 454,941 |
| 553,584 |
Income tax |
|
| 92,318 |
| 4,428 |
| (1,272,145) |
| (1,090,684) |
Related parties, net |
|
| 5,325 |
| (326,210) |
| (188,798) |
| (139,621) |
Trade payables |
|
| (117,333) |
| 106,705 |
| (252,810) |
| 510,616 |
Employee benefits |
|
| (45,897) |
| (34,773) |
| (356,210) |
| (249,244) |
Provision for legal proceedings |
|
| (26,976) |
| (4,115) |
| (461,574) |
| (328,394) |
Financial instruments derivatives |
|
| — |
| — |
| 2,894 |
| (65,939) |
Other financial liabilities |
|
| — |
| — |
| (566,058) |
| 110,659 |
Judicial deposits |
|
| (36,036) |
| 2,369 |
| (22,862) |
| (2,670) |
Deferred income |
|
| — |
| — |
| — |
| 592,601 |
Post-employment benefits obligation |
|
| — |
| — |
| (34,235) |
| (90,411) |
Other assets and liabilities, net |
|
| (18,002) |
| 3,409 |
| (244,309) |
| (78,936) |
|
|
| (79,698) |
| (230,901) |
| (2,450,595) |
| (708,196) |
|
|
|
|
|
|
|
|
| — |
Net cash (used in) generated from operating activities |
|
| (282,647) |
| (447,570) |
| 10,276,444 |
| 9,972,232 |
|
|
|
|
|
|
|
|
|
|
Cash flows from investing activities |
|
|
|
|
|
|
|
|
|
Capital contribution to associates |
|
| (2,716,505) |
| (8,475,590) |
| (47,300) |
| (86,205) |
Acquisition of subsidiary, net of acquired cash |
|
| (567,577) |
| (525,115) |
| (702,577) |
| (5,288,696) |
Purchase of marketable securities |
|
| 72,305 |
| 241,786 |
| (507,976) |
| (13,911,737) |
Restricted cash |
|
| (40,036) |
| (3,858) |
| (60,498) |
| (58,179) |
Dividends received from associates | 17 |
| 855,188 |
| 1,849,651 |
| 254,905 |
| 278,127 |
Dividends received from joint venture | 17 |
| 351,092 |
| 1,174,771 |
| 906,534 |
| 1,174,771 |
Dividends received from finance investment | 1.1 |
| — |
| — |
| 1,305,410 |
| — |
Acquisition of instruments designated at fair value |
|
| — |
| — |
| (7,485) |
| (190,990) |
Capital reduction in subsidiaries |
|
| 16,088 |
| — |
| 99,040 |
| — |
Statement of cash flow
(In thousands of Reais)
Acquisition of property, plant and equipment, intangible and contract assets |
|
| (7,209) |
| (2,471) |
| (6,267,962) |
| (4,531,374) |
Proceeds from the sale of investments |
|
| 15,000 |
| 87,200 |
| 645,772 |
| 1,969,789 |
Net cash from sale of discontinued operations |
|
| — |
| — |
| 62,700 |
| 44,969 |
Receipt of derivative financial instruments, except debt |
|
| 162,114 |
| 146,979 |
| 168,308 |
| 146,979 |
Payment of derivative financial instruments, except debt |
|
| (145,308) |
| (287,640) |
| (156,600) |
| (283,337) |
Cash received on the sale of property, plant and equipment and intangible assets |
|
| — |
| — |
| 4,637 |
| 9,319 |
Net cash generated from (used in) investing activities |
|
| (2,004,848) |
| (5,794,287) |
| (4,303,092) |
| (20,726,564) |
|
|
|
|
|
|
|
|
|
|
Cash flows from financing activities |
|
|
|
|
|
|
|
|
|
Proceeds from loans, borrowings and debentures | 5.4 |
| 8,636,528 |
| 9,450,210 |
| 12,785,628 |
| 23,886,960 |
Principal repayment of loans, borrowings and debentures | 5.4 |
| (579,942) |
| — |
| (8,054,763) |
| (15,278,378) |
Payment of interest on loans, borrowings and debentures | 5.4 |
| (973,919) |
| (830,380) |
| (3,552,292) |
| (3,441,978) |
Payment of derivative financial instruments |
|
| (787,608) |
| (658,874) |
| (2,851,267) |
| (2,079,805) |
Proceeds from derivative financial instruments |
|
| 789,574 |
| 226,684 |
| 1,193,534 |
| 291,619 |
Costs of banking operations with derivatives | 1.1 |
| — |
| — |
| (586,855) |
| — |
Principal repayment of leases | 5.5 |
| (5,524) |
| (5,051) |
| (490,012) |
| (400,248) |
Payment of interest on leases | 5.5 |
| (3,615) |
| (3,933) |
| (236,948) |
| (211,611) |
Transaction costs related to loans and borrowings |
|
| — |
| — |
| — |
| (94,196) |
Proceeds from capital contributions by non-controlling shareholders |
|
| — |
| — |
| (24,281) |
| 8,126,823 |
Transaction costs related to capital contributions by non-controlling shareholders |
|
| — |
| — |
| — |
| (19,217) |
Related parties |
|
| (3,534,080) |
| (1,231,979) |
| — |
| — |
Repurchase of own shares |
|
| — |
| (59,506) |
| (103,283) |
| (84,591) |
Proceeds from the sale of treasury shares |
|
| — |
| 2,370 |
| — |
| 2,370 |
Acquisition of non-controlling shareholders’ shares |
|
| — |
| (25,582) |
| — |
| (487,721) |
Dividends paid | 17 |
| (798,203) |
| (799,347) |
| (2,582,447) |
| (1,908,171) |
Payment of share-based compensation |
|
| — |
| — |
| (13,597) |
| (15,597) |
Net cash generated from (used in) financing activities |
|
| 2,743,211 |
| 6,064,612 |
| (4,516,583) |
| 8,286,259 |
|
|
|
|
|
|
|
|
|
|
Increase (decrease) in cash and cash equivalents |
|
| 455,716 |
| (177,245) |
| 1,456,769 |
| (2,468,073) |
|
|
|
|
|
|
|
|
|
|
Cash and cash equivalents at the beginning of the year |
|
| 1,348,461 |
| 1,718,077 |
| 13,301,716 |
| 16,174,130 |
Effect of the foreign exchange rate changes |
|
| (34,201) |
| (192,371) |
| (100,004) |
| (404,341) |
Cash and cash equivalents at the end of the year |
|
| 1,769,976 |
| 1,348,461 |
| 14,658,481 |
| 13,301,716 |
|
|
|
|
|
|
|
|
|
|
Additional information |
|
|
|
|
|
|
|
|
|
Income taxes paid |
|
| — |
| — |
| 361,726 |
| 318,845 |
(i) For more details see note 8.
The accompanying notes are an integral part of these individual and consolidated financial statements.
Statement of cash flow
(In thousands of Reais)
Non-cash transactions:
The Company presents its statements of cash flows using the indirect method. During the year ended December 31, 2023, the Company carried out the following transactions that did not involve cash and, therefore, are not reflected in the parent company and consolidated statement of cash flows:
| (i) | Recognition of right-of-use as a counterpart to the lease liability in the amount of R$2,037,779 (R$246,517 as at December 31, 2022), resulting from the application of inflation indexes and new contracts classified under the leasing rule (Note 11.4). |
| (ii) | Acquisition of property, plant and equipment and intangible assets with payment in installments R$860,551 (R$246,564 on December 30, 2022). |
| (iii) | Capital increase in subsidiary Cosan Nove Participações S.A. with funds from the balance of accounts receivable from related parties in the amount of R$121,621. |
| (iv) | Partial amortization of Senior Notes 2027 and 2029 in the amount of R$84,585 using the balance of other financial assets. |
| (v) | Transfer of the balance of securities and securities for investment in a subsidiary for Vale S.A shares in the amount of R$16,274,081. |
Disclosure of interest and dividends:
Dividends and interest on shareholders' equity are classified as cash flow from investing activities by the Company. Dividends and interest received or paid are classified as cash flow from financing activities.
(In thousands of Reais)
| Parent Company |
| Consolidated | ||||
| 12/31/2023 |
| 12/31/2022 (Restated) (i) |
| 12/31/2023 |
| 12/31/2022 (Restated) (i) |
Revenue |
|
|
|
|
|
|
|
Net sales | — |
| — |
| 44,290,457 |
| 46,855,778 |
Other operating income (expense), net | (23,940) |
| 243,655 |
| 6,282,834 |
| 2,635,017 |
Impairment gain (loss) on trade receivables | — |
| — |
| (74,706) |
| (16,544) |
| (23,940) |
| 243,655 |
| 50,498,585 |
| 49,474,251 |
Inputs purchased from third parties |
|
|
|
|
|
|
|
Cost of goods sold and services rendered | — |
| — |
| 25,155,268 |
| 16,579,962 |
Materials, energy, third-party services and other | 145,668 |
| 205,564 |
| 3,782,239 |
| 15,933,925 |
| 145,668 |
| 205,564 |
| 28,937,507 |
| 32,513,887 |
|
|
|
|
|
|
|
|
Gross value added | (169,608) |
| 38,091 |
| 21,561,078 |
| 16,960,364 |
|
|
|
|
|
|
|
|
Retention |
|
|
|
|
|
|
|
Depreciation and amortization | 14,401 |
| 13,936 |
| 3,364,943 |
| 3,014,480 |
Net value added | (184,009) |
| 24,155 |
| 18,196,135 |
| 13,945,884 |
|
|
|
|
|
|
|
|
Value added transferred in |
|
|
|
|
|
|
|
Interest earnings in associates | 2,236,069 |
| 3,909,579 |
| 350,399 |
| 418,897 |
Interest earnings in joint ventures | 192,472 |
| (333,622) |
| 1,695,945 |
| (92,179) |
Profit for the year from discontinued operation, net of tax | 15,654 |
| 17,180 |
| 45,419 |
| 49,846 |
Finance revenue | 829,235 |
| 277,734 |
| 3,028,134 |
| 5,777,521 |
| 3,273,430 |
| 3,870,871 |
| 5,119,897 |
| 6,154,085 |
|
|
|
|
|
|
|
|
Value added to be distributed | 3,089,421 |
| 3,895,026 |
| 23,316,032 |
| 20,099,969 |
|
|
|
|
|
|
|
|
Distribution of value added |
|
|
|
|
|
|
|
Personnel and payroll charges | 296,827 |
| 157,309 |
| 2,608,269 |
| 2,144,552 |
Direct remuneration | 275,868 |
| 141,010 |
| 2,093,703 |
| 1,735,284 |
Benefits | 12,191 |
| 9,970 |
| 401,914 |
| 341,624 |
FGTS and other | 8,768 |
| 6,329 |
| 112,652 |
| 67,644 |
|
|
|
|
|
|
|
|
Taxes, fees and contributions | (622,481) |
| (1,058,494) |
| 4,781,623 |
| 4,056,804 |
Federal | (627,134) |
| (1,067,479) |
| 1,777,439 |
| 1,930,941 |
State | — |
| — |
| 2,764,109 |
| 1,890,934 |
Municipal | 4,653 |
| 8,985 |
| 240,075 |
| 234,929 |
|
|
|
|
|
|
|
|
Financial expenses and rents | 2,320,684 |
| 3,620,179 |
| 11,041,396 |
| 11,077,738 |
Interest and foreign exchange variation | 2,408,020 |
| 3,296,927 |
| 10,188,657 |
| 10,583,018 |
Rents | — |
| — |
| 141,440 |
| 142,280 |
Other | (87,336) |
| 323,252 |
| 711,299 |
| 352,440 |
|
|
|
|
|
|
|
|
Equity Remuneration | 1,094,391 |
| 1,176,032 |
| 4,884,744 |
| 2,820,875 |
Non-controlling interests | — |
| — |
| 3,790,353 |
| 1,644,843 |
Dividends | 273,598 |
| 279,308 |
| 273,598 |
| 279,308 |
Retained profits | 805,139 |
| 879,544 |
| 775,374 |
| 846,878 |
Profit for the year from discontinued operation, net of tax | 15,654 |
| 17,180 |
| 45,419 |
| 49,846 |
(i) For more details see notes 3.4 and 8.
The accompanying notes are an integral part of these individual and consolidated financial statements.
Explanatory Notes to the Financial Statement
(In thousands of Reais, except when otherwise indicated)
Cosan S.A. (“Cosan” or “the Company”) is a publicly traded company at B3 S.A. - Brasil, Bolsa, Balcão (“B3”) in the special New Market (Novo Mercado) segment under the ticker symbol “CSAN3”. The Company's American Depositary Shares (“ADSs”) are listed on the New York Stock Exchange, or “NYSE”, and are traded under the ticker symbol “CSAN”. Cosan is a corporation (sociedade anônima) of indefinite term incorporated under the laws of Brazil, with its registered office in the city of São Paulo, state of São Paulo. Mr. Rubens Ometto Silveira Mello is the ultimate controlling shareholder of Cosan.
Corporate Cosan (Corporate segment) is formed by the following entities:
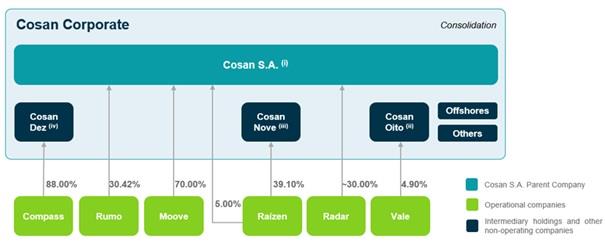
| (i) | Parent company with direct or indirect equity interest in subsidiaries and joint venture. The main effects on its profit or loss are general and administrative expenses, contingencies, equity income and financial results attributed to loans. |
| (ii) | Cosan Oito is a subsidiary of Cosan S.A, which holds a stake in Vale. |
| (iii) | Cosan Nove has a direct stake in Raízen of 39.15% and preferred shares with Itaú Unibanco S.A. (“Itaú”) which corresponds to an equity interest of 26.91%. |
| (iv) | Cosan Dez has a direct stake in Compass of 88,00% and preferred shares with Bradesco BBI S.A. (“Bradesco”) which corresponds to an equity interest of 23.20%. |
During the fourth quarter of the fiscal year 2022, the subsidiary Cosan Oito S.A. (“Cosan Oito”) concluded the transaction related to the acquisition of a non-controlling stake in Vale S.A. ("Vale") which was divided into: a) financial assets; b) debts incurred; c) contracted derivatives; d) issuance of preferred shares and) Obtaining significant influence. The Company initially recorded its shareholding in Vale as a financial asset accounted for at fair value in accordance with IFRS 9/CPC48.
On April 28, 2023, at Vale’s Ordinary General Assembly, the CEO of Cosan S.A., Luis Henrique Cals de Beauclair Guimarães (“Luis Henrique”), was elected a member of Vale’s Board of Directors, and on May 16, 2023, was appointed Coordinator of the Capital and Projects Allocation Committee (“CACP”) and member of the People and Compensation Committee (“CPR”). From January 1, 2024, Luis Henrique left the position of CEO of Cosan S.A., becoming part of the Board of Directors.
Explanatory Notes to the Financial Statement
(In thousands of Reais, except when otherwise indicated)
During the fiscal year 2023 the Company monitored the factors that could indicate significant influence in Vale. On November 30, 2023, the Company obtained sufficient evidence that demonstrated the ability to exert significant influence on Vale’s policies and operations, when the member appointed by Cosan to the Vale Board was able to participate in policy-making processes, including decisions on dividends and other distributions. Thus, from this date, Cosan began to consider Vale as a related company with significant influence, registering the investment by equity according to CPC 18/IAS 28, having 4.85% of shareholding, and closing the year with 4,65% of total participation as at December 31, 2023, after disposal of 0.21% of shares, as mentioned in note 1.1 (b).
With the acquisition of significant influence, the Company adopted the fair value approach to measure the opening balance of the investment on December 1, 2023, generating a premium of R$7,432,600 which was allocated as shown below:
|
| Balances as of December 1, 2023 |
Fair value as of November 30, 2023 |
| 16,274,081 |
Fair value of Vale’s assets and liabilities according to Cosan’s participation(i) |
| 8,841,481 |
Available amount to be allocated |
| 7,432,600 |
|
|
|
Allocation(i) |
|
|
Added value - Mining rights(ii) |
| 7,432,600 |
Deferred tax on added value |
| (2,527,084) |
Goodwill(iii) |
| 2,527,084 |
| (i) | As evaluation report prepared by specialized external evaluators. |
| (ii) | The surplus value will be amortized for 38 years following the expected useful life and exhaustion of Vale’s mining reserves. |
| (iii) | Although the Company has allocated all goodwill to Mining Rights, income tax and deferred social contribution relating to surplus value have been recognized and, in accordance with IAS 12.19/CPC 32.19 Income Taxes, a goodwill must be recorded. |
The goodwill generated in the acquisition of Vale shares is part of a cash-generating unit (“UGC”) that is the investment itself in Vale. Since it refers to a related investment, the value of the deferred tax liability is already part of the accounting balance of the investment, both in the individual financial statements and in the consolidated statements. Thus, for the purpose of the impairment test, the goodwill balance is net of the deferred tax liability related to capital gains and makes up the investment group in its accounting balance recognized in accordance with IAS 28, on a net basis.
Explanatory Notes to the Financial Statement
(In thousands of Reais, except when otherwise indicated)
The adjustment resulting from the valuation by the equity method is demonstrated as follows:
Company |
| Total amount of shares |
| Shareholders' equity of Vale S.A. |
| Quantity shares owned |
| Cosan's interest (i) |
| Equity in earnings |
| Total investment as of December 31, 2023 |
Vale S.A. |
| 4,539,007,580 |
| 190,965,062 |
| 210,866,700 |
| 4.90% |
| 96,075 |
| 15,662,485 |
| (i) | Percentage of participation excluding treasury shares for equity calculation. Cosan’s share of the total shares is 4.65% as at December 31, 2023. |
Assumptions for assessing the fair value of assets and liabilities
Given that there is no control over Vale, we face certain difficulties to access company information. Vale, in order to maintain equal information for all its shareholders, does not share financial data that is not publicly known, including additional details about its operations. Therefore, we used the public information available as at December 31, 2023, to perform analyses and support the determination of the fair value of the assets and liabilities identified in the allocation of the price paid. This information is in line with the financial statements disclosed to the market on 22 February 2024 and were duly audited by an independent auditor.
The methodology used for evaluation was the discounted cash flow.
Discount rate
To calculate Vale’s cost of equity, the Capital Asset Pricing Model ("CAPM") methodology was used, which aims to assess whether a stock is valued when its risk and the value of money in time are compared to its expected return.
As a risk-free rate, it was considered the average return rate of 2 years, with daily observations of the United States Treasury Bonds of 30 years ("T-Bond") on November 30, 2023, corresponding to 3.50%, reaching a Weighted Average Cost of Capital ("WACC") between 10% and 13%.
Identification of intangible assets
Brand: Vale is recognized in the market as one of the leading companies in the commodities sector. However, the company is dedicated to the production and sale of mineral commodities, a highly competitive and cost-focused segment. Commodities are commodities whose prices are determined by the international market, undifferentiated from the supplier, produced on a large scale and without distinction between them. Therefore, we conclude that the Vale brand does not offer a significant differential in its operations that justifies its inclusion in the allocation of the amount paid.
Customer relationship: The customers of a mining company are mostly industries looking for raw materials based mainly on price, not supplier relationship. Due to product characteristics, revenues from contracts with customers can be easily replaced. Vale, like other commodity market participants, has broad access to buyers, both local and international, and does not rely on customer relationships or customer loyalty to market its production. In this segment, contracts are established to define delivery terms, payment and technical specifications, but prices are determined by the international market. The commonly used international price references are the London Metal Exchange ("LME") and the Commodities Exchange ("COMEX").
Therefore, regardless of the regularity of supply, the Company understands that Vale’s current customers do not represent an asset that confers a significant competitive advantage and, therefore, are not considered an intangible to be evaluated.
Mining assets: It refers to the exclusive right to exploit the mining rights of the iron, nickel and copper mines operated by Vale. Without these rights, Vale could not carry out its operations. The useful life of these rights is determined by the exhaustion of mineral reserves, so they were considered in our assessments to determine the value to be allocated.
The allocation of the value of the mining asset was made by the difference of the available value to be allocated, because any remaining value should increase the value of this asset. For the projected period, the economic life of the mining rights accompanies the exhaustion of the reserves of the mines per business unit. The projections were made considering the division by business unit, aligned with Vale’s financial disclosures for the market of its numbers per business unit. These business units are: (i) Ferrous Minerals, (ii) Metals for Energy Transition, and (iii) Other Businesses.
In addition, throughout 2023, the Company made several advance payments of debts 4131 with the financial institutions JP Morgan and Citibank, as well as the permanent disposal of 9,5 million shares of Vale on December 18, 2023, equivalent to the participation of 0.21% of the total shares of the said company in the Collar Financing structure. These transactions led to the increase of its direct participation on December 31, 2023, to 2.45%, and total participation of 4.65% under the total shares of the company, which is in line with its strategy of seeing the company as an investment in affiliates, see footnote 1.1 (b). Additionally, on April 19, 2024, the Company sold an additional 33,525 million shares equivalent to a 0.74% stake in the total shares in the Collar Financing structure. With this last advance payment, the Company settled 100% of the debts linked to the operation and collar derivatives.
Explanatory Notes to the Financial Statement
(In thousands of Reais, except when otherwise indicated)
a) Assets acquired
Cosan Oito made the following investments in Vale: (a) acquisition of shares in the spot market and (b) purchase through a private operation with partial protection via derivatives (Collar), as shown in the table below:
|
| Inception date |
| At November 30, 2023 (i) | ||||
Description |
| % |
| Amount |
| % |
| Amount |
Direct shareholding |
| 1.47% |
| 4,918,245 |
| 2.45% |
| 8,220,927 |
Equity collar |
| 3.14% |
| 11,117,824 |
| 2.40% |
| 8,053,154 |
|
| 4.61% |
| 16,036,069 |
| 4.85% |
| 16,274,081 |
| (i) | From December 1, 2023, due to the acquisition of significant influence, the Company reclassified its share of financial investment for investment in related companies. |
b) Debt incurred and partial advances
The following loans were contracted for the acquisition of assets, together with the banks below:
Creditor |
| Amount (ii) |
| Maturities |
| Currency (i) |
| Annual interest rate (i) |
JP Morgan S.A. |
| 789,659 |
| Oct-24 |
| Euro |
| 2.95% |
JP Morgan S.A. |
| 1,825,467 |
| Oct-25 |
| Euro |
| 3.20% |
JP Morgan S.A. |
| 1,785,329 |
| Oct-26 |
| Euro |
| 3.40% |
JP Morgan S.A. |
| 741,320 |
| Oct-27 |
| Euro |
| 3.56% |
Citibank S.A. |
| 526,443 |
| Oct-24 |
| Yen |
| 0.25% |
Citibank S.A. |
| 1,216,939 |
| Oct-25 |
| Yen |
| 0.25% |
Citibank S.A. |
| 1,190,274 |
| Oct-26 |
| Yen |
| 0.25% |
Citibank S.A. |
| 494,199 |
| Oct-27 |
| Yen |
| 0.25% |
Total |
| 8,569,630 |
|
|
|
|
|
|
| (i) | Debts were contracted (Resolução 4131) in the currencies specified above with four maturities with pre-fixed amounts and derivative financial instruments were contracted with CDI plus 0.45% equivalent. |
| (ii) | During the first months of 2024 as shown in the table below, the Company pre-settled 100% of the debts linked to the acquisition of Vale’s shares, as well as the Collar Financing derivatives linked to the operation. |
Explanatory Notes to the Financial Statement
(In thousands of Reais, except when otherwise indicated)
|
| Cosan interest |
| Debt settlement |
|
| ||||||
Reference date |
| Direct |
| Collar |
| Total |
| Principal |
| Interest |
| Gain/Loss Settlement Collar Financing |
Inception date (October/2022) |
| 1.47% |
| 3.14% |
| 4.61% |
| 8,569,630 |
| — |
| — |
August 2023 |
| 1.65% |
| 3.21% |
| 4.85% |
| (275,866) |
| (4.878) |
| 28,961 |
October 2023 |
| 1.75% |
| 3.11% |
| 4.85% |
| (252,540) |
| (624) |
| 28,009 |
November 2023 |
| 2.45% |
| 2.40% |
| 4.85% |
| (1,844,022) |
| (41,355) |
| 30,525 |
December 2023 (ii) |
| 2.45% |
| 2.20% |
| 4.65% |
| (561,259) |
| (14.047) |
| 29,487 |
January 2024 (i) |
| 2.62% |
| 2.03% |
| 4.65% |
| (1,698,606) |
| (49,773) |
| 188,140 |
February 2024 (i) |
| 3.91% |
| 0.74% |
| 4.65% |
| (2,067,956) |
| (63,689) |
| 303,431 |
April 2024 (i)/(iv) |
| 3.91% |
| — |
| 3.91% |
| (1,918,773) |
| (65,880) |
| 331,116 |
| (i) | Settlement carried out after the closing of the 2023 financial year, being treated as a subsequent event. |
| (ii) | On December 18, 2023, the early settlement of debts, derivatives and permanent disposal of 9.5 million shares of Vale equivalent to the participation of 0.21% of the total shares of that company in the Collar Financing structure was carried out, which resulted in a positive cash effect of R$68,573. |
| (iii) | Cosan’s stake in Vale’s total shares. |
| (iv) | On April 19, 2024, the Company sold an additional 33,525 million shares equivalent to a 0.74% stake in the total shares in the Collar Financing structure, together with the early settlement of the remaining debt. With this last advance payment, the Company settled 100% of the debts linked to the operation and collar derivatives, now holding only a direct stake in Vale. |
c) Structured derivatives
For protection related to the acquisition of a 3.14% stake, derivatives were contracted consisting of a combination of call and put (Collar). Additionally, the following papers were contracted: (i) forward option (Forward) which grants the right to acquire 1.60% of Vale (optional) and (ii) Derivatives consisting of a combination of call and put positions (Synthetic Collar).
The collar and synthetic collar derivatives protect the Company from the devaluation of the share’s value below the strikes of the puts, at the same time, they allow Cosan Oito to participate partially in future increases in the share’s value limited to the strikes of the calls.
|
| Inception Date |
| At December 31, 2023 | ||||
Description |
| % |
| Amount (paid)/received |
| % (i) |
| Fair value |
Collar |
| 3.14% |
| 499,197 |
| 2.20% |
| 89,401 |
Call Spread |
| 1.60% |
| (888,612) |
| 1.60% |
| 562,435 |
Forward |
|
|
| (1,134,933) |
|
|
| 366,296 |
Collar synthetic |
|
|
| 246,321 |
|
|
| 196,139 |
Total |
|
|
| (389,415) |
|
|
| 651,836 |
| (i) | Reduction in the percentage of participation via collar operation due to the settlements that occurred throughout 2023, which resulted in a financial gain of R$116,982. As shown in item (b) above, by April 2024 the Company had liquidated 100% of Collar derivatives, leaving only Call Spread derivatives open. |
Explanatory Notes to the Financial Statement
(In thousands of Reais, except when otherwise indicated)
d) Issuance of preferred shares
Bradesco BBI S.A. (“Bradesco”) and Itaú Unibanco S.A. (“Itaú”) completed investments on December 23 and 28, 2022, acquiring 23.30% and 26.91% of the share capital of the subsidiaries Cosan Dez Participações S.A. ("Cosan Dez") and Cosan Nove Participações S.A. ("Cosan Nove") for R$4,000,000 and R$4,115,000, respectively.
As part of the issuance of preferred shares by Cosan Nove and Cosan Dez, Cosan S.A. contributed its investments in Raízen and Compass Gas and Energy. The structure after the contribution of investments follows as shown:
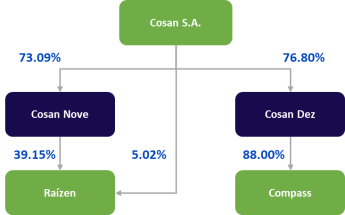
Disproportionate dividends
The subsidiaries Cosan Nove and Cosan Dez have outstanding preferred shares classified in equity by non-controlling interests. The Company calculates its share of profits or losses after adjusting the dividends on these shares, regardless of whether such dividends have been declared or not. This effectively means that the non-controlling interest, represented by the preferred shares, is receiving a portion of the profit or accrual of interest equivalent to the dividends.
As at December 31, 2023, the equity interest and economic benefit of Cosan S.A. on Cosan Nove and Cosan Dez, considering the disproportionate dividends were as shown below:
|
| % Equity interest |
| % Economic benefit (i) |
Cosan Nove |
| 73.09% |
| 66.16% |
Cosan Dez |
| 76.80% |
| 72.00% |
| (i) | Percentage used to calculate the interest as at December 31, 2023. To calculate the dividends of Cosan Nove and Cosan Dez for preferred shareholders, the profits of the respective Companies are used, multiplied by the participation percentages using the percentages defined in the Shareholders’ Agreements. |
Call option
The Company has a call option which gives it the right to repurchase all preferred shares from Cosan Nove and Cosan Dez, which may be exercised from the third year after the signing of the respective agreements in December 2022.
As at December 31, 2023, the Company measured the fair value of the call option and concluded that it is out of price.
Contingent sell Option
In the shareholders’ agreements signed between the Company and Itaú and Bradesco referring to the issuance of preferred shares, it was defined that both financial institutions have a contingent call option only when the specific material adverse effects provided for in the contract occur, which are in the control of the Company and, therefore, do not constitute a financial obligation.
Explanatory Notes to the Financial Statement
(In thousands of Reais, except when otherwise indicated)
The total of investments in preferred shares are calculated based on the initial amounts of R$4,115,000 and R$4,000,000 restated by a weighted average rate of CDI + 1.25% less dividends received by non-controlling shareholders in this period, which, as at December 31, 2023, is represented by the amounts of R$4,203,917 and R$4,201,215, respectively.
e) Summary of the accounting effect of the events mentioned in the previous topics.
Below is a summary of the accounting effect of the events mentioned above:
| Note |
| Financial asset |
| Investment in subsidiaries and associates |
| Debt incurred (vi) |
| Derivates |
| Dividends receivable, net |
| Dividends payable | ||||
|
|
|
|
| Collar (i) |
| Synthetic Collar (ii) |
| Forward (ii) |
|
| ||||||
At January 1, 2023 |
|
| 19,586,193 |
| — |
| (8,808,673) |
| (2,840,544) |
| (1,237,907) |
| 1,954,493 |
| 22,842 |
| — |
- Impacts on the profit or loss |
|
|
|
|
|
|
|
|
|
|
|
|
|
|
|
|
|
MTM of shares(iii) | 22 |
| (3,312,112) |
| — |
| — |
| — |
| — |
| — |
| — |
| — |
Interest and monetary and exchange variation (accrual) | 22 |
| — |
| — |
| 599,515 |
| — |
| — |
| — |
| — |
| — |
Dividends declared by Vale (vii) (viii) | 21 |
| — |
| — |
| — |
| — |
| — |
| — |
| 1,339,340 |
| — |
Costs of banking operations with derivatives | 22 |
| — |
| — |
| — |
| — |
| — |
| — |
| (554,998) |
| — |
MTM of derivates | 22 |
| — |
| — |
| (2,011,980) |
| 3,046,926 |
| 1,434,046 |
| (1,588,197) |
| — |
| — |
Equity in earnings of investees |
|
| — |
| 96,075 |
| — |
| — |
| — |
| — |
| — |
| — |
Cost of selling a shareholding (ix) |
|
| — |
| (701,575) |
| — |
| — |
| — |
| — |
| — |
| — |
- Impacts on cash flow - (receipt) / payment |
|
|
|
|
|
|
|
|
|
|
|
|
|
|
|
|
|
Dividends paid to minority shareholders from Cosan Nove and Dez |
|
| — |
| — |
| — |
| — |
| — |
| — |
| — |
| 821,772 |
Dividends (received) from Vale (iv) |
|
| — |
| — |
| — |
| — |
| — |
| — |
| (1,305,410) |
| — |
Costs of banking operations with derivatives (v) |
|
| — |
| — |
| — |
| — |
| — |
| — |
| 586,855 |
| — |
Partial payment of loans |
|
| — |
| — |
| 2,994,592 |
| — |
| — |
| — |
| — |
| — |
Payment of derivative financial instruments |
|
| — |
| — |
| 438,138 |
| — |
| — |
| — |
| — |
| — |
Receipt of derivative financial instruments |
|
| — |
| — |
| — |
| (116,981) |
| — |
| — |
| — |
| — |
- Impacts on the balance sheet |
|
|
|
|
|
|
|
|
|
|
|
|
|
|
|
|
|
Minority dividends payable referring to structure of issuance of preferred shares |
|
| — |
| — |
| — |
| — |
| — |
| — |
| — |
| (821,772) |
Income tax |
|
| — |
| — |
| — |
| — |
| — |
| — |
| (88,629) |
| — |
Equity in earnings of investees and other comprehensive income |
|
| — |
| (6,096) |
| — |
| — |
| — |
| — |
| — |
| — |
Transfer to investments in subsidiaries and associates | 9.1 |
| (16,274,081) |
| 16,274,081 |
| — |
| — |
| — |
| — |
| — |
| — |
At December 31, 2023 |
|
| — |
| 15,662,485 |
| (6,788,408) |
| 89,401 |
| 196,139 |
| 366,296 |
| — |
| — |
Explanatory Notes to the Financial Statement
(In thousands of Reais, except when otherwise indicated)
| (i) | Collar contracted to protect 3.21% of the shares acquired. |
| (ii) | Forward and synthetic collar contracted for the right to acquire and protect, respectively, 1.65% of Vale's shares. |
| (iii) | Mark to market consisting of |
a. 2.45% interest in shares purchased in cash, totaling R$1,669,686, and | |
b. 2.41% stake in shares with Collar protection totaling R$1,642,426. | |
| (iv) | The balance received from dividends is composed of R$1,250,712 referring to the year ended as at December 31,2023 and R$54,698 referring to the provisioned amount as at December 31, 2022. |
| (v) | The balance paid for costs of banking operations with derivatives is composed of R$554,998 referring to the year ended as at December 31,2023 and R$31,856 referring to the provisioned amount as at December 31, 2022. |
| (vi) | Also includes contracted derivatives (NDF) for exchange rate and interest protection. |
| (vii) | Vale’s Board of Directors approved, on July 27, 2023, the distribution of interest on equity ("JCP") in the gross total value of R$8,276,501, corresponding to the total value of R$1.917008992 per share, calculated according to its balance sheet of June 30, 2023. On October 26, 2023, also was approved the remuneration of shareholders in the amount of R$10,033. Of this amount, R$6,738 million refers to dividends corresponding to the total value of R$1.565890809 per share and R$3,295 related to interest on equity ("JCP") corresponding to the total value of R$0.765770758 per share as interest on equity. |
| (viii) | After obtaining significant influence, as described in item (e) above, the Company will no longer have its result impacted by dividend distribution, as the investment is now updated by the equity method. |
| (ix) | The amount of revenue related to the cost mentioned in this item was R$699,929. |
Explanatory Notes to the Financial Statement
(In thousands of Reais, except when otherwise indicated)
SALE OF SHARES OF SINLOG TECNOLOGIA EM LOGÍSTICA S.A.
On March 10, 2023, the Company entered into a share purchase and sale agreement with NSTECH MK LTDA, providing for the sale of its entire equity interest in Sinlog Tecnologia em Logística S.A. The transaction was completed on May 2, 2023, for R$45,000, divided into three equal installments, the first of which was received on the same date and the remaining installments to be received annually, restated by 100% of the CDI. This operation generated a gain in the Company's profit or loss in the amount of R$14,884, registered in other operating income (expenses), net, explanatory note 21.
ISSUANCE OF SENIOR NOTES 2030
On June 20, 2023, the Company issued a senior Notes offer in the total volume of US$550,000 equivalent to R$2,668,380, through its wholly owned subsidiary Cosan Luxembourg S.A ("Cosan Luxembourg"). The issuance of senior Notes occurred an annual interest rate of US$ + 7.50%, with maturity in June 2030 and payment of half-yearly interest.
ISSUANCE OF DEBENTURES
On April 20 and June 20, 2023, Cosan issued two debentures, not convertible into shares, in the total principal amount of R$1,000,000 each in a single series that bears interest at a rate equal to DI plus 2.4% per year maturing in April and June 2028, respectively, principal due upon maturity and interest paid semiannually.
ADDITION OF RIGHT OF USE – FRSU COMPASS S.A CONTRACT
On July 1, 2023, the subsidiary Compass effected the addition as Right of Use of the contract related to the chartering of the floating storage and regasification unit (“FRSU”) in the amount of R$1,510,810 with consideration in the rental liability as explanatory notes 11.4. Right of use and 5.5. Rental liabilities. The leased asset will be used for reception, storage and regasification of LNG ("Liquefied Natural Gas") at TRSP - LNG Regasification Terminal of São Paulo S.A. ("TRSP"). The term of the contract is 10 years with reasonable certainty of extension for two periods of 5 years, that is, the term of lease of this right of use was considered until June 2043.
TREND OFFER SENIOR NOTES 2027
On July 18, 2023, the subsidiary Cosan Luxembourg S.A. concluded the tender-offer of the 2027 senior notes with the repurchase of debt securities in the amount of US$250,000 thousand equivalent to R$1,201,000 in aggregate principal value, with payment of accrued interest of US$8,069 thousand equivalent to R$38,763 and a prize of US$7,500 thousand equivalent to R$36,030.
ISSUE OF DEBENTURES RUMO S.A.
On September 15, 2023, the subsidiary Rumo raised R$1,500,000 with the 17th issuance of simple debentures, not convertible into shares, of the unsecured type, divided into two series, the first of which has an amount of R$750,000, with IPCA+5.76% rate and 6-year term, while the second is R$750,000 with IPCA+6.18% rate and 10-year term. Both series will have semiannual interest payments and 100% principal amortization upon maturity. The funds from this fundraising will be used for investment. These debentures have the same restrictive financial clauses (“financial covenants”) as other debts and ESG commitments, as shown in note 5.1.
Explanatory Notes to the Financial Statement
(In thousands of Reais, except when otherwise indicated)
EXPORT CREDIT NOTE - RUMO
On July 7, 2023, the subsidiary Rumo obtained an Export Credit Note (“NCE”), in the amount of R$725,000, equivalent to USD150,000 thousands, with maturity in 18 months, quarterly amortization and cost of SOFR + 1.30%. Along with the debt, a Swap was contracted to transform the cost of debt to 108.9% of the CDI.
REALIZATION OF DEFERRED REVENUE
On July 1, 2022, the indirect subsidiary Compass Comercialização S.A. (“Compass Comercialização”) signed a contractual instrument for the cancellation of Liquefied Natural Gas (“LNG”) charges with deliveries planned with external suppliers for 2023. In return, a financial compensation was agreed between the parties whose receipt was initially recorded in the balance sheet of Compass Comercialização in the deferred revenue item. On July 13, 2023, after the fulfillment of all remaining performance obligations, the recognition was made under the heading of other operating revenues of the amount of R$923,214, being R$845,233 related to the instrument mentioned above and R$77,981 related to the recognition of bonus received, see note 22.
INTERNALIZATION OF SENIOR NOTES 2030
On September 29, 2023, the Company internalized the remaining resources arising from the 2030 senior notes, through the issuance of debentures by Cosan S.A., referenced in US dollars in the amount of R$1,491 million (equivalent to US$300,000 thousand), with coupon annual rate of 16.04% per year for first interest payment and 8.02% per year for the others. In return, Cosan Luxembourg contracted a Total Return Swap (“TRS”) with the same amount and counterparty in US dollars, with semi-annual payment frequency and annual remuneration of 15.52% per year for the first interest remuneration and 7.50% per year for the others, which has the issue of debentures as its underlying asset. For more information see note 5.4 (e).
INTERNALIZATION OF SENIOR NOTES 2029
In July 2019, Cosan Limited (“Cosan Limited”) held a senior Notes offer for a total volume of US$750,000, equivalent to R$4,147,650 with a 5.5% coupon and expiry date 2029 ("Bond 2029").
The Company evaluated alternatives for an Internalization of senior Notes debt and in December 2023 carried out the Hospitalization operation with Banco Santander acquiring a position in a Total Return Swap (“TRS”) with Banco Santander (Brazil) S.A. Grand Cayman Branch (“Santander Cayman”), which will have as underlying asset foreign exchange debentures, referenced in USD, issued by the Company, in the amount of US$598,000, equivalent to R$2,916,206,800, pursuant to Resolution CVM 160 (“Debentures”) which were fully subscribed by Banco Santander (Brazil) S.A. (“Santander”), and with this the total liquidation of the intercompany was carried out, remitting the recourse to Cosan Lux, and acquiring the position of TRS.
PARTIAL SPLIT COMMIT AND ASSET HELD FOR SALE
On October 9, 2023, the partial split of the indirect subsidiary Commit Gas S.A. ("Commit") was approved for a new company called Norgás S.A. ("Norgás"). The split is composed of Commit’s shareholding in the following companies: Companhia de Gás do Ceará ("CEGÁS"), Companhia Potiguar de Gás ("POTIGÁS"), Gás de Alagoas S.A. ("ALGÁS"), Sergipe Gás S.A. ("SERGÁS") and Companhia Pernambucana Gás ("). The subsidiary Compass Gas e Energia holds 51% of Norgás’s shareholding, the same percentage it holds in Commit, without altering the shareholding in the companies.
The occurrence of this event reinforces Compass' strategy of divestiture of its stake in Norgás, and with this, on the same date these investments for balance sheet purposes were classified as 'asset and liability maintained for sale' and for the purpose of demonstrating the result were classified as 'discontinued operation'. For more details see explanatory note 8.
ACQUISITION OF 51% EQUITY INTEREST IN BVP.
On October 20, 2023, Compass Comercialização completed the acquisition of control of 51% of Biometano Verde Paulínia S.A. (“BVP”). For more details see explanatory note 9.2.
Explanatory Notes to the Financial Statement
(In thousands of Reais, except when otherwise indicated)
MOOVE CORPORATE REORGANIZATION
During the third quarter of 2023, the Management of the subsidiary Moove approved the execution of a corporate reorganization consisting of the creation of a new entity in the Cayman Islands, Moove Lubricants Holdings – “MLH”, and the subsequent transfer of all assets of the current holding company of the Moove Group, Cosan Lubes Investments – “CLI”, for the new entity. The new entity will become the holding company of the Moove Group and the CLI will be liquidated. The reorganization is expected to be carried out throughout the fourth quarter of 2023.
2ND ISSUANCE OF DEBENTURES LINKED TO ENVIRONMENTAL, SOCIAL AND GOVERNANCE ("ESG") GOALS
On November 1, 2023, the subsidiary Compass issued simple and non-convertible debentures, in the amount of R$ 1,736,385 with semiannual remuneration equivalent to CDI + 1.55% per year and maturities on November 1, 2029 (50%) and November 1, 2030. The proceeds from the issuance will be used for investments and increased working capital.
This 2nd issuance of debentures is linked to ESG Goals of:
| (i) | Biomethane distributed volume (thousands of m³): Increase the daily volume distributed by 50 times in 2022 by 2027, reaching 0.25mln/m³ day. | |
| (ii) | Diversity in Leadership Positions: Reach 47% of people in leadership composed of Diversity Groups by 2027. |
The subsidiary Compass will suffer a step-up of 12.5 basis points for each target that is not met, which would increase the rate as of April 2028 (verification date) to up to CDI + 1.85% per year.
COSAN'S EIGHTH ISSUANCE OF DEBENTURES
On November 8, 2023, the Board of Directors of Cosan S.A. approved the public offering of the 8th issuance of simple debentures, under a firm placement guarantee, not convertible into shares, of the unsecured type, in a single series. The issuance will be in the total amount of R$ 1,250,000, with semiannual interest at a rate equal to DI plus a spread of 1.80% per year and principal maturity on January 21, 2031, with partial straight-line amortization on January 21, 2030, and on the maturity date. The net proceeds from the Issuance will be allocated to the ordinary management of the Company's business.
ISSUE OF COMMERCIAL BANKNOTES
On December 14, 2023, the Board of Directors of Cosan S.A. approved the public offering of the 4th issuance of commercial notes, in two tranches. The first tranche has a total value of R$550,000, charges interest at a rate equal to the DI plus a spread of 1.75% and matures on December 27, 2028. The second tranche has a total principal value of R$450,000, charges interest at a rate equal to the ID plus a 1.80% spread and matures on 30 January 2031, with partial linear amortization on 30 January 2030 and the maturity date. The net resources obtained with the Issuance will be destined for the ordinary management of the Company’s business.
Explanatory Notes to the Financial Statement
(In thousands of Reais, except when otherwise indicated)
ASSET HELD FOR SALE - TUP PORTO SÃO LUÍS S.A
The Company has carried out studies for the sale of Porto and is committed to the asset sale plan, which is expected to qualify as completed within one year. In view of this, the Company reclassified to active for sale for the year ending December 31, 2023.
IMPACT OF INTERNATIONAL CONFLICTS
After the outbreak of war in Ukraine in late February 2022, several countries-imposed sanctions on Russia, Belarus and certain regions of Ukraine. There has been an abrupt shift in the geopolitical situation, with uncertainties about the duration of the conflict, changes in the scope of sanctions and retaliatory actions, including new laws. These new circumstances limit the freedom of operation of Cosan Group companies in the Russian region and lead to a distortion and volatility in the level of activity. The war also contributed to increased volatility in foreign exchange markets, energy prices, raw materials and other input costs, as well as supply chain tensions and increased inflation in many countries.
Risks related to cybersecurity, loss of reputation, possible additional sanctions, export controls and other regulations (including restrictions on the transfer of funds to and from Russia) have increased. The ongoing war may continue to affect production and consumer demand. The Cosan Group assessed the consequences of the war on the Financial Statements, mainly considering the impacts on major judgments and significant estimates in addition to the operations that may be affected, such as:
| i. | Transported volume of fertilizers. | |
| ii. | Production of sugar cane due to unfavorable conditions for obtaining fertilizer. | |
| iii. | Rising oil prices, as a result of a more limited supply of Russian oil, can lead to a decrease in our margins and a pressure on the costs of acquiring basic inputs such as diesel oil; | |
| iv. | Debt and capital of third parties for our financing and investment activities, impacted by the measures of the Brazilian government and the Central Bank of Brazil to contain inflation, such as the increase of the basic interest rate. | |
| v. | Purchase of railway tracks by Rumo: although Rumo is able to obtain railway tracks from other non-Russian suppliers the prices charged and the deadlines required by these suppliers may be unfavorable in relation to the commercial conditions practiced in the past. |
Additionally, the Company has been monitoring the aftermath of the conflict in Israeli territory, especially in the context of volatility in the prices of natural gas oil commodities, exchange rate fluctuation and interest rates. So far, there have been no impacts on the annual financial statements. The Cosan Group will continue to monitor the facts about the conflicts, with a view to potential impacts on the business and, consequently, on the financial statements.
3.1. DECLARATION OF CONFORMITY
These individual and consolidated financial statements were prepared and are being presented in accordance with Brazilian accounting practices, which include the Brazilian Corporate Law, the rules of the Brazilian Securities Commission ("CVM"), and the pronouncements of the Accounting Pronouncements Committee (Comitê de Pronunciamentos Contábeis ("CPC")), as well as international accounting standards (International Financial Reporting Standards, or "IFRS") issued by the International Accounting Standards Board (“IASB”).
The presentation of individual and consolidated Value-Added Statements (“VAS”) is required by Brazilian corporate law and by the accounting practices adopted in Brazil applicable to publicly traded companies CPC 09 – Value Added Statements. The IFRS standards do not require the presentation of this statement. As a result, under the IFRS, this statement is presented as supplementary information, notwithstanding the financial statements as a whole.
Only the material information in the financial statements is hereby disclosed, and it corresponds to those used by Management in its management.
These financial statements were authorized for issuance by the Board of Directors on April 26, 2024.
Explanatory Notes to the Financial Statement
(In thousands of Reais, except when otherwise indicated)
3.2 MATERIAL ACCOUNTING POLICIES
Accounting policies are included in the explanatory notes, except for those described below:
FUNCTIONAL CURRENCY AND FOREIGN CURRENCY
The individual and consolidated financial statements are presented in Reais, which is the functional currency of the Company, its subsidiaries and joint ventures in Brazil, because it is the currency of the primary economic environment in which they operate, consume, and generate resources. The main functional currencies of the subsidiaries located outside Brazil are the US Dollar, the Euro or the Pound Sterling. Unless otherwise specified, all balances have been rounded to the nearest thousand.
Monetary assets and liabilities denominated and calculated in foreign currencies at the balance sheet date are converted into the functional currency using the current foreign exchange rate. Non-monetary assets and liabilities measured at fair value in a foreign currency are converted into the functional currency using the foreign exchange rate in effect on the date the fair value was determined. Non-monetary items measured in a foreign currency based on historical cost are converted at the foreign exchange rate on the transaction date. Foreign currency differences resulting from conversions are generally accounted for in profit or loss.
Assets and liabilities arising from international operations, including goodwill and fair value adjustments resulting from the acquisition, are converted into Reais at the balance sheet date using the foreign exchange rates in effect at the time. Income and expenses from international operations are converted into Reais using the foreign exchange rates in effect on the dates of the transactions.
Foreign currency differences are recognized and presented in other comprehensive income in equity. However, if the foreign operation is a non-wholly owned subsidiary, then the relevant proportion of the translation difference is allocated to non-controlling interests. When a foreign operation is disposed of such control, loss or significant influence is lost, the amount accumulated in the translation reserve related to that foreign operation is reclassified to financial result as part of the gain or loss on disposal.
The following table presents the foreign exchange rate, expressed in Reais for the years indicated, as informed by the Central Bank of Brazil (“BACEN”):
Currency | 12/31/2023 | 12/31/2022 | ||
Dollar (USD) | BRL 4.84 | BRL 5.22 | ||
Pound Sterling (£) | BRL 6.16 | BRL 6.28 | ||
Euro (€) | BRL 5.35 | BRL 5.57 | ||
Yen (¥) | BRL 0.03 | BRL 0.04 |
USE OF JUDGMENTS AND ESTIMATES
Management used judgments and estimates in preparing these financial statements, which affect the application of Cosan Group's accounting policies as well as the reported amounts of assets, liabilities, income, and expenses. Actual results may differ from these estimates.
Explanatory Notes to the Financial Statement
(In thousands of Reais, except when otherwise indicated)
Underlying estimates and assumptions are continually reviewed and recognized prospectively, when applicable. The following explanatory notes contain information on critical judgments, assumptions, and estimates of uncertainties in the application of accounting policies that have a greater impact on the amounts recognized in the financial statements:
- Note 1.1 – Stake in Vale S.A.
- Note 5.5 – Lease Liabilities
- Note 5.7 – Accounts receivable from customers
- Note 5.10 – Sectorial financial assets and liabilities
- Note 5.11 - Fair value measurement
- Note 9.2 – Acquisition of subsidiaries
- Note 10 – Investments in joint venture
- Notes 11.1 and 11.2 – Fixed assets, intangible assets and goodwill
- Notes 11.5 – Investment properties
- Note 12 – Commitments
- Note 15 – Income tax and social contribution
- Note 16 – Provision for legal expenses
- Note 23 – Post-employment benefit obligations
- Note 24 – Share-based compensation
3.3 ACCOUNTING IMPACTS RELATED TO ENVIRONMENTAL, SOCIAL AND GOVERNANCE INITIATIVES (“ESG”)
In June 2023, the International Sustainability Standards Board (“ISSB”) issued IFRS S1 - General Requirements for Disclosure of Sustainability-Related Financial Information and IFRS S2 - Climate-Related Disclosures, which provide new disclosure requirements on, respectively, sustainability-related risks and opportunities and specific climate-related disclosures.
The Company is taking the necessary steps to comply with the standard whose adoption is necessary for years starting from January 1, 2026, in accordance with CVM Resolution 193 issued in October 2023.
Company Initiatives
Promoting more transparent management, we will publish for the first time the Integrated Report of Cosan S.A. in 2024 for the 2023 financial year in accordance with CVM Resolution No. 014 on Integrated Report. We also consider the guidelines of the GRI Standard 2021, indicators from the Sustainable Accounting Standards Board (“SASB”) and the recommendations of the Task force on Climate-related Financial Disclosures (“TCFD”).
The Company is committed to integrating sustainability into its business through a strategy called “Visão ESG 2030 Cosan” with a long-term vision structure, which was passed on to all companies in the group, bringing together objectives and drivers that will guide the environmental, social and governance performance of the entire Group for the coming years.
The actions within the Company's strategy with ESG initiatives are evaluated and monitored within the context of critical accounting judgments and the Company's main estimates, and future changes in the global scenario may have impacts on the result and accounting balances of assets and liabilities of the Company in subsequent fiscal years. For the year ending December 31, 2023, the Company assessed potential climate and social impacts in the main critical estimates and no material impacts were identified.
Cosan began a process of reassessing its materiality and defining priority themes for the Company. After a careful process that involved conversations with internal and external stakeholders, studying benchmarks, analyzing ESG ratings and rankings and debugging the most important material topics for our company and our business, we arrived at the result of our materiality matrix. This construction was based on the concept of dual materiality, ensuring compliance with the best market practices.
Explanatory Notes to the Financial Statement
(In thousands of Reais, except when otherwise indicated)
The year 2023 was dedicated to consolidating and advancing the governance and management of the “ESG 2030 Cosan Vision”, which brings together our Objectives and Directors that will guide the environmental, social and governance performance of the entire Group for the coming years, starting a transformation project to generate value for all related parties, with 5 main objectives:
| 1. | Corporate Governance: (i) Comply with best governance and transparency practices; (ii) Be a reference in ESG Management and Communication | |
| 2. | Climate Change: (iii) Manage and reduce greenhouse gas emissions and offer paths for a safe energy transition; (iv) Carry out scenario analysis and adaptation plan to climate risks. | |
| 3. | Diversity, Equity and Inclusion: (v) Foster a safe, diverse, equitable and inclusive work environment; (vi) Ensure continuous evolution in the Diversity, Equity and Inclusion. | |
| 4. | Positive Social Impact: (vii) Generate positive social impact on communities and society; (viii) Promote Social Investment. | |
| 5. | People Safety: (ix) Promote the safety of people involved in operations; (x) Be a reference on the topic. |
The report on progress on each front of the “ESG 2030 Vision” is available in Cosan’s Integrated Report.
Environmental and Climate Pillar
In general, we recognize the relevance that our portfolio plays in implementing and accelerating the issue of Climate Change. By investing in Brazil's potential, we offer fundamental opportunities in this transformation, through the solid and already established infrastructure of our businesses, and through the development of low-carbon alternatives for various sectors of the economy.
We built our portfolio to combine our management expertise with high potential sectors and exposure to decarbonization and energy transition in Brazil and around the world. Each company in the portfolio plays a fundamental role in enabling the energy transition, so the way we operate allows for the gradual replacement of fossil fuels, by mixing with fuels from renewable sources and proactively offering low-carbon products and solutions. In this way, we contribute to advances in the energy transition in Brazil in a phased, safe and economically viable manner, using existing infrastructure.
The ethanol produced by Raízen is less polluting than gasoline and appears as an alternative in the decarbonization of sectors in which emissions are difficult to abate (hard-to-abate sectors). Rumo's operation of trains used to transport agricultural commodities emits 7x less greenhouse gases into the atmosphere than trucks. The gas distribution operation, linked to Compass' operations, is essential to replace coal and ensure a safe energy transition, as well as the opportunities presented with biomethane. The manufacture of Moove lubricants allows you to improve productivity at a low cost, both in vehicles and industrial plants.
The farmland portfolio consists of three managers: Radar, Tellus and Janus. Radar, focused on environmental preservation since its creation in 2008, seeks the best land to lease to prominent producers, such as Raízen. The companies manage around 320 thousand hectares, and in the last five years, an average of 200 hectares per year have been restored, totaling approximately 1,000 hectares.
Since 2019, all our businesses have been taking inventory of their greenhouse gas (GHG) emissions. The mapping is carried out in accordance with the guidelines of the Greenhouse Gas Protocol and its national version, the Brazilian GHG Protocol Program. In 2023, once again, Raízen, Rumo, Compass and Moove were recognized by GHG with the Gold seal, awarded to companies that meet all transparency criteria in publishing their emissions data and submit them to verification by an independent institution. Ensuring continuous evolution in emissions management, in 2023, we carried out a study of recommendations for improving the process of all GHG inventories of portfolio companies, ensuring alignment with the best practices existing in the market.
We remain committed to reducing the carbon footprint of our portfolio, through the continuous search for efficiency, productivity and innovation in our operations.
Explanatory Notes to the Financial Statement
(In thousands of Reais, except when otherwise indicated)
Social Pillar
For Cosan, valuing diversity and promoting inclusion reaffirm the power of the people who make Cosan happen, in this context, the “ESG 2030 Vision” brought clear diversity, equity and inclusion (DEI) goals included in Cosan's growth ambitions and of the portfolio.
The main diversity indicator monitored by Cosan is that of women in leadership and is connected to a public commitment made by the Company and all its companies. The target is applicable to the manager, the Company's Board of Directors and all businesses. An important sign of adherence to the commitment is that both Cosan, Rumo and Raízen, companies in their ecosystem, already have two or more women on their Boards of Directors (at Rumo, there are three). The Company's other companies are also moving to expand their participation.
All initiatives carried out demonstrate a consistent and intentional trajectory of evolution of the topic. This is evident and materialized with Cosan's recognition and entry into B3's iDiversa index.
Social responsibility is a strategic pillar of the Company. All companies in Cosan's portfolio have long-term community relationship programs surrounding their operations. We understand that in addition to creating jobs and increasing tax collection in municipalities and local businesses, we can and must take on an even greater responsibility: generating a significant social impact on communities, leaving a positive legacy.
Corporate Governance and Transparency Pillar
Since 2022 through the ESG 2030 Vision, the Company has developed an additional layer of governance for the ESG management of the portfolio.
In this way, the management of the socio-environmental and climate agenda is directly supervised by Cosan's Board of Directors through the Strategy and Sustainability Committee.
The body is responsible for monitoring the ESG strategy, commitments and goals, as well as promoting broad debate on trends involving the topic such as climate change, diversity and inclusion, and stakeholder engagement. The Board of Directors considers the impacts of the Company and its subsidiaries on society and the environment when approving the strategies of their respective businesses and acts to maintain the alignment of policies and best practices in all businesses it controls, ensuring the necessary autonomy to portfolio companies. The Strategy and Sustainability Committee reports to the Board of Directors on the Company's progress related to sustainability and compliance with the Cosan ESG 2030 Vision plan.
Furthermore, the Company created the Sustainability Committee, an important governance body formed by Cosan and business sustainability teams and leaders. The Commission is responsible for implementing and monitoring the commitments and goals assumed, presenting the status of each of them to the Group's senior management, promoting debate on trends in the ESG agenda - dialoguing with different actors and proposing agendas to be taken to the Committee of Cosan's Strategy and Sustainability, as well as identifying synergies and promoting the exchange of experiences between the group's companies.
To develop best market practices and improve our performance in ESG reporting, as well as engaging senior leadership in the agenda, the variable remuneration of the Company's executives and other employees is made up of ESG metrics determined based on performance analysis. of our companies in market indices and ratings that are highly relevant to various stakeholders, including our investors and shareholders. The variable remuneration also considers strategic projects, composed of the Group's information security maturity and internal control maturity.
In this way, we guarantee that the management of socio-environmental and climate issues are interconnected with the business strategy and with the objective of boosting Brazil's potential.
Explanatory Notes to the Financial Statement
(In thousands of Reais, except when otherwise indicated)
Risks
The risks arising from climate change in our business operations translate into financial and strategic risks for Cosan, which may affect the growth strategy and expected returns of our portfolio. Additionally, they can enhance other risks already identified in our monitoring.
In this way, mapping risks and opportunities related to climate change in our business becomes a central part of our Sustainability Strategy - Vision 2030, boosting our understanding and compliance with the recommendations of the Taskforce on Climate-Related Financial Disclosures (Taskforce on Climate -related Financial Disclosures – TCFD).
In 2023, we worked on improving, across our entire portfolio, the process of identifying, evaluating and managing risks and opportunities related to Climate Change, incorporating the monitoring of these risks into the formal risk management process of our portfolio. Additionally, based on an in-depth study, we developed a specific climate risk matrix for each company. These matrices were integrated both into the general risk matrix of each business and, in a consolidated manner, into Cosan's matrix.
Debt contracts with ESG clauses
The 2028 Senior Notes from the subsidiary Rumo were the first green issuance in the freight railway sector in Latin America. Rumo is committed to using resources to fully or partially finance ongoing and future projects that contribute to the promotion of a low-carbon transport sector with efficient use of resources in Brazil. Eligible projects are distributed in the areas of “Acquisition, replacement and updating of rolling stock”, “Infrastructure for duplication of railway sections, new yards and yard extensions”, and “Railroad modernization”. The company annually issues a report demonstrating the progress of the projects, which can be accessed directly on the investor relations page.
Rumo's Senior Notes 2032 was an issue in Sustainability-Linked Bonds (SLBs), with the following sustainable goals: 17.6% reduction in tons of direct greenhouse gas emissions per useful kilometer (TKU) by 2026, having 2020 as a reference. The company is subject to a step-up of 25 basis points from July 2027 if it does not reach this target, which would increase the interest rate to 4.45% per year.
The 2nd Debenture of Malha Paulista is linked to the sustainable target of reducing greenhouse gas emissions per RTK by 15% by 2023, having as a starting point the base date of December 2019. The Company will benefit from a step-down of 25 basis points in each series if this target is reached, which would reduce the rate from 2024 to CDI + 1.54% in the 1st series and IPCA + 4.52% in the 2nd series.
Rumo S.A.'s 17th Debenture is linked to the sustainable goal of reducing (i) 17.6% of tons of direct greenhouse gas emissions per useful kilometer (TKU) by 2026; and (ii) 21.6% until 2030, using 2020 as a reference. The company is subject to a step-up of 25 basis points in both series if it does not reach the targets.
On November 1, 2023, the subsidiary Compass issued simple, non-convertible debentures, in the amount of R$1,736,385 with semi-annual remuneration equivalent to CDI + 1.55% per year. and maturities on November 1, 2029 (50%) and November 1, 2030. The resources obtained from the issue will be used for investments and reinforcement of working capital. This 2nd issue of debentures is linked to ESG Targets of: (i) Distributed volume of Biomethane (thousands of m³): Increase the daily volume distributed by 50 times in 2022 until 2027, reaching 0.25mln/m³ day; (ii) Diversity in Leadership Positions: Reach 47% of people in leadership composed of Diversity Groups by 2027. The Compass subsidiary will undergo a step-up of 12.5 basis points for each target that is not achieved, which would increase the rate from April 2028 (verification date) for up to CDI + 1.85% per year.
Explanatory Notes to the Financial Statement
(In thousands of Reais, except when otherwise indicated)
3.4 RECLASSIFICATION IN THE INCOME STATEMENT
ARSESP, through deliberation 1,205 of August 18, 2021, NTF-044-2021, published a new Regulatory Accounting Manual and Chart of Accounts for the piped gas distribution sector for companies on its regulation with applicability from the 2023 financial year.
According to the technical note mentioned above, ARSESP determines that the accounting of variations, positive and negative, between the price included in the tariffs and that actually paid by the concessionaire to the supplier, which are periodically passed on to users through graphical accounts, must be recorded in the net operating revenue group. The accounting policy usually applied by the subsidiary Compass is consistent with the understanding of the essence of the operation, classifying the effects of the Regulatory Current Account (“CCR”) in its gross profit, but with allocations in the cost group of products sold and services provided. In addition, the document also mentions that the classification of expenses and costs may vary in relation to commonly adopted practices in which part of the administrative expenses are also admitted as costs of operations related to piped gas distribution services.
The indirect subsidiary Comgás voluntarily reassessed the way in which the classification of CCR effects and general and administrative expenses is presented, as it understands that such presentation will meet the requirements of ARSESP and OCPC08, providing more consistent information in consolidations aligned with the practices adopted by the group. These reclassifications do not impact the main indicators, such as profit for the year and equity, used by the indirect subsidiary Comgás and other Compass gas distributors.
The application of the change in accounting policy generated the following reclassification in the income statement in the comparative year:
|
| Consolidated | ||||
|
| 12/31/2022 (As stated) |
| Reclassification |
| 12/31/2022 (Restated) |
Net operating revenue |
| 39,737,368 |
| (414,582) |
| 39,322,786 |
Cost of goods sold and services provided |
| (30,753,137) |
| 196,318 |
| (30,556,819) |
Gross profit |
| 8,984,231 |
| (218,264) |
| 8,765,967 |
|
|
|
|
|
|
|
Selling expenses |
| (1,276,279) |
| — |
| (1,276,279) |
General and administrative expenses |
| (1,976,331) |
| 218,264 |
| (1,758,067) |
Other operation income, net |
| 1,752,222 |
| — |
| 1,752,222 |
Operating result |
| (1,500,388) |
| 218,264 |
| (1,282,124) |
|
|
|
|
|
|
|
Earnings before equity income and net financial revenue |
| 7,483,843 |
| — |
| 7,483,843 |
Explanatory Notes to the Financial Statement
(In thousands of Reais, except when otherwise indicated)
The Company's senior management (the Chief Operating Decision Maker) uses segment information to evaluate the performance of operating segments and make resource allocation decisions. This information is prepared in a manner consistent with the accounting policies used in the preparation of the individual and consolidated financial statements. Earnings before interest, taxes, depreciation, and amortization ("EBITDA") are used by the Company to evaluate the performance of its operating segments.
Reported segments:
| i. | Raízen: operates in (i) the production, commercialization, origination, and trading of ethanol, (ii) production and commercialization of bioenergy, (iii) resale and trading of electricity, (iv) production and commercialization of other product from renewable sources (solar energy and biogas), (v) production, marketing, origination and trading of sugar and (vi) distribution and commercialization of fuels and lubricants and operations related to the Shell Select convenience store business and proximity OXXO of the Nós Group, a joint venture with FEMSA Comércio. |
| ii. | Compass: (i) distribution of piped natural gas throughout Brazil to industrial, residential, commercial, automotive, and cogeneration customers; (ii) commercialization of electricity and natural gas; (iii) development of infrastructure projects in a regasification terminal and offshore gas pipeline; and (iv) development of thermal generation projects utilizing natural gas. |
| iii. | Moove: production and distribution of licensed Mobil lubricants in Brazil, Bolivia, Uruguay, Paraguay, Argentina, the United States of American, and the European market. Additionally, under the Comma brand, it manufactures and distributes products for European and Asian markets and corporate activities. |
| iv. | Rumo: logistics services for rail transport, port storage and loading of goods, primarily grains and sugar, leasing of locomotives, wagons, and other railroad equipment, as well as operation of containers. |
| v. | Radar: A reference in agricultural property management, Radar invests in a diversified portfolio with high potential for appreciation, through participation in the companies Radar, Tellus and Janus. |
Reconciliation:
| i | Cosan Corporate: represents the reconciliation of Cosan's corporate structure, which is composed of: (i) senior management and corporate teams, which incur general and administrative expenses and other expenses (operating income), including pre-operational investments; (ii) equity income from assets, including the interest in Vale S.A.; and (iii) financial result attributed to cash and debts of the controlling company, intermediary holding companies (Cosan Oito, Cosan Nove and Cosan Dez) and offshore financial companies, and mining projects and investment in the Climate Tech Fund, a fund managed by Fifth Wall, specialized in technologic innovation. |
Although Raízen S.A. is a joint venture registered under the equity method and is not proportionally consolidated, Management continues to review the information by segment. The reconciliation of these segments is presented in the column “Deconsolidation of jointly owned subsidiary”.
The Company reassessed its structure of segments presented as reconciliation items and added the companies Cosan Dez and Cosan Investments to the Cosan Corporative structure.
Explanatory Notes to the Financial Statement
(In thousands of Reais, except when otherwise indicated)
| 12/31/2023 | ||||||||||||||||
| Reported segments |
| Reconciliation |
| |||||||||||||
| Raízen |
| Compass |
| Moove (i) |
| Rumo |
| Radar |
| Cosan Corporate |
| Deconsolidation of Joint Ventures |
| Elimination Between Segments |
| Consolidated |
Result |
|
|
|
|
|
|
|
|
|
|
|
|
|
|
|
|
|
Net operating revenue | 221,693,298 |
| 17,767,327 |
| 10,078,626 |
| 10,937,716 |
| 743,411 |
| 2,709 |
| (221,693,298) |
| (61,292) |
| 39,468,497 |
Cost of goods sold and services provided | (202,926,764) |
| (14,256,031) |
| (7,359,606) |
| (6,838,433) |
| (153,470) |
| (3,648) |
| 202,926,764 |
| 61,292 |
| (28,549,896) |
Gross profit | 18,766,534 |
| 3,511,296 |
| 2,719,020 |
| 4,099,283 |
| 589,941 |
| (939) |
| (18,766,534) |
| — |
| 10,918,601 |
Selling expenses | (5,773,538) |
| (164,399) |
| (1,144,957) |
| (40,658) |
| — |
| (556) |
| 5,773,538 |
| — |
| (1,350,570) |
General and administrative expenses | (2,815,532) |
| (788,015) |
| (645,634) |
| (559,973) |
| (74,355) |
| (459,997) |
| 2,815,532 |
| — |
| (2,527,974) |
Other operating income (expenses), net | 1,968,248 |
| 607,226 |
| (336) |
| (100,780) |
| 2,253,803 |
| 1,164,464 |
| (1,968,248) |
| — |
| 3,924,377 |
Equity in associates’ earnings | (219,896) |
| 178,978 |
| — |
| 75,333 |
| 20,015 |
| 2,647,255 |
| 219,896 |
| (2,571,182) |
| 350,399 |
Equity income in joint ventures | — |
| — |
| — |
| 1,266 |
| — |
| 1,694,679 |
| — |
| — |
| 1,695,945 |
Financial result | (5,962,849) |
| (730,954) |
| (319,136) |
| (2,555,382) |
| 30,798 |
| (4,322,353) |
| 5,962,849 |
| — |
| (7,897,027) |
Financial expenses | (6,241,261) |
| (1,658,582) |
| (242,751) |
| (3,621,093) |
| (6,776) |
| (5,808,228) |
| 6,241,261 |
| — |
| (11,337,430) |
Financial revenue | 797,560 |
| 1,283,024 |
| 116,408 |
| 1,190,685 |
| 37,577 |
| 400,440 |
| (797,560) |
| — |
| 3,028,134 |
Foreign exchange variation | 1,240,924 |
| 152,592 |
| (155,618) |
| 368,259 |
| (3) |
| 1,412,208 |
| (1,240,924) |
| — |
| 1,777,438 |
Derivatives | (1,760,072) |
| (507,988) |
| (37,175) |
| (493,233) |
| — |
| (326,773) |
| 1,760,072 |
| — |
| (1,365,169) |
Income tax and social contribution | (1,936,598) |
| (859,311) |
| (332,090) |
| (197,174) |
| (147,636) |
| 1,261,785 |
| 1,936,598 |
| — |
| (274,426) |
Income for the year | 4,026,369 |
| 1,754,821 |
| 276,867 |
| 721,915 |
| 2,672,566 |
| 1,984,338 |
| (4,026,369) |
| (2,571,182) |
| 4,839,325 |
Profit (loss) from discontinued operations | — |
| 45,419 |
| — |
| — |
| — |
| 20,384 |
| — |
| (20,384) |
| 45,419 |
|
|
|
|
|
|
|
|
|
|
|
|
|
|
|
|
|
|
Result attributed to: |
|
|
|
|
|
|
|
|
|
|
|
|
|
|
|
|
|
Controlling shareholders | 3,863,605 |
| 1,410,630 |
| 193,888 |
| 218,886 |
| 768,162 |
| 1,094,391 |
| (3,863,605) |
| (2,591,566) |
| 1,094,391 |
Non-controlling shareholders | 162,764 |
| 389,610 |
| 82,979 |
| 503,029 |
| 1,904,404 |
| 910,331 |
| (162,764) |
| — |
| 3,790,353 |
| 4,026,369 |
| 1,800,240 |
| 276,867 |
| 721,915 |
| 2,672,566 |
| 2,004,722 |
| (4,026,369) |
| (2,591,566) |
| 4,884,744 |
Other selected information |
|
|
|
|
|
|
|
|
|
|
|
|
|
|
|
|
|
Depreciation and amortization | 8,071,288 |
| 899,635 |
| 273,772 |
| 2,175,834 |
| 275 |
| 15,427 |
| (8,071,288) |
| — |
| 3,364,943 |
EBITDA | 19,997,104 |
| 4,244,721 |
| 1,201,865 |
| 5,650,305 |
| 2,789,679 |
| 5,060,333 |
| (19,997,104) |
| (2,571,182) |
| 16,375,721 |
Additions to fixed assets, intangible assets and contract assets | 11,396,056 |
| 2,317,889 |
| 177,971 |
| 3,689,877 |
| 39,892 |
| 42,333 |
| (11,396,056) |
| — |
| 6,267,962 |
|
|
|
|
|
|
|
|
|
|
|
|
|
|
|
|
|
|
EBITDA reconciliation |
|
|
|
|
|
|
|
|
|
|
|
|
|
|
|
|
|
Income for the year | 4,026,369 |
| 1,754,821 |
| 276,867 |
| 721,915 |
| 2,672,566 |
| 1,984,338 |
| (4,026,369) |
| (2,571,182) |
| 4,839,325 |
Income taxes and social contribution | 1,936,598 |
| 859,311 |
| 332,090 |
| 197,174 |
| 147,636 |
| (1,261,785) |
| (1,936,598) |
| — |
| 274,426 |
Financial result | 5,962,849 |
| 730,954 |
| 319,136 |
| 2,555,382 |
| (30,798) |
| 4,322,353 |
| (5,962,849) |
| — |
| 7,897,027 |
Depreciation and amortization | 8,071,288 |
| 899,635 |
| 273,772 |
| 2,175,834 |
| 275 |
| 15,427 |
| (8,071,288) |
| — |
| 3,364,943 |
EBITDA | 19,997,104 |
| 4,244,721 |
| 1,201,865 |
| 5,650,305 |
| 2,789,679 |
| 5,060,333 |
| (19,997,104) |
| (2,571,182) |
| 16,375,721 |
| (i) | For additional information of the Moove segment see note 4.4. |
Explanatory Notes to the Financial Statement
(In thousands of Reais, except when otherwise indicated)
| 12/31/2022 (Restated) | ||||||||||||||||
| Reported segments |
| Reconciliation |
| |||||||||||||
| Raízen |
| Compass |
| Moove |
| Rumo |
| Radar |
| Cosan Corporate |
| Deconsolidation of Joint Ventures |
| Elimination Between Segments |
| Consolidated |
Result |
|
|
|
|
|
|
|
|
|
|
|
|
|
|
|
|
|
Net operating revenue | 244,293,722 |
| 19,719,205 |
| 8,980,077 |
| 9,841,508 |
| 834,616 |
| 10,416 |
| (244,293,722) |
| (63,036) |
| 39,322,786 |
Cost of goods sold and services provided | (233,658,136) |
| (16,364,835) |
| (6,990,171) |
| (6,695,147) |
| (560,274) |
| (9,428) |
| 233,658,136 |
| 63,036 |
| (30,556,819) |
Gross profit | 10,635,586 |
| 3,354,370 |
| 1,989,906 |
| 3,146,361 |
| 274,342 |
| 988 |
| (10,635,586) |
| — |
| 8,765,967 |
Selling expenses | (5,148,014) |
| (163,256) |
| (1,072,488) |
| (30,619) |
| — |
| (9,916) |
| 5,148,014 |
| — |
| (1,276,279) |
General and administrative expenses | (2,425,318) |
| (563,466) |
| (347,591) |
| (468,574) |
| (45,535) |
| (332,901) |
| 2,425,318 |
| — |
| (1,758,067) |
Other operating income (expenses), net | 283,606 |
| (91,905) |
| 29,002 |
| 348,543 |
| 1,302,442 |
| 164,140 |
| (283,606) |
| — |
| 1,752,222 |
Equity in associates’ earnings | (119,338) |
| 98,033 |
| — |
| 40,462 |
| 20,799 |
| 3,109,119 |
| 119,338 |
| (2,849,516) |
| 418,897 |
Equity income in joint ventures | — |
| — |
| — |
| — |
| — |
| (92,179) |
| — |
| — |
| (92,179) |
Financial result | (4,105,064) |
| (377,136) |
| (101,872) |
| (2,329,035) |
| 4,106 |
| (2,353,999) |
| 4,105,064 |
| — |
| (5,157,936) |
Financial expenses | (3,010,398) |
| (1,291,850) |
| (114,249) |
| (1,521,478) |
| (3,550) |
| (1,775,408) |
| 3,010,398 |
| — |
| (4,706,535) |
Financial revenue | 811,948 |
| 898,100 |
| 75,817 |
| 1,108,620 |
| 7,656 |
| 3,687,328 |
| (811,948) |
| — |
| 5,777,521 |
Foreign exchange variation | 963,060 |
| 102,655 |
| (15,394) |
| 374,859 |
| — |
| (201,374) |
| (963,060) |
| — |
| 260,746 |
Derivatives | (2,869,674) |
| (86,041) |
| (48,046) |
| (2,291,036) |
| — |
| (4,064,545) |
| 2,869,674 |
| — |
| (6,489,668) |
Income tax and social contribution | 864,710 |
| (329,185) |
| (10,062) |
| (193,116) |
| (74,915) |
| 725,682 |
| (864,710) |
| — |
| 118,404 |
Income for the year | (13,832) |
| 1,927,455 |
| 486,895 |
| 514,022 |
| 1,481,239 |
| 1,210,934 |
| 13,832 |
| (2,849,516) |
| 2,771,029 |
Profit (loss) from discontinued operations | — |
| 49,846 |
| — |
| — |
|
|
| 17,180 |
| — |
| (17,180) |
| 49,846 |
|
|
|
|
|
|
|
|
|
|
|
|
|
|
|
|
|
|
Result attributed to: |
|
|
|
|
|
|
|
|
|
|
|
|
|
|
|
|
|
Controlling shareholders | (66,054) |
| 1,834,528 |
| 340,914 |
| 156,380 |
| 749,840 |
| 961,066 |
| 66,054 |
| (2,866,696) |
| 1,176,032 |
Non-controlling shareholders | 52,222 |
| 142,773 |
| 145,981 |
| 357,642 |
| 731,399 |
| 267,048 |
| (52,222) |
| — |
| 1,644,843 |
| (13,832) |
| 1,977,301 |
| 486,895 |
| 514,022 |
| 1,481,239 |
| 1,228,114 |
| 13,832 |
| (2,866,696) |
| 2,820,875 |
Other selected information |
|
|
|
|
|
|
|
|
|
|
|
|
|
|
|
|
|
Depreciation and amortization | 9,297,498 |
| 776,248 |
| 251,886 |
| 1,966,945 |
| 238 |
| 19,163 |
| (9,297,498) |
| — |
| 3,014,480 |
EBITDA | 12,524,020 |
| 3,410,024 |
| 850,715 |
| 5,003,118 |
| 1,552,286 |
| 2,858,414 |
| (12,524,020) |
| (2,849,516) |
| 10,825,041 |
Additions to fixed assets, intangible assets and contract assets | 9,339,898 |
| 1,659,202 |
| 109,263 |
| 2,717,745 |
| 19,212 |
| 25,952 |
| (9,339,898) |
| — |
| 4,531,374 |
|
|
|
|
|
|
|
|
|
|
|
|
|
|
|
|
| — |
EBITDA reconciliation |
|
|
|
|
|
|
|
|
|
|
|
|
|
|
|
| — |
Income for the year | (13,832) |
| 1,927,455 |
| 486,895 |
| 514,022 |
| 1,481,239 |
| 1,210,934 |
| 13,832 |
| (2,849,516) |
| 2,771,029 |
Income taxes and social contribution | (864,710) |
| 329,185 |
| 10,062 |
| 193,116 |
| 74,915 |
| (725,682) |
| 864,710 |
| — |
| (118,404) |
Financial result | 4,105,064 |
| 377,136 |
| 101,872 |
| 2,329,035 |
| (4,106) |
| 2,353,999 |
| (4,105,064) |
| — |
| 5,157,936 |
Depreciation and amortization | 9,297,498 |
| 776,248 |
| 251,886 |
| 1,966,945 |
| 238 |
| 19,163 |
| (9,297,498) |
| — |
| 3,014,480 |
EBITDA | 12,524,020 |
| 3,410,024 |
| 850,715 |
| 5,003,118 |
| 1,552,286 |
| 2,858,414 |
| (12,524,020) |
| (2,849,516) |
| 10,825,041 |
Explanatory Notes to the Financial Statement
(In thousands of Reais, except when otherwise indicated)
12/31/2023 | |||||||||||||||||
| Reported segments |
| Reconciliation |
|
| ||||||||||||
| Raízen |
| Compass |
| Moove (i) |
| Rumo |
| Radar |
| Cosan Corporate |
| Deconsolidation of Joint Ventures |
| Elimination Between Segments |
| Consolidated |
Statement of financial position: |
|
|
|
|
|
|
|
|
|
|
|
|
|
|
|
|
|
Cash and cash equivalents | 7,915,876 |
| 3,931,532 |
| 773,552 |
| 7,233,993 |
| 39,946 |
| 2,679,458 |
| (7,915,876) |
| — |
| 14,658,481 |
Marketable securities | 349,584 |
| 800,267 |
| 77,814 |
| 1,396,107 |
| 239,361 |
| 990,412 |
| (349,584) |
| — |
| 3,503,961 |
Trade receivables | 13,438,430 |
| 1,550,973 |
| 1,101,854 |
| 556,298 |
| 234,801 |
| 710 |
| (13,438,430) |
| — |
| 3,444,636 |
Derivative financial instruments | 10,888,050 |
| 175,655 |
| — |
| 1,561,493 |
| — |
| 809,651 |
| (10,888,050) |
| — |
| 2,546,799 |
Inventories | 17,310,692 |
| 292,335 |
| 1,284,773 |
| 215,605 |
| — |
| 1 |
| (17,310,692) |
| — |
| 1,792,714 |
Sectorial financial assets | — |
| 548,700 |
| — |
| — |
| — |
| — |
| — |
| — |
| 548,700 |
Other financial assets | 103,774 |
| 2,423 |
| 690 |
| — |
| — |
| — |
| (103,774) |
| — |
| 3,113 |
Other current assets | 8,478,292 |
| 1,553,524 |
| 193,836 |
| 841,417 |
| 375,716 |
| 3,152,651 |
| (8,478,292) |
| (1,106,687) |
| 5,010,457 |
Other non-current assets | 13,957,596 |
| 1,166,991 |
| 209,823 |
| 3,528,375 |
| 14,378 |
| 3,832,013 |
| (13,957,596) |
| (180,880) |
| 8,570,700 |
Investments in associates | — |
| 1,630,124 |
| 2 |
| 312,302 |
| 88,656 |
| 32,792,891 |
| — |
| (17,212,606) |
| 17,611,369 |
Investments in joint ventures | 1,321,982 |
| — |
| — |
| 48,566 |
| — |
| 11,693,876 |
| (1,321,982) |
| — |
| 11,742,442 |
Biological assets | 3,818,316 |
| — |
| — |
| — |
| — |
| — |
| (3,818,316) |
| — |
| — |
investment properties | — |
| — |
| — |
| — |
| 15,976,126 |
| — |
| — |
| — |
| 15,976,126 |
Contract assets | 3,108,696 |
| 1,041,421 |
| 10,684 |
| — |
| — |
| — |
| (3,108,696) |
| — |
| 1,052,105 |
Right-of-use assets | 9,645,522 |
| 1,588,292 |
| 195,953 |
| 7,703,754 |
| 3,319 |
| 22,200 |
| (9,645,522) |
| — |
| 9,513,518 |
Fixed assets | 30,144,420 |
| 1,255,012 |
| 755,955 |
| 19,176,386 |
| 24 |
| 52,597 |
| (30,144,420) |
| — |
| 21,239,974 |
Intangible assets | 9,677,254 |
| 13,299,255 |
| 2,679,983 |
| 6,664,143 |
| — |
| 6,906 |
| (9,677,254) |
| — |
| 22,650,287 |
Loans, borrowings and debentures | (39,634,986) |
| (10,017,150) |
| (2,207,028) |
| (18,964,841) |
| — |
| (25,715,635) |
| 39,634,986 |
| — |
| (56,904,654) |
Derivative financial instruments - liabilities | (7,870,706) |
| (360,784) |
| (742) |
| (1,471,795) |
| — |
| (1,581,824) |
| 7,870,706 |
| — |
| (3,415,145) |
Suppliers | (20,150,654) |
| (1,534,041) |
| (1,494,568) |
| (1,084,931) |
| (68,422) |
| (2,563) |
| 20,150,654 |
| — |
| (4,184,525) |
Employee benefits payables | (966,452) |
| (301,560) |
| (147,313) |
| (318,550) |
| — |
| (61,906) |
| 966,452 |
| — |
| (829,329) |
Sectorial financial liabilities | — |
| (1,810,698) |
| — |
| — |
| — |
| — |
| — |
| — |
| (1,810,698) |
Other current liabilities | (10,642,734) |
| (1,703,128) |
| (336,080) |
| (1,583,216) |
| (182,298) |
| (1,239,688) |
| 10,642,734 |
| 571,201 |
| (4,473,209) |
Lease liabilities | (11,304,874) |
| (1,636,943) |
| (198,964) |
| (3,406,843) |
| (3,502) |
| (29,542) |
| 11,304,874 |
| — |
| (5,275,794) |
Other non-current liabilities | (12,284,662) |
| (2,678,578) |
| (580,103) |
| (6,537,271) |
| (543,490) |
| (2,367,850) |
| 12,284,662 |
| 716,444 |
| (11,990,848) |
Total assets (net of liabilities) allocated by segment | 27,303,416 |
| 8,793,622 |
| 2,320,121 |
| 15,870,992 |
| 16,174,615 |
| 25,034,358 |
| (27,303,416) |
| (17,212,528) |
| 50,981,180 |
Total assets | 130,158,484 |
| 28,836,504 |
| 7,284,919 |
| 49,238,439 |
| 16,972,327 |
| 56,033,366 |
| (130,158,484) |
| (18,500,173) |
| 139,865,382 |
|
|
|
|
|
|
|
|
|
|
|
|
|
|
|
|
|
|
Shareholders’ equity attributable to: |
|
|
|
|
|
|
|
|
|
|
|
|
|
|
|
|
|
Controlling shareholders | 26,561,384 |
| 5,798,294 |
| 1,624,273 |
| 4,766,403 |
| 5,023,574 |
| 20,955,291 |
| (26,561,384) |
| (17,212,528) |
| 20,955,307 |
Non-controlling shareholders | 742,032 |
| 2,995,328 |
| 695,848 |
| 11,104,589 |
| 11,151,041 |
| 4,079,067 |
| (742,032) |
| — |
| 30,025,873 |
Total shareholders’ equity | 27,303,416 |
| 8,793,622 |
| 2,320,121 |
| 15,870,992 |
| 16,174,615 |
| 25,034,358 |
| (27,303,416) |
| (17,212,528) |
| 50,981,180 |
| (i) | For additional information of the Moove segment see note 4.4. |
Explanatory Notes to the Financial Statement
(In thousands of Reais, except when otherwise indicated)
| 12/31/2022 (Restated) | ||||||||||||||||
| Reported segments |
| Reconciliation |
|
| ||||||||||||
| Raízen |
| Compass |
| Moove |
| Rumo |
| Radar |
| Cosan Corporate |
| Deconsolidation of Joint Ventures |
| Elimination Between Segments |
| Consolidated |
Balance sheet items: |
|
|
|
|
|
|
|
|
|
|
|
|
|
|
|
|
|
Cash and cash equivalents | 4,902,800 |
| 3,403,634 |
| 865,370 |
| 7,385,421 |
| 25,582 |
| 1,621,709 |
| (4,902,800) |
| — |
| 13,301,716 |
Marketable securities | 126,206 |
| 578,358 |
| 62,919 |
| 840,061 |
| 217,061 |
| 20,401,367 |
| (126,206) |
| — |
| 22,099,766 |
Trade receivables | 10,316,720 |
| 1,931,205 |
| 1,101,336 |
| 578,324 |
| 314,834 |
| 1,843 |
| (10,316,720) |
| — |
| 3,927,542 |
Derivative financial instruments - assets | 7,023,284 |
| 391,863 |
| — |
| 874,843 |
| — |
| 2,885,046 |
| (7,023,284) |
| — |
| 4,151,752 |
Inventories | 16,043,114 |
| 133,881 |
| 1,509,357 |
| 225,813 |
| — |
| 8 |
| (16,043,114) |
| — |
| 1,869,059 |
Sectorial financial assets | — |
| 342,333 |
| — |
| — |
| — |
| — |
| — |
| — |
| 342,333 |
Other financial assets | 230,780 |
| 277 |
| 450 |
| — |
| — |
| 88,511 |
| (230,780) |
| — |
| 89,238 |
Other current assets | 10,285,568 |
| 1,037,586 |
| 405,314 |
| 724,415 |
| 74,623 |
| 1,690,662 |
| (10,285,568) |
| (1,042,433) |
| 2,890,167 |
Other non-current assets | 8,938,318 |
| 897,654 |
| 297,616 |
| 3,385,624 |
| 7,643 |
| 3,041,082 |
| (8,938,318) |
| (266,513) |
| 7,363,106 |
Investments in associates | — |
| 2,525,292 |
| — |
| 381,469 |
| 74,505 |
| 16,118,992 |
| — |
| (16,186,315) |
| 2,913,943 |
Investments in joint ventures | 1,371,430 |
| — |
| — |
| — |
| — |
| 11,221,356 |
| (1,371,430) |
| — |
| 11,221,356 |
Biological assets | 3,254,850 |
| — |
| — |
| — |
| 9,992 |
| — |
| (3,254,850) |
| — | �� | 9,992 |
investment properties | — |
| — |
| — |
| — |
| 14,103,060 |
| — |
| — |
| — |
| 14,103,060 |
Contract assets | 3,297,856 |
| 1,110,335 |
| 8,380 |
| — |
| — |
| — |
| (3,297,856) |
| — |
| 1,118,715 |
Right-of-use assets | 9,556,152 |
| 83,059 |
| 170,120 |
| 7,732,284 |
| 3,584 |
| 23,822 |
| (9,556,152) |
| — |
| 8,012,869 |
Fixed assets | 25,210,448 |
| 671,573 |
| 805,377 |
| 17,049,188 |
| 34 |
| 422,264 |
| (25,210,448) |
| — |
| 18,948,436 |
Intangible assets | 9,337,192 |
| 12,015,135 |
| 2,854,874 |
| 6,774,306 |
| — |
| 477,627 |
| (9,337,192) |
| — |
| 22,121,942 |
Loans, borrowings and debentures | (33,551,302) |
| (8,278,839) |
| (2,862,154) |
| (16,758,088) |
| — |
| (25,088,135) |
| 33,551,302 |
| — |
| (52,987,216) |
Derivative financial instruments - liabilities | (4,909,074) |
| (400,351) |
| (18,146) |
| (1,412,945) |
| — |
| (3,459,490) |
| 4,909,074 |
| — |
| (5,290,932) |
Suppliers | (18,789,160) |
| (1,842,810) |
| (1,602,936) |
| (746,433) |
| (71,684) |
| (115,988) |
| 18,789,160 |
| — |
| (4,379,851) |
Employee benefits payables | (837,208) |
| (193,585) |
| (112,590) |
| (296,833) |
| — |
| (56,513) |
| 837,208 |
| — |
| (659,521) |
Sectorial financial liabilities | — |
| (1,616,616) |
| — |
| — |
| — |
| — |
| — |
| — |
| (1,616,616) |
Other current liabilities | (7,176,122) |
| (779,928) |
| (397,704) |
| (1,786,009) |
| (905,816) |
| (1,235,770) |
| 7,176,122 |
| 484,407 |
| (4,620,820) |
Lease liabilities | (10,568,042) |
| (76,606) |
| (166,651) |
| (3,254,011) |
| (3,708) |
| (31,182) |
| 10,568,042 |
| — |
| (3,532,158) |
Other non-current liabilities | (7,983,554) |
| (3,326,667) |
| (571,672) |
| (6,286,975) |
| (465,486) |
| (3,402,216) |
| 7,983,554 |
| 824,537 |
| (13,228,479) |
Total assets (net of liabilities) allocated by segment | 26,080,256 |
| 8,606,783 |
| 2,349,260 |
| 15,410,454 |
| 13,384,224 |
| 24,604,995 |
| (26,080,256) |
| (16,186,317) |
| 48,169,399 |
Total assets | 109,894,718 |
| 25,122,185 |
| 8,081,113 |
| 45,951,748 |
| 14,830,918 |
| 57,994,289 |
| (109,894,718) |
| (17,495,261) |
| 134,484,992 |
|
|
|
|
|
|
|
|
|
|
|
|
|
|
|
|
|
|
Shareholders’ equity attributable to: |
|
|
|
|
|
|
|
|
|
|
|
|
|
|
|
|
|
Controlling shareholders | 22,507,108 |
| 5,738,714 |
| 1,647,259 |
| 4,613,308 |
| 4,187,415 |
| 20,652,788 |
| (22,507,108) |
| (16,186,317) |
| 20,653,167 |
Non-controlling shareholders | 3,573,148 |
| 2,868,069 |
| 702,001 |
| 10,797,146 |
| 9,196,809 |
| 3,952,207 |
| (3,573,148) |
| — |
| 27,516,232 |
Total shareholders’ equity | 26,080,256 |
| 8,606,783 |
| 2,349,260 |
| 15,410,454 |
| 13,384,224 |
| 24,604,995 |
| (26,080,256) |
| (16,186,317) |
| 48,169,399 |
Explanatory Notes to the Financial Statement
(In thousands of Reais, except when otherwise indicated)
4.1 NET SALES BY SEGMENT
| 12/31/2023 |
| 12/31/2022 (Restated) |
Reported segment |
|
|
|
Raízen |
|
|
|
Ethanol | 23,312,258 |
| 29,652,112 |
Sugar | 29,070,524 |
| 23,695,768 |
Gasoline | 66,267,702 |
| 66,586,914 |
Diesel | 90,281,586 |
| 106,684,577 |
Cogeneration | 3,724,090 |
| 3,688,108 |
Other | 9,037,138 |
| 13,986,243 |
| 221,693,298 |
| 244,293,722 |
Compass |
|
|
|
Natural gas distribution |
|
|
|
Industrial | 11,411,212 |
| 12,945,164 |
Residential | 2,202,348 |
| 2,200,849 |
Cogeneration | 710,288 |
| 943,907 |
Automotive | 592,917 |
| 928,468 |
Commercial | 820,685 |
| 814,962 |
Construction revenue | 1,494,142 |
| 1,217,818 |
Others | 535,735 |
| 429,493 |
| 17,767,327 |
| 19,480,661 |
Electricity trading | — |
| 238,544 |
| 17,767,327 |
| 19,719,205 |
|
|
|
|
Moove |
|
|
|
Finished product | 7,480,150 |
| 8,094,216 |
Base oil | 772,632 |
| 596,443 |
Services | 1,825,844 |
| 289,418 |
| 10,078,626 |
| 8,980,077 |
|
|
|
|
Rumo |
|
|
|
North operations | 8,346,314 |
| 7,635,243 |
South operations | 2,032,703 |
| 1,739,391 |
Container operations | 558,699 |
| 466,874 |
| 10,937,716 |
| 9,841,508 |
|
|
|
|
Radar |
|
|
|
Lease and sale of lands | 743,411 |
| 834,616 |
|
|
|
|
Reconciliation |
|
|
|
Cosan Corporate | 2,709 |
| 10,416 |
|
|
|
|
Deconsolidation of joint venture, adjustments and eliminations | (221,754,590) |
| (244,356,758) |
Total | 39,468,497 |
| 39,322,786 |
Explanatory Notes to the Financial Statement
(In thousands of Reais, except when otherwise indicated)
4.2. INFORMATION ON GEOGRAPHICAL AREA
| Net sales |
| Other non-current assets | ||||
| 12/31/2023 |
| 12/31/2022 (Restated) |
| 12/31/2023 |
| 12/31/2022 (Restated) |
Brazil | 33,816,723 |
| 33,714,249 |
| 12,584,481 |
| 11,957,039 |
Europe (i) | 3,050,235 |
| 3,080,840 |
| 8,969 |
| 7,762 |
Latin America (ii) | 144,853 |
| 697,117 |
| 3,275 |
| 7,294 |
North America (iii) | 2,456,686 |
| 1,770,487 |
| 10,087 |
| 17,173 |
Asia and other | — |
| 60,093 |
| — |
| — |
Total | 39,468,497 |
| 39,322,786 |
| 12,606,812 |
| 11,989,268 |
| Main countries: |
| (i) England, France, Spain and Portugal; |
| (ii) Argentina, Bolivia, Uruguay and Paraguay, and |
| (iii) United States of America. |
4.3. MAIN CUSTOMERS
As at December 31, 2023, the subsidiary Rumo had a client who individually contributed a portion of 10.42% of its net operating revenue, with an approximate amount of R$1,213,263. In 2022, this same client individually contributed a portion of 9.89% of the subsidiary's net operating revenue with an approximate amount of R$858,831.
4.4 ADDITIONAL INFORMATION RELATED TO THE MOOVE SEGMENT
As presented above, Moove has operations in Brazil, Latin America, Europe and North America.
In 2023, the table below demonstrates certain financial information summed up from legal entities located in the United States of America (US) and the United Kingdom (UK) in the context of the Company’s individual and consolidated financial statements.
Financial statements |
| US and UK combined |
| Cosan consolidated |
| % |
Assets (i) |
| 4,769,269 |
| 139,865,382 |
| 3% |
Net revenue (i) |
| 4,902,335 |
| 39,468,497 |
| 12% |
Net income |
| (122,593) |
| 4,884,744 |
| (3%) |
Financial statements |
| US and UK combined |
| Cosan consolidated |
| % |
Shareholders' equity (ii) |
| 883,797 |
| 20,955,307 |
| 4% |
Interest in earnings of associates |
| (105,460) |
| 2,236,069 |
| (5%) |
Net income |
| (122.593) |
| 1,094,391 |
| (11%) |
| (i) | Amounts do not include the assets and net revenue of the jointly controlled subsidiary Raízen, as this subsidiary is not consolidated within the Company. |
| (ii) | Corresponding to the investment in legal entities located in the United States of America and the United Kingdom, which makes up Cosan's total investment in Moove of R$1,626,216 thousand, shown in explanatory note 9.1. |
Explanatory Notes to the Financial Statement
(In thousands of Reais, except when otherwise indicated)
Accounting policy: Measurement of financial assets and liabilities The Company initially measures a financial asset at its fair value plus (in case of a financial asset that is not measured at fair value through profit and loss) transaction costs, except for those measured at amortized cost and maintained within a business model with the goal of obtaining contractual cash flows that meet the principal and interest only criterion. Debt financial instruments are subsequently measured at fair value through profit and loss, amortized cost or fair value through other comprehensive income. The classification is based on two criteria: (i) the Company's business model for managing the assets; and (ii) whether the contractual cash flows from the instruments represent only principal and interest payments on the outstanding principal amount. The Company started recognizing its financial assets at amortized cost for financial assets held within a business model with the objective of obtaining contractual cash flows that satisfy the "Principal and Interest" criterion. This category includes trade receivables, cash and cash equivalents, receivables from related parties, other financial assets, dividends and interest on equity receivable, and other financial assets. Purchases or sales of financial assets that require the delivery of assets within a period established by regulation or market convention (regular trades) are recorded on the trade date, i.e., the date on which the Company enters into an agreement to buy or sell the asset. Financial assets are derecognized when the rights to receive cash flows from these assets have expired or when the Company has transferred substantially all risks and rewards associated with ownership. Financial liabilities are categorized based on whether they are measured at amortized cost or fair value through profit and loss. A financial liability is categorized as measured at fair value through profit and loss if it is held for trading, is a derivative, or was designated as such upon initial recognition. Financial liabilities are measured at fair value and the net result, including interest, is included in the income (loss). Other financial liabilities are subsequently measured using the effective interest method at their amortized cost. Interest expense and foreign exchange gains and losses are accounted for in the financial result. The Company derecognizes a financial liability when its contractual obligations are discharged, cancelled, or expired, or when its terms are modified and the cash flows of the modified liability are materially different, in which case a new financial liability is recognized at fair value based on the modified terms. Any gain or loss on derecognition is accounted for in the income (loss). |
Explanatory Notes to the Financial Statement
(In thousands of Reais, except when otherwise indicated)
Financial assets and liabilities are stated as classified below:
|
|
| Parent Company |
| Consolidated | ||||
| Note |
| 12/31/2023 |
| 12/31/2022 |
| 12/31/2023 |
| 12/31/2022 |
Assets |
|
|
|
|
|
|
|
|
|
Fair value through profit and loss |
|
|
|
|
|
|
|
|
|
Cash and cash equivalents | 5.2 |
| 1,667,155 |
| 759,965 |
| 3,298,142 |
| 1,134,030 |
Marketable securities | 5.3 |
| 705,777 |
| 724,050 |
| 3,503,961 |
| 22,099,766 |
Derivative financial instruments | 5.6 |
| 157,816 |
| 1,368,809 |
| 2,546,799 |
| 4,151,752 |
Other financial assets |
|
| — |
| — |
| 3,113 |
| 89,238 |
|
|
| 2,530,748 |
| 2,852,824 |
| 9,352,015 |
| 27,474,786 |
Amortized cost |
|
|
|
|
|
|
|
|
|
Cash and cash equivalents | 5.2 |
| 102,821 |
| 588,496 |
| 11,360,339 |
| 12,167,686 |
Trade receivables | 5.7 |
| — |
| — |
| 3,444,636 |
| 3,927,542 |
Restricted cash | 5.3 |
| 81,621 |
| 35,039 |
| 203,252 |
| 139,933 |
Receivables from related parties | 5.8 |
| 348,096 |
| 737,340 |
| 340,091 |
| 476,542 |
Sectorial financial assets | 5.10 |
| — |
| — |
| 548,700 |
| 342,333 |
Dividends and interest on equity receivable | 17 |
| 319,135 |
| 609,456 |
| 255,777 |
| 161,147 |
|
|
| 851,673 |
| 1,970,331 |
| 16,152,795 |
| 17,215,183 |
Total |
|
| 3,382,421 |
| 4,823,155 |
| 25,504,810 |
| 44,689,969 |
Liabilities |
|
|
|
|
|
|
|
|
|
Amortized cost |
|
|
|
|
|
|
|
|
|
Loans, borrowings and debentures |
|
| (13,496,324) |
| (5,475,628) |
| (33,952,162) |
| (21,620,197) |
Trade payables | 5.9 |
| (2,431) |
| (115,146) |
| (4,184,525) |
| (4,379,851) |
Consideration payable |
|
| — |
| — |
| (203,094) |
| (223,960) |
Other financial liabilities |
|
| — |
| — |
| (476,895) |
| (954,547) |
Leases | 5.5 |
| (29,543) |
| (30,365) |
| (5,275,794) |
| (3,532,158) |
Concession payable | 13 |
| — |
| — |
| (3,565,373) |
| (3,351,410) |
Related parties payable | 5.8 |
| (6,648,867) |
| (10,458,897) |
| (323,238) |
| (387,736) |
Dividends payable | 17 |
| (276,065) |
| (279,979) |
| (549,054) |
| (892,006) |
Sectorial financial liabilities | 5.10 |
| — |
| — |
| (1,810,698) |
| (1,616,616) |
Installment of tax debts | 14 |
| (211,226) |
| (202,140) |
| (217,348) |
| (208,760) |
|
|
| (20,664,456) |
| (16,562,155) |
| (50,558,181) |
| (37,167,241) |
Fair value through profit and loss |
|
|
|
|
|
|
|
|
|
Loans, borrowings and debentures |
|
| — |
| — |
| (22,952,492) |
| (31,367,019) |
Derivative financial instruments | 5.6 |
| (645,985) |
| (618,947) |
| (3,415,145) |
| (5,290,932) |
|
|
| (645,985) |
| (618,947) |
| (26,367,637) |
| (36,657,951) |
Total |
|
| (21,310,441) |
| (17,181,102) |
| (76,925,818) |
| (73,825,192) |
| (i) | The Company's subsidiaries have operations that seek ways to improve working capital efficiency and generally negotiate the extension of payment terms with their suppliers and enter into structured payment agreements (also known as reverse factoring or cashed risk) with intermediaries third parties, such as financial institutions. |
| As at December 31, 2023, the balance advanced by Rumo and Moove with financial institutions was R$342,276 and R$175 (R$817,869 and R$64,099 as at December 31, 2022), respectively. These operations had top-tier banks as counterparties, at an average rate of 12.42% per year (14.53% per year as at December 31, 2022) for Rumo and CDI + 2.5% per year (CDI + 2.5% per year as at December 31, 2022) for Moove. The average term of these operations, which are recorded at present value at the previously mentioned rate, is around 111 and 103 days (109 and 102 days as at December 31, 2022), respectively. Financial charges embedded in the transaction are recorded in the financial result, representing R$95,356 in the year ended December 31, 2023 (R$96,752 as of December 31, 2022). | |
| The settlement flow of the balance of credits assigned by suppliers to financial agents is classified in the statement of cash flows in operating activities, as it better represents the cash expenditure from the perspective of the Company's operations. |
Explanatory Notes to the Financial Statement
(In thousands of Reais, except when otherwise indicated)
Under the terms of the main loan lines, the Company and its subsidiaries are required to comply with the following financial clauses:
Company | Debt | Triggers | Ratios |
Cosan Corporate |
|
|
|
Cosan S.A. | * 1st issue debenture | Net debt (i) / EBITDA (ii) cannot exceed 4.0x | 2.42 |
Cosan Luxembourg S.A. | * Senior Notes 2027 | Proforma net debt (iv) / pro forma EBITDA (iv) cannot exceed 3.5x | 2.00 |
* Senior Notes 2029 | |||
* Senior Notes 2030 | |||
Compass |
|
|
|
Comgás S.A. | * 4th issue debenture | Short-term debt / total debt (iii) cannot exceed 0.6x | 0.17 |
Comgás S.A. | * Debenture 4th to 9th issues | Net debt (i) / EBITDA (ii) cannot exceed 4.0x | 1.32 |
* BNDES | |||
* Resolution 4131 | |||
Sulgás | * BNDES | Net debt (i) / EBITDA (ii) cannot exceed 3.5x | (0.02) |
Short-term debt / Total debt (iii) cannot exceed 0.8x
| 0.69 | ||
Moove |
|
|
|
MLH | *Syndicated Loan | Net debt (i) / EBITDA (ii) cannot exceed 3.5x at the end of each quarter | 1.13 |
ICSD (x) cannot be less than 2.5x at the end of each quarter | 5.25 | ||
Rumo |
|
|
|
Rumo S.A. | * Debenture (11th, 12th, 13th and 14th) (viii) | ICJ (ix) = EBITDA(ii) / Financial result (v) cannot be less than 2.0x | 3.84 |
* ECA | |||
Rumo S.A. | * NCE | Net debt (i) / EBITDA (ii) cannot exceed 3.5x | 1.81 |
* ECA | |||
Rumo Luxembourg S.à r.l. | * Senior Notes 2028 (vi) | Net debt (i) / EBITDA (ii) cannot exceed 3.5x | 1.81 |
* Senior Notes 2032 (vii) | |||
* Debentures (vii) | |||
Brado | * NCE | Net debt (i) / EBITDA (ii) cannot exceed 3.3x | 1.18 |
| 57 |
Explanatory Notes to the Financial Statement
(In thousands of Reais, except when otherwise indicated)
| (i) | Net debt is composed of current and non-current loans, financing and debentures, obligations with preferred shareholders in subsidiaries (“Gross Debt”), net of cash and cash equivalents, marketable securities and derivative financial instruments on debt. |
| (ii) | Corresponds to the EBITDA accumulated over the previous twelve months. |
| (iii) | Total debt is the sum of current and non-current loans, borrowings and debentures, and current and non-current derivative financial instruments. |
| (iv) | Net debt and EBITDA Proforma, including the equivalent of 50% of the joint venture financial information as determined in the contracts. Net debt and EBITDA Proforma are a non-GAAP measure. EBITDA Proforma corresponds to the accumulated period of the last 12 months. For senior Notes covenants the values of unrestricted subsidies are excluded. |
| (v) | The financial result of net debt is represented by the cost of net debt. |
| (vi) | Senior Notes due 2028 was the first green issuance in the Latin American freight rail sector. The subsidiary Rumo is committed to using the resources to fully or partially finance ongoing and future projects that contribute to the promotion of a resource-efficient, low-carbon transport sector in Brazil. Eligible projects include "acquisition, replacement, and modernization of rolling stock," "Infrastructure for duplication of railway sections, new yards, and yard extensions," and "railway modernization." The subsidiary publishes an annual report detailing the progress of projects, which is available on the investor relations page. |
| (vii) | Senior Notes due 2032 was an issue of Sustainability-Linked Bonds (SLBs), with the following sustainable targets: reduction of 17.6% by 2026 in greenhouse gas emissions per Ton per useful kilometer (“TKU”) with the base date of December 2020 as the starting point. The company is subject to a step-up of 25 basis points from July 2027 if it does not reach this target, which would increase the interest rate to 4.45% per year. |
| (viii) | The 11th, 12th and 13th issues debentures have a contractual leverage ratio limited to 3.0x. However, they have a prior consent (waiver) that allows the broadcaster to extrapolate this index up to the limit of 3.5x until December 31, 2027. |
| (ix) | Interest Coverage Ratio (“ICJ”). |
| (x) | Debt Service Coverage Ratio. |
Explanatory Notes to the Financial Statement
(In thousands of Reais, except when otherwise indicated)
The Company has non-financial covenants controlled for the Debentures in which a Financial Statement is expected to be issued within 90 days, and after 90 days the Company has another 30 days of “cure” period to carry out the issuance and not breach with the obligation towards debenture holders. Therefore, with the issuance of the Financial Statements on April 26, 2024, the Company is within the cure period and has no breach of agreements.
Accounting policy: Cash and cash equivalents consist of cash on hand, demand deposits, and highly liquid investments with maturities of three months or less from the date of acquisition and are subject to an insignificant risk of devaluation. |
| Parent Company |
| Consolidated | ||||
| 12/31/2023 |
| 12/31/2022 |
| 12/31/2023 |
| 12/31/2022 |
Cash and bank accounts | 251 |
| 147 |
| 209,479 |
| 307,819 |
Savings account | 102,400 |
| 184,386 |
| 431,011 |
| 974,198 |
Financial Investments | 1,667,325 |
| 1,163,928 |
| 14,017,991 |
| 12,019,699 |
| 1,769,976 |
| 1,348,461 |
| 14,658,481 |
| 13,301,716 |
Financial investments include the following:
| Parent Company |
| Consolidated | ||||
| 12/31/2023 |
| 12/31/2022 |
| 12/31/2023 |
| 12/31/2022 |
Investment fund |
|
|
|
|
|
|
|
Repurchase Agreements (i) | 1,667,155 |
| 759,965 |
| 3,259,210 |
| 1,181,280 |
Certificate of bank deposits | — |
| — |
| — |
| 123,052 |
Other investments | — |
| — |
| 38,932 |
| — |
| 1,667,155 |
| 759,965 |
| 3,298,142 |
| 1,304,332 |
Bank Investments |
|
|
|
|
|
|
|
Repurchase agreements | — |
| — |
| 616,633 |
| 96,841 |
Certificate of bank deposits - CDB | — |
| 403,823 |
| 9,807,983 |
| 10,396,376 |
Other | 170 |
| 140 |
| 295,233 |
| 222,150 |
| 170 |
| 403,963 |
| 10,719,849 |
| 10,715,367 |
| 1,667,325 |
| 1,163,928 |
| 14,017,991 |
| 12,019,699 |
(i) The repurchase agreements are allocated to the WG Renda Fixa Crédito Privado Fundo de Investimento (“WG”), which was created in the form of an open condominium and is managed by Itaú Unibanco Asset Management Ltda. (“Itaú Asset”). The fund's portfolio is composed of investments in public bonds and repurchase agreements backed by federal public bonds.
The Company's onshore financial investments bear interest at rates approximating 100% of the Brazilian interbank offered rate (Certificado de Depósito Interbancário, or "CDI") as of December 31, 2023, and December 31, 2022. Offshore financial investments are remunerated at rates around 100% of the Fed funds (Federal Reserve System). The sensitivity analysis of interest rate risks is in 5.12.
Explanatory Notes to the Financial Statement
(In thousands of Reais, except when otherwise indicated)
Accounting policy: The valuation and classification of marketable securities are based on their fair value, as determined by the financial result. Securities consist of all equity instruments with readily ascertainable fair values. The fair values of equity instruments are deemed readily determinable if the securities are listed or if a current market value or fair value can be determined even without a direct listing (for example, prices of shares in mutual funds). Restricted cash is measured and classified at amortized cost, with an average maturity of between two and five years for government bonds, but they can be redeemed quickly and are subject to an insignificant risk of change in value. |
| Parent Company |
| Consolidated | ||||
| 12/31/2023 |
| 12/31/2022 |
| 12/31/2023 |
| 12/31/2022 |
Marketable securities |
|
|
|
|
|
|
|
Financial investment in listed entities (i) | — |
| — |
| — |
| 19,586,193 |
Government securities (ii) | 705,777 |
| 724,050 |
| 3,107,813 |
| 2,059,325 |
Certificate of bank deposits (CDB) | — |
| — |
| 300,142 |
| 363,145 |
ESG Funds | — |
| — |
| 96,006 |
| 91,103 |
| 705,777 |
| 724,050 |
| 3,503,961 |
| 22,099,766 |
Current | 705,777 |
| 724,050 |
| 3,407,955 |
| 2,422,470 |
Non-current | — |
| — |
| 96,006 |
| 19,677,296 |
Total | 705,777 |
| 724,050 |
| 3,503,961 |
| 22,099,766 |
| Restricted cash | |||||||
| Securities pledged as collateral | 81,621 | 35,039 | 203,252 | 139,933 | |||
| 81,621 | 35,039 | 203,252 | 139,933 | ||||
| Current | — | — | 7,860 | 8,024 | |||
| Non-current | 81,621 | 35,039 | 195,392 | 131,909 | |||
| Total | 81,621 | 35,039 | 203,252 | 139,933 | |||
| (i) | After obtaining significant influence in Vale S.A, the balances of financial assets were transferred to investments in subsidiaries and associates. See more details in note 1.1. |
| (ii) | The sovereign debt securities declared interest linked to the Special System of Liquidation and Custody, or “SELIC”, with a yield of approximately 100% of the CDI. |
Explanatory Notes to the Financial Statement
(In thousands of Reais, except when otherwise indicated)
Accounting policy: Initial measurement is at fair value, net of transaction costs, and subsequent measurement is at amortized cost. When the obligation specified in the contract is satisfied, canceled, or expires, they are derecognized. The difference between the carrying amount of a financial liability that has been extinguished or transferred to another party and the consideration paid, including any non-monetary assets transferred or liabilities assumed, is recorded as other financial revenue or expense in the income statement. Classified as current liabilities unless there is an unconditional right to defer settlement for at least one year after the date of the balance sheet. Initial measurement of financial guaranteed contracts issued by the Company is at fair value, and if not designated at fair value in the financial result, the financial guarantee contracts are subsequently measured at the higher amount between:
|
a) Composition
|
| Finance Charges |
| Parent Company |
|
|
|
| ||||||
Description |
| Index |
| Annual |
| Currency |
| 12/31/2023 |
| 12/31/2022 |
| Maturity |
| Objective |
No Warranty |
|
|
|
|
|
|
|
|
|
|
|
|
|
|
Debentures |
| CDI + 2.65% |
| 14.61% |
| Real |
| 1,208,141 |
| 1,819,837 |
| Aug-25 |
| Investments |
|
| CDI + 1.65% |
| 13.49% |
| Real |
| 784,475 |
| 787,519 |
| Aug-28 |
| Capital management |
|
| CDI + 1.50% |
| 13.32% |
| Real |
| 406,471 |
| 407,308 |
| May-28 |
| Capital management |
|
| CDI + 1.90% |
| 13.77% |
| Real |
| 1,117,966 |
| 1,120,577 |
| May-32 |
| Capital management |
|
| CDI + 2.00% |
| 13.88% |
| Real |
| 942,010 |
| 946,379 |
| Aug-31 |
| Capital management |
|
| CDI + 2.40% |
| 14.33% |
| Real |
| 1,020,673 |
| — |
| Apr-28 |
| Capital management |
|
| CDI + 2.40% |
| 14.33% |
| Real |
| 998,542 |
| — |
| Jun-28 |
| Capital management |
|
| CDI + 1.80% |
| 13.66% |
| Real |
| 1,260,684 |
| — |
| Jan-31 |
| Capital management |
|
| IPCA + 5.75% |
| 10.43% |
| Real |
| 412,478 |
| 394,008 |
| Aug-31 |
| Capital management |
|
| 8.02% + exchange rate variation (i) |
| 16.04% |
| Dollar |
| 1,451,867 |
| — |
| Sep-29 |
| Capital management |
|
| 7.52% base 360 |
| 7.52% |
| Dollar |
| 2,897,097 |
| — |
| Jun-30 |
| Capital management |
Commercial bank notes |
| CDI + 1.75% |
| 13.60% |
| Real |
| 547,755 |
| — |
| Dec-28 |
| Capital management |
|
| CDI + 1.80% |
| 13.66% |
| Real |
| 448,165 |
| — |
| Jan-31 |
| Capital management |
Total |
|
|
|
|
|
|
| 13,496,324 |
| 5,475,628 |
|
|
|
|
Current |
|
|
|
|
|
|
| 800,987 |
| 802,549 |
|
|
|
|
Non-current |
|
|
|
|
|
|
| 12,695,337 |
| 4,673,079 |
|
|
|
|
| (i) | The operation has an interest rate for the first interest flow of 16.04% per year, while for the other flows it will be 8.02% per year. |
Explanatory Notes to the Financial Statement
(In thousands of Reais, except when otherwise indicated)
|
| Finance Charges |
| Consolidated |
|
|
|
|
|
| ||||||
Description |
| Index |
| Currency |
| Annual |
| 12/31/2023 |
| 12/31/2022 |
| Maturity |
| Objective |
| Segments |
With guarantee |
|
|
|
|
|
|
|
|
|
|
|
|
|
|
|
|
Resolution 4131 |
|
|
|
|
|
|
|
|
|
|
|
|
|
|
|
|
|
| Prefixed |
| Euro |
| — |
| — |
| 868,367 |
| Oct-24 |
| Investments |
| Cosan Corporate |
|
| Prefixed |
| Yen |
| — |
| — |
| 578,708 |
| Oct-24 |
| Investments |
| Cosan Corporate |
|
| Prefixed |
| Euro |
| 3.20% |
| 860,658 |
| 2,009,452 |
| Oct-25 |
| Investments |
| Cosan Corporate |
|
| Prefixed |
| Yen |
| 0.25% |
| 602,487 |
| 1,338,697 |
| Oct-25 |
| Investments |
| Cosan Corporate |
|
| Prefixed |
| Euro |
| 3.40% |
| 1,954,022 |
| 1,966,061 |
| Oct-26 |
| Investments |
| Cosan Corporate |
|
| Prefixed |
| Yen |
| 0.25% |
| 1,135,226 |
| 1,309,330 |
| Oct-26 |
| Investments |
| Cosan Corporate |
|
| Prefixed |
| Euro |
| 3.56% |
| 812,496 |
| 816,172 |
| Oct-27 |
| Investments |
| Cosan Corporate |
|
| Prefixed |
| Yen |
| 0.25% |
| 470,951 |
| 543,160 |
| Oct-27 |
| Investments |
| Cosan Corporate |
BNDES |
| URTJLP |
| Real |
| 8.60% |
| 2,210,390 |
| 2,221,900 |
| Jul-31 |
| Investments |
| Rumo |
|
| Prefixed |
| Real |
| 6.00% |
| 128,494 |
| 280,919 |
| Dec-24 |
| Investments |
| Rumo |
|
| Prefixed |
| Real |
| 3.50% |
| 29 |
| 378 |
| Jan-24 |
| Investments |
| Rumo |
|
| IPCA + 5.74% |
| Real |
| 10.42% |
| 295,058 |
| — |
| Dec-36 |
| Investments |
| Compass |
|
| IPCA + 6.01% |
| Real |
| 10.71% |
| 304,276 |
| — |
| Dec-36 |
| Investments |
| Compass |
|
| 99.98% of the CDI |
| Real |
| 7.82% |
| 1,547,664 |
| 1,653,501 |
| Jun-34 |
| Investments |
| Compass |
|
| IPCA + 4.10% |
| Real |
| 8.71% |
| 112,946 |
| 131,885 |
| Apr-29 |
| Investments |
| Compass |
|
| IPCA + 5.74% |
| Real |
| 10.42% |
| 598,752 |
| 544,925 |
| Dec-36 |
| Investments |
| Compass |
Export credit note |
| CDI + 1.03% |
| Real |
| 15.39% |
| 78,965 |
| 98,003 |
| Feb-26 |
| Investments |
| Rumo |
|
| CDI + 2.25% |
| Real |
| 15.16% |
| 60,774 |
| 62,760 |
| May-26 |
| Investments |
| Rumo |
|
| CDI + 2.20% |
| Real |
| 14.20% |
| 30,252 |
| — |
| Mar-26 |
| Capital management |
| Rumo |
|
| CDI + 2.07% |
| Real |
| 14.85% |
| 52,101 |
| 50,467 |
| Mar-25 |
| Capital management |
| Rumo |
|
| CDI + 0.80% |
| Real |
| - |
| — |
| 355,770 |
| Dec-23 |
| Investments |
| Rumo |
|
| SOFR + 1.30% |
| Dollar |
| 6.65% |
| 487,544 |
| — |
| Jan-25 |
| Investments |
| Rumo |
Bank credit note |
| IPCA |
| Real |
| 5.41% |
| 954,205 |
| 806,028 |
| Jan-48 |
| Investments |
| Rumo |
Debentures |
| CDI + 1.79% |
| Real |
| 13.65% |
| 753,435 |
| 754,785 |
| Jun-27 |
| Investments |
| Rumo |
|
| CDI + 1.30% |
| Real |
| 13.10% |
| 759,390 |
| 759,175 |
| Oct-27 |
| Investments |
| Rumo |
|
| IPCA + 4.77% |
| Real |
| 9.41% |
| 773,556 |
| 632,440 |
| Jun-31 |
| Investments |
| Rumo |
Export Credit Agency (“ECA”) |
| Euribor + 0.58% |
| Euro |
| 4.52% |
| 48,849 |
| 68,455 |
| Sep-26 |
| Investments |
| Rumo |
|
| IPCA + 4.10% |
| Real |
| 10.63% |
| 140,016 |
| 73,717 |
| Jan-30 |
| Investments |
| Compass |
|
|
|
|
|
|
|
| 15,172,536 |
| 17,925,055 |
|
|
|
|
|
|
No Warranty |
|
|
|
|
|
|
|
|
|
|
|
|
|
|
|
|
|
| Prefixed |
| Pound |
| - |
| — |
| 125,707 |
| Dec-23 |
| Investments |
| Moove |
Resolution 4131 |
| Prefixed |
| Dollar |
| 5.50% |
| 31,920 |
| 45,124 |
| Mar-25 |
| Investments |
| Moove |
|
| Prefixed |
| Dollar |
| - |
| — |
| 395,285 |
| May-23 |
| Investments |
| Compass |
|
| Prefixed |
| Dollar |
| 2.13% |
| 943,486 |
| 1,000,957 |
| Feb-25 |
| Investments |
| Compass |
|
| Prefixed |
| Dollar |
| 4.04% |
| 734,191 |
| — |
| May-26 |
| Investments |
| Compass |
|
| Prefixed |
| Dollar |
| 1.36% |
| 362,774 |
| 377,705 |
| Feb-24 |
| Investments |
| Compass |
Perpetual Notes |
| Prefixed |
| Dollar |
| 8.25% |
| 2,451,160 |
| 2,641,732 |
| Nov-40 |
| Acquisition |
| Cosan Corporate |
Senior Notes Due 2027 |
| Prefixed |
| Dollar |
| 7.00% |
| 2,016,330 |
| 3,587,265 |
| Jan-27 |
| Acquisition |
| Cosan Corporate |
Senior Notes Due 2028 |
| Prefixed |
| Dollar |
| 5.25% |
| 2,178,449 |
| 2,196,083 |
| Jan-28 |
| Acquisition |
| Rumo |
Senior Notes Due 2029 |
| Prefixed |
| Dollar |
| 5.50% |
| 3,622,922 |
| 3,953,564 |
| Sep-29 |
| Acquisition |
| Cosan Corporate |
Senior Notes Due 2030 |
| Prefixed |
| Dollar |
| 7.50% |
| 2,642,023 |
| — |
| Jun-30 |
| Capital management |
| Cosan Corporate |
Senior Notes Due 2032 |
| Prefixed |
| Dollar |
| 4.20% |
| 2,066,885 |
| 2,124,051 |
| Jan-32 |
| Acquisition |
| Rumo |
Prepayment |
| 3M Libor + 1.00% |
| Dollar |
| - |
| — |
| 104,667 |
| Oct-23 |
| Capital management |
| Moove |
|
| 1.27% |
| Dollar |
| - |
| — |
| 151,871 |
| Jul-23 |
| Capital management |
| Moove |
Explanatory Notes to the Financial Statement
(In thousands of Reais, except when otherwise indicated)
|
| Finance Charges |
| Consolidated |
|
|
|
|
|
| ||||||
Description |
| Index |
| Currency |
| Annual |
| 12/31/2023 |
| 12/31/2022 |
| Maturity |
| Objective |
| Segments |
Debentures |
| IPCA + 4.68% |
| Real |
| 9.32% |
| 396,201 |
| 518,680 |
| Feb-26 |
| Investments |
| Rumo |
|
| IPCA + 4.50% |
| Real |
| 9.13% |
| 1,596,910 |
| 1,523,382 |
| Jun-31 |
| Investments |
| Rumo |
|
| IPCA + 3.60% |
| Real |
| 8.19% |
| 413,881 |
| 367,476 |
| Dec-30 |
| Capital management |
| Rumo |
|
| CDI + 2.65% |
| Real |
| 14.61% |
| 1,208,141 |
| 1,819,837 |
| Aug-25 |
| Investments |
| Cosan Corporate |
|
| IPCA + 6.80% |
| Real |
| 11.53% |
| 1,004,762 |
| 893,852 |
| Apr-30 |
| Investments |
| Rumo |
|
| IPCA + 3.90% |
| Real |
| 8.50% |
| 1,113,820 |
| 1,048,252 |
| Oct-29 |
| Investments |
| Rumo |
|
| IPCA + 5.73% |
| Real |
| 10.41% |
| 551,709 |
| 537,261 |
| Oct-33 |
| Investments |
| Rumo |
|
| IPCA + 4.00% |
| Real |
| 8.61% |
| 1,077,141 |
| 941,203 |
| Dec-35 |
| Investments |
| Rumo |
|
| IPCA + 4.54% |
| Real |
| 9.17% |
| 254,232 |
| 80,987 |
| Jun-36 |
| Investments |
| Rumo |
|
| IPCA + 5.99% |
| Real |
| 10.69% |
| 470,177 |
| 435,780 |
| Jun-32 |
| Investments |
| Rumo |
|
| IPCA + 5.76% |
| Real |
| 10.45% |
| 753,439 |
| — |
| Aug-29 |
| Investments |
| Rumo |
|
| IPCA + 6.18% |
| Real |
| 10.88% |
| 749,252 |
| — |
| May-33 |
| Investments |
| Rumo |
|
| IPCA + 5.87% |
| Real |
| - |
| — |
| 907,366 |
| Dec-23 |
| Investments |
| Compass |
|
| IPCA + 4.33% |
| Real |
| 8.95% |
| 554,147 |
| 523,837 |
| Oct-24 |
| Investments |
| Compass |
|
| IGPM + 6.10% |
| Real |
| 6.10% |
| 359,639 |
| 372,171 |
| May-28 |
| Investments |
| Compass |
|
| CDI + 1.90% |
| Real |
| 13.77% |
| 1,117,966 |
| 1,120,577 |
| May-32 |
| Investments |
| Cosan Corporate |
|
| CDI + 1.50% |
| Real |
| 13.32% |
| 406,471 |
| 407,308 |
| May-28 |
| Investments |
| Cosan Corporate |
|
| CDI + 1.95% |
| Real |
| 13.83% |
| 735,565 |
| 824,866 |
| Aug-24 |
| Investments |
| Compass |
|
| CDI + 1.45% |
| Real |
| 13.27% |
| 399,457 |
| 399,616 |
| Dec-26 |
| Investments |
| Compass |
|
| CDI + 1.55% |
| Real |
| 13.38% |
| 1,764,022 |
| — |
| Nov-30 |
| Investments |
| Compass |
|
| 109.20% of the CDI |
| Real |
| 9.78% |
| 550,342 |
| 491,153 |
| Aug-31 |
| Investments |
| Compass |
|
| IPCA + 7.36% |
| Real |
| 12.12% |
| 80,960 |
| 114,014 |
| Dec-25 |
| Investments |
| Compass |
|
| IPCA + 5.22% |
| Real |
| 9.88% |
| 533,854 |
| 467,841 |
| Aug-36 |
| Investments |
| Compass |
|
| CDI + 1.65% |
| Real |
| 13.49% |
| 784,475 |
| 787,519 |
| Aug-28 |
| Capital management |
| Cosan Corporate |
|
| CDI + 2.40% |
| Real |
| 14.33% |
| 1,020,673 |
| — |
| Apr-28 |
| Capital management |
| Cosan Corporate |
|
| CDI + 2.40% |
| Real |
| 14.33% |
| 998,542 |
| — |
| Jun-28 |
| Capital management |
| Cosan Corporate |
|
| CDI + 2.00% |
| Real |
| 13.88% |
| 942,011 |
| 946,379 |
| Aug-31 |
| Capital management |
| Cosan Corporate |
|
| CDI + 1.80% |
| Real |
| 13.66% |
| 1,260,684 |
| — |
| Jan-31 |
| Capital management |
| Cosan Corporate |
|
| IPCA + 5.75% |
| Real |
| 10.43% |
| 412,478 |
| 394,008 |
| Aug-31 |
| Capital management |
| Cosan Corporate |
Capital Management |
| CDI + 1.60% |
| Real |
| - |
| — |
| 100,170 |
| Jun-23 |
| Capital management |
| Moove |
|
| SOFR + 1.50% |
| Dollar |
| 1.50% |
| 2,175,107 |
| 2,334,615 |
| May-27 |
| Acquisition |
| Moove |
Commercial bank notes |
| CDI + 1.75% |
| Real |
| 13.60% |
| 547,755 |
| — |
| Dec-28 |
| Capital management |
| Cosan Corporate |
|
| CDI + 1.80% |
| Real |
| 13.66% |
| 448,165 |
| — |
| Jan-31 |
| Capital management |
| Cosan Corporate |
|
|
|
|
|
|
|
| 41,732,118 |
| 35,062,161 |
|
|
|
|
|
|
Total |
|
|
|
|
|
|
| 56,904,654 |
| 52,987,216 |
|
|
|
|
|
|
Current |
|
|
|
|
|
|
| 4,882,398 |
| 4,542,205 |
|
|
|
|
|
|
Non-current |
|
|
|
|
|
|
| 52,022,256 |
| 48,445,011 |
|
|
|
|
|
|
Explanatory Notes to the Financial Statement
(In thousands of Reais, except when otherwise indicated)
For debts linked to derivatives, the effective rates are shown in the explanatory note 5.6.
To calculate the average rates, on an annual basis, the average annual CDI rate of 11.65% per year was considered. (13.65% per year. As at December 31, 2022) and TJLP of 6.55% per year. (7.20% per year as at December 31, 2022).
All debts with maturity dates denominate in foreign currency are hedged against foreign exchange risk through derivatives (note 5.6), except for perpetual notes.
Loans, borrowings and debentures that are classified as non-current have the following maturities:
| Parent Company |
| Consolidated | ||||
| 12/31/2023 |
| 12/31/2022 |
| 12/31/2023 |
| 12/31/2022 |
1 to 2 years | 569,067 |
| 571,971 |
| 4,800,498 |
| 4,534,638 |
2 to 3 years | — |
| 571,564 |
| 6,255,752 |
| 6,663,907 |
3 to 4 years | 360,698 |
| — |
| 6,626,698 |
| 5,631,841 |
4 to 5 years | 3,319,442 |
| 372,687 |
| 7,554,468 |
| 8,550,932 |
5 to 6 years | 3,327,245 |
| 772,925 |
| 8,143,128 |
| 4,836,087 |
6 to 7 years | 3,101,714 |
| 428,001 |
| 6,777,099 |
| 6,527,516 |
7 to 8 years | 1,650,648 |
| 794,668 |
| 2,599,593 |
| 2,180,672 |
Over 8 years | 366,523 |
| 1,161,263 |
| 9,265,020 |
| 9,519,418 |
| 12,695,337 |
| 4,673,079 |
| 52,022,256 |
| 48,445,011 |
b) Movement
| Parent Company |
| Consolidated |
At January 1, 2022 | 8,164,256 |
| 45,659,037 |
Business combination | — |
| 12,825 |
Funding | 9,450,210 |
| 23,886,960 |
Amortization of principal | — |
| (15,278,378) |
Interest payment | (830,380) |
| (3,441,978) |
Transfer | (12,196,109) |
| — |
Interest, foreign exchange variation and fair value | 887,651 |
| 2,148,750 |
Balance as of December 31, 2022 | 5,475,628 |
| 52,987,216 |
Funding | 8,636,528 |
| 12,785,628 |
Amortization of principal | (579,942) |
| (8,054,763) |
Interest payment | (973,919) |
| (3,552,292) |
Payment of interest on work in progress | — |
| (288,569) |
Interest, foreign exchange variation and fair value | 938,029 |
| 3,027,434 |
Balance as of December 31, 2023 | 13,496,324 |
| 56,904,654 |
Explanatory Notes to the Financial Statement
(In thousands of Reais, except when otherwise indicated)
c) Guarantees
The subsidiary Rumo has entered into financing contracts with development banks, intended for investments with a bank guarantee, according to each contract, with an average cost of 0.70% per year or by real guarantees (assets) and escrow account. As of December 31, 2023, the balance of bank guarantees contracted was R$3,120,034 (R$3,037,453 as of December 31, 2022).
The subsidiary CLI has a bank guarantee for a loan from Cosan Lubrificantes S.R.L. (“Moove Argentina”), with an average annual cost of 0.18%, and guarantee with top-tier banks for payment to third parties, with an average annual cost of 3.90%. As at December 31, 2023, the balance of contracted guarantees was R$31,931 (R$ 44,813 as at December 31, 2022).
The subsidiary Cosan Oito has loans in foreign currency (Resolution 4,131) with top banking institutions, which are guaranteed by 100% of the Vale shares that are in the Collar structure.
d) Available credit line
As of December 31, 2023, the Company had credit lines with banks rated AA, which were not used, in the amount of R$2,102,756 (R$3,052,287 as of December 31, 2022). The use of these lines of credit is subject to certain contractual conditions.
e) Offset of assets and liabilities
INTERNALIZATION OF SENIOR NOTES 2030
In June 2023, the Company, through its subsidiary Cosan Luxembourg S.A. (“Cosan Lux”), carried out an offering of senior notes in the amount of US$550,000 thousand with a coupon of 7.50% and maturing in 2030 (“Senior Notes 2030”).
On September 29, 2023, the Company internalized the remaining resources arising from this debt, through the issuance of debentures by Cosan S.A., referenced in US dollars in the amount of R$ 1,491 million (equivalent to US$ 300,000 thousand), with coupon annual rate of 16.04% per year for first interest payment and 8.02% per year for the others. In return, Cosan Luxembourg contracted a Total Return Swap (“TRS”) with the same amount and counterparty in US dollars, with semi-annual payment frequency and annual remuneration of 15.52% per year for the first interest remuneration and 7.50% per year for the others, which has the 7th issue of the debenture as the underlying asset.
INTERNALIZATION OF SENIOR NOTES 2029
In July 2019, Cosan Limited ("Cosan Limited") held a senior Notes offer for a total volume of US$750,000, equivalent to R$4,147,650, with a coupon of 5.5% and expiry date 2029 ("Bond 2029").
The Company carried out the reverse incorporation of Cosan Limited, approved in January 2021, being certain that the Company succeeded Cosan Limited in all rights and obligations arising, as amended in the First Supplemental Indenture, dated February 2021.
Subsequently, the Company ceded its rights and obligations to Cosan Luxembourg ("Cosan Lux") pursuant to the Second Supplemental Indenture, dated May 2022, in conjunction with the Third Supplemental Indenture, dated July 2022. In the assignment of rights, the Company and Cosan Lux signed a mutual contract (July 2022), with the commitment of payment by the Company in the amount of interest and principal, exactly equal to Bond 2029. Two additions were made, where the Company prepaid US$30,000, equivalent to R$164,250, and US$121,313, equivalent to R$641,090, made in July and August 2022, respectively. The balance of the main contract was US$ 598,687 thousand, equivalent to R$ 2,919,557.
In this structure that was in place, Cosan remitted interest to Cosan Lux, which was subject to the Withholding Income Tax ("IRRF"). Given this scenario, the Company evaluated alternatives for an Internalization of senior Notes debt and in December 2023 carried out the Hospitalization operation with Banco Santander acquiring a position in a Total Return Swap ("TRS") with Banco Santander (Brazil) S.A. Grand Cayman Branch ("Santander Cayman"), which will have as underlying asset foreign exchange debentures, referenced in USD, issued by the Company, in the amount of US$598,000, equivalent to R$2,919,557, pursuant to CVM Resolution 160 ("Debentures") which were fully subscribed by Banco Santander (Brazil) S.A. ("Santander"), and with this the total liquidation of the intercompany was carried out, remitting the recourse to Cosan Lux, and acquiring the position of TRS.
Since the Company has the legally enforceable right to offset the amounts and have the intention to settle them simultaneously, for consolidation purposes, the Company made the compensation in the balance sheet of the asset related to the contracting of TRS with the debt liability arising from the debentures, presenting them at net value, and their respective impacts on the income statement. In this way, sensitivity analysis is also not performed because both transactions have no risk to the Company.
Explanatory Notes to the Financial Statement
(In thousands of Reais, except when otherwise indicated)
| Consolidated | ||||
| Gross value |
| Compensated amount |
| Net value |
TRS (Notional) | 4,347,487 |
| (4,347,487) |
| — |
TRS (Interest) | 6,704 |
| (6,704) |
| — |
| 4,354,191 |
| (4,354,191) |
| — |
|
|
|
|
|
|
Debentures principal and exchange rate variation) (i) | (4,347,487) |
| 4,347,487 |
| — |
Debentures (interest) | (6,704) |
| 6,704 |
| — |
| (4,354,191) |
| 4,354,191 |
| — |
| (i) | The amounts are equivalent to US$898,000 thousand, with the PTAX conversion rate of September 29,2023 being R$4.8413. |
f) Fair value and exposure to financial risk
The fair value of loans is determined by discounting future cash flows at their implied discount rate. Due to the use of unobservable inputs, including own credit risk, they are classified as fair value at level 2 of the hierarchy (Note 5.12).
Details of the Company's exposure to risks arising from loans are shown in Note 5.12.
Explanatory Notes to the Financial Statement
(In thousands of Reais, except when otherwise indicated)
Accounting policy: Upon inception or modification of a contract, the Company assesses whether the contract is or contains a lease. The lease liability is initially measured at the present value of the lease payments that are not made on the commencement date, discounted at the interest rate implicit in the lease or, if that rate cannot be determined easily, at the Company's incremental borrowing rate. The Company's incremental borrowing rate is generally used as the discount rate. The lease payments included in calculating the lease liability are as follows:
To calculate the incremental borrowing rate, the Company:
The incremental (nominal) interest rate used by the Company and its subsidiaries was determined based on interest rates, adjusted for functional currency and the terms of its contracts. Rates between 8.23% and 13.73% were used, according to the term and currency of each contract. In addition, for the measurement of the lease liability, the Company may account for two or more contracts together provided that:
Variable lease payments that do not depend on an index or rate are recognized as expenses in the period in which the event or condition that generates these payments occurs. The Company is exposed to potential future increases in variable lease payments based on an index or rate, which are not included in the lease liability until they come into effect. When adjustments to lease payments based on an index or rate come into effect, the lease liability is revalued and adjusted against the right of use asset. Lease payments are allocated between the principal and the financial cost. The financial cost is debited to profit over the lease period to produce a constant periodic interest rate on the remaining balance of the liability in each period. Payments associated with short-term leases of equipment and vehicles and all leases of low value assets are recognized by the linear method as an expense in the result. Short-term leases are leases with a lease term of 12 months or less. Low-value assets comprise IT equipment and small items of office furniture. In determining the term of the lease, the Company considers all facts and circumstances that create an economic incentive to exercise the option of extension, or not to exercise the option of termination. Extension options (or periods after termination options) are only included in the lease term if there is reasonable certainty that it will be extended (or not terminated). |
Explanatory Notes to the Financial Statement
(In thousands of Reais, except when otherwise indicated)
For warehouse rentals, retail stores and equipment, the following factors are usually the most relevant:
Most of the extension options in offices and car rentals were not included in the rental liability because the Company could replace the assets without significant cost or business interruption. The subsequent valuation of the lease liability is at amortized cost, using the effective interest rate method. It is revalued when there is a change in future lease payments resulting from a change in index or rate, if there is a change in the amounts expected to be paid according to the residual value guarantee, if the Company changes its valuation, one the option will be exercised in the purchase, extension or termination or if there is an essentially fixed revised lease payment. |
| Parent Company |
| Consolidated |
At January 1, 2022 | 40,047 |
| 3,267,678 |
Business combination | — |
| 174,229 |
Additions | 542 |
| 224,714 |
Write-offs | (7,769) |
| (116,157) |
Settlement interest and foreign exchange variation | 3,437 |
| 377,449 |
Repayment of principal | (5,051) |
| (400,248) |
Payment of interest | (3,933) |
| (211,611) |
Contractual adjustment | 3,092 |
| 221,077 |
Transfers between liabilities | — |
| (4,973) |
At December 31, 2022 | 30,365 |
| 3,532,158 |
Additions (i) | — |
| 1,923,138 |
Write-offs | — |
| (15,329) |
Settlement interest and foreign exchange variation | 7,566 |
| 458,507 |
Repayment of principal | (5,524) |
| (490,012) |
Payment of interest | (3,615) |
| (236,948) |
Contractual adjustment | 751 |
| 104,280 |
At December 31, 2023 | 29,543 |
| 5,275,794 |
Current | 8,959 |
| 733,063 |
Non-current | 20,584 |
| 4,542,731 |
| 29,543 |
| 5,275,794 |
| (i) | The addition of the period is mainly composed of the contract related to the charter of the floating storage and regasification unit (“FRSU”) see note 2. |
Explanatory Notes to the Financial Statement
(In thousands of Reais, except when otherwise indicated)
The lease agreements have different terms, with the last due date occurring in December 2058. The amounts are updated annually by inflation indexes (such as IGPM and IPCA) or may incur interest calculated based on the TJLP or CDI and some of the contracts have renewal or purchase options that were considered in determining the term and classification as finance lease.
In addition to the amortization and appropriation of interest and exchange variation highlighted in the previous tables, the following impacts on income were recorded for the other lease contracts that were not included in the measurement of lease liabilities.
| 12/31/2023 |
| 12/31/2022 |
Variable lease payments not included in the recognition of lease obligations | 43,115 |
| 56,612 |
Expenses related to short-term leases | 37,739 |
| 14,986 |
Low asset leasing costs, excluding short-term leases | 5,376 |
| 1,445 |
| 86,230 |
| 73,043 |
The lease balances recorded by the Company include the contract for the indirect subsidiary Rumo Malha Central and the amendment to renew the contract for the indirect subsidiary Rumo Malha Paulista, which have an identified implicit rate and are, therefore, readily determinable in such cases. In other words, in these cases the valuation does not generate the distortions in the liabilities and right of use object of CVM Circular Letter 2/2019. This particularity of the Company means that the effects on the balances (of lease liabilities, right of use, financial expenses and depreciation expenses) if the measurement were made by the present value of the expected installments plus projected future inflation, would not are relevant to influence users' decisions and, consequently, to be presented in the financial statements.
The Company recorded lease liabilities at the present value of the installments due, that is, including any tax credits to which it will be entitled at the time of payment of the leases. The potential PIS/COFINS credit included in liabilities as at December 31, 2023, is R$32,244 (R$6,318 as at December 31, 2022).
Accounting policy: Initial recognition of derivatives at fair value occurs on the date a derivative contract is entered into, and derivatives are subsequently remeasured at fair value at the end of each reporting period. Whether subsequent changes in fair value are recorded depends on whether the derivative is designated as a hedging instrument and, if so, the nature of the item being hedged. The Company identifies certain derivatives as:
At the inception of the hedging relationship, the Company documents the economic relationship between the hedging instruments and the hedged items, including expected changes in the cash flows of the hedging instruments. The Company documents its risk management objective and strategy for hedging transactions. Changes in the fair value of any derivative instrument that do not qualify for hedge accounting are immediately registered in the income statement and included in other financial revenue (expenses). The fair values of derivative financial instruments designated in hedging relationships are disclosed below. The total fair value of a hedging derivative is classified as a non-current asset or liability when the remaining maturity of the hedged item is greater than 12 months; it is classified as a current asset or liability when the remaining maturity of the hedged item is less than 12 months. The Company evaluates, both at the beginning of the hedging relationship and on an ongoing basis, whether the hedging instruments are anticipated to be highly effective in offsetting changes in the fair value or cash flows of the respective attributable hedged items. The actual results of each hedge for the hedged risk fall between 60% and 140%. The Company maintains a portfolio of energy contracts (purchase and sale) designed to meet supply and demand for energy consumption or supply. In addition, there is a portfolio of forward positions comprising contracts. There is no purchase commitment associated with this portfolio's sales contract. |
Explanatory Notes to the Financial Statement
(In thousands of Reais, except when otherwise indicated)
Considering its policies and risk limits, the Company has the flexibility to manage the contracts in this portfolio in order to profit from changes in market prices. This portfolio contains contracts that may be settled net in cash or another financial instrument (for example: by entering an offsetting contract with the counterparty; or by "unwinding a position" from the contract prior to its exercise or expiration; or shortly after purchase, selling for the purpose of generating a profit from short-term fluctuations in price or gain on resale margin). These energy purchase and sale transactions occur on an active market and qualify as financial instruments because they are settled at net cash value and are easily convertible to cash. These contracts are treated as derivatives and are recognized in the balance sheet at fair value on the date the derivative is entered into and remeasured at fair value on the balance sheet date. Financial assets and liabilities are offset, and the net amount is reported in the balance sheet, when there is a legal right to offset the recognized amounts and intent to settle them on a net basis, or when the asset is realized and the liability is settled simultaneously. The legal right must be enforceable in the ordinary course of business and in the event of default, insolvency, or bankruptcy of the company or the counterparty. The estimated fair value of these derivatives is based in part on price quotations published in active markets, to the extent that such observable market data exists, and in part on valuation techniques that consider: (i) prices established in recent purchase and sale transactions, (ii) margin of risk in the supply, and (iii) projected market price in the availability period. A fair value gain or loss is recognized at the base date whenever the fair value at initial recognition for these contracts differs from the transaction price. A financial asset previously accounted for in accordance with IFRS 9/CPC 48 may become an investee accounted for by equity when: • the investor acquires an additional stake; or • There is a change in circumstances that results in obtaining significant influence or joint control. |
The Company uses swap instruments, whose fair value is determined from discounted cash flows discounted cash flows based on market curves, to hedge the exposure to foreign exchange risk and exposure to foreign exchange risk and interest and inflation risk. The consolidated data are presented below:
Explanatory Notes to the Financial Statement
(In thousands of Reais, except when otherwise indicated)
| Parent Company |
| Consolidated | ||||||||||||
| Notional |
| Fair value |
| Notional |
| Fair value | ||||||||
| 12/31/2023 |
| 12/31/2022 |
| 12/31/2023 |
| 12/31/2022 |
| 12/31/2023 |
| 12/31/2022 |
| 12/31/2023 |
| 12/31/2022 |
Exchange rate derivatives |
|
|
|
|
|
|
|
|
|
|
|
|
|
|
|
Forward agreements (i) | — |
| — |
| — |
| — |
| 6,716 |
| 53,012 |
| (147) |
| (485) |
FX option agreements | — |
| — |
| — |
| — |
| 363,098 |
| 676,214 |
| 30,677 |
| 25,360 |
| — |
| — |
| — |
| — |
| 369,814 |
| 729,226 |
| 30,530 |
| 24,875 |
Commodity derivatives |
|
|
|
|
|
|
|
|
|
|
|
|
|
|
|
Contracts for gas options | — |
| — |
| — |
| — |
| 28,494 |
| — |
| 4,333 |
| — |
Option agreements (ii) | — |
| — |
| — |
| — |
| — |
| — |
| — |
| 21,744 |
| — |
| — |
| — |
| — |
| 28,494 |
| — |
| 4,333 |
| 21,744 |
Interest rate and exchange rate risk |
|
|
|
|
|
|
|
|
|
|
|
|
|
|
|
Swap agreements (interest rate) (iii) | 7,038,443 |
| 9,255,278 |
| (9,945) |
| (195,017) |
| 7,209,400 |
| 9,255,278 |
| (10,686) |
| (155,518) |
Swap agreements (interest and FX) (iv) | 10,434,580 |
| 7,318,840 |
| (562,802) |
| 901,749 |
| 18,260,969 |
| 17,191,070 |
| (1,546,736) |
| 790,840 |
Forward agreements (interest and FX) (v) | 126,472 |
| — |
| (3,720) |
| — |
| 8,985,594 |
| 12,811,427 |
| (939,559) |
| 760,152 |
Swap agreements (interest and inflation) (iii) | — |
| — |
| — |
| — |
| 14,307,844 |
| 10,070,343 |
| 853,639 |
| (500,444) |
| 17,599,495 |
| 16,574,118 |
| (576,467) |
| 706,732 |
| 48,763,807 |
| 49,328,118 |
| (1,643,342) |
| 895,030 |
Share price risk |
|
|
|
|
|
|
|
|
|
|
|
|
|
|
|
Swap agreements - (TRS) (vi) | 1,775,341 |
| 1,515,827 |
| 88,298 |
| 43,130 |
| 1,775,341 |
| 1,515,827 |
| 88,297 |
| 43,130 |
Call Spread (v) | — |
| — |
| — |
| — |
| 5,594,212 |
| 5,594,212 |
| 366,296 |
| 1,954,493 |
Collar (Vale Shares) (v) | — |
| — |
| — |
| — |
| 13,114,720 |
| 16,931,662 |
| 285,540 |
| (4,078,452) |
| 1,775,341 |
| 1,515,827 |
| 88,298 |
| 43,130 |
| 20,484,273 |
| 24,041,701 |
| 740,133 |
| (2,080,829) |
Total financial instruments |
| (488,169) |
| 749,862 |
|
|
|
|
| (868,346) |
| (1,139,180) | |||
Current assets |
|
|
|
| 54,935 |
| — |
|
|
|
|
| 202,399 |
| 1,086,698 |
Non-current assets |
|
|
|
| 102,881 |
| 1,368,809 |
|
|
|
|
| 2,344,400 |
| 3,065,054 |
Current liabilities |
|
|
|
| (364,747) |
| — |
|
|
|
|
| (1,250,520) |
| (1,039,357) |
Non-current liabilities |
|
|
|
| (281,238) |
| (618,947) |
|
|
|
|
| (2,164,625) |
| (4,251,575) |
Total |
|
|
|
| (488,169) |
| 749,862 |
|
|
|
|
| (868,346) |
| (1,139,180) |
| (i) | To hedge exposures and expenses in foreign currency, the Company and its subsidiaries have foreign exchange forward agreements and/or options indexed to foreign exchange. | |
| (ii) | Call options on Brent for hedging purposes, intended to provide protection in the event that the commodity's price rises above the agreed-upon price due to the Ukraine-Russia war. | |
| (iii) | The Company structured derivatives to protect against exposure to pre-fixed interest in Reais in order to convert such debt into post-fixed debt. | |
| (iv) | The Company and its subsidiary Rumo conduct interest and foreign exchange swap operations, making the Company active in U.S. Dollar + fixed interest and passive in a portion of the CDI. In interest and inflation Swap operations, the Company is active in Extended National Consumer Price Index (Índice Nacional de Preços ao Consumidor Amplo) ("IPCA") + fixed interest and passive in CDI percentage. | |
| (v) | The Company structured derivatives, as described in Note 1.1, to protect against price fluctuations in Vale's shares. | |
| (vi) | The Company entered into a Total Return Swap ("TRS") agreement with commercial banks. According to the TRS, which will have a financial settlement, Cosan will receive the return on the price variation of CSAN3 shares, adjusted for dividends for the period, and will pay annual interest referenced to CDI + Spread. The contracted equivalent quantity of CSAN3 shares with TRS was 97,215,812 shares, and the initial total was R$1,265,790. The Company's mark-to-market result for financial revenue as at December 31, 2023 was R$83,390 (a financial revenue of R$375,693 as at December 31, 2022). |
Explanatory Notes to the Financial Statement
(In thousands of Reais, except when otherwise indicated)
Below, we demonstrate the opening value of derivative debt and non-debt derivative financial instruments:
|
|
| Parent company |
| Consolidated | ||||
| Note |
| 12/31/2023 |
| 12/31/2022 |
| 12/31/2023 |
| 12/31/2022 |
Derivative financial instruments | 5.12 |
| (576,467) |
| 706,733 |
| (990,764) |
| (1,228,928) |
Non-derivative financial instruments |
|
| 88,298 |
| 43,129 |
| 122,418 |
| 89,748 |
|
|
| (488,169) |
| 749,862 |
| (868,346) |
| (1,139,180) |
Derivatives are only used for economic hedging purposes and not as speculative investments.
a) Fair value hedge
The Company adopts fair value hedge accounting for some of its operations, both the hedging instruments and the hedged items are measured and recognized at fair value through profit or loss.
There is an economic relationship between the hedged item and the hedging instrument as the terms of the interest rate and exchange rate swap correspond to the terms of the fixed rate loan, i.e. notional amount, term and payment. The Company established a 1:1 coverage ratio for the hedging relationships, as the underlying risk of the interest rate and exchange rate swap is identical to the hedged risk component. To test the effectiveness of the hedge, the Company uses the discounted cash flow method and compares changes in the fair value of the hedging instrument with changes in the fair value of the hedged item attributable to the hedged risk. The sources of hedge ineffectiveness that are expected to affect the hedging relationship during its term evaluated by the Company are mainly: (i) reduction or modification of the hedged item; and (ii) a change in the credit risk of the Company or the counterparty of the contracted swaps. The amounts related to the items designated as hedging instruments were as follows:
|
|
| Registered value |
| Accumulated fair value adjustment | ||||
| Notional |
| 12/31/2023 |
| 12/31/2022 |
| 12/31/2023 |
| 12/31/2022 |
FX rate risk hedge |
|
|
|
|
|
|
|
|
|
Designated items |
|
|
|
|
|
|
|
|
|
Senior notes 2028 (Rumo Luxembourg) | (2,791,600) |
| (2,178,449) |
| (2,196,083) |
| 167,874 |
| (336,161) |
Senior notes 2032 (Rumo Luxembourg) | (2,259,375) |
| (2,066,885) |
| (2,124,051) |
| 126,408 |
| (629,220) |
NCE USD (Rumo Malha Norte) | (483,400) |
| (487,544) |
| — |
| 3,147 |
| — |
PPE 1 – (Export prepayment) 1 (Moove) | — |
| — |
| (156,884) |
| — |
| 2,389 |
PPE 2 – (Export prepayment) 2 (Moove) | — |
| — |
| (104,667) |
| — |
| 2,624 |
Total debt | (5,534,375) |
| (4,732,878) |
| (4,581,685) |
| 297,429 |
| (960,368) |
Derivative financial instruments |
|
|
|
|
|
|
|
|
|
Swaps Senior Notes 2028 (Rumo Luxembourg) | 2,791,600 |
| (460,939) |
| (418,674) |
| 42,265 |
| 685,200 |
Swaps Senior Notes 2032 (Rumo Luxembourg) | 2,259,375 |
| (239,630) |
| (128,986) |
| 110,644 |
| 804,558 |
Swap exchange rate and interest (Rumo Malha Norte) | 483,400 |
| 5,293 |
| — |
| (5,293) |
| — |
SWAP - Export prepayment - PPE 1 (Moove) | — |
| — |
| (11,079) |
| — |
| (11,079) |
SWAP - Export prepayment - PPE 2 (Moove) | — |
| — |
| (7,067) |
| — |
| (7,067) |
Total derivatives | 5,534,375 |
| (695,276) |
| (565,806) |
| 147,616 |
| 1,471,612 |
Total | — |
| (5,428,154) |
| (5,147,491) |
| 445,045 |
| 511,244 |
Explanatory Notes to the Financial Statement
(In thousands of Reais, except when otherwise indicated)
|
| Registered value |
| Accumulated fair value adjustment | |||||
| Notional |
| 12/31/2023 |
| 12/31/2022 |
| 12/31/2023 |
| 12/31/2022 |
Interest rate risk hedge |
|
|
|
|
|
|
|
|
|
Designated items |
|
|
|
|
|
|
|
|
|
Debenture 5th issue - single series (Comgás) | — |
| — |
| (907,366) |
| — |
| (33,892) |
BNDES Project VIII (Comgás) | (1,000,000) |
| (803,990) |
| (851,689) |
| 54,807 |
| 70,260 |
Debenture (Rumo) | (7,485,276) |
| (7,973,671) |
| (5,755,679) |
| 397,073 |
| (327,290) |
Finem (Rumo) | (28,107) |
| (36,301) |
| (28,115) |
| 971 |
| (1,644) |
CCB (Rumo) | (975,292) |
| (954,205) |
| (785,366) |
| (10,088) |
| (4,418) |
Total debt | (9,488,675) |
| (9,768,167) |
| (8,328,215) |
| 442,763 |
| (296,984) |
Derivative financial instruments |
|
|
|
|
|
|
|
|
|
Debenture 5th issue - single series (Comgás) | — |
| — |
| 221,000 |
| (221,000) |
| 1,248 |
BNDES Project VIII (Comgás) | 1,000,000 |
| (56,085) |
| (90,193) |
| 34,108 |
| (61,242) |
Swaps Debenture (Rumo) | 7,485,276 |
| 559,964 |
| (148,662) |
| (708,626) |
| 72,856 |
Finem (Rumo) | 28,107 |
| 1,600 |
| (558) |
| (2,158) |
| 558 |
CCB (Rumo) | 975,292 |
| (15,221) |
| (6,976) |
| 8,245 |
| 6,976 |
Derivative total | 9,488,675 |
| 490,258 |
| (25,389) |
| (889,431) |
| 20,396 |
Total | — |
| (9,277,909) |
| (8,353,604) |
| (446,668) |
| (276,588) |
b) Fair value options
Certain derivative instruments were not designated to documented hedging structures.
The Company chose to designate the hedged liabilities (hedge objects) to be recorded at fair value through profit or loss. Considering that derivative instruments are always accounted for at fair value through profit or loss, the accounting effects are the same as those that would be obtained through hedging documentation:
|
|
|
|
| Registered Value |
| Accumulated fair value | ||||
|
|
| Notional |
| 12/31/2023 |
| 12/31/2022 |
| 12/31/2023 |
| 12/31/2022 |
FX rate risk |
|
|
|
|
|
|
|
|
|
|
|
Items |
|
|
|
|
|
|
|
|
|
|
|
Senior Notes 2027 (Cosan Luxembourg) | USD+7.0% |
| (1,897,790) |
| (1,928,934) |
| (3,587,265) |
| 616,251 |
| 967,778 |
Export Credit Agreement (Rumo) | EUR + 0.58% |
| (38,054) |
| (48,849) |
| (68,455) |
| (1,444) |
| 377 |
Resolution 4131 (Rumo) | USD + 2.20% |
| — |
| — |
| — |
| — |
| 247 |
Resolution 4131 (Comgás - 2021) | USD + 1.60% |
| (407,250) |
| (362,774) |
| (377,705) |
| 2,106 |
| 15,545 |
Resolution 4131 (Comgás - 2022) | USD + 2.51% |
| (1,097,400) |
| (943,486) |
| (1,000,957) |
| 33,324 |
| 51,798 |
Resolution 4131 (Comgás - 2022) | USD + 4.76% |
| (749,310) |
| (734,191) |
| — |
| (5,468) |
| — |
Resolution 4131 (Comgás - 2018) | USD + 4.32% |
| — |
| — |
| (395,285) |
| — |
| (2,680) |
Total |
|
| (4,189,804) |
| (4,018,234) |
| (5,429,667) |
| 644,769 |
| 1,033,065 |
|
|
|
|
|
|
|
|
|
|
|
|
Derivative instruments |
|
|
|
|
|
|
|
|
|
|
|
Swap Senior Notes 2027 (Cosan Luxembourg) | 126.85% CDI |
| 1,897,790 |
| (46,214) |
| 1,285,454 |
| (379,397) |
| (736,466) |
FX and interest rate swaps (Rumo) | 108% CDI |
| 38,054 |
| 9,316 |
| 15,468 |
| 6,153 |
| 15,067 |
FX and interest rate swaps (Rumo) | 118% CDI |
| — |
| — |
| — |
| — |
| 47,527 |
Resolution 4131 (Comgás - 2021) | CDI + 1.25% |
| 407,250 |
| (63,184) |
| (50,245) |
| (65,656) |
| (88,612) |
Resolution 4131 (Comgás - 2022) | CDI + 1.20% |
| 1,097,400 |
| (212,180) |
| (160,369) |
| (184,726) |
| (217,215) |
Resolution 4131 (Comgás - 2023) | CDI + 1.30% |
| 749,310 |
| (22,611) |
| — |
| (57,845) |
| — |
Resolution 4131 (Comgás - 2018) | 107.9% of CDI |
| — |
| — |
| 123,760 |
| (28,050) |
| (61,685) |
Total derivatives |
|
| 4,189,804 |
| (334,873) |
| 1,214,068 |
| (709,521) |
| (1,041,384) |
Total |
|
| — |
| (4,353,107) |
| (4,215,599) |
| (64,752) |
| (8,319) |
Explanatory Notes to the Financial Statement
(In thousands of Reais, except when otherwise indicated)
|
|
|
|
| Registered Value |
| Accumulated fair value adjustment | ||||
|
|
| Notional |
| 12/31/2023 |
| 12/31/2022 |
| 12/31/2023 |
| 12/31/2022 |
Interest rate risk |
|
|
|
|
|
|
|
|
|
|
|
Items |
|
|
|
|
|
|
|
|
|
|
|
Debenture 4th issue - 3rd series (Comgás) | IPCA + 7.36% |
| (114,818) |
| (80,960) |
| (114,014) |
| 33,804 |
| (114,014) |
Debenture 6th issue - single series (Comgás) | IPCA + 4.33% |
| (523,993) |
| (554,147) |
| (523,837) |
| (27,986) |
| (523,837) |
Debenture 9th issue - 1st series (Comgás) | IPCA + 5.12% |
| (500,000) |
| (550,342) |
| (491,153) |
| (41,005) |
| (6,179) |
Debenture 9th issue - 2nd series (Comgás) | IPCA + 5.22% |
| (500,000) |
| (502,799) |
| (467,841) |
| (15,841) |
| 9,737 |
BNDES Projects VI and VII (Comgás) | IPCA + 4.10% |
| (160,126) |
| (112,946) |
| (131,885) |
| 34,144 |
| (131,885) |
BNDES Project VIII (Comgás) | IPCA + 3.25% |
| (870,149) |
| (743,674) |
| (801,812) |
| 73,053 |
| (801,812) |
BNDES Project IX (Comgás) | IPCA + 5.74% |
| (565,582) |
| (598,752) |
| (544,925) |
| (36,668) |
| (544,925) |
Debenture (Rumo) | IPCA + 4.68% |
| (300,000) |
| (396,201) |
| (518,680) |
| 13,474 |
| (6,070) |
Debenture (Rumo) | IPCA + 4.50% |
| (600,000) |
| (774,939) |
| (704,954) |
| 34,721 |
| (34,745) |
Total |
|
| (4,134,668) |
| (4,314,760) |
| (4,299,101) |
| 67,696 |
| (2,153,730) |
Derivative instruments |
|
|
|
|
|
|
|
|
|
|
|
Debenture 4th issue - 3rd series (Comgás) | 94.64% CDI |
| — |
| — |
| — |
| — |
| (3,900) |
Debenture 4th issue - 3rd series (Comgás) | 112.49% CDI |
| 114,818 |
| 4,567 |
| (778) |
| (1,122) |
| (5,096) |
Debenture 6th issue - single series (Comgás) | 89.9% CDI |
| 523,993 |
| 20,116 |
| (10,419) |
| (8,552) |
| (26,161) |
Debenture 9th issue - 1st series (Comgás) | 109.20% CDI |
| 500,000 |
| 42,093 |
| (17,705) |
| 16,119 |
| (37,517) |
Debenture 9th issue - 2nd series (Comgás) | 110.60% CDI |
| 500,000 |
| 26,901 |
| (40,441) |
| 23,225 |
| (53,304) |
BNDES Projects VI and VII (Comgás) | 87.50% CDI |
| 160,126 |
| 64 |
| (2,046) |
| (782) |
| (6,923) |
BNDES Project VIII (Comgás) | 82.94% CDI |
| 870,149 |
| (6,578) |
| (21,039) |
| (4,693) |
| (48,613) |
BNDES Project IX (Comgás) | 98.9% CDI |
| 565,582 |
| 46,904 |
| (6,632) |
| 15,749 |
| (6,632) |
Debenture (Rumo) | 107% CDI |
| 300,000 |
| 81,885 |
| 76,194 |
| (5,691) |
| (4,819) |
Debenture (Rumo) | 103% CDI |
| 600,000 |
| 147,429 |
| 74,092 |
| (73,337) |
| 8,252 |
Total derivatives |
|
| 4,134,668 |
| 363,381 |
| 51,226 |
| (39,084) |
| (184,713) |
Total |
|
| — |
| (3,951,379) |
| (4,247,875) |
| 28,612 |
| (2,338,443) |
c) Cash flow hedge
Compass
Natural gas purchase and sale contracts
The indirect subsidiary Compass Comercialização S.A. entered natural gas purchase (JKM risk) and sale agreements (BRENT risk) with a third party and related party. To protect and mitigate the risks arising from fluctuations in natural gas indexes, the subsidiary designated this operation subject to hedge accounting for the respective cash flow protection.
In this contracting, the expected benefits are: reducing the financial risk associated with fluctuations in natural gas prices, avoiding fluctuations in the financial result of hedge instruments, protecting the subsidiary's margins, as well as maintaining predictability in its costs or revenues, ensuring greater stability in operating results.
Highly probable revenues in US dollars (Leasing)
The indirect subsidiary TRSP adopted a hedge accounting strategy to protect its results from exposure to variability in cash flows arising from the exchange rate effects of highly probable revenues in US dollars projected for a period of 20 years, through non-derivative hedging instruments – lease liabilities in US dollars already contracted.
Explanatory Notes to the Financial Statement
(In thousands of Reais, except when otherwise indicated)
Rumo
Investment costs
The subsidiary Rumo S.A contracted certain derivative instruments to protect certain investment costs contracted for the period of 2023 and opted to link the instruments to documented hedge structures:
As at December 31, 2023, there was no ineffective portion reclassified to profit or loss. The impacts recognized in the subsidiary's shareholders' equity and the estimated realization in shareholders' equity are shown below:
a) Composition
Financial instruments |
| Subsidiary |
| Risk |
| Unit |
| Notional R$ |
| Fair value 12/31/2023 |
| Book value 12/31/2023 |
Future |
| Compass |
| BRENT |
| Barrel |
| 368,000 |
| (2,843) |
| (2,843) |
Leasing |
| Compass |
| FX rate |
| BRL |
| 1,548,942 |
| (18,071) |
| (18,071) |
Effect on balance sheet |
|
|
|
|
|
|
| 1,916,942 |
| (20,914) |
| (20,914) |
b) Movement
Financial instruments | Net financial result |
| Comprehensive income (i) |
| Gains or (losses) realized |
Future (BRENT) (ii) | (9,785) |
| (2,843) |
| — |
Future (JKM) | — |
| — |
| 12,012 |
Leasing | — |
| (18,071) |
| — |
NDF (Non deliverable forwards) (ii) | — |
| — |
| (2,280) |
December 31, 2023 | (9,785) |
| (20,914) |
| 9,732 |
| (i) | Effect of deferred income tax and social contribution is R$7,110. | |
| (ii) | Operations settled in December 2023. |
Explanatory Notes to the Financial Statement
(In thousands of Reais, except when otherwise indicated)
Accounting policy: Trade receivables are initially recognized at the unconditional consideration amount unless they contain significant financing components, in which case they are recognized at fair value. The Company holds trade receivables with the intention of collecting the contractual cash flows, and subsequently measuring them at amortized cost using the effective interest rate method. For the purpose of estimating credit losses, trade receivables have been categorized according to their credit risk characteristics and days overdue. A loss allowance for anticipated credit losses is recognized as a component of selling expenses. The expected loss rates are derived from historical credit losses incurred during the period. Historical loss rates may be modified to reflect current and forecasted information regarding macroeconomic factors that influence the ability of customers to settle receivables. The Company has determined that the implied interest rate in the agreement is the most significant factor, and as a result, it adjusts historical loss rates based on the anticipated changes to this factor. |
| Consolidated | ||
| 12/31/2023 |
| 12/31/2022 |
Domestic market | 2,790,623 |
| 3,085,227 |
Unbilled receivables (i) | 782,813 |
| 968,147 |
Foreign market - foreign currency | 32,308 |
| 28,786 |
| 3,605,744 |
| 4,082,160 |
Expected credit losses | (161,108) |
| (154,618) |
| 3,444,636 |
| 3,927,542 |
Current | 3,330,488 |
| 3,769,908 |
Non-current | 114,148 |
| 157,634 |
Total | 3,444,636 |
| 3,927,542 |
| (i) | Unbilled revenue refers to the portion of the monthly gas supply for which measurement and billing have not been completed. |
The aging of accounts receivable is as follows:
| Consolidated | ||
| 12/31/2023 |
| 12/31/2022 |
Not overdue | 3,181,795 |
| 3,514,756 |
Overdue |
|
|
|
Up to 30 days | 203,143 |
| 376,868 |
From 31 to 60 days | 48,968 |
| 40,389 |
From 61 to 90 days | 18,146 |
| 20,254 |
More than 90 days | 153,692 |
| 129,893 |
Expected credit losses | (161,108) |
| (154,618) |
| 3,444,636 |
| 3,927,542 |
Explanatory Notes to the Financial Statement
(In thousands of Reais, except when otherwise indicated)
Changes in the expected credit losses are as follows:
| Consolidated |
Balance as of January 1, 2022 | (115,052) |
Business combination | (31,923) |
Additions/reversals | (28,463) |
Exchange rate variation | (4,905) |
Write-offs | 25,725 |
Balance as of December 31, 2022 | (154,618) |
Additions/reversals | (31,053) |
Exchange rate variation | 1,353 |
Write-offs | 23,210 |
Balance as of December 31, 2023 | (161,108) |
Accounting policy The transactions between related parties are conducted at standard market prices. Unpaid balances at the end of the year are not guaranteed, do not accrue interest, and are settled in cash. There were no given or received guarantees on any accounts receivable or payable involving related parties. At the end of each period, a recovery of amounts and receivables analysis is performed, but no provision was recognized in this year. |
Explanatory Notes to the Financial Statement
(In thousands of Reais, except when otherwise indicated)
a) Accounts receivable and payable with related parties:
Parent Company |
| Consolidated | |||||
| 12/31/2023 |
| 12/31/2022 |
| 12/31/2023 |
| 12/31/2022 |
Current assets |
|
|
|
|
|
|
|
Commercial operations |
|
|
|
|
|
|
|
Raízen S.A. (i) | 7,798 |
| 7,555 |
| 63,004 |
| 79,297 |
Rumo S.A. | 6,214 |
| 3,045 |
| — |
| — |
Elevações Portuárias S.A. | 10 |
| — |
| 21,633 |
| 5,424 |
Cosan Lubrificantes e Especialidades S.A. (ii) | 5,722 |
| 3,418 |
| — |
| — |
Aguassanta Participações S.A. | 88 |
| 2,184 |
| 88 |
| 2,184 |
Compass Gás e Energia S.A. | 4,253 |
| 996 |
| — |
| — |
Termag - Terminal Marítimo de Guarujá S.A. | — |
| — |
| 9,286 |
| 14,286 |
Vale S.A. |
|
|
|
| 5,000 |
| — |
Norgás S.A. | — |
| — |
| 8,976 |
| — |
Other | 121 |
| 7,269 |
| 452 |
| 6,512 |
| 24,206 |
| 24,467 |
| 108,439 |
| 107,703 |
Financial and corporate operations |
|
|
|
|
|
|
|
Raízen S.A. (i) | 36,020 |
| 20,585 |
| 36,032 |
| 20,586 |
Cosan Oito S.A. | — |
| 6,742 |
| — |
| — |
Cosan Nove Participações S.A. (iii) | — |
| 121,621 |
| — |
| — |
Cosan Dez Participações S.A. (iii) | 111,659 |
| 111,659 |
| — |
| — |
Ligga S.A. (iv) | — |
| — |
| 107,000 |
| 107,252 |
Cosan Lubrificantes e Especialidades S.A. (ii) | — |
| 96,473 |
| — |
| — |
Other | 1,466 |
| — |
| — |
| — |
| 149,145 |
| 357,080 |
| 143,032 |
| 127,838 |
Total current assets | 173,351 |
| 381,547 |
| 251,471 |
| 235,541 |
Non-current assets |
|
|
|
|
|
|
|
Commercial operations |
|
|
|
|
|
|
|
Raízen S.A. (i) | — |
| — |
| — |
| 47,731 |
Termag - Terminal Marítimo de Guarujá S.A. | — |
| — |
| 36,952 |
| 43,810 |
| — |
| — |
| 36,952 |
| 91,541 |
Financial and corporate operations |
|
|
|
|
|
|
|
Raízen S.A. (i) | 46,911 |
| 149,347 |
| 46,935 |
| 149,347 |
Cosan Lubrificantes e Especialidades S.A. (ii) | 127,834 |
| 206,446 |
| — |
| — |
Other | — |
| — |
| 4,733 |
| 113 |
| 174,745 |
| 355,793 |
| 51,668 |
| 149,460 |
Total non-current assets | 174,745 |
| 355,793 |
| 88,620 |
| 241,001 |
Related parties receivables | 348,096 |
| 737,340 |
| 340,091 |
| 476,542 |
Explanatory Notes to the Financial Statement
(In thousands of Reais, except when otherwise indicated)
| Parent Company |
| Consolidated | ||||
| 12/31/2023 |
| 12/31/2022 |
| 12/31/2023 |
| 12/31/2022 |
Current liabilities |
|
|
|
|
|
|
|
Commercial operations |
|
|
|
|
|
|
|
Raízen S.A. (i) | 4,099 |
| 6,208 |
| 232,713 |
| 296,051 |
Termag - Terminal Marítimo de Guarujá S.A. | — |
| — |
| 10,500 |
| — |
Aguassanta Participações S.A. | — |
| — |
| 984 |
| 6,419 |
Cosan Lubrificantes e Especialidades S.A. (ii) | 1,065 |
| 1,855 |
| — |
| — |
Vale S.A. |
|
|
|
| 4,000 |
| — |
Other | 6,065 |
| 3,038 |
| 39,542 |
| 20,569 |
| 11,229 |
| 11,101 |
| 287,739 |
| 323,039 |
Financial and corporate operations |
|
|
|
|
|
|
|
Raízen S.A. (i) | 32,405 |
| 60,866 |
| 34,421 |
| 64,697 |
Cosan Overseas Limited | 31,282 |
| 33,715 |
| — |
| — |
Cosan Luxembourg S.A (v) | 123,983 |
| 1,085,617 |
| — |
| — |
Other | — |
| 46,191 |
| — |
| — |
| 187,670 |
| 1,226,389 |
| 34,421 |
| 64,697 |
Total current liabilities | 198,899 |
| 1,237,490 |
| 322,160 |
| 387,736 |
Non-current liabilities |
|
|
|
|
|
|
|
Financial and corporate operations |
|
|
|
|
|
|
|
Cosan Lubrificantes e Especialidades S.A. (ii) | 655,683 |
| 765,148 |
| — |
| — |
Cosan Luxembourg S.A (v) | 3,355,612 |
| 5,829,147 |
| — |
| — |
Cosan Overseas Limited (v) | 2,437,595 |
| 2,627,112 |
| — |
| — |
Raízen S.A. (i) | 1,078 |
| — |
| 1,078 |
| — |
Total non-current liabilities | 6,449,968 |
| 9,221,407 |
| 1,078 |
| — |
Payables to related parties | 6,648,867 |
| 10,458,897 |
| 323,238 |
| 387,736 |
| (i) | Current and non-current assets receivable from Raízen S.A. and its subsidiaries are, substantially, tax credits that will be reimbursed to the Company when realized. The preferred shares are used by Raízen to reimburse Cosan, with preferred dividends, when the net operating loss is consumed in Raízen. Current liabilities represent Cosan S.A.'s obligation to reimburse Raízen S.A. and its subsidiaries for expenses related to settled legal disputes and other liabilities incurred prior to the formation of the joint venture. |
| (ii) | On December 31, 2018, an agreement for the assumption of rights and obligations was entered into between the Company and the subsidiary Cosan Lubrificantes e Especialidades S.A. (“CLE”) and assets and liabilities related to the fuel business were transferred from the acquisition of Esso Brasileira de Petroleum Ltd. (“Esso”) in 2008, which were not contributed to the formation of Raízen, a fact that generated an increase in the Company’s related parties’ assets and liabilities accounts in that year and which has been changing as transactions are settled. This transfer of assets and liabilities does not impact the Company's consolidated position, nor the segment information |
| (iii) | The highlighted amounts refer to expenses incurred by Cosan S.A. in the process of issuing preferred shares of Cosan Nove and Cosan Dez while they were in the process of incorporation, and which will be reimbursed by these entities. |
| (iv) | Advance for future capital increase. |
| (v) | These operations serve as a vehicle for transferring funds from the Company to the subsidiaries, which are the holders of Senior Notes and are responsible for honoring their obligations. The increases observed in these liability balances refer to the creation of a loan arising from the transfer of the Senior Notes due 2029 debt and foreign exchange rate variation, which was levied on the Export Prepayment (“PPE”) operations that we have today between the Companies and the subsidiaries Cosan Lux and Cosan Overseas Limited (“Cosan Overseas”). |
Explanatory Notes to the Financial Statement
(In thousands of Reais, except when otherwise indicated)
b) Transactions with related parties:
Parent Company | Consolidated | ||||||
| 12/31/2023 |
| 12/31/2022 |
| 12/31/2023 |
| 12/31/2022 |
Operating income |
|
|
|
|
|
|
|
Raízen S.A. (i) | — |
| — |
| 974,612 |
| 908,588 |
Elevações Portuárias S.A. | — |
| — |
| 15,434 |
| — |
Vale S.A. | — |
| — |
| 56,000 |
| — |
Other | — |
| — |
| — |
| 6,910 |
| — |
| — |
| 1,046,046 |
| 915,498 |
Purchase of products / inputs / services |
|
|
|
|
|
|
|
Raízen S.A. (i) | — |
| — |
| (2,251,896) |
| (2,528,022) |
Elevações Portuárias S.A. | — |
| — |
| (16,536) |
| — |
Vale S.A. | — |
| — |
| (52,000) |
| — |
Terminal Marítimo do Guarujá S.A. | — |
| — |
| (74,785) |
| — |
| — |
| — |
| (2,395,217) |
| (2,528,022) |
Shared income (expenses) |
|
|
|
|
|
|
|
Companhia de Gás de São Paulo - COMGÁS | (176) |
| (1,425) |
| — |
| — |
Compass Gás e Energia S.A. | 10,908 |
| 6,001 |
| — |
| — |
Cosan Lubrificantes e Especialidades S.A. | 5,275 |
| 3,816 |
| — |
| — |
Elevações Portuárias S.A. | — |
| — |
| (753) |
| — |
Payly Soluções de Pagamentos S.A. | — |
| 280 |
| — |
| — |
Raízen S.A. | (4,887) |
| (1,701) |
| (83,054) |
| (68,120) |
Rumo S.A. | 6,195 |
| 4,365 |
| — |
| — |
Sinlog Tecnologia em Logística S.A. | 129 |
| 138 |
| — |
| — |
Other | 56 |
| — |
| (2) |
| 96 |
| 17,500 |
| 11,474 |
| (83,809) |
| (68,024) |
Financial result |
|
|
|
|
|
|
|
Cosan Luxembourg S.A. | (269,661) |
| 102,283 |
| — |
| — |
Cosan Overseas Limited | (14,199) |
| (28,818) |
| — |
| — |
Raízen S.A. | — |
| (106) |
| — |
| (106) |
Aldwych Temple Venturec Capital Limited | 46,191 |
| 2,472 |
| — |
| — |
Other | — |
| 12 |
| — |
| (92) |
| (237,669) |
| 75,843 |
| — |
| (198) |
Total | (220,169) |
| 87,317 |
| (1,432,980) |
| (1,680,746) |
| (i) | The amount is related to the purchase of fuels and provision of logistics transport by the subsidiary Rumo. |
Explanatory Notes to the Financial Statement
(In thousands of Reais, except when otherwise indicated)
c) Managers’ and directors’ compensation:
The Company has a compensation policy approved by the Board of Directors. Compensation of the Company's key management personnel includes salaries, contributions to a defined post-employment benefit plan and stock-based compensation. On April 27, 2023, the Annual General Meeting approved the global annual compensation of the managers and members of the Fiscal Council for the 2023 fiscal year. We present below the result of the Parent Company as at December 31, 2023, as follows:
| 12/31/2023 |
| 12/31/2022 |
Short-term benefits to employees and managers | 44,465 |
| 38,227 |
Share-based compensation | 73,513 |
| 59,015 |
Post-employment benefits | 532 |
| 464 |
| 118,510 |
| 97,706 |
Accounting policy: Due to the short-term nature of suppliers, their carrying amounts are the same as their fair values, and they are generally paid within 30 to 45 days of recognition. |
| Parent Company |
| Consolidated | ||||
12/31/2023 |
| 12/31/2022 |
| 12/31/2023 |
| 12/31/2022 | |
Material and services suppliers | 2,431 |
| 115,146 |
| 3,110,114 |
| 2,923,486 |
Natural gas(i)/ transport and logistics suppliers | — |
| — |
| 1,074,411 |
| 1,456,365 |
| 2,431 |
| 115,146 |
| 4,184,525 |
| 4,379,851 |
Current | 2,431 |
| 115,146 |
| 3,920,273 |
| 4,318,362 |
Non-current | — |
| — |
| 264,252 |
| 61,489 |
Total | 2,431 |
| 115,146 |
| 4,184,525 |
| 4,379,851 |
| (i) | The open balance of natural gas supply primarily refers to the natural gas supply contracts with Petróleo Brasileiro S.A. (“Petrobras”). |
The carrying amounts of suppliers and other payables are the same as their fair values due to their short-term nature.
Explanatory Notes to the Financial Statement
(In thousands of Reais, except when otherwise indicated)
Accounting policy: The purpose of sectoral financial assets and liabilities is to neutralize the economic impacts on the distributors' results, due to the difference between gas cost and tax rates contained in the ordinances issued by regulatory agencies, and those contemplated in the tariff, each adjustment/ tariff revision.
These differences between the actual cost and the cost considered in the tariff adjustments generate a right as the realized cost is greater than that contemplated in the tariff, or an obligation, when the costs are lower than those contemplated in the tariff. The differences are considered in the subsequent tariff readjustment and become part of the rate readjustment index of the distributors.
In the case of distributors regulated by the Agência Reguladora de Serviços Públicos do Estado de São Paulo ("ARSESP"), as provided for in resolution 1010 of the ARSESP, any balances in the existing graphic accounts at the end of the concession will be indemnified to the distributors or returned to the users at the end of the concession period. The balance consists of: (i) the previous cycle (in amortization), which represents the balance approved by the ARSESP already contemplated in the tariff and (ii) the cycle in constitution, which are the differences that will be approved by the ARSESP in the next tariff adjustment.
Still, this resolution was about the balance contained in the current tax account, which accumulated values related to tax credits used by distributors, but that essentially are part of the tariff composition and should be subsequently passed on via tariff.
With the advent of such deliberation, the subsidiaries Comgás and Necta understand that there is no more significant uncertainty that is impeding the recognition of sectoral financial assets and liabilities as values effectively to be received or payable. In this way, it recognizes sector financial assets and liabilities in its financial statements.
However, for other distributors operating in the other states of the country the recognition of sectoral financial assets and liabilities will only be registered after the resolution of the regulatory body.
|
The following demonstrates the change in net sectorial financial assets (liabilities) for the year ending as at December 31, 2023:
| Sectorial Assets |
| Sectorial liabilities |
| Total |
At January 1, 2022 | 558,310 |
| (1,372,283) |
| (813,973) |
Cost of gas (i) | (466,743) |
| — |
| (466,743) |
Credits taxes (ii) | — |
| 16,876 |
| 16,876 |
Monetary variation (iii) | 80,996 |
| (120,804) |
| (39,808) |
Deferral of IGP-M (v) | 110,013 |
| — |
| 110,013 |
Business combination | 59,757 |
| (140,405) |
| (80,648) |
At December 31, 2022 | 342,333 |
| (1,616,616) |
| (1,274,283) |
Cost of gas (i) | (v) | 27,954 |
| — |
| 27,954 |
Tax credits (ii) | 12,425 |
| (47,144) |
| (34,719) |
Monetary update (iii) | 49,098 |
| (146,938) |
| (97,840) |
Deferral of IGP-M (iv) | 116,890 |
| — |
| 116,890 |
At December 31, 2023 | 548,700 |
| (1,810,698) |
| (1,261,998) |
|
|
|
|
|
|
Current | 207,005 |
| (70,013) |
| 136,992 |
Non-current | 341,695 |
| (1,740,685) |
| (1,398,990) |
Total | 548,700 |
| (1,810,698) |
| (1,261,998) |
Explanatory Notes to the Financial Statement
(In thousands of Reais, except when otherwise indicated)
| (i) | Refers to the cost of gas purchased in comparison to that contained in the tariffs, fully classified in current assets, since the regulator's deliberation provides for tariff recovery on an annual basis for the residential and commercial customer categories and quarterly for the others customer categories. | |
| (ii) | Refers to the net value of tax credits in the year, as per deliberation no. 1,359 of December 10, 2022. | |
| (iii) | Monetary update on the gas current account and extemporaneous credit, based on the SELIC rate. | |
| (iv) | Appropriation of the IGP-M deferral for the categories of residential and commercial customers, recognized in non-current assets, as per deliberation no. 1,162 of May 26, 2021, and 7th Addendum of the Concession Agreement on October 1, 2021. | |
| (v) | Includes the effects of R$34,193 on June 30, 2023, R$75,158 on September 26, 2023, and R$68,063 on November 24, 2023, referring to amounts redistributed to consumers. |
In view of the public hearing held by ARSESP on January 9, 2023, related to the topic of returning PIS/COFINS credits to customers, resulting from the exclusion of ICMS from their bases, subsidiaries and sector representatives presented important contributions to be considered by the agency during the analysis period. According to deliberation No. 1,491 of January 24, 2024, the availability of the Detailed Report regarding the contributions received was extended by up to 120 days, counting from the day following the end date of the previous extension, that is, January 27, 2024. Therefore, until the analysis of these contributions by the regulatory agency is completed, the topic remains open and without any specification regarding next steps, thus having no impact on this financial statement.
Accounting policy: When the fair value of financial assets and liabilities cannot be derived from active markets, their fair value is determined by means of valuation techniques, such as the discounted cash flow model. When possible, inputs to these models are obtained from observable markets; however, when this is not possible, some judgment is required to determine fair values. In determining data such as liquidity risk, credit risk, and volatility, judgment is required. Variations in these variables may impact the reported fair value of financial instruments. Specific valuation techniques used to value financial instruments include:
Level 2 includes all resulting estimates of fair value when fair values are determined based on present values and discount rates are adjusted for counterparty or own credit risk. The Company has an established control structure regarding the measurement of fair values. Significant unobservable inputs and valuation adjustments are reviewed by Management on a regular basis. If third-party information, such as brokerage quotes or pricing services, is used to measure fair values, Treasury evaluates evidence obtained from third parties to support the conclusion that these valuations comply with the Company's policy, including the market level. |
Explanatory Notes to the Financial Statement
(In thousands of Reais, except when otherwise indicated)
The Board of Directors is informed of significant valuation issues. When determining the fair value of an asset or liability, the Company makes extensive use of observable market data. A fair value hierarchy categorizes fair values into different levels based on the inputs used in valuation techniques, as follows:
If the inputs used to measure the fair value of an asset or liability fall into different levels of the fair value hierarchy, then the entire fair value measurement is classified at the same level as the lowest-level entry that is significant to the entire measurement. Among the specific techniques used to value financial instruments are:
|
All resulting fair value estimates are included in level 2, except for contingent consideration payables for which fair values have been determined using present values and discount rates adjusted for counterparty or own credit risk.
Explanatory Notes to the Financial Statement
(In thousands of Reais, except when otherwise indicated)
The carrying amounts and fair value of consolidated assets and liabilities are as follows:
|
|
| Carrying amount |
| Assets and liabilities measured at fair value | ||||||||||||
|
|
| 12/31/2023 |
| 12/31/2022 |
| 12/31/2023 |
| 12/31/2022 | ||||||||
| Note |
|
|
|
|
| Level 1 |
| Level 2 |
| Level 3 |
| Level 1 |
| Level 2 |
| Level 3 |
Assets |
|
|
|
|
|
|
|
|
|
|
|
|
|
|
|
|
|
Investment funds | 5.2 |
| 3,298,142 |
| 1,304,332 |
| — |
| 3,298,142 |
| — |
| — |
| 1,304,332 |
| — |
Marketable securities | 5.3 |
| 3,503,961 |
| 22,099,766 |
| — |
| 3,503,961 |
| — |
| 19,586,193 |
| 2,513,573 |
| — |
Other financial assets |
|
| 3,113 |
| 89,238 |
| 3,113 |
| — |
| — |
| 89,238 |
| — |
| — |
Investment properties (i) | 11.5 |
| 15,976,126 |
| 14,103,060 |
| — |
| — |
| 15,976,126 |
| — |
| — |
| 14,103,060 |
Derivate financial instruments | 5.6 |
| 2,546,799 |
| 4,151,752 |
| — |
| 2,546,799 |
| — |
| — |
| 4,151,752 |
| — |
Total |
|
| 25,328,141 |
| 41,748,148 |
| 3,113 |
| 9,348,902 |
| 15,976,126 |
| 19,675,431 |
| 7,969,657 |
| 14,103,060 |
Liabilities |
|
|
|
|
|
|
|
|
|
|
|
|
|
|
|
|
|
Loans, financing and debentures (ii) | 5.4 |
| (56,904,654) |
| (52,987,216) |
| — |
| (22,952,492) |
| — |
| — |
| (31,367,019) |
| — |
Derivative financial instruments | 5.6 |
| (3,415,145) |
| (5,290,932) |
| — |
| (3,415,145) |
| — |
| — |
| (5,290,932) |
| — |
Total |
|
| (60,319,799) |
| (58,278,148) |
| — |
| (26,367,637) |
| — |
| — |
| (36,657,951) |
| — |
| (i) | The fair value of investment properties was determined using the direct comparative method of market data applied to transactions involving similar properties (type, location, and quality of property) and, to a lesser extent, sales quotes for potential transactions involving comparable assets (level 3). The methodology used to determine fair value incorporates direct comparisons of market information, such as market research, homogenization of values, spot market prices, sales, distances, facilities, access to land, topography and soil, land use (crop type), and rainfall, among other data, in accordance with the standards issued by the Brazilian Association of Technical Standards ("ABNT"). The discount rates used vary between 11.12% per year and 11.20% per year as at December 31, 2023 (11.20% to 13.75% per year as at December 31, 2022). |
| For fair value assessments of investment properties in the periods between annual assessments, management considers regional market trends presented by the S&P Global Commodity Insights report for the Brazilian rural real estate market. If Management reasonably believes that property values have changed differently from the variation in the S&P Global Commodity Insights report, based on its understanding of current market conditions and evidence of proposals received for the assets, considerations may be made to determine fair value property market. | |
| (ii) | The fair value of the Company’s loans does not differ significantly from their carrying value except for the debts that are designated at fair value through the result. |
| For debts having a market value quoted on the Luxembourg Stock Exchange the measurement of fair value for disclosure purposes is based on the quoted market price as follows: |
Debt |
| Company |
| 12/31/2023 |
| 12/31/2022 |
Senior Notes 2028 |
| Rumo Luxembourg S.à r.l. |
| 96.41% |
| 95.04% |
Senior Notes 2032 |
| Rumo Luxembourg S.à r.l. |
| 85.65% |
| 80.36% |
Senior Notes 2027 |
| Cosan Luxembourg S.A. |
| 100.92% |
| 100.92% |
Explanatory Notes to the Financial Statement
(In thousands of Reais, except when otherwise indicated)
This note describes the group's exposure to financial risks and how these risks may affect future financial performance. To provide more context, current year profit and loss information has been included where applicable:
Risk | Exposure arising from | Measurement | Management |
Market risk - foreign exchange |
|
| Foreign currency |
Market risk - interest | Cash and cash equivalents, securities, loans, borrowings and debentures, leases and derivative financial instruments. | Sensitivity analysis | Interest rate swap |
Market risk – price |
|
|
|
Credit risk | Cash and cash equivalents, marketable securities, trade receivables, derivatives, receivables from related parties, dividends and investment property |
| Availability and lines of credit |
Liquidity risk | Loans, borrowings and debentures, accounts payable to suppliers, other financial liabilities, REFIS, leases, derivatives, payables to related parties and dividends. | Cash flow forecasting | Availability and lines of credit |
The Company's Management identifies, evaluates, and hedges financial risks in close collaboration with operating units. The Board of Directors provides written principles for managing global risk in addition to policies covering specific areas such as currency risk, interest rate risk, credit risk, use of derivative and non-derivative financial instruments, and excess investment of liquidity.
When all applicable criteria are satisfied, hedge accounting is used to eliminate the accounting mismatch between the hedging instrument and the hedged item. This will result in the effective recognition of interest expense at a fixed interest rate for hedged floating rate loans and inventory at the fixed foreign exchange rate for purchases hedged against foreign exchange risk.
The Company may opt for formal designation of new debt transactions for which it has swap-type derivative hedging instruments for foreign exchange rate variation and interest, as measured at fair value. The Fair Value Option is intended to eliminate inconsistencies caused by disparities between the measurement credits of certain liabilities and their hedging instruments. Consequently, both swaps and respective debts are now valued at fair value. This option is irrevocable and must be exercised upon the operation's initial accounting entry.
The policy of the Company is to maintain a sufficient capital base to foster the confidence of investors, creditors, and the market, and to ensure the business's future growth. Each of its businesses' rate of return on capital is monitored by Management.
An analysis of the risk exposure that Management intends to cover determines the use of financial instruments to protect against these areas of volatility.
a) Market risk
The objective of market risk management is to manage and control exposures to market risk within acceptable parameters, optimizing returns.
The Company uses derivatives to manage market risks. All these transactions are carried out within the guidelines defined by the Risk Management Committee. Generally, the Company seeks to apply hedge accounting to manage volatility in profit or loss.
Explanatory Notes to the Financial Statement
(In thousands of Reais, except when otherwise indicated)
- Foreign exchange risk
As of December 31, 2023, and 2022, the Company had the following net exposure to foreign exchange variation on assets and liabilities denominated in US Dollars, Euros, Yen and Pound Sterling:
| 12/31/2023 |
| 12/31/2022 |
Cash and cash equivalents | 284,956 |
| 1,138,948 |
Trade payables | (441,768) |
| (97,259) |
Loans, borrowings and debentures | (24,861,084) |
| (13,698,102) |
Leases | (1,627,104) |
| (94,716) |
Consideration payable | (203,094) |
| (223,960) |
Derivative financial instruments | 14,182,102 |
| 7,728,609 |
FX exposure, net | (12,665,992) |
| (5,246,480) |
The probable scenario considers the estimated foreign exchange rates, carried out by a specialized third party, at the maturity of transactions for companies with real functional currency (positive and negative, before tax effects), as follows:
|
|
|
|
|
| Scenarios | ||||||
Instrument |
| Risk factor |
| Probable |
| 25% |
| 50% |
| (25%) |
| (50%) |
Cash and cash equivalents |
| Low FX rate |
| 43,130 |
| 116,704 |
| 190,278 |
| (30,445) |
| (104,019) |
Trade receivables |
| Low FX rate |
| 252 |
| 2,234 |
| 4,217 |
| (1,731) |
| (3,713) |
Trade payables |
| High FX rate |
| (32) |
| (285) |
| (538) |
| 221 |
| 473 |
Derivative financial instruments |
| Low FX rate |
| 1,637,844 |
| 7,019,308 |
| 11,124,823 |
| (1,168,664) |
| (5,211,482) |
Loans, borrowings and debentures |
| High FX rate |
| (3,156,486) |
| (7,857,863) |
| (13,541,119) |
| 3,606,358 |
| 9,319,729 |
Leases |
| High FX rate |
| (1,602,279) |
| (2,022,389) |
| (2,442,499) |
| (1,182,168) |
| (500,436) |
Consideration payable |
| High FX rate |
| (6,658) |
| (14,979) |
| (23,301) |
| 1,664 |
| 9,986 |
Impacts on profit or loss before taxes |
|
|
| (3,084,229) |
| (2,757,270) |
| (4,688,139) |
| 1,225,235 |
| 3,510,538 |
The probable scenario considers the estimated exchange rates, made by a specialized third party, upon maturity of the transactions for the companies with functional currency Reais (positive and negative, before tax effects), as follows:
|
| Exchange rate sensitivity analysis | ||||||||||
|
| 12/31/2023 |
| Scenarios | ||||||||
|
|
| Probable |
| 25% |
| 50% |
| (25%) |
| (50%) | |
US$ |
| 4.8413 |
| 5.0000 |
| 6.2500 |
| 7.5000 |
| 3.7500 |
| 2.5000 |
Euro |
| 5.3516 |
| 5.6500 |
| 7.0625 |
| 8.4750 |
| 4.2375 |
| 2.8250 |
GBP |
| 6.1586 |
| 6.5000 |
| 8.1250 |
| 9.7500 |
| 4.8750 |
| 3.2500 |
JPY |
| 0.0342 |
| 0.0379 |
| 0.0473 |
| 0.0568 |
| 0.0284 |
| 0.0189 |
ii. Interest rate risk
The Company and its subsidiaries monitor fluctuations in variable interest rates related to their financing and use derivative instruments to minimize the risk of fluctuations in variable interest rates.
A sensitivity analysis on interest rates on loans and borrowings to offset investments in CDI with pre-tax increases and decreases of 25% and 50% is presented below:
|
|
|
| Scenarios | ||||||
Interest rate exposure |
| Probable |
| 25% |
| 50% |
| (25%) |
| (50%) |
Cash and cash equivalents |
| 1,341,723 |
| 1,677,154 |
| 2,012,584 |
| 1,006,292 |
| 670,861 |
Marketable securities |
| 301,620 |
| 377,026 |
| 452,431 |
| 226,215 |
| 150,810 |
Restricted cash |
| 20,131 |
| 25,164 |
| 30,197 |
| 15,098 |
| 10,066 |
Lease and concession in installments |
| (107,615) |
| (134,519) |
| (161,422) |
| (80,711) |
| (53,807) |
Leases liabilities |
| (441,671) |
| (442,081) |
| (442,493) |
| (441,262) |
| (440,855) |
Derivative financial instruments |
| (1,928,668) |
| 1,463,062 |
| 1,184,732 |
| 1,171,704 |
| 2,301,380 |
Loans, borrowings and debentures |
| (2,031,467) |
| (3,271,263) |
| (3,793,309) |
| (2,227,171) |
| (1,705,125) |
Other financial liabilities |
| (39,589) |
| (48,132) |
| (56,674) |
| (31,046) |
| (22,504) |
Impacts on the income (loss) before taxes |
| (2,885,536) |
| (353,589) |
| (773,954) |
| (360,881) |
| 910,826 |
Explanatory Notes to the Financial Statement
(In thousands of Reais, except when otherwise indicated)
The probable scenario considers the estimated interest rate, made by a specialized third party and the Central Bank of Brazil (Banco Central do Brasil or “BACEN”) as follows:
|
|
|
| Scenarios | ||||||
|
| Probable |
| 25% |
| 50% |
| (25%) |
| (50%) |
SELIC |
| 10.08% |
| 12.60% |
| 15.13% |
| 7.56% |
| 5.04% |
CDI |
| 9.98% |
| 12.48% |
| 14.98% |
| 7.49% |
| 4.99% |
TJLP462 (TJLP + 1% per year) |
| 7.20% |
| 8.75% |
| 10.30% |
| 5.65% |
| 4.10% |
TJLP |
| 6.20% |
| 7.75% |
| 9.30% |
| 4.65% |
| 3.10% |
IPCA |
| 3.85% |
| 4.82% |
| 5.78% |
| 2.89% |
| 1.93% |
IGPM |
| 3.34% |
| 4.17% |
| 5.01% |
| 2.50% |
| 1.67% |
Fed Funds |
| 4.25% |
| 5.31% |
| 6.38% |
| 3.19% |
| 2.13% |
SOFR |
| 4.20% |
| 5.25% |
| 6.30% |
| 3.15% |
| 2.10% |
iii. Price risk
- Natural gas
Natural gas derivative transactions were conducted with bank counterparties and recognized at fair value through profit or loss, based on the difference between the contracted price and the market price of outstanding contracts as of the date of the balance sheet.
These are our open positions in natural gas derivatives:
Instrument |
| Risk factor |
| Probable |
| 25% |
| 50% |
| -25% |
| -50% |
Brent derivatives – options |
| Price variation US$ /bbl |
| 7,375 |
| 9,216 |
| 11,067 |
| 5,527 |
| 3,689 |
- Options
We use derivative financial instruments called options to limit our exposure to changes in the value of Vale shares. The widely accepted methodology used to calculate the fair value of options is based on the Black & Scholes pricing model. The values calculated in the sensitivity analysis of the framework mentioned reflect the impacts of the intrinsic values of the options as the shares appreciate or depreciate.
|
|
|
| Scenarios | ||||||||
Instrument |
| Interest |
| Probable |
| 25% |
| 50% |
| (25%) |
| (50%) |
VALE3 (Collar) (i) |
| 2.20% |
| 7,788,856 |
| 8,158,058 |
| 8,434,888 |
| 7,361,797 |
| 7,006,051 |
VALE3 (Call Spread) |
| 1.60% |
| 563,903 |
| 826,670 |
| 1,004,452 |
| 272,147 |
| 72,611 |
(i)As mentioned in note 1.1 (c), 100% of Collar derivatives were settled in April 2024.
- Total Return Swap (TRS)
We are exposed to risks linked to CSAN3 share prices. To mitigate such exposures, total return swap derivatives of 96,185,412 shares of CSAN3 were contracted in which the Company receives the variation of the share price and proceeds on the active side and pays CDI + 1.65% on the passive side.
The sensitivity analysis considers the closing share price as shown below:
Explanatory Notes to the Financial Statement
(In thousands of Reais, except when otherwise indicated)
|
|
|
| Scenarios |
| |||||||||||||||||||
Instrument |
| Probable |
| 25% |
| 50% |
| (25%) |
| (50%) |
| |||||||||||||
Value of the investment |
| 41,557 |
| 470,525 |
| 941,049 |
| (470,525) |
| (941,049) |
| |||||||||||||
Value of the share (CSAN3) |
| 19.36 |
| 24.20 |
| 29.04 |
| 14.52 |
| 9.68 |
| |||||||||||||
b) Credit risk
The Company's regular operations expose it to the risk of default when customers, suppliers, and counterparties are unable to fulfill their financial commitments or other obligations. The Company seeks to mitigate this risk by conducting transactions with a diverse group of counterparties. However, the Company's operations remain susceptible to the unanticipated financial failures of third parties. The credit risk exposure was as follows:
| 12/31/2023 |
| 12/31/2022 |
Cash and cash equivalents | 14,658,481 |
| 13,301,716 |
Trade receivables | 3,444,636 |
| 3,927,542 |
Marketable securities | 3,503,961 |
| 2,513,574 |
Restricted cash | 203,252 |
| 139,933 |
Derivative financial instruments | 2,546,799 |
| 4,151,752 |
Receivables from related parties | 340,091 |
| 476,542 |
Receivable dividends and interest on equity | 255,777 |
| 161,147 |
Other financial assets | 3,113 |
| 89,238 |
| 24,956,110 |
| 24,761,444 |
The Company is exposed to risks related to its cash management activities and temporary investments.
The majority of liquid assets are invested in government bonds and other bank investments. The treasury department manages the credit risk of bank and financial institution balances in accordance with the Company's policy.
The credit risk associated with lease receivables is divided into two customer categories: (i) Level 1 and (ii) Level 2. The majority of subsidiary investment properties are leased to customers classified as Level 1, with no history of late payments or default and a solid financial standing. To mitigate the credit risk associated with lease receivables, the Company's policy restricts its exposure to Level 2 customers. The risk associated with accounts receivable related to the sale of investment properties is mitigated by granting land ownership to the customer only after receiving a down payment for the transaction. In addition, the transfer of ownership is contingent upon receipt of all outstanding payments.
Only approved counterparties and within the credit limits assigned to each counterparty may invest surplus funds. Credit limits for counterparties are reviewed annually and may be modified throughout the period. The limits are established to minimize the concentration of risks and, consequently, to mitigate financial loss caused by potential counterparty default. The credit risk of cash and cash equivalents, marketable securities, restricted cash, and derivative financial instruments is determined by widely accepted market rating instruments and is structured as follows:
Explanatory Notes to the Financial Statement
(In thousands of Reais, except when otherwise indicated)
| 12/31/2023 |
| 12/31/2022 |
AAA | 20,475,536 |
| 16,769,858 |
AA | 172,871 |
| 3,133,455 |
A | 124,932 |
| 138,478 |
Not rated | 139,154 |
| 65,184 |
| 20,912,493 |
| 20,106,975 |
c) Liquidity risk
The Company's strategy for managing liquidity is to ensure, whenever possible, that it has sufficient liquidity to meet its liabilities when they are due, under normal and stressed conditions, without incurring unacceptable losses or risking reputational harm.
The Company's financial liabilities (based on contracted undiscounted cash flows) are categorized by maturity dates as follows:
| 12/31/2023 |
| 12/31/2022 | ||||||||
| Up to 1 year |
| 1 - 2 years |
| 2 - 5 years |
| More than 5 years |
| Total |
| Total |
Loans, borrowings and debentures | (5,504,188) |
| (5,300,723) |
| (23,711,254) |
| (33,419,306) |
| (67,935,471) |
| (63,200,127) |
Trade payables | (3,920,273) |
| (264,252) |
| — |
| — |
| (4,184,525) |
| (4,379,851) |
Other financial liabilities | (476,895) |
| — |
| — |
| — |
| (476,895) |
| (924,562) |
Installment of tax debts | (53,210) |
| (1,505) |
| (1,810) |
| (160,742) |
| (217,267) |
| (208,760) |
Leases liabilities | (658,131) |
| (818,888) |
| (1,233,690) |
| (18,164,132) |
| (20,874,841) |
| (16,436,839) |
Lease and concession in installments | (266,814) |
| (291,161) |
| (579,320) |
| — |
| (1,137,295) |
| (1,137,173) |
Payables to related parties | (322,160) |
| — |
| — |
| — |
| (322,160) |
| (387,736) |
Dividends payable | (549,054) |
| — |
| — |
| — |
| (549,054) |
| (892,006) |
Derivative financial instruments | (2,149,524) |
| (1,327,485) |
| (3,146,345) |
| 1,705,459 |
| (4,917,895) |
| (84,126) |
| (13,900,249) |
| (8,004,014) |
| (28,672,419) |
| (50,038,721) |
| (100,615,403) |
| (87,651,180) |
d) Capital management risk
The group manages the capital structure and adjusts it considering changes in economic conditions and requirements of financial covenants. To maintain or adjust the capital structure, the Group may adjust the payment of dividends to shareholders, return capital to them or issue new shares. The Company monitors capital mainly through the leverage index, calculated as net debt on EBITDA. The group policy is to keep this index up to 3.3x, which represents the lowest covenants ratio of the group components.
The Company's policy is to maintain a solid capital base to foster the confidence of its parent companies, creditors, and the market, and to ensure the business's future growth.
To achieve this general objective, the Group’s capital management, among other things, aims to ensure compliance with the financial commitments associated with loans and borrowings that define capital structure requirements.
Explanatory Notes to the Financial Statement
(In thousands of Reais, except when otherwise indicated)
Accounting Policy: Tax assets are measured at cost and primarily consist of (i) tax effects that are recognized when the asset is sold to a third party or recovered through amortization over the remaining economic life of the asset; and (ii) tax receivables that are expected to be recovered as refunds from tax authorities or as a reduction for future tax liabilities. |
| Parent Company |
| Consolidated | ||||
| 12/31/2023 |
| 12/31/2022 |
| 12/31/2023 |
| 12/31/2022 |
COFINS | 3,699 |
| 3,699 |
| 487,160 |
| 975,878 |
PIS | — |
| — |
| 110,904 |
| 350,867 |
Tax credits | 33,639 |
| 31,774 |
| 33,639 |
| 31,774 |
ICMS | — |
| — |
| 924,180 |
| 845,450 |
ICMS - CIAP | — |
| — |
| 189,813 |
| 118,809 |
Other | 4,647 |
| 4,667 |
| 132,863 |
| 76,348 |
| 41,985 |
| 40,140 |
| 1,878,559 |
| 2,399,126 |
|
|
|
|
|
|
|
|
Current | 8,346 |
| 8,366 |
| 745,856 |
| 1,324,203 |
Non-current | 33,639 |
| 31,774 |
| 1,132,703 |
| 1,074,923 |
Total | 41,985 |
| 40,140 |
| 1,878,559 |
| 2,399,126 |
Accounting policy: Inventories are stated at the lower of cost and net realizable value (it is the estimated selling price in the normal course of business, minus the estimated completion costs and estimated costs necessary to make the sale). The cost of finished and work-in-progress goods comprises direct materials, direct labor and an appropriate proportion of variable and fixed overheads, the latter of which are allocated based on normal operating capacity. Costs are assigned to individual inventory items based on weighted average costs. The provision for obsolete inventories is made for risks associated with the realization and sale of obsolete inventories, and is measured at net realizable value or cost, whichever is lower. |
| Consolidated | ||
| 12/31/2023 |
| 12/31/2022 |
Finished products | 1,254,818 |
| 1,504,134 |
Parts and accessories | 178,260 |
| 168,777 |
Construction Materials | 316,370 |
| 152,789 |
Warehouse and other | 43,266 |
| 43,359 |
| 1,792,714 |
| 1,869,059 |
The balances are presented net of a provision of R$ 78,709 for obsolete inventories as at December 31, 2023 (R$38,747 as at December 31, 2022).
Explanatory Notes to the Financial Statement
(In thousands of Reais, except when otherwise indicated)
Accounting policy: The Company classifies non-current assets and disposal groups as held for sale if their carrying values are recovered mainly through a sale transaction and not through continuous use. Non-current assets and disposal groups classified as held for sale (except investment properties measured at fair value) are measured at the lower of carrying value and fair value less costs to sell. Selling costs are the incremental costs directly attributable to the disposal of an asset (disposal group), excluding financial expenses and income tax expenses. The criteria for classifying held for sale are considered met only when the sale is highly probable and the asset or group for disposal is available for immediate sale in its current condition. The actions required to complete the sale must indicate that it is unlikely that significant changes to the sale will be made or that the decision to sell will be withdrawn. Management must be committed to the asset sale plan and the sale is expected to be completed within one year of the classification date. Assets and liabilities classified as held for sale are presented separately in the balance sheet. |
a) Assets held for sale:
| Properties held for sale |
| Other assets held for sale |
| Total |
At January 1, 2022 | — |
| — |
| — |
Business combination | 268,385 |
| — |
| 268,385 |
Transfers | 322,430 |
| — |
| 322,430 |
Sale of agricultural properties held for sale | (550,432) |
| — |
| (550,432) |
At December 31, 2022 | 40,383 |
| — |
| 40,383 |
Additions | — |
| 1,795,773 |
| 1,795,773 |
Transfers (i) | 444,782 |
| — |
| 444,782 |
Sale of agricultural properties held for sale | (142,773) |
| — |
| (142,773) |
At December 31, 2023 | 342,392 |
| 1,795,773 |
| 2,138,165 |
| (i) | Transfers arising from the group of investment properties as per note 11.5, arising from the proposed sales of Fazendas Grão de Ouro and Dourados (Tellus Brasil Participações S.A.); Fazenda Santa Rita Cana (Duguetiapar Empreendimentos e Participações S.A.); Gleba Macaé (Radar II Properties Agrícolas S.A.). |
Other assets held for sale
As mentioned in explanatory note 2, the balances corresponding to “Norgás” and TUP Porto São Luis S.A balance sheet were reclassified to the heading of assets and liabilities held for sale are shown below:
| Norgás |
| TUP Porto São Luis S.A |
| Total |
Cash and cash equivalents | — |
| 48,231 |
| 48,231 |
Other current tax receivable | — |
| 3,030 |
| 3,030 |
Dividend and interest on equity capital receivable | 18,646 |
| — |
| 18,646 |
Investments in associates | 892,854 |
| — |
| 892,854 |
Property, plant and equipment | — |
| 395,757 |
| 395,757 |
Intangible assets | — |
| 437,220 |
| 437,220 |
Other assets | — |
| 35 |
| 35 |
Total | 911,500 |
| 884,273 |
| 1,795,773 |
The balance of R$2,998 at the parent company is composed of receivables from parties related to TUP Porto São Luis S.A.
Explanatory Notes to the Financial Statement
(In thousands of Reais, except when otherwise indicated)
b) Liabilities held for sale:
| Norgás |
| TUP Porto São Luis S.A |
| Total |
Trade payables | — |
| 17,248 |
| 17,248 |
Employee benefits payables | — |
| 1,828 |
| 1,828 |
Other liabilities | — |
| 456 |
| 456 |
Deferred income and social contribution taxes | 152,255 |
| 66,606 |
| 218,861 |
Total | 152,255 |
| 86,138 |
| 238,393 |
c) Discontinued operation result:
As mentioned in Explanatory Note 2, the balances corresponding to Norgás’s income statements were reclassified to the profit and loss item of discontinued transactions as follows:
| Parent company |
| Consolidated | ||||
| 12/31/2023 |
| 12/31/2022 |
| 12/31/2023 |
| 12/31/2022 |
Equity income (loss) | 15,654 |
| 17,180 |
| 45,419 |
| 49,846 |
Controlling shareholders | 15,654 |
| 17,180 |
| 23,164 |
| 25,421 |
Non-controlling shareholders | — |
| — |
| 22,255 |
| 24,425 |
Comparative balance reclassification:
|
| Parent company | ||||
|
| 12/31/2022 (Originally presented) |
| Reclassification |
| 12/31/2022 (Restated) |
Income before equity income (loss) and net financial result |
| (162,865) |
| — |
| (162,865) |
Equity income (loss) in associates |
| 3,926,759 |
| (17,180) |
| 3,909,579 |
Equity income (loss) of jointly controlled companies |
| (333,622) |
| — |
| (333,622) |
Equity income (loss) |
| 3,593,137 |
| (17,180) |
| 3,575,957 |
Net financial result |
| (3,342,443) |
| — |
| (3,342,443) |
Profit before income tax and social contribution |
| 87,829 |
| (17,180) |
| 70,649 |
Income tax and social contribution |
| 1,088,203 |
| — |
| 1,088,203 |
Net profit from continuing operations |
| 1,176,032 |
| (17,180) |
| 1,158,852 |
Profit for the year from discontinued operations, net of taxes |
| — |
| 17,180 |
| 17,180 |
Net profit for the year |
| 1,176,032 |
| — |
| 1,176,032 |
Explanatory Notes to the Financial Statement
(In thousands of Reais, except when otherwise indicated)
| Consolidated | ||||
| 12/31/2022 (Originally presented) |
| Reclassification |
| 12/31/2022 (Restated) |
Income before equity income (loss) and net financial result | 7,483,843 |
| — |
| 7,483,843 |
Equity income (loss) in associates | 468,743 |
| (49,846) |
| 418,897 |
Equity income (loss) of jointly controlled companies | (92,179) |
| — |
| (92,179) |
Equity income (loss) | 376,564 |
| (49,846) |
| 326,718 |
Net financial result | (5,157,936) |
| — |
| (5,157,936) |
Profit before income tax and social contribution | 2,702,471 |
| (49,846) |
| 2,652,625 |
Income tax and social contribution | 118,404 |
| — |
| 118,404 |
Net profit from continuing operations | 2,820,875 |
| (49,846) |
| 2,771,029 |
Profit for the year from discontinued operations, net of taxes | — |
| 49,846 |
| 49,846 |
Net profit for the year | 2,820,875 |
| — |
| 2,820,875 |
d) Reclassification of comparative cash flow balance:
| Parent company | ||||
| 12/31/2022 (Originally presented) |
| Reclassification |
| 12/31/2022 (Restated) |
Cash flow from operating activities |
|
|
|
|
|
Profit before income tax and social contribution | 87,829 |
| (17,180) |
| 70,649 |
Equity income (loss) in subsidiaries and associates | (3,926,759) |
| 17,180 |
| (3,909,579) |
Other items of operating activities | 3,391,360 |
| — |
| 3,391,360 |
Net cash (used) generated in operating activities | (447,570) |
| — |
| (447,570) |
|
|
|
|
|
|
Net cash used in investing activities | (5,653,626) |
| — |
| (5,653,626) |
|
|
|
|
|
|
| Net cash generated in financing activities | 5,923,951 | — | 5,923,951 | ||
Decrease in cash and cash equivalents | (177,245) |
| — |
| (177,245) |
|
|
|
|
|
|
Cash and cash equivalents at beginning of year | 1,718,077 |
| — |
| 1,718,077 |
Effect of exchange rate variation on the balanceof cash and cash equivalents | (192,371) |
| — |
| (192,371) |
Cash and cash equivalents at end of year | 1,348,461 |
| — |
| 1,348,461 |
Explanatory Notes to the Financial Statement
(In thousands of Reais, except when otherwise indicated)
| Consolidated | ||||
| 12/31/2022 (Originally presented) |
| Reclassification |
| 12/31/2022 (Restated) |
Cash flow from operating activities |
|
|
|
|
|
Profit before income tax and social contribution | 2,702,471 |
| (49,846) |
| 2,652,625 |
Equity income (loss) in subsidiaries and associates | (468,743) |
| 49,846 |
| (418,897) |
Other items of operating | 7,738,504 |
| — |
| 7,738,504 |
Net cash (used) generated in operating activities | 9,972,232 |
| — |
| 9,972,232 |
|
|
|
|
|
|
Cash flow from investing activities |
|
|
|
|
|
Dividends received from subsidiaries and associates | 323,096 |
| (44,969) |
| 278,127 |
Discontinued operation | — |
| 44,969 |
| 44,969 |
Other items of investing activities | (21,068,877) |
| — |
| (21,068,877) |
Net cash used in investing activities | (20,745,781) |
| — |
| (20,745,781) |
|
|
|
|
|
|
Net cash generated in financing activities | 8,305,476 |
| — |
| 8,305,476 |
|
|
|
|
|
|
Decrease in cash and cash equivalents | (2,468,073) |
| — |
| (2,468,073) |
|
|
|
|
|
|
Cash and cash equivalents at beginning of year | 16,174,130 |
| — |
| 16,174,130 |
Effect of exchange rate variation on the balance of cash and cash equivalents | (404,341) |
| — |
| (404,341) |
Cash and cash equivalents at end of year | 13,301,716 |
| — |
| 13,301,716 |
Explanatory Notes to the Financial Statement
(In thousands of Reais, except when otherwise indicated)
Accounting policy:
Subsidiaries are all entities over which the Company has control, are fully consolidated from the date of acquisition of control and deconsolidated when control ceases to exist. Control is obtained when the Company is exposed or entitled to variable returns based on its involvement with the investee and has the ability to affect those returns through the power exercised in relation to the investee. Specifically, the Company controls an investee if, and only if, it has: • Power over the investee (i.e., existing rights that give it the current ability to direct the relevant activities of the investee); • Exposure or right to variable returns arising from its involvement with the investee; and • The ability to use its power over the investee to affect the value of its returns. There is usually a presumption that a majority of voting rights results in control. To support this presumption and when the Company has less than a majority of the voting rights of an investee, we consider all relevant facts and circumstances when assessing whether it has power over an investee, including: • The contractual agreement between the investor and other holders of voting rights; • Rights arising from other contractual agreements; and • The Company's voting rights and potential voting rights. Using consistent accounting policies, subsidiaries' financial statements are prepared for the same reporting period as the parent company. Adjustments are made to the financial statements of the subsidiaries in order to conform their accounting policies to those of the Company. On consolidation, all transactions between related parties are eliminated. Unrealized gains resulting from transactions with investees recorded using the equity method are written off against the investment in proportion to the Company's ownership interest in the investee. Unrealized losses are eliminated in the same manner, but only if no evidence of impairment exists. ii. Associates Associates are entities over whose financial and operating policies the Company has significant influence, but neither control nor joint control. In preparing the consolidated financial statements, intragroup balances and transactions, as well as any unrealized income or expenses arising from intragroup transactions, are written off. In accordance with the equity method, the equity interest of associates attributable to the Company in the profit or loss for the exercise of such investments is recorded in the income statement, under “Equity in earnings”. Unrealized gains and losses arising from transactions between the Company and its investees are written off in proportion to the Company's ownership stake in these investees. Other comprehensive income of subsidiaries, associates, and joint ventures is recorded directly under "Other comprehensive income" in the Company's shareholders' equity. iii. Investments in affiliates with significant influence Significant influence is the power to participate in decisions about financial and operational policies of an investee, but without individual or joint control of these policies. If the investor holds directly or indirectly less than twenty per cent of the investee’s voting power, it is presumed that he has no significant influence unless that influence can be clearly demonstrated. For investments with a stake of less than 20 percent, the company conducts the appropriate valuations to determine whether it has significant influence. Participations in investments with significant influence are valued by the equity method and, when applicable, deducted from provision for losses by recoverable value (impairment). Unrealized gains resulting from transactions with investments recorded using the equity method are written off in proportion to the Company's ownership interest in the investee. Unrealized losses are written off in the same manner, but only if there is no evidence of an impairment loss. |
Explanatory Notes to the Financial Statement
(In thousands of Reais, except when otherwise indicated)
The Company's subsidiaries and associates are listed below:
| 12/31/2023 |
| 12/31/2022 |
Directly owned subsidiaries excluding treasury shares |
|
|
|
Cosan Corporate |
|
|
|
Cosan Corretora de Seguros Ltda | 100.00% |
| 100.00% |
Cosan Nove Participações S.A. | 73.09% |
| 73.09% |
Cosan Luxembourg S.A. (i) | 100.00% |
| 100.00% |
Cosan Overseas Limited | 100.00% |
| 100.00% |
Pasadena Empreendimentos e Participações S.A. | 100.00% |
| 100.00% |
Cosan Limited Partners Brasil Consultoria Ltda. | 97.50% |
| 97.50% |
Barrapar Participaçoes Ltda. | 100.00% |
| 100.00% |
Aldwych Temple | 100.00% |
| 100.00% |
Vale S.A (vi) | 4.90% |
| — |
Cosan Oito S.A. | 100.00% |
| 100.00% |
Cosan Global Limited | 100.00% |
| 100.00% |
Atlântico Participações Ltda. | 100.00% |
| 100.00% |
Sinlog Tecnologia em Logística S.A. (ii) | - |
| 57.48% |
Cosan Dez Participações S.A. | 76.80% |
| 76.80% |
Radar |
|
|
|
Radar Propriedades Agrícolas S.A. (iii) | 50.00% |
| 50.00% |
Radar II Propriedades Agrícolas S.A. (iii) | 50.00% |
| 50.00% |
Nova Agrícola Ponte Alta S.A. (iii) | 50.00% |
| 50.00% |
Nova Amaralina S.A Propriedades Agrícolas (iii) | 50.00% |
| 50.00% |
Nova Santa Bárbara Agrícola S.A.(iii) | 50.00% |
| 50.00% |
Terras da Ponta Alta S.A. (iii) | 50.00% |
| 50.00% |
Castanheira Propriedades Agrícolas S.A. (iii) | 50.00% |
| 50.00% |
Manacá Propriedades Agrícolas S.A. (iii) | 50.00% |
| 50.00% |
Paineira Propriedades Agrícolas S.A. (iii) | 50.00% |
| 50.00% |
Tellus Brasil Participações S.A. (iv) | 20.00% |
| 20.00% |
Janus Brasil Participações S.A. (iv) | 20.00% |
| 20.00% |
Duguetiapar Empreendimentos e Participações S.A. (iv) | 20.00% |
| 20.00% |
Gamiovapar Empreendimentos e Participações S.A. (iv) | 20.00% |
| 20.00% |
Moove |
|
|
|
Moove Lubricants Holdings | 70.00% |
| 70.00% |
Rumo |
|
|
|
Rumo S.A. (v) | 30.42% |
| 30.35% |
| (i) | Despite presenting an unsecured liability amount of R$146,276 as at December 31, 2023, as shown below, no other events or conditions were identified that, individually or collectively, may raise relevant doubts as to the ability to maintenance of its operational continuity. Subsidiaries have financial support from the Company. | |
| (ii) | Sale of interest completed on May 2, 2023, for R$45,000 | |
| (iii) | The Company is the majority shareholder, holding 50% of the capital stock plus one share. | |
| (iv) | The Company holds more than 60.00% of the voting shares of each entity, has decision-making power over the relevant activities of each entity and has the right to appoint a majority of the members of the board of directors of each entity pursuant to a shareholders' agreement entered with certain other shareholders of these entities. | |
| (v) | The Company is the largest shareholder. In addition, the Company has decision-making power over the relevant activities of this entity and has the right to appoint a majority of the members of the board of directors in accordance with the shareholders' agreement entered with certain other shareholders of the entity. | |
| (vi) | From November 30, 2023, the Company began to have significant influence in Vale S.A as explained in note 1.1, recognizing equity under its equity through Cosan Oito. The value of 4.9% refers to the percentage of participation excluding treasury shares to calculate equity and receive dividends. |
Explanatory Notes to the Financial Statement
(In thousands of Reais, except when otherwise indicated)
The following are investments in subsidiaries and related companies as of December 31, 2023, which are relevant to the Company:
a) Parent company
| Shares issued by the associate |
| Shares held by Cosan |
| Cosan ownership interest |
| Economic benefit (%) |
Cosan Corporate |
|
|
|
|
|
|
|
Cosan Corretora de Seguros Ltda | 5,000 |
| 4,999 |
| 100.00% |
| 100.00% |
Cosan Nove Participações S.A. (i) | 7,663,761,735 |
| 5,601,178,095 |
| 73.09% |
| 66.16% |
Cosan Luxembourg S.A. | 500,010 |
| 500,010 |
| 100.00% |
| 100.00% |
Cosan Overseas Limited | 4,850,000 |
| 4,850,000 |
| 100.00% |
| 100.00% |
Pasadena Empreendimentos e Participações S.A. | 41,481,296 |
| 41,481,046 |
| 100.00% |
| 100.00% |
Cosan Limited Partners Brasil Consultoria Ltda | 160,000 |
| 156,000 |
| 97.50% |
| 97.50% |
Cosan Oito S.A. | 8,194,005,000 |
| 8,194,005,000 |
| 100.00% |
| 100.00% |
Cosan Global Limited | 300 |
| 300 |
| 100.00% |
| 100.00% |
Atlântico Participações Ltda. | 928,005,000 |
| 928,004,997 |
| 100.00% |
| 100.00% |
Cosan Dez Participações S.A. (i) | 3,473,458,687 |
| 2,667,494,858 |
| 76.80% |
| 72.00% |
Radar |
|
|
|
|
|
|
|
Radar Propriedades Agrícolas S.A. | 737,500 |
| 305,694 |
| 41.45% |
| 41.45% |
Radar II Propriedades Agrícolas S.A. | 81,440,221 |
| 40,720,111 |
| 50.00% |
| 50.00% |
Nova Agrícola Ponte Alta S.A. | 160,693,378 |
| 66,607,405 |
| 41.45% |
| 41.45% |
Nova Amaralina S.A Propriedades Agrícolas | 30,603,159 |
| 12,685,010 |
| 41.45% |
| 41.45% |
Nova Santa Bárbara Agrícola S.A. | 32,336,994 |
| 13,403,684 |
| 41.45% |
| 41.45% |
Terras da Ponte Alta S.A. | 16,066,329 |
| 6,659,494 |
| 41.45% |
| 41.45% |
Castanheira Propriedades Agrícolas S.A. | 83,850,938 |
| 34,756,214 |
| 41.45% |
| 41.45% |
Manacá Propriedades Agrícolas S.A. | 128,977,921 |
| 53,461,349 |
| 41.45% |
| 41.45% |
Paineira Propriedade Agrícolas S.A. | 132,667,061 |
| 54,990,497 |
| 41.45% |
| 41.45% |
Tellus Brasil Participações S.A. | 119,063,044 |
| 71,609,945 |
| 60.14% |
| 19.57% |
Janus Brasil Participações S.A. | 286,370,051 |
| 173,464,883 |
| 60.57% |
| 19.57% |
Duguetiapar Empreendimentos e Participações S.A. | 3,573,842 |
| 2,163,979 |
| 60.55% |
| 19.57% |
Gamiovapar Empreendimentos e Participações S.A. | 12,912,970 |
| 7,819,194 |
| 60.55% |
| 19.57% |
Moove |
|
|
|
|
|
|
|
Moove Lubricants Holdings | 34,963,764 |
| 24,474,635 |
| 70.00% |
| 70.00% |
Rumo |
|
|
|
|
|
|
|
Rumo S.A. (ii) | 1,854,868,949 |
| 562,529,490 |
| 30.42% |
| 30.42% |
| (i) | The participation related to economic benefit differs from the corporate participation exclusively on account of dividend distribution as explanatory note 1.1. | |
| (ii) | On July 19, 2023, the subsidiary Rumo S.A. and the indirect subsidiary Rumo Malha Norte called their respective Extraordinary General Assemblies – AGEs, approving the corporate acts relating to the Corporate Reorganization, as communicated by Rumo S.A to the market on the dates of 20 April, June 2nd and June 19th, 2023. |
Explanatory Notes to the Financial Statement
(In thousands of Reais, except when otherwise indicated)
| At January 1, 2023 |
| Interest in earnings of subsidiaries |
| Discontinued operation |
| Change of equity interest in subsidiary |
| Asset and liability valuation adjustment |
| Dividends |
| Capital (reduction) increase |
| Gain (loss) with capital increase in subsidiary |
| Other |
| At December 31, 2023 |
| Dividend receivable(ii) |
Rumo |
|
|
|
|
|
|
|
|
|
|
|
|
|
|
|
|
|
|
|
|
|
Rumo S.A. | 4,613,248 |
| 218,623 |
| — |
| 6,323 |
| (391) |
| (51,986) |
| 3,984 |
| — |
| (23,335) |
| 4,766,466 |
| 51,986 |
Cosan Corporate |
|
|
|
|
|
|
|
|
|
|
|
|
|
|
|
|
|
|
|
|
|
Cosan Corretora de Seguros Ltda | 244 |
| 1,013 |
| — |
| — |
| — |
| — |
| — |
| — |
| — |
| 1,257 |
| — |
Cosan Nove Participações S.A. | 7,153,764 |
| 661,434 |
| — |
| — |
| (39,996) |
| (88,496) |
| 121,621 |
| (32,732) |
| 35,183 |
| 7,810,778 |
| — |
Cosan Dez Participações S.A. | 4,311,213 |
| 825,074 |
| 15,654 |
| — |
| 1,502 |
| 33,456 |
| 5 |
| — |
| (7,740) |
| 5,179,164 |
| 11,717 |
Pasadena Empreendimentos e Participações S.A. | 1,486 |
| (34) |
| — |
| — |
| — |
| — |
| — |
| — |
| — |
| 1,452 |
| — |
Cosan Limited Partners Brasil Consultoria Ltda | 346 |
| (68) |
| — |
| — |
| — |
| — |
| — |
| — |
| — |
| 278 |
| — |
Other | 73,565 |
| (45,030) |
| — |
| — |
| (1,055) |
| — |
| — |
| — |
| (2,368) |
| 25,112 |
| — |
Cosan Oito S.A. | 8,258,622 |
| (346,359) |
| — |
| — |
| 11,230 |
| (246,384) |
| 2,716,500 |
| — |
| (17,326) |
| 10,376,283 |
| — |
Atlântico Participações Ltda | 911,342 |
| (8,921) |
| — |
| — |
| — |
| — |
| — |
| — |
| — |
| 902,421 |
| 190 |
Cosan Global | 128,868 |
| (9,513) |
| — |
| — |
| — |
| — |
| — |
| — |
| — |
| 119,355 |
| — |
Sinlog Tecnologia em Logística S.A. (i) | 20,155 |
| (2,661) |
| — |
| — |
| — |
| — |
| — |
| 12,622 |
| (30,116) |
| — |
| — |
Radar |
|
|
|
|
|
|
|
|
|
|
|
|
|
|
|
|
|
|
|
|
|
Radar II Propriedades Agrícolas S.A. | 943,255 |
| 174,346 |
| — |
| — |
| — |
| 37,831 |
| (1,902) |
| — |
| — |
| 1,153,530 |
| 8,199 |
Radar Propriedades Agrícolas S.A. | 222,967 |
| 4,331 |
| — |
| — |
| — |
| (4,677) |
| (7,275) |
| — |
| — |
| 215,346 |
| — |
Nova Agrícola Ponte Alta S.A. | 390,615 |
| 35,196 |
| — |
| — |
| — |
| 16,010 |
| — |
| — |
| — |
| 441,821 |
| 1,960 |
Nova Santa Bárbara Agrícola S.A. | 31,504 |
| (3,141) |
| — |
| — |
| — |
| (415) |
| — |
| — |
| — |
| 27,948 |
| 1,712 |
Nova Amaralina S.A. Propriedades Agrícolas | 192,332 |
| 12,971 |
| — |
| — |
| — |
| 14,881 |
| — |
| — |
| — |
| 220,184 |
| — |
Terras da Ponte Alta S.A. | 81,292 |
| 14,440 |
| — |
| — |
| — |
| (3,610) |
| — |
| — |
| — |
| 92,122 |
| 11,072 |
Paineira Propriedades Agrícolas S.A. | 169,216 |
| 40,115 |
| — |
| — |
| — |
| 1,404 |
| — |
| — |
| — |
| 210,735 |
| 4,433 |
Manacá Propriedades Agrícolas S.A. | 170,613 |
| 40,163 |
| — |
| — |
| — |
| 19 |
| (1,151) |
| — |
| — |
| 209,644 |
| 2,694 |
Castanheira Propriedades Agrícolas S.A. | 251,370 |
| 52,944 |
| — |
| — |
| — |
| 27,139 |
| — |
| — |
| — |
| 331,453 |
| 4,863 |
Tellus Brasil Participações S.A. | 634,068 |
| 138,418 |
| — |
| — |
| — |
| (9,970) |
| (4,526) |
| — |
| 16,847 |
| 774,837 |
| — |
Janus Brasil Participações S.A. | 884,053 |
| 227,451 |
| — |
| — |
| — |
| (18,407) |
| — |
| — |
| 29,595 |
| 1,122,692 |
| — |
Duguetiapar Empreendimentos e Participações S.A. | 18,740 |
| 6,441 |
| — |
| — |
| — |
| (7,458) |
| — |
| — |
| (2) |
| 17,721 |
| — |
Gamiovapar Empreendimentos e Participações S.A. | 122,561 |
| 4,731 |
| — |
| — |
| — |
| (11,654) |
| (1,231) |
| — |
| (71) |
| 114,336 |
| — |
Moove |
|
|
|
|
|
|
|
|
|
|
|
|
|
|
|
|
|
|
|
|
|
Moove Lubricants Holdings | 1,644,170 |
| 193,618 |
| — |
| — |
| (183,732) |
| (35,808) |
| — |
| — |
| 7,968 |
| 1,626,216 |
| 368 |
Other | 762 |
| 290 |
| — |
| — |
| (57) |
| (368) |
| — |
| — |
| — |
| 627 |
| — |
Total investments in associates | 31,230,371 |
| 2,235,872 |
| 15,654 |
| 6,323 |
| (212,499) |
| (348,493) |
| 2,826,025 |
| (20,110) |
| 8,635 |
| 35,741,778 |
| 99,194 |
Cosan Corporate |
|
|
|
|
|
|
|
|
|
|
|
|
|
|
|
|
|
|
|
|
|
Cosan Luxembourg S.A. | (146,473) |
| 197 |
| — |
| — |
| — |
| — |
| — |
| — |
| — |
| (146,276) |
| — |
Total provision for uncovered liability of associates | (146,473) |
| 197 |
| — |
| — |
| — |
| — |
| — |
| — |
| — |
| (146,276) |
| — |
Total | 31,083,898 |
| 2,236,069 |
| 15,654 |
| 6,323 |
| (212,499) |
| (348,493) |
| 2,826,025 |
| (20,110) |
| 8,635 |
| 35,595,502 |
| 99,194 |
| (i) | On March 10, 2023, Sinlog Tecnologia was transferred to Logística S.A. for assets held for sale, and consequently their definitive sale as detailed in the explanatory note 2. | |
| (ii) | Dividends receivable by Cosan S.A. from its subsidiaries. |
Explanatory Notes to the Financial Statement
(In thousands of Reais, except when otherwise indicated)
| At January 1, 2022 |
| Interest in earnings of subsidiaries |
| Discontinued operation |
| Change of equity interest in subsidiary |
| Asset and liability valuation adjustment |
| Dividends |
| Capital increase |
| Investment reclassification |
| Contributed capital |
| Bargain purchase |
| Business combination |
| Other |
| At December 31, 2022 |
| Dividend receivable |
Rumo |
|
|
|
|
|
|
|
|
|
|
|
|
|
|
|
|
|
|
|
|
|
|
|
|
|
|
|
Rumo S.A. | 4,490,787 |
| 156,420 |
| — |
| 1,344 |
| 1,837 |
| (37,140) |
| — |
| — |
| — |
| — |
| — |
| — |
| 4,613,248 |
| 37,131 |
Cosan Corporate |
|
|
|
|
|
|
|
|
|
|
|
|
|
|
|
|
|
|
|
|
|
|
|
|
|
|
|
Compass Gás e Energia | — |
| — |
| — |
| — |
| — |
| — |
| — |
| — |
| — |
| — |
| — |
| — |
| — |
| — |
Cosan Corretora de Seguros Ltda | — |
| 239 |
| — |
| — |
| — |
| — |
| 5 |
| — |
| — |
| — |
| — |
| — |
| 244 |
| — |
Cosan Nove Participações S.A. | — |
| 142,169 |
| — |
| 1,416,657 |
| 27,530 |
| (33,765) |
| — |
| — |
| 5,601,173 |
| — |
| — |
| — |
| 7,153,764 |
| 33,765 |
Cosan Dez Participações S.A. | — |
| 32,154 |
| 17,180 |
| 2,558,635 |
| 16,882 |
| (11,717) |
| 138,933 |
| — |
| 1,559,146 |
| — |
| — |
| — |
| 4,311,213 |
| 48,745 |
Pasadena Empreendimentos e Participações S.A. | 879 |
| (93) |
| — |
| — |
| — |
| — |
| 700 |
| — |
| — |
| — |
| — |
| — |
| 1,486 |
| — |
Cosan Limited Partners Brasil Consultoria Ltda | 555 |
| (209) |
| — |
| — |
| — |
| — |
| — |
| — |
| — |
| — |
| — |
| — |
| 346 |
| — |
Other | 68,768 |
| 1,871 |
| — |
| — |
| 1,959 |
| — |
| — |
| — |
| — |
| — |
| — |
| 1,729 |
| 74,327 |
| — |
Cosan Oito S.A. | — |
| 522,783 |
| — |
| — |
| — |
| (124,161) |
| 7,860,000 |
| — |
| — |
| — |
| — |
| — |
| 8,258,622 |
| 124,161 |
Atlântico Participações Ltda | 433,615 |
| (1,497) |
| — |
| — |
| — |
| — |
| 479,224 |
| — |
| — |
| — |
| — |
| — |
| 911,342 |
| 190 |
Cosan Global | 137,527 |
| (8,659) |
| — |
| — |
| — |
| — |
| — |
| — |
| — |
| — |
| — |
| — |
| 128,868 |
| — |
Sinlog Tecnologia em Logística S.A. | 17,052 |
| (12,318) |
| — |
| 9,339 |
| — |
| — |
| 6,082 |
| — |
| — |
| — |
| — |
| — |
| 20,155 |
| — |
Radar |
|
|
|
|
|
|
|
|
|
|
|
|
|
|
|
|
|
|
|
|
|
|
|
|
|
|
|
Radar II Propriedades Agrícolas S.A. | — |
| 246,698 |
| — |
| — |
| 108 |
| (60,482) |
| — |
| 756,931 |
| — |
| — |
| — |
| — |
| 943,255 |
| 85,517 |
Radar Propriedades Agrícolas S.A. | — |
| 34,002 |
| — |
| — |
| — |
| (9,614) |
| — |
| 198,579 |
| — |
| — |
| — |
| — |
| 222,967 |
| 11,797 |
Nova Agrícola Ponte Alta S.A. | — |
| 97,035 |
| — |
| — |
| — |
| (25,459) |
| — |
| 319,039 |
| — |
| — |
| — |
| — |
| 390,615 |
| 30,069 |
Nova Santa Bárbara Agrícola S.A. | — |
| 8,000 |
| — |
| — |
| — |
| (1,981) |
| — |
| 25,485 |
| — |
| — |
| — |
| — |
| 31,504 |
| 1,981 |
Nova Amaralina S.A. Propriedades Agrícolas | — |
| 53,686 |
| — |
| — |
| — |
| (14,098) |
| — |
| 152,744 |
| — |
| — |
| — |
| — |
| 192,332 |
| 19,358 |
Terras da Ponte Alta S.A. | — |
| 39,890 |
| — |
| — |
| — |
| (8,907) |
| — |
| 50,309 |
| — |
| — |
| — |
| — |
| 81,292 |
| 8,990 |
Paineira Propriedades Agrícolas S.A. | — |
| 58,604 |
| — |
| — |
| — |
| (15,790) |
| — |
| 126,402 |
| — |
| — |
| — |
| — |
| 169,216 |
| 13,028 |
Manacá Propriedades Agrícolas S.A. | — |
| 46,793 |
| — |
| — |
| — |
| (13,259) |
| — |
| 137,079 |
| — |
| — |
| — |
| — |
| 170,613 |
| 12,347 |
Castanheira Propriedades Agrícolas S.A. | — |
| 77,819 |
| — |
| — |
| — |
| (25,776) |
| — |
| 199,327 |
| — |
| — |
| — |
| — |
| 251,370 |
| 40,831 |
Violeta Fundo de Investimento Multimercado | 2,119,143 |
| 107,133 |
| — |
| — |
| 11,035 |
| (132,885) |
| — |
| (2,104,426) |
| — |
| — |
| — |
| — |
| — |
|
|
Tellus Brasil Participações S.A. | 142,795 |
| 99,855 |
| — |
| — |
| — |
| (26,410) |
| — |
| 58,806 |
| — |
| 37,578 |
| 363,211 |
| (41,767) |
| 634,068 |
| 5,086 |
Janus Brasil Participações S.A. | 183,356 |
| 126,508 |
| — |
| — |
| — |
| (122,661) |
| — |
| 79,725 |
| — |
| 49,224 |
| 567,901 |
| — |
| 884,053 |
| — |
Duguetiapar Empreendimentos e Participações S.A. | — |
| 1,453 |
| — |
| — |
| — |
| — |
| — |
| — |
| — |
| 1,798 |
| 10,022 |
| 5,467 |
| 18,740 |
| — |
Gamiovapar Empreendimentos e Participações S.A. | — |
| 9,020 |
| — |
| — |
| — |
| — |
| — |
| — |
| — |
| 10,741 |
| 66,500 |
| 36,300 |
| 122,561 |
| — |
Payly Soluções de Pagamentos S.A. | 9,607 |
| (3,748) |
| — |
| — |
| — |
| — |
| — |
| — |
| — |
| — |
| — |
| (5,859) |
| — |
| — |
Moove |
|
|
|
|
|
|
|
|
|
|
|
|
|
|
|
|
|
|
|
|
|
|
|
|
|
|
|
Moove Lubricants Holdings | 1,600,170 |
| 340,621 |
| — |
| — |
| 11,801 |
| (308,422) |
| — |
| — |
| — |
| — |
| — |
| — |
| 1,644,170 |
| 136,460 |
Other | — |
| — |
| — |
| — |
| — |
| — |
| — |
| — |
| — |
| — |
| — |
| — |
| — |
| — |
Compass |
|
|
|
|
|
|
|
|
|
|
|
|
|
|
|
|
|
|
|
|
|
|
|
|
|
|
|
Compass Gás e Energia | 5,583,215 |
| 1,523,381 |
| — |
| (891) |
| (11,688) |
| (1,437,213) |
| — |
| — |
| (5,656,804) |
| — |
| — |
| — |
| — |
|
|
Total investments in associates | 14,787,469 |
| 3,699,610 |
| 17,180 |
| 3,985,084 |
| 59,464 |
| (2,409,740) |
| 8,484,944 |
| — |
| 1,503,515 |
| 99,341 |
| 1,007,634 |
| (4,130) |
| 31,230,371 |
| 609,456 |
Cosan Corporate |
|
|
|
|
|
|
|
|
|
|
|
|
|
|
|
|
|
|
|
|
|
|
|
|
|
|
|
Cosan Luxembourg S.A. | (356,442) |
| 209,969 |
| — |
| — |
| — |
| — |
| — |
| — |
| — |
| — |
| — |
| — |
| (146,473) |
| — |
Total provision for uncovered liability of associates | (356,442) |
| 209,969 |
| — |
| — |
| — |
| — |
| — |
| — |
| — |
| — |
| — |
| — |
| (146,473) |
| — |
Total | 14,431,027 |
| 3,909,579 |
| 17,180 |
| 3,985,084 |
| 59,464 |
| (2,409,740) |
| 8,484,944 |
| — |
| 1,503,515 |
| 99,341 |
| 1,007,634 |
| (4,130) |
| 31,083,898 |
| 609,456 |
Explanatory Notes to the Financial Statement
(In thousands of Reais, except when otherwise indicated)
Financial information of subsidiaries and associates:
| Balance as of December 31, 2023 |
| Balance as of December 31, 2022 | ||||||||||||
| Assets |
| Liabilities |
| Shareholders' equity and unsecured liabilities |
| Net income for the year |
| Assets |
| Liabilities |
| Shareholders' equity and unsecured liabilities |
| Net income for the year |
Rumo |
|
|
|
|
|
|
|
|
|
|
|
|
|
|
|
Rumo S.A. | 49,238,439 |
| (33,367,447) |
| 15,870,992 |
| 721,915 |
| 45,951,748 |
| (30,541,294) |
| 15,410,454 |
| 514,022 |
Cosan Corporate |
|
|
|
|
|
|
|
|
|
|
|
|
|
|
|
Cosan Corretora de Seguros Ltda | 1,475 |
| (218) |
| 1,257 |
| 1,013 |
| 245 |
| (2) |
| 243 |
| 239 |
Cosan Nove Participações S.A. | 10,378,188 |
| (393) |
| 10,377,795 |
| 999,748 |
| 9,957,152 |
| (169,079) |
| 9,788,073 |
| 194,522 |
Cosan Dez Participações S.A. | 29,394,359 |
| (19,707,826) |
| 9,686,533 |
| 1,804,326 |
| 25,124,201 |
| (16,642,318) |
| 8,481,883 |
| 62,650 |
Pasadena Empreendimentos e Participações S.A. | 2,013 |
| (561) |
| 1,452 |
| (33) |
| 2,048 |
| (562) |
| 1,486 |
| (93) |
Cosan Limited Partners Brasil Consultoria Ltda | 287 |
| — |
| 287 |
| (69) |
| 357 |
| (1) |
| 356 |
| 214 |
Cosan Luxembourg S.A. | 8,141,418 |
| (8,287,693) |
| (146,275) |
| 198 |
| 7,394,386 |
| (7,540,859) |
| (146,473) |
| 209,969 |
Cosan Oito S.A. | 17,148,403 |
| (6,772,114) |
| 10,376,289 |
| (346,359) |
| 21,105,355 |
| (12,846,728) |
| 8,258,627 |
| 522,783 |
Atlântico Participações Ltda | 992,412 |
| (89,991) |
| 902,421 |
| (8,921) |
| 981,457 |
| (70,115) |
| 911,342 |
| (1,497) |
Cosan Global | 119,355 |
| — |
| 119,355 |
| (9,513) |
| 128,868 |
| — |
| 128,868 |
| (8,659) |
Sinlog Tecnologia em Logística S.A. | — |
| — |
| — |
| — |
| 18,503 |
| (8,901) |
| 9,602 |
| (1,764) |
Radar |
|
|
|
|
|
|
|
|
|
|
|
|
|
|
|
Radar II Propriedades Agrícolas S.A. | 2,378,123 |
| (91,077) |
| 2,287,046 |
| 332,222 |
| 2,089,843 |
| (224,131) |
| 1,865,712 |
| 509,131 |
Radar Propriedades Agrícolas S.A. | 549,223 |
| (29,692) |
| 519,531 |
| 10,448 |
| 590,386 |
| (52,469) |
| 537,917 |
| 97,663 |
Nova Agrícola Ponte Alta S.A. | 1,108,509 |
| (42,596) |
| 1,065,913 |
| 84,912 |
| 1,039,678 |
| (97,302) |
| 942,377 |
| 245,687 |
Nova Santa Bárbara Agrícola S.A. | 78,808 |
| (11,380) |
| 67,428 |
| (7,577) |
| 86,364 |
| (10,360) |
| 76,005 |
| 20,127 |
Nova Amaralina S.A. Propriedades Agrícolas | 563,096 |
| (31,890) |
| 531,206 |
| 31,292 |
| 534,096 |
| (70,085) |
| 464,012 |
| 136,048 |
Terras da Ponte Alta S.A. | 259,687 |
| (37,436) |
| 222,251 |
| 34,838 |
| 224,952 |
| (28,830) |
| 196,122 |
| 96,754 |
Paineira Propriedades Agrícolas S.A. | 537,119 |
| (28,711) |
| 508,408 |
| 96,780 |
| 453,093 |
| (44,851) |
| 408,242 |
| 152,373 |
Manacá Propriedades Agrícolas S.A. | 530,358 |
| (24,585) |
| 505,773 |
| 96,894 |
| 451,728 |
| (40,117) |
| 411,611 |
| 127,955 |
Castanheira Propriedades Agrícolas S.A. | 840,064 |
| (40,418) |
| 799,646 |
| 127,731 |
| 729,294 |
| (122,854) |
| 606,440 |
| 248,744 |
Tellus Brasil Participações Ltda | 4,129,945 |
| (171,300) |
| 3,958,645 |
| 707,176 |
| 3,533,817 |
| (294,358) |
| 3,239,459 |
| 1,424,072 |
Janus Brasil Participações S.A. | 6,017,992 |
| (282,158) |
| 5,735,834 |
| 1,162,047 |
| 5,031,454 |
| (514,828) |
| 4,516,626 |
| 1,910,077 |
Duguetiapar Empreendimentos e Participações S.A. | 97,542 |
| (7,008) |
| 90,534 |
| 32,906 |
| 98,862 |
| (3,124) |
| 95,739 |
| 19,403 |
Gamiovapar Empreendimentos e Participações S.A. | 617,029 |
| (32,890) |
| 584,139 |
| 24,170 |
| 644,621 |
| (21,462) |
| 623,159 |
| 119,273 |
Moove |
|
|
|
|
|
|
|
|
|
|
|
|
|
|
|
Moove Lubricants Holdings | 7,969,260 |
| (5,649,161) |
| 2,320,099 |
| 276,938 |
| 8,969,378 |
| (6,620,118) |
| 2,349,260 |
| 486,897 |
Explanatory Notes to the Financial Statement
(In thousands of Reais, except when otherwise indicated)
b) Consolidated
| Shares issued by the investee |
| Shares held by Cosan |
| Cosan ownership interest |
Rumo |
|
|
|
|
|
Rhall Terminais Ltda | 28,580 |
| 8,574 |
| 30.00% |
Termag - Terminal Marítimo de Guarujá S.A. | 500,000 |
| 99,246 |
| 19.85% |
TGG - Terminal de Granéis do Guarujá S.A. | 79,747,000 |
| 7,914,609 |
| 9.92% |
Elevações Portuárias S.A. | 672,397,254 |
| 134,479,451 |
| 20.00% |
Terminal XXXIX S.A. | 200,000 |
| 99,246 |
| 49.62% |
Compass |
|
|
|
|
|
Gás de Alagoas S.A. – ALGÁS | 810,896,963 |
| 238,728,878 |
| 29.44% |
Companhia de Gás do Ceará – Cegás | 39,400,000 |
| 11,599,428 |
| 29.44% |
CEG Rio S.A. | 1,995,022,625 |
| 746,251,086 |
| 37.41% |
Companhia Paranaense de Gás - Compagás | 33,600,000 |
| 8,232,000 |
| 24.50% |
Companhia Potiguar de Gás – Potigas | 4,245,000 |
| 3,523,350 |
| 83.00% |
Companhia de Gás de Mato Grosso do Sul - Msgás | 61,610,000 |
| 30,188,900 |
| 49.00% |
Companhia de Gás de Santa Catarina - Scgás | 10,749,497 |
| 4,407,293 |
| 41.00% |
Sergipe Gás S.A. – SERGÁS | 1,593,656 |
| 661,363 |
| 41.50% |
Companhia Pernambucana de Gás - Copergás | 163,485,912 |
| 67,846,653 |
| 41.50% |
Cosan Corporate |
|
|
|
|
|
Vale S.A | 4,539,007,580 |
| 190,965,062 |
| 4.90% |
Explanatory Notes to the Financial Statement
(In thousands of Reais, except when otherwise indicated)
| At January 1, 2023 |
| Interest in earnings of subsidiaries |
| Discontinued operation |
| Dividends |
| Capital reduction |
| Reclassification to held for sale |
| Reclassification of financial assets |
| Other (ii) |
| At December 31, 2023 |
| Dividend receivable (i) |
Rumo |
|
|
|
|
|
|
|
|
|
|
|
|
|
|
|
|
|
|
|
Rhall Terminais Ltda | 5,654 |
| 1,716 |
| — |
| (1,200) |
| — |
| — |
| — |
| — |
| 6,170 |
| — |
Termag - Terminal Marítimo de Guarujá S.A. | 8,464 |
| (2,446) |
| — |
| — |
| — |
| — |
| — |
| — |
| 6,018 |
| — |
TGG - Terminal de Granéis do Guarujá S.A. | 17,468 |
| 8,826 |
| — |
| (10,334) |
| — |
| — |
| — |
| — |
| 15,960 |
| — |
Elevações Portuárias S.A. | 296,746 |
| 38,992 |
| — |
| (18,960) |
| (99,040) |
| — |
| — |
| — |
| 217,738 |
| — |
Terminal XXXIX S.A. | 53,136 |
| 28,247 |
| — |
| (14,968) |
| — |
| — |
| — |
| — |
| 66,415 |
| — |
Compass |
|
|
|
|
|
|
|
|
|
|
|
|
|
|
|
|
|
|
|
Companhia Paranaense de Gás - Compagás | 424,837 |
| 36,300 |
| — |
| (57,956) |
| — |
| — |
| — |
| 351 |
| 403,532 |
| 5,636 |
Companhia Pernambucana de Gás - Copergás | 415,301 |
| — |
| 5,921 |
| (19,238) |
| — |
| (401,984) |
| — |
| — |
| — |
| — |
Companhia de Gás de Santa Catarina - Scgás | 627,829 |
| 37,028 |
| — |
| (24,525) |
| — |
| — |
| — |
| — |
| 640,332 |
| 6,957 |
Sergipe Gás S.A. - SERGÁS | 69,430 |
| — |
| 3,230 |
| (5,466) |
| — |
| (67,194) |
| — |
| — |
| — |
| — |
Companhia de Gás do Ceará - Cegás | 184,537 |
| — |
| 11,573 |
| (13,676) |
| — |
| (183,880) |
| — |
| 1,446 |
| — |
| — |
CEG Rio S.A. | 274,480 |
| 84,822 |
| — |
| (70,916) |
| — |
| — |
| — |
| — |
| 288,386 |
| 20,708 |
Companhia de Gás de Mato Grosso do Sul - Msgás | 291,543 |
| 20,828 |
| — |
| (14,497) |
| — |
| — |
| — |
| — |
| 297,874 |
| 2,496 |
Companhia Potiguar de Gás - Potigas | 168,887 |
| — |
| 14,371 |
| (13,118) |
| — |
| (170,140) |
| — |
| — |
| — |
| — |
Gás de Alagoas S.A. - Algás | 68,448 |
| — |
| 10,324 |
| (8,492) |
| — |
| (69,656) |
| — |
| (624) |
| — |
| — |
Cosan Corporate |
|
|
|
|
|
|
|
|
|
|
|
|
|
|
|
|
|
|
|
Vale S.A | — |
| 96,075 |
| — |
| — |
| — |
| — |
| 16,274,081 |
| (707,671) |
| 15,662,485 |
| — |
Other | 7,183 |
| 11 |
| — |
| — |
| — |
| — |
| — |
| (735) |
| 6,459 |
| 39 |
| 2,913,943 |
| 350,399 |
| 45,419 |
| (273,346) |
| (99,040) |
| (892,854) |
| 16,274,081 |
| (707,233) |
| 17,611,369 |
| 35,836 |
| (i) | Dividends receivable by the controlling companies of the subsidiaries disclosed in the table, which are consolidated in Cosan S.A. | |
| (ii) | The balance of others is mainly composed of the cost of the shares sold by Vale S.A. in the amount of R$701,575. |
Explanatory Notes to the Financial Statement
(In thousands of Reais, except when otherwise indicated)
| At January 1, 2022 |
| Interest in earnings of subsidiaries |
| Discontinued operation |
| Change of equity interest in subsidiary |
| Asset valuation adjustment |
| Declared dividends |
| Disposal of investment |
| Contributed capital |
| Business combination |
| Other |
| At December 31, 2022 |
| Dividend receivable (i) |
Rumo |
|
|
|
|
|
|
|
|
|
|
|
|
|
|
|
|
|
|
|
|
|
|
|
Rhall Terminais Ltda | 4,907 |
| 1,647 |
| — |
| — |
| — |
| (900) |
| — |
| — |
| — |
| — |
| 5,654 |
| 71 |
Termag - Terminal Marítimo de Guarujá S.A. | 4,725 |
| 4,445 |
| — |
| — |
| — |
| — |
| — |
| — |
| — |
| (706) |
| 8,464 |
| 151 |
TGG - Terminal de Granéis do Guarujá S.A. | 17,563 |
| 5,689 |
| — |
| — |
| — |
| (5,784) |
| — |
| — |
| — |
| — |
| 17,468 |
| 118 |
Elevações Portuárias S.A. | — |
| 6,190 |
| — |
| 135,159 |
| — |
| — |
| 155,397 |
| — |
| — |
| — |
| 296,746 |
| 717 |
Terminal XXXIX S.A. | 30,649 |
| 22,487 |
| — |
| — |
| — |
| — |
| — |
| — |
| — |
| — |
| 53,136 |
| — |
Compass |
|
|
|
|
|
|
|
|
|
|
|
|
|
|
|
|
|
|
|
|
|
|
|
Companhia Paranaense de Gás - Compagás | — |
| 19,931 |
| — |
| — |
| — |
| (6,831) |
| — |
| — |
| 411,737 |
| — |
| 424,837 |
| 44,121 |
Companhia Pernambucana de Gás - Copergás | — |
| — |
| 19,094 |
| — |
| — |
| (9,493) |
| — |
| — |
| 405,700 |
| — |
| 415,301 |
| 8,300 |
Companhia de Gás de Santa Catarina - Scgás | — |
| 34,885 |
| — |
| — |
| — |
| (15,524) |
| — |
| — |
| 608,468 |
| — |
| 627,829 |
| 16,214 |
Sergipe Gás S.A. - SERGÁS | — |
| — |
| 9,015 |
| — |
| — |
| (3,441) |
| — |
| — |
| 63,856 |
| — |
| 69,430 |
| 3,202 |
Companhia de Gás do Ceará - Cegás | — |
| — |
| 6,717 |
| — |
| — |
| (4,189) |
| — |
| — |
| 182,009 |
| — |
| 184,537 |
| — |
CEG Rio S.A. | — |
| 29,686 |
| — |
| — |
| — |
| (16,542) |
| — |
| — |
| 261,336 |
| — |
| 274,480 |
| 14,968 |
Companhia de Gás de Mato Grosso do Sul - Msgás | — |
| 13,530 |
| — |
| — |
| — |
| (6,160) |
| — |
| — |
| 284,173 |
| — |
| 291,543 |
| 3,837 |
Companhia Potiguar de Gás - Potigas | — |
| — |
| 9,066 |
| — |
| — |
| (8,390) |
| — |
| — |
| 168,211 |
| — |
| 168,887 |
| 7,674 |
Gás de Alagoas S.A. - Algás | — |
| — |
| 5,954 |
| — |
| — |
| (2,985) |
| — |
| — |
| 66,001 |
| (522) |
| 68,448 |
| 2,711 |
Radar |
|
|
|
|
|
|
|
|
|
|
|
|
|
|
|
|
|
|
|
|
|
|
|
Tellus Brasil Participações S.A. | 142,798 |
| 128,860 |
| — |
| — |
| — |
| (30,756) |
| — |
| 58,806 |
| (299,708) |
| — |
| — |
| — |
Janus Brasil Participações S.A. | 183,357 |
| 150,687 |
| — |
| — |
| — |
| (35,559) |
| — |
| 79,725 |
| (378,210) |
| — |
| — |
| — |
Cosan Corporate |
|
|
|
|
|
|
|
|
|
|
|
|
|
|
|
|
|
|
|
|
|
|
|
TUP Porto São Luis S.A. | 394,380 |
| 49 |
| — |
| — |
| — |
| — |
| — |
| — |
| (393,579) |
| (850) |
| — |
| — |
Other | 1,688 |
| 811 |
| — |
| — |
| 5,536 |
| — |
| — |
| — |
| — |
| (852) |
| 7,183 |
| — |
| 780,067 |
| 418,897 |
| 49,846 |
| 135,159 |
| 5,536 |
| (146,554) |
| 155,397 |
| 138,531 |
| 1,379,994 |
| (2,930) |
| 2,913,943 |
| 102,084 |
| (i) | Dividends receivable by the parent companies of the subsidiaries disclosed in the table, which are consolidated in Cosan S.A. |
Explanatory Notes to the Financial Statement
(In thousands of Reais, except when otherwise indicated)
Financial information of subsidiaries and associates
| Balance as of December 31, 2023 |
| Balance as of December 31, 2022 | ||||||||||||
| Assets |
| Liabilities |
| Shareholders' equity and unsecured liabilities |
| Profit for the year |
| Assets |
| Liabilities |
| Shareholders' equity and unsecured liabilities |
| Profit for the year |
Rumo |
|
|
|
|
|
|
|
|
|
|
|
|
|
|
|
Rhall Terminais Ltda. | 33,060 |
| (12,491) |
| 20,569 |
| 5,983 |
| 33,382 |
| (14,534) |
| 18,848 |
| 5,811 |
Elevações Portuárias S.A. | 1,251,643 |
| (444,748) |
| 806,895 |
| 194,954 |
| 950,538 |
| (243,797) |
| 706,741 |
| 127,554 |
Termag - Terminal Marítimo de Guarujá S.A. | 298,815 |
| (268,730) |
| 30,085 |
| 4,721 |
| 273,760 |
| (231,119) |
| 42,641 |
| 19,881 |
TGG - Terminal de Granéis do Guarujá S.A. | 242,779 |
| (73,216) |
| 169,563 |
| 88,867 |
| 254,748 |
| (78,657) |
| 176,091 |
| 58,139 |
Terminal XXXIX S.A. | 481,569 |
| (326,731) |
| 154,838 |
| 53,986 |
| 433,412 |
| (388,882) |
| 44,530 |
| 44,530 |
Compass |
|
|
|
|
|
|
|
|
|
|
|
|
|
|
|
Companhia Paranaense de Gás - Compagás | 1,208,959 |
| (685,288) |
| 523,671 |
| 96,866 |
| 1,115,974 |
| (458,322) |
| 657,652 |
| 161,467 |
Companhia de Gás de Santa Catarina - Scgás | 1,118,237 |
| (399,252) |
| 718,985 |
| 153,217 |
| 1,093,210 |
| (453,632) |
| 639,578 |
| 161,504 |
CEG Rio S.A. | 1,944,385 |
| (1,326,484) |
| 617,901 |
| 233,099 |
| 1,910,875 |
| (1,351,937) |
| 558,938 |
| 150,969 |
Companhia de Gás de Mato Grosso do Sul - Msgás | 390,976 |
| (193,298) |
| 197,678 |
| 56,649 |
| 339,695 |
| (164,774) |
| 174,921 |
| 11,448 |
Cosan Corporate |
|
|
|
|
|
|
|
|
|
|
|
|
|
|
|
Vale S.A. | 423,626,000 |
| (232,661,000) |
| 190,965,000 |
| 39,940,000 |
| — |
| — |
| — |
| — |
Explanatory Notes to the Financial Statement
(In thousands of Reais, except when otherwise indicated)
Accounting policy: Combinations of businesses are recorded using the acquisition method. In general, the consideration transferred in an acquisition, as well as the identifiable net assets acquired and liabilities assumed, are measured at fair value. Any goodwill that develops is annually evaluated for impairment. Unless related to the issuance of debt or equity, transaction expenses are recorded as incurred in the income statement. For each business combination, the Company measures non-controlling interests in the acquisition using one of the following methods:
The transferred consideration excludes amounts related to the liquidation of preexisting relationships. Typically, these amounts are recognized in profit or loss Contingent consideration depends on an acquired business meeting targets within a fixed period. To calculate obligations at the time of acquisition and at each subsequent reporting date, projections of future performance are required. In addition, estimates are required to value the assets and liabilities acquired in business combinations. Intangible assets, such as brands, are frequently a crucial component of an acquired business because they enable us to derive greater value than would be possible otherwise. Measurement of fair values In measuring fair values, valuation techniques were used considering market prices for similar items, discounted cash flow, among others. Since this is a fair value measurement, the accounting for the acquisition will be revisited if new information obtained within one year of the acquisition date regarding the facts and circumstances that existed at the acquisition date indicates adjustments to the amounts mentioned above or any additional provision that existed at the acquisition date. Management's expectation is that only the measurements of intangible assets could have some kind of impact on this evaluation. |
BIOMETANO VERDE PAULÍNIA S.A.
On October 20, 2023, Compass Comercialização acquired a 51% stake in Biometano Verde Paulínia S.A. (“BVP”) for R$247,152, of which R$100,000 via capital contribution, R$135,000 paid in a single installment to the former controlling shareholders and R$12,152 referring to contingent consideration.
BVP is a privately held company based in Brazil whose activities will involve the purification and treatment of Biogas and the production, movement and sale of Biomethane. Compass Comercialização carried out the acquisition in line with the objective of expanding the Marketing & Services segment, offering increasingly complete solutions to its customers towards a safe and efficient energy transition.
In the evaluation carried out by the Company, the acquisition price was allocated as a biogas supply contract, lending contract and licenses for a fair value of R$384,277. Intangible assets will be amortized until 2045.
The fair value of the assets and liabilities acquired is shown below:
Explanatory Notes to the Financial Statement
(In thousands of Reais, except when otherwise indicated)
Consideration transferred |
| 12/31/2023 |
Capital contribution |
| 100,000 |
Cash transfer |
| 135,000 |
Contingent consideration |
| 12,152 |
Consideration transferred |
| 247,152 |
Identifiable assets acquired and liabilities assumed |
|
|
Cash, cash equivalents and restricted cash |
| 100,341 |
Intangible assets |
| 582,238 |
Trade payables |
| (5) |
Other obligations |
| (1) |
Deferred Income Tax (IR) and social contribution (CS) |
| (197,961) |
Non-controlling interest |
| (237,460) |
Liquid and acquired assets |
| 247,152 |
Contingent consideration |
| (12,152) |
Returns on financial investments |
| 341 |
Cash received |
| (100,341) |
Transferred consideration, net of cash |
| 135,000 |
The consolidated income statement includes net profit in the amount of R$1,104 since the acquisition date, respectively generated by BVP. If the acquired subsidiary had been consolidated since January 1, 2023, the consolidated income statement for the year ended December 31, 2023, would show a net profit of R$2,826 (unaudited).
For the purposes of annual procedures, Management evaluated the factors of the business combination and the estimates used.
Explanatory Notes to the Financial Statement
(In thousands of Reais, except when otherwise indicated)
Accounting policy: Transactions with non-controlling equity interests that do not result in a loss of control are accounted for as equity transactions – that is, as transactions with owners in their capacity as owners. |
Below is summarized financial information for each subsidiary that has non-controlling interests that are material to the group. The amounts disclosed for each subsidiary are before intercompany eliminations.
| Shares issued by the subsidiary |
| Shares held by non-controlling shareholders |
| Non-controlling interest |
Radar |
|
|
|
|
|
Tellus Brasil Participações S.A. | 119,063,044 |
| 95,250,435 |
| 80.00% |
Janus Brasil Participações S.A. | 286,370,051 |
| 229,096,041 |
| 80.00% |
Duguetiapar Empreendimentos e Participações S.A. | 3,573,842 |
| 2,859,074 |
| 80.00% |
Gamiovapar Empreendimentos e Participações S.A. | 12,912,970 |
| 10,330,376 |
| 80.00% |
Radar Propriedades Agrícolas S.A. | 737,500 |
| 368,750 |
| 50.00% |
Nova Agrícola Ponte Alta S.A. | 160,693,378 |
| 80,346,689 |
| 50.00% |
Terras da Ponte Alta S.A. | 16,066,329 |
| 8,033,165 |
| 50.00% |
Nova Santa Bárbara Agrícola S.A. | 32,336,994 |
| 16,168,497 |
| 50.00% |
Nova Amaralina S.A. | 30,603,159 |
| 15,301,580 |
| 50.00% |
Paineira Propriedades Agrícolas S.A. | 132,667,061 |
| 66,333,531 |
| 50.00% |
Manacá Propriedades Agrícolas S.A. | 128,977,921 |
| 64,488,961 |
| 50.00% |
Castanheira Propriedades Agrícolas S.A. | 83,850,938 |
| 41,925,469 |
| 50.00% |
Radar II Propriedades Agrícolas S.A. | 81,440,221 |
| 40,720,111 |
| 50.00% |
Rumo |
|
|
|
|
|
Rumo S.A. | 1,854,868,949 |
| 1,291,629,301 |
| 69.58% |
Moove |
|
|
|
|
|
Cosan Lubes Investments Limited | 34,963,764 |
| 10,489,129 |
| 30.00% |
Cosan Corporate |
|
|
|
|
|
Cosan Nove Participações S.A. | 7,663,761,735 |
| 2,062,583,640 |
| 26.91% |
Cosan Dez Participações S.A. | 3,473,458,687 |
| 805,963,829 |
| 23.20% |
The following table summarizes information relating to each of the Company's subsidiaries that has material non-controlling interests, prior to any intra-group elimination.
Explanatory Notes to the Financial Statement
(In thousands of Reais, except when otherwise indicated)
On January 1, 2023 | Interest in earnings of subsidiaries | Capital (reduction) increase | Gain (loss) with capital increase | Asset and liability valuation adjustment | Dividends | Business combination | Reclassification | Other | On December 31, 2023 | ||||||||||
Compass |
|
|
|
|
|
|
|
|
|
|
|
|
|
|
|
|
|
|
|
Comgás | 27,151 |
| 11,419 |
| — |
| — |
| 444 |
| (6,869) |
| — |
| — |
| — |
| 32,145 |
Commit Gás S.A. | 2,058,651 |
| 185,312 |
| — |
| — |
| — |
| (309,324) |
| — |
| (372,030) |
| (109) |
| 1,562,500 |
Norgás S.A. | — |
| — |
| — |
| — |
| — |
| — |
| — |
| 372,030 |
| — |
| 372,030 |
Biometano Verde Paulínia S.A | — |
| 521 |
| — |
| — |
| — |
| — |
| 237,460 |
| — |
| — |
| 237,981 |
Compass Gás e Energia | 782,583 |
| 192,358 |
| — |
| — |
| 132 |
| (183,126) |
| — |
| — |
| (1,275) |
| 790,672 |
Rumo |
|
|
|
|
|
|
|
|
|
|
|
|
|
|
|
|
|
|
|
Rumo S.A. | 10,797,146 |
| 503,029 |
| (12,250) |
| (9,280) |
| 704 |
| (122,165) |
| — |
| — |
| (52,595) |
| 11,104,589 |
Moove |
|
|
|
|
|
|
|
|
|
|
|
|
|
|
|
|
|
|
|
Cosan Lubes Investments Limited | 702,001 |
| 82,979 |
| — |
| — |
| (78,742) |
| (15,346) |
| — |
| — |
| 4,956 |
| 695,848 |
Cosan Corporate |
|
|
|
|
|
|
|
|
|
|
|
|
|
|
|
|
|
|
|
Cosan Limited Partners Brasil | 9 |
| (2) |
| — |
| — |
| — |
| — |
| — |
| — |
| — |
| 7 |
Cosan Nove Participações S.A. | 2,634,310 |
| 338,315 |
| — |
| 32,732 |
| (14,728) |
| (436,566) |
| — |
| — |
| 12,956 |
| 2,567,019 |
Cosan Dez Participações S.A. | 1,302,661 |
| 573,987 |
| 1 |
| — |
| 454 |
| (372,772) |
| — |
| — |
| 7,710 |
| 1,512,041 |
Sinlog Tecnologia em Logística S.A. | 14,911 |
| (1,969) |
| 21,959 |
| (12,622) |
| — |
| — |
| — |
| — |
| (22,279) |
| — |
Radar |
|
|
|
|
|
|
|
|
|
|
|
|
|
|
|
|
|
|
|
Janus Brasil Participações S.A. | 3,773,279 |
| 924,908 |
| — |
| — |
| — |
| (74,830) |
| — |
| — |
| 119,844 |
| 4,743,201 |
Tellus Brasil Participações S.A. | 2,584,058 |
| 562,713 |
| (18,400) |
| — |
| — |
| (40,531) |
| — |
| — |
| 68,488 |
| 3,156,328 |
Gamiovapar Empreendimentos e Participações S.A. | 505,681 |
| 19,233 |
| (5,004) |
| — |
| — |
| (47,377) |
| — |
| — |
| (289) |
| 472,244 |
Duguetiapar Empreendimentos e Participações S.A. | 70,857 |
| 26,185 |
| — |
| — |
| — |
| (30,319) |
| — |
| — |
| (8) |
| 66,715 |
Radar II Propriedades Agrícolas S.A. | 878,879 |
| 174,346 |
| (1,902) |
| — |
| — |
| 37,831 |
| — |
| — |
| — |
| 1,089,154 |
Radar Propriedades Agrícolas S.A. | 212,065 |
| 4,331 |
| (7,275) |
| — |
| — |
| (4,677) |
| — |
| — |
| — |
| 204,444 |
Nova Agrícola Ponte Alta S.A. | 365,807 |
| 35,196 |
| — |
| — |
| — |
| 16,010 |
| — |
| — |
| — |
| 417,013 |
Nova Amaralina S.A. Propriedades Agrícolas | 2,041 |
| 12,971 |
| — |
| — |
| — |
| 14,881 |
| — |
| — |
| — |
| 29,893 |
Nova Santa Bárbara Agrícola S.A. | 201,389 |
| (3,141) |
| — |
| — |
| — |
| (415) |
| — |
| — |
| — |
| 197,833 |
Terras da Ponte Alta S.A. | 73,421 |
| 14,440 |
| — |
| — |
| — |
| (3,610) |
| — |
| — |
| — |
| 84,251 |
Paineira Propriedades Agrícolas S.A. | 157,784 |
| 40,115 |
| — |
| — |
| — |
| 1,404 |
| — |
| — |
| — |
| 199,303 |
Manacá Propriedades Agrícolas S.A. | 160,553 |
| 40,163 |
| (1,151) |
| — |
| — |
| 19 |
| — |
| — |
| — |
| 199,584 |
Castanheira Propriedades Agrícolas S.A. | 210,995 |
| 52,944 |
| — |
| — |
| — |
| 27,139 |
| — |
| — |
| — |
| 291,078 |
| 27,516,232 |
| 3,790,353 |
| (24,022) |
| 10,830 |
| (91,736) |
| (1,550,643) |
| 237,460 |
| — |
| 137,399 |
| 30,025,873 |
Explanatory Notes to the Financial Statement
(In thousands of Reais, except when otherwise indicated)
| On January 1, 2022 |
| Interest in earnings of subsidiaries |
| Change of equity interest in subsidiary |
| Asset and liability valuation adjustment |
| Dividends |
| Capital increase |
| Acquisition of non-controlling interests |
| Business combination |
| Other |
| On December 31, 2022 |
Compass |
|
|
|
|
|
|
|
|
|
|
|
|
|
|
|
|
|
|
|
Comgás | 28,466 |
| 14,881 |
| — |
| — |
| (16,926) |
| — |
| — |
| — |
| 730 |
| 27,151 |
Commit Gás S.A. | — |
| 107,593 |
| — |
| — |
| (64,435) |
| — |
| — |
| 2,015,493 |
| — |
| 2,058,651 |
Compass Gás e Energia | 761,432 |
| 221,871 |
| (78) |
| 3,197 |
| (201,024) |
| — |
| — |
| — |
| (2,815) |
| 782,583 |
Sulgás | — |
| 6,466 |
| — |
| — |
| (26,701) |
| — |
| (888,450) |
| 908,883 |
| (198) |
| — |
Rumo |
|
|
|
|
|
|
|
|
|
|
|
|
|
|
|
|
|
|
|
Rumo S.A. | 10,527,777 |
| 357,642 |
| (21,358) |
| 2,061 |
| (89,194) |
| — |
| — |
| — |
| 20,218 |
| 10,797,146 |
Moove |
|
|
|
|
|
|
|
|
|
|
|
|
|
|
|
|
|
|
|
Cosan Lubes Investments Limited | 683,143 |
| 145,981 |
| — |
| (127,123) |
| — |
| — |
| — |
| — |
| — |
| 702,001 |
Cosan Corporate |
|
|
|
|
|
|
|
|
|
|
|
|
|
|
|
|
|
|
|
Cosan Limited Partners Brasil | 14 |
| (5) |
| — |
| — |
| — |
| — |
| — |
| — |
| — |
| 9 |
Cosan Nove Participações S.A. | — |
| 53,353 |
| (1,416,657) |
| 10,070 |
| (12,434) |
| 4,115,000 |
| — |
| — |
| (115,022) |
| 2,634,310 |
Cosan Dez Participações S.A. | — |
| 14,965 |
| (2,592,096) |
| 5,073 |
| (3,540) |
| 4,000,000 |
| — |
| — |
| (121,741) |
| 1,302,661 |
Sinlog Tecnologia em Logística S.A. | 6,549 |
| (7,677) |
| 16,039 |
| — |
| — |
| — |
| — |
| — |
| — |
| 14,911 |
Payly | 2,602 |
| (1,626) |
| — |
| — |
| — |
| — |
| — |
| — |
| (976) |
| — |
Radar |
|
|
|
|
|
|
|
|
|
|
|
|
|
|
|
|
|
|
|
Janus Brasil Participações S.A. | — |
| (10,971) |
| — |
| — |
| — |
| — |
| (196,857) |
| 3,981,107 |
| — |
| 3,773,279 |
Tellus Brasil Participações S.A. | — |
| 8,531 |
| — |
| — |
| — |
| — |
| (7,508) |
| 2,583,035 |
| — |
| 2,584,058 |
Gamiovapar Empreendimentos e Participações S.A. | — |
| 2,900 |
| — |
| — |
| — |
| — |
| 4,975 |
| 497,806 |
| — |
| 505,681 |
Duguetiapar Empreendimentos e Participações S.A. | — |
| (788) |
| — |
| — |
| — |
| — |
| (4,534) |
| 76,179 |
| — |
| 70,857 |
Radar II Propriedades Agrícolas S.A. | — |
| 246,698 |
| — |
| 108 |
| (124,858) |
| — |
| — |
| — |
| 756,931 |
| 878,879 |
Radar Propriedades Agrícolas S.A. | — |
| 34,002 |
| — |
| — |
| (20,516) |
| — |
| — |
| — |
| 198,579 |
| 212,065 |
Nova Agrícola Ponte Alta S.A. | — |
| 97,035 |
| — |
| — |
| (50,267) |
| — |
| — |
| — |
| 319,039 |
| 365,807 |
Nova Amaralina S.A. Propriedades Agrícolas | — |
| 8,000 |
| — |
| — |
| (31,444) |
| — |
| — |
| — |
| 25,485 |
| 2,041 |
Nova Santa Bárbara Agrícola S.A. | — |
| 53,686 |
| — |
| — |
| (5,041) |
| — |
| — |
| — |
| 152,744 |
| 201,389 |
Terras da Ponte Alta S.A. | — |
| 39,890 |
| — |
| — |
| (16,778) |
| — |
| — |
| — |
| 50,309 |
| 73,421 |
Paineira Propriedades Agrícolas S.A. | — |
| 58,604 |
| — |
| — |
| (27,222) |
| — |
| — |
| — |
| 126,402 |
| 157,784 |
Manacá Propriedades Agrícolas S.A. | — |
| 46,793 |
| — |
| — |
| (23,319) |
| — |
| — |
| — |
| 137,079 |
| 160,553 |
Castanheira Propriedades Agrícolas S.A. | — |
| 77,819 |
| — |
| — |
| (66,151) |
| — |
| — |
| — |
| 199,327 |
| 210,995 |
Violeta Fundo de Investimento Multimercado | 2,119,102 |
| 69,200 |
| (107,359) |
| 11,143 |
| (132,885) |
| — |
| — |
| — |
| (1,959,201) |
| — |
| 14,129,085 |
| 1,644,843 |
| (4,121,509) |
| (95,471) |
| (912,735) |
| 8,115,000 |
| (1,092,374) |
| 10,062,503 |
| (213,110) |
| 27,516,232 |
Explanatory Notes to the Financial Statement
(In thousands of Reais, except when otherwise indicated)
Summary statement of financial position:
| Cosan Dez |
| Cosan Nove |
| Moove |
| Rumo |
| Radar | ||||||||||
| 12/31/2023 |
| 12/31/2022 |
| 12/31/2023 |
| 12/31/2022 |
| 12/31/2023 |
| 12/31/2022 |
| 12/31/2023 |
| 12/31/2022 |
| 12/31/2023 |
| 12/31/2022 |
Current |
|
|
|
|
|
|
|
|
|
|
|
|
|
|
|
|
|
|
|
Assets | 1,020,790 |
| 2,015 |
| 4,903 |
| 2,721 |
| 91,412 |
| 1,777,104 |
| 3,846,647 |
| 2,474,218 |
| 819,887 |
| 514,788 |
Liabilities | (127,876) |
| (126,916) |
| (392) |
| (169,079) |
| (3,603) |
| (1,341,106) |
| (1,135,917) |
| (852,071) |
| (184,004) |
| (916,363) |
Current net assets | 892,914 |
| (124,901) |
| 4,511 |
| (166,358) |
| 87,809 |
| 435,998 |
| 2,710,730 |
| 1,622,147 |
| 635,883 |
| (401,575) |
Non-current |
|
|
|
|
|
|
|
|
|
|
|
|
|
|
|
|
|
|
|
Assets | 5,798,291 |
| 5,738,715 |
| 10,373,285 |
| 9,954,431 |
| 2,218,429 |
| 2,204,878 |
| 22,572,211 |
| 20,971,764 |
| 16,152,441 |
| 14,316,130 |
Liabilities | — |
| — |
| — |
| — |
| — |
| (1,208,604) |
| (9,611,588) |
| (7,402,742) |
| (613,705) |
| (530,331) |
Non-current net assets | 5,798,291 |
| 5,738,715 |
| 10,373,285 |
| 9,954,431 |
| 2,218,429 |
| 996,274 |
| 12,960,623 |
| 13,569,022 |
| 15,538,736 |
| 13,785,799 |
Shareholders’ equity | 6,691,205 |
| 5,613,814 |
| 10,377,796 |
| 9,788,073 |
| 2,306,238 |
| 1,432,272 |
| 15,671,353 |
| 15,191,169 |
| 16,174,619 |
| 13,384,224 |
Summary statements of profit or loss and other comprehensive income:
| Cosan Dez | Cosan Nove |
| Moove |
| Rumo | Radar | ||||||||||||||||||
| 12/31/2023 |
| 12/31/2022 |
| 12/31/2023 |
| 12/31/2022 |
| 12/31/2023 |
| 12/31/2022 |
| 12/31/2023 |
| 12/31/2022 |
| 12/31/2023 |
| 12/31/2022 | ||||||
Net revenue | — |
| — |
| — |
| — |
| — |
| 3,842,981 |
| 1,013,446 |
| 984,597 |
| 743,411 |
| 834,616 | ||||||
Income before taxes | 1,396,633 |
| 63,578 |
| 1,005,640 |
| 194,522 |
| 207,982 |
| 485,729 |
| 769,233 |
| 633,164 |
| 2,820,202 |
| 1,556,155 | ||||||
Income tax and social contribution | (2,301) |
| — |
| (5,892) |
| — |
| — |
| 11,665 |
| (49,569) |
| (118,224) |
| (147,636) |
| (74,915) | ||||||
Income (loss) for the year | 1,394,332 |
| 63,578 |
| 999,748 |
| 194,522 |
| 207,982 |
| 497,394 |
| 719,664 |
| 514,940 |
| 2,672,566 |
| 1,481,240 | ||||||
Other comprehensive income (loss) | 1,957 |
| — |
| (54,731) |
| — |
| (262,473) |
| — |
| 1,011 |
| 2,961 |
| — |
| — | ||||||
Total comprehensive results | 1,396,289 |
| 63,578 |
| 945,017 |
| 194,522 |
| (54,491) |
| 497,394 |
| 720,675 |
| 517,901 |
| 2,672,566 |
| 1,481,240 | ||||||
Comprehensive income attributable to non-controlling shareholders | 454 |
| 14,965 |
| (14,728) |
| 52,353 |
| (78,742) |
| 149,218 |
| 704 |
| 360,776 |
| — |
| — | ||||||
Dividends paid | 372,772 |
| — |
| 571,261 |
| — |
| — |
| 150,000 |
| 122,231 |
| 35,733 |
| 530,576 |
| 948,967 | ||||||
Summary Cash Flow Statement:
| Cosan Dez |
| Cosan Nove |
| Moove |
| Rumo |
| Radar | ||||||||||
| 12/31/2023 |
| 12/31/2022 |
| 12/31/2023 |
| 12/31/2022 |
| 12/31/2023 |
| 12/31/2022 |
| 12/31/2023 |
| 12/31/2022 |
| 12/31/2023 |
| 12/31/2022 |
Cash (generated (used in) in operating activities | (176) |
| 3 |
| 14,941 |
| 2 |
| (359) |
| 292,204 |
| 674,137 |
| 94,522 |
| 626,057 |
| 791,779 |
Cash (generated (used in) in investing activities | 757,196 |
| — |
| 555,408 |
| (19,217) |
| (5,683) |
| (41,004) |
| (175,273) |
| 2,518,699 |
| (30,681) |
| 175,611 |
Cash generated (used in) in financing activities | (372,772) |
| 2,011 |
| (571,261) |
| 21,936 |
| 7,976 |
| (197,994) |
| 445,843 |
| (1,235,688) |
| (581,012) |
| (949,277) |
Reduction of cash and cash equivalents | 384,248 |
| 2,014 |
| (912) |
| 2,721 |
| 1,934 |
| 53,206 |
| 944,707 |
| 1,377,533 |
| 14,364 |
| 18,113 |
Cash and cash equivalents at the beginning of the year | 2,014 |
| — |
| 2,721 |
| — |
| — |
| 761,698 |
| 2,169,335 |
| 791,802 |
| 25,582 |
| 7,469 |
Effect of FX variation on the cash balance and cash equivalents | — |
| — |
| — |
| — |
| (76) |
| — |
| — |
| — |
| — |
| — |
Cash and cash equivalents at the end of the year | 386,262 |
| 2,014 |
| 1,809 |
| 2,721 |
| 1,858 |
| 814,904 |
| 3,114,042 |
| 2,169,335 |
| 39,946 |
| 25,582 |
Explanatory Notes to the Financial Statement
(In thousands of Reais, except when otherwise indicated)
Accounting policy: A joint venture is an agreement whereby the parties that have joint control of the agreement have rights to the net assets of the agreement. The Company, through its subsidiary Cosan Nove, has an investment in a joint venture shown in the balance sheet as the share of net assets under the equity method of accounting, less any impairment losses. If applicable, adjustments are made to align any different accounting policies that may exist. The Company’s share of the results and shareholder’s equity of the joint venture is included in the income statement, comprehensive income statement and shareholder’s equity, respectively. Unrealized gains and losses resulting from transactions between the Company and its joint venture are eliminated to the extent of the Company’s investment in the joint venture, except where unrealized losses provide evidence of an impairment of the transferred asset. Goodwill arising from the acquisition of joint venture is included as part of the Company’s investment in the joint venture and, when necessary, the entire book value of the investment (including goodwill) is tested for impairment in accordance with CPC 01/IAS 36 Impairment of Assets as a single asset by comparing its recoverable amount (whichever is higher between the value in use and fair value less costs of disposal) with its book value. The investment in joint venture is considered as non-current assets and are shown at cost less any impairment losses. When an investment in a joint venture is classified as held for sale, it is accounted for in accordance with CPC 31/IFRS 5 Non-current Assets Held for Sale and Discontinued Operations. |
Changes to the investments in joint ventures were as follows:
| Raízen S.A. |
| Terminal Alvorada S.A |
| Total |
Shares issued by the investee | 10,352,509,484 |
| 100,197,076 |
|
|
Shares held by Cosan | 4,557,597,117 |
| 50,098,538 |
|
|
|
|
|
|
|
|
Cosan ownership interest | 5.02% |
| 50.00% |
|
|
Cosan's indirect shareholding | 25.90% |
| — |
|
|
Total (i) | 30.92% |
| 50.00% |
|
|
On January 1, 2022 | 10,936,663 |
| — |
| 10,936,663 |
Interest in earnings of joint ventures | (92,179) |
| — |
| (92,179) |
Asset and liability valuation adjustment | 1,053,226 |
| — |
| 1,053,226 |
Dividends | (676,354) |
| — |
| (676,354) |
On January 1, 2023 | 11,221,356 |
| — |
| 11,221,356 |
Interest in earnings of joint ventures (ii) | 1,694,679 |
| 1,266 |
| 1,695,945 |
Asset and liability valuation adjustment | (7,428) |
| — |
| (7,428) |
Capital increase (iv) | — |
| 47,300 |
| 47,300 |
Dividends (iii) | (1,214,731) |
| — |
| (1,214,731) |
At December 31, 2023 | 11,693,876 |
| 48,566 |
| 11,742,442 |
Explanatory Notes to the Financial Statement
(In thousands of Reais, except when otherwise indicated)
Raízen S.A
| (i) | The Company's total interest in Raízen S.A. is made up of 5.02% direct participation and 39.15% indirect participation through Cosan Nove. The disclosed percentage of 25.90% refers to the economic benefit calculated by the result of Cosan S.A's participation in its subsidiary Cosan Nove of 66.16% multiplied by the participation of 39.15% For the Company's consolidated information, direct and indirect interests are added together and the impact relating to the participation of non-controlling shareholders in Cosan Nove is shown in the result line attributed to non-controlling shareholders. |
| (ii) | Raízen measured and recognized on September 30, 2023, PIS and COFINS credits in the consolidated amount of R$3,765,456 relating to Complementary Law 192/22 and R$1,465,726 relating to Complementary Law 194/22, totaling R $5,231,182, which impacted the equity income for the year by R$1,617,481, net of income tax and social contribution. |
| (iii) | Amount proposed and allocated in the year. In year ended as at December 31, 2023, dividends constituted in the period were paid in the amount of R$906,534. The joint venture’s statement of financial position and income statement are disclosed in the explanatory note 4 - Information by segment. As of December 31, 2023, the Company was in compliance with the covenants of the agreement governing the joint venture. |
Terminal Alvorada S.A. | |
| (iv) | On July 7, 2023, the subsidiary Rumo S.A contributed R$47,300 to form the joint venture Terminal Alvorada S.A with CHS Agronegócio Indústria e Comércio Ltda “CHS”, whose objective is to transform the CHS road transshipment warehouse in Alvorada (TO) in a road-rail transshipment terminal. |
Accounting policy:
Reduction to recoverable value
The recoverable amount is determined through value in use calculations, using the discounted cash flow determined by Management based on budgets that take into account the assumptions related to each business, using information available in the market and past performance. Discounted cash flows were prepared over a ten-year period and carried forward in perpetuity without considering an actual growth rate. Management understands the use of periods greater than five years in the preparation of discounted cash flows is appropriate for the purpose of calculating the recoverable amount, because it reflects the estimated time of use of the asset and of the business groups.
The Company reviews impairment indicators for intangible assets with defined useful lives and fixed assets on an annual basis. In addition, goodwill and intangible assets with an indefinite useful life are subjected to an impairment test. An impairment occurs when the carrying amount of an asset or cash-generating unit exceeds its recoverable amount, which is the greater of its fair value less costs to sell and its value in use.
The assumptions used in discounted cash flow projections - estimates of future business performance, cash generation, long-term growth, and discount rates - are utilized in our assessment of impairment of assets as of the date of the balance sheet. No plausible change to a central premise would be harmful. The primary assumptions used to determine the recoverable value of the various cash-generating units to which goodwill is allocated are described in the following section. |
Explanatory Notes to the Financial Statement
(In thousands of Reais, except when otherwise indicated)
Accounting policy:
Identification and evaluation
Cost, less accumulated depreciation and any accumulated impairment losses is used to value fixed assets.
Subsequent expenditures are only capitalized when it is probable that the associated future economic benefits will accrue to the company. Ongoing repairs and maintenance expenses are recorded as they are incurred.
Depreciated from the date of availability for use or, for constructed assets, from the date of completion and readiness for use.
Unless it is capitalized as part of the cost of another asset, depreciation is calculated on the book value of fixed assets less estimated residual values using the straight-line method over its estimated useful life and recognized in profit or loss. Land is not depreciated.
Methods of depreciation, such as useful lives and residual values, are reviewed at the end of each fiscal year or when there is a significant change without an expected consumption pattern, such as a relevant incident or technical obsolescence. If applicable, any adjustments are recorded as changes to accounting estimates. Depreciation is calculated on a straight-line basis over the estimated useful lives of the assets, as follows: |
Buildings and improvements | 4% - 5% | ||
Machinery, equipment and installations | 8% - 11% | ||
Furniture and fixtures | 10% - 15% | ||
Wagons | 2.9% - 6% | ||
Locomotives | 3.3% - 8% | ||
Permanent ways | 3% - 4% | ||
IT equipment | 20% | ||
Others | 10% - 20% |
Explanatory Notes to the Financial Statement
(In thousands of Reais, except when otherwise indicated)
a) Reconciliation of carrying amount:
| Consolidated |
| Parent Company | ||||||||||||
| Land, buildings and improvements |
| Machines, equipment and installations |
| Wagons and locomotives (i) |
| Permanent easement |
| Construction in progress |
| Other assets |
| Total |
| Total |
Cost |
|
|
|
|
|
|
|
|
|
|
|
|
|
|
|
On January 1, 2022 | 2,001,165 |
| 1,974,614 |
| 7,738,889 |
| 8,755,001 |
| 3,244,653 |
| 441,742 |
| 24,156,064 |
| 81,406 |
Business combination | 310,730 |
| 227,257 |
| — |
| — |
| 133,474 |
| 163,427 |
| 834,888 |
| — |
Additions | 5,442 |
| 12,208 |
| 772 |
| 11,120 |
| 3,387,758 |
| (2,253) |
| 3,415,047 |
| 1,636 |
Write-offs | (3,368) |
| (15,368) |
| (61,536) |
| (52) |
| (9,024) |
| (52,056) |
| (141,404) |
| (608) |
Transfers (ii) | 182,504 |
| 141,379 |
| 316,211 |
| 1,650,431 |
| (2,419,014) |
| 32,921 |
| (95,568) |
| (340) |
Exchange differences | 35,544 |
| 131,160 |
| — |
| — |
| 684 |
| 142,215 |
| 309,603 |
| — |
Write-off by disposal of investment | (396,614) |
| (528,452) |
| — |
| — |
| (23,444) |
| (5,043) |
| (953,553) |
| — |
On December 31, 2022 | 2,135,403 |
| 1,942,798 |
| 7,994,336 |
| 10,416,500 |
| 4,315,087 |
| 720,953 |
| 27,525,077 |
| 82,094 |
Additions | 11,356 |
| 18,671 |
| 898 |
| 710 |
| 4,577,377 |
| 15,497 |
| 4,624,509 |
| 1,380 |
Write-offs | (199,080) |
| (34,872) |
| (118,414) |
| (116,957) |
| (2,157) |
| (16,961) |
| (488,441) |
| — |
Transfers (ii) | 281,621 |
| 196,158 |
| 821,701 |
| 2,552,077 |
| (3,710,146) |
| 33,451 |
| 174,862 |
| (28) |
Exchange differences | (11,626) |
| (23,492) |
| — |
| — |
| 1,944 |
| (13,668) |
| (46,842) |
| — |
Assets held for sale | (89) |
| — |
| — |
| — |
| (396,150) |
| (535) |
| (396,774) |
| — |
On December 31, 2023 | 2,217,585 |
| 2,099,263 |
| 8,698,521 |
| 12,852,330 |
| 4,785,955 |
| 738,737 |
| 31,392,391 |
| 83,446 |
|
|
|
|
|
|
|
|
|
|
|
|
|
|
|
|
Depreciation |
|
|
|
|
|
|
|
|
|
|
|
|
|
|
|
On January 1, 2022 | (618,618) |
| (882,542) |
| (2,842,050) |
| (3,115,641) |
| (13,379) |
| (35,281) |
| (7,507,511) |
| (28,399) |
Additions | (73,712) |
| (187,599) |
| (566,999) |
| (670,921) |
| — |
| (66,064) |
| (1,565,295) |
| (8,058) |
Transfers (ii) | — |
| 8,170 |
| 51,591 |
| 8 |
| — |
| 53,031 |
| 112,800 |
| 407 |
Write-offs | (16,135) |
| 26,732 |
| 139 |
| 23,931 |
| — |
| (514) |
| 34,153 |
| — |
Exchange differences | (22,244) |
| (120,943) |
| — |
| — |
| — |
| (127,215) |
| (270,402) |
| — |
Write-off by disposal of investment | 208,661 |
| 406,945 |
| — |
| — |
| — |
| 4,008 |
| 619,614 |
| — |
On December 31, 2022 | (522,048) |
| (749,237) |
| (3,357,319) |
| (3,762,623) |
| (13,379) |
| (172,035) |
| (8,576,641) |
| (36,050) |
Additions | (76,599) |
| (183,965) |
| (613,033) |
| (806,398) |
| — |
| (74,695) |
| (1,754,690) |
| (7,579) |
Transfers (ii) | (49,649) |
| 5,476 |
| (6,838) |
| (31,199) |
| — |
| (45) |
| (82,255) |
| — |
Write-offs | 17,769 |
| 14,870 |
| 110,237 |
| 89,725 |
| — |
| 15,192 |
| 247,793 |
| — |
Exchange differences | 3,536 |
| 4,684 |
| — |
| — |
| — |
| 3,775 |
| 11,995 |
| — |
Assets held for sale | 40 |
| 937 |
| — |
| — |
| — |
| 404 |
| 1,381 |
| — |
On December 31, 2023 | (626,951) |
| (907,235) |
| (3,866,953) |
| (4,510,495) |
| (13,379) |
| (227,404) |
| (10,152,417) |
| (43,629) |
On December 31, 2022 | 1,613,355 |
| 1,193,561 |
| 4,637,017 |
| 6,653,877 |
| 4,301,708 |
| 548,918 |
| 18,948,436 |
| 46,044 |
On December 31, 2023 | 1,590,634 |
| 1,192,028 |
| 4,831,568 |
| 8,341,835 |
| 4,772,576 |
| 511,333 |
| 21,239,974 |
| 39,817 |
| (i) | As at December 31, 2023, assets, mainly wagons and locomotives in the amount of R$ 1,390,404 (R$745,203 as at December 31, 2022), were pledged to guarantee bank loans. |
| (ii) | Transfers of property, plant and equipment resulting from capitalization and other reclassifications of those assets. |
b) Capitalization of borrowing costs
In the year ended December 31, 2023, loan costs capitalized in the subsidiary Rumo were R$41,304 (R$86,614 as of December 31, 2022), using an average rate of 12.30% per year (13.25% per year as of 31 December 2022), while in the subsidiary Compass the capitalized costs were R$98,214 at a weighted average rate of 8.87% per year (R$62,365 and 6.27% per year in the year ended December 31, 2022).
Explanatory Notes to the Financial Statement
(In thousands of Reais, except when otherwise indicated)
Accounting policy: a) Goodwill Goodwill is initially recognized in accordance with the accounting policy for business combinations (see Note 9.2). Its value is determined by deducting accumulated impairment losses from its cost. Goodwill acquired in a business combination is assigned to the Company's CGUs or groups of CGUs that are anticipated to benefit from the synergies created by the business combination. b)Other intangible assets Other acquired intangible assets with a short useful life are measured at cost, less accumulated amortization and any accumulated impairment losses. c)Customer relationships Costs incurred in developing gas systems for new customers (including pipelines, valves, and other equipment) are considered intangible assets and amortized over the contract's term. The costs associated with the customer portfolio and right-of-use and operation contracts are considered as intangible assets and amortized over the contract's term. d)Concession rights Some subsidiaries of the Cosan group have public concession contracts for the gas distribution service in which the Granting Authority controls which services will be provided and the price, in addition to holding significant participation in the infrastructure at the end of the concession. These concession contracts represent the right to charge users for gas supply during the contract term. Thus, the subsidiaries recognize this right as an intangible. The assets acquired or constructed underlying the concession necessary for the distribution of gas, are amortized to correspond to the period in which the future economic benefits of the asset are expected to be reverted to the subsidiaries, or the final term of the concession, whatever happens first. This period reflects the economic life of each of the underlying assets that make up the concession. This economic service life is also used by regulatory bodies to determine the basis of measurement of the tariff for the provision of the services object of the concession. The amortization is recognized by the linear method and reflects the expected standard for the use of future economic benefits, which corresponds to the useful life of the assets that make up the infrastructure according to the provisions of the regulatory body. The amortization of assets is discontinued when the respective asset is used or downloaded in full and is no longer included in the basis of calculation of the tariff for the provision of concession services, whichever occurs first. e)Rumo’s concession rights Rumo's concession rights resulting from the business combination with Rumo Malha Norte were fully allocated to the Rumo Malha Norte concession and amortized in a straight-line basis. f)Port authorization and license The subsidiary TUP possesses a license that authorizes the installation of a private port terminal, with no expiration date as long as the property is used for this purpose. Given this entity's core activity, the Company allocated a significant portion of the purchase price to this authorization, which is classified as an intangible asset with an indefinite useful life. As mentioned in note 8, this investment was reclassified to assets available for sale. g)Contract of supply The indirect subsidiary Biometano Verde Paulínia has a signed contract for the purchase and sale of biogas produced in the landfill of Paulínia, where the purification plant is located. The term of the contract is 20 years and was calculated from the start date of the operation. h)Subsequent expenses Subsequent expenses are capitalized only if they increase the future economic benefits embodied in the particular asset to which they pertain. All other expenses are recorded in profit or loss as incurred. i)Amortization Except for goodwill and intangible assets with indefinite useful life, intangible assets are amortized using a straight-line method over their estimated useful lives, beginning on the date they are acquired or made available for use. At each reporting date, the depreciation methods, useful lives, and residual values are evaluated and adjusted as necessary. |
Explanatory Notes to the Financial Statement
(In thousands of Reais, except when otherwise indicated)
Consolidated |
| Parent Company | |||||||||||||||
| Goodwill |
| Concession right |
| Licenses |
| Brands and patents |
| Customer relationships |
| Other |
| Supply Agreement |
| Total |
| Total |
Cost |
|
|
|
|
|
|
|
|
|
|
|
|
|
|
|
|
|
On January 1, 2022 | 1,132,817 |
| 19,616,524 |
| 379,182 |
| 66,640 |
| 1,604,067 |
| 509,053 |
| — |
| 23,308,283 |
| 15,731 |
Additions | 10,031 |
| — |
| 2,605 |
| — |
| 113,497 |
| 16,622 |
| — |
| 142,755 |
| 835 |
Business combination | 402,055 |
| 2,508,558 |
| 436,594 |
| 98,382 |
| 1,062,832 |
| 388 |
| — |
| 4,508,809 |
| — |
Write-offs | — |
| (57,723) |
| — |
| — |
| (19) |
| 579 |
| — |
| (57,163) |
| — |
Transfers (i) | — |
| 837,788 |
| (1,911) |
| — |
| (6) |
| 61,295 |
| — |
| 897,166 |
| 340 |
Exchange differences | (21,909) |
| — |
| 771 |
| (1,099) |
| 47,613 |
| (2,110) |
| — |
| 23,266 |
| — |
Write-off by disposal of investment | (62,922) |
| (5,403) |
| (317,148) |
| — |
| — |
| (26,169) |
| — |
| (411,642) |
| — |
On December 31, 2022 | 1,460,072 |
| 22,899,744 |
| 500,093 |
| 163,923 |
| 2,827,984 |
| 559,658 |
| — |
| 28,411,474 |
| 16,906 |
Additions | 4,731 |
| — |
| — |
| — |
| 121,806 |
| 67,600 |
| — |
| 194,137 |
| 5,422 |
Write-offs | — |
| (62,272) |
| — |
| — |
| (64) |
| (2,075) |
| — |
| (64,411) |
| — |
Transfers (i) | — |
| 1,460,012 |
| 183,996 |
| — |
| (219,318) |
| 14,067 |
| — |
| 1,438,757 |
| 28 |
Exchange differences | (42,012) |
| — |
| (4,451) |
| (8,443) |
| (97,642) |
| 5,315 |
| — |
| (147,233) |
| — |
Assets held for sale | (30,817) |
| — |
| (436,594) |
| — |
| (1,819) |
| (17,060) |
| — |
| (486,290) |
| — |
Business Combination | — |
| — |
| — |
| — |
| — |
| 7,875 |
| 574,363 |
| 582,238 |
| — |
On December 31, 2023 | 1,391,974 |
| 24,297,484 |
| 243,044 |
| 155,480 |
| 2,630,947 |
| 635,380 |
| 574,363 |
| 29,928,672 |
| 22,356.00 |
|
|
|
|
|
|
|
|
|
|
|
|
|
|
|
|
|
|
Amortization |
|
|
|
|
|
|
|
|
|
|
|
|
|
|
|
|
|
On January 1, 2022 | — |
| (3,910,259) |
| (167,287) |
| (9,201) |
| (1,028,608) |
| (411,430) |
| — |
| (5,526,785) |
| (13,927) |
Additions | — |
| (773,765) |
| (8,879) |
| — |
| (164,843) |
| (35,667) |
| — |
| (983,154) |
| (732) |
Write-offs | — |
| 25,658 |
| — |
| — |
| 1 |
| (155) |
| — |
| 25,504 |
| — |
Transfers (i) | — |
| — |
| — |
| — |
| — |
| (60) |
| — |
| (60) |
| — |
Exchange differences | — |
| — |
| (771) |
| — |
| 22,956 |
| (2,838) |
| — |
| 19,347 |
| — |
Write-off by disposal of investment | — |
| 5,403 |
| 157,743 |
| — |
| — |
| 12,470 |
| — |
| 175,616 |
| — |
On December 31, 2022 | — |
| (4,652,963) |
| (19,194) |
| (9,201) |
| (1,170,494) |
| (437,680) |
| — |
| (6,289,532) |
| (14,659) |
Additions | — |
| (861,103) |
| (6,969) |
| — |
| (196,995) |
| (28,436) |
| — |
| (1,093,503) |
| (834) |
Write-offs | — |
| 37,148 |
| — |
| — |
| 2 |
| 71 |
| — |
| 37,221 |
| — |
Transfers (i) | — |
| — |
| (37,209) |
| — |
| 75,265 |
| 19,873 |
| — |
| 57,929 |
| — |
Exchange differences | — |
| — |
| 156 |
| — |
| 2,453 |
| 1,526 |
| — |
| 4,135 |
| — |
Assets held for sale | — |
| — |
| — |
| — |
| 1,213 |
| 4,152 |
| — |
| 5,365 |
| — |
On December 31, 2023 | — |
| (5,476,918) |
| (63,216) |
| (9,201) |
| (1,288,556) |
| (440,494) |
| — |
| (7,278,385) |
| (15,493) |
On December 31, 2022 | 1,460,072 |
| 18,246,781 |
| 480,899 |
| 154,722 |
| 1,657,490 |
| 121,978 |
| — |
| 22,121,942 |
| 2,247 |
On December 31, 2023 | 1,391,974 |
| 18,820,566 |
| 179,828 |
| 146,279 |
| 1,342,391 |
| 194,886 |
| 574,363 |
| 22,650,287 |
| 6,863 |
| (i) | The number of transfers also includes a portion of R$103,084 of intangible assets that was reclassified to financial assets (R$35,057, year ended December 31, 2022). |
Explanatory Notes to the Financial Statement
(In thousands of Reais, except when otherwise indicated)
a) Amortization methods and useful lives:
Intangible assets (except goodwill) |
| Annual amortization rate | 12/31/2023 |
| 12/31/2022 | |
Concession rights: |
|
|
|
|
| |
Compass (i) |
| From 3.54% to 4.58% | 12,307,964 |
| 11,614,163 | |
Rumo (ii) |
| 1.59% | 6,512,602 |
| 6,632,618 | |
|
|
| 18,820,566 |
| 18,246,781 | |
|
|
|
|
|
| |
Operating license for port terminal |
| 3.70% | 47,610 |
| 44,305 | |
Moove |
| 5.00% | 132,218 |
| 139,905 | |
Licenses and authorizations (iii) |
| Indefinity | — |
| 436,594 | |
|
|
| 179,828 |
| 620,804 | |
Trademarks |
|
|
|
|
| |
Comma |
| Indefinity | 47,015 |
| 47,929 | |
Petrochoice (iii) |
| Indefinity | 96,826 |
| 104,354 | |
Tirreno (iii) |
| Indefinity | 2,438 |
| 2,439 | |
|
|
| 146,279 |
| 154,722 | |
Customers relationship |
|
|
|
|
| |
Compass |
| 20.00% | 280,111 |
| 285,423 | |
Moove (iii) |
| 5% to 30% | 1,062,280 |
| 1,227,588 | |
Other |
|
| — |
| 4,574 | |
|
|
| 1,342,391 |
| 1,517,585 | |
Contract of supply |
|
|
|
|
| |
Compass |
| 5.00% | 574,363 |
| — | |
|
|
| 574,363 |
| — | |
Others |
|
|
|
|
| |
Software license |
| 20.00% | 90,162 |
| 65,108 | |
Others |
| 20.00% | 104,724 |
| 56,870 | |
|
|
| 194,886 |
| 121,978 | |
Total |
|
| 21,258,314 |
| 20,661,870 |
| (i) | Intangible asset of the public gas distribution service concession, which represents the right to charge users for the supply of gas, comprising: (i) the concession rights recognized in the business combination and (ii) the assets of the concession. | |
| (ii) | Refers to Rumo's railway concession agreement. The amount will be amortized until the end of the concession in 2079. | |
| (iii) | Authorization for: (i) installation of port terminal activities; operation of the port facility by the subsidiary TUP Porto São Luís, (ii) lubrication and contamination control solutions, (iii) production and sale of lubricating oils, additives and fluids |
Explanatory Notes to the Financial Statement
(In thousands of Reais, except when otherwise indicated)
b) Goodwill paid for expected future profitability and intangibles with an indefinite useful life
Below we show the carrying amount of goodwill and intangible assets with indefinite useful lives allocated to each of the cash generating units:
|
| 12/31/2023 |
| 12/31/2022 | ||||||||
|
| Goodwill |
| Brands and patents |
| Licenses and authorizations |
| Goodwill |
| Brands and patents |
| Licenses and authorizations |
UGC Moove |
| 1,254,253 |
| 146,279 |
| — |
| 1,296,266 |
| 154,722 |
| — |
UGC Compass |
| 100,192 |
| — |
| — |
| 100,192 |
| — |
| — |
UGC Rumo |
| 37,529 |
| — |
| — |
| 37,529 |
| — |
| — |
UGC Cosan corporate |
| — |
| — |
| — |
| 26,085 |
| — |
| 436,594 |
|
| 1,391,974 |
| 146,279 |
| — |
| 1,460,072 |
| 154,722 |
| 436,594 |
In general, future cash flow projections for the Company assume growth rates of 3.5% (2.7% in 2022), which are neither higher nor greater than the long-term average growth rates for the sector and country.
To determine the present value of cash flows, a pre-tax discount rate is utilized. Before taxes and in nominal terms, discount rates ranged between 11.80% and 12.40% (between 10.10% and 24.80% in 2022).
The main assumptions for the first part of the financial model consider inflation and GDP by region where the CGU is located, plus the Cosan Group's strategies and market opportunities. For the remaining years of the model, the main assumptions relate to inflation and market expansion. The discount rate used is the weighted average cost of capital, or “WACC”, for which the main assumptions are risk-free rate (return rate of an investment without risk of loss), market risk premium (excess return earned by an investment in the stock market at a risk-free rate) and inflation. Most assumptions are obtained from external sources of information.
Future cash flows were constructed considering the following factors: (i) EBITDA for the cash-generating unit, adjusted for other relevant operating cash items and recurring capital expenditures; (ii) the Cosan Group discount rate (WACC) before taxes; and (iii) a growth rate calculated using the inflation index by region.
The annual impairment test utilized the following assumptions:
Premises |
| % Yearly |
Risk-free rate (T-Note 10y) |
| 3.51% |
Inflation (BR) |
| 3.76% |
Inflation (US) |
| 2.00% |
Inflation (UK) |
| 2.00% |
Country risk premium (BR) |
| 4.40% |
Country risk premium (UK) |
| 0.88% |
Country risk premium (ARG) |
| 17.55% |
Market risk premium |
| 4.60% |
Tax rate (BR) |
| 34.00% |
Tax rate (UK) |
| 19.00% |
Tax rate (ARG) |
| 30.00% |
Explanatory Notes to the Financial Statement
(In thousands of Reais, except when otherwise indicated)
Determining the recoverability of assets depends on certain key assumptions that are influenced by the market, technological, and economic conditions prevailing at the time this recovery is tested; therefore, it is not possible to predict whether there will be future losses due to a reduction in recoverability and, if so, whether they would be material.
During the year ended December 31, 2023, the Company did not identify any additional indicators of impairment, so no impairment test was required for tangible and intangible assets with defined useful lives. Consequently, no impairment expense was recorded for goodwill and assets with indefinite and definite useful lives as at December 31, 2023, and 2022
Accounting policy
Contract assets are measured based on their acquisition cost, which includes capitalized borrowing costs. The depreciable amounts in the concession contract are transferred to intangible assets when the assets are put into operation. The indirect affiliate Comgás reassesses the useful life, and whenever this assessment reveals that the amortization period will exceed the term of the concession agreement, a portion of the asset is converted into a financial asset because it represents a receivable from the granting authority. This classification follows IFRIC 12 - Concession Agreements. |
| Compass |
| Moove |
| Total |
On January 1, 2022 | 684,970 |
| 21,012 |
| 705,982 |
Additions | 1,217,818 |
| 10,823 |
| 1,228,641 |
Write-offs | — |
| (25,156) |
| (25,156) |
Business combination | 87,735 |
| — |
| 87,735 |
Transfers (i) | (880,188) |
| 1,701 |
| (878,487) |
On December 31, 2022 | 1,110,335 |
| 8,380 |
| 1,118,715 |
Additions | 1,494,142 |
| 33,952 |
| 1,528,094 |
Write-offs | — |
| (31,648) |
| (31,648) |
Transfers (i) | (1,563,056) |
| — |
| (1,563,056) |
On December 31, 2023 | 1,041,421 |
| 10,684 |
| 1,052,105 |
| (i) | The amount of transfers also includes a portion of the intangible asset that was reclassified to a financial asset. |
Explanatory Notes to the Financial Statement
(In thousands of Reais, except when otherwise indicated)
During the year ended December 31, 2023, through its subsidiaries, R$126,522 were added to internally generated intangible assets (R$109,265 in the year ended December 31, 2022), through the capitalization of labor.
a) Investment commitments
The indirect subsidiary Comgás assumed commitments in its concession contract for investments (expansion, improvements, and maintenance) to be carried out during the estimated concession period until 2049. In addition to investments in administrative support, the investment values for expansion projects and operational support exceed R$20,000,000, with an expected disbursement of approximately R$3,000,000.
Considering that the concession contract provides for incentive regulation, defining an efficient business plan at each five-year cycle in light of a capital return rate defined at the time to ensure that the concessionaire is able to obtain adequate remuneration for its investments, Comgás will propose a binding regulatory plan for each tariff revision, taking into account the reality at the time and the rate of return on capital defined by the regulator.
The other distributors operating in another state do not have investment commitments to be made during the concession period.
b) Capitalization of borrowing costs
During the year ended December 31, 2023, the indirect subsidiary Comgás capitalized R$82,441 at a weighted average rate of 12.70% per year (R$70,884 at 12.06% per year in the year ended December 31, 2022).
During the year ended December 31, 2023, the indirect subsidiary Sulgás capitalized R$973 at a weighted average rate of 5.81% per year (R$217 at 4.10% per year in the year ended December 31, 2022).
Accounting policy:
The right-of-use asset is initially measured at cost, which includes the initial measurement value of the lease liability, adjusted for any lease payments made up to the commencement date, any initial direct costs incurred by the lessee, and an estimate of the costs to be incurred by the lessee in dismantling and removing the underlying asset, restoring the site where it is located, or restoring the underlying asset to the condition required by the terms and conditions of the lease, less any lease incentives received.
The right-of-use asset is then depreciated on a straight-line basis from the date of commencement until the end of the lease term, unless the lease transfers ownership of the underlying asset to the lessee at the end of the lease term, or if the cost of the lease right-of-use asset reflects the likelihood that the lessee will exercise the purchase option. In this instance, the right-of-use asset will be depreciated over the useful life of the underlying asset, which is determined in the same manner as property, plant, and equipment. In addition, the right-of-use asset is periodically adjusted for certain remeasurements of the lease liability and impairment losses, if any.
The subsidiary Rumo evaluated its railway concessions within the scope of interpretation IFRIC 12 / CPC 01 Concession Contracts and, since it did not meet the terms of this interpretation, recorded its concession contracts as a right-of-use. |
Explanatory Notes to the Financial Statement
(In thousands of Reais, except when otherwise indicated)
| Consolidated |
| Parent company | ||||||||||||||
| Land, buildings and improvements |
| Machine, equipment, and installations |
| Wagons and locomotives |
| Software |
| Vehicles |
| Floating storage and regasification |
| Railway and port infrastructure |
| Total |
| Total |
Cost |
|
|
|
|
|
|
|
|
|
|
|
|
|
|
|
|
|
On January 1, 2022 | 254,883 |
| 142,449 |
| 938,610 |
| 87,028 |
| 29,099 |
| — |
| 7,800,313 |
| 9,252,382 |
| 49,529 |
Business combination | 116,919 |
| 2,693 |
| — |
| — |
| 43 |
| — |
| — |
| 119,655 |
| — |
Additions (i) | 91,799 |
| 73,317 |
| 1,006 |
| — |
| 4,561 |
| — |
| 111,457 |
| 282,140 |
| 541 |
Contractual readjustments | 9,008 |
| 52,972 |
| 3,480 |
| (1,079) |
| 1,540 |
| — |
| 155,734 |
| 221,655 |
| 3,092 |
Write-offs | (24,005) |
| (724) |
| — |
| — |
| (218) |
| — |
| (106,363) |
| (131,310) |
| (15,261) |
Exchange differences | 5,114 |
| (2,237) |
| — |
| — |
| (282) |
| — |
| — |
| 2,595 |
| — |
On December 31, 2022 | 453,718 |
| 268,470 |
| 943,096 |
| 85,949 |
| 34,743 |
| — |
| 7,961,141 |
| 9,747,117 |
| 37,901 |
Additions (i) | 81,911 |
| 233,155 |
| — |
| — |
| 25,541 |
| 1,533,969 |
| 45,271 |
| 1,919,847 |
| — |
Contractual readjustments | 17,917 |
| 3,426 |
| 332 |
| — |
| — |
| — |
| 96,257 |
| 117,932 |
| 4,754 |
Write-offs | (25,110) |
| (7,084) |
| — |
| — |
| — |
| — |
| (6,384) |
| (38,578) |
| — |
Transfers | — |
| 34,742 |
| — |
| — |
| — |
| — |
| — |
| 34,742 |
| — |
Exchange differences | (11,347) |
| (11,589) |
| — |
| — |
| (120) |
| — |
| — |
| (23,056) |
| — |
On December 31, 2023 | 517,089 |
| 521,120 |
| 943,428 |
| 85,949 |
| 60,164 |
| 1,533,969 |
| 8,096,285 |
| 11,758,004 |
| 42,655 |
Amortization | — |
| — |
| — |
| — |
| — |
| — |
| — |
| — |
| — |
On January 1, 2022 | (67,919) |
| (29,258) |
| (399,218) |
| (16,959) |
| (15,125) |
| — |
| (776,636) |
| (1,305,115) |
| (15,358) |
Additions | (65,254) |
| (81,349) |
| (34,990) |
| (4,015) |
| (7,713) |
| — |
| (267,094) |
| (460,415) |
| (5,146) |
Write-offs | 6,099 |
| 710 |
| — |
| — |
| 943 |
| — |
| 20,535 |
| 28,287 |
| 5,635 |
Exchange differences | 1,577 |
| 1,246 |
| — |
| — |
| 172 |
| — |
| — |
| 2,995 |
| — |
On December 31, 2022 | (125,497) |
| (108,651) |
| (434,208) |
| (20,974) |
| (21,723) |
| — |
| (1,023,195) |
| (1,734,248) |
| (14,869) |
Additions | (74,850) |
| (47,435) |
| (34,347) |
| (4,380) |
| (13,128) |
| (38,349) |
| (320,280) |
| (532,769) |
| (5,586) |
Write-offs | 10,166 |
| 1,151 |
| — |
| — |
| — |
| — |
| — |
| 11,317 |
| — |
Exchange differences | 2,913 |
| 8,187 |
| — |
| — |
| 114 |
| — |
| — |
| 11,214 |
| — |
On December 31, 2023 | (187,268) |
| (146,748) |
| (468,555) |
| (25,354) |
| (34,737) |
| (38,349) |
| (1,343,475) |
| (2,244,486) |
| (20,455) |
On December 31, 2022 | 328,221 |
| 159,819 |
| 508,888 |
| 64,975 |
| 13,020 |
| — |
| 6,937,946 |
| 8,012,869 |
| 23,032 |
On December 31, 2023 | 329,821 |
| 374,372 |
| 474,873 |
| 60,595 |
| 25,427 |
| 1,495,620 |
| 6,752,810 |
| 9,513,518 |
| 22,200 |
| (i) | The addition of the period is mainly composed of the contract related to the charter of the floating storage and regasification unit (“FRSU”) according to note 2. |
Explanatory Notes to the Financial Statement
(In thousands of Reais, except when otherwise indicated)
Accounting policy:
Investment properties are initially value at cost, including transaction costs. Upon initial recognition, investment properties are measured at fair value, which reflects market conditions at the date of the balance sheet, with changes recorded in the income statement. Revenue from the sale of agricultural properties is not recognized in income until I the sale is complete, (ii) the Company determines that payment by the buyer is probable, (iii) the revenue can be reliably measured, and (iv) the Company has transferred all risks associated with the property to the buyer and no longer has any involvement with the property. The gains from the sale of agricultural properties are reported as net income on the income statement, while the costs are reported as cost of properties sold.
The fair value of agricultural properties was determined using the direct comparative method of market data applied to transactions involving comparable properties (type, location, and quality of property) and, to a lesser extent, using sales quotes for potential transactions involving comparable assets (level 3). In accordance with the standards issued by the Brazilian Association of Technical Standards (Associação Brasileira de Normas Técnicas – “ABNT”), the methodology used to determine fair value takes into account direct comparisons of market information, such as market research, homogenization of values, spot market prices, sales, distances, facilities, access to land, topography and soil, use of land (type of crop), and rainfall, among other data. As at December 31, 2023, discount rates range between 11.12% per year and 11.20% per year (11.20% per year and 13.75% per year as at December 31, 2022).
The portfolio is evaluated annually by external specialists and periodically by internal professionals who are technically qualified to conduct this type of evaluation. |
| Investment properties |
On January 1, 2022 | 3,886,696 |
Change in the fair value of investment properties | 1,311,691 |
Business combination | 9,209,626 |
Additions | 17,477 |
Transfers (i) | (322,430) |
On December 31, 2022 | 14,103,060 |
Change in the fair value of investment properties | 2,259,924 |
Additions | 58,506 |
Transfers (i) | (444,782) |
Write off | (582) |
On December 31, 2023 | 15,976,126 |
| (i) | Transfers to the group of properties maintained for sale as explanatory note 8, resulting from the sales of proposals Fazendas Grão de Ouro e Dourados (Tellus Brasil Participações S.A.); Fazenda Santa Rita Cana (Duguetiapar Empreendimentos e Participações S.A.); Gleba Macaé (Radar II Propriedades Agrícolas S.A.). |
Explanatory Notes to the Financial Statement
(In thousands of Reais, except when otherwise indicated)
Considering the current gas supply contracts, the subsidiaries have financial commitment that totaled an estimated present value of R$44,057,687, the amount of which includes the minimum volume established in the contract, both in commodities and in transportation, with a term until December 2034.
The sub-concession agreements for which Rumo, through its subsidiaries, generally include commitments to execute investments with certain characteristics during the term of the agreement. We can highlight:
| (i) | The amendment to renew the Malha Paulista concession, which provides for the execution throughout the concession of a set of investment projects to increase capacity and reduce urban conflicts, estimated by the agency at R$6,100,000 (value updated until December 2017). Of this amount, around R$3,000,000 make up the bond book, the physical execution of which was 26.99% up to the balance sheet date. | |
| (ii) | The Malha Central sub concession contract provides for investments with a fixed term (from one to three years from the signing of the contract), estimated by ANTT at R$645,573. As of December 31, 2023, the physical execution of the projects in the book of obligations was 96.41%. |
Accounting policy: This account contains the balance of lease payments at issue in disputes with the granting authority. Upon transfer from the "lease liabilities" account, the initial registration is completed at the value of the installment at maturity. These values are then adjusted using the SELIC rate. In this account, balances are maintained in installments with the Granting Authority. The initial registration is for the balance owed following the resolution of the dispute. These values are then adjusted using the SELIC rate. Balances payable for granted concession rights ("Concessions and Grants"), initially recorded as a counterpart to intangible assets, are also recorded in this account (Note 11.2). The following measurement is performed at the effective rate. |
| 12/31/2023 |
| 12/31/2022 |
Disputed lease and concession: |
|
|
|
Rumo Malha Oeste S.A. | 2,206,945 |
| 1,957,149 |
| 2,206,945 |
| 1,957,149 |
|
|
|
|
Lease installment payments: |
|
|
|
Rumo Malha Paulista S.A. | 1,067,256 |
| 1,138,076 |
| 1,067,256 |
| 1,138,076 |
|
|
|
|
Concessions and grants: |
|
|
|
Rumo Malha Sul S.A. | 76,191 |
| 81,112 |
Rumo Malha Paulista S.A. | 190,282 |
| 156,497 |
Rumo Malha Central S.A. | 24,699 |
| 18,576 |
| 291,172 |
| 256,185 |
|
|
|
|
Total | 3,565,373 |
| 3,351,410 |
|
|
|
|
Current | 250,971 |
| 256,759 |
Non-current | 3,314,402 |
| 3,094,651 |
| 3,565,373 |
| 3,351,410 |
Explanatory Notes to the Financial Statement
(In thousands of Reais, except when otherwise indicated)
a) Disputed lease and concession:
On July 21, 2020, Rumo filed with the National Land Transport Agency (Agência Nacional de Transportes Terrestres – “ANTT”) a request to participate in a third-party re-bidding process for the Concession Agreement entered into between Malha Oeste and the Federal Government, through the Ministry of Transport ("Rebidding Process"), in accordance with Law No. 13,448 of June 5, 2017, and Decree No. 9,957 of August 8, 2019. An amendment to the concession agreement was signed, and as a result, the economic and financial rebalancing action filed by Rumo Malha Oeste against the Union, which had a decision of origin from the lower court and was awaiting a ruling from the Federal Regional Court, was suspended by joint decision of the parties.
The total amount of judicial deposits related to the cases is R$26,064 (R$24,125 as at December 31, 2022).
b) Leases and grants within the scope of CPC 06 R2/IFRS 16
| 12/31/2023 |
| 12/31/2022 |
Leases: |
|
|
|
Rumo Malha Sul S.A. | 452,701 |
| 542,996 |
Rumo Malha Paulista S.A. | 422,173 |
| 539,900 |
Rumo Malha Oeste S.A. | 131,038 |
| 185,324 |
Portofer Transporte Ferroviário Ltda. | — |
| 11,658 |
| 1,005,912 |
| 1,279,878 |
|
|
|
|
Grants: |
|
|
|
Rumo Malha Paulista S.A. (renewal) | 919,011 |
| 732,727 |
Rumo Malha Central S.A. | 940,456 |
| 792,374 |
| 1,859,467 |
| 1,525,101 |
|
|
|
|
Total | 2,865,379 |
| 2,804,979 |
|
|
|
|
Current | 358,464 |
| 350,719 |
Non-current | 2,506,915 |
| 2,454,260 |
| 2,865,379 |
| 2,804,979 |
Explanatory Notes to the Financial Statement
(In thousands of Reais, except when otherwise indicated)
Accounting policy: The Company incurs various taxes and contributions, including municipal, state, and federal taxes, taxes on bank deposits and withdrawals, turnover taxes, regulatory fees, and income tax, among others. Additionally, it is subject to other taxes on its activities that do not generally represent an expense. |
| Parent Company |
| Consolidated | ||||
| 12/31/2023 |
| 12/31/2022 |
| 12/31/2023 |
| 12/31/2022 |
Tax debts installments | 211,226 |
| 202,140 |
| 217,348 |
| 208,760 |
ICMS | — |
| 43 |
| 190,474 |
| 271,688 |
COFINS | 96,905 |
| 48,982 |
| 177,720 |
| 246,501 |
PIS | 12,951 |
| 2,579 |
| 27,073 |
| 43,524 |
Social Security charges | 62,249 |
| 29,416 |
| 87,214 |
| 42,186 |
IRRF | — |
| — |
| 14,133 |
| 14,553 |
Other | 2,082 |
| 6,676 |
| 122,998 |
| 86,517 |
|
|
|
|
|
|
|
|
| 385,413 |
| 289,836 |
| 836,960 |
| 913,729 |
|
|
|
|
|
|
|
|
Current | 226,556 |
| 141,216 |
| 673,718 |
| 760,041 |
Non-current | 158,857 |
| 148,620 |
| 163,242 |
| 153,688 |
Total | 385,413 |
| 289,836 |
| 836,960 |
| 913,729 |
The amounts due in non-current liabilities have the following maturity schedule:
| Parent Company |
| Consolidated | ||||
| 12/31/2023 |
| 12/31/2022 |
| 12/31/2023 |
| 12/31/2022 |
From 13 to 24 months | — |
| 1,599 |
| 881 |
| 2,255 |
From 25 to 36 months | — |
| — |
| 572 |
| 656 |
From 37 to 48 months | — |
| — |
| 572 |
| 656 |
From 49 to 60 months | — |
| — |
| 572 |
| 656 |
Over 60 months | 158,857 |
| 147,021 |
| 160,645 |
| 149,465 |
| 158,857 |
| 148,620 |
| 163,242 |
| 153,688 |
Explanatory Notes to the Financial Statement
(In thousands of Reais, except when otherwise indicated)
Accounting policy The total rate of income tax and social contribution is 34%. Current tax and deferred tax are recognized in profit or loss, with the exception of certain transactions which are directly recognized in shareholder’s equity or other comprehensive income. a)Current tax It is the expected tax payable or receivable on taxable profit or loss for the year, using tax rates enacted or substantively enacted as of the date of the balance sheet, as well as any adjustments to tax payable in respect of prior years. b)Deferred tax Deferred tax is recognized as temporary differences between the carrying amounts of assets and liabilities for financial reporting purposes and the amounts used for taxation and tax loss. The measurement of deferred tax reflects how the Company expects, at the end of the reporting period, to realize or settle the carrying value of its assets and liabilities. Deferred tax is measured at the rates anticipated to be applied to temporary differences upon their reversal, using rates enacted or substantively enacted as of the date of the balance sheet. If there is a legally enforceable right to offset current tax assets and liabilities, and if they relate to taxes imposed by the same tax authority on the same taxable entity, deferred tax assets and liabilities are offset. c)Tax exposure In calculating the amount of current and deferred tax, the Company considers the impact of uncertain tax positions and the possibility of additional taxes and interest being owed. This evaluation is based on estimates and hypotheses and may involve a series of future event judgments. New information may become available, causing the Company to change its opinion regarding the sufficiency of existing tax liabilities; such changes in tax obligations will have an impact on tax expenses in the period in which the determination is made. d)Recoverability of deferred income tax and social contribution When evaluating the recoverability of deferred taxes, Management takes future taxable income projections and changes in temporary differences into account. The recoverability of the deferred tax asset in the parent company depends on taxable income projections. When it is unlikely that a portion or all the tax liability will be realized, the tax asset is reversed. No deadline exists for the utilization of tax losses and negative bases, but the utilization of these accumulated losses from prior years is limited to 30% of annual taxable income. The Company and its subsidiaries adhere to both the letter and spirit of the tax laws and regulations of the countries in which they conduct business, being committed to good tax practices. They are also committed to the practice of transfer pricing that respects the principles of full competition and the rules defined by the tax legislation of the jurisdictions in which they operate, with transparency of operations, business ethics, and no use of practices that result in an artificial reduction in taxation. |
Explanatory Notes to the Financial Statement
(In thousands of Reais, except when otherwise indicated)
a) Reconciliation of income tax and social contribution expenses:
|
| Parent Company |
| Consolidated | ||||
|
| 12/31/2023 |
| 12/31/2022 (Restated) |
| 12/31/2023 |
| 12/31/2022 (Restated) |
Income before income tax and social contribution |
| 430,447 |
| 70,649 |
| 5,113,751 |
| 2,652,625 |
Income tax and social contribution at nominal rate (34%) |
| (146,352) |
| (24,021) |
| (1,738,675) |
| (901,893) |
Adjustments for calculating the effective rate |
|
|
|
|
|
|
|
|
Equity income |
| 825,704 |
| 1,226,979 |
| 672,947 |
| 122,238 |
Result of companies abroad |
| (44,101) |
| (28,539) |
| (62,870) |
| (16,973) |
Operating profit |
| — |
| — |
| 279,941 |
| 197,307 |
Share-based payment transactions |
| — |
| (73) |
| — |
| (73) |
Interest on equity capital |
| (22,709) |
| (66,544) |
| (191,763) |
| (26,058) |
Goodwill amortization effect |
| — |
| — |
| 1,271 |
| — |
Permanent differences |
| — |
| — |
| (16,787) |
| (13,788) |
Unrecognized tax losses and temporary differences |
| — |
| — |
| (308,358) |
| (228,579) |
ICMS benefit - extemporaneous |
| — |
| — |
| 5,506 |
| 345,067 |
ICMS benefit - current year |
| — |
| — |
| 68,409 |
| 242,694 |
Dividend income (i) |
| — |
| — |
| 254,260 |
| — |
Provision for non-realization of the benefit of the Federative covenant (ii) |
| — |
| — |
| (307,099) |
| — |
Provision for non-realization of the benefit of the Federative covenant - Interest and Fine (iii) |
| — |
| — |
| 100,731 |
| — |
Selic on indebtedness |
| 16,203 |
| 11,206 |
| 147,741 |
| 22,103 |
Rate differential (iv) |
| — |
| — |
| 805,725 |
| 446,293 |
Benefit Membership Program Zero Litigation (iii) |
| 19,710 |
| — |
| 23,276 |
| — |
Other |
| (165) |
| (30,805) |
| (8,681) |
| (69,934) |
Income tax and social contribution (current and deferred) |
| 648,290 |
| 1,088,203 |
| (274,426) |
| 118,404 |
|
|
|
|
|
|
|
|
|
Effective rate - % |
| 150.61% |
| 1540.29% |
| (5.37%) |
| 4.46% |
Explanatory Notes to the Financial Statement
(In thousands of Reais, except when otherwise indicated)
| (i) | Refers to dividends received from Vale S.A. | |
| (ii) | From the 1st quarter of 2021, the subsidiaries Comgás and Moove began to calculate and use current and extemporaneous credits resulting from the non-taxation of the benefit of the ICMS calculation base reduction. The subsidiary Comgás uses the base reduction of ICMS calculation in the State of São Paulo, pursuant to art. 8th of Annex II of the ICMS Regulation, approved by State Decree nº 45.490/2000, as amended by State Decrees nº 62.399/2016 and 67.383/2022. Natural gas outlets within the State of São Paulo are subject to ICMS at the effective rate of 15% instead of the general rate of 18%. The subsidiary Moove, makes use of deferrals of ICMS provided by art. 44, Book IV of RICMS/ RJ1 and art. 1st of Decree 44.637/2014, in the internal acquisition and import of basic oil, input for the production of lubricating oil. These credits were recognized by the Company in 2021 based on its better understanding of the subject, embodied by the opinion of its external legal advisors, which took into account all the jurisprudence then applicable to the subject. On April 26, 2023, the Supreme Court ruled that tax benefits as a base reduction of ICMS calculation can only be excluded from the IRPJ/CSLL if the requirements of Complementary Law 160/2017 are met (art. 30 of Law 12.973/2014), that is, with the constitution of reserve. Based on this decision, the Company’s directors, observing the technical interpretation that governs the treatment of uncertainties regarding taxes on profit (ICPC22 and IFRIC 23), decided to establish a provision on March 31, 2023, in the historical amount of R$1,370,304 (R$1,074,989 of principal registered in the current income tax line, R$138,526 of interest and R$156,790 of fine recorded in the financial result line). The updated amount used by the Company for extemporaneous and current credit totals R$1,681,795 (R$1,122,358 principal, R$281,565 fine and R$277,871 interest) which also includes the assessments received for the year 2018 and the other credits used in the following years until March 31, 2023, plus the respective legal charges. On December 29, 2023, Law 14,789/2023 was published, which granted a discount of 80% for payment of all debts, charges and not charged by the RFB on this subject. With the regulation of the portion referring to the debits not charged, through IN 2.184/2024, the Company will follow the administrative procedures for the effective settlement of this portion and awaits the regulation of the portion referring to the debits charged, to complete the discharge of liabilities. Because of the discount granted, there was a chargeback of liabilities in the amount of R$1,345,435 and the balance of the Company’s updated liabilities in the year ended December 31, 2023, is R$336,359 (R$224,472 principal, R$56,312 fine and R$55,574 interest). | |
| (iii) | Adherence to the Tax Litigation Reduction Program, (Joint Ordinance PGFN/RFB No. 01/2023), as defined in art. 11 § 12 of Law 13,988/2020, which establishes the requirements and conditions for dispute resolution transactions with the Public Treasury. | |
| (iv) | Difference in rate between the nominal rate of 34% and the effective rate applicable to entities that calculate the tax under the presumed profit regime. |
Explanatory Notes to the Financial Statement
(In thousands of Reais, except when otherwise indicated)
b)Deferred income tax assets and liabilities
Below are presented the tax effects of temporary differences that give rise to significant parts of the company's deferred tax assets and liabilities:
| Parent Company |
| Consolidated | |||||
|
| 12/31/2023 |
| 12/31/2022 |
| 12/31/2023 |
| 12/31/2022 |
Deferred tax assets from: |
|
|
|
|
|
|
|
|
Income tax losses |
| 945,685 |
| 697,179 |
| 2,714,996 |
| 2,244,654 |
Social contribution tax losses |
| 340,981 |
| 251,519 |
| 929,055 |
| 809,556 |
Temporary differences |
|
|
|
|
|
|
|
|
Foreign exchange variation - Loans and borrowings |
| 1,165,734 |
| 1,299,577 |
| 1,292,954 |
| 1,701,529 |
Provision for lawsuits |
| 95,780 |
| 78,190 |
| 218,881 |
| 204,303 |
Impairment provision (Rumo Malha Oeste) |
| — |
| — |
| 27,072 |
| 34,469 |
Post-employment benefit obligation |
| — |
| — |
| 150,336 |
| 152,373 |
Provisions for expected credit losses |
| — |
| — |
| 34,511 |
| 31,880 |
Provision for unrealized taxes |
| 6,985 |
| 6,985 |
| 73,641 |
| 70,815 |
Share-based payment transactions |
| 64,065 |
| 26,846 |
| 157,825 |
| 82,480 |
Lease |
| 2,497 |
| 2,493 |
| 161,840 |
| 167,962 |
Unrealized loss with derivatives |
| 165,978 |
| — |
| 823,286 |
| 674,554 |
Provisions for profit sharing |
| 36,020 |
| 18,322 |
| 159,994 |
| 124,833 |
Business Combination - Intangible assets |
| — |
| — |
| 124,379 |
| 119,060 |
Business combination – Property, plant and equipment |
| — |
| — |
| 24,795 |
| 36,535 |
Selic on indebtedness |
| — |
| 77,645 |
| — |
| 100,264 |
Other provisions |
| — |
| 196,671 |
| 691,162 |
| 581,059 |
Deferred tax on pre-operating income |
| — |
| — |
| 87,454 |
| 14,009 |
Regulatory asset (liability) |
| — |
| — |
| 6,661 |
| 4,843 |
Other |
| 208,331 |
| 1,607 |
| 391,444 |
| 488,299 |
Total |
| 3,032,056 |
| 2,657,034 |
| 8,070,286 |
| 7,643,477 |
|
|
|
|
|
|
|
|
|
Deferred tax liabilities from: |
|
|
|
|
|
|
|
|
Temporary differences |
|
|
|
|
|
|
|
|
Exchange rate variation - Loans and borrowings |
| — |
| — |
| (195,232) |
| — |
Provision for lawsuits |
| — |
| — |
| (408) |
| — |
Useful life review |
| — |
| — |
| (456,093) |
| (401,926) |
Business combination – Property, plant and equipment |
| — |
| — |
| (148,872) |
| (76,263) |
Tax goodwill amortized |
| — |
| — |
| (618,758) |
| (359,100) |
Unrealized income with derivatives |
| — |
| (249,206) |
| (299,965) |
| (226,243) |
Fair value adjustment on debt |
| — |
| — |
| (281,784) |
| (548,726) |
Marketable securities |
| — |
| — |
| (77,437) |
| (1,150,916) |
Investment properties |
| — |
| — |
| (455,773) |
| (391,382) |
Goods intended for sale |
| — |
| — |
| (10,546) |
| — |
Capitalized interest |
| — |
| — |
| — |
| (108,616) |
Effects on the formation of joint ventures |
| (103,992) |
| (106,254) |
| (103,992) |
| (106,254) |
Business Combination – Intangible assets |
| — |
| — |
| (4,426,881) |
| (4,486,211) |
Post-employment obligations |
| — |
| — |
| (4,641) |
| (4,594) |
Lease |
| — |
| 495 |
| (10,034) |
| (11,797) |
Provisions |
| — |
| 815 |
| (449,153) |
| (79,092) |
Other (i) |
| (449,153) |
| (445,264) |
| (147,120) |
| (687,601) |
Total |
| (553,145) |
| (799,414) |
| (7,686,689) |
| (8,638,721) |
Total deferred taxes recorded |
| 2,478,911 |
| 1,857,620 |
| 383,597 |
| (995,244) |
Deferred tax assets (ii) |
| 2,478,911 |
| 1,857,620 |
| 5,609,030 |
| 4,474,124 |
Deferred tax liabilities |
| — |
| — |
| (5,225,433) |
| (5,469,368) |
Total deferred, net |
| 2,478,911 |
| 1,857,620 |
| 383,597 |
| (995,244) |
Explanatory Notes to the Financial Statement
(In thousands of Reais, except when otherwise indicated)
| (i) | Refers mainly to the tax loss recognized on the capital contribution in a controlled company. | |
| (ii) | Total amount of the balance of deferred income tax and social contribution consolidated assets, R$1,869,877 corresponds to the balance of the subsidiary Rumo S.A. |
The Company determined the period for offsetting its deferred tax assets on tax losses, social contribution negative basis and temporary differences based on the projection of its taxable income and long-term strategic planning, with the following realization expected as at December 31, 2023:
| Parent company |
| Consolidated |
Within 1 year | 98,926 |
| 808,979 |
1 to 2 years | 1,006,146 |
| 1,308,994 |
2 to 3 years | 81,466 |
| 384,929 |
3 to 4 years | 567,216 |
| 823,923 |
4 to 5 years | 65,210 |
| 328,555 |
5 to 8 years | 312,183 |
| 950,882 |
8 to 10 years | 347,764 |
| 1,002,768 |
| 2,478,911 |
| 5,609,030 |
Deferred income tax and social contribution inactivated
As of December 31, 2023, the balance of inactivated income tax and social contribution is R$2,678,299 and refers mainly to tax losses and temporary differences of the subsidiary Rumo S.A, of the indirect subsidiaries Rumo Malha Sul and Rumo Malha Oeste, which under current conditions do not meet the requirements for the accounting of said deferred income tax and social contribution asset due to the lack of predictability of future generation of tax profits.
Explanatory Notes to the Financial Statement
(In thousands of Reais, except when otherwise indicated)
c)Changes in deferred tax assets and liabilities:
Assets
| Income and Social contribution tax losses |
| Employee benefits |
| Unrealized loss with derivatives |
| Provisions |
| Leases |
| Other |
| Total |
On January 1, 2022 | 721,109 |
| 34,986 |
| — |
| 268,874 |
| 1,998 |
| 1,559,777 |
| 2,586,744 |
Credited / charged from income for the year | 227,589 |
| 10,182 |
| — |
| 12,972 |
| 495 |
| 9,876 |
| 261,114 |
Recognized in equity | — |
| — |
| — |
| — |
| — |
| (8,269) |
| (8,269) |
Foreign exchange differences | — |
| — |
| — |
| — |
| — |
| (182,555) |
| (182,555) |
On December 31, 2022 | 948,698 |
| 45,168 |
| — |
| 281,846 |
| 2,493 |
| 1,378,829 |
| 2,657,034 |
Credited / charged from income for the year | 337,968 |
| 54,917 |
| 165,978 |
| (179,081) |
| 4 |
| 129,079 |
| 508,865 |
Foreign exchange differences | — |
| — |
| — |
| — |
| — |
| (133,843) |
| (133,843) |
On December 31, 2023 | 1,286,666 |
| 100,085 |
| 165,978 |
| 102,765 |
| 2,497 |
| 1,374,065 |
| 3,032,056 |
Liabilities
Parent Company | |||||||
| Effects on the formation of joint venture |
| Unrealized income with derivatives |
| Other |
| Total |
On January 1, 2023 | (602,673) |
| (748,873) |
| (457,512) |
| (1,809,058) |
Credited / charged from income for the year | 496,419 |
| 499,667 |
| 13,558 |
| 1,009,644 |
On December 31, 2022 | (106,254) |
| (249,206) |
| (443,954) |
| (799,414) |
Credited / charged from income for the year | 2,262 |
| 249,206 |
| (8,762) |
| 242,706 |
Other comprehensive income (loss) | — |
| — |
| 3,563 |
| 3,563 |
On December 31, 2023 | (103,992) |
| — |
| (449,153) |
| (553,145) |
|
|
|
|
|
|
|
|
Total deferred taxes recognized |
|
|
|
|
| 2,478,911 | |
Explanatory Notes to the Financial Statement
(In thousands of Reais, except when otherwise indicated)
Assets:
| Consolidated | ||||||||||||||||
| Income and Social contribution tax losses |
| Post-employment obligations |
| Employee benefits |
| Provisions |
| Leases |
| Unrealized gains on derivatives |
| Intangible assets |
| Other |
| Total |
On January 1, 2022 | 2,367,707 |
| 160,082 |
| 148,338 |
| 688,972 |
| 189,890 |
| — |
| 111,590 |
| 2,024,834 |
| 5,691,413 |
Credited / charged from income for the year | 686,503 |
| (7,709) |
| 58,975 |
| 233,554 |
| (21,928) |
| 674,554 |
| 7,470 |
| 299,687 |
| 1,931,106 |
Recognized in equity | — |
| — |
| — |
| — |
| — |
| — |
| — |
| (13,071) |
| (13,071) |
Foreign exchange differences | — |
| — |
| — |
| — |
| — |
| — |
| — |
| 34,029 |
| 34,029 |
On December 31, 2022 | 3,054,210 |
| 152,373 |
| 207,313 |
| 922,526 |
| 167,962 |
| 674,554 |
| 119,060 |
| 2,345,479 |
| 7,643,477 |
Credited / charged from income for the year | 589,841 |
| (2,037) |
| 110,506 |
| 122,741 |
| (6,122) |
| 148,732 |
| 5,319 |
| (133,596) |
| 835,384 |
Foreign exchange differences | — |
| — |
| — |
| — |
| — |
| — |
| — |
| (408,575) |
| (408,575) |
On December 31, 2023 | 3,644,051 |
| 150,336 |
| 317,819 |
| 1,045,267 |
| 161,840 |
| 823,286 |
| 124,379 |
| 1,803,308 |
| 8,070,286 |
Liabilities:
| Consolidated | ||||||||||||||||||
| Effects on the formation of joint ventures |
| Post-employment obligations |
| Intangible assets |
| Unrealized gains on derivatives |
| Property, plant and equipment |
| Fair value adjustment |
| Leases |
| Provisions |
| Other |
| Total |
On January 1, 2022 | (602,673) |
| — |
| (3,492,345) |
| (1,028,058) |
| (350,110) |
| (126,174) |
| (3,219) |
| (11,427) |
| (843,835) |
| (6,457,841) |
Credited / charged from income for the year | 496,419 |
| (4,594) |
| 369,455 |
| 807,391 |
| (51,816) |
| (355,946) |
| (8,578) |
| (67,665) |
| (1,784,407) |
| (599,741) |
Other comprehensive income | — |
| — |
| — |
| (5,576) |
| — |
| — |
| — |
| — |
| (1,469) |
| (7,045) |
Business combination | — |
| — |
| (1,363,321) |
| — |
| — |
| (66,606) |
| — |
| — |
| (144,167) |
| (1,574,094) |
On December 31, 2022 | (106,254) |
| (4,594) |
| (4,486,211) |
| (226,243) |
| (401,926) |
| (548,726) |
| (11,797) |
| (79,092) |
| (2,773,878) |
| (8,638,721) |
Credited / charged from income for the year | 2,262 |
| (47) |
| 59,330 |
| (73,722) |
| (54,167) |
| 200,336 |
| 1,763 |
| (370,469) |
| 1,178,542 |
| 943,828 |
Other comprehensive income | — |
| — |
| — |
| — |
| — |
| — |
| — |
| — |
| (58,402) |
| (58,402) |
Liabilities available for sale | — |
| — |
| — |
| — |
| — |
| 66,606 |
| — |
| — |
| — |
| 66,606 |
On December 31, 2023 | (103,992) |
| (4,641) |
| (4,426,881) |
| (299,965) |
| (456,093) |
| (281,784) |
| (10,034) |
| (449,561) |
| (1,653,738) |
| (7,686,689) |
|
|
|
|
|
|
|
|
|
|
|
|
|
|
|
|
|
|
|
|
Total deferred taxes recognized |
|
|
|
|
|
|
|
|
|
|
|
|
|
|
|
|
| 383,597 | |
Explanatory Notes to the Financial Statement
(In thousands of Reais, except when otherwise indicated)
Accounting policy: They are recognized as other expenses when the Company has a present or constructive obligation as a result of previous events, it is expected that an outflow of resources will be required to settle the obligation, and the amount can be estimated with reasonable certainty. The chance of loss evaluation is comprised of existing facts, the hierarchy of laws, case law, the most recent court decisions, the legal system's relevance, and the opinion of outside counsel. Provisions are examined and altered for conditions, such as the expiration of the statute of limitations, the conclusion of tax audits, or the identification of additional exposures based on new matters or judicial decisions. Provisions for lawsuits stemming from business combinations are valued at fair market value. |
As of December 31, 2023, and December 31, 2022, the Corporation had contingent liabilities and judicial deposits pertaining to:
|
| ||||||
| Provision for lawsuits | ||||||
| Parent Company |
| Consolidated | ||||
| 12/31/2023 |
| 12/31/2022 |
| 12/31/2023 |
| 12/31/2022 |
Tax | 272,063 |
| 227,481 |
| 813,732 |
| 747,647 |
Civil, environmental and regulatory | 73,744 |
| 53,835 |
| 512,979 |
| 662,052 |
Labor | 55,286 |
| 68,041 |
| 387,692 |
| 391,487 |
| 401,093 |
| 349,357 |
| 1,714,403 |
| 1,801,186 |
| Judicial deposit | ||||||
| Parent Company |
| Consolidated | ||||
| 12/31/2023 |
| 12/31/2022 |
| 12/31/2023 |
| 12/31/2022 |
Tax | 373,779 |
| 327,354 |
| 652,236 |
| 585,988 |
Civil, environmental and regulatory | 16,126 |
| 15,644 |
| 114,724 |
| 92,411 |
Labor | 13,584 |
| 17,565 |
| 128,941 |
| 136,045 |
| 403,489 |
| 360,563 |
| 895,901 |
| 814,444 |
Explanatory Notes to the Financial Statement
(In thousands of Reais, except when otherwise indicated)
Changes in provisions for lawsuits:
| Parent Company | ||||||
| Tax |
| Civil, environmental, and regulatory |
| Labor |
| Total |
On January 1, 2022 | 164,652 |
| 123,420 |
| 73,787 |
| 361,859 |
Provisioned in the year | 42,295 |
| 20,386 |
| 4,332 |
| 67,013 |
Write-offs by reversal / payment | (31,243) |
| (86,308) |
| (15,821) |
| (133,372) |
Interest (i) | 51,777 |
| (3,663) |
| 5,743 |
| 53,857 |
On December 31,2022 | 227,481 |
| 53,835 |
| 68,041 |
| 349,357 |
Provisioned in the year | 17,579 |
| 29,080 |
| 2,899 |
| 49,558 |
Write-offs by reversal / payment | (3,180) |
| (20,768) |
| (15,469) |
| (39,417) |
Interest (i) | 30,183 |
| 11,597 |
| (185) |
| 41,595 |
On December 31,2023 | 272,063 |
| 73,744 |
| 55,286 |
| 401,093 |
|
|
|
|
|
|
|
|
| Consolidated | ||||||
| Tax |
| Civil, environmental, and regulatory |
| Labor |
| Total |
On January 1, 2022 | 647,610 |
| 585,034 |
| 411,417 |
| 1,644,061 |
Provisioned in the year | 71,063 |
| 159,758 |
| 153,789 |
| 384,610 |
Write-offs by reversal / payment | (56,447) |
| (238,912) |
| (225,044) |
| (520,403) |
Conversion effect | 3,994 |
| 15,786 |
| 52 |
| 19,832 |
Interest (i) | 81,427 |
| 140,386 |
| 51,273 |
| 273,086 |
On December 31,2022 | 747,647 |
| 662,052 |
| 391,487 |
| 1,801,186 |
Provisioned in the year | 44,812 |
| 105,526 |
| 113,151 |
| 263,489 |
Write-offs by reversal / payment | (33,427) |
| (258,021) |
| (168,160) |
| (459,608) |
Transfer | — |
| 3,793 |
| 607 |
| 4,400 |
Interest (i) | 54,700 |
| (371) |
| 50,607 |
| 104,936 |
On December 31,2023 | 813,732 |
| 512,979 |
| 387,692 |
| 1,714,403 |
| (i) | Includes write-off of interest due to reversal. |
The Company has debts secured by assets or by means of cash deposits, bank guarantees or guarantee insurance.
The Company has probable indemnity lawsuits in addition to those mentioned, and as they represent contingent assets, they were not reported.
Explanatory Notes to the Financial Statement
(In thousands of Reais, except when otherwise indicated)
a) Probable losses
Tax: The main tax proceedings for which the risk of loss is probable are described below:
|
|
|
|
|
|
|
|
| Parent Company |
| Consolidated | ||||
| 12/31/2023 |
| 12/31/2022 |
| 12/31/2023 |
| 12/31/2022 |
Compensation with FINSOCIAL (i) | — |
| — |
| 326,220 |
| 312,721 |
INSS (ii) | 77,254 |
| 72,389 |
| 100,149 |
| 98,657 |
ICMS credit (iii) | 99,864 |
| 63,093 |
| 174,860 |
| 125,723 |
PIS and COFINS | 32,832 |
| 27,954 |
| 33,244 |
| 30,446 |
IPI | 56,638 |
| 54,430 |
| 63,358 |
| 60,852 |
IRPJ and CSLL | 1,102 |
| 1,065 |
| 10,698 |
| 11,676 |
Other | 4,373 |
| 8,550 |
| 105,203 |
| 107,572 |
| 272,063 |
| 227,481 |
| 813,732 |
| 747,647 |
| (i) | Offset of FINSOCIAL with federal taxes, based on a September 2003 final and non-appealable court ruling in the case records where the constitutionality of FINSOCIAL was discussed. Compensation of taxes remains a topic of administrative discussion. | |
| (ii) | Amount provisioned as INSS, the majority of which is comprised of amounts related to social security contributions levied on billing in accordance with article 22-A of Law 8.212/91, the constitutionality of which is being litigated. The amounts are deposited with the court. The leading case – RE 611.601 (topic 281) was judged unfavorably by the Federal Supreme Court, recognizing the constitutionality of art. 22-A of Law No. 8,212/91. | |
| (iii) | ICMS required by the State of São Paulo resulting from disallowances of credits for diesel oil used in the agro-industrial production process. The Motions on Execution were dismissed as unfounded, as were the appeals that followed; and infraction notices relating to ICMS credits arising from materials used in the production process classified as “use and consumption”, which would not generate the right to credit |
- Labor claims: The Company and its subsidiaries are parties to labor claims filed by former employees and outsourced service providers claiming among other things, compensation and indemnities. Additionally, the Company has public civil actions filed by the Labor Prosecutor's Office regarding alleged non-compliance with labor standards, working conditions and working environment. For claims deemed to have merit, the Company has signed Conduct Adjustment Agreements with the Brazilian authorities.
- Civil, environmental and regulatory lawsuits: The Company and its subsidiaries are involved in a number of Indemnity Lawsuits, Public Civil Actions, and Administrative Proceedings where, in the opinion of its legal counsel, the risk of loss is probable.
Explanatory Notes to the Financial Statement
(In thousands of Reais, except when otherwise indicated)
b) Possible losses
The main lawsuits for which we anticipate a risk of loss as possible are outlined below:
| Parent Company |
| Consolidated | ||||
| 12/31/2023 |
| 12/31/2022 |
| 12/31/2023 |
| 12/31/2022 |
Tax | 4,934,309 |
| 5,034,867 |
| 15,703,294 |
| 16,079,589 |
Civil, environmental and regulatory | 1,045,171 |
| 1,015,125 |
| 7,166,011 |
| 6,597,105 |
Labor | 9,168 |
| 23,972 |
| 805,222 |
| 782,080 |
| 5,988,648 |
| 6,073,964 |
| 23,674,527 |
| 23,458,774 |
Tax:
| Parent Company |
| Consolidated | ||||
| 12/31/2023 |
| 12/31/2022 |
| 12/31/2023 |
| 12/31/2022 |
Isolated fine - Federal tax (i) | — |
| — |
| 792,496 |
| 762,613 |
IRPJ/CSLL (ii) | 1,280,245 |
| 1,296,481 |
| 6,316,155 |
| 6,297,550 |
ICMS -Tax on circulation of goods (iii) | 1,205,621 |
| 1,264,685 |
| 2,962,716 |
| 2,987,853 |
IRRF (iv) | — |
| 1,389 |
| 1,226,223 |
| 1,366,268 |
PIS and COFINS (v) | 1,286,634 |
| 1,322,277 |
| 2,293,933 |
| 2,556,050 |
MP 470 installment of debts (vi) | 232,104 |
| 246,000 |
| 381,060 |
| 388,166 |
Stock Grant Plan | — |
| — |
| 60,863 |
| 68,846 |
IOF on loans (vii) | — |
| — |
| 154,606 |
| 149,323 |
Reward Credit Compensation (viii) | 143,322 |
| 138,753 |
| 143,322 |
| 138,753 |
IPI - Tax on industrialized products (ix) | 233,464 |
| 227,184 |
| 374,471 |
| 374,274 |
INSS | 79,019 |
| 90,049 |
| 159,007 |
| 161,037 |
Other | 473,900 |
| 448,049 |
| 838,442 |
| 828,856 |
| 4,934,309 |
| 5,034,867 |
| 15,703,294 |
| 16,079,589 |
| (i) | Among the demands related to the isolated fine, there is a fine resulting from disregard of REPORTO's tax benefits with the consequent application of the isolated fine corresponding to 50% of the value of the goods acquired. | |
| (ii) | Infraction notices and lawsuits have been issued by the Special Department of Federal Revenue of Brazil regarding (a) disallowance of amortization of goodwill expenses based on future profitability resulting from corporate operations; (b) capital gains on the sale of an equity interest; (c) labor provisions; and (d) still, there are infraction notices issued by the Federal Revenue Service in 2011, 2013 and 2019. | |
| (iii) | The ICMS demands are substantially related to (a) the disallowance of ICMS credits related to the acquisition of diesel oil; goods supposedly classified as use and consumption and suppliers who had their state registration revoked (declared unsuitable), among others; (b) proof of delivery of goods sold with FOB clause; (c) ICMS on transport services for export; (d) divergence in the application of legislation governing operations with tax substitution; and (e) acquisition of wagons as a result of the alleged non-exemption provided for by the Tax Regime for Incentives for the Modernization and Expansion of the Port Structure. | |
| (iv) | Collection of IRRF on (a) alleged capital gain from the acquisition of foreign companies and (b) disallowance of IRRF compensation on swap transactions. |
Explanatory Notes to the Financial Statement
(In thousands of Reais, except when otherwise indicated)
| (v) | Disallowances of PIS and COFINS credits calculated in the non-cumulative system as a result of divergence in the definition of inputs. | |
| (vi) | Applications for the payment in installment of federal tax debts are partially denied by the Special Department of Federal Revenue of Brazil due to insufficient tax losses to settle the respective debts. | |
| (vii) | IOF charges related primarily to (a) current accounts maintained by the Company's subsidiaries and (b) financial transactions between group companies. | |
| (viii) | Offset statements via the PERD/COMP electronic system that reference "premium credit" are considered as not declared by the Special Department of Federal Revenue of Brazil. | |
| (ix) | Claim for credit disallowance regarding IPI credits related to the acquisition of raw materials used in the manufacturing of immune products. |
Except for the effect noted in Note 15.a, item (ii), we have not identified any other effects of IFRIC 23 / ICPC 22 - Uncertainty over Income Tax Treatments that could significantly affect the accounting policies of the Company and its subsidiaries and these annual financial statements.
Civil, environmental and regulatory:
| Parent Company |
| Consolidated | ||||
| 12/31/2023 |
| 12/31/2022 |
| 12/31/2023 |
| 12/31/2022 |
Civil | 983,867 |
| 972,966 |
| 3,184,240 |
| 3,336,284 |
Environmental | 60,549 |
| 42,159 |
| 2,330,683 |
| 1,764,671 |
Regulatory | 755 |
| — |
| 1,651,088 |
| 1,496,150 |
| 1,045,171 |
| 1,015,125 |
| 7,166,011 |
| 6,597,105 |
Several civil, environmental, and regulatory judicial and administrative proceedings involving the Company and its subsidiaries present a potential for loss. The majority of civil litigation consists of contractual and extracontractual claims for damages. In the environmental realm, the processes involve commitment terms, civil investigations, and public civil actions. Regarding cases involving substantial sums, the following are the most pertinent:
Explanatory Notes to the Financial Statement
(In thousands of Reais, except when otherwise indicated)
Civil:
| (i) | The Company is litigating an action for the collection of legal fees filed by Alexandre Saddy Chade and others, where they request that the Company and other defendants be ordered to pay alleged legal fees that would be owed to the plaintiffs and that would amount to amounts close to R$366,110. The case awaits judgment on the Plaintiffs' Appeal and the Company's Adhesive Appeal, which seeks to increase the sentence in succumbing amounts. | |
| (ii) | The subsidiary Moove is a party to a lawsuit filed by Petroleum Comércio e Representações Ltda., seeking to order the company to pay material damages, loss of profits and a fine, alleging breach of contract. This process involves a total value of R$160,508. The judgment on the merits in the first instance is awaited. | |
| (iii) | The indirect subsidiary Rumo Malha Sul is a party to the execution of a conduct adjustment agreement signed with the Federal Public Ministry, in which the latter alleges that Rumo would not be transporting cargo in the Presidente Prudente region and, as a result of this, requested the execution of a daily fine, as well as an increase in the value of the fine. Rumo, in turn, filed a declaratory action to give the correct interpretation to the TAC, since its commitment was to try to obtain cargo in sufficient volume to carry out transportation. Periodically, the Company holds seminars in the region, but so far it has not been able to attract anyone interested in providing services. The demands are in the first instance, awaiting a court decision. There was a request to suspend the demand to attempt an agreement and, in parallel, Malha Sul, União and ANTT signed an agreement with a view to be adapting the criteria used to determine the value for return of the section. The total contingency of the case is R$130,239, with 50% of the amounts provisioned and the remainder classified as possible. | |
| (iv) | In November 2021, CADE, in the judgment of the administrative proceeding initiated based on the representation of a former client, among other points, condemned the subsidiary Rumo to pay a fine in the updated amount of R$339,811, a decision that was maintained in the judgment of the declaration embargoes. The establishment of such a value contradicts CADE's own precedents, whether in relation to the calculation basis or in relation to the rate used, which is why the Company filed an action to annul such decision, which is currently under appeal. Based on the technical analysis of its external legal team, Rumo assesses the risk of losing a portion in the amount of R$31,262 (for which it recorded a provision) as probable and classifies the difference as a possible contingency. | |
| (v) | The indirect subsidiary Rumo Malha Paulista is a defendant, together with the Municipality of Jales and others, in a public civil action, in which the MPF alleges a lack of level crossing structure throughout the municipalities of the Jales subsection, as well as indiscriminate use of horn. The estimated risk is R$137,210. |
Environmental:
| (vi) | The subsidiary Moove was cited last year in the Public Civil Action seeking the payment of compensation for environmental pollution that occurred in the former area of Companhia Usina de Passivos. Several ACPs were filed against different companies and the original value attributed by the Public Ministry is R$365,318. The action was dismissed in November 2023, due to the lack of final and unappealable conditions for the action, and the case was archived in February 2024. | |
| (vii) | The indirect subsidiary Rumo Malha Paulista was fined, in 2013, by IBAMA (Brazilian Institute of the Environment and Natural Resources) for alleged damage to water resources. There was a defense presentation. In September 2021, the Company requested recognition of intercurrent prescription. Analysis of the merits of the matter is awaited. The amount involved is R$221,256. | |
| (viii) | The indirect subsidiary Rumo Malha Sul was fined, in 2014, by IBAMA for alleged oil spills that did not comply with regulations. An administrative appeal was filed and a decision has been awaited at the administrative level since 2015. The amount involved is R$106,120. |
Regulatory:
| (ix) | The indirect subsidiary Rumo Malha Sul was fined, in 2014, by IBAMA for alleged oil spills that did not comply with regulations. An administrative appeal was presented and a decision has been awaited at the administrative level since 2015. The amount involved is R$176,867. | |
| (x) | The indirect subsidiary Malha Paulista is a party to a compensation action, filed by the former Rede Ferroviária Federal S/A (RFFSA), succeeded by the Union, due to the deactivation of the railway's electric traction system, the value of which claims totals R$356,284, for the which there is no provision. In February 2023, a judgment of unfoundedness was handed down. Awaiting judgment on the Union's appeal. |
Explanatory Notes to the Financial Statement
(In thousands of Reais, except when otherwise indicated)
Labor:
| Parent Company |
| Consolidated | ||||
| 12/31/2023 |
| 12/31/2022 |
| 12/31/2023 |
| 12/31/2022 |
Labor claims | 9,168 |
| 23,972 |
| 805,222 |
| 782,080 |
| 9,168 |
| 23,972 |
| 805,222 |
| 782,080 |
The indirect subsidiary Rumo Malha Paulista is currently party to a Public Civil Action that is being processed before the Labor Court. This process originated from an inspection carried out against the company MS Teixeira, which was subcontracted by Prumo Engenharia Ltda. (“Prumo Engenharia”) which, in turn, was hired by Rumo. The inspection alleged that MS Teixeira workers worked in degrading conditions like slavery. Prumo Engenharia assumed full responsibility for the condition of these employees, including labor and contractual responsibilities, as well as all losses arising from the alleged working conditions established by its subcontractors. Prumo Engenharia terminated the employment contracts of these workers, which were approved by the then Ministry of Labor and Employment, highlighting that there was no participation by Rumo in these acts. Furthermore, a criminal investigation was launched against Rumo, which was archived. Notwithstanding the above, the Public Ministry of Labor still filed a public civil action (ACP) against Malha Paulista, without the inclusion of Prumo in the dispute, requesting the payment of compensation for collective moral damages in the amount of R$100,000 (among other commitments), judged partially valid, condemning the subsidiary to obligations to do and not to do, as well as collective moral damages of R$15,000. Rumo entered into an agreement with the Public Ministry of Labor, in which it assumed the fulfillment of various obligations linked to working conditions, as well as paying compensation in the amount of R$20,000, allocated to various social entities. The agreement was judicially approved by the Superior Labor Court. After approval, the Attorney General's Office filed an appeal questioning, solely and solely, the allocation of the compensation, since, in the view of the Attorney General's Office, the compensation should be allocated to the FAT. The Union's appeal was not known. Final and unappealable approval of the agreement on 11/08/23. Process sent to origin.
a) Share capital
Accounting policy: Equity is reduced by the incremental costs directly attributable to the issuance of common shares. In accordance with the policy outlined in Note 15 - Income tax and social contribution, transaction costs related to income tax are accounted for in accordance with Note 15 - Income tax and social contribution. Transactions involving group shareholders are allocated within Equity Transactions, such as share-based payments and changes in interests in subsidiaries. |
The subscribed capital as at December 31, 2023, is R$8,682,544 (R$8,402,544 as at December 31, 2022), fully paid in, represented by 1,874,070,932 registered, book-entry common shares with no par value. According to the statute, the authorized share capital can be increased up to the limit of R$9,000,000.
On April 27, 2023, the Extraordinary General Meeting approved the increase in the Company's share capital, in the amount of R$280,000, distribution of dividends of R$628,979, allocations of the legal reserve of R$58,802 and statutory reserve in the amount of R$488,252.
As of December 31, 2023, the Company's share capital consists of the following:
|
| Ordinary actions | ||
Shareholding structure |
| Amount |
| % |
Controlling shareholders |
| 672,312,942 |
| 35.87% |
Administrators |
| 25,745,154 |
| 1.37% |
Free float |
| 1,169,498,325 |
| 62.41% |
Outstanding shares |
| 1,867,556,421 |
| 99.65% |
Treasury stock |
| 6,514,511 |
| 0.35% |
Total |
| 1,874,070,932 |
| 100.00% |
Explanatory Notes to the Financial Statement
(In thousands of Reais, except when otherwise indicated)
b) Treasury shares
Accounting policy Treasury shares consists of shares that have been repurchased by the company for specific and limited purposes. Cosan holds the necessary number of shares for future employee share-based payment plans, and the volume is treated similarly to treasury shares for accounting purposes. |
On August 14, 2023, the Company's Board of Directors approved the new Share Buyback Program of up to 116,000,000 common shares, representing 9.93% of the total shares available on the market, with a term of up to 18 months. The repurchased shares may be used to meet obligations arising from potential exercises of share-based compensation plans, holding in treasury, disposal or cancellations in accordance with applicable legislation.
As at December 31, 2023, the Company had 6,514,511 shares in treasury (7,432,832 shares as at December 31, 2022), whose market price was R$19.36.
c) Statutory reserve - special reserve
Accounting policy: Its purpose is to strengthen working capital and finance the maintenance, expansion, and development of the company's core activities. |
d) Legal reserve
Accounting policy: In accordance with Law 6,404, it is created by appropriating 5% of net income for the year up to a maximum of 20% of capital. |
e) Dividends
Accounting policy: In accordance with corporate law, a mandatory minimum dividend equal to 25% of the company's annual net profit is allocated, adjusted for changes in the reserves. The next Ordinary General Meeting will discuss dividends, allocation of net income for the year, and excess of profit reserves, as determined by article 199 of the Corporate Law. |
Explanatory Notes to the Financial Statement
(In thousands of Reais, except when otherwise indicated)
- Receivable
Parent Company |
| Investments in associates (i) |
| Investments in joint venture |
| Total |
On January 1, 2022 |
| 22,747 |
| 517,344 |
| 540,091 |
Declared Dividends |
| 2,340,514 |
| 549,883 |
| 2,890,397 |
Proposed interest on equity capital |
| 95,846 |
| 107,544 |
| 203,390 |
Dividends received |
| (1,849,651) |
| (1,174,771) |
| (3,024,422) |
On December 31, 2022 |
| 609,456 |
| — |
| 609,456 |
Declared Dividends |
| 348,493 |
| 571,033 |
| 919,526 |
Other movements |
| (3,567) |
| — |
| (3,567) |
Dividends received |
| (855,188) |
| (351,092) |
| (1,206,280) |
On December 31, 2023 |
| 99,194 |
| 219,941 |
| 319,135 |
(i) See composition of the balance in note 9.1.a.
Consolidated |
| Investments in associates (ii) |
| Investments in joint venture |
| Total |
On January 1, 2022 |
| 2,621 |
| 517,344 |
| 519,965 |
Declared Dividends |
| 278,654 |
| 549,883 |
| 828,537 |
Interest on own capital |
| — |
| 107,544 |
| 107,544 |
Other movements |
| 202,968 |
| — |
| 202,968 |
Discontinued operation |
| (44,969) |
| — |
| (44,969) |
Dividends received |
| (278,127) |
| (1,174,771) |
| (1,452,898) |
On December 31, 2022 |
| 161,147 |
| — |
| 161,147 |
Declared Dividends |
| 273,346 |
| 626,653 |
| 899,999 |
Proposed interest on own capital |
| — |
| 588,078 |
| 588,078 |
Income tax |
| — |
| (88,256) |
| (88,256) |
Discontinued operation |
| (62,699) |
| — |
| (62,699) |
Other movements |
| (81,053) |
| — |
| (81,053) |
Dividends received |
| (254,905) |
| (906,534) |
| (1,161,439) |
On December 31, 2023 |
| 35,836 |
| 219,941 |
| 255,777 |
(ii) See composition of the balance in note 9.1.b
Explanatory Notes to the Financial Statement
(In thousands of Reais, except when otherwise indicated)
ii. Payable
|
| Parent Company |
|
|
| 12/31/2023 |
|
Net income for the year |
| 1,094,391 |
|
Calculation basis for dividend distribution |
| 1,094,391 |
|
Minimum mandatory dividends - 25% |
| (273,598) |
|
Statutory Reserve |
| 820,793 |
|
Movement of dividends payable
|
| Parent Company |
| Consolidated |
On January 1, 2022 |
| 754,282 |
| 799,634 |
Dividends for the year |
| 279,308 |
| 2,000,543 |
Dividends complementary to the previous year |
| 45,736 |
| — |
Dividends paid |
| (799,347) |
| (1,908,171) |
On December 31, 2022 |
| 279,979 |
| 892,006 |
Declared dividends (i) |
| 794,289 |
| 2,239,495 |
Dividends paid |
| (798,203) |
| (2,582,447) |
On December 31, 2023 |
| 276,065 |
| 549,054 |
| (i) | The value of the dividend per share in the year ended December 31, 2023, was R$ 1.27 real. (R$ 0.66 cents as at December 31, 2022). |
Explanatory Notes to the Financial Statement
(In thousands of Reais, except when otherwise indicated)
f) Other comprehensive income
|
| 12/31/2022 |
| Comprehensive (loss) income |
| 12/31/2023 |
Cash flow hedge result |
| (1,361,895) |
| (125,233) |
| (1,487,128) |
Exchange rate differences on conversion of operations abroad |
| 2,010,914 |
| (172,501) |
| 1,838,413 |
Actuarial losses of defined benefit plan |
| (219,663) |
| (71,550) |
| (291,213) |
Deferred tax on actuarial losses of defined benefit plan |
| 74,685 |
| 24,327 |
| 99,012 |
Loss on measurement of derivative financial instrument |
| (45,631) |
| — |
| (45,631) |
Change in the fair value of a financial asset |
| 77,152 |
| — |
| 77,152 |
Deferred income tax on financial asset |
| (26,232) |
| — |
| (26,232) |
Total |
| 509,330 |
| (344,957) |
| 164,373 |
|
|
|
|
|
|
|
Attributable to: |
|
|
|
|
|
|
Controlling shareholders |
| 567,546 |
| (253,221) |
| 314,325 |
Non-controlling shareholders |
| (58,216) |
| (91,736) |
| (149,952) |
|
| 12/31/2021 |
| Comprehensive (loss) income |
| 12/31/2022 |
Cash flow hedge result |
| (1,362,618) |
| 723 |
| (1,361,895) |
Exchange rate differences on conversion of operations abroad |
| 1,093,366 |
| 917,548 |
| 2,010,914 |
Actuarial losses of defined benefit plan |
| (299,993) |
| 80,330 |
| (219,663) |
Deferred tax on actuarial losses of defined benefit plan |
| 101,997 |
| (27,312) |
| 74,685 |
Loss on measurement of derivative financial instrument |
| (45,631) |
| — |
| (45,631) |
Change in the fair value of a financial asset |
| 43,220 |
| 33,932 |
| 77,152 |
Deferred income tax on financial asset |
| (14,695) |
| (11,537) |
| (26,232) |
Total |
| (484,354) |
| 993,684 |
| 509,330 |
|
|
|
|
|
|
|
Attributable to: |
|
|
|
|
|
|
Owners of the Company |
| (521,609) |
| 1,089,155 |
| 567,546 |
Non-controlling interests |
| 37,255 |
| (95,471) |
| (58,216) |
Explanatory Notes to the Financial Statement
(In thousands of Reais, except when otherwise indicated)
Accounting policy: a)Basic earnings per share Basic earnings per share is calculated by dividing:
b)Diluted earnings per share Diluted earnings per share adjusts the values used in determining basic earnings per share to account for:
|
Basic earnings per share is calculated by dividing net income by the weighted average number of common shares outstanding during the period. Earnings per share after potentially dilutive instruments is computed by adjusting earnings and the number of shares for the impact of potentially dilutive instruments.
The following table presents the calculation of earnings per share (in thousands of reais, except for amounts per share):
Basic and diluted - Continued operation |
|
|
|
| 12/31/2023 |
| 12/31/2022 |
Net income attributable to holders of common shares of Company used in calculating basic earnings per share | 1,078,737 |
| 1,158,852 |
Diluting effect of the share-based plan of subsidiaries | (814) |
| (1,739) |
Net income attributable to holders of common shares of Company used in the calculation of diluted earnings per share | 1,077,923 |
| 1,157,113 |
|
|
|
|
Weighted average number of common shares outstanding - basic (in thousands of shares) |
|
|
|
Basic | 1,867,005 |
| 1,869,077 |
Dilutive effect of the share-based plan | 7,341 |
| 5,503 |
Diluted | 1,874,346 |
| 1,874,580 |
|
|
|
|
Earnings per share |
|
|
|
Basic | R$0.5778 |
| R$0.6200 |
Diluted | R$0.5751 |
| R$0.6173 |
Explanatory Notes to the Financial Statement
(In thousands of Reais, except when otherwise indicated)
Basic and diluted - Discontinued operation |
|
|
|
| 12/31/2023 |
| 12/31/2022 |
Net income attributable to holders of common shares of Company used in calculating basic earnings per share | 15,654 |
| 17,180 |
|
|
|
|
Weighted average number of common shares outstanding - basic (in thousands of shares) |
|
|
|
Basic | 1,867,005 |
| 1,869,077 |
Dilutive effect of the share-based plan | 7,341 |
| 5,503 |
Diluted | 1,874,346 |
| 1,874,580 |
|
|
|
|
Earnings per share |
|
|
|
Basic | R$0.0084 |
| R$0.0092 |
Diluted | R$0.0084 |
| R$0.0092 |
Diluting instruments
The Company and its subsidiaries have two categories of possible dilutive effects: stock grants and put options. For stock grants, a calculation is performed to determine the impact of dilution on the profit attributable to the Parent Company's shareholders as a result of the exercise of stock grants in subsidiaries. It is assumed that the put option was converted into common stock, and the profit attributable to the Parent Company's shareholders is adjusted accordingly.
Anti-dilution instruments
In the year ended December 31, 2023, 12,269,677 (61,540,876 as at December 31, 2022) shares related to the Company's stock option plan were considered in the earnings per share analysis, but did not affect calculations, as they increase earnings per share.
Explanatory Notes to the Financial Statement
(In thousands of Reais, except when otherwise indicated)
Accounting policy: The Company presents gross revenue from sales and services, sales deductions, rebates and taxes, as required for Brazilian companies in accordance with law no. 6,404/76, section V, Art. 187. The main sources of revenue are:
The Company records sales revenue upon customer delivery. Delivery is regarded as occurring when the customer accepts the goods and ownership risks and benefits are transferred. This is the point at which revenue is recognized if revenue and costs can be reliably measured, receipt of consideration is probable, and there is no ongoing management involvement with the products. The subsidiary Moove is responsible for the production and distribution of lubricants, including Mobil and Comma brands. Products are sold under identified contracts with individual or multiple customers, as a bundle of goods or services. Some lubricant sales contracts are not available for purchase outside of a service package. However, contracts clearly distinguish between goods and services. This type of sale represents two separate performance obligations; consequently, revenue will be recognized for each performance obligation upon transfer of control of the respective goods and services to the customer. On the basis of the standalone sale price, the transaction price is allocated to various performance obligations in which revenues are separately identified, measured, and recorded. Trade incentives, such as cash incentives, volume discounts and rebates, and free or discounted goods and services, are recorded as a revenue reduction. ii. Billed revenue Through distributors controlled directly and indirectly by Compass Gás e Energia, the Company provides natural gas distribution services in areas where it has concession rights. In general, the fair value and selling price of individual services are comparable. Gas distribution revenue is recognized when its amount can be reliably measured, with income recognized in the same period that volumes are delivered to customers on the basis of monthly measurements. iii. Unbilled revenue Unbilled gas revenue refers to the amount of gas delivered that has not yet been metered and billed to customers. This estimate is based on the period between the last measurement date and the last day of the month. Actual volume billed may vary from estimates. The Company believes, based on past experience with similar operations, that the estimated amount of unbilled services will not differ significantly from the actual amount. iv. Concession construction revenue The construction of the necessary infrastructure for gas distribution is regarded as a construction service provided to the Granting Authority, and revenue is recognized over time using the incurred cost method. The costs are deducted from income when they are incurred. Advances received are accounted for as contractual liabilities. v. Provided services As services are performed, revenue is recorded over time. The stage of completion for determining the amount of revenue to be recognized is determined based on work-in-progress evaluations. If the performance of services under a single contract spans multiple time periods, consideration is allocated based on their individual selling prices. Individual sales prices are based on the list prices at which the Cosan Group sells its services in separate transactions. |
Explanatory Notes to the Financial Statement
(In thousands of Reais, except when otherwise indicated)
vi. Energy trading Through the delivery of electricity in a given period, the Company recognizes revenue from the sale of electricity at the fair value of the consideration. The measurement of the amount of energy delivered to the purchaser occurs monthly. As soon as they consume electricity, customers gain control over it. Monthly invoices are typically paid within 30 days of issuance. Energy trading revenue is recorded based on bilateral contracts signed with market agents and duly registered with the Electric Energy Trading Chamber (Câmara de Comercialização de Energia Elétrica – “CCEE”). Revenue is recognized based on the energy sold and the prices specified in the terms of the supply and supply agreements. The subsidiary Compass Comercialização will be able to sell the generated energy in two environments: (i) in the Free Contracting Environment (Ambiente de Contratação Livre – ACL), where the commercialization of electric energy takes place through the free negotiation of prices and conditions between the parties, via bilateral contracts; and (ii) in the Regulated Contracting Environment (Ambiente de Contratação Regulada – ACR), where electricity is sold to distribution agents.
When transactions on the short-term market occur, the Company records revenue at the fair value of the consideration to be received. The energy cost for these operations is tied to the Differences Settlement Price (Preço de Liquidação de Diferenças – PLD). b. Energy trading operations Energy trading transactions occur on an active market and, for accounting measurement purposes, satisfy the definition of fair-value financial instruments. The Company records revenue at the fair value of the consideration upon delivery of energy to the customer. In addition, unrealized net gains resulting from mark-to-market, which is the difference between contracted and market prices, are recognized as income for outstanding contracted net operations as of the date of the financial statements. vii. Logistics services provided Income from services rendered is recognized when the subsidiary transfers to the counterparty the significant risks and benefits inherent in the provision of services, when it is probable that the economic benefits associated with the transaction will flow to the subsidiary, and when the related amount and costs can be reliably measured. According to service orders or contracts, prices for services are fixed. Revenue consists primarily of rail freight, road freight, container transport, and port lifting services; consequently, the aforementioned criteria are typically met to the extent that the logistics service is offered. viii. Lease income Rental income is recognized on a straight-line basis over the term of each contract since the contracts transfer to customers the right to use the assets for a period in exchange for payments that can be reliably measured. ix. Sale of investment properties Income consists of the fair value of the consideration received or receivable for the sale of investment properties in the ordinary course of the subsidiaries' operations. The revenues are presented net of taxes, returns, rebates, and discounts, and in the consolidated financial statements, sales within the subsidiary are eliminated. Revenue is recorded when the subsidiary satisfies all obligations and promises outlined in the contract for the transfer of goods to the customer. |
Explanatory Notes to the Financial Statement
(In thousands of Reais, except when otherwise indicated)
| Consolidated | ||
| 12/31/2023 |
| 12/31/2022 (Restated) |
Gross revenue from the sale of products and services | 45,298,287 |
| 45,977,407 |
Construction revenue | 1,494,142 |
| 1,217,818 |
Indirect taxes and other deductions | (7,323,932) |
| (7,872,439) |
Net sales | 39,468,497 |
| 39,322,786 |
In the following table, revenue is disaggregated by products and service lines and timing of revenue recognition:
| Consolidated | ||
| 12/31/2023 |
| 12/31/2022 (Restated) |
At a point in time |
|
|
|
Natural gas distribution | 15,737,450 |
| 17,854,412 |
Lubricants and base oil | 8,252,782 |
| 8,690,659 |
Lease and sale of property | 743,411 |
| 834,616 |
Electricity trading | — |
| 238,544 |
Other | 538,445 |
| 418,847 |
| 25,272,088 |
| 28,037,078 |
Over time |
|
|
|
Railroad transportation services | 10,379,017 |
| 9,503,965 |
Construction revenue | 1,494,141 |
| 1,217,818 |
Container operations | 558,699 |
| 337,543 |
Other services | 1,825,844 |
| 289,418 |
| 14,257,701 |
| 11,348,744 |
Eliminations | (61,292) |
| (63,036) |
Total net sales | 39,468,497 |
| 39,322,786 |
Explanatory Notes to the Financial Statement
(In thousands of Reais, except when otherwise indicated)
Accounting policy:
The Company and its subsidiaries account for natural gas distribution concession contracts using the intangible asset model in accordance with ICPC 01/IFRIC 12 and CPC 04/IAS 38 and classify the amortization of the concession contract as cost of sales. |
The costs and expenses are presented in the statement of profit and loss by function. The reconciliation of costs and expenses by nature/purpose is as follows:
| Parent Company |
| Consolidated | ||||
| 12/31/2023 |
| 12/31/2022 |
| 12/31/2023 |
| 12/31/2022 |
Raw material and material for use in the provision of services | — |
| — |
| (7,291,453) |
| (6,588,465) |
Gas and transportation cost | — |
| — |
| (11,919,415) |
| (13,892,505) |
Electricity purchased for resale | — |
| — |
| — |
| (260,891) |
Railroad transport and port elevation expenses | — |
| — |
| (2,696,333) |
| (3,074,624) |
Other transport | — |
| — |
| (523,747) |
| (137,255) |
Depreciation and amortization | (14,401) |
| (13,936) |
| (3,364,943) |
| (3,014,480) |
Personnel expenses | (317,936) |
| (180,929) |
| (2,893,919) |
| (2,498,912) |
Construction cost | — |
| — |
| (1,494,141) |
| (1,217,818) |
Expenses with third-party services | (46,816) |
| (28,260) |
| (952,294) |
| (888,195) |
Business expenses | (29) |
| — |
| (37,451) |
| (23,505) |
Cost of properties sold (Note 10.5) | — |
| — |
| (153,470) |
| (550,432) |
Other expenses | (58,208) |
| (77,137) |
| (1,101,274) |
| (1,444,083) |
| (437,390) |
| (300,262) |
| (32,428,440) |
| (33,591,165) |
|
|
|
|
|
|
|
|
Cost of goods sold and services rendered | — |
| — |
| (28,549,896) |
| (30,556,819) |
Selling expenses | — |
| — |
| (1,350,570) |
| (1,276,279) |
General and administrative expenses | (437,390) |
| (300,262) |
| (2,527,974) |
| (1,758,067) |
| (437,390) |
| (300,262) |
| (32,428,440) |
| (33,591,165) |
| Parent Company |
| Consolidated | ||||
| 12/31/2023 |
| 12/31/2022 |
| 12/31/2023 |
| 12/31/2022 |
Gain from bargain purchase | — |
| 99,341 |
| — |
| 99,341 |
Result on the sale of investments | — |
| 54,707 |
| — |
| 988,077 |
Extemporaneous tax credits | — |
| — |
| 43,835 |
| 114,812 |
Change in fair value of investment properties – Note 11.5 | — |
| — |
| 2,259,924 |
| 1,311,691 |
Loss on disposals of non-current assets and intangible assets (i) | 13,563 |
| (2,323) |
| (17,016) |
| (13,035) |
Net effect of provisions for legal proceedings and tax installments | (86,619) |
| (41,463) |
| (204,158) |
| (370,765) |
Settlement of disputes in the renewal process and grant review | — |
| — |
| — |
| (90,022) |
Result in the termination of the legal agreement | — |
| — |
| — |
| (396,818) |
Dividends received from Vale S.A – Note 1.1 (f) | — |
| — |
| 1,339,340 |
| — |
Realization of deferred revenue – Note 2 | — |
| — |
| 923,214 |
| — |
Other income | 66,850 |
| — |
| 160,604 |
| — |
Other | (63,050) |
| 27,135 |
| (581,366) |
| 108,941 |
| (69,256) |
| 137,397 |
| 3,924,377 |
| 1,752,222 |
(i) | Includes the gain relating to the sale of SINLOG TECNOLOGIA EM LOGÍSTICA S.A in the amount of R$14,884, see note 2.1. |
Explanatory Notes to the Financial Statement
(In thousands of Reais, except when otherwise indicated)
Accounting policy:
Financial income consists of interest income on invested funds, dividends, gains in the fair value of financial assets measured at fair value through profit or loss, gains on remeasurement of any pre-existing interest in an acquisition in a business combination, gains on hedging instruments recognized in the results, and reclassifications of net gains previously recognized in other comprehensive income. Using the effective interest rate method, interest income is recorded as it is recognized in the results. Dividend income is recognized in the results on the date that the Company's right to receive payment is established, which is typically the ex-dividend date for listed securities.
Financial expenses consist of interest expenses on borrowings, settlement of discount provisions and deferrals, losses on the disposal of available-for-sale financial assets, dividends on preferred shares categorized as liabilities, losses on the fair value of financial assets at fair value through profit or loss contingent consideration and loss, impairment losses recognized in financial assets (other than accounts receivable), losses on hedging instruments that are recognized in income (loss) and reclassifications of net losses previously recognized in other comprehensive income.
The effective interest rate method is used to account for borrowing costs that are not directly attributable to the acquisition, construction, or production of an eligible asset.
Foreign exchange gains and losses on financial assets and liabilities are reported net as financial income or financial expense, based on whether net foreign currency fluctuations result in a gain or loss. |
Explanatory Notes to the Financial Statement
(In thousands of Reais, except when otherwise indicated)
The details of financial income and expenses are as follows:
| Parent Company |
| Consolidated | |||||||
|
| 12/31/2023 |
| 12/31/2022 |
|
| 12/31/2023 |
| 12/31/2022 |
Gross debt cost |
|
|
|
|
|
|
|
|
|
Interest and monetary variation (i) |
| (969,613) |
| (954,320) |
|
| (4,267,829) |
| (4,464,754) |
Net foreign exchange variation on debts (i) |
| 60,798 |
| 135,445 |
|
| 1,921,632 |
| 549,682 |
Financial result with derivatives and fair value (ii)|(iii) |
| (1,253,705) |
| (2,000,888) |
|
| (2,684,111) |
| (4,203,149) |
Amortization of borrowing costs |
| (9,529) |
| (78,112) |
|
| (64,588) |
| (244,344) |
Guarantees and warranties |
| — |
| — |
|
| (38,773) |
| (41,505) |
|
| (2,172,049) |
| (2,897,875) |
|
| (5,133,669) |
| (8,404,070) |
Income from financial investments and exchange rate variation in cash and cash equivalents |
| 222,839 |
| 191,315 |
|
| 2,057,369 |
| 1,788,477 |
Changes in fair value of investments in listed entities (iv) |
| — |
| — |
|
| (3,147,031) |
| 3,385,047 |
|
| 222,839 |
| 191,315 |
|
| (1,089,662) |
| 5,173,524 |
Cost of debt, net |
| (1,949,210) |
| (2,706,560) |
|
| (6,223,331) |
| (3,230,546) |
|
|
|
|
|
|
|
|
|
|
Other charges and monetary variations |
|
|
|
|
|
|
|
|
|
Interest on other receivables |
| 45,285 |
| 37,210 |
|
| 450,478 |
| 355,634 |
Update of other financial assets |
| 1,777 |
| (1,405) |
|
| 1,777 |
| (1,405) |
Monetary variation on leases and concessions agreements |
| — |
| — |
|
| (514,236) |
| (417,703) |
Interest on leases |
| (3,574) |
| (3,858) |
|
| (444,850) |
| (374,177) |
Interest on equity capital |
| 481,753 |
| 33,134 |
|
| (46,212) |
| 33,134 |
Interest on contingencies and contracts |
| (217,481) |
| (138,513) |
|
| (781,087) |
| (593,144) |
Interest on sectoral assets and liabilities |
| — |
| — |
|
| (97,845) |
| (36,670) |
Bank charges and other |
| (36,319) |
| (151,214) |
|
| (107,747) |
| (145,200) |
Foreign exchange and non-debt derivatives |
| 186,321 |
| (411,237) |
|
| (133,974) |
| (747,859) |
|
| 457,762 |
| (635,883) |
|
| (1,673,696) |
| (1,927,390) |
Financial result, net |
| (1,491,448) |
| (3,342,443) |
|
| (7,897,027) |
| (5,157,936) |
|
|
|
|
|
|
|
|
|
|
Reconciliation |
|
|
|
|
|
|
|
|
|
Financial expenses |
| (1,934,520) |
| (1,970,687) |
|
| (11,337,430) |
| (4,706,535) |
Financial income |
| 829,235 |
| 277,734 |
|
| 3,028,134 |
| 5,777,521 |
Exchange variation |
| 712,582 |
| 649,899 |
|
| 1,777,438 |
| 260,746 |
Net effect of derivatives |
| (1,098,745) |
| (2,299,389) |
|
| (1,365,169) |
| (6,489,668) |
Financial result, net |
| (1,491,448) |
| (3,342,443) |
|
| (7,897,027) |
| (5,157,936) |
|
|
|
|
|
|
|
|
|
|
| (i) | At December 31, 2023, the amount of interest for monetary variation and exchange variation of debts linked to the purchase of assets from Vale was R$ 599,515. |
| (ii) | At December 31, 2023, the cost of banking operations with derivatives was R$ 554,998. |
| (iii) | At December 31, 2023, the result with derivatives and fair value of the securities linked to the protection of the investment in Vale shares was R$ 880,795. |
| (iv) | The gross balance of the financial investment’s accrual in listed entities without effects of PIS and COFINS in the nine months ended December 31, 2023, is R$ 3,312,112. |
Explanatory Notes to the Financial Statement
(In thousands of Reais, except when otherwise indicated)
Accounting policy Using actuarial valuations, the cost of defined benefit pension plans and other post-employment benefits, as well as the present value of the retirement obligation, are determined. A valuation based on actuarial principles is based on a number of assumptions that may differ from actual results in the future. These include determining the discount rate, salary increases in the future, death rates, and future pension increases. The sensitivity of a defined benefit obligation to changes in these assumptions is high. Management reviews all assumptions at each balance sheet date.
A defined contribution plan is a post-employment benefit plan in which the Company pays fixed contributions to a separate entity and has no legal or constructive obligation to pay additional amounts. Obligations for contributions to defined contribution plans are recorded as an employee benefit expense in the financial results during the periods in which the related services are rendered by employees. Contributions to a defined contribution plan that are due more than 12 months after the end of the service period are discounted to their present value. The Company sponsors a defined contribution private pension plan named Plano de Aposentadoria FuturaFlex (for the employees of Compass, Comgás and Commit), managed by FuturaMais – Complementary Pension Fund Entity (Entidade de Previdência Complementar) (formerly named RaizPrev – Private Pension Fund Entity (Entidade de Previdência Privada), which merged Futura II –Entidade de Previdência Complementar). The Entity has administrative, asset and financial autonomy, and has as object the management and execution of social security benefit plans, as defined in the Regulation of Benefit Pension Plans. ii. Variable contribution A variable contribution plan is also known as a mixed plan that brings together aspects of the BD – defined benefit and the DC – defined contribution. The other companies of the Group sponsor a supplementary pension plan structured in the Variable Contribution modality, called the Future Retirement Plan II, also managed by FuturaMais – Complementary Pension Fund Entity (formerly called RaizPrev – Private Pension Entity, which incorporated Futura II – Complementary Pension Entity). It brings together the characteristics of the Defined Contribution for scheduled benefits (normal and early retirement) and the Defined Benefit for risk benefits (sickness benefit, disability, savings and death pension). iii. Defined benefit The defined benefit plan is a plan in which the participants have the due benefit established by means of regulatory provisions. The cost is determined through actuarial evaluations, which are conducted at least annually based on assumptions. The Pension Plan, managed by Futura – Entidade de Previdência Complementar, is sponsored by Cosan Lubrificantes e Especialidades S.A., and is closed since 2011. According to the regulation, which leads the Company to adopt such a provision in the present value of benefits and that assisted participants receive annuity according to the plan. The main actuarial risks are: a) life expectancy longer than specified in the mortality table; b) the return on equity under the actuarial discount rate plus the accrued IGP-DI; and c) real family structure of different hypotheses of established retirement. iv. Health insurance The Comgás subsidiary provides a post-employment health care benefit to retired employees and their dependents who retired until May 31, 2000. After that date, only employees with 20 years of contribution to the INSS and 15 years of uninterrupted work at the Company as of May 31, 2000 are eligible for this defined benefit plan, provided they are still employed by the Company on the date the retirement is granted. Independent actuaries calculate annually the liability reported in the balance sheet in relation to the defined benefit post-employment plan. The amount recognized in the balance sheet in respect of post-employment benefit plan liabilities represents the present value of the obligations less the fair value of the assets, including actuarial gains and losses. Remeasurements of the net obligation, which include: actuarial gains and losses, return on plan assets (excluding interest) and the effect of the asset ceiling (if any, excluding interest), are recognized immediately in other comprehensive income. Net interest and other expenses related to the defined benefit plan are recognized in the result. Actuarial gains and losses resulting from adjustments based on experience and changes in actuarial assumptions are recorded as other comprehensive income directly in shareholder’s equity when they occur. |
Explanatory Notes to the Financial Statement
(In thousands of Reais, except when otherwise indicated)
| Consolidated | ||
| 12/31/2023 |
| 12/31/2022 |
Defined contribution |
|
|
|
Futura II | 333 |
| 332 |
Defined benefit |
|
|
|
Futura | 175,150 |
| 127,351 |
Health Insurance | 442,164 |
| 448,157 |
| 617,314 |
| 575,508 |
| 617,647 |
| 575,840 |
| a) | Defined contribution |
| During the year ended December 31, 2023, the amount of employee contributions was R$103 (R$303 as at December 31, 2022). | |
| b) | Defined benefit |
| Futura: The subsidiary CLE sponsors Futura - Entidade de Previdência Complementar ("Futura"), formerly known as Previd Exxon - Entidade de Previdência Complementar, whose primary objective is to provide supplemental benefits within certain limits established by the Retirement Plan regulations. On 5 May 2011, the competent authorities authorized a modification to this plan to exclude new participants. The contributions totaled R$13,199 for the year ending December 31, 2023 (R$60,827 for the year ended on December 31, 2022). The obligation's weighted average duration is 8.9 years (8.7 years as of December 31, 2022). | |
| c) | Health insurance |
| Comgás: Obligations related to post-employment benefit plans, which include medical assistance and retirement incentives, sick pay and disability pension. | |
| The defined benefit pension plan is governed by Brazilian labor laws, which mandate that final salary payments during retirement be adjusted for the consumer price index at the time of payment. The level of benefits provided is dependent on the member's length of service and final salary. During the year ended December 31, 2023, the contributions amounted to R$27,088 (R$27,118 for the year ended December 31, 2022). The weighted average duration of the obligation is 10,9 years (10.6 years in 2022). |
Explanatory Notes to the Financial Statement
(In thousands of Reais, except when otherwise indicated)
Details of the present value of the defined benefit obligation and the fair value of plan assets are as follows:
| 12/31/2023 |
| 12/31/2022 |
Actuarial obligation at beginning of the year | 1,097,982 |
| 1,161,693 |
Current service cost | 157 |
| 219 |
Cost of past services | — |
| 319 |
Interest on actuarial obligation | 107,057 |
| 98,343 |
Early settlement in the plan | — |
| (3,081) |
Actuarial (gain) loss arising from financial assumptions | 62,807 |
| (88,709) |
Actuarial loss (gain) arising from experience adjustment | (62,889) |
| 14,319 |
Actuarial gains arising from demographic assumptions | 22,116 |
|
|
Benefit payments | (85,389) |
| (85,121) |
Actuarial obligation at the end of the year | 1,141,841 |
| 1,097,982 |
|
|
|
|
Fair value of plan assets at the beginning of the year | (521,568) |
| (492,408) |
Interest income | (49,720) |
| (42,224) |
Return on assets higher than the discount rate | 2,443 |
| 11,405 |
Early settlement in the plan | — |
| 3,698 |
Employer contributions | (40,287) |
| (87,945) |
Benefit payments | 85,389 |
| 85,000 |
Fair value of plan assets at the end of the year | (523,743) |
| (522,474) |
Net defined benefit liability | 618,098 |
| 575,508 |
The total expense recognized in the financial results is as follows:
| 12/31/2023 |
| 12/31/2022 |
Current service cost | (157) |
| (219) |
Interest on actuarial obligation | (57,337) |
| (56,119) |
| (57,494) |
| (56,338) |
Total amount recognized as accumulated other comprehensive income:
| 12/31/2023 |
| 12/31/2022 |
Accumulated at the beginning of the year | 204,788 |
| 141,803 |
Actuarial gain (loss) arising from financial assumptions | (62,807) |
| 88,709 |
Actuarial (loss) gain arising from experience adjustment | 62,889 |
| (14,319) |
Actuarial loss arising from demographic assumptions | (22,116) |
| — |
Return on assets higher than the discount rate | (2,443) |
| (11,405) |
Accumulated at the end of the year | 180,311 |
| 204,788 |
Explanatory Notes to the Financial Statement
(In thousands of Reais, except when otherwise indicated)
The plan's assets consist of the following:
| 12/31/2023 |
| 12/31/2022 | ||||
| Value |
| % |
| Value |
| % |
Fixed income | 523,743 |
| 100.00% |
| 496,950 |
| 95.28% |
Others | — |
| — |
| 24,618 |
| 4.72% |
| 523,743 |
| 100.00% |
| 521,568 |
| 100.00% |
Plan assets consist of financial assets quoted on active markets and are therefore classified as Levels 1 and 2 in the fair value hierarchy. The expected rate of return on plan assets is determined based on market expectations applicable to the period during which the obligation is to be settled at the time the rate is determined.
The following are the primary assumptions used to determine the Company's and its subsidiaries' benefit obligations:
| Futura |
| Health insurance | ||||
| 12/31/2023 |
| 12/31/2022 |
| 12/31/2023 |
| 12/31/2022 |
Discount rate | 9.29% |
| 10.03% |
| 10.12% per year |
| 10.45% |
Inflation rate | 3.50% |
| 3.50% |
| 4.50% per year |
| 4.25% |
Future salary increases | N/A |
| N/A |
| N/A |
| N/A |
Morbidity (aging factor) | N/A |
| N/A |
| 3.00% |
| 3.00% |
Future pension increases | 3.50% |
| 3.50% |
| 3.00% per year |
| 3.00% |
Overall mortality (segregated by sex) | N/A |
| N/A |
| AT-2000 (smoothed in 10%) |
| AT-2000 |
Disability mortality | N/A |
| N/A |
| IAPB-1957 |
| IAPB-1957 |
Entry into disability (modified) | N/A |
| N/A |
| UP-84 modified |
| UP-84 modified |
Turnover | N/A |
| N/A |
| 0.60/ (service time +1) |
| 0.60/(service time +1) |
Sensitivity analysis
Changes in the discount rate to the date of the balance sheet is one of the relevant actuarial assumptions, while other assumptions are maintained, as it impacts the defined benefit obligation as shown below:
| Discount rate | ||
| Increase 0.50% |
| Reduction (0.50)% |
Futura | 672,044 |
| 727,827 |
Health insurance | (23,123) |
| 20,998 |
There have been no changes regarding the biometric and demographic assumptions compared to previous years and the methods adopted in preparing the sensitivity analysis.
Explanatory Notes to the Financial Statement
(In thousands of Reais, except when otherwise indicated)
Accounting policy: The fair value of share-based payment benefits at the grant date is recognized, as personnel expenses, with a corresponding increase in equity, for the period in which employees unconditionally acquire the right to the benefits. The amount recognized as an expense is adjusted to reflect the number of shares for which there is an expectation that the service conditions and non-market acquisition conditions will be met, such that the amount ultimately recognized as an expense is based on the number of shares that actually meet the service conditions and non-market acquisition conditions on the date the payment rights are acquired (vesting date). For share-based payment benefits with a non-vesting condition, the grant date fair value of the share-based payment is measured to reflect such conditions and there is no modification for differences between expected and actual benefits. The fair value of the amount payable to employees in respect of share appreciation rights, which are settled in cash, is recognized as an expense with a corresponding increase in liabilities during the period in which employees unconditionally acquire the right to payment. Liabilities are remeasured at each balance sheet date and settlement date, based on the fair value of share appreciation rights. Any changes in the fair value of the liability are recognized in profit or loss as personnel expenses. |
The Company and its subsidiaries have Share-Based Compensation Plans that are payable in shares and cash. As of December 31, 2023, the Group has the following share-based payment arrangements:
Plans before 2022
| (i) | Share grant plans (settled in share), without lock-up, with delivery of shares at the end of the 5-year grace period, conditioned only on the maintenance of the employment relationship (service condition). |
| (ii) | Share grant plans (settled in share), without lock-up, with delivery of shares throughout or at the end of the grace period of 3 to 5 years, subject to i) part of the options on maintaining the employment relationship (service condition) and ii) starting from the achievement of each of the metrics that make up the performance goals (performance conditions). |
| (iii) | Share-based remuneration plan (cash-settled) where beneficiaries are allocated a certain number of units referenced to a theoretical share price calculated based on the Cosan Group's EBITDA each year. The units will be paid in cash, upon compliance with the contractual conditions of a 3 to 5 year vesting period. Payments take place at the end of each cycle (3 to 5 years after the grant date), based on the converted reference value of the share at that time. |
Explanatory Notes to the Financial Statement
(In thousands of Reais, except when otherwise indicated)
Grants made in 2023
- Share grant program (liquidated in shares)
In the year ended of December 31, 2023, the following Grant Program was established:
Program | Conditions for vesting | |
Cosan Partners 2023. | Grants January 30, 2023. The incentive program is conditioned on length of service (service condition) and performance targets (performance conditions). Of the program's total shares, 60% are related to length of service for a period of 3 years, with shares being granted annually. The remainder, equivalent to 40% of the program, are related to performance goals, requiring the achievement of specific metrics that can vary between 0% and 110% (to calculate the fair value, reaching 100% was considered). Stocks stay in lock-up for a year. Grant March 28, 2023. The incentive program is conditioned on length of service (service condition) and performance targets (performance conditions). Of the program's total shares, 49% are related to length of service for a period of 3 years, with shares being granted annually. The remainder, equivalent to 51% of the program, are related to performance goals, requiring the achievement of specific metrics that can vary between 0% and 110%. (to calculate the fair value was considered the achievement of 100%). Shares are in lock-up for one year. The total value of shares granted in the two plans is 12,472,325. | |
Cosan Invest. | Grant July 31, 2023. The incentive program is conditioned on length of service (service condition) and performance targets (performance conditions). Of the program's total shares, 41% are related to length of service for a period of 3 years, with shares being granted annually. The remainder, equivalent to 59% of the program, are related to performance goals, requiring the achievement of specific metrics that can vary between 50% and 150%. |
Explanatory Notes to the Financial Statement
(In thousands of Reais, except when otherwise indicated)
Program | Conditions for vesting | |
Investe Cosan III - Partners | Grant December 01, 2023. The incentive program in the matching model is conditioned on service time (service condition) and the investment made by the beneficiary with own resources, which must be maintained in shares during the grace period. Of the total actions of the program 50% are related to service time of 3 years and the rest, equivalent to 50% of the program, related to service time of 5 years. | |
Rumo Invest. | Grant September 1, 2023. Option programs, without lock-up, with delivery of the shares at the end of the three-year grace period, conditioned on i) part of the options to the maintenance of the employment relationship (service condition) and ii) part to the achievement of each of the metrics that make up the performance goals, and the number of performance options granted may vary between 0% and 200% depending on performance. | |
SOP Moove. | Grant July 1, 2023. The incentive program is conditioned on length of service (service condition) and linked to the occurrence of a liquidity event defined in the program (performance conditions). The options granted to participants may only be exercised after they become vested options, and the maximum period for exercising the Options will be 6 (six) years from the date of grant. The exercise price of the options covered by this Program is R$50.05 for Model A options, R$106.28 for Model B options and R$135.05 for Models C and D options (“Exercise Price”) and must be paid in cash, simultaneously with the formalization of the subscription or purchase. To measure fair value, the binomial model is used with premises such as price of the base asset, distribution of dividends (0% dividend yield), exercise price according to each Model within the program, expected average exit rate, risk-free rate, volatility and effect of lock-up linked to the exercise of options. |
Explanatory Notes to the Financial Statement
(In thousands of Reais, except when otherwise indicated)
Award Type / Award Date |
| Company |
| Life expectancy (months) |
| Grants under plans |
| Exercised / Canceled / Transferred |
| Available |
| Fair value as of grant date - R$ |
Share grant program |
|
|
|
|
|
|
|
|
|
| ||
7/31/2018 |
| Cosan S.A. |
| 60 |
| 842,408 |
| (842,408) |
| — |
| 9.65 |
7/31/2019 |
| Cosan S.A. |
| 60 |
| 229,020 |
| (41,714) |
| 187,306 |
| 13.44 |
7/31/2020 |
| Cosan S.A. |
| 60 |
| 68,972 |
| (6,704) |
| 62,268 |
| 20.93 |
7/31/2021 - Invest I |
| Cosan S.A. |
| 36 |
| 424,839 |
| (25,722) |
| 399,117 |
| 24.38 |
9/10/2021 - Invest II |
| Cosan S.A. |
| 48 |
| 5,283,275 |
| (1,981,231) |
| 3,302,044 |
| 22.24 |
10/11/2021 - Invest III |
| Cosan S.A. |
| 60 |
| 806,752 |
| — |
| 806,752 |
| 23.20 |
7/31/2022 - Invest I |
| Cosan S.A. |
| 36 |
| 846,506 |
| (11,208) |
| 835,298 |
| 18.74 |
11/22/2022 - Invests Partners |
| Cosan S.A. |
| 60 |
| 377,173 |
| — |
| 377,173 |
| 17.14 |
1/30/2023 - Invest Partners |
| Cosan S.A. |
| 36 |
| 12,472,325 |
| — |
| 12,472,325 |
| 15.26 |
7/31/2023 - Invest Cosan I - Regular |
| Cosan S.A. |
| 36 |
| 1,047,845 |
| — |
| 1,047,845 |
| 17.53 |
12/01/2023 - Invest Cosan III - Associates |
| Cosan S.A. |
| 60 |
| 546,734 |
| — |
| 546,734 |
| 17.68 |
|
|
|
|
|
| 22,945,849 |
| (2,908,987) |
| 20,036,862 |
|
|
|
|
|
|
|
|
|
|
|
|
|
|
|
7/31/2019 |
| Comgás |
| 48 |
| 83,683 |
| (83,683) |
| — |
| 79.00 |
|
|
|
|
|
|
|
|
|
|
|
|
|
7/01/2023 - Program SOP A |
| Moove |
| 72 |
| 699,276 |
| — |
| 699,276 |
| 142.62 |
7/01/2023 - Program SOP B |
| Moove |
| 72 |
| 279,710 |
| — |
| 279,710 |
| 88.32 |
7/01/2023 - Program SOP C |
| Moove |
| 72 |
| 223,768 |
| — |
| 223,768 |
| 76.54 |
7/01/2023 - Program SOP D |
| Moove |
| 72 |
| 139,855 |
| — |
| 139,855 |
| 71.45 |
|
|
|
|
|
| 1,342,609 |
| — |
| 1,342,609 |
|
|
|
|
|
|
|
|
|
|
|
|
|
|
|
8/1/2018 |
| Rumo S.A. |
| 60 |
| 1,149,544 |
| (1,149,544) |
| — |
| 13.94 |
8/15/2019 |
| Rumo S.A. |
| 60 |
| 843,152 |
| (267,977) |
| 575,175 |
| 22.17 |
11/11/2020 |
| Rumo S.A. |
| 60 |
| 776,142 |
| (249,747) |
| 526,395 |
| 20.01 |
5/5/2021 |
| Rumo S.A. |
| 60 |
| 1,481,000 |
| (977,523) |
| 503,477 |
| 20.84 |
9/15/2021 |
| Rumo S.A. |
| 36 |
| 1,560,393 |
| (191,959) |
| 1,368,434 |
| 18.19 |
9/1/2022 |
| Rumo S.A. |
| 36 |
| 1,781,640 |
| (53,959) |
| 1,727,681 |
| 20.36 |
9/1/2022 |
| Rumo S.A. |
| - |
| 146,909 |
| (146,909) |
| — |
| 20.36 |
9/1/2023 |
| Rumo S.A. |
| 36 |
| 1,724,867 |
| — |
| 1,724,867 |
| 21.86 |
|
|
|
|
|
| 9,463,647 |
| (3,037,618) |
| 6,426,029 |
|
|
Explanatory Notes to the Financial Statement
(In thousands of Reais, except when otherwise indicated)
Share-based compensation plan (settled in cash) |
|
|
|
|
|
|
|
| ||||
07/31/2019 - Invest I |
| Moove |
| 60 |
| 132,670 |
| (26,285) |
| 106,385 |
| 50.79 |
07/31/2020 - Invest II |
| Moove |
| 60 |
| 106,952 |
| (17,695) |
| 89,257 |
| 61.89 |
07/31/2021 - Invest III |
| Moove |
| 36 |
| 80,729 |
| (13,628) |
| 67,101 |
| 102.73 |
07/31/2022 - Invest IV |
| Moove |
| 36 |
| 77,967 |
| (3,779) |
| 74,188 |
| 135.05 |
07/31/2023 - Invest V |
| Moove |
| 36 |
| 82,204 |
| (233) |
| 81,971 |
| 150.98 |
8/1/2021 |
| Compass Gás e Energia |
| 24 |
| 29,492 |
| (29,492) |
| — |
| 25.46 |
8/1/2021 |
| Compass Comercialização |
| 36 |
| 35,075 |
| (6,001) |
| 29,074 |
| 25.46 |
8/1/2021 |
| Compass Gás e Energia |
| 36 |
| 170,647 |
| — |
| 170,647 |
| 25.46 |
8/1/2021 |
| Compass Gás e Energia |
| 36 |
| 37,572 |
| — |
| 37,572 |
| 25.46 |
11/1/2021 |
| Compass Gás e Energia |
| 32 |
| 192,405 |
| — |
| 192,405 |
| 25.46 |
11/1/2021 |
| Compass Gás e Energia |
| 32 |
| 1,646,411 |
| (17,873) |
| 1,628,538 |
| 25.46 |
2/1/2022 |
| Compass Gás e Energia |
| 29 |
| 90,087 |
| — |
| 90,087 |
| 25.59 |
8/1/2022 |
| Compass Gás e Energia |
| 36 |
| 837,439 |
| — |
| 837,439 |
| 25.59 |
8/1/2022 |
| Compass |
| 36 |
| 30,651 |
| (6,460) |
| 24,191 |
| 25.59 |
8/1/2022 |
| TRSP |
| 36 |
| 31,675 |
| — |
| 31,675 |
| 25.59 |
8/1/2023 |
| Compass Gás e Energia |
| 36 |
| 242,802 |
| — |
| 242,802 |
| 34.12 |
8/1/2023 |
| Compass |
| 36 |
| 25,716 |
| — |
| 25,716 |
| 34.12 |
8/1/2023 |
| TRSP |
| 36 |
| 22,950 |
| — |
| 22,950 |
| 34.12 |
|
|
|
|
|
| 3,873,444 |
| (121,446) |
| 3,751,998 |
|
|
Total |
|
|
|
|
| 37,709,232 |
| (6,151,734) |
| 31,557,498 |
|
|
Explanatory Notes to the Financial Statement
(In thousands of Reais, except when otherwise indicated)
a) Reconciliation of outstanding share options
The change in outstanding share options is as follows:
|
| Parent company |
| Consolidated |
On January 1, 2022 |
| 7,801,240 |
| 15,592,511 |
Granted |
| 1,223,679 |
| 5,156,829 |
Exercised/cancels/other |
| (1,597,962) |
| (2,872,832) |
On December 31, 2022 |
| 7,426,957 |
| 17,876,508 |
Granted |
| 14,066,904 |
| 16,868,466 |
Exercised/cancels/other |
| (1,456,999) |
| (3,187,476) |
On December 31, 2023 |
| 20,036,862 |
| 31,557,498 |
|
|
|
|
|
b) Fair value measurement
The weighted average fair value of the programs granted during December 31, 2023 and 2022 and the main assumptions used in applying the Black-Scholes and Binominal model were as follows:
|
| Average market price on the grant date |
| Interest rate |
| Volatility | |
Cosan S.A | 12/31/2023 | 16.82 |
| N/A |
| N/A | |
12/31/2022 | 17.14 |
| 6.82% |
| 36.50% | ||
|
|
|
|
|
|
| |
Compass | 12/31/2023 | 42.21 |
| N/A |
| N/A | |
12/31/2022 | 29.20 |
| N/A |
| N/A | ||
|
|
|
|
|
|
| |
Comgás | 12/31/2023 | - |
| N/A |
| N/A | |
12/31/2022 | 79.00 |
| N/A |
| N/A | ||
|
|
|
|
|
|
| |
TRSP | 12/31/2023 | 42.21 |
| N/A |
| N/A | |
12/31/2022 | 29.20 |
| N/A |
| N/A | ||
|
|
|
|
|
|
| |
Rumo (i) | 12/31/2023 | 21.87 |
| 10.41% |
| 25.84% | |
12/31/2022 | 20.56 |
| 11.53% |
| 27.70% | ||
|
|
|
|
|
|
| |
Moove (ii) | 12/31/2022 | 105.98 |
| 4.05% |
| 42.85% | |
|
|
|
|
|
|
|
| (i) | Volatility was determined based on the historical volatility of the share price in the last thirty days prior to the grant date. |
| (ii) | Volatility was determined based on the historical volatility of the parent company's share price, since Moove is not yet publicly traded, taking as a measure the period proportional to the term of the plan. |
c) Expenses recognized in profit or loss
Share-based compensation expenses included in the income statement for the periods ended December 31, 2023, and 2022 were R$207,713 and R$99,098, respectively.
Explanatory Notes to the Financial Statement
(In thousands of Reais, except when otherwise indicated)
ISSUANCE OF SENIOR NOTES 2031
On January 26, 2024, the Company issued a senior Notes offering for a total volume of US$600,000 equivalent to R$2,947,500, through its wholly owned subsidiary Cosan Luxembourg S.A ("Cosan Luxembourg"). The issuance of senior Notes occurred with an annual interest rate of US$ + 7.25%, maturing in June 2031 and semi-annual interest payments.
On February 16, 2024, the Company committed the remaining funds from Senior Notes 2031, through the issuance of debt modality Resolution 4131 ("4131") by Cosan S.A. On February 16, 2024, the Company committed the remaining funds from Senior Notes 2031, through the issuance of debt modality Resolution 4131 ("4131") by Cosan S.A.
DISTRIBUTION OF DIVIDENDS FROM VALE
The Board of Directors of Vale approved on February 22, 2024 the remuneration of shareholders in the amount of R$11,721,894. The declared amount corresponds in full to dividends in the total amount of R$ 2.738548374 per share. The payment occurred on March 19, 2024 and the amount received by the subsidiary Cosan Oito was R$577,469.
TENTH EMISSION OF COMGÁS DEBENTURES
On February 29, 2024, the Board of Directors of the indirect subsidiary Comgás approved the public offer of the 10th issue of simple debentures, under a firm guarantee of placement, not convertible into shares, of the chirographer species, in a single series. The issue will be in the total amount of R$ 1,500,000, with incidence of half-yearly interest at a rate equal to DI plus a spread of 0.80% per year and with maturity of the principal on March 15, 2029, with amortization on the due date. The net proceeds obtained from the Issuance will be allocated to the ordinary management of the business of the indirect subsidiary Comgás.
RENEWAL OF THE SUDAM TAX BENEFIT
On December 20, 2023, Rumo Malha Norte S.A. presented the incorporation report number 143/2023 to the Federal Revenue of Brazil – RFB, issued by SUDAM on December 6, 2023, attesting to compliance with the legal conditions and requirements required to renew the tax benefit for another 10 years. In view of the above, the RFB, through the use of its powers, decided on March 13, 2024, through executive declaratory act number 024213308, to recognize the right to a 75% reduction in income tax and additional amounts referred to in art. 1 of Provisional Measure No. 2,199-14, of August 24, 2001, calculated based on the exploration profit, of the legal entity Rumo Malha Norte.
THIRD ISSUE OF COMPASS DEBENTURES
On March 15, 2024, the subsidiary Compass Gás e Energia S.A. disbursed its 3rd issue of simple and non-convertible debentures, in the amount of R$ 1,500,000 with remuneration of CDI + 1.08% per year, semi-annual interest and principal with maturity on March 15, 2029. The funds obtained with the issue will be intended for general purposes and strengthening working capital.
COMPASS GAS AND ENERGY DIVIDEND RESOLUTION
On March 27, 2024, the Board of Directors of the indirect subsidiary Compass Gas and Energy approved the distribution of dividends in the amount of R$1,500,000. The payment occurred on April 12, 2024 and the amount received by the subsidiary Cosan Dez was R$1,320,000.
Explanatory Notes to the Financial Statement
(In thousands of Reais, except when otherwise indicated)
COMPASS AND TRSP TRADE NOTES
On March 20, 2024, Compass and its subsidiary TRSP signed the 1st Issuance of Commercial Notes in the amount of R$ 200,000, with its maturity in March 2026 and its remuneration at 100% CDI + 1,7% per year. The contract was concluded through the depositary Laqus Depositary of Securities S.A. following the market conditions for the respective transaction.
COMPASS MARKETING LOAN
On March 21, 2024. Compass and its subsidiary Compass commercialized a loan agreement "Uncommitted Term Loan Facility Agreement - Loan Agreement" with the bank BNP Paribas S.A., for funding in accordance with the terms of Law Nº 4.131. On March 22, 2024, the Company completed the fundraising in the amount of EUR 78 million with maturity in March 2025 and interest rate of 4.879% per year.
ISSUANCE OF DEBENTURES RUMO MALHA PAULISTA S.A.
On March 25, 2024, Rumo Malha Paulista raised R$ 1,200,000 with the 5th issuance of simple debentures, not convertible into shares, of the chirographer species, divided into two series, the first having an amount of R$ 532,243, with IPCA + 5 fee,7970% per year, 10-year term, semi-annual interest payments and Bullet amortization, while the second is R$ 667,757 with IPCA + 5.9284% per year, 15-year term, semi-annual interest payments and amortizations in the last three years.
PORT TERMINAL PROJECT - SEEDS
On March 25, 2024, the Companies Rumo S.A. and EMBRAPORT - Empresa Brasileira de Terminais Portuários S.A., signed a binding agreement for the implementation of a new project (terminal) for grain and fertilizer elevations in the port of Santos. The estimated investment for the construction of the Terminal is R$ 2,5 billion and will be financed with loans, in addition to the possibility of potential strategic partnerships throughout the course of implementation of the Project. The start of construction is conditional on compliance with previous conditions for this type of operation, including licensing and legal and regulatory approvals. After the fulfillment of all the previous conditions, the period of 30 months for construction is estimated.
UNWIND DEBTS - VALE S.A OPERATION
During the initial months of 2024, as shown in Note 1.1(b), the Company made advancements on debts related to the Vale operation. By April 2024, 100% of the debts, as well as the collar financing derivatives linked to the operation, were fully settled.
Explanatory Notes to the Financial Statement
(In thousands of Reais, except when otherwise indicated)
26.1 RECENT ACCOUNTING STANDARDS ADOPTED BY THE COMPANY
Applicable standard | Main requirements | Impact |
Amendments to IAS 8/CPC 23 - Accounting Policies, Change of Estimate and Error Rectification Effective as of January 1, 2023 | IAS 8/CPC 23 introduces the new definition of accounting estimate "Accounting estimates are monetary amounts in financial statements that are subject to measurement uncertainty" and clarifies how entities should distinguish changes in accounting estimates from changes in accounting policies. The impacted paragraphs are items 5, 32, 34, 38 and 48 and the title of item 32. A distinction is made between accounting estimates (which are applied prospectively) and accounting policies (which are applied retrospectively). | These changes had no impact on the Cosan Group’s individual and consolidated financial statements because the Company’s accounting estimates already met the new definition. |
Amendments to IAS 1/ CPC 26 - Presentation of Financial Statements Effective as of January 1, 2023. | IAS 1/CPC 26 introduces guidance for deciding which accounting policies to disclose in your financial statements. The paragraphs impacted to support the identification of material accounting policy are items 114, 117, 122, 117A, 117E, 139V and exclusion of items 118, 119 and 121. | These changes had no impact on the individual and consolidated financial statements of the Cosan Group because the policies disclosed by the Company already met the new definition of material policies. |
Amendments to IAS 12/CPC 32 -Taxes on Profit Effective as of January 1, 2023. | Change of scope of initial recognition exemption and clarifies how entities should account for deferred tax in certain transactions such as: leases and liabilities for disassembly and removal. The impacted paragraphs are: Alteration of items (i) and (ii) of letter b of item 15, letters b and c of item 22 and b of item 24; includes item (iii) of letter b of item 15, item 22A, letter c of item 24, items 98K and 98L and example 8 of Appendix B | These changes had no impact on the individual and consolidated financial statements of the Cosan Group as it is not applicable to the Company. |
Explanatory Notes to the Financial Statement
(In thousands of Reais, except when otherwise indicated)
Applicable standard | Main requirements | Impact |
Amendments to Standard IFRS 17/CPC 50 - Insurance Contracts | The amendment adds a new transition option to IFRS 17 (the ‘classification overlay’) to alleviate operational complexities and one-time accounting mismatches in comparative information between insurance contract liabilities and related financial assets on the initial application of IFRS 17. It allows presentation of comparative information about financial assets to be presented in a manner that is more consistent with IFRS 9 Financial Instruments. | These amendments had no impact on the individual and consolidated financial statements of Grupo Cosan as it is not applicable to the Company. |
Amendment CPC 32 - item 4A referring to the new tax rule Pillar Two In force as of 2023 | Given that in 2023 many countries enacted tax regulation aimed at implementing the rules of global models against erosion of the tax base at the global level (Globe model Rules) members of the project called "Pillar Two" and coordinated by the Organization for Economic Cooperation and Development (OECD), this legislation caused uncertainties in the calculation of deferred tax assets and liabilities in the context of CPC 32 ("Taxes on Profit"). In view of this scenario, the IASB and the AASB proposed changes in IAS 12, which were implemented in Brazil through the publication of CVM Resolution 197, on 12/28/2023, introducing changes in the corresponding Brazilian standard (CPC 32). These changes introduced a mandatory temporary exemption with respect to the recognition and disclosure of deferred tax assets and liabilities related to Pillar Two income taxes (item 4A of CPC 32). CVM Resolution 197/2023 also introduced in CPC 32 obligations to disclose information about the entity’s exposure to Pillar Two taxes, without presenting specific requirements regarding the level of detail and allowing the fulfillment of this obligation with the disclosure of information on the progress of the entity in assessing its exposure. | The Company applied this temporary exemption for the financial statements ending December 31, 2023. Additionally, we assess what is in the scope of tax regulations that have been enacted or substantially enacted in some of the countries in which certain entities consolidated by the group operate. In spite of the fact that the implementation of these regulations is still very recent and that no country applied a concrete minimum global tax requirement in 2023, the Company, considering the points above, carried out a preliminary assessment, supported by expert advice, and concluded that there are no expected significant impacts in relation to the jurisdictions where it operates. However, the Company will continue with the studies and further evaluation of the application of the new rules, for disclosure of any exposure, if any, in the financial statements of the coming quarters. |
Explanatory Notes to the Financial Statement
(In thousands of Reais, except when otherwise indicated)
26.2 NEW STANDARDS AND INTERPRETATIONS NOT YET IN FORCE
The following new standards, interpretations and amendments were issued by CPC and by IASB but are not effective for annual periods started after January 1, 2023. Early adoption is not allowed.
Additionally, based on an initial review, the Company currently believes that the adoption of these following standards/amendments will not significantly affect the consolidated result or financial position of the Company.
Applicable standard | Key requirements or changes in accounting policy |
Amendments to IFRS 16/ CPC 06 (R2) - Leases Effective as of January 1, 2024. | Inclusion of requirements on variable payments for a sale-leaseback that aims to provide guidance on how to account for variable payments to the seller-lessee in a Sales and leaseback transaction. These changes did not have a significant impact on the individual and consolidated financial statements of the Cosan Group, as it is not applicable to the Company. |
Changes to IAS 1/CPC 26 (R1) - Presentation of Financial Statements Effective as of January 1, 2024. | The change in the standard provides further clarification for classification of debt between circulating and non-circulating aimed at the right of an entity to defer settlement should exist on the base date, exclusion of the application for the right to be unconditional and included the application to have substance. It also carried out further clarification for liabilities with covenants that guides only the covenants that must comply to the base date affect the classification of a liability as circulating or non-circulating. For covenants after the base date do not affect the classification of liabilities. For December 2023, the Company did not implement it in advance, however, no significant impacts are expected, since the classification between short and long term is already carried out within the new definitions. As for covenants, the Company constantly monitors and will make any required disclosures, if applicable. |
Amendments to CPC 03/IAS 7 and CPC 40/IFRS 7) - Supplier financing agreements ("Risk Taken")
Effective as of January 1, 2024. | The changes introduce two new disclosure objectives - one in IAS 7 and one in IFRS 7 - for the company to provide information on its supplier financing arrangements that would allow the reader of the statements to assess the effects of those arrangements on liabilities and cash flows of the company. It will also be necessary to disclose the type and effect of non-monetary changes in the book values of financial liabilities that are part of a supplier financing agreement. For December 2023, the Company did not implement it in advance, however, we do not expect significant changes. |
Explanatory Notes to the Financial Statement
(In thousands of Reais, except when otherwise indicated)
Applicable standard | Key requirements or changes in accounting policy |
Changes to IAS 21/ CPC 02 - Effects of Changes in Exchange Rates and Conversion of Financial Statements Effective as of January 1, 2025. | The changes bring greater clarification about an entity being able to perform activities abroad in two ways: (i) carrying out transactions in foreign currency or (ii) owning entities abroad. The purpose of the standard is to determine how to include transactions in foreign currency and how to convert the financial statements of this entity into another currency. For December 2023, the Company did not implement it in advance, but is evaluating all the impacts for adoption of the standard. |
New Accounting Standard - IFRS 18 - Presentation and Disclosure in Financial Statements
Effective from January 1, 2027. | This new standard aims to provide investors with a deeper understanding of companies' financial performance by offering consistent benchmarks for their analyses, enabling better investment decisions. Given that the standard was only published in April 2024, there are no impacts for December 2023. Therefore, the Company has not yet assessed the impacts, but this will be done for future fiscal years, considering that the standard takes effect in 2027. |
SIGNATURES
Pursuant to the requirements of the Securities Exchange Act of 1934, the registrant has duly caused this report to be signed on its behalf by the undersigned, thereunto duly authorized.
Date: April 29, 2024
COSAN S.A. | ||
By: | /s/ Rodrigo Araujo Alves | |
| Name: Rodrigo Araujo Alves | |
| Title: Chief Financial Officer | |
| 169 |