UNITED STATES
SECURITIES AND EXCHANGE COMMISSION
Washington, D.C. 20549
FORM 6-K
REPORT OF FOREIGN PRIVATE ISSUER PURSUANT TO RULE 13a-16 OR 15d-16 UNDER THE SECURITIES EXCHANGE ACT OF 1934
For the month of May 2024
Commission File Number: 001-40155
Cosan S.A.
(Exact name of registrant as specified in its charter)
N/A
(Translation of registrant’s name into English)
Av. Brigadeiro Faria Lima, 4,100 – 16th floor
São Paulo – SP, 04538-132, Brazil
+55 11 3897-9797
(Address of principal executive office)
Indicate by check mark whether the registrant files or will file annual reports under cover of Form 20-F or Form 40-F:
Form 20-F | ☒ |
| Form 40-F | ☐ |
EXPLANATORY NOTE
Cosan S.A. (the “Company”) is furnishing this current report on Form 6-K to present (i) a discussion of the Company’s business and operations as of December 31, 2023 and 2022 and for each of the three years in the period ended December 31, 2023, and (ii) a convenience translation into English of the Company’s consolidated financial information as of and for the fiscal years ended December 31, 2023 and 2022 filed with the Brazilian Securities Commission (Comissão de Valores Mobiliários).
The financial information for Cosan S.A. as of and for the fiscal years ended December 31, 2023 and 2022 included herein has not been audited in accordance with the standards of the Public Company Accounting Oversight Board (United States) (“PCAOB”). As previously disclosed by the Company on a current report on Form 6-K furnished on March 26, 2024, the Company’s audited consolidated financial statements for the year ended December 31, 2023 will not be completed within the prescribed timeframe strictly due to the date on which the Company’s new independent public accounting firm, BDO RCS Auditores Independentes SS Ltda. (“BDO”), began its audit of the Company, and the number of entities that need to be audited as part of a consolidated audit of the Company. The Company is working with BDO towards completing the necessary work in order to file its annual report on Form 20-F for the year ended December 31, 2023 as soon as possible.
TABLE OF CONTENTS
ITEM
SIGNATURE
Pursuant to the requirements of the Securities Exchange Act of 1934, the registrant has duly caused this report to be signed on its behalf by the undersigned, thereunto duly authorized.
COSAN S.A. | ||
By: | /s/ Rodrigo Araujo Alves | |
| Name: | Rodrigo Araujo Alves |
| Title: | Chief Financial and Investor Relations Officer |
Date: May 28, 2024.
Item 1
table of contents
We present our individual and consolidated financial information in accordance with International Financial Reporting Standards, or “IFRS,” as issued by the International Accounting Standards Board, or “IASB.”
The individual and consolidated financial information is presented in Brazilian reais, the functional and presentation currency of Cosan S.A., or “Cosan” or “Cosan S.A.” and is the currency of the primary economic environment in which Cosan and its subsidiaries and jointly-controlled entity, located in Brazil, operate and generate and expend cash. The functional currency for the subsidiaries located outside Brazil is the U.S. dollar, British pound or the euro. Cosan S.A. and its subsidiaries are collectively referred to as the “Company,” “we,” “us” and “our.”
Individual and Consolidated Financial Information
We have included in this current report a convenience translation into English of our consolidated financial information as of and for the fiscal years ended December 31, 2023 and 2022 filed with the Brazilian Securities Commission (Comissão de Valores Mobiliários), or the “CVM.”
All references herein to “our financial information,” “our consolidated financial information” and “our individual and consolidated information” are to the convenience translation into English of Cosan S.A.’s consolidated financial information as of and for the fiscal years ended December 31, 2023 and 2022 filed with the CVM and included elsewhere in this current report on Form 6-K.
Restatement of Compass’s and Our 2022 Financial Information
Our subsidiary, Compass Gás e Energia, or “Compass,” restated its consolidated financial statements for the year ended December 31, 2022, as a result of the reclassification by its subsidiary Comgás - Companhia de Gás de São Paulo S.A., or “Comgás,” of the effects of the regulatory current account (conta corrente regulatória), or the “CCR,” on its gross profit. More specifically, the State of São Paulo Public Services Regulation Agency (Agência Reguladora de Serviços Públicos do Estado de São Paulo), or ARSESP, through Deliberation No. 1,205 dated August 18, 2021 (NTF-044-2021), published a new regulatory accounting manual and chart of accounts for the piped gas distribution sector applicable to companies subject to its regulation and effective as of fiscal year 2023. According to this rule, ARSESP set forth that the accounting of variations (positive and negative) between the price included in the tariffs and the price actually paid by a concessionaire to a supplier, which are periodically passed on to users through graphical accounts, must be recorded as net operating revenue. The accounting policy that we usually applied is consistent with our understanding of the essence of this transaction. We classified the effects of the CCR in our gross profit, but with allocations in the cost of products sold and services provided. In addition, the ARSESP rule states that the classification of expenses and costs may vary in relation to commonly adopted practices in which part of the administrative expenses are also admitted as costs of operations related to piped gas distribution services. These reclassifications do not impact the main indicators, such as profit for the year and equity, used by our indirect subsidiary Comgás and other Compass gas distributors.
As a result of the foregoing, we voluntarily reassessed the way in which we present the classification of the effects of CCR and general and administrative expenses, as we understand that such presentation will meet the requirements of ARSESP and Brazilian generally accepted accounting practices and will therefore be more consistent with market practice. Accordingly, we restated our consolidated statement of profit or loss for the fiscal year ended December 31, 2022, in order to reflect Compass’s restated results. For more information, see note 3.4 to our individual and consolidated financial information included elsewhere in this current report.
Certain Corporate Events
Our Corporate Reorganization
On January 22, 2021, the shareholders of Cosan Limited (the former parent company of Cosan and Cosan Logística S.A., or “Cosan Logística”) and the shareholders of Cosan and Cosan Logística approved an intra-group restructuring, consisting of a merger of companies under common control, pursuant to which Cosan Limited and Cosan Logística were merged into Cosan, or the “Merger,” as part of an effort to streamline our operations and to simplify our corporate structure. Cosan is now the sole holding company of the “Cosan Group,” which consists of Cosan and its consolidated subsidiaries.
Interest in Raízen
On June 1, 2011, we and Shell Brazil Holdings B.V., or “Shell,” formed two joint ventures, or the “Joint Venture,” for a combined 50/50 investment, under the names Raízen Combustíveis S.A., or “Raízen Combustíveis” and Raízen Energia e Participações S.A. (currently Raízen Energia S.A.), or “Raízen Energia.”
On June 1, 2021, Cosan and Shell contributed all their respective common shares, as well as class A and D preferred shares issued by Raízen Energia, in a capital increase of Raízen Combustíveis (with the exception of two common shares, each held by one of Cosan Investimentos e Participações S.A., or “CIP,” and Shell Brasil Holding BV). On this date, Raízen Energia also redeemed all of its own class B preferred shares. As a result, Raízen Combustíveis became the holder of the entire share capital of Raízen Energia, and it subsequently changed its corporate name to Raízen S.A. Following this corporate reorganization, Cosan S.A. and Shell terminated the Raízen Energia shareholders’ agreement and amended the Raízen Combustíveis shareholders’ agreement in order to adapt its terms and conditions to the new corporate organization. After the above-mentioned corporate reorganization, Raízen completed its initial public offering whereby its preferred shares with no voting rights were listed on the Nível 2 segment of the São Paulo Stock, Commodities and Futures Exchange (B3 S.A. – Brasil, Bolsa, Balcão), or “B3.”
This reorganization and such initial public offering did not by themselves affect the combined businesses of Raízen Combustíveis and Raízen Energia nor did they affect the respective voting rights of Cosan and Shell in Raízen’s share capital. Accordingly, references to “Raízen” refer, (i) prior to the corporate reorganization as a result of which Raízen Energia became the direct wholly-owned subsidiary of Raízen Combustíveis, to Raízen Energia and Raízen Combustíveis collectively, together with their respective consolidated subsidiaries; and (ii) following the corporate reorganization as a result of which Raízen Energia became the direct wholly-owned subsidiary of Raízen Combustíveis, to Raízen S.A. (the current corporate name of Raízen Combustíveis), together with its consolidated direct or indirect subsidiaries.
Cosan’s total interest in Raízen is made up of a 5.02% direct interest and a 39.15% indirect interest through Cosan’s interest in its subsidiary Cosan Nove S.A., or “Cosan Nove.” We therefore report an equity interest of 25.90% in Raízen, which is calculated by reference to Cosan’s 66.16% equity interest in its subsidiary Cosan Nove multiplied by Cosan Nove’s 39.15% equity interest in Raízen.
For further information, see note 4, “Segment Information,” to our individual and consolidated financial information as of and for the fiscal years ended December 31, 2023 and 2022, included elsewhere in this current report.
Acquisition of Significant Influence in Vale S.A., or “Vale”
During the fourth quarter of 2022, we completed a financial investment in Vale in a series of transactions that allowed us to finance, and hedge against certain risks relating to, the acquisition of Vale’s shares. The acquisition was financed by a combination of new indebtedness and derivatives. Vale is a Brazilian mining company that operates in 20 countries, has investments in energy infrastructure projects and conducts logistics operations through its railroads, ports and terminals.
On October 14, 2022, our subsidiary Cosan Oito S.A., or “Cosan Oito,” completed the R$16,425.4 million investment in the shares of Vale. The investment was comprised of several transactions starting in September 2022, which included: (i) the acquisition of 1.55% of Vale’s shares in the open market for R$4,918.2 million, which exposed us to the risk of changes in the price of Vale’s shares; (ii) the purchase of 3.31% of Vale’s shares in a private placement transaction for R$11,117.8 million, together with derivative financial instruments (from which we received a R$499.2 million premium) that partially hedge our exposure to changes in Vale’s share price; and (iii) the acquisition of a call spread, which consist of a synthetic economic exposure (“forward”) to an additional 1.6% of Vale’s shares in the open market at a predetermined price per share (for which we paid a R$1,134.9 million premium), together with derivative financial instruments that partially hedge our exposure to changes in Vale’s share price, from which we received a R$246.3 million premium (with the option, subject to satisfaction of certain conditions, to negotiate with the derivative banks in good faith to convert this synthetic exposure into outright ownership subject to the same cap and floor prices). Except as otherwise specified herein, all percentages of Vale’s shares as used in this section are based on 4,535,617,099 Vale shares outstanding as of October 31, 2022.
The net cost of the investment in Vale of R$16,425.4 million in the year ended December 31, 2022, was financed through new indebtedness in the aggregate amount of R$16,569.7 million.
A summary of the loans we entered into for the financing of our investment in Vale is set forth in the table below:
Creditor | Issue Date | Aggregate Amount (in millions of reais) | Maturity Date | Interest Rate | ||||
|---|---|---|---|---|---|---|---|---|
Itaú Unibanco S.A.(1) | September 16, 2022 | R$4,000.0 | September 16, 2023 | CDI + 1.35% | ||||
Bradesco BBI S.A.(1) | September 27, 2022 | R$4,000.0 | September 27, 2023 | CDI + 1.35% | ||||
J.P. Morgan S.A.(2)(3) | October 14, 2022 | R$5,141.8 | October 1, 2027 | 3.28% p.a. | ||||
Citibank S.A.(2)(3) | October 14, 2022 | R$3,427.9 | October 1, 2027 | 0.25% p.a. |
| (1) | Settled prior to maturity in December 2022. |
| (2) | The charges for these operations bear pre-fixed interest, raised in foreign currency for €1.0 billion and ¥95.3 billion with JP Morgan S.A. and Citibank S.A., respectively. Subsequently, derivative financial instruments were structured for these financings, which converted suchoperations into reais at a cost of CDI plus 0.45% p.a. The financings obtained from JP Morgan S.A. and Citibank S.A. are secured by 100% of Vale’s shares in the collar structure, which represent Cosan Oito’s acquired stake of 3.31% of Vale. The collar loans mature in four tranches, namely in October 2024, 2025, 2026 and 2027. “CDI” refers to the Brazilian interbank deposit certificate rate (certificado de depósito interbancário). |
| (3) | During the first months of 2024, the Company settled 100% of the debts linked to the acquisition of our equity interest in Vale, as well as the collar financing derivatives linked to the transaction. |
For protection against the risks involved in the acquisition of a 3.14% stake in Vale by Cosan Oito, cash-settled derivatives were structured with J.P. Morgan S.A. and Citibank S.A. consisting of a combination of call and put positions that mitigate the risk associated with a decrease in the share price of Vale below certain thresholds, while also allowing Cosan Oito to participate in future share value increases up to a certain threshold. These call and put positions are scheduled to expire periodically between October 2024 and November 2027. At the inception of the transaction, a net premium of R$499.2 million was received for the difference between the put and call options.
In order to secure our right to make an additional financial investment of 1.6% stake in Vale at a later date, cash-settled derivatives were structured consisting of an equity forward plus a combination of call and put options that mitigate share value depreciation risk, while also allowing Cosan Oito to participate partially in future share value increases. These call and put positions are scheduled to expire periodically between October 2024 and November 2027. In the equity forward transaction, we paid the amount of R$1,134.9 million to J.P. Morgan S.A. and Citibank S.A., and in the synthetic collar transaction we received from J.P. Morgan S.A. and Citibank S.A. an amount of R$246.3 million upon entering into these structured derivatives, totaling a net payment by us of a premium of R$888.6 million. We have the option, subject to satisfaction of certain conditions, to negotiate with the derivative banks in good faith to convert the synthetic economic exposure under the equity forward into outright ownership subject to the same cap and floor prices.
On December 23, 2022, Banco Bradesco BBI S.A. invested R$4.0 billion in preferred shares representing 23.2% of the share capital of our subsidiary Cosan Dez Participações S.A., or “Cosan Dez.” As part of the transaction, Cosan S.A. contributed to Cosan Dez its investment in Compass and certain commercial notes issued by Banco Bradesco BBI S.A. Cosan Dez redeemed these commercial notes for a total aggregate amount of R$4.0 billion (including principal plus interest until the redemption date) using the proceeds from the issuance of its preferred shares. As a result of the transaction, Cosan Dez now holds 88.0% of Compass’s shares, and, as the holder of preferred shares in Cosan Dez, Banco Bradesco BBI S.A. has a preferential right to the receipt of dividends or other distributions from Cosan Dez. We have also entered into a shareholders’ agreement with Banco Bradesco BBI S.A. with respect to Cosan Dez. In addition, on December 28, 2022, Itaú Unibanco S.A. invested R$4.1 billion in preferred shares representing 26.9% of the share capital of our subsidiary Cosan Nove Participações S.A., or “Cosan Nove.” As part of the transaction, Cosan S.A. contributed to Cosan Nove its investment in Raízen and certain commercial notes issued by Itaú Unibanco S.A. Cosan Nove redeemed these commercial notes for a total aggregate amount of R$4.1 billion (including principal plus interest until the redemption date) using the proceeds from the issuance of its preferred shares. As a result of the transaction, Cosan Nove now holds 39.1% of Raízen’s shares, and, as the holder of preferred shares in Cosan Nove, Itaú Unibanco S.A. has a preferential right to the receipt of dividends or other distributions from Cosan Nove. We have also entered into a shareholders’ agreement with Itaú Unibanco S.A. with respect to Cosan Nove.
We initially recorded our shareholding in Vale as a financial asset accounted for at fair value in accordance with IFRS 9. On April 28, 2023, at Vale’s general shareholder’s meeting, our then-chief executive officer, Luis Henrique Cals de Beauclair Guimarães, was elected as a member of Vale’s board of directors, and, on May 16, 2023, was appointed coordinator of Vale’s capital and projects allocation committee, or the “CACP,” and a member of Vale’s people and compensation committee, or “CPR.” From January 1, 2024, Mr. Guimarães left his position as our chief executive officer, while remaining a member of our board of directors. During the year ended December 31, 2023, we monitored the factors that could indicate our having significant influence in Vale, given Mr. Guimarães’ participation in Vale’s CACP and CPR. On November 30, 2023, we obtained sufficient evidence that demonstrated our ability to exert significant influence on Vale’s policies and operations, given that Mr. Guimarães was able to participate in policy-making processes, including decisions relating to dividends and other distributions. From this date, we began to consider Vale as a related company over which we have significant influence and to account for our investment in Vale using the equity method in accordance with IAS 28. As of December 31, 2023, we had a 4.65% interest in Vale, reflecting the sale of shares equivalent to 0.21% of Vale’s total share capital since we started accounting for Vale using the equity method. For more information, see note 1.1 to our individual and consolidated financial information included elsewhere in this current report.
As shown in the table below, in the fourth quarter of 2023 and the first months of 2024, we accelerated the settlement of the indebtedness tied to the acquisition of Vale shares, as well as the collar financing derivatives tied to this transaction.
Reference Date | Direct Interest | Interest through Collar | Total Interest in Vale’s Share Capital | Aggregate Amount (in millions of reais) – Principal Debt Settlement | ||||
|---|---|---|---|---|---|---|---|---|
Inception date (October 2022) | 1.47% | 3.14% | 4.61% | 8,569.6 | ||||
August 2023 | 1.65% | 3.21% | 4.85% | (275.9) | ||||
October 2023 | 1.75% | 3.11% | 4.85% | (252.5) | ||||
November 2023 | 2.45% | 2.40% | 4.85% | (1,844.0) | ||||
December 2023 | 2.45% | 2.20% | 4.65% | (561.3) | ||||
January 2024 | 2.62% | 2.03% | 4.65% | (1,698.6) | ||||
February 2024 | 3.91% | 0.74% | 4.65% | (2,068.0) | ||||
April 2024 | 3.91% | — | 3.91% | (1,918.8) |
Special Note Regarding Non-GAAP Financial Measures
This current report presents our Net debt, which is a non-GAAP financial measure. A non-GAAP financial measure is generally defined as one that purports to measure financial performance but excludes or includes amounts that would not be so adjusted in the most comparable GAAP measure.
We calculate Net debt as current and non-current loans, borrowings and debentures plus preferred shareholders payable in subsidiaries plus cash and cash equivalents plus marketable securities plus derivatives on debt. Our calculation of Net debt may differ from the calculation of similarly titled measures used by other companies.
Our management believes that disclosure of Net Debt is useful to potential investors as it helps to give them a clearer understanding of our financial liquidity. Net Debt is also used to calculate certain leverage ratios. However, Net Debt is not a measure under IFRS and should not be considered as a substitute for measures of indebtedness determined in accordance with IFRS. For a reconciliation of Net debt to the most directly comparable IFRS measure, see “Selected Financial Data.”
Market Data
We obtained market and competitive position data, including market forecasts, used throughout this current report from market research, publicly available information and industry publications, as well as internal surveys. We include data from reports prepared by LMC International Ltd., the Central Bank of Brazil (Banco Central do Brasil), or the “Brazilian Central Bank,” the Sugarcane Agroindustry Association of the state of São Paulo (União da Agroindústria Canavieira de São Paulo), or “UNICA,” the Brazilian Ministry of Agriculture, Livestock, and Supply (Ministério da Agricultura, Pecuária e Abastecimento), or “MAPA,” the Brazilian Institute of Geography and Statistics (Instituto Brasileiro de Geografia e Estatística), or “IBGE,” the Brazilian Ministry of Development, Industry and Foreign Trade (Ministério do Desenvolvimento e do Comércio Exterior), or “MDIC,” the Brazilian Ministry of Infrastructure (Ministério da Infraestrutura), or “MI,” the Food and Agriculture Organization of the United Nations, or “FAO,” the National Traffic Agency (Departamento Nacional de Trânsito—DENATRAN), the Brazilian Association of Vehicle Manufactures (Associação Nacional dos Fabricantes de Veículos Automotores—ANFAVEA), Datagro Publicações Ltda., F.O. Licht, Czarnikow, Apoio e Vendas Procana Comunicações Ltda., the B3, the Brazilian Securities Commission (Comissão de Valores Mobiliários), or “CVM,” the International Sugar Organization, the Brazilian National Economic and Social Development Bank (Banco Nacional de Desenvolvimento Econômico e Social), or “BNDES,” the New York Board of Trade, or “NYBOT,” the New York Stock Exchange, or “NYSE,” the Brazilian Agricultural Research Corporation (Empresa Brasileira de Pesquisa Agropecuária), or “Embrapa,” the Brazilian Secretariat for Foreign Trade (Secretaria de Comércio Exterior), or “Secex,” the National Supply Company (Companhia Nacional de Abastecimento), or “Conab,” the United States Department of Agriculture, or “USDA,” the London Stock Exchange, the National Agency of Petroleum, Natural Gas and Biofuels (ANP – Agência Nacional do Petróleo, Gás Natural e Biocombustíveis), or “ANP,” the Brazilian Antitrust Authority (Conselho Administrativo de Defesa Econômica), or the “Brazilian Antitrust Authority,” the National Union of Distributors of Fuels and Lubricants (Sindicato Nacional das Empresas Distribuidoras de Combustíveis e de Lubrificantes), or “Sindicom,” the Sanitation and Energy Regulatory Agency for the state of São Paulo (Agência Reguladora de Energia de São Paulo), or “ARSESP,” the Brazilian Gas Distributors Association (Associação Brasileira das Empresas Distribuidoras de Gás), or “ABEGÁS,” the Agriculture School of the University of São Paulo (Escola Superior de Agricultura Luiz de Queiroz), or “ESALQ,” the National Waterway Transportation Agency (Agência Nacional de Transportes Aquaviários), or “ANTAQ,” the Brazilian Transportation Authority (Agência Nacional de Transporte Terrestre), or “ANTT,” Estação da Luz Participações Ltda., or “EDLP,” the National Electric Energy Agency (Agência Nacional de Energia Elétrica), or “ANEEL,” and the Chamber of Electric Energy Commercialization (Câmara de Comercialização de Energia Elétrica), or “CCEE.” We believe that all market data in this current report is reliable, accurate and complete.
Terms Used in This Current Report
In this current report, we present information in gallons, liters and cubic meters (m³ or cbm). In addition, we also present information in tons. In this current report, references to “ton” or “tonne” refer to the metric tonne, which is equal to 1,000 kilograms.
All references in this current report to “TSR” are to total sugar recovered, which represents the total amount of sugar content in a given quantity of sugarcane.
All references in this current report to “RTK” mean revenue ton kilometer.
All references to the “real,” “reais” or “R$” are to the Brazilian real, the official currency of Brazil. All references in this current report to “U.S. dollars,” “dollars” or “U.S.$” are to U.S. dollars. All references to the “Euro,” “Euros,” “€” or “EUR” are to the official currency of the European Union. All references to the “Yen,” “¥” or “JP¥” are to the Japanese Yen, the official currency of Japan.
Rounding
We have made rounding adjustments to reach some of the figures included in this current report. Accordingly, numerical figures shown as totals in some tables may not be an arithmetic aggregation of the figures that preceded them.
This current report contains estimates and forward-looking statements, mainly under “Risk Factors,” “Information on the Company—B. Business Overview” and “Management’s Discussion and Analysis of Financial Condition and Results of Operations.” Some of the matters discussed concerning our business and financial performance include estimates and forward-looking statements.
Our estimates and forward-looking statements are mainly based on our current expectations and estimates on projections of future events and operating and financial trends, which affect or may affect our industry, market share, reputation, businesses, financial condition, results of operations, margins and/or cash flow. Although we believe that these estimates and forward-looking statements are based upon reasonable assumptions, they are subject to several risks and uncertainties, are made in light of information currently available to us and should not be considered a guarantee of the results of operations we may achieve. Many significant factors in addition to those stated in this current report may adversely affect our current estimates and forward-looking statements, and whether these estimates or statements may be realized. Our estimates and forward-looking statements may be influenced by the following factors, among others:
- general economic, political, demographic and business conditions in Brazil and in the world (including any impact resulting from the ongoing war between Russia and Ukraine and conflicts in the Middle East) and the cyclicality affecting our selling prices, including, for example, inflation, interest rates, levels of employment, population growth, consumer confidence and liquidity in the credit, financial and capital markets;
- inflation and government measures to fight inflation;
- the effects of global financial and economic crises in Brazil;
- our ability to implement our expansion strategy in other regions of Brazil and international markets through organic growth, acquisitions or Joint Ventures;
- our ability to successfully compete in all segments and geographical markets where we currently conduct business or may conduct businesses in the future;
- competitive developments in the segments in which we operate;
- our ability to implement our capital expenditure plan, including our ability to arrange financing when required and on reasonable terms;
- government intervention resulting in changes to the economy, taxes and tariffs, regulatory environment or regulation in Brazil, including the effects of tax reforms in Brazil and their impact on the distribution of dividends;
- price of natural gas, ethanol and other fuels, as well as sugar;
- equipment failure and service interruptions;
- our ability to compete and conduct our businesses in the future;
- adverse weather conditions, including those related to climate change events causing physical and transition risks in the markets in which we operate;
- changes in customer demand;
- changes in our businesses;
- our ability to work together successfully with our partners to operate our partnerships (such as the Joint Venture);
- technological advances in the natural gas sector, including developments of natural gas for use in other applications, and advances in the development of alternatives to natural gas;
- technological advances in the ethanol sector and advances in the development of alternatives to ethanol;
- changes in global energy usage;
- government intervention and trade barriers, resulting in changes in the economy, taxes, rates, prices or regulatory environment including in relation to our regulated businesses such as Compass and Rumo;
- appreciation and depreciation of the real against the U.S. dollar, which has experienced significant volatility in recent years;
- the political instability related to the recent election of the President of Brazil and a new presidential term that began in January 2023, including uncertainties in relation to the implementation by the new government of monetary, fiscal and social security policies and the political climate after the result of the election, which has resulted in demonstrations and/or strikes;
- the business, results of operations and financial condition of Vale;
- public health threats or outbreaks of communicable diseases, such as the novel coronavirus, or COVID-19, and others, could have an adverse effect on our operations and financial results;
- other factors that may affect our financial condition, liquidity and results of our operations; and
- other risk factors discussed under “Risk Factors.”
The words “believe,” “should,” “may,” “might,” “could,” “seek,” “aim,” “likely,” “will,” “estimate,” “continue,” “anticipate,” “intend,” “expect” and other similar words used in this current report are intended to identify estimates and forward-looking statements. Estimates and forward-looking statements speak only as of the date they were made, and we undertake no obligation to update or to review any estimate and/or forward-looking statement because of new information, future events or other factors. Estimates and forward-looking statements involve risks and uncertainties and are not guarantees of future performance. Our future results may differ materially from those expressed in these estimates and forward-looking statements. In light of the risks and uncertainties described above, the estimates and forward-looking statements discussed in this current report might not occur and our future results and our performance may differ materially from those expressed in these forward-looking statements due to but not limited to, the factors mentioned above. Because of these uncertainties, you should not make any investment decision based on these estimates and forward-looking statements.
The following tables present selected historical financial and operating data for the Company derived from our individual and consolidated financial information. You should read the following information in conjunction with our individual and consolidated financial information and related notes, and the information under “Management’s Discussion and Analysis of Financial Condition and Results of Operations” in this current report.
The financial data as of and for the fiscal years ended December 31, 2023 and 2022 have been derived from our individual and consolidated financial information using the predecessor method of accounting prepared in accordance with IFRS as issued by the IASB and included elsewhere in this current report. See “Presentation of Financial and Other Information—Individual and Consolidated Financial Information.”
| As of and for the fiscal year ended December 31, | |||||
|---|---|---|---|---|---|---|
| 2023 | 2022 | 2021 | |||
| (in millions of reais, except where otherwise indicated) | |||||
Consolidated Profit or Loss Data: |
|
|
| |||
Net sales | 39,468.5 | 39,322.8 | 25,865.0 | |||
Cost of sales(1) | (28,549.9 | ) | (30,556.8 | ) | (19,864.2 | ) |
Gross profit(1) | 10,918.6 | 8,766.0 | 6,000.8 | |||
Selling expenses(1) | (1,350.6 | ) | (1,276.3 | ) | (723.4 | ) |
General and administrative expenses(1) | (2,528.0 | ) | (1,758.1 | ) | (1,572.4 | ) |
Other income, net | 3,924.4 | 1,752.2 | 382.6 | |||
Total operations expenses | 45.8 | (1,282.2 | ) | (1,913.2 | ) | |
Profit before equity in earnings of investees, finance results and income taxes | 10,964.4 | 7,483.8 | 4,087.6 | |||
Equity in earnings of investees | 2,046.3 | 326.7 | 4,720.9 | |||
Finance results, net | (7,897.0 | ) | (5,157.9 | ) | (2,557.6 | ) |
Profit before income taxes | 5,113.8 | 2,652.6 | 6,250.9 | |||
Income taxes: |
|
|
| |||
Current | (1,645.1 | ) | (1,247.0 | ) | (787.6 | ) |
Deferred | 1,370.6 | 1,365.4 | 1,233.2 | |||
| (274.4 | ) | 118.4 | 445.6 | ||
Profit for the year | 4,884.7 | 2,820.9 | 6,696.5 | |||
Profit attributable to non-controlling interests | 3,790.4 | 1,644.8 | 384.3 | |||
Profit attributable to owners of the Company) | 1,094.4 | 1,176.0 | 6,312.1 | |||
Consolidated Statement of Financial Position Data: |
|
|
| |||
Cash and cash equivalents | 14,658.5 | 13,301.7 | 16,174.1 | |||
Marketable securities (current and non-current) | 3,504.0 | 22,099.8 | 4,388.0 | |||
Inventories | 1,792.7 | 1,869.1 | 1,149.3 | |||
Right-of-use assets | 9,513.5 | 8,012.9 | 7,947.3 | |||
Property, plant and equipment | 21,240.0 | 18,948.4 | 16,648.6 | |||
Intangible assets and goodwill | 22,650.3 | 22,121.9 | 17,781.5 | |||
Total assets | 139,865.4 | 134,485.0 | 97,842.0 | |||
Current liabilities | 16,158.8 | 15,798.2 | 12,957.0 | |||
| As of and for the fiscal year ended December 31, | ||||||||
|---|---|---|---|---|---|---|---|---|---|
| 2023 | 2022 | 2021 | ||||||
| (in millions of reais, except where otherwise indicated) | ||||||||
Non-current liabilities | 72,725.4 | 70,517.4 | 56,015.0 | ||||||
Loans, borrowings and debentures (current and non-current) | 56,904.7 | 52,987.2 | 45,659.0 | ||||||
Preferred shareholders payable in subsidiaries | — | — | — | ||||||
Provision for legal proceedings | 1,714.4 | 1,801.2 | 1,644.1 | ||||||
Equity attributable to owners of the Company | 20,955.3 | 20,653.2 | 14,740.9 | ||||||
Equity attributable to non-controlling interests | 30,025.9 | 27,516.2 | 14,129.1 | ||||||
Total shareholders’ equity | 50,981.2 | 48,169.4 | 28,870.0 | ||||||
Consolidated Other Financial Data: |
|
|
| ||||||
Depreciation and amortization | 3,364.9 | 3,014.5 | 2,504.4 | ||||||
Net debt(2) | 39,733.0 | 18,814.7 | 21,463.5 | ||||||
Working capital(3) | 11,685.1 | 9,779.7 | 14,336.1 | ||||||
Cash flow provided by (used in): |
|
|
| ||||||
Operating activities | 10,276.4 | 9,972.2 | 5,147.2 | ||||||
Investing activities | (4,303.1 | ) | (20,726.6 | ) | (5,446.8 | ) | |||
Financing activities | (4,516.6 | ) | 8,286.3 | 2,319.4 | |||||
Basic earnings per share from continuing operations(4) | R$ | 0.58 | R$ | 0.62 | R$ | 3.44 | |||
Diluted earnings per share from continuing operations(4) | R$ | 0.58 | R$ | 0.62 | R$ | 3.43 | |||
Number of shares outstanding(4) | 1,867,556,421 | 1,866,638,100 | 1,868,630,160 | ||||||
Declared dividends (millions of reais) | 2,375.6 | 1,237.8 | 2,031.3 | ||||||
Declared dividends (millions of U.S. dollars) | U.S.$ | 475.1 | U.S.$ | 237.2 | U.S.$ | 503.4 | |||
Declared dividends per share (reais)(4) | R$ | 0.5778 | R$ | 0.6173 | R$ | 1.0858 | |||
Declared dividends per share (U.S. dollars)(4) | U.S.$ | 0.1156 | U.S.$ | 0.1194 | U.S.$ | 0.2694 | |||
Other Operating Data: |
|
|
| ||||||
Crushed sugarcane (in million tons) | 83.5 | 73.4 | 54.2 | ||||||
Sugar production (in million tons) | 5.8 | 4.8 | 3.7 | ||||||
Ethanol production (in billion liters) | 3.1 | 3.0 | 2.2 | ||||||
Volume of fuel sold (in million liters) | 35,295 | 34,822 | 33,178 | ||||||
Volume loaded (Rumo) (in million tons) | — | 10.8 | 12.5 | ||||||
Transported volume (Rumo) (in million TKU) | 77,258.4 | 74,944.0 | 64,028.0 | ||||||
Natural gas (Compass) (in million m³) | 4,926.7 | 5,448.3 | 4,859.1 | ||||||
Volume of finished goods and base oil sold (in million liters) | 665.5 | 524.7 | 388.7 | ||||||
| (1) | Our subsidiary Compass restated its consolidated financial statements for the year ended December 31, 2022, as a result of the reclassification by its subsidiary Comgás of the effects of the CCR on its gross profit. As a result, we voluntarily reassessed the way in which we present the classification of the effects of CCR and general and administrative expenses, as we understand that such presentation will meet the requirements of ARSESP and Brazilian generally accepted accounting practices and will therefore be more consistent with market practice. Accordingly, we restated our consolidated statement of profit or loss for the fiscal year ended December 31, 2022, in order to reflect Compass’s restated results. For more information, see “Presentation of Financial Information— Individual and Consolidated Financial Information—Restatement of Compass’s and Our 2022 Financial Information” and note 3.4 to our Individual and consolidated financial information included elsewhere in this current report. |
| (2) | Net debt consists of current and non-current debt (including preferred shareholders payable in subsidiaries), net of cash and cash equivalents, marketable securities and derivatives on debt recorded in our consolidated financial statements as other non-current assets. Net debt is a non-GAAP measure. |
| (3) | Working capital consists of total current assets less total current liabilities. |
| (4) | Reflects the Merger and the stock split undertaken on April 30, 2021 for all years presented as if it had occurred on January 1, 2020. For more information about the Merger and the stock split, see “Information on the Company—A. History and Development of the Company—History.” |
The information in the table below presents a reconciliation of Net debt, a non-GAAP financial measure, the most directly comparable IFRS financial measure. Our calculation of Net debt may differ from the calculation of similarly titled measures used by other companies. Our management believes that disclosure of Net Debt is useful to potential investors as it helps to give them a clearer understanding of our financial liquidity. Net Debt is also used to calculate certain leverage ratios. However, Net Debt is not a measure under IFRS and should not be considered as a substitute for measures of indebtedness determined in accordance with IFRS.
| As of December 31, | |||||||
|---|---|---|---|---|---|---|---|---|
| 2023 | 2022 | 2021 | |||||
| (in millions of reais, except where otherwise indicated) | |||||||
Current loans, borrowings and debentures | 4,882.4 | 4,542.2 | 4,241.4 | |||||
Non-current loans, borrowings and debentures | 52,022.3 | 48,445.0 | 41,417.7 | |||||
Total | 56,904.7 | 52,987.2 | 45,659.0 | |||||
Cash and cash equivalents | (14,658.5 | ) | (13,301.7 | ) | (16,174.1 | ) | ||
Current marketable securities | (3,407.9 | ) | (2,422.5 | ) | (4,372.7 | ) | ||
Noncurrent marketable securities | (96 | ) | (19,677.3 | ) | (15.3 | ) | ||
Total | (18,162.5 | ) | (35,401.5 | ) | (20,562.1 | ) | ||
Derivatives on debt, net (1) | 990.8 | 1,228.9 | (3,633.4 | ) | ||||
Net debt(1)(2) | 39,733.0 | 18,814.7 | 21,463.5 | |||||
| (1) | As of December 31, 2022, we started calculating Net Debt taking into account only derivatives on debt as opposed to the total amount of derivatives. |
| (2) | Our covenants consider preferred shareholders payable in subsidiaries in the calculation of net debt. |
Summary of Risk Factors
The following summarizes the principal factors that make an investment in our company speculative or risky, all of which are more fully described in the Risk Factors below. This summary should be read in conjunction with the Risk Factors below and should not be relied upon as an exhaustive summary of the material risks facing our business. The following factors could result in harm to our business, reputation, revenue, financial results, and prospects, among other impacts:
Summary of Risks Related to Our Businesses and the Industries in Which We Operate Generally
- The expansion of our business through acquisitions and strategic alliances creates risks that may reduce the benefits we anticipate from these transactions. Material liabilities associated with an acquisition could materially and adversely affect our reputation, business, operating results or financial condition.
- We may be unable to implement our growth strategy successfully. Our failure to achieve our expected growth may have a material adverse effect on our business, financial condition, results of operations and ability to repay our debt obligations.
- Climate change can create transition risks, physical risks and other risks that could adversely affect us. Transition and/or physical risks arising from climate change may adversely affect our business, financial condition and results of operations.
- Government policies and regulations could have a material adverse effect on our operations and profitability. Government policies in Brazil and elsewhere may adversely affect the supply, and demand for, and prices of, our products or restrict our ability to do business in our existing and target markets.
- We depend on our information technology systems. Any failure of our information technology systems to operate effectively or integrate with other systems, or inadequate performance of, or breaches of security regarding such systems could result in interruptions in the availability of our online resources.
- Our controlling group holds 672,312,942 or 35.87% of our common shares and voting rights. We are highly dependent on our chairman and other members of our management to develop and implement our strategy and to oversee our operations. If we lose key personnel, our business, financial condition and results of operations may be adversely affected.
- Our business would be materially adversely affected if operations experienced significant interruptions. The distribution of fuels, natural gas and other products is by its nature subject to inherent risks, including interruptions or disturbances in the distribution system which may be caused by accidents or force majeure events.
- Changes in taxes and other assessments may adversely affect us. The modification, suspension, cancellation or non-renewal of our tax benefits could have a material adverse effect on us.
- The ongoing war between Russia and Ukraine and conflicts in the Middle East may have a material adverse effect on the global and Brazilian economies as well as on us. As a company that operates globally, the adverse effects of the ongoing war between Russia and Ukraine and their adverse effects on the global economy and market conditions could have a material adverse effect on our business.
Summary of Risks Related to Our American Depositary Shares and Our Common Shares
- Our ADSs may not be as liquid as our common shares. Our maintenance of two listings may adversely affect liquidity for our common shares and ADSs and result in pricing differentials between them.
- Holders of our ADSs do not have the same voting rights as our shareholders. Furthermore, holders of our ADSs may face difficulties in serving process on or enforcing judgments against us and other persons. Holders of our ADSs may not be able to give voting instructions to the Depositary, withdraw our common shares underlying their ADSs to vote such shares, to exercise the preemptive rights relating to the common shares, or receive dividends or interest on own capital.
- The market price of our common shares and ADSs may be volatile. Broad general economic, political, market and industry factors may adversely affect the market price of our common shares and ADSs.
- We are a foreign private issuer and, as a result, in accordance with the listing requirements of the NYSE, we rely on certain home country governance practices from Brazil, rather than the corporate governance requirements of the NYSE. The standards that are applicable to us are considerably different than the standards applied to U.S. domestic issuers.
- Based on information presently available, we do not expect that we were a PFIC in 2023. However, this is subject to further evaluation when the Company’s audited consolidated financial statements for the year ended December 31, 2023 in accordance with PCAOB standards have been completed, and there is a risk that we were a PFIC for 2023 and that we will be a PFIC for 2024 or in future taxable years, which could result in adverse U.S. federal income tax consequences to U.S. investors in the ADSs.
Summary of Risks Related to the Countries in Which We Operate
- Our international operations expose us to political and economic risks in other countries. Our international activities expose us to risks not faced by companies that operate solely in Brazil.
- Historically, the Brazilian government has influenced and continues to influence the economy of Brazil, which may negatively affect our business and financial performance. Macroeconomic policies imposed by the Brazilian government can have a significant impact on market conditions, as well as on the business and the prices of securities issued by Brazilian companies such as us.
- The deterioration of economic and market conditions in other countries may have a negative impact on the Brazilian economy and on our business. The market for securities issued by Brazilian companies is influenced, to differing degrees, by global economies and market conditions, especially those of Latin American countries and emerging markets.
- The Brazilian political environment has historically influenced and continues to influence the performance of the country’s economy and the confidence of investors and the general public. The Brazilian economy has been and continues to be affected by political events in Brazil, which have also had an impact on the confidence of investors and the general public. Recently, Brazil has undergone high levels of political and economic volatility and instability, including the contraction of its gross domestic product, strong fluctuations of the real against the U.S. dollar, increased unemployment, and lower levels of spending and consumer confidence.
- Inflation and government measures to curb inflation may adversely affect the Brazilian economy, the Brazilian securities market, our business and operations, and the market prices of our shares. Brazil has experienced extremely high rates of inflation in the past and has therefore implemented monetary policies that have resulted in one of the highest interest rates in the world.
- Significant volatility in the value of the Brazilian real in relation to foreign currencies could harm our ability to meet our liabilities denominated in foreign currencies. Due to inflationary pressures and adjustments to economic policy, the Brazilian currency has historically experienced volatility against the foreign currencies.
- If we do not successfully comply with laws and regulations designed to prevent governmental corruption in countries in which we operate and sell our products (notably Brazil), we could become subject to fines, penalties or other regulatory sanctions, which could cause our sales and profitability to be materially reduced. Any breach of anti-corruption laws may have a material adverse effect on our business, financial condition and results of operations.
Risks Related to Our Businesses and the Industries in Which We Operate Generally
The expansion of our business through acquisitions and strategic alliances creates risks that may reduce the benefits we anticipate from these transactions.
We have grown substantially through acquisitions and intend to continue to grow by acquiring, or investing in, directly or indirectly, from time to time, businesses considered suitable by our management that are consistent with our values and which we believe are conducive to generating results. Additionally, we may enter into strategic alliances to increase our competitiveness in the markets in which we operate.
Despite our recent expansion, our management is unable to predict whether and when any new acquisitions or strategic alliances will occur or the likelihood that any particular transaction will be completed on favorable terms and conditions. Our ability to continue to expand our business through acquisitions or alliances depends on many factors, including its ability to identify acquisition opportunities or access capital markets on acceptable terms. Even if we are able to identify opportunities and obtain the resources necessary to do so, financing these acquisitions could result in an over-commitment on our part.
Acquisitions, particularly those involving sizeable enterprises, may bring managerial and operational challenges, including the diversion of management’s attention from existing operations and difficulties in integrating operations and personnel. Any material failure by us in integrating new businesses or in managing any new alliances may adversely affect our business and financial performance. Additionally, some of our major competitors may pursue growth through acquisitions and alliances, which may reduce the likelihood that we will be successful in completing acquisitions and alliances. In addition, any major acquisition we consider may be subject to antitrust and other regulatory approvals. We may not be successful in obtaining required approvals on a timely basis or at all.
Acquisitions also expose us to the risk of successor liability-related actions involving any acquired entity, their respective management or contingent liabilities incurred before the acquisition. The due diligence investigation conducted in connection with an acquisition, and any contractual guarantees or indemnities that we may receive from sellers of acquired companies, may not be sufficient to protect us from, or compensate us for, actual liabilities. Material liabilities associated with an acquisition, such as labor or environmental liabilities, could materially and adversely affect our reputation, business, operating results or financial condition, and reduce the benefits that we expect to result from such acquisition.
On October 14, 2022, our subsidiary Cosan Oito completed the acquisition of a noncontrolling interest in Vale. For more information about the risks related to the acquisition of the interest at Vale, see “—The financial investment by the Company in Vale involved a combination of complex transactions and involves financial risks” and “Risks Related to Vale.”
We may not successfully acquire or develop additional production capacity through greenfield projects or expansion of existing facilities.
We may explore growth opportunities in the future through the acquisition or development of greenfield projects or through the expansion of our existing facilities. We may be unable to complete these projects on a timely basis or at all, and may not realize the related benefits we anticipate. The factors which may prevent us from doing so include, among other things, (i) our failure to obtain environmental and other licenses; (ii) our inability to obtain supplies of appropriate equipment or raw materials; (iii) increases in costs and/or decreases in revenue; (iv) a lack of qualified workforce; (v) lack of service providers; and (vi) our inability to obtain any required financing on satisfactory terms, or at all.
Our greenfield projects and/or expansion of existing facilities require a significant number of service providers. Any inability on our part to enter into contracts with duly qualified service providers who are able to provide the technical services that we require may prevent us from completing our greenfield projects and/or expansions of existing facilities on a timely basis, or at all. In addition, the integration of greenfield projects or expansion of our existing facilities may result in unforeseen operating difficulties and may require significant financial and managerial resources that would otherwise be used for our current operations. Planned or future greenfield projects or expansions of existing facilities may not enhance our financial performance. Any failure in the implementation of growth projects and/or expansion of existing facilities may have a material adverse effect on our business, financial condition and results of operations.
We may be unable to implement our growth strategy successfully.
Our future growth and financial performance depend, in part, on the successful implementation of our business strategy, including (i) our ability to maintain our existing client base, increase volume from existing clients in specific markets and locations and attract new clients, (ii) our capacity to finance investments (through indebtedness or otherwise), or (iii) our ability to increase our operational capacity and expand our current capacity to supply to new markets, among others. We cannot assure you that we will be able to achieve these objectives and/or strategies successfully or at all. Our failure to achieve any of these objectives and/or strategies as a result of competitive difficulties, cost increases or restrictions on our ability to invest, among other factors, may limit our ability to implement our growth strategy successfully. We may need to incur additional indebtedness in order to finance new investments to implement our growth strategy. Unfavorable economic conditions in Brazil and in the global credit markets, such as high interest rates on new loans, reduced liquidity or reduced interest of financial institutions in granting loans may limit our access to new credit. Furthermore, failure to achieve our expected growth may have a material adverse effect on our business, financial condition, results of operations and ability to repay our debt obligations.
The ongoing war between Russia and Ukraine and conflicts in the Middle East may have a material adverse effect on the global and Brazilian economies as well as on us.
Russia’s invasion of Ukraine on February 24, 2022 marked the beginning of an ongoing war between the two countries which has materially affected the global economy and international relations. The conflict has already caused strong reactions from the United States, the United Kingdom, the European Union (“EU”), and other countries around the world, notably the members of the North Atlantic Treaty Organization (“NATO”), which have applied broad economic sanctions against Russia, including financial and trade measures. The United States, the EU, and the United Kingdom have taken measures against Russian businesses and governmental entities, the Russian central bank and others, such as sanctioning individuals with close ties to the Russian president, imposing visa restrictions on several oligarchs, as well as their family members and close associates, and blocking or freezing assets. In addition, several countries have already provided support to Ukraine, with the supply of financial resources, weapons and equipment, as well as other humanitarian aid, which may lead to the internationalization of the conflict.
The war has already resulted in significant volatility in the financial markets, depreciation of the Russian ruble and the Ukrainian hryvnia against the U.S. dollar and other currencies, and rising energy and commodity prices around the world. If the conflict continues or escalates, markets may face continued volatility as well as economic and security consequences, including but not limited to supply shortages of different products, further increases in commodity prices, including piped natural gas, higher energy prices, higher prices of foodstuffs, and market volatility, among others.
The potential consequences of the war for us include, without limitation:
- Appreciation of the U.S. dollar, which may increase the price of goods and services on which we depend and for which we pay certain of our obligations, and increase pressure on our margins and prices in general.
- Increased inflation in Brazil and measures by the Brazilian government and the Brazilian Central Bank to contain inflation, which could materially impact the cost of debt and third-party capital for our financing and investment activities.
- The increase in oil prices as a result of a more limited or less accessible supply of Russian oil globally may also lead to a decrease in our margins and an increase in the costs of acquisition of basic inputs, such as diesel fuel.
- Brazil is dependent on imports of Russian and Belarusian fertilizers. The failure to obtain sufficient quantities of fertilizer could adversely affect our business, notably the production of grains transported by Rumo and the production of sugarcane by Raízen.
- Limitations on international sales. For example, our lubricants business, “Moove” (consisting of Cosan Lubrificantes e Especialidades S.A., or “CLE,” Tirreno Indústria e Comércio de Produtos Químicos Ltda., or “Tirreno,” Stanbridge Group Limited, or “Stanbridge,” Moove Lubricants Limited, or “Moove Lubricants” (previously known as Comma Oil Chemicals Limited), TTA – SAS Techniques et Technologie Appliquées, or “TTA,” LubrigrupoII– Comércio e Distribuição de Lubrificantes, S.A., or “LubrigrupoII,” Cosan Lubricantes S.R.L, or “Cosan S.R.L.,” Commercial Lubricants Moove Corp, or “Moove Corp” (previously known as Commercial Lubricants, LLC (d/b/a Metrolube)), or “Metrolube,” and Millennium Moove Corp, or “Millennium,” which is the holding company of the PetroChoice subgroup within our group) exported certain of its products to Russia and Ukraine. These export sales were suspended during the first quarter of 2022.
- A recession in the Brazilian and/or global economies as a result of the events mentioned above could also have a material adverse effect on our business.
Other potential consequences include, but are not limited to, growth in the number of popular uprisings in the region, increased political discontent, especially in the regions most affected by the conflict or economic sanctions, increased cyberterrorism activities and attacks, an exodus from regions close to the areas of conflict and an increase in the number of refugees fleeing across Europe, among other unforeseen social and humanitarian effects.
In addition, on October 7, 2023, Hamas launched an attack on Israel killing hundreds of Israeli civilians. In response, Israel declared war against Hamas, targeting the Gaza Strip. The war is causing a humanitarian crisis and could lead to an escalation of the conflict in the region, rise in oil and gas prices, more inflationary pressures and market volatility, among others. In the aftermath of the conflict, there have been a number of attacks elsewhere in the Middle East, prompting fears that the conflict may spread. It is unclear whether these challenges and uncertainties will be contained or resolved, and what effects they may have on global political and economic conditions in the long term.
The effects of the war between Russia and Ukraine and the conflicts in the Middle East are ongoing, and its continuation or escalation could precipitate or aggravate the other risk factors identified in this current report, which in turn could further materially and adversely affect our business, financial condition, liquidity, results of operations and profitability, including in ways not currently known or considered by us to present material risks.
We may engage in hedging transactions which could have material adverse effect on our results.
We are exposed to market risks arising from the conduct of our business activities—in particular, market risks arising from changes in commodity prices, exchange rates or interest rates. In an attempt to minimize the effects of the volatility of prices and exchange rates on our cash flows and results of operations, for example, we engage in hedging transactions involving commodities and exchange rate futures, options, forwards and swaps. We also engage in interest rate-related hedging transactions from time to time. These transactions expose us to the risk of financial loss. In particular, Raízen enters into hedging transactions against market price fluctuations by fixing the prices of our sugar export volumes and exchange rates. Any fluctuations in market prices could therefore have a material adverse effect on our business, financial condition and results of operations. Alternatively, we may choose not to engage in hedging transactions in the future, which could have a material adverse effect on our financial performance during periods in which commodities prices decrease.
Climate change can create transition risks, physical risks and other risks that could adversely affect us.
Climate risk is a transversal risk that can be an aggravating factor for the types of traditional risks that we manage in the ordinary course of business, including without limitation the risks described in this “Risk Factors” section. Based on the classifications used by Task-Force on Climate-Related Financial Disclosures, we consider that there are two primary sources of climate change-related financial risks: physical and transition.
Physical risks resulting from climate change can be event-driven (acute) or long-term shifts (chronic) in climate patterns. Acute physical risks include increased severity of extreme weather events, such as drought, hurricanes or floods. Chronic physical risks include changes in precipitation patterns and extreme variability in weather patterns, rising mean temperatures, chronic heat waves or rising sea levels.
Especially in Brazil, rainfall patterns have been constantly changing, causing certain regions to experience rainfall volumes far above historical averages, resulting in floods and inundations and landslides in hillside and mountain regions. Such changes in rainfall patterns could have an adverse effect on our production and distribution capacity, affecting crop harvests as well as our ability to produce sugar and ethanol, generate energy, distribute our products and provide services to our customers. The occurrence of storms and floods may also influence the cost to insure our assets, especially those in high-risk regions, where storms, tornadoes and other extreme events are more pronounced. In periods of scarcity of rain, water deficiency occurs because of the decrease in the levels of water reservoirs, with an influence on the availability and costs of electric energy, considering the dependence on energy generated through hydroelectric plants, as well as on crop harvests. The scarcity of rains combined with low levels of reservoirs can lead governments and authorities to restrict industrial activities and direct water for human consumption. The increase in average temperatures may have an impact on our operating costs due to the greater demand for cooling and air conditioning to produce, store and transport some of our products. Historically, in periods of water scarcity, the Brazilian government authorizes an increase in the energy prices as a measure to stimulate the reduction of consumption, which can create inflationary pressure, with impacts on the income levels of the population in general, on production costs and on the final price of products, which consequently affects our revenues and results. Extreme and prolonged changes in rainfall patterns and an increase in temperatures can influence production cycles in certain regions, and droughts can influence the increase in fires and devastation, which may adversely affect our facilities. Additionally, they can also cause a reduction in revenue and an increase in costs due to negative impacts on our employees and suppliers, such as increased absenteeism and issues involving health and safety.
The impact of climate change poses tangible physical risks to the operations of certain of our subsidiaries, as follows:
- Rumo: Given its extensive railway network spanning various regions of Brazil, Rumo is susceptible to a range of physical risks that could potentially impact its operations. Any significant rise in temperature can lead to rail buckling, causing the tracks to deform and trains to derail, disrupting operations and jeopardizing the safety of employees and communities along the railway. In addition, forest fires could cause direct physical damage to railways, signaling equipment and railway crossing points, leading to interruptions in its operations. At terminals, cargoes requiring temperature control might necessitate additional cooling capacity, increasing energy usage and associated costs. Excessive rainfall may result in a deterioration in the conditions of railroads and an increase in transit time, which may lead to losses. Infrastructure deficiencies resulting from adverse weather conditions, among other things, may make it more difficult to conduct business in the areas in which Rumo operates. Additionally, Rumo has strong relationship with climate-dependent sectors, such as agribusiness, which may experience reduced or increased productivity due to climate effects.
- Moove: A growing number of extreme heat events could impact manufacturing, storage and logistics while posing a threat to employee well-being. High temperatures can adversely affect our workforce, leading to disruptions, health issues and increased accident risks, affecting the productivity of our operations. Other extreme weather events to which Moove may be exposed include (i) tropical cyclones that could disrupt supply chains and inflict damage on critical infrastructure; (ii) severe shifts in wind patterns that may increase the likelihood of port incidents, posing threats to the safety of employees and suppliers and compromising the receipt of inputs and impacting commercial relationships with suppliers; and (iii) flooding due to extreme rainfall, which could impair equipment, transportation networks, employee safety and the integrity of storage facilities.
- Compass: Compass’s operations may be susceptible to landslides caused by extreme rainfalls, which could lead to the rupture of buried pipelines or overhead crossings, resulting in fire-related incidents. Similarly, extreme rainfall and flooding could expose and damage buried pipelines. Furthermore, extreme wind and tropical cyclone events have the potential to disrupt or interrupt Compass’s operations.
- Raízen: The productivity and sucrose content of sugarcane are mainly influenced by climatic conditions such as rainfall and temperature. Therefore, a change in rainfall patterns in Brazil’s central and southern regions, home to Raízen’s operations, especially an increase in dry periods, could trigger a reduction in the amount of sucrose per planted area, impacting the final volume of sugar and ethanol produced.
- Transition risks refer to actions taken to address mitigation and adaptation requirements related to climate change. These risks can fall into various categories such as market, technology and market changes:
- Market risk may manifest through shifts in supply and demand for certain commodities, products, and services, as climate-related risks and opportunities are increasingly taken into account. In particular, as global efforts to combat climate change intensify, the market dynamics for various industries are undergoing a significant shift towards products and services with lower carbon footprints.
- Technology risk arises from improvements or innovations to support the transition to a lower-carbon, energy-efficient economic system that can have a significant impact on companies to the extent that new technology displaces old systems and disrupts some parts of the existing economic system.
- Policy actions generally fall into two categories—those that attempt to constrain actions that contribute to the adverse effects of climate change and those that seek to promote adaptation to climate change. The risk associated with, and the financial impact of, policy changes depend on the nature and timing of the policy change. The ongoing developments to establish a carbon-regulated market in Brazil could materially impact our financial condition and results of operations in the upcoming years. The implementation of a carbon pricing mechanism could entail additional costs, taxes and compliance-related expenditures. Moreover, it may require extra capital allocation for the adoption of low-carbon or green investments and may also impact prices to consumers.
These requirements may increase going forward as a result of the increasing importance of environmental matters, which could expose us to increased compliance costs and limit our ability to pursue certain business opportunities and provide certain products and services, each of which could adversely affect our business, financial condition and results of operations.
The impact of climate change poses tangible transition risks to the operations of certain of our subsidiaries, as follows:
- Raízen: Raízen’s traditional fuel distribution business may be significantly impacted by regulatory measures and changing consumer preferences reducing the demand for traditional fossil fuels, which could have an adverse effect on Raízen’s revenue and profit margins and require investments in operational adaptation. In 2016, the Brazilian Ministry of Mines and Energy (Ministério de Minas e Energia), or the “MME,” launched the “Renovabio” program, which aims to expand the production of biofuels through the sale of decarbonization credits (or “CBios”). Pursuant to Renovabio, the production of biofuels would generate CBios, which could in turn be purchased in the forms of quotas by fuel distributors, which could lead to an increase in operational and compliance costs and impact the margins of the companies involved. Furthermore, Raízen’s bioproducts, such as sugar, ethanol, second-generation ethanol (2G), biomethane and biogas, are marketed to international markets that are increasingly stringent in evaluating product sustainability, particularly in terms of emissions. The escalating international concern regarding emissions linked to products introduces a potential risk if Raízen fails to align with this prevailing trend and effectively manage its carbon emissions. Furthermore, both the traditional fuel and bioenergy solutions businesses could be adversely impacted by the rapid electrification of urban mobility, leading to potential declines in demand of fuel.
- Compass: Compass’s business could be adversely impacted by the growing emphasis on reducing carbon emissions due to a potential shift away from traditional natural gas as an energy source, in favor of cleaner energy sources in the long term. Failure to meet evolving market and customer behavior demands involves the risk of a shrinking market that could affect Compass’s revenues and financial condition.
- Rumo: Rumo’s operations in the logistics sector can be significantly impacted by the risk of transitioning costs, in the context of the evolving regulatory landscape and changes in costumer behavior towards sustainability and lower-carbon alternatives, including a potential shift in business and consumption preference towards “greener” transportation, such as electrification or alternative fuels. This shift may require Rumo to invest in new locomotives or adapt existing ones to align with lower-emission standards and market dynamics. In addition, regulation targeting the reduction of carbon emissions could significantly increase Rumo’s cost of compliance with evolving emission standards and novel product regulation may require investments in emission control technologies, fuel upgrades or other modifications to meet regulatory requirements.
- Moove: Moove’s business may be adversely impacted if Moove fails to develop innovative solutions that align with the emerging market demand for products with lower or zero carbon footprints and reduced environmental impact. Due to its operation in Europe and the United States, Moove may be subject in the future to stricter regulations on carbon-linked products.
We may face conflicts of interest in transactions with related parties.
We engage in business and financial transactions with our controlling shareholder and other shareholders that may create conflicts of interest between our Company and these shareholders. Commercial and financial transactions between our affiliates and us, even if entered into on an arm’s-length basis, create the potential for, or could result in, conflicts of interest. See “Major Shareholders and Related Party Transactions—B. Related Party Transactions.”
Technological advances could affect demand for our products and services or require substantial capital expenditures for us to remain competitive.
The development and implementation of new technologies may result in a significant reduction in the costs of the products and services we provide. We cannot predict when new technologies may become available, the rate of acceptance of new technologies by our competitors or the costs associated with such new technologies. Advances in the development of alternatives to the products and services which we currently sell could significantly reduce demand or eliminate the need for them.
For example, the development of alternative products to sugar, ethanol and natural gas may reduce the demand for our products or materially reduce the demand for ethanol or natural gas to be used as a source of energy, and the use of alternative sweeteners may adversely affect the overall demand for sugar in Brazil and abroad, which could have a material adverse effect on our business, financial condition and results of operations.
Any advances in technology which require significant capital expenditures to remain competitive or which otherwise reduce demand for our products and services will have a material adverse effect on our business and financial performance. Any other alternative products or technological advances which reduce demand for the products of our subsidiaries and joint ventures may have a material adverse effect on our results of operations and financial condition.
Any failure of our information technology systems could adversely affect our operating results and make us more susceptible to cyber threats, adversely affecting our business.
We depend on information technology systems for significant elements of our operations, including the storage of data and retrieval of critical business information. Our information technology systems are vulnerable to damage from a variety of sources, including network failures, malicious human acts, and natural disasters. Moreover, despite network security and back-up measures, some of our servers are potentially vulnerable to physical or electronic break-ins, computer viruses, and similar disruptive problems. Failures or significant disruptions to our information technology systems or those used by our third-party service providers could prevent us from conducting our general business operations. Any disruption or loss of information technology systems on which critical aspects of our operations depend could have an adverse effect on our business, results of operations, and financial condition.
Furthermore, we store highly confidential information on our information technology systems, including information related to our products. If our servers or the servers of the third party on which our data is stored are attacked by a physical or electronic break-in, computer virus or other malicious human action, our confidential information could be stolen or destroyed. Any security breach involving the misappropriation, loss or other unauthorized disclosure or use of confidential information of our suppliers, customers, or others, whether by us or a third party, may (i) subject us to civil and criminal penalties; (ii) adversely impact our reputation; and (iii) expose us to liability to our suppliers, customers, other third parties or governmental authorities, among others. Any such developments may adversely affect our business, financial condition and results of operations.
In addition, any failure of our information technology systems to operate effectively or integrate with other systems, or inadequate performance of, or breaches of security regarding, such systems could result in interruptions in the availability of our online resources, delays in delivering products or services and reduced efficiency in our operations. Each of these factors may adversely affect our businesses as well as their financial condition, results of operations and reputation. We also hold certain highly confidential personal and financial data relating to our customers in our information technology systems. Any failures in the information technology systems on which we depend or any breaches resulting in the unauthorized disclosure of the personal or financial data of our customers may adversely affect our business, financial condition, results of operations and reputation.
We were the target of a cybersecurity incident which disrupted our systems, and we could be the target of attempted cyber threats in the future, which could adversely affect our business.
We face various cybersecurity risks, including but not limited to penetration of our information technology systems and platforms by ill-intentioned third parties, infiltration of malware (such as computer viruses) into our systems, contamination (whether intentional or accidental) of our networks and systems by third parties with whom we exchange data, unauthorized access to confidential customer and/or proprietary data by persons inside or outside our organization and cyberattacks causing systems degradation or service unavailability that may result in business losses.
In addition, we may be subject to potential fraud and theft by cybercriminals, who are becoming increasingly sophisticated, seeking to gain unauthorized access to or exploit weaknesses that may exist in our systems. We continuously monitor and develop our networks and information technology infrastructure. We also conduct annual tests to prevent, detect, address and mitigate the risk of unauthorized access, misuse, computer viruses and other events that could have an impact on our security. However, we cannot guarantee that these measures will be effective in protecting us against cyberattacks and other breaches related to our information technology systems. Techniques used to gain unauthorized, improper or illegal access to our systems, our data or our customers’ data, to disable or degrade service, or to sabotage systems, due to constant evolution, can be difficult to detect quickly and are often not known until used on a target. Unauthorized parties may attempt to gain access to our systems or facilities through various means, including, among others, hacking into our systems or those of our customers, partners or vendors, or attempting to fraudulently induce our employees, customers, partners, vendors or other users of our systems to disclose usernames, passwords, financial information or other sensitive information, which may in turn be used to access our information technology systems. Certain efforts by third parties to access our information technology systems may be supported by significant financial and technological resources, making them even more sophisticated and difficult to detect. We have seen in recent years computer systems of businesses and organizations being targeted not only by cyber criminals, but also by rogue activists and states. Cyberattacks can cause the loss of significant amounts of customer data and other confidential information, as well as significant levels of liquid assets (including cash). In addition, cyberattacks could cause the shutdown of our information technology systems, including systems used to service our customers. We may also be subject to the effects of cyberattacks against critical infrastructure in Brazil and other countries in which we operate, and we have limited ability to protect our technology systems against such attacks.
If we fail to effectively manage our cybersecurity risk, for example, by failing to update our systems and processes in response to new threats, this could harm our reputation and adversely affect our operating results, financial condition and prospects through the payment of customer compensation, regulatory penalties and fines and/or the loss of assets. Furthermore, upon a failure to comply with applicable laws and regulations, we may be ordered to change our business practices, policies or systems in a manner that adversely impacts our operating results.
Moreover, critical infrastructures that our information technology systems rely on in Brazil and other countries in which we operate may be the target of cyberattacks, which could negatively affect our ability to service our customers.
Further, we store highly confidential information on our information technology systems, including personal data, financial information, and other types of information related to our products and customers. If our servers or the servers of the third parties on which our data is stored are the subject of a physical or electronic break-in, computer virus or other cyber risks, our confidential information could be stolen, rendered unavailable, devalued or destroyed. Any security breach involving the misappropriation, loss or other unauthorized disclosure or use of confidential information of our suppliers, customers, or others, whether by us or a third party, could (i) subject us to civil and criminal penalties, (ii) have a negative impact on our reputation or (iii) expose us to liability to our suppliers, customers, other third parties or government authorities.
We cannot assure you that our information technology systems will not be attacked in the future, that we will be able to adequately protect the confidential information we maintain. If we are the victim of successful cyberattacks or experience cybersecurity incidents in the future, we could incur substantial costs and suffer other negative consequences, such as remediation costs (liabilities for stolen assets or information or repairs of system damage, among others), increased cybersecurity protection costs, lost revenue from unauthorized use of proprietary information or the failure to retain or attract customers after an attack, as mentioned above, litigation and legal risks, increased insurance, reputational damage affecting the trust of our customers and investors, as well as damage to our competitiveness, stock price, and long-term shareholder value. Any failure by us to adequately protect our information technology systems and the confidential data which we hold could have a material adverse effect on our business, financial condition and results of operations. Importantly, even when a failure or disruption to our systems or facilities is resolved in a timely manner or an attempted cyber incident or other security breach is successfully prevented or thwarted, substantial resources are typically expended to do so, and we may be required to take actions that could negatively affect customer satisfaction or behavior and could pose a threat to our reputation.
On March 11, 2020, our subsidiaries and jointly controlled companies suffered a cyberattack by ransomware that caused a partial and temporary interruption of our operations, as widely disclosed by the Company at that time. Following the incident, we have taken certain additional precautionary measures to reduce cyber risks. We cannot assure you that our security frameworks and measures will be successful in preventing future cyberattacks. In addition, we expect that the cost to obtain cyber liability insurance in the future should we wish to do so (we do not currently have cyber liability insurance) will be higher than they would otherwise have been as a result of this incident.
Any of the above developments could adversely affect our business, as well as its financial condition, results of operations and reputation.
Failure to comply with the Brazilian General Data Protection Law may adversely affect our business.
Until the entry into force of Law No. 13,709/2018, or the Brazilian General Data Protection Law (Lei Geral de Proteção de Dados Pessoais), or the “LGPD,” the processing of personal data in Brazil was regulated by a series of rules scattered throughout legislation such as the Brazilian Federal Constitution, Law No. 8,078/1990, or the Consumer Protection Code, and the Brazilian Civil Framework for the Internet. The LGPD, which came into force on September 18, 2020, regulates practices related to the processing of personal data in Brazil, through a system of rules that impacts all sectors of the economy and establishes, among other measures, protection rights for the holders of personal data. In cases where the processing of personal data is permitted through legal bases, there are obligations and requirements related to information security incidents, such as leakage of personal data and transfer of personal data, as well as sanctions for non-compliance. In addition, the LGPD authorized the creation of the National Data Protection Authority (Autoridade Nacional de Proteção de Dados), or ANPD, which is responsible for developing guidelines and applying administrative sanctions in case of non-compliance with the LGPD. The administrative sanctions provided for in the LGPD (art. 52, 53 and 54), came into effect on August 1, 2021, under Law no. 010/2020; if we are not in compliance with the LGPD, we will be subject to the following sanctions, in isolation or cumulatively: (i) warning, with an indication of the deadline for adopting measures; (ii) fines of up to 2% of the revenue of the group’s last fiscal year, excluding taxes, up to an overall amount of R$50 million per violation; (iii) daily fines up to the limit referred to in item B; (iv) an incident disclosure obligation; (v) temporary blocking and/or deletion of personal data; (vi) partial suspension of the database to which the infraction relates for a period of up to six months, extendable for the same period, until the personal data processing is regularized; (vii) suspension of the exercise of the personal data processing activity to which the infraction relates for a period of up to six months, extendable for the same period; and (viii) partial or total prohibition from exercising activities related to data processing.
In addition to administrative sanctions, failure to comply with any provisions set forth in the LGPD has the following risks: (i) the filing of legal, individual or collective actions seeking compensation for damages arising from violations, based not only on the LGPD, but on sparse and sectorial legislation on current data protection; and (ii) the application of the penalties provided for in the Consumer Protection Code and the Brazilian Civil Framework for the internet by some consumer protection agencies, since they have already acted in this regard, even before the validity of the LGPD and the effective structuring of the ANPD, especially in cases of security incidents that result in breaches of personal data. Therefore, failures in the protection of personal data processed by us as well as failure to comply with the applicable legislation, including those related to cybersecurity incidents and other events of failures in our information technology systems, may result in high fines, disclosure of the incident to the market, elimination of personal data from the base and even suspension of activities, resulting in costs that may have an adverse and negative effect on our reputation, results, the value of our ADSs and our common shares.
Our performance depends on maintaining functioning labor relations with our employees and our compliance with labor laws. Any deterioration of those relations or increase in labor costs could adversely affect our business.
All of our employees are represented by labor unions. Our relationships with these organizations are governed by labor agreements or collective bargaining agreements which we negotiate with labor unions. Upon the expiry of such agreements, we are required to renegotiate new agreements with the applicable labor union. As part of these renegotiations, new terms and conditions may be established. In certain cases, these agreements may not be renewed, which could lead to strikes and/or stoppages in our activities and have an adverse impact on our business, financial condition and results of operations. Furthermore, since the enactment of Law No. 13,467/2017, labor agreements and collective bargaining agreements prevail over certain provisions of labor legislation, as stated in items I to XV, of Article 611-A, of the Consolidation of Brazilian Labor Laws (Consolidação das Leis do Trabalho), such as working time arrangements and the manner in which these are recorded, work breaks, and certain employer-specific internal rules, among others. As a result, employers may expand or reduce certain labor rights, provided this is done pursuant to the terms of labor agreements negotiated with unions and/or individual agreements negotiated with the respective employees.
Failure to comply with, obtain or renew the licenses and permits required for each of the sectors in which we operate may have a material adverse effect on us.
We are required to obtain specific licenses with respect to our terminals from the applicable environmental authorities, which are required in connection with the emission, ejection and emanation of products and by-products resulting from distribution activities. We are also required to obtain specific licenses and permits from governmental authorities for rural producers in order to carry out certain of our operations. Similarly, we are also required to obtain applicable licenses and comply with regulatory obligations for operations involving fuel and energy sectors. The laws and regulations which govern these licenses may occasionally require us to purchase and install costly pollution control equipment or to make operational changes to limit our impact on the environment and/or the health of our employees.
Any failure to comply with the terms of such laws, regulations and licenses and permits may result in significant financial penalties, criminal sanctions, revocation of operating licenses and permits, and/or the prohibition of certain of our activities. In addition, we may not be able to renew licenses that are currently in effect or obtain new licenses necessary to operate new ventures, which could affect our results or impact the development of our business plans, growth and expansion.
Contamination of our products and other related risks could adversely affect our reputation, leading to judicial and administrative proceedings and/or resulting in the closure of our production facilities.
Certain of our products may have adverse effects on consumers (including certain components, raw materials and supplies used to produce these products), including as a result of product contamination or subsequent errors in the production or distribution chain. Contamination of any of our products may result in a need for recalls or the beginning of legal and administrative proceedings against us, which may adversely affect our reputation, our business, the operation of our production facilities, our financial condition and our operating results. Any damage to our reputation could have a material adverse effect on us.
We are exposed to the possibility of losses related to natural disasters, catastrophes, accidents, fire, political, social and economic events and other events not in our control, which may have a material adverse effect on our business, financial conditions and results of operations.
Our operations are subject to certain risks that affect our properties, facilities, permanent passageways, rail banks and inventory, including, among others, fire, which may destroy machinery, equipment and facilities as well as client cargo being transported, explosions, fuel leaks and other flammable products as well as other environmental events, cargo loss or damage to railroads or cargo loading and unloading terminals, accidents, business interruptions due to political, social or economic events (whether local or international), civil unrest or other conflicts, labor claims, demonstrations by social and/or environmental groups or associations, strikes or work stoppages (of our own employees or of those linked to entities with which we have a relationship, such as port operators) disease outbreaks, pests, adverse weather conditions, and natural disasters, such as floods, may result in the loss of revenues, assumption of liabilities or cost increases. We are also subject to stoppages and blockades of highways and other public roads. Stoppages and blockages of highways and other public roads may adversely affect our business and results. Moreover, our operations may be periodically affected by crop shortfalls, landslides and other natural disasters.
Our transportation and handling of cargo exposes us to risks relating to catastrophes, mechanical and electrical failures, collisions and loss of assets. A portion of our freight activities involves petroleum products and other flammable materials, and the presence of such products may aggravate the effects of any catastrophe.
As our insurance does not cover all potential risks and losses we may incur, the occurrence of a natural disaster of large proportions, catastrophes, cyberattacks, pandemics, mechanical failures, loss of assets or any other of the events referred to above, and any resulting damage to our business, may have a material adverse effect on our business, operating results and financial condition, including as a result of civil, administrative and/or criminal sanctions relating to environmental liability.
We are exposed to credit and other counterparty risks of our customers in the ordinary course of our business.
We have various credit terms with various types of customers, including fuel distributors, wholesalers, retailers, trading companies and consumers of the energy which we generate or trade. Our customers have varying degrees of creditworthiness and are subject to different rules and regulations, which exposes us to the risk of nonpayment or other default under our contracts and other arrangements with them. In the event that a significant number of material customers default on their payment obligations, our cash flows, could be materially and adversely affected.
We are subject to restrictive covenants under our financing agreements.
We are subject to certain restrictive covenants based on certain financial and non-financial indicators which are set forth in the majority of the indebtedness and finance agreements to which we are a party. The majority of such covenants relate to requirements to comply with certain predetermined levels of leverage. A failure by us to comply with the restrictive covenants in our credit agreements as a result of adverse conditions in our business environment may trigger the acceleration of part of our indebtedness, limit our access to new credit facilities and adversely affect our business.
Failure to work within our financial framework could impact our ability to operate and result in financial loss.
Failure to accurately forecast or work within our financial framework could impact our ability to operate and result in financial loss. Trade and other receivables, including overdue receivables, may not be recovered, divestments may not be successfully completed and a substantial and unexpected cash call or funding request could disrupt our financial framework or overwhelm our ability to meet our obligations. An event such as a significant operational incident, legal proceedings or a geopolitical event in an area where we have significant activities, could reduce our financial liquidity and our credit ratings. Credit rating downgrades could potentially increase financing costs and limit access to financing or engagement in our trading activities on acceptable terms, which could put pressure on the group’s liquidity. In the event of extended constraints on our ability to obtain financing, we could be required to reduce capital expenditure or increase asset disposals in order to provide additional liquidity.
We may raise additional capital in the future, including by issuing securities, which may result in a potential dilution of equity investors’ stake in our shares, or by taking on additional indebtedness.
We may need additional funds in the future to implement our business strategy and may choose to raise them through the public or private placement of shares and/or other securities convertible or exchangeable into shares. Any such issuance of our securities may result in a decrease in the price of our common shares and/or ADSs and dilute our existing shareholders’ interests in our share capital. The raising of additional funds by means of the issuance of shares or securities convertible into shares may, under the terms of the Brazilian Corporation Law, be made to the exclusion of the preemptive rights of its shareholders, including investors in our shares, and may therefore dilute the financial investment of investors. We may also opt to raise additional capital by taking on additional indebtedness, which may require us to expend a significant additional portion of our cash flow on servicing indebtedness.
We are not insured against business interruption of operations and most of our assets are not insured against war or sabotage.
Our operations are subject to a number of hazards and risks. We maintain insurance at levels that are customary in our industry to protect against these liabilities; however, our insurance may not be adequate to cover all losses or liabilities that might be incurred in our operations. We do not maintain insurance coverage for any type of business interruptions of operations, including business interruptions caused by work stoppages. If, for example, our workers were to strike, the resulting work stoppages could have a substantial and adverse effect on us. In addition, we do not insure most of its assets against war or sabotage. Therefore, an attack or an operational incident causing an interruption of our business activities could have a material and adverse effect on our performance. Moreover, we will be subject to the risk that we may not be able to maintain or obtain insurance of the type and amount desired at reasonable rates. If we were to incur a significant liability for which we were not fully insured, it could have a materially adverse effect on our business, financial condition and results of operations.
We are highly dependent on our chairman and other members of our management to develop and implement our strategy and to oversee our operations.
We are dependent upon the ability and experience of a number of our key personnel who have substantial experience with our operations. Such key personnel include our chairman and controlling shareholder, other members of senior management and certain members of our board of directors. Many of our key personnel have worked for us for a significant amount of time or were recruited by us specifically due to their industry experience. It is possible that the loss of the services of one or a combination of our key personnel could have a material adverse effect on our business, financial condition and results of operations. In particular, our business is particularly dependent on our chairman, who is also our controlling shareholder. We currently do not carry any key-man insurance.
Our controlling group holds 672,312,942 or 35.9% of our common shares and voting rights.
Our controlling group, led by our ultimate controlling shareholder, has the power to indirectly control the Company, including the power to:
- elect a majority of our directors and appoint our executive officers, set our management policies and exercise overall control over our Company and subsidiaries;
- agree to sell or otherwise transfer his controlling stake in our Company; and
- determine the outcome of substantially all actions requiring shareholder approval, including transactions with related parties, corporate reorganizations, acquisitions and dispositions of assets, and dividends.
Currently, because of our share capital structure, our controlling group is able to control substantially all matters submitted to our shareholders for a vote or approval. The concentrated control will limit your ability to influence corporate matters and, consequently, we may take actions that our shareholders do not view as beneficial. Moreover, our controlling group may make decisions that are contrary to the interests of our other shareholders, and diverge from those of our minority shareholders. These may include actions to conduct acquisitions, divest assets, engage in new business partnerships and engage in new financings or similar operations. As a result, the market price of our common shares and ADSs could be adversely affected.
We may not be able to access the capital markets or secure bank financing in the amounts necessary to meet our financial obligations, investments objectives and execute our business strategy.
We rely on obtaining financing and refinancing of existing loans in order to operate our business, implement our strategy and grow our business. We need bank guarantees to obtain credit facilities and we typically need insurance guarantees in order to participate in court proceedings to which we are a party.
Our ability to obtain funding to finance our growth or operate our business depends on several factors, including our level of indebtedness and market conditions. Substantial volatility in the global capital markets, high interest rates, high inflation, unavailability of financing in the global capital markets at reasonable rates, the ongoing banking crisis in the United States and Europe, and credit market disruptions have had a significant negative impact on financial markets, as well as on the global and Brazilian economies. In particular, the cost of financing in the global debt markets has increased substantially, restricting the availability of funds in such markets. Substantial volatility in the financial and capital markets, the unavailability of financing at reasonable rates, recent and ongoing increases in inflation and interest rates in Brazil and globally, and disruptions in the credit market and increasing inflation in Brazil and the world’s largest economies may have a significant negative impact on overall conditions for fundraising.
If we are unable to obtain new financing or refinance existing loans when required, obtain or renew insurance guarantees on reasonable terms or at all, we may not be able to honor our financial obligations or exploit business opportunities.
Our governance processes, compliance policies and internal controls may not be sufficient to prevent regulatory penalties and reputation damage.
Our compliance and governance policies, which include the review of internal controls over financial reporting, may not be sufficient to ensure that we are able to comply with existing and future legal, regulatory (including applicable anti-corruption and antitrust laws), accounting and other corporate governance requirements and standards. Accordingly, we, our subsidiaries and our affiliates may be subject to violations of our code of conduct and anti-corruption policies, and cases of fraudulent behavior or corrupt or anti-competitive practices by employees, contractors or other agents.
In particular, given the complexity and breadth of our business, and the particular sensitivity of the industries in which we operate to anti-competitive practices, we cannot assure you that our processes, such as our governance and compliance programs as well as our internal controls, are sufficient to avoid risks of investigation of illicit or irregular conduct and possible penalties. Despite the existence of our internal procedures, we may be subject to, among other things, litigation, investigations, expenses, fines, administrative and criminal sanctions and penalties by different authorities (including arrests and coercive conduction of its representatives, employees, contractors or other collaborators), in addition to the loss of licenses, permits or other regulatory instruments necessary for its operations, search and apprehension, and damage to its image and reputation. The fuel sector, in particular, has been the subject of investigation by the Brazilian authorities, especially by the Brazilian Antitrust Authority and the Brazilian Federal Public Prosecutors’ Office. There are allegations of cartels involving price agreements in the fuel distribution sectors, and the Brazilian Antitrust Authority has been monitoring participants in these sectors in different regions of Brazil. Our fuel operations are subject to continued supervision and regular inspections, so there is a risk of being charged in administrative proceedings or notices of infraction (autos de infração) by the National Petroleum, Natural Gas and Biofuels Agency (Agência Nacional do Petróleo, Gás Natural e Biocombustíveis or “ANP”).
Failure to comply with the applicable rules and legislation may subject us, our subsidiaries, our affiliates, our employees, contractors or other agents, to, among other things, litigation, investigations, expenses, fines, loss of operating licenses, reputation damage, preventive arrest warrants, coercive measures and other applicable sanctions, penalties and damage, each of which may adversely affect our business, financial condition and results of operations.
We are subject to anti-corruption, anti-bribery, anti-money laundering and other international trade laws and regulations.
We are subject to anti-corruption, anti-bribery, anti-money laundering and other international trade laws and regulations. We are required to comply with the laws and regulations of Brazil and various jurisdictions where we conduct operations. In particular, we are subject to the Brazilian Anti-corruption Law No. 12,846, to the U.S. Foreign Corrupt Practices Act of 1977, or the “FCPA,” to the United Kingdom Bribery Act of 2010, as well as economic sanction programs, including those administered by the United Nations, the European Union and the United States, including the U.S. Treasury Department’s Office of Foreign Assets Control, or “OFAC.” The FCPA prohibits providing anything of value to foreign officials for the purposes of obtaining or retaining business or securing any improper business advantage. As part of our business, we may deal with entities and employees which are considered foreign officials for purposes of the FCPA. In addition, economic sanctions programs restrict our dealings with certain sanctioned countries, individuals and entities. Although we have internal policies and procedures designed to ensure compliance with applicable anti-fraud, anti-bribery and anti-corruption laws and sanctions regulations, potential violations of anti-corruption laws have been identified on occasion as part of our compliance and internal control processes. When such issues arise, we attempt to act promptly to learn relevant facts, conduct appropriate due diligence and take any appropriate remedial action to address the risk. Given the size of our operations and the complexity of the production chain, there can be no assurance that our internal policies and procedures will be sufficient to prevent or detect all inappropriate practices, fraud or violations of law by our employees, directors, officers, partners, agents and service providers or that such persons will not take actions in violation of our policies and procedures (or otherwise in violation of the relevant anti-corruption laws and sanctions regulations) for which we or they may be ultimately held responsible. Violations of anti-bribery and anti-corruption laws and sanctions regulations could have a material adverse effect on our business, reputation, results of operations and financial condition. In addition, we may be subject to one or more enforcement actions, investigations and proceedings by authorities for alleged infringements of these laws. These proceedings may result in penalties, fines, sanctions or other forms of liability and could have a material adverse effect on our reputation, business, financial condition and results of operations.
Government policies and regulations could have a material adverse effect on our operations and profitability.
Government policies in Brazil and elsewhere, in each case whether at the federal, state or local level, may adversely affect the supply and demand for, and prices of, our products or restrict our ability to do business in our existing and target markets, which could adversely affect our financial performance.
Agricultural production and trade flows are significantly affected by Brazilian federal, state and municipal, as well as foreign, government policies and regulations. Governmental policies affecting the agricultural industry, such as taxes, tariffs, duties, subsidies and import and export restrictions on agricultural commodities and commodity products, may influence industry profitability, the planting of certain crops versus others, the uses of agricultural resources, the location and size of crop production, the trading levels for unprocessed versus processed commodities, and the volume and types of imports and exports.
Pursuant to the Brazilian Federal Constitution, gas distribution services are the responsibility of the state government of each Brazilian state. Our natural gas distribution operations are currently concentrated in the states of São Paulo and Rio Grande do Sul. Our activities are regulated, respectively, by the ARSESP and by the State Agency for the Regulation of Delegated Public Services of the State of Rio Grande do Sul (Agência Estadual de Regulação dos Serviços Públicos Delegados do Rio Grande do Sul or “AGERGS”). Any changes affecting governmental policies and regulations regarding natural gas in these states (at the federal, state, or municipal level) may have a material adverse effect on our business, financial condition and results of operations.
In addition, oil and oil products have historically been subject to price controls in Brazil. Due to the increase in fuel prices in 2021, a legislative bill was introduced in the Brazilian Congress proposing to establish guidelines for the selling prices of gasoline, diesel and liquefied petroleum gas, or “LPG.” In addition, the legislative bill seeks to establish progressive export tax rates on crude oil. The legislative process related to such legislative bill has not progressed as of the date of this current report. Moreover, because Petrobras is the only supplier of domestically produced oil-based fuels in Brazil, and a government-controlled company, prices of oil and oil products are subject to the influence of the Brazilian government, resulting in potential inconsistencies between international prices and internal oil prices, which could adversely impact our business, financial results and results of operations.
We are subject to extensive environmental regulations and may be exposed to liabilities in the event we fail to comply with these regulations.
Our business activities in Brazil are subject to extensive laws and regulations concerning environmental protection, which impose on us various environmental obligations, such as environmental licensing requirements; standards for the release of effluents, management of solid waste, emission and discharge of hazardous materials, sugarcane burning and health and safety of our employees; protection of certain areas (including the Legal Reserve, areas of traditional indigenous and quilombolas communities, conservation units, archeological sites and permanent preservation areas); and the need for special authorizations for the use of water, among others.
Failure to comply with such laws and regulations (including a failure to obtain or maintain relevant environmental permits, as well as to comply with technical conditions imposed by environmental permits) may subject the violator to administrative fines, mandatory interruption of activities and criminal sanctions, in addition to the obligation to remedy and pay environmental and third-party damage compensation. In addition, Brazilian environmental law adopts a strict liability system for environmental damages, in connection with which a polluter is liable irrespective of whether the polluter was at fault or engaged in intentional misconduct, resulting in our joint and several liability for the obligations of our suppliers or customers, for example.
Brazilian law provides that separate legal personality may be disregarded where it would otherwise prevent the repayment of environmental damages. In such a situation, shareholders may be held personally liable for environmental liabilities.
If we become subject to environmental liability, any costs we may incur in connection with the indemnification against potential environmental damage would lead to a reduction in the financial resources that would otherwise remain at our disposal for current or future strategic investment, which may materially and adversely affect our business, results of operations or financial condition.
As environmental laws and their enforcement become increasingly stringent, our expenses for complying with environmental requirements are likely to increase in the future. Furthermore, the possible implementation of new regulations, changes in existing regulations or the adoption of other measures could cause the amount and frequency of our expenditures relating to environmental preservation to vary significantly compared to present estimates or historical costs. Any unplanned future expenses could force us to reduce or forego strategic investments, and as a result, could materially and adversely affect our business, results of operations or financial condition.
The occurrence of environmental damage may lead to the need to make significant financial resources available for both containment and repair of these damages. The occurrence of such events may also lead to a disruption in production due to intervention by government agencies. In either case, financial and/or image impacts may be significant. In addition, the creation of new regulations may lead to the need for greater expenses for environmental preservation. Furthermore, extensive environmental regulation can also lead to delays in the implementation of new projects as bureaucratic procedures for obtaining environmental licenses from various government agencies may take considerable time.
We are party to a number of administrative and judicial proceedings for alleged failures to comply with environmental and health laws, which may result in fines, shutdowns, obligations to remedy or contain the environmental damage caused or other adverse effects on our operations. Claims that give rise to administrative proceedings may also lead to civil or criminal claims against us and our subsidiaries. Our costs of complying with current and future environmental and health and safety laws, and our liabilities arising from past or future claims, could adversely affect our business or financial performance.
Raízen, Moove, Compass and WX Energy are subject to the application of regulatory penalties in the event of noncompliance with the terms and conditions of their respective authorizations, including the possible revocation of such authorizations.
Raízen performs generation activities in accordance with the regulations applicable to the energy sector and with the terms and conditions of authorizations granted by the Brazilian government through ANEEL. The duration of such authorizations varies from 20 to 35 years.
ANEEL may apply regulatory penalties to Raízen in the event of noncompliance with the authorizations or with the regulations applicable to the energy sector. Such penalties may include, depending on the seriousness of the infraction, warnings, fines (in some cases up to 2% of our revenues for the last 12 months), restrictions on Raízen’s operations, temporary suspension from participating in public bidding procedures to obtain new permissions, authorizations and concessions, prohibition from contracting with ANEEL, and revocation of its authorizations.
In addition, Raízen conducts its fuel distribution activities and Moove manufactures and distributes lubricants and base oil in accordance with the rules and regulations applicable to the oil and gas sector in Brazil as well as with the terms of the licenses and permits granted to them by the Brazilian government acting through the ANP. Failure to comply with the applicable rules and regulations or with the terms of the relevant licenses and permits may result in fines and other penalties (including confiscation or destruction of products, cancellation of product registrations, bans on certain facilities, and revocation of existing licenses and permits, among others). The applicable fines vary between R$5 thousand and R$5 million, depending on the gravity of the infraction, the economic capacity of the noncompliant party and recidivism.
Furthermore, the electricity trading operations of WX Energy Comercializadora de Energia Ltda., or “WX Energy,” which Bioenergia Barra Ltda., a wholly-owned subsidiary of Raízen Energia, acquired on July 5, 2018, and Compass Comercialização S.A., or “Compass Comercialização,” which was acquired on January 31, 2020, are highly regulated and supervised by the Brazilian government, including through ANEEL as well as other regulatory authorities. Such regulatory authorities have discretionary authority to implement and change policies, interpretation and rules applicable to different aspects of WX Energy and Compass Comercialização’s businesses, especially their operations, maintenance, safety, compensation and inspection. Any significant regulatory measure implemented by the competent authorities may impose a significant burden on both companies’ activities.
We cannot assure you that Raízen, Moove, Compass Comercialização and WX Energy will not be penalized by ANEEL, ANP or other federal, state or local regulatory authorities, as applicable, nor can we assure you that they will comply with all terms and conditions of their authorizations and with the regulations applicable to their respective businesses, which may have a material adverse effect on their and our business, financial condition and results of operations.
We face significant competition, which may have a material adverse effect on our market share and profitability.
The ethanol and sugar industries in which Raízen operates are highly competitive. Internationally, Raízen competes with global ethanol and sugar producers in the United States, India, Thailand, Australia and Europe, among others. Some of Raízen’s competitors are divisions of larger enterprises and may have greater financial resources than Raízen has or than we have. In Brazil, Raízen competes with numerous small to medium-size producers. The Brazilian ethanol and sugar industry remains highly fragmented. Raízen’s major competitors in Brazil are Tereos - Guarani, Bunge, Santa Terezinha and São Martinho, among others. Each of these producers markets ethanol and sugar products through the Cooperative of Sugarcane, Sugar and Ethanol Producers of the state of São Paulo (Cooperativa de Produtores de Cana-de-açúcar, Açúcar e Álcool do Estado de São Paulo), or “Copersucar.” Copersucar consists of producers in the states of São Paulo, Minas Gerais and Paraná. Raízen is not a member of Copersucar.
Raízen also faces strong competition from international producers, particularly in highly regulated and protected markets such as the United States and the European Union. With regard to sugar exports, Raízen faces intense competition from producers all around the world, including India, Thailand, and the European Union, among others. There are global producers of sugar whose costs are lower than those of Brazilian producers, including Raízen, and whose production capacity and prices could lead to a decrease in prices on the global sugar market. Furthermore, Raízen faces very strong competition internationally with regards to ethanol, especially from the United States. Ethanol production in the United States is based on corn-derived ethanol and is undertaken on a larger scale than Brazilian ethanol production. Accordingly, a reduction in corn prices may lead to material reductions in the price of ethanol produced in the United States and result in increased competition in the Brazilian market.
Historically, imports of sugar have not provided substantial competition for us in Brazil due to, among other factors, the production and logistical cost-competitiveness of sugar produced in Brazil. If the Brazilian government were to create incentives for sugar imports, Raízen could face increased competition in the Brazilian market by foreign producers. Many factors influence our competitive position, including the availability, quality and cost of fertilizer, energy, water, chemical products and labor. Some of our international competitors might have greater financial and marketing resources, larger customer bases and broader product ranges than Raízen does. If Raízen is unable to remain competitive with these producers in the future, its market share may be adversely affected.
The fuel distribution market in Brazil in which Raízen operates is active and highly competitive. For example, we compete with domestic fuel distributors who purchase substantially all of their fuel from Petrobras and from suppliers based outside of Brazil. There are few domestic participants, such as Vibra, Ipiranga and Raízen, who import fuels into Brazil. In addition, Raízen competes with producers and marketers in other industries that supply alternative forms of energy and fuel to satisfy the requirements of Raízen’s industrial, commercial and retail consumers. Certain measures currently being taken by participants in the fuel distribution market, including the expansion of their distribution networks, as well as the arrival of new participants, may result in an increase in fuel supply and a consequent decrease in fuel prices, which may have an adverse effect on our business, financial condition and results of operations. Raízen’s main competitor in Argentina is state-owned YPF, which has more than half of the market share in the country.
Moove’s main competitors in the global lubricant market are larger and have substantially greater resources than Moove. Because of their larger capitalization, these companies may be more flexible in responding to volatile industry or market conditions, such as shortages of base oil and other feedstock or intense price fluctuations. The actions of Moove’s competitors could lead to lower prices or reduced margins for Moove’s products, which could have a material and adverse effect on Moove and on our business, results of operations and financial performance.
Competition in the transportation services industry in which Rumo operates is intense and includes: (i) competition with other transportation modes, such as road freight; (ii) competition with alternative export options for agricultural products through other ports; (iii) dependence on operating quality and port and terminal capacity; (iv) the limitations established by the maximum tariffs established by the ANTT; (v) a reduction in road tariffs, particularly during times of declining growth rates in the economy or low demand from agricultural producers, which may limit our ability to maintain or increase rates, operating margins or growth of Rumo’s business; and (vi) establishment of cooperative relationships by Rumo’s competitors to increase their ability to address shipper needs. Rumo’s main competitors are companies in the truck transportation business, which has historically been the main cargo transportation mode in Brazil. Any new measures by the Brazilian government that benefit or reduce costs for road transportation, such as cheaper toll fares or permanent suspension of the toll-road concession program, may also limit Rumo’s growth prospects. Rumo may also face significant competition from third parties if the granting authority decides to subject its maturing concessions to a rebidding process.
The intense competition in the Brazilian markets in which we operate and the actions of our competitors could lead to lower prices or reduced margins for the products we sell, as well as reductions in our sales volumes, which could have a material and adverse effect on our business, results of operations and financial performance.
Raw material and supply service costs are subject to fluctuations that could have a material adverse effect on our business, financial condition and results of operations.
Raw materials used in our business and the costs of services in connection with our operations are subject to wide fluctuations depending on market conditions and government policies. For example, Compass’s distributors and Raízen’s distribution of natural gas and the procurement of agricultural inputs are subject to developments in the international energy and commodity markets, to Brazilian trade and other governmental policies, and to the policies of foreign governments, among other factors. The prices charged our various businesses for inputs and services are influenced by several factors over which we have little or no control, including, but not limited to, international and national economic conditions, regulations, government policies, the actions of our counterparties, tariff adjustments and global effects of supply and demand, particularly in commodity prices. We cannot assure you that we will be able to pass on any increased costs to our customers, which could decrease our profit margin and result in a material adverse effect on our business, financial condition and results of operations.
Furthermore, the COVID-19 pandemic, the war between Russia and Ukraine and conflicts in the Middle East have disrupted supply chains and international trade generally, affecting in particular the supply of fertilizer globally and in Brazil. Brazil depends to a significant extent on imports of Russian and Belarusian fertilizer, which have been severely disrupted. Raízen may be unable to obtain fertilizer (in particular nitrate) on favorable terms, sufficient quantities or at all, which could make agricultural production less efficient (potentially resulting in reduced output) or result in increases in costs (including as a result of the need to purchase other types of fertilizers). In addition, failure to obtain sufficient amounts of fertilizer may result in a reduction in grain production, which could affect Rumo’s transported volumes. Rumo has also purchased railroad tracks from Russian companies in the past. While we expect that Rumo will be able to source these tracks from other, non-Russian suppliers if needed, the prices charged and terms demanded by these alternative suppliers may not be as favorable as those which Rumo has obtained in the past. Any of these developments could have a material adverse effect on our business, financial condition and results of operations.
The fuel, natural gas, and base oil distribution businesses are concentrated in a single supplier.
Significant interruption in sales of fuels, natural gas and lubricants by us may occur if there is an interruption in the supply by our only supplier, Petrobras. Any interruption would immediately affect our ability to supply products to their customers. If we are unable to obtain adequate supply from Petrobras on acceptable terms, we may seek to cover their demands through purchases in the international market. The cost of products in the international market may be higher than the price obtained through the supplier.
Any interruption could increase our purchasing costs and reduce our sales volume, consequently adversely affecting our operating margins. In addition, we may be adversely affected if Petrobras significantly modifies its business plan or reduces its activities related to the distribution of fuel in Brazil. In particular, the current divestment plan of Petrobras suggests that Petrobras is scaling back its positions in refining and logistics, which may result in disruption of logistics services and changes to distribution policies, which may adversely affect the competitiveness of fuel distributors.
We are subject to developments affecting the Brazilian agribusiness sector as a whole.
We cannot assure you that in the future, the Brazilian agribusiness sector (i) will maintain the growth rate and development which it has experienced in recent years and (ii) will not suffer losses due to unfavorable climatic conditions, reduction of the prices of the agricultural commodities in the national and international markets, changes in credit policies for domestic producers, both by government agencies and private entities, that may affect our income, as well as other economic and political crises that may affect the agricultural industry in general. Any deterioration in the overall condition of the Brazilian agribusiness sector may have a material adverse effect on us.
We may be adversely affected by unfavorable outcomes in pending legal proceedings.
We are involved in a significant number of tax, civil (including regulatory and environmental) and labor proceedings. We cannot predict whether we will prevail in these or other proceedings, or whether we will have to pay significant amounts, including penalties and interest, as payment for our liabilities, which would materially and adversely impact our business and financial performance.
In addition, unfavorable decisions in criminal proceedings involving members of our management may have a material adverse effect on us. Certain members of our management have been named as defendants in criminal proceedings (i) in their capacity as officers of the predecessor entity of Raízen Energia for alleged artificial price fixing of fuel and the formation of a cartel with the purpose of establishing control over the regional market, (ii) in their capacity as officers of Raízen Energia and in our Company for alleged tax evasion carried out by these entities and (iii) in their capacity as officers of the predecessor entities of Raízen for the crimes of disobedience and pollution in connection with the alleged burning of sugarcane contrary to a judicial decision. In the event of a final non-appealable conviction, one or more of these officers may be barred from holding executive positions within our Company, and depending on the development of the proceedings, our reputation in the opinion of our clients, suppliers and investors may be materially adversely affected.
We cannot predict whether we will prevail in these or other proceedings, or whether we will have to pay significant amounts, including penalties and interest, as payment for our liabilities, which would materially and adversely impact our business, financial condition and results of operations. If we are the subject of an unfavorable outcome in any of these legal proceedings, the amount of such unfavorable decisions will have a material adverse effect on our financial position and operating results.
Furthermore, we may not have sufficient funds to post collateral or provide guarantees in judicial or administrative proceedings involving substantial amounts. Even if we do not post such collateral or provide guarantees, we will be liable for paying any amounts due pursuant to any unfavorable outcomes in legal proceedings. We cannot assure you that, if we cannot make such payments, our assets, including financial assets, will not be attached or that we will be able to obtain tax good-standing certificates, all of which may have a material adverse effect on our business, financial condition and results of operations.
Our business would be materially adversely affected if our operations, as well as those of our suppliers and customers, experienced significant interruptions.
The distribution of fuels, natural gas and other products is by its nature subject to inherent risks, including interruptions or disturbances in the distribution system which may be caused by accidents or force majeure events. Our operations are dependent upon the uninterrupted operation of our terminals and storage facilities and various means of transportation and distribution facilities. Our operations are subject to risks affecting our agricultural properties and facilities and distribution networks, including fire potentially destroying some or all of our crop and facilities, and our operations are subject to hazards associated with the manufacture of flammable products and transportation of raw materials and flammable products. In addition, we are dependent upon the uninterrupted operation of certain facilities owned or operated by our suppliers and customers.
Operations at our facilities and at the facilities owned or operated by our suppliers and customers could be partially or completely shut down, temporarily or permanently, as the result of any number of circumstances that are not within our control, such as:
- catastrophic events, including hurricanes, floods and fire;
- environmental matters (including environmental licensing processes or environmental incidents, contamination, wildlife preservation obligations and others);
- labor difficulties (including work stoppages, strikes and other events);
- changes to legislation; and
- disruptions in the supply of our products to our facilities or means of transportation.
The occurrence of any such catastrophic event, or any significant interruption at these facilities or inability to transport products to or from these facilities or to or from our customers for any reason could subject us to liability in judicial, administrative or other proceedings, even for disruptions caused by events outside of our control. In addition, our insurance coverage may not be sufficient to provide full protection against these types of casualties. If we are held liable for such events, our business, financial condition, results of operations and cash flow would be materially adversely affected.
Volatility in the price of the products we sell, through subsidiaries and joint ventures, may have a material adverse effect on us.
Our results of operations may be significantly affected by volatility in the prices of the products we sell, through subsidiaries and joint ventures. The prices of these products are subject to significant fluctuation as a result of domestic and international demand, production volumes and global stock levels. Price volatility may have a significant impact on our results of operations, particularly if our revenues fall below our production costs.
The prices at which our subsidiaries and joint ventures are able to sell their products depend on market conditions, both in Brazil and internationally, which are outside of our control. The prices at which our subsidiaries and joint ventures are able to sell their products have a significant impact on our results of operations. As is the case with other commodities, the prices of the products we sell, through subsidiaries and joint ventures, are subject to significant fluctuation as a result of natural disasters, harvest levels, agricultural investments, governmental policies (in particular with regard to the agricultural sector), trade policies, changes in supply and demand patterns, increases or decreases in purchasing power, the production of similar or competing products and other factors beyond our control. A significant portion of our products are also traded on commodities exchanges and their prices may therefore be affected by speculation on financial markets.
The price of sugar is also affected by the obligation to comply with certain requirements relating to exports and the consequent effects on supply within Brazil. As a result, the price of sugar has historically been subject to greater volatility than the prices of other products. Sugar prices may decrease as a result of, directly or indirectly, competition from alternative sweeteners, including saccharine and high fructose corn syrup, changes in agricultural policies or international or Brazilian trade policies (including those mandated by the World Trade Organization).
Any significant or prolonged decrease in the price of sugar and/or ethanol may have adverse effects on our business, financial condition and results of operations.
Our activities are inherently hazardous and involve high operational risk.
Through our subsidiaries, we produce, store and transport toxic, combustible and inflammable products, including petroleum and gas products. The complex manufacturing operations performed at (i) Raízen’s facilities (mills, terminals and its refinery in Argentina), (ii) Comgás (infrastructure used in the distribution of piped natural gas), (iii) Moove (a lubricants oil blending plant) and (iv) Rumo (storage terminals, ports and railcars) involve a variety of safety and other operating risks, including the handling, production, storage and transportation of toxic materials. These risks can result in personal injury, death, severe damage to or destruction of property, plant and equipment, and environmental damage. A major accident at one of our subsidiaries’ facilities could force us to suspend operations and result in significant compensation costs, loss of revenue and reputational damage.
Railroad transportation is an activity, which is carried out by Rumo, that involves risks relating to mechanical failures, derailments or other accidents that could interrupt the network of railroads and result in the payment of fines, damages to locomotives and wagons and loss of the product transported, which could result in significant financial losses and reputational damage for us. These accidents may also expose nearby communities to risks of life, personal injuries, or significant damages to property and the environment. The occurrence of any of these events may have a material adverse effect on our business, financial condition and results of operations. Furthermore any contamination of the soil or underground may subject our subsidiaries to administrative sanctions, including, but not limited to, suspension, shutdown, mandatory payment of fines and other expenses, or an obligation to materially alter or cease particular operations, in addition to subjecting them to criminal and civil proceedings in case of environmental damages, which include the obligation to repair and/or indemnify the contaminated area for any damages caused to the environment, public health and third parties. The proximity of our operation and storage sites to populated areas, including residential, commercial and industrial facilities, may also increase our risk exposure.
In Brazil, there is a wide range of regulations, norms, and standards that regulate the handling, storage, use, transportation, and marketing of products considered hazardous. Failure to comply with these regulations may result in the filing of administrative proceedings against these companies and the payment of fines, penalties or obligations to indemnify, as well as other sanctions.
The costs associated with complying with current and potential legislation relating to environmental protection, health and safety and liabilities incurred in connection with the leakage or exposure to harmful substances are substantial. Any increase in such costs could have a material adverse impact on our business, results of operations and financial standing of our subsidiaries.
We may also not receive insurance proceeds, if available, in a timely manner and these may be insufficient to cover all losses, including lost profits. Equipment breakdowns, natural disasters and delays in obtaining necessary replacement supplies may also have a material adverse effect on our business, financial condition and results of operations.
In Brazil and the other markets in which we operate, there are a wide range of regulations, norms and standards that regulate the handling, storage, use, transportation and marketing of products considered hazardous. Failure to comply with these regulations may result in the filing of administrative proceedings against these companies and the payment of fines, penalties or obligations to indemnify, as well as other sanctions.
The shareholders’ and certain other definitive agreements with respect to the Joint Venture and certain other of our subsidiaries are subject to various put and call options and termination provisions.
We have entered into certain definitive agreements with Shell with respect to the Joint Venture, Raízen. Specifically, these agreements set forth the rights and obligations of each shareholder in respect of our and Shell’s interest in the Joint Venture and establish certain options whereby we or Shell may acquire the other shareholder’s interest in the Joint Venture, certain lock-up provisions, rules governing intra-group transfers regarding our economic group and Shell, and remedies for fundamental breaches of the documentation governing the incorporation and operation of the Joint Venture. If triggered, these provisions may cause the Joint Venture, or our participation in it, to terminate prior to the scheduled expiration date of certain of the agreements in June 2031.
In November 2016, we executed amendments to certain agreements with Shell to remove the fixed-date call options over Raízen S.A. shares exercisable in 2021 and 2026 and replace them with certain call and put options exercisable by us or Shell in certain circumstances, including, among others, (1) fundamental breaches of the obligations provided for in the agreements governing the Joint Venture, (2) breach of anticorruption laws, (3) insolvency or bankruptcy of a party, (4) change of control and (5) in the event of the death or disability of our current Chairman, Mr. Rubens Ometto Silveira Mello or if he fails to attend meetings of the board of directors of Raízen for 12 consecutive months. Moreover, we granted Shell a call option that is applicable if we fail to comply with certain obligations agreed upon with Shell or if certain of Raízen’s or our financial indices are not met.
We also granted Shell a call option that can be exercised by Shell if a controlling company (referred to as a “Controlling Entity”) fails to (1) have a CEO for a period exceeding six months, (2) publish or prepare, as required by law, its financial statements under the terms and conditions agreed in the Joint Venture Agreement, or (3) if Cosan or a new shareholder of Cosan (referred to as a “New Cosan Shareholder”), as applicable, with respect to a joint venture entity (referred to as a “JV Entity”), fails to (i) appoint members to the executive board or (ii) propose names of candidates for the position of CEO of Raízen within the period provided for in the Shareholders’ Agreements. Lastly, there is a call option granted by us to Shell in the event of an involuntary delisting or involuntary suspension of the registration, as a publicly held company, of Cosan or any successor thereof.
We and Shell further agreed to renew the existing lock-up period for five years from the date of the execution of the amendment, following which the parties may sell their shares in Raízen S.A. subject to compliance with certain preemption rights in each other’s favor.
In May 2021 and July 2021, we executed amendments to certain agreements in anticipation of Raízen’s initial public offering, which was completed in August 2021. As part of these amendments, the lock-up period referred to above was renewed for an additional five years from July 2021. The call and put options described above remained the same.
We are also parties to shareholders’ agreements, partnership agreements, association agreements and other related agreements in relation to a number of other businesses, as described under “Major Shareholders and Related Party Transactions—A. Major Shareholders.” If any of the provisions described above or other similar provisions are triggered under the shareholders’ agreements or any of the other related agreements relating to the Joint Venture or our other businesses, our partnerships, or certain rights we hold in connection therewith, could terminate prior to the scheduled expiration, which could adversely affect our results of operations.
The modification, suspension, cancellation or non-renewal of the tax benefits which we have been granted could have a material adverse effect on us.
We benefit from certain federal, state and municipal tax incentives, benefit programs and special regimes, including reductions in corporate income tax, suspensions of PIS and COFINS (respectively, the profit participation contribution and the social security financing contribution, both of which are social contributions due on certain revenues net of some expenses on certain products, reductions in ICMS on certain activities, and suspensions or reductions in certain other taxes (including import duties, tax on industrial products (Imposto sobre Produtos Industrializados) and certain other social security charges). We cannot assure you that these tax benefits will be maintained or renewed or that we will be able to obtain new tax benefits. If we lose our existing tax benefits due to our noncompliance with future requirements or if the current tax programs and agreements from which we benefit are modified, suspended, canceled or not renewed, we could be materially and adversely affected.
Public health threats or outbreaks of communicable diseases, such as the COVID-19 virus and others, could have an adverse effect on our operations and financial results.
We may face risks related to public health threats or outbreaks of communicable diseases. The outbreak of communicable diseases could result in a widespread health crisis that could adversely affect the global economy and our ability and our business partners’ ability to conduct business in Brazil for an indefinite period of time. For example, the early 2020 outbreak in China of COVID-19 that spread across the globe and resulted in a global and regional economic slowdown, a shutdown of production and supply chains and a disruption of international trade, negatively impacting the industries in which we operate.
Disruptions in public and private infrastructure, including communications and financial, could materially and adversely disrupt our normal business operations. During the COVID-19 pandemic, we transitioned a significant subset of our employee population to a remote work environment in an effort to mitigate the spread of COVID-19, which lasted until the first semester of 2021. Starting in the second semester of 2021, we adopted a flexible working model with three formats: (i) in-person - aimed at professionals who wish to work entirely in the office; (ii) hybrid - focused on professionals who wish to balance their routine between the office and other environments; and (iii) remote - a model carried out primarily at home. Remote work may cause certain risks to our business, including an increased demand for information technology resources, increased risk of phishing and other cybersecurity attacks, and increased risk of unauthorized dissemination of sensitive personal information or proprietary or confidential information about us, our hub partners, our students or other third parties.
The potential impact of any future health outbreak, epidemic or pandemic, and the measures that may be taken to control such outbreak by government and businesses, cannot be predicted and are beyond our control and it is possible that any such future outbreak could have an adverse effect on our business and results of operations.
We may not be successful in meeting our environmental, social and corporate governance, or ESG, commitments, which may have an adverse effect on our business, financial condition, reputation and results of operations.
The market is increasingly concerned with how companies assess and manage ESG risks to protect themselves and create opportunities to generate value. As part of this trend, we have made certain ESG commitments, and we strive to maintain socially responsible business practices, including fostering social investments and structuring programs to generate a positive social impact through in areas related to our business, such as renewable energy, employability, education, and culture. Failure to meet our ESG commitments or to pursue these socially responsible business practices, partially or at all, may have a material adverse effect on our business, reputation, financial condition and results of operations.
There has been an increase in ESG rules and regulations applicable to our business and we expect this tendency to continue. Given the pace of legislative developments in this area, we may not be able to comply with the new regulations in their totality. We are also exposed to the risk that future ESG rules and regulations may adversely affect our ability to conduct our business by requiring us to reduce the value of our assets or reduce their useful life, facing increased compliance costs or taking other actions that may be adverse to us.
The activities of Raízen, Rumo, Moove and Compass may impact the lives and socioeconomic dynamics of communities, especially those neighboring our operating units, bioenergy parks, service stations and franchisees. These impacts may include truck, train, vehicle and pedestrian traffic, construction, property expropriation, and the displacement of communities. As a result, there may be stoppages in our operations by virtue of demonstrations in surrounding communities, as well as investigations and judicial measures by public prosecutors and other authorities. Such demonstrations or investigations may be motivated by a lack of dialogue with the communities surrounding our units.
In addition, our suppliers or dealers may engage in conduct that violates human rights and for which we may be held liable in civil, labor, criminal and administrative proceedings, including for damages and remediation costs. As a result, we may face difficulties in obtaining or maintaining operating licenses, and their reputation may be negatively affected.
We operate in sectors in which market demand and prices are cyclical and affected by weather and economic conditions in Brazil and worldwide.
The sectors in which we operate are historically cyclical and sensitive to internal and external changes in supply and demand. Rainfall and temperature levels, which may vary and may be influenced by global climate changes, may cause significant volatility in the sectors in which we operate and adversely affect our business. Furthermore, Raízen’s business is subject to seasonality according to the sugarcane growth cycle in the Central-South region of Brazil. The annual sugarcane harvesting period in the Central-South region of Brazil begins in April or May and ends in November or December. This creates fluctuations in Raízen’s inventory and in its ability to generate energy, both of which usually peak in December, to cover sales between crop harvests (primarily from January to March), and a degree of seasonality in our gross profit, with ethanol and sugar sales significantly lower in the quarter ended on December 31. Rural producers of sugar and ethanol with whom Raízen maintains a commercial relationship may experience a similar degree of seasonality, which may impact the supply of ethanol and/or other products necessary for Raízen’s activities. Seasonality and any reduction in the volumes of sugar recovered could have a material adverse effect on our business, financial condition and results of operations. Raízen is also subject to seasonality with respect to demand for the energy which it generates and sells. Specifically, demand for energy is subject to various factors which vary from season to season according to the type of customer, geographical location and consumption type (e.g., residential, commercial or industrial), among other factors, and demand for energy and trading activities may be affected by variations in such factors. Furthermore, Rumo is subject to the seasonality that influences the sugar production cycle and grain harvest. During the peak months of each harvest, there is higher demand for transport and logistics operations. For example, Soybean harvests generally occur between January and May, corn harvests (mainly for export) generally occur between April and July and sugar harvests generally begin in April or May and end in November or December. For this reason, Rumo typically transports larger volumes of goods in the second and third quarters of each year and lower volumes in the “off season” (i.e., the first and fourth quarters of each year).
Any downturn in these industries may have a material adverse effect on Rumo’s business, financial condition and results of operations. In addition, some of the products Rumo transports have shown a historical pattern of price cyclicality, which has typically been influenced by the general economic environment, industry capacity and demand. Rumo is also subject to the risk that sugarcane mills may change their production mix in favor of ethanol if the relative prices of the two products swing that way. This could reduce the demand for sugar logistics and transport.
Seasonality could have a material adverse effect on our business, financial condition and results of operations.
We may be unable to protect our intellectual property rights and may be accused of violating third-party property.
If we are unable to protect our intellectual property rights, or those of subsidiaries, investees and jointly controlled company, our ability to operate our business and to compete in the markets in which we operate could be adversely affected. Among other factors, the success of our business also depends on the effective protection of our trademarks, patents, domain names, trade secrets, know-how and intellectual property rights and those held by our subsidiaries, investees and jointly controlled company.
There is a risk that we may not be successful in renewing our title or licensing certain intellectual property rights in a timely manner or at all, or that the validity of such rights may be successfully challenged by third parties. In addition, we may not be able to enforce intellectual property rights in certain countries where our subsidiaries, investees or common controlled company operate as the laws of certain foreign countries, including those in many emerging markets, may not fully protect these rights. The costs required to maintain proper registration and protect such rights can be substantial and affect the result of our operations.
We cannot assure you that third parties will not infringe or misappropriate intellectual property rights, despite our efforts to actively monitor against their unauthorized use. In addition, we are not able to guarantee that the measures taken by companies to protect our intellectual property rights will be sufficient. For this reason, we may need to engage in legal proceedings to defend our rights and there can be no guarantees that we will be successful.
The improper or unauthorized use of such intellectual property rights could decrease the value of our brands, adversely affect our reputation, cause a decline in sales, and have a material adverse effect on our business, financial condition and results of operations.
Additionally, third parties may claim that the products or services provided by our subsidiaries, investees or our jointly controlled company violate their intellectual property rights. Consequently, our companies may be forced to engage in potentially costly litigation, or to revise, in whole or in part, the products that are allegedly infringing on the rights of third parties and/or pay significant amounts in damages, royalties or licensing fees, in addition to the potential risk of damages to our image and loss of demand for our products. Any such developments could have a material adverse effect on business, financial condition and results of operations.
Anticompetitive practices in the fuel and lubricant distribution markets may distort market prices.
Anticompetitive practices have been one of the main problems affecting fuel distributors in Brazil. These practices usually involve a combination of tax evasion and fuel adulteration, such as diluting gasoline by mixing solvents or adding anhydrous ethanol in proportions greater than those permitted by law (anhydrous ethanol is taxed less than hydrous ethanol and gasoline).
Taxes constitute a significant portion of the cost of fuels sold in Brazil. For this reason, tax evasion has been a recurring practice of some distributors, allowing them to charge lower prices. These practices have allowed some distributors to supply large quantities of fuel products at prices lower than those offered by the main distributors, allowing the former to increase their sales volumes at the expenses of the latter. Consequently, these anti-competitive practices may affect Raízen and Moove sales volumes, which could have a material adverse effect on our businesses. If these practices become predominant, it could result in lower prices or reduced margins for products sold, which may cause a material adverse impact on our subsidiaries’ businesses and results of operations.
Given the complexity and breadth of our operations and the special sensitivity of the sector in which we operate, particularly in regard to anti-competitive practices, we cannot guarantee that our internal control mechanisms, such as our governance and compliance programs, are sufficient to avoid risks of investigations for illicit or irregular conducts and possible sanctions and legal proceedings. Despite having these internal control mechanisms, we and our subsidiaries, investees and jointly controlled company, may be subject to, among others, litigation, investigations, expenses, fines, sanctions and penalties, both administrative and criminal, by different authorities. We may also lose our licenses, permits or other regulatory instruments required for our operations, be subjected to search and seizure procedures, and suffer damage to our image and reputation. The fuel sector, in particular, has been the subject of investigations by the Brazilian authorities, especially by the Brazilian Antitrust Authority and the Public Prosecutors’ Offices. There are allegations on involving cartels and price agreements in the fuel distribution sector, and the Brazilian Antitrust Authority has been monitoring participants, which may adversely affect our operations.
Volatility and uncertainty in fuel prices can affect our operational margins and competitive position.
Fuel prices have historically been volatile and may continue to be so in the future. Fuel prices are influenced by numerous factors including, among others, demand and supply, processing, transportation allotment and availability, price and availability of alternative fuel sources, weather conditions, natural disasters and political conditions or hostilities in oil-producing regions, besides the political factors related to government pricing policy.
In our operations, we may need to contract freight services provided by outsourced truck drivers to carry out the distribution of our products, and the costs of these types of services are strongly linked to the cost of fuels, especially that of diesel, which may adversely affect our business, financial condition and results of operations.
Particularly in relation to our subsidiary Rumo, significant reductions in fuel prices could make rail transport less attractive, considering that Rumo’s main competitors have a higher exposure to road freight, which has between 50% and 60% of its cost linked to that of diesel, while the railroads, on average, have a much lower exposure at approximately 20%. If fuel prices were to decrease, the price of rail transport would decrease less than the price of road freight, which could result in lost transportation volume for Rumo or force Rumo to decrease its prices in order to be able to retain or attract customers.
In addition, the gas distribution market may also be impacted, because the price of natural gas is indexed to a basket of fuel oils and inflation. Rapid variations and/or substantial decreases in international prices for oil and oil-derived products may therefore have an effect on the price of our natural gas which could have a material adverse effect on Compass.
Accordingly, any significant variations in fuel prices may have a material adverse effect on our business, financial condition and results of operations.
Since the consummation of our significant financial investment in Vale in the fourth quarter of 2022, we became exposed to risks affecting Vale .
As a result of our significant financial investment in Vale as further described under “Presentation of Financial and Certain Other Information—Certain Corporate Events—Acquisition of Significant Influence in Vale S.A., or ‘Vale’” and “Information on the Company—B. Business Overview—Vale,” our business, results of operations and financial condition in future periods will be affected by any risks to which Vale is exposed. Important factors that could adversely affect Vale’s actual results of operations and financial condition include, among others, the following:
- the impact of the collapse of the tailings dam in Brumadinho in 2019, the collapse of Samarco’s tailings dam in 2015, and related remediation measures on Vale’s operations, cash flows and financial position;
- the implementation of Vale’s dam de-characterization plan;
- the outcome of the various investigations, regulatory, governmental, uncertain tax treatments and legal proceedings in which Vale is involved;
- the impact of the ongoing war in Ukraine and the economic sanctions imposed on Russia, and their impact on the global economy, which are highly uncertain and difficult to predict;
- our direction and future operation;
- the implementation of Vale’s financing strategy and capital expenditure plans;
- the exploration of mineral reserves and resources and development of mining facilities;
- the depletion and exhaustion of mines and mineral reserves and resources;
- trends in commodity prices, supply and demand for commodities;
- the future impact of competition and regulation;
- the payment of dividends or interest on shareholders’ equity;
- compliance with financial covenants;
- industry trends, including the direction of prices and expected levels of supply and demand;
- the implementation of Vale’s principal operating strategies, including Vale’s potential participation in acquisition, divestiture or joint venture transactions or other investment opportunities;
- our ability to comply with Vale’s ESG targets and commitments;
- the implementation of new technologies to mitigate operational risks or achieve Vale’s ESG targets and commitments;
- other factors or trends affecting Vale’s financial condition or results of operations; and
- the factors discussed under “Overview—Risk factors” in Vale’s latest annual report on Form 20-F filed with the SEC, which is not part of, and is not incorporated by reference in, this current report.
The loss of our existing concessions may have a material adverse effect on our business and results of operations.
In Brazil, gas distribution and rail transportation services are provided through concessions granted by governmental authorities. Pursuant to Law No. 8,987 dated February 13, 1995, as amended, or the Concessions Law, natural gas concessions are subject to early termination in certain events. Concession agreements may be terminated as a consequence of the following: (i) expiration of the contractual term; (ii) expropriation of the concessions in the public interest (i.e., encampação); (iii) forfeiture (caducidade); (iv) termination; (v) annulment of the concession agreement to the extent irregularities in the bidding process or the granting of the concession are identified; or (vi) the bankruptcy of the concessionaire or expiration of the concession-holding entity.
Upon termination of a concession, the concession assets revert to the granting authority. Any compensation received by the concession holder upon termination may not be sufficient to offset investments made in, or the implied rate of return and the loss of future profits from, the concession. In addition, a termination of a concession may have a material impact on Compass and Rumo’s operating results and affect our payment capacity and ability to meet our financial obligations, as well as damage our reputation. In addition, it would not relieve Compass or Rumo from liability for any damages caused to third parties in connection with the provision of services, or from their obligations to their creditors.
If we fail to provide adequate services or if we fail to comply with applicable legal and regulatory norms and contractual clauses, including, without limitation, as a result of a negative outcome in ongoing legal proceedings, our concession agreements may be terminated, and the amount of compensation to be paid by the granting authority may be reduced as a result of the imposition of fines or other penalties, which may have a material adverse effect on our business and results of operations.
Changes in accounting standards, pronouncements and interpretations, as well as amendments and/or updates to existing accounting standards or pronouncements by the IASB, CVM, SEC and the Brazilian Accounting Pronouncements Committee (Comitê de Pronunciamentos Contábeis), or “CPC,” may have a material effect on our consolidated financial statements.
The adoption of new accounting standards, pronouncements and interpretations, as well as amendments and/or updates to existing accounting standards or pronouncements by the IASB, CVM, SEC and CPC, may have a material impact on our consolidated financial statements, with possible effects on our financial results, including possible impacts on the basis of dividend distributions. The effects of the adoption of new accounting standards can only be measured if and when the adverse effects mentioned above occur.
Risks Related to Raízen
Ethanol prices are directly influenced by sugar and gasoline prices, so that a decline in those prices will adversely affect both our ethanol and sugar businesses.
The price of ethanol generally is closely associated with the sugar and gasoline prices in international and local markets. A vast majority of ethanol in Brazil is produced at sugarcane mills that produce both ethanol and sugar. Because sugarcane millers are able to alter their product mix in response to the relative prices of ethanol and sugar, this results in the prices of both products being directly correlated, and the correlation between them may increase over time. In addition, sugar prices in Brazil are determined by prices in the world market, so that there is a correlation between Brazilian ethanol prices and world sugar prices.
Because flex fuel vehicles allow consumers to choose between gasoline and ethanol at the pump rather than at the showroom, ethanol prices are correlated to gasoline prices as well and, consequently, international oil prices. We believe the correlation among the three products will increase over time. Accordingly, a decline in sugar prices will have an adverse effect on the financial performance of Raízen’s ethanol and sugar businesses, and a decline in petroleum prices could make ethanol less competitive and reduce demand, despite increased sales of flex fuel vehicles, affecting its results and financial condition, including cash flows.
Raízen may not be successful in its plans to sell energy from bioenergy projects, and the regulation of the electricity sector issued by the Brazilian government could adversely affect its business and financial performance.
Raízen’s bioenergy capacity is used to generate energy for its own industrial operations and to sell the surplus in the Brazilian national interconnected system (Sistema Nacional Interligado). The Brazilian government regulates the energy sector extensively. Raízen may not be able to satisfy all the requirements necessary to enter into new contracts or to otherwise comply with Brazilian energy regulation. Changes in current regulation or in the federal program for granting authorizations, and the creation of more stringent criteria for qualifying in future public energy auctions, in addition to lower prices, may adversely affect our results of operations from our bioenergy business.
Government authorities may, at their own discretion, change the regulations or the terms and conditions applicable to Raízen’s electricity concessions, causing additional costs or diminishing projected revenues. Raízen may be subject to regulatory penalties if we are unable to comply with the new terms and conditions. Raízen’s authorizations are subject to review by the granting authorities with respect to the amounts Raízen may sell in energy purchase and sale agreements, known as a “physical guarantee.” If the physical guarantee of its plants is reduced, Raízen may have our sales capacity reduced and may be exposed to payments and penalties within the scope of the Electric Energy Sales Board (Câmara de Comercialização de Energia Elétrica). Raízen may also be ordered to suspend its power generation if so determined by the National Electric System Operator (Operador Nacional do Sistema Elétrico), for example, in the event of excess generation and incapacity of the electricity grid, and Raízen may not be fully compensated for these restrictions.
Any failure to implement these plans could have a material adverse effect on Raízen’s business, financial condition and results of operations. Additionally, regulations in the electricity sector impose the payment of various sector charges, and the total costs of these charges may be increased by government authorities, adversely affecting the business of Raízen. In addition, cases of force majeure, acts of God, disturbances or interruptions can affect the energy transmission and distribution system.
Government policies and regulations directly related to Raízen products may adversely affect its results through increased production costs or reduced revenues.
The Brazilian government regulates the energy sector extensively. This includes the market for gasoline and diesel, which are the products we primarily distribute and sell. Thus, any intervention in or changes to the regulation of this sector may affect the prices of Raízen products.
More specifically, Raízen produces and sells three main types of ethanol: hydrous ethanol, anhydrous ethanol for fuel and industrial ethanol. The primary type of ethanol consumed in Brazil is hydrous ethanol, which is used as an alternative to gasoline for flex fuel vehicles (as opposed to anhydrous ethanol, which is used as an additive to gasoline). Governmental authorities of several countries, including Brazil and the United States, currently require the use of a certain percentage of anhydrous ethanol in gasoline. Since 1997, the Brazilian Sugar and Alcohol Inter-ministerial Council (Conselho Interministerial do Açúcar e Álcool), or “CIMA,” has fixed the percentage of anhydrous ethanol that must be used as an additive to gasoline. According to CIMA Resolution No. 1, dated March 4, 2015, and MAPA Ordinance No. 75, dated March 5, 2015, the current percentage of anhydrous alcohol for regular gasoline (regular gasoline “C”) is 27%, and for additive/premium gasoline (gasoline “C”) is 25%. The blending of ethanol with gasoline for automotive use is subject to a high degree and regularity of inspections by the ANP, which is responsible for establishing the acceptable specification parameters for ethanol through ANP Resolution No. 907/2022. Any blending of fuel that does not comply with these parameters will be subject to fines and even the loss of the license to operate in the sector. According to ANP data, approximately one-half of all fuel ethanol in Brazil is used to fuel automobiles that run on a blend of anhydrous ethanol and gasoline; the remainder is used in either flex fuel vehicles or vehicles powered by hydrous ethanol alone. Other countries have similar governmental policies requiring various blends of anhydrous ethanol and gasoline. Any reductions in the percentage of ethanol to be added to gasoline or changes in Brazilian government policies related to the taxation and use of ethanol, as well as growth in the demand for natural gas and other fuels as an alternative to ethanol, such as natural gas, may cause us significant adverse effects.
Further, new technologies may be developed or implemented to obtain alternative energy sources, and cars that use these sources may replace flex fuel vehicles. Advances in the development of alternatives to ethanol, or the development of automobiles that use energy sources other than ethanol, could significantly reduce the demand for ethanol, thereby affecting Raízen’s sales.
Raízen may not be able to satisfy all the requirements necessary to enter into new contracts or to otherwise comply with Brazilian energy regulation. Changes in current Brazilian regulations or authorization programs and the creation of stricter criteria for eligibility in future energy auctions, in addition to lower prices, may adversely affect Raízen’s operating results in its energy cogeneration businesses, increase the costs of projected investments and, as a result, hinder the growth of its business.
In addition, flex fuel vehicles in Brazil are currently taxed at lower levels than gasoline-only vehicles, which has contributed to the increase in the production and sale of flex fuel vehicles. Any reduction in the percentage of ethanol required to be added to gasoline or increase in the levels at which flex fuel vehicles are taxed in Brazil, as well as growth in the demand for natural gas and other fuels as an alternative to ethanol, lower gasoline prices or an increase in gasoline consumption (versus ethanol), may cause demand for ethanol to decline and affect our business. In addition, ethanol prices are influenced by the supply and demand for gasoline; therefore, a reduction in oil prices resulting in a decrease in gasoline prices and an increase in gasoline consumption (versus ethanol), may have a material adverse effect on our business, financial condition and results of operations.
Raízen may be adversely affected by a shortage of sugarcane or by high sugarcane costs and the consequent lack of sugar cane may materially impact Raízen’s ability to produce and distribute ethanol and sugar.
Sugarcane is the main raw material Raízen uses for the production of ethanol and sugar. Raízen generally enters into medium- and long-term supply contracts for periods varying from three and one-half to seven years.
Raízen’s supply of sugarcane in Brazil may be significantly reduced as a result of the termination of supply contracts or lease agreements, which may result in a shortage of sugarcane supply and an increase in the price of sugarcane. If there is a shortage of sugarcane or any supply contracts or lease agreements are terminated, Raízen may experience a material reduction in the sugarcane available for processing or an increase in sugarcane prices, which may materially adversely affect our business, results of operation and financial condition.
In Brazil, the price of sugarcane may increase as a result of changes in the criteria established by the Association of Producers of Sugarcane, Sugar and Ethanol of the state of São Paulo (Conselho dos Produtores de Cana-de-açúcar, Açúcar e Álcool do Estado de São Paulo), or “Consecana,” which is composed of sugarcane producers and sugar mill operators. The price of sugarcane is set in supply agreements, lease agreements and partnership agreements and is partially fixed and partially variable, as provided for in the criteria set forth by Consecana. As a result, any changes to the criteria established by Consecana may lead to an increase in the cost of sugarcane, which may have a material adverse effect on our business, financial condition and results of operations.
In addition, in certain cases, as a result of the price-setting formulas in the contracts which Raízen has entered into with its customers, Raízen may not be able to pass on the full amount of these cost increases to its customers. This may have a material adverse effect on Raízen’s business, financial condition and results of operations.
Furthermore, the availability of sugarcane may be affected by various environmental and climate-related factors, including water scarcity, excessive or insufficient rainfall and other weather patterns.
Raízen may be subject to expropriation of real estate intended for rural production.
The real estate used by Raízen, or by third parties with whom Raízen maintains a partnership or lease relationship, for the cultivation of sugarcane may be unilaterally expropriated by the Brazilian government for purposes of public and social interest, and we cannot assure you that the payment of the indemnification that they may have to pay to Raízen will be fair. Pursuant to Brazilian law, the Brazilian government may expropriate the real estate of rural producers where the sugarcane is planted by necessity or for public utility or social interest, partially or totally. In the event of expropriation, we cannot assure you that the price paid by the Brazilian government will be fair or equivalent to the market value, or that it will effectively and adequately compensate Raízen for the amounts invested. Accordingly, any expropriation of any real estate used by Raízen, or by third parties with whom Raízen maintains partnership or lease relationships, may adversely and significantly affect Raízen’s financial situation and results, and may also impact Raízen’s activities, which may have a material adverse effect on our business, financial condition and results of operations.
Social movements may affect the use of Raízen’s agricultural properties or cause damage to them.
Social movements are active in Brazil and advocate land reform and property redistribution by the Brazilian government. Invasion and occupation of agricultural land by large numbers of people is a common practice among the members of such movements, and in certain regions, including those in which Raízen owns or leases property, remedies such as police protection or eviction procedures might be inadequate or non-existent. As a result, we cannot assure you that Raízen’s agricultural properties will not be subject to invasion or occupation by any of such social movements. In these cases, our operations, image and reputation may be affected, and Raízen may be subject to legal and administrative litigation that may result in criminal and administrative penalties, including, but not limited to, suspension, shutdowns, and a requirement to pay fines, which may range from R$50 to R$50 million and can be doubled or tripled in case of recurrence, which may also result in the need for additional investments.
In addition, Raízen may be subject to civil liabilities for environmental damage, which includes the obligation to redress any damages caused to the environment and/or public health. The demonstration of the cause-and-effect relationship between the damage caused and action or omission is sufficient to trigger the obligation to redress environmental damage.
Raízen’s sugar and ethanol products are sold to a small number of customers who may be able to exercise significant bargaining power concerning pricing and other sale terms.
A non-negligible share of Raízen’s sugar and ethanol production is sold to a small number of customers that acquire large portions of our production and thus may be able to exercise significant bargaining power concerning pricing and other sale terms. In addition, intense competition in the ethanol and sugar industries further increases the bargaining power of customers, which may have a material adverse effect on Raízen’s sales volumes and, consequently, on us.
Raízen’s export sales are subject to a broad range of risks associated with international operations.
International activities expose Raízen to risks not faced by companies operating exclusively in Brazil. The risks associated with international operations include:
- changes in tax laws and regulations and other general laws and regulations applicable to activities in the sugar and ethanol sector;
- changes in social, political and economic conditions, including recessions;
- restrictions on currency convertibility and volatility in foreign exchange markets;
- import and export quotas;
- changes in local working conditions;
- global economic and social developments, including as a result of the COVID-19 pandemic and the ongoing war between Russia and Ukraine and conflicts in the Middle East;
- expropriation and nationalization of assets in a particular jurisdiction; and
- restrictions on the repatriation of dividends or profits.
Most ethanol and/or sugar producing countries, including the United States and member countries of the European Union, protect local producers from foreign competition by establishing government policies and regulations that affect ethanol and sugar production, including quotas, import and export restrictions, subsidies, tariffs and duties. As a result of these policies, domestic ethanol and sugar prices vary greatly in individual countries. We have limited or no access to these large markets as a result of trade barriers. If these protectionist policies continue, we may not be able to expand our export activities at the rate we currently expect, or at all, which could have a material adverse effect on our business, financial condition and results of operations. Also, if new trade barriers are established in our key export markets, Raízen may face difficulties in reallocating products to other markets on favorable terms, and both Raízen’s and our business and financial performance may be adversely affected.
Raízen may be adversely affected if the outsourcing of mechanized sugarcane cutting becomes prohibited.
Raízen is a defendant in a public civil action in which the Public Ministry of Labor claims the prohibition of outsourcing the planting, loading and transport of sugarcane. If the Superior Labor Court changes its understanding in relation to the appeal granted to Raízen to annul the unfavorable decision of the lower court and determines that the activities in question are intrinsic activities to our production chain (and could not be outsourced), Raízen may be required to carry out these activities on its own on an ongoing basis (including hiring employees and purchasing suitable machinery). This could have a direct material adverse effect on Raízen and an indirect one on us. Such material adverse effects may also arise from a similar understanding in relation to other activities outsourced by us.
Any mismatches between the cash outflows for the payment of litigation costs of Raízen and the time of receipt of the related reimbursement by the Joint Venture’s shareholders may lead to pressures on Raízen’s cash flows.
Pursuant to the agreement entered into in the context of the formation of the Raízen joint venture, we agree that we will reimburse our shareholders or be reimbursed by them, as the case may be, for any amounts received or paid in relation to the lawsuits, provided that the events triggering such payments or receipts have occurred prior to the formation of the Raízen joint venture on June 1, 2011, and provided such amounts have actually been paid or received.
The agreement also provides that our controlling shareholders are required to indemnify us for any expenses related to litigation (tax, labor, civil and others) that have been caused by events prior to the formation of the Raízen joint venture. Any mismatch between cash outflows to pay litigation costs and the timing of receipt of the related reimbursement by our shareholders, or any failure by our shareholders to reimburse us, could lead to pressure on our cash flows.
In addition, Brazilian courts, in some circumstances, understand that a controlling shareholder, a successor entity of another company, a company assignee of another company’s assets and other companies subject to the common control of the assignor or predecessor company must all be liable, jointly and separately for, among other obligations, labor, social security, civil, tax or environmental obligations of the assignor, assignee or predecessor. Therefore, we may be liable for obligations of our controlling shareholders for which we have not made and do not intend to make any provisions, which could adversely affect our business, financial condition and results of operations.
Crop disease and pestilence may strike our crops which may result in destruction of a significant portion of the harvest.
Crop disease and pestilence can occur from time to time and have a devastating effect on Raízen’s crops, potentially rendering useless or unusable all or a substantial portion of affected harvests. Even when only a portion of the crop is damaged, Raízen’s business, financial condition and results of operations could be adversely affected because we may have incurred a substantial portion of the production cost for the related harvest. The cost of treatment of crop disease tends to be high. Any serious incidents of crop disease or pestilence, and related costs, may adversely affect Raízen’s production levels and, as a result, our net sales and overall financial performance.
Significant competition in Brazil, Argentina and Paraguay may distort prices and adversely affect our market share, our operations and our profitability.
The fuel distribution markets in Brazil and Argentina are highly competitive within both the wholesale and retail segments. Raízen competes with small and large domestic fuel distributors. Large players may be more flexible than Raízen in responding to volatile industry or market conditions, such as shortages of crude oil and other raw materials or intense price fluctuations. In addition, Raízen competes with producers and traders in other industries that provide alternative forms of energy and fuel to satisfy the requirements of our industrial, commercial and retail customers.
Certain measures currently being taken by participants in the fuel distribution market, including the expansion of their distribution networks, as well as the arrival of new participants or the offer of alternative forms of energy and fuel, may result in an increase in competition and/or fuel supply and a consequent decrease in fuel prices, which could have an adverse effect on our business, financial condition and results of operations.
Intense competition and the actions of Raízen’s competitors could lead to reduced profit margins for the products we sell, as well as reductions in sales volumes, which could have a material adverse effect on our business, financial condition and results of operations.
See also “—Risks Related to Our Businesses and the Industries in Which We Operate Generally—Anticompetitive practices in the fuel and lubricant distribution markets may distort market prices.”
Disruption of Raízen’s transportation and logistics services or insufficient investment in public infrastructure could materially adversely affect our operating results.
One of the principal disadvantages of the Brazilian agriculture sector is that key growing regions lie far from major ports. As a result, efficient access to transportation infrastructure and ports is critical to the growth of Brazilian agriculture as a whole and of our operations in particular. As part of its business strategy, Raízen is investing in areas where existing transportation infrastructure is underdeveloped.
A substantial portion of Brazilian agricultural production is currently transported by truck, a means of transportation significantly more expensive than the rail transportation available to U.S. and other international producers. Raízen’s dependence on truck transport may affect our position as a low-cost producer, such that its ability to compete in world markets may be impaired. Furthermore, Raízen’s supply chain is dependent on road transport and may be adversely affected by weather conditions which require a decrease or stoppage in road transport. Any such impediments to road traffic along the routes typically used within Raízen’s supply chain could require it and its suppliers to use alternative routes, which may result in delays and have a material adverse effect on Raízen’s business, financial condition and results of operations.
Given that a significant part of Raízen’s sales are exported to countries other than Brazil (both with regards to sugar and ethanol), we may be adversely affected by the lack of port capacity or an increase in the costs of such port capacity as a result of limitations in supply.
Raízen currently outsources the transportation and logistics services necessary to operate its business. Any disruption in these services, or any obligation to take over these services from existing service providers as a result of judicial orders banning the outsourcing of these services, could result in supply problems at Raízen’s processing plants and impair its ability to deliver processed products to our customers in a timely manner. In addition, a natural disaster or other catastrophic event could result in disruption in regional transportation infrastructure systems affecting Raízen’s third-party transportation providers.
Even though road and rail improvement projects have been considered for some areas of Brazil, and in some cases have been implemented, substantial investments are required for road and rail improvement projects, which may not be completed on a timely basis, if at all. Any delay or failure in developing infrastructure systems could hurt the demand for our products, impede our delivery of products or impose additional costs on Raízen.
Raízen depends on third parties to provide its customers and Raízen with facilities and services that are integral to its business. Additionally, Raízen depends on the renewal of contracts with retail dealers that operate Shell-branded sites in Brazil and Argentina.
Raízen has entered into agreements with third-party contractors to provide facilities and services required for its operations, including fuel distribution, storage facilities and transportation services for Raízen’s ethanol and sugar operations. Additionally, Raízen depends on contracts entered into with retail dealers that operate Shell-branded sites in Brazil and Argentina. The loss or expiration of Raízen’s agreements with third-party contractors and retail dealers, or Raízen’s inability to renew these agreements or to negotiate new agreements with other suppliers and retail dealers at comparable rates could harm its business and financial performance. Raízen’s reliance on third parties to provide essential services on its behalf, and retail dealers that operate Shell-branded sites in Brazil and Argentina, also gives Raízen less control over the costs, efficiency, timeliness and quality of those services. Contractors’ negligence could compromise the safety of the transportation of ethanol from Raízen’s production facilities to its export facilities and expose Raízen to the risk of liability for environmental damage caused by such third parties. Raízen is expected to be dependent on such agreements for the foreseeable future, and if Raízen enters any new market segments, Raízen will need to have similar agreements in place.
Brazilian labor authorities, based on case law, previously prohibited the outsourcing of activities considered to be part of an entity’s core business. Noncompliance with this prohibition could result in fines and a requirement that the outsourcing be terminated. Recent decisions by the Brazilian Federal Supreme Court (Supremo Tribunal Federal), or the “STF,” and recently enacted labor laws, have permitted the outsourcing of activities considered part of an entity’s core business, provided certain conditions are met. Raízen faces the risk that (1) it may be held indirectly liable when third-party contractors fail to comply with their labor obligations, and (2) it is held jointly and severally liable with its third-party contractors where they fail to comply with their labor obligations if it is proved that there was a direct relationship between Raízen and the outsourced employees, or in cases of fraud. Any such developments could materially adversely affect Raízen and, consequently, us.
We and Shell have joint control over Raízen
Raízen is controlled by two different shareholders, Cosan and Shell. Pursuant to the Raízen shareholders’ agreement, several matters require the approval of its board of directors, which consists of eight members: two independent members and six members appointed by the two controlling shareholders (three each). Decisions of Raízen’s board of directors require majority approval, which could result in delays in making important decisions related to Raízen’s business if there is any misalignment between our interests and those of Shell.
The shared control may result in deadlocks and disputes between us and Shell regarding strategy, control and other important matters. Any such deadlocks and disputes could have a material adverse effect on Raízen’s and therefore, our business, financial condition and results of operations.
The shareholders’ agreement and other agreements, related to Raízen, into which we have entered with Shell are subject to put and call options and termination provisions.
We and Shell have entered into certain agreements with respect to Raízen that are subject to put and call options (ranging from general to specific events) and termination provisions that, if triggered, would cause a change in the control structure of Raízen.
If any of these events or similar provisions are triggered under the terms of the agreements relating to Raízen, or if certain rights that we or Shell hold in connection therewith are exercised, our interest in Raízen may be liquidated prior to scheduled termination, which could have a materially adverse effect on our business, financial condition and results of operations.
The sale of fuel products refineries in Brazil by Petrobras may have a material adverse effect on our business, financial condition and results of operations.
The cease and desist agreement (Termo de Compromisso de Cessação), or “TCC,” entered into by Petrobras and the Brazilian Antitrust Authority regarding the divestment of Petrobras’ refineries marks a significant change to the Brazilian government’s historical approach to the oil and gas industry. The TCC was signed on June 8, 2019, and reflects a focus on promoting market competition and reducing the government’s intervention in the economy. The TCC requires Petrobras to sell its refineries to third-party companies, which is expected to increase competition in the oil market and promote a more dynamic and efficient sector. Competition in the fuel distribution industry may be increased if the oil product refineries that are currently being sold by Petrobras are acquired by third parties. Similarly, Raízen may be impacted by the acquisition of Petrobras’ refineries by private investors that practice more restrictive pricing and supply policies, limiting access to petroleum products from these locations. Additionally, we cannot assure you that Raízen would be successful if it acquires, directly or indirectly, any of the refineries that are being sold, which may have a material adverse effect on Raízen’s and our business, financial condition and results of operations. On the other hand, there is a possibility that the newly elected Brazilian government administration decides to abandon the plan to sell Petrobras’ refineries, despite the TCC having been entered into by Petrobras and the Brazilian Antitrust Authority. This decision would represent a significant shift in the government’s approach to the oil and gas industry, and it would likely face resistance from market participants and regulators. There is a possibility that the sale of Petrobras’ refinery assets is put on review by the newly elected Brazilian government administration; however, such scenario may help to maintain current market conditions in favor of Raízen. Any of the adverse developments referred to above as well as the ongoing uncertainty with respect to the sale of fuel products refineries may have a material adverse effect on our business, financial condition and results of operations.
The high concentration of the Brazilian aviation market in a small number of airlines could have a material adverse effect on Raízen’s and our business, financial condition and results of operations should any of these companies face financial difficulties.
Raízen supplies fuel to the Brazilian aviation market, which is highly concentrated in a few airlines. LATAM, Gol and Azul, according to the Brazilian National Civil Aviation Agency (Agência Nacional de Aviação Civil), are the three biggest national airlines in terms of number of passengers. If any of these airlines were to encounter financial difficulties, this could have a material adverse effect on our business, financial condition and results of operations and those of our subsidiaries, including Raízen’s.
Considering the high concentration in commercial aviation, the migration of any of the large domestic airlines to another distributor of fuel could also have a material adverse effect on Raízen’s and our business, financial condition and results of operations.
Risks Related to Compass
Raw material and supply service costs are subject to fluctuations that could have a material adverse effect on Comgás’s results of operations.
Raw materials used in Comgás’s business and the cost of services it engages for the distribution of natural gas are subject to wide fluctuations depending on market conditions and government policies. These prices are influenced by several factors over which we have little or no control, including, but not limited to, international and national economic conditions, regulations, government policies (including those applicable to the pricing policies of Petrobras, which is our main gas supplier), tariff adjustments and global effects of supply and demand, particularly in commodity prices. We cannot assure you that Comgás’s tariff adjustment will be conducted in a timely manner or be sufficient to reflect and/or offset increases in inflation, operation costs and expenses, amortization of investments and taxes. As a result, Comgás might not be able to pass on the increased costs to its customers, which could decrease its profit margin and result in a material adverse effect on Comgás’s and our business, financial condition and results of operations.
The transportation and storage of natural gas, the import of liquefied natural gas (LNG), regasification and distribution of natural gas are inherently hazardous.
Compass and its subsidiaries are involved in activities which are inherently hazardous and fraught with operational risks, including leaks, accidents and mechanical problems. These risks could result in personal injury and death, severe damage to or destruction of property and equipment, pollution and environmental damage and a suspension of operations, which could result in significant lost revenue and other penalties. Compass and its subsidiaries do not carry insurance against all the risks and losses to which they are exposed. In addition, insurance proceeds, if available, may be insufficient to cover all losses. The location of pipelines near populated areas, including residential areas, commercial business centers and industrial sites, could increase the level of damages resulting from these risks. The occurrence of any of these events could adversely affect our image, reputation, results of operations, cash flows and financial condition.
Variations in the price of natural gas may affect the operating costs and competitive positions of our businesses, which could adversely affect our results of operations, cash flows and financial condition.
Natural gas prices historically have been volatile and may continue to be volatile in the future. Prices for natural gas are subject to a variety of factors that are beyond our control. These factors include, but are not limited to, the level of consumer demand for, and the supply of, natural gas, processing, gathering and transportation availability, statutory gas supply purchase obligations, price and availability of alternative fuel sources, weather conditions, natural disasters and political conditions or hostilities in natural gas producing regions.
In addition, the amounts we pay under our natural gas supply agreements are composed of two components: (i) one that is indexed to a basket of combustible oils in the international market that is adjusted quarterly and (ii) one that is adjusted annually based on the inflation rate. We have no control over either of these components. Furthermore, natural gas supply agreements often take the form of a “take or pay” agreement, pursuant to which we might be required to pay the difference in amounts between actual consumption and the contract amount. Variations and uncertainties in the price and demand of oil and gas are beyond our control and may adversely affect our results of operations.
We may be unable to renew the term of our concession agreements, or the terms of the concession agreements may be renewed on terms that are less favorable to us, which may have a material adverse effect on our business and results of operations.
Comgás, Sulgás and Necta Gás Natural S.A., or “Necta,” all of which are indirect subsidiaries of Cosan and subsidiaries of Compass, carry out natural gas distribution activities pursuant to concession agreements entered into with the governments of the state of São Paulo and Rio Grande do Sul, respectively. The concession agreement of Comgás and Necta in the state of São Paulo expires in 2049 and 2029 respectively, and the concession agreement of Sulgás in the state of Rio Grande do Sul expires in 2044.
Due to the discretionary power of the government of the states of São Paulo and Rio Grande do Sul in granting the renewal of the concession agreements, we cannot assure you that the concession agreements will be renewed, that they will be renewed on the same terms or that, to the extent they are renewed, that the amount of compensation Compass’s subsidiaries receive will be sufficient to cover the full value of our investment, all of which may have a material adverse effect on Compass’s and our business, results of operations and financial condition.
Moreover, our results of operations, our ability to implement our growth strategy and the ordinary course of our business may be materially and adversely affected if (i) there are any changes in the applicable laws or regulations, (ii) we are unable to extend any of our concessions, (iii) any extension is subjected to certain conditions precedent or the applicable concessions are extended on terms less favorable than those currently in place or (iv) state concession programs are cancelled.
We cannot guarantee that the results of tariff reviews pursuant to our concession agreements will be supportive of our strategy. These tariff results may be affected by administrative or judicial decisions.
The principal rights and obligations on our natural gas distribution subsidiaries are contained in the applicable concession agreements and in the regulations established by the applicable regulatory agencies. The concession agreements provide for tariff reviews, which should ordinarily occur in five-year cycles, setting the maximum margin for the prospective cycle and the rates that will apply for each segment. Any delays, disagreements with respect to tariffs or inadequate tariff adjustments relative to our costs could have a negative impact on our results of operations.
Given the margins established in the concession agreements are prospectively set and approved by the applicable regulatory agencies and consider, among others, the costs, the asset base, investments, rate of remuneration, depreciation and projections for each tariff cycle, the results of prior, current and future tariff cycles may not be supportive of our strategy and/or may be challenged or amended, including as a result of third-party judicial and/or administrative proceedings.
As part of the tariff review processes, our natural gas distribution subsidiaries and third parties initiated certain procedures and appeals with the applicable regulatory agencies, which are currently pending. They relate to certain material and formal aspects of the tariff review procedures, including with respect to required revenue formation and asset base forecast, and they could potentially result in new judicial and/or administrative proceedings related to past tariff reviews and/or could reduce our margins and adversely affect the balance of the concession, including our ability to generate revenues, our investment capacity and our operations.
The liberalization of the gas market in Brazil depends on compliance by Petrobras with a cease and desist agreement (Termo de Compromisso de Cessação). Any noncompliance or delay in the implementation of the TCC may hinder or prevent the development of the natural gas market, which may have a material adverse effect on our business.
As of the date of this current report, Petrobras dominates the Brazilian gas market. In 2019, Petrobras entered into the TCC with the Brazilian Antitrust Authority. The liberalization of the Brazilian gas market and our participation in it may be adversely affected to the extent that Petrobras does not comply with the terms of the TCC and Petrobras’s dominant position in the gas sector is not reduced in the coming years, including through (1) the release of contracted and unused capacity in pipelines; (2) access to all essential natural gas infrastructure; (3) the sale of holdings in transportation and distribution companies; and (4) the leasing of liquefied natural gas regasification terminals. Any such developments may limit our participation and the participation of other players in the natural gas market by limiting opportunities for developments, investments, and for the negotiation of gas supply and distribution.
Any failure by Petrobras to comply in whole or in part with the terms of the TCC may adversely affect the liberalization of the Brazilian gas market, which may have a material adverse effect on our business.
We cannot assure you that our natural gas supply contracts will be renewed or extended, or that we will be able to replace these contracts with agreements with alternative suppliers on favorable terms or at all.
Our natural gas supply contracts have a definite term, which is on average 10 years. We could be adversely affected if we are unable to renew or extend these contracts, or to replace them with new agreements with alternative suppliers, on favorable terms or at all. In recent years, additional participants have entered the Brazilian natural gas market, and this increase in competition has also increased the uncertainty around the renewal and/or extension of existing agreements. Failure to renew, extend or replace our natural gas supply contracts on favorable terms, or at all, could have a material adverse effect on our business, financial condition and results of operations.
In addition, natural gas purchase and sale transactions are conducted bilaterally between agents, and we are exposed to the credit risk of our counterparties. A default by one of our counterparties will expose us to market prices at that time, which could adversely affect our projected results of operations.
We may be forced to buy or sell energy at prices that may generate additional costs.
Our energy trading activities require us to estimate future market demand for electricity. We may be adversely affected to the extent that we overestimate or underestimate such demand.
If we underestimate demand and buy less electricity than we need, we may be forced to buy additional electricity in the spot market at substantially higher prices than those provided for in long-term purchase contracts. We may also be unable to pass on these additional costs to our customers and would be subject to penalties pursuant to applicable regulations. On the other hand, if we overestimate demand and buy more electricity than we need (if, for example, a significant portion of our customers start purchasing electricity directly in the open market), we may need to sell the surplus at substantially lower prices. Any significant divergence between our anticipated needs and demand for electricity may adversely affect our results of operations.
Market activities are subject to potential losses due to short-term changes in spot market prices, and may not be able to purchase sufficient electricity to honor the sales contracts.
We may be unable to purchase the electricity we need to fulfill our sales contracts, which may expose us to short-term market prices that are significantly higher than the prices set by our medium and long-term contracts. Free market contracts are subject to possible mismatches between the volume of generated or purchased electricity (supply) and the volume of electricity sold or consumed (demand). These volume mismatches are settled by the CCEE at the differentiated settlement price (Preço de Liquidação das Diferenças), or the PLD. The PLD is calculated weekly and is based on the Marginal Cost of Operation, or the CMO, and is limited to minimum and maximum values, which are reviewed and set by the ANEEL annually. Changes in short-term market prices can lead to potential losses in our market activities. The PLD may be impacted by (1) variations in expected and verified loads; (2) variations in the levels of hydroelectric plant reservoirs; (3) decreases/increases in expected and verified inflows; (4) an advanced or delayed start of operations of new generators and/or transmitters; and (5) variations in expected and verified generation of small plants. The occurrence of any of these events could lead to a significant variation in the PLD, which could result in increased costs or reduced revenue from energy sales in the short-term, and could adversely affect our cash flows.
In addition, the purchase and sale of electricity transactions are conducted bilaterally between agents, and we are exposed to the credit risk of our counterparties. A default by one of our counterparties will expose us to market prices at that time, which could adversely affect our projected results of operations.
We may not be successful in executing our business strategy, which may have a material adverse effect on us.
Our business strategy and financial performance depend on the successful implementation of various strategies and on a multitude of factors, including the ability to undertake successful expansions, acquisition opportunities, approval of projects by the competent authorities, variations in the cost of construction, favorable macroeconomic factors, access to financing on attractive terms and increased consumer capacity, among others. We cannot assure you that our strategy will be executed successfully or at all, which may have a material adverse effect on us.
Moreover, we are unable to predict whether or when acquisitions or strategic alliances will occur or the likelihood that any particular transaction will be completed on favorable terms and conditions to us. In addition, we cannot assure you that we will be able to obtain the necessary financing to make any such acquisitions, whether on favorable terms or at all.
Acquisitions, investments or partnerships, particularly those involving large companies, may bring managerial and operational challenges, including diverting management’s attention from existing operations and difficulties in integrating operations and personnel. Any material failure to integrate new businesses or manage new partnerships could adversely affect our business, financial condition and results of operations. Acquisitions may also expose us to potential legal proceedings relating to liabilities involving any acquired company, its directors or officers or contingent liabilities incurred prior to the acquisition. Material liabilities associated with an acquisition, such as labor or environmental liabilities, could materially and adversely affect our reputation, business, results of operations or financial condition and reduce the benefits expected to accrue from such acquisition. In addition, any major acquisition we envisaged may be subject to antitrust and other regulatory approvals, and we may not be successful in obtaining such approvals on a timely basis or at all. Failure to obtain such approvals may result in fines or penalties for us.
If we try to expand our current operations, we may face difficulties in obtaining appropriate permits for expansions and installation of new projects. Any expansions may not achieve the level of revenue and profitability in the time frame we estimate and, consequently, may adversely affect our profitability, which could have a material adverse effect on us.
Finally, we may not be able to fully implement our business strategy as projected, which may result in increased investments and operating expenses that may not be offset by the expected increase in revenue (if such an expected increase materializes in full or at all, which we cannot guarantee), resulting in a decrease of our operating margins. Failure to implement our strategy may have a material adverse effect on our business, financial condition and results of operations.
See also “—Risks Related to Our Businesses and the Industries in Which We Operate Generally—We may be unable to implement our growth strategy successfully.”
Compass is subject to regulatory risks arising from the different state regulatory regimes to which its operations are subject.
Several Brazilian states have local regulatory agencies that conduct tariff reviews and regulate gas distribution services. There is a risk that tariff reviews in certain states may be delayed, or that such states may apply the provisions of the concession contracts in a manner which we consider to be incorrect, since reviews occur (or should occur) annually for all distributors operating under the cost-plus model. A delay of six to eight months in the conclusion of a tariff review process may impact the revision of the following year, given the proximity of the tariff updates.
We also cannot assure you that state regulatory agencies will conduct their policy-making decisions and reviews in a manner which is consistent across all of the states in which we operate. This may result in divergent regulatory standards across states, which could increase our compliance costs. State governments may also from time to time appoint or remove senior civil servants from these regulatory agencies, which may affect the agencies’ decision-making process and decisions, and thereby have a material adverse effect on Compass.
Furthermore, certain of these state regulatory agencies are relatively new and do not therefore have established regulatory review processes and methods. Accordingly, they tend to base their decisions on precedents from other state regulatory agencies. There is therefore a risk that a precedent decision that is adverse to us in one state (for example, about tariff calculation, or the recognition of operating expenses and/or capital expenditure items) may adversely affect our business other states as well.
The administrative penalties and sanctions applied by these regulatory agencies may range from a simple warning to forfeiture of the concession, depending on (i) the scope and severity of the violation; (ii) the size of the damage; (iii) the advantage gained through the violation; (iv) the company’s record; and (v) the duration of the violation.
Any delays in the exploration, development, negotiation or other issues related to the supply of gas from the pre-salt gas fields and Bolivia, as well as delays in negotiations or operational issues that create compliance issues with the expected timetables for the supply of gas through the importation of liquefied natural gas, may affect the plans and profitability of our activities and those of our subsidiaries.
The success of our and our subsidiaries’ strategies depends on our ability to access different sources of natural gas supply to be competitive and expand our supply options for consumption in the Brazilian market.
There are currently alternatives for accessing natural gas, such as pre-salt, mainly from the Santos basin in Brazil, gas from Bolivia imported via pipelines, and liquefied natural gas (“LNG”) imported into Brazil from overseas and made available to customers after regasification in terminals such as the Terminal de Regaseificação de GNL de São Paulo S.A., or “TRSP.” Each of these sources has different risks related to exploration, development and supply. Operational issues that hinder access or delay negotiations for the supply of natural gas, or additionally in the case of LNG, the expected timetable for the TRSP project or the importation of LNG, may adversely affect our strategy and operations, and could have a material adverse effect on our business, financial condition and results of operations.
In addition, a public hearing before the ANP is underway in Brazil to implement changes to the process for obtaining licenses and authorizations to operate in the LNG market in Brazil. Depending on the results of such public hearing, there may be adverse impacts to operators working with this type of fuel, including on our business, financial condition and results of operations.
Compass’s future performance is uncertain considering the degree of maturity of projects and assets recently incorporated into its portfolio, which may adversely affect our business plan.
Compass has been developing a number of projects and incorporating a number of assets into its portfolio. It is therefore subject to risks, expenses and uncertainties associated with the implementation of Compass’s business plan, as it may be unable to conclude such projects or obtain the expected benefits from them and the newly incorporated assets. Unlike Comgás, Compass has other companies in their early stages of development, some of them in the pre-operational stage, which involves significant business risks and could result in significant losses. For these initiatives, Compass may face challenges and uncertainties in financial planning due to the absence of available historical data for its newly incorporated assets and uncertainties regarding the nature, scope and results of its future activities.
It is possible that Compass may not be successful in implementing its business strategies, integrating newly acquired assets or completing the development of the structure necessary to conduct its business as planned. If one or more of its projects fails to be completed, or is delayed or cancelled, if Compass is unable to successfully integrate new assets, or if material liabilities relating to such new assets were to materialize, Compass’s and our business, financial condition and results of operations may suffer a material adverse effect. Compass’s projects may be delayed or cancelled for various reasons, including political instability, governmental regulatory action or supervening legislation, revocation, loss of or not obtaining environmental permits, insufficient capital, natural disasters, engineering failure or changes in business policy. As a result of industry factors or factors relating specifically to Compass, it may be necessary to change its methods of conducting business, in which case its financial condition and results of operations will be adversely affected.
Any such developments could have a material adverse effect on Compass’s and our business, financial condition and results of operations.
The supply of natural gas in Brazil is highly concentrated among a few suppliers. Any decisions by these suppliers regarding their natural gas business may adversely affect the revenues and operating margins of Compass.
The supply of natural gas that Compass sells is highly concentrated among a few suppliers as a result of the limited number of natural gas suppliers in Brazil. Compass therefore remains exposed to this concentration of supply and its revenues and operating margins may be adversely affected by decisions such suppliers take about their natural gas business.
In addition, a significant interruption of natural gas supply from one of these suppliers could occur in the event of a disruption in their operations or in the event of a commercial disagreement with Compass, which would adversely affect Compass’s ability to sell natural gas to its customers and making it more dependent on other suppliers. If Compass is unable to obtain an adequate supply of natural gas, it may be forced to meet its natural gas demands by purchasing on the international market, which could adversely affect its revenues and operating margins. Any such developments could have a material adverse effect on Compass’s and our business, financial condition and results of operations.
Risks Related to Moove
Moove’s international operations expose it to political and economic risks in other countries.
In the year ended December 31, 2023, our lubricants business, Moove, derived approximately 52% of its gross sales from its international operations. Moove’s international activities expose us to risks not faced by companies that operate solely in Brazil. Risks associated with our international operations include: (i) foreign exchange controls; (ii) changes in the political or economic conditions in a specific country or region, especially in emerging markets; (iii) potentially negative consequences resulting from changes to regulatory requirements; (iv) difficulties and costs associated with our observance of different laws, treaties and complex international regulations; (v) tax rates that may exceed those applicable in Brazil and other countries or gains that may be subject to withholding regimes and an increase in repatriation taxes; (vi) imposition of trade barriers; and (vii) limitations on the repatriation of undistributed profits. The realization of any of these risks may have a material adverse effect on Moove’s and our business, results of operations or financial condition.
We may not be able to maintain or renew certain agreements with third parties which are important to our business.
Our business, financial condition and results of operations may be materially and adversely affected if we are unable to maintain or renew certain agreements (including, without limitation, supply agreements, service contracts, licensing agreements, distribution agreements, joint ventures, partnerships and others) with third parties which are important to our business and operations.
On November 1, 2017, we acquired Stanbridge, which distributes lubricants and fuels in some regions of the United Kingdom. The company, via its subsidiaries, had a non-exclusive supply and service agreements for supply and delivery of ground fuel with the company operating Heathrow Airport. Such agreements had been extended until Airport Energy Services Limited (a subsidiary of Stanbridge) was awarded on July 30, 2020 a new agreement with Heathrow Airport Limited for the supply and delivery of ground fuel at Heathrow Airport. This agreement commenced on August 1, 2020 and will continue in full force and effect until March 31, 2025.
We, through our subsidiary Moove, are the manufacturer and exclusive distributor of lubricants in Brazil based on formulas that have been provided under the terms of the Principal Lubricants Agreement that we have entered into with ExxonMobil. On March 19, 2018, we entered into an agreement with ExxonMobil Lubricants Trading Company which grants our subsidiary Moove the exclusive production, import, distribution and marketing rights in Brazil, Bolivia, Paraguay and Uruguay of lubricants and certain other related products under the Mobil brand until November 30, 2038. This agreement came into force on December 1, 2018. The termination or failure to renew these agreements, or the failure by ExxonMobil to adequately maintain and protect its intellectual property rights, could materially and adversely affect our results of operations or could require significant unplanned investments by us if we are forced to develop or acquire alternative technology. In the future, it may be necessary or desirable to obtain other third-party technology licenses relating to one or more of our products or relating to current or future technologies to enhance our product offerings. However, we may not be able to obtain licensing rights to the needed technology or components on commercially reasonable terms or at all.
Risks Related to Rumo
Rumo depends on a few major customers for a significant portion of its revenue.
The majority of the cargo Rumo transports is for the agricultural commodities industry. Rumo’s major clients are export companies participating in this market, such as Cargill, Bunge, ADM, Amaggi, COFCO, Louis Dreyfus and Raízen, among others. Those clients accounted for a significant share of Rumo’s total net revenue. We cannot guarantee that Rumo will obtain similar revenue from its major clients in the future. Any change by Rumo’s major clients in their demand for transportation services, including logistics services, may have a material adverse effect on Rumo’s business, financial condition and results of operations. Moreover, Rumo’s revenue predominantly derives from transportation agreements between Rumo and its clients. We cannot guarantee that these transportation agreements will be renewed once they have expired. Failure to renew or otherwise extend these agreements may adversely affect Rumo’s and our business, financial condition and results of operations. For further information, see “Information on the Company—B. Business Overview—Rumo—Overview—Major Customers.”
Rumo’s significant indebtedness could adversely affect its financial health and prevent it from fulfilling its indebtedness obligations, which would have a material adverse effect on us, our financial condition and reduce our ability to raise capital to finance our investments and our results of operations and would adversely impact our ability to recover from economic changes.
Rumo’s indebtedness level and the composition of its indebtedness could have important consequences to its business. For example, it could: (i) require Rumo to reserve a substantial part of its operational cash flows to pay principal and interest on Rumo’s indebtedness, which will reduce the availability of its cash flow to fund working capital, capital expenditures, acquisitions and investments; (ii) limit its flexibility in planning for, or reacting to, changes in our business and the industry in which we operate; (iii) limit its ability to borrow additional funds, obtain bank guarantees or collateral insurance and generally increase its borrowing costs; and (iv) place Rumo at a competitive disadvantage compared to our competitors that have less indebtedness. We cannot assure you that Rumo will be able to refinance any such indebtedness on terms satisfactory to it or at all.
In addition, certain of Rumo’s financing agreements are subject to early maturity due to cross default and cross acceleration provisions in case Rumo fails to comply with certain nonfinancial covenants or defaults on certain of its financial obligations under such financing agreements.
Any of the aforementioned developments could have a material adverse effect on Rumo as well as on us, our financial condition and results of operations.
Certain of Rumo’s assets are involved in the provision of public rail transport services and, as a result, would not be available to honor Rumo’s obligations in the event of execution, liquidation or insolvency, which may have an adverse effect on Rumo’s business.
A substantial part of Rumo’s assets is involved in the provision of public services. Such assets will not be subject to liquidation in the case of Rumo’s bankruptcy nor may they be the subject of an order to guarantee the execution of a judicial sentence. Pursuant to legislation currently in force and to the concession agreements to which Rumo is a party, upon the maturity of the respective concession agreements or upon their early termination, Rumo’s assets involved in the provisions of public rail transport services will revert to the granting authority free and clear of any liens or encumbrances and may not be subject to attachment or liquidation. Accordingly, if any indemnities to be paid by the granting authority to us for these reversions are lower than the market value of the reverted assets, the amounts available for distribution to Rumo’s shareholders, including us, may be significantly reduced.
Rumo may not obtain an early renewal of the Rumo Malha Sul S.A., or “Rumo Malha Sul,” concession agreement, currently under review by the Brazilian Transportation Authority (Agência Nacional de Transporte Terrestre), or ANTT, which may have a material adverse effect on Rumo’s investment plan and growth strategy.
The concession agreement for Malha Sul expires in 2027. Rumo has already filed a formal request for an early renewal of the term of this concession agreement, similarly to the request made in connection with the renewal of the Rumo Malha Paulista S.A., or “Rumo Malha Paulista,” concession agreement already approved by ANTT. See “—Rumo made certain commitments in connection with the Rumo Malha Paulista early renewal agreement and may incur additional liability if it fails to comply with them.”
In the meantime, Law No. 13,448/2017 was enacted following the conversion into law of Provisional Measure No. 752/2016 which defines the general rules governing extensions of concessions, including early renewals, as well as re-bidding of partnership contracts of the federal public administration pursuant to the provisions of Law No. 13,334/2016, in the road, rail and airport sectors. Pursuant to the terms of the new law, the granting authority will perform re-bidding if there is a breach of contract or if the concession holders are no longer capable of fulfilling the contractual and financial obligations originally undertaken. In the case of early renewals, rail concession holders must demonstrate provision of adequate services, including compliance with production and safety targets or of safety targets set forth in the applicable contracts, pursuant to the provisions of article 6, paragraph 2 of Law No. 13,448/2017. In addition, contract amendments must contain a timeline for required investments and include measures to discourage potential noncompliance or delay in complying with obligations (such as the annual rebalancing discount and the additional grant payment).
We cannot guarantee that Rumo’s requests for renewals will be successful or that they will occur within the timeframe which we anticipate. In addition, any early renewal may be subject to certain conditions precedent or the applicable concessions may be renewed on terms less favorable than those currently in place. Rumo may also face significant competition from third parties if the granting authority decides to subject our maturing concessions to a re-bidding process.
Rumo made certain commitments in connection with the Rumo Malha Paulista early renewal agreement and may incur additional liability if it fails to comply with them.
The concession contract for Malha Paulista was initially going to expire in 2028. In September 2015, Rumo filed a formal request with ANTT for an early extension of the term of this contract. Such request resulted in the signature of the Second Addendum to the Concession Agreement of Rumo Malha Paulista of December 30, 1998 and its respective attachments. On May 27, 2020, Rumo entered into an amendment to the concession agreement relating to Rumo Malha Paulista with the ANTT. The amendment was reviewed and authorized by the Brazilian Federal Court of Accounts (Tribunal de Contas da União). As a result, the term of the Rumo Malha Paulista concession is expected to be extended to 2058, provided that Rumo complies with certain obligations such as investments to increase its operating capacity. Furthermore, the new value of the concession grant is approximately R$3.4 billion, to be paid in quarterly installments during the term from 2038 until 2058, with estimated investments of R$6.1 billion (as of the signing of the contract).
Rumo may not be able to comply with all of the conditions imposed by the public authority in the Addendum, which could prevent Rumo from extending the concession to 2058. Failure to comply with such conditions may subject Rumo to sanctions.
Any investment overages in connection with Rumo’s expansion strategy could materially and adversely affect anticipated returns and jeopardize Rumo’s financial condition.
Rumo is actively engaged in multiple capacity expansion initiatives over the next few years. Carrying these out in compliance with applicable regulatory requirements constitutes a significant undertaking. These efforts, coupled with routine operational maintenance, constitute substantial financial commitments. Example of such commitments include the Paulista Network Investments Obligations, the Rumo Extension Project in the State of Mato Grosso, and investments in the expansion of the Internal Railway of the Port of Santos (Ferrovia Interna do Porto do Santos).
Given the complexity and long timeline of these investments, spanning several years, their projected funding requirements are susceptible to changes in scope and inflationary pressures. If Rumo’s estimates of the funding and other commitments to these projects prove to be too low, Rumo may be required to expend significant additional financial and other resources to complete these projects. Rumo may also not be able to complete these projects in a timely manner, on budget or at all. Any such developments could have a material adverse effect on Rumo’s business, financial condition and results of operations.
Rumo is subject to certain global and domestic market forces that could have an adverse effect on its business and results of operations.
The transportation and logistics industries are highly cyclical and generally subject to fluctuations in the global economy. As a result, Rumo’s operations are subject to a number of risks that could adversely impact its results of operations, including, among others: (i) global and Brazilian macroeconomic conditions, (ii) global demand for agricultural and other commodities, (iii) Brazil’s competitiveness versus other countries for the supply of agricultural commodities, (iv) the competitiveness of domestic transport and logistics providers in Brazil, (v) local demand for transportation of agricultural commodities to foreign markets, (vi) efficient operation of its railroad to meet transportation demand, (vii) shutdowns, blockades, demonstrations, changes in legislation or strikes that interfere with Rumo’s operations and the operations of its business partners, whether on the highway, railroad or port, (viii) specific market factors, and (ix) changes in demand from customers that operate in highly cyclical industries, such as oil and gas and agriculture.
Rumo may not be able to fulfill the terms of its concession, sub-concession, authorization agreements and leases, which may result in fines, other penalties, and, depending on the severity of the breach, the loss of the respective concessions, sub-concessions, authorizations and leases. Rumo may also fail to renew such concessions, sub-concessions, authorizations and leases.
Brazilian railway concessions are subject to premature termination under certain circumstances, including by the Brazilian authorities taking back control of the service in accordance with applicable law, or by the termination of the concession due to breach of the respective contracts, especially by the inadequate provision of the railway service under the concession contracts. Failure to comply with the terms of a concession agreement may also result in fines, the loss of operating rights or other penalties. Any fines, penalties or loss of operating rights could materially adversely affect Rumo’s business, financial condition and results of operations.
Rumo and its subsidiaries also hold leases for certain ports. If Rumo’s subsidiaries fail to comply with the applicable regulatory rules or contractual obligations relating to their terminals, their leases may be terminated early pursuant to the Concession Law (Law No. 8,987/1995), which applies to port leases. Termination of Rumo’s port lease agreements may adversely impact Rumo’s transportation costs and the turnaround time for the export of Rumo’s products, as well as Rumo’s revenues from service agreements related to Rumo’s port facilities, which could have a material adverse effect on Rumo’s business, financial condition and results of operations. Rumo may also fail to renew such leases, which could also have a material adverse effect on Rumo’s business, financial condition and results of operations.
In addition, port assets deemed essential to the continuity of port operations will revert to the granting authority upon expiration of the concession. The reversion following expiration is subject to indemnification for investments in assets not yet amortized or depreciated which were undertaken to guarantee service continuity. Upon termination of the concession, it is possible that the investments made in those assets will have not been entirely amortized or depreciated. In this case, Rumo and the granting authority will negotiate the amount of any indemnification for such investments, to the extent such investments have been previously approved by the granting authority. As the final decision on this amount will be made solely by the granting authority, Rumo’s financial condition may be negatively impacted if indemnification eventually approved is not sufficient to compensate us for the investments made.
Any of the aforementioned developments could have a material adverse effect on Rumo as well as on us, our financial condition and results of operations.
Rumo’s Brazilian rail tariffs are subject to a maximum rate established by the Brazilian government.
Under Rumo’s rail network concession agreements, tariffs for our rail freight services are subject to a maximum rate. Maximum tariff rates that Rumo is allowed to charge are adjusted for inflation according to variations in the Price Index-Domestic Supply (Índice Geral de Preços – Disponibilidade Interna), or IGP-DI index (or a substitute index) in accordance with applicable Brazilian law or concession agreements. Currently, tariff adjustments are performed on an annual basis, at different months of the year, depending on the terms of each concession agreement. Additionally, the tariffs Rumo charges for rail freight services on our rail network can be revised upward or downward if there is a justified, permanent market and/or costs change that may alter the rail network concession agreements’ economic and financial balance, or as determined by the Brazilian government every five years. The mechanisms for restoring the financial balance are defined in Brazilian law or in the agreements and must be requested by the non-breaching party along with adequate economic evidence.
ANTT may implement a review of the reference rates, changing the methodology for defining the tariffs originally established. Any application of revised tables may impact Rumo’s revenues and we cannot guarantee that future tariffs will be set at a level that will allow Rumo to continue operating profitably.
We cannot predict the outcome of an investigation into the conduct of former employees of ALL – América Latina Logística S.A., or “ALL,” prior to its acquisition by Rumo.
During 2016, Rumo became aware of certain press reports alleging that improper payments to government officials were made by former employees of ALL (prior to being acquired by Rumo) in connection with an investment by Fundo de Investimento do Fundo de Garantia do Tempo de Serviço, or “FI-FGTS,” in Rumo’s indirect subsidiary Brado Logística and in ALL. As a result of these allegations, Rumo hired external advisors to conduct an internal investigation. Upon completion of the investigation, in July 2016, we voluntarily submitted a report to the Public Prosecutor’s Office, clarifying that the facts found refer to the period prior to our merger with ALL.
Rumo has been made aware that information regarding this investigation report was added to the records of a criminal investigative procedure initiated by the Federal Prosecutor’s Office to investigate these and other facts. As of the date of this current report, this investigative proceeding is ongoing.
In June 2021, Rumo became aware of certain press reports alleging that a former chief executive officer of ALL (prior to being acquired by Rumo) had been involved in suspicious payments made in 2013 to companies connected to a certain politician. Rumo immediately investigated and informed the legal authorities. These payments had been also reported in 2016 to the legal authorities, as noted above. A criminal investigation is ongoing, but Rumo is not a party to this criminal investigation. As of the date of this current report, we can neither predict the outcome of the criminal investigation, the consequences of any findings or any measures that may be taken by local authorities, any of which may have a material adverse effect on Rumo.
The rail transportation services by Rumo and its partners are regulated and any measures adopted by governmental authorities may have a material adverse effect on it.
The rail transportation services performed by Rumo and its partners are extensively regulated and supervised by the Brazilian federal government, especially through the Brazilian Ministry of Transportation and Ministry of Ports and Airports, as well as certain regulatory agencies, which regulate Rumo’s activities through laws, decrees, provisional measures, ordinances and resolutions, among other legislative and regulatory acts. Thus, any changes in the legislation or in the regulation related to the railway sector may adversely affect our business and the financial and operational results.
The concession contracts are administrative contracts, governed by public law rules, which give the applicable governmental authority the right to unilaterally modify, terminate and supervise them as well as to apply sanctions. Accordingly, the actions of the governmental authority may adversely affect the services provided by Rumo if, for example, (i) there is the imposition of new obligations, (ii) there is the imposition of a requirement to make additional investments not originally provided for in the concession agreements, or (iii) the scope of the concession agreements is reduced or certain provisions are not enforced (such as the possible early extension, the extension of the term of the concessions in force or their execution under conditions that are not favorable to us). Any such developments could have a material adverse effect on Rumo’s business, financial condition and results of operations.
We cannot predict which actions will be taken by the Brazilian federal government in the future and in which aspects such actions may affect Rumo. If Rumo is required to operate in a manner substantially different from that set forth in its business plans, Rumo’s and our business, financial condition and results of operations may be materially adversely affected.
Any disruptions to Malha Norte business could adversely affect Rumo’s results of operations and financial condition.
In the years ended December 31, 2023, 2022 and 2021, the volume of goods transported (in TKUs) in Rumo’s Malha Norte operations accounted for 83%, 82% and 78% of Rumo’s total transported volume, respectively.
The performance of Malha Norte’s operations is materially dependent on certain critical infrastructures, including the Port of Santos, the Rondonópolis Inland Transshipment Terminal and the railway segment of the Malha Paulista. As a result, Malha Norte’s operations are subject to various potential disruptions, including accidents, public security concerns, strikes, blockades, demonstrations, productivity issues at the Port of Santos terminals and adverse weather conditions leading to landslides and terminal shutdowns, among others. Any incidents affecting Malha Norte or the critical infrastructures on which it depends may have a material adverse effect on Rumo’s and our business, financial condition and results of operations.
Rail transportation is inherently hazardous, and Rumo may not be able to prevent accidents or other occurrences.
Rail transportation involves a series of risks including mechanical failures, derailments and other accidents which may result in disruptions to Rumo’s rail network, fines or other penalties, damage to rolling stock and loss of transported goods. Safety management actions and protocols by Rumo may prove inadequate or insufficient in preventing such accidents or other occurrences, particularly in light of external factors and/or actions by third parties. Any such consequences may expose employees and nearby communities to considerable risks, including loss of life, significant property damage and environmental contamination. Moreover, the proximity of railway infrastructure to storage facilities, commercial areas and industrial sites heightens the potential for exacerbated damage. The occurrence of any of these events could have a material adverse effect on Rumo’s and our business, financial condition and results of operations.
| 44 |
Rumo’s expansive railway infrastructure is susceptible to criminal activities, and inadequate public safety conditions may materially adversely affect Rumo’s operations.
Violent and nonviolent criminal activities, ranging from cargo theft to vandalism, directly affect Rumo’s operations and could result in significant damage and liabilities. Rumo’s ability to address these challenges is limited as public security in Brazil is primarily a governmental responsibility. Rumo may experience capacity constraints and decreased productivity due to delays caused by cargo removal from tracks, repairs necessitated by external interventions, knock-on effects from travel disruptions and volume reallocations, obligations to compensate third parties, loss of or damage to property, among other adverse consequences.
Rumo could also incur significant expenses and/or loss of revenue as a result of decreased transport volumes and increased expenses with maintenance, compensation, security and contractual penalties for unfulfilled commitments, such as take-or-pay agreements. These risks are underscored, for instance, by notable incidents like grain and fuel thefts in the Baixada Santista region of the State of São Paulo in early 2023, which were extensively covered by the media. Similarly, acts of vandalism could result in environmental harm, including product and fuel leaks into soil and water resources, for which Rumo could be held liable, whether or not Rumo is actually responsible for such environmental harm.
Any such developments could have a material adverse effect on Rumo’s and our business, financial condition and results of operations.
Risks Related to Radar
Owning and managing rural properties involves significant risks.
We own a rural properties management business, which manages 305,802 hectares of land in eight Brazilian states, all of which are leased to third parties. The risks involved in owning and managing rural properties include:
- the value of rural properties can fluctuate based on various factors, such as commodity supply and demand, government policies, economic conditions and weather patterns. Therefore, there is a risk that the value of the rural properties may fluctuate, which could result in gains/losses on the investment; and
- lease payments are made in Brazilian reais and are based on a fixed amount of commodity (sugar or soybean bags). As a result, the revenue could be impacted by the following market factors:
- commodity prices and exchange rates as the lease model is based on the Brazilian domestic market price. Accordingly, global supply and demand and exchange rate fluctuations will directly impact local prices, and therefore, lease revenue;
- the yield is dependent on various environmental factors, such as weather conditions, pests and diseases. These factors can impact crop yield and quality which, in turn, can indirectly affect lease income. Additionally, the cost of production can increase due to unexpected events such as natural disasters, which can reduce profitability. The lease model prevents the landowner from being exposed to production risk; however, in the event of substantial loss, lease revenue could be impacted;
- operating rural properties requires significant knowledge, skills and resources. There is a risk that the operators (whether they are farmers or other rural professionals) may not be able to manage the land effectively, resulting in decreased profitability or even crop failure. Similarly to production risk, the lease model also prevents the landowner from being exposed to operational risk; however, in the event of total loss, lease revenue could be impacted; and
- legal and regulatory risk, in that agriculture is subject to various laws and regulations related to land use, water rights, labor and environmental protection, such as the Brazilian Forest Code. There is a risk that changes in law or regulations may impact the profitability of the rural properties investment.
We consider these risks before acquiring rural properties as investments. However, we cannot assure you that we will always be able to accurately assess these risks, or that other risks which we may not have anticipated will not materialize. Any such developments could have a material adverse effect on our business, financial condition and results of operations.
Risks Related to Our American Depositary Shares and Our Common Shares
Our ADSs may not be as liquid as our common shares.
Some companies that have issued ADSs on U.S. stock exchanges have experienced lower levels of liquidity in their ADSs than is the case for their equity securities listed on their domestic exchange. There is a possibility that our ADSs, listed on the NYSE, will be less liquid than our common shares listed on the B3.
There is no guarantee that an active public market in our ADSs will develop or be sustained. If an active market for our ADSs does not develop, the market price and liquidity our ADSs may be adversely affected.
Our maintenance of two exchange listings may adversely affect liquidity in the market for our common shares and ADSs and result in pricing differentials between the two exchanges.
Our common shares are listed on the B3 and our ADSs are listed on the NYSE. It is not possible to predict how trading will be conducted on such markets. The listing of our common shares and our ADSs on two distinct exchanges may adversely affect the liquidity of such shares in one or both markets and may adversely affect the development of an active trading market for our common shares on the B3 and for our ADSs on the NYSE. In addition, differences in the trading schedules, as well as the volatility in the exchange rate of the two trading currencies, may result in different trading prices for our common shares and our ADSs.
The market price of our common shares and ADSs may be volatile.
The market price of our common shares and ADSs may be volatile. Broad general economic, political, market and industry factors may adversely affect the market price of our common shares and ADSs, regardless of our actual operating performance. Factors that could cause fluctuation in the price of our commons shares and ADSs include:
- actual or anticipated variations in quarterly operating results and the results of competitors;
- changes in financial projections by us, if any, or by any securities analysts that might cover our common shares or ADSs;
- conditions or trends in the industry, including regulatory changes or changes in the securities marketplace;
- announcements by us or our competitors of significant acquisitions, strategic partnerships or divestitures;
- announcements of investigations or regulatory scrutiny of our operations or lawsuits filed against us;
- additions or departures of key personnel;
- volatility in global and Brazilian capital markets;
- variations in exchange rates and in particular the exchange rate between the Brazilian real and the U.S. dollar;
- other factors affecting the price of securities listed on the B3 and NYSE;
- the ongoing war between Russia and Ukraine and conflicts in the Middle East, which may have repercussions on the world’s geopolitical and economic scenarios;
- the policies adopted or to be adopted by the new administration in Brazil following the 2022 presidential elections; and
- issuances or sales of our common shares or ADSs, including sales of shares by our directors and officers or our key investors.
Shareholders could be diluted in the future, which could also adversely affect the market price of our common shares and ADSs.
It is possible that we may decide to offer additional common shares or ADSs or securities convertible therein in the future either to raise capital or for other purposes. If our shareholders do not take up such offer or are not eligible to participate in such offering, their proportionate ownership and voting interests would be reduced. An additional offering could have a material adverse effect on the market price of our common shares and ADSs.
In addition, according to art. 172 of Law No. 6,404, of December 15, 1976, as amended, or the “Brazilian Corporation Law,” we may not be required to grant preemptive rights to our shareholders in the event of a capital increase through a public offering of shares or securities convertible into shares, which may result in a dilution of our current shareholders’ stake in our company.
Exchange controls and restrictions on remittances abroad may adversely affect holders of our ADSs.
Brazilian laws provide that whenever a serious imbalance in Brazil’s balance of payments exists or is anticipated, the Brazilian federal government may impose temporary restrictions on the repatriation by foreign investors of the proceeds of their investment in Brazil and on the conversion of Brazilian currency into foreign currency. For example, for six months in 1989 and early 1990, the Brazilian federal government restricted all fund transfers that were owed to foreign equity investors and held by the Brazilian Central Bank, in order to preserve Brazil’s foreign currency reserves. These amounts were subsequently released in accordance with Brazilian federal government directives. Although the Brazilian federal government has never exercised such a prerogative since, we cannot guarantee that the Brazilian federal government will not take similar actions in the future.
You may be adversely affected if the Brazilian federal government imposes restrictions on the remittance to foreign investors of the proceeds of their investments in Brazil and, as it has done in the past, on the conversion of the real into foreign currencies. These restrictions could hinder or prevent the conversion of dividends, distributions or the proceeds from any sale of shares, as the case may be, into U.S. dollars and the remittance of U.S. dollars abroad. We cannot assure that the government will not take this measure or similar measures in the future. Holders of our ADSs could be adversely affected by delays in, or a refusal to grant, any required governmental approval for conversion of real payments and remittances abroad in respect of the shares, including the shares underlying our ADSs. In such a case, the depositary will distribute reais or hold the reais it cannot convert for the account of our ADS holders who have not been paid.
Holders of our ADSs may face difficulties in serving process on or enforcing judgments against us and other persons.
We are organized under, and are subject to, the laws of Brazil, and substantially all our directors and executive officers and our independent registered public accounting firm reside or are based in Brazil. Substantially all of our assets and those of these other persons are located in Brazil. As a result, it may not be possible for holders of the ADSs to effect service of process upon us or these other persons within the United States or other jurisdictions outside Brazil or to enforce against us or these other persons judgments obtained in the United States or other jurisdictions outside Brazil. Because judgments of U.S. courts for civil liabilities based upon the U.S. federal securities laws may only be enforced in Brazil if certain conditions are met, our ADS holders may face greater difficulties in protecting their interests due to actions by us or our directors or executive officers than would shareholders of a U.S. corporation.
The relative volatility and illiquidity of the Brazilian securities markets may adversely affect holders of our common shares and ADSs.
Investments in securities, such as our common shares or ADSs, of issuers from emerging market countries, including Brazil, involve a higher degree of risk than investments in securities of issuers from more developed countries. The Brazilian securities market is substantially smaller, less liquid, more concentrated and more volatile than major securities markets in the United States and other jurisdictions, and may be regulated differently from the ways familiar to U.S. investors. There is also significantly greater concentration in the Brazilian securities market than in major securities markets in the United States.
The uncertainties caused by the outbreak of COVID-19 had an adverse impact on the global economy and global capital markets, including in Brazil, especially during 2020. As a result of this volatility, the B3’s circuit breaker mechanism was triggered eight times during March 2020. The prices of most securities traded on the NYSE and the B3, including the price of our common shares, were adversely affected by the COVID-19 pandemic. Impacts similar to those described above may reoccur, which may result in volatility in the price of our securities traded on the NYSE and on the B3. We cannot assure you that the price of our securities will not fall below the lowest levels at which our securities traded during the ongoing pandemic.
These features may substantially limit the ability to sell our common shares, including in the form of ADSs, at a price and time at which holders wish to do so. A liquid and active market may never develop for the ADSs, and as a result, the ability of holders of our ADSs to sell at the desired price or time may be significantly hindered.
Holders of our ADSs may face difficulties in protecting their interests because we are subject to different corporate rules and regulations than a U.S. company and holders of our ADSs may have fewer and less well-defined rights.
Holders of our ADSs are not our direct shareholders and may be unable to enforce the rights of shareholders under our bylaws and Brazilian law. Holders of our common shares are generally required under our current bylaws to resolve any disputes with us through arbitration. Our corporate affairs are governed by our bylaws and Brazilian law, which differ from the legal principles that would apply if we were incorporated in a jurisdiction in the United States, or elsewhere outside Brazil. Although insider trading and price manipulation are crimes under Brazilian law, the Brazilian securities markets are not as highly regulated and supervised as the U.S. securities markets or the markets in some other jurisdictions. In addition, rules and policies against self-dealing or for preserving shareholder interests may also be less well-defined and enforced in Brazil than in the United States and certain other countries, which may put holders of our ADSs at a potential disadvantage.
Holders of our ADSs do not have the same voting rights as our shareholders.
Holders of our ADSs do not have the same voting rights as holders of our common shares. Holders of our ADSs are entitled to the contractual rights set forth for their benefit under the deposit agreement. ADS holders exercise voting rights by providing instructions to the Depositary, as opposed to attending shareholders’ meetings or voting by other means available to shareholders. In practice, the ability of a holder of ADSs to instruct the Depositary as to voting will depend on the timing and procedures for providing instructions to the Depositary, either directly or through the holder’s custodian and clearing system.
Due to delays in notification to and by the Depositary, holders of our ADSs may not be able to give voting instructions to the Depositary or to withdraw our common shares underlying their ADSs to vote such shares in person, virtually or by proxy.
Despite our efforts, the Depositary may not receive voting materials for our common shares represented by ADSs in time to ensure that holders of such ADSs can either instruct the Depositary to vote our common shares underlying their ADSs or withdraw such shares to vote them in person, virtually or by proxy.
In addition, the Depositary’s liability to holders of ADSs for failing to execute voting instructions, or for the manner in which voting instructions are executed, will be limited by the deposit agreement for the ADSs. As a result, holders of our ADSs may not be able to exercise their rights to give voting instructions, or to vote in person, virtually or by proxy, and may not have any recourse against the Depositary or us if our common shares underlying their ADSs are not voted as they have requested or if our common shares underlying their ADSs cannot be voted.
An exchange of ADSs for common shares risks the loss of certain foreign currency remittance advantages.
Holders of our ADSs benefit from the certificate of foreign capital registration, which permits the Depositary to convert dividends and other distributions with respect to common shares into foreign currency, and to remit the proceeds abroad. Holders of our ADSs who exchange their ADSs for common shares will then be entitled to rely on the Depositary’s certificate of foreign capital registration for five business days from the date of exchange. Thereafter, they will not be able to remit non-Brazilian currency abroad unless they obtain their own certificate of foreign capital registration, or unless they qualify under Resolution No. 4,373/2014 of the CMN, which entitles certain investors to buy and sell shares on Brazilian stock exchanges without obtaining separate certificates of registration. There can be no assurance that the certificate of registration of the Depositary, or any certificate of foreign capital registration obtained by holders of our ADSs, will not be affected by future legislative or regulatory changes, or that additional Brazilian law restrictions applicable to their investment in our ADSs may not be imposed in the future.
Holders of our ADSs may not be able to exercise the preemptive rights relating to the common shares.
Holders of our ADSs may not be able to exercise the preemptive rights relating to the common shares underlying their ADSs unless a registration statement under the Securities Act is effective with respect to the rights or an exemption from the registration requirements of the Securities Act is available. We are not obligated to file a registration statement with respect to the shares or other securities relating to these preemptive rights, and we cannot assure holders of the ADSs that we will file any such registration statement. Unless we file a registration statement or an exemption from registration applies, holders of our ADSs may receive only the net proceeds from the sale of their preemptive rights by the Depositary or, if the preemptive rights cannot be sold, the rights will be allowed to lapse.
The holders of our common shares (including the common shares underlying the ADSs) may not receive dividends or interest on own capital.
According to our current bylaws, our shareholders are entitled to receive a mandatory minimum annual dividend equal to 25% of our annual net profit, calculated and adjusted under the terms of the Brazilian Corporation Law. Our current bylaws allow for the payment of intermediary dividends, to the retained earnings account or the existing earnings reserves in the last yearly or six-month balance, by means of the annual dividend. We may also pay interest on own capital, as described by Brazilian law. The intermediary dividends and the interest on own capital declared in each fiscal period may be imputed to the mandatory dividend that results from the fiscal period in which they are distributed. At the general shareholders’ meeting, shareholders may decide on the capitalization, on the offset of our losses or on the net profit retention, as provided for in the Brazilian Corporation Law, with the aforementioned net profit not being made available for the payment of dividends or interest on own capital.
In addition, Brazilian Corporation Law allows publicly-held companies, like us, to suspend the required minimum distribution of dividends. The payment of dividends may be suspended if our management reports at an annual shareholders’ meeting that such distribution would be inadvisable in view of our financial condition and has provided the shareholders at the annual general shareholders’ meeting with an opinion to that effect, which has been reviewed by our fiscal council, if installed. In addition, our management must submit a report to the CVM within five days following said meeting clarifying the reasoning for any such non-payment. If the abovementioned occurs, holders of the common shares (including the common shares underlying the ADSs) may not receive dividends or interest on own capital.
Judgments of Brazilian courts with respect to our shares will be payable only in reais.
If proceedings are brought in the courts of Brazil seeking to enforce our obligations in respect of the common shares, we will not be required to discharge our obligations in a currency other than reais. Under Brazilian exchange control limitations, an obligation in Brazil to pay amounts denominated in a currency other than reais may only be satisfied in Brazilian currency at the exchange rate, as determined by the Brazilian Central Bank, in effect on the date the judgment is obtained, and such amounts are then adjusted to reflect exchange rate variations through the effective payment date. The then-prevailing exchange rate may not afford non-Brazilian investors with full compensation for any claim arising out of or related to our obligations under the ADSs.
As a foreign private issuer, we have different disclosure and other requirements than U.S. domestic registrants.
As a foreign private issuer under the Exchange Act, we may be subject to different disclosure and other requirements than U.S. domestic registrants. For example, as a foreign private issuer, in the United States, we are not subject to the same disclosure requirements as a U.S. domestic registrant under the Exchange Act, including the requirements to prepare and issue quarterly reports on Form 10-Q or to file current reports on Form 8-K upon the occurrence of specified significant events, the proxy rules applicable to U.S. domestic registrants under Section 14 of the Exchange Act or the insider reporting and short-swing profit rules applicable to U.S. domestic registrants under Section 16 of the Exchange Act. In addition, we rely on exemptions from certain U.S. rules, which permit us to follow Brazilian legal requirements rather than certain of the requirements that are applicable to U.S. domestic registrants.
Furthermore, foreign private issuers are required to file their annual report on Form 20-F within 120 days following the end of each fiscal year, while U.S. domestic issuers that are accelerated filers are required to file their annual report on Form 10-K within 75 days following the end of each fiscal year. As a result of the above, even though, we are required to make submissions on Form 6-K disclosing the information that we have made or are required to make public pursuant to Brazilian law, or are required to distribute to shareholders generally, and that is material to us, you may not receive information of the same type or amount that is required to be disclosed to shareholders of a U.S. company.
We are a foreign private issuer and, as a result, in accordance with the listing requirements of the NYSE, we rely on certain home country governance practices from Brazil, rather than the corporate governance requirements of the NYSE.
We report under the Exchange Act as a non-U.S. company with foreign private issuer status. The NYSE rules provide that foreign private issuers are permitted to follow home country practice in lieu of certain NYSE corporate governance standards. The standards that are applicable to us are considerably different than the standards applied to U.S. domestic issuers. For instance, we are not required to:
- have a majority of independent members on our board of directors (other than as may result from the requirements for audit committee member independence under the Exchange Act);
- have a minimum of three independent members on our audit committee;
- have a compensation committee or a nominating and corporate governance committee; or
- have regularly scheduled executive sessions of our board that consist of independent directors only.
As a foreign private issuer, we may follow our home country practice in Brazil (including the rules and regulations of the B3 and the CVM) in lieu of the above requirements. Therefore, the approach to governance adopted by our board of directors may be different from that of a board of directors consisting of a majority of independent directors, and, as a result, our management oversight may be more limited than if we were subject to all of the NYSE corporate governance standards. Accordingly, you may not have the same protections afforded to shareholders of companies that are not foreign private issuers. See “Directors, Senior Management and Employees—C. Board Practices—Summary of Significant Differences of Corporate Governance Practices.”
Holders of Cosan ADSs may not be entitled to a jury trial with respect to claims arising under the deposit agreement, which could result less favorable results to the plaintiff(s) in any such action.
The deposit agreement governing the Cosan ADSs representing the Cosan common shares provides that holders and beneficial owners of Cosan ADSs irrevocably waive the right to a trial by jury in any legal proceeding arising out of or relating to the deposit agreement, the Cosan common shares or the Cosan ADSs or the transactions contemplated thereby, including claims under U.S. federal securities laws, against us or the Depositary to the fullest extent permitted by applicable law. The waiver continues to apply to claims that arise during the period when a holder holds the Cosan ADSs, whether the holder of Cosan ADSs acquired the Cosan ADSs pursuant to the Merger or in secondary transactions. If this jury trial waiver provision is prohibited by applicable law, an action could nevertheless proceed under the terms of the deposit agreement with a jury trial. To our knowledge, the enforceability of a contractual pre-dispute jury trial waiver in connection with claims arising under the U.S. federal securities laws has not been finally adjudicated by the United States Supreme Court. However, we believe that a jury trial waiver provision is generally enforceable under the laws of the state of New York, which govern the deposit agreement, by a court of the state of New York or a federal court in New York, which have jurisdiction over matters arising under the deposit agreement, applying such law. In determining whether to enforce a jury trial waiver provision, New York courts and federal courts will consider whether the visibility of the jury trial waiver provision within the agreement is sufficiently prominent such that a party has knowingly waived any right to trial by jury. We believe that this is the case with respect to the deposit agreement, the Cosan common shares and the Cosan ADSs and the transactions contemplated thereby. In addition, New York courts will not enforce a jury trial waiver provision in order to bar a viable setoff or counterclaim sounding in fraud or one which is based upon a creditor’s negligence in failing to liquidate collateral upon a guarantor’s demand, or in the case of an intentional tort claim (as opposed to a contract dispute), none of which we believe are applicable in the case of the deposit agreement, the Cosan common shares or the Cosan ADSs or the transactions contemplated thereby. No condition, stipulation or provision of the deposit agreement or Cosan ADSs serves as a waiver by any holder or beneficial owner of Cosan ADSs or by us or the depositary of compliance with any provision of the U.S. federal securities laws. If you or any other holder or beneficial owner of Cosan ADSs brings a claim against us or the Depositary in connection with matters arising under the deposit agreement, the Cosan common shares or the Cosan ADSs or the transactions contemplated thereby, you or such other holder or beneficial owner may not be entitled to a jury trial with respect to such claims, which may result in increased costs to bring a claim, and have the effect of limiting and discouraging lawsuits against us and/or the Depositary. If a lawsuit is brought against us and/or the Depositary under the deposit agreement, it may be heard only by a judge or justice of the applicable trial court, which would be conducted according to different civil procedures and may augur different results than a trial by jury would have had, including results that could be less favorable to the plaintiff(s) in any such action.
Although, based on information presently available, we do not expect that we were a PFIC in 2023, this is subject to further evaluation when the Company’s audited consolidated financial statements for the year ended December 31, 2023 in accordance with PCAOB standards have been completed, and there is a risk that we were a PFIC for 2023 and that we will be a PFIC for 2024 or in future taxable years, which could result in adverse U.S. federal income tax consequences to U.S. investors in the ADSs.
In general, a non-U.S. corporation will be a “passive foreign investment company,” or “PFIC,” for U.S. federal income tax purposes for any taxable year in which, after applying certain look-through rules, either (1) at least 75% of its gross income is “passive income” or (2) at least 50% of the average quarterly value of its assets consists of assets that produce “passive income” or are held for the production of “passive income.” For purposes of these calculations, a non-U.S. corporation that owns (or is treated as owning for U.S. federal income tax purposes), directly or indirectly, at least 25% by value of the stock of another corporation is treated as if it held its proportionate share of the assets of the other corporation and received directly its proportionate share of the income of the other corporation. On the other hand, an equity investment in a corporation representing less than 25% by value of that corporation is generally treated as a passive asset for purposes of the PFIC rules. Passive income for this purpose generally includes dividends, interest, royalties, rents and gains from foreign currency, securities and certain commodities transactions. In addition, the value of a company’s goodwill is an active asset under the PFIC rules to the extent attributable to activities that produce active income.
Based on information currently available to us, we expect that we were not a PFIC for our taxable year ended December 31, 2023. However, this is subject to further evaluation when the Company’s audited consolidated financial statements for the year ended December 31, 2023 in accordance with PCAOB standards have been completed, and we cannot assure you that we will not be considered a PFIC for the 2023 taxable year or 2024 or any future taxable year. Our PFIC status for any taxable year is an annual factual determination that can be made only after the end of that year and depends on the composition of our income and assets and the value of our assets from time to time. Moreover, we hold significant minority investments in certain entities (representing less than 25% by value of the entity’s equity). Accordingly, our PFIC status for any taxable year will depend in part on the value of those minority investments relative to the value of our active assets, including goodwill. The value of our goodwill may be determined, in large part, by reference to our market capitalization. If the value of our minority (less-than-25%-owned) equity investments were to increase relative to our active assets (in particular, if our market capitalization were to decline), we could be treated as a PFIC for our taxable year 2024 and/or future taxable years. Thus, we cannot assure you that we will not be considered a PFIC for any taxable year.
If we are a PFIC for any taxable year during which you hold common shares or ADSs, you generally will be subject to adverse U.S. federal income tax consequences, including increased tax liability on disposition gains and “excess distributions,” and additional reporting requirements. This will generally continue to be the case even if we ceased to be a PFIC in a later taxable year, unless certain elections are made. See “Taxation—U.S. Federal Income Tax Considerations—Passive Foreign Investment Company Rules.”
Risks Related to the Countries in Which We Operate
Our international operations expose us to political and economic risks in other countries.
Our international activities and those of our subsidiaries, investees and jointly-controlled companies, including the Joint Venture, expose us to risks not faced by companies that operate solely in Brazil. Risks associated with our international operations include: (i) foreign exchange controls; (ii) changes in the political or economic conditions in a specific country or region, especially in emerging markets such as Argentina; (iii) potentially negative consequences resulting from changes to regulatory requirements; (iv) difficulties and costs associated with our compliance with different laws, treaties and complex international regulations; (v) tax rates that may exceed those applicable in Brazil or Argentina and other countries or gains that may be subject to withholding regimes and an increase in repatriation taxes; (vi) the imposition of trade barriers; and (vii) limitations on the repatriation of undistributed profits. The realization of any of these risks may materially adversely affect our business, results of operations or financial condition.
Historically, the Brazilian government has influenced and continues to influence the economy of Brazil, which may negatively affect our business and financial performance.
Political and economic conditions directly affect our business and can result in a material adverse effect on our operations and financial condition. Macroeconomic policies imposed by the government can have significant impacts on Brazilian companies, including ourselves, as well as market conditions and securities prices in Brazil.
The Brazilian economy has been characterized by frequent and occasionally extensive intervention by the Brazilian government and unstable economic cycles. The Brazilian government has often changed monetary, taxation, credit, tariff and other policies to influence the course of Brazil’s economy. The Brazilian government’s actions to control inflation have at times involved setting wage and price controls, blocking access to bank accounts, imposing exchange controls and limiting imports into Brazil.
Our business, financial performance and prospects, as well as the market prices of our shares, may be adversely affected by, among others, the following factors:
- general, political, economic and social developments in Brazil, including any adverse impact of the ongoing war between Russia and Ukraine and conflicts in the Middle East;
- inflation;
- exchange rate movements;
- exchange rate control policies;
- interest rate and exchange rate fluctuations;
- the downgrade of Brazil’s credit rating;
- liquidity available in the domestic capital, credit and financial markets;
- expansion or contraction of the Brazilian economy, as measured by rates of growth in gross domestic product, or “GDP;”
- oil and gas sector regulations, including price policies;
- ports, customs and tax authorities’ strikes;
- changes in transportation market regulations;
- energy and water shortages and rationing;
- price increases of oil and other inputs;
- price instability;
- social and political instability, including allegations of corruptions against political parties, civil servants and others;
- the political climate leading up to and eventual outcome of the 2022 presidential elections in Brazil;
- disease outbreaks, such as the COVID-19 pandemic;
- fiscal policies;
- the ongoing COVID-19 pandemic, including novel and variant strains and vaccine development and roll-out, the Brazilian government’s response to the COVID-19 pandemic, and the effects of the COVID-19 pandemic and the government’s response to it on the economic, social and political situation in Brazil; and
- other economic, political, diplomatic and social developments in or affecting Brazil.
Instability resulting from any changes made by the Brazilian government to policies or regulations that may affect these or other factors in the future may contribute to economic uncertainty in Brazil and intensify the volatility of Brazilian securities markets and securities issued abroad by Brazilian companies. The President of Brazil has the power to define the policies and actions of the Brazilian government in relation to the Brazilian economy and thereby affect the operations and financial performance of Brazilian companies. The Brazilian government may be subject to internal pressure to change the current macroeconomic policies in order to achieve higher rates of economic growth. We cannot predict what policies will be adopted by the Brazilian government. Moreover, in the past, the Brazilian economy has been affected by the country’s political events, which have also affected the confidence of investors and the public in general, thereby adversely affecting the performance of the Brazilian economy. Any indecisiveness by the Brazilian government in implementing changes to certain policies or regulations may contribute to economic uncertainty in Brazil and heightened volatility for the Brazilian securities markets and securities issued abroad by Brazilian companies.
These factors, as well as uncertainty as to whether the Brazilian government will apply changes to its policy or regulations that may affect any of the abovementioned factors or other factors in the future, can lead to political and economic uncertainty and increase the volatility of the capital markets and the securities issued by Brazilian companies. Changes in such policies and regulations may have a negative impact on our operating results and financial position and the price of our common shares and ADSs.
The deterioration of economic and market conditions in other countries may have a negative impact on the Brazilian economy and on our business.
The market for securities issued by Brazilian companies is influenced, to differing degrees, by global economies and market conditions, especially those of Latin American countries and emerging markets. Investors’ reactions to developments in other countries may have a negative impact on the value of Brazilian companies’ securities. Crises or economic policies in other countries may reduce investor demand for Brazilian companies’ securities, including ours and those of our subsidiaries, which may adversely affect the market price of their securities, and the capacity of obtaining financing. In the past, negative developments in the economic conditions of emerging markets led to significant withdrawals of resources from Brazil, and a drop in the amount of foreign capital in the country. Changes in the share prices of public companies, lack of available credit, cost‑cutting, a slowdown in the global economy, exchange rate instability, interest rate increases in Brazil or abroad, and inflationary pressure may adversely affect the Brazilian economy and capital markets, which may reduce global liquidity and investor interest in Brazilian capital markets, which, in turn, may negatively affect the price of Brazilian companies’ securities, including ours and those of our subsidiaries.
Economic, political and other conditions, as well as governmental measures, may negatively affect our business and results of operations and the market price of our shares.
The Brazilian economy has been characterized by frequent and occasionally extensive interventions by the Brazilian government as well as unstable economic cycles. The Brazilian government has frequently changed monetary, tax, credit, tariff, and other policies to influence the course of the economy in Brazil. In the past, government actions to control inflation have included wage and price controls, blocking access to bank accounts, exchange controls and restrictions on imports into Brazil. Inflation, actions to combat inflation and public speculation about possible additional actions have also had significant effects on the Brazilian economy and contributed materially to economic uncertainty in Brazil and to heightened volatility in the Brazilian securities markets. We cannot control or predict what policies or actions will be taken by the Brazilian government in the future.
Brazil has experienced extremely high rates of inflation in the past and has therefore implemented monetary policies that have resulted in one of the highest interest rates in the world. According to the General Market Price Index (Índice Geral de Preços – Mercado), or “IGP-M,” a general price inflation index, Brazil recorded inflation of 3.2% in 2023, 5.45 % in 2022 and 17.8% in 2021. In addition, according to the National Extended Consumer Price Index (Índice Nacional de Preços ao Consumidor Amplo), published by the IBGE, the Brazilian price inflation rates were 4.6% in 2023, 5.8% in 2022 and 10.1% in 2021.
Uncertain macroeconomic conditions in Brazil are expected to continue throughout 2025 as considerable economic and political uncertainty remains both in Brazil and globally, compounded by the ongoing war between Russia and Ukraine and conflicts in the Middle East, which have contributed and continue to contribute to further increases in the prices of energy, oil, gas, fertilizer, basic materials and other commodities and to volatility in financial markets globally, as well as a new landscape in relation to international sanctions. There is also uncertainly about new variants and a new crisis in the COVID-19 pandemic. It is unclear whether these challenges and uncertainties will be contained or resolved, and what effects they may have on global political and economic conditions in the long term.
Brazil may experience high levels of inflation in future periods, and has recently experienced a significant increase in inflation. Periods of higher inflation may slow the rate of growth of the Brazilian economy, which could lead to reduced demand for our products in Brazil and decreased net sales. Inflation is also likely to increase some of our costs and expenses, which we may not be able to pass on to our customers and, as a result, may reduce our profit margins and net income. In addition, high inflation generally leads to higher domestic interest rates, and, as a result, the costs of servicing any floating-rate real-denominated debt may increase, resulting in lower net income. Inflation and its effect on domestic interest rates can, in addition, lead to reduced liquidity in the domestic capital and lending markets, which could affect our ability to refinance our indebtedness in those markets. Future Brazilian governmental actions, including interest rate decreases, intervention in the foreign exchange market and actions to adjust or fix the value of the real, may trigger increases in inflation and adversely affect the performance of the Brazilian economy as a whole. Any of the aforementioned developments may adversely affect the Brazilian economy as a whole, as well as our financial condition, operations and profits. Any decline in our net sales or net income and any deterioration in our financial performance would also likely lead to a decline in the market price of our common shares and ADSs.
High interest rates may adversely affect our operations and financial condition.
The Brazilian government’s measures to control inflation have frequently included maintaining a restrictive monetary policy with high interest rates, thereby limiting the availability of credit and reducing economic growth. Official interest rates in Brazil at the end of 2023, 2022 and 2021 were 11.75%, 13.75% and 9.25% per year, respectively, as established by the monetary policy committee of the Brazilian Central Bank (Comitê de Política Monetária). As of the date of this current report, the official interest rate in Brazil was 11.75%. Any increase of such interest rates may negatively affect our profits and results of operations, thereby increasing the costs of financing our operations.
High interest rates may impact our cost of obtaining loans and also the cost of indebtedness, resulting in an increase in our financial expenses. This increase may adversely affect our ability to pay our financial obligations, as it reduces our cash availability. Mismatches between contracted indexes for assets versus liabilities and/or high volatilities in interest rates may result in financial losses for us.
As of December 31, 2023, our consolidated indebtedness was either fixed or linked to various benchmark interest rates typically used in Brazil. We enter into certain financial instruments to mitigate our exposure to interest rate fluctuations. For more information, see “Management’s Discussion and Analysis of Financial Condition and Results of Operations—B. Liquidity and Capital Resources—Indebtedness.”
Significant volatility in the value of the Brazilian real in relation to foreign currencies could harm our ability to meet our liabilities denominated in foreign currencies.
The Brazilian currency has historically experienced volatility against the U.S. dollar, Euro, Yen and other foreign currencies. In the past, the Brazilian government has implemented various economic plans and exchange rate policies, including sudden devaluations and periodic mini-devaluations, during which the frequency of adjustments has ranged from daily to monthly, fluctuation band exchange rate systems, exchange controls and dual exchange rate markets.
As of April 30, 2024, the exchange rate for reais into U.S. dollars was R$5.17 per U.S.$1.00, a 6.8% appreciation of the real against the U.S. dollar since December 31, 2023. As of April 30, 2024, the exchange rate for reais into Euros was R$5.52 per €1.00, a 3.3% appreciation of the real against the Euro since December 31, 2023. As of April 30, 2024, the exchange rate for reais into Yen was R$0.03 per ¥1.00, a 4.1% depreciation of the real against the Yen since December 31, 2023. There can be no assurance that the real will not depreciate or appreciate further against the U.S. dollar, the Euro or the Yen. For more information, see “Management’s Discussion and Analysis of Financial Condition and Results of Operations—Principal Factors Affecting Our Results of Operations—Currency Fluctuations.”
Because our subsidiaries and jointly controlled entities generally invoice their sales in reais, devaluation of the real against foreign currencies may generate losses from our foreign currency-denominated liabilities as well as an increase in our funding costs with a negative impact on our ability to finance our operations through access to the international capital markets and on the market value of the shares. A strengthening of the real in relation to the U.S. dollar generally has the opposite effect, which may adversely affect our operating margins. In addition, our indebtedness has both pre-fixed and post-fixed rates and is therefore exposed to the risk of interest rate variations. If interest rates increase, our financial results may be adversely affected. Further devaluations of the Brazilian currency may occur and impact our business in the future. These foreign exchange and monetary gains or losses can be substantial, which can significantly impact our earnings from one period to the next. In addition, depreciation of the real relative to the U.S. dollar could (i) result in additional inflationary pressures in Brazil by generally increasing the price of imported products and services and requiring recessionary government policies to curb demand, and (ii) weaken investor confidence in Brazil and reduce the market price of the shares. On the other hand, further appreciation of the real against the U.S. dollar may lead to a deterioration of the country’s current account and the balance of payments and may dampen export-driven growth.
Furthermore, Brazilian law provides that, whenever there is a serious imbalance in Brazil’s balance of payments or there are compelling reasons to foresee a serious imbalance, temporary restrictions may be imposed on remittances of foreign capital abroad. Any such restrictions on remittances of foreign capital abroad may limit our ability to receive dividends from our subsidiaries. We cannot assure you that such measures will not be taken by the Brazilian government in the future. Exchange rate fluctuation will affect the U.S. dollar value of any distributions we receive from our subsidiaries as well as the U.S. dollar value of any dividends or other distributions we make to our shareholders, which will be made in reais.
In addition, we are active in the capital markets, and regularly seek to obtain funds denominated in national and foreign currencies to finance our investments and working capital. We manage a portion of our exchange rate risk through foreign currency derivative instruments. Our foreign currency debt obligations are not completely hedged, as a portion of our perpetual notes are unhedged. As a result, the possible depreciation of the real against the U.S. dollar could increase the cost of our obligations in foreign currency, and therefore significantly affect our income statement in the short term. The depreciation of the real may limit our access to international capital markets and may favor state intervention in the economy, including the imposition of potentially recessionary policies.
Infrastructure and workforce deficiency in Brazil may impact economic growth and have a material adverse effect on us.
Our performance depends on the overall health and growth of the Brazilian economy. Brazilian GDP growth has fluctuated over the past few years, with increases of 5.0% in 2021, 2.9% in 2022 and 2% in 2023. Continued growth is limited by inadequate infrastructure, including potential energy shortages and deficient transportation, logistics and telecommunication sectors, the lack of a qualified labor force and the lack of private and public investments in these areas, which limit productivity, as well as efficiency. Any of these factors could lead to labor market volatility and generally impact income, purchasing power and consumption levels, which could limit growth or result in contraction and ultimately have a material adverse effect on our business.
Furthermore, deficiencies in the road, rail or waterway network of the areas in which we operate, such as unpaved or maintenance-free roads and lack of railroads, especially in regions farthest from the ports, result in high logistics costs and, consequently, reduce the profitability of our sugarcane operations. Likewise, failure or malpractice in transportation handling, whether on trains, trucks or vessels, may lead to loss of production, waste of quantities or damage to sugarcane. Constant climate change, such as excessive rainfall, has led to a worsening of the conditions of the roads, which may lead to an increase in over-production losses. The aforementioned infrastructure deficiencies may make it more difficult for us to conduct our business in the areas in which we operate and thereby adversely affect us.
Developments and the perception of risk in other countries may adversely affect the Brazilian economy and market price of Brazilian issuers’ securities.
The market value of securities of Brazilian issuers is affected by economic and market conditions in other countries, including the United States, European countries, and in other Latin American and emerging market countries. Although economic conditions in Europe and the United States may differ significantly from economic conditions in Brazil, investors’ reactions to developments in these other countries may have an adverse effect on the market value of securities of Brazilian issuers. Additionally, crises in other emerging market countries may diminish investor interest in securities of Brazilian issuers, including our securities, as well as adversely affect the availability of credit to Brazilian companies in the international markets, with a significant outflow of capital from Brazil and a decrease in the amount of foreign currency invested in Brazil. In addition, negative events in the Brazilian financial and capital markets, any news or evidence of corruption in government, publicly traded companies and other issuers of securities, and the lack of rigorous application of investor protection rules or lack of transparency of information or potential crises in the Brazilian economy and in other economies may influence the Brazilian capital markets and negatively impact the securities issued in Brazil. This could adversely affect the market price of our securities, restrict our access to capital markets and compromise our ability to finance our operations in the future on favorable terms, or at all.
In June 2016, the United Kingdom had a referendum in which the majority voted to leave the European Union (so-called “Brexit”). Trade relations between the UK and the EU are currently regulated by the UK-EU Trade and Cooperation Agreement, or “TCA,” which provided that there will be no tariffs or quotas on the movement of goods between the UK and EU and marked the UK’s departure from the EU customs union and single market. There continues to be uncertainty surrounding political and economic concerns, as the true effects of the TCA and future trade agreements outside of the EU begin to unfold, which developments we continue to monitor. Continued uncertainty around the terms of the UK’s relationship with the EU and the lack of a comprehensive trade agreement may negatively impact the economic growth of both regions, which would similarly have an adverse effect on the wider global economy (including in Brazil), market conditions and investor confidence. As a result, uncertainties around post-Brexit trade negotiations could impair our ability to transact business in the United Kingdom and in countries in the European Union. In particular, Brexit and its effects may have an adverse impact on the ability of our lubricants business, Moove, to conduct business within the European Union given that Moove has operations in both the United Kingdom and the European Union and that both Moove Lubricants and Stanbridge (subsidiaries of Moove) are headquartered in the United Kingdom. If the United Kingdom were to significantly alter its regulations affecting the lubricants industry, we could face significant new costs. It may also be time-consuming and expensive for us to alter our internal operations in order to comply with new regulations. We have no control over and cannot predict the effect of United Kingdom’s exit from the European Union nor over whether and to which effect any other member state will decide to exit the European Union in the future. The wider impact of Brexit on financial markets through market fragmentation, reduced access to finance and funding, and lack of access to certain financial market infrastructure, may affect our operations, financial condition and prospects and those of our customers. These developments, as well as potential crises and forms of political instability arising therefrom or any other as of yet unforeseen development, may harm our business and the price of our common shares and ADSs.
Since 2022, the war between Russia and Ukraine and the recent conflicts in the Middle East have contributed and continue to contribute to further increases in the prices of energy, oil and other commodities (including certain inputs on which we rely to conduct our operations), disruptions to global supply chains, and to volatility in financial markets globally, as well as a new landscape in relation to international sanctions. Also, the Middle East conflict presents similar concerns, mainly in relation to oil prices, fertilizer imports and the export of agricultural products that are made in high quantities for Israel. See also “—The ongoing war between Russia and Ukraine and conflicts in the Middle East may have a material adverse effect on the global and Brazilian economies as well as on us.”
In recent years, there was an increase in volatility in all Brazilian markets due to, among other factors, uncertainties about how monetary policy adjustments in the United States would affect the international financial markets, the increasing risk aversion to emerging market countries and the uncertainties regarding Brazilian macroeconomic and political conditions. These uncertainties adversely affected us and the market value of our securities.
In addition, we continue to be exposed to disruptions and volatility in the global financial markets because of their effects on the financial and economic environment, particularly in Brazil, such as a slowdown in the economy, an increase in the unemployment rate, a decrease in the purchasing power of consumers and the lack of credit availability. Disruption or volatility in the global financial markets could further increase negative effects on the financial and economic environment in Brazil, which could have a material adverse effect on our business, financial condition and results of operations.
A reduction in the volume of foreign investments in Brazil may have a negative impact on us.
Any reduction in the volume of foreign investments in Brazil may have an impact on the balance of payments, which may force the Brazilian government to have a greater need to raise funds, both in the domestic and in the international markets, at higher interest rates. Likewise, any significant increase in Brazilian inflation rates and the current slowdowns of the European and American economies may have a negative impact on the Brazilian economy and affect interest rate levels, raising expenses on loans already obtained and costs of new funding from resources by Brazilian companies, including us.
Changes in taxes and other assessments may adversely affect us.
The legislatures and tax authorities in the tax jurisdictions in which we operate regularly enact reforms to the tax and other assessment regimes to which we and our customers are subject. Such reforms include changes in tax rates and, occasionally, enactment of temporary taxes, the proceeds of which are earmarked for designated governmental purposes. In addition, the interpretation of tax laws by courts and taxation authorities is constantly evolving. In Brazil, the tax system is highly complex and the interpretation of the tax laws and regulations is commonly controversial. The effects of these changes and any other changes that result from enactment of additional tax reforms or changes to the manner in which current tax laws are applied cannot be quantified and there can be no assurance that any such reforms or changes would not have an adverse effect upon our business.
The Brazilian government regularly implements changes to tax regimes that may increase the tax burden on us, our subsidiaries and jointly-controlled entity and their respective customers. These changes include modifications in the rate of assessments and the enactment of new or temporary taxes, the proceeds of which are earmarked for designated governmental purposes.
A proposed tax reform has been under review in the Brazilian Congress since 2003, with several proposals to make the tax system more transparent and simplify tax assessments and collection processes. Proposals have also been made for the taxation of dividend income, which is not currently taxed in Brazil. Discussions have intensified in 2019, when proposed constitutional amendments, or “PECs,” were introduced before the congressional houses for discussion. Each of PEC 45/2019 and PEC 110/2019 sets forth a simplification of the tax collection system in Brazil, the effects of which on our business have not yet been quantified and/or assessed. Furthermore, the final output of the Brazilian tax reform is outside of our control, and any failure to comply with new tax rules may adversely affect our business and results of operations.
If we do not successfully comply with laws and regulations designed to prevent governmental corruption in countries in which we operate and sell our products (notably Brazil), we could become subject to fines, penalties or other regulatory sanctions, which could cause our sales and profitability to be materially reduced.
Our anti-corruption policies and procedures designed to prevent governmental corruption violations may not prevent our management, employees or third parties acting on our behalf in the countries in which we operate from taking actions that violate applicable laws and regulations on improper payments to government officials for the purpose of obtaining or keeping business or business advantages. Laws prohibiting such behaviors include (but are not limited to) laws relating to the OECD’s 1997 Convention on Combating Bribery of Foreign Public Officials in International Business Transactions, such as the U.S. Foreign Corrupt Practices Act and Brazilian Anticorruption Law No. 12,846/2013, or the “Anti-Corruption Act,” which has been in effect since January 29, 2014. Any breach thereof may have a material adverse effect on our business, financial condition and results of operations, including access to financing, as well as the acceleration of loans and financing.
The Anti-Corruption Act imposes strict liability on companies for acts of corruption, fraud or manipulation of public tenders and government contracts, and interference with investigations or inspections by governmental authorities. Companies found liable under the Anti-Corruption Act face fines of up to 20% of their gross revenue in the immediately preceding year or, if such annual gross revenue cannot be estimated, such fines may range from R$6,000 to R$60 million. Among other sanctions, the Anti-Corruption Act also provides for the seizure of assets or benefits obtained illegally, the suspension or partial prohibition of operations, the dissolution of the entity and/or the prohibition to receive incentives, subsidies, donations or financing from the government or from government-controlled entities for up to five years. In assessing penalties under the Brazilian Anti-Corruption Law, local authorities may consider the adoption of an effective compliance program. Other relevant laws applicable to corruption-related violations, such as Law No. 8.492/1992, or the “Administrative Misconduct Law,” also provide for penalties that include the prohibition to enter into government contracts for up to 10 years.
Consequently, if we, our management, our employees or third parties acting on our behalf in the countries in which we operate and sell our products become involved in any corruption or criminal investigations or proceedings in connection with our business in Brazil or in any other jurisdiction, our business could be materially adversely affected.
General
We are a publicly-held company incorporated under the laws of Brazil on July 8, 1966 for an indefinite term. Cosan S.A. is registered with the Junta Comercial do Estado de São Paulo in Brazil under registration number 35.300.177.045. Our legal name is Cosan S.A. and our commercial name is “Cosan.” Our registered office is located at Av. Brigadeiro Faria Lima, 4,100 – 16th floor, São Paulo – SP, 04538-132, Brazil and our general telephone and fax numbers are 55 11 3897-9797 and 55 11 3897-9799, respectively. Our website is https://www.cosan.com.br/en. In addition, the SEC maintains a website that contains information which we have filed electronically with the SEC, including our annual reports, periodic reports and other filings, which can be accessed at https://www.sec.gov. The information contained on our website, any website mentioned in this current report or any website directly or indirectly linked to these websites, is not part of, and is not incorporated by reference in, this current report and you should not rely on such information.
History
Over the last decades, we have transitioned from being a sugar and alcohol producer with a complex corporate structure, into a streamlined group of publicly held companies operating in the natural resources sectors in which Brazil has a global competitive advantage. Our history dates back to 1936 when the Costa Pinto mill was established by the Ometto family in the city of Piracicaba in the state of São Paulo. As of the mid-1980s, we began to expand our operations through the acquisition of various milling facilities in the state of São Paulo and, in 2000, we consolidated the activities of our sugar and alcohol conglomerate into a single company, which was named Cosan S.A. Indústria e Comércio, currently Cosan S.A. We began diversifying our portfolio in 2008 with the acquisition of Exxon Mobil assets in Brazil, and the creation of Rumo and Radar, enabling us to focus on fuel distribution, sugarcane transport and operation, and management of agricultural properties, respectively. In 2011, we successfully completed the formation of the joint venture with Shell for the incorporation of Raízen, which combined our sugar and ethanol and fuel distribution assets with Shell’s fuel distribution operations in Brazil. The remaining Exxon Mobil assets were contributed to the creation of Moove, which today operates in several countries in the Americas and Europe producing and distributing high quality lubricants. As part of our strategy to consolidate as an energy business, we acquired Comgás and contributed its shares to Compass, which now operates in infrastructure, distribution and commercialization of natural gas, in addition to projects focused on generation (transforming gas into electricity efficiently) and commercialization of gas.
In 2021, we (i) reorganized our corporate structure to optimize investments across the group and consolidate the various free floats of our businesses, and (ii) obtained the registration of Raízen as a “category A” publicly held company with the CVM and completed the IPO of its preferred shares, allowing for the capitalization of Raízen’s business while maintaining the original control arrangement among its shareholders.
In 2022, we acquired a 4.96% equity interest in Vale’s outstanding share capital (4.85% of its total share capital), allowing us to invest in a relevant player in the energy transition and decarbonization, with a competitive advantage in the sectors in which it operates. As of the date of this current report, we hold a 3.91% equity interest in Vale’s total share capital. See “Presentation of Financial and Certain Other Information—Certain Corporate Events—Acquisition of Significant Influence in Vale S.A., or ‘Vale.’” We believe that we have become a distinct corporate group, with recognized brands and a commitment to transitioning to a cleaner energy matrix. In addition, throughout 2023, we made several advance payments on our indebtedness with J.P. Morgan S.A. and Citibank S.A. and sold 9.5 million Vale shares on December 18, 2023, an amount equal to 0.21% of its total share capital, in connection with the collar financing structure. These transactions brought our direct interest in Vale’s total share capital to 2.45% and our total interest to 4.65%, in each case as of December 31, 2023, which is in line with our strategy of viewing Vale as an investment in an affiliate. Additionally, on April 19, 2024, we sold an additional 33.5 million Vale shares, an amount equal to 0.74% of its total share capital, in connection with the collar financing structure. With this final advance payment, we settled all of our indebtedness tied to this transaction and the collar financing derivatives.
In 2023, we (i) sold all of our equity interest in Sinlog Tecnologia em Logística S.A. or “Trizy”; (ii) issued our fifth, seventh, eighth and ninth issuance of debentures, in an aggregate principal amount of R$1 billion, R$1.5 billion, R$1.3 billion and R$2.9 billion, respectively; (iii) internalized the remaining resources from the issuance of our 2030 senior notes, through the issuance of debentures by Cosan S.A., referenced in U.S. dollars in the amount of R$1,491 million (equivalent to approximately U.S.$300 million); (iv) issued U.S.$550.0 million in aggregate principal amount of 7.500% notes due 2030, the net proceeds of which were used to pay the tender price of our then-outstanding 7.00% Senior Notes due 2027, or the “2027 Notes,” tendered in connection with the tender offer for such notes which expired in July 2023; and (v) issued unsecured commercial paper, in two series, in an aggregate principal amount of R$1 billion, accruing interest at a rate equal to the DI. For more information, see “Management’s Discussion and Analysis of Financial Condition and Results of Operations—B. Liquidity and Capital Resources—Indebtedness.” In addition, we prepaid 60% of the first tranche and 30% of the second tranche of the Collar financing related to the acquisition of our stake in Vale, which included the settlement of certain foreign exchange derivatives. Our board of directors also approved a new 18-month-duration share buyback program for up to 116,000,000 common shares of Cosan S.A., or approximately 6.19% of our total shares.
In 2024, Mr. Luis Henrique Guimarães stepped down as our chief executive officer and Mr. Nelson Roseira Gomes Neto, former chief executive officer of Compass, took over as our chief executive officer while remaining on the board of directors for Compass, and was also appointed to the boards of directors of Raízen, Moove and Rumo. Mr. Ricardo Lewin stepped down as our chief financial and investor relations officer and Mr. Rodrigo Araujo Alves, our former director of strategy, took over as our chief financial and investor relations officer. We also issued U.S.$600.0 million in aggregate principal amount of 7.250% notes due 2031, which were delivered to investors on January 26, 2024 and which proceeds were used for general corporate purposes.
We are a holding company and the following companies are part of our group: Raízen (which is under joint control), Compass and its subsidiary Comgás, Commit Gás e Energia S.A., or “Commit” (previously known as Petrobras Gás S.A. - Gaspetro), Sulgás, Moove and Rumo, and Radar, through which we control real estate companies, among others. We also have a minority stake in Vale, a mining company.
Raízen, a joint venture between us and Shell created in June of 2011, produces more than three billion liters of ethanol per year to supply both domestic and international markets and 5.8 million tons of sugar, with 1.6 GW of installed capacity - making it one of the largest sugar exporters and one of the world’s largest power generators of electricity from sugarcane bagasse. The company plants, harvests and processes sugarcane, the main raw material used in the production of sugar and ethanol. Raízen also distributes fuel to over 8,204 service stations throughout Brazil, Argentina and Paraguay under the Shell brand, with more than 2,000 Shell Select convenience stores, 74 distribution terminals and presence in 69 airports supplying jet fuel.
Compass was created in March 2020 to expand and diversify the gas market in Brazil, promoting greater security and competitiveness to the country’s energy matrix. Compass has invested approximately R$9.0 billion in the Brazilian natural gas market, with operations currently grouped into two segments: (i) distribution and (ii) marketing & services. The distribution segment operates through two vehicles that hold stakes in Comgás, Brazil’s largest natural gas distributor, and in 6 other gas distributors managed by Commit, a subsidiary of Compass. Commit’s assets are organized with a focus on the Central-South regions of Brazil, where it owns Sulgás, whose control was acquired from the State of Rio Grande do Sul in early 2022, and Necta, directly controlled by Commit. The marketing & services segment offers alternative natural gas supply options to consumers while promoting decarbonization for all its customers, whether connected to the distribution network or off-grid, displacing other energy sources through road transportation. This business model relies on strategic assets such as the TRSP (São Paulo Regasification Terminal located in Santos), biomethane assets and contracts, LNG B2B (liquefied natural gas), other infrastructure projects, and gas trading.
Through Moove, we produce and distribute automotive and industrial lubricants. Under the Mobil brand, Cosan S.A. operates in Brazil and in nine other countries: in South America, Argentina, Bolivia, Uruguay and Paraguay (South America); in North America, the United States of America; and in Europe, Spain, France, Portugal and the United Kingdom. These operations are aligned with Moove’s strategy of leveraging the ExxonMobil strategic partnership and expanding its operations globally. In addition, Moove operates through a range of proprietary brands, which include the “Tirreno” brand in Brazil and the “Comma” brand in the United Kingdom (through which it also sells its products to over 40 other countries in Europe and Asia). Following our acquisition of PetroChoice in May 2022, Moove also operates throughout the United States under the main brands “EcoUltra, Medallion Plus and Dyna-Plex 21C.”
Rumo is Latin America’s largest logistics operator, with an independent railway base, and offering a broad range of rail transportation logistics services, port loading and storage. The five railway concessions Rumo operates are in the States of Mato Grosso, Mato Grosso do Sul, São Paulo, Tocantins, Goiás and the States of Brazil’s south region (Paraná, Santa Catarina, and Rio Grande do Sul). Rumo is a leader in the transport of sugar for exportation and is creating an integrated transport platform that will significantly increase the efficiency of Brazilian exports. In addition, following Rumo’s merger with ALL, Rumo has become one of the most important transportation and port operators for grains and other commodities in Brazil. For additional information, see “—A. History and Development of the Company.”
Our real estate operations are conducted through Radar, Radar II, Tellus, Janus, Gamiovapar and Duguetiapar. These companies focus on acquiring rural properties to be subsequently leased or sold to third parties. Radar is a land management company that invests in assets with high productivity potential in Brazil. It owns and manages approximately 417 rural properties covering a total of 91,176 hectares, and harvests sugarcane, soy, cotton, corn and other commodities in the States of São Paulo, Maranhão and Mato Grosso. Radar manages its properties using a satellite-based geomonitoring system and we believe it is well-positioned to create carbon credits. Cosan acquired additional stakes in Tellus, Janus, Gamiovapar and Duguetiapar in September 2022. Tellus, Janus, Gamiovapar and Duguetiapar are also land management companies that invest in agricultural land in Brazil and oversee approximately 427 rural properties, covering a total of 214,626 hectares (148,876 hectares of which are considered useful), dedicated to the harvesting of sugarcane, soy, cotton, corn and other commodities in several States of Brazil.
In October 2022, we announced the acquisition of a 4.96% equity interest in Vale’s outstanding share capital (4.85% of its total share capital), one of the world’s leading mining companies. As of the date of this current report, we hold a 3.91% equity interest in Vale’s total share capital. This investment is aligned with our capital allocation and portfolio diversification strategies.
Cosan S.A. (B3 ticker: “CSAN3”) has been listed since 2005 on the B3 segment with the highest standards of corporate governance, the “Novo Mercado.” Raízen (B3 ticker: “RAIZ4”) has been listed on the B3 since August 2021 on the “Nível 2” segment. Comgás (B3 ticker: “CGAS3” and “CGAS5”) has been listed since 1997 on the B3. Rumo (B3 ticker: “RAIL3”) has been listed since 2015 on the B3, and also on the “Novo Mercado” segment. Our ADSs have also been listed on the NYSE under the symbol “CSAN” since March 2021, as a consequence of the Merger.
Raízen
Raízen primarily operates in the energy sector and other synergistic activities. Raízen has increasingly consolidated itself as an integrated energy company with a diverse portfolio, from renewable sources such as biomass (and expanding to other sources, such as solar), to its core businesses of globally distributing and selling first- and second-generation ethanol (from sugarcane), sugar and other by-products to enterprise, or “B2B,” customers, in Brazil, Argentina and Paraguay, and operating a network of service stations and airport bases. Raízen’s operations also include proximity retail, through Rede Integrada de Lojas de Conveniências e Proximidade S.A., or “Grupo Nós,” a joint venture between Raízen and FEMSA Comercio, S.A. de C.V., or “FEMSA Comercio.”
Prior to the corporate reorganization of Raízen completed on June 1, 2021, we viewed Raízen as two reportable operating segments whereby each of the legal entities (Raízen Combustíveis S.A. and Raízen Energia S.A.) was considered to be a separate segment. Following the corporate reorganization of Raízen, we started to consider Raízen as a single reportable segment. Accordingly, our previously reported segment information has been recast for all periods presented to reflect the changes in the reportable segments. For further information, see “Presentation of Financial and Other Information—Certain Corporate Events—Consolidation of Raízen,” “Information on the Company—E. Supplemental Information About Joint Venture,” “Management’s Discussion and Analysis of Financial Condition and Results of Operations—Financial Presentation and Accounting Policies—Business Segments and Presentation of Segment Financial Data” and note 4, “Segment Information,” to our individual and consolidated financial information as of and for the fiscal years ended December 31, 2023 and 2022, included elsewhere in this current report.
Raízen’s operations include the production and marketing of ethanol, sugar, gasoline and diesel, and the cogeneration of energy:
| For the Year Ended December 31, | |||||
|---|---|---|---|---|---|---|
| 2023 | 2022 | 2021 | |||
| (in R$ millions) | |||||
Raízen S.A.(1) |
|
|
| |||
Ethanol | 23,312.3 | 29,652.1 | 27,464.3 | |||
Sugar | 29,070.5 | 23,695.8 | 13,946.5 | |||
Gasoline | 66,267.7 | 66,586.9 | 55,158.0 | |||
Diesel | 90,281.6 | 106,684.6 | 71,828.1 | |||
Cogeneration | 3,724.1 | 3,688.1 | 3,968.9 | |||
Other | 9,037.1 | 13,986.2 | 7,288.5 | |||
Intercompany elimination | — | — | (4,607.1 | ) | ||
Total net operating revenue | 221,693.3 | 244,293.7 | 175,047.3 | |||
| (1) | Includes 100% of Raízen’s results. As of December 31, 2023, we held a 30.9% equity interest in Raízen (33.6% and 44.0% as of December 31, 2022 and 2021, respectively), which under IFRS 11 is recorded in the “Interest in earnings of joint venture” line item in our individual and consolidated financial information as of and for the years ended December 31, 2023 and 2022 included elsewhere in this current report. |
Ethanol, Biomass and Electricity
Raízen produces and markets renewable energy and by-products of its bioenergy projects and of third parties, and seeks to expand its operations into other low-carbon energy sources. Raízen’s activities in the renewables segment encompass:
- First-generation ethanol: This fuel is used in cars either on its own or mixed with gasoline. It can also be combined for industrial applications, including in pharmaceuticals, cosmetics, alcoholic beverages, sanitation and other industries.
- Second-generation ethanol: Second-generation ethanol can be used for the same purposes as first-generation ethanol. We are pioneers in producing second-generation ethanol on an industrial scale. We believe that using sugarcane product residues (bagasse and straw), this technology will increase ethanol production capacity by up to 50% from the same acreage.
- Electricity: Raízen produces electricity from sugarcane waste, and is expanding into other sources of energy, such as solar energy.
- Biogas: In addition to using sugarcane waste for electric energy production, we produce biomethane using sugarcane residues. Biomethane is a substitute for methane in various applications.
- Biomass pellets: Pellets solve issues arising from the inefficient logistics of energy-rich biomass. They can be used to replace coal in thermoelectric plants, which we believe bodes well for a promising international market with strong growth in demand expected in the coming years.
First-generation ethanol is produced in a chemical process called fermentation by which sugarcane used in ethanol production is processed in the same way as for sugar production and resulting molasses gets mixed with sugarcane juice and yeast in tanks. The by-product of the fermentation process is then boiled and distilled and/or dehydrated to produce the various types of ethanol. Raízen also produces second-generation ethanol, or “E2G,” which emits 80% less carbon dioxide than fossil fuels. E2G is a cellulosic biofuel made according to our proprietary technology. The process of making E2G consists of hydrolysis and fermentation of bagasse and straw with enzymes and yeasts. Raízen is a pioneer in developing carbon circularity from the by-products of its production processes. Raízen introduced biogas technology in its bioenergy parks, which is produced through a biodigestion process from vinasse and filter cake, and can be a substitute for methane in its various applications, including in the production of electricity. Raízen also produces other products derived from sugarcane biomass such as the steam from excess bagasse in boilers, which can be used to move mechanical parts in bioenergy parks as well as to generate electricity sold to the grid.
Raízen is able to transport ethanol and sugar production from its extensive infrastructure of port terminals and bioenergy parks in the Central-South region of Brazil. Raízen also has terminals connected to the most efficient modes of transportation and strategic positioning in the main ports to export production, in addition to having its own teams to market production both in Brazil and overseas. The logistics of delivering products to customers depend on the complexity and the potential to capture value by advancing development into the supply chain.
In addition to sugar and ethanol, Raízen also sells any excess energy produced from processing sugarcane in its bioenergy parks through energy auctions conducted by the government of the state of São Paulo. Furthermore, Raízen began advances into the value chain (production, logistics, marketing and refining) by replicating the same model currently applied to its ethanol business.
Sale and Distribution of Fuel
Raízen produces, distributes and sells fuels and other specialties. Raízen’s primary products include ethanol, gasoline, diesel, vehicular natural gas, kerosene and aviation fuel, lubricants, and oil fuel. In addition, Raízen operates proximity retail stores both within and outside service stations, offering consumer products and services like bakeries, tobacco, groceries, hygiene and cleaning products, food products, and beverages.
The following table presents certain key operating indicators consolidating Brazil, Argentina and Paraguay (except where otherwise indicated), for the periods set forth below.
| Year Ended December 31, | |||||
|---|---|---|---|---|---|---|
| 2023 | 2022 | 2021 | |||
Service Stations | 8,204 | 8,057 | 7,300 | |||
Fuels sold (million liters) | 35,295 | 34,822 | 33,178 | |||
Gasoline (million liters) | 11,479 | 11,437 | 10,311 | |||
Ethanol (million liters) | 2,989 | 3,017 | 3,470 | |||
Diesel (million liters) | 16,951 | 17,465 | 17,062 | |||
Aviation (million liters) | 1,873 | 1,161 | 885 | |||
Other (million liters) | 2,002 | 1,742 | 1,451 | |||
Raízen is the largest fuel distributor in Paraguay, and the second-largest in Brazil and Argentina. Its operations consist of the purchase, storage, mixing and distribution of gasoline, ethanol, diesel and aviation kerosene through a network of over 8,204 retail service stations licensed with the Shell brand (over 1,640 of which feature integrated convenience stores), and have recorded consistent year-on-year growth. Raízen’s logistics infrastructure in the segment has been built over more than 100 years, and is strategically located close to major consumer markets. Raízen currently has 74 land distribution terminals, and storage capacity for approximately 1.4 billion liters. In the aviation market, Raízen operates through 69 supply bases in Brazilian and Argentinean airports.
Raízen has a complete platform focused on B2B2C and B2B customers (B2B2C refers to situations in which our products go through an intermediary before reaching the final customer) that support its strategic objective to be the preferred choice for resellers and customers in the markets in which it operates.
Since 2017, Raízen has invested in increasing the productivity and safety of its partner carriers and reducing logistical costs through the ONE Project, focusing on real-time management of the routes for our entire fuel tanker fleet from a monitoring center. Further, Raízen’s capillarity enables it to reach over 50 million consumers in Brazil, who benefit from Raízen’s investments in the development of innovative payment methods and cloud-based platforms such as Shell Box, which is a mobile application that enables customers to enjoy contact-less payment solutions, promotions and other benefits.
Moreover, Raízen’s store models allow it to serve different segments in markets with different characteristics, as well as different profiles and purchase needs. This commercial proposal is leveraged by long-term partnerships with the main fast-moving consumer goods companies, generating new forms of monetization and ensuring better competitiveness for our stores, while transforming our network into a strategic channel to launch and position our products. Raízen combines this strategy with promotional and marketing activity in all its stores.
Finally, Raízen has over 6,000 customers in the B2B market in Brazil and in Argentina, which are categorized into over different segments (e.g., cargo and passenger transport, agricultural and mining sectors). The B2B strategy is focused on customer loyalty through an offering of premium technology products (such as Shell Evolux, Shell Rimula and Shell Helix portfolios) and carrier fleet control tools. We believe that this strategy, which connects our physical and digital presence, has the potential to create a leading omnichannel platform in the market, in addition to offering financial, procurement, engineering and Health, Safety, Security and Environment, or “HSSE,” solutions for our customers.
Sugar
Raízen produces and markets a variety of sugars from our bioenergy projects and from third parties, such as raw sugar (or very high polarity sugar, or “VHP”), refined sugar and liquid sugar.
The following table details Raízen’s energy and sugar production.
| Year Ended December 31, | |||||||
|---|---|---|---|---|---|---|---|
| 2023 | 2022 | 2021 | ||||
Crushed sugarcane (million tons) | 83.5 | 73.4 | 54.2 | ||||
Volume of sugar sold (thousand tons) | 10,173.7 | 10,954.8 | 7,758.0 | ||||
Volume of ethanol sold (million liters) | 5,497.5 | 6,231.4 | 4,453.0 | ||||
Energy sold (thousand MWh) | 27,208.5 | 20,673.0 | 21,253.0 | ||||
Sugarcane is the main raw material used in Raízen’s bioenergy parks. It is a photosynthetic metabolism plant which has four essential attributes: (1) sugarcane is best suited to convert solar energy into biomass when compared to other crops with which Raízen’s products compete; (2) sugar is the basis for a diversified product portfolio, which includes sustainable foods, biofuels, bioelectricity and bioproducts or biomaterial. This is consistent with Raízen’s strategy, which includes: Bonsucro, ELO, Raw Materials and Deforestation; (3) low carbon footprint in Raízen’s products due to circularity and waste optimization; and (4) high levels of productivity in the Brazilian Central-South region, due to certain natural characteristics of the region (including soil, climate and other factors), combined with access to logistical infrastructure for the outflow of production.
Raízen received the Bonsucro certification for its bioenergy parks and became responsible for a large portion of sugarcane certified under this model globally. In addition to the Bonsucro certification, Raízen has led the creation of an innovative program in the sugar and ethanol industry, the ELO program, which provides a system of continuous improvement and technical assistance to third-party sugarcane suppliers. Generating shared value within our raw material supply chain is an important part of our business. In connection with the Elos program, our Cultivar program offers solutions to its partner producers across their business life cycles. These producers accounted for approximately 93% of all the third-party sugarcane purchased for the 2022/2023 harvest.
As a result of the circular nature of the sugarcane production process, sugarcane-derived products have a low carbon footprint, and can therefore serve as substitutes for fossil and/or products with high environmental impact. For example, consistent with the Bonsucro certification, Raízen’s operations cause no deforestation, and all of its raw materials are subject to sustainability programs.
Raízen’s sugar production encompasses a three-step process: (i) sugarcane is processed for juice extraction; (ii) the product is filtered to remove impurities and boiled to crystallize sugars; and (iii) the product is passed through a centrifuge for the production of the final product, raw sugar or VHP. This can then be refined, dried and packaged in Raízen’s refineries. This process is routinely optimized through Raízen’s proprietary technologies supporting decisions and driving its business.
Regulation
Regulation of the Oil and Gas Industry
Brazil
The ANP is a federal agency responsible for the control, supervision and implementation of the government’s oil, gas and biofuel regulations. The ANP regulates all aspects of the production, distribution and sale of oil, natural gas, and biofuels products in Brazil. With respect to regulation relating to gasoline, diesel and biofuels, the ANP determines: (i) standards and restrictions applicable to the companies which it regulates; (ii) the product quality standards and minimum storage capacities required to be maintained by distributors; (iii) the limits of oil-based fuel volume purchased by distributors based on their storage capacity; and (iv) the criteria applicable to the authorization for the construction, operation and usage of the infrastructure used to handling and storage of fuels.
Environmental health and safety standards. Fuel distributors are subject to Brazilian federal, state and municipal laws and regulations relating to environmental protection, safety and occupational health and safety, licensing by fire departments, environment and transport authorities. The National Environmental Council (Conselho Nacional do Meio Ambiente), or “CONAMA,” is the main government body responsible for issuing environmental standards and regulations at the federal level. Environmental state agencies and municipal departments are also responsible for establishing and supervising complementary laws and regulations within their areas of operation.
Fuel distributors must obtain authorizations and/or licenses from federal, state and/or municipal environmental agencies and fire departments to implement and operate their facilities, and are subject to extensive registration and operational requirements resulting in certain limitations to, among others, the (i) distribution of liquid fuels; (ii) distribution of aviation fuels; (iii) liquid and aviation fuels storage; (iv) liquid products storage and handling; and (v) ethanol production. Furthermore, fuel distributors are required to develop programs to control air, soil and water pollution, including management of hazardous waste.
Port Regulation. The Brazilian port sector is regulated by (1) the National Water Transportation Agency (Agência Nacional de Transportes Aquaviários), or the “ANTAQ,” which is linked to the Brazilian Ministry of Infrastructure (Ministério da Infraestrutura), or the “Ministry of Infrastructure,” (2) the National Secretariat of Ports (Secretaria Nacional de Portos), or the “SNP,” which is also linked to the Ministry of Infrastructure, and (3) local port authorities. Since 2012, the Brazilian port sector has undergone a number of regulatory changes, including the enactment of Federal Law No. 12,815/2013, as amended by Law No. 14,047, dated August 24, 2020 (regulated by Decree No. 8,033/2013). One of the most important changes brought about by this new regulatory framework is the abolition of the distinction between “own cargo” and “third-party cargo” for the development and operation of private use terminals, or “TUPs.” Authorizations to operate TUPs are granted by authorizations preceded by public calls (chamadas públicas) or public announcement (anúncio público) and, as applicable, a public bidding procedure.
In addition, the operations of Energina Compañía Argentina de Petróleo S.A., or “Raízen Argentina,” are subject to regulation pursuant to Argentine federal, state and municipal laws and regulations relating to fuel distribution, environmental protection, safety, occupational health and safety, environment and transport matters.
Argentina
The oil and gas industry in Argentina is regulated by Law No. 17,319/1967, as amended by Law No. 26,197/2007 and Law No. 27,007/2014, which sets forth the general legal framework for the exploration, development, industrialization, transportation and marketing of hydrocarbons in Argentina.
Hydrocarbon resources are severable from the general ownership of property. According to the Argentine Constitution, as amended in 1994, natural resources, including hydrocarbon reserves, belong to the provinces in which they are located. However, the Argentine Constitution empowers the Argentine National Congress to legislate on hydrocarbon matters.
Transfer of ownership of hydrocarbon reserves and resources from the federal domain to the provinces was implemented through the enactment of the several legal provisions that effectively amended Law No. 17,319, including by means of Law No. 26,197. The reserves and resources transferred pursuant to Law No. 26,197 were those located in the provinces and in territorial waters up to 12 nautical miles from a baseline, which in Argentina is the mean low-water line along the coast. In addition, with Law No. 26,197 the enforcement of the exploration permits and production and transportation concessions granted by the Argentine federal government over the hydrocarbon reserves and resources prior to the law was transferred to the provinces.
The Secretariat of Energy of the Ministry of Economy (Ministerio de Economia), or “SE,” is the federal enforcement agency responsible for the control, supervision and implementation of the Argentine government’s oil, gas, and biofuel regulations. The SE regulates all aspects of the production, distribution and sale of oil, natural gas, and biofuels products in Argentina. With respect to regulation relating to gasoline, diesel oil and biofuels, the SE determines the product quality standards and storage requirements (SE Resolution No. 1,283/2006).
Hydrocarbon-refining activities are subject to Law No. 13,660/1949, which provides the basic regulatory framework for these activities, whether conducted by oil producers or third parties, and to registration requirements established by the SE (SE Resolution No. 419/1998). In addition to federal rules, refining activities must comply with provincial and municipal regulations on technical and safety standards. Decree No. 1,212/1989 established a Refineries and Gas Station Price Deregulation Policy. Moreover, the locations where liquid fuels are sold are subject to registration requirements established by Resolution No. 1102/2004, enacted by the SE.
The export of crude oil, natural gas and their derivatives is subject to prior governmental approval. The import of crude oil and liquid fuels also requires prior governmental approval. Law No. 26,050 establishes the legal framework for the industrialization and commercialization of liquid petroleum gas.
Port Regulation. The Argentinean port sector is regulated by Law No. 24,093 and Decree No. 769/1993. This legal framework regulates all matters related to the authorization, administration; and operation of existing and to-be-created state-owned and private ports in Argentina. The regulation classifies ports according to their ownership into national, provincial, municipal; and privately owned, and according to their purpose into commercial, industrial; and recreational. It also contains the conditions and requirements for authorizing ports. The Argentine ports regulation also provides that private individuals may build, administer; and operate public or private ports for commercial, industrial or recreational purposes, on public land or on their own property, and requires that the fees, prices and other consideration paid by users be strictly proportional to the service provided.
Environmental Health and Safety standards. Provinces have the power to legislate as to and regulate environmental matters. Provincial environmental regulations must set standards equal to or higher than those approved by the Argentine National Congress. Most of the hydrocarbon-producing provinces have issued specific environmental regulations for the oil industry, including on unconventional operations.
Legislation Applicable to Fuel Distributors. Fuel distributors are subject to Argentine federal, state and municipal laws and regulations relating to environmental protection, safety and occupational health and safety, environment and transport authorities. The Argentine Ministry of Environmental and Sustainable Development (Ministerio de Ambiente y Desarrollo Sostenible) is the government agency primarily responsible for issuing environmental standards and regulations at the federal level. Law No. 25,675 sets out minimum standards for the adequate and sustainable management of the environment, the preservation and protection of biodiversity and the implementation of sustainable development. Fuel distributors must obtain authorizations and/or licenses from federal, state and/or municipal environmental agencies to operate their facilities. They are required to develop programs to control air, soil and water pollution, including to manage hazardous waste in accordance with Law No. 24,051, which contains the regulatory framework on the generation, handling, transportation; and treatment of hazardous waste.
Regulation of Sugar, Ethanol and Cogeneration Activities
Raízen is subject to several Brazilian federal, state and municipal environmental protection and health and safety laws and regulations governing, among other things, the generation, storage, handling, use, transportation and discharge of hazardous materials into the ground, air and water as well as regulation concerning electricity generation. Below is a summary of the principal rules and regulations to which Raízen is subject in this regard.
Permits
Certain environmental laws require us to obtain from governmental authorities permits, licenses and authorizations to install and operate our mills, to burn sugarcane and to perform other activities.
We are subject to the regulations of the pollution control and remediation agencies of several Brazilian states, such as:
- Environmental Company of the state of São Paulo (Companhia Ambiental do Estado de São Paulo—CETESB);
- Environmental Agency of the state of Goiás (Secretaria de Estado de Meio Ambiente e Desenvolvimento Sustentável —SEMAD); and
- Environmental Institute of the state of Mato Grosso do Sul (Instituto de Meio Ambiente do Mato Grosso do Sul—IMASUL).
Environmental Licensing of Raízen
We operate mills, transport facilities and numerous warehouses. CONAMA is the government agency responsible for issuing rules and resolutions on environmental licensing at a national level. Environmental licensing is required for the development of new facilities and for alterations in existing operations. Environmental licenses must be periodically renewed.
Sugarcane Burning
The state of São Paulo and certain municipal governments have established laws and regulations that limit or eliminate the burning of sugarcane entirely. We have voluntarily signed the Agro-Environmental Sugarcane Protocol, which establishes accelerated deadlines for the reduction of sugarcane burning.
Brazilian Forestry Code
We are subject to Brazilian Federal Law No. 12,651, dated May 25, 2012, or the “Brazilian Forest Code,” which prohibits land use in certain permanently protected areas, and obligates us to maintain and register a forest reserve in each of our rural landholdings covering from 20% to 80% of the total area of such land, known as “Legal Reserve.”
Environmental Liabilities
We are involved in certain administrative and judicial proceedings for alleged failure to comply with environmental laws and regulations (especially relating to environmental damages caused by sugarcane burning and contaminated areas). The Brazilian Federal Constitution provides for three different types of environmental liabilities: (1) civil, (2) administrative and (3) criminal. Noncompliance with environmental law is subject to administrative, civil and/or criminal sanctions, regardless of the civil impacts such as the obligation to repair, compensate or indemnify any damages caused to the environment or third parties. Public attorneys’ offices, foundations, state agencies, state-owned companies and environmental protection associations are all authorized by law to file public civil actions seeking compensation for environmental damages.
Sugar Regulation
The MAPA is responsible for planning, coordinating, monitoring and assessing the implementation of governmental initiatives and programs related to the production of sugarcane and ethanol. All sugarcane processing mills must be duly registered with SAPCana (Sistema de Acompanhamento de Produção Canavieira), a system created and maintained by the MAPA that registers all sugar and ethanol producing mills and ethanol trading companies and monitors the production of sugarcane, sugar and ethanol in Brazil. All registered mills must regularly submit (online) reports about the production, output and inventory of sugar and ethanol, in accordance with Normative Instruction No. 52, of November 12, 2009 (the regulation that created SAPCana). Noncompliance with the rules established under the aforementioned Normative Instruction may subject us to suspension or cancellation of the registration in SAPCana until irregularities are resolved.
Ethanol Regulation
The Brazilian ethanol industry is also regulated by the ANP, a federal agency linked to the Ministry of Mines and Energy (Ministério de Minas e Energia), or the “MME.” On April 29, 2011, a provisional measure was published in Brazil’s Official Gazette, or the Provisional Measure No. 532/11, that changed the status of ethanol from an agricultural product to a fuel. Previously, the ANP was only responsible for the oversight of the distribution and sale of ethanol. Since the publication of Provisional Measure No. 532/11, converted into law on September 16, 2011 as Law No. 12,490/11, the agency then became responsible for the supervision of mills producing sugarcane-based biofuel. In accordance with Law No. 12,490/12, and in order to regulate the ethanol industry, the ANP published Resolution No. 734 of June 28, 2018, pursuant to which the production of ethanol, which involves construction, capacity expansion, modification and operation of ethanol production plants, became subjected to prior authorization of the ANP.
The performance of an activity without the proper authorization or with an expired authorization issued by the ANP may subject us to the following penalties, among others: (1) fine (from R$5,000 and R$5 million); (2) prohibition on performing such activity while the company is not in conformance; (3) temporary suspension of all or part of the site or operation of the facility; (4) inability to operate in the same activity in the future; or (5) annulment of our registration, pursuant to Law No. 9,847/99, of October 26, 1999. These penalties may be applied cumulatively and tend to be more severe depending on the economic capacity of the party and recidivism.
Electricity Regulation
The Brazilian power industry is regulated by ANEEL, a federal regulatory agency, in accordance with the general guidelines set forth by the Ministry of Mines and Energy. In order to perform power generation activities, the power agent must obtain authorizations granted by ANEEL or execute concession and permission agreements with the Brazilian government through ANEEL, which can be terminated before their original term upon the occurrence of certain events. The activities related to generation and commercialization of electricity performed by Raízen are subject to ANEEL’s supervision. Pursuant to Law No. 9,427 dated December 26, 1996 and ANEEL’s Resolution No. 846/2016, within the scope of its powers of inspection of electrical energy plants and services, ANEEL may impose penalties (including warnings, fines, temporary suspension of the right to participate in bidding processes for new concessions, licenses or authorizations, or request for new grants, licenses or authorizations, and revocation of existing authorizations or concessions granted by ANEEL) on power industry participants based on the nature of its relation with the agency (concessionaires or agents who hold permission or authorization) and the materiality of the infraction. In case of fines, the limit of 2.0% of the revenue of the concessionaire in the 12-month period preceding any assessment notice must be respected or, for independent producers or self-producers (authorized agents), 2.0% of the estimated amount of energy produced in the same period. In addition, pursuant to ANEEL’s Resolution No. 846/2019 some infractions may result in fines related to the failure of the agent in requesting ANEEL’s prior approval to certain conduct, including the following:
- entering into certain related party transactions, pursuant to ANEEL’s Resolution No. 948/2021;
- sale or assignment of the assets related to services rendered as well as the imposition of any encumbrance (including any security, bond, guarantee, pledge and mortgage) on them or any other assets related to the concession or permission, or the revenues of the electricity services;
- changes in corporate control of the holder of the authorization, permission or concession, as per terms of ANEEL’s Resolution No. 948/2021; and
- as applicable, submit to ANEEL projects of electric works and plants and their modifications, as well as proceed with its execution in disagreement with the project approved and with the established scheduled.
Furthermore, if a power generator’s fuel suppliers are either unable or unavailable to comply with their respective contractual obligations, in whole or in part, the power generator may face (1) a default of its regulatory duties, (2) a temporary reduction of its allotted energy generation capacity, and (3) difficulties in maintaining assets or projects. Finally, if power generators lack fuel, they may be subject to fines under ANEEL Resolution No. 583/2013, as applicable.
Raízen and its subsidiaries also operate in the distributed energy generation segment, wherein projects enjoy the benefits of ANEEL Normative Resolution No. 482/2012, or “Resolution 482” – in particular, an exemption from charges on the transmission and distribution of electricity. The Brazilian National Congress recently instituted a new legal framework for the micro and small-size distributed generation sector in Brazil. As a result of the enactment of Law No. 14,300, both ANEEL and electricity distributors must adapt their rules, regulations, procedures and processes to the new guidelines within 180 days after its publication.
Pursuant to Law No. 10,848, dated March 15, 2004, the purchase and sale of electricity operations are carried out in two different market segments: (i) the regulated contracting environment, which houses the purchase by distributors, through auctions, of all the electricity that is necessary to supply its consumers, and (ii) the free contracting environment, which houses the purchase of electricity from other CCEE agents (such as electricity generators and traders). Energy sector agents are also subject to the payment of sector charges and fees for the use of the transmission or distribution system, as applicable.
Controlled Substances
Certain laws and regulations require us to obtain from governmental authorities permits, licenses and certificates to use controlled substances in our activities. Decree No. 10,030, dated September 30, 2019, regulates the Brazilian Army’s control over explosive substances and establishes that those who manufacture, store or sell such substances are required to obtain a registration certificate, which must be periodically renewed. Law No. 10,357, dated December 27, 2001, sets forth that those who manufacture, store, handle, use and distribute chemical substances, which could be employed in the manufacture of narcotics or psychotropic substances, are subject to control by the Federal Police Department and shall obtain the required certificates, which must be periodically renewed. In parallel, state legislation empowers each state’s respective Civil Police to grant licenses for use, storage, marketing, importation and exportation of certain chemical products, usually consisting of an inspection certificate and an operating license. Sanctions that can be imposed in cases of noncompliance with the applicable regulations concerning controlled substances include notices, fines, pre-interdiction fines, interdiction, apprehension of products, suspension, and cancellation or forfeiture of the corresponding certificates and licenses.
Sanitation Regulation
The food industry is subject to the rules set forth in Decree No. 986, dated October 21, 1969, and is regulated by the National Agency of Health Surveillance (Agência Nacional de Vigilância Sanitária), or the “ANVISA,” an independent federal regulatory agency, in accordance with the general guidelines set forth by the Ministry of Health, and by the MAPA. The requirements for classification, identity, quality and labeling applicable to sugars for human consumption are established by the MAPA Normative Instruction No. 45, dated August 30, 2018, and the ANVISA Resolution No. 271, dated September 22, 2005. Activities related to the production and selling of standard sugars for human consumption are subject to local sanitary authorities’ licensing. Law No. 6,437 dated August 20, 1977, as amended, governs the imposition of sanctions for players in the food sector, which include notices, fines up to R$1,500,000 (which may be doubled in cases of repeated penalties), production and/or sales prohibition, facilities interdiction, revocation of the facilities’ sanitary permit, and seizure and/or destruction of products.
Compass
Overview
On January 14, 2020, we contributed to the share capital of our wholly owned subsidiary Compass, formerly known as Distribuidora de Gás Participações S.A., the totality of the shares we held in Comgás (i.e., 103,699,333 common shares and 27,682,044 preferred shares), equivalent to 99.15% of the total share capital of Comgás, for an amount of R$2,861.9 million. As the parties to the transaction are under common control transaction, there was no effect on our consolidated financial statements. We derecognized the investment in Comgás and we recognized an investment in Compass for the same amount.
On March 9, 2020, we announced the creation of our new gas and power business segment of which Compass is the holding company and through which we now conduct our activities in the gas and power market. On January 3, 2022, Compass’s subsidiary Compass Um Participações S.A. concluded the acquisition of 51% of the capital stock of Sulgás, assuming the control of Rio Grande do Sul’s gas supply concessionaire.
In addition, on July 11, 2022 Compass concluded the acquisition of 51% of Commit, a holding company that holds interests in 11 gas supply concessionaires in 11 states of Brazil. This acquisition from Petróleo Brasileiro S.A., or “Petrobras” was agreed to after a competitive process led by Petrobras to divest Petrobras Gás S.A., or “Gaspetro” (now known as Commit). Before the acquisition, Commit held interests in 18 gas supply concessionaires, but this number was reduced by seven due to the exercise by other shareholders of preemptive rights that were triggered upon the change of control of Commit.
Compass’s subsidiary, Comgás, is Brazil’s largest distributor of piped natural gas, with a network reaching 21,908 kilometers and delivering natural gas to more than two million residential, commercial and industrial consumers in about 177 cities, including 94 municipalities in the metropolitan areas of São Paulo, Campinas and Santos as well as the Paraíba Valley. Compass’s subsidiary, Commit has a distribution network of approximately 2,842 km, serving over 133.7 thousand customers in more than 6 states, and in 2023 distributed a volume of 2.74 million cbm/day.
We believe the prospects for future availability of natural gas in Brazil are positive based on expected exploration of carbon deposits discovered in the pre-salt layer offshore of Brazil’s coast. Comgás’s supply of natural gas is currently sourced primarily from Petrobras, with contracts in Bolivia and Brazil having been entered into. Our natural gas supply agreement with Petrobras will expire in 2024. See “Risk Factors—Risks Related to Our Business, the Operations of Our Joint Venture, and Industries in Which We Operate—Our business would be materially adversely affected if operations experienced significant interruptions. Our business would also be materially adversely affected if the operations of our customers and suppliers experienced significant interruptions.”
Compass Highlights | As of and for the | |||||
|---|---|---|---|---|---|---|
| 2023 | 2022 | 2021 | |||
Natural gas sold (million cbm) | 4,926.7 | 5,448.3 | 4,859.0 | |||
Net sales (R$ millions) | 17,767.3 | 19,719.2 | 12,330.2 | |||
Regulation
The ANP is responsible for the control, supervision and implementation of the government’s oil, gas and biofuel policies. The ANP is responsible for regulating all exploration, production and importation activities with respect to the gas sector, as well as for regulating the gas transport sector.
In addition to the regulation by ANP, Compass’s activities are also supervised and regulated by ARSESP and ARGERGS, with which it maintains continuous dialogue through its directorate for Regulatory and Institutional Affairs in order to enhance or formulate industry policies. The functions and responsibilities of these agencies include, among others: (i) setting, adjusting, reviewing and approving both the distribution contracts and the tariffs applicable to the contracts; (ii) holding public consultations and hearings to issue new and review old rules related to the activity of gas distribution; and (iii) conducting inspection activities, as well as applying sanctions to agents that violate the rules and guidelines issued by the agencies.
Concessions and Authorizations
Pursuant to the Brazilian Federal Constitution of 1988, it is the responsibility of the State to provide, directly or through concessions, piped gas services. Concessions are formalized through concession agreements. Our subsidiaries Comgás and Necta are the concessionaires for the public distribution of natural gas for part of the state of São Paulo pursuant to Decree No. 43,888, of March 10, 1999, or Decree No. 43,888/99, and concession agreement No. CSPE/01/99, entered into on May 31, 1999 with the state of São Paulo (as amended), which at the time was represented by the Public Energy Services Commission of the state of São Paulo, and has since been replaced by the ARSESP.
In the case of the state of Rio Grande do Sul, our subsidiary Sulgás is the concessionaire for the public service of natural gas distribution. The company was established by State Law No. 9,128, of August 7, 1990, and is authorized to operate as the state’s distributor for a term of 50 years, pursuant to a concession agreement entered into on April 19, 1994.
São Paulo Concession
The Comgás concession agreement was originally set for a 30-year term, which was renewed for an additional 20 years at the discretion of the government of the state of São Paulo considering that Comgás is in compliance with all of its tax, social security and other legal and regulatory commitments and obligations. In September 2019, Comgás submitted an extension request for the concession to the SIMA, as provided for in the concession agreement. On October 1, 2021, the 7th Amendment to the Concession Agreement No. CSPE/01/99 was signed, extending the concession agreement until May 30, 2049.
Pursuant to the concession agreement, Comgás has the right to distribute and commercialize piped gas to customers until 2049 and in a concession area comprising 177 cities in the state of São Paulo. Comgás is also authorized to carry out other business activities, provided that (1) it obtains prior authorization from the ARSESP; (2) such activities do not interfere with Comgás’s main activity; and (3) the revenues from such activities are accounted for separately. In addition, any change in the bylaws of Comgás resulting in a transfer of shares or a change of control requires the prior approval of the ARSESP.
The concession agreement sets out Comgás’s obligations, including, with respect to quality and safety, the five‑year tariff review procedures. CSPE Ordinance No. 160/01 established the general conditions for the supply of piped gas and was replaced by the ARSESP Resolution No. 732 in August 2017. The concession agreement provides for three types of tariff review/adjustments, namely (1) the five-year cycle tariff review; (2) the annual adjustment as of December 10 of each year of the average margin using the IPCA/IBGE; and (3) extraordinary revisions to the extent there are significant cost variations, in order to reestablish the economic and financial balance of the concession. Also, under the terms of the concession agreement, Comgás must achieve certain minimum targets for the sale of gas and the implementation of mechanisms for improving the piped gas distribution system, under the evaluation of ARSESP.
On December 6, 2019, ARSESP published Resolution No. 933, which approved the amount of R$697.2 million plus monetary adjustment since April 2018, as a result of the Third Ordinary Tariff Review, to be applied to the value of the assets returned by Comgás upon termination of the concession, or to any amounts payable by Comgás if the concession is renewed, or to any amounts payable in connection with any renewal of the concession agreement, as it comes to be defined by ARSESP, according to Resolution No. 995 of May 27, 2020. With the publication of the aforementioned resolution, there are no more ongoing discussions regarding tariffs related to previous periods with ARSESP. The amount indicated in Resolution No. 933 was not recognized in our financial statements because it does not comply with accounting standards.
To the extent Comgás fails to comply with its obligations under the concession agreement, it will be subject to penalties of up to 2% of its annual revenues, and the granting authority may terminate the concession or take control of the concession to ensure the adequate provision of the piped gas distribution services.
The concession agreements may be terminated as a consequence of: (1) expiration of the contractual term; (2) expropriation of the concessions in the public interest (i.e., encampação); (3) forfeiture (caducidade); (4) termination; (5) annulment of the concession agreement to the extent irregularities in the bidding process or the granting of the concession are identified; or (6) the bankruptcy or expiration of Comgás.
Authorizations to carry out public works in the concession area are obtained from the relevant municipality.
On November 10, 1999, Necta entered into Concession Contract Nº CSPE/02/99 with the public energy services commission (Comissão de Serviços Públicos de Energia or “CSPE”) of the state of São Paulo to provide piped gas distribution services in 375 municipalities for a term of 30 years, extendable for an additional 20 year term.
Furthermore, under the terms of ARSESP Deliberation No. 1,061/2020, the concession to Compass and Necta would be subject to the piped gas free market regime. Accordingly, pursuant to the ARSESP terms, such gas suppliers would be entitled: (i) to freely contract the purchase of piped gas from supplying agents and free users or partially free users; and (ii) to negotiate prices and other commercial conditions for piped gas in any location in the State.
Rio Grande do Sul Concession
Our subsidiary Sulgás is the concessionaire for the public distribution of natural gas in the state of Rio Grande do Sul pursuant to a concession agreement signed on April 19, 1994. The concession agreement is for a 50-year term.
On April 19, 1994, Sulgás signed a concession contract with the State of Rio Grande do Sul for the exclusive rights to provide piped gas distribution services to any and all consumers or industry, commerce, institutions and residences, for any and all uses or purposes in Rio Grande do Sul for a period of 50 years.
Under the terms of the concession agreement, Sulgás will be obligated to ensure (i) the provision of adequate services, as provided in the agreement and applicable technical standards; (ii) the maintenance of the inventory and registration of assets related to the concession; (iii) the collection of tariffs as established in the agreement; (iv) the use of the public domain necessary for the execution of the service, as well as to promote expropriation and create easements of areas declared of public utility for the provision of services; (v) rendering of accounts of the management of the service to the state government and its users; (vi) care for the integrity of the assets linked to the rendering of the services; (vi) permission to inspect, at any time, the works and installations included in the concession, as well as the respective accounting records; and (vii) the maintenance, on a permanent basis, of a user service agency with the specific purpose of attending to complaints and claims regarding the rendering of services, as well as to forward suggestions aimed at its improvement.
The concession agreement will be terminated upon the occurrence of one of the following events: (i) expiration of the 50-year term; (ii) removal from service (i.e. taken over due to public interest); (iii) forfeiture; (iv) rescission; (v) annulment; or (vi) extinction of the concessionaire. The contract can also be terminated at Sulgás’s discretion in the event of non-compliance by the state government with certain contractual provisions of the concession agreement.
In the event that Sulgás does not comply with the provisions of the concession agreement, it will be subject to intervention by the state of Rio Grande do Sul, as well as having to bear the costs of the administrative process and the subsequent rendering of accounts before the state.
In accordance with Brazilian state law 15.648/21, which has not yet been regulated by AGERGS, free agents (i.e. auto-producers, auto-importers and free consumers) may purchase natural gas other than through the piped gas service concessionaire. In this case, the concessionaire must (i) provide the necessary infrastructure for meeting the gas handling needs in its concession area, including the needs of the free agents; or (ii) if the free agents cannot have their natural gas handling needs met by Sulgás, they may directly build and implement a gas distribution infrastructure for their use, which must be operated and maintained by Sulgás by signing a Distribution System Use Agreement (Contrato de Uso do Sistema de Distribuição, or “CUSD”) as well as the payment of a Distribution System Use Tariff (Tarifa de Uso do Sistema de Distribuição, or “TUSD”).
Currently, there are several discussions involving Sulgás at AGERGS: (i) Public Consultation and Public Hearing No. 02/2023, which addresses Sulgás’ tariff revision for 2023; (ii) Normative Resolution No. 67/2023, whose intention is to approve the Regulation for Distribution Services of Piped Gas for the state of Rio Grande do Sul; and (iii) Normative Resolution No. 68/2023, with the objective of establishing the legal framework for the free market of piped gas in the state. The results of these discussions could directly and permanently affect Sulgás’ operations.
Electricity Generation and Sale
The energy sector is regulated by Law No. 10,848, of March 15, 2004, as amended, or the New Electricity Sector Model Law, and has the following three objectives: (1) guarantee electricity supply security; (2) promote low tariffs through the efficient contracting of electricity; and (3) promote universal access to electricity.
Electricity must be purchased and sold in accordance with the provisions of the New Electricity Sector Model Law. The volume of electricity sold by producers at the CCEE must be electricity that has been generated by such producers at their own plants and/or must be electricity that has been purchased through Energy Purchase and Sale Contracts, or “CCVEs.” Agents who fail to comply with these requirements will be subject to penalties imposed by the ANEEL and CCEE.
Pursuant to Decree No. 5,163, of July 30, 2004, which regulates the sale of electricity and the granting of electricity generation concessions and authorizations, energy producers, distributors and transmitters, as well as independent energy producers and free or regulated customers, are required to submit an annual declaration of their electricity requirements by August 1 of each year in which they inform the MME of their market forecast for the next five years. Based on these projections, the MME organizes electricity purchase auctions to meet the needs of all distribution companies.
The New Electricity Sector Model Law introduced changes to existing guidelines and the rules applicable to the sale of electricity in Brazil, including: (1) the creation of two trading environments for electricity: the regulated market and the free market; (2) changes in criteria applicable to bidding processes criteria, from a highest payment to lowest rate basis; (3) requirements for distribution companies to bid in public auctions for contracts covering 100% of their demand for energy; (4) separation of energy generation, distribution, commercialization and transmission activities, to ensure that distribution companies focus only on distributing electrical energy; (5) controls in transactions with related parties, including barring sales of energy from generation companies to affiliated distribution companies, unless sold through auctions; (6) creation of regulatory agencies to oversee and enforce regulations; and (7) creation of programs for the universalization of electricity.
Electrical Energy Trading Chamber – CCEE
Law No. 10,848/2004 created the Electric Power Trading Chamber (Câmara de Comercialização de Energia Elétrica), or “CCEE.” The CCEE is a private non-profit entity that is regulated by the ANEEL. Under the New Electricity Sector Model Law, the CCEE consists of holders of concessions, permits or authorizations, other agents associated with electricity services and facilities, and free-market consumers.
The CCEE’s key responsibilities include: (1) recording the volume of all energy trading contracts between buyers and sellers; (2) keeping accounts of and settling the difference between amounts contractually agreed and amounts actually generated or consumed by market agents; and (3) calculating the PLD used for short-term market transaction values. Since 2018, the CCEE has also been responsible for operating energy surplus disposal mechanisms.
The CCEE’s board consists of five members: comprised of a chair designated by the MME, and four members representing generation, distribution and trading entities and sector agents as a whole.
National Electrical Energy Agency – ANEEL
The ANEEL is an autonomous federal agency whose main responsibility is to regulate and supervise the electricity sector in accordance with the MME and federal government policies. The ANEEL is responsible for, among others: (1) inspecting electricity generation, transmission and distribution concessions, including the approval of electricity tariffs; (2) issuing regulations; (3) implementing and regulating the exploitation of energy sources, including the use of hydroelectric electricity; (4) coordinating the bidding process for new concessions; (5) arbitrating administrative disputes between electricity generating entities and buyers; and (6) establishing criteria and methodologies for calculating transmission tariffs.
The Gas Law
The natural gas industry is regulated by Law No. 14,134, of April 8, 2021, as amended, or the New Gas Law. This New Gas Law revoked the Law No. 11,909, of March 4, 2009, and has set a new regulatory framework for the exploration of the economic activities in the natural gas market. The New Gas Law seeks to attract private investment and promote a more open and dynamic market, which is intended to reduce energy costs, stimulating economic growth, establish a more transparent and predictable regulatory framework, simplify the licensing process and allow third-party access to gas transportation and distribution infrastructure. These measures are expected to increase competition among gas companies, reduce dependency on Petrobras, and stimulate the development of new gas fields and infrastructure. In addition, Decree 10,712, of June 2, 2021, regulated Law No. 14,134, which sets forth the new guidelines on natural gas transportation in Brazil.
Moove
Moove is responsible for the manufacturing and distribution of passenger vehicle lubricants, commercial vehicle lubricants, industrial lubricants and special application products such as greases, cutting oils and car care products under the Mobil brand, operates in Brazil and in nine other countries: Argentina, Bolivia, Uruguay, Paraguay, the United States of America, Spain, France, Portugal and the United Kingdom. This is consistent with Moove’s strategy of leveraging the ExxonMobil partnership and expanding abroad. Under the “Comma” brand, Moove also operates in the United Kingdom, selling its products to over 40 other countries in Europe and Asia.
Moove Highlights: | As of and for the | ||||||||
|---|---|---|---|---|---|---|---|---|---|
| 2023 | 2022 | 2021 | ||||||
Volume of lubricants sold (million liters) | 665.5 | 524.7 | 388.7 | ||||||
Net sales (R$ millions) | 10,078.6 | 8,980.1 | 6,112.5 | ||||||
Moove has five production plants. In Brazil there are two plants, one in the city of Rio de Janeiro, state of Rio de Janeiro, where the largest plant of the business, with its own pier, is located, and the second one, in the city of Diadema, state of São Paulo, where products are produced under the Tirreno brand. Outside Brazil, Moove has a plant in Gravesend, England, where it produces and distributes lubricants, as well as other automotive products, such as antifreeze, additives and coolants, destined for the UK markets and exported to some European and Asian countries, mainly under the Comma brand. Moove also has two other plants in the United States in the cities of Wichita, Kansas, and another one in Indianapolis, Indiana, where lubricants and other automotive products are produced under the Dynaplex, Ecoultra and Medallion Plus brands. Through these plants, Moove produces and markets a comprehensive portfolio of lubricant products and specialties for various sectors, from automotive to industrial.
We have distribution and production rights for Mobil brand products in Brazil and distribution rights in Bolivia, Paraguay and Uruguay following the purchase of ExxonMobil’s lubricant distribution business in these latter three countries in 2011.
In July 2012, we acquired Moove Lubricants, which reinforced our strategy to enter into the European lubricants and specialties markets. As a result, we acquired finished lubricants and the manufacture and sale of chemicals to third parties, all of Moove Lubricants’ assets at the Gravesend site in Kent, United Kingdom, as well as ownership of Moove Lubricants’ trademarks and brand names. In addition, there are agreements in place allowing Moove Lubricants to distribute select Mobil-brand lubricants into specific sales channels in the United Kingdom and to continue to manufacture and distribute a range of seasonal and ancillary automotive products to ExxonMobil and other Mobil distributors in Europe and Asia.
Since December 2016, Moove has had distribution rights for Mobil brand products in Spain and, more recently, in the United Kingdom, France, Portugal and the United States of America. Since December 2018, Moove has had distribution rights for Mobil-branded products in Argentina.
In May 2022, Moove expanded its international portfolio by acquiring PetroChoice, a lubricants distributor and marketer for Mobil brand products and proprietary brands in the United States that distributes about 240 million liters of lubricants annually, and its assets, which include two lubricant blending plants and more than 50 distribution centers across 25 states. Moove also acquired Tirreno, a privately held company headquartered in Brazil, specialized in the production and sale of lubricating oils, additives and fluids. The acquisition of Tirreno is intended to enhance synergies in automotive and industrial products and fluids through technology and manufacturing, distribution, and cross-selling and branding opportunities.
Our lubricants business is not subject to significant seasonality. However, a significant proportion of our raw material purchases are invoiced in U.S. dollars and we hedge part of our shipments of base oils against variations in exchange rates.
Regulation
Moove is subject to substantially the same regulation imposed by the regulatory bodies to which our fuel distribution business is subject with respect to its operations in Brazil. See “Raízen—Regulation—Regulation of the Oil and Gas Industry—Brazil.”
Moove is also subject to several federal, state and municipal oil and gas, environmental protection and health and safety laws and regulations governing, among other things, the manufacturing and distribution of passenger vehicle lubricants, commercial vehicle lubricants, industrial lubricants and special application products such as greases, ancillaries, base oils and car care products in Brazil, Argentina, Bolivia, Uruguay, Paraguay, the United States of America, Spain, France, Portugal and the United Kingdom.
Rumo
Overview
Our logistics operations are conducted through Rumo, which offers an integrated logistics solution to many sectors, but primarily to agricultural commodity producers across Brazil, connecting the main producing regions with Brazil’s four main ports. Rumo also offers warehousing services.
The following table sets forth certain financial and other information of Rumo for the periods indicated:
Rumo Highlights: | As of and for the | ||||||||
|---|---|---|---|---|---|---|---|---|---|
| 2023 | 2022 | 2021 | ||||||
Transported volume (million TKU) | 77,258.4 | 74,944.0 | 64,028.0 | ||||||
Port elevation volume (thousand tons) | — | 10,794.0 | 12,493.0 | ||||||
North operations (R$ millions) | 8,346.3 | 7,635.2 | 5,479.6 | ||||||
South operations (R$ millions) | 2,032.7 | 1,739.4 | 1,624.1 | ||||||
Container operations (R$ millions) | 558.7 | 466.9 | 336.0 | ||||||
Net sales (R$ millions) | 10,937.7 | 9,841.5 | 7,439.6 | ||||||
Following Rumo’s merger with ALL which was completed on April 1, 2015, Rumo has expanded its offering of logistics services, including, among other things, by providing port handling services. Furthermore, Rumo acquired control of ALL’s former concessions which include the main railroads between the sugar and grain producing areas of the central-south region of Brazil and the ports of Santos, Paranaguá, São Francisco and Rio Grande. As a result, Rumo now operates in the states of Mato Grosso and São Paulo as well as the southern region of Brazil where four of the most active ports in the country are located and through which most of Brazil’s grain production is exported. Moreover, Rumo started operating 9 main inland terminals, either directly or through partners. In September 2021, Rumo announced a contract with the state of Mato Grosso for the construction, operation, exploration, and maintenance of the first state railroad in Brazil. The contract, which has a 45-year concession, renewable for an additional 45 years, will add 740 kilometers to Malha Norte, connecting the city of Rondonópolis and the cities of Cuiabá and Lucas do Rio Verde, both in the state of Mato Grosso, to the Port of Santos in the state of São Paulo.
The transportation of agricultural commodities, primarily for export, represented approximately 83%, 82% and 81% of Rumo’s transported volume in the fiscal years ended December 31, 2023, 2022 and 2021, respectively. The transportation of industrial products represented approximately 12%, 13% and 19% of Rumo’s transported volume in the same periods, respectively. Rumo’s transported volume derived from the transportation of grains (soybean, corn and soybean meal) represented 70%, 70% and 66% in the fiscal years ended December 31, 2023, 2022 and 2021, respectively.
Rumo also provides intermodal transportation logistics services, which is the movement of freight via container using two or more modes of transportation (generally rail and truck). We believe that these methods of transportation reduce the costs of cargo handling, because containers are typically consolidated from trucks onto trains or ships that can carry mass loads, allowing for fuel efficiency.
In November 2022, Rumo concluded the sale of 80% of its equity interest in its then wholly owned subsidiary EPSA whose main operation is the storage and handling of grains and sugar. Rumo continues to hold a 20% stake in the entity, making up Rumo’s portfolio of port assets.
Operational Segments
Rumo conducts its operations through three segments that correspond to the main markets in which it operates: (1) the north operations business segment, or “Northern Operations,” comprising the Rumo Malha Norte, Rumo Malha Paulista and Rumo Malha Central S.A., or “Rumo Malha Central,” rail concessions, Rumo’s transshipment terminals located in the states of Mato Grosso and São Paulo, and its port operation in Santos, (2) Rumo’s south operations business segment, or “Southern Operations,” comprising the Rumo Malha Oeste and Rumo Malha Sul rail concessions and Rumo’s transshipment terminals located in the state of Paraná, and (3) Rumo’s container operations business segment, or “Container Operations,” comprising the operations of Brado Logística which focuses on container logistics, whether by rail or road transport, and the results of container operations on the networks.
The table below shows Rumo’s net sales by segment as well as a percentage of total net sales for the periods indicated:
| As of and for the | ||||||||||||||||
|---|---|---|---|---|---|---|---|---|---|---|---|---|---|---|---|---|---|
| 2023 | 2022 | 2021 | ||||||||||||||
| (in R$ millions, except percentages) | ||||||||||||||||
Northern Operations | 8,346.3 | 76.3% | 7,635.2 | 77.6% | 5,479.6 | 73.7% | |||||||||||
Southern Operations | 2,032.7 | 18.6% | 1,739.4 | 17.7% | 1,624.1 | 21.8% | |||||||||||
Container Operations | 558.7 | 5.1% | 466.9 | 4.7% | 336.0 | 4.5% | |||||||||||
Net sales | 10,937.7 | 100% | 9,841.5 | 100% | 7,439.6 | 100% | |||||||||||
Major Customers
The majority of the cargo Rumo transports is for the agricultural commodities industry. Rumo’s major clients are export companies participating in this market, such as Bunge, Cargill, ADM, COFCO, Amaggi and Louis Dreyfus. In the fiscal year ended December 31, 2023, Bunge accounted for 12.1% of Rumo’s total net revenue, while Rumo’s six major clients accounted for 54.1% of its total net revenue in the same period. In the fiscal year ended December 31, 2022, Cargill accounted for 9.9% (10.1% in 2021) of Rumo’s total net revenue, while Rumo’s six major clients accounted for 43.8% (44.0% in 2021) of Rumo’s total net revenue in the same period.
Rumo’s major clients in the rail sector are export companies such as Cargill, Bunge, ADM, Amaggi, COFCO and Louis Dreyfus. In the fiscal year ended December 31, 2023, Bungee accounted for 10.4% of Rumo’s net revenue from services in the rail sector, while Rumo’s six major clients in the rail sector jointly accounted for 50.2% of its net revenue from services in that sector. In the fiscal year ended December 31, 2022, Cargill accounted for 8.6% (7.7% in 2021) of Rumo’s net revenue from services in the rail sector, while Rumo’s six major clients in the rail sector jointly accounted for 45.8% (46.2% in 2021) of its net revenue from services in that sector.
Seasonality
Rumo is subject to the seasonality that influences the sugarcane and grain harvest. During the peak months of the harvests, there is higher demand for transport and logistics operations. Rumo is also subject to the risk that sugarcane mills may change their production mix in favor of ethanol if the relative prices of the two products swing that way. This could reduce the demand for sugar logistics and transport. See also “Management’s Discussion and Analysis of Financial Condition and Results of Operations—Principal Factors Affecting Our Results of Operations—Seasonality.”
Regulation
Rumo’s activities are subject to extensive regulation by public authorities, especially by the Brazilian Ministry of Infrastructure, the ANTT and ANTAQ.
Further, given the fact that they operate in the transport infrastructure sector, Rumo’s subsidiaries and affiliates maintain a constant relationship with their respective granting authorities, whether in the context of participation in bidding processes to obtain new business (concessions) or in the context of inspections of their existing business by the authorities responsible for supervising services rendered, in order to remain in compliance with the demands of such authorities.
Rail Transportation Regulation
Rail transportation activities in Brazil are subject to a wide variety of laws and regulations. Rail transportation regulation in Brazil regulates (1) the relationship between the Brazilian government and the rail companies, (2) the relationship among the rail companies, including interchange and mutual transit rights, (3) the relationship between the rail companies and their customers and (4) rail safety. The rules also contain a few provisions relating to a railroad operator’s liability. According to Decree No. 1,832/1996, Rumo will be relieved of liability for damage caused by Rumo’s operations in the event of (1) inherent defects or causes inherent to the nature of the goods to be transported, (2) death or injury of animals as a consequence of the natural risk inherent to rail transportation, (3) lack of latent defect in or fraudulent procedure for the packaging of the product, (4) damage derived from the operations of loading, unloading or trans-loading by the sender, the addressee or their representatives or (5) damage to freight that has been packaged in sealed containers or sealed railroad cars but, after transportation, arrives damaged but still displaying a non-violated seal. Rumo is otherwise liable for losses and damages. The liability is limited to the value declared by the sender, which must be stated on the bill of lading. In the event of fault of both Rumo and the cargo owner, the responsibility is allocated proportionally based on relative fault. Total loss is assumed 30 days after the agreed date of delivery, except when due to force majeure.
Pursuant to Decree No. 2,681/1912, the liability of the rail company for total or partial loss, damage or theft of transported freight is always assumed and the burden of proof of non-liability may only be deemed satisfied if the rail company is able to provide evidence of (1) an act of God or force majeure, (2) a loss caused by fault of the merchandise, (3) death or injury to a live animal resulting from an ordinary risk caused by the transportation, (4) defective packaging of the freight, (5) loss or damage caused by transportation in open cars, as required by regulation or resulting from the agreement with the customer, (6) loss or damage caused by loading and unloading by either the shipper or receiver or (7) loss or damage that could have been avoided by proper surveillance by the shipper of a freighted car. In the cases provided in (1), (2), (3), (5) and (6), whenever there is mutual fault of the rail company and the shipper and/or the receiver, the indemnification shall be apportioned based on relative fault. For a total loss of the merchandise, the amount of the indemnification is limited to the fair market price of the shipped goods. For damage to the merchandise, the indemnification is proportional to the damage caused. In both cases, recovery is reduced by the amount of expenses not incurred by the shipper as a result of the damage or loss. For willful misconduct, all direct damages are indemnifiable. Late deliveries also are indemnifiable under certain circumstances.
Indemnification is limited by a one-year statute of limitations, counted from the delivery date (in case of damage) or from the 31st day after the promised delivery (in case of loss or theft). Any agreement providing for the exemption of railway liability is null and void, except that the indemnification may be limited based on an agreed-upon tariff reduction.
If more than one rail company causes damage, any of them may be named as a sole defendant, although such named defendant will have recourse against the others. Death, disability or personal injuries are also indemnifiable and subject to this presumed liability rule, except when caused by force majeure or the injured party’s sole liability, without fault of the rail company. Indemnification for personal injuries may include, in addition to medical expenses and loss of profits, other indemnification that may be granted. In addition, in 2001, the land transportation industry underwent reform with the enactment of Law No. 10,233/2001, which created, among other agencies, the ANTT, an entity member of the indirect federal administration, submitted to the special administration system and linked to the Brazilian Ministry of Infrastructure, the responsibilities of which include, among others, (1) to publish bidding invitations, judge the bids and execute the rail transportation service concession agreements, (2) to administer concession agreements and rail network leases executed until the date of reform of the transportation market, according to Law No. 10,233/2001, (3) to publish invitations to bid, to judge the bids and to execute concession agreements for the construction and exploitation of new rail networks, (4) to inspect, through cooperation arrangements, compliance with contractual clauses for the provision of rail transportation services, as well as maintenance and replacement of the leased assets, and (5) to regulate and coordinate each concessionaire’s operations.
Rail transportation services in Brazil can be provided by private parties under the concession regime regulated by Law No. 8,987 of February 13, 1995, or the Concession Law. The Concession Law requires that the granting authority and concession holder enter into a concession agreement regulating the terms of such exploration and setting forth the terms applicable to the performance of the services.
Examples of key clauses found in such concession agreements include those relating to its purpose, the concession area and the concession term; the manner, form and conditions for rendering the services; criteria, indicators, formulas and parameters defining the quality of services; the price of the services, criteria and proceedings for the readjustment and review of tariffs; and rights, warrants and obligations of each of the granting authority and the concession holder, including those related to predictable needs of future change and expansion and services and consequent modernization, improvement and expansion of equipment and installations. Further examples include clauses relating to customers’ rights and obligations to have and use the services; contractual and administrative penalties to which the concession holder is subject and their application; concession termination events; revertible assets; criteria for the calculation and the payment conditions of indemnification owned to the concession holder; and conditions relating to the renewal of the concession agreement.
In addition, both the Concession Law and the concession agreements regulate the penalties applicable in case of breach of the concession agreement. Pursuant to the Concession Law, the granting authority is entitled to terminate the concession agreement if (1) the services rendered by the concession holder fall below the standard agreed between the parties with regard to such services; (2) there is a breach of the provisions of the concession agreement by the concession holder; (3) the concession holder interrupts the provision of the services, unless such interruption is due to a force majeure event; (4) the concession holder does not have the financial resources necessary to render the services required under the concession agreement; (5) the concession holder does not comply with penalties imposed by the granting authority; (6) the concession holder does not comply with requests from the granting authority intended to improve the services provided under the concession agreement; or (7) the concession holder does not provide, within 180 days after a request by the granting authority to that effect, documents proving that it is in compliance with applicable tax law. In addition, the granting authority can also terminate the concession agreement when it considers that it is in the public interest to do so, in which case specific legislation must be enacted regarding such termination and the concession holder must be duly indemnified for it.
Waterborne Transportation Regulation
Waterborne transportation services in Brazil are regulated by Law No. 12,815/2013, as amended by Law No. 14,047, dated August 24, 2020, Decree No. 8,033/2013 and by the rules issued by ANTAQ and by the Brazilian Ministry of Infrastructure.
ANTAQ, which was created by Law No. 10,233/2001, is linked to the Brazilian Ministry of Infrastructure. Among other things, ANTAQ is responsible for (1) publishing invitations to bid, executing concession agreements, and issuing authorizations to exploit private port terminals and facilities, (2) inspecting compliance with contractual clauses for the provision of services in connection with public terminals and private port facilities and (3) regulating and coordinating each concession holder’s operations and companies authorized to exploit private port facilities.
In Brazil, there are two main regulatory regimes affecting waterborne transportation: (1) the concession regime, preceded by a public bidding process which regulates the operation of government-owned port terminals and the leasing of government-owned terminals, also preceded by a public bidding process, except when there is only one interested operator, and (2) the authorization regime, relating to new private port terminals and facilities. Furthermore, the Law No. 14,047/2020 has created a temporary use granting of government-owned port terminals for unconsolidated market cargo handling.
Pursuant to Law No. 12,815/2013, with its amendments and additions issued by Law No. 14,047/2020, the following provisions are essential to the lease agreements: contract object, area and term; those relating to the manner, form and conditions for the exploration of organized ports and facilities; the value of the contract, tariffs in place and criteria and procedure for their readjustment and review; those relating to the contracting party’s investment obligations; the parties’ rights, obligations and responsibilities; the duty to provide information of interest and access to port facilities to the competent entities; clauses relating to the port owner’s liability for nonperformance or deficient performance of activities; contract termination events; and penalties and the application thereof; criteria, indicators, formulas and parameters defining the quality of activities performed, as well as goals and time frames for reaching certain service levels; customers’ rights and obligations, including the related obligations of the contracted party and the respective sanctions; assets reversal; contractor and contracting party’s rights, obligations and warrants, including those related to future supplemental need, change and activities expansion and consequent modernization, improvement and expansion of facilities; inspection of facilities, equipment and of the methods and practices for the development of the activities, as well as the appointment of competent entities to perform it; guarantees for the adequate performance of the contract; and clauses on customs inspection measures for goods, vehicles and customers.
Until December 6, 2012, port operations in Brazil were governed by Federal Law No. 8,630/1993, or the Ports Modernization Law, which provided the legal framework applicable to the operation of government-owned port terminals and facilities in Brazil. In view of the need to improve the applicable legislation, the Brazilian government implemented Law No. 12,815/2013, or the Ports Law, which expressly revoked the Ports Modernization Law and established a new legal framework with respect to port operations in Brazil. As a result, public ports are regulated by the Ports Law and by specific complementing regulations, such as Decree No. 8,033/2013, with its amendments and additions issued by Decree No. 10,672/2021. According to the provisions of the Ports Law, there are no more distinctions between third-party and own cargo handled at private port terminals. As a result, public ports are expected to face higher competition by private operators, as private operators are subject to less rigorous regulatory requirements than publicly owned ports. Accordingly, it is possible that Rumo may not be able to reach the minimum cargo movement provided for in its concession agreement for the operation of public port terminals, which may subject it to fines and, upon repeated violations, to the early termination of the concession. Even though the Ports Law does not provide for the adjustments of the terms of any concession agreement currently in place, it is possible that new regulations may make such provision. New regulations applicable to port operations in Brazil that might cause an adjustment of the terms in Rumo’s concession agreements may adversely affect Rumo’s results of operations.
On January 8, 2014, ANTAQ published Resolution No. 3,220/2014, which sets forth the process for requesting the economic and financial rebalancing of the concession agreements for the operation of government-owned port terminals.
Environmental Regulation
Rumo’s operations are subject to a wide range of federal, state and local laws, in addition to regulations and permit requirements regarding environmental protection in Brazil.
Rumo’s rail operations are subject to potential environmental liabilities involving the use, handling and transportation of hazardous materials. Rumo can also be held liable for damages resulting from vegetation suppression in connection with railroad expansion and other works in the vicinity of Rumo’s railroads. Locomotives are supplied with fossil fuel, which can be transported by wagon or truck, depending on the location. We have 20 active refueling stations, with a total storage capacity of over 2.3 million liters. Potential incidents and leaks at those refueling stations may result in environmental damage.
Legislation authorizes the use of herbicides throughout Rumo’s rail system to control overgrown invasive vegetation, except in permanent preservation areas, where herbicides are prohibited. Rumo is constantly researching alternatives to control invasive vegetation in partnership with environmental authorities.
Rumo possesses an interstate railroad network and, pursuant to the Complementary Federal Law No. 140/2011, the Brazilian Institute of Environment and Natural Resources (Instituto Brasileiro do Meio Ambiente e dos Recursos Naturais Renováveis), or “IBAMA,” is the federal entity competent for licensing these activities. Rumo holds operating permits that allow us to operate the railways in the states of Rio Grande do Sul, Santa Catarina, Paraná, São Paulo, Mato Grosso and Mato Grosso do Sul, pending the issuance of the operating permits for the south of São Paulo and all operating units. The issuance of these licenses by IBAMA is pending, but Rumo is currently standardizing its environmental licensing in accordance with applicable legislation.
The performance of environmental programs is essential to guarantee the granting and renewal of rail network permits and the continuity of Rumo’s operations. The following environmental programs are included as conditions in Rumo’s permits:
- monitoring and mitigation of accidents involving wildlife;
- monitoring and displacement of wild animals;
- identification, control and correction of erosive processes;
- identification and correction of critical drainage points;
- identification and correction of vegetation overgrowth on rail tracks;
- restoration of vegetation in permanent preservation areas;
- social communication;
- environmental education;
- risk analysis, risk management plan and emergency planning;
- reduction of bulk leakage during rail transportation;
- imaging and geographical information systems;
- environmental management and audit;
- diagnosis, monitoring and regularization of rights of way;
- gradual replacement of railroad ties;
- solid waste management;
- noise control;
- air emissions control; and
- identification, control and correction of environmental liabilities.
Rumo currently has an environmental licensing timeline for the improvement and expansion of Rumo’s rail operations. Compliance with environmental conditions imposed by the current permits is of great importance in obtaining new licensing from environmental agencies.
Rumo seeks to comply with several procedures to reduce the risks related to the transportation of hazardous materials, such as having an emergency service plan and a management risk plan, and undertaking periodical track maintenance. Rumo also has an authorization to transport hazardous materials in the states in which we operate. In addition, Rumo has put in place certain procedures to reduce the risks of leakage of hazardous materials. For example, the recent installation of automatic shut-off valves and high-level alarms at Rumo’s diesel storage areas are expected to help reduce the number of accidental discharges. Rumo’s investment program includes comprehensive upgrades to control systems that are expected to reduce the number and severity of hazardous materials leaks in cases of derailments. The environmental impact caused by the leakage of hazardous materials may vary in each case, so we perform quarterly internal audits to identify any noncompliance with the environmental standards. Rumo has identified and is in the remediation and monitoring phase with respect to certain areas of soil and groundwater contamination resulting from inadequate operation of wastewater treatment systems associated with railcar maintenance and washing and contamination from the leakage of hazardous materials.
Rumo’s environmental liabilities consist of environmental proceedings, including with respect to contaminated areas undergoing remediation, monitoring, supply posts and workshops. Rumo has been investing to resolve these liabilities. Other issues identified that require improvement include leakage prevention and leakage containment procedures, particularly with respect to avoiding water and soil contamination.
Compliance with applicable legislation is essential in order to fulfill the terms of current environmental permits as well as to obtain permits for new projects. Due to the need to compete for new projects and perform operational enhancements, we try to enhance and improve Rumo’s routine and operational procedures, and it is likely that Rumo’s environmental investments and costs associated with compliance with environmental legislation will increase with the passage of time in accordance with Rumo’s need to undertake new projects and improve its operations.
Rail Concessions
Rumo conducts its rail activities through the following concession agreements: (1) the concession agreement entered into on December 30, 1998 and amended on May 27, 2020 involving Rumo Malha Paulista, which was originally scheduled to expire in 2028 but in May 2020 it was extended to 2058, as Rumo complied with the required obligations; (2) the concession agreement entered into on May 19, 1989 involving Rumo Malha Norte, expiring in 2079; (3) the concession agreement entered into on July 7, 1996 involving Rumo Malha Oeste, expiring in 2026; and (iv) the concession agreement entered into on February 27, 1997 involving Rumo Malha Sul, expiring in 2027 (which may be extended for a further 30 years)
In September 2015, we filed a formal request for the renewal of the Rumo Malha Sul concession agreement with the ANTT and, in January 2018, a request for extension of the concession agreement termination date.
The granting authority may unilaterally rescind all of Rumo’s rail concession agreements prior to their expiration in the following circumstances:
- encampação, which is the takeover of the provision of the services by the granting authority by means of specific legal order and prior payment of indemnity;
- forfeiture, which means the complete or partial non-performance of the concession agreement or failure to comply with the financial terms of the concession agreement and the lease agreement (when there is one in force);
- bankruptcy or dissolution of the concession holder; or
- cancellation of the bidding process.
The enforcement of any of the unilateral termination provisions of the concession agreement must be preceded by the relevant administrative proceeding with ANTT and may result in indemnity to us for assets that revert to the granting authority. As of the date of current report, we are aware of the existence of the administrative proceedings that could potentially give rise to unilateral termination events for our concessions, after all applicable administrative and judicial spheres have been overcome. For further information, see “Legal Proceedings—Probable Losses—Civil, regulatory, environmental and other claims.”
On March 28, 2019, Rumo won the tender No. 02/2018 organized by ANTT to operate the railway network located between the cities of Porto Nacional, in the state of Tocantins, and Estrela d’Oeste, in the state of São Paulo, or the Ferrovia Norte Sul Tramo Central, for 30 years. Rumo’s bid was R$2,719.5 million. On July 31, 2019, Rumo entered into a sub-concession agreement with ANTT and Valec Engenharia, Construções e Ferrovias S.A., allowing Rumo Malha Central to explore for 30 years the activities of rail freight transport and operate the Ferrovia Norte Sul Tramo Central. If Rumo is unable to comply with the obligations detailed in the tender notice for the Ferrovia Norte Sul Tramo Central, Rumo’s assets may be encumbered, which may adversely affect Rumo’s financial condition and results of operations.
See also “Risk Factors—Risks Related to Our Business, the Operations of Our Joint Venture, and Industries in Which We Operate––The loss of Brazilian railway concessions may have a material adverse effect on our business.” and “Risk Factors—Risks Related to Our Business, the Operations of Our Joint Venture, and Industries in Which We Operate––Rumo may not obtain an early renewal of the Rumo Malha Sul concession agreement, currently under review by the Brazilian Transportation Authority (Agência Nacional de Transporte Terrestre), or ANTT, which may have a material adverse effect on Rumo’s investment plan and growth strategy.”
Rail Authorization Agreements
Currently, no section of our railroad network is subject to an authorization, rather than a concession, by any governmental entity. However, on July 19, 2021, the government of the state of Mato Grosso launched a public call to receive bids for an authorization to construct a new, 730-kilometer railroad network within the state. Under current law, an authorization to construct a railway network requires no prior tender. Rather, a simplified, public call process may be used, wherein technically and financially eligible companies may submit bids for the project without an elaborate competitive process. However, whereas concession agreements typically entail the operation or expansion of an existing railway network in consideration for a guaranteed rate of return, an authorization requires a successful bidder to build a railway network from scratch, and carries with it no guarantee of success or return.
On September 20, 2021, Rumo Malha Norte entered into an adhesion agreement with the state of Mato Grosso, which allows Rumo Malha Norte to engage in the construction, operation, exploration and conservation of a railroad that independently connects the Rondonópolis railroad terminal to Cuiabá and Lucas do Rio Verde in the state of Mato Grosso.
Port Lease Agreements
Rumo holds equity interests in: (1) Terminal XXXIX and the adjacent areas for moving agricultural products and bulk as well as other goods capable of being transported in those port installations, through a port lease agreement due to expire in 2050; (2) Portofer Transporte Ferroviário Ltda., which leases facilities, equipment and railroad tracks for the transportation of goods and import/export through the right and left banks of the port of Santos, by means of a lease agreement with Portofer Transporte Ferroviário Ltda. due to expire in 2025; (3) Terminal de Granéis do Guarujá (TGG), located on the left bank of the port of Santos, for the transport of solid and liquid bulk, through an area used by Rumo Malha Norte via a leasing agreement due to expire in 2027; and (4) Terminal Marítimo do Guarujá (TERMAG), located on the left bank of the port of Santos, mainly for the transport of solid and liquid bulk, through an area used by Rumo Malha Norte via a lease agreement due to expire in 2027.
If Rumo fails to comply with the applicable regulatory rules or contractual obligations, its lease may be terminated early pursuant to the Concession Law, which applies to port leases.
Furthermore, there are ongoing legal and administrative proceedings which question the validity or legality of Rumo’s concessions or leaseholds in port facilities, as follows: (i) ongoing legal proceeding regarding whether the execution of the lease agreement relating to Terminal XXXIX, TGG and TERMAG should have been subject to a prior bidding procedure. The Brazilian Superior Justice Court (Superior Tribunal de Justiça) sustained Rumo’s appeal by finding in its favor, to which the public prosecutor’s office filed an additional appeal, which is currently pending disposition; (ii) an ongoing public civil action filed by the Brazilian Federal Prosecutor’s Office challenging the validity of the Portofer lease agreement. A trial court has ruled in favor of Rumo and rejected the claim, but an appeal had been lodged by the Federal Prosecutor’s Office and is currently awaiting disposition; and (iii) an administrative proceeding before the Federal Court of Accounts, or the TCU, challenging the legal validity of the Portofer lease agreement. In June 2020, the TCU decided that a declaration of invalidity relating to the lease agreement would be contrary to public interest, however, the Santos Port Authority, or “SPA,” was denied the right to renew the lease agreement with Portofer for subsequent terms upon its expiration in June 2025. Considering the TCU decision and to avoid costs associated with third-party leases of the railroad in the Santos Port, the SPA issued public notice calling for members to join an association to manage the railroad in the Port area (Ferrovia Interna do Porto de Santos), or “FIPS.” Rumo, MRS and VLI Multimodal S.A. have accepted to join this association. FIPS has been created and has entered into a lease agreement with Port Authority. FPIS is expected to begin its activities following a transition process with Portofer, after which Portofer will end its activities.
Real Estate
Our real estate operations are conducted through Radar, Tellus, Gamiovapar, Duguetiapar and Janus. Through these companies, we acquire rural properties to be leased or sold to third parties. Radar, Tellus, Janus, Gamiovapar and Duguetiapar together manage approximately 320,000 hectares of land in the Brazilian states of São Paulo, Goiás, Mato Grosso, Maranhão, Minas Gerais, Tocantins, Bahia and Piauí.
In November 2021, we concluded the acquisition of an additional interest in Radar. This initiative is aligned with our capital allocation strategy and reinforces our commitments to the sustainable development of Brazilian agribusiness while creating value to all stakeholders. On September 30, 2022, we entered into a share purchase agreement for the acquisition of an additional stake in Tellus Brasil Participações S.A., Janus Brasil Participações S.A., Gamiovapar Empreendimentos e Participações S.A. and Duguetiapar Empreendimentos e Participações S.A.
Regulation
Our real estate operations are subject to various Brazilian federal, state and municipal environmental and real estate laws and regulations governing, among other things, the acquisition, lease and disposal of rural properties.
Certain environmental laws require the tenants of Radar’s properties to obtain permits, licenses and approvals from governmental authorities in order to conduct agricultural activities and operate storage facilities. Despite Radar’s position as a real estate investor, if its tenants fail to obtain licenses and permits that they would be obliged to obtain for the use of land, Radar could be adversely impacted. We are subject to regulation by the following principal governmental agencies:
- Instituto Nacional de Colonização e Reforma Agrária or “INCRA”: Responsible for regulating the ownership of agricultural properties. This agency monitors the operation of the agricultural properties.
- Instituto Brasileiro do Meio Ambiente e dos Recursos Naturais Renováveis, or “IBAMA”: A regulator, responsible for environmental licenses relating to operations.
- Local environmental agencies: The Secretarias de Meio Ambiente Estaduais (State Secretariats for the Environment), Secretaria do Meio Ambiente or “SEMA – MT,” Secretaria do Meio Ambiente or “SMA” and Instituto do Meio Ambiente e Recursos Hídricos or “INEMA.”
Furthermore, certain of our activities such as land ownership and georeferencing processes, are regulated by several Brazilian laws, including but not limited to the Brazilian Constitution. INCRA is responsible for approving georeferencing procedures necessary for registering any title of acquired agricultural property in Brazil. We are also subject to the Brazilian Forestry Code, which prohibits land use in certain permanently protected areas, and obliges us to maintain and register a forestry reserve in each of our rural landholdings covering at least 20% of the area in any such property. The responsibility for maintenance of forestry reserves and permanent preservation areas as required by law falls jointly upon the landowners (in our case, Radar) and any tenants.
Vale
In October 2022, we completed the acquisition, through a subsidiary and via the combination of direct investments and derivative operations, of a stake corresponding to 4.96% of Vale’s outstanding share capital (4.85% of its total share capital). As of the date of this current report, we hold a 3.91% of Vale’s total share capital. For more information on the acquisition of our stake in Vale, see “Presentation of Financial and other Information—Certain Corporate Events—Acquisition of Significant Influence in Vale S.A.,” or “Vale.”
Vale was created by the Brazilian federal government on June 1, 1942, by Decree-Law No. 4,352 for the purpose of exploiting, marketing, transporting and exporting iron ore from the mines of Itabira, state of Minas Gerais, and of exploiting the Vitória-Minas railroad, which transported iron ore and agricultural products through the Rio Doce valley in southeastern Brazil to the port of Vitória, located in the state of Espírito Santo. For additional information, see Vale’s latest annual report on Form 20-F filed with the SEC, which is not part of, and is not incorporated by reference in, this current report.
Competition
Raízen
Raízen faces competition in its fuel distribution and renewables businesses.
In the fuel distribution business, Raízen competes with companies in the sectors in which it operates and with companies in other sectors that produce similar products. Competitors include gas stations from large integrated oil companies, independent gas stations, convenience stores, fast food stores and other similar outlets, some of which are well-known Brazilian or regional retail companies. According to SINDICOM, the three largest fuel distributors in Brazil are Vibra Energia (through the BR Petrobras brand), Raízen (through our Shell brand gas stations) and Ultrapar S.A. (through the Ipiranga brand). The main competitive factors affecting retail marketing operations include site location, product price, selection and quality, appearance and cleanliness, opening hours, safety at the store, customer loyalty and brand recognition. In the year ended December 31, 2023, we registered 21.3 billion liters of fuel sold in Brazil, while in the years ended December 31, 2022 and December 31, 2021, Raízen registered the sale, respectively, of 21.1 billion and 21.2 billion liters. In November 2021, Raízen concluded the acquisition of B&R, the largest fuel distributor in Paraguay, complementing our operating platform in South America. In its international operations, Raízen faces competition from several other fuel distributors, including YPF, Axion and Puma, among others. There, Raízen recorded 5.5 billion liters of fuels sold in the year ended December 31, 2023.
Raízen is a leading global company in the ethanol and sugar markets, with low-cost, large-scale production and integrated operations throughout Brazil. The favorable conditions in Brazil enable sugarcane to be harvested five to six times before replanting becomes necessary, which is a major advantage relative to other countries, such as India, where sugarcane needs to be replanted every two or three harvests on average. However, Raízen faces competition from international ethanol producers who use other sources of ethanol, such as corn and sugar beet to produce ethanol fuel.
We believe that Raízen is a global leader in terms of the products it markets through the renewables and sugar segments, as follows:
- Sugarcane: Raízen is the world’s largest sugarcane producer and processor, having processed 83.5 million tons of sugarcane in the nine months of the 2023/2024 harvest, compared to 73.2 million tons in the 2022/2023 harvest and 54.1 million tons for the 2021/2022 harvest.
- Ethanol: Raízen is the largest sugar ethanol producer in Brazil and one of the largest in the world, having produced 3.1 billion liters during nine months of the 2023/2024 harvest, 3.0 billion liters in the 2022/2023 harvest and 2.2 billion liters in the 2021/2022 harvest.
- Sugar: Raízen is the largest producer-exporter of sugar in the world, having produced 5.8 million tons in the nine months of the 2023/2024 harvest, compared to 4.8 tons in the 2022/2023 harvest and 3.7 million tons in the 2021/2023 harvest.
- Energy Cogeneration: Raízen is the world’s largest producer of energy from sugarcane bagasse. We have an installed energy capacity of 1.6 GW per year from our 35 plants. We consider energy cogeneration to be strategic to our business, as it allows for greater stability of cash flow across commodity cycles, significantly reducing volatility in our operations.
Compass
Comgás’s concession area covers 94 municipalities in the metropolitan areas of São Paulo, Campinas and Santos as well as the Paraíba Valley. Comgás distributes natural gas for residential, commercial and industrial customers, and also supplies gas for use as fuel for vehicles and electricity generation. For the residential and commercial customers, Comgás holds exclusivity rights within its area of concession. For industrial customers, Comgás has exclusive distribution rights until 2049. Comgás faces competition from electricity concessionaires, oil and ethanol producers in its activities.
Sulgás and Necta are distribution companies in which Compass and Commit own equity interests, directly and indirectly, in excess of 51% as of December 31, 2023. Sulgás is the natural gas distribution company with an exclusive distribution rights until 2044 in the state of Rio Grande do Sul, and it operates in the industrial, commercial, residential and automotive segment. Necta is responsible for the distribution of natural gas to the northwest area of the state of São Paulo and it has an exclusive distribution right until 2029. Necta also distributes natural gas for residential, commercial and industrial customers, and supplies gas for use as fuel for vehicles.
Rumo
Companies active in the Brazilian railroad transport market generally provide logistics services in their respective regions, with regions being allocated to various companies based on the public concessions granted by the ANTT. The necessity of obtaining a concession from the ANTT represents a barrier to the entry of new competitors into the market given that each concession area is granted to a single operator. As there are currently no parallel rail tracks in the Brazilian railway network, the competition in the market in which we operate primarily derives from truck transportation, which can compete for the same freight as rail operators.
Clients generally select a mode of transportation based on the freight rates charged, efficiency and volume. Given our offering of advantageous prices coupled with our significant transport capacity and greater efficiency over trucks, we believe we have significant opportunities to increase our current market share within the areas in which we operate and that we are in a better strategic position than our competitors to seize the growth opportunities in these industries.
Historically, railroad freight prices have varied in conjunction with road freight prices. Freight prices in the road transportation market have increased significantly in the past years, usually in line with the fluctuations of diesel prices. We expect this increase to also benefit railroad operators such as us, given the correlation between road and rail freight prices.
Each railway concession agreement grants the recipient concession holder an exclusive right to develop the rail network infrastructure in a particular geographic area. Because each concession holder operates in a separate geographic area, they do not compete directly with each other. Instead, the main competition to the various rail concession holders is, in most cases, the truck transportation sector, which has historically been the main form of cargo transportation in Brazil.
The main competitive factors affecting intermodal logistics operations include (1) rates charged, (2) haul time, (3) haul volume and (4) the quality and reliability of the service provided. We believe that Rumo in a strong position to compete effectively in the intermodal transportation sphere due to the lower rates it can charge due to our relatively larger transportation capacity and operational efficiencies arising from our long-term investment plan.
Vale
The global iron ore and iron ore pellet markets are highly competitive. Factors affecting competition are price, quality and range of products offered, reliability, operating costs and shipping costs.
Patents, Licenses, Contracts and Processes
In Brazil, ownership of trademarks can be acquired only through a validly approved registration with the National Institute of Intellectual Property (Instituto Nacional de Propriedade Industrial), or “INPI,” the agency responsible for registering trademarks, patents and designs in Brazil. After registration, the owner has exclusive rights of use of the trademark throughout Brazil for a ten-year period that can be successively renewed for equal periods.
As of the date of this current report, we own 485 trademarks in Brazil, 135 of which are owned by Cosan S.A., 28 of which are owned by Rumo S.A., with the remaining 322 owned by other companies of the Cosan Group. All material trademarks for our business are registered or have been submitted to INPI by us or our affiliates.
Research and Development
Our main research and development activities for the fiscal years ended December 31, 2023, 2022 and 2021 concentrated in the following key areas:
- We engage CanaVialis S.A., or “CanaVialis,” to provide us with access to its sugarcane genetic improvement program specifically tailored to Raízen’s mills. CanaVialis, which is a subsidiary of Monsanto, is a privately owned firm focused on the genetic improvement of sugarcane. We benefit from their support services and use of their bio factory, which allows us to decrease the amount of time required for seedling production and grants us access to new, improved sugarcane varieties through their genetic improvement program. CanaVialis also conducts field trials and region-specific genetic selection programs to develop sugarcane varieties for our greenfield projects for the construction of new sugarcane mills.
- Raízen also invests in innovation in the ethanol manufacturing process. Raízen has an interest in Shell’s commercialization rights of Iogen Energy, which conducts research into advanced fuels, including ethanol extracted from the cellulose of sugarcane and other plants.
Our total research and development expenditure amounted to R$12.0 million in the fiscal year ended December 31, 2023, R$9.7 million in the fiscal year ended December 31, 2022, and R$5.3 million in the fiscal year ended December 31, 2021.
Cybersecurity
Information security is a key aspect of our strategic and operational business management. Our cybersecurity operations are organized on a group-wide basis. Our Chief Information Security Officer, or “CISO,” reports to our chief financial and investor relations officers, while collaborating with the Business Information Security Officers, or “BISOs,” of each of our subsidiaries. Our CISO, Mr. Fernando Madureira, has over 25 years of experience in information security and cybersecurity and has worked in European, American, and Brazilian companies across various business sectors. The purpose of our information and cybersecurity operations is to minimize our exposure to risks associated with this area. Our concern extends across all business areas. For instance, a cyberattack on our gas supply services could disrupt supply to customers, hospitals, and industries, causing significant harm to society. Consequently, we endeavor to develop mechanisms to protect our data and the systems that drive our operations.
Governance in this area involves regular reporting and alignment of identified risks. Our board of directors has overall oversight responsibility for our cybersecurity risk management, and is charged with oversight of our cybersecurity management program. We work closely with our subsidiaries to enhance processes. Strategic reports are presented monthly to our board of executive officers and quarterly to our board of directors. Management is responsible for identifying, considering and assessing material cybersecurity risks on an ongoing basis, establishing processes to ensure that such potential cybersecurity risk exposures are monitored, putting in place appropriate mitigation measures and maintaining cybersecurity programs. Our CISO delivers periodic presentations to our audit committee and board of directors, with cybersecurity being a regular item on the audit committee’s agenda. This approach improves our management of information security, cybersecurity, and data protection by placing these topics at the heart of our strategic discussions.
The Cosan Group has a structured process to monitor, analyze, and pinpoint weaknesses, threats, and impacts on information assets so that suitable controls can be put in place, and their effectiveness is tested periodically. As a result, security risks are mapped and duly communicated to the responsible stakeholders for treatment and mitigation. Monthly meetings are held to report on information security, which meetings are attended by our BISO, technology managers, CIO, CFO, and CEO. The Security Maturity Program includes independent assessments conducted twice a year. The security maturity rating is also a variable of the Profit-Sharing Component. This program encompasses key international frameworks such as NIST-CSF, ISO 27001/2, and CIS Controls.
We believe that centralized cybersecurity governance is beneficial for the Cosan Group. It offers operational cost synergies, a unified threat intelligence center, a multidisciplinary team (including technicians, specialists, and business interactions), and access to the latest technologies. Our shared intelligence model involves developing standardized strategies, policies, norms, risk management approaches, and educational programs (such as the “Guardian Program”) that are compatible and replicable across all of our subsidiaries. In 2024, we will continue our planning initiated in 2021, projecting strategic goals until 2025. We conduct annual reviews to keep up with best market practices. We have consolidated information security and cybersecurity operations within our operational and industrial environments as part of the phase 2 expansion. Additionally, we remain committed to enhancing our approach to safeguarding critical assets.
In March 2020, our subsidiaries and jointly controlled companies suffered a cyberattack by ransomware that caused a partial and temporary interruption of our operations. Following this incident, we have strengthened procedures and controls with the support of our chief of information security and cybersecurity, internal cybersecurity-dedicated personnel and third-party security experts to expand and improve our cyber security controls. Our cyber-defense center gained a security operations center which focuses on cyberattacks and operates on a 24/7 basis, and a new process for periodic pentesting (i.e., an authorized simulated cyberattack on a computer system) exercises was introduced into our vulnerability management structure. See also “Risk Factors—Risks Related to Our Businesses and the Industries in Which We Operate Generally—We were the target of a cybersecurity incident which disrupted our systems, and we could be the target of attempted cyber threats in the future, which could adversely affect our business.”
In the fiscal years ended December 31, 2021, 2022 and 2023, we did not identify any cybersecurity threats that have materially affected or are reasonably likely to materially affect our business strategy, results of operations or financial condition. However, despite our efforts, we cannot eliminate all risks from cybersecurity threats, or provide assurances that we have not experienced an undetected cybersecurity incident.
Purchases of Equity Securities by the Issuer and Affiliated Purchasers
The following table reflects purchases of our equity securities by us or our affiliates in 2023 and in 2024 through to the date of this current report.
Months | Total Number Common Shares Purchased | Average Price Paid per Common Share in U.S.$(1) | Total Number of Common Shares Purchased as Part of Publicly Announced Plans or Programs | Maximum Number (or Approximate Dollar Value) of Common Shares That May Yet Be Purchased Under the Plans or Programs(2) | ||||
|---|---|---|---|---|---|---|---|---|
January 2023 | — | — | — | — | ||||
February 2023 | — | — | — | — | ||||
March 2023 | — | — | — | — | ||||
April 2023 | — | — | — | — | ||||
May 2023 | — | — | — | — | ||||
June 2023 | — | — | — | — | ||||
July 2023 | — | — | — | — | ||||
August 2023 | — | — | — | — | ||||
September 2023 | — | — | — | — | ||||
October 2023 | — | — | — | — | ||||
November 2023 | — | — | — | — | ||||
December 2023 | — | — | — | — | ||||
January 2024 | 500,000 | 4.00 | 500,000 | — | ||||
February 2024 | 2,588,400 | 4.64 | 2,588,400 | — | ||||
March 2024 | 2,000,000 | 3.62 | 2,000,000 | — | ||||
April 2024 (through April 30, 2024) | 4,683,300 | 4.32 | 4,683,300 | — | ||||
Total(2) | 9,771,700 | 3.90 | 9,771,700 | — |
(1) Solely for the convenience of the reader, we have translated the amounts presented in this column from reais into U.S. dollars using the exchange rate as reported by the Brazilian Central Bank as of December 31, 2023 for reais into U.S. dollars of R$4.82 per U.S.$1.00. This U.S. dollar equivalent information is provided solely for the convenience of investors and should not be construed as implying that the amounts in reais represent, or could have been or could be converted into, U.S. dollars at such rates or any other rate.
(2) On May 9, 2022, our board of directors approved a new share buyback program for our common shares. Under this program, up to 110,000,000 common shares representing 5.87% of our total shares may be repurchased over a period of 18 months from the date of approval. On August 14, 2023, our board of directors approved a new share buyback program to supersede our former buyback program. The maximum number of shares that can be repurchased under this new program is 116,000,000 shares within a period of 18 months from the date of approval. Shares repurchased under each such program may or could be used to meet our obligations from potential exercises of our equity-based compensation plans, and may or could also be held in treasury, disposed of or cancelled in accordance with applicable law.
We are an integrated energy and logistics company and, when considered together with the Joint Venture, a Brazilian market leader in fuel distribution, sugar and ethanol production, natural gas distribution and logistics. Our operations include: (1) the production of sugar, ethanol and bioenergy through Raízen, which also distributes and sells fuels and lubricants under the “Shell” brand, supplying a network of service stations, airport refueling sites and business-to-business customers in Brazil, Paraguay and Argentina, where it also refines oil, manufactures and sells automotive and industrial lubricants, and produces and sells liquefied petroleum gas, and which also operates a network of Shell Select convenience stores and OXXO proximity stores; (2) through our Compass segment, (i) the distribution of piped natural gas in Southeast, South, Center, North and Northeast regions of Brazil to customers in the industrial, residential, commercial, automotive, thermogeneration cogeneration sectors through Comgás, Sulgás and the other companies in which Commit has an interest; and (ii) other investments in the development process and value chain of natural gas, with Terminal de Regasificação de LNG de São Paulo S.A., or “TRSP” and Rota 4 Participações S.A., or “Rota 4”; (3) the production and distribution of lubricants under the Mobil brand in Brazil, Argentina, Bolivia, Uruguay, Paraguay, the United States of America and certain European countries, as well as in the European and Asian markets under the “Comma” trademark and corporate activities through Moove; (4) logistics services for rail transportation, storage and port loading of commodities, mainly for grains and sugar, leasing of locomotives, wagons and another railway equipment through Rumo; (5) the management of agricultural properties, mining and logistics projects; (6) logistics projects and investment in the Climate Tech Fund, which specializes in technological innovation; and (7) a minority stake in Vale, a mining company.
The chart below sets forth a simplified summary of our corporate structure as of the date of this current report:
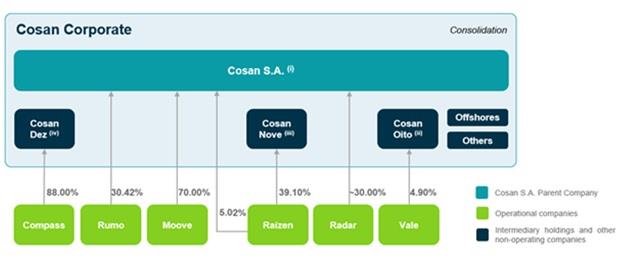
| (i) | Cosan S.A. is the parent company holding a direct or indirect equity interest in its subsidiaries and in the Raízen joint venture. The main effects on its profit or loss are general and administrative expenses, contingencies, equity income and financial results attributed to loans. |
| (ii) | Cosan Oito is a subsidiary of Cosan S.A. and holds an interest in Vale. |
| (iii) | Cosan Nove has a direct interest in Raízen of 39.15%. In addition, Banco Itaú Unibanco S.A. holds a direct interest of 26.90% in Cosan Nove through its ownership of preferred shares. |
| (iv) | Cosan Dez has a direct stake in Compass of 88.00%. In addition, Banco Bradesco BBI S.A. holds a direct interest of 23.20% in Cosan Dez through its ownership of preferred shares. |
A list of our subsidiaries is included in note 9.1 of our individual and consolidated financial information as of and for the fiscal years ended December 31, 2023 and 2022, included elsewhere in this current report.
The investments constituting the Joint Venture are accounted for under the equity method. We and our subsidiaries own 30.92% and Shell and its affiliates likewise own 44.02% of the preferred shares (which have preferential dividend rights in certain circumstances) issued by Raízen S.A. The differences between the shareholdings of Cosan and Shell in Raízen S.A. result from an investment made on December 28, 2022 by Itaú in Cosan Nove, our investment vehicle that now holds part of the shares issued by Raízen S.A., following which our shareholding rights as co-controlling entity of Raízen pursuant to the Shareholders’ Agreement with Shell remained unchanged.
For more information related to property, plant and equipment see note 11.1 to our individual and consolidated financial information as of and for the fiscal years ended December 31, 2023 and 2022, included elsewhere in this current report. See also “—Capital Expenditures” for a description of our ongoing expansions and renovations of our property, plant and equipment.
We present a summary below of our material tangible fixed assets, including investment properties and intangible assets (concessions), by segment:
Raízen
Raízen distributes fuels through 74 distribution terminals to approximately 8,204 service stations throughout Brazil, Argentina and Paraguay under the Shell brand and also has 69 airport terminals supplying aviation fuel. In addition, in its energy generation business, Raízen operates 35 mills, has an installed capacity for grinding 105 million tons of sugarcane and installed capacity to generate 1.6 GW of power, a second-generation (E2G) ethanol plant and a biogas plant.
In 2018, Raízen acquired Shell’s downstream operations in Argentina. The assets acquired consist of a refinery, located in the Buenos Aires metropolitan region, with a refining capacity of 110 thousand barrels per day, which distributes fuels and lubricants through 869 strategically-located service stations under the Shell brand.
On November 1, 2021, Raízen concluded the acquisition of 50% of the capital stock of Barcos y Rodados S.A., or “B&R.” B&R is based in Paraguay and is the leader in the fuel distribution market in Paraguay, with a network of 340 fuel resale stations. With the acquisition and sublicense of the right to use the Shell brand in the B&R network, the B&R service stations will progressively start operating under the Shell brand.
On May 1, 2022, Raízen concluded the acquisition of the entirety of Shell Brasil Petroleo Ltda.’s lubricants operations in Brazil, including a production unit strategically located in Ilha do Governador, Rio de Janeiro, that produces and distributes lubricants under Shell brand in Brazil.
Compass
Compass is the holding company through which we own interests in a number of businesses which make up our Compass segment:
- Comgás is Brazil’s largest natural gas distributor with a pipeline network of approximately 21,908 kilometers, supplying natural gas to 2.62 million residential, commercial and industrial consumers in over 177 cities, covering approximately 94 municipalities in the metropolitan areas of São Paulo, Campinas, Santos and the Paraíba Valley.
- Commit is a holding company with minority stakes in natural gas distributors in several Brazilian states. Commit controls Sulgás, the State of Rio Grande do Sul-based and formerly state-owned gas supply concessionaire with an exclusive right to operate a concession throughout the state of Rio Grande do Sul until August 2044. Sulgás’ networks totaled approximately 1,488 kilometers, delivering natural gas to more than 89.1 thousand clients in 38 cities, with a distributed volume of 1.991 million cbm/day. Commit also controls Necta, situated in the northwest concession area of the state of São Paulo, with a pipeline network of approximately 1,354 kilometers. Necta delivers a total of 0.744 million cbm/day to more than 44.6 thousand clients in 24 cities in the state of São Paulo.
- Edge – Empresa de Geração de Energia S.A., or “Edge,” a part of Compass’s marketing and services segment, offers alternative natural gas supply options, ensuring security and flexibility, and promoting decarbonization for all its customers. Through TRSP (São Paulo Regasification Terminal), we will enter into a 10-year supply contract with Total Energies of 12 million cbm/day). Our floating storage regasification unit, or “FSRU,” is expected to have the capacity to regasify 14 million cbm/day and to storage 173,000 m³. This infrastructure offers natural gas to distributors or free market customers at competitive prices, through on- or off-grid arrangements.
Moove
Moove has five production plants. In Brazil there are two plants, one in the city of Rio de Janeiro, state of Rio de Janeiro, where the largest plant of the business, with its own pier, is located, and the second one, in the city of Diadema, state of São Paulo, where products are produced under the Tirreno brand. Outside of Brazil, Moove has a plant in Gravesend, England, where it produces and distributes lubricants and other automotive products, such as antifreeze, additives and coolants. Through these plants products are shipped to the UK markets and exported to certain countries in Europe and Asia, mainly under the Comma brand. It also has two other plants in the United States in the cities of Wichita, Kansas, and another one in Indianapolis, Indiana, where lubricants and other automotive products are produced under the Dynaplex, Ecoultra and Medallion Plus brands.
Through these plants, Moove produces and markets a comprehensive portfolio of lubricant products and specialties for various sectors - from automotive to industrial - providing the market with innovative solutions in high-performance products and services.
Rumo
Rumo concluded the ALL Acquisition on April 1, 2015 and is Brazil’s largest logistics operator in terms of total volume transported, providing rail transport logistics, port handling and warehousing services. Rumo operates in the states of Mato Grosso, Mato Grosso do Sul, Goiás, Tocantins, São Paulo, Paraná, Santa Catarina and Rio Grande do Sul.
Currently, Rumo owns and operates a large asset base, including a rail network consisting of five concessions that extend over approximately 13,500 kilometers of railway lines, over 1,200 locomotives, over 33,000 rail cars, as well as distribution centers and warehousing facilities. Rumo provides efficient and complete logistics services to its clients through its operation of 9 transshipment terminals and 5 port terminals, either controlling or minority interest. At its most important terminal, the logistics complex of Rondonópolis (in the state of Mato Grosso), Rumo has the capability to load over 1,800,000 tons of grains per month depending on the period and assortment of transported volumes. Moreover, Rumo holds equity interests in five port terminals in the port of Santos, in the state of São Paulo, and one in the state of Paraná. The real estate Rumo leases in connection with its concessions contain available area for construction and development of warehouses and logistics terminals, which makes possible for Rumo to expand its operations and improve its logistics and other services. For example, Rumo currently holds a 9.9% equity interest in the Grain Terminal of Guarujá (TGG) in the port terminal in Santos, which is a significant port project. To expand its North Operation, in September of 2021, Rumo signed an agreement with the state of Mato Grosso to construct and operate a railway stretch that independently connects the road-rail terminal of Rondonópolis to Cuiabá and Lucas do Rio Verde in the state of Mato Grosso.
Radar
Our real estate operations are conducted through Radar, Radar II, Tellus, Janus, Gamiovapar and Duguetiapar. Radar and Radar II own and manage approximately 417 rural properties covering a total of 91 thousand hectares, and harvests sugarcane, soy, cotton, corn and other commodities in the States of São Paulo, Maranhão, Bahia and Mato Grosso. Radar manages its properties using a satellite-based geomonitoring system. Tellus, Janus, Gamiovapar and Duguetiapar oversee approximately 427 rural properties, covering a total of 214,626 hectares (148,876 hectares of which are considered useful), dedicated to the harvesting of sugarcane, soy, cotton, corn and other commodities in several States of Brazil. For more information on our real estate operations, see “Information on the Company—B. Business Overview—Real Estate.”
Capital Expenditures
Our capital expenditure program is currently focused on the following areas (each of these primarily within Brazil):
Raízen
Raízen’s investment plan for the year ended December 31, 2023 was comprised of the following: (i) planting and treating sugarcane fields (R$3,165 million); (ii) maintaining industrial, agricultural, logistics and distribution assets, and assets relating to adapting and developing our standards for environmental safety and health related in the production of sugar, ethanol and electricity (R$2,612 million); (iii) improvements and expansions related to sugar, ethanol and electricity (R$3,708 million); and (iv) expand the network of operations in retail, aviation and distribution terminals in Brazil with a focus on profitability and sustainable growth (R$1,195 million). Raízen’s total projected capital expenditure in Argentina was R$1,084 million, of which approximately R$756 million refers to a nonrecurring project to modernize our refining facilities, while the remainder is for maintenance and other operational improvements.
Moreover, Raízen invests in maintaining and renewing sugarcane fields at approximately 33.4% of its total capital expenditures per year. Raízen also invests every year in intercrop maintenance (i.e., primarily in plant and agricultural machine repairs during the times in which no operations are ongoing). The biological asset and intercrop maintenance capital expenditures totaled approximately R$3,658 million in the fiscal year ended December 31, 2023.
Compass
Comgás has been investing in its network expansion. During the fiscal year ended December 31, 2023, it invested R$2,317.9 million, of which approximately 46% was associated with expansion programs, approximately 45% was related to network support investments, and approximately 9% was related to administrative and software investments. In 2024, we expect to invest approximately R$1,600 million, according to a similar distribution. The funds used by Comgás for making capital expenditures are generated from its working capital and existing or new indebtedness. During the fiscal year ended December 31, 2023, TRSP’s capital expenditure totaled R$576 million.
Sulgás has been investing in its network expansion. During the fiscal year ended December 31, 2023, Sulgás invested R$68.2 million, which approximately 80% was associated with expansion programs, approximately 3% was related to network support investments and approximately 17% was related to administrative and software investments.
Necta has been investing in the expansion of its network. During the fiscal year ended December 31, 2023. It invested R$74.2 million, of which approximately 60% was associated with expansion programs, approximately 4% was related to network support investments, and approximately 36% was related to administrative and software investments.
The funds used by Comgás, Sulgás and Necta for making capital expenditures are generated from their working capital and existing or new indebtedness.
Rumo
Rumo’s strategy is focused on investments in the renovation of assets, in particular its locomotives and railcar fleet, through the purchase of new rolling stock to replace assets in poor condition of use. The purpose of Rumo’s investment in rail tracks is to reduce its operating costs and maximize its transported volume. As result of Rumo’s ongoing efforts, Rumo is increasing capacity while reducing transit time along some of our major routes. During the fiscal year ended December 31, 2023, Rumo’s total investments in property, plant and equipment and intangible assets amounted to R$3,689.7 million in the aforementioned initiatives. The main investments in capacity expansion were (1) the Lucas do Rio Verde project, an extension of the railway network in Mato Grosso, one of the main grain production regions in Brazil; (2) upgrading the permanent way by replacing tracks and sleepers; (3) expanding yards to adjust for the 135-railcar train; and (4) infrastructure improvements, with the aim of removing restrictions.
The funds used by Rumo for making capital expenditures are provided by Rumo’s operating results and from financings and credit extended by private banks, as well as by government-owned banks such as BNDES.
Moove
As of December 31, 2023, Moove’s capital expenditures (property, plant and equipment, intangible assets and contract assets) totaled R$178.0 million, of which 26.3%, or R$46.9 million, was invested in Moove’s Brazilian operations and the remainder was invested in its European and North American and other South American operations. R$36.4 million was mostly invested in recurring projects in Brazil. In Europe and North America, approximately 100% was invested in recurring projects. The funds used by Moove for making capital expenditures are generated from cash flows generated from operations and existing or new indebtedness.
Raízen and its consolidated subsidiaries are not consolidated in our financial statements. Nevertheless, we have included below a summary of business performance derived from note 4 (Segment information) to our individual and consolidated financial information included elsewhere in this current report.
Prior to the corporate reorganization of Raízen completed on June 1, 2021, we viewed Raízen as two reportable operating segments whereby each of the legal entities (Raízen Combustíveis S.A. and Raízen Energia S.A.) was considered to be a separate segment. Following the corporate reorganization of Raízen, we started to consider Raízen as a single reportable segment. Accordingly, our previously reported segment information has been recast for all periods presented to reflect the changes in the reportable segments. For further information, see “Presentation of Financial and Other Information—Certain Corporate Events—Consolidation of Raízen,” “—B. Business Overview—Raízen,” “Management’s Discussion and Analysis of Financial Condition and Results of Operations—Financial Presentation and Accounting Policies—Business Segments and Presentation of Segment Financial Data” and note 4, “Segment Information,” to our individual and consolidated financial information as of and for the fiscal years ended December 31, 2023 and 2022, included elsewhere in this current report.
The discussion in this section is based on a comparison of the fiscal year ended December 31, 2023 with the fiscal year ended December 31, 2022, and on a comparison of the fiscal year ended December 31, 2022 with the fiscal year ended December 31, 2021.
Results of Operations for the Joint Venture for the Fiscal Year Ended December 31, 2023 Compared to the Fiscal Year Ended December 31, 2022
The following table presents Raízen’s comparative combined consolidated financial information for the years ended December 31, 2023 and 2022.
| Year Ended December 31,(1)(2) | ||||||
|---|---|---|---|---|---|---|---|
| 2023 | 2022 | 2023/2022 | ||||
| (in millions of R$) | (variation %) | |||||
Net sales | 221,693.3 | 244,293.7 | (9.3)% | ||||
Costs of sales | (202,926.7 | ) | (233,658.1 | ) | (13.2)% | ||
Gross profit | 18,766.5 | 10,635.6 | 76.4% | ||||
Selling expenses | (5,773.5 | ) | (5,148.0 | ) | 12.2% | ||
General and administrative expenses | (2,815.5 | ) | (2,425.3 | ) | 16.1% | ||
Other income (expenses), net | 1,968.2 | 283.6 | 594.0% | ||||
Interest in earnings of associates | (219.9 | ) | (119.3 | ) | 84.4% | ||
| (6,840.7 | ) | (7,409.0 | ) | (7.7)% | ||
Profit before finance result, net and income taxes | 11,925.8 | 3,226.6 | 269.6% | ||||
Finance costs | (6,241.3 | ) | (3,010.4 | ) | 107.3% | ||
Finance income | 797.6 | 811.9 | (1.8)% | ||||
Foreign exchange differences, net | 1,240.9 | 963.1 | 28.8% | ||||
Net effect of derivatives | (1,760.1 | ) | (2,869.7 | ) | (38.7)% | ||
Finance income result, net | (5,962.9 | ) | (4,105.1 | ) | 45.3% | ||
(Loss) profit before income taxes | (5,962.9 | ) | (878.5 | ) | n.m. | ||
Income taxes | (1,936.6 | ) | 864.7 | n.m. | |||
(Loss) profit for the year | 4,026.3 | (13.8 | ) | n.m. | |||
n.m. = not meaningful.
| (1) | Includes 100% of Raízen’s results. As of December 31, 2023, we held a 30.9% equity interest in Raízen (33.6% as of December 31, 2022), which under IFRS 11 is recorded in the “Interest in earnings of joint venture” line item in our individual and consolidated financial information as of December 31, 2023 and 2022 and for the years ended December 31, 2023 and 2022 included elsewhere in this current report. |
| (2) | Following the corporate reorganization of Raízen completed on June 1, 2021, we started to consider Raízen as a single reportable segment. Accordingly, our previously reported segment information has been recast for all periods and is presented to reflect the changes in the reportable segments. For further information, see “Presentation of Financial and Other Information—Certain Corporate Events—Consolidation of Raízen.” |
| 92 |
Net Sales
Raízen’s net sales decreased by 9.3%, or R$22,600.4 million, to R$244,293.3 million in the year ended December 31, 2023 from R$244,293.7 million in the year ended December 31, 2022. This decrease was primarily due to (i) a 16% decrease in the average price of oil derivative products, resulting in a 10.0%, or R$16,722.2 million, decrease in oil derivative products sales revenues in Brazil, Argentina and Paraguay, and (ii) a 10% decrease in the average ethanol sales price and a 21.4% reduction in the volume of ethanol sales, resulting in a R$6,339.8 million decrease in net sales.
Costs of Sales
Raízen’s costs of sales decreased by 13.2%, or R$30,731.3 million, to R$202,926.8 million in the year ended December 31, 2023 from R$233,658.1 million in the year ended December 31, 2022, mainly due to (1) a 13% decrease in the cost of sales in Raízen’s mobility segment driven by a decrease in the price of oil derivative products, resulting in a R$21,111.7 million decrease in Raízen’s costs of goods sold and services provided, and (2) a decrease in the prices of Raízen’s inputs, such as sugarcane (with an impact of R$9,808.8 million).
Gross Profit
Raízen’s gross profit increased by 76.4%, or R$8.130.9 million, to R$18,766.5 million in the year ended December 31, 2023 from R$10,653.6 million in the year ended December 31, 2022 (representing 8.5% and 4.4% of net sales, respectively), for the reasons indicated above.
Other Income (Expenses), net
Raízen’s operating expenses increased by R$1,684.6 million, to a R$1,968.2 million net expense in the year ended December 31, 2023, from a R$7,409.0 million net expense in the year ended December 31, 2022. This increase was mainly due to the recognition of PIS and COFINS tax credits in an amount of R$1,465.6 million in connection with Supplementary Laws Nos. 192 and 194 (which reduced the rates of PIS and COFINS applicable to certain products) as further described in note 10 to our individual and consolidated financial information included elsewhere in this current report.
Finance results, net
Raízen’s finance results, net increased by 45.3%, or R$1,857.8 million, to an expense of R$5,962.9 million in the year ended December 31, 2023, from an expense of R$4,105.1 million in the year ended December 31, 2022. This increase was primarily due to a higher cost of interest as a result of an increase in current and non-current loans, borrowings and debentures, which increased from R$33.6 billion as of December 31, 2022 to R$39.6 billion as of December 31, 2023
Profit (loss) before Income Taxes
Raízen’s profit before income tax and social contribution changed by R$6.841.4 million, to an income of R$5,962.9 million in the year ended December 31, 2023 from an expense of R$878.5 million in the year ended December 31, 2022 (representing 2.7% and 0.4% of net sales, respectively), for the reasons indicated above.
Income Taxes
Raízen’s total income and social contribution taxes changed by R$2.801.3 million, to an expense of R$1,939.6 million in the year ended December 31, 2023, from a gain of R$864.7 million in the year ended December 31, 2022 (representing 0.9% and 0.4% of operating revenue, net, respectively), primarily due to the increase of the result before income and social taxes for the reasons indicated above.
Profit (Loss) for the Year
Raízen’s profit (loss) for the year increased by R$4,040.1 million, to a profit of R$4,026.3 million in the year ended December 31, 2023 from a loss of R$13.8 million in the year ended December 31, 2022 (representing 1.8% and 0.01% of operating revenue, net sales, respectively), for the reasons indicated above.
Results of Operations for the Joint Venture for the Fiscal Year Ended December 31, 2022 Compared to the Fiscal Year Ended December 31, 2021
The following table presents Raízen’s comparative combined consolidated financial information for the years ended December 31, 2022 and 2021.
| Year Ended December 31,(1)(2) | ||||||
| 2022 | 2021(3) | 2022/2021 | ||||
| (in millions of R$) | (variation %) | |||||
Net sales | 244,293.7 | 175,047.3 | 39. 6% | ||||
Costs of sales | (233,658.1 | ) | (163,367.6 | ) | 43.0% | ||
Gross profit | 10,635.6 | 11,679.7 | (8.9)% | ||||
Selling expenses | (5,148.0 | ) | (3,882.7 | ) | 32.6% | ||
General and administrative expenses | (2,425.3 | ) | (1,788.2 | ) | 35.6% | ||
Other income (expenses), net | 283.6 | 717.8 | (75.6)% | ||||
Interest in earnings of associates | (119.3 | ) | (45.3 | ) | 163.4% | ||
| (7,409.0 | ) | (4,996.6 | ) | 48.3% | ||
Profit before finance result, net and income taxes | 3,226.6 | 6,683.1 | (51.7)% | ||||
Finance costs | (3,010.4 | ) | (1,606.7) | 87.4% | |||
Finance income | 811.9 | 580.2 | 39.9% | ||||
Foreign exchange differences, net | 963.1 | (1,076.7 | ) | n.m. | |||
Net effect of derivatives | (2,869.7 | ) | 136.1 | n.m. | |||
Finance income result, net | (4,105.1 | ) | (1,967.1 | ) | 108.7% | ||
(Loss) profit before income taxes | (878.5 | ) | 4,716.0 | n.m. | |||
Income taxes | 864.7 | (1,350.3 | ) | n.m. | |||
(Loss) profit for the year | (13.8 | ) | 3,365.7 | n.m. | |||
n.m. = not meaningful.
| (1) | Includes 100% of Raízen’s results. As of December 31, 2022, we held a 33.6% equity interest in Raízen (44.0% as of December 31, 2021), which under IFRS 11 is recorded in the “Interest in earnings of joint venture” line item in our individual and consolidated financial information as of December 31, 2023 and 2022 and for the years ended December 31, 2023 and 2022 included elsewhere in this current report. |
| (2) | Following the corporate reorganization of Raízen completed on June 1, 2021, we started to consider Raízen as a single reportable segment. Accordingly, our previously reported segment information has been recast for all periods and is presented to reflect the changes in the reportable segments. For further information, see “Presentation of Financial and Other Information—Certain Corporate Events—Consolidation of Raízen.” |
| (3) | On August 10, 2021, Raízen completed the acquisition of Biosev. See “Information on the Company—A. History and Development of the Company—History.” Raízen began consolidating Biosev within its results of operations as from August 10, 2021. As a result, the comparability of Raízen’s combined consolidated financial information for the fiscal year ended December 31, 2021 with Raízen’s consolidated financial information for the fiscal year ended December 31, 2022 is limited. |
Net Sales
Raízen’s net sales increased by 39.6%, or R$69,246.5 million, to R$244,293.7 million in the year ended December 31, 2022 from R$175,047.3 million in the year ended December 31, 2021. This increase is primarily due to (i) the significant volume growth in sugar sales of 41.2% (with an impact of R$4,016.7 million), consistent with the strategy to expand Raízen’s participation in the value chain, (ii) our sales strategy which enabled us to charge prices 12.0% higher for sugar compared to the previous year (with an impact of R$1,169.9 million) and (iii) a 5.0% increase in sales volume in the distribution of fuel and lubricants and improved refinery performance (with an impact of R$57,745.9 million).
Costs of Sales
Raízen’s costs of sales increased by 43.0%, or R$70,290.6 million, to R$233,658.1 million in the year ended December 31, 2022 from R$163,367.6 million in the year ended December 31, 2021, mainly due to (1) a 39.6%, or R$69,246.4 million, increase in sales, and (2) a 21.2% increase in the prices of Raízen’s inputs such as sugarcane (with an impact of R$2,066.8 million).
Gross Profit
Raízen’s gross profit decreased by 8.9%, or R$1,044.1 million, to R$10,653.6 million in the year ended December 31, 2022 from R$11,679.7 million in the year ended December 31, 2021 (representing 4.4% and 6.7% of net sales, respectively), for the reasons indicated above.
Other Income (Expenses), Net
Raízen’s operating expenses increased by 48.3%, or R$2,416.6 million, to a R$7,409.0 million net expense in the year ended December 31, 2022 from a R$4,996.6 million net expense in the year ended December 31, 2021. This increase was mainly due to higher expenses incurred as a result of inflation and the increase of R$1,265.3 million in selling expenses, due to (1) a 75.0%, or R$906.8 million, increase in freight expenses and (2) a 60.1%, or R$193.8 million, increase in logistics expenses.
Finance Results, Net
Raízen’s finance results, net increased by 180.7%, or R$2,137.9 million, to an expense of R$4,105.1 million in the year ended December 31, 2022 from an expense of R$1,967.1 million in the year ended December 31, 2021, primarily due to (i) the higher balance of net debt (loans, borrowings and debentures - current and non-current liabilities minus cash and cash equivalent plus marketable securities) which increased from R$19.2 billion in 2021 to R$28.1 billion in 2022, (ii) the increase in the SELIC interest rate to 13.75% as of December 31, 2022 in comparison with 9.25% as of December 31, 2021, and (iii) the depreciation of the U.S. dollar relative to the real, to R$5.165 per U.S.$1.00 on average during the year ended December 31, 2022 in comparison to R$5.396 per U.S.$1.00 on average during the year ended December 31, 2021. The combination of these factors resulted in higher debt servicing costs, which reached R$2,096.7 million in the year ended December 31, 2022.
Profit (Loss) before Income Taxes
Raízen’s profit before income taxes decreased by 118.6%, or R$5.594.5 million, to an expense of R$878.5 million in the year ended December 31, 2022 from an income of R$4,716.0 million in the year ended December 31, 2021 (representing 0.4% and 2.7% of net sales, respectively), for the reasons indicated above.
Income Taxes
Raízen’s total income and social contribution taxes changed by R$2,215.0 million, to a gain of R$864.7 million in the year ended December 31, 2022 from an expense of R$1,350.3 million in the year ended December 31, 2021 (representing 0.4% and 0.8% of operating revenue, net, respectively), primarily due to the decrease of the result before income and social taxes for the reasons indicated above.
Profit (Loss) for the Year
Raízen’s profit (loss) for the year decreased by 100.4%, or R$3,379.5 million, to a loss of R$13.8 million in the year ended December 31, 2022 from a profit of R$3,365.7 million in the year ended December 31, 2021 (representing 0.01% and 1.9% of operating revenue, net sales, respectively), for the reasons indicated above.
Legal and Administrative Proceedings of the Joint Venture
Overview
In the ordinary course of business, Raízen and its subsidiaries are parties to numerous judicial and administrative proceedings of a tax, civil, regulatory, environmental, criminal and labor nature, including proceedings with probable, possible and remote risks of loss.
Pursuant to the framework agreement which was entered into during the formation of the Raízen joint venture, Raízen has agreed that it will reimburse its shareholders, i.e., Cosan S.A. and Shell, or will be reimbursed by them, as applicable, for any amounts received or paid in connection with legal proceedings, provided that the triggering events for such payments or receipts occurred before the formation of the Raízen joint venture on April 1, 2011 and provided that any such sums have actually been paid or received.
As of December 31, 2023, Raízen and its subsidiaries were party to proceedings with a probable risk of loss involving an aggregate amount of R$2,054.2 million for which provisions have been made. Raízen and its subsidiaries were also party to proceedings for which our risk of loss was deemed possible which involved an aggregate amount of R$22,335.5 million and for which no provision has been made.
Raízen and its subsidiaries constitute provisions for tax, civil, environmental and labor contingencies in which our risk of loss is considered probable, in accordance with IFRS. Determination of the likelihood of loss includes determination of available evidence, hierarchy of laws, jurisprudence available, more recent court decisions and relevance thereof in the legal system, as well as an evaluation by internal and external attorneys. Such provisions are reviewed and adjusted to take into account changes in circumstances, such as statute of limitations applicable, tax inspection conclusions or additional exposures identified based on new matters or court decisions.
Below is a description of Raízen and its subsidiaries’ principal proceedings:
- Corporate Income Taxes (Imposto de Renda Pessoa Jurídica), or “IRPJ,” and Social Contribution on Net Profits (Contribuição Social sobre o Lucro Líquido), or “CSLL.” Raízen has received:
- A tax assessment filed by the Brazilian federal tax authorities seeking to collect IRPJ and CSLL with regards to 2006 through 2009. The assessments challenged (1) the deductibility of certain amortization expenses and goodwill; (2) the offset of tax losses and the use of a negative calculation basis in connection with CSLL; and (3) certain taxes due in connection with discrepancies in the revaluations of certain assets. From January 2012 to October 2019, Raízen appealed the tax assessment before the administrative tax court and obtained a partially favorable decision that canceled item (3) described above and reduced one of the fines from 150% to 75% in connection with item (2) above. In November 2019, Raízen filed an annulment request before certain federal courts to discuss the remaining items of the tax assessment. The case is currently under discovery proceedings. As of December 31, 2023, the aggregate amount under discussion was R$525.8 million, including interest and fines, which has been classified as having a possible risk of loss by external counsel. An insurance bond was issued to guarantee this amount.
- A tax assessment relating to the amortization of goodwill deducted from the basis of IRPJ and CSLL in 2011 and 2012. As of December 31, 2023, the total amount assessed by the Brazilian tax authorities, including interest and fines, was R$131,586 million. The risk of an unfavorable final decision in this proceeding has been classified as possible. As of the date of this current report, this proceeding is pending judgment of the special appeal filed by Raízen.
- A tax assessment related to the amortization of goodwill deducted from the basis of IRPJ and CSLL in 2013 and 2014. As of December 31, 2023, the total amount assessed by the Brazilian tax authorities, including interest and a 150% fine of the relevant goodwill expenses, was R$172,809 million. The risk of an unfavorable final decision in this proceeding has been classified as possible. As of the date of this current report, we are awaiting judgment by the administrative court.
- A tax assessment related to the amortization of goodwill deducted from the basis of IRPJ and CSLL from 2013 to 2016. As of December 31, 2023, the total amount assessed by the Brazilian tax authorities, including interest and a 150% fine of the relevant goodwill expenses, was R$564,387 million. The risk of an unfavorable final decision in this proceeding has been classified as possible with respect to 434,533 million and remote with respect to R$129,833 million. As of the date of this current report, we are awaiting judgment by the administrative court.
- Certain of the alleged underlying facts in relation to the above occurred before the formation of the Raízen joint venture on April 1, 2011. Accordingly, the amounts relating to the facts which occurred prior to the formation of the Raízen Joint Venture would be subject to reimbursement by shareholders in the event of an adverse decision. No provision has been made for these proceedings in our individual and consolidated financial information.
- Goodwill contributed in Raízen Combustíveis. This refers to tax assessments filed by the Brazilian federal tax authorities seeking to collect IRPJ and CSLL in connection with the amortization of goodwill derived from certain investments. As of December 31, 2023, the total amount of the tax assessment relating to the amortization of goodwill in 2011 and 2012 was R$254,512 million, and the total amount of the tax assessment relating to the amortization of goodwill in 2014 was R$105,354 million. As of the date of this current report, both proceedings are pending judgment of the administrative appeals filed by Raízen. The third tax assessment relating to the amortization of goodwill in 2013 has been challenged by Raízen before judicial courts since December 2019 (after the proceeding had been concluded in the administrative sphere). This lawsuit is in the submission of evidence phase. As of December 31, 2023, the total amount is R$187,822 million. The risk of loss with respect to the relevant assessments is estimated as possible. The alleged underlying fact occurred before the formation of the Raízen joint venture on April 1, 2011. Therefore, relevant amounts will be reimbursed by the shareholders in the event of an unfavorable decision.
- Social Security Contributions. In June 2010, Raízen filed an ordinary action challenging the obligation to accrue the social security contributions tax based on gross revenue. The first instance court rendered a partially favorable judgment. Currently, the case records are in the Court of Appeals awaiting judgment of the appeal filed by the Brazilian federal government. The risk of loss is classified as probable as a result of the decision rendered by STF in a leading case (RE 700922). As of December 31, 2023, the aggregate amount involved in these proceedings was R$745,322 million, for which Raízen had recorded provisions, and the same amount had been judicially deposited (the two together therefore cancel each other out). The alleged underlying facts occurred both before and after the formation of the Raízen joint venture on April 1, 2011 and, therefore, these amounts would be subject to reimbursement by Raízen’s shareholders for a portion of any loss in the event of an adverse decision.
- Tax on industrialized products. Nine tax claims filed by the Brazilian federal government based on Normative Instruction No. 67/98 regarding the tax on industrialized products (imposto sobre produtos industrializados), or IPI, allegedly due as a result of the removal of certain types of sugar from our facilities from 1992 to 1997, as the case may be. Four of the lawsuits are pending judgment by the lower court, while five of the lawsuits are pending judgment of the appeal filed by the attorney general against the lower court decision rendered in favor of Raízen. As of December 31, 2023, the aggregate amount involved in these proceedings was R$199,462 million and the risk of loss was classified as possible with respect to R$154,408 million, as remote with respect to R$22,937 million and as probable with respect to R$21,227 million. The alleged underlying facts occurred before the formation of the Raízen joint venture on April 1, 2011. Therefore, relevant amounts will be reimbursed by Raízen’s shareholders in the event of an unfavorable decision. In addition to these tax claims, Raízen is also a party to other proceedings regarding the IPI imposed on sugar products of certain polarity levels (sugar products with a polarity level of at least 99.5º are exempt from IPI).
- Tax on industrialized products. Based on Normative Instruction No. 67/98, we applied for the offset of tax debts with the Brazilian federal tax authorities. Tax credits were generated from undue payment in relation to certain of its products, as allowed by Normative Instruction No. 67/98. The offset was partially granted by the administrative trial court. However, the calculation of the amount of credit is still pending. As of December 31, 2023, the amount involved in this proceeding was R$142,987 million. The risk of loss is classified as possible. The alleged underlying facts occurred before and after the formation of the Raízen joint venture on April 1, 2011. Accordingly, the amounts involved in the lawsuit will be reimbursed by Raízen’s shareholders for a portion of any loss in the event of an unfavorable decision. No provision has been made for this proceeding in our consolidated financial information.
- MP 470. Brazilian federal tax authorities have partially rejected Raízen’s application for payment of federal tax debts with carryforward losses, pursuant to the payment plan provided for by provisional measure No. 470/2009. The Brazilian federal tax authorities’ notice in this respect stated that Raízen’s carryforward losses are not sufficient to offset the relevant debts. As of December 31, 2023, the amount involved in this proceeding is R$289,190 million. The chance of loss is possible with respect to R$256,689 million, remote with respect to R$29,212 million and probable with respect to R$3,289 million.
- PIS and COFINS Credits. Brazilian federal tax authorities issued tax assessment notices against Raízen related to the allegedly undue use of PIS and COFINS credits. The proceedings refer to credits arising from the costs and expenses with goods and services directly associated with Raízen’s activities and which were therefore deemed to be inputs. Part of the alleged underlying facts occurred before the formation of the Raízen joint venture on April 1, 2011 and amounts relating to such facts are accordingly subject to reimbursement by shareholders in the event of an adverse decision. Currently, the tax assessments are pending judgment by the administrative tax courts. As of December 31, 2023, the aggregate amount involved in such proceedings was R$37,052 million. In relation to the use of credits of PIS and COFINS by Raízen after the formation of the Raízen joint venture on April 1, 2011 (and, therefore, these amounts will be reimbursed by Raízen’s shareholders in the event of an adverse decision), Raízen has received tax assessment notices. As of December 31, 2023, the aggregate amount involved in these proceedings is R$957,362 million. The risk of loss connected with PIS and COFINS credits is estimated as possible in each case.
- ICMS – Diesel Oil. Tax authorities of the state of São Paulo have challenged the use of ICMS credits by Raízen based on the understanding that Raízen should have written off ICMS credits derived from the acquisition of diesel used in several stages of sugar production, including vehicles and machines from suppliers, because relevant credits were not directly associated with the main activity. In addition to this, it was alleged that Raízen had failed to issue tax documents and had reported an incorrect amount of the ICMS due. In relation to the alleged actions that occurred before the formation of the joint venture on April 1, 2011, shareholders will reimburse Raízen for a portion of any loss in case of an adverse decision. There are several ongoing administrative and judicial proceedings regarding the matter. As of December 31, 2023, the aggregate amount involved was R$510,794 million. In relation to the alleged actions that occurred after the formation of the joint venture on April 1, 2011, Raízen has received tax assessment notices, which are currently pending decision of the first and second administrative court. As of December 31, 2023, the relevant amount in this proceeding was R$471,182 million. The risk of loss is classified as possible in the majority of these cases, while one case is estimated as remote risk of loss. No provision has been made for this proceeding in our individual and consolidated financial information.
- ICMS. Tax assessment filed by tax authorities of the state of São Paulo against Raízen relating to ICMS based on allegations of (i) the acquisition and sale of goods without proper registration in the tax books and (ii) lack of registration of the fiscal documents that supported symbolic return of goods from warehouses. Raízen obtained decisions from the lower administrative court and the administrative court of appeals that materially reduced the tax debt. As of the date of this current report, the proceeding is pending a new judgment by the administrative tax courts, although the material reduction already obtained remains valid and has been reflected in the collection documents. The total amount involved as of December 31, 2023 was R$556,039 million and the risk of loss is classified as remote. The underlying facts occurred before the formation of the Raízen joint venture on April 1, 2011. Accordingly, these amounts would be reimbursed by shareholders in the event of an adverse decision. No provision has been recorded for this proceeding in our individual and consolidated financial information.
- ICMS – Jet Fuel (Raízen Combustíveis). The state tax authority of Rio de Janeiro issued a tax assessment against Raízen in order to charge ICMS in operations involving jet fuel. Tax authorities argue that a tax incentive granted by the state of Rio de Janeiro was not constitutional, based on a decision rendered by the Brazilian Federal Supreme Court. After the recognition that these debts could be subjected to a remission, a petition was filed and it is still waiting for a decision. The amount involved is R$508 million as of December 31, 2023. The risk of loss is classified as possible. The alleged underlying facts occurred before the formation of the Raízen joint venture on April 1, 2011 and, therefore, these amounts would be subject to reimbursement by our shareholders in the event of an adverse decision. No provision has been made for this proceeding in our individual and consolidated financial information.
- CIDE – Technical Services (Raízen Combustíveis). Raízen filed a judicial lawsuit claiming that the Economic Intervention Contribution, or “CIDE,” is not levied on payments remitted abroad in connection with the import of technical services which do not involve the transfer of technology. It currently awaits a decision by the Brazilian Superior Court of Justice. The Brazilian federal tax authorities issued a tax assessment notice against Raízen in order to charge a part of the CIDE tax debt under dispute. The risk of loss is classified as probable. As of December 31, 2023, we recorded provisions in connection with this proceeding in the aggregate amount of R$437 million and have also deposited in an escrow account the same amount. As all our exposure is already guaranteed by the judicial deposit, there would be no cash impact from an adverse decision. The alleged underlying facts occurred before the formation of the Raízen joint venture on April 1, 2011 and, therefore, these amounts would be subject to reimbursement by our shareholders in the event of an adverse decision.
- WHT – Technical Services (Raízen Combustíveis). The Brazilian federal tax authorities filed a judicial tax enforcement proceeding to charge WHT on payments made to a company domiciled in the Netherlands in connection with the rendering of technical services without the transfer of technology. The amount under dispute in the tax enforcement as of December 31, 2023 is R$496 million and Raízen presented a surety bond, that is under discussion, in order to continue to litigate. The first and second level decisions were unfavorable and a motion for clarification has been filed. The risk of loss is classified as possible. The alleged underlying facts occurred before the formation of the Raízen joint venture on April 1, 2011 and, therefore, these amounts would be subject to reimbursement by our shareholders in the event of an adverse decision.
- PIS and COFINS Offsets (Raízen Combustíveis). The Brazilian federal tax authorities filed a tax assessment to charge PIS and COFINS for the years 2006 to 2009 in connection with unauthorized offset of tax debts made by Raízen. Raízen obtained a partially favorable decision from the first-tier administrative court, and tax authorities filed an appeal to the second-tier administrative court that is still pending a decision. The amount under dispute as of December 31, 2023 was R$696 million. Moreover, the office of the Attorney-General of Brazil filed two judicial proceedings seeking enforcement of payment relating to PIS and COFINS debts originating from refund and offsetting claims made by Raízen from the same period. The amount under dispute as of December 31, 2023 was R$475 million. The tax enforcement proceeding was dismissed in the Federal Court of Rio de Janeiro that determined the suspension of these charges until a final decision over the relevant tax assessment is rendered by CARF. The risk of loss is classified as possible. The alleged underlying facts occurred before the formation of the Raízen joint venture on April 1, 2011 and, therefore, these amounts would be subject to reimbursement by Raízen’s shareholders in the event of an adverse decision. No provision has been made for this proceeding in our individual and consolidated financial information.
- PIS and COFINS (Raízen Combustíveis). The Brazilian federal tax authorities filed a couple of judicial tax enforcement proceedings in order to charge PIS and COFINS debts originating from refund and offsetting claims made by Raízen. The amount under dispute as of December 31, 2023 was R$106 million and Raízen presented a surety bond in order to continue to litigate. The risk of loss was classified as possible. The alleged underlying facts occurred before the formation of the Raízen joint venture on April 1, 2011 and, therefore, these amounts would be subject to reimbursement by Raízen’s shareholders in the event of an adverse decision. No provision has been made for this proceeding in our individual and consolidated financial information.
- Corporate Income Taxes – Goodwill Amortization (Raízen Combustíveis). The Brazilian federal tax authorities issued a tax assessment notice in order to charge corporate income taxes for the years 2004 to 2006 and penalties due to the deductibility of goodwill amortization expenses triggered by the merger of Enterprise Oil Ltda. by Shell Brasil Ltda. (currently named Raízen Combustíveis). After a decision at the final level administrative tax court, the proceeding returned to the first-tier administrative tax court for a new decision. After an unfavorable decision, an Appeal was filed and the Tax Administrative Court reduced drastically the penalties imposed, decreasing the total amount by approximately 60%. The office of the Attorney-General of Brazil then filed a judicial proceeding seeking the revision of the Administrative Tax Court’s new decision. A surety bond was presented by Raízen Combustíveis. The first instance decision was unfavorable to Raízen Combustíveis and an appeal has been filed at the Federal Court of Rio de Janeiro and awaits trial. The amount in dispute is R$354 million as of December 31, 2023. The risk of loss is classified as possible. The alleged underlying facts occurred before the formation of the Raízen joint venture on April 1, 2011 and, therefore, these amounts would be subject to reimbursement by our shareholders in the event of an adverse decision. No provision has been made for this proceeding in our individual and consolidated financial information.
- Labor Public Civil Action No. 0000642-29.5-01.003. Raízen Paraguaçú Ltda. (formerly known as Raízen Tarumã Ltda.), among other defendants, is a party to a civil public action filed by the Labor Prosecutor’s Office of the city of Rio de Janeiro in the state of Rio de Janeiro relating primarily to the following matters: (1) exposure of employees to conditions that are allegedly degrading, (2) alleged irregularities in the outsourcing practices of the companies and (3) alleged noncompliance with health and safety rules and regulations relating to working hours. The Labor Court ruled the case groundless in the first instance. The Public Prosecutor’s Office of Rio de Janeiro and Raízen appealed against the decision to the Regional Labor Appeals Court. The risk of loss is classified as possible. Should the proceedings be decided against Raízen, this may result in Raízen being barred from outsourcing certain core activities, an obligation to comply with certain health and safety rules as well as rules applicable to employees’ working hours, the imposition of pecuniary fines in case of noncompliance and indemnification for the violation of employees’ rights (including collective moral damages) in an amount of R$6.9 million. The alleged underlying facts occurred before the formation of the Raízen joint venture on April 1, 2011 and, therefore, these amounts would be subject to reimbursement by Raízen’s shareholders for a portion of any loss in the event of an adverse decision. No provision has been made for this proceeding in our individual and consolidated financial information.
- Labor Public Civil Action. Raízen and certain of its subsidiaries are defendants in a confidential labor public civil action filed by the Labor Prosecutor’s Office in relation to allegations of discrimination by Raízen in the hiring of certain former employees. The Labor Court ruled against Raízen in the first instance. Raízen has appealed against the decision to the Regional Labor Appeals Court. The risk of loss is classified as remote. Should the proceedings be decided against Raízen, this may result in the imposition of collective moral damages in an amount of R$3 million plus interest as provided by law – such amount corresponding to a reduction of the initial claimed amount of R$10 million ruled by the Labor Court in the first instance. The alleged underlying facts occurred before and after the formation of the Raízen joint venture on April 1, 2011 and, therefore, these amounts would be subject to partial reimbursement by our shareholders for a portion of any loss in the event of an adverse decision. No provision has been made for this proceeding in our individual and consolidated financial information.
- Proceedings from Unions and Former Employees. Raízen and its subsidiaries are defendants in certain legal proceedings brought by unions and former employees relating to amounts claimed to be due in connection with overtime and other labor rights allegedly breached by us. These proceedings involve an aggregate amount of R$636,681 million. Of this total amount, Raízen has constituted a provision of R$240 million for proceedings with a probable chance of loss. An amount of R$53.1 million of this provision is subject to reimbursement to Raízen by Cosan.
- Civil Public Action in connection with ethanol adulteration. Raízen is party to a civil public action filed by the State Prosecutor’s Office of the state of Rio de Janeiro in 2017, which charges Raízen with selling hydrous ethanol adulterated with methanol to resale stations in the State. The suit seeks the forfeiture of Raízen’s state registration and to annul all tax incentives granted by the State to Raízen. The trial court dismissed the case without resolving the merits, as it held that the topic matter could not be discussed in a civil public action. The State Prosecutor’s Office filed an appeal against this decision, which is pending adjudication. The risk of loss has been classified as remote, as Raízen was a victim of a fraudulent scheme from a supplier, which has been found guilty in an indemnity lawsuit filed by Raízen. We are unable to estimate the potential amount of losses for Raízen if the request of the State Prosecutor’s Office of the state of Rio de Janeiro is accepted and its state registration is revoked and all tax incentives granted by the state of Rio de Janeiro are declared null and void. The appeal filed by the Public Prosecutor’s Office of Rio de Janeiro was rejected by the Rio de Janeiro Court of Justice on June 6, 2023, and the Public Prosecutor’s Office of Rio de Janeiro chose not to appeal this decision. Therefore, the decision has become final.
- Banco Cruzeiro do Sul S.A. proceeding. Raízen is party to proceedings commenced by Banco Cruzeiro do Sul S.A. in 2008, seeking the annulment of an amendment to an agreement for the purchase and sale of 45,000 m³ of anhydrous ethyl alcohol, entered into on May 28, 2007, between Companhia Brasileira de Açúcar e Álcool, Benálcool Açúcar e Álcool S.A. and Bauche Energy Brasil Comercial, Importadora e Exportadora Ltda. Banco Cruzeiro do Sul S.A. claims that such amendment amounted to a default on the guarantees granted by Companhia Brasileira de Açúcar e Álcool. This proceeding is awaiting decision in lower court and involves an aggregate amount of R$221.7 million. The risk of loss has been classified as possible.
- Proceedings related to governmental payment orders (precatórios). Raízen is party to proceedings commenced by Álvaro Roque Cardoso and others in 2015. Plaintiffs claim Raízen should pay them certain amounts that were received from the Brazilian government through governmental payment orders (precatórios). Raízen has deposited the undisputed amount of R$34 million and controversy persists only with respect to the outstanding amount of R$193.8 million. The risk of loss with respect to the disputed amount has been classified as possible.
- Civil Action against the state of Ceará. Raízen is party to a civil public action filed by State Prosecutor’s Office of the state of Ceará in 2015, seeking the forced transfer of all fuel distributors from the Port of Mucuripe to an industrial complex to be developed in the Port of Pecém. Raízen has committed to transfer its operations to the Port of Pecém as soon as the infrastructure constructions are completed, and judicial confirmation of such commitment is pending. We are now waiting for the court’s decision about whether the agreement regulating the terms and conditions of the transference of Raízen and other distributors’ operations to Pecém will be approved. The current risk of loss remains classified as remote.
- Proceedings in connection with the Fuel Center at the Aeroporto Internacional de Guarulhos S.A. Raízen is a plaintiff, alongside Petrobras Distribuidora S.A. and Air BP Brasil Ltda., in two proceedings commenced in 2020: one against Gran Petro Distribuidora de Combustíveis Ltda., or “Gran Petro,” and Concessionária do Aeroporto Internacional de Guarulhos S.A., or “GRU Airport,” that is currently awaiting judgment at the Brazilian Superior Court of Justice, and a second proceeding against the National Civil Aviation Agency of Brazil (Agência Nacional de Aviação Civil), or “ANAC.” Plaintiffs seek to protect the investment made in the fuel center at the Guarulhos International Airport by preventing the forced entry of a competitor without having followed proper financial, operational and security procedures. The amount at issue in these proceedings cannot be quantified. The risk of loss has been classified as possible. In this same context, we are defendants in a claim for damages brought in 2021 by the Gran Petro foundation before the Court of The Hague, Netherlands, against Shell, Shell Holding and Raízen S.A. The plaintiff claims that Gran Petro assigned its rights to receive certain indemnification in connection with anti-competitive conduct related to Gran Petro’s entry into the GRU Airport and the aviation market. A decision was rendered recognizing that the Court of The Hague does not have jurisdiction in relation to Raízen, however, the plaintiff appealed that decision. In 2021, a third proceeding was filed against Gran Petro, GRU Airport and ANAC, and a favorable injunction granted by the trial court. The amount at issue in these proceedings cannot be quantified. The risk of loss has been classified as possible. In November 2022, the Brazilian Antitrust Authority, by the majority of its members sitting in an administrative proceeding, found against Raízen, Vibra, Air BP, and GRU Airport. The decision imposed a penalty of approximately R$60 million on Raízen and required the publication of access rules for interested third parties. On January 16, 2023, an annulment action was filed by Raízen against the Brazilian Antitrust Authority’s decision, seeking injunction relief for an urgent suspension of the imposed penalties. On January 18, 2023, a decision was rendered granting the urgent relief, determining the suspension of the enforceability of the penalties imposed by CADE until a definitive judgment is rendered, which has not occurred as of the date of this current report. The risk of loss is classified as possible.
- Civil proceedings of environmental nature. Raízen is party to a civil public action filed by the Federal Prosecutor’s Office in 2019, in which an injunction is sought to prevent construction and suspend certain vegetation suppression and installation licenses at the São Luis distribution site. Currently, the preliminary injunction is suspended by a court decision and the public civil action is awaiting judgment. In addition to the detrimental effect of further construction being suspended and licenses being discontinued, the proceeding also exposes Raízen to a risk of having to cover an aggregate amount of R$0.6 million in relation to legal fees and compensation for material and moral damages related to native and environmentally protected vegetation suppression, estimated at R$10 million. Raízen may suffer adverse effects from both a financial and a reputational perspective. The risk of loss has been classified as possible.
- Civil proceedings of environmental nature. Petróleo Sabbá S.A., Raízen’s controlled Company, is party to an administrative proceeding filed by the Superintendence of the Institute for National Historic and Artistic Heritage (Instituto do Patrimônio Histórico e Artístico Nacional), or “IPHAN,” in 2018. Petróleo Sabbá is charged with building port facilities without IPHAN’s prior consent — a mandatory requirement under current environmental licensing legislation. Initially this could result in impacts on Petróleo Sabbá’s operations, and lead to further civil and criminal charges. However, after IPHAN’s notification of a stop order with respect to all aspects of the port construction, Petróleo Sabbá presented a defense seeking to limit the stop order to just certain aspects of the construction, while also presenting information requested by IPHAN, including: a soil geological survey, a construction work project and schedule, a georeferenced plant highlighting the priority areas for the construction work project, and a summary of field activities/interventions, in each case in order to avoid a total embargo. Subsequently, an administrative proceeding was filed by the public prosecutor’s office in order to monitor the construction project. Such administrative proceeding was initiated due to a complaint of alleged violation of environmental laws as a result of the installation of the port building. Petróleo Sabbá has presented a statement of compliance with laws and due process for environmental licensing before the relevant environmental agencies with respect to Petróleo Sabbá’s properties. In addition, an Archeological Heritage Management Program (PGPA) has been registered with IPHAN and IPHAN has approved the expert’s report in respect of that program. The current risk of loss is remote.
- Administrative proceedings of environmental nature. The Brazilian Institute of the Environment and Natural Resources (Instituto Brasileiro do Meio Ambiente e dos Recursos Naturais Renováveis — IBAMA) issued eight infraction Notices against Raízen due to alleged trading of aviation fuel in violation of applicable regulatory requirements. Ibama has imposed eight fines, each of up to R$1.5 million, for an aggregate amount of up to R$12.2 million, as well as the immediate suspension of the sale of aviation fuels to third-party companies in violation of regulations passed by the State of Roraima. Administrative defenses were filed with Ibama which are pending administrative review by Ibama. The risk of loss has been classified as possible. An adverse decision in these proceedings could adversely affect Raízen and its reputation.
- Public Civil Action. Biosev is party to a public civil action filed by the Federal District’s Prosecution Office in Brasília. The public civil action alleges that vehicles used by Biosev were carrying weights beyond the authorized limit. The Federal District’s Prosecution Office seeks to prohibit Biosev’s overweight vehicles from transiting on Brazilian federal highways, in addition to paying material damages and collective moral damages. Brazil’s Superior Court of Justice ruled that Biosev should pay material damages and collective moral damages, against which decision Biosev filed a motion of clarification that is pending judgment. If the decision is upheld, beyond the financial loss, Biosev could face operational and reputational impacts. As of the date of this current report, the amount involved in this proceeding is R$55.9 million, and the risk of loss is classified as possible.
- Public Civil Action. Biosev and one of its business partners are parties to a public civil action filed by the Prosecutor’s Office in the state of Minas Gerais alleging that Biosev has conducted its business operations without the required environmental license in the Municipality of Luz, state of Minas Gerais. The Prosecutor’s Office requested that Biosev provide proof of its operating license and requested material compensation for property damage. If the prosecution succeeds, Biosev could face operational and reputational impacts. Biosev is currently awaiting service of process for commencement of the proceedings. As of the date of this current report the risk of loss is classified as possible.
Criminal Actions and Investigations Involving Raízen
Environmental Criminal Action
According to article 225, paragraph 3, of the Brazilian Federal Constitution and Law No. 9,605/98, legal entities may be subject to criminal and administrative sanctions if they engage in environmentally damaging actions. In addition, entities which engage in such actions may also be required to repair the environmental degradation caused. Under the terms of article 21 of Law No. 9,605/98, legal entities are subject to fines, penalties restricting rights and community service obligations.
Raízen is party to a criminal proceeding filed by São Paulo Prosecutor’s Office in 2020 for the alleged practice of destroying or damaging protected forest areas or using them in violation of applicable environment protection norms, as a result of a fire that occurred at the Fazenda Palmital, leased by us for the cultivation of sugarcane, which would have caused damage to both agro-pastoral areas and areas of permanent preservation. The public prosecutor’s office filed a complaint against Raízen and one of its employees, who was responsible for the fire brigade. The risk of loss was initially classified as possible. However, Raízen and its employee presented defenses requesting the annulment of the accusation due to lack of a forensic report and requesting their acquittal. Moreover, Raízen and its employee clarified that there was no omission on the part of Raízen, which had every interest in fighting the fire and had invested in the adoption of numerous environmental best practices, among other factors leading up to Raízen and its employee’s acquittal. As a result, the court judge dismissed the claim for lack of materiality. The public prosecutor’s office presented an appeal and Raízen and its employee offered objections. On March 22, 2022, the Court of Appeals of the State of São Paulo confirmed the prior decision and the Court dismissed the claim for lack of materiality. The chances of reversal of the decision that was favorable to Raízen and its employee have been classified as remote.
Biosev is party to a criminal proceeding commenced by the civil police of the City of Moema, state of Minas Gerais, to investigate an alleged environmental crime allegedly committed by Biosev. It is alleged that Biosev operated without the required environmental license. A detailed report has been prepared by the civil police in respect of this proceeding. Biosev requested the dismissal of the proceeding, which is currently under review by the prosecution office and the civil police in the City of Moema. Should the prosecution continue and be successful, Biosev could face operational and reputational impacts. The risk of loss has been classified as possible.
Raízen is party to a criminal proceeding filed by Amazonas State Prosecutor’s Office on July 21, 2023, for allegedly committing the environmental crime provided for in article 56 of Federal Law 9,605/1998, namely trading dangerous products (aviation fuel) in contravention of the requirements established in applicable regulations. On August 14, 2023, Raízen filed a response to the accusation. On November 9, 2023, the court accepted the defendants’ arguments and rejected the complaint of the prosecutor’s office. On November 24, 2023, the Amazonas State Prosecutor’s Office filed an appeal. On December 6, 2023, Raízen filed its reply to the appeal. Should the proceeding continue and be successful, Raízen’s reputation could be adversely affected. The risk of loss has been classified as remote, considering the first rejection of the accusation.
Criminal Investigations Involving Raízen’s Employees
On July 31, 2018, the Civil Police of the state of Paraná launched Controlled Margin Operation to investigate alleged violation, by Raízen Combustíveis and other distributors, in the suggestion of resale prices at gas stations in the region. The operation involved dawn raids and temporary arrest of some individuals, but the arrest warrants were withdrawn after three days and there have been no further developments. Raízen Combustíveis is currently contesting the proceeding, which is a police investigation/operation and not a lawsuit at this moment. The investigation is ongoing as to whether these employees were engaged in misconducts against the economic order. We are waiting the closure of the police investigation.
On July 31, 2018, in connection with Operation Dubai, the Public Prosecutor’s Office of the Federal District filed a complaint against, among other parties, one employee of Raízen in relation to certain alleged anticompetitive practices. In said complaint, the Public Prosecutor’s Office of the Federal District requested that certain assets and funds of Raízen and of such Raízen’s employee in an amount of approximately R$120 million be frozen. However, Raízen successfully contested the freezing of assets. If the employee of Raízen is convicted, we may suffer reputational harm. This proceeding involves an aggregate amount of R$151.7 million, to us and our employee, and a total amount at issue of R$996.7 million. The risk of loss has been classified as possible.
Raízen is currently the subject of a criminal investigation, which commenced with an administrative proceeding before the Brazilian Antitrust Authority in 2009 against certain resellers and distributors. The proceeding is related to the alleged artificial price fixing of fuel and the alleged formation of a cartel among fuel distributors and resellers in the Brazilian Federal District in order to establish regional market control. In 2012, the Brazilian Antitrust Authority issued a technical note that alleged the existence of cartels within the sector. In November 2015, the Brazilian federal police executed search and seizure warrants against certain resellers and fuel distributors, including Raízen at its distribution terminal in Brasília. Raízen is cooperating with Brazilian authorities in connection with the investigation, which is currently ongoing. As of the date of this current report, no individual (including gas station owners) indicted in connection with the investigation has any relationship or affiliation with Raízen. On June 30, 2020, the Brazilian Antitrust Authority issued a technical notice, which we are currently evaluating, commencing an administrative proceeding involving resellers and fuel distributors, including Raízen. If Raízen or any of its employees are determined to have been involved in the misconduct, Raízen may be subject to penalties, including fines.
The following discussion of our financial condition and results of operations should be read in conjunction with our individual and consolidated financial information, as well as with the information presented under the sections entitled “Presentation of Financial and Other Information” and “Selected Financial Data.”
The following discussion contains forward-looking statements that involve risks and uncertainties. Our actual results may differ materially from those discussed in the forward-looking statements as a result of various factors, including those set forth in “Forward-Looking Statements” and “Risk Factors.”
Financial Presentation and Accounting Policies
Presentation Financial Information
We have included in this current report the individual and consolidated financial information of Cosan S.A. using the predecessor method of accounting as of December 31, 2023 and 2022 and for the years ended December 31, 2023 and 2022, as further discussed under “Presentation of Financial and Certain Other Information—Individual and Consolidated Financial Information.”
We use IFRS as issued by the IASB for financial reporting purposes. Investments in entities which we do not control, but either jointly control or have significant influence over, are accounted for using the equity method. The results of operations of Raízen S.A., our Joint Venture, are accounted for using the equity method, under IFRS 11.
See also “Presentation of Financial and Certain Other Information.”
Business Segments and Presentation of Segment Financial Data
We present the following reportable segments:
(1) Raízen: operates in the production of sugar, ethanol and bioenergy. Raízen is an integrated producer of energy from renewable sources such as biomass and solar energy, and also invests in technologies that will allow it to intensify the use of biomass in its portfolio. In addition, Raízen distributes and sells fuels under the “Shell” brand, supplying a network of service stations, airport refueling sites and business-to-business customers in Brazil and Argentina, where it also refines oil, manufactures and sells automotive and industrial lubricants, and produces and sells liquefied petroleum gas. Raízen’s operations also include the Shell Select convenience stores and the OXXO proximity stores of Grupo Nós, a joint venture with FEMSA Comércio. Following the corporate reorganization of Raízen completed on June 1, 2021, we started to consider Raízen as a single reportable segment. Accordingly, our previously reported segment information has been recast for all periods presented to reflect the changes in the reportable segments. For further information, see “Presentation of Financial and Other Information—Certain Corporate Events—Consolidation of Raízen,” “Information on the Company—B. Business Overview—Raízen,” “Information on the Company—E. Supplemental Information About Joint Venture” and note 4 “Segment Information” to our individual and consolidated financial information as of and for the fiscal years ended December 31, 2023 and 2022, included elsewhere in this current report;
(2) Compass: (i) distribution of piped natural gas throughout Brazil to industrial, residential, commercial, automotive and cogeneration customers; (ii) the sale of electricity and natural gas; (iii) the development of infrastructure projects in a regasification terminal and offshore gas pipeline; and (iv) development of thermal generation projects utilizing natural gas. Our Compass segment was created in March 2020. Prior to its creation, our natural gas distribution operations were concentrated in our Comgás segment, which has since been contributed to our Compass segment;
(3) Moove: production and distribution of lubricants under the Mobil brand in Brazil, Argentina, Bolivia, Uruguay, Paraguay, the United States of America and certain European countries, as well as in the European and Asian markets under the “Comma” trademark and corporate activities;
(4) Rumo: logistics services for rail transportation, storage and port loading of commodities, mainly for grains and sugar, leasing of locomotives, wagons and other railway equipment;
(5) Radar: agricultural property management; and
Reconciliation
(6) Cosan Corporate: this segment represents Cosan’s corporate structure, which includes: (i) senior management and corporate departments, which incur general and administrative expenses and other expenses (operating income), including pre-operational investments; (ii) result of equity method of assets, including our 4.85% equity interest in Vale’s total share capital as of December 31, 2023; and (iii) financial result attributed to the cash and indebtedness of the controlling company, intermediary holding companies (i.e., Cosan Oito, Cosan Nove and Cosan Dez) and offshore financial companies, and mining projects and investments in the Climate Tech Fund, a fund managed by Fifth Wall, specializing in technological innovation.
Principal Factors Affecting Our Results of Operations
In addition to the factors that are described in “Information on the Company—B. Business Overview,” our results of operations have been influenced and will continue to be influenced by the following key factors:
Brazilian Economic Environment
The Brazilian economic environment has historically been characterized by significant variations in economic growth, inflation and currency exchange rates. Our results of operations and financial condition are influenced by these factors and the effect that these factors have on employment rates, the availability of credit and average wages in Brazil. The following table sets forth Brazilian inflation rates, interest rates, and exchange rates for the periods indicated:
| For the Fiscal Year Ended December 31, | |||||||
|---|---|---|---|---|---|---|---|---|
| 2023 | 2022 | 2021 | |||||
GDP growth | 2.00% | 2.7% | 4.6% | |||||
Inflation (IGP M) | (3.2)% | 5.5% | 17.8% | |||||
Inflation (IPCA)(1) | 4.6% | 5.8% | 10.1% | |||||
Interbank rate – CDI (2) | 13.0% | 12.4% | 4.4% | |||||
SELIC average rate | 11.65% | 13.65% | 9.15% | |||||
Long term interest rates (3) | 6.6% | 7.2% | 5.3% | |||||
Exchange rate at the end of the period per U.S.$1.00 | R$ | 4.84 | R$ | 5.22 | R$ | 5.58 | ||
Average exchange rate per U.S.$1.00 | R$ | 5.00 | R$ | 5.17 | R$ | 5.40 | ||
Appreciation (depreciation) of the real against the U.S. dollar (4) | (7.3)% | (6.5)% | (7.4)% | |||||
Exchange rate at the end of the period per €1.00 | R$ | 5.35 | R$ | 5.57 | R$ | 6.32 | ||
Average exchange rate per €1.00 | R$ | 5.40 | R$ | 5.44 | R$ | 6.38 | ||
Appreciation (depreciation) of the real against the Euro (4) | (3.9)% | (11.9)% | (0.9)% | |||||
Exchange rate at the end of the period per ¥1.00 | R$ | 0.03 | R$ | 0.04 | R$ | 0.05 | ||
Average exchange rate per ¥1.00 | R$ | 0.04 | R$ | 0.04 | R$ | 0.05 | ||
Appreciation (depreciation) of the real against the Yen (4) | (13.5)% | (18.4)% | (3.9)% | |||||
Exchange rate at the end of the period per £1.00 | R$ | 6.16 | R$ | 6.28 | R$ | 7.52 | ||
Average exchange rate per £1.00 | R$ | 6.21 | R$ | 6.69 | R$ | 7.42 | ||
Appreciation (depreciation) of the real against the Pound (4) | (1.9)% | (16.6)% | 6.0% | |||||
Sources: IBGE, Brazilian Central Bank, B3 and Fundação Getúlio Vargas, or “FGV.”
(1) IPCA is a consumer price index calculated by IBGE.
(2) CDI refers to the average overnight interbank loan rates in Brazil.
(3) The Brazilian long‑term interest rate (taxa de juros de longo prazo), or “TJLP,” is the rate applicable to long‑term loans by BNDES.
(4) Comparing the PTAX exchange rate, as calculated by the Brazilian Central Bank, at the end of the period’s last day against the day immediately prior to the period’s first day. PTAX is the exchange rate calculated at the end of each day by the Brazilian Central Bank. It is the average rate of all business conducted in U.S. dollars, Euro, Pound and Yen on the determined date in the interbank exchange market.
Any deterioration in Brazil’s rate of economic growth, or changes in interest rates, the unemployment rate or price levels generally, may limit the availability of credit, income and purchasing power of our customers, thereby adversely affecting demand for our products. Our international operations expose us to political and economic risks in other countries. The Brazilian economy is also exposed to global macroeconomic conditions. Accordingly, the deterioration of economic and market conditions in other countries may have a negative impact on the Brazilian economy and on our business. See also “Risk Factors—Risks Related to Our Businesses and the Industries in Which We Operate Generally” and “Risk Factors—Risks Related to the Countries in Which We Operate.”
Acquisitions, Partnerships and Corporate Restructurings
Our strategy is to be a leading Brazilian group in the energy and logistics sectors. For this reason, since May 2004, we have expanded our operations primarily through acquisitions, partnerships and corporate restructurings. We have also diversified into other operations to become a vertically integrated energy and logistics company. In 2022, we also acquired a minority interest in Vale. See also “Presentation of Financial and Certain Other Information—Certain Corporate Events—Acquisition of Significant Influence in Vale S.A., or ‘Vale.’”
Sugar
The profitability of our sugar products is mainly affected by fluctuations in the international price of raw sugar and in the real/dollar exchange rate. International raw sugar prices are determined based on the New York Board of Trade Futures Contract No. 11, or “NY11.” Refined sugar trades at a premium to raw sugar, known as the “white premium,” and its price is determined based on the London International Financial Futures and Options Exchange Contract No. 5, or “LIFFE No. 5.” Prices are affected by the perceived and actual supply and demand for sugar and its substitute products. The supply of sugar is affected by weather conditions, governmental trade policies and regulations, and the amount of sugarcane and sugar beet planted by farmers, including substitution by farmers of other agricultural commodities for sugarcane or sugar beet. Demand is affected by growth in worldwide consumption of sugar and the prices of substitute sugar products. From time to time, imbalances may occur between overall sugarcane and sugar beet processing capacity, sugarcane and sugar beet supply and the demand for sugar products. Prices of sugar products are also affected by these imbalances, which, in turn, impact our decisions regarding whether and when to purchase, store or process sugarcane and whether to produce sugar or more ethanol.
The table below sets forth the prices for raw sugar NY11 for the periods indicated:
Sugar NY11 | |||||
| For the Fiscal Year Ended December 31, | ||||
| 2023 | 2022 | 2021 | ||
| (U.S.$/lb.) | ||||
Initial quote | 0.2176 | 0.1874 | 0.1576 | ||
Closing quote | 0.2058 | 0.2004 | 0.1888 | ||
Daily average quote | 0.2117 | 0.1882 | 0.1787 | ||
High quote | 0.2188 | 0.2098 | 0.2042 | ||
Low quote | 0.2033 | 0.1740 | 0.1471 | ||
Source: NYBOT; prices from the 1st Generic Future. Bloomberg.
Ethanol
Our ethanol products are affected by domestic Brazilian and international prices of ethanol, competition, governmental policies and regulations, and market demand for ethanol as an alternative or additive to gasoline. The price for ethanol we sell in Brazil is set in accordance with market prices, using indices published by the Agriculture School of the University of São Paulo (Escola Superior de Agricultura Luiz de Queiroz—ESALQ) and B3 as a reference. Prices for ethanol we export are set based on international market prices, including the New York Board of Trade’s recently launched ethanol futures contract. Prices for the industrial alcohol and bottled alcohol products we sell are also set based on market prices and have been historically higher than market prices for ethanol.
The table below sets forth the prices for hydrous ethanol in the Brazilian market for the periods indicated:
| Hydrous Ethanol ESALQ | ||||
|---|---|---|---|---|---|
| For the Fiscal Year Ended December 31, | ||||
| 2023 | 2022 | 2021 | ||
| (U.S.$/thousand liters) | ||||
Initial quote | 522.80 | 590.80 | 387.80 | ||
Closing quote | 392.90 | 549.70 | 591.80 | ||
Daily average quote | 480.60 | 576.47 | 549.55 | ||
Monthly average quote | 482.40 | 576.71 | 548.54 | ||
High quote | 617.20 | 819.10 | 695.80 | ||
Low quote | 376.60 | 429.30 | 387.80 | ||
Source: ESALQ.
The table below sets forth the prices for anhydrous ethanol in the Brazilian market for the periods indicated:
| Anhydrous Ethanol ESALQ | ||||
|---|---|---|---|---|---|
| For the Fiscal Year Ended December 31, | ||||
| 2023 | 2022 | 2021 | ||
| (U.S.$/thousand liters) | ||||
Initial quote | 600.80 | 676.30 | 451.30 | ||
Closing quote | 436.10 | 616.30 | 681.60 | ||
Daily average quote | 556.24 | 664.88 | 630.00 | ||
High quote | 693.50 | 902.20 | 810.20 | ||
Low quote | 430.20 | 535.30 | 442.20 | ||
The following table sets forth our average selling prices (in R$ per thousand liters) for ethanol in the export market for the periods indicated:
| Ethanol | ||||
|---|---|---|---|---|---|
| For the Fiscal Year Ended December 31, | ||||
| 2023 | 2022 | 2021 | ||
| (R$/thousand liters) | ||||
Average Unitary Price | 4,090.92 | 3,368.28 | 4,508.60 | ||
Source: Cosan/Raízen.
Demand for Fuels
Demand for natural gas, gasoline, ethanol and diesel is susceptible to volatility related to the level of economic activity in Brazil, Argentina and Paraguay, and may also fluctuate depending on the performance of specific industries. We expect that a decrease in economic activity would adversely affect demand for fuels.
Currency Fluctuations
A significant proportion of the sales of sugar of Raízen, a significant proportion of natural gas purchases of Compass, and a significant proportion of the base oil purchases of CLE are conducted in U.S. dollars. Therefore, a depreciation of the real against the U.S. dollar would have the effect of increasing our sales in Raízen, and increasing our costs of sales in Compass and Moove. An appreciation of the real against the U.S. dollar would have the opposite effect.
A significant proportion of our debt is denominated in U.S. dollars, Euro and Yen. A depreciation of the real against the U.S. dollar, Euro and Yen would increase our debt burden and our related financial expenses. However, we have receivables and other financial assets denominated in U.S. dollars, which would partially offset the impact that a depreciation of the real would have on our financial position. An appreciation of the real against the U.S. dollar, Euro and Yen would have the opposite effect.
See also “—Hedging Transactions and Exposures.”
Seasonality
Our business is subject to a degree of seasonality as described below. See also “Risk Factors—Risks Related to Our Business, the Operations of Our Joint Venture, and Industries in Which We Operate—We operate in sectors in which market demand and prices are cyclical and affected by weather and economic conditions in Brazil and worldwide.”
Raízen is subject to seasonal trends based on the sugarcane growing cycle in the Central-South region of Brazil. The annual sugarcane harvesting period in the Central-South region of Brazil begins in April/May and ends in November/December. This creates variations in inventory, which is usually high in November due to harvest dynamics and a degree of seasonality in gross income from sales of ethanol and sugar, and is significantly lower in the quarter ending March 31. In addition, Rumo is subject to the seasonality that influences the sugarcane and grain harvest. During the peak months of the harvests, there is higher demand for transport and logistics operations.
Inflation
Inflation rates in Brazil were 3% in 2017, 3.8% in 2018, 4.3% in 2019, 4.5% in 2020, 10.1% in 2021, 5.8% in 2022 and 4.6% in 2023, as measured by the Extended National Consumer Price Index (Índice Nacional de Preços ao Consumidor Amplo), or “IPCA,” published by the Brazilian Institute for Geography and Statistics (Instituto Brasileiro de Geografia e Estatística), or “IBGE.” The inflation rate reached a level of 4.6% for the 12-month period ending December 31, 2023 and 1.8% as of April 30, 2024.
Inflation affects our financial performance by increasing certain of our operating expenses denominated in reais (and not linked to the U.S. dollar). These operating expenses include labor costs, leases, and selling and general administrative expenses. However, inflation did not have a material impact on our business for the periods presented.
As a result of COVID-19’s continuous disruption of global supply chains and the ongoing armed conflicts between Russia and Ukraine and in the Middle East, inflationary pressure has increased in Brazil and around the world in the markets in which we operate. These inflationary pressures may lead to an increase in our costs and expenses which could ultimately impact our profitability.
See also “Risk Factors—Risks Related to the Countries in Which We Operate—Inflation and government measures to curb inflation may adversely affect the Brazilian economy, the Brazilian securities market, our business and operations, and the market prices of our shares.”
Cost Structure
The cost structure of Raízen is affected mainly by variable costs related to purchase of crude oil (Argentina), and fuels (mainly gasoline, ethanol and diesel). Costs related to our property, plant and equipment incur fixed depreciation charges which increase in line with our capital expenditure. Costs that are linked to the prices of our products and costs that are not linked to the prices of our products. Two of our principal cost components, raw materials and land leases, are linked to the prices of our products. Accordingly, we adjust the prices of our products to follow fluctuations in the cost of our raw materials and leased land, substantially minimizing the impact of this cost volatility on our results of operations. In addition, another relevant portion of our costs is represented by agricultural and industrial inputs, some of which are imported and which are also subject to price fluctuations primarily as a result of exchange rate variations. As 2% of our net sales are derived from exports, a portion of fluctuations in the costs of these inputs is offset by similar fluctuations in our Brazilian and international prices, minimizing the impact of this cost volatility on our results of operations.
Our cost structure for Compass is affected by fixed and variable costs. Costs related to our property, plant and equipment incur fixed depreciation charges which increase in line with our capital expenditure. Costs relating to the natural gas resource, costs relating to transportation and other gas services are affected by volumes sold.
The cost of oil, gas and related products is linked to oil and natural gas commodity prices driven by the Platts Japan Borea Marker, a benchmark price that reflects the spot market value of liquefied natural gas, and Brent the leading global price benchmark for basin crude oils. The war between Russia and Ukraine and the recent conflicts in the Middle East have caused and continue to cause an imbalance in supply and demand for a range of products and services, including oil and natural gas, in addition to increased uncertainty regarding the global macroeconomic environment and energy prices.
Our cost structure for Moove is affected by the cost of imported base oil and additives for lubricants blending.
Our cost structure for Rumo is affected by fixed and variable costs. Costs related to our property, plant and equipment incur fixed depreciation charges, which increase in line with our capital expenditure. Costs relating to the transportation of sugar and other commodities are partially dependent on sales volumes.
Other Factors
Other factors that will impact the results of our operations include:
- general economic, political, demographic and business conditions in Brazil and in the world (including any impact resulting from the ongoing war between Russia and conflicts in the Middle East);
- the economic and political situation in Brazil, including the potential impact of the policies to be adopted by the new administration;
- the growth rate of the global economy and its resulting corresponding growth in worldwide demand for sugar, ethanol, fuel, energy and logistics services;
- trade barriers in U.S., European and other markets that currently limit access to their domestic sugar, ethanol and other industry through quotas, subsidies and restrictions on imports;
- the tax policies adopted by the Brazilian government and the governments of the Brazilian states in which we operate (including tax incentives from which we benefit), and our resulting tax obligation;
- demand for ethanol, natural gas, logistics services and the other products and services we offer;
- the evolving use of ethanol derivatives as an alternative to oil derivatives and as a cleaner burning fuel, derived from renewable sources;
- the use of ethanol as a cleaner burning fuel, derived from renewable sources;
- readjustments to tariffs on natural gas prices;
- the crop harvesting in Brazil of agricultural commodities;
- our investment in Vale;
- changes in interest rates, inflation, currency exchange rates, and other local or regional market conditions
- changes in international prices of oil (denominated in U.S. dollars) and related changes in the domestic prices of oil (denominated in reais); and
- hedging transactions (as discussed under “—Hedging Transactions and Exposures”).
Hedging Transactions and Exposures
Our management has overall responsibility for the establishment and oversight of our risk management framework. Our board of directors has established the risk management committee, which is responsible for developing and monitoring our risk management policies. The committee reports regularly to our board of directors on its activities.
Our risk management policies are established to identify and analyze the risks that we face, to set appropriate risk limits and controls and to monitor risks and adherence to limits. Risk management policies and systems are reviewed regularly to reflect changes in market conditions and our activities. Our management, through its training, standards and procedures, aims to maintain a disciplined and constructive control environment in which all employees understand their roles and obligations.
Our hedging strategy primarily seeks to protect our cash flows from risks arising from exchange rate fluctuations. Accordingly, certain of our derivatives financial instruments have been designated for hedge accounting, namely: (1) at Comgás, the fifth issuance of debentures due in 2023 and debt incurred with the BNDES due in 2034, and the associated derivative financial instruments; (2) at Rumo, the Senior Notes due 2025 (redeemed on January 18, 2022), due 2028 and 2032, debentures due between 2027 and 2036, Cédula de Crédito Bancário (“CCB”) due 2048 and Financiamento a empreendimentos (“Finem”) due 2031, and the associated derivatives financial instruments; and (3) at Moove, two export prepayments (Pré-pagamento de exportação) due in the months of October and December of 2023.
We also have derivatives financial instruments that have not been designated for hedge related to acquisition of interest in Vale. For more information see “Presentation of Financial and Certain Other Information—Certain Corporate Events—Acquisition of Significant Influence in Vale S.A., or ‘Vale.’”
In addition, Raízen hedges part of the future price risk of its sugar production (that which it believes will be exported) and of its exchange rate derivative transactions using future contracts, options and swaps. Its hedging strategy seeks to protect it from cash flow risks caused by commodities price and exchange rate fluctuations, and as most of the derivative instruments have been designated for hedge accounting, Raízen has not experienced material gains or losses in its financial results.
See “Management’s Discussion and Analysis of Financial Condition and Results of Operations—E. Quantitative and Qualitative Disclosures About Market Risk” and note 5.12 to our individual and consolidated financial information attached hereto for further information.
The following discussion of our results of operations is based on the financial information derived from our individual and consolidated financial information prepared in accordance with IFRS as issued by the IASB, unless otherwise stated. In the following discussion, references to increases or decreases in any year are made by comparison with the corresponding prior year, as applicable, except as the context otherwise indicates. The discussion in this section is based on a comparison of the fiscal year ended December 31, 2023 with the fiscal year ended December 31, 2022, and a comparison of the fiscal year ended December 31, 2022 with the fiscal year ended December 31, 2021.
Results of Operations for the Fiscal Year Ended December 31, 2023 Compared to the Fiscal Year Ended December 31, 2022
Consolidated Results
The following table sets forth our consolidated statement of profit or loss for the fiscal years ended December 31, 2023 and 2022:
| For the Fiscal Year Ended | ||||||||
|---|---|---|---|---|---|---|---|---|---|
| 2023 | 2022 | % Variation | ||||||
| (in millions of reais, except percentages) | ||||||||
Consolidated statement of profit or loss |
|
|
| ||||||
Net sales | 39,468.5 | 39,322.8 | 0.4% | ||||||
Cost of sales(1) | (28,549.9 | ) | (30,556.8 | ) | (6.6)% | ||||
Gross profit(1) | 10,918.6 | 8,766.0 | 24.2% | ||||||
Selling expenses(1) | (1,350.6 | ) | (1,276.3 | ) | 5.8% | ||||
General and administrative expenses(1) | (2,528.0 | ) | (1,758.1 | ) | 43.8% | ||||
Other income, net | 3,924.4 | 1,752.2 | 124.0% | ||||||
Operating expenses | 45.8 | (1,282.1 | ) | (103.6)% | |||||
Profit before equity in earnings of investees, finance results and income taxes | 10,964.4 | 7,483.8 | 46.5% | ||||||
Interest in earnings of associates | 350.4 | 418.9 | (16.4)% | ||||||
Interest in earnings of joint venture | 1,695.9 | (92.2 | ) | (1,939.4)% | |||||
Finance results, net | (7,897.0 | ) | (5,157.9 | ) | 53.1% | ||||
Profit before income taxes | 5,113.8 | 2,652.6 | 92.8% | ||||||
Income taxes – current | (1,645.1 | ) | (1,247.0 | ) | 31.9% | ||||
Income taxes – deferred | 1,370.6 | 1,365.4 | 0.4% | ||||||
Total income taxes | (274.4 | ) | 118.4 | (331.8)% | |||||
Profit for the year | 4,884.7 | 2,820.9 | 73.2% | ||||||
Profit attributable to non-controlling interests | 3,790.4 | 1,644.8 | 130.4% | ||||||
Profit attributable to owners of the Company | 1,094.4 | 1,176.0 | (6.9)% | ||||||
| (1) | In the first quarter of 2022, we revised our intangible asset policy for natural gas distribution concession contracts and reclassified the balances of amortization expense related to the concession intangible assets from selling, general and administrative expenses to cost of sales retrospectively. This reclassification does not impact regulatory margins or key indicators used by us. Our previously reported financial information has been restated for all periods presented to reflect this change in classification and presentation. |
Net Sales
We report net sales after deducting federal and state taxes assessed on gross sales (ICMS, PIS, COFINS) and IPI (a federal value-added tax assessed on our sales in the Brazilian market at rates that vary by product). Deductions from sales in the Brazilian domestic market, which are subject to these taxes, are significantly higher than our deductions from sales in export markets.
The table below presents a breakdown of our net sales for the fiscal years ended December 31, 2023 and 2022:
| For the Fiscal Year Ended | % Variation | ||||||
|---|---|---|---|---|---|---|---|---|
| 2023 | 2022 | ||||||
| (in millions of reais, except percentages) | |||||||
Rumo | 10,937.7 | 9,841.5 | 11.1% | |||||
North Operations | 8,346.3 | 7,635.2 | 9.3% | |||||
South Operations | 2,032.7 | 1,739.4 | 16.9% | |||||
Container Operations | 558.7 | 19,719.2 | 19.7% | |||||
Compass | 17,767.3 | 19,719.2 | (9.9)% | |||||
Natural gas distribution | 17,767.3 | 19,719.2 | (9.9)% | |||||
Industrial | 11,411.2 | 12,945.1 | (11.8)% | |||||
Residential | 2,202.3 | 2,200.8 | 0.1% | |||||
Construction revenue | 1,494.1 | 1,217.8 | 22.7% | |||||
Commercial | 820.7 | 814.9 | 0.7% | |||||
Cogeneration | 710.3 | 943.9 | (24.7)% | |||||
Automotive | 592.9 | 928.5 | (36.1)% | |||||
Other | 535.7 | 429.5 | 24.7% | |||||
Electricity trading | — | 238.6 | n.m. | |||||
Moove | 10,078.6 | 8,980.1 | 12.2% | |||||
Finished goods | 8,520.2 | 8,050.3 | 5.8% | |||||
Base oil | 765.4 | 596.4 | 28.3% | |||||
Services | 793.0 | 333.3 | 137.9% | |||||
Radar | 743.4 | 834.6 | (10.9)% | |||||
Leases and sale of lands | 743.4 | 834.6 | (10.9)% | |||||
Reconciliation |
|
|
| |||||
Cosan Corporate | 2.7 | 10.4 | (74.0)% | |||||
Digital platforms(1) | 2.7 | 2.8 | (3.6)% | |||||
Logistics services(1) | — | 7.6 | n.m. | |||||
Segment elimination | (61.2 | ) | (63.0 | ) | (2.9)% | |||
Net sales | 39,468.5 | 39,322.8 | 0.4% | |||||
n.m. = not meaningful.
| (1) | Beginning in the fiscal year ended December 31, 2023, we reclassified our “digital platforms” and “logistics services” line items in our statements of profit or loss from the Radar segment to Cosan Corporate. |
The change in the various components consists of the following:
Rumo
Rumo’s net sales increased by R$1,096.2 million, or 11.1%, to R$10,937.7 million from R$9,841.5 million in the fiscal year ended December 31, 2023 compared to the year ended December 31, 2022, mainly due to (1) the demand for freight for key agricultural commodities, such as soybean, sugar and fertilizers, which led to an increase in average yields on a consolidated basis of 12.4% in 2023 to R$130.2 per 1,000 RTK in the year ended December 31, 2023 compared to R$115.8 per 1,000 RTK in the year ended December 31, 2022, and (2) a 3.1% increase in consolidated transported volume.
Compass
Compass’s net sales in the fiscal year ended December 31, 2023 amounted to R$17,767.3 million, representing the results of its natural gas distribution and electricity trading activities. This represented a decrease of 9.9%, or R$1,951.9 million, as compared to net sales of R$19,719.2 million in the fiscal year ended December 31, 2022. This decrease was primarily due to (1) a R$1,840.9 million decrease in net sales at Comgás, which, in turn, was caused by a decrease in the volume of distributed natural gas, and (2) a R$238.6 million decrease in electricity trading results to nil in the year ended December 31, 2023, which resulted from the execution by our subsidiary Compass Comercialização S.A. of an electricity purchase and sale contracts assignment agreement with WX Energy Comercializadora de Energia Ltda. in July 2022. These factors were partially offset by the acquisition of Commit and the consolidation of its results beginning in July 2022, which resulted in an increase in net sales of R$362.8 million.
Moove
The net revenue of the lubricants business was R$10,078.6 million in the fiscal year ended December 31, 2023, an increase of R$1,098.5 million, or 12.2%, compared to net revenue of R$8,980.1 million in the fiscal year ended December 31, 2022, primarily due to (1) the acquisition and consolidation of the results of PetroChoice and Tirreno beginning in May 2022, which increased net sales by R$791.4 million; and (2) an increase of 31.6% in the volume of lubricants and base oils sold, which accounts for the remainder of the increase.
Radar
Leases and sales of land amounted to R$743.4 million in the fiscal year ended December 31, 2023, a decrease of R$91.2 million, or 10.9%, compared to leases and sales of land of R$834.6 million in the fiscal year ended December 31, 2022, primarily due to a decrease in sales of land in 2023 with an impact of R$348.7 million on Janus and Radar, which was partially offset by an increase of R$257.5 million in sales of land by Tellus.
Cosan Corporate
Cosan Corporate net sales totaled R$2.7 million in the fiscal year ended December 31, 2023, a decrease of R$7.7 million, or 74.0% when compared to R$10.4 million in the fiscal year ended December 31, 2022. This decrease was mainly due to our sale of Trizy in March 2023, which impacted revenue from logistics services.
Cost of Sales
| For the Fiscal Year Ended | % | |||||||
|---|---|---|---|---|---|---|---|---|---|
| 2023 | 2022 | |||||||
| (in millions of reais, except percentages) | ||||||||
Rumo | (6,838.4 | ) | (6,695.1 | ) | 2.1% | ||||
Compass(1) | (14,256.0 | ) | (16,364.8 | ) | (12.9)% | ||||
Moove | (7,359.6 | ) | (6,990.2 | ) | 5.3% | ||||
Radar | (153.5 | ) | (560.3 | ) | (72.6)% | ||||
Reconciliation |
|
|
| ||||||
Cosan Corporate | (3.6 | ) | (9.4 | ) | (61.7)% | ||||
Segment elimination | 61.2 | 63.0 | (2.9)% | ||||||
Cost of sales | (28,549.9 | ) | (30,556.8 | ) | (6.6)% | ||||
n.m. = not meaningful.
| (1) | In the first quarter of 2022, we revised our intangible asset policy for natural gas distribution concession contracts and reclassified the balances of amortization expense related to the concession intangible assets from selling, general and administrative expenses to cost of sales retrospectively. This reclassification does not impact regulatory margins or key indicators used by us. Our previously reported financial information has been restated for all periods presented to reflect this change in classification and presentation. |
Total cost of sales decreased by R$2,006.9 million, or 6.6%, to R$28,549.8 million during the fiscal year ended December 31, 2023, from R$30,556.8 million during the fiscal year ended December 31, 2022, due to the factors described below.
Rumo
The cost of sales of the Rumo segment in the fiscal year ended December 31, 2023 increased by R$143.3 million, or 2.1%, to R$6,838.4 million in the fiscal year ended December 31, 2022, from R$6,695.1 million in the previous year, which was primarily due to (i) a 3.1% increase in transported volume, and (ii) an increase of R$212.7 million due to depreciation and amortization related to the acquisition of fixed assets. This increase was partially offset by a decrease in electricity costs in the amount of R$38.8 million. Cost of sales accounted for 62.5% of net sales from services in the fiscal year ended December 31, 2023 as compared to 68.0% for the fiscal year ended December 31, 2022.
Compass
Compass’s costs of sales, which corresponds to the cost of gas, transportation, construction activity on the gas distribution infrastructure under concession and electricity trading, totaled R$14,256.0 million in the fiscal year ended December 31, 2023, a 12.9%, or R$2,108.8 million, decrease in comparison with R$16,364.8 million in the fiscal year ended December 31, 2022. This decrease was primarily due to (1) a 9.6% decrease in the volume of natural gas distributed, which resulted in a R$1,839.6 million decrease in Comgás’s cost of sales, and (2) a R$260.9 million decrease in energy trading results. These factors were partially offset by the acquisition of Commit and the consolidation of its results beginning in July 2022, resulting in an increase in cost of sales of R$297.1 million.
Moove
The cost of sales of Moove totaled R$7,359.6 million in the fiscal year ended December 31, 2023, an increase of 5.3%, or R$369.4 million, compared to R$6,990.2 million in the fiscal year ended December 31, 2022, mainly due to (1) the acquisition and consolidation of the results of PetroChoice and Tirreno beginning in May 2022, which increased the cost of sales by R$395.8 million; and (2) the general increase in sales of Moove’s core businesses discussed under “—Net Sales,” which accounts for the remainder of the increase.
Radar
The cost of sales of Radar in the fiscal year ended December 31, 2023 decreased by R$406.8 million to R$153.5 million in the fiscal year ended December 31, 2023, from R$560.3 million in the fiscal year ended December 31, 2022, mainly due to a decrease in costs incurred with the sale of real estate.
Cosan Corporate
Cosan Corporate cost of sales totaled R$3.6 million in the fiscal year ended December 31, 2023, a decrease of R$5.8 million, or 61.7% when compared to R$9.4 million in the fiscal year ended December 31, 2022. This decrease was mainly due to our sale of Trizy in March 2023.
Selling Expenses
Selling expenses are primarily related to transportation costs, including freight and shipping costs for lubricant sold in Brazil and exported. Moove’s lubricant marketing expenses, as well as storage expenses, are also included as selling expenses.
| For the Fiscal Year Ended December 31, | % | ||||||
|---|---|---|---|---|---|---|---|---|
| 2023 | 2022 | ||||||
| (in millions of reais, except percentages) | |||||||
Rumo | (40.7 | ) | (30.6 | ) | (33.0)% | |||
Compass(1) | (164.4 | ) | (163.3 | ) | (0.7)% | |||
Moove | (1,145.0 | ) | (1,072.5 | ) | (6.8)% | |||
Radar | (0.5 | ) | (9.9 | ) | (94.9)% | |||
Selling expenses | (1,350.6 | ) | (1,276.3 | ) | (5.8)% | |||
n.m. = not meaningful.
| (1) | In the first quarter of 2022, we revised our intangible asset policy for natural gas distribution concession contracts and reclassified the balances of amortization expense related to the concession intangible assets from selling, general and administrative expenses to cost of sales retrospectively. This reclassification does not impact regulatory margins or key indicators used by us. Our previously reported financial information has been restated for all periods presented to reflect this change in classification and presentation. |
Selling expenses increased by R$74.3 million, or 5.8%, to R$1,350.6 million during the fiscal year ended December 31, 2023 from R$1,276.3 million during the fiscal year ended December 31, 2022, due to the factors described below.
Rumo
Selling expenses increased by R$10.1 million, or 33.0%, to R$40.7 million in the fiscal year ended December 31, 2023 compared to R$30.6 million in the fiscal year ended December 31, 2022. This increase was mainly due to (1) a decrease in employee expenses of R$7.3 million, and (2) a decrease of R$1.0 million in reversals of allowances for credit losses.
Compass
Selling expenses increased by R$1.1 million, or 0.7%, to R$164.4 million during the fiscal year ended December 31, 2023, from an expense of R$163.3 million during the fiscal year ended December 31, 2022. This increase was primarily due to the acquisition and consolidation of the results of Sulgás beginning in January 2022 and Commit beginning in July 2022, which increased selling expenses in the Compass segment by R$16.6 million. This increase was mostly offset by a decrease of R$15.4 million in Comgás’s selling expenses, which primarily reflected a reversal of allowances for credit losses.
Moove
Selling expenses increased by R$72.5 million, or 6.8%, to R$1,145.0 million in the fiscal year ended December 31, 2023, as compared to R$1,072.5 million in the fiscal year ended December 31, 2022. This increase was mainly due to (1) the acquisition and consolidation of the results of PetroChoice and Tirreno beginning in May 2022, which increased selling expenses by R$38.9 million, and (2) a 21.7%, or R$44.5 million, increase in freight expenses. This increase in expenses was offset by a R$10.2 million decrease in depreciation and amortization in 2023 compared to 2022, which primarily resulted from the depreciation of the U.S. dollar during the period.
Radar
Selling expenses decreased by R$9.4 million, to R$0.5 million in the fiscal year ended December 31, 2023, from R$9.9 million in the fiscal year ended December 31, 2022, as a result of there only having been negligible selling expenses related to leasing in 2023.
General and Administrative Expenses
| For the Fiscal Year Ended December 31, | % | ||||||
|---|---|---|---|---|---|---|---|---|
| 2023 | 2022 | ||||||
| (in millions of reais, except percentages) | |||||||
Rumo | (560.0 | ) | (468.6 | ) | 19.5% | |||
Compass | (788.0 | ) | (563.5 | ) | 39.8% | |||
Moove | (645.6 | ) | (347.6 | ) | 85.7% | |||
Radar | (74.3 | ) | (45.5 | ) | 63.3% | |||
Reconciliation |
|
|
| |||||
Cosan Corporate | (460.0 | ) | (332.9 | ) | 38.2% | |||
General and administrative expenses | (2,527.9 | ) | (1,758.1 | ) | 43.8% | |||
n.m. = not meaningful
General and administrative expenses consist of salaries and benefits paid to employees, taxes, expenses related to third-party services, rentals and other expenses. Our total general and administrative expenses increased by 43.8% to R$2,527.9 million during the fiscal year ended December 31, 2023, from R$1,758.1 million during the fiscal year ended December 31, 2022, due to the factors described below.
Rumo
General and administrative expenses totaled R$560.0 million in the fiscal year ended December 31, 2023, an increase of 19.5%, or R$91.4 million, from R$468.6 million in the fiscal year ended December 31, 2022, primarily due to increases of (1) R$67.3 million in salaries paid, and (2) an increase of R$40.8 million related to third-party services, including consulting and audit services.
Compass
General and administrative expenses totaled R$788.0 million in the fiscal year ended December 31, 2023, an increase of R$224.6 million, or 39.9%, compared to R$781.7 million in the fiscal year ended December 31, 2022. This increase was mainly due to: (1) the acquisition and consolidation of the results of Sulgás beginning in January 2022 and of the results of Commit beginning in July 2022, which increased general and administrative expenses in the Compass segment by R$48 million; (2) an increase of R$80.0 million due to an increase in depreciation and amortization expenses related to the acquisition of fixed assets; (3) an increase of R$34.4 million in taxes and fees; and (4) an increase of R$33.3 million related to third-party services, including consulting and audit services.
Moove
General and administrative expenses totaled R$645.6 million in the fiscal year ended December 31, 2023, an increase of R$298 million, or 85.8% when compared to the expense of R$347.6 million in the fiscal year ended December 31, 2022, primarily due to (1) the acquisition and consolidation of the results of PetroChoice and Tirreno beginning in May 2022, which increased Moove’s general and administrative expenses by R$193.8 million, and (2) an increase of R$120.2 million in employee expenses. This increase was partially offset by a decrease of R$46 million in provisions for doubtful accounts.
Radar
General and administrative expenses totaled R$74.4 million in the fiscal year ended December 31, 2023, an increase of R$28.8 million, or 63.3% when compared to expenses of R$45.5 million in the fiscal year ended December 31, 2022, primarily due to (1) the acquisition of the land management companies Tellus, Janus, Gamiovapar and Duguetiapar in the last quarter of 2022, which increased general and administrative expenses by R$16.6 million, and (2) an increase in third-party services expenses of R$11.0 million, mainly due to an increase in amounts paid to a strategic management consultancy firm.
Cosan Corporate
General and administrative expenses totaled R$460.0 million in the fiscal year ended December 31, 2023, an increase of R$127.1 million, or 38.2% when compared to the expense of R$332.9 million in the fiscal year ended December 31, 2022. This increase was mainly due to an increase of R$120.7 million in salaries paid.
Other Income, Net
Other income, net increased from R$1,752.2 million in the fiscal year ended December 31, 2022 to R$3,924.4 million in the fiscal year ended December 31, 2023, mainly due to: (1) an increase of R$948.2 million reflecting changes in the fair value of investment properties (the methodology used to determine fair value incorporates direct comparisons of market information, such as market research, spot market prices, sales, distances, facilities, access to land, topography and soil, land use (crop type), and rainfall, among other data, in accordance with the standards issued by the Brazilian Association of Technical Standards (Associação Brasileira de Normas Técnicas — ABNT)); (2) the recognition of dividends declared by Vale in the amount of R$1,339.3 million; and (3) the recognition of other operating income received in the amount of R$923.2 million from our subsidiary Compass Comercialização, reflecting the cancellation of certain liquefied natural gas contracts with deliveries scheduled for 2023 and the receipt of financial compensation in connection thereto, initially recorded on its balance sheet under deferred revenue and subsequently recognized as other operating income upon contract cancellation, as further described in note 2 to our individual and consolidated financial information included elsewhere in this current report. This increase was partially offset by: (1) Rumo’s R$955.6 million capital gain arising from the sale of its shareholding interest in EPSA; and (2) R$99.3 million of bargain purchase gains in the acquisition of Tellus, Janus, Gamiovapar and Duguetiapar in 2022.
Interest in Earnings of Associates
Interest in earnings of associates includes our 20% of interest in EPSA, interest in eight distributors acquired by Compass and other investments. Interest in earnings of associates decreased to R$350.4 million in the fiscal year ended December 31, 2023 from R$418.9 million in the fiscal year ended December 31, 2022, mainly due to the decrease in income from our interests in Tellus and Janus in the amount of R$279.6 million reflecting our acquisition of additional equity interests in these companies in the fourth quarter of 2022, following which the results from these entities were fully consolidated and no longer recorded under this line item. This decrease was offset by (1) the acquisition by our subsidiary Compass of minority interests in eight distributors in Brazil, which resulted in an impact in the amount of R$81.0 million in 2023; (2) the sale by Rumo of part of its controlling interest in EPSA in November 2022, which resulted in an impact in the amount of R$34.9 million; and (3) an increase in income from our interest in Vale in the amount of R$96.1 million in the year ended December 31, 2023.
Interest in Earnings of the Joint Venture
Interest in earnings of the joint venture includes our 30.9% interests in Raízen S.A. Interest in earnings of the joint venture increased to an income of R$1,695.9 million in the fiscal year ended December 31, 2023, representing an increase of R$1,788.1 million, from an expense of R$92.2 million in the fiscal year ended December 31, 2022, mainly due to the recognition of PIS and COFINS tax credits in an amount of R$1,465.6 million in connection with Supplementary Laws Nos. 192 and 194 (which reduced the rates of PIS and COFINS applicable to certain products). For more information see “Information on the Company—E. Supplemental Information About Joint Venture.”
Finance Results, Net
Finance results, net in the fiscal year ended December 31, 2023 totaled a net financial expense of R$7,800.1 million compared with a net financial expense of R$5,157.9 million in the fiscal year ended December 31, 2022, an increase of R$2,600.4 million, or 51.2%.
For a better understanding of our finance results, the following table details our cost of debt:
| For the Fiscal Year Ended December 31, | % | ||||||||
|---|---|---|---|---|---|---|---|---|---|---|
| 2023 | 2022 | ||||||||
| (in millions of reais, except percentages) | |||||||||
Cost of gross debt |
|
|
| |||||||
Interest on debt | (4,267.8 | ) | (4,464.8 | ) | (4.4)% | |||||
Monetary and exchange rate variation | 1,921.6 | 549.7 | 249.6% | |||||||
Derivatives and fair value measurement | (2,684.1 | ) | (4,203.1 | ) | (36.1)% | |||||
Amortization of borrowing costs | (64.6 | ) | (244.3 | ) | (73.5)% | |||||
Guarantees and warranties | (38.8 | ) | (41.5 | ) | 6.5% | |||||
| (5,133.7 | ) | (8,404.0 | ) | (38.9)% | |||||
Income from financial investments and exchange rate in cash and cash equivalents | 2,057.4 | 1,788.5 | 15.0% | |||||||
Changes in fair value of investment in listed entities | (3,147.0 | ) | 3,385.0 | n.m. | ||||||
Cost of debt, net | (6,223.3 | ) | (3,230.5 | ) | 92.6% | |||||
Other charges and monetary variations |
|
|
| |||||||
Interest on other receivables | 450.5 | 355.6 | 26.7% | |||||||
Update of other financial assets | 1.8 | (1.4 | ) | n.m. | ||||||
Monetary variation of other financial assets | (514.2 | ) | (417.7 | ) | 23.1% | |||||
Interest on lease liabilities | (444.9 | ) | (374.2 | ) | 18.9% | |||||
Interest on shareholders’ equity | (46.2 | ) | 33.1 | n.m. | ||||||
Interest on contingencies and contracts | (781.1 | ) | (593.1 | ) | 31.7% | |||||
Interest on sectoral assets and liabilities | (97.9 | ) | (36.7 | ) | 166.8% | |||||
Bank charges and other | (107.8 | ) | (145.2 | ) | (25.8)% | |||||
Foreign exchange, net | (134.0 | ) | (747.8 | ) | (82.1)% | |||||
| (1,673.7 | ) | (1,927.4 | ) | (13.2)% | |||||
Finance results, net | (7,897.1 | ) | (5,157.9 | ) | 53.1% | |||||
Reconciliation |
|
|
| |||||||
Finance expense | (11,337.4 | ) | (4,706.5 | ) | 140.9% | |||||
Finance income | 3,028.1 | 5,777.5 | (47.6)% | |||||||
Foreign exchange losses, net | 1,777.4 | 260.8 | 581.5% | |||||||
Derivatives | (1,365.2 | ) | (6,489.7 | ) | (79.0)% | |||||
| (7,897.1 | ) | (5,157.9 | ) | 53.1% | |||||
n.m. = not meaningful.
Cost of gross debt. The total cost of gross debt (which includes interest expenses, exchange variation and derivative gain or loss) decreased by R$3,318.8 million, or 39.5%. This decrease was primarily due to (1) the decrease of the average SELIC interest rate and the resulting effect over CDI rate, which decreased to 11.65% for the year ended December 31, 2023 from 13.65% for the year ended December 31, 2022, and (2) the depreciation of the U.S. dollar relative to the real, to R$5.00 per U.S.$1.00 on average during the year ended December 31, 2023 in comparison to R$5.17 per U.S.$1.00 on average during the year ended December 31, 2022.
Income from financial investments and exchange rate in cash and cash equivalents. Income from financial investments and exchange rate in cash and cash equivalents amounted to R$2,057.4 million in the fiscal year ended December 31, 2023, an increase of 15.0% as compared to interest income of R$1,788.5 million in the fiscal year ended December 31, 2022. This increase was primarily due to the increase in financial investments from R$12,019.7 million for the year ended December 31, 2022 to R$14,066.2 million for the year ended December 31, 2023.
Financial investment on listed entities. Income from financial investment on listed entities amounted to R$3,147.0 in the fiscal year ended December 31, 2023. This amount is related to the loss from the adjustment at fair value based on the market value of Vale’s shares.
Other charges and monetary variations. Other charges and monetary variations decreased by R$205.1 million, or 10.6%, from an expense of R$1,927.4 million in the fiscal year ended December 31, 2022, to an expense of R$1,722.3 million in the fiscal year ended December 31, 2023. This decrease was due to a foreign exchange loss in the amount of R$565.3 million due to an effect of the depreciation of the U.S. dollar relative to the real, to R$5.00 per U.S.$1.00 on average during the year ended December 31, 2023 in comparison to R$5.165 per U.S.$1.00 on average during the year ended December 31, 2022. This increase was partially offset by (1) an increase of R$188.0 million in interest on contingencies and contracts, and (2) an increase of R$70.7 million in interest on lease liabilities.
Total Income Taxes
Income tax expenses amounted to an expense of R$274.4 million for the fiscal year ended December 31, 2023, compared to an income of R$118.4 million in the fiscal year ended December 31, 2022. This variation was primarily due to tax implications related to the exclusion of the ICMS benefit in the IRPJ and CSLL calculation, recorded at Comgás and Moove in the amount of R$398.1 million under current income tax and R$5.2 million for income tax and deferred social contribution.
In the fiscal year ended December 31, 2023, the effective tax rate was negative 5.4%, which was lower than the nominal corporate tax rate of 34%, mainly due to the recognition of a tax credit by Comgás following the payment in excess of income tax and social contributions in the years 2015, 2016 and 2019.
Profit Attributable to Owners of the Company
As a result of the foregoing, profit attributable to the owners of the Company was R$1,094.4 million in the fiscal year ended December 31, 2023, compared to R$1,176.0 million in the fiscal year ended December 31, 2022. This represented a decrease after deducting profit attributable to noncontrolling interests of R$3,790.4 million and R$1,644.8 million in the fiscal year ended December 31, 2023 and the fiscal year ended December 31, 2022, respectively.
| 118 |
Results of Operations for the Fiscal Year Ended December 31, 2022 Compared to the Fiscal Year Ended December 31, 2021
Consolidated Results
The following table sets forth our consolidated statement of profit or loss for the fiscal years ended December 31, 2022 and 2021:
| For the Fiscal Year Ended | % | ||||||||
|---|---|---|---|---|---|---|---|---|---|---|
| 2022 | 2021 | ||||||||
| (in millions of reais, except percentages) | |||||||||
Consolidated statement of profit or loss |
|
|
| |||||||
Net sales | 39,322.8 | 25,865.0 | 52.0% | |||||||
Cost of sales(1) | (30,556.8 | ) | (19,864.2 | ) | 53.8% | |||||
Gross profit(1) | 8,766.0 | 6,000.8 | 46.1% | |||||||
Selling expenses(1) | (1,276.3 | ) | (723.4 | ) | 76.4% | |||||
General and administrative expenses(1) | (1,758.1 | ) | (1,572.4 | ) | 11.8% | |||||
Other income, net | 1,752.2 | 382.6 | 358.0% | |||||||
Operating expenses | (1,282.2 | ) | (1,913.2 | ) | (33.0)% | |||||
Profit before equity in earnings of investees, finance results and income taxes | 7,483.8 | 4,087.6 | 83.1% | |||||||
Interest in earnings of associates | 418.9 | 130.2 | 221.7% | |||||||
Interest in earnings of joint venture | (92.2 | ) | 4,590.6 | (102.0)% | ||||||
Finance results, net | (5,157.9 | ) | (2,557.6 | ) | 101.7% | |||||
Profit before income taxes | 2,652.6 | 6,250.9 | (57.6)% | |||||||
Income taxes – current | (1,247.0 | ) | (787.6 | ) | 58.3% | |||||
Income taxes – deferred | 1,365.4 | 1,233.2 | 10.7% | |||||||
Total income taxes | 118.4 | 445.6 | (73.4)% | |||||||
Profit for the year | 2,820.9 | 6,696.5 | (57.9)% | |||||||
Profit attributable to non-controlling interests | (1,644.8 | ) | (384.3 | ) | 328.0% | |||||
Profit attributable to owners of the Company | 1,176.0 | 6,312.1 | (81.4)% | |||||||
| (1) | In the first quarter of 2022, we revised our intangible asset policy for natural gas distribution concession contracts and reclassified the balances of amortization expense related to the concession intangible assets from selling, general and administrative expenses to cost of sales retrospectively. This reclassification does not impact regulatory margins or key indicators used by us. Our previously reported financial information has been restated for all periods presented to reflect this change in classification and presentation. |
Net Sales
We report net sales after deducting federal and state taxes assessed on gross sales (ICMS, PIS, COFINS) and IPI (a federal value-added tax assessed on our sales in the Brazilian market at rates that vary by product). Deductions from sales in the Brazilian domestic market, which are subject to these taxes, are significantly higher than our deductions from sales in export markets.
The table below presents a breakdown of our net sales for the fiscal years ended December 31, 2022 and 2021:
| For the Fiscal Year Ended | % Variation | ||||||
|---|---|---|---|---|---|---|---|---|
| 2022 | 2021 | ||||||
| (in millions of reais, except percentages) | |||||||
Rumo | 9,841.5 | 7,439.7 | 32.3% | |||||
North Operations | 7,635.2 | 4,518.9 | 39.3% | |||||
South Operations | 1,739.4 | 1,624.1 | 7.1% | |||||
Container Operations | 466.9 | 336.0 | 39.0% | |||||
Compass | 19,719.2 | 12,330.2 | 59.9% | |||||
Natural gas distribution | 19,480.7 | 11,709.9 | 66.4% | |||||
Industrial | 12,945.2 | 7,386.3 | 75.3% | |||||
Residential | 2,200.8 | 1,610.3 | 36.7% | |||||
Construction revenue | 1,217.8 | 1,020.2 | 19.4% | |||||
Commercial | 815.0 | 448.6 | 81.7% | |||||
Cogeneration | 943.9 | 637.5 | 48.1% | |||||
Automotive | 928.5 | 364.7 | 154.6% | |||||
Other | 429.5 | 242.3 | 77.3% | |||||
Electricity trading | 238.5 | 620.5 | (61.6)% | |||||
Moove | 8,980.1 | 6,112.5 | 46.9% | |||||
Finished goods | 8,094.2 | 5,088.1 | 59.1% | |||||
Base oil | 596.4 | 458.0 | 30.2% | |||||
Services | 289.4 | 566.4 | (48.9)% | |||||
Radar | 834.6 | 31.5 | 2,249.5% | |||||
Leases and sale of lands | 834.6 | 31.5 | 2,249.5% | |||||
Reconciliation |
|
|
| |||||
Cosan Corporate | 10.4 | 8.3 | 25.3% | |||||
Digital platforms(1) | 2.8 | — | n.m. | |||||
Logistics services(1) | 7.6 | — | n.m. | |||||
Segment elimination | (63.0 | ) | (57.4 | ) | 9.8% | |||
Net sales | 39,322.8 | 25,865.0 | 52.0% | |||||
n.m. = not meaningful.
| (1) | Beginning in the fiscal year ended December 31, 2023, we reclassified our “digital platforms” and “logistics services” line items in our statements of profit or loss from the Radar segment to Cosan Corporate. |
The change in the various components consists of the following:
Rumo
Rumo’s net sales increased by R$2,401.8 million, or 32.3%, to R$9,841.5 million from R$7,439.7 million in the fiscal year ended December 31, 2022 compared to the year ended December 31, 2021, mainly due to an increase of 17% in tariffs and an increase of 17% in transported volume (which, combined, lead to an increase in net sales of R$2,287.0 million). The increase in tariffs in the year ended December 31, 2022 was driven by (i) fuel price adjustments and (ii) industrial cargo yields which usually have long-term agreements with adjustments by inflation and diesel prices. The increase in volume transported in the year ended December 31, 2022 was driven by higher demand for transportation services due to an increase in the production volumes of corn across Brazil, which led to a 72.8% increase in the volume of corn transported by Rumo in the year ended December 31, 2022 compared to the year ended December 31, 2021.
Compass
Compass’s net sales in the fiscal year ended December 31, 2022 amounted to R$19,719.2 million, representing the results of its activities of natural gas distribution and electricity trading. This represented an increase of 59.9%, or R$7,803.6 million, as compared to net sales of R$12,330.2 million in the fiscal year ended December 31, 2021. This increase was primarily due to (1) the acquisition and consolidation of the results of Sulgás in January 2022, and of the results of Commit in July 2022, resulting in a combined increase in net sales of R$2,504.8 million, and (2) the readjustment of tariff tables by the Resolution No. 1,274 of ARSESP, with an average increase of 14.5% in the industrial segment, 16.1% (tariff applied to gas stations) in the price of natural gas vehicles, or “CNG,” and 15.9% for the cogeneration and refrigeration segment, which resulted in an increase in net sales of R$5,704.4 million. This increase in net sales was offset by a R$381.9 million decrease in trading volume in 2022 compared to 2021.
Moove
The net revenue of the lubricants business was R$8,980.1 million in the fiscal year ended December 31, 2022, an increase of R$2,867.6 million, or 46.9%, compared to net revenue of R$6,112.5 million in the fiscal year ended December 31, 2021, primarily due to (1) the acquisition and consolidation of the results of PetroChoice and Tirreno beginning in May 2022, which increased net sales by R$1,368.8 million; and (2) the increase of 35.0% in volume of lubricants and base oils sold, which accounts for the remainder of the increase.
Radar
The net sales of Radar were R$834.6 million in the fiscal year ended December 31, 2022, compared to net sales of R$31.5 million in the fiscal year ended December 31, 2021, primarily due to (1) the acquisition of the land management companies Tellus, Janus, Gamiovapar and Duguetiapar in the last quarter of 2022, which since the acquisition date have contributed in an increase in revenue of R$576.9 million; (2) the consolidation of the results of operations of Radar reflected throughout the year ended December 31, 2022 (in 2021, consolidation started only in November 2021) (result in an increase in net sales of R$226.3 million); and (3) the reclassification in the beginning of 2022 of investments in Payly Soluções de Pagamentos S.A., or “Payly,” and Trizy from the Corporate segment to the Radar segment, which increased the net sales of the Radar segment by R$10.4 million (R$2.8 million and R$7.6 million, relating to Payly (digital platform) and Trizy (logistic services), respectively).
Cosan Corporate
Cosan Corporate did not have net sales in the fiscal year ended December 31, 2022, compared to net sales of R$8.3 million in the fiscal year ended December 31, 2021. This decrease was due to the reclassification in the beginning of 2022 of investments relating to Payly and Trizy, respectively, from Cosan Corporate to the Radar segment.
Cost of Sales
| For the Fiscal Year Ended | % | ||||||
|---|---|---|---|---|---|---|---|---|
| 2022 | 2021 | ||||||
| (in millions of reais, except percentages) | |||||||
Rumo | (6,695.1 | ) | (5,352.0 | ) | 25.1% | |||
Compass(1) | (16,364.8 | ) | (9,755.4 | ) | 67.8% | |||
Moove | (6,990.2 | ) | (4,808.7 | ) | 45.4% | |||
Radar | (560.3 | ) | — | n.m. | ||||
Reconciliation |
|
|
| |||||
Cosan Corporate | (9.4 | ) | (5.2 | ) | n.m. | |||
Segment elimination | 63.0 | 57.1 | 10.3% | |||||
Cost of sales | (30,556.8 | ) | (19,864.2 | ) | 53.8% | |||
n.m. = not meaningful.
| (1) | In the first quarter of 2022, we revised our intangible asset policy for natural gas distribution concession contracts and reclassified the balances of amortization expense related to the concession intangible assets from selling, general and administrative expenses to cost of sales retrospectively. This reclassification does not impact regulatory margins or key indicators used by us. Our previously reported financial information has been restated for all periods presented to reflect this change in classification and presentation. |
Total cost of sales increased by R$10,692.6 million, or 53.8%, to R$30,556.8 million during the fiscal year ended December 31, 2022, from R$19,864.2 million during the fiscal year ended December 31, 2021, due to the factors described below.
Rumo
The cost of sales of the logistics services in the fiscal year ended December 31, 2021 increased by R$1,343.1 million, or 25.1%, to R$6,695.1 million in the fiscal year ended December 31, 2022, from R$5,352.0 million in the previous year. This increase in cost of sales of logistic services was primarily due to (1) a 17% increase in transported volume, coupled with a 42% increase in fuel prices which was partially offset by a 6% energy efficiency gain, which combined resulted in an increase in cost of sales of R$786.0 million, and (2) an increase in logistics solution costs of R$183 million, or 52.7%, driven by rising road freight and diesel prices. The cost of services accounted for 68.0% of net sales from services in the fiscal year ended December 31, 2022 as compared to 71.9% for the fiscal year ended December 31, 2021.
Compass
Compass’s costs of sales, which corresponds to the cost of gas, transportation, construction activity on the gas distribution infrastructure under concession and electricity trading, totaled R$16,364.8 million in the fiscal year ended December 31, 2022, a 67.8%, or R$6,609.4 million, increase in comparison with R$9,755.4 million in the fiscal year ended December 31, 2021. This increase was driven by (1) the acquisition and consolidation of the results of Sulgás beginning in January 2022, and of the results of Commit beginning in July 2022, which increased cost of sales by R$2,268.1 million; and (2) the increase in gas prices discussed under “—Net Sales,” which increased cost of sales by R$5,210.5 million. The cost increase is consistent with the segment’s revenue growth. This increase in costs of sales and services was offset by a R$742.8 million decrease in trading volume in 2022 compared to 2021.
Moove
Cost of sales of lubricants totaled R$6,990.2 million in the fiscal year ended December 31, 2022, an increase of 45.4%, or R$2,181.5 million, compared to R$4,808.6 million in the fiscal year ended December 31, 2021, mainly due to (1) the acquisition and consolidation of the results of PetroChoice and Tirreno beginning in May 2022, which increased the cost of sales by R$1,274.9 million; and (2) the general increase in sales of Moove’s core businesses discussed under “—Net Sales,” which accounts for the remainder of the increase.
Radar
The cost of sales of Radar in the fiscal year ended December 31, 2022 increased by R$560.3 million to R$560.3 million in the fiscal year ended December 31, 2022, from nil in the previous year primarily due to (1) the acquisition of an additional stake in each of the land management companies Tellus, Janus, Gamiovapar and Duguetiapar in September 2022 that impacted Radar’s cost of sales in an amount of R$543.9 million; (2) the consolidation of Radar’s results, reflected throughout the year ended December 31, 2022 (in 2021, consolidation started only in November 2021) which increased cost of sales by R$16.4 million; and (3) the reclassification in the beginning of 2022 of investments in Payly and Trizy from the Cosan Corporate segment to the Radar segment, which increased the cost of sales in the Radar segment by R$9.4 million (R$1.0 million and R$8.4 million, relating to Payly and Trizy, respectively).
Cosan Corporate
The cost of sales of Cosan Corporate in the fiscal year ended December 31, 2022 was R$9.4 million compared to R$5.2 million in the fiscal year ended December 31, 2021, with the difference being due to the reclassification of Payly and Trizy from Cosan Corporate to the Radar segment.
Selling Expenses
Selling expenses are primarily related to transportation costs, including freight and shipping costs for lubricant sold in Brazil and exported. Moove’s lubricant marketing expenses, as well as storage expenses, are also included as selling expenses.
| For the Fiscal Year Ended December 31, | % | |||||
|---|---|---|---|---|---|---|---|
| 2022 | 2021 | |||||
| (in millions of reais, except percentages) | ||||||
Rumo | (30.6 | ) | (39.0 | ) | (21.5)% | ||
Compass(1) | (163.3 | ) | (125.4 | ) | 30.2% | ||
Moove | (1,072.5 | ) | (551.5 | ) | 94.5% | ||
Reconciliation |
|
|
| ||||
Cosan Corporate | (9.9 | ) | (7.5 | ) | 32.0% | ||
Selling expenses(1) | (1,276.3 | ) | (723.4 | ) | 76.4% | ||
n.m. = not meaningful.
| (1) | In the first quarter of 2022, we revised our intangible asset policy for natural gas distribution concession contracts and reclassified the balances of amortization expense related to the concession intangible assets from selling, general and administrative expenses to cost of sales retrospectively. This reclassification does not impact regulatory margins or key indicators used by us. Our previously reported financial information has been restated for all periods presented to reflect this change in classification and presentation. |
Selling expenses increased by R$552.9 million, or 76.4%, to R$1,276.3 million during the fiscal year ended December 31, 2022 from R$723.4 million during the fiscal year ended December 31, 2021, due to the factors described below.
Rumo
Selling expenses decreased by R$8.4 million, or 21.5% to R$30.6 million in the fiscal year ended December 31, 2022 compared to R$39.0 million in the fiscal year ended December 31, 2021. This decrease was primarily due to a decrease in expenses with third-party services to R$0.3 million in the fiscal year ended December 31, 2022 from R$11.2 million in the fiscal year ended December 31, 2021. This decrease in selling expenses was offset by an increase in employee expenses in the amount of R$1.9 million mainly due to the readjustment of wages paid.
Compass
Selling expenses increased by R$37.8 million, or 30.2%, to R$163.3 million during the fiscal year ended December 31, 2022, from an expense of R$125.4 million during the fiscal year ended December 31, 2021. This increase was primarily due to (i) the effect of the acquisition and consolidation of the selling expenses of Sulgás beginning in January 2022 in an amount of R$2.5 million, (ii) the consolidation of results of Commit beginning in July 2022 which led to an R$18.3 million increase in selling expenses and (iii) an increase of R$14.3 million in provisions for doubtful accounts due to the effect of the reversal of a provision for doubtful accounts in 2021 after the reduction in the number of defaults due to the adverse macroeconomic conditions as a result of by the COVID-19 pandemic as restrictions were lifted and the macroeconomic environment improved in 2022.
Moove
Selling expenses increased by R$521.0 million, or 94.5%, to R$1,072.5 million in the fiscal year ended December 31, 2022, as compared to R$551.5 million in the fiscal year ended December 31, 2021. This increase was mainly due to the acquisition and consolidation of the selling expenses of PetroChoice which increased selling expenses by R$488.2 million and Tirreno which increased selling expenses by R$12.5 million beginning in May 2022.
Cosan Corporate
Selling expenses decreased by R$2.4 million in the fiscal year ended December 31, 2022, from selling expenses of R$7.5 million in the fiscal year ended December 31, 2021, due to the reclassification of selling expenses in the beginning of 2022 from Cosan Corporate to the Radar segment.
General and Administrative Expenses
| For the Fiscal Year Ended December 31, | % | |||||
|---|---|---|---|---|---|---|---|
| 2022 | 2021 | |||||
| (in millions of reais, except percentages) | ||||||
Rumo | (468.6 | ) | (472.7 | ) | (0.9)% | ||
Compass(1) | (563.5 | ) | (502.0 | ) | 12.3% | ||
Moove | (347.6 | ) | (269.8 | ) | 28.8% | ||
Radar | (45.5 | ) | (6.5 | ) | n.m. | ||
Reconciliation |
|
|
| ||||
Cosan Corporate | (332.9 | ) | (321.3 | ) | 3.6% | ||
General and administrative expenses(1) | (1,758.1 | ) | (1,572.4 | ) | 11.8% | ||
n.m. = not meaningful
| (1) | In the first quarter of 2022, we revised our intangible asset policy for natural gas distribution concession contracts and reclassified the balances of amortization expense related to the concession intangible assets from selling, general and administrative expenses to cost of sales retrospectively. This reclassification does not impact regulatory margins or key indicators used by us. Our previously reported financial information has been restated for all periods presented to reflect this change in classification and presentation. |
General and administrative expenses consist of salaries and benefits paid to employees, taxes, expenses related to third-party services, rentals and other expenses. Our total general and administrative expenses increased by 11.8% to R$1,758.1 million during the fiscal year ended December 31, 2022, from R$1,572.4 million during the fiscal year ended December 31, 2021, due to the factors described below.
Rumo
General and administrative expenses totaled R$468.6 million in the fiscal year ended December 31, 2022, a decrease of 0.9%, or R$4.1 million, from R$472.7 million in the fiscal year ended December 31, 2021.
Compass
General and administrative expenses totaled R$563.5 million in the fiscal year ended December 31, 2022, an increase of R$61.5 million, or 12.3%, compared to R$502.0 million in the fiscal year ended December 31, 2021. This increase was mainly due to (1) the acquisition and consolidation of the results of Sulgás beginning in January 2022, and of the results of Commit beginning in July 2022, which increased general and administrative expenses in the Compass segment by R$116.0 million; (2) nonrecurring expenses related to the integration of new businesses and projects in development which increased general and administrative expenses by R$83.6 million; and (3) an increase of R$96.3 million due to an increase of numbers of employees and an increase in wages.
Moove
General and administrative expenses totaled R$347.6 million in the fiscal year ended December 31, 2022, an increase of R$77.8 million, or 28.8% when compared to the expense of R$269.8 million in the fiscal year ended December 31, 2021, primarily due to (1) the acquisition and consolidation of the results of PetroChoice and Tirreno beginning in May 2022, which increased Moove’s general and administrative expenses by R$6.0 million, (2) an increase in nonrecurring expenses related to the integration of new businesses which increased general and administrative expenses by R$45.6 million, and (3) an increase of R$29.4 million in employee expenses.
Radar
General and administrative expenses totaled R$45.5 million in the fiscal year ended December 31, 2022, an increase of R$39.0 million when compared to expenses of R$6.5 million in the fiscal year ended December 31, 2021, primarily due to (1) the acquisition of the land management companies Tellus, Janus, Gamiovapar and Duguetiapar in the last quarter of 2022, which increased general and administrative expenses by R$4.8 million, (2) the consolidation of the result of Radar reflected throughout the year ended December 31, 2022 (consolidation started in November 2021) which increased general and administrative expenses by R$34.2 million, (3) the reclassification in the beginning of 2022 of investments in Payly and Trizy from Cosan Corporate to the Radar segment, which increased general and administrative expenses by R$9.9 million and R$11.6 million, relating to Payly and Trizy, respectively, (4) the acquisition of TUP Porto São Luís S.A. in the first quarter of 2022, which increased general and administrative expenses R$9.5 million, and (5) an increase in employee expenses in the amount of R$23.2 million mainly due to the transfer of some employees from Cosan Corporate to Radar.
Cosan Corporate
General and administrative expenses totaled R$332.9 million in the fiscal year ended December 31, 2022, a decrease of R$11.6 million, or 3.6% when compared to the expense of R$321.3 million in the fiscal year ended December 31, 2021, primarily due to (i) the reclassification in the beginning of 2022 of investments in the amount of R$11.6 million and R$9.9 million, relating to Payly and Trizy, respectively, from Cosan Corporate to the Radar segment, (ii) a decrease in employee expenses in the amount of R$23.2 million mainly due to the transfer of some employees from Cosan Corporate to Radar and (iii) a decrease of R$10.7 million due to the closing of our office in New York.
Other Income, Net
Other income, net increased from R$382.6 million in the fiscal year ended December 31, 2021 to R$1,752.2 million in the fiscal year ended December 31, 2022. This increase was mainly due to (1) the adjustment in fair value of our land properties, totaling R$1,311.7 million; and (2) Rumo’s R$955.6 million capital gain arising from the sale of its shareholding interest in EPSA. These effects were partially offset by (1) the termination of a confidential arbitration proceeding on November 22, 2022, which resulted from the acquisition by Rumo of all the shares of Farovia S.A. which resulted in a payment by Rumo of R$396.8 million; and (2) the R$316.9 million difference between bargain purchase gains in the acquisition of Radar in 2021 and the acquisition of Tellus, Janus, Gamiovapar and Duguetiapar in 2022.
Interest in Earnings of Associates
Interest in earnings of associates includes our 20% of interest in EPSA, interest in eight distributors acquired by Compass and other investments. Equity in earnings of associates increased to R$468.7 million in the fiscal year ended December 31, 2022 from R$130.2 million in the fiscal year ended December 31, 2021, mainly due to the (1) acquisition by our subsidiary Compass of minority interests in eight distributors in Brazil, which resulted in an impact in the amount of R$141.9 million; (2) sale by Rumo of part of its controlling interest in EPSA which resulted in an impact in the amount of R$6.2 million; and (3) an increase in our interests in Tellus and Janus during the year partially offset by the acquisition of control of these companies in the fourth quarter of the year, with an impact of R$190.4 million.
Interest in Earnings of the Joint Venture
Interest in earnings of the joint venture includes our 33.63% interests in Raízen S.A. Equity income decreased to an expense of R$92.2 million in the fiscal year ended December 31, 2022 from an income of R$4,590.6 million in the fiscal year ended December 31, 2021. This variation is mainly due (i) to the effects of the 2021 initial public offering, from which there was a gain of R$2,929.9 million, (ii) the exercise by Hédera Investimentos e Participações S.A. of a subscription warrant on August 10, 2021 that generated a capital increase with an impact of R$1,043.3 million, and (iii) a decrease in Raízen’s results of operations in the year ended December 31, 2022 compared to the year ended December 31, 2021. For more information see “Information on the Company—E. Supplemental Information About Joint Venture.”
Finance Results, Net
Finance results, net in the fiscal year ended December 31, 2022 totaled a net financial expense of R$5,157.9 million compared with a net financial expense of R$2,557.6 million in the fiscal year ended December 31, 2021, an increase of R$2,600.4 million, or 101.7%.
For a better understanding of our finance results, the following table details our cost of debt:
| For the Fiscal Year Ended December 31, | % Variation | ||||||||
| 2022(1) | 2021(1) | ||||||||
| (in millions of reais, except percentages) | |||||||||
Cost of gross debt |
|
|
| ||||||
Interest on debt | (4,464.8 | ) | (3,162.9 | ) | 41.2% | ||||
Monetary and exchange rate variation | 549.7 | (1,069.2 | ) | n.m. | |||||
Derivatives and fair value measurement | (4,203.1 | ) | 2,193.9 | n.m. | |||||
Amortization of borrowing costs | (244.3 | ) | (341.0 | ) | (28.4)% | ||||
Guarantees and warranties | (41.5 | ) | (52.1 | ) | (20.4)% | ||||
| (8,404.0 | ) | (2,431.3 | ) | 245.7% | ||||
Income from financial investments and exchange rate in cash and cash equivalents | 1,788.5 | 600.9 | 197.6% | ||||||
Changes in fair value of investment in listed entities | 3,385.0 | — | n.m. | ||||||
Cost of debt, net | (3,230.5 | ) | (1,830.4 | ) | 76.5% | ||||
Other charges and monetary variations |
|
|
| ||||||
Interest on other receivables | 355.6 | 411.4 | (13.6)% | ||||||
Monetary variation of other financial assets | (1.4 | ) | (0.4 | ) | 250.0% | ||||
Interest on other payables | (454.4 | ) | (424.9 | ) | 6.9% | ||||
Interest on lease liabilities | (374.2 | ) | (408.0 | ) | (8.3)% | ||||
Interest on shareholders’ equity | 33.1 | (8.3 | ) | (498.8)% | |||||
Interest on contingencies and contracts | (593.1 | ) | (315.6 | ) | 87.9% | ||||
Bank charges and other | (145.2 | ) | (97.0 | ) | 49.7% | ||||
Foreign exchange, net | (747.8 | ) | 115.6 | (746.9)% | |||||
| (1,927.4 | ) | (727.2 | ) | 165.1% | ||||
Finance results, net | (5,157.9 | ) | (2,557.6 | ) | 101.7% | ||||
Reconciliation |
|
|
| ||||||
Finance expense | (4,706.5 | ) | (2,527.5 | ) | 86.21% | ||||
Finance income | 5,777.5 | 1,258.4 | 359.10% | ||||||
Foreign exchange losses, net | 260.8 | (1,099.4 | ) | (123.71)% | |||||
Derivatives | (6,489.7 | ) | (189.0) | n.m. | |||||
| (5,157.9 | ) | (2,557.6 | ) | 101.67% | ||||
n.m. = not meaningful.
| (1) | Following the Merger, Cosan S.A. began consolidating the results of Cosan Logística from March 1, 2021. For the financial information of Cosan S.A. as of and for the year ended December 31, 2021 we used the predecessor accounting method. See “Presentation of Financial and Other Information—Individual and Consolidated Financial Information.” |
Cost of gross debt. The total cost of gross debt (which includes interest expenses, exchange variation and derivative gain or loss) increased by R$5,972.8 million, or 245.7%. This increase was primarily due to (1) the increase of the average SELIC interest rate and the resulting effect over CDI rate, which increased to 12.4% for the year ended December 31, 2022 from 4.4% for the year ended December 31, 2021, (2) an increase in loans, borrowings and debentures (current and non-current) from R$45,659.0 million on December 31, 2021 to R$52,987.2 million on December 31, 2022, (3) an increase of R$2,124.0 million due to expenses associated with the derivatives used in the Vale transaction and (4) depreciation of the U.S. dollar relative to the real, to R$5.165 per U.S.$1.00 on average during the year ended December 31, 2022 in comparison to R$5.396 per U.S.$1.00 on average during the year ended December 31, 2021.
Income from financial investments and exchange rate in cash and cash equivalents. Income from financial investments and exchange rate in cash and cash equivalents amounted to R$1,788.5 million in the fiscal year ended December 31, 2022, an increase of 197.64% as compared to interest income of R$600.9 million in the fiscal year ended December 31, 2021. This increase was primarily due to the increase of the average CDI rate to 12.4% for the year ended December 31, 2022 from 4.4% for the year ended December 31, 2021.
Financial investment on listed entities. Income from financial investment on listed entities amounted to R$3,385.0 in the fiscal year ended December 31, 2022. This amount is related to the gain from the adjustment at fair value based on the market value of Vale’s shares.
Other charges and monetary variations. Other charges and monetary variations increased by R$1,200.2 million or 165.0%, from an expense of R$727.2 million in the fiscal year ended December 31, 2021, to an expense of R$1,927.4 million in the fiscal year ended December 31, 2022. This increase was due to (1) foreign exchange loss in the amount of R$863.5 million due to an effect of the depreciation of the U.S. dollar relative to the real, to R$5.165 per U.S.$1.00 on average during the year ended December 31, 2022 in comparison to R$5.396 per U.S.$1.00 on average during the year ended December 31, 2021, and (2) the recognition of interest on contingencies and contracts in the amount of R$277.5 million referring to the reclassification of certain legal proceedings.
Total Income Taxes
Income tax expenses amounted to an income of R$118.4 million for the fiscal year ended December 31, 2022, compared to an income of R$445.6 million in the fiscal year ended December 31, 2021. This decrease was primarily due to the impact in interest on investee’s earnings in 2021 caused by (i) the initial public offering of Raízen, and (ii) the exercise of subscription warrants by Hédera Investimentos e Participações S.A. on August 10, 2021, resulting in a capital increase of Raízen.
In the fiscal year ended December 31, 2022, the effective tax rate was 4.38%, which was lower than the nominal corporate tax rate of 34%, mainly due to the recognition of a tax credit by Comgás following the payment in excess of income tax and social contributions in the years 2015, 2016 and 2019, as a result of the application of a higher rate to the calculation of the ICMS taxable base (15.6% instead of 12.0%).
Profit Attributable to Owners of the Company
As a result of the foregoing, profit attributable to the owners of the Company was R$1,176.0 million in the fiscal year ended December 31, 2022, compared to R$6,312.1 million in the fiscal year ended December 31, 2021. This represented a decrease after deducting profit attributable to noncontrolling interests of R$1.644.8 million and R$384.3 million in the fiscal year ended December 31, 2022 and the fiscal year ended December 31, 2021, respectively.
Overview
Our financial condition and liquidity are influenced by several factors, including:
- our ability to generate cash flow from our operations;
- the level of our outstanding indebtedness and related accrued interest, which affects our net financial expenses;
- prevailing Brazilian and international interest rates, which affect our debt service requirements;
- exchange rate variations, which can affect both our foreign currency denominated debt and our U.S. dollar-denominated supply agreements; and
- credit ratings, including factors that may materially influence credit ratings, implications of potential changes in ratings and management’s expectations; and covenant compliance, including the implications of a breach of financial or other covenants and our capacity for additional borrowing under its covenants.
Our cash needs have traditionally consisted of working capital requirements, servicing of our indebtedness, capital expenditures related to investments in operations, maintenance and expansion of plant facilities, as well as acquisitions. Our sources of liquidity have traditionally consisted of cash flows from our operations and short- and long-term borrowings. We have financed acquisitions through seller financing, third-party financing or capital contributions by our shareholders. We believe our current working capital is sufficient for our present requirements and would expect to meet any potential shortfalls in our working capital needs through short- and long-term borrowings, capital contributions by our shareholders, or offerings of debt or equity securities in the domestic and international capital markets.
In the fiscal years ended December 31, 2023, 2022 and 2021, the cash flow used in investing activities was funded mainly by increased borrowing and also by the operational cash flows of our subsidiaries. As of December 31, 2023, our consolidated cash and cash equivalents (including marketable securities – current and non-current) amounted to R$18,162.4 million, compared to R$35,401 million as of December 31, 2022 and R$20,562.1 million as of December 31, 2021.
On December 31, 2023, Cosan S.A. had positive consolidated working capital (total current assets less total current liabilities) of R$12,451.4 million and a profit for the year of R$4,026.4 million.
Cash Flows
The following table sets forth certain of our cash flow data for the periods indicated:
Consolidated | For the Fiscal Year Ended December 31, | |||||
|---|---|---|---|---|---|---|
| 2023 | 2022(1) | 2021 | |||
| (in R$ millions, except percentages) | |||||
Cash flows generated from operating activities | 10,276.4 | 9,972.2 | 5,147.2 | |||
Cash flows used in investing activities | (4,303.1 | ) | (20,726.6 | ) | (5,446.8 | ) |
Cash flows generated from financing activities | (4,516.6 | ) | 8,286.3 | 2,319.4 | ||
| (1) | Following the Merger, Cosan S.A. began consolidating the results of Cosan Logística from March 1, 2021. For the financial information of Cosan S.A. as of and for the year ended December 31, 2021 we used the predecessor accounting method. See “Presentation of Financial and Other Information—Individual and Consolidated Financial Information.” |
The change in the various components consists of the following:
Cash Flows Generated from Operating Activities
The net cash flows generated from operating activities in the fiscal year ended December 31, 2023 amounted to R$10,276.4 million, compared to R$9,972.2 million in the fiscal year ended December 31, 2022, representing an increase of R$304.2 million, which was primarily attributable to (i) R$9,379.5 million in net interest and foreign exchange in the year ended December 31, 2023, compared to R$6,521.9 million in the year ended December 31, 2022, representing an increase of R$2,857.6 million, or 43.8%, mainly attributable to the effect of the fair value adjustment of the interest acquired in Vale, and (ii) depreciation and amortization of R$3,364.9 million in the fiscal year ended December 31, 2023, compared to R$3,014.5 million in the fiscal year ended December 31, 2022, representing an increase of R$350.5 million, or 11.6%, mainly due to acquisitions carried out in the period. These effects were partially offset by (i) interest in earnings of the associates and joint venture in the amount of R$2,046.3 million in the fiscal year ended December 31, 2023, and (ii) an increase of R$1,719.6 million from a profit of R$326.7 million in the fiscal year ended December 31, 2022, mainly due to the recognition of PIS and COFINS tax credits in an amount of R$1,465.6 million in connection with Supplementary Laws Nos. 192 and 194 (which reduced the rates of PIS and COFINS applicable to certain products).
Cash Flows Used In Investing Activities
Net cash flows used in investing activities amounted to R$4,303.1 million in the fiscal year ended December 31, 2023, compared to net cash flows used in investing activities of R$20,745.8 million in the fiscal year ended December 31, 2022, representing a decrease of R$16,423.5 million, which was primarily attributable to (i) costs associated with acquisitions that we carried out in the period, net of acquired cash, in the amount of R$4,586.1 million, (ii) the purchase of marketable securities in the amount of R$501.0 million in the year ended December 31, 2023 compared to R$13,911.7 million in the year ended December 31, 2022, representing a decrease of R$13,403.8 million, and (iii) the receipt of dividends declared by Vale S.A. in the amount of R$1,305.4 million in the year ended December 31, 2023, as compared to nil for the year ended December 31, 2022. These effects were partially offset by (i) the acquisition of property, plant and equipment, intangible assets and contract assets in the amount of R$6,268.0 million in year ended December 31, 2023 compared to R$4,531.4 million for the year ended December 31, 2022, representing a R$1,736.6 million, or 38.3%, increase, mainly due to ongoing construction in the Rumo and Compass segments, and (iii) proceeds from the sale of investments in the amount of R$694.0 million in the year ended December 31, 2023 compared to R$1,969.8 million in the year ended December 31, 2022, representing a decrease of R$1,324.0 million.
Cash Flows Generated From (Used in) Financing Activities
Net cash flows used in financing activities were R$4,516.6 million in the fiscal year ended December 31, 2023, compared to net cash flows generated in financing activities of R$8,305.5 million in the fiscal year ended December 31, 2022, representing a decrease of R$12,802.8 million, which was primarily attributable to (i) loans, borrowings and debentures in the amount of R$12,785.6 million incurred in the fiscal year ended December 31, 2023 compared to R$23,887.0 million incurred in the fiscal year ended December 31, 2022, representing a decrease of R$11,101.3 million, (ii) a decrease of R$8,151.1 million in the acquisition of non-controlling shareholders’ shares, and (iii) the payment of dividends in the amount of R$2,582.4 million in the year ended December 31, 2023, compared to R$1,908.2 in the year ended December 31, 2022. This variation was partially offset by a decrease of R$7,223.6 million in the repayment of principal on loans, borrowings and debentures, to R$8,054.8 million in the year ended December 31, 2023 compared to R$15,278.4 million for the year ended December 31, 2022.
Indebtedness
As of December 31, 2023, our outstanding debt (represented by current and non-current Loans, borrowings and debentures) totaled R$56,904.7 million, of which R$4,882.4 million was short-term debt. Our debt consisted of R$31,307.2 million in local currency-denominated debt and R$25,510.0 million in foreign currency-denominated debt.
Our total debt (represented by current and non-current loans, borrowings and debentures) of R$56,904.7 million as of December 31, 2023 increased by 7.2% as compared to our total debt of R$52,987.2 million as of December 31, 2022, primarily due to issuance by Cosan Luxembourg of its senior notes due 2030 in the total amount of R$2,642.0 million. Our U.S. dollar-denominated debt as of December 31, 2023 represented 34.6%, our euro-denominated debt represented 6.5% and our yen-denominated debt represented 3.9% of our total indebtedness. Our secured debt as of December 31, 2023 represented 26.7% of our total indebtedness, mostly in the form of land mortgage deeds and the assignment/pledge of credit rights, machinery and equipment.
Certain of our long-term debt agreements require us or certain of our subsidiaries, as applicable, to comply with certain financial covenants, including our U.S.$600 million 7.250% senior notes due 2031, U.S.$550 million 7.500% senior notes due 2030, our U.S.$400 million 7.000% senior notes due 2027, our U.S.$750 million 5.500% senior notes due 2029, Rumo’s U.S.$500 million 5.250% senior notes due 2028, Rumo’s U.S.$500 million 4.200% sustainability-linked notes due 2032, our U.S.$200 million and U.S.$300 million 8.25% perpetual notes and our U.S.$121 million 5.00% notes due 2023, which limit the ability of our subsidiaries to, among other things, enter into certain transactions with shareholders or affiliates, make certain restricted payments (including, in certain circumstances, payments of dividends), engage in a merger, sale or consolidation transactions and create liens.
We and our subsidiaries are subject to certain restrictive financial covenants set forth in existing loans and financing agreements. As of December 31, 2023 and the date of this current report, we and our subsidiaries were in compliance with our debt covenants.
The principal financing activities for the fiscal year ended December 31, 2023 are described below:
- On January 31, 2023, Rumo entered into two separate loan agreements with Banco do Brasil in an aggregate principal amount of down R$12.7 million. Interest accrues at a rate equal to the IPCA rate plus 1.37% per annum for the tranche due on December 3, 2040 and IPCA rate plus 1.75% per annum for the tranche due on April 1, 2041. The proceeds were used to fund capital expenditures.
- On March 9, 2023, Rumo drew down R$36.2 million under a BNDES FINEM financing. Interest accrues at a rate equal to the IPCA rate plus 4.46% per annum. The principal on this financing will be repaid in 101 installments. The loan matures on July 15, 2031. The proceeds were used to fund capital expenditures.
- On March 15, 2023, Raízen entered into a EPP agreement with Rabobank International S/A in an aggregate principal amount of U.S.$100 million. Interest accrues at a fixed rate equal to 6.13% per annum, due on March 23, 2029. The proceeds were used for general corporate purposes.
- On March 28, 2023, Comgás drew down R$300 million under a BNDES FINEM (Project IX) financing. Interest accrues at a rate equal to the IPCA rate plus 5.74% per annum. The principal on this financing will be repaid in 138 installments. The maturity date is December 15, 2036. The proceeds were used to fund capital expenditures.
- On March 29, 2023, Raízen entered into an export pre-payment agreement with BNP Paribas in an aggregate principal amount of U.S.$125 million. Interest accrues at a rate equal to SOFR plus 2.52% per annum, due on March 27, 2029. The proceeds were used for general corporate purposes.
- On March 29, 2023, Raízen entered into an export pre-payment agreement with Bank of America Merrill Lynch in an aggregate principal amount of U.S.$70 million. Interest accrues at a fixed rate equal to SOFR plus 2.30% per annum, due on September 29, 2028. The proceeds were used for general corporate purposes.
- On March 31, 2023, Comgás entered into a loan agreement with Scotiabank in an aggregate principal amount of U.S.$150 million (R$762.1 million), which was disbursed in full on May 30, 2023. The loan agreement matures on May 29, 2026. Interest accrues at a fixed rate equal to 4.0418% per annum. Part of the proceeds was used to repay a U.S.$75 million (R$381.0 million) loan and it is expected that the remaining proceeds will be used for general corporate purposes.
- On March 31, 2023, Raízen entered into an export pre-payment agreement with Credit Agricole Corporate and Investment Bank in an aggregate principal amount of U.S.$50 million. Interest accrues at a fixed rate equal to 5.25% per annum, due on March 29, 2030. The proceeds were used for general corporate purposes.
- On April 3, 2023, Raízen entered into two different loan agreements with Banco Bradesco in an aggregate principal amount of R$2 billion. Interest accrues at a fixed rate equal to the 14.09% per annum for both agreements, due on March 18, 2024. The proceeds were used for general corporate purposes.
- On April 28, 2023, Cosan S.A. completed the issuance of simple, nonconvertible, unsecured debentures in a single series, issued as part of its fifth issuance of debentures, in an aggregate principal amount of R$1 billion. Interest accrues at a rate equal to DI plus 2.4% per annum and the debentures mature in April 2028, with principal due upon maturity.
- On June 27, 2023, we issued U.S.$550.0 million in aggregate principal amount of notes. Delivery of the notes was made to investors on June 27, 2023. The net proceeds from the issuance of the notes were used to pay the tender price of our senior notes due 2027 tendered in connection with the tender offer for such notes which expired in July 2023, as described under “Information on the Company—A. History and Development of the Company—History—Recent History.” The remaining proceeds were used for general corporate purposes.
- On June 29, 2023, Rumo drew down an amount of R$347.3 million under a financing agreement with BNDES FINEM it had entered into in 2020 from BNDES FINEM. Interest accrues at the TJLP rate plus 2.10% per year. The maturity date is December 15, 2029. The funds were used to finance capital expenditures.
- On June 30, 2023, Cosan S.A. completed the issuance of simple, nonconvertible, unsecured debentures in a single series, issued as part of its sixth issuance of debentures, in an aggregate principal amount of R$1 billion. Interest accrues at a rate equal to DI plus 2.4% per annum and the debentures mature in June 2028, with principal due upon maturity. We refer to this issuance of debentures as the “Sixth Issuance of Debentures.”
- On July 7, 2023, Rumo entered into an export credit note (nota de crédito à exportação) with Citibank in an aggregate principal amount of R$725.1 million. Interest accrues at the SOFR rate plus 1.30% per year, and the maturity date is January 7, 2025. The funds were used to finance Rumo Malha Norte’s corporate restructuring.
- On July 27, 2023, Raízen entered into a foreign exchange advance agreement (adiantamento sobre contrato de câmbio) with Crédit Agricole in an aggregate principal amount of U.S.$100 million. Interest accrues at a fixed rate of 6.77% per year, and the maturity date is March 22, 2024. The funds were used to finance capital expenditures.
- On July 31, 2023, Raízen entered into a rural credit (crédito rural) agreement with Banco Bradesco in an aggregate principal amount of R$1.000 million. Interest accrues at a fixed rate of 11.77% per year, and the maturity date is March 22, 2024. The funds were used to finance capital expenditures.
- On August 15, 2023, Rumo completed the issuance of simple, nonconvertible, unsecured debentures in two series, in an aggregate principal amount of R$1.5 billion. The first series accounts for R$750 million in aggregate principal amount and the second series for R$750 million. Interest accrues at the IPCA rate plus 5.76% per year for the first series, which matures on August 15, 2029 and at the IPCA rate plus 6.183% per year for the second series, which matures on May 15, 2033. The funds were used to finance capital expenditures.
- On August 16, 2023, Raízen entered into a rural credit (crédito rural) agreement with Banco Santander in an aggregate principal amount of R$100 million. Interest accrues at a rate equivalent to 103% of the CDI rate per year, and the maturity date is August 9, 2024. The funds were used to finance capital expenditures.
- On August 17, 2023, Raízen entered into an export prepayment agreement with Banco Sumitomo in an aggregate principal amount of U.S.$190 million. Interest accrues at the SOFR rate plus 1.29% per year, and the maturity date is March 5, 2024. The funds were used to finance capital expenditures.
- On August 16, 2023, Raízen entered into a rural credit (crédito rural) agreement with Banco Safra in an aggregate principal amount of U.S.$190 million. Interest accrues at a rate equivalent to 102% of the CDI rate per year, and the maturity date is March 5, 2024. The funds were used to finance capital expenditures.
- On September 29, 2023, Raízen entered into a rural credit (crédito rural) agreement with SACE, an Italian export credit agency, in an aggregate principal amount of EUR300 million. Interest accrues at a rate equivalent to the EURIBOR rate plus 1.10% per year, and the maturity date is September 22, 2035. The funds were used to finance capital expenditures.
- On September 29, 2023, Cosan S.A. completed the issuance of simple, nonconvertible, unsecured debentures in a single series, issued as part of its seventh issuance of debentures, in an aggregate principal amount of R$1.49 billion in order to move the proceeds of the issuance of its senior notes due 2030 to Brazil. Interest accrues at a rate equal to (i) 16.04% per annum for the first accrual period (ending on the first interest payment date of December 26, 2023), and (ii) 8.02% per annum for all subsequent accrual periods. These debentures mature in June 2030, with principal due upon maturity. In connection with this transaction, Cosan Luxembourg S.A. entered into a total return swap, with the abovementioned debentures as the underlying asset, for an equivalent amount of U.S. dollars, with semiannual payments and on which interest accrues at 16.04% p.a. for the first accrual period (ending on the first interest payment date of December 26, 2023) and 8.02% p.a. for all subsequent accrual periods.
- On October 20, 2023, Raízen Energia S.A. completed the issuance of agribusiness receivables certificates, or “CRAs,” to True Securitizadora S.A., in three series, in an aggregate principal amount of R$1 billion. The CRAs accrue interest at a rate equal to 6.0081% per annum for the first series, 6.2513% per annum for the second series and 12.2874% per annum for the third series. The principal amount in each series is due at maturity, which will occur in October 2030 for the first series and in October 2033 for the second and third series. The net proceeds were used for general corporate purposes.
- On November 1, 2023, Compass completed the issuance of simple, nonconvertible, unsecured debentures in a single series linked to environmental, social and governance, or “ESG,” goals in an aggregate principal amount of R$1.7 billion. Interest accrues at a rate equal to the DI (depósito interbancário) rate plus 1.55% per annum. The debentures mature in November 2030. The principal is payable in two equal installments due in November 2029 and November 2030. The debentures are subject to an interest rate step-up of 12.5 basis points for each ESG target that is not achieved, which would increase the applicable interest rate starting from April 2028 (the verification date) to up to DI (depósito interbancário) rate plus 1.85% per annum. The ESG targets to which the debentures are subject are: (1) a 50-fold increase in the daily volume of biomethane distributed volume from the base volume of 2022, to reach 0.25mln/m³ day in 2027, and (2) reaching 47% of people in leadership positions from underrepresented groups by 2027. The net proceeds were used for investments and working capital.
- On November 22, 2023, Cosan S.A. completed the issuance of simple, nonconvertible, unsecured debentures in a single series, issued as part of its eighth issuance of debentures, in an aggregate principal amount of R$1.25 billion. Interest accrues at a rate equal to the DI (depósito interbancário) rate plus 1.80% per annum. The debentures mature in January 2031. The principal is payable in two equal installments due in January 2030 and January 2031. The net proceeds were used for general corporate purposes.
- On December 21, 2023, Cosan S.A. completed the issuance of simple, nonconvertible, unsecured debentures in a single series, issued as part of its ninth issuance of debentures, in an aggregate principal amount of R$2.9 billion in order to move the proceeds of the issuance of its senior notes due 2029 to Brazil. Interest accrues at a rate equal to 7.520% per annum. The debentures mature on September 19, 2029, when principal will become due and payable. In connection with this transaction, Cosan Luxembourg S.A. entered into a total return swap, with the abovementioned debentures as the underlying asset, for an equivalent amount of U.S. dollars, with semiannual payments and on which interest accrues at 7.2% p.a. for the first accrual period (ending on the first interest payment date of March 2024) and at interest rates ranging from approximately 6.7% to 7% p.a. for all subsequent accrual periods.
- On December 27, 2023, Cosan S.A. completed its fourth issuance of unsecured commercial paper, in two series, in an aggregate principal amount of R$1 billion. The commercial paper accrues interest at a rate equal to the DI (depósito interbancário) rate plus 1.75% per annum for the first series, and at a rate equal to the DI rate plus 1.80% per annum for the second series. The principal amount for the first series is R$550 million, due at maturity, which will occur in December 2028. The principal amount for the second series is R$450 million, payable in two equal installments due in January 2030 and January 2031. The net proceeds were used for general corporate purposes.
The table below shows the profile of our debt instruments as of the dates indicated:
Description | Index | Annual Interest | December 31, 2023 | December 31, 2022 | December 31, 2021 | Currency | Maturity | |||||||
|---|---|---|---|---|---|---|---|---|---|---|---|---|---|---|
|
|
| (in millions) |
|
| |||||||||
Secured |
|
|
|
|
|
|
| |||||||
BNDES | IPCA + 5.74% | 10.42% | 598.7 | 544.9 | — | R$ | Dec-2036 | |||||||
| URTJLP | 8.60% | 2,210.3 | 2,221.9 | 2,598.6 | R$ | Dec-2029 | |||||||
| Fixed | 6.00% | 128.5 | 280.9 | 461.8 | R$ | Jan-2025 | |||||||
| IPCA + 6.01% | 10.71% | 304.3 | — | — | R$ | Dec-2036 | |||||||
| Fixed | 3.50% | 0.03 | 0.4 | 0.7 | R$ | Jan-2024 | |||||||
| 99.98% CDI | 7.82% | 1,547.7 | 1,653.5 | 945.7 | R$ | Apr-2029 | |||||||
| IPCA + 4.10% | 8.71% | 113.0 | 131.9 | 154.8 | R$ | Apr-2029 | |||||||
Export credit agreement (ECA) | Euribor + 0.58% | 4.52% | 48.8 | 68.5 | 95.5 | EUR | Sep-2026 | |||||||
| CDI + 1.03% | 15.39% | 79.0 | 98.0 | 86.7 | R$ | Feb-2023 | |||||||
| CDI + 2.25% | 15.16% | 60.8 | 62.8 | 60.7 | R$ | May-2026 | |||||||
| CDI + 0.80% | — | — | 355.8 | 515.9 | R$ | Dec-2023 | |||||||
| CDI + 2.07% | 14.85% | 52.1 | 50.5 | — | R$ | Mar-2025 | |||||||
| IPCA + 4.10% | 10.63% | 140.0 | 73.7 | — | R$ | Jan-2030 | |||||||
| CDI + 2.20% | 14.20% | 30.2 | — | — | R$ | Mar-2026 | |||||||
| SOFR + 1.30% | 6.65% | 487.5 | — | — | U.S.$ | Jan-2025 | |||||||
Resolution 4131 | U.S.$ | — | — | — | 148.9 | U.S.$ | Nov-2022 | |||||||
| Fixed | — | — | 868.4 | — | EUR | Oct-2024 | |||||||
| Fixed | — | — | 578.7 | — | JP¥ | Oct-2024 | |||||||
| Fixed | 3.20% | 860.6 | 2,009.5 | — | EUR | Oct-2025 | |||||||
| Fixed | 0.25% | 602.5 | 1,338.7 | — | JP¥ | Oct-2025 | |||||||
| Fixed | 3.40% | 1,954.0 | 1,966.1 | — | EUR | Oct-2026 | |||||||
| Fixed | 0.25% | 1,135.2 | 1,309.3 | — | JP¥ | Oct-2026 | |||||||
| Fixed | 3.56% | 812.5 | 816.2 | — | EUR | Oct-2027 | |||||||
| Fixed | 0.25% | 471.0 | 543.2 | — | JP¥ | Oct-2027 | |||||||
Debentures | CDI + 1.79% | 13.65% | 753.4 | 754.8 | 753.8 | R$ | Jun-2027 | |||||||
| CDI + 1.30% | 13.10% | 759.4 | 759.1 | 746.7 | R$ | Oct-2027 | |||||||
| IPCA + 4.77% | 9.41% | 773.6 | 632.3 | 694.9 | R$ | Jun-2031 | |||||||
|
|
| 15,172.5 | 17,925.1 | 7,911.3 |
|
| |||||||
Description | Index | Annual Interest | December 31, 2023 | December 31, 2022 | December 31, 2021 | Currency | Maturity | |||||||
|---|---|---|---|---|---|---|---|---|---|---|---|---|---|---|
|
|
| (in millions) |
|
| |||||||||
Unsecured |
|
|
|
|
|
|
| |||||||
Foreign loans | GBP + Libor 6-month + 1.50% | — | — | — | — | GBP | Jul-2021 | |||||||
| GBP | Fixed | — | — | — | 37.6 | GBP | Nov-2022 | |||||||
| GBP + Libor 6-month + 1.10% | — | — | — | — | GBP | Dec-2021 | |||||||
| GBP + Libor 6-month + 1.50% | — | — | — | 263.5 | GBP | Dec-2022 | |||||||
| EUR | Fixed | — | — | — | 0.9 | EUR | Sep-2022 | |||||||
| GBP | Fixed | — | — | 125.8 | 150.6 | GBP | Dec-2023 | |||||||
ECN | CDI + 1.03% | — | — | — | — | R$ | Feb-2023 | |||||||
| CDI + 0.80% | — | — | — | — | R$ | Dec-2023 | |||||||
| CDI + 3.05% | — | — | — | — | R$ | Mar-2021 | |||||||
| CDI + 3.15% | — | — | — | — | R$ | Mar-2021 | |||||||
Perpetual Notes | U.S.$ | 8.25% | 2,451.1 | 2,641.7 | 2,825.4 | U.S.$ | — | |||||||
Resolution 4,131* | Fixed | 5.50% | 31.9 | 45.1 | — | U.S.$ | May-2023 | |||||||
| Fixed | 2.13% | 943.5 | 1,000.9 | — | U.S.$ | Feb-2025 | |||||||
| U.S.$ | Fixed | — | — | — | — | U.S.$ | Nov-2022 | |||||||
| CDI | — | — | — | — | U.S.$ | Apr-2021 | |||||||
| Fixed | 3.67% | — | 395.3 | 438.8 | U.S.$ | May-2023 | |||||||
| Fixed | 4.04% | 734.1 | — | — | U.S.$ | May-2026 | |||||||
| — | — | — | — | — | U.S.$ | Apr-2021 | |||||||
| Fixed | 1.36% | 362.8 | 377.7 | 414.3 | U.S.$ | Feb-2024 | |||||||
Banking credit certificates | IPCA + 0.81% | — | — | — | — | R$ | Jan-2048 | |||||||
Senior Notes Due 2023 | U.S.$ | Fixed | — | — | — | 685.5 | U.S.$ | Mar-2023 | |||||||
Senior Notes Due 2024 | U.S.$ | Fixed | — | — | — | — | U.S.$ | Feb-2024 | |||||||
Senior Notes Due 2024 | U.S.$ | Fixed | — | — | — | — | U.S.$ | Sep-2024 | |||||||
Senior Notes Due 2025 | U.S.$ | Fixed | — | — | — | 2,981.3 | U.S.$ | Jan-2025 | |||||||
Senior Notes Due 2027 | U.S.$ | Fixed | 7.00% | 1,928.9 | 3,587.3 | 4,305.9 | U.S.$ | Jan-2027 | |||||||
Senior Notes Due 2028 | U.S.$ | Fixed | 5.25% | 2,178.5 | 2,196.1 | 2,700.6 | U.S.$ | Jan-2028 | |||||||
Senior Notes Due 2029 | U.S.$ | Fixed | 5.50% | 3,662.9 | 3,953.6 | 4,226.1 | U.S.$ | Sep-2029 | |||||||
Senior Notes Due 2030 | U.S.$ | Fixed | 7.50% | 2,642.0 | — | — | U.S.$ | Jun-2030 | |||||||
Senior Notes Due 2032 | U.S.$ | Fixed | 4.20% | 2,066.8 | 2,124.1 | 2,800.7 | U.S.$ | Jan-2032 | |||||||
Working capital | CDI + 1.60% | 15.47% | — | 100.2 | 100.2 | R$ | Jun-2022 | |||||||
| SOFR + 1.50% | 1.50% | 2,175.1 | 2,334.6 | — | U.S.$ | May-2027 | |||||||
Bank overdrafts | 125% of CDI | — | — | — | — | R$ | Jan-2020 | |||||||
Prepayment | Libor 3-month + 3.50% | — | — | — | — | U.S.$ | Mar-2021 | |||||||
| Libor 3-month + 1.00% | 1.59% | — | 104.7 | 111.9 | U.S.$ | Oct-2023 | |||||||
| 1.27% Base 360 | 1.27% | — | 151.9 | 166.4 | R$ | Jul-2023 | |||||||
Debentures | IPCA + 4.68% | 9.32% | 396.2 | 518.7 | 543.8 | R$ | Feb-2026 | |||||||
Description | Index | Annual Interest | December 31, 2023 | December 31, 2022 | December 31, 2021 | Currency | Maturity | |||||||
|---|---|---|---|---|---|---|---|---|---|---|---|---|---|---|
|
|
| (in millions) |
|
| |||||||||
| CDI + 1.45% | 13.27% | 399.4 | 399.6 | — | R$ | Dec-2026 | |||||||
| IPCA + 4.50% | 9.13% | 1,596.9 | 1,523.4 | 1,483.9 | R$ | Feb-2029 | |||||||
| CDI + 2.65% | 14.61% | 1,208.1 | 1,819.8 | 1,858.8 | R$ | Aug-2025 | |||||||
| IPCA + 6.80% | 11.53% | 1,004.8 | 893.9 | 892.0 | R$ | Apr-2030 | |||||||
| IPCA + 3.90% | 8.50% | 1,113.8 | 1,048.3 | 1,018.8 | R$ | Oct-2029 | |||||||
| IPCA + 4.00% | — | — | — | — | R$ | Oct-2029 | |||||||
| IPCA + 7.48% | — | — | — | 165.5 | R$ | Dec-2022 | |||||||
| IPCA + 7.36% | 12.12% | 81.0 | 114.0 | 108.5 | R$ | Dec-2025 | |||||||
| IPCA + 5.87% | — | — | 907.4 | 873.5 | R$ | Dec-2023 | |||||||
| IPCA + 4.33% | 8.95% | 554.2 | 523.8 | 501.3 | R$ | Oct-2024 | |||||||
| IGPM + 6.10% | 6.10% | 359.6 | 372.2 | 352.2 | R$ | May-2028 | |||||||
| CDI + 0.50% | — | — | — | 2,033.2 | R$ | Oct-2022 | |||||||
| IPCA + 3.60% | 8.19% | 413.9 | 367.5 | 361.9 | R$ | Sep-2020 | |||||||
| IPCA + 5.73% | 10.41% | 551.7 | 537.3 | 505.6 | R$ | Oct-2033 | |||||||
| IPCA + 4.00% | 8.61% | 1,077.1 | 941.3 | 952.7 | R$ | Dec-2035 | |||||||
| IPCA + 4.54% | 9.17% | 254.2 | 81.0 | 126.7 | R$ | Jun-2036 | |||||||
| CDI + 1.95% | 13.83% | 735.6 | 824.9 | 717.7 | R$ | Aug-2024 | |||||||
| 109.20% CDI | 9.78% | 550.3 | 491.2 | 485.0 | R$ | Aug-2031 | |||||||
| IPCA + 5.22% | 9.88% | 553.9 | 467.8 | 477.6 | R$ | Aug-2036 | |||||||
| CDI + 1.65% | 13.49% | 784.5 | 787.5 | 774.2 | R$ | Aug-2028 | |||||||
| CDI + 2.00% | 13.88% | 942.0 | 946.3 | 930.3 | R$ | Aug-2031 | |||||||
| IPCA + 5.75% | 10.43% | 412.5 | 394.0 | 374.8 | R$ | Aug-2031 | |||||||
| CDI + 1.50% | 13.32% | 406.5 | 407.2 | — | R$ | May-2028 | |||||||
| CDI + 1.90% | 13.77% | 1,118.0 | 1,120.5 | — | R$ | May-2032 | |||||||
| IPCA + 5.99% | 10.69% | 470.1 | 435.7 | — | R$ | Jun-2032 | |||||||
| IPCA + 5.76% | 10.45% | 753.4 | — | — | R$ | Aug-2029 | |||||||
| IPCA + 6.18% | 10.88% | 749.3 | — | — | R$ | May-2033 | |||||||
| CDI + 1.55% | 13.38% | 1,764.0 | — | — | R$ | Nov-2030 | |||||||
| CDI + 2.40% | 14.33% | 1,020.7 | — | — | R$ | Apr-2028 | |||||||
| CDI + 2.40% | 14.33% | 998.542 | — | — | R$ | Jun-2028 | |||||||
| CDI + 1.80% | 13.66% | 1,260.7 | — | — | R$ | Jan-2031 | |||||||
Promissory notes | CDI + 3.00% | 12.33% | — | — | — | R$ | Apr-2021 | |||||||
| CDI + 3.40% | 12.73% | — | — | — | R$ | Apr-2021 | |||||||
| CDI + 1.75% | 13.60% | 547.8 | — | — | R$ | Dec-2028 | |||||||
| CDI + 1.80% | 13.66% | 448.2 | — | — | R$ | Jan-2031 | |||||||
|
|
| 41,732.1 | 35,062.1 | 37,747.7 |
|
| |||||||
Consolidated Debt |
|
| 56,904.7 | 52,987.2 | 45,659.0 |
|
| |||||||
|
|
|
|
|
|
|
| |||||||
Current |
|
| 4,882.4 | 4,542.2 | 4,241.3 |
|
| |||||||
Non-current |
|
| 52,022.3 | 48,445.0 | 41,417.7 |
|
| |||||||
* Resolution 4,131: funds raised outside of Brazil with several financial institutions.
In addition, the principal financing activities of us, our subsidiaries and joint venture in 2024 through the date of this current report are described below:
- On January 26, 2024, we issued U.S.$600 million in aggregate principal amount of 7.250% notes due 2031. Delivery of the notes was made to investors on January 26, 2024. The net proceeds from the issuance of the notes were used for general corporate purposes;
- On February 29, 2024, Comgás completed the issuance of simple and nonconvertible debentures in a single series, issued as part of its tenth issuance of debentures, in an aggregate principal amount of R$1.5 billion to be used for general corporate purposes by its indirect subsidiary, Comgás. Interest accrues at a rate equal to the CDI rate plus 0.80% per annum. The debentures mature on March 15, 2029;
- On March 15, 2024, Compass completed the issuance of simple and nonconvertible debentures in a single series, issued as part of its third issuance of debentures, in an aggregate principal amount of R$1.5 billion to be used in working capital management. Interest accrues at a rate equal to the CDI rate plus 1.08% per annum. The debentures mature on March 15, 2029;
- On March 22, 2024, Compass and its subsidiary Compass Comercialização entered into an uncommitted term loan facility agreement with BNP Paribas S.A. for fundraising in accordance with the terms of Law No. 4.131 in the amount of €78 million, maturing in March 2025, with an interest rate of 4.879% per year; and
- On March 25, 2024, Rumo Malha Paulista raised R$1.2 billion in its fifth issuance of simple debentures, non-convertible into shares, in two series. The first series amounted to R$ 532.2 million, with an interest rate equal to the IPCA rate plus 5.7970% per annum, a term of 10 years, semiannual interest payments, and bullet amortization. The second series amounted to R$667.8 million, with an interest rate equal to the IPCA rate plus 5.9284% per annum, a term of 15 years, semiannual interest payments, and amortization in the last three years.
We believe we will be able to refinance our existing debt on favorable market conditions.
Unused Sources of Liquidity
As of December 31, 2023 and 2022, we and our subsidiaries had unused available credit lines in the amount of R$2,102.8 million and R$3,052.3 million, respectively. The use of these credit lines is subject to certain contractual conditions.
Working Capital
As of December 31, 2023, we had working capital (total current assets less total current liabilities) of R$12,451.4 million, compared to R$9,779.7 million as of December 31, 2022. The difference between the position as of December 31, 2023 and December 31, 2022 was mainly attributable to an increase in cash and cash equivalents.
Capital Expenditures
Our capital expenditures, which consist of acquisitions of property, plant and equipment, intangible and contract assets, were R$6,268.0 million during the fiscal year ended December 31, 2023, compared to R$4,531.4 million during the fiscal year ended December 31, 2022. For the fiscal year ended December 31, 2021 our capital expenditures were R$4,774.8 million.
In 2023, 2022 and 2021, our capital expenditures consisted primarily of the following:
- Rumo. Rumo has focused on investments in (i) the renovation of assets, in particular its locomotives and trailer fleet; (ii) construction works at Rumo Malha Central and the improvement of the Rumo Malha Paulista infrastructure; (iii) permanent infrastructure investments by way of the replacement of rails and ties; (iv) improvements and implementation of infrastructure in its terminals.
- Compass. Compass has invested in the expansion of its network and has also undertaken network support investments in order to reinforce, restore and renovate the existing distribution network.
- Moove. Moove has invested in the modernization and maintenance of its assets.
- Radar. Our subsidiary TUP Porto São Luís S.A. has invested in the construction of the port in the city of Sao Luis.
The following table sets forth our capital expenditures for the fiscal years ended December 31, 2023, 2022 and 2021:
| For the Fiscal Year Ended | ||||
|---|---|---|---|---|---|
| 2023 | 2022 | 2021 | ||
| (in millions of reais) | ||||
Rumo | 3,689.9 | 2,717.7 | 3,453.4 | ||
Compass | 2,317.9 | 1,659.2 | 1,269.9 | ||
Moove | 178.0 | 109.3 | 42.5 | ||
Radar | 39.9 | 19.2 | 8.7 | ||
Cosan Corporate | 42.3 | 26.0 | 0.3 | ||
Total consolidated capital expenditures (1) | 6,268.0 | 4,531.4 | 4,774.8 | ||
(1) Capital expenditures consist of acquisitions of property, plant and equipment, intangible and contract assets.
The main planned and undergoing projects related to capital expenditures are described in “Information on the Company—D. Property, Plant and Equipment.” We expect to fund such planned and undergoing projects primarily through our and our subsidiaries’ working capital and existing or new indebtedness.
Contractual Financial Obligations
The following table sets forth the maturity schedule of our material contractual financial obligations (contracted undiscounted cash flows basis) as of December 31, 2023:
| Less than | 1 to 2 years | 2 to 5 years | More than | Total | ||||||||
|---|---|---|---|---|---|---|---|---|---|---|---|---|---|
| (in millions of reais) | ||||||||||||
Loans, borrowings and debentures(1) | 5,504.2 | 5,300.7 | 23,711.3 | 33,419.3 | 67,935.5 | ||||||||
Trade payables | 3,920.3 | 264.3 | — | — | 4,184.5 | ||||||||
Other financial liabilities | 476.9 | — | — | — | 476.9 | ||||||||
Tax installments – REFIS | 53.2 | 1.5 | 1.8 | 160.7 | 217.3 | ||||||||
Leases | 658.1 | 818.9 | 1,233.7 | 18,164.1 | 20,874.8 | ||||||||
Lease and concession installments | 266.8 | 291.2 | 579.3 | — | 1,137.3 | ||||||||
Payables to related parties | 322.2 | — | — | — | 322.2 | ||||||||
Dividends payable | 549.1 | — | — | — | 549.1 | ||||||||
Derivative financial instruments | 2,149.5 | 1,327.5 | 3,146.3 | 1,705.5 | 4,917.9 | ||||||||
Total | 13,900.2 | 8,004.0 | 28,672.4 | 50,038.7 | 100,615.4 | ||||||||
(1) Include future interests based on the applicable rates as of December 31, 2023.
Since December 31, 2023, there have been no material changes to the contractual obligations described above.
Off-Balance Sheet Arrangements
We have no off-balance sheet arrangements to finance our operations. We have no subsidiaries in which we hold a majority or minority stake that are not included in our individual and consolidated financial information, nor do we have any interests in or relationships with any special purpose companies that are not reflected in our individual and consolidated financial information.
However, we have entered, in the normal course of business, into several types of off-balance sheet arrangements, as set forth below:
Acquisition of Assets
Following the postponement of the 2014 Five-Year Tariff Review 2014 as a result of the publications of ARSESP Resolutions No. 493 and No. 494, both of which were published on May 27, 2014, which approved the “Tariff Review Process of Gas distribution companies in the state of São Paulo, defining event schedule,” and the “Provisional adjustment of marketing margins of Companhia de Gás de São Paulo — COMGÁS,” we are not subject to any set regulatory commitment to purchase assets as of December 31, 2023, 2022 and 2021.
The following list sets forth, in our view, the most important trends, uncertainties and events that are reasonably likely to continue to have a material effect on our revenues, income from continuing operations, profitability, liquidity and capital resources, or that may cause reported financial information to be not necessarily indicative of future operating results or financial condition:
- general economic, political, demographic and business conditions in Brazil and in the world (including any impact resulting from the ongoing war between Russia and Ukraine and conflicts in the Middle East);
- the economic and political situation in Brazil, including the potential impact of the policies to be adopted by the new administration;
- developments and the perception of risk in other countries may adversely affect the Brazilian economy;
- potential inflation increases that could cause an increase in interest rates and lower growth in lending activities;
- continued market volatility and instability that could affect our revenues;
- restrictive regulations or government intervention;
- decreased liquidity in domestic and international capital markets;
- tax policies that could decrease our profitability; and
- currency fluctuation and exchange rate controls that could have an adverse impact on international investor;
For further information, see “Risk Factors,” where we present the risks we face in our business that may affect our commercial activities, operating results or liquidity.
Our financial information is presented in IFRS as issued by the IASB. For summary information about critical judgments, assumptions and estimation uncertainties in applying accounting policies that have the most significant effect on the amounts recognized in the financial statements, see “—Financial Presentation and Accounting Policies—Critical Accounting Policies and Estimates” and note 3.2 to our individual and consolidated financial information as of and for the fiscal years ended December 31, 2023 and 2022, included elsewhere in this current report.
No new accounting standards or amendments that came into effect in the years ended December 31, 2023, 2022 and 2021 have had a material impact on our individual and consolidated financial information. There are no other standards and interpretations issued but not yet adopted that may, in the opinion of management, have a significant impact on the results or equity disclosed by us.
Risk Management
We consider market risk to be the potential loss arising from adverse changes in market rates and prices. The Company, its subsidiaries and jointly controlled entities are exposed to market risks, chief of which are: (1) credit risk; (2) liquidity risk; (3) commodities risk; (4) interest rate risk; (5) foreign currency exchange rate risk; and (6) price risk. In order to manage its market risks, we have adopted policies and procedures which establish limits and monitor risk exposure and counterparties and approve financial instruments. Risk and financial instrument management activities are carried out through the definition of strategies, establishment of control systems and determination of limits to exposure to market risks. We periodically review our exposure to market risks and determine at the senior management level how to manage and reduce the impact of these risks.
The Company uses derivatives solely to manage market risk, especially commodity price and foreign exchange rate fluctuations. Although the value of these hedge instruments varies, these variations are usually offset by the value of the related hedged item. The parties to these agreements are mainly trade boards and trading companies in the case of futures, options and price setting, and major financial institutions in the case of foreign exchange derivatives and interest rate swaps. The Company does not use derivatives or other hedge instruments for speculative purposes.
As a result, we do not believe that we are subject to any material credit risk arising from these contracts, and accordingly, we do not anticipate any material credit-related losses.
Credit Risk
Credit risk is managed through specific rules concerning client acceptance which require credit rating checks and limits for customer exposure, applicable to all subsidiaries and jointly controlled entities. Raízen generally requires a letter of credit from a reputable bank for most of our sugar export sales. We do not believe that we are subject to any material credit risk and we do not anticipate any material credit-related losses. Management believes that any credit risk is covered by the allowance for doubtful accounts recorded in our statement of financial position.
Liquidity Risk
Liquidity risk arises where we may encounter difficulties in meeting the obligations associated with our financial liabilities that are settled by delivering cash or another financial asset. Our approach to managing liquidity is to ensure, as far as possible, that we will have sufficient liquidity to meet our liabilities when they are due, under both normal and stressed conditions, without incurring unacceptable losses or risking damage to our reputation. Please see note 5.12 to our individual and consolidated financial information attached hereto for measures on which our management has been working to enable us to honor our commitments.
Commodities Risk
Mainly applicable to the energy-generating business of Raízen, agricultural commodity prices and supply levels change according to unpredictable factors such as the weather, investments, government programs and policies and changes in world demand, among others.
Raízen conducts sensitivity tests to estimate its exposure to these risks and uses derivatives to mitigate its exposure to sugar price oscillation on the international market. Derivative operations allow us to ensure an average margin for future sales. Raízen actively manages its open positions and monitors the result of these activities on a daily basis through effective mark-to-market controls and price impact simulations so that it may adjust targets and strategies due to changes in market conditions.
For risk management purposes and to evaluate the overall level of commodity price exposure, Raízen further reduces its exposure to commodity market risk related to the sugar and ethanol produced from sugarcane that is purchased from growers and sugarcane harvested from leased land, as both costs are linked to TSR. The price of sugarcane supplied by growers or the lease payments incurred to produce sugarcane harvested by Raízen from leased land is indexed to the market price of sugar and ethanol, which provides a partial natural hedge to domestic sugar and ethanol sales price exposure.
The table below provides information about our (through Raízen) sugar, diesel, gasoline, ethanol and electric power derivative contracts that are sensitive to changes in commodity prices, specifically sugar prices as of December 31, 2023. For the derivative contracts, the table presents the notional amounts in tons, the weighted average contract prices, and the total U.S. dollar contract amount by expected maturity dates.
Commodities Price Risk – Commodities Derivatives Opened as of December 31, 2023
Derivatives | Purchased / Sold | Market | Contract | Maturity Date | Notional | Notional | Fair Value | ||||||||
|---|---|---|---|---|---|---|---|---|---|---|---|---|---|---|---|
|
|
|
|
| (unit) | (R$ thousand) | |||||||||
Futures | Sold | ICE | Sugar #11 | Jan/24 to Feb/26 | 9,441,829 | t | 23,188,684 | 2,528,304 | |||||||
Futures | Sold | NYSE LIFFE | Sugar #5 | Feb/24 to Nov/24 | 476,200 | t | 1,569,707 | 213,323 | |||||||
Futures | Sold | OTC | Sugar #11 | Feb/24 to Sep/25 | 2,989,315 | t | 6,593,307 | 54,544 | |||||||
Options | Sold | ICE | Sugar #11 | Jan/24 to Feb/25 | 1,700,102 | t | (4,687,826) | (302,817) | |||||||
Options | Sold | OTC | Sugar #11 | Jan/24 to Apr/25 | 36,171 | t | (84,692) | (2,951) | |||||||
Subtotal of sugar future sold | 14,643,617 | t | 26,579,180 | 2,490,203 | |||||||||||
Futures | Purchased | ICE | Sugar #11 | Feb/24 to Sep/25 | (9,277,839) | t | (21,696,733) | (1,867,796) | |||||||
Futures | Purchased | NYSE LIFFE | Sugar #5 | Feb/24 to Sep/24 | (169,850) | t | (590,548) | (100,505) | |||||||
Futures | Purchased | OTC | Sugar #11 | Apr/24 | (30,000) | t | (37,244) | (1,244) | |||||||
Options | Purchased | ICE | Sugar #11 | Jan/24 to Feb/25 | (1,845,550) | t | 4,453,505 | 283,157 | |||||||
Options | Purchased | OTC | Sugar #11 | Jan/24 to Nov/24 | (15,596) | t | 35,928 | 1,499 | |||||||
Subtotal of sugar future purchased | (11,338,835) | t | (17,835,092) | (1,684,889) | |||||||||||
Physical fixed | Purchased | ICE | Sugar #11 | Jan/24 to Jan/31 | 18,036,578 | t | 41,543,113 | 1,012,589 | |||||||
Physical fixed | Purchased | NYSE LIFFE | Sugar #5 | Jan/24 to Nov/24 | 428,657 | t | 1,388,323 | 132,858 | |||||||
Subtotal of sugar physical fixed sold | 18,465,235 | t | 42,931,436 | 1,145,447 | |||||||||||
Physical fixed | Purchased | ICE | Sugar #11 | Jan/24 to Jan/28 | (9,334,695) | t | (21,407,958) | (324,470) | |||||||
Physical fixed | Purchased | NYSE LIFFE | Sugar #5 | Jan/24 to Jan/28 | (874,877) | t | (2,160,172) | 34,657 | |||||||
Subtotal of sugar physical fixed purchased | (10,209,572) | t | (23,568,130) | (289,813) | |||||||||||
Subtotal of sugar future | (11,560,572) | t | 28,107,394 | 1,660,948 | |||||||||||
Futures | Sold | B3 | Ethanol | Jan/24 to Dec/24 | 41,040 | m³ | 99,070 | (1,160) | |||||||
Futures | Sold | NYMEX | Ethanol | Jan/24 to Dec/24 | 822,923 | m³ | 1,812,017 | 134,157 | |||||||
Futures | Sold | OTC | Ethanol | Jan/24 | 2,385 | m³ | (4,773) | (119) | |||||||
Subtotal of ethanol future sold | 866,348 | m³ | 1,906,314 | 132,878 | |||||||||||
Futures | Purchased | B3 | Ethanol | Jan/24 to Dec/24 | (121,320) | m³ | (290,339) | 2,655 | |||||||
Futures | Purchased | NYMEX | Ethanol | Jan/24 to Dec/24 | (759,025) | m³ | (1,945,742) | (156,084) | |||||||
Options | Purchased | NYMEX | Ethanol | Jan/24 to Dec/24 | (18,285) | m³ | 39,574 | 164 | |||||||
Subtotal of ethanol future purchased | (828,630) | m³ | (2,196,507) | (153,265) | |||||||||||
Physical fixed | Sold | CHGOETHNL | Ethanol | Jan/24 to Dec/26 | 510,041 | m³ | 1,785,681 | 125,075 | |||||||
Physical fixed | Purchased | CHGOETHNL | Ethanol | Jan/24 to Jun/30 | (341,198) | m³ | (932,467) | 54,045 | |||||||
Subtotal future physical fixed ethanol | 168,843 | m³ | 853,214 | 179,120 | |||||||||||
Subtotal of ethanol futures | 136,561 | m³ | 563,021 | 158,733 | |||||||||||
Futures | Sold | NYMEX | Gasoline | Jan/24 to Nov/24 | 50,085 | m³ | 140,684 | 6,149 | |||||||
Futures | Purchased | NYMEX | Gasoline | Jan/24 to Nov/24 | (13,356) | m³ | (36,914) | (1,313) | |||||||
Subtotal of gasoline futures | 36,729 | m³ | 103,770 | 4,836 | |||||||||||
Derivatives | Purchased / Sold | Market | Contract | Maturity Date | Notional | Notional | Fair Value | ||||||||
|---|---|---|---|---|---|---|---|---|---|---|---|---|---|---|---|
|
|
|
|
| (unit) | (R$ thousand) | |||||||||
Futures | Sold | NYMEX | Heating Oil | Jan/24 to Jun/24 | 1,432,861 | m³ | 9,829,839 | 108,642 | |||||||
Futures | Sold | ICE | Heating Oil | Jan/24 to Dec/24 | 246,933 | m³ | 474,018 | 17,025 | |||||||
Futures | Sold | ICE | Heating Oil | Jan/24 to Dec/24 | - |
| (3,210) | (1,030) | |||||||
Options | Sold | NYMEX | Heating Oil | Jan/24 to Feb/24 | 31,800 | m³ | (203) | (714) | |||||||
Subtotal of future heating oil sold | 1,711,594 | m³ | 10,300,444 | 123,923 | |||||||||||
Futures | Purchased | NYMEX | Heating Oil | Jan/24 to Sep/24 | (801,797) | m³ | (1,714,740) | (58,637) | |||||||
Futures | Purchased | ICE | Heating Oil | Jan/24 to Dec/24 | (41,574) | m³ | (166,718) | (17,276) | |||||||
Futures | Purchased | OTC | Heating Oil | May/25 | (10,017) | m³ | 323 | 664 | |||||||
Futures | Purchased | CME | Heating Oil | Jan/24 to Mar/24 | (63,600) | m³ | 407 | 1,427 | |||||||
Futures | Purchased | NYMEX | Heating Oil | Jan/24 | (35,298) | m³ | 119,062 | 7,239 | |||||||
Futures | Purchased | ICE | Heating Oil | Jan/24 to Dec/24 | - | m³ | 3,079 | 1,030 | |||||||
Subtotal of future heating oil purchased | (952,286) | m³ | (1,758,587) | (65,553) | |||||||||||
Physical fixed | Sold | ICE | Heating Oil | Jan/24 to Feb/24 | 853,480 | t | 806,152 | 39,280 | |||||||
Physical fixed | Purchased | ICE | Heating Oil | Jan/24 to Feb/24 | (1,002,980) | t | (709,757) | (104,626) | |||||||
Subtotal of physical fixed heating oil | (149,500) | t | 96,395 | (65,346) | |||||||||||
Physical fixed | Sold | NYMEX | Heating Oil | Jan/24 to Feb/24 | 1,480,516 | m³ | 697,340 | 4,176 | |||||||
Physical fixed | Purchased | NYMEX | Heating Oil | Jan/24 to Jul/24 | (1,018,361) | m³ | (503,906) | 19,739 | |||||||
Subtotal of physical fixed heating oil | 462,155 | m³ | 193,434 | 23,915 | |||||||||||
Subtotal of heating oil futures | 1,071,963 | m³ | 8,831,686 | 16,939 | |||||||||||
Physical fixed | Sold | CCEE/OTC | Energy | Jan/24 to Dec/41 | 56,864,953 | MWh | 8,231,753 | 1,171,798 | |||||||
Physical fixed | Purchased | CCEE/OTC | Energy | Jan/24 to Sep/53 | (40,255,372) | MWh | (7,165,880) | (337,269) | |||||||
Subtotal of energy physical fixed | 16,609,581 | MWh | 1,065,873 | 834,529 | |||||||||||
Net exposure to commodity derivatives as of December 31, 2023 |
|
| 38,671,744 | 2,675,985 | |||||||||||
Interest Rate Risk
We have fixed and floating rate indebtedness and, therefore, we are exposed to market risk as a result of changes in interest rates. See “—B. Liquidity and Capital Resources—Indebtedness” for further information.
Our interest rate risk refers to the impact of an increase in the LIBOR (London Interbank Offered Rate) indexed interest rate, TJLP (Long-term Interest Rate), TR (Reference Interest Rate), IGP-M (General Market Price Index), IPCA (Consumer Price Index) and CDI (Interbank Deposit Certificate) indexed debt on our finance results.
As of December 31, 2023, 18.4%, or R$10,487.9 million (27.3%, or R$14,449.6 million as of December 31, 2022) of our consolidated total debt outstanding was fixed rate debt.
The majority of our debt, except the jointly controlled subsidiary Raízen, is dollar-denominated with fixed interest rates or real-denominated debts indexed to the CDI or TJLP. Most of our outstanding debt is linked to the CDI note. We have a substantial amount of cash and cash equivalents and marketable securities indexed to the CDI, which provides a partial natural hedge to our interest rate exposure of our real-denominated debts.
Based on the foregoing, we believe that as of December 31, 2023, a hypothetical 10% increase in all interest rates would increase our financial expenses by R$1,048.8 million per year based on the net financial expenses we recorded in our consolidated statement of profit or loss for the fiscal year ended December 31, 2023.
Foreign Currency Exchange Rate Risk
The foreign exchange variations to which we are exposed are mainly related to our outstanding perpetual notes in an aggregate amount of U.S.$500 million. We use derivatives to hedge the cash flows for payment of part of the interest on this debt against a possible appreciation of the U.S. dollar against the real. In addition, basic oil imports for the lubricants business are also exposed to foreign exchange variations, hedged by derivatives on a case-by-case basis.
A significant portion of the revenue of the jointly controlled subsidiary Raízen is U.S. dollar denominated. Most of Raízen Energia’s costs are denominated in reais and therefore, when the real appreciates against the U.S. dollar, its operating margins are adversely affected. A considerable part of Raízen’s debt is also denominated in dollars exposing it to the risk of variations in the real to U.S. dollar exchange rate (derivative financial instruments are used to hedge the cash flows for payment of interest of these debts).
Raízen has foreign exchange derivatives in order to mitigate its exposure to the effect of foreign exchange variations on its sugar and ethanol export revenues, combined with cash outlays to cover its debt commitments in foreign currency, mainly the U.S. dollar. The exchange rate derivatives together with the sugar price derivatives allow Raízen to ensure an average margin from future sales. Raízen actively manages open positions, and the results of these activities are monitored on a daily basis through effective mark-to-market controls and price impact simulations that allow Raízen to adjust targets and strategies as a result of changes in market conditions. Raízen uses financial derivative instruments to hedge foreign exchange risk.
As of December 31, 2023, our foreign exchange exposure, net was R$12,666.0 million (R$5,246.5 million in the fiscal year ended December 31, 2022) which were represented by cash and cash equivalents, loans and derivatives contracts as disclosed in note 5.12 to our individual and consolidated financial information attached hereto.
As a measure of our market risk with respect to our foreign currency exposure, a hypothetical 10% appreciation of the real against the foreign currency would increase in profit for the year by R$524.7 million per year, based on the foreign exchange exposure for the fiscal year ended December 31, 2023, before considering the effects on U.S. dollar derivative contracts and other foreign currency denominated assets and liabilities, as set forth below:
Foreign Currency Financial Instruments Outstanding as of | Notional Amount/ Quantity | Estimated Fair Value Asset (Liability) | Foreign Exchange Gain/ Loss – 10% FX Rate Decrease | ||
|---|---|---|---|---|---|
| (in millions of reais) | ||||
Denominated debt(1) | (27,133.1) | (27,133.1) | (2,713.3) | ||
Denominated cash and cash equivalents | 285.0 | 285.0 | 28.5 | ||
Denominated derivative financial instruments (notional) | 14,182.1 | 14,182.1 | 1,418.2 | ||
Denominated receivables | — | — | — | ||
Foreign exchange exposure, net | (12,665.0) | (12,665.0) | (1,266.6) | ||
(1) Denominated debt means the sum of Trade payables, Loans, borrowings and debentures, Leases and Consideration payable.
Price Risk
We have electricity operations traded on an active market and natural gas derivative transactions conducted with bank counterparties. The transactions are recognized at fair value through profit or loss, based on the difference between the contracted price and the market price of outstanding contracts as of the date of the balance sheet.
In addition, we are exposed to market risks as a result of the fluctuating prices of certain equity securities and option instruments. Our exposure to changes in the price of equity securities is primarily derived from Vale’s common shares purchased on the spot market, which, as of December 31, 2023, represented 2.45% of the outstanding shares.
Additionally, we enter into equity derivative contracts that consist of a combination of call and put positions (collar) that limit the risk of devaluation of the value of the shares while allowing us to participate in the appreciation of the shares—equal to 2.4% as of December 31, 2023. These contracts are expected to offset declines in the fair value of these securities below the per-share hedge price on maturity, allowing us to retain a portion of the positive valuation of the per-share hedge price to the relevant price cap. Actual per-share contract hedge prices will vary based on average share prices in effect when the contracts were entered into. Actual maximum contract prices vary based on each contract’s maturity and terms, among other factors. If any of these contracts are terminated before their scheduled maturity date due to a contract-specified event, we will be required to repay the fair value of the guaranteed debt offset by the sum of the fair values of the underlying shares and equity collar, calculated on the date of termination. Finally, exposures resulting from derivatives are reflected in the call spread structure, representing an additional potential of 1.6% of Vale’s outstanding shares as of December 31, 2023. In this structure, we do not own the shares, but we do possess an instrument that enables us to acquire the additional shares through a derivative structure. The calculated values in the aforementioned structure’s sensitivity analysis reflect the impacts of the intrinsic values of the options on the valuation or devaluation of the shares.
In our consolidated balance sheets, the underlying shares and equity collars are recorded at fair value, while secured debt is recorded at principal amount, net of funding costs. These funding expenses are amortized over the respective debt’s term.
In addition, we face risks associated with the share prices of Cosan (CSAN3). We have entered into a total return swap with respect to 97,215,812 shares of Cosan (CSAN3).
Rubens Ometto Silveira Mello, who controls the majority of our common shares, has the overall power to control us, including the power to establish our management policies.
Our board of directors consists of at least five (5) members and at most twenty (20) members. Out of the members of the Board of Directors, at least two members or 20% of the members, whichever is higher, must be independent directors, as defined in the Novo Mercado Rulebook. The qualification of the members appointed as independent directors will be resolved upon at the shareholders’ meeting that elects such independent directors. A director elected as permitted under article 141, paragraphs 4 and 5 of Brazilian Corporation Law will also be deemed an independent director even if there is a controlling shareholder. Should compliance with the foregoing percentage requirement lead to a fractional number of directors, the number of directors will be rounded to the whole number immediately higher.
The number of directors to be elected for the upcoming term will be decided by a majority vote at the relevant shareholders’ meeting. A shareholder or a group of shareholders representing at least 15% of the share capital of Cosan may separately elect up to one additional director. Additionally, shareholders representing a percentage of the share capital of Cosan of 5% (depending on the aggregate value of capital stock of Cosan at such time, pursuant to the applicable CVM ruling) may request that the election of directors be subject to cumulative voting proceedings, as provided for in article 141 of the Brazilian Corporation Law and CVM Ruling 70.
Board of Directors
Our board of directors is the decision-making body responsible for, among other things, determining policies and guidelines for our business. The board of directors also supervises our executive officers and monitors their implementation of policies and guidelines established from time to time by our board of directors.
The following table lists the members of our board of directors:
Name | Date of Election | Position | Year of Birth | |||
|---|---|---|---|---|---|---|
Rubens Ometto Silveira Mello | April 27, 2023 | Chairman | 1950 | |||
Marcelo Eduardo Martins | April 27, 2023 | Vice Chairman | 1966 | |||
Burkhard Otto Cordes | April 27, 2023 | Director | 1975 | |||
Luis Henrique Cals de Beauclair Guimarães | April 27, 2023 | Director | 1966 | |||
Pedro Isamu Mizutani | April 27, 2023 | Director | 1959 | |||
Silvia Brasil Coutinho(1) | April 27, 2023 | Director | 1961 | |||
Vasco Augusto Pinto da Fonseca Dias Júnior(1) | April 27, 2023 | Director | 1956 | |||
José Alexandre Scheinkman(1) | April 27, 2023 | Director | 1948 | |||
Ana Paula Pessoa(1) | April 27, 2023 | Director | 1967 |
(1) Independent director.
The following is a summary of the business experience of our current directors. Unless otherwise indicated, the business address of our current directors is Av. Brigadeiro Faria Lima, 4,100 – 16th floor, São Paulo – SP, Zip Code 04538-132, Brazil.
Rubens Ometto Silveira Mello. Mr. Mello is the chairman of Cosan S.A., Compass, Rumo, Radar, Moove and Raízen, besides being the controlling shareholder of these companies. He holds a degree in mechanical engineering from the Polytechnic School of the University of São Paulo (Escola Politécnica da Universidade de São Paulo) (1972), with a post-graduate degree in finance from the Universidade Metodista de Piracicaba, or “UNIMEP,” and an MBA degree in business management from Fundação Getúlio Vargas – FGV with extension to Ohio University. Mr. Mello has more than 40 years of experience in the management of large companies. He has also served as planning supervisor, financial manager and as administrative and financial superintendent of Costa Pinto S.A. from 1983 to 1990 and officer and chairman of the board of directors of Aguassanta Participações S.A., since 2001. He is also one of the founders of UNICA, the Sugarcane Agroindustry Association of the state of São Paulo (UNICA—União da Agroindústria Canavieira do Estado de São Paulo). Prior to joining Cosan, Mr. Mello worked from 1971 to 1973 as an advisor to the board of executive officers of UNIBANCO - União de Bancos Brasileiros S.A., and from 1973 to 1980 as chief financial officer of Indústrias Votorantim S.A.
Marcelo Eduardo Martins. Mr. Martins became an executive officer of Aguassanta Participações S.A. in July 2007. Since then he has held various significant positions at companies with the Cosan Group. He is currently the vice-chairman of our board of directors and our chief strategy officer and our former chief financial officer and investor relations officer. Prior to joining the Cosan Group, Mr. Martins was the chief financial and business development officer of Votorantim Cimentos between July 2003 and July 2007 and, prior to that, head of Latin American Fixed Income at Salomon Smith Barney (Citigroup) in New York. He has significant experience in capital markets, having worked at Citibank (where he began his career as a trainee in 1989), Unibanco, UBS and FleetBoston. He has a degree in business administration from the FGV, specializing in finance.
Burkhard Otto Cordes. Mr. Cordes has been a member of our board of directors since 2005. He holds a degree in business administration from Fundação Armando Álvares Penteado (1997) and an MBA in finance from IBMEC-SP (2001). Mr. Cordes has worked in financial markets at Banco BBM S.A., a company owned by Grupo Mariani, where he worked in the commercial division focusing on the corporate and middle market segments. Before holding his current position, he had worked at IBM Brasil in its financial division. Mr. Cordes is Mr. Mello’s son-in-law.
Luis Henrique Cals de Beauclair Guimarães. Mr. Guimarães is a member of our board of directors and our former chief executive officer. He was also the chief executive officer of Cosan Limited from April 1, 2020 until Cosan Limited’s merger with and into Cosan S.A. Prior to that he had been chief executive officer of Raízen. He was formerly the chief executive officer of Comgás, and after that, the fuels operational officer and person responsible for Raízen’s downstream division, which covers the retail, commercial and aviation businesses. Mr. Guimarães joined Shell in 1987 and worked in several positions in the lubricants and retail businesses in Brazil and abroad (based in London). From 2007 until September 2010, he served as Shell’s chief marketing officer for lubricants in North America, based in Houston. Mr. Guimarães has a bachelor’s degree in statistics and an MBA in marketing from Coppead – Universidade Federal do Rio de Janeiro. Mr. Guimarães is also a member of the board of directors of Vale.
Pedro Isamu Mizutani. Mr. Mizutani has been a member of our board of directors since 2021 and has more than 20 years of experience in the business and financial departments of sugarcane companies. He also worked at Costa Pinto S.A. as planning supervisor, financial manager, and as administrative and financial superintendent. From 1990 to 2001, he served as administrative and financial officer of the Cosan Group, and in 2001 he became a superintendent officer responsible for the coordination of strategic and operating activities of the commercial, administrative, financial, agricultural and industrial areas. In 2011, he became vice chairman and operations officer of Raízen, where he remained in office until 2019. Mr. Mizutani holds a bachelor’s degree in production engineering from Escola Politécnica da Universidade de São Paulo (1982) and a post-graduate degree in finance from UNIMEP – Universidade Metodista de Piracicaba and also an MBA in business management from Fundação Getúlio Vargas – FGV with an extension course at Ohio University.
Silvia Brasil Coutinho. Ms. Brasil Coutinho has over 45 years of experience, including close to 20 years at Citibank in various departments and approximately 10 years at HSBC. Ms. Brasil Coutinho is also a member of the board of directors of Edenred and the current country head of UBS Group in Brazil and head of wealth management in Latin America for UBS. Ms. Brasil Coutinho has a bachelor’s degree in agronomy and a master’s degree in agricultural economics from Escola de Agricultura da Universidade de São Paulo – ESALQ, as well as an MBA from Columbia University.
Vasco Augusto Pinto da Fonseca Dias Júnior. Mr. Dias Júnior has been a member of our board of directors since 2021. He joined Shell Group as intern in 1979 and later became analyst and chief of systems. In December 2000, he left Shell Group to become executive officer of Companhia Siderúrgica Nacional – CSN. He returned to Shell Group in 2005 as chairman for Latin America. He also served as officer chairman of Raízen from 2011 to March 2016. Mr. Dias Júnior holds a bachelor’s degree in systems engineering from Pontifícia Universidade Católica do Rio de Janeiro.
José Alexandre Scheinkman. Mr. Scheinkman has been a member of our board of directors since 2021 and is a professor at Columbia University and professor of economics at Theodore A. Wells ‘29 (Emeritus) at Princeton University. He is member of several research groups and associations, including the National Bureau of Economic Research and Cambridge Endowment for Research in Finance. He received the title of Doctor Honoris Causa from Université Paris Dauphine in 2001. He is member of the Scientific Board of Europlace Institute of Finance (Paris), National Academy of Sciences, American Finance Association and Academic Board of INSPER. Previously, he was financial strategy vice chairman of Goldman, Sachs & Co., a member of Axion Investments from 2003 to 2013, co-editor of the Journal of Political Economy and a member of the economic advisory group of Foundation Sloan. Mr. Scheinkman holds a bachelor’s degree in economics from Universidade Federal do Rio de Janeiro and a master’s degree and PhD in economics from the University of Rochester, as well as a master’s degree in mathematics from the Institute of Pure and Applied Mathematics.
Ana Paula Pessoa. Ms. Pessoa has been a member of our board of directors since 2021 and is a partner, investor and chairman of the board of directors of Kunumi AI, a Brazilian artificial intelligence company. She is also a member of the global board of Credit Suisse, in Zurich, of News Corporation, in New York, and of Vinci Group, in Paris. Her voluntary activities concentrate on educational initiatives and environmental concerns to foment sustainable growth. She is a member of the global board of Stanford University, in California, the advisory board of The Nature Conservancy Brazil, the audit committee of Fundação Roberto Marinho, and Instituto Atlantico de Gobierno, Madrid. She was the financial officer of the Rio 2016 Olympic and Paralympic Organizing Committee. She is an independent member of the boards of directors of Suzano, Vinci and Credit Suisse. She was a partner and founder of Brunswick São Paulo and worked for 18 years in several companies of Organizações Globo. She worked for the United Nations Development Program and for the World Bank in the United States and in Africa. Ms. Pessoa holds bachelor’s degree in economics and international relations and a master’s degree in development economics from Stanford University.
Executive Officers
Our executive officers serve as our executive management body. They are responsible for our internal organization and day-to-day operations and for the implementation of the general policies and guidelines established from time to time by our board of directors.
Our bylaws require that its board of executive officers consist of a minimum of three and a maximum of eight officers, each responsible for a specific area of the business.
The following table lists our current executive officers:
Name | Date of Election | Position | Year of Birth | |||
|---|---|---|---|---|---|---|
Nelson Roseira Gomes Neto | November 14, 2023 | Chief Executive Officer | 1970 | |||
Rodrigo Araujo Alves | November 14, 2023 | Chief Financial and Investor Relations Officer | 1985 | |||
Marcelo Eduardo Martins | November 14, 2023 | Chief Strategy Officer | 1966 | |||
Maria Rita de Carvalho Drummond | November 14, 2023 | General Counsel | 1980 |
The following is a summary of the business experience of our executive officers. Unless otherwise indicated, the business address of the executive officers is Avenida Brigadeiro Faria Lima, 4,100 – 16th floor, Room 1, São Paulo – SP, 04538-132, Brazil.
Nelson Roseira Gomes Neto. Mr. Gomes Neto is our Chief Executive Officer. He also served as the former Chief Executive Officer of Compass and remains a member of the board of directors of Rumo, Compass, Comgás, Raízen and Moove. Mr. Gomes Neto is also the chair of the board of directors of Commit, Sulgás and Necta. He joined ExxonMobil Corporation in 1991 as a trainee. Throughout the course of his career, he has served in positions of increasing managerial responsibility in several business lines such as Fuels Marketing, Convenience Retailing, Natural Gas, and since 2001, as part of our Lubricants business. In February 2008, he was appointed Brazil Lubricants Officer to Esso Brasileira de Petróleo Limitada, and in December 2008, he was appointed as Vice President of the Lubricants segment. Mr. Gomes Neto holds a bachelor’s degree in engineering from Catholic University of Paraná (1992), a master’s degree in corporative finance at Fundação Getulio Vargas (1998) and an MBA from COPPEAD – UFRJ (2001).
Rodrigo Araujo Alves. Mr. Alves is our chief financial and investor relations officer. He worked at Petróleo Brasileiro S.A. from 2007 to 2023 and has broad experience in the financial area, holding the position of Executive Manager of Accounting and Tax Matters; Executive Chief Finance and Investors Relations Officer at Petrobras; Chair of the Fiscal Council of TBG; Fiscal Council member of other companies within the Petrobras group; Member of an advisory group of the International Accounting Standards Board (IASB); Member of the Executive Board of the Brazilian Association of Publicly Held Companies (ABRASCA), and Strategy Director at Cosan. Mr. Alves earned an undergraduate degree in Business Administration from the Federal University of Minas Gerais; an undergraduate degree in Accounting from Faculdade Moraes Júnior Mackenzie – Rio de Janeiro; an MBA in Economic and Financial Business Management from FGV; an executive master’s degree in Finance (with honors) from HEC Paris; he is a Certified Public Accountant (CPA) from the State of Washington – United States; he earned a COSO Internal Control Certificate from the American Institute of Certified Public Accountants (AICPA); he is certified in IFRS (CertIFR) from the Association of Chartered Certified Accountants (ACCA); he also holds degrees in Management and Finance from INSEAD; Chicago Booth; Singularity University; Fundação Dom Cabral; CFA Institute; and MDT International.
Marcelo Eduardo Martins. See “—Board of Directors.”
Maria Rita de Carvalho Drummond. Ms. Drummond has been our legal officer since 2011. She joined the Cosan Group in 2008, after leaving the law firm Barbosa, Mussnich e Aragão, where she worked from 2000 to 2004 and from 2007 to 2008. Ms. Drummond was a manager for Latin America at BAT, the controlling shareholder of Souza Cruz S.A., based in London, from 2004 to 2005. In 2019, Ms. Drummond was appointed by the Brazilian Association of Listed Companies (Associação Brasileira das Companhias Abertas) to hold a position on the Appeal Council of the National Financial System (Conselho de Recursos do Sistema Financeiro Nacional), with a mandate until March 2022. Ms. Drummond holds a law degree from Pontifícia Universidade Católica do Rio de Janeiro, a postgraduate degree in civil law from Universidade Estadual do Rio de Janeiro and a master’s degree in international law from the London School of Economics. She is currently a member of the board of directors of Rumo S.A.
Committees of the Board of Directors
Audit Committee
Our audit committee is a statutory and permanent body, responsible for undertaking technical and/or consultancy functions. Our audit committee comprises three members, elected by our board of directors for a renewable two-year term of office, limited to a ten-year office renewal, all of whom are independent and will preferably have experience in compliance. Our audit committee was created on March 28, 2012 at an extraordinary shareholders’ meeting. Our audit committee is governed by internal regulations that were approved by a meeting of our board of directors on October 29, 2018.
Our audit committee has the following responsibilities:
- voicing an opinion on retaining or discharging an independent auditor and supervising the activities of such auditor, as well as supervising our internal controls, internal audits and the team in charge of preparing our financial statements;
- monitoring the quality and integrity of internal control mechanisms and financial statements, including quarterly and interim financial information and statements;
- assessing and monitoring our risk exposure, with the power to require detailed information on policies and procedures in connection with management compensation and the use of company assets and expenses incurred on our behalf;
- assessing and monitoring, jointly with management and our internal audit area, the adequacy and respective outcomes of our transactions with related parties; and
- preparing a summary of the annual report to be submitted with the financial statements, containing a description of:
- the committee’s activities, results, conclusions reached and recommendations made; and
- any situations in which there may be an express difference among our management, our independent auditors and our audit committee regarding our financial statements.
Our statutory audit committee meets the requirements for the exemption available to foreign private issuers under paragraph (c)(3) of Rule 10A-3 under the Exchange Act. The statutory audit committee is not the equivalent of, or wholly comparable to, a U.S. audit committee. Among other differences, it is not required to meet the standards of “independence” established in Rule 10A-3 and is not fully empowered to act on all the matters that are required by Rule 10A-3 to be within the scope of an audit committee’s authority.
The following table sets forth certain information related to the current members of our audit committee, all of whom are independent:
Name | Date of Election | Position | ||
|---|---|---|---|---|
Carla Alessandra Trematore | July 31, 2023 | Chair | ||
José Alexandre Scheinkman | July 31, 2023 | Member | ||
Felício Mascarenhas de Andrade | July 31, 2023 | Member |
The terms of the current members of our audit committee expire in July 2025 or until the election of new members.
We present below a brief biographical description of each member of our audit committee.
Carla Alessandra Trematore. Ms. Trematore is currently a member of the fiscal councils of Cosan S.A. and Comgás. Ms. Trematore holds a Bachelor’s Degree in Computer Science from Universidade Estadual Paulista – UNESP and a Bachelor’s Degree in Accounting Sciences from the Pontifical Catholic University of Minas Gerais – PUC Minas. She worked at independent audit firms such as Arthur Andersen, Deloitte and EY between 1996 and 2010. She was also an internal audit manager at Confab, a publicly held Brazilian company controlled by the Italian-Argentine group Techint/Tenaris, and a partner at Hirashima & Associados, where she led the accounting and financial consulting services. Ms. Trematore acted as a consultant for the Fundação Institute of Accounting, Actuarial and Financial Research – FIPECAFI, and was also a chairman of the Audit Committee of Caixa Econômica Federal. She is currently a member of the fiscal councils of Ânima Educação, ISA CTEEP and Localiza, and the audit committees of Grupo Oncoclínicas and Allied Tecnologia.
José Alexandre Scheinkman. See “—Board of Directors.”
Felício Mascarenhas de Andrade. Mr. Andrade is a founding partner of Vecte, which provides expert advice on good corporate governance practices. He spent his career in international consulting firms such as Andersen, Accenture, EY and KPMG. Throughout his career he has advised tens of large Brazilian companies on improving their financial management, governance mechanisms, financial risk management, and preparation for IPOs, among other themes related to the growth and protection of shareholder value. Mr. Andrade holds a bachelor’s degree in computer science from Universidade Estadual Paulista and an MBA from IBMEC.
Our board of directors has determined that Carla Alessandra Trematore, José Alexandre Scheinkman and Felício Mascarenhas de Andrade meet the independence requirements of the SEC and the NYSE listing standards, and Mr. José Alexandre Scheinkman is our audit committee financial expert.
People and Nominating Committee
Our people and nominating committee was established on August 18, 2011 and was re-constituted on April 27, 2017. On January 27, 2022, the committee was re-named the people and nominating committee effective immediately (it was previously known as the people committee). It comprises three members each appointed on a two-year term. Our people and nominating committee is governed by internal regulations that were approved at a meeting of our board of directors on January 27, 2022.
The role of our people and nominating committee is to provide guidance for strategic decision-making in relation to human resources, including, but not limited to, determining issues relating to compensation, goals, diversity, development, succession, leadership, and the identification, recruitment, interviewing and selection of potential candidates to fill vacancies on our board of directors or officers, among others. Furthermore, the committee also advises our board of directors on matters relating to the fixed and variable compensation of our directors, officers, members of our fiscal council and other employees, the definition and control of targets, as well as providing information to our board of directors.
The following table sets forth certain information related to the current members of our people and nominating committee:
Name | Date of Election | Position | ||
|---|---|---|---|---|
Rubens Ometto Silveira Mello | January 27, 2022 | Chair | ||
Burkhard Otto Cordes | January 27, 2022 | Member |
The terms of the current members of our people and nominating committee expire in May 2024.
See “—Board of Directors” above for a brief biographical description of each member of our people and nominating committee.
Strategy and Sustainability Committee
Our strategy and sustainability committee was established on January 27, 2022. The committee is comprised of at least three members, each appointed on a two-year term. Our strategy and sustainability committee is governed by internal regulations that were approved at a meeting of our board of directors on January 27, 2022.
The role of our strategy and sustainability committee is to assess the strategy, objectives, and commitments of Cosan and its subsidiaries with respect to matters related to climate change, diversity and stakeholder involvement; to promote debate about matters related to sustainability, including by proposing objectives and targets; to oversee the sustainability committees of our subsidiaries, if applicable; and to provide support for our strategic development plan by assessing potential business opportunities that are presented to our executive officers.
The following table sets forth certain information related to the current members of our strategy and sustainability committee:
Name | Date of Election | Position | ||
|---|---|---|---|---|
Ana Paula Pessoa | May 24, 2022 | Chair | ||
Luis Henrique Cals de Beauclair Guimarães | May 24, 2022 | Member | ||
Marcelo Eduardo Martins | May 24, 2022 | Member | ||
Vasco Augusto Pinto da Fonseca Dias Júnior | May 24, 2022 | Member |
The terms of the current members of our strategy and sustainability committee expire in May 2024.
See “—Board of Directors” above for a brief biographical description of each member of our strategy and sustainability committee.
Fiscal Council
The Brazilian Corporation Law establishes the responsibilities, duties and powers of the fiscal council. Fiscal council resolutions are passed upon a majority of votes of members present at fiscal council meetings.
The role of our fiscal council is to: (1) supervise the actions of officers and directors, and their compliance with legal and statutory requirements; (2) voice its opinion regarding management’s annual report, and include in its report on such matter the additional information which it believes is necessary or useful to the deliberations of our general shareholders’ meetings; (3) voice its opinion on the proposals of management bodies to be submitted to our general shareholders’ meetings in relation to changes to the capital, issuance of debentures or subscription bonuses, investment plans or capital budgets, distributions of dividends, transformations, incorporations, mergers or spinoffs; (4) report to management on any mistakes, fraud or crime which it uncovers, and if management does not take appropriate action to protect our interests, report to the general shareholders’ meeting, and recommend useful steps we may take in this regard; (5) call an ordinary general shareholders’ meeting if management bodies delay the calling thereof for over a month, and extraordinary general shareholders’ meetings whenever serious or urgent events occur, and include in the agenda for such meetings the items which it considers necessary; (6) analyze, at least on a quarterly basis, our financial statements; (7) review our financial statements for each fiscal year and voice its opinion thereon; and (8) exercise the aforementioned functions during a liquidation, taking into account the specific provisions governing such a situation.
The following sets forth certain information related to the current members of our fiscal council:
Name | Date of Election | Position | ||
|---|---|---|---|---|
Vanessa Claro Lopes | April 27, 2023 | Member | ||
João Ricardo Ducatti | July 31, 2023 | Member | ||
Marcelo Curti | April 27, 2023 | Member |
The terms of the current members of our fiscal council expire at our ordinary general shareholders’ meeting to be held in 2024.
Vanessa Claro Lopes. Ms. Lopes is currently a member of the fiscal councils of Cosan S.A. and Comgás and a member of the audit committee at Tegma Logistica S.A.. She was formerly the chairman of the fiscal council of Via Varejo S.A. from 2014 to 2018, a member of the fiscal council of Terra Santa Agro S.A. from 2016 to 2018, a member of the fiscal council of Gerdau S.A. from 2016 to 2017 and a member of the fiscal councils of Estacio Participações S.A. and Renova Energia S.A. from 2017 to 2019. With over 25 years’ experience in corporate governance and internal and external audits of large private and listed companies, she started her career at PricewaterhouseCoopers in advisory services and was responsible for the creation of the revenue assurance specialists department in Brazil for the telecoms sector. She was an executive officer and the head of the internal accounting department of TAM S.A. from 2010 to 2014, an executive officer and the head of the internal accounting department of Globex Utilidades S.A. (Grupo Pão de Açúcar) from 2004 to 2010 and a coordinator and the head of the accounting department of Grupo Telefónica from 2001 to 2004. She was formerly a professor of audit systems and information security at Objetivo University. Ms. Lopes holds an MBA from EAESP/FGV, a master’s degree in management systems from Universidade Federal Fluminense, a master’s degree in computer networks from São Judas University, an accounting degree from Universidade Federal Fluminense and a systems analysis degree from FATEC/BS.
João Ricardo Ducatti. Mr. Ducatti is a business manager. He worked at Westinghouse of Brazil from 1973 to 1982, where he was a financial resources manager and a treasurer for Latin America, then as business manager of Usina Barbacena, located in Ribeirão Preto, in 1982 and 1983. He was also an administrative and financial officer of Grupo Bom Jesus, which produces sugar and ethanol and is located in Piracicaba, from 1983 to 1991, and an administrative and financial officer of the Cosan Group, which produces sugar and ethanol and is also located in Piracicaba, from 1991 to 1995. He was also a managing officer of SUCRESP, a professional association representing 17 mills producing sugar and alcohol, from 1995 to 1999. From 1999 to the present, he has focused on providing economic and financial advisory services, asset valuation, management of corporate structuring, sales development of equity and other associated activities, through his company, RDR Consultores Associados Ltda. Mr. Ducatti holds a bachelor’s degree in business administration from Faculdade de Ciências Administrativas e Contábeis Tabajara.
Marcelo Curti. Mr. Curti is currently a member of the fiscal councils of Cosan S.A. Mr. Curti was previously a managing partner of Rio Branco Consultores Associados Ltda. and of MAIOL Assessoria em Gestão Empresarial Ltda. He worked in the Safra Group from 1981 to 2008, where he was a statutory officer. He has also been a member of the fiscal council of Duke Energy S.A. and of Hypermarcas S.A. Mr. Curti holds a bachelor’s degree in economics from Fundação Armando Álvares Penteado – São Paulo (1985) and a postgraduate degree in business administration from Fundação Escola de Comércio Álvares Penteado (1986).
Our Relationship with Our Executive Officers, Directors and Key Managers
Mr. Burkhard Otto Cordes is a member of Cosan S.A.’s boards of directors and serves as a financial manager at Aguassanta Participações S.A. Mr. Cordes was previously married to Mr. Mello’s daughter. There are no arrangements or understandings with any of our shareholders, customers, suppliers or others, pursuant to which any director or member of our senior management has been or will be selected.
Under our current bylaws, our general shareholders’ meeting is responsible for approving the annual aggregate compensation that we pay to the members of our board of directors and our executive officers. The aggregate amount of compensation paid to all members of the board of directors and its executive officers on a consolidated basis was R$346.2 million during the fiscal year ended December 31, 2023, R$265.8 million during the fiscal year ended December 31, 2022 and R$252.2 million in the fiscal year ended December 31, 2021. Our compensation strategy aims to reflect best market practice, help us retain our executives and incentivize them to produce superior results.
Our executive officers receive the same benefits generally provided to our employees. Members of our board of directors are not entitled to these benefits. We currently have no employment agreements with our directors and executive officers providing for benefits upon the termination of employment.
Equity-Based Compensation Plans
In addition, certain executive officers, managers and other eligible employees may receive equity-based compensation pursuant to our stock option plan.
See “—E. Share Ownership—Equity-Based Compensation Plans” for information on the equity-based compensation plans in place at our Company.
Summary of Significant Differences of Corporate Governance Practices
The Sarbanes-Oxley Act, as well as related rules subsequently implemented by the SEC, require foreign private issuers, such our Company, to comply with various corporate governance practices. In addition, following the listing of our ADSs on the NYSE, we are required to comply with the listing rules of the NYSE, or NYSE rules.
NYSE rules include certain accommodations to corporate governance requirements that allow foreign private issuers, such as our Company, to follow “home country” corporate governance practices in lieu of the otherwise applicable corporate governance standards of the NYSE. Under NYSE rules, we are required to:
- have an audit committee or audit board in accordance with an exemption available to foreign private issuers, as discussed below;
- provide prompt certification by our chief executive officer of any material non-compliance with any corporate governance rules; and
- provide a brief description of the significant differences between our corporate governance practices and the NYSE corporate governance practice required to be followed by U.S. listed companies.
A summary of the significant differences between our corporate governance practices and those required of U.S. listed companies is included below.
Majority of Independent Directors
NYSE rules require that a majority of the board of a listed company consist of independent directors. Independence is defined by various criteria, including the absence of a material relationship between the director and the listed company. Under the B3 listing rules, our board of directors must be composed of a minimum of two independent directors or a minimum of 20% of our total directors must be independent, whichever is greater. Additionally, pursuant to the Brazilian Corporation Law and CVM regulations, our directors are required to meet certain qualification requirements that address their compensation, duties and responsibilities. While our directors meet the qualification requirements of the Brazilian Corporation Law and CVM regulations, we do not believe that a majority of our directors would be considered independent under the NYSE rules test for director independence.
Executive Sessions
NYSE rules require that independent directors must meet at regularly scheduled executive sessions. The Brazilian Corporation Law does not have a similar provision, however, the bylaws may provide for such requirement. Under our bylaws, all directors shall meet at least four times each year.
Nominating/Corporate Governance Committee and Compensation Committee
NYSE rules require that listed companies maintain a nominating/corporate governance committee and a compensation committee comprising entirely independent directors and governed by a written charter addressing each committee’s required purpose and detailing its required responsibilities. The responsibilities of the nominating/corporate governance committee include, among other matters, identifying and selecting qualified board member nominees and developing a set of applicable corporate governance principles. The responsibilities of the compensation committee, in turn, include, among other matters, reviewing corporate goals relevant to the chief executive officer’s compensation, evaluating the chief executive officer’s performance, approving the chief executive officer’s compensation levels and recommending to the board compensation of other executive officers, incentive compensation and equity-based compensation plans.
Pursuant to the Brazilian Corporation Law, we are not required to maintain a nominating committee, corporate governance committee or a compensation committee. Aggregate compensation for our directors and executive officers is established by our shareholders at annual shareholders’ meetings. The allocation of aggregate compensation among our directors and executive officers is determined by our directors at board of director meetings. The Brazilian Corporation Law and CVM regulations establish rules in relation to certain qualification requirements and restrictions, compensation, duties and responsibilities of a company’s executives and directors. In addition to the foregoing, the Novo Mercado Rules applicable to us require that the board of directors of a company discusses and approves certain internal policies, including a compensation policy and a nominating policy.
Audit Committee and Audit Committee Additional Requirements
Under Section 303A.06 of the NYSE listing rules and the requirements of Rule 10A-3 under the Exchange Act, each U.S. listed company is required to have an audit committee consisting entirely of independent members that comply with the requirements of Rule 10A-3. In addition, the audit committee must have a written charter compliant with the requirements of Section 303A.07(b) of the NYSE listing rules, the listed company must have an internal audit function and the listed company must fulfill all other requirements of the NYSE and Rule 10A-3. The SEC has recognized that, for foreign private issuers, local legislation may delegate some of the functions of the audit committee to other advisory bodies. We have established a statutory audit committee. Our statutory audit committee meets the requirements for the exemption available to foreign private issuers under paragraph (c)(3) of Rule 10A-3 under the Exchange Act. The statutory audit committee is not the equivalent of, or wholly comparable to, a U.S. audit committee. Among other differences, it is not required to meet the standards of “independence” established in Rule 10A-3 and is not fully empowered to act on all the matters that are required by Rule 10A-3 to be within the scope of an audit committee’s authority.
Shareholder Approval of Equity Compensation Plans
NYSE rules provide for limited exceptions to the requirement that shareholders be given the opportunity to vote on all equity compensation plans and material revisions to those plans (which may be approved for an undefined period). In contrast, pursuant to the Brazilian Corporation Law, all stock option plans must be submitted for approval by the holders of our common shares.
Corporate Governance Guidelines
NYSE rules require that listed companies adopt and disclose corporate governance guidelines. We comply with the corporate governance guidelines under applicable Brazilian law and the Novo Mercado Rules. We believe the corporate governance guidelines applicable to us under Brazilian law are consistent with the NYSE rules. We have adopted and observe policies that deal with the public disclosure of all relevant information and which requires management to disclose all transactions relating to our securities as per CVM’s regulations and the Novo Mercado Rules.
Internal Audit Function
NYSE rules require that listed companies maintain an internal audit function to provide management and the audit committee with ongoing assessments of our risk management processes and system of internal control.
The Novo Mercado Rules provide that the listed companies are required to have an audit department whose activities are reported to our board of directors, and which among other matters, is responsible for assessing the quality and effectiveness of our risk management processes.
As of December 31, 2023, we had 11,656 employees (including employees of our subsidiaries and excluding employees of Raízen). The following table sets forth the number of our total employees as of the dates indicated (including employees of Cosan Limited, Cosan, Cosan Logística and their respective subsidiaries for dates prior to the Merger):
| As of December 31, | |||||||
|---|---|---|---|---|---|---|---|---|
| 2023 | 2022 | 2021 | |||||
Brazil | 11,188 | 10,658 | 10,078 | |||||
Abroad | 468 | 506 | 503 | |||||
Total(1) | 11,656 | 11,164 | 10,581 | |||||
(1) As of December 31, 2023, 2022 and 2021, respectively, we had 9,244, 9,252 and 9,070 male employees, and 2,312, 1,930 and 1,511 female employees, respectively (including employees of Cosan Limited, Cosan, Cosan Logística and their respective subsidiaries for dates prior to the Merger).
In the year ended December 31, 2023, we had an average of 5,568 temporary employees.
We believe that we have good relations with our employees and the unions that represent them. Collective bargaining agreements to which we are party have either one-year or two-year terms, are subject to annual renewal and are subject to changes in Brazilian law. We apply the terms of bargaining agreements entered into with the unions equally to unionized and non-unionized employees.
Our total annual personnel expenses were R$2,893.9 million for the year ended December 31, 2023, which includes a provision for vacations, and bonuses, taxes and social contributions.
We offer our employees, including our executive officers, various benefits, which are provided in accordance with the employee’s position in our company. Benefits include medical (including dental) assistance, meal and transport vouchers, life insurance, maternity leave, scholarships and funeral assistance and nursery assistance. All of our employees participate in profit sharing plans developed with the labor unions of which our employees are members, which provide performance-based compensation.
As of April 10, 2024, the following members of the board of directors and executive officers owned our shares and ADSs:
Name | Position Held – | Cosan | Cosan ADSs | |||
|---|---|---|---|---|---|---|
Rubens Ometto Silveira Mello* | Chairman | 562,702,674 | 27,402,567 | |||
Others | Board Members | 3,081,754 | 4,896,920 |
* Shares owned directly and indirectly by Mr. Rubens Ometto Silveira Mello include the total shares of our controlling group, which is not wholly-owned by him.
Other than as disclosed in the table above, none of the members of our board of directors or our executive officers currently owns or holds common shares or ADSs of our Company.
Equity-Based Compensation Plans
Below is a description of our equity-based compensation plans. See note 24 to our individual and consolidated financial information included elsewhere in this current report for additional information.
Cosan S.A.
Cosan has two share-based compensation plans in force: (i) the share purchase option plan, approved by the Company’s Ordinary and Extraordinary General Meeting, held on July 29, 2011, or the “Stock Option Plan,” which has not made active grants since 2017, and (ii) the share-based remuneration plan, approved by the Company's Ordinary and Extraordinary General Meeting, held on April 27, 2017, or the “Share-Based Remuneration Plan.” The Share-Based Remuneration Plan provides for the distribution of up to 3% of the Company’s common shares, after giving effect to the issuances of common shares under such plan.
As of the date of this current report, 34,622,217 common shares of the Company have been granted pursuant to these plans, amounting to 1.85% of the Company’s share capital as of December 31, 2023. This includes shares that were granted in 2017 by the Company in replacement of the options delivered until 2017 as part of the Stock Option Plan, before it was replaced by the Share-Based Remuneration Plan.
Rumo
On May 5, 2021, a new share-based payment plan allowing for a total award of up to 1,481,000 shares of Rumo was approved. The eligible executives may be granted common shares or no-cash consideration or cash, at Rumo’s discretion, after five years.
On September 15, 2021, a new share-based payment plan allowing for a total award of up to 1,560,393 shares of Rumo was approved. The eligible executives may be granted common shares or no-cash consideration or cash, at Rumo’s discretion, after three years.
On September 1, 2022, two new share-based payment plans were approved allowing for (i) a total award of up to 1,781,640 shares of Rumo, to be granted at Rumo’s discretion to eligible executives through common shares, no cash consideration, or cash, after three years; and (ii) a total award of up to 146,909 shares of Rumo, to be granted at Rumo’s discretion to eligible executives through common shares, no-cash consideration or cash.
Comgás
On November 1, 2021, Comgás awarded 195,414 restricted shares to certain eligible executives, which will be fully transferred three years from the approval of the grant. The final transfer of the restricted shares to the executives is subject to the terms of the applicable share-grant program.
Compass
On August 1, 2021, a new share-based payment plan allowing for a total award of up to 30,205 shares of Compass was approved. The eligible executives may be granted common shares or no-cash consideration or cash, at Compass’s discretion, after two years.
On August 1, 2021, a new share-based payment plan allowing for a total award of up to 35,777 shares of Compass Comercialização was approved. The eligible executives may be granted common shares or no-cash consideration or cash, at Compass Comercialização’s discretion, after three years.
On August 1, 2021, a new share-based payment plan allowing for a total award of up to 173,316 shares of Compass was approved. The eligible executives may be granted common shares or no-cash consideration or cash, at Compass’s discretion, after three years.
On August 1, 2021, a new share-based payment plan allowing for a total award of up to 38,158 shares of Terminal de Regaseificação de São Paulo was approved. The eligible executives may be granted common shares or no-cash consideration or cash, at Terminal de Regaseificação de São Paulo’s discretion, after three years.
On November 1, 2021, a new share-based payment plan allowing for a total award of up to 1,672,626 shares of Compass was approved. The eligible executives may be granted common shares or no-cash consideration or cash, at Compass’s discretion, after three years.
On February 1, 2022, a new share-based payment plan allowing for a total award of up to 88,899 shares of Compass was approved. The eligible executives may be granted common shares or no-cash consideration or cash, at Compass’s discretion, after three years.
On August 1, 2022, a new share-based payment plan allowing for a total award of up to 31,258 shares of Terminal de Regaseificação de São Paulo was approved. The eligible executives may be granted common shares or no-cash consideration or cash, at Terminal de Regaseificação de São Paulo’s discretion, after three years. On August 1, 2022, a new share-based payment plan allowing for a total award of up to 826,392 shares of Compass was approved. The eligible executives may be granted common shares or no-cash consideration or cash, at Compass’s discretion, after three years.
On August 1, 2022, a new share-based payment plan allowing for a total award of up to 30,441 shares of Compass Comercialização was approved. The eligible executives may be granted common shares or no-cash consideration or cash, at Compass Comercialização’s discretion, after three years.
Moove
On July 31, 2020, Moove awarded 106,952 share appreciation rights to certain eligible executives. The rights entitle the executives to a cash payment after five years of service. The amount payable will be determined based on the increase of the share price between the grant date and the vesting date. The rights must be exercised on the vesting date and will expire if not exercised on that date.
On July 31, 2021, Moove awarded 80,729 share appreciation rights to certain eligible executives. The rights entitle the executives to a cash payment after three years of service. The amount payable will be determined based on the increase of the share price between the grant date and the vesting date. The rights must be exercised on the vesting date and will expire if not exercised on that date.
On July 31, 2022, Moove awarded 615,362 share appreciation rights to certain eligible executives. The rights entitle the executives to a cash payment after four years of service. The amount payable will be determined based on the increase of the share price between the grant date and the vesting date. In July 2023, such share appreciation rights were cancelled.
On July 31, 2022, Moove awarded 77,967 share appreciation rights to certain eligible executives. The rights entitle the executives to a cash payment after three years of service. The amount payable will be determined based on the increase of the share price between the grant date and the vesting date. The rights must be exercised on the vesting date and will expire if not exercised on that date.
On July 31, 2023, Moove awarded 82,204 share appreciation rights to certain eligible executives. The rights entitle the executives to a cash payment after three years of service. The amount payable will be determined based on the increase of the share price between the grant date and the vesting date. The rights must be exercised on the vesting date and will expire if not exercised on that date.
On July 31, 2023, Moove created an incentive program conditioned on length of service (service conditions) and the occurrence of certain liquidity events as set forth in such program (performance conditions). The options granted to participants may only be exercised after they become vested options, and the maximum period for exercising such options will be six years from the date of grant. As of the date of this current report, Moove has awarded 1,342,609 shares to certain eligible executives.
Cosan Limited and Cosan Logística
Cosan Limited’s and Cosan Logística’s equity-based compensation plan were discontinued and all outstanding awards were settled before the merger of Cosan Limited and Cosan Logística with and into Cosan S.A.
As of April 30, 2024, our issued share capital was R$8,682,543,550.97, fully issued and paid in comprising 1,874,070,932 common shares, nominative and without nominal value (including 13,735,073 treasury shares).
The following table sets forth, as of April 30, 2024, except where otherwise noted, certain information with respect to the number of common shares beneficially owned (as defined by the SEC’s rules and regulations) by (1) each of our executive officers, (2) each member of our board of directors, (3) all current executive officers and directors as a group and (4) each person known to us to own beneficially more than 5% of our outstanding common shares:
Shareholders | Total Number of | Percentage | ||||
Controlling Group | 672,312,942 | 35.87% | ||||
Board of directors | 18,783,321 | 1.00% | ||||
Executive officers | 3,886,113 | 0.21% | ||||
Others | 1,165,353,483 | 62.18% | ||||
Treasury shares | 13,735,073 | 0.73% | ||||
Total | 1,874,070,932 | 100.0% | ||||
Ex-Treasury Shares | 1,860,335,859 | 99.27% |
The total number of ADSs held by U.S. investors as of April 30, 2024 is 62,082,104. The total number of common shares held by U.S. investors as of April 30, 2024 is 181,452,546 (excluding common shares held by JPMorgan Chase Bank, N.A. as depositary).
Controlling Group: Aguassanta Investimentos S.A.
On April 30, 2019, a corporate reorganization was approved among companies from our controlling group (Aguassanta Participações S.A., or “Aguassanta,” Queluz S.A. Administração e Participações, or “Queluz,” Costa Pinto S.A., or “Costa Pinto,” and Usina Bom Jesus S.A. Açúcar e Álcool, or “UBJ”), which wished to consolidate their control with Aguassanta, controlled by Mr. Rubens Ometto Silveira Mello. As a result, Costa Pinto, UBJ and Queluz merged into Aguassanta on April 30, 2019.
This reorganization resulted in the transference by Queluz and UBJ to Aguassanta of 19,499,418 class A common shares issued by Cosan Limited and the transfer by Queluz and Costa Pinto to Aguassanta of all the class B common shares issued by Cosan Limited.
On July 29, 2019, Aguassanta approved the incorporation a new company named Aguassanta Investimentos S.A., or “Aguassanta Investimentos,” into which Aguassanta contributed the total of class A common shares and class B common shares issued by Cosan Limited which it held.
Aguassanta Investimentos was the direct controlling shareholder of Cosan Limited, and our indirect controlling shareholder, prior to our intra-group restructuring that occurred on January 22, 2021, pursuant to which Cosan Limited and Cosan Logística were merged into us. Aguassanta Investimentos is our current controlling shareholder.
Voting Rights of Principal Shareholders
Our principal shareholders do not have voting rights distinct from those of our other shareholders of the same class of shares. See “Description of Share Capital—A. Memorandum and Articles of Association.”
Cosan Logística
At our extraordinary shareholders’ meeting held on October 1, 2014, our shareholders approved the spin-off of our logistics business and its merger into Cosan Logística. This corporate restructuring was intended to segregate our logistics activities, by then focused on Rumo, and allowed each of our businesses to be focused on their specific sectors and also to establish capital structures appropriate for each segment. After the spin-off, Cosan Limited became not only our controlling shareholder but also of Cosan Logística. As a result of the spin-off, all shares issued by Cosan Logística previously held by us were canceled and consequently 405,856,814 new shares of Cosan Logística were attributed to our shareholders, at a 1:1 ratio. Since October 6, 2014, our shares were traded without rights to Cosan Logística’s shares, which in turn were traded from October 6, 2014 until March 5, 2021 on the Novo Mercado segment of the B3 under the ticker symbol “RLOG3.” In addition, the spin-off had no impact on the rights attached to our shares. On January 22, 2021, the shareholders of Cosan Limited (the former parent company of Cosan and Cosan Logística) and the shareholders of Cosan and Cosan Logística approved an intra-group restructuring, announced on July 3, 2020 by Cosan, Cosan Limited and Cosan Logística, consisting of a merger of companies under common control, as provided by art. 264, paragraph 4, of Brazilian Law No. 6,404, pursuant to which Cosan Limited and Cosan Logística were merged into Cosan.
Rumo
On February 24, 2014, Cosan S.A., through its subsidiary Rumo Logística Operadora Multimodal S.A., or “Rumo Logística,” submitted to ALL a binding proposal for the incorporation of ALL by Rumo. The merger was completed on April 1, 2015. See “Information on the Company—A. History and Development of the Company” for further information.
Radar
On August 27, 2008, as amended on July 14, 2012, September 28, 2012 and November 4, 2016, we entered into a shareholders’ agreement with the TIAA-CREF group, regarding its subsidiary Radar, whose corporate purpose is to identify and acquire rural properties with high appreciation potential for subsequent leasing and/or sale. This agreement was terminated on November 3, 2021, and on the same date we, Mansilla Participações Ltda., and Radar II Propriedades Agrícolas S.A. entered into a new shareholders’ agreement. We currently hold approximately 50% of Radar’s capital, with the remaining 50% being divided among other investors part of TIAA-CREF group. According to the shareholders’ agreement, we retain the majority of votes on Radar’s Board of Directors as well as the power to direct the activities of Radar.
Tellus
On July 1, 2011, we entered into a shareholders’ agreement with TIAA-CREF in order to govern certain of their rights, duties and obligations as shareholders of Tellus Brasil Participações S.A., as amended on October 20, 2022.
Janus
On August 19, 2014, we entered into a shareholders’ agreement with TIAA-CREF in order to govern certain of their rights, duties and obligations as shareholders of Janus Brasil Participações S.A., as amended on October 20, 2022.
Duguetiapar e Gamiovapar
On October 20, 2022, we entered into a shareholders’ agreement with TIAA-CREF in order to govern certain of their rights, duties and obligations as shareholders of Duguetiapar Empreendimentos e Participações S.A. and Gamiovapar Empreendimentos e Participações S.A.
Moove
On July 3, 2012, we entered into the European lubricants and specialties market by signing a sale and purchase agreement with Esso Petroleum Company to acquire Comma Oil & Chemicals Limited (currently known as Moove Lubricants). The value of the transaction, after all adjustments, was less than U.S.$100 million. Moove Lubricants continued to operate in the ordinary course under the “Comma” brand, manufacturing and selling Comma-branded and private label products following the change in control, in order to facilitate our entry into the European lubricants market.
Compass and Comgás
On November 5, 2012, we concluded the acquisition of 60.05% of Comgás from BG Group for R$3.4 billion.
In December, 2017, the put options held by three vehicles of the Shell Group against Cosan Limited were exercised. As a result, Cosan Limited delivered to Shell 17,187,937 common shares issued by us, representing 4.21% of its capital, and received 21,805,645 common shares of Comgás. These were transferred to us, under the same price and payment term conditions of the transaction with Shell. At the conclusion of this transaction, the Cosan Limited reduced its interest in our share capital to 57.98% and we increased our interest in Comgás to 79.87%, with Shell no longer being a shareholder of Comgás.
At the end of this transaction, we and Integral Investments B.V. terminated the Comgás shareholders’ agreement dated December 19, 2012.
On March 8, 2019, we announced the conclusion of the tender offer for the acquisition of class A preferred shares issued by Comgás. A total of 19,496,165 preferred shares were acquired by us in the tender offer at a price of R$82.00 per share, representing approximately 14.77% of Comgás’s capital stock. As a result, our interest in Comgás increased from 80.12% prior to this tender offer to 94.88% following the conclusion of the tender offer, while our interest in Comgás increased from 79.88% prior to this tender offer to 94.65% following the conclusion of the tender offer.
On June 30, 2019, we concluded the tender offer for the acquisition of class A preferred shares issued by Comgás. A total of 22,597,886 preferred shares were acquired by us in the tender offer at a price of R$82.00 per share, representing approximately 17.11% of Comgás’s capital stock. As a result, our interest in Comgás increased from 94.88% prior to this tender offer to 97.23% following the conclusion of the tender offer.
On September 30, 2019, we concluded the tender offer for acquisition of common shares issued by Comgás. A total of 2,527,682 common shares of Comgás were acquired by us in the tender offer at a price of R$83.16 per preferred share, representing approximately 1.92% of Comgás’s capital stock. As a result, our interest in Comgás increased from 97.23% prior to the tender offer to 99.15% following the conclusion of the tender offer.
On January 14, 2020, we contributed to the share capital of our wholly owned subsidiary Compass, formerly known as Distribuidora de Gás Participações S.A., the totality of the shares we held in Comgás (i.e., 103,699,333 common shares and 27,682,044 preferred shares), equivalent to 99.15% of the total share capital of Comgás, for an amount of R$2,862 million. As the parties to the transaction are under common control transaction, there was no effect on our consolidated financial statements. We derecognized the investment in Comgás and we recognized an investment in Compass for the same amount.
On January 3, 2022, Compass, through one of its subsidiaries, concluded the acquisition of 51% of the share capital of Companhia de Gás do Estado do Rio Grande do Sul, or “Sulgás,” in the privatization process carried out by the state of Rio Grande do Sul, former controlling shareholder of Sulgás.
On July 11, 2022, Compass concluded the acquisition from Petrobras of 51% of the share capital of Gaspetro, now known as Commit Gás S.A. (“Commit”). On October 9, 2023, Commit’s shareholders approved the partial spin-off of Commit to form a new company to be called Norgás S.A. (“Norgás”). The spun-off portion comprises shares held by Commit in Companhia de Gás do Ceará (“CEGÁS”), Companhia Potiguar de Gás (“POTIGÁS”), Gás de Alagoas S.A. (“ALGÁS”), Sergipe Gás S.A. (“SERGÁS”) and Companhia Pernambucana de Gás (“COPERGÁS”).
On October 20, 2023, Compass, through one of its subsidiaries, concluded the acquisition of 51% of the share capital of Biometano Verde Paulínia S.A., a company that will invest in the development of a biomethane purification plant.
On November 13, 2023, Compass announced the creation of a new business, known as Edge, responsible for the consolidation of Compass’s marketing and services activities, which includes the liquified natural gas regasification terminal located in Santos, biomethane operations, gas trade and other infrastructure project.
Shareholders’ Agreements and Other Arrangements
Agreements between Shell and Us
We and Shell have entered into other definitive agreements, among others, concerning the scope of the Joint Venture, the governance and management of the Joint Venture and the granting of reciprocal put and call options concerning their interests in the Joint Venture. Each of these agreements was entered into on June 1, 2011.
The shareholders’ agreement for Raízen, or the “Raízen Shareholders’ Agreement,” establishes the scope and governance of the Joint Venture. The agreement provides that the scope of the Joint Venture is the global production of sugarcane-based ethanol and sugar and the distribution; the commercialization and sale of fuel products and lubricants; the operation and franchising and/or licensing of convenience stores businesses within Brazil; the supply and commercialization of fuel products; the operation of retail stations and operation and franchising and/or licensing of convenience stores; the operation of the refinery in Buenos Aires; and the supply, blending, commercialization, and sale of lubricants within Argentina. We, Shell and our respective affiliates are prohibited from competing with the Joint Venture as long as they remain shareholders of the Joint Venture (subject to customary exceptions).
The Raízen Shareholders’ Agreement provides that we and Shell are required to hold a prior meeting whenever a general meeting or a board of directors meeting is convened and to vote at the general meetings, or instruct our appointed representatives to the board of directors to vote at the meetings of the board of directors, in a manner consistent with the resolutions adopted at the prior meeting.
The Raízen Shareholders’ Agreement provides certain significant matters, however, will be subject to the approval of shareholders, at a prior meeting, representing at least 75% of Raízen’s capital stock, namely: (i) appointment or removal of members of the board of directors and the fiscal council or establishment of the fiscal council; (ii) approval of management accounts and financial statements; (iii) resolutions related to the allocation of profits during the year and the distribution of dividends or interest on equity, in accordance with the proposal submitted by the board of directors; (iv) any determination regarding the global compensation of the members of Raízen’s board of directors, executive board and fiscal council; (v) creation of any share grant plan in relation to Raízen’s shares; (vi) any amendment to or termination of the management compensation plan or any decision not to pay any amount payable to any participant in said plan; (vii) any amendment to Raízen’s bylaws or the respective document of any of its subsidiaries; (viii) any change to Raízen’s business purpose or the business purpose of any of its subsidiaries; (ix) any increase or decrease Raízen’s in our capital stock; (x) redemption, amortization, repurchase, alteration or any other form of reorganization or restructuring of Raízen’s shares or creation of additional classes of our shares; (xi) any split or reverse split of Raízen’s shares or payment of share dividends; (xii) any consolidation, spin-off or merger involving Raízen, merger of Raízen’s shares or change in its corporate type or similar transaction in any of its subsidiaries; (xiii) winding up, dissolution, bankruptcy, voluntary termination of business activities or reorganization of Raízen or its subsidiaries; (xiv) appointment or dismissal of a liquidator or member of the audit committee during any period of our liquidation or of any of Raízen or any subsidiary ; (xv) resolution of any matters to which shareholder representatives have referred at a shareholders’ meeting or prior meeting; and (xvi) provided that it is put to vote at any shareholders’ meeting or prior meeting, approval of any act or transaction described in the Shareholders’ Agreement.
Unless another shareholder elects a member of Raízen’s board of directors who is not considered an independent member, we and Shell shall appoint, each, three members of our board of directors, and one of the members appointed by us must be Rubens Mello, as executive chairman of the board of directors. In addition, we and Shell shall each appoint one member considered independent, in accordance with the applicable regulations. Finally, the Raízen Shareholders’ Agreement mentions certain situations in which the voting rights of shareholders would be impaired as a result of a conflict of interest.
In November 2016, we executed amendments to certain agreements with Shell to remove the fixed-date call options over Raízen S.A. shares exercisable in 2021 and 2026 and replace them with certain call and put options exercisable by us or Shell in certain circumstances, including, among others, (1) fundamental breaches of the obligations provided for in the agreements governing the Joint Venture, (2) breach of anticorruption laws, (3) insolvency or bankruptcy of a party, (4) change of control and (5) in the event of the death or disability of our current Chairman, Mr. Rubens Ometto Silveira Mello or if he fails to attend meetings of the board of directors of Raízen for 12 consecutive months. Moreover, we granted Shell a call option that is applicable if we fail to comply with certain obligations agreed upon with Shell or if certain of Raízen’s or our financial indices are not met.
We also granted Shell a call option that can be exercised by Shell if a controlling company (referred to as a “Controlling Entity”) fails to (1) have a CEO for a period exceeding six months, (2) publish or prepare, as required by law, its financial statements under the terms and conditions agreed in the Joint Venture Agreement, or (3) if Cosan or a new shareholder of Cosan (referred to as a “New Cosan Shareholder”), as applicable, with respect to a joint venture entity (referred to as a “JV Entity”), fails to (i) appoint members to the executive board or (ii) propose names of candidates for the position of CEO of Raízen within the period provided for in the Shareholders’ Agreements. Lastly, there is a call option granted by us to Shell in the event of an involuntary delisting or involuntary suspension of the registration, as a publicly held company, of Cosan or any successor thereof.
We and Shell further agreed to renew the existing lock-up period for five years from the date of the execution of the amendment, following which the parties may sell their shares in Raízen S.A. subject to compliance with certain preemption rights in each other’s favor.
In May 2021 and July 2021, we executed amendments to certain agreements in anticipation of Raízen’s initial public offering, which was completed in August 2021. As part of these amendments, the lock-up periods provided for in the applicable agreements were renewed for an additional five years from July 2021. The call and put options described above remained the same.
On July 27, 2023, we entered into the Eighth Amendment to the Shareholders’ Agreement in order to (i) establish the organization of the Lubricants Strategy and Operations Committee, (ii) include Cosan Nove Participações S.A. as a new party of the Shareholders’ Agreement, and (iii) reflect recently-made amendments that have been made to Raízen’s bylaws.
Radar Propriedades Agrícolas S.A. – Shareholders’ Agreement
Mansilla Participações Ltda., Teachers Insurance and Annuity Association of America, we and Radar II Propriedades Agrícolas entered into this shareholders’ agreement on August 27, 2008, amended on November 4, 2016. This shareholders’ agreement consolidates Radar’s shareholders resolutions about share control, transfer of shares, preemption rights, tag‑along and the right to appoint the members of the board of directors. Subject to certain exceptions, corporate resolutions must be approved by shareholders representing a majority of the voting shares.
We, Mansilla Participações Ltda., and Radar II Propriedades Agrícolas entered into a new shareholders’ agreement on November 3, 2021. This shareholders’ agreement consolidates Radar’s shareholders resolutions about shareholders meetings, conditions of future property investments by Radar, transfer of shares, preemption rights, tag‑along, right of first offer (on the sale of certain investments), buy/sell right, the right to appoint the members of the board of directors and conditions of approval of some matters by the board of directors. Subject to certain exceptions, corporate resolutions must be approved by shareholders representing a majority of the voting shares.
Radar II Propriedades Agrícolas S.A. – Shareholders Agreement
The shareholders’ agreement of Radar II Propriedades Agrícolas S.A. was executed by and among Mansilla Participações Ltda., Teachers Insurance and Annuity Association of America, a New York Corporation and us on September 28, 2012, amended on November 4, 2016. This Shareholders Agreement covered Radar II’s shareholders resolutions about share control, transfer of shares, preemption rights, tag‑along and the right to appoint the members of the Board of Directors. Except for certain relevant decisions, the corporate resolutions were to be adopted by shareholders representing the majority of the voting shares.
We and Mansilla Participações Ltda. entered into a new shareholders’ agreement on November 3, 2021. This shareholders’ agreement covers Radar II’s shareholders resolutions about shareholders meetings, conditions of future property investments, Radar II’s voting rights in Radar I and of the group companies, transfer of shares, preemption rights, tag‑along, right of first offer (on the sale of certain investments), buy/sell right, the right to appoint the members of the board of directors and conditions of approval of some matters by the board of directors. Subject to certain exceptions, the corporate resolutions shall be adopted by shareholders representing the majority of the voting shares.
Rumo S.A. – Shareholders’ Agreement
Cosan Logística and Mrs. Julia Dora Antonia Koranyi Arduini entered into the Arduini Shareholders’ Agreement on November 28, 2016. On December 31, 2016, Rumo Logística was merged into its wholly owned subsidiary Rumo S.A., and on January 22, 2021, Cosan Logística was merged into Cosan S.A. As a result, the current parties to the Arduini Shareholders’ Agreement are Rumo S.A. (as the successor entity to Rumo Logística), Cosan S.A. (as the successor entity to Cosan Logística), and Mrs. Julia Arduini.
The Arduini Shareholders’ Agreement defines the terms and conditions that govern the relationship between the parties to the agreement, in particular with respect to: (1) the election of members of our board of directors; (2) the restrictions on the sale and transfer of our shares; and (3) voting arrangements for our shareholders, general meeting and board of directors meeting. The Arduini Shareholders’ Agreement will remain in force for 10 years from November 28, 2016 and may be terminated early if Mr. Rubens Mello leaves the position of chairman of our board of directors or if Julia Arduini’s interest in the company decreases by 50% after the three-year lock-up period on the transfer of shares to which the parties are subject. In addition, the Arduini Shareholders’ Agreement states that our shareholders and board of directors’ meetings will be preceded by preliminary meetings between the parties to the Arduini Shareholders’ Agreement, which shall determine the voting instructions for their representatives at those meetings, who shall vote together as a block.
Tellus Brasil Participações S.A. – Shareholders’ Agreement
The Shareholders Agreement of Tellus Brasil Participações S.A., executed by and among TIAA-CREF Global Agriculture LLC, Nova Gaia Brasil Participações Ltda., Terraviva Brasil Participações Ltda., Radar Propriedades Agrícolas S.A., and us on July 1, 2011, amended on December 20, 2013, December 21, 2014 and October 20, 2022. This Shareholders Agreement consolidates Tellus’ shareholder resolutions about corporate capital and share control, corporate governance, redemption right, put option, transfer of shares, preemption rights, tag‑along, Cosan’s right of first refusal (on the sale of investment), noncompetition provisions and right to appoint the members of the Board of Directors. Except for certain reserved matters, corporate resolutions must be approved by shareholders representing a majority of the voting shares.
Janus Brasil Participações S.A. – Shareholders’ Agreement
The Shareholders Agreement of Janus Brasil Participações S.A., executed by and among TIAA-CREF Global Agriculture II LLC, Helios Brasil Participações Ltda., Iris Brasil Participações Ltda., Radar Propriedades Agrícolas S.A. and us on September 23, 2014, amended on October 20, 2022. This Shareholders Agreement consolidates Janus’ shareholder resolutions about corporate capital and share control, corporate governance, redemption right, put option, transfer of shares, preemption rights, tag‑along, Cosan’s right of first refusal (on the sale of investment), noncompetition provisions and the right to appoint the members of the Board of Directors. Except for certain reserved matters, corporate resolutions must be approved by shareholders representing a majority of the voting shares.
Duguetiapar Empreendimentos e Participações S.A. e Gamiovapar Empreendimentos e Participações S.A. – Shareholders’ Agreement
The Shareholders’ Agreement of Duguetiapar Empreendimentos e Participações S.A., or “Duguetiapar,” and Gamiovapar Empreendimentos e Participações S.A., or “Gamiovapar,” executed by and among TIAA-CREF Global Agriculture LLC, Nova Gaia Brasil Participações Ltda., Terraviva Brasil Participações Ltda., Radar II Propriedades Agrícolas S.A. and us on October 20, 2022, or the “Duguetiapar and Gamiovapar Shareholders’ Agreement.” The Duguetiapar and Gamiovapar Shareholders’ Agreement consolidates, as between Duguetiapar and Gamiovapar, the rules applicable to corporate share capital and control, corporate governance, redemption rights, put options, transfer of shares, preemption rights, tag-along rights, Cosan’s right of first refusal in potential asset sales, noncompete clauses and the right to appoint certain members of the boards of directors of Duguetiapar and Gamiovapar. Except where a qualified quorum is required by the constitutive documents of each company and/or the Duguetiapar and Gamiovapar Shareholders’ Agreement, corporate resolutions shall be adopted by shareholders representing the majority of voting shares.
Brado Logística e Participações S.A. – Shareholders’ Agreement
The shareholders’ agreement of Brado Logística e Participações S.A., or “Brado,” was entered into by and among Fundo de Investimento do Fundo de Garantia do Tempo de Serviço- FI-FGTS, or “FI-FGTS,” Logística Brasil-Fundo de Investimento em Participações, Deminvest Empreendimentos e Participações S.A., Markinvest Gestão de Participações Ltda., or the “Original Shareholders,” and Brado Holdings S.A., with the intervention of Brado Logística Participações S.A., Brado Logística S.A. and ALL-América Latina Logística S.A. (current Rumo S.A.) on August 5, 2013. This shareholders’ agreement resolutions about share control, transfer of shares, preemption rights, tag‑along and the right to appoint the members of the board of directors. The shareholders’ agreement also provides that certain reserved matters are subject to a right of veto on the part of the signatories. We are not a party to this Agreement. This Agreement is the object of an ongoing confidential arbitration procedure.
Cosan Lubes Investments Limited – Shareholders’ Agreement
On March 29, 2019, we entered into a shareholders’ agreement in relation to Cosan Lubes Investments Limited, or “CLI,” with Galt Lubes Investments Limited, or “Galt,” an investment vehicle managed by CVC Fund VII, or “CVC,” following Galt’s subscription for new common shares representing 30% of the share capital of CLI. This shareholders’ agreement contains the reserved matters to be voted on at the shareholder’s meeting and board of directors, lock-up provisions which restrict our ability to transfer of control of CLI for a period of five years from March 29, 2019, includes a right of first refusal for both of us and Galt and tag-along rights in the case of transfer of shares to any third party, preemption rights in the case of an issuance of new shares or other securities and provisions relating to the transfer of shares, stock option plan, noncompete and nonsolicitation, among others.
Compass – Shareholders Agreement
On December 11, 2019, Comercializadora de Gás S.A., a company wholly owned by Compass, a subsidiary of Cosan S.A., entered into a quota purchase agreement with Marcelo Faria Parodi and Ritchie Guder for the acquisition of 100% of the quotas of Compass Comercializadora de Energia Ltda., Compass Energia Ltda. and Black River Participações Ltda. These entities are involved in the sale of electric power and consulting for clients in such segment.
On January 30, 2020, on the closing date of the acquisition mentioned above, as part of the transaction, Cosan S.A. approved a capital increase in Compass, which was fully subscribed by Marcelo Parodi and Ritchie. In this context, Marcelo Parodi and Ritchie became shareholders of Compass with an interest of less than 1%.
As shareholders of Compass, Marcelo Parodi and Ritchie are subject to a lock-up provision of three years and are entitled to a put option right exercisable during a month after the publishing of the financial statements of Compass for the fiscal year of 2022. We are also entitled to a call option exercisable during the same period. Marcelo Parodi and Ritchie are entitled to a tag-along right if we decide to sell our shares in Compass, and have a preemptive right to acquire Marcelo Parodi and Ritchie’s shares. On July 16, 2021, we bought the shares of Compass owned by Marcelo Parodi and Ritchie; thus, the conditions above mentioned were terminated.
On May 31, 2021, we, Atmos Ilíquidos Fundo de Investimento em Ações, Atmos Master Fundo de Investimento em Ações, Manzat Inversiones Auu S.A. and Ricardo Ernesto Correa da Silva executed the shareholders agreement of Compass. The shareholders’ agreement consolidates Compass’s shareholders’ resolutions about corporate capital and share control, preferred shares rights, preferred shareholders prior meetings, provisions relating to transfer of shares, restriction to the transfer of Compass’s shares by the preferred shareholders for a three‑year period (except for the permitted transfers provided in the shareholders agreement), tag-along, preemption rights, and initial public offering conditions, if applicable. This agreement will remain in force (i) for 10 years from the signing date or (ii) until financial settlement of any initial public offering of the company, if applicable.
On September 4, 2021, we, Bradesco Vida e Previdência S.A., Nucleo Capital Ltda., BC Gestão de Recursos Ltda., and Prisma Capital Ltda. executed the shareholders agreement of Compass S.A. This shareholders’ agreement consolidates Compass’s shareholders resolutions about corporate capital and share control, preferred shares rights, preferred shareholders prior meetings, provisions relating to transfer of shares, restriction to the transfer of Compass’s shares by the preferred shareholders for a three-year period (except for the permitted transfers provided in the shareholders agreement), tag‑along, preemption rights, and initial public offering conditions, if applicable. This agreement will remain in force (i) for 10 years from the signing date or (ii) until financial settlement of any initial public offering of the company, if applicable.
Commit Gás S.A. – Shareholders Agreement
On December 28, 2015, Petróleo Brasileiro S.A. and Mitsui Gás e Energia do Brasil Ltda. entered into the shareholders’ agreement, or the “Commit Shareholders’ Agreement.” Following the acquisition of 51% of the share capital of Commit by Compass, on July 11, 2022, Compass entered into the Commit Shareholders’ Agreement substituting Petróleo Brasileiro S.A. The Commit Shareholders’ Agreement provides, among other things, for the controlling interest of Commit, dividends distribution, preferred shares rights, share transfer provisions, preemption right, call option, shareholders’ meeting, composition and decisions of the board of directors, executive officers composition and appointments, and administration of subsidiaries.
Cosan Dez Participações S.A. – Shareholders Agreement
On December 23, 2022, we and Bradesco BBI S.A. entered into a shareholder’s agreement relating to our subsidiary Cosan Dez, or the “Cosan Dez Shareholders’ Agreement.” The Cosan Dez Shareholders’ Agreement provides that Cosan Dez’s shareholders resolutions will establish share-control arrangements, preferred shares rights, distribution of profits, provisions relating to transfer of shares, lock-up period, preemption rights, call options and redemption rights. Cosan Dez’s Shareholders’ Agreement will remain in force as long as there are outstanding preferred shares. Cosan Dez currently holds the totality of the shareholding interest Cosan previously had in Compass.
On December 23, 2022, we and Bradesco BBI S.A. entered into a voting agreement relating to the voting rights of Cosan Dez’s shareholders, or the “Cosan Dez Voting Agreement.” Cosan Dez Voting Agreement provides that shareholders’ resolutions will establish share-control arrangements, shareholders’ meeting frequency and preferred shares voting rights. Unless a qualified quorum is otherwise required, corporate resolutions shall be adopted by shareholders representing the majority of Cosan Dez’s voting shares. Cosan Dez’s Voting Agreement will remain in force until December 23, 2032.
Cosan Nove Participações S.A. – Shareholders Agreement
On December 28, 2022, we and Itaú Unibanco S.A. entered into a shareholders’ agreement relating to our subsidiary Cosan Nove, or the “Cosan Nove Shareholders’ Agreement.” The Cosan Nove Shareholders’ Agreement provides that shareholders resolutions will establish share-control arrangements, preferred shares rights, provisions relating to transfer of shares, distribution of profits, lock-up period, preemption rights, tag-along rights, call options, redemption rights, and our rights to appoint all of Cosan Nove’s executive officers. Unless a qualified quorum is otherwise required, corporate resolutions shall be adopted by shareholders representing the majority of the voting shares of Cosan Nove. The Cosan Nove Shareholders’ Agreement will remain in force until December 28, 2057. Cosan Nove currently holds part of the shareholding interest that Cosan previously held in Raízen.
We engage in related party transactions with certain of our affiliates, some of which are of a recurring nature. Financial information with respect to certain material related party transactions is set forth in note 5.8 to our individual and consolidated financial information included elsewhere in this current report.
Our board of directors delegates to the audit committee the responsibility for reviewing and approving all related party transactions (within the meaning of Item 404 of Regulation S-K of the SEC). The audit committee is responsible for obtaining information from our directors, executive officers and major shareholders with respect to related party transactions and for then determining, based on the facts and circumstances, whether our company or a related party has a direct or indirect material interest in the transaction. As required under SEC rules, transactions that are determined to be directly or indirectly material to our company or a related party has been disclosed herein.
In the normal course of business, we have operational and financing transactions with related parties. The significant related party balances and transactions are described in note 5.8 to our individual and consolidated financial information included elsewhere in this current report.
We are party to numerous legal proceedings, the most relevant of which are further described below.
Probable Losses
In the ordinary course of our business, we are party to a number of legal proceedings for which we deem the risk of loss as probable and for which we have recorded provisions for legal proceedings in an aggregate amount of R$1,714.4 million as of December 31, 2023 and R$1,801.2 million as of December 31, 2022. Provisions relating to probable losses are categorized into tax, civil, environmental, regulatory, and labor, as described below.
Tax. We recorded provisions of R$813.7 million and R$747.6 million for tax proceedings involving probable risk of loss as of December 31, 2023 and December 31, 2022, respectively. The principal tax proceedings for which the risk of loss is probable are described below:
- FINSOCIAL – set-off applications. The Brazilian federal tax authorities denied applications filed by CLE to set off credits derived from undue payments of FINSOCIAL, a social tax levy, against other federal tax debts. Based on a favorable judicial decision, Mobil acquired the right to set off credits of FINSOCIAL against certain COFINS liabilities. However, a subsequent favorable judicial decision granted CLE immunity against the enforcement of such COFINS-related debts. Therefore, previous set-off applications were canceled, because COFINS liabilities ceased to exist, and CLE sought to use the relevant tax credits to set off other federal tax debts. However, the Brazilian federal tax authorities refused to ratify the set-offs, claiming that the COFINS immunity applied v
- only to the fiscal year during which the lawsuit was filed (i.e., in 1992). No judicial deposits were made for these proceedings. The provision for these proceedings was R$326,219 million as of December 31, 2023 and R$312.7 million as of December 31, 2022. The risk of loss is classified as probable.
- Social security contributions – In June 2010, Raízen filed an ordinary action challenging the obligation to accrue social security contributions tax based on gross revenue. The first instance court gave a partially favorable judgment. Currently, the case records are in the Court of Appeals awaiting judgment of the appeal filed by the Brazilian federal government against a partially favorable first-level decision. The risk of loss is classified as probable and as of December 31, 2023, Raízen had recorded provisions in connection with this proceeding in the aggregate amount of R$745,322 million, and the same amount had been judicially deposited in a judicial escrow account. The alleged underlying facts occurred both before and after the formation of the Raízen joint venture on April 1, 2011 and, therefore, a portion of these amounts is subject to reimbursement by Raízen’s shareholders in the event of an adverse decision.
- ICMS – We have provisioned amounts relating to tax assessments issued against us by the tax authorities related to several types of ICMS credits, including: (a) an assessment notice related to ICMS payments for raw material purchases which are considered for “use and consumption” and therefore, according to the tax authorities, are not eligible for compensation; (b) an assessment, as sole obligor, for allegedly disregarding withholding obligations of ICMS taxes in relation to a tolling agreement, arising from an agricultural partnership between our sugarcane plants and Central Paulista Ltda. Açúcar e Álcool; (c) an assessment notice related to ICMS payments related to the exportation of crystallized sugar not considered under tax immunity; (d) assessment notice related to the ICMS under the tax substitution regime; and (e) ICMS assessment notice related to interstate operations taxed as internal transactions and, therefore, subject to a higher rate. No judicial deposits have been made in connection with these proceedings. These provisions amounted to R$114,757 million as of December 31, 2023 and R$125.7 million as of December 31, 2022.
- MS Teixeira Prumo Engenharia. One of Rumo’s subsidiaries, Rumo Malha Paulista is currently a party to a public civil action before the labor courts. This proceeding originated in an inspection of the company MS Teixeira, which was hired by Prumo Engenharia, Rumo’s subcontractor. The inspecting authority alleged that workers for MS Teixeira were working in conditions that were degrading and analogous to indentured servitude. Prumo Engenharia fully assumed the responsibility for the condition of the employees, including labor and contractual liabilities and all losses resulting from the alleged unlawful working conditions put in place by its subcontractors, and the dismissal agreements of such employees were approved by the Brazilian Ministry of Labor without any participation by Rumo. In addition, a criminal investigation against Rumo was filed, which was later dismissed with the acquittal of Rumo Malha Paulista. Notwithstanding the foregoing, the Labor Prosecutor’s Office filed a public civil action solely against Rumo. Rumo was ordered (in both the first instance and on initial appeal) to comply with several obligations relating to workplace conditions, and pay collective moral damages in the amount of R$15 million, as well as fines of R$100,000 per breach or per worker in the event of future labor rights’ violations. However, it is possible under the law that an adverse decision may lead to the inclusion of Rumo Malha Paulista on the list of employers who submit workers to conditions analogous to slavery. Rumo appealed to the Superior Labor Court. Rumo entered into an agreement with the Labor Prosecutor’s Office to comply with certain obligations to improve workplace conditions and to pay a fine in the amount of R$20 million, to be applied to social-support organizations. This agreement was ratified by the Superior Labor Court but the Federal Advocacy-General’s Office filed an appeal challenging the destination of the R$20 million fine, based on the allegation it should have been applied to the employees’ public support fund, but the appeal has been dismissed. The agreement is final judgment. Awaiting proof of compliance with the agreement, that is why the risk is not probable.
- Reassessment of the Chance of Loss in Certain Proceedings. Pursuant to the tax legislation in force since 2014, amended in 2017, taxpayers subject to certain ICMS tax incentives can exclude the value of these incentives from the calculation basis for corporate income tax, subject to certain requirements and conditions. Comgás and Moove benefit from certain specific ICMS tax incentives. As such, we, through our subsidiaries, adopted this specific tax treatment based on our best understanding of the subject, substantiated by the opinion of our external legal advisors. In 2023, a decision rendered by the Brazilian Superior Court of Justice (Superior Tribunal de Justiça) cast doubt on which types of ICMS tax incentives can and cannot be subject to this tax treatment. As a result of the uncertainty created by these developments, we assessed that the chance of loss in certain legal proceedings to which Comgás and Moove are party increased from possible to probable, and accordingly constituted a provision in an amount of R$1,590.3 million, as disclosed in note 15(a) to our individual and consolidated financial information included elsewhere in this current report. This provision encompasses pre-existing legal proceedings that deal with this issue, as well as subsequent calendar-years in which we adopted the same tax treatment referred to above, but have not been subject to inspection as of the date of this current report. On December 29, 2023, Federal Law 14,789/23 was published. Such law provides for the payment of IRPJ and CSLL debts, which are derived from the deduction of ICMS tax incentives, with discounts of up to 80% of the total amounts. Comgás and Moove have chosen to settle their debts with that discount. Considering the amounts involved, applying the discounts provided this legislation, the provision was reduced to R$336.4 million.
Civil, regulatory, environmental and other claims. We, our subsidiaries and jointly controlled entity are parties to a several number of civil legal claims related to (1) indemnity for material and moral damages; (2) termination or litigation of in relation to different kinds of agreements (3) public civil claims related to sugarcane stubble burning; (4) environmental matters; and (5) compliance with certain conduct adjustment agreement and other matters. Provisions for civil, regulatory and environmental claims as of December 31, 2023 amounted to R$513.0 million and R$662.1 million as of December 31, 2022. As of December 31, 2023, R$114.7 million in judicial deposits were made for civil and environmental claims, and this figure was R$92.4 million as of December 31, 2022. Cosan S.A., its subsidiaries and jointly controlled entity are also parties to a number of regulatory legal proceedings related to (1) collection of fines by the ANTT; (2) discussions on the tariff ceiling imposed by the ANTT; and (3) certain other matters.
Labor claims. We, our subsidiaries and jointly controlled entity are also parties to a number of labor claims filed by former employees and service providers challenging, among other matters, the payment of overtime, night shift premiums and risk premiums, the recognition of employment relationships and the reimbursement of discounts from payroll, such as social contribution and trade union charges. Additionally, we are involved in several labor administrative and judicial proceedings such as labor investigations and class actions filed by the labor prosecutor’s office regarding alleged noncompliance with certain labor regulations, including work and safety rules, labor conditions and work environment, and social assistance plans. Moreover, we entered into certain consent orders (Termos de Ajustamento de Conduta) with Brazilian authorities and in the event we fail to comply with such consent orders, we could be subject to fines. Provisions for labor claims as of December 31, 2023 and 2022, amounted to R$387.7 million and R$391.5 million, respectively, while judicial deposits for labor claims amounted to R$128.9 million and R$136.0 million as of December 31, 2023 and 2022, respectively.
Possible Losses
In addition, there are currently certain legal proceedings pending in which we are involved for which we have not recorded provisions, as we deem the likelihood of loss as possible. If adverse decisions are rendered against us in any of these legal proceedings, our results of operations or financial condition could be materially and adversely affected. The aggregate amount involved in proceedings for which our risk of loss has been deemed possible as of December 31, 2023 totaled R$23,674.5 million, of which R$15,703.3 million, R$7,166.0 million and R$805.2 million were related to tax, civil, environmental and regulatory and labor claims, respectively. The principal proceedings for which we deem the risk of loss as possible are described below:
- Withholding income tax – capital gain ExxonMobil. The Brazilian federal tax authorities issued a tax assessment against CLE, as the responsible party for the collection of withholding income tax allegedly due on the capital gains recognized by ExxonMobil International Holdings B.V. and ExxonMobil Brasil Holdings B.V., companies incorporated outside of Brazil, in connection with the sale of cooperatives headquartered in the Netherlands. Brazilian tax authorities disregarded the transaction based on the understanding that CLE intended to acquire a Brazilian asset held by the Dutch cooperatives, namely Esso Brasileira de Petróleo Ltda. Administrative proceedings have been concluded, but CLE has brought judicial proceedings. The portion of the assessment related to the application of the 150% penalty remains in the administrative courts and judgment of a special appeal is pending. On December 31, 2023, the aggregate amount under discussion was R$1,139.1 million. The risk of loss is classified as possible with respect to R$1,006.2 million and remote with respect to R$390.9 million.
- Goodwill on the acquisition of Esso. The Brazilian federal tax authorities issued four tax assessments against CLE for the collection of IRPJ and CSLL relating to the calendar years 2009, 2010, 2011, 2012, 2013, 2014, 2015, 2016, 2017 and 2018 due to the write-off of goodwill expenses accrued in connection with the acquisition of Dutch cooperatives that controlled Esso Brasileira de Petróleo Ltda. CLE is challenging the 2012, 2013, 2014, 2015, 2016, 2017 and 2018 assessments in administrative proceedings, while the 2009, 2010 and 2011 assessments have been challenged before judicial courts. On December 31, 2023, the amounts under discussion were R$636.6 million (for assessments relating to the years 2009, 2010 and 2011), R$185.6 million (for assessments relating to 2012), R$199.4 million (for assessments relating to 2013), R$45.5 million (for assessments relating to the years 2014 and 2015) , R$58.9 million (for assessments relating to 2016) and R$112.8 (for the assessments relating to 2017 and 2018). The risk of loss is classified as possible.
- ICMS. We are parties to various proceedings relating to ICMS, including proceedings relating to: (1) tax assessment notices received in relation to unpaid ICMS and noncompliance with ancillary obligations, in connection with the agricultural and industrial tolling services partnership; (2) ICMS levied on the remittances for export of crystallized sugar, which we understand to be exempt. However, tax authorities classify crystallized sugar as a semi-finished product subject to ICMS; (3) ICMS withholding rate differences on the sale or purchase of goods, which after the transaction, had their tax registrations canceled; (4) disallowance of ICMS tax credits on the sale of diesel fuel to customers engaged in the agro-industrial business; (5) ICMS payments on inventory differences arising from mistaken assessments by the State Tax Administration of São Paulo, Bahia, Mato Grosso and Paraíba; (6) ICMS related to the so-called “tax war” between various Brazilian states to attract economic activities by granting tax benefits; (7) CLE being a party to a legal proceeding to challenge the state fund of fiscal equilibrium (Fundo Estadual de Equilíbrio Fiscal), or “FEEF,” further replaced by “FOT” (deposit of 10% of ICMS tax exempted by the use of tax benefits) imposed by certain Brazilian states on the industrialization and commercialization of lube oils; (8) ICMS exemption in relation to the transportation of goods for export. There is a favorable position for taxpayers in the higher courts; (9) ICMS allegedly due in the state of Mato Grosso in connection with the imposition of tax and fines of 50% of the value of operations, based on the understanding that export operations should be supported by electronic transportation documents; (10) inventory differences and (11) ICMS for payments received from distributors not connected with the sale of goods. As of December 31, 2023, the total amount involved in these proceedings was R$1,662.6 million. The risk of loss in these proceedings is classified as possible.
- Environmental civil class action. Cosan is being sued by the Municipality of Ulianópolis for environmental damages related to alleged irregular waste disposal in a landfill located in the Municipality of Ulianópolis, in the state of Pará. Eight other companies are involved in the same lawsuit, and the plaintiff intends to declare all of them as jointly liable for restoring the environmental damage involved therein. The plaintiff seeks R$179.8 million in damages reparation but the specific amount needed to restore the damage can only be estimated at a subsequent stage of the proceedings. The class action is in its pleading stage and there has been no significant progress since its commencement. We believe the amount under discussion in these proceedings to be approximately R$441 million, classified as a possible risk of loss.
- Environmental civil class action. CLE and ExxonMobil Química are being sued by the Prosecutor’s Office of the state of Rio de Janeiro in connection with soil contamination at CLE’s operational complex, located in Rio de Janeiro’s Ilha do Governador neighborhood. The Prosecutor’s Office of the state of Rio de Janeiro is seeking damages from both companies in an amount of R$55.6 million, as well as the imposition on the companies of an obligation to remediate the damage caused, based on the joint liability provided for under Brazilian environmental law. The parties are awaiting the appointment of a legal expert in order to proceed with the production and presentation of evidence. As of December 31, 2023, the amount involved was R$124 million. The risk of loss was classified as possible.
- Administrative fine. CLE is being fined R$35 million by the State Environment Agency (Instituto Estadual do Ambiente) of Rio de Janeiro, for allegedly releasing liquid waste into the Guanabara Bay, in violation of the requirements established by laws and environmental regulations. An anticipated production of evidence action (No. 0302911-45.2016.8.19.0001) was filed. The expert evidence was favorable to CLE, as it demonstrates that CLE did not engage in any irregularities. The expert evidence has already been ratified by the court and submitted to the administrative prosecution. We are currently awaiting the analysis of the abovementioned evidence and the administrative judgment of the State Environment Agency of Rio de Janeiro. As of December 31, 2023, the amount involved was R$61.1 million. The risk of loss was classified as possible.
- Environmental civil class action. Raízen Energia was named as defendant in an environmental class action filed by the Federal Prosecutor Office’s due to the burning of sugarcane straw in the municipality of Piracicaba, in the state of São Paulo, in 2007. The prosecutor’s office requests, among other things, recovery and compensation of alleged damages caused to the environment and public health, as well as the payment for substantial and moral damages. In May 2023, Raízen Energia was ordered to pay R$18 million in compensation for environmental damages and has appealed from such decision. The appeal is currently awaiting judgment at the relevant court of appeal. As of December 31, 2023, the amount involved was R$49.7 million. The risk of loss was classified as possible.
- Rumo Malha Paulista annulment action. The Brazilian Ministry of Labor has imposed a fine and served an infraction notice on Rumo Malha Paulista in connection with the abovementioned allegations that certain employees of MS Teixeira were working in degrading conditions analogous to indentured servitude. Rumo Malha Paulista has challenged the infraction notice in an administrative proceeding with the Brazilian Ministry of Labor. Prumo Engenharia has admitted responsibility for the degrading conditions in which certain employees were working, including acknowledging its status as their employer and paying all applicable employment termination fees. This process was recognized and duly recorded by the Brazilian Ministry of Labor. In spite of this, Rumo Malha Paulista has been included in a list of employers that employ workers in a condition analogous to indentured servitude by the Brazilian Ministry of Labor. On April 13, 2018, as part of an annulment action currently being heard, the 83rd Labor Court of São Paulo granted an injunction, requiring that Rumo Malha Paulista be removed from the list until a final and unappealable judicial verdict is issued. The Regional Labor Appeals Court of São Paulo upheld the injunction following an appeal. Rumo has entered into an agreement with the Brazilian Ministry of Labor, providing for (i) a R$3 million fine to be applied to the employees’ public support fund, (ii) the creation of a program to monitor compliance of its labor obligations for a period of two years, (iii) the promotion of two social projects, (iv) the offering of training to its employees, and (v) the payment of certain amounts as indemnification. This agreement was ratified by the 83rd Labor Court of São Paulo, but the Labor Prosecutor’s Office in the State of São Paulo appealed against the authority of the Brazilian Ministry of Labor to enter into the agreement and discharge Rumo from further liability in connection therewith. The appeal is currently pending judgment. If Rumo fails to comply with the agreement, Rumo may be included on the list of employers who submit workers to conditions analogous to slavery. We estimate the risk of annulment of the agreement with the Brazilian Ministry of Labor, as remote. However, as of December 31, 2023, we estimate the risk of being found in breach of the agreement as probable, with potential penalties of approximately R$4.5 million.
- Rumo Malha Paulista working conditions of engine/train drivers. Labor unions and the Labor Public Prosecutor’s Office filed a public civil action against Rumo Malha Paulista in connection with the working conditions of engine/train drivers, requesting the (1) prohibition of the so-called “stand-alone driving” (when only train driver is in the train cockpit driving it, without any assistant present), (2) installation and proper maintenance of toilets in all locomotives, and (3) payment of moral collective damages in the amount of R$30 million. The 36th Labor Court of São Paulo has ordered Rumo Malha Paulista stop the “stand-alone driving” practice and pay moral collective damages in the amount of R$10,000 per train driver, as well as moral collective damages in the amount of R$100,000 due to lack of toilets in locomotives. Rumo Malha Paulista, the labor unions and the Labor Public Prosecutor’s Office have appealed to the Regional Appeal Labor Court of São Paulo. Rumo Malha Paulista’s appeal was partially granted by the Regional Appeal Labor Court to allow the “stand-alone driving” practice and to exclude the payment of moral collective damages to the train drivers. The Labor Public Prosecutor’s Office and labor unions’ appeals were also partially granted by the Regional Appeal Labor Court to order the payment of moral damages, due to failure to properly install and maintain toilets in locomotives, in an amount between R$5,000 and R$20,000 per train driver, and to pay moral collective damages in the amount of R$0.5 million. Rumo Malha Paulista and the Labor Public Prosecutor’s Office presented motions for clarification to the Regional Appeal Labor Court, which has not been successful. Rumo Malha Paulista and the Labor Public Prosecutor’s Office appealed to the Superior Labor Court. These appeals were partially allowed and are currently pending judgment. The total amount involved as of December 31, 2023 was R$69.7 million. Rumo estimates that the risk of loss is possible with respect to R$5.9 million (for which no provision has been recorded) and remote with respect to the remaining R$63.8 million.
- Rumo Malha Oeste working conditions of engine/train drivers. A labor union has filed a collective action against Rumo Malha Oeste requesting the prohibition of “stand-alone driving.” The 1st Labor Court of Bauru has declared the dismissal of the action. The labor union filed an appeal to the Regional Labor Appellate Court of Campinas, which was granted in November 2019, prohibiting monoconduction. Thereafter, we filed a motion to clarify and a motion for exception, as one of the judges at the labor court participated as a member of the Labor Public Prosecutor’s Office. The labor union also submitted a motion to clarify. The Regional Labor Court in the 15th Judicial District gave Rumo 180 days to comply with the injunction prohibiting stand-alone driving, but suspended this decision in July 2022. We filed a motion for clarification, which was accepted and remanded to the original trial court for presentation of further evidence. The case is currently pending judgment and, therefore, stand-alone driving is still currently used in the Rumo Malha Oeste. As of December 31, 2023, the total amount involved was R$3.2 million and the risk of loss was classified as possible.
- Rumo Malha Sul claims for payment of a risk premium. A labor union has filed a public civil action against Rumo Malha Sul and the Brazilian government seeking payment of a risk premium related to the exposure of workers performing maintenance activities on permanent roads to flammable and explosive product, as well as electricity. The labor court ruled in favor of the labor union, requiring the parties to pay this risk premium to the employees represented in the lawsuit. At the same time, Rumo Malha Sul filed a cross-claim against the Brazilian government, seeking to restore the economic-financial balance of certain leases and concession agreements. A settlement was reached between us and the labor union in July 2020, whereby we agreed to pay R$3.4 million for our own liability, and R$45.1 million for the Brazilian government’s liability, which was settled and paid for using certain credits owed to us by the Brazilian government under the aforementioned leases and concession agreements. However, the Brazilian federal government has filed an appeal to challenge the terms of the agreement regarding the compensation of the amounts owed to Rumo for the restoration of the economic-financial balance of certain leases and concession agreements. As of December 31, 2023, an adverse outcome in the remaining proceedings (i.e., referring to workers that were not subject to the settlement with the labor union) could result in aggregate losses of R$80.8 million, for which Malha Sul estimates a probable risk of loss and has recorded provisions in the amount of R$0.2 million.
- Road cargo transportation and labor conditions of lorry drivers. The Labor Prosecution Office filed a public civil action against Rumo requesting: (1) the prohibition of outsourcing services related to road freight transport and (2) compliance with working hour rules. In addition, the Labor Prosecution Office requested the payment of compensation for collective moral damages in the amount of R$91.5 million due to (1) noncompliance with outsourcing rules; (2) severe extended working hours; (3) working conditions analogous to indentured servitude; (4) suppression of legal breaks; (5) indirect promotion of illegal substance abuse by employees; (6) enhancement of potential work-related accidents; and (7) social dumping. The 1st Labor Court of Araraquara in the state of São Paulo has ordered Rumo not to outsource road cargo transportation and to ensure compliance with the legal overtime limit and mandatory breaks, in addition to paying R$15 million of moral collective damages. Rumo appealed and the Regional Appeal Labor Court of Campinas in the state of São Paulo ruled partially in favor of Rumo, enabling the outsourcing of road cargo transportation and reducing the amount of moral collective damages to R$5 million, but maintaining the obligation to comply with overtime limit and mandatory breaks. Rumo appealed and the Superior Labor Court granted the appeal to dismiss the public civil action. The Labor Prosecution Office filed a motion of clarification, which was dismissed by the Superior Labor Court.
- Claims for Overtime, Night Shifts and Certain Improvements to Working Conditions. A labor union has filed a labor claim demanding that we pay for (1) overtime, (2) night shifts, and (3) breaks for rest and meals. The Labor Court ruled partially in favor of the labor union, requiring that overtime be paid. We appealed to the Regional Appellate Court and Superior Labor Court, but both appeals were dismissed. We appealed again to the Supreme Court and this appeal was definitely dismissed. The claim was dismissed on May 20, 2020, and we expect to pay amounts individually in the lawsuits filed by the replaced employees: 274 lawsuits were filed and Rumo has already paid R$12.1 million in total in part of those individual lawsuit, thus reducing the amount recorded as provision accordingly. We estimate that, as of December 31, 2023, the risk of loss as probable and for which we have recorded a provision in the amount of R$44.4 million, and risk of loss as possible in the amount of R$21.9 million, and remote in the amount of R$66.2 million, for which no provision has been recorded.
- Brazilian Antitrust Authority (Agrovia). In July 2018, Rumo became aware that a preliminary investigation was started by the Brazilian Antitrust Authority following certain allegations made by Agrovia S.A., or “Agrovia.” Agrovia alleges that Rumo abused its dominant position in the sugar market resulting in damages to Agrovia. Rumo has sought to refute the arguments presented by the Brazilian Antitrust Authority and has pointed out that most of the facts have already been analyzed and rejected in separate administrative proceedings. In March 2019, the Brazilian Antitrust Authority started an administrative proceeding accusing Rumo of abusing its dominant position against Agrovia. Brazilian Antitrust Authority has ruled against Rumo ordering the payment of R$247.0 million in fines. Rumo filed suit seeking an annulment based on a disproportionate penalty allegation. The trial court has rejected Rumo’s petition and Rumo has presented an appeal. The total amount involved in this proceeding is R$339.8 million as of December 31, 2023. Rumo’s external counsel has assessed the risk of loss as possible in an amount of R$308.5 million and as probable in an amount of R$31.2 million.
- Brazilian Antitrust Authority (Rumo). The Brazilian Antitrust Authority initiated enforcement action against Rumo seeking payment of outstanding credits owed in relation to daily fines applied against Rumo for the alleged delay in complying with a finding by the Brazilian Antitrust Authority of a violation of applicable law. However, this finding remains subject to legal action filed by Rumo seeking its annulment. Accordingly, Rumo filed motions to suspend enforcement, which are pending judgment. Rumo’s external counsel estimated a possible risk of loss in the amount of R$46.9 million.
- Petroleum Comércio e Representações Ltda’s breach of contract claim. Cosan is party to proceedings commenced by Petroleum Comércio e Representações Ltda in which the plaintiff seeks indemnification from Cosan for losses, damages and contractual penalty arising from an alleged breach of contract. These proceedings are pending entry of a ruling in the trial courts and involve an aggregate amount of R$160 million. The risk of loss has been classified as possible.
- Chade Advogados Associados’ attorney fees collection claim. Cosan is party to proceedings commenced by Alexandre Saddy Chade, Oswaldo Chade e Chade Advogados Associados in which the plaintiff seeks indemnification for an alleged breach of contract and payment of fees and disbursements of counsel. The trial courts entered judgment favorably to us, and plaintiffs have appealed. The case currently awaits entry of judgment by the court of appeals and involves an aggregate amount of R$366.1 million. The risk of loss has been classified as possible.
- Civil Class Action. A civil class action was filed by the São Paulo State Public Prosecutor’s Office against Terminal de Regaseificação de GNL de São Paulo S/A, Environmental Company of the State of São Paulo (Companhia Ambiental do Estado de São Paulo — CETESB), and the Municipality of Santos in the state of São Paulo on December 18, 2020, seeking to suspend construction of the GNL Regasification Terminal of São Paulo based on an allegedly flawed environmental licensing process. The plaintiff further requested the annulment of the environmental licenses granted for the implementation of the GNL Regasification Terminal of São Paulo and the payment of collective material and moral damages to the local population by the defendants. The Brazilian Superior Court of Justice has granted an injunction preventing trial and appellate courts from rendering preliminary injunctions staying the construction of the GNL Regasification Terminal of São Paulo until a final and nonpeelable decision is entered on the merits of the civil class action. On January 22, 2023, a decision on the merits was rendered dismissing all requests made by the plaintiff, which is pending publication to the official records of the judiciary. As of December 31, 2023, the risk of loss had been classified as remote. We have made provisions in connection with this class action in the amount of R$1.2 billion.
- Lawsuits concerning the economic-financial balance of leasing and concession contracts.
- Rumo Malha Oeste. Rumo Malha Oeste is part of lawsuits with the Brazilian government relating to the restoration of the economic-financial balance of the contracts entered into by the parties under the concession for certain railroad networks and the leasing of the related equipment. The Brazilian government filed lawsuits to collect unpaid installments of the leasing and concession contracts. Rumo Malha Oeste, in turn, filed its own lawsuits seeking the restoration of the economic-financial balance of the contracts. The trial court issued interlocutory decisions authorizing Rumo Malha Oeste to guarantee the maturing installments through insurance guarantees provided by insurers. The trial court subsequently ruled in Rumo Malha Oeste’s favor on December 19, 2014. The Brazilian government filed appeals against the decision. As of the date of this current report, the appeal regarding Rumo Malha Oeste is still pending. The aggregate payments alleged to be owed by Rumo Malha Oeste total R$2,147 million. An adverse outcome in this lawsuit could result in significant losses to Rumo. In particular, Rumo Malha Oeste would be required to pay the installments guaranteed by insurance guarantees. As of the date of this current report, considering that Malha Oeste has required a re-bidding process, the parties have required the suspension of the lawsuit in order to do a settlement. The risk of loss in these proceedings is estimated as possible.
- Rumo Malha Sul. Rumo Malha Sul has also filed a lawsuit against the Brazilian federal government in connection with certain labor obligations which Rumo Malha Sul believes should be paid by the Brazilian federal government and not by Rumo Malha Sul pursuant to the applicable concession agreement. In 2020, the court decided the case in favor of Rumo Malha Sul and granted an injunction authorizing Rumo Malha Sul to offset part of these labor-related obligations against payments it owed to the Brazilian federal government. The Brazilian federal government has filed an appeal which is pending as of the date of this current report. The amount involved is R$90 million and the risk of loss has been estimated as possible.
- Portofer lawsuit. The Federal Prosecutor’s Office filed a public civil action against ALL and Rumo Malha Paulista, relating to irregularities in the public bidding of the railroad network of Porto de Santos in the state of São Paulo. According to the Federal Prosecutor’s Office, the government leased the railroad network to Ferroban, Ferronorte and Ferrovia Novoeste without having held prior bidding proceedings. ALL and Rumo Malha Paulista were included in this lawsuit as defendants because they are successors to these companies. The trial court dismissed the injunction request of the Federal Prosecutor’s Office, pursuant to which the Federal Prosecutor’s Office requested the commencement of a new bidding proceeding and that the Brazilian government be prevented from renewing the current concession contract and denied the injunction requested by the Federal Prosecutor’s Office. The court also denied the Federal Prosecutor’s other requests. The Federal Prosecutor has filed an appeal. The risk of loss in these proceedings is estimated as possible. The Brazilian Court of Auditors (Tribunal de Contas da União), or “TCU,” has also analyzed the legality of these lease agreements and decided that the Port Authority had to do a bidding process. In an attempt to prevent losses to port operations, TCU determined that Portofer should continue with the lease contract through its maturity date, without right to a renewal for subsequent terms. In order to avoid costs associated with a third-party lessee, Santos Port Authority “APS” has done a public notice for those interested in joining an association to administrate the railroad within the Port area, the Ferrovia Interna do Porto de Santos, or “FIPS.” Rumo, MRS and VLI have accepted to join FIPS, which has been created and has already signed a lease agreement with the Port Authority. FIPS started its activities after a transition process, and Portofer ended its activities in October 2023. The court judged the Federal Prosecutor’s Office’s appeal to be prejudiced and extinguished the public civil action due to the fact that APS and Portofer has ended their lease agreement which was replaced by the FIPS lease agreement.
- Terminals Leasing. Proceedings have been brought against Rumo Malha Norte in connection with alleged irregularities in the public bidding process relating to the lease contract and amendments thereto entered into between Rumo Malha Norte, the Santos Port Authority “APS” and others in relation to Terminal XXXIX, Terminal de Granéis do Guarujá and Terminal Marítimo do Guarujá. According to the claim, the contract should not have been signed without a prior bidding process was held. The first instance court denied the claims. The initial judgment was then revised on appeal. Following another appeal, the Superior Court of Justice denied the claim once again. The appeal to be made by the prosecutor is still pending. A decision against Rumo Malha Norte could result in the loss of the Terminals leasing, a new bidding process being held in relation to the Terminals and the restitution of any unamortized investment made by us in the network. The risk of loss in this proceeding is classified to be possible.
- Rumo Malha Norte Administrative Misconduct. A class action was filed against Rumo Malha Norte and others alleging that the defendants entered into the lease agreement no. 1/97 in breach of the legal requirements applicable to public bidding processes, pursuant to article 10, item VIII, of the Brazilian Administrative Misconduct Law. The case was suspended by a popular action moved and the class action was later dismissed, which decision is pending entry of final judgment by the court of appeals. Rumo’s external counsel assessed the risk of loss as possible.
- Rumo/ALL Investigation. During 2016, Rumo became aware of certain press reports alleging that improper payments to government officials were made by former employees of ALL (prior to being acquired by Rumo) in connection with an investment by Fundo de Investimento do Fundo de Garantia do Tempo de Serviço, or “FI-FGTS,” in Rumo’s indirect subsidiary Brado Logística and in ALL. As a result of these allegations, Rumo has engaged external legal counsel and consultants to conduct an internal investigation. The report of the investigation was submitted to the Federal Prosecutor’s Office, which determined the Police Department to file a police inquiry to investigate corruption and money laundering that allegedly occurred at ALL and Brado prior to its acquisition by Rumo. At this time, we can neither predict the outcome of the criminal investigation, the consequences of any findings or any measures that may be taken by local authorities, any of which may have a material adverse effect on Rumo. See “Risk Factors—Risks Related to Our Business, the Operations of Our Joint Venture, and Industries in Which We Operate—We cannot predict the outcome of an investigation into the conduct of former employees of ALL prior to its acquisition by Rumo.” The TCU is also analyzing the regularity of this investment by FI-FGTS in Rumo’s indirect subsidiary Brado Logística and in ALL. Rumo and ALL Brado have presented their defense, stating that the investment generates a financial return to FI-FGTS that justifies it. Until the date hereof, no final decision has been issued by TCU on this matter.
- Rumo Malha Oeste Wild Fire Environmental Lawsuit. The Public Prosecutor’s Office of the State of Mato Grosso do Sul filed a lawsuit against Rumo Malha Oeste due to a fire that occurred on June 9, 2007, in an area of 322 hectares of private natural heritage reserve area (reserva particular do patrimônio natural) and another of 160 hectares of native pastures, on the Capão do Pires farm in Miranda, State of Mato Grosso do Sul. The plaintiff is seeking to have Rumo Malha Oeste; (i) build firebreaks at least three meters wide, on both sides of the rail tracks operated by Rumo Malha Oeste; (ii) stop using cutting torches in the maintenance and conservation works of the railroad; (iii) adopt environmentally-friendly techniques in all works of implementation, expansion and conservation of the railroad; (iv) create a plan to fight wild fires, including the creation of a volunteer fire brigade. Finally, the plaintiff seeks to have Rumo Malha Oeste pay compensation for past environmental damage and frustration of recovery of any environmental damage caused, which penalty amount is to be determined by an expert appointed by the court. A settlement was made pursuant to which Rumo agreed to replant 5,299,558 seedlings of native species and to construct firebreaks along the railroad in the region. An appeal has been brought against this decision that accepted settlement and is awaiting judgment before the court. Rumo’s external counsel classified the risk of possible loss in an amount of R$2.5 million.
- Infraction Notices. Rumo was notified of several infraction notices, including for: (i) an accident in the Serra do Mar region that allegedly caused water pollution and interruption of the region’s water supply, involving an amount ranging between R$25 million and R$51 million which has been classified by external counsel at a possible risk of loss; (ii) the operation of an establishment that uses environmentally hazardous materials, which resulted in oil spillage, involving a fine in the amount of R$221 million which has been classified by external counsel at a possible risk of loss; (iii) the release of oil and oily substances into the environment in violation on applicable laws, involving a potential loss of R$176.8 million; however, the statute of limitations was recognized to have elapsed; (iv) the disposal of solid waste into sea water in the area of the Port of Santos, involving a potential loss of R$30.4 million which has been classified by external counsel as a possible risk of loss.
- Rumo Malha Sul Environmental Licensing Case. The Federal Public Prosecutor’s Office filed suit against Rumo Malha Sul and IBAMA in order to (i) compel IBAMA to present a conclusive analysis of an ongoing environmental licensing process initiated by Rumo for the reactivation of the railway section belonging to the Mafra-Marcelino Ramos line, and (ii) compel Rumo Malha Sul to immediately adopt the necessary measures to preserve the quality and usefulness of its remaining railway assets in the Pinheiro Preto–Capinzal section. The plaintiff also seeks an order requiring Rumo Malha Sul S.A. to adopt the necessary measures to preserve the quality and usefulness of the remaining railway assets in the Pinheiro Preto–Capinzal section, and conviction of IBAMA in the compulsory conclusion of a specific administrative process of environmental licensing. An appeal was filed by Rumo in October 2019, which is currently pending judgment. Rumo’s external counsel assessed the risk of loss as possible.
- Railroad track maintenance. The Federal Public Prosecutor’s Office filed suit against Rumo Malha Paulista for the absence or insufficiency of maintenance on the railroad track and the indiscriminate use of the horn by train drivers. The suit alleges that wagons or machinery immobile for a long period at level crossings preventing the transit of vehicles and people for hours on end. The Public Prosecutor requested the restriction of the transit of railway compositions in the Municipality of Jales between 7:00 am and 10:00 pm and the adjustment of the noise produced by the horns. The preliminary injunction requests were partially granted, in order to attribute the obligations pleaded by the public prosecutor. Rumo filed an appeal that suspended the decision. Since then, a trial of the case has been awaited. Rumo’s external counsel assessed the risk of loss as possible.
- Tariff Alteration Suit. As a result of ANTT’s Resolutions No. 3,888/2012, No. 3,889/2012, No. 3,890/2012 and No. 3,891/2012, reducing the tariff ceilings applied to concessionaires, plaintiffs filed a lawsuit challenging the resolutions and were successful in obtaining a preliminary relief, despite later losing the case on its merits. The plaintiffs filed appeals. Rumo Malha Paulista and Malha Oeste subsequently entered into contractual amendments with ANTT and forfeited their rights to the proceeding. Rumo remained a named appellant, but the appeal was denied. The case currently awaits judgment by superior court of appeals and could result in Rumo having to comply with the tariff ceilings as amended by the resolutions.
- ALL Malha Sul Infraction Notices Annulment. ALL Malha Sul filed suit seeking the annulment of 66 infraction notices issued by the ANTT which alleged practices of overcharging tariffs beyond regulatory limits. The trial court entered judgment in favor of ALL Malha Sul, finding for the annulment of the notifications arising from a specific administrative proceeding. ANTT’s appeal was dismissed. Judgment on motions for clarification is awaited by the superior court. The total amount of this action is R$74 million. Rumo’s external counsel assessed the risk of loss as possible.
- The ANTT initiated an administrative proceeding against Rumo to determine whether there was a breach of contract by Rumo for the lack of recovery of certain sections of its concession: Maringá/Cianorte; Santiago-Dilermando Aguiar, Santiago-São Borja dos Reis, Passo Fundo-Cruz Alta, Mafra-Porto União. Rumo presented an administrative defense, which is currently pending judgment. Rumo’s external counsel assessed the risk of loss as possible.
- Rumo filed suit seeking annulment of six infraction notices imposed by the ANTT for alleged failure to comply with an obligation to eradicate a railroad section. In 2004 a partial injunction was granted to suspend part of the infraction notices and in 2006 judgment was entered partly upholding Rumo’s claim and partially modifying the preliminary injunction. In December 2006, ALL filed an appeal, which is currently pending judgment. Rumo’s external counsel assessed the risk of loss as possible. The amount involved in this action is R$55 million.
- Rumo Malha Sul filed a preliminary injunction seeking the suspension of enforceability relating to credits arising from an administrative proceeding in which Rumo Malha Sul was fined. The preliminary injunction was granted. This proceeding is currently awaiting entry of final judgment and Rumo’s external counsel assessed the risk of loss as possible in relation to an amount of R$30.4 million.
- Rumo filed an annulment action relating to the fines imposed by ANTT in connection with five infraction notices for breach of contract. In July 2012, the case was dismissed and Rumo filed an appeal, which is currently pending judgment. Rumo’s external counsel assessed the risk of loss as possible in relation to an amount of R$33 million.
- The Federal Prosecutor’s Office filed suit against Rumo Malha Sul seeking enforcement of alleged credits in the amounts of R$2.8 million and R$42.4 million. The plaintiff has forfeited its claim relating to the R$42.4 million credit given the lack of enforceability. Rumo’s external counsel assessed the risk of loss as possible in relation to an amount of R$49.5 million.
- The State of Paraná Public Prosecutor’s Office filed a criminal action against Rumo Malha Sul S.A. for alleged environmental crimes occurred on January 18, 2018, relating to damage native vegetation in an advanced stage of regeneration, soil contamination in a permanent preservation area, inadequate disposal of solid waste and exploitation of the natural landscape in an area attached to a conservation and full protection unit. In February 2020, a decision was issued rejecting the complaint. The Public Prosecutor’s Office filed an appeal, which was granted, and Rumo appealed against this decision. Rumo’s external counsel assessed the risk of loss as possible.
- The Federal Prosecutor’s Office filed a public civil action against Rumo S.A., Rumo Malha Paulista S.A., Agência Nacional de Transportes Terrestres - ANTT, Instituto de Patrimônio Histórico e Artístico Nacional – IPHAN, Instituto Brasileiro do Meio Ambiente e dos Recursos Naturais Renováveis – IBAMA, the Brazilian federal government and Santos, São Vicente, Praia Grande, Mongaguá, Itanhaém, Peruíbe, Itariri, Pedro de Toledo, Miracatu, Juquiá, Registro, Jacupiranga and Cajati counties for violation of obligations set out in the concession contract in these regions, including the alleged complete abandonment of the railway in the Cajati – Samaritá section (reactivation). Rumo Malha Paulista S.A. presented its defense alleging that administrative review must precede judicial appreciation of the facts. The proceeding currently awaits judgment.
- Ferroviária Paraná S.A. Suit. Pound S.A. and Rumo S.A. were shareholders of Ferroviária Paraná S.A. prior to its bankruptcy and engaged in a series of legal discussions imputing on each other, among other things, non-fulfillment of obligations and responsibility for mismanagement of Ferroviária Paraná S.A. Pound S.A. intends to obtain compensation for losses arising from the alleged mismanagement of Rumo / ALL as the head of the administration of Ferrovia Paraná S.A. in the period from August 2003 to March 2005. In December 2013, a ruling was issued by the trial court in favor of Rumo and Pound S.A. appealed the sentence. In March 2020, the court dismissed Pound’s appeal. An appeal for the Superior Court of Justice was filed by Pound S.A., which was initially rejected. A new appeal was presented by Pound S.A. Rumo’s external counsel assessed the risk of loss as remote in the amount of R$136.4 million.
- Rumo Malha Paulista S.A. Federal Suit. The Federal Prosecutor’s Office filed suit against Rumo Malha Paulista S.A. seeking damages to be determined by examination of an expert appointed by the trial court, resulting from the deactivation of the overhead electrical traction network subsystem in a substation subsystem, sectioning cabins and power lines subsystem. The action was dismissed by the trial court and an appeal was filed by plaintiff, which is currently pending judgment. The amount involved in this proceeding is R$356.2 million and the risk of loss has been estimated as possible.
- Wagons Suits. (i) The city of Jaguariaíva filed a lawsuit against Rumo Malha Sul for the alleged parking of hundreds of old wagons in inappropriate location, which could generate risks to the environment associated with transported materials remains in the wagons and the risk to contaminate soil and rivers. The plaintiff seeks removal of the wagons with a daily-fine penalty in case of violation. If the court decides against Rumo, costs associated with removal of the assets and applicable fines are expected to be incurred. In May 2019, the federal trial court authorized the cutting of the wagons for sale as scrap. Rumo prepared a schedule and began the cuts. Rumo is presenting a monthly report on productivity in cutting wagons and maintains compliance with the schedule. (ii) The Federal Public Prosecutor’s Office filed a lawsuit against Rumo S.A. seeking the reimbursement of DNIT in the amount of R$24 million for the parking 329 destructed wagons in the city of Mafra and the replacement of the wagons during the period of negotiations for amendment of the concession contracts. The trial court prohibited Rumo from using the railway line in Mafra as a deposit of wagons and to fix the assets within 18 months. An appeal was filed by Rumo concurrently with the presentation by Rumo of a an authorization request and schedule for cutting the wagons. The schedule was partially accepted, granting a 20-month deadline for finalizing the cuts. The appeal filed by Rumo is still awaiting judgment. The amount involved is R$54,6 million and the risk of loss has been estimated as possible. (iii) A collective civil action was initiated against Rumo S.A. to investigate alleged abandonment of wagons around the Iperó Railway Station, seeking payment by Rumo S.A. of collective material and moral damages in the amount of R$23.7 million. Plaintiff requested and was granted an injunction forcing Rumo S.A. to refrain from depositing any new scrap waste, debris, useless wagons, unusable material or any other railway asset within the territorial limits of the municipality of Iperó, subject to a daily fine of R$30,000 up to a limit of R$10 million. In February 2023 a final ruling was issued against Rumo to refrain from reusing the area around Iperó Station as a deposit for abandoned wagons and any other type of scrap or unusable railway material. The ruling imposed on Rumo the obligation to pay material and moral collective damages in the amount of R$9.2 million. Rumo appalled the decision, and the proceeding is currently awaiting judgment of the appeal. The amount involved is R$95.7 million and the risk of loss has been estimated as possible in the amount of R$40.6 million and as remote in the amount of R$55 million.
- Rede Ferroviária Federal S.A. Suit. Rede Ferroviária Federal S.A. filed a lawsuit against Rumo Malha Sul seeking to restore certain railroad sections of its concessions and to obtain pecuniary compensation for alleged damages. The Instituto Brasileiro de Avaliações e Perícias de Engenharia do Estado do Rio de Janeiro – IBAPE was summoned to appoint an expert with respect to this proceeding, and the expert fees have been established at R$150.0 thousand. The Brazilian federal government intervened in the proceeding to request that IBAPE be replaced by Conselho Federal de Engenharia e Agronomia — CONFEA for the appointment of engineering professionals specialized in the railway network to serve as experts. Currently, the production of an expert report is awaited, after which a judgment is expected to be entered. The risk of loss has been estimated as possible.
- Rumo Malha Sul TAC Renegotiation Case. The Federal Public Prosecutor’s Office filed a lawsuit in May 2015 for Rumo Malha Sul’s failure to comply with its obligations under the June 2011 Termo de Ajuste de Conduta (“TAC”). The Public Prosecutor’s Office requested: (i) the payment of a daily fine of R$50.0 thousand; (ii) that Rumo Malha Sul restores and maintains the railroad section between Presidente Epitácio and Presidente Prudente; (iii) the reactivation of the section Epitácio—Rubião Jr; (iv) the continuous and effective operation of sufficient locomotives to satisfactorily and adequately meet regional demand beyond other requests. Rumo Malha Sul filed an annulment action seeking the annulment of the June 2011 TAC, alleging an error in the interpretation of its scope. Following this, Rumo Malha Sul and the public prosecutor agreed to suspend the enforcement in order to achieve an agreement The amount involved is R$130.3 million and the risk of loss has been estimated as probable for half the amount and as possible for the other half of the amount.
- Rumo Confidential Arbitration. A confidential arbitration was initiated by Rumo S/A against a consulting company that had been hired by Rumo, seeking the declaration of validity of the termination of the consultancy services agreement and the declaration that no amounts are due by Rumo under the contract. The amount involved is R$30.3 million and the risk of loss has been estimated as possible.
- Goodwill Comgás. Comgás received three tax assessment notices for the collection of IRPJ and CSLL relating to calendar years 2013 to 2014, 2015 to 2016 and 2017 to 2018. Tax authorities disregarded goodwill expenses derived from certain investments. According to Comgás, as of December 31, 2023, the total amount under discussion was R$1,263 million (for the 2013 to 2014 assessment); R$1,566 million (for the 2015 to 2016 assessment) and R$960.7 million (for the 2017 and 2018 assessment). The risk of loss is classified as possible for R$2,833 million and remote for R$956 million.
- Tax assessment notices. The Company and its subsidiaries have received assessment notices based on the following: (1) Comgás was aware of the offsetting procedures, using income tax credits (IRPJ and CSLL), in a possible amount of R$153 million as of December 31, 2023; and (2) CLE has a requirement of IPI at restricting its constitutional immunity from oil lubricant derived, in a possible amount of R$209.5 million as of December 31, 2023.
- Comgás ICMS tax incentive. Comgás received notice of an administrative proceeding for a tax assessment seeking collection of IRPJ and CSLL relating to calendar year 2017. Tax authorities disregarded the exclusion of Comgás ICMS tax incentive from the assessment base of IRPJ and CSLL. According to Comgás, as of December 31, 2023, the total amount under discussion was R$665.3 million. The risk of loss is classified as probable.
- Comgás regulatory current account. Comgás applied for the offset of tax credits relating to the calendar year of 2015. The tax credit was generated upon the deduction from the IRPJ and CSLL calculating basis of the regulatory current account (“CCR”) balance in proportion to the asset realization; however, in the calendar year of 2015 it was passed on to the gas tariff and effectively recovered the amounts from customers. The offset applications were denied by Brazil Federal Revenue Office. As of December 31, 2023, the total amount under discussion was R$115.3 million. The risk of loss is classified as possible.
Certain Tax Proceedings
We are parties to certain other tax proceedings, including the following primary proceedings:
- Rumo has received tax assessments in connection with PIS and COFINS payments relating to Rumo Malha Norte, Rumo Malha Sul, Rumo Malha Paulista and Rumo Malha Oeste concerning administrative disallowance for a noncumulative system relative to (1) credits issued untimely unattended of previous rectification of tax return; (2) credits of expenses of mutual traffic contracts; (3) unproven credits of expenses with services classified as input material; (4) company employees transportation expenses credits; (5) electricity expenses credits; (6) unproven equipment rental agreement and rental expenses credits; (7) expenses in acquisition of machines, equipment and incorporated into company permanent assets credits and (8) standalone fine corresponding to 50% of the amount of credits. As of December 31, 2023, the amount involved was R$876.6 million with a possible risk of loss.
- Rumo Malha Paulista had part of its IRPJ credit balance rejected based on the argument that it would not be entitled to IRRF compensation on swap transactions. The amount involved is R$200.5 million, with a possible risk of loss.
- Rumo has received an assessment relating to isolated fines with respect to failure to collect IRPJ, CSLL, PIS and COFINS. Rumo Malha Sul submitted various compensation declarations, or “DCOMP,” through the PER/DCOMP electronic system with respect to credit premiums, using credit acquired from a third party (Fibra S.A. Indústria e Comércio and others). The DCOMP deemed these not to have been declared as they related to third parties’ credit and credit premiums, and imposed a 75% fine, according to article 18, para. 4, of Federal Law no. 10,833/2003, and ruled for the disregard of the tax benefits of REPORTO (PIS and COFINS suspension), on the grounds that the locomotives and freight cars purchased in 2010, 2011 and 2012 were used outside the limits of the port. Therefore, Rumo was assessed to pay PIS and COFINS, as well as a fine corresponding to 50% of the value of acquired assets, in the amount of R$792.5 million as of December 31, 2023, with a possible risk of loss.
- The tax authorities have partially rejected the installment requests for federal tax debts made by Rumo Malha Sul and Intermodal, arguing that the Net Operating Losses, or “NOLs,” offered by the companies were not sufficient to discharge their existing debts. The amount involved is R$148.9 million as of December 31, 2023. The probability of loss is considered possible, since the NOLs existed and were available for such use.
- Rumo is a party to administrative proceedings brought by the Brazilian Federal Revenue service with respect to (1) the collection of the tax on financial transactions (IOF) on checking accounts maintained by Rumo for its affiliates and other controlled companies. The Brazilian federal revenue service argued the use of an accounting caption to indicate advance of expenses to affiliated companies, without a formal loan contract, constitutes a checking account over which IOF should be paid and (2) the failure to collect IOF by Rumo Malha Norte, in 2017 and 2018, on financial transactions between the group companies, in particular in relation to the remittance of mutual traffic between Rumo Malha Norte and Rumo Malha Paulista, contracts with Raízen and other values in the accounting statement. The amount involved is R$154.6 million, with a possible risk of loss.
- Rumo has received various tax assessments requiring the payment of IRPJ and CSLL related to (i) Rumo Malha Norte Goodwill: tax assessment notices issued for the collection of IRPJ and CSLL, as well as interest for late payment and fines. In the opinion of the Brazilian federal revenue, Rumo Malha Norte improperly amortized the goodwill calculated on the acquisition of Brasil Ferrovias S.A. and Novoeste Brasil S.A.; (ii) GIF, TPG and Teaçu: tax assessment notices issued for the collection of IRPJ and CSLL, in addition to default interest and fines for the following reasons: (a) deduction of the actual profit and the CSLL tax base from the amount corresponding to the amortization made in the acquisition of an interest in Teaçu Armazéns Gerais S.A. and (b) deduction of the actual profit and the basis of calculation of CSLL from the amount corresponding to the amortization of the goodwill paid by TPG Participações S.A. and GIF LOG Participações S.A. in the acquisition of shares issued by Rumo S.A.; (iii) Labor provisions: tax authorities have questioned Rumo’s assumption that we could exclude from the calculation of the actual profit and the adjusted basis of calculation of CSLL certain labor provisions. According to the tax authorities, the write-off of labor provisions has been made without the identification of provisions and reversals, which would impact the tax calculation,(iv) denial of offset application adjustment that informed a credit refund and (v) Tax assessments filed by the Brazil Revenue Service against Rumo in 2011, 2013 and 2019 to challenge (1) the amortization of goodwill expenses that were based on future profitability, (2) the deduction of financial expenses and (3) the nontaxation of capital gains derived from the disposal of equity interest in a company of the same group. As of December 31, 2023, the total amount involved was R$579.8 and the risk of loss has been classified as possible.
- Rumo received tax assessments that require the payment of ICMS, as follows: (i) payment of ICMS on rail freight services rendered in connection with the export of goods; (ii) improper ICMS bookkeeping; (iii) credits of expenses with services classified as input material; (iv) payment of ICMS based on the understanding that certain export transactions that made use of cancelled electronic documents of transportation (DACTEs) would be unlawful; and (v) payment of ICMS between 2018 and 2019 on the acquisition of certain locomotives as a result of the alleged nonexemption provided for by REPORTO. As of December 31, 2023, the total amount involved in these proceedings is R$1,140.8 million with a possible risk of loss.
Judicial Deposits
In accordance with court orders concerning certain tax, civil and labor lawsuits, we had bank judicial deposits in an aggregate amount of R$895.9 million as of December 31, 2023.
Criminal Proceedings
Criminal Environmental Claims
Cosan and its subsidiaries are parties to nine criminal environmental lawsuits and are being investigated in certain environmental police inquiries in process in the states of São Paulo, Pará, Rio Grande do Sul, Mato Grosso do Sul, Paraná, Rio de Janeiro, Minas Gerais, Bahia, Pernambuco and Santa Catarina. The main crimes alleged to have been committed are noise pollution, contamination of soil and rivers, burning, deforestation of native forest, emission of pollutants into the atmosphere and irregular transportation of dangerous products.
Cosan is party to a criminal proceeding commenced by the Public Prosecutor’s Office of Pará for the alleged environmental crime of pollution. In March 2017, a decision was rendered recognizing that the statute of limitations had expired against the Public Prosecutor’s Office claim against Cosan. The prosecution filed an appeal and the court of appeals has granted continuance of the proceedings. We are currently awaiting service of process for the recommencement of the criminal proceeding. In addition to the application of fines, imposition of penalties that restrict certain rights, such as the suspension of activities or prohibition to enter into contracts with public authorities. The risk of loss has been classified as possible.
Criminal Proceedings Involving Members of Our Management
Certain members of our management are parties to criminal proceedings, as follows:
Mr. Rubens Mello and Mr. Pedro Mizutani
Mr. Rubens Mello and Mr. Pedro Mizutani and others were named as defendants in a criminal complaint filed on October 29, 2014 to determine whether they have committed tax evasion in connection with the alleged failure to adequately pay state value added taxes (ICMS). The determination as to whether outstanding taxes are in fact due is at issue in a separate tax collection enforcement proceeding that is independent of the criminal proceeding. Bank letters of credit and insurance guarantees have been deposited with the relevant court in order to secure the amount in controversy. Given the fact that the crime of tax evasion requires there to be an actual loss to the tax authorities, such deposits have generally been interpreted by the Brazilian courts to eliminate criminal liability given that there would no longer exist a direct or indirect risk of harm to the public treasury and the allegedly illicit conduct of the defendants would no longer constitute a crime. This understanding, however, may change depending on the judge’s final decision. In view of the foregoing, the defense filed a motion requesting that the criminal proceedings (which are currently suspended) be terminated for lack of cause. As of the date of this current report, this criminal proceeding is stayed and awaiting final judgment of a motion to stay enforcement of the related tax proceedings. In the opinion of counsel responsible for the defense, the likelihood of a decision favorable to the defendants is possible. In any event the payment of the amounts due would be sufficient to extinguish criminal liability.
Mr. Rubens Mello and Mr. Pedro Mizutani were named as defendants in a criminal complaint filed on May 16, 2019 to determine whether they have committed tax evasion in connection with the alleged failure to adequately pay state value-added taxes (namely ICMS). The determination as to whether outstanding taxes are in fact due is at issue in a separate tax collection enforcement proceeding that is independent of the criminal proceeding. Bank letters of credit and insurance guarantees have been deposited with the relevant court in order to secure the amount in controversy. Given the fact that the crime of tax evasion requires there to be an actual loss to the tax authorities, such deposits have generally been interpreted by the Brazilian courts to eliminate criminal liability given that there would no longer exist a direct or indirect risk of harm to the public treasury and the allegedly illicit conduct of the defendants would no longer constitute a crime. This understanding, however, may change depending on the judge’s final decision. In September 2023, the Court confirmed the previously decision that the criminal proceedings will be suspended until the final decision in motion to stay execution on tax sphere. In the opinion of counsel responsible for the defense, the likelihood of a decision favorable to the defendant is possible.
Mr. Rubens Mello, in his capacity as a representative of Cosan, is also a party to two police investigations into tax evasion practices. For similar reasons as in the case above, these investigations have been stayed, and a court has ordered that Mr. Mello’s name be removed from the investigation. The amount at issue is R$9.1 million. Possible contingencies could result from other procedures related to these facts, such as the tax foreclosure proceedings that gave rise to this criminal investigation. The chance of loss has been assessed as possible.
Mr. Rubens Mello and Mr. Marcelo Martins
Mr. Martins and Mr. Mello, together with other individuals, are named defendants in their capacities as executive officers and accountants of Nova América S/A Comercial, in certain criminal complaints filed by the prosecutors of the state of Rio de Janeiro in connection with the alleged commission of crimes against the tax order related to the alleged failure to adequately pay state value-added taxes (ICMS) by Nova América. Mr. Martins and Mr. Mello and the other defendants were summoned and presented their defenses. In December 2021, the court ruled that the criminal complaint be suspended until the final decision in the motion to stay execution on the tax proceedings. As a result, this proceeding is currently stayed. In the opinion of the counsel responsible for the defense, the likelihood of a decision favorable to the defendant is possible.
Legal Proceedings of the Joint Venture
In addition, the Raízen Joint Venture is also party of certain legal proceedings as described under “Information on the Company—E. Supplemental Information About Joint Venture—Legal and Administrative Proceedings of the Joint Venture.”
Dividends and Dividend Policy
Dividend Rights
The Brazilian Corporation Law and Cosan S.A.’s bylaws require that we distribute annually to our shareholders a mandatory minimum dividend, unless our board of directors notifies the shareholders that such distribution is not advisable in light of our financial condition as reflected in our consolidated financial statements. The basis of the mandatory dividend is a percentage of the net income, as adjusted pursuant to the Brazilian Corporation Law. Under our bylaws, a minimum of 25% of our adjusted net income should be intended for distribution and payment to our shareholders as mandatory dividend. However, the payment of mandatory dividends to our shareholders may be limited to the amount of realized net income in a given year, provided the difference is recorded as an unrealized income reserve.
We are required by the Brazilian Corporation Law and our bylaws to hold an annual shareholders’ meeting no later than four months after the end of each fiscal year, at which time the allocation of the results of operations in any year and the distribution of an annual dividend are reviewed. The distribution of annual dividends is based on our audited individual and consolidated financial statements prepared for the immediately preceding fiscal year.
Additionally, pursuant to the Brazilian Corporation Law and Cosan S.A.’s bylaws, interim and extraordinary dividends may be distributed to our shareholders by decision of our board of directors, to be confirmed by the shareholders’ meeting. Amounts paid as interim and extraordinary dividends are included in the calculation of the minimum mandatory dividend provided for in the Brazilian Corporation Law and Cosan S.A.’s bylaws.
Calculation of Adjusted Net Income
At each annual shareholders’ meeting, our board of directors is required to recommend how to allocate our net income for the preceding fiscal year, which recommendation our board of executive officers initially submits to our board of directors for approval.
This allocation is subject to approval by our common shareholders. The Brazilian Corporation Law defines “net income” for any fiscal year as our profit after income taxes for that fiscal year, net of any accumulated losses from prior fiscal years and any amounts allocated to employees’ participation in our profit in that fiscal year. Under the Brazilian Corporation Law, our adjusted net profit available for distribution are equal to our net profit in any fiscal year, reduced by amounts allocated to our legal reserve and other applicable reserves, and increased by any reversals of reserves that we constituted in prior years.
Reserve Accounts
Under the Brazilian Corporation Law and our bylaws, we are required to maintain a legal reserve. In addition, we are permitted by the Brazilian Corporation Law to establish the following discretionary reserves:
- a contingency reserve for an anticipated loss that is deemed probable in future years. Any amount allocated in a previous year must be reversed in the fiscal year in which the loss had been anticipated if the loss does not occur as projected or charged off in the event that the anticipated loss occurs;
- a reserve for investment projects, in an amount based on a capital expenditure budget approved by our shareholders;
- an unrealized income reserve; and
- a tax incentive investment reserve, included in our capital reserve accounts, in the amount of the reduction in our income tax obligations due to government tax incentive programs.
Allocations to each of these reserves (other than the legal reserve) are subject to approval by our common shareholders voting at our annual shareholders’ meeting.
The Brazilian Corporation Law provides that the legal reserve and the tax incentive investment reserve may be credited to shareholders’ equity or used to absorb losses, but these reserves are unavailable for the payment of distributions in subsequent years.
The amounts allocated to the other reserves may be credited to shareholders’ equity and used for the payment of distributions in subsequent years.
We expect to have sufficient available cash to pay dividends in accordance with our dividend policy. We do not, however, plan to pay dividends in the event that we do not generate sufficient cash from operations. In addition, we will not pay dividends if we believe that such payment will limit or preclude our or our subsidiaries’ ability to pursue growth opportunities. Although our bylaws do not restrict us from borrowing funds to pay dividends, we do not intend to borrow funds to pay dividends.
Any cash dividends payable to holders of our ADSs quoted on the NYSE will be paid to J.P. Morgan Chase Bank, N.A., our transfer agent in the United States, for disbursement to those holders.
Joint Venture’s Dividend Policy
The shareholders’ agreement between us and Shell also establish the dividend policy of the Joint Venture. The dividend policy states that the Joint Venture seeks to maximize the amount of profits to be distributed to its shareholders in a manner consistent with its leverage ratio objectives and capital investment requirements. The supervisory boards must propose, and the shareholders approve, an allocation of the net profit of the Joint Venture in accordance with the shareholders’ agreements. The shareholders’ agreements provide that net profit is subject to the following allocation order:
- first, up to 5% of net profit to the respective company’s legal reserve, which may not exceed a specified amount, the lower of 20% of the respective company’s capital stock or 30% of the capital plus any capital surplus;
- second, payment of a mandatory dividend of 1% of net profit to the holders of common shares and preferred shares;
- third, payment to the respective company’s statutory reserve (reserve estatutária) for operations and projects, provided that such amount does not to exceed 80% of net profits or 80% of the respective company’s share capital; and
- fourth, the distribution of the remaining amount of net profit as dividends to the holders of the common shares and preferred shares, in accordance with any determination at the annual general meeting.
Brazilian Taxation
Taxation of Dividends
Dividends paid on our common shares or ADSs to U.S. Holders are currently not subject to withholding income tax, or “WHT,” in Brazil to the extent that such amounts are related to profits generated on or after January 1, 1996. Dividends paid from profits generated before January 1, 1996 may be subject to WHT at variable rates, according to the tax legislation applicable to each corresponding year.
Law No. 11,638, dated December 28, 2007, or Law No. 11,638, significantly changed the Brazilian Corporation Law in order to align Brazilian generally accepted accounting principles with the IFRS. Nonetheless, Law No. 11,941, dated May 27, 2009, introduced the Transitory Tax Regime, or the “RTT,” in order to render neutral, from a tax perspective, all the changes provided by Law No. 11,638. Under the RTT, for tax purposes, legal entities should observe accounting methods and criteria that were effective on December 31, 2007.
Profits determined pursuant to Law No. 11,638, or the “IFRS Profits,” may differ from the profits calculated pursuant to the accounting methods and criteria as effective on December 31, 2007, or the “2007 Profits.” While it was general market practice to distribute exempted dividends with reference to the IFRS Profits, Rule No. 1,397, issued by the Brazilian tax authorities on September 16, 2013, established that legal entities should observe the 2007 Profits in order to determine the amount of profits that could be distributed as exempted income to their beneficiaries. Any profits paid in excess of such 2007 Profits, or Excess Dividends, should, in the tax authorities’ view and in the specific case of nonresident beneficiaries, be subject to the following rules of taxation: (1) 15.0% WHT, in case of beneficiaries domiciled abroad, but not in a Low or Nil Tax Jurisdiction, and (2) 25.0% WHT in the case of beneficiaries domiciled in a Low or Nil Tax Jurisdiction.
In order to mitigate potential disputes on the subject, Law No. 12,973, dated May 13, 2014, or Law No. 12,973, in addition to revoking the RTT, introduced a new set of tax rules, or the “New Brazilian Tax Regime,” including new provisions with respect to excess dividends. Under these new provisions: (1) excess dividends related to profits assessed from 2008 to 2013 are exempt; (2) potential disputes remain concerning the excess dividends related to 2014 profits, since Law No. 12,973 has not expressly excluded those amounts from taxation and Rule No. 1,492, issued by the Brazilian tax authorities on September 17, 2014, established they are subject to taxation when distributed by companies which have not elected to apply the New Brazilian Tax Regime in 2014; and (3) as of 2015, as the New Brazilian Tax Regime is mandatory and has completely replaced the RTT, dividends calculated based on IFRS Profits should be considered fully exempt.
Recently, the Brazilian National Congress approved Constitutional Amendment 123/23, known as the Consumption Tax Reform, which enacts various changes to consumption taxes. The approved text also sets a deadline for the Brazilian federal government to present a proposal for income tax reform, including potential taxation on dividends. Therefore, there is no assurance that the current tax exemption on dividends distributed by Brazilian companies will continue in the future. Potential changes in the tax treatment of these payments would become effective in the year following the enactment of the relevant law.
Distribution of Interest on Equity
Brazilian corporations are allowed to make payments to shareholders of interest on shareholders’ equity as an alternative to carrying out dividend distributions and treat those payments as a deductible expense for the purposes of calculating Brazilian corporate income tax and social contribution on net income.
For tax purposes, this interest is limited to the daily variation of the pro rata variation of the TJLP, as determined by the Central Bank from time to time as applied to certain equity accounts, subject to certain inclusions or exclusions as set forth in the applicable law, and the amount of the distribution may not exceed the greater of:
- 50% of net income (before distributions and any deductions for income taxes) for the year with respect to which the payment is made; and
- 50% of retained earnings for the year prior to the year payment is made. Payments of interest on shareholders’ equity are resolved by the shareholder based on recommendations of our board of directors.
Payments of interest on shareholders’ equity to Brazilian and non-Brazilian holders of common shares, including payments to the depositary in respect of common shares underlying ADSs, are deductible by us for Brazilian corporate income tax purposes. Any payments to U.S. holders or other non-Brazilian holders are subject to Brazilian withholding tax at the rate of 15%. If the recipient of the payment is domiciled in a tax haven jurisdiction, as defined by Brazilian law, the rate will be of 25%.
In the context of the ongoing public discussion in Brazil in relation to reform in its tax system, the Brazilian government presented a bill to modify the law of interest on equity. The proposed bill is still pending analysis and approval from specific committees of the Brazilian Congress before being subject to vote. Potential modifications in the tax treatment of those payments would become effective in the year following the enactment of the relevant law.
We cannot assure you that the Brazilian federal government will not increase the withholding income tax on interest on shareholders’ equity in the future or eliminate the interest on shareholders’ equity altogether.
The following is a summary of certain significant provisions of our bylaws (estatuto social). This description does not purport to be complete and is qualified by reference to the complete text of our bylaws and the applicable laws of Brazil. This summary should not be considered as legal advice regarding these matters. You are urged to carefully review our bylaws in their entirety as they, and not this description, will control your rights as a holder of our common shares. In this section, unless otherwise stated, references to “we,” “us,” “our,” or the “Company” refer solely Cosan S.A., excluding its subsidiaries.
General
Pursuant to the Novo Mercado regulations, our capital stock must consist exclusively of common shares. Cosan is a corporation (sociedade anônima) of indefinite term incorporated under the laws of Brazil, having its registered office in the city of São Paulo, state of São Paulo, at Avenida Brigadeiro Faria Lima, 4,100 – 16th floor, room 1, ZIP Code 04538-132, Brazil, enrolled with the Brazilian taxpayers’ registry (Cadastro Nacional de Pessoas Jurídicas — CNPJ) under No. 50.746.577/0001-15. Cosan was incorporated on July 8, 1966. Cosan is governed by the laws of Brazil, as well as by our bylaws.
Capital Stock
As per Article 5 of our bylaws, the capital stock of Cosan, fully subscribed and paid in, is of R$8,682,543,550.97, divided into 1,874,070,932 registered common shares, with no par value. The capital stock of Cosan will be represented solely by common shares, and each common share will be entitled to one vote on the resolutions to be adopted by the shareholders.
Cosan is authorized to increase its capital stock, regardless of an amendment to our bylaws, in up to nine billion reais (R$9,000,000,000.00), upon a resolution of its board of directors, which will establish the terms of issuance, including the price and payment. The board of directors may also approve the issuance of warrants (bonus de subscrição) and convertible debentures, as well as capitalization of profits of reserves, whether or not by issuing bonus shares, within the limits of the authorized capital.
The board of directors of Cosan may grant stock purchase or subscription options, under the plan or programs approved at the shareholders’ meeting, to the managers and employees of Cosan, as well as to managers and employees of other companies directly or indirectly controlled by Cosan, without preemptive rights to the shareholders at the time of either grant or exercise of such options, subject to the balance of the authorized capital limit at the time of exercise of subscription options, analyzed together with the balance of treasury shares at the time of exercise of purchase options.
Corporate Purpose
As per Article 3 of the our bylaws, our corporate purposes are to (1) import, export, produce and trade sugar, ethanol, sugarcane, and other sugar byproducts; (2) distribute fuels in general and trade oil byproducts; (3) establish fuel supply stations, purchase and sell oil-derived fuels and lubricants; (4) provide logistics and port services, as well as technical, administrative and financial advisory services; (5) any type of transportation of passengers and cargo, including inland navigation, river and lake ferries; (6) produce and trade electricity, live steam, steam escape and other electricity co-generation byproducts; (7) farming and livestock activities in proprietary or third-party-owned lands; (8) import, export, handle, trade, produce, store, load or unload fertilizers and other agricultural inputs; (9) manage on its own account or through third parties assets and property and may lease, receive and grant in partnership, rent and lease furnishings, properties and equipment in general; (10) render technical services related to the activities mentioned above; (11) hold equity interest in other companies; and (12) processing and trading of fuel gases.
The development of activities by the companies that Cosan holds direct or indirect interest in any type considers the following factors: (1) the short- and long-term interests of Cosan and its shareholders, and (2) the short and long‑term economic, social, environmental and legal effects on its employees, suppliers, partners, clients and other creditors, as well as on the communities in which Cosan operates, both locally and globally.
Dividends
Our bylaws require that we distribute annually to our shareholders a mandatory minimum dividend, which we refer to as the mandatory dividend, equal to at least 25% of our net income after taxes, after certain deductions, including accumulated losses and any amounts allocated to employee and management participation, any amount allocated to our legal reserve, any amount allocated to our special reserve, any amount allocated to the contingency reserve and any amount written off with respect to the contingency reserve accumulated in previous fiscal years, in each case in accordance with Brazilian law.
However, the Brazilian Corporation Law permits a company to suspend the mandatory distribution of dividends if its board of directors reports to the shareholders’ meeting that the distribution would be incompatible with the financial condition of the company, subject to approval by the shareholders’ meeting and review by the fiscal council. In addition, our management must submit a report to the CVM clarifying the reasoning for any such non-payment. Net income not distributed due to such a suspension must be attributed to a separate reserve and, if not absorbed by subsequent losses, must be paid as dividends as soon as the financial situation of the company permits.
The amounts available for distribution are determined on the basis of financial statements prepared in accordance with the requirements of the Brazilian Corporation Law. In addition, amounts arising from tax incentive benefits or rebates are appropriated to a separate capital reserve in accordance with the Brazilian Corporation Law. This investment incentive reserve is not normally available for distribution, although it can be used to absorb losses under certain circumstances, or be capitalized. Amounts appropriated to this reserve are not available for distribution as dividends.
The Brazilian Corporation Law permits a company to pay interim dividends out of preexisting and accumulated profits for the preceding fiscal year or semester, based on financial statements approved by its shareholders. We may prepare financial statements semiannually or for shorter periods. Our board of directors may declare a distribution of dividends based on the profits reported in semiannual financial statements. Our board of directors may also declare a distribution of interim dividends or interest based on profits previously accumulated or in profits reserve, which are reported in such financial statements or in the last annual financial statement approved by resolution taken at a shareholders’ meeting. The board of directors may also declare dividends based on financial statements prepared for interim periods; provided that the total amount of dividends paid in each semester does not exceed the amounts accounted for in our capital reserve account set forth in paragraph 1 of Article 182 of the Brazilian Corporation Law and any dividends that fail to be claimed within a period of three years will revert to Cosan.
In general, Non-Resident Holders must register their equity investment with the Brazilian Central Bank to have dividends, sales proceeds or other amounts with respect to their shares eligible to be remitted outside of Brazil. The common shares underlying the Cosan ADSs are held in Brazil by the custodian, as agent for the Depositary, which is the registered owner on the records of the registrar for our shares.
Payments of cash dividends and distributions, if any, are made in reais to the custodian on behalf of the Depositary, which then converts such proceeds into U.S. Dollars and causes such U.S. Dollars to be delivered to the Depositary for distribution to holders of Cosan ADSs. In the event that the custodian is unable to convert immediately the foreign currency received as dividends into U.S. dollars, the amount of U.S. dollars payable to holders of Cosan ADSs may be adversely affected by devaluations of the Brazilian currency that occur before the dividends are converted. Under the Brazilian Corporation Law, dividends paid to Non-Resident Holders will not be subject to Brazilian withholding tax; however, it is not clear under Brazilian law whether such withholding income tax exemption is also applicable to dividends distributed to holders of Cosan ADSs abroad.
Brazilian law allows the payment of dividends solely in reais, limited to the unappropriated retained earnings in our financial statements prepared in accordance with IFRS.
Rights of Holders of Common Shares
Each of our common shares entitles its holder to one vote per common share at our annual or extraordinary general shareholders’ meetings (assembleia geral ordinária or assembleia geral extraordinária). Pursuant to our bylaws and its B3 listing agreement in connection with the listing of the common shares on the Novo Mercado, we cannot issue shares without voting rights or with restricted voting rights. As long as we are listed on the Novo Mercado, we may not issue preferred shares. In addition, our bylaws and the Brazilian Corporation Law provide that holders of common shares of Cosan are entitled to dividends or other distributions made in respect of common shares of Cosan in accordance with their respective participation in Cosan’s capital. See “—Dividends.” In addition, in the event of our liquidation and following the payment of all our outstanding liabilities, holders of common shares of Cosan are entitled to receive their pro rata interest in any remaining assets, in accordance with their respective participation in our capital. The shareholders have preemptive rights to subscribe for new shares issued by us, pursuant to the Brazilian Corporation Law, but are not obligated to subscribe for future capital increases.
Pursuant to the Novo Mercado Rules and the Brazilian Corporation Law, common shares of Cosan have tag-along rights which enable their holders, upon the sale of a controlling interest in us, to receive in exchange for their shares 100% of the price paid per common share for the controlling block.
Pursuant to the Brazilian Corporation Law, neither our bylaws nor actions taken at a shareholders’ meeting may deprive a shareholder of: (1) the right to participate in the distribution of net income; (2) the right to participate equally and proportionally in any residual assets in the event of liquidation of our company; (3) preemptive rights in the event of issuance of new shares, convertible debentures or subscription warrants, except in some specific circumstances under the Brazilian Corporation Law; (4) the right to hold our management accountable in accordance with the provisions of the Brazilian Corporation Law; and (5) the right to withdraw from us in the cases specified in the Brazilian Corporation Law, including merger or consolidation, which are described in “—Right of Withdrawal” and “—Redemption.”
Neither our bylaws, nor the Brazilian Corporation Law, contain any restriction on voting by Non-Resident Holders of common shares of Cosan.
Pursuant to our bylaws, every shareholder, group of shareholders or holders of ADSs that holds, acquires or becomes the owner, directly or indirectly, of 2.5%, 5.0%, 7.5% or 10.0% (and successively upon 2.5% increments) or more of the total shares of our capital stock, is required to inform us of the total amount of shares, or rights of shares, owned.
Public Tender Offer upon Sale of Control
The direct or indirect disposal of controlling interest in Cosan in a single transaction or series of successive transactions must be agreed upon under a condition that the acquirer will make a tender offer to purchase the shares issued by Cosan and owned by the remaining shareholders, subject to the terms of, and within the time limits prescribed by, prevailing regulation and legislation and the Novo Mercado Regulation, so that the holders of such remaining shares may receive the same treatment as accorded to the seller pursuant to Article 254-A of the Brazilian Corporation Law and Articles 37 and 38 of the Novo Mercado Rules and Article 36 of our bylaws.
Our Bylaws contain a provision stating that any shareholder that acquires or becomes the owner, directly or indirectly, of our capital stock corresponding to 10%, until January 31, 2028, and 15% as from February 1, 2028, or more of the total shares of our capital stock, whether by means of a single transaction or through several transactions, must make or apply for registration of, as the case may be, a tender offer to purchase all shares of our capital stock of Cosan, subject to the provisions of the applicable regulations issued by the CVM and Novo Mercado Regulation and Article 37 of our bylaws.
Allocation of Net Income
Together with the financial statements for the fiscal year, the board of directors will submit to the Annual Shareholders’ Meeting the proposed allocation of net income, in compliance with the provisions of law and Cosan Bylaws.
The shareholders will be entitled to receive as dividends each year a mandatory minimum percentage of twenty five percent (25%). Pursuant to Brazilian Corporation Law, our net income may be allocated to income reserves and to the distribution of dividends. For purposes of Brazilian Corporation Law, net income is defined as a period’s result minus accumulated losses from previous years, income and social contribution tax provisions and any other amounts allocated for the payment of profit sharing authorized in our bylaws to employees and management
Under the Brazilian Corporation Law, payment of the mandatory dividend is not required if the board of directors has formally declared such distribution to be inadvisable in view of our financial condition and has provided the shareholders at the annual general shareholders’ meeting with an opinion to that effect, which has been reviewed by our fiscal council. In addition, our management must submit a report to the CVM within five days following said meeting clarifying the reasoning for any such non-payment. See “—Dividends.”
Preemptive Rights
Our shareholders have a general preemptive right to subscribe for our shares in any capital increase of the same class of shares owned by them, pro rata to their interest in our capital stock at the time of the capital increase, except in the event of a grant or assignment of any option to acquire or subscribe to our common shares.
While our shareholders also have preemptive rights to subscribe for convertible debentures and subscription warrants, no preemptive rights apply to actual conversions of debentures, acquisitions of common shares from subscription of warrants and the offer and exercise of call options. In accordance with Brazilian Corporation Law, a period of at least 30 days following the publication of a notice of issuance of shares, convertible debentures or subscription warrants is granted for the exercise of preemptive rights, which rights may be transferred or disposed of for value. However, in accordance with Article 172 of Brazilian Corporation Law, our board of directors may refuse the granting of preemptive rights, or reduce the exercise period, with respect to the issue of new shares, convertible debentures and subscription warrants, up to the maximum limit of our authorized capital stock, if the placement of those shares, debentures or warrants occurs through a stock exchange sale or a public offering, in a public tender offer, with the objective of acquiring control of another company.
Our shareholders are not entitled to preemptive rights to subscribe our shares or our subscription bonus issued and placed through the trade on a stock exchange or a public subscription or the acquisition of shares made in the context of a public offer for acquisition of control.
Arbitration
In accordance with the regulations of the Novo Mercado and our bylaws, Cosan, its shareholders, executive officers, directors and fiscal council members are required to resolve through arbitration any disputes or controversies, including those related to or arising out of the application, validity, effectiveness, interpretation and violation, among others, of the provisions of the Brazilian Corporation Law, Law No. 6,385/76, our bylaws, the rules published by the CMN, the Brazilian Central Bank, the CVM and other rules applicable to the Brazilian capital markets in general, as well as those set forth in the Novo Mercado Listing Regulations, in the Novo Mercado Listing Agreement and in other rules issued by the B3, and such arbitration is the exclusive means to settle such disputes with Cosan’s shareholders. As the holders of Cosan ADSs are not direct shareholders of Cosan, these arbitration requirements do not apply to such Cosan ADS holders; however, because the Depositary is a holder of common shares of Cosan, it would be bound by these mandatory arbitration provisions if it sought to exercise remedies against Cosan under Brazilian law.
Liquidation
Cosan shall be liquidated upon the occurrence of certain events provided for in the Brazilian Corporation Law, whereupon a meeting of the shareholders shall determine the form of liquidation, electing the liquidator(s) and the members of our fiscal council, which must operate on a mandatory basis during the liquidation period.
Redemption
According to the Brazilian Corporation Law, we may redeem common shares of Cosan subject to the approval of our shareholders at an extraordinary shareholders’ meeting where shareholders representing at least 50% of the shares that would be affected are present. The share redemption may be paid with our retained earnings, income reserves or capital reserves, with the exception of the legal reserve.
If the share redemption is not applicable to all shares, the redemption will be made by lottery. If custody shares are picked in the lottery and there are no rules established in the custody agreement, the financial institution will specify, on a pro rata basis, the shares to be redeemed.
Right of Withdrawal
The Brazilian Corporation Law provides that, in case any of our shareholders dissent from certain decisions taken at a shareholders’ meeting, they have the right to withdraw its equity interest from the company and to receive payment for the portion of shareholders’ equity attributable to its equity interest.
Pursuant to Brazilian Corporation Law, shareholder withdrawal rights may be exercised under the following circumstances, among others:
- to reduce the mandatory distribution of dividends;
- to merge with another company (including if Cosan is merged into one of its controlling companies) or to consolidate, except as described in the fourth paragraph following this list;
- to approve our participation in a centralized group of companies, as defined under Article 265 of the Brazilian Corporation Law, and subject to the conditions set forth therein, except as described in the fourth paragraph following this list;
- to change our corporate purpose;
- to terminate a state of liquidation of the corporation;
- to dissolve the corporation; or
- to transfer all of our shares to another company or in order to make us a wholly owned subsidiary of such company, known as a merger of shares (incorporação de ações), except as described in the fourth paragraph following this list;
- to acquire the totality of shares of another company through a merger of shares (incorporação de ações), except as described in the fourth paragraph following this list;
- to approve the acquisition of control of another company at a price which exceeds certain limits set forth in the Brazilian Corporation Law, except as described in the fourth paragraph following this list; or
- to conduct a spin-off that results in (a) a change of our corporate purpose, except if the assets and liabilities of the spin-off company are contributed to a company that is engaged in substantially the same activities, (b) a reduction in the mandatory dividend or (c) any participation in a centralized group of companies, as defined under the Brazilian Corporation Law.
In addition, in the event that the entity resulting from incorporação de ações, or a merger of shares, a consolidation or a spin-off of a listed company fails to become a listed company within 120 days of the shareholders’ meeting at which such decision was taken, the dissenting or non-voting shareholders may also exercise their withdrawal rights.
Only holders of shares adversely affected by the changes mentioned in the first and second items above may withdraw their shares. The right of withdrawal lapses 30 days after publication of the minutes of the relevant shareholders’ meeting. We would be entitled to reconsider any action giving rise to withdrawal rights within 10 days following the expiration of such rights if the withdrawal of shares of dissenting shareholders would jeopardize Cosan’s financial condition.
The Brazilian Corporation Law allows companies to redeem their shares at their economic value, subject to certain requirements. Since our bylaws currently do not provide that our shares be subject to withdrawal at their economic value, our shares would be subject to withdrawal at their book value, determined on the basis of the last balance sheet approved by the shareholders. If the shareholders’ meeting giving rise to withdrawal rights occurs more than 60 days after the date of the last approved balance sheet, a shareholder may demand that its shares be valued on the basis of a new balance sheet that is of a date within 60 days of such shareholders’ meeting. In this case, Cosan must immediately pay 80% of the net worth of the shares, calculated on the basis of the most recent statement of financial position approved by its shareholders, and the balance must be paid within 120 days after the date of the resolution of the shareholders’ meeting.
Pursuant to the Brazilian Corporation Law, in events of consolidation, merger, incorporação de ações, participation in a group of companies, and acquisition of control of another company, the right to withdraw does not apply if the shares meet certain tests relating to liquidity and dispersal of the type or class of shares on the market (they are part of the B3 Index or other stock exchange index (as defined by the CVM)). In such cases, shareholders will not be entitled to withdraw their shares if the shares are a component of a general securities index in Brazil or abroad admitted to trading on the securities markets, as defined by the CVM, and the shares held by persons unaffiliated with the controlling shareholder represent more than half of the outstanding shares of the relevant type or class.
Registration of Shares
The common shares of Cosan are held in book-entry form with Itaú Corretora de Valores S.A. Transfer of the common shares of Cosan is carried out through a debit entry on the seller’s account and a credit entry on the purchaser’s account upon (1) written request of the seller; or (2) judicial order or authorization.
Form and Transfer
Because the common shares of Cosan are in registered book-entry form, the transfer of shares is made under Article 35 of the Brazilian Corporation Law, which determines that a transfer of shares is effected by an entry made by the registrar, by debiting the share account of the transferor and crediting the share account of the transferee. Itaú Corretora de Valores S.A. performs safe-keeping, share transfer and other related services for us.
Transfers of shares by a foreign investor are made in the same way and executed by that investor’s local agent on the investor’s behalf except that, if the original investment was registered with the Brazilian Central Bank, pursuant to Resolution No. 4,373/2014 of the Brazilian Central Bank, the foreign investor, through its local agent, should also seek amendment, if necessary, of the electronic certificate of registration to reflect the new ownership.
The B3 operates a central clearing system (the Central Depositária of the B3). A holder of common shares of Cosan may choose, at its discretion, to hold our common shares through this system and all shares elected to be put into the system will be deposited in custody with the relevant stock exchange (through a Brazilian institution duly authorized to operate by the Brazilian Central Bank having a clearing account with the relevant stock exchange). The fact that those shares are subject to custody with the relevant stock exchange will be reflected in our register of shareholders. Each participating shareholder will, in turn, be registered in our register of beneficial shareholders maintained by the relevant stock exchange and will be treated in the same way as a registered shareholder.
Shareholders’ Meetings
Pursuant to the Brazilian Corporation Law, our shareholders are generally empowered to take any action relating to our corporate purposes and to pass resolutions that they deem necessary. Shareholders at our annual general shareholders’ meeting, which is required to be held within the first four months of the end of each year, have the exclusive right to approve our audited financial statements and our management accounts, as well as to determine the allocation of our net income and the distribution of dividends with respect to the fiscal year ended immediately prior to the date of the relevant shareholders’ meeting. Generally (1) the installation of the fiscal council and election of its members, (2) the election of the members of our board of directors and (3) the determination of the annual compensation of our executive officers, board of directors and fiscal council are approved in the annual shareholders’ meeting, but such matters may also be approved at extraordinary shareholders’ meetings.
An extraordinary shareholders’ meeting may be held at any time during the year, including concurrently with the annual shareholders’ meeting. The following matters, among others, may be resolved only at a shareholders’ meeting:
- amendment of our bylaws;
- election and dismissal of the members of our board of directors and fiscal council, whenever requested by our shareholders;
- approval of management accounts and of our audited financial statements on a yearly basis;
- authorization of issuance of debentures by us, except for issuances which our board of directors has been authorized to decide pursuant to a previous decision of our shareholders or authorized by our bylaws;
- suspension of the exercise of a shareholder’s rights in the event of noncompliance with the Brazilian Corporation Law or our bylaws;
- approval of valuation reports of assets offered by a shareholder to us as payment for the subscription of shares of our capital stock;
- approval of issuance of shares in excess of the limit of our authorized capital;
- determination of the annual compensation of our executive officers, board of directors and fiscal council;
- approval of any transaction involving our transformation into a limited liability company, consolidation, merger or spin-off;
- approval of any transaction involving our dissolution or liquidation, the appointment and dismissal of the respective liquidator and the official review of the reports prepared by it;
- authorization to delist from B3 Novo Mercado and to become a private company, as well as to retain a specialist firm to prepare a valuation report with respect to the value of our common shares, in such event;
- authorization to our directors and officers to petition for bankruptcy or file a request for judicial or extrajudicial restructuring;
- approval of stock option plans for managers and employees of Cosan and companies directly or indirectly controlled by Cosan, excluding shareholder preemptive rights; and
- approval of any stock splits or reverse stock splits.
Quorum
As a general rule, the Brazilian Corporation Law provides that the quorum for purposes of a shareholders’ meeting consists of the presence of shareholders representing at least 25% of our issued and outstanding shares on first call, and, if that quorum is not reached, any percentage on second call. If our shareholders meet to amend our bylaws, a supermajority quorum of shareholders representing at least two-thirds of our issued and outstanding shares shall be required on first call, and any percentage will be sufficient on second call.
A shareholder may be represented in a shareholders’ meeting by an attorney-in-fact appointed no more than one year prior to the date of the relevant shareholders’ meeting. The attorney-in-fact must be a shareholder, director or executive officer of Cosan, a lawyer or a financial institution registered by their manager.
Generally, the affirmative vote of shareholders representing at least the majority of our issued and outstanding shares present in person, or represented by proxy, at a shareholders’ meeting is required to approve any proposed action, with abstentions not taken into account. Exceptionally, according to the Brazilian Corporation Law, the affirmative vote of shareholders representing not less than one-half of our issued and outstanding shares is required to, among other measures:
- reduce the percentage of mandatory dividends;
- change our corporate purpose;
- consolidate with or merge us into another company;
- engage in a spin-off transaction;
- approve our participation in a group of companies (as defined in the Brazilian Corporation Law);
- apply for cancellation of any voluntary liquidation;
- approve our dissolution; and
- approve the merger of all of our common shares into another Brazilian company.
Location of a Shareholders’ Meeting
Our shareholders’ meetings take place at our headquarters in the city of São Paulo, state of São Paulo, Brazil. The Brazilian Corporation Law allows our shareholders to hold meetings in another location in the event of a force majeure, provided that the meetings are held in the city of São Paulo and the relevant notice includes a clear indication of the place where the meeting will occur. All information relating to shareholders’ meetings will be available (1) at our headquarters, in the City of São Paulo, state of São Paulo, at Avenida Brigadeiro Faria Lima, 4,100, 16th floor, ZIP Code 04538-132 and (2) on the internet at our website (https://ri.cosan.com.br/en/), the website of the CVM (https://www.cvm.gov.br/cvm/en?set_language=en), and the website of B3 (www.b3.com.br). The information included on these websites does not form part of this current report and is not incorporated by reference herein.
Who May Call a Shareholders’ Meeting
The shareholders’ meetings may be called by our board of directors and by:
- any shareholder, if our board of directors fails to call a shareholders’ meeting within 60 days after the date it is required to do so under applicable law and our bylaws;
- shareholders holding at least five percent of our capital stock, if our board of directors fails to call a meeting within eight days after receipt of a justified request to call the meeting by those shareholders indicating the proposed agenda;
- shareholders holding at least five percent of our capital stock if our board of directors fails to call a meeting within eight days after receipt of a request to call the meeting for the creation of the fiscal council; or
- our fiscal council, if one is created, if the board of directors fails to call an annual shareholders’ meeting within one month after the date it is required to do so under applicable law and our bylaws, or if the fiscal council believes that there are important or urgent matters to be addressed.
Notice of a Shareholders’ Meeting
All notices of general meetings must be published at least three times in any newspaper widely circulated, which, in our case, is the Folha de São Paulo. The notice must include, in addition to the place, date and time, the agenda of the meeting and, in the case of a proposed amendment to our bylaws, a description of the subject matter of the proposed amendment.
Conditions of Admission to our Shareholders’ Meeting
In order to attend a shareholders’ meeting and exercise their voting rights shareholders must, within two days prior to the shareholders’ meeting, prove their status as shareholders and their ownership of by presenting his or her identity card/organizational documents and proof of power of attorney, if applicable, and proof of deposit issued by the financial institution responsible for the bookkeeping of the common shares of Cosan.
A shareholder may be represented at a shareholders’ meeting by a proxy, appointed less than one year before the meeting, who must be one of our shareholders, or one of our officers or directors, a lawyer or a financial institution represented by their manager.
Delisting from the Novo Mercado
At any time, Cosan may decide to delist its common shares from the Novo Mercado. In order to delist its common shares from the Novo Mercado, Cosan (or its controlling shareholders) would be required to first launch a public tender offer through which Cosan or the controlling shareholders would acquire the free float shares, or the “Delisting TO.” The Delisting TO must comply with the applicable rules of the CVM Resolution No. 85, dated March 31, 2022, as amended or “CVM Resolution No. 85,” and (1) have a “fair price,” according to the Brazilian Corporation Law; and (2) be approved by the holders of more than 2/3 of the outstanding free float shares. However, the Delisting TO requirement can be waived so long as holders of 2/3 of the free float shares approve such waiver. Our delisting from the Novo Mercado will not necessarily result in the loss of its registration as a public company on the B3.
If Cosan delists from Novo Mercado due a corporate restructuring transaction, either (1) the surviving company must submit the application for listing on the Novo Mercado within 120 days after the date of the shareholders’ meeting that approved such corporate restructuring transaction or (2) if the resulting companies do not wish to be listed on the Novo Mercado, the majority of the holders of the outstanding free float shares must approve such corporate restructuring transaction.
In certain circumstances, Cosan (or its controlling shareholders) could be required under the Novo Mercado rules to launch a Delisting TO. Novo Mercado regulation stipulates that the compulsory delisting from Novo Mercado will be applied only in the event Cosan has violated Novo Mercado listing rules for a period of more than nine months.
Under CVM rules, if the offeror in a Delisting TO, or the “Delisting TO Offeror,” subsequent transfers shareholding control within the 12-month period following the occurrence of a Delisting TO, the Delisting TO Offeror must pay to the former shareholders that tendered their shares in the Delisting TO, or the “Delisting TO Former Shareholders,” on a pro rata basis, the difference, if any, between the tender offer price paid to the Delisting TO Former Shareholders and the price the Delisting TO Offeror received in such subsequent transfer.
Purchases of Our Common Shares for Treasury
Pursuant to CVM Resolution No. 77, dated March 29, 2022, or “CVM Resolution No. 77,” the purchase or sale by us of our own shares requires shareholders’ approval in the event that the transaction:
- takes place outside a stock exchange or over-the-counter market, or involves more than 5.0% of the outstanding shares of a certain type or class, and is performed within an 18-month period;
- takes place outside a stock exchange or over-the-counter market and at prices that are 10.0% higher with respect to purchases, and 10.0% lower, with respect to sales, than the price of our shares quoted on the relevant stock exchange;
- aims to change or prevent a change in our controlling shareholding or administrative structure; and
- takes place outside a stock exchange or over-the-counter market and the counterpart is a related party.
Subject to certain conditions described in CVM Resolution No. 77, our shareholders’ approval is not required for the purchase or sale by us of our own shares:
- where the counterparty is a member of our board of directors, our officer, employee or supplier in the context of exercise of stock options granted under a stock option plan (or other similar plans); or
- in the context of a secondary public offering of treasury shares (or securities convertible or exchangeable into treasury shares).
We may acquire our own shares to be held in treasury, sold or canceled, pursuant to a resolution of our board of directors or our shareholders, as applicable. We may not acquire our shares, hold them in treasury or cancel them in the event that such transaction:
- targets shares owned by our controlling shareholders;
- takes place on organized securities markets at prices higher than market price;
- is concurrent with a public offering for the acquisition of shares of Cosan, pursuant to the applicable securities regulations; or
- requires funds greater than those currently available to us.
In order to authorize the purchase of our own shares, our board of directors or our shareholders (through a resolution approved at a shareholders meeting) must specify the purpose of the transaction, the maximum number of shares to be acquired, the total number of our outstanding shares and the maximum period of time to effect such purchase (not exceeding 18 months), among other information required by CVM Resolution No. 77.
Policy for the Trading of Our Securities by Us and Its Controlling Shareholder (If Any), Directors and Officers
CVM Resolution No. 44, dated August 23, 2021, or “CVM Resolution No. 44,” establishes that “insiders” must abstain from trading our securities, including derivatives backed by or linked to our securities, prior to our disclosure of material information to the market.
The following persons are considered insiders for purposes of CVM Resolution No. 44: we, any person who negotiated any of our securities and made use of any relevant nondisclosed information acquired, our controlling shareholder (if any), members of our board of directors, executive officers, members of our fiscal council and whoever by virtue of its title, duty or position in our company, our controlling shareholder, controlled companies or affiliates has knowledge of a material fact and is aware that such fact has not been disclosed to the market, including auditors, analysts, underwriters and advisors.
Such restriction on trading also applies:
- to any of our former officers, members of our board of directors or our fiscal council for a three-month period, if any such officer, director or member of the fiscal council left our company prior to the disclosure of material information he/she was aware of while in office;
- in the event that we intend to acquire another company, consolidate, spin off part or all of our assets, merge, transform, or reorganize;
- to us, in connection with or for the transfer of our control, or in the event that an option or mandate to such effect has been granted, and any other negotiation involving our securities;
- to our direct and indirect controlling shareholders, their officers and members of their board of directors, whenever we, any of our subsidiaries or affiliates are in the process of purchasing or selling common shares of Cosan or have granted stock options over shares of Cosan, or if a mandate for such purposes has been granted; or
- during the 15-day period preceding the disclosure of our quarterly information (informações trimestrais) or our standardized financial statements (demonstrações financeiras padronizadas), which is a standard form report containing relevant financial information derived from our financial statements that we are required to file with the CVM.
Investors who are non-residents in Brazil must register their investment in shares under Law No. 4,131, or CMN Resolution No. 4,373, and CVM Resolution No. 13 of November 18, 2020.
CMN Resolution No. 4,373 affords favorable tax treatment to foreign investors who are not residents in a low or nil tax jurisdiction, as defined by Brazilian tax laws (please refer to the section “Taxation” for further discussion on the concept of a low or nil tax jurisdiction under Brazilian law).
Under CMN Resolution No. 4,373, investors who are non-residents in Brazil may invest in almost all financial assets and engage in almost all transactions available in the Brazilian financial and capital markets, provided that certain requirements are met. CMN Resolution No. 4,373 covers investors who are individuals, companies, mutual funds and other collective investment entities domiciled or headquartered outside of Brazil. Under CMN Resolution No. 4,373, an investor under this category must:
- appoint one or more representatives in Brazil, which must be a financial institution duly authorized by the Brazilian Central Bank to receive service of process related to any action regarding financial and capital markets legislation, among others;
- obtain a taxpayer identification number from the Brazilian tax authorities;
- appoint one or more authorized custodians in Brazil for its investments, who must be duly authorized by the CVM; and
- through its representative or representatives, register as a foreign investor with the CVM and register its investments with the Brazilian Central Bank.
In addition, an investor operating under the provisions of CMN Resolution No. 4,373 must be registered with the Brazilian internal revenue service pursuant to its Normative Ruling No. 2,119/2022. This registration process is undertaken by the investor’s legal representative in Brazil.
Securities and other financial assets held by non-Brazilian investors pursuant to CMN Resolution No. 4,373 must be registered or maintained in deposit accounts or under the custody of an entity duly licensed by the Brazilian Central Bank or the CVM. In addition, securities trading is restricted to transactions carried out in the stock exchanges or through organized over-the-counter markets licensed by the CVM, except for transfers resulting from a corporate reorganization, or occurring upon the death of an investor by operation of law or will.
Non-Brazilian investors may also invest directly under Law No. 4,131 and may sell their shares in both private and open market transactions, but these investors are subject to less favorable tax treatment on gains than Resolution No. 4,373 investors. A non-Brazilian direct investor under Law No. 4,131 must:
- register as a foreign direct investor with the Brazilian Central Bank;
- obtain a Brazilian identification number from the Brazilian tax authorities;
- appoint a tax representative in Brazil; and
- appoint a representative in Brazil for service of process in respect of suits based on the Brazilian Corporation Law.
If a holder of ADSs decides to exchange ADSs for the underlying common shares, the holder will be entitled to (1) sell the common shares on the B3 and rely on the depositary’s electronic registration for five business days from the date of exchange to obtain and remit U.S. dollars abroad upon the holder’s sale of our common shares, (2) convert its investment into a foreign portfolio investment under of CMN Resolution No. 4,373, or (3) convert its investment into a foreign direct investment under Law No. 4,131.
If a holder of ADSs wishes to convert their investment into either a foreign portfolio investment under CMN Resolution No. 4,373 or a foreign direct investment under Law No. 4,131, they should begin the process of obtaining foreign investor registration with the Brazilian Central Bank or with the CVM as the case may be, in advance of exchanging the ADSs for common shares.
The custodian is authorized to update the depositary’s electronic registration to reflect conversions of ADSs into foreign portfolio investments under CMN Resolution No. 4,373. If a holder of ADSs elects to convert their ADSs into a foreign direct investment under Law No. 4,131, the conversion will be effected by the Brazilian Central Bank after receipt of an electronic request from the custodian with details of the transaction.
If a foreign direct investor under Law No. 4,131 wishes to deposit their shares into the ADR program in exchange for ADSs, such holder will be required to present to the custodian evidence of payment of capital gains taxes. The conversion will be effected by the Brazilian Central Bank after receipt of an electronic request from the custodian with details of the transaction. Please refer to “Taxation” for a description of the tax consequences to an investor residing outside Brazil of investing in our common shares in Brazil.
For additional information on Brazilian tax consequences of investing in our common shares, see “Taxation.”
Our common shares became listed on the B3 and began trading under the symbol “CSAN3” on November 18, 2005. Following the Merger, our ADSs began trading on the NYSE under the symbol “CSAN,” on March 8, 2021. On April 30, 2024, there were 1,860,335,869 common shares issued and outstanding (excluding 13,735,073 common shares held in treasury), out of which 62,082,104 (representing 248,328,416 common shares) were represented by ADSs outstanding, which is equivalent to 13.25% of our total outstanding shares. On April 30, 2024, we had approximately 153,375 shareholders, including approximately 215 registered U.S. resident holders of our common shares listed on the B3.
Trading on the São Paulo Stock Exchange
Settlement of transactions conducted on the São Paulo Stock Exchange, or Brasil, Bolsa, Balcão, or the “B3,” becomes effective two business days after the trade date. Delivery of, and payment for, shares is made through the facilities of separate clearinghouses for each exchange, which maintain accounts for member brokerage firms. The seller is ordinarily required to deliver the shares to the clearinghouse of the B3 on the second business day following the trade date.
In order to better control volatility, the B3 has adopted a “circuit breaker” system pursuant to which trading sessions may be suspended for a period of 30 minutes or one hour whenever the indices of these stock exchanges fall below the limits of 10% and 15%, respectively, in relation to the index registered in the previous trading session.
The Brazilian securities market is substantially smaller, less liquid, more concentrated and more volatile than major securities markets in the United States and other jurisdictions, and may be regulated differently from the ways familiar to U.S. investors. There is also significantly greater concentration in the Brazilian securities market than in major securities markets in the United States. Although any of the outstanding shares of a listed company may trade on a Brazilian stock exchange, in most cases fewer than half of the listed shares are actually available for trading by the public, the remainder being held by small groups of controlling persons, governmental entities or one principal shareholder.
Trading on the B3 by non-residents of Brazil is subject to certain limitations under Brazilian foreign investment and tax legislation. See “Taxation” and “Description of Share Capital—B. Exchange Controls.”
São Paulo Stock Exchange Corporate Governance Standards
The B3 has three main listing segments:
- Level 1;
- Level 2; and
- Novo Mercado.
These listing segments have been designed for the trading of shares issued by companies that voluntarily undertake to abide by corporate governance practices and disclosure requirements in addition to those already required under the Brazilian Corporation Law and the rules of the CVM. The inclusion of a company in any of these listing segments requires adherence to a series of corporate governance rules. These rules are designed to increase shareholders’ rights and enhance the quality of information provided by Brazilian corporations.
As our common shares are listed on the Novo Mercado segment of the B3, in addition to the disclosure obligations imposed by the Brazilian Corporation Law and the CVM, we also must comply with the following additional disclosure requirements set forth by the Novo Mercado rules:
- no later than six months following our listing on the Novo Mercado, we must disclose financial statements and consolidated financial statements at the end of each quarter (except the last quarter of the year) and at the end of each fiscal year, including a statement of cash flows which must indicate, at a minimum, the changes in our cash and cash equivalents, divided into operating, financing and investing activities;
- from the date on which we release our financial statements relating to the second fiscal year following our listing on the Novo Mercado we must, no later than four months after the end of the fiscal year: (1) prepare our annual financial statements and consolidated financial statements, if applicable, in accordance with U.S. GAAP or IFRS, in reais or U.S. dollars, in the English language, together with (i) management reports, (ii) notes to the financial statements, including information on net income and shareholders’ equity calculated at the end of such fiscal year in accordance with Brazilian GAAP, as well as management proposals for allocation of net income, and (iii) our independent auditors’ report; or (2) disclose, in the English language, complete financial statements, management reports and notes to the financial statements, prepared in accordance with the Brazilian Corporation Law, accompanied by (i) an additional note regarding the reconciliation of year-end net income and shareholders’ equity calculated in accordance with Brazilian GAAP to U.S. GAAP or IFRS, as the case may be, which must include the main differences between the accounting principles used, and (ii) the independent auditors’ report; and
- from the date on which we release our first financial statement prepared as provided above, no more than 15 days following the term established by law for the publication of quarterly financial information, we must: (1) disclose, in its entirety, our quarterly financial information translated into the English language or (2) disclose our financial statements and consolidated financial statements in accordance with Brazilian GAAP, U.S. GAAP or IFRS as provided above, accompanied by the independent auditors’ report.
No later than six months following the listing of our common shares on the Novo Mercado, we must disclose the following information together with our ITR:
- our consolidated balance sheet, consolidated income statement and a discussion and analysis of our consolidated performance, if we are obliged to disclose consolidated financial statements at year-end;
- any direct or indirect ownership interest exceeding 5.0% of our capital stock, considering any ultimate individual beneficial owner;
- the number and characteristics, on a consolidated basis, of our common shares held directly or indirectly by any controlling shareholders, members of our board of directors, board of executive officers and fiscal committee;
- changes in the numbers of our common shares held by any controlling shareholders, members of our board of directors, board of executive officers and fiscal committee in the immediately preceding 12 months;
- in an explanatory note, our statement of cash flows and consolidated statement of cash flows, which should indicate the cash flows changes in cash balance and cash equivalent, separated into operating, financing and investing activities; and
- the number of free-float shares, and their percentage in relation to the total number of issued shares.
The following information must also be included in our formulário de referência within seven business days of the occurrence of the following events, among others:
- change in management or of an audit committee member;
- change in capital stock;
- issuance of new securities even if for private subscription;
- change in the rights of the securities issued;
- change in direct or indirect holdings by controlling shareholders or variations in their share positions equal to or greater than 5% of the same types or class of stocks of the issuer;
- when any natural or legal person, or a group of persons representing the same interest, has a direct or indirect share that is equal to or higher than 5% of the same type or class of stocks of the issuer, provided that the issuer is aware of such change;
- any change in the share position held by the persons mentioned in the two preceding items, in an amount greater than 5% of the same types or class of stocks of the issuer, provided that the issuer is aware of such change;
- merger, merger of shares, or spin-off;
- change in the projections or estimates or disclosure of new projections or estimates;
- execution, amendment or termination of a shareholders’ agreement filed at the company’s headquarters or to which the controlling shareholder is party that provides for the exercise of voting rights or the control of the company; and
- bankruptcy, judicial recovery, liquidation, or court approval of an extrajudicial recovery.
All members of our board of directors, our board of executive officers and our fiscal council have signed a management compliance statement (Termo de Anuência dos Administradores) under which they take personal responsibility for compliance with the Novo Mercado listing agreement, the rules of the Market Arbitration Chamber and the regulations of the Novo Mercado.
Additionally, pursuant to the Novo Mercado rules, we must, by December 10 of each year, publicly disclose and send to the B3 an annual calendar with a schedule of our corporate events. Any subsequent modification to such schedule must be immediately and publicly disclosed and sent to B3.
JPMorgan Chase Bank, N.A., or the “Depositary,” has acted as depositary in relation to the ADSs program since March 5, 2021. The Depositary’s office is located at 383 Madison Avenue, Floor 11, New York, NY 10179.
Fees and Expenses
The Depositary may charge each person to whom ADSs are issued, including, without limitation, issuances against deposits of common shares of Cosan, issuances in respect of share distributions, rights and other distributions, issuances pursuant to a stock dividend or stock split declared by us or issuances pursuant to a merger, exchange of securities or any other transaction or event affecting the ADSs or deposited securities, and each person surrendering ADSs for withdrawal of deposited securities or whose ADSs are cancelled or reduced for any other reason, U.S.$5.00 for each 100 ADSs (or any portion thereof) issued, delivered, reduced, cancelled or surrendered, as the case may be. The Depositary may sell (by public or private sale) sufficient securities and property received in respect of a share distribution, rights and/or other distribution prior to such deposit to pay such charge.
The following additional charges shall also be incurred by the holders of American Depositary Receipts evidencing ADSs of Cosan, or “ADRs,” and beneficial owners of ADSs, by any party depositing or withdrawing common shares of Cosan or by any party surrendering ADSs and/or to whom ADSs are issued (including, without limitation, issuance pursuant to a stock dividend or stock split declared by us or an exchange of stock regarding the ADSs or the deposited securities or a distribution of ADSs), whichever is applicable:
- a fee of up to U.S.$0.05 per ADS held upon which any cash distribution made pursuant to the deposit agreement or in the case of an elective cash/stock dividend, upon which a cash distribution or an issuance of additional ADSs is made as a result of such elective dividend;
- an aggregate fee of up to U.S.$0.05 per ADS per calendar year (or portion thereof) for services performed by the Depositary in administering the ADRs (which fee may be charged on a periodic basis during each calendar year and shall be assessed against ADR holders as of the record date or record dates set by the Depositary during each calendar year and shall be payable in the manner described in the next succeeding provision);
- a fee for the reimbursement of such fees, charges and expenses as are incurred by the Depositary and/or any of its agents (including, without limitation, the Custodian and expenses incurred on behalf of ADR holders in connection with compliance with foreign exchange control regulations or any law, rule or regulation relating to foreign investment) in connection with the servicing of the common shares of Cosan or other deposited securities, the sale of securities (including, without limitation, deposited securities), the delivery of deposited securities or otherwise in connection with the Depositary’s or its Custodian’s compliance with applicable law, rule or regulation (which fees and charges shall be assessed on a proportionate basis against ADR holders as of the record date or dates set by the Depositary and shall be payable at the sole discretion of the Depositary by billing such ADR holders or by deducting such charge from one or more cash dividends or other cash distributions), including, without limitation, any amounts charged by any governmental authorities or other institutions such as the B3 S.A. – Brasil, Bolsa, Balcão, the stock exchange on which the common shares of Cosan are registered for trading;
- a fee for the distribution of securities (or the sale of securities in connection with a distribution), such fee being in an amount equal to the U.S.$0.05 per ADS issuance fee for the execution and delivery of ADSs which would have been charged as a result of the deposit of such securities (treating all such securities as if they were common shares of Cosan) but which securities or the net cash proceeds from the sale thereof are instead distributed by the Depositary to those ADR holders entitled thereto;
- stock transfer or other taxes and other governmental charges;
- SWIFT, cable, telex and facsimile transmission and delivery charges incurred at your request in connection with the deposit or delivery of common shares of Cosan, ADRs or deposited securities;
- transfer or registration fees for the registration of transfer of deposited securities on any applicable register in connection with the deposit or withdrawal of deposited securities; and
- fees of any division, branch or affiliate of the Depositary utilized by the Depositary to direct, manage and/or execute any public and/or private sale of securities under the deposit agreement.
To facilitate the administration of various Depositary receipt transactions, including disbursement of dividends or other cash distributions and other corporate actions, the Depositary may engage the foreign exchange desk within the Depositary and/or its affiliates in order to enter into spot foreign exchange transactions to convert foreign currency into U.S. dollars.
The fees and charges you may be required to pay may vary over time and may be changed by us and by the Depositary. ADR holders will receive prior notice of the increase in any such fees and charges. The right of the Depositary to charge and receive payment of fees, charges and expenses as provided above shall survive the termination of the deposit agreement.
The Depositary may make available to us a set amount or a portion of the Depositary fees charged in respect of the ADR program or otherwise upon such terms and conditions as we and the Depositary may agree from time to time. The Depositary collects its fees for issuance and cancellation of ADSs directly from investors depositing common shares of Cosan or surrendering ADSs for the purpose of withdrawal or from intermediaries acting for them. The Depositary collects fees for making distributions to investors by deducting those fees from the amounts distributed or by selling a portion of distributable property to pay the fees. The Depositary may collect its annual fee for Depositary services by deduction from cash distributions, or by directly billing investors, or by charging the book-entry system accounts of participants acting for them. The Depositary will generally set off the amounts owing from distributions made to ADR holders. If, however, no distribution exists and payment owing is not timely received by the Depositary, the Depositary may refuse to provide any further services to ADR holders that have not paid those fees and expenses owing until such fees and expenses have been paid. At the discretion of the ADS Depositary, all fees and charges owing under the deposit agreement are due in advance and/or when declared owing by the ADS Depositary.
Direct and Indirect Payments
The Depositary has agreed to reimburse us for certain expenses related to the establishment and maintenance of the ADR program upon such terms and conditions as we and the Depositary may agree from time to time. Under certain circumstances, including the removal of JPMorgan Chase Bank, N.A. as depositary, we are required to repay to JPMorgan Chase Bank, N.A. amounts reimbursed in prior periods. For the year ended December 31, 2023, such reimbursements paid to us by the Depositary amounted to U.S.$0.23 million.
U.S. Federal Income Tax Considerations
The following is a description of the material U.S. federal income tax consequences of owning and disposing of our common shares or ADSs during the year ended December 31, 2023. It does not purport to be a comprehensive description of all of the tax considerations that may be relevant to a particular person’s decision to hold the securities. This discussion applies to you only if you are a U.S. Holder (as defined below) that holds our common shares or ADSs as capital assets for U.S. federal income tax purposes.
This discussion does not describe all of the tax consequences that may be relevant to you in light of your particular circumstances, including alternative minimum tax consequences, the potential application of the provisions of the Internal Revenue Code of 1986, as amended, or the “Code,” known as the Medicare contribution tax and differing tax consequences applicable to you if you are, for instance:
- a financial institution;
- a regulated investment company;
- a dealer or electing trader in securities that uses a mark-to-market method of tax accounting;
- holding our common shares or ADSs as part of a “straddle,” integrated transaction or similar transaction;
- a person whose functional currency for U.S. federal income tax purposes is not the U.S. dollar;
- a partnership for U.S. federal income tax purposes;
- a tax-exempt entity; or
- a person that owns or is deemed to own 10% or more of our stock (by vote or value);
If you are a partnership for U.S. federal income tax purposes holding our common shares or ADSs, the U.S. federal income tax treatment of your partners will generally depend on the status of the partners and the activities of your partnership. Partnerships holding our common shares or ADSs and partners in such partnerships should consult their tax advisers as to the particular U.S. federal income tax consequences of holding and disposing of our common shares or ADSs.
This discussion is based on the Code, administrative pronouncements, judicial decisions and final, temporary and proposed Treasury regulations, all as of the date hereof, any of which is subject to change, possibly with retroactive effect. Please consult your tax adviser concerning the U.S. federal, state and local and non-U.S. tax consequences of owning and disposing of our common shares or ADSs in your particular circumstances.
As used herein, the term “U.S. Holder” means a beneficial owner of our common shares or ADSs that is, for U.S. federal income tax purposes:
- a citizen or individual resident of the United States;
- a corporation, or other entity taxable as a corporation, created or organized in or under the laws of the United States or any state therein or the District of Columbia; or
- an estate or trust the income of which is subject to U.S. federal income taxation regardless of its source.
In general, if you own ADSs, you will be treated as the owner of the underlying shares represented by those ADSs for U.S. federal income tax purposes. Accordingly, no gain or loss will be recognized if you exchange ADSs for the underlying shares represented by those ADSs.
This discussion generally assumes that we are not, and will not become, a passive foreign investment company, as described below.
Taxation of Distributions
The following is subject to the discussion under “—Passive Foreign Investment Company Rules” below.
Distributions paid on our common shares or ADSs (including distributions that are treated as interest on equity for Brazilian tax purposes, as discussed below under “—Brazilian Tax Considerations”), other than certain pro rata distributions of common shares or ADSs, will be treated as dividends to the extent paid out of our current or accumulated earnings and profits (as determined under U.S. federal income tax principles). Because we do not expect to determine our earnings and profits in accordance with U.S. federal income tax principles, you should expect that a distribution will generally be reported as a dividend. Dividends paid by qualified foreign corporations to certain non-corporate U.S. Holders are taxable at rates applicable to long-term capital gains. A foreign corporation is treated as a qualified foreign corporation with respect to dividends paid on stock that is readily tradable on a securities market in the United States, such as the NYSE (where our ADSs are traded). It is unclear whether these reduced rates will apply to dividends paid with respect to our common shares that are not represented by ADSs. You should consult your tax adviser to determine whether these preferential rates will apply to dividends you receive and whether you are subject to any special rules that limit your ability to be taxed at these preferential rates.
The amount of a dividend will include any amounts withheld in respect of Brazilian taxes on the distribution. The amount of the dividend will be treated as foreign-source dividend income to you and will not be eligible for the dividends-received deduction generally allowed to U.S. corporations under the Code. Dividends will be included in your income on the date of your or, in the case of ADSs, the depositary’s, receipt of the dividend. The amount of any dividend income paid in reais will be the U.S. dollar amount calculated by reference to the exchange rate in effect on the date of such receipt regardless of whether the payment is in fact converted into U.S. dollars. If the dividend is converted into U.S. dollars on the date of receipt, you generally should not be required to recognize foreign currency gain or loss in respect of the dividend income. You may have foreign currency gain or loss if the dividend is converted into U.S. dollars after the date of its receipt.
Sale or Other Disposition of Common Shares or ADSs
The following is subject to the discussion under “—Passive Foreign Investment Company Rules” below.
For U.S. federal income tax purposes, gain or loss you realize on the sale or other disposition of our common shares or ADSs will be capital gain or loss, and will be long-term capital gain or loss if you held those shares or ADSs for more than one year at the time of disposition. The amount of gain or loss will be equal to the difference between your tax basis in the common shares or ADSs disposed of and the amount realized on the disposition. The gain or loss will generally be U.S.-source gain or loss for foreign tax credit purposes. If a Brazilian tax is withheld on the sale or other disposition of common shares or ADSs, your amount realized will include the gross amount of the proceeds of such sale or other disposition before deduction of the Brazilian tax.
See “—Brazilian Tax Considerations—Income Tax—Capital Gains” for a description of when a disposition may be subject to taxation by Brazil.
Foreign Tax Credits in Respect of Brazilian Taxes
Subject to applicable limitations that may vary depending upon your circumstances, including limitations described in the following discussion, it is possible that Brazilian income taxes withheld from dividends on our common shares or ADSs might be creditable against your U.S. federal income tax liability. On December 28, 2021, new Treasury Regulations pertaining to foreign tax credits (the “FTC Regulations”) were released that impose significant new limitations on the non-U.S. taxes (including withholding taxes) for which a foreign tax credit can be claimed. Corrections with respect to the FTC Regulations were published on July 27, 2022. We have not determined whether these limitations will prevent you from claiming a foreign tax credit with respect to any withholding tax imposed on dividends on common shares or ADSs. Furthermore, recent notices from the IRS indicate that the Treasury and the IRS are considering proposing amendments to such regulations and allow taxpayers, subject to certain conditions, to defer the application of many aspects of such regulations until the date when a notice or other guidance withdrawing or modifying this temporary relief is issued (or any later date specified in such notice or other guidance). If Brazilian withholding taxes on dividends on common shares or ADSs were otherwise creditable, the availability of those credits would be subject to other applicable limitations that may vary depending on your circumstances. You should therefore consult your tax advisers as to the availability of foreign tax credits for any amounts withheld with respect to dividends on common shares or ADSs.
You will be entitled to use foreign tax credits to offset only the portion of your U.S. tax liability that is attributable to foreign-source income. This limitation on foreign taxes eligible for credit is calculated separately with regard to specific classes of income. In addition, you must satisfy minimum holding period requirements in order to be eligible to claim a foreign tax credit for foreign taxes withheld on dividends.
In addition, the FTC Regulations generally will preclude you from claiming a foreign tax credit with respect to any tax imposed on gains from the disposition of shares by a jurisdiction, such as Brazil, that does not have an applicable income tax treaty with the United States. As discussed above, the IRS has released notices that provide temporary relief from certain of the provisions of the FTC Regulations (including the limitation described in the preceding sentence) for taxable years ending before the date that a notice or other guidance withdrawing or modifying the temporary relief is issued (or any later date specified in such notice or other guidance). However, because any gain from dispositions of the common shares or ADSs generally will be U.S.-source gain for foreign tax credit purposes, even if the FTC Regulations do not prohibit a U.S. Holder from claiming a foreign tax credit with respect to Brazilian income taxes on disposition gains, other limitations under the foreign tax credit rules may preclude a U.S. Holder from claiming a foreign tax credit with respect to such Brazilian income taxes.
If you are precluded from claiming a foreign tax credit, it is possible that any Brazilian taxes on disposition gains may either be deductible or reduce the amount realized on the disposition. An election to deduct foreign taxes instead of claiming foreign tax credits must apply to all taxes paid or accrued in the taxable year to foreign countries and possessions of the United States.
Any Brazilian IOF/Exchange Tax (as discussed below under “—Brazilian Tax Considerations—Tax on Mergers Involving Bonds and Securities”) will not be treated as creditable foreign taxes for U.S. federal income tax purposes. You should consult your tax adviser regarding the tax treatment of these taxes for U.S. federal income tax purposes.
The rules governing foreign tax credits are complex and, therefore, you should consult your tax adviser regarding the creditability or deductibility of any Brazilian tax in your particular circumstances.
Passive Foreign Investment Company Rules
In general, a non-U.S. corporation will be a “passive foreign investment company,” or “PFIC,” for U.S. federal income tax purposes for any taxable year in which, after applying certain look-through rules, either (1) at least 75% of its gross income is “passive income” or (2) at least 50% of the average quarterly value of its assets consists of assets that produce “passive income” or are held for the production of “passive income.” For purposes of these calculations, a non-U.S. corporation that owns (or is treated as owning for U.S. federal income tax purposes), directly or indirectly, at least 25% by value of the stock of another corporation is treated as if it held its proportionate share of the assets of the other corporation and received directly its proportionate share of the income of the other corporation. On the other hand, an equity investment in a corporation representing less than 25% by value of that corporation is generally treated as a passive asset for purposes of the PFIC rules. Passive income for this purpose generally includes dividends, interest, royalties, rents and gains from foreign currency, securities and certain commodities transactions. In addition, the value of a company’s goodwill is an active asset under the PFIC rules to the extent attributable to activities that produce active income.
Based on information currently available to us, we expect that we were not a PFIC for our taxable year ended December 31, 2023. However, this is subject to further evaluation when the Company's audited consolidated financial statements for the year ended December 31, 2023 in accordance with PCAOB standards have been completed, and we cannot assure you that we will not be considered a PFIC for the 2023 taxable year or any future taxable year. Our PFIC status for any taxable year is an annual factual determination that can be made only after the end of that year and depends on the composition of our income and assets and the value of our assets from time to time. Moreover, we hold significant minority investments in certain entities (representing less than 25% by value of the relevant entity’s equity). Accordingly, our PFIC status for any taxable year will depend in part on the value of those minority investments relative to the value of our active assets, including goodwill. The value of our goodwill may be determined, in large part, by reference to our market capitalization. If the value of our minority (less-than-25%-owned) equity investments were to increase relative to our active assets (in particular, if our market capitalization were to decline), we could be treated as a PFIC for our taxable year 2024 and/or future taxable years. Thus, we cannot assure you that we will not be considered a PFIC for any taxable year.
If we were a PFIC for any taxable year during which you held our common shares or ADSs, gain recognized by you on a sale or other disposition (including certain pledges) of the common shares or ADSs would be allocated ratably over your holding period for the common shares or ADSs. The amounts allocated to the taxable year of the sale or other disposition and to any year before we became a PFIC would be taxed as ordinary income. The amount allocated to each other taxable year would be subject to tax at the highest rate on ordinary income in effect for individuals or corporations, as appropriate for that taxable year, and an interest charge would be imposed on the resulting tax liability. Further, to the extent any distribution in respect of our common shares or ADSs exceeded 125% of the average of the annual distributions on common shares or ADSs received by you during the preceding three years or your holding period, whichever was shorter, that distribution would be subject to taxation in the same manner as gain, described immediately above. Certain elections might be available that would result in alternative treatments (such as mark-to-market treatment) of our common shares or ADSs. You should consult your tax adviser to determine whether these elections would be available and, if so, what the consequences of the alternative treatments would be in your particular circumstances.
In addition, if we were a PFIC for the taxable year in which we paid a dividend or for the prior taxable year, the favorable tax rates applicable to long-term capital gains discussed above with respect to dividends paid to non-corporate U.S. Holders would not apply.
If a U.S. Holder owns our common shares or ADSs during any year in which we are a PFIC, the U.S. Holder generally must file annual reports containing such information as the U.S. Treasury may require on IRS Form 8621 (or any successor form) with respect to the Company, generally with the U.S. Holder’s federal income tax return for that year.
U.S. Holders should consult their tax advisers regarding the potential application of the PFIC rules.
Information Reporting and Backup Withholding
Payments of dividends and sales proceeds that are made within the United States or through certain U.S.-related financial intermediaries generally are subject to information reporting and backup withholding unless (1) you are a corporation or other exempt recipient or (2) in the case of backup withholding, you provide a correct taxpayer identification number and certify that you are not subject to backup withholding.
The amount of any backup withholding from a payment to you will be allowed as a credit against your U.S. federal income tax liability and may entitle you to a refund, provided that the required information is timely furnished to the Internal Revenue Service.
Brazilian Tax Considerations
Income Tax
Dividends
Dividends paid by a Brazilian corporation, such as Cosan, including stock dividends and other dividends paid to a Non-Resident Holder of common shares, are currently not subject to withholding income tax in Brazil to the extent that these amounts are related to profits generated on or after January 1, 1996. Dividends paid from profits generated prior to January 1, 1996 may be subject to Brazilian withholding income tax at varying rates, according to the tax legislation applicable to each corresponding year.
Notwithstanding the foregoing, it should be noted that Brazilian GAAP was subject to changes in the end of 2007 (effective as of 2008) in order to conform to IFRS accounting standards. However, until January 1, 2015, Brazilian companies were still required to adopt, for tax purposes, the accounting rules and criteria that were effective on December 31, 2007, or the old Brazilian GAAP, pursuant to a transitory tax regime (regime tributário de transição), or RTT. Law No. 12,973 of May 13, 2014, as amended, or Law No. 12,973/14, extinguished the RTT and approved new rules aimed at permanently aligning the Brazilian tax system with IFRS as of January 1, 2015, including with respect to dividend distributions. For the 2014 fiscal year, the taxpayers were entitled to elect to adopt the new rules or to adopt the RTT.
Under the RTT, there was controversy on how tax authorities would view certain situations, including whether dividends should be calculated in accordance with the IFRS rules or the old Brazilian GAAP. It was debatable whether any dividend distributions made in accordance with IFRS rules in excess of the amount that could have been distributed had the profits been ascertained based on the old Brazilian GAAP would be taxable income. In view of such controversy, Law No. 12,973/14 expressly determines that dividends calculated in accordance with the IFRS rules based on profits ascertained between January 1, 2008 and December 31, 2013 should not be subject to taxation.
Notwithstanding the provisions of Law No. 12,973/14, Brazilian tax authorities issued Normative Ruling No. 1,492, of September 17, 2014, or Normative Ruling No. 1,492/14, which provides that dividend distributions supported by IFRS profits ascertained in the year 2014 that exceed the amount resulting from the adoption of the old Brazilian GAAP should be subject to taxation. However, this rule would only apply to taxpayers that have not elected to account for the effects of Law No. 12,973/14 (i.e., taxation based on IFRS rules) for the 2014 fiscal year.
Despite our belief that the tax exemption on dividends applies to dividends distributed by Brazilian companies out of profits ascertained in accordance with IFRS principles, there can be no assurance that dividends distributed out of the profits of companies ascertained in the 2014 fiscal year and that have not elected to adopt the new rules in said fiscal year will be tax exempt. If the provisions of Normative Ruling No. 1,492/14 are applicable, dividends ascertained in the fiscal year of 2014 based on IFRS that exceed the amount that would result from the adoption of the old Brazilian GAAP could be subject to withholding income tax at the rate of 15%, or 25% if the Non-Resident Holder is domiciled in a country or other jurisdiction (1) that does not impose income tax, (2) where the maximum income tax rate is lower than 20.0% or 17%, as the case may be, or (3) where the applicable local laws impose restrictions on the disclosure of the shareholding composition or the ownership of investments (a “Low or Nil Tax Jurisdiction”). See “—Discussion on Low or Nil Tax Jurisdictions.”
Finally, there is proposed legislation pending before the Brazilian Congress seeking to impose taxes on dividend income. It is not possible to predict if the taxation of dividends will be effectively approved by the Brazilian Congress and how such taxation would be implemented.
Interest Attributable to Shareholder’s Equity
Law No. 9,249, dated December 26, 1995, as amended, or Law No. 9,249/95, allows a Brazilian corporation, such as Cosan, to make distributions to shareholders of interest on equity and treat those payments as deductible expense, for purposes of calculating Brazilian corporate income tax and social contribution on net profits as long as the limits described below are observed. These distributions may be paid in cash. For tax purposes, this interest is limited to the daily pro rata variation of the TJLP as determined by the Brazilian Central Bank from time to time, and the amount of the deduction may not exceed the greater of:
- 50% of net income (before distributions and any deductions for income taxes) for the year with respect to which the payment is made; and
- 50% of retained earnings for the year prior to the year payment is made. Payments of interest on shareholders’ equity are resolved by the shareholders based on recommendations of our board of directors.
Payment of interest on equity to a Non-Resident Holder is subject to withholding income tax at the rate of 15%, or 25% if the Non-Resident Holder is domiciled in a Low or Nil Tax Jurisdiction.
These payments may be included, at their net value, as part of any mandatory dividend. To the extent payment of interest on equity is so included, the corporation is required to distribute to shareholders an additional amount to ensure that the net amount received by them, after payment of the applicable Brazilian withholding income tax, plus the amount of declared dividends is at least equal to the mandatory dividend.
Distributions of interest on equity to Non-Resident Holders may be converted into U.S. dollars and remitted outside Brazil, subject to applicable exchange controls, to the extent that the investment is registered with the Brazilian Central Bank.
Capital Gains
According to Article 26 of Law No. 10,833, dated December 29, 2003, as amended, gains related to the sale or disposition of assets located in Brazil, such as the common shares of Cosan, by a Non-Resident Holder, are subject to withholding income tax in Brazil, regardless of whether the sale or disposition is made by a Non-Resident Holder to another non-resident of Brazil or to a Brazilian resident.
As a general rule, capital gains realized as a result of a sale or disposition of common shares are equal to the positive difference between the amount realized on the sale or disposition and the respective acquisition costs of the common shares.
There is a controversy regarding the currency that should be considered for purposes of determining the capital gain realized by a Non-Resident Holder on a sale or disposition of shares in Brazil, more specifically, if such capital gain is to be determined in foreign or in local currency.
Under Brazilian law, income tax on such gains can vary depending on the domicile of the Non-Resident Holder, the type of registration of the investment by the Non-Resident Holder with the Brazilian Central Bank and how the disposition is carried out, as described below.
Currently, capital gains realized by Non-Resident Holders on a sale or disposition of shares carried out on the B3 (including the organized over-the-counter market) are:
- exempt from income tax when realized by a Non-Resident Holder that (1) has registered its investment in Brazil with the Brazilian Central Bank under the rules of Resolution 4,373/14 of the Brazilian Monetary Council (a “4,373 Holder”), and (2) is not resident or domiciled in a Low or Nil Tax Jurisdiction;
- subject to income tax at a rate of 15% in the case of gains realized by (A) a Non-Resident Holder that (1) is not a 4,373 Holder and (2) is not resident or domiciled in a Low or Nil Tax Jurisdiction; or (B) a Non-Resident Holder that (1) is a 4,373 Holder, and (2) is resident or domiciled a Low or Nil Tax Jurisdiction; or
- subject to income tax at a rate of up to 25% in the case of gains realized by a Non-Resident Holder that (1) is not a 4,373 Holder, and (2) is resident or domiciled in a Low or Nil Tax Jurisdiction.
A withholding income tax of 0.005% will apply and can be offset against the eventual income tax due on the capital gain. Such withholding does not apply to a 4,373 Holder that is not resident or domiciled in a Low or Nil Tax Jurisdiction.
Under current law, for transactions taking place outside the B3 or the organized over-the counter market, capital gains recognized by a Non-Resident Holder would be, in principle, subject to income tax in Brazil at progressive rates from 15% to 22.5% or 25%, if such Non-Resident Holder is resident or domiciled in a Low or Nil Tax Jurisdiction. The rates mentioned above would apply unless a lower rate is provided for in an applicable tax treaty between Brazil and the country where the Non-Resident Holder is domiciled.
Law No. 13,259 of March 16, 2016 determined the new progressive taxation method over capital gains mentioned above that has been in force since January 1, 2017. Capital gains are subject to income tax based on the following rates:
(i) 15% on any capital gain not exceeding R$5,000,000.00;
(ii) 17.5% on the portion of the capital gain between R$5,000,000.00 and R$10,000,000.00;
(iii) 20% on the portion of the capital gain between R$10,000,000.00 and R$30,000,000.00; or
(iv) 22.5% on the portion of the capital gain exceeding R$30,000,000.00.
If the Non-Resident Holder is a 4,373 Holder and is not resident or domiciled in a Low or Nil Tax Jurisdiction, it is arguable that the progressive rates mentioned above should not apply and, in such case, the 4,373 Holder would be subject to income tax at a fixed rate of 15%.
In the cases above, if the capital gains are related to transactions conducted on the Brazilian non-organized over-the-counter market with the intermediation of a financial institution the withholding income tax of 0.005% will apply and can later be offset against any income tax due on the capital gains.
The exercise of any preemptive rights relating to our common shares will not be subject to Brazilian income tax. Gains realized by a Non-Resident Holder on the disposition of preemptive rights in Brazil will be subject to Brazilian income tax according to the same rules applicable to the sale or disposition of shares.
There can be no assurance that the current favorable tax treatment of 4,373 Holders will continue in the future.
Discussion on Low or Nil Tax Jurisdictions
According to Law No 9,430, dated December 27, 1996, Low or Nil Tax Jurisdiction is a country or location that (1) does not impose taxation on income, (2) imposes the income tax at a rate lower than 20% or (3) imposes restrictions on the disclosure of shareholding composition or the ownership of the investment. On November 28, 2014, the Brazilian tax authorities issued the Ordinance No. 488, which decreased from 20% to 17% such minimum threshold for specific cases. The 17% threshold applies only to countries and regimes aligned with international standards of fiscal transparency in accordance with rules to be established by the Brazilian tax authorities.
Law No. 11,727/08 created the concept of Privileged Tax Regimes, which encompasses the countries and jurisdictions that: (1) do not tax income or tax it at a maximum rate lower than 20.0%; (2) grant tax advantages to a non-resident entity or individual (a) without the need to carry out a substantial economic activity in the country or jurisdiction, or (b) conditioned to the non-exercise of a substantial economic activity in the country or jurisdiction; (3) do not tax or tax proceeds generated abroad at a maximum rate lower than 20.0%; or (4) restrict the ownership disclosure of assets and ownership right or restrict disclosure about economic transactions carried out. Although we believe that the best interpretation of the current tax legislation is that the above-mentioned “privileged tax regime” concept should apply solely for purposes of Brazilian transfer pricing and thin capitalization rules, among other rules that make express reference to the concepts, we can provide no assurance that the tax authorities will not interpret the rules as also applicable to a Non-Resident Holder on payments of interest on shareholders’ equity.
In addition, Brazilian tax authorities enacted Normative Ruling No. 1,037, of June 7, 2010, or Normative Ruling No. 1,037/10, as amended, listing (1) the countries and jurisdictions considered Low or Nil Tax Jurisdictions, and (2) the Privileged Tax Regimes.
The interpretation of the current Brazilian tax legislation should lead to the conclusion that the concept of Privileged Tax Regimes should only apply for certain Brazilian tax purposes, such as transfer pricing and thin capitalization rules. According to this interpretation, the concept of Privileged Tax Regimes should not be applied in connection with the taxation of dividends, interest on equity and gains related to investments made by Non-Brazilian Holders in Brazilian corporations. Regulations and non-binding tax rulings issued by Brazilian federal tax authorities seem to confirm this interpretation.
Currently, the understanding of the Brazilian tax authorities is that the rate of 15.0% withholding tax applies to payments made to beneficiaries residing in privileged tax regimes (Answer to Advance Tax Ruling Request COSIT No. 575, of December 20, 2017). In any case, if the Brazilian tax authorities determine that payments made to a Non-Resident Holder under a privileged tax regime are subject to the same rules applicable to payments made to Non-Resident Holders located in Low or Nil Tax Jurisdictions, the withholding tax applicable to such payments could be assessed at a rate up to 25.0%.
We recommend that you consult your own tax advisors from time to time to verify any possible tax consequences arising from Normative Ruling No. 1,037 and Law No. 11,727. If the Brazilian tax authorities determine that payments made to a Non-Resident Holder are considered to be made under a “privileged tax regime,” the withholding income tax applicable to such payments could be assessed at a rate of up to 25.0%.
Sale of ADSs
We do not expect the gains realized by a Non-Resident Holder on the disposition of ADSs to another non‑Brazilian resident to be subject to Brazilian tax, based on the argument that the ADSs would not constitute assets located in Brazil for purposes of Law No. 10,833/03. However, we cannot assure you how Brazilian courts would interpret the definition of assets located in Brazil in connection with the taxation of gains realized by a Non-Resident Holder on the disposition of ADSs to another non-Brazilian resident. As a result, gains on a disposition of ADSs by a Non-Resident Holder to a Brazilian resident, or even to a Non-Resident Holder in the event that courts determine that the ADSs would constitute assets located in Brazil, may be subject to income tax in Brazil according to the rules described above. If this income tax does apply, it could have an adverse impact on Non-Resident Holders.
Gains on the Exchange of ADSs for Shares
Non-Resident Holders may exchange ADSs for the underlying shares, sell the shares on a Brazilian stock exchange and remit abroad the proceeds of the sale. As a general rule, the exchange of ADSs for shares is not subject to income taxation in Brazil.
Upon receipt of the underlying shares in exchange for ADSs, Non-Resident Holders may also elect to register with the Brazilian Central Bank the U.S. dollar value of such shares as a foreign portfolio investment under CMN Resolution No. 4,373/14, which will entitle them to the tax treatment referred above on the future sale of the shares.
Alternatively, the Non-Resident Holder is also entitled to register with the Brazilian Central Bank the U.S. dollar value of such shares as a foreign direct investment under Law No. 4,131/62, in which case the respective sale would be subject to the tax treatment applicable to transactions carried out of by a Non-Resident Holder that is not a 4,373 Holder.
Gains on the Exchange of Shares for ADSs
The deposit of shares of a Brazilian entity in exchange for the ADSs by a Non-Resident Holder may be subject to Brazilian withholding income tax on capital gains if the acquisition cost is lower than the share price verified on the exchange date. The capital gains ascertained by the Non-Resident Holder, in this case, should be subject to taxation at rates that vary from 15% to 22.5%, depending on the amount of the gain, as referred to above; or at 25% if realized by a Non-Resident Holder that is resident or domiciled in a Low or Nil Tax Jurisdiction. In certain circumstances, there may be arguments to sustain the position that such taxation is not applicable to 4,373 Holders that are not resident or domiciled in a Low or Nil Tax Jurisdiction, which would be subject to taxation at a fixed 15% rate.
Tax on Foreign Exchange Transactions
Brazilian law imposes a tax on foreign exchange transactions, or “IOF/Exchange,” due on the conversion of Brazilian currency into foreign currency (e.g., for purposes of paying dividends and interest) and the conversion of foreign currency into Brazilian currency. Currently, for most exchange transactions, the rate of IOF/Exchange is 0.38%
Effective as of December 1, 2011, however, the IOF/Exchange is levied at a rate of 0% over foreign exchange transactions entered into in connection with the inflow of proceeds to Brazil for investments made by a foreign investor (including a Non-Resident Holder) in (1) variable income transactions carried out on the Brazilian stock, futures and commodities exchanges, and (2) the acquisitions of shares of Brazilian publicly held companies in public offerings or subscription of shares related to capital contributions, provided that the company has registered its shares for trading with the stock exchange. As of June 5, 2013, this beneficial tax treatment was extended to all investments made under the rules of CMN Resolution 4,373/14 in the Brazilian financial and capital markets, including the investment in common shares. The IOF/Exchange at a rate of 0% also applies for the outflow of funds from Brazil related to these types of investments, including payments of dividends and interest on equity and the repatriation of funds invested in the Brazilian market.
Furthermore, the IOF/Exchange is currently levied at a 0% rate on the withdrawal of ADSs into shares of a Brazilian entity. Nonetheless, the Brazilian government may increase the rate at any time up to 25%. However, any increase in rates may only apply to future foreign exchange transactions.
Tax on Mergers Involving Bonds and Securities
Brazilian law imposes a tax on transactions involving bonds and securities, or “IOF/Bonds,” including those carried out on a Brazilian stock exchange. The rate of IOF/Bonds applicable to transactions involving common shares is currently 0%, although the Brazilian government may increase such rate at any time up to 1.5% of the transaction amount per day, but only in respect of future transactions.
On December 24, 2013, the Brazilian government reduced the IOF/Bonds to zero for transactions involving the deposit of shares which are issued by a Brazilian company admitted to trade on the B3 with the specific purpose of enabling the issuance of depositary receipts traded outside Brazil.
Other Brazilian Taxes
There are no Brazilian inheritance, gift or succession taxes applicable to the ownership, transfer or disposition of common shares by a Non-Resident Holder, except for gift and inheritance taxes imposed by some Brazilian states on gifts or bequests by individuals or entities not domiciled or residing in Brazil to individuals or entities domiciled or residing within such states. There are no Brazilian stamp, issue, registration, or similar taxes or duties payable by holders of common shares.
Item 2
 |
Cosan S.A.
2023 Management Report
Cosan S.A. (“Cosan” or “Company”) submits for consideration of its shareholders the Management Report concerning the activities performed in fiscal year 2023. The result is presented in accordance with the accounting practices adopted in Brazil and the International Financial Reporting Standards (IFRS). Except where otherwise stated, all comparisons in this report are of 2023 with 2022.
The Company informs that the Financial Statements are being restated due to the matters mentioned in note 3.3 of the Financial Statements and we emphasize that the restated information does not alter the accounting numbers published on April 26, 2024.
The Company also provides a detailed version of its Financial Statements and earnings release on its website: www.cosan.com.br/en.
1. Message from the CEO
We ended 2023 with a significant growth of EBITDA under management and net income, supported by the performance of the businesses, reinforcing the quality of our assets and resilience of our portfolio. Investments were in line with the plans for the year, allocated to the structural projects of the portfolio, as well as the efficient maintenance of our operations.
Rumo’s result was boosted by the increase in transportation capacity and higher consolidated average tariff, reaching record volumes and demonstrating the growing competitiveness of the rail modal. The Lucas do Rio Verde project – extension of the railway network in Mato Grosso, one of the main regions of Brazil in grain production – will enable a major expansion in Rumo’s addressable market.
At Compass, the record number of new connections, consolidation of Commit’s natural gas distribution companies, as well as the start of operations under the Edge brand, with the sale of the first LNG shipments, offset the decline in the volume of natural gas distributed, affected by the lower industrial production and higher temperatures. Furthermore, in 2023 the company created a JV among Compass and Orizon to invest in a biomethane purification plant in Paulínia (São Paulo) and executed a long-term biomethane supply agreement between Compass and São Martinho.
Moove had its best year ever, driven by the higher sales and healthy margins, reflecting Moove’s leading position in the market of synthetic lubricants and ongoing improvement of its business model. Its strong international footprint is also a highlight, with significant results achieved in 2023 with the successful integration of Petrochoice.
At Radar, the value of agricultural properties portfolio we invested reflects the high-quality portfolio and the strong commodity cycle.
Raízen achieved an important recovery of the agricultural productivity of its sugarcane fields, setting a record for crushing in the crop year. The better sugar prices and strong fuel distribution margins drove the company’s EBITDA, offsetting the effects of the challenging scenario for ethanol. In addition, I highlight the progress in our renewable’s agenda, with the launch of the 2nd Second-Generation Ethanol (2GE) plant in Bonfim, with twice the production capacity of the 1st plant.
We kicked off an intense debt management process at Cosan, with successful funding transactions in the domestic and international markets. This process has lengthened our debt amortization schedule to better support the current cycle of major investments of our portfolio, ensuring competitive costs. In 2023 and early 2024, we consolidated our exposure to Vale, increasing our direct stake because of the unwind of the collar financing structure. This movement aims to capture Vale’s dividends in full while adequate our capital structure. We ended the year with leverage within adequate levels and, as of this quarter, we will report the interest coverage ratio, a metric that complements the perspective for liquidity of Cosan Corporate.
Finally on capital allocation, we remain attentive to opportunities to repurchase shares of Cosan itself, executing Total Return Swaps worth approximately R$300 million during the year. Finally, we distributed R$800 million to our shareholders as dividends.
Nelson Gomes
CEO of Cosan
|
2. Annual Results
Cosan Consolidated
The following table shows the consolidated accounting result of 2023 for Cosan and its business units. Except for Raízen (company co-controlled by Cosan), all other information reflects the consolidation of 100% of subsidiaries’ results, irrespective of Cosan’s interest. For more information, see Note 9 “Investments in Subsidiaries and Associated Companies” to the individual and consolidated Financial Statements of December 31, 2023 (“Financial Statements”).
Note that Cosan (corporate segment) represents the reconciliation of the corporate structure of Cosan, offshore financial companies and other expenses, as detailed in Note 1 to the Financial Statements. The following table reflects the complete information provided in the Financial Statements of the Company.
Income Statement for the Period | 2023 | 2022 | Change |
BRL mln | (Jan-Dec) | (Jan-Dec) | 2023 x 2022 |
Net revenue | 39,469 | 39,323 | 0% |
Cost of goods and services sold | (28,550) | (30,557) | (7%) |
Gross profit | 10,919 | 8,766 | 25% |
Selling, general & administrative expenses | (3,879) | (3,034) | 28% |
Other net operating income (expenses) | 3,924 | 1,752 | n/a |
Financial results | (7,897) | (5,158) | 53% |
Equity pick-up | 2,046 | 327 | n/a |
Expenses with income and social contribution taxes | (274) | 118 | n/a |
Discontinued operation | 45 | 50 | (9%) |
Non-controlling interest | (3,790) | (1,645) | n/a |
Profit (loss) attributable to owners of the Company | 1,094 | 1,176 | (7%) |
Information by segment:
Results by Business Unit | Raízen | Compass | Moove | Rumo | Radar | Cosan Corporate | Deconsolidation of Joint Ventures | Elimination between | Consolidated |
BRL mln | |||||||||
Net revenue | 221,693 | 17,767 | 10,079 | 10,938 | 743 | 3 | (221,693) | (61) | 39,469 |
Cost of goods and services sold | (202,927) | (14,256) | (7,360) | (6,838) | (153) | (4) | 202,927 | 61 | (28,550) |
Gross profit | 18,767 | 3,511 | 2,719 | 4,099 | 590 | (1) | (18,767) | - | 10,919 |
Selling, general & administrative expenses | (8,589) | (952) | (1,791) | (601) | (74) | (461) | 8,589 | - | (3,879) |
Other net operating income (expenses) | 1,968 | 607 | - | (101) | 2,254 | 1,164 | (1,968) | - | 3,924 |
Financial results | (5,963) | (731) | (319) | (2,555) | 31 | (4,322) | 5,963 | - | (7,897) |
Equity pick-up | (220) | 179 | - | 77 | 20 | 4,342 | 220 | (2,571) | 2,046 |
Expenses with income and social contribution taxes | (1,937) | (859) | (332) | (197) | (148) | 1,262 | 1,937 | - | (274) |
Discontinued operation | - | 45 | - | - | - | 16 | - | (16) | 45 |
Non-controlling interest | (163) | (390) | (83) | (503) | (1,904) | (910) | 163 | - | (3,790) |
Profit (loss) attributable to owners of the Company | 3,864 | 1,411 | 194 | 219 | 768 | 1,090 | (3,864) | (2,587) | 1,094 |
(1) Although Raízen S.A. is a joint venture whose results are registered under the equity pickup method and not consolidated proportionally, the Management continues to analyze information by segment. The reconciliation of these segments is presented in the “Deconsolidation of shared-control company” column.
|
Below are the material changes to the statements of income:
Net Revenue
Cosan’s consolidated net revenue was R$39.5 billion in 2023, practically stable in relation to 2022. Below are the main variations in revenues by segment:
At Rumo, net revenue was R$10.9 billion in 2023 (+11%). Revenue increased for all operations of the company: North Operation, South Operation and Container Operation.
Compass’ net revenue was R$17.8 billion in 2023 (-10%), partly due to the lower distributed volume, reflecting the slowdown in industrial activity in the year, affected by the lower volumes consumed by the ceramics, glass and steel industries, as well as reduction in residential consumption due to high temperatures registered in 2023 vs. 2022.
At Moove, net revenue was R$10.1 billion in 2023 (+12%), thanks to the strong sales of lubricants and better mix of products sold. Note that 2023 was the first full year of operation of Tirreno and Petrochoice, after their acquisition.
At Radar, net revenue was R$743 million in 2023, compared to R$835 million in 2022.
Operating Cost
The cost of goods and services sold by Cosan’s subsidiaries totaled R$28.6 billion in the fiscal year ended December 31, 2023, (-7%). Such reduction is explained as follows:
At Compass, the cost of gas, transportation and others decreased from R$16.4 billion in 2022 to R$14.3 billion in 2023, driven by the cost of the molecule, composed by exchange rate and Brent oil price. The reduction is also explained by the lower sales volume. The construction cost of the gas distribution network increased from R$1.2 billion in 2022 to R$1.5 billion in 2023. Finally, costs decreased due to the discontinuation of all energy agreements, with effect of R$0.3 billion.
Gross Profit
With these results, Cosan delivered gross profit of R$11.0 billion in 2023 (+25%), mainly due to the segments of Rumo, reflecting an increase in operating revenue from transportation, and Moove, due to the higher sales volume and healthy margins.
Selling, General & Administrative Expenses and Other Revenues
Selling, general and administrative expenses and other revenues totaled R$45.9 million in 2023, an increase over 2022, due to: (i) dividends received from Vale S.A., in the amount of R$1.3 billion; (ii) realization of deferred revenue, with an effect of R$923 million on operational result; (iii) change in the fair value of properties for investment, creating an impact of R$2.3 billion.
Financial Result
In 2023, Cosan’s net financial result was an expense of R$7.9 billion, as against expense of R$5.2 billion in 2022. The increase reflects: (i) interest amounts, inflation adjustment and exchange variation of debts linked to the acquisition of Vale’s assets, in the amount of R$599 million; (ii) cost of bank transactions with derivatives, in the negative amount of R$555 million; (iii) result from derivatives and fair value of securities linked to the investment in Vale’s stock, in the amount of R$881 million; (iv) update of financial investment in listed entities, without any PIS and COFINS effects, which at December 31, 2023 totaled loss of R$3.3 billion.
|
Equity Pick-up
At December 31, 2023, equity pick-up came to R$2.0 billion, compared to R$327 million in 2022. This variation is mainly due to: (i) On November 30, 2023, the Company obtained sufficient evidence of its capacity to exert significant influence on Vale. On December 01, 2023, the Company began to account for the investment in Vale under the equity pick-up method (see more details on Note 1.1 “Equity Interest in Vale S.A.” of the Financial Statements of December 31, 2023); and (ii) Raízen calculated and recognized, on December 31, 2023, PIS and COFINS credits amounting to R$3.7 billion in connection with Supplementary Law 192/22 and R$1.5 billion in connection with Supplementary Law 194/22, totaling R$5.2 billion, with an impact of R$1.6 billion of equity pick-up in the period, net of income and social contribution taxes.
Income and Social Contribution Taxes
Income and social contribution taxes in the fiscal year ended December 31, 2023 amounted to an expense of R$274 million vs. a revenue of R$118 million in the previous year. In December 2023, the effective tax rate was 5.37%. The main effects were due to: (i) dividends received from Vale (R$254 million); (ii) benefit from adhesion to the government’s Zero Litigation program (R$23 million); (iii) rate difference (R$805 million); (iv) provision for non-realization of the benefit related to Brazil’s federative pact (-R$307 million); and (v) increase of R$551 million compared to the same period of the previous year in equity pickup constituting the balance of R$673 million.
Net Income
Cosan ended 2023 with net income of R$1.1 billion, practically stable in relation to 2022, which represented a strong comparison base due to the significant appreciation of Vale’s shares in 4Q22.
3. Proposal for Retention of Earnings
In the fiscal year ended December 31, 2023, the Management proposed that net income be allocated as follows: R$274 million to the minimum mandatory dividends, complementary dividends in the amount of R$566 million and the remainder of R$254 million allocated to the profit reserve. Such allocation will be submitted for approval or alteration at the Shareholders Meeting of the Company.
4. Human Capital
In 2023, we took a significant step in enhancing our Entrepreneurial Culture. We evolved our agenda of Diversity, Equity & Inclusion, ensuring a safe workplace where all voices are heard and respected, intensifying our focus on caring for our people.
We made progress in increasing female participation in senior leadership positions. Our Board of Directors currently consists of two women and seven men, and of them identifies as LGBTQIAPN+. Therefore, in 2023, we received the Women on Board (WOB) seal, an initiative that recognizes and values women's participation in the organizational sphere. We also saw an increase in female representation in our employee base, with 58% of women, 36% of whom hold senior management positions.
As part of our purpose, we seek to empower people and businesses to their fullest potential and, in this sense, our teams find various development opportunities and career alternatives within our ecosystem, enabling growth alongside our portfolio.
The safety and well-being of all individuals are priorities for Cosan. We pursue the goal of zero accidents daily in Cosan and in our investees, investing in training, technology and promoting best practices to ensure a safe workplace. Together, we offer our employees comprehensive health benefits, reflecting our commitment to caring for and supporting the physical and mental health of our team.
|
5. Capital Market & Corporate Governance
Cosan is a publicly traded company and its shares have been traded on the B3 - Brasil, Bolsa, Balcão, under the ticker CSAN3, since 2005, in the Novo Mercado listing segment, which features companies that undertake to adhere to the best corporate governance practices.
Since March 2021, the Company has level II American Depositary Shares (ADS) listed on the New York Stock Exchange (NYSE), under the ticker CSAN, which represents compliance with an additional regulatory layer, evidencing the strength of the policies and practices adopted by Cosan and its businesses.
Cosan’s capital stock is divided into 1,874,070,932 registered, book-entry common shares without par value and with voting rights, in compliance with B3’s Novo Mercado segment. Rubens Ometto Silveira Mello is Cosan’s controlling shareholder.
In recent years, the Company has strengthened its corporate governance and now has a robust framework, through which strategies and action plans are extensively discussed by competent professionals and adequately disseminated to all levels of the team.
To support the Company's management, Committees that mostly report directly to the Board of Directors have been established. In addition, Cosan has a robust risk management structure to identify events that may negatively impact the sustainability of its business.
Governance Structure
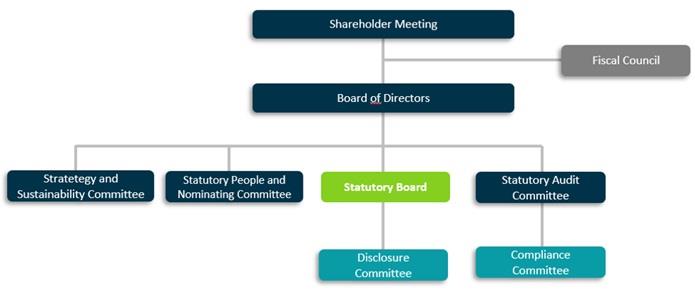
6. Commitment to Sustainability
Our role in sustainability includes managing material ESG aspects for the Company and across the portfolio (Governance, Climate Change, Diversity, Social Impact, and Safety), as well as engaging investees in these areas. We incorporate climate risks into our risk matrix and decision-making analyses. As such, we advanced in our agenda of continuous monitoring and performance metrics together with our investees, in order to act with greater transparency in reporting information to our stakeholders and interested parties, which is reflected in the performance of the indices and ratings of which Cosan and its investees are components.
We also dedicated our efforts to disseminate the strategy, advance in the implementation of governance and management of the “ESG Vision 2030,” contributing to the value creation process and achievement of commitments across our portfolio. For the next cycles, we will maintain our commitment to leverage the sustainable development of society, central pillar of our business strategy.
For more information, refer to Note 3.3 “Accounting impacts related to environmental, social and governance (ESG) initiatives” to the Financial Statements for fiscal year ended December 31, 2023.
To learn more about Cosan’s sustainability practices, visit www.cosan.com.br/en/sustainability/.
|
7. Relationship with Independent Auditor
The Company has a Policy on Engaging Independent Auditor and Non-Audit Services (“Policy”) to establish the rules related to engaging independent auditors and audit firms, including the guidelines and procedures to ensure the independence of independent auditors and third-party consultants providing audit and non-audit services to the Company, its subsidiaries, joint venture and associated companies. The policy is available at https://www.cosan.com.br/en/about-cosan/bylaw-policies-and-code-of-ethics/.
Per the Notice to the Market disclosed on December 22, 2023, Cosan’s independent auditor was changed. The audit firm Ernst & Young Auditores Independentes S.S (“EY”) was responsible for reviewing the Companys’s Interim Financial Statements for the periods ended March 31, 2023, June 30, 2023, and September 30, 2023, while BDO RCS Auditores Independentes (“BDO”) was in charge of auditing the Company’s Financial Statements ended on December 31, 2023.
We inform that EY was engaged to provided non-audit services, with the sum of EY’s fees representing 16% of its total fees for reviewing the Company’s Interim Financial Statements for the periods ended March 31, 2023, June 30, 2023, and September 30, 2023, which did not affect the principle of independence established in the Policy. Such services refer mainly to:
| (i) | revision of tax compliance of Company subsidiaries; and |
| (ii) | works related to audit, such as revision of prospects, due diligence activities and other procedures previously agreed and approved by the Company’s Audit Committee. |
Based on the aforementioned independence principle, EY has stated that all work conducted and concluded until November 30, 2023 (the date of the change of independent auditor) was not compromised in terms of independence and objectivity required for the services provided to the Company. Also, based on the aforementioned independence principle, BDO has stated that all work conducted from December 1, 2023, onwards and concluded until the present moment was not compromised in terms of independence and objectivity required for the services provided to the Company.
During the fiscal year ended December 31, 2023, the independent auditors provided no other non-audit services other than those mentioned above.
8. Acknowledgements
Cosan’s Management thanks its shareholders, clients, suppliers and financial institutions for their collaboration and trust, and especially its employees for their dedication and commitment. For a detailed analysis of Cosan’s 2023 results, please access our website: www.cosan.com.br/en/.www.cosan.com.br/en/.
CONTENT
 |
To the
Shareholders, Board Members and Management of
Cosan S.A.
São Paulo - SP
Opinion
We have audited the individual and consolidated financial statements of Cosan S.A. (“Company”), identified as parent company and consolidated, respectively, which comprise the statement of financial position as at December 31, 2023, and the respective statements of income, comprehensive income, changes in equity and cash flows for the year then ended, as well as the corresponding notes to the financial statements, including material accounting policies and other explanatory information.
In our opinion, the accompanying financial statements present fairly, in all material respects, the individual and consolidated financial position of the Company as at December 31, 2023, its individual and consolidated financial performance and its individual and consolidated cash flows for the year then ended in accordance with Brazilian accounting practices and International Financial Reporting Standards (IFRS) issued by the International Accounting Standards Board (IASB).
Basis for opinion on the individual and consolidated financial statements
We conducted our audit in accordance with Brazilian and International Standards on Auditing (ISAs). Our responsibilities under those standards are further described in the “Auditor’s Responsibilities for the Audit of the Individual and Consolidated Financial Statements” section of our report. We are independent of the Company and its controlled companies in accordance with the relevant ethical principles established in the Code of Ethics for Professional Accountants and in the professional standards issued by the Brazilian Federal Council of Accounting (CFC), and we have fulfilled our other ethical responsibilities in accordance with these standards. We believe that the audit evidence we have obtained is sufficient and appropriate to provide a basis for our qualified audit opinion.
Emphasis
Restatement of the individual and consolidated financial statements
As described in Note 3.1, the individual and consolidated financial statements for the year ended December 31, 2023, are being restated due to the conclusion of the audit of the legal entities of subsidiary Moove Lubricants Holdings (“Moove”), located in the United States and the United Kingdom, and includes updates and improvements in the disclosure of certain notes. This report replaces the one previously issued on April 26, 2024. Our opinion is not modified in respect of this matter.
Key audit matters
Key audit matters are those matters that, in our professional judgment, were of most significance in our audit of the financial statements for the current year. These matters were addressed in the context of our audit of the individual and consolidated financial statements as a whole and in forming our opinion thereon and, accordingly, we do not provide a separate opinion on them. We determined that the matters described below are the key audit matters to be communicated in our report:
Assessment on the recoverability of deferred Income and Social Contribution tax assets (“deferred taxes assets”)
As disclosed in Note 15 to the individual and consolidated financial statements, as at December 31, 2023, the Company and its subsidiaries have recorded the amount of R$ 5,609,030 thousand under “Deferred taxes” arising from Income and Social Contribution tax losses, as well as nondeductible and/or taxable temporary differences, whose balance substantially originates from the Parent company, in the amount of R$ 2,478,911 thousand, and from the subsidiary Rumo S.A. in the amounts of R$ 1,869,877 thousand.
Management assesses at least annually the risk of impairment losses for this asset, which requires significant judgement to assess the probability of realization of future taxable income, considering, among other aspects, long-term forecasts and existence of events that might be out of the Company’s control, i.e., favorable conditions for the realization of capital market transactions, receipts of dividends and interest on equity capital, the future of certain subsidiaries and associated companies, climate events that might influence agricultural production, and global geopolitical crisis that may cause impact on agricultural products exports, both of which directly affecting volume forecasts and, consequently, net revenue of controlled companies, which are components of the deferred taxes recoverability framework.
Due to the forementioned aspects, the materiality of the amounts involved and considering that any changes to the economic assumptions used by the Company, including the Company’s and its subsidiaries’ business conditions, might result in significant effects on the forecasts for future taxable income and, as consequence, in material impacts on the consolidated financial statements, we consider this to be a key audit matter.
Audit response
Our audit procedures included, among others:
| § | Understanding of relevant internal control environment related to deferred tax assets and liabilities, including internal controls over the analysis of the realization of such taxes; |
| § | Application of group audit procedures, evaluating the risks involved and procedures performed by the auditors of significant components on the accounting and financial information of these components that relate to the Company’s consolidated financial statements, including the preparation and submission of audit instructions to the component engagement team members and oversight and monitoring by the Company’s audit team; |
| § | Review of the reasonability of the model adopted by Management to elaborate future taxable income forecasts, including understanding relevant risks and evaluating the main assumptions and criteria applied, as well as evaluating the representations of which of such assumptions are comprised in the long-term strategic planning approved by Management. |
| § | Review of arithmetic calculations on the recognition and measurement of deferred tax assets and liabilities; |
| § | Review of the disclosures made by the Company in its financial statements. |
Based on the results of the audit procedures described above, we believe that the criteria and assumptions adopted by Management to determine the realization value of deferred taxes are reasonable, considering the applicable accounting practices and reasonableness of the supporting documentation on projections, maintained by Management, to corroborate its conclusion.
|
Measurement of fair value of investment properties
According with Note 11.5 to the individual and consolidated financial statements, as at December 31, 2023, the Company and its subsidiaries have recorded under “Investment properties” the amount of R$ 15,976,126 thousand, which originated revenue from change to fair value in income, as at December 31, 2023, of R$ 2,259,924 thousand, as disclosed in Note 21 to the individual and consolidated financial statements.
The methodologies and frameworks applied to determine fair value included Management hiring external evaluators to, by means of their database, compare properties under scrutiny with similar assets to determine the realization fair value of these Company’s investment properties.
Considering the forementioned aspects, the significance of the amounts involved relative to the whole of assets, to equity and to the effects of changes in fair value of properties in income, and also to uncertainties inherent to estimates of fair value, we consider this to be a key audit matter.
Audit response
Our audit procedures included, among others:
| § | Understanding of the relevant internal control environment referring to investment properties, which includes internal controls that relate to the hiring of external specialists, the determination of assumptions for the calculation of fair value and the review of the result presented in the properties valuation reports. |
| § | Application of group audit procedures, evaluating the risks involved and procedures performed by the auditors of significant components on the accounting and financial information of these components that relate to the Company’s consolidated financial statements, including the preparation and submission of audit instructions to the component engagement team members and oversight and monitoring by the Company’s audit team; |
| § | Application of document testing to a sample of base assets to measure fair value; |
| § | Involvement of our specialists to: (i) evaluating the reasonability of the framework adopted to determine the fair value of investment properties, including the understanding of significand assumptions and criteria applied; (ii) evaluating the geographical size registered to the properties’ title, as well as the mandatory legally-enforced environmental protection areas of each property; |
| § | Review of the arithmetic calculations on the recognition and measurement of deferred tax assets; |
| § | Review of the disclosures made by the Company in its financial statements. |
Based on the results of the audit procedures described above, we believe that the criteria and assumptions adopted by Management to determine the fair value of the investment properties are reasonable, considering the applicable accounting practices and reasonableness of the projections supporting documentation, maintained by Management, to corroborate its conclusion.
|
Public concession contracts for distribution of piped gas
As disclosed in Note 11.2(a) and 11.3 to the individual and consolidated financial statements, the Company has recorded in public concession intangible asset and contract assets from gas distribution services the respective amounts of R$ 12,307,964 thousand and R$ 1,041,421 thousand, which represent, substantially, expenses on infrastructure for this concession at the subsidiary Compass Gás e Energia S.A.
The investments in expansion and improvement of the concession infrastructure for the distribution of piped gas are accounted for as contract assets while under construction. From the effective beginning of operations, investments are divided between “Intangible assets”, due to their returns relying on the usage of a public service, by means of the consumption of piped gas by consumers, and “Financial assets”, for investments made and not amortized until the completion of the concession contract, since there is an unconditional right to receive cash or other financial asset directly from the Granting Authority.
The definition of which expenses are eligible and should be capitalized during the construction process as infrastructure costs involves significand complexity and judgement from the Company’s Management.
For the forementioned aspects and given the significance of the amounts involved, we consider this to be a key audit matter.
Audit response
Our audit procedures included, among others:
| § | Application of group audit procedures, evaluating the risks involved and procedures performed by the auditors of components on the accounting information of this component that relate to the Company’s consolidated financial statements, including the preparation and submission of audit instructions to the component engagement team members and oversight and monitoring by the Company’s audit team; |
| § | Understanding of the relevant design and processes implemented by the Company on measurement and recognition of amounts accounted for as contract assets and intangible assets, including their classification as an asset qualifiable for capitalization; |
| § | Assessment of the type of those investments on the implemented infrastructure; |
| § | Application of document testing, by sampling, on: (i) materials and services applied in construction work, as well as the allocation of workforce working hours and evaluation of whether their classification was appropriate; and (ii) additions, amortization and capitalization of interest; |
| § | Evaluation of accounting classifications between contract assets and right-related intangible assets of this concession, considering the periods and stages of construction work; |
| § | Review of the accounting policies established by the Company for such accounts and their applicability as per the accounting standards in effect; |
| § | Amortization testing of the right-related intangible assets of the concession, recognized throughout 2023; |
| § | Review of the disclosures made by the Company in its financial statements. |
Based on the outcome of the audit procedures hereby described, we considered the criteria and policies applied to the capitalization and amortization of public concession infrastructure assets related to gas distribution services prepared by Management to be reasonable, as well as the respective disclosures in the Notes to the individual and consolidated financial statements, as a whole.
|
Capitalization of expenses incurred in the construction of infrastructure assets of railway concession
As disclosed in Note 11.1(a) to the individual and consolidated financial statements, as at December 31, 2023, the Company has recorded under property, plant and equipment assets related to railway concession infrastructure from the subsidiary Rumo S.A., which is comprised by locomotives and cars, in the amount of R$ 4,831,568 thousand, and permanent way, in the amount of R$ 8,341,835 thousand, totaling R$ 13,173,403. The expenses capitalized on those assets directly related to the railway concession infrastructure are relevant and fundamental for the maintenance of the infrastructure used to render railway transportation services.
The classification of expenses incurred between capital goods (Capital expenditure – Capex) and operating expenses (Operational Expenditure – Opex) involves the setting up of IT systems, communication and assessment between areas of different specialty fields within the subsidiary Rumo S.A., to align the definition of the type of expense for those incurred with the purpose of replacing or renewing parts and pieces necessary for the asset to achieve the intended operating condition, criteria to allocate the workforce directly attributable to the construction of this asset, and also the adoption of processes and controls appropriately designed and continually operated by Management to mitigate the possibility of misallocation of those such expenses between construction in progress, under property, plant and equipment, and operating expenses recognized in income.
Due to the mentioned aspects, the significance of the amounts involved and the risk of undue capitalization regarding assets directly related to the railway concession infrastructure, we consider this to be a key audit matter.
Audit response
Our audit procedures included, among others:
| § | Application of group audit procedures, evaluating the risks involved and procedures performed by the auditors of components on the accounting information of this component that relate to the Company’s consolidated financial statements, including the preparation and submission of audit instructions to the component engagement team members and oversight and monitoring by the Company’s audit team; |
| § | General understanding of the control environment to allocate expenses to either Capex or Opex; |
| § | Meeting with Management to understand and validate concepts based on Technical Pronouncement CPC 27 – Fixed assets; |
| § | Meeting with Projects area representatives to understand, among others, budgeting, allocation of expenses and the actual development of certain projects; |
| § | Research on news related to determinate projects recorded as construction in progress; |
| § | Understanding of determinate IT systems used in processes associated to expenses on construction in progress |
| § | Application of document testing, by sampling, on additions to property, plant and equipment recorded under “construction in progress”; |
| § | Obtaining of evidences, by sampling, on the actual development of certain construction in progress; |
| § | Review of the disclosures made by the Company in its financial statements. |
Based on the procedures applied, we considered the assumptions used for the allocation of expenses incurred in the construction of assets recorded under Construction in progress to be appropriate, based on sample testing, as well as the disclosures in the financial statements, taken as a whole.
|
Provision for legal claims
As disclosed in Note 16, the Company and its subsidiaries are party to legal and administrative proceedings at tax, civil, environmental, regulatory and labor levels, which arise from the normal course of its business. As at December 31, 2023, the Company and its subsidiaries have tax and civil, environmental and regulatory matters being discussed at several procedural levels, in the total amount of R$ 15,703,294 thousand and R$ 7,166,011 thousand, respectively, of which R$ 813,732 thousand and R$ 512,979 thousand, respectively, are provisioned, referring to proceedings with probable outflow of funds, according to the evaluation of Management based on the opinion of its legal counselors.
The definition of the amounts provisioned and disclosed depends on Management’s critical judgment in relation to the probability of loss highlighted in the ongoing legal discussions, as a result of the interpretations of the current legislation, judicial decisions and evolution of the jurisprudence. Additionally, considering the relevance of the amounts involved and the complexity of the legal and regulatory environment, any changes in the assumptions adopted for determining the loss prognosis may have a material impact on the Company's individual and consolidated financial statements.
Due to the significance of the amounts involved in contingencies classified as of possible loss, the increased number of court claims the Company is party to and the complexity of the judgements made by Management in the process of measuring those contingencies, we consider this to be a key audit matter.
Audit response
Our audit procedures included, among others:
| § | Meetings with key-personnel from the Company’s legal department; |
| § | Understanding and assessment of the internal control environment related to the cycle of identification, recognition, measurement and disclosure of contingent liabilities; |
| § | Application of group audit procedures, evaluating the risks involved and procedures performed by the auditors of significant components on the accounting information of these components that relate to the Company’s consolidated financial statements, including the preparation and submission of audit instructions to the component engagement team members and oversight and monitoring by the Company’s audit team; |
| § | Evaluation of the methodology, assumptions and criteria used by the Company, including adjustments, for the recognition, measurement and disclosure of contingencies in the financial statements; |
| § | Obtaining of external confirmation letters from the legal counselors in charge of the proceedings, aiming to confirm: (i) the existence of the proceedings and their current status; (ii) the respective assessment of loss involved and the applicable legal grounds; |
| § | Involvement of our tax specialists to evaluate the type, grounds and/or defense thesis, and occasional changes to loss probability classification for the certain relevant tax proceedings considered as possible loss, that include complex judgement and subjectivity in the evaluations; |
| § | Regarding the tax aspects of income taxes, our evaluation included: (i) meetings with Management to understand the existing internal controls to identify and monitor uncertain tax treatments; (ii) criteria adopted for the recognition and measurement of tax liabilities, if applicable; |
| § | Review of the disclosures made by the Company in its financial statements. |
|
Based on the procedures applied, we considered acceptable the assumptions used by Management to measure the provisions for contingencies and their disclosure in the context of the financial statements taken as a whole.
Other matters
Prior-year financial statements audited by other independent auditor
The individual and consolidated financial statements for the year ended December 31, 2022, originally prepared prior to the reclassifications disclosed in Notes 3.1 and 3.4 to the individual and consolidated financial statements, were examined by other independent auditor, whose report thereon, dated February 28, 2023, was unmodified. As part of our audit of the individual and consolidated financial statements of 2023, we have also examined the reclassifications described in Notes 3.1 and 3.4, which were made to change corresponding values relative to the individual and consolidated financial statements of 2022. In our opinion, such reclassifications are appropriate and were correctly made. We were not engaged to audit, review or apply any other procedures on the Company’s individual and consolidated financial statements for the year ended December 31, 2022, and, accordingly, we do not issue an opinion or provide any form of assurance on the individual and consolidated financial statements for 2022 taken as a whole.
Statements of value added
The individual and consolidated statements of value added, prepared under the responsibility of the Company’s Management for the year ended December 31, 2023, and presented as supplemental information for IFRS purposes, were submitted to audit procedures along with the audit of the Company’s financial statements. In order to form an opinion, we have checked whether these statements are reconciled with the financial statements and accounting records as applicable, and whether its form and contents meet the criteria established in Technical Pronouncement NBC TG 09 - Statement of Value Added. In our opinion, the statements of value added were properly prepared, in all material respects, in accordance with the criteria established in that Technical pronouncement, and are consistent with the individual and consolidated financial statements taken as a whole.
Other information accompanying the individual and consolidated financial statements and auditor’s report
The Company’s Management is responsible for the other information that comprises the Management Report.
Our opinion on the individual and consolidated financial statements does not cover the Management Report and we do not express any form of audit conclusion thereon.
|
In connection with our audit of the individual and consolidated financial statements, our responsibility is to read the Management Report and, in doing so, consider whether the report is materially inconsistent with the financial statements or our knowledge obtained in the audit, or otherwise appears to be materially misstated. If, based on the work we have performed, we conclude that there is a material misstatement of this Management Report, we are required to report that fact. We have nothing to report in this regard.
Responsibilities of Management and those charged with governance for the individual and consolidated financial statements
Management is responsible for the preparation and fair presentation of the individual and consolidated financial statements in accordance with Brazilian accounting practices and IFRS issued by IASB, and for such internal control as management determines is necessary to enable the preparation of financial statements that are free from material misstatement, whether due to fraud or error.
In preparing the individual and consolidated financial statements, Management is responsible for assessing the Company’s ability to continue as a going concern, disclosing, as applicable, matters related to going concern and using the going concern basis of accounting unless Management either intends to liquidate the Company and its subsidiaries or to cease operations, or has no realistic alternative but to do so.
Those charged with governance are responsible for overseeing the Company’s and its subsidiaries’ financial reporting process.
Auditor’s responsibilities for the audit of the individual and consolidated financial statements
Our objectives are to obtain reasonable assurance about whether the individual and consolidated financial statements as a whole are free from material misstatement, whether due to fraud or error, and to issue an auditor’s report that includes our opinion. Reasonable assurance is a high level of assurance but is not a guarantee that an audit conducted in accordance with Brazilian and International Standards on Auditing (ISA) will always detect a material misstatement when it exists. Misstatements can arise from fraud or error and are considered material if, individually or in the aggregate, they could reasonably be expected to influence the economic decisions of users taken on the basis of these financial statements.
As part of an audit in accordance with Brazilian standards and ISAs, we exercise professional judgment and maintain professional skepticism throughout the audit. We also:
|
| § | Identify and assess the risks of material misstatement of the individual and consolidated financial statements, whether due to fraud or error, design and perform audit procedures responsive to those risks, and obtain audit evidence that is sufficient and appropriate to provide a basis for our opinion. The risk of not detecting a material misstatement resulting from fraud is higher than for one resulting from error, as fraud may involve collusion, forgery, intentional omissions, misrepresentations, or the override of internal controls; |
| § | Obtain an understanding of internal controls relevant to the audit in order to design audit procedures that are appropriate in the circumstances, but not for the purpose of expressing an opinion on the effectiveness of the Company’s and its subsidiaries' internal controls; |
| § | Evaluate the appropriateness of accounting policies used and the reasonableness of accounting estimates and disclosures made by Management; |
| § | Conclude on the appropriateness of Management’s use of the going concern basis of accounting and, based on the audit evidence obtained, whether material uncertainty exists related to events or conditions that may cast significant doubt on the Company’s and its subsidiaries’ ability to continue as a going concern. If we conclude that material uncertainty exists, we are required to draw attention in our auditor’s report to the related disclosures in the individual and consolidated financial statements or, if such disclosures are inadequate, to modify our opinion. Our conclusions are based on the audit evidence obtained up to the date of our auditor’s report. However, future events or conditions may cause the Company and its subsidiaries to cease to continue as a going concern; |
| § | Evaluate the overall presentation, structure and content of the financial statements, including the disclosures, and whether the individual and consolidated financial statements represent the underlying transactions and events in a manner that achieves fair presentation; |
| § | Obtain sufficient and appropriate audit evidence regarding the financial information of the entities or business activities within the group to express an opinion on the consolidated financial statements. We are responsible for the direction, supervision and performance of the audit. We remain solely responsible for our audit opinion. |
|
We communicate with those charged with governance regarding, among other matters, the planned scope and timing of the audit and significant audit findings, including any significant deficiencies in internal controls that we identify during our audit.
We also provide those charged with governance with a statement that we have complied with relevant ethical requirements regarding independence, and that we have informed them of all relationships and other matters that may reasonably be thought to bear on our independence, and where applicable, related safeguards.
Of the matters communicated to those charged with governance, we determine those that were of most significance for the audit of the financial statements for the current year and which are therefore the key audit matters. We describe these matters in our auditor’s report unless law or regulation precludes public disclosure about the matter or when, in extremely rare circumstances, we determine that a matter should not be communicated in our report because the adverse consequences of doing so would reasonably be expected to outweigh the public interest benefits of such communication.
The accompanying financial statements have been translated into English for the convenience of readers outside Brazil.
São Paulo, May 28, 2024
 |
BDO RCS Auditores Independentes SS Ltda. CRC 2 SP 013846/O-1 |
|
|
Luiz Gustavo Pereira dos Santos |
Accountant CRC 1 SP 258849/O-9 |
(In thousands of Reais)
|
|
| Parent Company |
| Consolidated | ||||
| Note |
| 12/31/2023 |
| 12/31/2022 |
| 12/31/2023 |
| 12/31/2022 |
Assets |
|
|
|
|
|
|
|
|
|
Cash and cash equivalents | 5.2 |
| 1,769,976 |
| 1,348,461 |
| 14,658,481 |
| 13,301,716 |
Restricted cash | 5.3 |
| — |
| — |
| 7,860 |
| 8,024 |
Marketable securities | 5.3 |
| 705,777 |
| 724,050 |
| 3,407,955 |
| 2,422,470 |
Trade receivables | 5.7 |
| — |
| — |
| 3,330,488 |
| 3,769,908 |
Derivative financial instruments | 5.6 |
| 54,935 |
| — |
| 202,399 |
| 1,086,698 |
Inventories | 7 |
| — |
| — |
| 1,792,714 |
| 1,869,059 |
Receivables from related parties | 5.8 |
| 173,351 |
| 381,547 |
| 251,471 |
| 235,541 |
Income tax receivable |
|
| 508,268 |
| 272,130 |
| 888,942 |
| 560,789 |
Other current tax receivable | 6 |
| 8,346 |
| 8,366 |
| 745,856 |
| 1,324,203 |
Dividend receivable | 17 |
| 319,135 |
| 609,456 |
| 255,777 |
| 161,147 |
Sectorial financial assets | 5.10 |
| — |
| — |
| 207,005 |
| 148,955 |
Other financial assets |
|
| — |
| — |
| 690 |
| 88,961 |
Other current assets |
|
| 177,001 |
| 119,266 |
| 722,386 |
| 560,080 |
|
|
| 3,716,789 |
| 3,463,276 |
| 26,472,024 |
| 25,537,551 |
Current assets held for sale | 8 |
| 2,998 |
| — |
| 2,138,165 |
| 40,383 |
Current assets |
|
| 3,719,787 |
| 3,463,276 |
| 28,610,189 |
| 25,577,934 |
|
|
|
|
|
|
|
|
|
|
Trade receivables | 5.7 |
| — |
| — |
| 114,148 |
| 157,634 |
Marketable securities | 5.3 |
| — |
| — |
| 96,006 |
| 19,677,296 |
Restricted cash | 5.3 |
| 81,621 |
| 35,039 |
| 195,392 |
| 131,909 |
Deferred tax assets | 15 |
| 2,478,911 |
| 1,857,620 |
| 5,609,030 |
| 4,474,124 |
Receivables from related parties | 5.8 |
| 174,745 |
| 355,793 |
| 88,620 |
| 241,001 |
Income tax receivable |
|
| — |
| — |
| 432,360 |
| 434,886 |
Other non-current tax receivable | 6 |
| 33,639 |
| 31,774 |
| 1,132,703 |
| 1,074,923 |
Judicial deposits | 16 |
| 403,489 |
| 360,563 |
| 895,901 |
| 814,444 |
Derivative financial instruments | 5.6 |
| 102,881 |
| 1,368,809 |
| 2,344,400 |
| 3,065,054 |
Sectorial financial assets | 5.10 |
| — |
| — |
| 341,695 |
| 193,378 |
Other non-current assets |
|
| 71,250 |
| 62,432 |
| 216,694 |
| 201,811 |
Other financial assets |
|
| — |
| — |
| 2,423 |
| 277 |
Investments in associates | 9.1 |
| 35,741,778 |
| 31,230,371 |
| 17,611,369 |
| 2,913,943 |
Investment in joint ventures | 10 |
| 1,320,592 |
| 1,266,926 |
| 11,742,442 |
| 11,221,356 |
Property, plant and equipment | 11.1 |
| 39,817 |
| 46,044 |
| 21,239,974 |
| 18,948,436 |
Intangible assets and goodwill | 11.2 |
| 6,863 |
| 2,247 |
| 22,650,287 |
| 22,121,942 |
Contract asset | 11.3 |
| — |
| — |
| 1,052,105 |
| 1,118,715 |
Right-of-use assets | 11.4 |
| 22,200 |
| 23,032 |
| 9,513,518 |
| 8,012,869 |
Investment property | 11.5 |
| — |
| — |
| 15,976,126 |
| 14,103,060 |
Non-current assets |
|
| 40,477,786 |
| 36,640,650 |
| 111,255,193 |
| 108,907,058 |
|
|
|
|
|
|
|
|
|
|
Total assets |
|
| 44,197,573 |
| 40,103,926 |
| 139,865,382 |
| 134,484,992 |
The accompanying notes are an integral part of these financial statements.
Statement of financial position
(In thousands of Reais)
|
|
| Parent Company |
| Consolidated | ||||
| Note |
| 12/31/2023 |
| 12/31/2022 |
| 12/31/2023 |
| 12/31/2022 |
Liabilities |
|
|
|
|
|
|
|
|
|
Loans, borrowings and debentures | 5.4 |
| 800,987 |
| 802,549 |
| 4,882,398 |
| 4,542,205 |
Leases | 5.5 |
| 8,959 |
| 7,676 |
| 733,063 |
| 550,529 |
Derivative financial instruments | 5.6 |
| 364,747 |
| — |
| 1,250,520 |
| 1,039,357 |
Trade payables | 5.9 |
| 2,431 |
| 115,146 |
| 3,920,273 |
| 4,318,362 |
Employee benefits payables |
|
| 61,926 |
| 49,301 |
| 829,329 |
| 659,521 |
Income tax payables |
|
| 2,716 |
| 7,876 |
| 445,934 |
| 204,387 |
Other taxes payable | 14 |
| 226,556 |
| 141,216 |
| 673,718 |
| 760,041 |
Dividends payable | 17 |
| 276,065 |
| 279,979 |
| 549,054 |
| 892,006 |
Concessions payable | 13 |
| — |
| — |
| 250,971 |
| 256,759 |
Related party payables | 5.8 |
| 198,899 |
| 1,237,490 |
| 322,160 |
| 387,736 |
Sectorial financial liabilities | 5.10 |
| — |
| — |
| 70,013 |
| 67,419 |
Other financial liabilities | 5 |
| — |
| — |
| 476,895 |
| 924,562 |
Other current liabilities |
|
| 593,643 |
| 543,084 |
| 1,516,084 |
| 1,195,329 |
|
|
| 2,536,929 |
| 3,184,317 |
| 15,920,412 |
| 15,798,213 |
Liabilities related to assets held for sale | 8 |
| — |
| — |
| 238,393 |
| — |
Current liabilities |
|
| 2,536,929 |
| 3,184,317 |
| 16,158,805 |
| 15,798,213 |
Loans, borrowings, and debentures | 5.4 |
| 12,695,337 |
| 4,673,079 |
| 52,022,256 |
| 48,445,011 |
Leases | 5.5 |
| 20,584 |
| 22,689 |
| 4,542,731 |
| 2,981,629 |
Derivative financial instruments | 5.6 |
| 281,238 |
| 618,947 |
| 2,164,625 |
| 4,251,575 |
Trade payables | 5.9 |
| — |
| — |
| 264,252 |
| 61,489 |
Other taxes payable | 14 |
| 158,857 |
| 148,620 |
| 163,242 |
| 153,688 |
Provision for legal proceedings | 16 |
| 401,093 |
| 349,357 |
| 1,714,403 |
| 1,801,186 |
Concessions payable | 13 |
| — |
| — |
| 3,314,402 |
| 3,094,651 |
Investments with unsecured liabilities | 9.1 |
| 146,276 |
| 146,473 |
| — |
| — |
Related party payables | 5.8 |
| 6,449,968 |
| 9,221,407 |
| 1,078 |
| — |
Post-employment benefits | 23 |
| 313 |
| 312 |
| 617,647 |
| 575,840 |
Deferred tax liabilities | 15 |
| — |
| — |
| 5,225,433 |
| 5,469,368 |
Sectorial financial liabilities | 5.10 |
| — |
| — |
| 1,740,685 |
| 1,549,197 |
Deferred revenue |
|
| — |
| — |
| 19,129 |
| 624,801 |
Other financial liabilities | 5 |
| — |
| — |
| — |
| 29,985 |
Other non-current liabilities |
|
| 551,671 |
| 1,085,558 |
| 935,514 |
| 1,478,960 |
Non-current liabilities |
|
| 20,705,337 |
| 16,266,442 |
| 72,725,397 |
| 70,517,380 |
Total liabilities |
|
| 23,242,266 |
| 19,450,759 |
| 88,884,202 |
| 86,315,593 |
|
|
|
|
|
|
|
|
|
|
Shareholders' equity |
|
|
|
|
|
|
|
|
|
Share capital |
|
| 8,682,544 |
| 8,402,544 |
| 8,682,544 |
| 8,402,544 |
Treasury shares |
|
| (93,917) |
| (107,140) |
| (93,917) |
| (107,140) |
Additional paid-in capital |
|
| 2,561,964 |
| 2,319,928 |
| 2,561,964 |
| 2,319,928 |
Accumulated other comprehensive income |
|
| 314,325 |
| 567,546 |
| 314,325 |
| 567,546 |
Retained earnings |
|
| 9,490,391 |
| 9,470,289 |
| 9,490,391 |
| 9,470,289 |
Equity attributable to: |
|
|
|
|
|
|
|
|
|
Owners of the Company |
|
| 20,955,307 |
| 20,653,167 |
| 20,955,307 |
| 20,653,167 |
Non-controlling interests | 9.3 |
| — |
| — |
| 30,025,873 |
| 27,516,232 |
Total shareholders' equity |
|
| 20,955,307 |
| 20,653,167 |
| 50,981,180 |
| 48,169,399 |
Total liabilities and shareholders' equity |
|
| 44,197,573 |
| 40,103,926 |
| 139,865,382 |
| 134,484,992 |
The accompanying notes are an integral part of these individual and consolidated financial statements.
(In thousands of Reais, except earnings per share)
|
|
| Parent Company |
| Consolidated | ||||
| Note |
| 12/31/2023 |
| 12/31/2022 (Restated) (i) |
| 12/31/2023 |
| 12/31/2022 (Restated) (i) |
Net sales | 19 |
| — |
| — |
| 39,468,497 |
| 39,322,786 |
Cost of sales | 20 |
| — |
| — |
| (28,549,896) |
| (30,556,819) |
Gross profit |
|
| — |
| — |
| 10,918,601 |
| 8,765,967 |
|
|
|
|
|
|
|
|
|
|
Selling expenses | 20 |
| — |
| — |
| (1,350,570) |
| (1,276,279) |
General and administrative expenses | 20 |
| (437,390) |
| (300,262) |
| (2,527,974) |
| (1,758,067) |
Other incomes (expenses), net | 21 |
| (69,256) |
| 137,397 |
| 3,924,377 |
| 1,752,222 |
Operating expenses |
|
| (506,646) |
| (162,865) |
| 45,833 |
| (1,282,124) |
|
|
|
|
|
|
|
|
|
|
Profit (loss) before equity in earnings of investees and financial results |
|
| (506,646) |
| (162,865) |
| 10,964,434 |
| 7,483,843 |
|
|
|
|
|
|
|
|
|
|
Interest in earnings of associates | 9.1 |
| 2,236,069 |
| 3,909,579 |
| 350,399 |
| 418,897 |
Interest in earnings of joint ventures | 10 |
| 192,472 |
| (333,622) |
| 1,695,945 |
| (92,179) |
Equity in earnings of investees |
|
| 2,428,541 |
| 3,575,957 |
| 2,046,344 |
| 326,718 |
|
|
|
|
|
|
|
|
|
|
Financial expense |
|
| (1,934,520) |
| (1,970,687) |
| (11,337,430) |
| (4,706,535) |
Financial income |
|
| 829,235 |
| 277,734 |
| 3,028,134 |
| 5,777,521 |
Foreign exchange, net |
|
| 712,582 |
| 649,899 |
| 1,777,438 |
| 260,746 |
Net effect of derivatives |
|
| (1,098,745) |
| (2,299,389) |
| (1,365,169) |
| (6,489,668) |
Financial results, net | 22 |
| (1,491,448) |
| (3,342,443) |
| (7,897,027) |
| (5,157,936) |
|
|
|
|
|
|
|
|
|
|
Profit before income taxes |
|
| 430,447 |
| 70,649 |
| 5,113,751 |
| 2,652,625 |
|
|
|
|
|
|
|
|
|
|
Income taxes | 15 |
|
|
|
|
|
|
|
|
Current |
|
| 30,562 |
| — |
| (1,645,063) |
| (1,246,990) |
Deferred |
|
| 617,728 |
| 1,088,203 |
| 1,370,637 |
| 1,365,394 |
|
|
| 648,290 |
| 1,088,203 |
| (274,426) |
| 118,404 |
|
|
|
|
|
|
|
|
|
|
Profit for the year from continuing operations |
|
| 1,078,737 |
| 1,158,852 |
| 4,839,325 |
| 2,771,029 |
Profit for the year from discontinued operations, net of tax | 8 |
| 15,654 |
| 17,180 |
| 45,419 |
| 49,846 |
Profit for the year |
|
| 1,094,391 |
| 1,176,032 |
| 4,884,744 |
| 2,820,875 |
|
|
|
|
|
|
|
|
|
|
Profit attributable to: |
|
|
|
|
|
|
|
|
|
Owners of the Company |
|
| 1,094,391 |
| 1,176,032 |
| 1,094,391 |
| 1,176,032 |
Non-controlling interests |
|
| — |
| — |
| 3,790,353 |
| 1,644,843 |
|
|
| 1,094,391 |
| 1,176,032 |
| 4,884,744 |
| 2,820,875 |
|
|
|
|
|
|
|
|
|
|
Earnings per share of continuing operations | 18 |
|
|
|
|
|
|
|
|
Basic |
|
|
|
|
|
| R$0.5778 |
| R$0.6200 |
Diluted |
|
|
|
|
|
| R$0.5751 |
| R$0.6173 |
|
|
|
|
|
|
|
|
|
|
Earnings per share of discontinued operations | 18 |
|
|
|
|
|
|
|
|
Basic |
|
|
|
|
|
| R$0.0084 |
| R$0.0092 |
Diluted |
|
|
|
|
|
| R$0.0084 |
| R$0.0092 |
(i) For additional information see notes 3.4 and 8.
The accompanying notes are an integral part of these individual and consolidated financial statements.
(In thousands of Reais)
| Parent Company | Consolidated | |||||
| 12/31/2023 |
| 12/31/2022 | 12/31/2023 |
| 12/31/2022 | |
Profit for the year | 1,094,391 |
| 1,176,032 | 4,884,744 |
| 2,820,875 | |
Other comprehensive income: |
|
|
|
|
|
| |
Items that can be reclassified subsequently to profit or loss: |
|
|
|
|
|
| |
Foreign currency translation differences | (109,134) |
| 1,032,232 | (172,501) |
| 917,548 | |
Gain (loss) on cash flow hedge | (92,491) |
| 58 | (125,233) |
| 723 | |
Change in fair value of financial assets, net of taxes | — |
| 11,144 | — |
| 22,395 | |
| (201,625) |
| 1,043,434 | (297,734) |
| 940,666 | |
|
|
|
|
|
|
| |
Items that cannot be reclassified to profit or loss: |
|
|
|
|
|
| |
Actuarial gains losses with defined benefit plan | (51,596) |
| 45,721 | (71,550) |
| 80,330 | |
Deferred taxes | — |
| — | 24,327 |
| (27,312) | |
| (51,596) |
| 45,721 | (47,223) |
| 53,018 | |
|
|
|
|
|
|
| |
Comprehensive income from continuing operations | 825,516 |
| 2,248,007 | 4,494,368 |
| 3,764,713 | |
Comprehensive income from discontinued operations | 15,654 |
| 17,180 | 45,419 |
| 49,846 | |
Total comprehensive income for the year | 841,170 |
| 2,265,187 | 4,539,787 |
| 3,814,559 | |
|
|
|
|
|
|
| |
Comprehensive income attributable to: |
|
|
|
|
|
| |
Owners of the Company | 841,170 |
| 2,265,187 | 841,170 |
| 2,265,187 | |
Non-controlling interest | — |
| — | 3,698,617 |
| 1,549,372 | |
| 841,170 |
| 2,265,187 | 4,539,787 |
| 3,814,559 | |
The accompanying notes are an integral part of these individual and consolidated financial statements.
Statement of changes in equity
(In thousands of Reais)
|
|
|
|
| Capital reserve |
|
|
| Profit reserve |
|
|
|
|
|
|
|
| |||||||||
|
| Share capital |
| Treasury share |
| Corporate transactions - Law 6404 |
| Capital transactions |
| Accumulated other comprehensive loss |
| Legal |
| Statutory reserve |
| Profit to be realized |
| Retained earnings |
| Accumulated profits |
| Equity attributable to controlling shareholders |
| Non-controlling interest |
| Total equity |
On January 1, 2022 |
| 6,365,853 |
| (69,064) |
| 737 |
| (1,690,972) |
| (521,609) |
| 348,753 |
| 9,872,037 |
| 171,021 |
| 264,181 |
| — |
| 14,740,937 |
| 14,129,085 |
| 28,870,022 |
Net income for the year |
| — |
| — |
| — |
| — |
| — |
| — |
| — |
| — |
| — |
| 1,176,032 |
| 1,176,032 |
| 1,644,843 |
| 2,820,875 |
Other comprehensive income (note 17) |
|
|
|
|
|
|
|
|
|
|
|
|
|
|
|
|
|
|
|
|
|
|
|
|
|
|
Gain from cash flow hedge accounting |
| — |
| — |
| — |
| — |
| 58 |
| — |
| — |
| — |
| — |
| — |
| 58 |
| 665 |
| 723 |
Foreign currency translation differences |
| — |
| — |
| — |
| — |
| 1,032,232 |
| — |
| — |
| — |
| — |
| — |
| 1,032,232 |
| (114,684) |
| 917,548 |
Actuarial gain on defined benefit plan, net of tax |
| — |
| — |
| — |
| — |
| 45,721 |
| — |
| — |
| — |
| — |
| — |
| 45,721 |
| 7,297 |
| 53,018 |
Change in fair value of financial assets |
| — |
| — |
| — |
| — |
| 11,144 |
| — |
| — |
| — |
| — |
| — |
| 11,144 |
| 11,251 |
| 22,395 |
Total comprehensive income for the year |
| — |
| — |
| — |
| — |
| 1,089,155 |
| — |
| — |
| — |
| — |
| 1,176,032 |
| 2,265,187 |
| 1,549,372 |
| 3,814,559 |
Transactions with owners of the Company contributions and distributions: |
|
|
|
|
|
|
|
|
|
|
|
|
|
|
|
|
|
|
|
|
|
|
|
|
|
|
Capital increase |
| 2,036,691 |
| — |
| — |
| — |
| — |
| (348,753) |
| (1,423,757) |
| — |
| (264,181) |
| — |
| — |
| 7,889,251 |
| 7,889,251 |
Sale of treasury shares |
| — |
| 1,752 |
| — |
| 618 |
| — |
| — |
| — |
| — |
| — |
| — |
| 2,370 |
| — |
| 2,370 |
Share based payments |
| — |
| 19,678 |
| — |
| (30,930) |
| — |
| — |
| — |
| — |
| — |
| — |
| (11,252) |
| 5,636 |
| (5,616) |
Dividends |
| — |
| — |
| — |
| — |
| — |
| — |
| (45,736) |
| — |
| — |
| (279,308) |
| (325,044) |
| (912,735) |
| (1,237,779) |
Legal reserve |
| — |
| — |
| — |
| — |
| — |
| 58,802 |
| — |
| — |
| — |
| (58,802) |
| — |
| — |
| — |
Statutory reserve |
| — |
| — |
| — |
| — |
| — |
| — |
| 837,922 |
| — |
| — |
| (837,922) |
| — |
| — |
| — |
Acquisition of treasury shares |
| — |
| (59,506) |
| — |
| — |
| — |
| — |
| — |
| — |
| — |
| — |
| (59,506) |
| — |
| (59,506) |
Business combination |
| — |
| — |
| — |
| — |
| — |
| — |
| — |
| — |
| — |
| — |
| — |
| 10,062,503 |
| 10,062,503 |
Employee share schemes - value of employee services |
| — |
| — |
| — |
| 55,391 |
| — |
| — |
| — |
| — |
| — |
| — |
| 55,391 |
| 7,003 |
| 62,394 |
Total contributions and distributions |
| 2,036,691 |
| (38,076) |
| — |
| 25,079 |
| — |
| (289,951) |
| (631,571) |
| — |
| (264,181) |
| (1,176,032) |
| (338,041) |
| 17,051,658 |
| 16,713,617 |
|
|
|
|
|
|
|
|
|
|
|
|
|
|
|
|
|
|
|
|
|
|
|
|
|
|
|
Transactions with owners of the Company: |
|
|
|
|
|
|
|
|
|
|
|
|
|
|
|
|
|
|
|
|
|
|
|
|
|
|
Acquisition of non-controlling interest |
| — |
| — |
| — |
| — |
| — |
| — |
| — |
| — |
| — |
| — |
| — |
| (1,092,374) |
| (1,092,374) |
Change of shareholding interest in subsidiary |
| — |
| — |
| — |
| 3,985,084 |
| — |
| — |
| — |
| — |
| — |
| — |
| 3,985,084 |
| (4,121,509) |
| (136,425) |
Total transactions with owners of the Company |
| — |
| — |
| — |
| 3,985,084 |
| — |
| — |
| — |
| — |
| — |
| — |
| 3,985,084 |
| (5,213,883) |
| (1,228,799) |
Total transactions with owners of the Company contributions and distributions: |
| 2,036,691 |
| (38,076) |
| — |
| 4,010,163 |
| — |
| (289,951) |
| (631,571) |
| — |
| (264,181) |
| (1,176,032) |
| 3,647,043 |
| 11,837,775 |
| 15,484,818 |
On December 31, 2022 |
| 8,402,544 |
| (107,140) |
| 737 |
| 2,319,191 |
| 567,546 |
| 58,802 |
| 9,240,466 |
| 171,021 |
| — |
| — |
| 20,653,167 |
| 27,516,232 |
| 48,169,399 |
The accompanying notes are an integral part of these individual and consolidated financial statements.
Statement of changes in equity
(In thousands of Reais)
|
|
|
|
|
| Capital reserve |
|
|
| Profit reserve |
|
|
|
|
|
|
|
| ||||||||
|
| Share capital |
| Treasury share |
| Corporate transactions - Law 6404 |
| Capital transactions |
| Accumulated other comprehensive loss |
| Legal |
| Statutory reserve |
| Unrealized profit |
| Retained earnings |
| Accumulated profits |
| Equity attributable to controlling shareholders |
| Interest of non-controlling shareholders |
| Total equity |
On January 1, 2023 |
| 8,402,544 |
| (107,140) |
| 737 |
| 2,319,191 |
| 567,546 |
| 58,802 |
| 9,240,466 |
| 171,021 |
| — |
| — |
| 20,653,167 |
| 27,516,232 |
| 48,169,399 |
Net income for the year |
| — |
| — |
| — |
| — |
| — |
| — |
| — |
| — |
| — |
| 1,094,391 |
| 1,094,391 |
| 3,790,353 |
| 4,884,744 |
Other comprehensive income (note 17) |
|
|
|
|
|
|
|
|
|
|
|
|
|
|
|
|
|
|
|
|
|
|
|
|
|
|
Loss from cash flow hedge accounting |
| — |
| — |
| — |
| — |
| (92,491) |
| — |
| — |
| — |
| — |
| — |
| (92,491) |
| (32,742) |
| (125,233) |
Foreign currency translation differences |
| — |
| — |
| — |
| — |
| (109,134) |
| — |
| — |
| — |
| — |
| — |
| (109,134) |
| (63,367) |
| (172,501) |
Actuarial gain (loss) on defined benefit plan, net of tax |
| — |
| — |
| — |
| — |
| (51,596) |
| — |
| — |
| — |
| — |
| — |
| (51,596) |
| 4,373 |
| (47,223) |
Total comprehensive income (loss) for the year |
| — |
| — |
| — |
| — |
| (253,221) |
| — |
| — |
| — |
| — |
| 1,094,391 |
| 841,170 |
| 3,698,617 |
| 4,539,787 |
Transactions with owners of the Company contributions and distributions: |
|
|
|
|
|
|
|
|
|
|
|
|
|
|
|
|
|
|
|
|
|
|
|
|
|
|
Capital increase (note 17) |
| 280,000 |
| — |
| — |
| — |
| — |
| — |
| (280,000) |
| — |
| — |
| — |
| — |
| — |
| — |
Funds from capital increase and decrease in subsidiary (note 9.2) |
| — |
| — |
| — |
| — |
| — |
| — |
| — |
| — |
| — |
| — |
| — |
| 6,657 |
| 6,657 |
Gain from capital increase in a subsidiary |
| — |
| — |
| — |
| 60,348 |
| — |
| — |
| — |
| — |
| — |
| — |
| 60,348 |
| 10,830 |
| 71,178 |
Share based payments |
| — |
| 13,223 |
| — |
| (40,113) |
| — |
| — |
| — |
| — |
| — |
| — |
| (26,890) |
| (79,565) |
| (106,455) |
Write-off of interest in subsidiary |
| — |
| — |
| — |
| — |
| — |
| — |
| — |
| — |
| — |
| — |
| — |
| (22,280) |
| (22,280) |
Dividends and allocation of results (i) |
| — |
| — |
| — |
| — |
| — |
| — |
| (349,670) |
| (171,021) |
| 820,793 |
| (820,793) |
| (520,691) |
| (1,581,323) |
| (2,102,014) |
Mandatory minimum dividends |
| — |
| — |
| — |
| — |
| — |
| — |
| — |
| — |
| — |
| (273,598) |
| (273,598) |
| - |
| (273,598) |
Business combination |
| — |
| — |
| — |
| — |
| — |
| — |
| — |
| — |
| — |
| — |
| — |
| 237,460 |
| 237,460 |
Employee share schemes - value of employee services |
| — |
| — |
| — |
| 135,653 |
| — |
| — |
| — |
| — |
| — |
| — |
| 135,653 |
| 50,664 |
| 186,317 |
Total contributions and distributions |
| 280,000 |
| 13,223 |
| — |
| 155,888 |
| — |
| — |
| (629,670) |
| (171,021) |
| 820,793 |
| (1,094,391) |
| (625,178) |
| (1,377,557) |
| (2,002,735) |
Transactions with owners of the Company: |
|
|
|
|
|
|
|
|
|
|
|
|
|
|
|
|
|
|
|
|
|
|
|
|
|
|
Gain on dividends from subsidiary |
| — |
| — |
| — |
| 79,825 |
| — |
| — |
| — |
| — |
| — |
| — |
| 79,825 |
| 188,581 |
| 268,406 |
Change of shareholding interest in subsidiary (note 9.1) |
| — |
| — |
| — |
| 6,323 |
| — |
| — |
| — |
| — |
| — |
| — |
| 6,323 |
| — |
| 6,323 |
Total transactions with owners of the Company |
| — |
| — |
| — |
| 86,148 |
| — |
| — |
| — |
| — |
| — |
| — |
| 86,148 |
| 188,581 |
| 274,729 |
Total transactions with owners of the Company contributions and distributions: |
| 280,000 |
| 13,223 |
| — |
| 242,036 |
| — |
| — |
| (629,670) |
| (171,021) |
| 820,793 |
| (1,094,391) |
| (539,030) |
| (1,188,976) |
| (1,728,006) |
On December 31, 2023 |
| 8,682,544 |
| (93,917) |
| 737 |
| 2,561,227 |
| 314,325 |
| 58,802 |
| 8,610,796 |
| — |
| 820,793 |
| — |
| 20,955,307 |
| 30,025,873 |
| 50,981,180 |
The accompanying notes are an integral part of these individual and consolidated financial statements.
(i) The allocation of the statutory reserve for the year 2023 will be held after the Ordinary General Meeting.
(In thousands of Reais)
|
|
| Parent Company | Consolidated | |||||
| Note |
| 12/31/2023 |
| 12/31/2022 (Restated) (i) |
| 12/31/2023 |
| 12/31/2022 (Restated) (i) |
Cash flows from operating activities |
|
|
|
|
|
|
|
|
|
Profit before income taxes |
|
| 430,447 |
| 70,649 |
| 5,113,751 |
| 2,652,625 |
Adjustments for: |
|
|
|
|
|
|
|
|
|
Depreciation and amortization | 20 |
| 14,401 |
| 13,936 |
| 3,364,943 |
| 3,014,480 |
Interest in earnings of associates | 9.1 |
| (2,236,069) |
| (3,909,579) |
| (350,399) |
| (418,897) |
Interest in earnings of joint ventures | 10 |
| (192,472) |
| 333,622 |
| (1,695,945) |
| 92,179 |
Loss (gain) on disposed assets | 21 |
| (13,563) |
| 2,323 |
| 17,016 |
| 13,035 |
Share based payment | 24 |
| 109,467 |
| 41,832 |
| 207,713 |
| 99,088 |
Change in fair value of investment properties | 11.5 |
| — |
| — |
| (2,259,924) |
| (1,311,691) |
Legal proceedings provision | 21 |
| 86,619 |
| 41,463 |
| 204,158 |
| 370,764 |
Interest, derivatives, monetary and foreign exchange, net |
|
| 1,589,201 |
| 3,396,305 |
| 9,379,506 |
| 6,521,930 |
Bargain purchase gain (loss) | 21 |
| — |
| (99,341) |
| — |
| (99,341) |
Sectorial financial assets and liabilities, net | 5.10 |
| — |
| — |
| (110,125) |
| 339,854 |
(Gain) loss on energy derivative transactions |
|
| — |
| — |
| — |
| (248,123) |
Provisions for employee benefits |
|
| 58,522 |
| 26,682 |
| 419,241 |
| 380,967 |
Allowance for expected credit losses |
|
| — |
| — |
| 74,706 |
| 28,463 |
Tax credit recovery |
|
| — |
| — |
| (33,384) |
| (110,541) |
Results from the sale of investments | 21 |
| — |
| (54,707) |
| — |
| (988,077) |
Deferred revenue |
|
| — |
| — |
| (597,998) |
| (5,366) |
Revenue from finance investment |
|
| — |
| — |
| (1,284,647) |
| (32,493) |
Other |
|
| (49,502) |
| (79,854) |
| 278,427 |
| 381,572 |
|
|
| (202,949) |
| (216,669) |
| 12,727,039 |
| 10,680,428 |
Variation in: |
|
|
|
|
|
|
|
|
|
Trade receivable |
|
| — |
| — |
| 573,737 |
| (6,327) |
Inventories |
|
| — |
| — |
| (83,166) |
| (423,430) |
Other taxes, net |
|
| 66,903 |
| 17,286 |
| 454,941 |
| 553,584 |
Income tax |
|
| 92,318 |
| 4,428 |
| (1,272,145) |
| (1,090,684) |
Related parties, net |
|
| 5,325 |
| (326,210) |
| (188,798) |
| (139,621) |
Trade payables |
|
| (117,333) |
| 106,705 |
| (252,810) |
| 510,616 |
Employee benefits |
|
| (45,897) |
| (34,773) |
| (356,210) |
| (249,244) |
Provision for legal proceedings |
|
| (26,976) |
| (4,115) |
| (461,574) |
| (328,394) |
Financial instruments derivatives |
|
| — |
| — |
| 2,894 |
| (65,939) |
Other financial liabilities |
|
| — |
| — |
| (566,058) |
| 110,659 |
Judicial deposits |
|
| (36,036) |
| 2,369 |
| (22,862) |
| (2,670) |
Deferred income |
|
| — |
| — |
| — |
| 592,601 |
Post-employment benefits obligation |
|
| — |
| — |
| (34,235) |
| (90,411) |
Other assets and liabilities, net |
|
| (18,002) |
| 3,409 |
| (244,309) |
| (78,936) |
|
|
| (79,698) |
| (230,901) |
| (2,450,595) |
| (708,196) |
|
|
|
|
|
|
|
|
| — |
Net cash (used in) generated from operating activities |
|
| (282,647) |
| (447,570) |
| 10,276,444 |
| 9,972,232 |
|
|
|
|
|
|
|
|
|
|
Cash flows from investing activities |
|
|
|
|
|
|
|
|
|
Capital contribution to associates |
|
| (2,716,505) |
| (8,475,590) |
| (47,300) |
| (86,205) |
Acquisition of subsidiary, net of acquired cash |
|
| (567,577) |
| (525,115) |
| (702,577) |
| (5,288,696) |
Purchase of marketable securities |
|
| 72,305 |
| 241,786 |
| (507,976) |
| (13,911,737) |
Restricted cash |
|
| (40,036) |
| (3,858) |
| (60,498) |
| (58,179) |
Dividends received from associates | 17 |
| 855,188 |
| 1,849,651 |
| 254,905 |
| 278,127 |
Dividends received from joint venture | 17 |
| 351,092 |
| 1,174,771 |
| 906,534 |
| 1,174,771 |
Dividends received from finance investment | 1.1 |
| — |
| — |
| 1,305,410 |
| — |
Acquisition of instruments designated at fair value |
|
| — |
| — |
| (7,485) |
| (190,990) |
Capital reduction in subsidiaries |
|
| 16,088 |
| — |
| 99,040 |
| — |
Statement of cash flow
(In thousands of Reais)
|
|
| Parent Company | Consolidated | |||||
| Note |
| 12/31/2023 |
| 12/31/2022 (Restated) (i) |
| 12/31/2023 |
| 12/31/2022 (Restated) (i) |
Acquisition of property, plant and equipment, intangible and contract assets |
|
| (7,209) |
| (2,471) |
| (6,267,962) |
| (4,531,374) |
Proceeds from the sale of investments |
|
| 15,000 |
| 87,200 |
| 645,772 |
| 1,969,789 |
Net cash from sale of discontinued operations |
|
| — |
| — |
| 62,700 |
| 44,969 |
Receipt of derivative financial instruments, except debt |
|
| 162,114 |
| 146,979 |
| 168,308 |
| 146,979 |
Payment of derivative financial instruments, except debt |
|
| (145,308) |
| (287,640) |
| (156,600) |
| (283,337) |
Cash received on the sale of property, plant and equipment and intangible assets |
|
| — |
| — |
| 4,637 |
| 9,319 |
Net cash generated from (used in) investing activities |
|
| (2,004,848) |
| (5,794,287) |
| (4,303,092) |
| (20,726,564) |
|
|
|
|
|
|
|
|
|
|
Cash flows from financing activities |
|
|
|
|
|
|
|
|
|
Proceeds from loans, borrowings and debentures | 5.4 |
| 8,636,528 |
| 9,450,210 |
| 12,785,628 |
| 23,886,960 |
Principal repayment of loans, borrowings and debentures | 5.4 |
| (579,942) |
| — |
| (8,054,763) |
| (15,278,378) |
Payment of interest on loans, borrowings and debentures | 5.4 |
| (973,919) |
| (830,380) |
| (3,552,292) |
| (3,441,978) |
Payment of derivative financial instruments |
|
| (787,608) |
| (658,874) |
| (2,851,267) |
| (2,079,805) |
Proceeds from derivative financial instruments |
|
| 789,574 |
| 226,684 |
| 1,193,534 |
| 291,619 |
Costs of banking operations with derivatives | 1.1 |
| — |
| — |
| (586,855) |
| — |
Principal repayment of leases | 5.5 |
| (5,524) |
| (5,051) |
| (490,012) |
| (400,248) |
Payment of interest on leases | 5.5 |
| (3,615) |
| (3,933) |
| (236,948) |
| (211,611) |
Transaction costs related to loans and borrowings |
|
| — |
| — |
| — |
| (94,196) |
Proceeds from capital contributions by non-controlling shareholders |
|
| — |
| — |
| (24,281) |
| 8,126,823 |
Transaction costs related to capital contributions by non-controlling shareholders |
|
| — |
| — |
| — |
| (19,217) |
Related parties |
|
| (3,534,080) |
| (1,231,979) |
| — |
| — |
Repurchase of own shares |
|
| — |
| (59,506) |
| (103,283) |
| (84,591) |
Proceeds from the sale of treasury shares |
|
| — |
| 2,370 |
| — |
| 2,370 |
Acquisition of non-controlling shareholders’ shares |
|
| — |
| (25,582) |
| — |
| (487,721) |
Dividends paid | 17 |
| (798,203) |
| (799,347) |
| (2,582,447) |
| (1,908,171) |
Payment of share-based compensation |
|
| — |
| — |
| (13,597) |
| (15,597) |
Net cash generated from (used in) financing activities |
|
| 2,743,211 |
| 6,064,612 |
| (4,516,583) |
| 8,286,259 |
|
|
|
|
|
|
|
|
|
|
Increase (decrease) in cash and cash equivalents |
|
| 455,716 |
| (177,245) |
| 1,456,769 |
| (2,468,073) |
|
|
|
|
|
|
|
|
|
|
Cash and cash equivalents at the beginning of the year |
|
| 1,348,461 |
| 1,718,077 |
| 13,301,716 |
| 16,174,130 |
Effect of the foreign exchange rate changes |
|
| (34,201) |
| (192,371) |
| (100,004) |
| (404,341) |
Cash and cash equivalents at the end of the year |
|
| 1,769,976 |
| 1,348,461 |
| 14,658,481 |
| 13,301,716 |
|
|
|
|
|
|
|
|
|
|
Additional information |
|
|
|
|
|
|
|
|
|
Income taxes paid |
|
| — |
| — |
| 361,726 |
| 318,845 |
(i) For more details see note 8.
The accompanying notes are an integral part of these individual and consolidated financial statements.
Statement of cash flow
(In thousands of Reais)
Non-cash transactions:
The Company presents its statements of cash flows using the indirect method. During the year ended December 31, 2023, the Company carried out the following transactions that did not involve cash and, therefore, are not reflected in the parent company and consolidated statement of cash flows:
| (i) | Recognition of right-of-use as a counterpart to the lease liability in the amount of R$2,037,779 (R$246,517 as at December 31, 2022), resulting from the application of inflation indexes and new contracts classified under the leasing rule (Note 11.4). |
| (ii) | Acquisition of property, plant and equipment and intangible assets with payment in installments R$860,551 (R$246,564 on December 30, 2022). |
| (iii) | Capital increase in subsidiary Cosan Nove Participações S.A. with funds from the balance of accounts receivable from related parties in the amount of R$121,621. |
| (iv) | Partial amortization of Senior Notes 2027 and 2029 in the amount of R$84,585 using the balance of other financial assets. |
| (v) | Transfer of the balance of securities and securities for investment in a subsidiary for Vale S.A shares in the amount of R$16,274,081. |
Disclosure of interest and dividends:
Dividends and interest on shareholders' equity are classified as cash flow from investing activities by the Company. Dividends and interest received or paid are classified as cash flow from financing activities.
(In thousands of Reais)
| Parent Company |
| Consolidated | ||||
| 12/31/2023 |
| 12/31/2022 (Restated) (i) |
| 12/31/2023 |
| 12/31/2022 (Restated) (i) |
Revenue |
|
|
|
|
|
|
|
Net sales | — |
| — |
| 44,290,457 |
| 46,855,778 |
Other operating income (expense), net | (23,940) |
| 243,655 |
| 6,282,834 |
| 2,635,017 |
Impairment gain (loss) on trade receivables | — |
| — |
| (74,706) |
| (16,544) |
| (23,940) |
| 243,655 |
| 50,498,585 |
| 49,474,251 |
Inputs purchased from third parties |
|
|
|
|
|
|
|
Cost of goods sold and services rendered | — |
| — |
| 25,155,268 |
| 16,579,962 |
Materials, energy, third-party services and other | 145,668 |
| 205,564 |
| 3,782,239 |
| 15,933,925 |
| 145,668 |
| 205,564 |
| 28,937,507 |
| 32,513,887 |
|
|
|
|
|
|
|
|
Gross value added | (169,608) |
| 38,091 |
| 21,561,078 |
| 16,960,364 |
|
|
|
|
|
|
|
|
Retention |
|
|
|
|
|
|
|
Depreciation and amortization | 14,401 |
| 13,936 |
| 3,364,943 |
| 3,014,480 |
Net value added | (184,009) |
| 24,155 |
| 18,196,135 |
| 13,945,884 |
|
|
|
|
|
|
|
|
Value added transferred in |
|
|
|
|
|
|
|
Interest earnings in associates | 2,236,069 |
| 3,909,579 |
| 350,399 |
| 418,897 |
Interest earnings in joint ventures | 192,472 |
| (333,622) |
| 1,695,945 |
| (92,179) |
Profit for the year from discontinued operation, net of tax | 15,654 |
| 17,180 |
| 45,419 |
| 49,846 |
Finance revenue | 829,235 |
| 277,734 |
| 3,028,134 |
| 5,777,521 |
| 3,273,430 |
| 3,870,871 |
| 5,119,897 |
| 6,154,085 |
|
|
|
|
|
|
|
|
Value added to be distributed | 3,089,421 |
| 3,895,026 |
| 23,316,032 |
| 20,099,969 |
|
|
|
|
|
|
|
|
Distribution of value added |
|
|
|
|
|
|
|
Personnel and payroll charges | 296,827 |
| 157,309 |
| 2,608,269 |
| 2,144,552 |
Direct remuneration | 275,868 |
| 141,010 |
| 2,093,703 |
| 1,735,284 |
Benefits | 12,191 |
| 9,970 |
| 401,914 |
| 341,624 |
FGTS and other | 8,768 |
| 6,329 |
| 112,652 |
| 67,644 |
|
|
|
|
|
|
|
|
Taxes, fees and contributions | (622,481) |
| (1,058,494) |
| 4,781,623 |
| 4,056,804 |
Federal | (627,134) |
| (1,067,479) |
| 1,777,439 |
| 1,930,941 |
State | — |
| — |
| 2,764,109 |
| 1,890,934 |
Municipal | 4,653 |
| 8,985 |
| 240,075 |
| 234,929 |
|
|
|
|
|
|
|
|
Financial expenses and rents | 2,320,684 |
| 3,620,179 |
| 11,041,396 |
| 11,077,738 |
Interest and foreign exchange variation | 2,408,020 |
| 3,296,927 |
| 10,188,657 |
| 10,583,018 |
Rents | — |
| — |
| 141,440 |
| 142,280 |
Other | (87,336) |
| 323,252 |
| 711,299 |
| 352,440 |
|
|
|
|
|
|
|
|
Equity Remuneration | 1,094,391 |
| 1,176,032 |
| 4,884,744 |
| 2,820,875 |
Non-controlling interests | — |
| — |
| 3,790,353 |
| 1,644,843 |
Dividends | 273,598 |
| 279,308 |
| 273,598 |
| 279,308 |
Retained profits | 805,139 |
| 879,544 |
| 775,374 |
| 846,878 |
Profit for the year from discontinued operation, net of tax | 15,654 |
| 17,180 |
| 45,419 |
| 49,846 |
(i) For more details see notes 3.4 and 8.
The accompanying notes are an integral part of these individual and consolidated financial statements.
Explanatory Notes to the Financial Statement
(In thousands of Reais, except when otherwise indicated)
Cosan S.A. (“Cosan” or “the Company”) is a publicly traded company at B3 S.A. - Brasil, Bolsa, Balcão (“B3”) in the special New Market (Novo Mercado) segment under the ticker symbol “CSAN3”. The Company's American Depositary Shares (“ADSs”) are listed on the New York Stock Exchange, or “NYSE”, and are traded under the ticker symbol “CSAN”. Cosan is a corporation (sociedade anônima) of indefinite term incorporated under the laws of Brazil, with its registered office in the city of São Paulo, state of São Paulo. Mr. Rubens Ometto Silveira Mello is the ultimate controlling shareholder of Cosan.
Corporate Cosan (Corporate segment) is formed by the following entities:
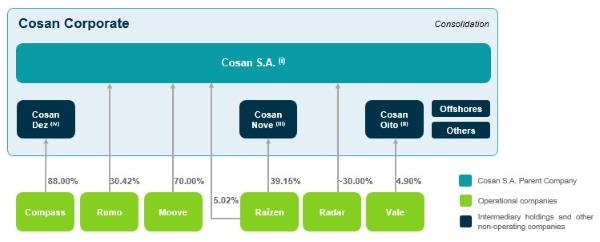
| (i) | Parent company with direct or indirect equity interest in subsidiaries and joint venture. The main effects on its profit or loss are general and administrative expenses, contingencies, equity income and financial results attributed to loans. |
| (ii) | Cosan Oito is a subsidiary of Cosan S.A, which holds a stake in Vale. |
| (iii) | Cosan Nove has a direct stake in Raízen of 39.15% and preferred shares with Itaú Unibanco S.A. (“Itaú”) which corresponds to an equity interest of 26.91%. |
| (iv) | Cosan Dez has a direct stake in Compass of 88,00% and preferred shares with Bradesco BBI S.A. (“Bradesco”) which corresponds to an equity interest of 23.20%. |
During the fourth quarter of the fiscal year 2022, the subsidiary Cosan Oito S.A. (“Cosan Oito”) concluded the transaction related to the acquisition of a non-controlling stake in Vale S.A. ("Vale") which was divided into: a) financial assets; b) debts incurred; c) contracted derivatives; d) issuance of preferred shares and) Obtaining significant influence. The Company initially recorded its shareholding in Vale as a financial asset accounted for at fair value in accordance with IFRS 9/CPC48.
On April 28, 2023, at Vale’s Ordinary General Assembly, the CEO of Cosan S.A., Luis Henrique Cals de Beauclair Guimarães (“Luis Henrique”), was elected a member of Vale’s Board of Directors, and on May 16, 2023, was appointed Coordinator of the Capital and Projects Allocation Committee (“CACP”) and member of the People and Compensation Committee (“CPR”). From January 1, 2024, Luis Henrique left the position of CEO of Cosan S.A., becoming part of the Board of Directors.
Explanatory Notes to the Financial Statement
(In thousands of Reais, except when otherwise indicated)
During the fiscal year 2023 the Company monitored the factors that could indicate significant influence in Vale. On November 30, 2023, the Company obtained sufficient evidence that demonstrated the ability to exert significant influence on Vale’s policies and operations, when the member appointed by Cosan to the Vale Board was able to participate in policy-making processes, including decisions on dividends and other distributions. Thus, from this date, Cosan began to consider Vale as a related company with significant influence, registering the investment by equity according to CPC 18/IAS 28, having 4.85% of shareholding, and closing the year with 4,65% of total participation as at December 31, 2023, after disposal of 0.21% of shares, as mentioned in note 1.1 (b).
With the acquisition of significant influence, the Company adopted the fair value approach to measure the opening balance of the investment on December 1, 2023, generating a premium of R$7,432,600 which was allocated as shown below:
|
| Balances as of December 1, 2023 |
Fair value as of November 30, 2023 |
| 16,274,081 |
Fair value of Vale’s assets and liabilities according to Cosan’s participation(i) |
| 8,841,481 |
Available amount to be allocated |
| 7,432,600 |
|
|
|
Allocation(i) |
|
|
Added value - Mining rights(ii) |
| 7,432,600 |
Deferred tax on added value |
| (2,527,084) |
Goodwill(iii) |
| 2,527,084 |
| (i) | As evaluation report prepared by specialized external evaluators. |
| (ii) | The surplus value will be amortized for 38 years following the expected useful life and exhaustion of Vale’s mining reserves. |
| (iii) | Although the Company has allocated all goodwill to Mining Rights, income tax and deferred social contribution relating to surplus value have been recognized and, in accordance with IAS 12.19/CPC 32.19 Income Taxes, a goodwill must be recorded. |
The goodwill generated in the acquisition of Vale shares is part of a cash-generating unit (“UGC”) that is the investment itself in Vale. Since it refers to a related investment, the value of the deferred tax liability is already part of the accounting balance of the investment, both in the individual financial statements and in the consolidated statements. Thus, for the purpose of the impairment test, the goodwill balance is net of the deferred tax liability related to capital gains and makes up the investment group in its accounting balance recognized in accordance with IAS 28, on a net basis.
The adjustment resulting from the valuation by the equity method is demonstrated as follows:
Company |
| Total amount of shares |
| Shareholders' equity of Vale S.A. |
| Quantity shares owned |
| Cosan's interest (i) |
| Equity in earnings |
| Total investment as of December 31, 2023 |
Vale S.A. |
| 4,539,007,580 |
| 190,965,062 |
| 210,866,700 |
| 4.90% |
| 96,075 |
| 15,662,485 |
| (i) | Percentage of participation excluding treasury shares for equity calculation. Cosan’s share of the total shares is 4.65% as at December 31, 2023. |
Explanatory Notes to the Financial Statement
(In thousands of Reais, except when otherwise indicated)
Assumptions for assessing the fair value of assets and liabilities
Given that there is no control over Vale, we face certain difficulties to access company information. Vale, in order to maintain equal information for all its shareholders, does not share financial data that is not publicly known, including additional details about its operations. Therefore, we used the public information available as at December 31, 2023, to perform analyses and support the determination of the fair value of the assets and liabilities identified in the allocation of the price paid. This information is in line with the financial statements disclosed to the market on 22 February 2024 and were duly audited by an independent auditor.
The methodology used for evaluation was the discounted cash flow.
Discount rate
To calculate Vale’s cost of equity, the Capital Asset Pricing Model ("CAPM") methodology was used, which aims to assess whether a stock is valued when its risk and the value of money in time are compared to its expected return.
As a risk-free rate, it was considered the average return rate of 2 years, with daily observations of the United States Treasury Bonds of 30 years ("T-Bond") on November 30, 2023, corresponding to 3.50%, reaching a Weighted Average Cost of Capital ("WACC") between 10% and 13%.
Identification of intangible assets
Brand: Vale is recognized in the market as one of the leading companies in the commodities sector. However, the company is dedicated to the production and sale of mineral commodities, a highly competitive and cost-focused segment. Commodities are commodities whose prices are determined by the international market, undifferentiated from the supplier, produced on a large scale and without distinction between them. Therefore, we conclude that the Vale brand does not offer a significant differential in its operations that justifies its inclusion in the allocation of the amount paid.
Customer relationship: The customers of a mining company are mostly industries looking for raw materials based mainly on price, not supplier relationship. Due to product characteristics, revenues from contracts with customers can be easily replaced. Vale, like other commodity market participants, has broad access to buyers, both local and international, and does not rely on customer relationships or customer loyalty to market its production. In this segment, contracts are established to define delivery terms, payment and technical specifications, but prices are determined by the international market. The commonly used international price references are the London Metal Exchange ("LME") and the Commodities Exchange ("COMEX").
Therefore, regardless of the regularity of supply, the Company understands that Vale’s current customers do not represent an asset that confers a significant competitive advantage and, therefore, are not considered an intangible to be evaluated.
Mining assets: It refers to the exclusive right to exploit the mining rights of the iron, nickel and copper mines operated by Vale. Without these rights, Vale could not carry out its operations. The useful life of these rights is determined by the exhaustion of mineral reserves, so they were considered in our assessments to determine the value to be allocated.
The allocation of the value of the mining asset was made by the difference of the available value to be allocated, because any remaining value should increase the value of this asset. For the projected period, the economic life of the mining rights accompanies the exhaustion of the reserves of the mines per business unit. The projections were made considering the division by business unit, aligned with Vale’s financial disclosures for the market of its numbers per business unit. These business units are: (i) Ferrous Minerals, (ii) Metals for Energy Transition, and (iii) Other Businesses.
In addition, throughout 2023, the Company made several advance payments of debts 4131 with the financial institutions JP Morgan and Citibank, as well as the permanent disposal of 9,5 million shares of Vale on December 18, 2023, equivalent to the participation of 0.21% of the total shares of the said company in the Collar Financing structure. These transactions led to the increase of its direct participation on December 31, 2023, to 2.45%, and total participation of 4.65% under the total shares of the company, which is in line with its strategy of seeing the company as an investment in affiliates, see footnote 1.1 (b). Additionally, on April 19, 2024, the Company sold an additional 33,525 million shares equivalent to a 0.74% stake in the total shares in the Collar Financing structure. With this last advance payment, the Company settled 100% of the debts linked to the operation and collar derivatives.
Explanatory Notes to the Financial Statement
(In thousands of Reais, except when otherwise indicated)
a) Assets acquired
Cosan Oito made the following investments in Vale: (a) acquisition of shares in the spot market and (b) purchase through a private operation with partial protection via derivatives (Collar), as shown in the table below:
|
| Inception date |
| At November 30, 2023 (i) | ||||
Description |
| % |
| Amount |
| % |
| Amount |
Direct shareholding |
| 1.47% |
| 4,918,245 |
| 2.45% |
| 8,220,927 |
Equity collar |
| 3.14% |
| 11,117,824 |
| 2.40% |
| 8,053,154 |
|
| 4.61% |
| 16,036,069 |
| 4.85% |
| 16,274,081 |
| (i) | From December 1, 2023, due to the acquisition of significant influence, the Company reclassified its share of financial investment for investment in related companies. |
b) Debt incurred and partial advances
The following loans were contracted for the acquisition of assets, together with the banks below:
Creditor |
| Amount (ii) |
| Maturities |
| Currency (i) |
| Annual interest rate (i) |
JP Morgan S.A. |
| 789,659 |
| Oct-24 |
| Euro |
| 2.95% |
JP Morgan S.A. |
| 1,825,467 |
| Oct-25 |
| Euro |
| 3.20% |
JP Morgan S.A. |
| 1,785,329 |
| Oct-26 |
| Euro |
| 3.40% |
JP Morgan S.A. |
| 741,320 |
| Oct-27 |
| Euro |
| 3.56% |
Citibank S.A. |
| 526,443 |
| Oct-24 |
| Yen |
| 0.25% |
Citibank S.A. |
| 1,216,939 |
| Oct-25 |
| Yen |
| 0.25% |
Citibank S.A. |
| 1,190,274 |
| Oct-26 |
| Yen |
| 0.25% |
Citibank S.A. |
| 494,199 |
| Oct-27 |
| Yen |
| 0.25% |
Total |
| 8,569,630 |
|
|
|
|
|
|
| (i) | Debts were contracted (Resolução 4131) in the currencies specified above with four maturities with pre-fixed amounts and derivative financial instruments were contracted with CDI plus 0.45% equivalent. |
| (ii) | During the first months of 2024 as shown in the table below, the Company pre-settled 100% of the debts linked to the acquisition of Vale’s shares, as well as the Collar Financing derivatives linked to the operation. |
Explanatory Notes to the Financial Statement
(In thousands of Reais, except when otherwise indicated)
|
| Cosan interest |
| Debt settlement |
|
| ||||||
Reference date |
| Direct |
| Collar |
| Total |
| Principal |
| Interest |
| Gain/Loss Settlement Collar Financing |
Inception date (October/2022) |
| 1.47% |
| 3.14% |
| 4.61% |
| 8,569,630 |
| — |
| — |
August 2023 |
| 1.65% |
| 3.21% |
| 4.85% |
| (275,866) |
| (4.878) |
| 28,961 |
October 2023 |
| 1.75% |
| 3.11% |
| 4.85% |
| (252,540) |
| (624) |
| 28,009 |
November 2023 |
| 2.45% |
| 2.40% |
| 4.85% |
| (1,844,022) |
| (41,355) |
| 30,525 |
December 2023 (ii) |
| 2.45% |
| 2.20% |
| 4.65% |
| (561,259) |
| (14.047) |
| 29,487 |
January 2024 (i) |
| 2.62% |
| 2.03% |
| 4.65% |
| (1,698,606) |
| (49,773) |
| 188,140 |
February 2024 (i) |
| 3.91% |
| 0.74% |
| 4.65% |
| (2,067,956) |
| (63,689) |
| 303,431 |
April 2024 (i)/(iv) |
| 3.91% |
| — |
| 3.91% |
| (1,918,773) |
| (65,880) |
| 331,116 |
| (i) | Settlement carried out after the closing of the 2023 financial year, being treated as a subsequent event. |
| (ii) | On December 18, 2023, the early settlement of debts, derivatives and permanent disposal of 9.5 million shares of Vale equivalent to the participation of 0.21% of the total shares of that company in the Collar Financing structure was carried out, which resulted in a positive cash effect of R$68,573. |
| (iii) | Cosan’s stake in Vale’s total shares. |
| (iv) | On April 19, 2024, the Company sold an additional 33,525 million shares equivalent to a 0.74% stake in the total shares in the Collar Financing structure, together with the early settlement of the remaining debt. With this last advance payment, the Company settled 100% of the debts linked to the operation and collar derivatives, now holding only a direct stake in Vale. |
c) Structured derivatives
For protection related to the acquisition of a 3.14% stake, derivatives were contracted consisting of a combination of call and put (Collar). Additionally, the following papers were contracted: (i) forward option (Forward) which grants the right to acquire 1.60% of Vale (optional) and (ii) Derivatives consisting of a combination of call and put positions (Synthetic Collar).
The collar and synthetic collar derivatives protect the Company from the devaluation of the share’s value below the strikes of the puts, at the same time, they allow Cosan Oito to participate partially in future increases in the share’s value limited to the strikes of the calls.
|
| Inception Date |
| At December 31, 2023 | ||||
Description |
| % |
| Amount (paid)/received |
| % (i) |
| Fair value |
Collar |
| 3.14% |
| 499,197 |
| 2.20% |
| 89,401 |
Call Spread |
| 1.60% |
| (888,612) |
| 1.60% |
| 562,435 |
Forward |
|
|
| (1,134,933) |
|
|
| 366,296 |
Collar synthetic |
|
|
| 246,321 |
|
|
| 196,139 |
Total |
|
|
| (389,415) |
|
|
| 651,836 |
| (i) | Reduction in the percentage of participation via collar operation due to the settlements that occurred throughout 2023, which resulted in a financial gain of R$116,982. As shown in item (b) above, by April 2024 the Company had liquidated 100% of Collar derivatives, leaving only Call Spread derivatives open. |
Explanatory Notes to the Financial Statement
(In thousands of Reais, except when otherwise indicated)
d) Issuance of preferred shares
Bradesco BBI S.A. (“Bradesco”) and Itaú Unibanco S.A. (“Itaú”) completed investments on December 23 and 28, 2022, acquiring 23.30% and 26.91% of the share capital of the subsidiaries Cosan Dez Participações S.A. ("Cosan Dez") and Cosan Nove Participações S.A. ("Cosan Nove") for R$4,000,000 and R$4,115,000, respectively.
As part of the issuance of preferred shares by Cosan Nove and Cosan Dez, Cosan S.A. contributed its investments in Raízen and Compass Gas and Energy. The structure after the contribution of investments follows as shown:
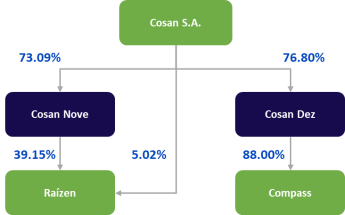
Disproportionate dividends
The subsidiaries Cosan Nove and Cosan Dez have outstanding preferred shares classified in equity by non-controlling interests. The Company calculates its share of profits or losses after adjusting the dividends on these shares, regardless of whether such dividends have been declared or not. This effectively means that the non-controlling interest, represented by the preferred shares, is receiving a portion of the profit or accrual of interest equivalent to the dividends.
As at December 31, 2023, the equity interest and economic benefit of Cosan S.A. on Cosan Nove and Cosan Dez, considering the disproportionate dividends were as shown below:
|
| % Equity interest |
| % Economic benefit (i) |
Cosan Nove |
| 73.09% |
| 66.16% |
Cosan Dez |
| 76.80% |
| 72.00% |
| (i) | Percentage used to calculate the interest as at December 31, 2023. To calculate the dividends of Cosan Nove and Cosan Dez for preferred shareholders, the profits of the respective Companies are used, multiplied by the participation percentages using the percentages defined in the Shareholders’ Agreements. |
Call option
The Company has a call option which gives it the right to repurchase all preferred shares from Cosan Nove and Cosan Dez, which may be exercised from the third year after the signing of the respective agreements in December 2022.
As at December 31, 2023, the Company measured the fair value of the call option and concluded that it is out of price.
Contingent sell Option
In the shareholders’ agreements signed between the Company and Itaú and Bradesco referring to the issuance of preferred shares, it was defined that both financial institutions have a contingent call option only when the specific material adverse effects provided for in the contract occur, which are in the control of the Company and, therefore, do not constitute a financial obligation.
Explanatory Notes to the Financial Statement
(In thousands of Reais, except when otherwise indicated)
The total of investments in preferred shares are calculated based on the initial amounts of R$4,115,000 and R$4,000,000 restated by a weighted average rate of CDI + 1.25% less dividends received by non-controlling shareholders in this period, which, as at December 31, 2023, is represented by the amounts of R$4,203,917 and R$4,201,215, respectively.
e) Summary of the accounting effect of the events mentioned in the previous topics.
Below is a summary of the accounting effect of the events mentioned above:
| Note |
| Financial asset |
| Investment in subsidiaries and associates |
| Debt incurred (vi) |
| Derivates |
| Dividends receivable, net |
| Dividends payable | ||||
|
|
|
|
| Collar (i) |
| Synthetic Collar (ii) |
| Forward (ii) |
|
| ||||||
At January 1, 2023 |
|
| 19,586,193 |
| — |
| (8,808,673) |
| (2,840,544) |
| (1,237,907) |
| 1,954,493 |
| 22,842 |
| — |
- Impacts on the profit or loss |
|
|
|
|
|
|
|
|
|
|
|
|
|
|
|
|
|
MTM of shares(iii) | 22 |
| (3,312,112) |
| — |
| — |
| — |
| — |
| — |
| — |
| — |
Interest and monetary and exchange variation (accrual) | 22 |
| — |
| — |
| 599,515 |
| — |
| — |
| — |
| — |
| — |
Dividends declared by Vale (vii) | (viii) | 21 |
| — |
| — |
| — |
| — |
| — |
| — |
| 1,339,340 |
| — |
Costs of banking operations with derivatives | 22 |
| — |
| — |
| — |
| — |
| — |
| — |
| (554,998) |
| — |
MTM of derivates | 22 |
| — |
| — |
| (2,011,980) |
| 3,046,926 |
| 1,434,046 |
| (1,588,197) |
| — |
| — |
Equity in earnings of investees |
|
| — |
| 96,075 |
| — |
| — |
| — |
| — |
| — |
| — |
Cost of selling a shareholding (ix) |
|
| — |
| (701,575) |
| — |
| — |
| — |
| — |
| — |
| — |
- Impacts on cash flow - (receipt) / payment |
|
|
|
|
|
|
|
|
|
|
|
|
|
|
|
|
|
Dividends paid to minority shareholders from Cosan Nove and Dez |
|
| — |
| — |
| — |
| — |
| — |
| — |
| — |
| 821,772 |
Dividends (received) from Vale (iv) |
|
| — |
| — |
| — |
| — |
| — |
| — |
| (1,305,410) |
| — |
Costs of banking operations with derivatives (v) |
|
| — |
| — |
| — |
| — |
| — |
| — |
| 586,855 |
| — |
Partial payment of loans |
|
| — |
| — |
| 2,994,592 |
| — |
| — |
| — |
| — |
| — |
Payment of derivative financial instruments |
|
| — |
| — |
| 438,138 |
| — |
| — |
| — |
| — |
| — |
Receipt of derivative financial instruments |
|
| — |
| — |
| — |
| (116,981) |
| — |
| — |
| — |
| — |
- Impacts on the balance sheet |
|
|
|
|
|
|
|
|
|
|
|
|
|
|
|
|
|
Minority dividends payable referring to structure of issuance of preferred shares |
|
| — |
| — |
| — |
| — |
| — |
| — |
| — |
| (821,772) |
Income tax |
|
| — |
| — |
| — |
| — |
| — |
| — |
| (88,629) |
| — |
Equity in earnings of investees and other comprehensive income |
|
| — |
| (6,096) |
| — |
| — |
| — |
| — |
| — |
| — |
Transfer to investments in subsidiaries and associates | 9.1 |
| (16,274,081) |
| 16,274,081 |
| — |
| — |
| — |
| — |
| — |
| — |
At December 31, 2023 |
|
| — |
| 15,662,485 |
| (6,788,408) |
| 89,401 |
| 196,139 |
| 366,296 |
| — |
| — |
Explanatory Notes to the Financial Statement
(In thousands of Reais, except when otherwise indicated)
| (i) | Collar contracted to protect 3.21% of the shares acquired. |
| (ii) | Forward and synthetic collar contracted for the right to acquire and protect, respectively, 1.65% of Vale's shares. |
| (iii) | Mark to market consisting of |
a. 2.45% interest in shares purchased in cash, totaling R$1,669,686, and | |
b. 2.41% stake in shares with Collar protection totaling R$1,642,426. | |
| (iv) | The balance received from dividends is composed of R$1,250,712 referring to the year ended as at December 31,2023 and R$54,698 referring to the provisioned amount as at December 31, 2022. |
| (v) | The balance paid for costs of banking operations with derivatives is composed of R$554,998 referring to the year ended as at December 31,2023 and R$31,856 referring to the provisioned amount as at December 31, 2022. |
| (vi) | Also includes contracted derivatives (NDF) for exchange rate and interest protection. |
| (vii) | Vale’s Board of Directors approved, on July 27, 2023, the distribution of interest on equity ("JCP") in the gross total value of R$8,276,501, corresponding to the total value of R$1.917008992 per share, calculated according to its balance sheet of June 30, 2023. On October 26, 2023, also was approved the remuneration of shareholders in the amount of R$10,033. Of this amount, R$6,738 million refers to dividends corresponding to the total value of R$1.565890809 per share and R$3,295 related to interest on equity ("JCP") corresponding to the total value of R$0.765770758 per share as interest on equity. |
| (viii) | After obtaining significant influence, as described in item (e) above, the Company will no longer have its result impacted by dividend distribution, as the investment is now updated by the equity method. |
| (ix) | The amount of revenue related to the cost mentioned in this item was R$699,929. |
Explanatory Notes to the Financial Statement
(In thousands of Reais, except when otherwise indicated)
SALE OF SHARES OF SINLOG TECNOLOGIA EM LOGÍSTICA S.A.
On March 10, 2023, the Company entered into a share purchase and sale agreement with NSTECH MK LTDA, providing for the sale of its entire equity interest in Sinlog Tecnologia em Logística S.A. The transaction was completed on May 2, 2023, for R$45,000, divided into three equal installments, the first of which was received on the same date and the remaining installments to be received annually, restated by 100% of the CDI. This operation generated a gain in the Company's profit or loss in the amount of R$14,884, registered in other operating income (expenses), net, explanatory note 21.
ISSUANCE OF SENIOR NOTES 2030
On June 20, 2023, the Company issued a senior Notes offer in the total volume of US$550,000 equivalent to R$2,668,380, through its wholly owned subsidiary Cosan Luxembourg S.A ("Cosan Luxembourg"). The issuance of senior Notes occurred an annual interest rate of US$ + 7.50%, with maturity in June 2030 and payment of half-yearly interest.
ISSUANCE OF DEBENTURES
On April 20 and June 20, 2023, Cosan issued two debentures, not convertible into shares, in the total principal amount of R$1,000,000 each in a single series that bears interest at a rate equal to DI plus 2.4% per year maturing in April and June 2028, respectively, principal due upon maturity and interest paid semiannually.
ADDITION OF RIGHT OF USE – FRSU COMPASS S.A CONTRACT
On July 1, 2023, the subsidiary Compass effected the addition as Right of Use of the contract related to the chartering of the floating storage and regasification unit (“FRSU”) in the amount of R$1,510,810 with consideration in the rental liability as explanatory notes 11.4. Right of use and 5.5. Rental liabilities. The leased asset will be used for reception, storage and regasification of LNG ("Liquefied Natural Gas") at TRSP - LNG Regasification Terminal of São Paulo S.A. ("TRSP"). The term of the contract is 10 years with reasonable certainty of extension for two periods of 5 years, that is, the term of lease of this right of use was considered until June 2043.
TREND OFFER SENIOR NOTES 2027
On July 18, 2023, the subsidiary Cosan Luxembourg S.A. concluded the tender-offer of the 2027 senior notes with the repurchase of debt securities in the amount of US$250,000 thousand equivalent to R$1,201,000 in aggregate principal value, with payment of accrued interest of US$8,069 thousand equivalent to R$38,763 and a prize of US$7,500 thousand equivalent to R$36,030.
ISSUE OF DEBENTURES RUMO S.A.
On September 15, 2023, the subsidiary Rumo raised R$1,500,000 with the 17th issuance of simple debentures, not convertible into shares, of the unsecured type, divided into two series, the first of which has an amount of R$750,000, with IPCA+5.76% rate and 6-year term, while the second is R$750,000 with IPCA+6.18% rate and 10-year term. Both series will have semiannual interest payments and 100% principal amortization upon maturity. The funds from this fundraising will be used for investment. These debentures have the same restrictive financial clauses (“financial covenants”) as other debts and ESG commitments, as shown in note 5.1.
Explanatory Notes to the Financial Statement
(In thousands of Reais, except when otherwise indicated)
EXPORT CREDIT NOTE - RUMO
On July 7, 2023, the subsidiary Rumo obtained an Export Credit Note (“NCE”), in the amount of R$725,000, equivalent to USD150,000 thousands, with maturity in 18 months, quarterly amortization and cost of SOFR + 1.30%. Along with the debt, a Swap was contracted to transform the cost of debt to 108.9% of the CDI.
REALIZATION OF DEFERRED REVENUE
On July 1, 2022, the indirect subsidiary Compass Comercialização S.A. (“Compass Comercialização”) signed a contractual instrument for the cancellation of Liquefied Natural Gas (“LNG”) charges with deliveries planned with external suppliers for 2023. In return, a financial compensation was agreed between the parties whose receipt was initially recorded in the balance sheet of Compass Comercialização in the deferred revenue item. On July 13, 2023, after the fulfillment of all remaining performance obligations, the recognition was made under the heading of other operating revenues of the amount of R$923,214, being R$845,233 related to the instrument mentioned above and R$77,981 related to the recognition of bonus received, see note 22.
INTERNALIZATION OF SENIOR NOTES 2030
On September 29, 2023, the Company internalized the remaining resources arising from the 2030 senior notes, through the issuance of debentures by Cosan S.A., referenced in US dollars in the amount of R$1,491 million (equivalent to US$300,000 thousand), with coupon annual rate of 16.04% per year for first interest payment and 8.02% per year for the others. In return, Cosan Luxembourg contracted a Total Return Swap (“TRS”) with the same amount and counterparty in US dollars, with semi-annual payment frequency and annual remuneration of 15.52% per year for the first interest remuneration and 7.50% per year for the others, which has the issue of debentures as its underlying asset. For more information see note 5.4 (e).
INTERNALIZATION OF SENIOR NOTES 2029
In July 2019, Cosan Limited (“Cosan Limited”) held a senior Notes offer for a total volume of US$750,000, equivalent to R$4,147,650 with a 5.5% coupon and expiry date 2029 ("Bond 2029").
The Company evaluated alternatives for an Internalization of senior Notes debt and in December 2023 carried out the internalization operation with Banco Santander acquiring a position in a Total Return Swap (“TRS”) with Banco Santander (Brazil) S.A. Grand Cayman Branch (“Santander Cayman”), which will have as underlying asset foreign exchange debentures, referenced in USD, issued by the Company, in the amount of US$598,000, equivalent to R$2,916,206,800, pursuant to Resolution CVM 160 (“Debentures”) which were fully subscribed by Banco Santander (Brazil) S.A. (“Santander”), and with this the total liquidation of the intercompany was carried out, remitting the recourse to Cosan Lux, and acquiring the position of TRS.
PARTIAL SPLIT COMMIT AND ASSET HELD FOR SALE
On October 9, 2023, the partial split of the indirect subsidiary Commit Gas S.A. ("Commit") was approved for a new company called Norgás S.A. ("Norgás"). The split is composed of Commit’s shareholding in the following companies: Companhia de Gás do Ceará ("CEGÁS"), Companhia Potiguar de Gás ("POTIGÁS"), Gás de Alagoas S.A. ("ALGÁS"), Sergipe Gás S.A. ("SERGÁS") and Companhia Pernambucana Gás ("). The subsidiary Compass Gas e Energia holds 51% of Norgás’s shareholding, the same percentage it holds in Commit, without altering the shareholding in the companies.
The occurrence of this event reinforces Compass' strategy of divestiture of its stake in Norgás, and with this, on the same date these investments for balance sheet purposes were classified as 'asset and liability maintained for sale' and for the purpose of demonstrating the result were classified as 'discontinued operation'. For more details see explanatory note 8.
ACQUISITION OF 51% EQUITY INTEREST IN BVP.
On October 20, 2023, Compass Comercialização completed the acquisition of control of 51% of Biometano Verde Paulínia S.A. (“BVP”). For more details see explanatory note 9.2.
Explanatory Notes to the Financial Statement
(In thousands of Reais, except when otherwise indicated)
MOOVE CORPORATE REORGANIZATION
During the third quarter of 2023, the Management of the subsidiary Moove approved the execution of a corporate reorganization consisting of the creation of a new entity in the Cayman Islands, Moove Lubricants Holdings – “MLH”, and the subsequent transfer of all assets of the current holding company of the Moove Group, Cosan Lubes Investments – “CLI”, for the new entity. The new entity will become the holding company of the Moove Group and the CLI will be liquidated. The reorganization is expected to be carried out throughout the fourth quarter of 2023.
2ND ISSUANCE OF DEBENTURES LINKED TO ENVIRONMENTAL, SOCIAL AND GOVERNANCE ("ESG") GOALS
On November 1, 2023, the subsidiary Compass issued simple and non-convertible debentures, in the amount of R$ 1,736,385 with semiannual remuneration equivalent to CDI + 1.55% per year and maturities on November 1, 2029 (50%) and November 1, 2030. The proceeds from the issuance will be used for investments and increased working capital.
This 2nd issuance of debentures is linked to ESG Goals of:
| (i) | Biomethane distributed volume (thousands of m³): Increase the daily volume distributed by 50 times in 2022 by 2027, reaching 0.25mln/m³ day. | |
| (ii) | Diversity in Leadership Positions: Reach 47% of people in leadership composed of Diversity Groups by 2027. |
The subsidiary Compass will suffer a step-up of 12.5 basis points for each target that is not met, which would increase the rate as of April 2028 (verification date) to up to CDI + 1.85% per year.
COSAN'S EIGHTH ISSUANCE OF DEBENTURES
On November 8, 2023, the Board of Directors of Cosan S.A. approved the public offering of the 8th issuance of simple debentures, under a firm placement guarantee, not convertible into shares, of the unsecured type, in a single series. The issuance will be in the total amount of R$ 1,250,000, with semiannual interest at a rate equal to DI plus a spread of 1.80% per year and principal maturity on January 21, 2031, with partial straight-line amortization on January 21, 2030, and on the maturity date. The net proceeds from the Issuance will be allocated to the ordinary management of the Company's business.
ISSUE OF COMMERCIAL BANKNOTES
On December 14, 2023, the Board of Directors of Cosan S.A. approved the public offering of the 4th issuance of commercial notes, in two tranches. The first tranche has a total value of R$550,000, charges interest at a rate equal to the DI plus a spread of 1.75% and matures on December 27, 2028. The second tranche has a total principal value of R$450,000, charges interest at a rate equal to the ID plus a 1.80% spread and matures on 30 January 2031, with partial linear amortization on 30 January 2030 and the maturity date. The net resources obtained with the Issuance will be destined for the ordinary management of the Company’s business.
Explanatory Notes to the Financial Statement
(In thousands of Reais, except when otherwise indicated)
ASSET HELD FOR SALE - TUP PORTO SÃO LUÍS S.A
The Company has carried out studies for the sale of Porto and is committed to the asset sale plan, which is expected to qualify as completed within one year. In view of this, the Company reclassified to active for sale for the year ending December 31, 2023.
IMPACT OF INTERNATIONAL CONFLICTS
After the outbreak of war in Ukraine in late February 2022, several countries-imposed sanctions on Russia, Belarus and certain regions of Ukraine. There has been an abrupt shift in the geopolitical situation, with uncertainties about the duration of the conflict, changes in the scope of sanctions and retaliatory actions, including new laws. These new circumstances limit the freedom of operation of Cosan Group companies in the Russian region and lead to a distortion and volatility in the level of activity. The war also contributed to increased volatility in foreign exchange markets, energy prices, raw materials and other input costs, as well as supply chain tensions and increased inflation in many countries.
Risks related to cybersecurity, loss of reputation, possible additional sanctions, export controls and other regulations (including restrictions on the transfer of funds to and from Russia) have increased. The ongoing war may continue to affect production and consumer demand. The Cosan Group assessed the consequences of the war on the Financial Statements, mainly considering the impacts on major judgments and significant estimates in addition to the operations that may be affected, such as:
| i. | Transported volume of fertilizers. | |
| ii. | Production of sugar cane due to unfavorable conditions for obtaining fertilizer. | |
| iii. | Rising oil prices, as a result of a more limited supply of Russian oil, can lead to a decrease in our margins and a pressure on the costs of acquiring basic inputs such as diesel oil; | |
| iv. | Debt and capital of third parties for our financing and investment activities, impacted by the measures of the Brazilian government and the Central Bank of Brazil to contain inflation, such as the increase of the basic interest rate. | |
| v. | Purchase of railway tracks by Rumo: although Rumo is able to obtain railway tracks from other non-Russian suppliers the prices charged and the deadlines required by these suppliers may be unfavorable in relation to the commercial conditions practiced in the past. |
Additionally, the Company has been monitoring the aftermath of the conflict in Israeli territory, especially in the context of volatility in the prices of natural gas oil commodities, exchange rate fluctuation and interest rates. So far, there have been no impacts on the annual financial statements. The Cosan Group will continue to monitor the facts about the conflicts, with a view to potential impacts on the business and, consequently, on the financial statements.
3.1. DECLARATION OF CONFORMITY
These individual and consolidated financial statements were prepared and are being presented in accordance with Brazilian accounting practices, which include the Brazilian Corporate Law, the rules of the Brazilian Securities Commission ("CVM"), and the pronouncements of the Accounting Pronouncements Committee (Comitê de Pronunciamentos Contábeis ("CPC")), as well as international accounting standards (International Financial Reporting Standards, or "IFRS") issued by the International Accounting Standards Board (“IASB”).
The presentation of individual and consolidated Value-Added Statements (“VAS”) is required by Brazilian corporate law and by the accounting practices adopted in Brazil applicable to publicly traded companies CPC 09 – Value Added Statements. The IFRS standards do not require the presentation of this statement. As a result, under the IFRS, this statement is presented as supplementary information, notwithstanding the financial statements as a whole.
Only the material information in the financial statements is hereby disclosed, and it corresponds to those used by Management in its management.
Explanatory Notes to the Financial Statement
(In thousands of Reais, except when otherwise indicated)
These financial statements were authorized for issue by the Board of Directors on May 28, 2024, and are being restated to replace those originally issued on April 26, 2024, due to the resolution of the audit scope limitation of the foreign legal entities located in the United Kingdom and the United States of America, linked to the Moove segment and include, in addition, updates and improved disclosures as follows: (i) deletion of note 4.4 - Additional information to the Moove segment, which was removed as it is no longer applicable, and (ii) addition of note 9.4 - Investments in Associates with Significant Influence; (iii) complement of subsequent events occurring from April 27 to May 28, 2024; (iv) adjustments in note 5.6 of opening debts referring to fair value on December 31, 2023 and adjustment of accumulated value; and (v) reclassification between lines in note 4.1 and note 19, both referring to the Moove segment.
Moove made the reclassifications below, motivated by the initial adoption and aimed at more accurately reflecting its operating performance:
Note 4.1 – Net Sales by Segment
| 12/31/2023 (Restated) |
| Reclassification |
| 12/31/2023 |
Reported segment |
|
|
|
|
|
|
|
|
|
|
|
Moove |
|
|
|
|
|
Finished product | 8,520,267 |
| 1,040,117 |
| 7,480,150 |
Base oil | 765,408 |
| (7,224) |
| 772,632 |
Services | 792,951 |
| (1,032,893) |
| 1,825,844 |
| 10,078,626 |
| — |
| 10,078,626 |
| 12/31/2022 (Restated) |
| Reclassification |
| 12/31/2022 |
Reported segment |
|
|
|
|
|
|
|
|
|
|
|
Moove |
|
|
|
|
|
Finished product | 8,050,310 |
| (43,906) |
| 8,094,216 |
Base oil | 596,443 |
| — |
| 596,443 |
Services | 333,324 |
| 43,906 |
| 289,418 |
| 8,980,077 |
| — |
| 8,980,077 |
Explanatory Notes to the Financial Statement
(In thousands of Reais, except when otherwise indicated)
Note 19 – Net Sales
|
|
| Consolidated | ||||
| 12/31/2023 (Restated) |
| Reclassification |
| 12/31/2023 | ||
At a point in time |
|
|
|
|
| ||
Natural gas distribution | 15,737,450 |
| — |
| 15,737,450 | ||
Lubricants, base oil and other | 9,285,675 |
| 1,032,893 |
| 8,252,782 | ||
Lease and sale of property | 743,411 |
| — |
| 743,411 | ||
Electricity trading | — |
| — |
| — | ||
Other | 538,445 |
| — |
| 538,445 | ||
| 26,304,981 |
| 1,032,893 |
| 25,272,088 | ||
Over time |
|
|
|
|
| ||
Railroad transportation services | 10,379,017 |
| — |
| 10,379,017 | ||
Construction revenue | 1,494,141 |
| — |
| 1,494,141 | ||
Container operations | 558,699 |
| — |
| 558,699 | ||
Other services | 792,951 |
| (1,032,893) |
| 1,825,844 | ||
| 13,224,808 |
| (1,032,893) |
| 14,257,701 | ||
|
|
|
|
|
| ||
Eliminations | (61,292) |
| — |
| (61,292) | ||
|
|
|
|
|
| ||
Total net sales | 39,468,497 |
| — |
| 39,468,497 | ||
|
|
| Consolidated | ||||
| 12/31/2022 (Restated) |
| Reclassification |
| 12/31/2022 | ||
At a point in time |
|
|
|
|
| ||
Natural gas distribution | 17,854,412 |
| — |
| 17,854,412 | ||
Lubricants, base oil and other | 8,646,753 |
| (43,906) |
| 8,690,659 | ||
Lease and sale of property | 834,616 |
| — |
| 834,616 | ||
Electricity trading | 238,544 |
| — |
| 238,544 | ||
Other | 418,847 |
| — |
| 418,847 | ||
| 27,993,172 |
| (43,906) |
| 28,037,078 | ||
Over time |
|
|
|
|
| ||
Railroad transportation services | 9,503,965 |
| — |
| 9,503,965 | ||
Construction revenue | 1,217,818 |
| — |
| 1,217,818 | ||
Container operations | 337,543 |
| — |
| 337,543 | ||
Other services | 333,324 |
| 43,906 |
| 289,418 | ||
| 11,392,650 |
| 43,906 |
| 11,348,744 | ||
|
|
|
|
|
| ||
Eliminations | (63,036) |
|
|
| (63,036) | ||
|
|
|
|
|
| ||
Total net sales | 39,222,786 |
| — |
| 39,222,786 | ||
|
|
|
|
|
| ||
These new financial statements do not include any changes to the balance sheet, income statement, comprehensive income, shareholders' equity and cash flow previously disclosed.
Explanatory Notes to the Financial Statement
(In thousands of Reais, except when otherwise indicated)
3.2 MATERIAL ACCOUNTING POLICIES
Accounting policies are included in the explanatory notes, except for those described below:
FUNCTIONAL CURRENCY AND FOREIGN CURRENCY
The individual and consolidated financial statements are presented in Reais, which is the functional currency of the Company, its subsidiaries and joint ventures in Brazil, because it is the currency of the primary economic environment in which they operate, consume, and generate resources. The main functional currencies of the subsidiaries located outside Brazil are the US Dollar, the Euro or the Pound Sterling. Unless otherwise specified, all balances have been rounded to the nearest thousand.
Monetary assets and liabilities denominated and calculated in foreign currencies at the balance sheet date are converted into the functional currency using the current foreign exchange rate. Non-monetary assets and liabilities measured at fair value in a foreign currency are converted into the functional currency using the foreign exchange rate in effect on the date the fair value was determined. Non-monetary items measured in a foreign currency based on historical cost are converted at the foreign exchange rate on the transaction date. Foreign currency differences resulting from conversions are generally accounted for in profit or loss.
Assets and liabilities arising from international operations, including goodwill and fair value adjustments resulting from the acquisition, are converted into Reais at the balance sheet date using the foreign exchange rates in effect at the time. Income and expenses from international operations are converted into Reais using the foreign exchange rates in effect on the dates of the transactions.
Foreign currency differences are recognized and presented in other comprehensive income in equity. However, if the foreign operation is a non-wholly owned subsidiary, then the relevant proportion of the translation difference is allocated to non-controlling interests. When a foreign operation is disposed of such control, loss or significant influence is lost, the amount accumulated in the translation reserve related to that foreign operation is reclassified to financial result as part of the gain or loss on disposal.
The following table presents the foreign exchange rate, expressed in Reais for the years indicated, as informed by the Central Bank of Brazil (“BACEN”):
Currency | 12/31/2023 | 12/31/2022 | ||
Dollar (USD) | BRL 4.84 | BRL 5.22 | ||
Pound Sterling (£) | BRL 6.16 | BRL 6.28 | ||
Euro (€) | BRL 5.35 | BRL 5.57 | ||
Yen (¥) | BRL 0.03 | BRL 0.04 |
USE OF JUDGMENTS AND ESTIMATES
Management used judgments and estimates in preparing these financial statements, which affect the application of Cosan Group's accounting policies as well as the reported amounts of assets, liabilities, income, and expenses. Actual results may differ from these estimates.
Explanatory Notes to the Financial Statement
(In thousands of Reais, except when otherwise indicated)
Underlying estimates and assumptions are continually reviewed and recognized prospectively, when applicable. The following explanatory notes contain information on critical judgments, assumptions, and estimates of uncertainties in the application of accounting policies that have a greater impact on the amounts recognized in the financial statements:
- Note 1.1 – Stake in Vale S.A.
- Note 5.5 – Lease Liabilities
- Note 5.7 – Accounts receivable from customers
- Note 5.10 – Sectorial financial assets and liabilities
- Note 5.11 - Fair value measurement
- Note 9.2 – Acquisition of subsidiaries
- Note 10 – Investments in joint venture
- Notes 11.1 and 11.2 – Fixed assets, intangible assets and goodwill
- Notes 11.5 – Investment properties
- Note 12 – Commitments
- Note 15 – Income tax and social contribution
- Note 16 – Provision for legal expenses
- Note 23 – Post-employment benefit obligations
- Note 24 – Share-based compensation
3.3 ACCOUNTING IMPACTS RELATED TO ENVIRONMENTAL, SOCIAL AND GOVERNANCE INITIATIVES (“ESG”)
In June 2023, the International Sustainability Standards Board (“ISSB”) issued IFRS S1 - General Requirements for Disclosure of Sustainability-Related Financial Information and IFRS S2 - Climate-Related Disclosures, which provide new disclosure requirements on, respectively, sustainability-related risks and opportunities and specific climate-related disclosures.
The Company is taking the necessary steps to comply with the standard whose adoption is necessary for years starting from January 1, 2026, in accordance with CVM Resolution 193 issued in October 2023.
Company Initiatives
Promoting more transparent management, we will publish for the first time the Integrated Report of Cosan S.A. in 2024 for the 2023 financial year in accordance with CVM Resolution No. 014 on Integrated Report. We also consider the guidelines of the GRI Standard 2021, indicators from the Sustainable Accounting Standards Board (“SASB”) and the recommendations of the Task force on Climate-related Financial Disclosures (“TCFD”).
The Company is committed to integrating sustainability into its business through a strategy called “Visão ESG 2030 Cosan” with a long-term vision structure, which was passed on to all companies in the group, bringing together objectives and drivers that will guide the environmental, social and governance performance of the entire Group for the coming years.
The actions within the Company's strategy with ESG initiatives are evaluated and monitored within the context of critical accounting judgments and the Company's main estimates, and future changes in the global scenario may have impacts on the result and accounting balances of assets and liabilities of the Company in subsequent fiscal years. For the year ending December 31, 2023, the Company assessed potential climate and social impacts in the main critical estimates and no material impacts were identified.
Cosan began a process of reassessing its materiality and defining priority themes for the Company. After a careful process that involved conversations with internal and external stakeholders, studying benchmarks, analyzing ESG ratings and rankings and debugging the most important material topics for our company and our business, we arrived at the result of our materiality matrix. This construction was based on the concept of dual materiality, ensuring compliance with the best market practices.
Explanatory Notes to the Financial Statement
(In thousands of Reais, except when otherwise indicated)
The year 2023 was dedicated to consolidating and advancing the governance and management of the “ESG 2030 Cosan Vision”, which brings together our Objectives and Directors that will guide the environmental, social and governance performance of the entire Group for the coming years, starting a transformation project to generate value for all related parties, with 5 main objectives:
| 1. | Corporate Governance: (i) Comply with best governance and transparency practices; (ii) Be a reference in ESG Management and Communication | |
| 2. | Climate Change: (iii) Manage and reduce greenhouse gas emissions and offer paths for a safe energy transition; (iv) Carry out scenario analysis and adaptation plan to climate risks. | |
| 3. | Diversity, Equity and Inclusion: (v) Foster a safe, diverse, equitable and inclusive work environment; (vi) Ensure continuous evolution in the Diversity, Equity and Inclusion. | |
| 4. | Positive Social Impact: (vii) Generate positive social impact on communities and society; (viii) Promote Social Investment. | |
| 5. | People Safety: (ix) Promote the safety of people involved in operations; (x) Be a reference on the topic. |
The report on progress on each front of the “ESG 2030 Vision” is available in Cosan’s Integrated Report.
Environmental and Climate Pillar
In general, we recognize the relevance that our portfolio plays in implementing and accelerating the issue of Climate Change. By investing in Brazil's potential, we offer fundamental opportunities in this transformation, through the solid and already established infrastructure of our businesses, and through the development of low-carbon alternatives for various sectors of the economy.
We built our portfolio to combine our management expertise with high potential sectors and exposure to decarbonization and energy transition in Brazil and around the world. Each company in the portfolio plays a fundamental role in enabling the energy transition, so the way we operate allows for the gradual replacement of fossil fuels, by mixing with fuels from renewable sources and proactively offering low-carbon products and solutions. In this way, we contribute to advances in the energy transition in Brazil in a phased, safe and economically viable manner, using existing infrastructure.
The ethanol produced by Raízen is less polluting than gasoline and appears as an alternative in the decarbonization of sectors in which emissions are difficult to abate (hard-to-abate sectors). Rumo's operation of trains used to transport agricultural commodities emits 7x less greenhouse gases into the atmosphere than trucks. The gas distribution operation, linked to Compass' operations, is essential to replace coal and ensure a safe energy transition, as well as the opportunities presented with biomethane. The manufacture of Moove lubricants allows you to improve productivity at a low cost, both in vehicles and industrial plants.
The farmland portfolio consists of three managers: Radar, Tellus and Janus. Radar, focused on environmental preservation since its creation in 2008, seeks the best land to lease to prominent producers, such as Raízen. The companies manage around 320 thousand hectares, and in the last five years, an average of 200 hectares per year have been restored, totaling approximately 1,000 hectares.
Since 2019, all our businesses have been taking inventory of their greenhouse gas (GHG) emissions. The mapping is carried out in accordance with the guidelines of the Greenhouse Gas Protocol and its national version, the Brazilian GHG Protocol Program. In 2023, once again, Raízen, Rumo, Compass and Moove were recognized by GHG with the Gold seal, awarded to companies that meet all transparency criteria in publishing their emissions data and submit them to verification by an independent institution. Ensuring continuous evolution in emissions management, in 2023, we carried out a study of recommendations for improving the process of all GHG inventories of portfolio companies, ensuring alignment with the best practices existing in the market.
We remain committed to reducing the carbon footprint of our portfolio, through the continuous search for efficiency, productivity and innovation in our operations.
Explanatory Notes to the Financial Statement
(In thousands of Reais, except when otherwise indicated)
Social Pillar
For Cosan, valuing diversity and promoting inclusion reaffirm the power of the people who make Cosan happen, in this context, the “ESG 2030 Vision” brought clear diversity, equity and inclusion (DEI) goals included in Cosan's growth ambitions and of the portfolio.
The main diversity indicator monitored by Cosan is that of women in leadership and is connected to a public commitment made by the Company and all its companies. The target is applicable to the manager, the Company's Board of Directors and all businesses. An important sign of adherence to the commitment is that both Cosan, Rumo and Raízen, companies in their ecosystem, already have two or more women on their Boards of Directors (at Rumo, there are three). The Company's other companies are also moving to expand their participation.
All initiatives carried out demonstrate a consistent and intentional trajectory of evolution of the topic. This is evident and materialized with Cosan's recognition and entry into B3's iDiversa index.
Social responsibility is a strategic pillar of the Company. All companies in Cosan's portfolio have long-term community relationship programs surrounding their operations. We understand that in addition to creating jobs and increasing tax collection in municipalities and local businesses, we can and must take on an even greater responsibility: generating a significant social impact on communities, leaving a positive legacy.
Corporate Governance and Transparency Pillar
Since 2022 through the ESG 2030 Vision, the Company has developed an additional layer of governance for the ESG management of the portfolio.
In this way, the management of the socio-environmental and climate agenda is directly supervised by Cosan's Board of Directors through the Strategy and Sustainability Committee.
The body is responsible for monitoring the ESG strategy, commitments and goals, as well as promoting broad debate on trends involving the topic such as climate change, diversity and inclusion, and stakeholder engagement. The Board of Directors considers the impacts of the Company and its subsidiaries on society and the environment when approving the strategies of their respective businesses and acts to maintain the alignment of policies and best practices in all businesses it controls, ensuring the necessary autonomy to portfolio companies. The Strategy and Sustainability Committee reports to the Board of Directors on the Company's progress related to sustainability and compliance with the Cosan ESG 2030 Vision plan.
Furthermore, the Company created the Sustainability Committee, an important governance body formed by Cosan and business sustainability teams and leaders. The Commission is responsible for implementing and monitoring the commitments and goals assumed, presenting the status of each of them to the Group's senior management, promoting debate on trends in the ESG agenda - dialoguing with different actors and proposing agendas to be taken to the Committee of Cosan's Strategy and Sustainability, as well as identifying synergies and promoting the exchange of experiences between the group's companies.
To develop best market practices and improve our performance in ESG reporting, as well as engaging senior leadership in the agenda, the variable remuneration of the Company's executives and other employees is made up of ESG metrics determined based on performance analysis. of our companies in market indices and ratings that are highly relevant to various stakeholders, including our investors and shareholders. The variable remuneration also considers strategic projects, composed of the Group's information security maturity and internal control maturity.
In this way, we guarantee that the management of socio-environmental and climate issues are interconnected with the business strategy and with the objective of boosting Brazil's potential.
Explanatory Notes to the Financial Statement
(In thousands of Reais, except when otherwise indicated)
Risks
The risks arising from climate change in our business operations translate into financial and strategic risks for Cosan, which may affect the growth strategy and expected returns of our portfolio. Additionally, they can enhance other risks already identified in our monitoring.
In this way, mapping risks and opportunities related to climate change in our business becomes a central part of our Sustainability Strategy - Vision 2030, boosting our understanding and compliance with the recommendations of the Taskforce on Climate-Related Financial Disclosures (Taskforce on Climate -related Financial Disclosures – TCFD).
In 2023, we worked on improving, across our entire portfolio, the process of identifying, evaluating and managing risks and opportunities related to Climate Change, incorporating the monitoring of these risks into the formal risk management process of our portfolio. Additionally, based on an in-depth study, we developed a specific climate risk matrix for each company. These matrices were integrated both into the general risk matrix of each business and, in a consolidated manner, into Cosan's matrix.
Debt contracts with ESG clauses
The 2028 Senior Notes from the subsidiary Rumo were the first green issuance in the freight railway sector in Latin America. Rumo is committed to using resources to fully or partially finance ongoing and future projects that contribute to the promotion of a low-carbon transport sector with efficient use of resources in Brazil. Eligible projects are distributed in the areas of “Acquisition, replacement and updating of rolling stock”, “Infrastructure for duplication of railway sections, new yards and yard extensions”, and “Railroad modernization”. The company annually issues a report demonstrating the progress of the projects, which can be accessed directly on the investor relations page.
Rumo's Senior Notes 2032 was an issue in Sustainability-Linked Bonds (SLBs), with the following sustainable goals: 17.6% reduction in tons of direct greenhouse gas emissions per useful kilometer (TKU) by 2026, having 2020 as a reference. The company is subject to a step-up of 25 basis points from July 2027 if it does not reach this target, which would increase the interest rate to 4.45% per year.
The 2nd Debenture of Malha Paulista is linked to the sustainable goal of reducing greenhouse gas emissions by TKU by 15% by 2023, starting with the base date of December 2019. The Company will benefit from a stepdown of 25 Basis points in each series if it reaches this goal, which would reduce the rate from 2024 to CDI + 1.54% in the 1st series and IPCA + 4.52% in the 2nd series. As disclosed in note 25 of Subsequent Events, in April 2024 compliance with the condition for the Rate Step Down was verified and the company will benefit from the next capitalization period.
Rumo S.A.'s 17th Debenture is linked to the sustainable goal of reducing (i) 17.6% of tons of direct greenhouse gas emissions per useful kilometer (TKU) by 2026; and (ii) 21.6% until 2030, using 2020 as a reference. The company is subject to a step-up of 25 basis points in both series if it does not reach the targets.
On November 1, 2023, the subsidiary Compass issued simple, non-convertible debentures, in the amount of R$1,736,385 with semi-annual remuneration equivalent to CDI + 1.55% per year. and maturities on November 1, 2029 (50%) and November 1, 2030. The resources obtained from the issue will be used for investments and reinforcement of working capital. This 2nd issue of debentures is linked to ESG Targets of: (i) Distributed volume of Biomethane (thousands of m³): Increase the daily volume distributed by 50 times in 2022 until 2027, reaching 0.25mln/m³ day; (ii) Diversity in Leadership Positions: Reach 47% of people in leadership composed of Diversity Groups by 2027. The Compass subsidiary will undergo a step-up of 12.5 basis points for each target that is not achieved, which would increase the rate from April 2028 (verification date) for up to CDI + 1.85% per year.
Explanatory Notes to the Financial Statement
(In thousands of Reais, except when otherwise indicated)
3.4 RECLASSIFICATION IN THE INCOME STATEMENT
ARSESP, through deliberation 1,205 of August 18, 2021, NTF-044-2021, published a new Regulatory Accounting Manual and Chart of Accounts for the piped gas distribution sector for companies on its regulation with applicability from the 2023 financial year.
According to the technical note mentioned above, ARSESP determines that the accounting of variations, positive and negative, between the price included in the tariffs and that actually paid by the concessionaire to the supplier, which are periodically passed on to users through graphical accounts, must be recorded in the net operating revenue group. The accounting policy usually applied by the subsidiary Compass is consistent with the understanding of the essence of the operation, classifying the effects of the Regulatory Current Account (“CCR”) in its gross profit, but with allocations in the cost group of products sold and services provided. In addition, the document also mentions that the classification of expenses and costs may vary in relation to commonly adopted practices in which part of the administrative expenses are also admitted as costs of operations related to piped gas distribution services.
The indirect subsidiary Comgás voluntarily reassessed the way in which the classification of CCR effects and general and administrative expenses is presented, as it understands that such presentation will meet the requirements of ARSESP and OCPC08, providing more consistent information in consolidations aligned with the practices adopted by the group. These reclassifications do not impact the main indicators, such as profit for the year and equity, used by the indirect subsidiary Comgás and other Compass gas distributors.
The application of the change in accounting policy generated the following reclassification in the income statement in the comparative year:
|
| Consolidated | ||||
|
| 12/31/2022 (As stated) |
| Reclassification |
| 12/31/2022 (Restated) |
Net operating revenue |
| 39,737,368 |
| (414,582) |
| 39,322,786 |
Cost of goods sold and services provided |
| (30,753,137) |
| 196,318 |
| (30,556,819) |
Gross profit |
| 8,984,231 |
| (218,264) |
| 8,765,967 |
|
|
|
|
|
|
|
Selling expenses |
| (1,276,279) |
| — |
| (1,276,279) |
General and administrative expenses |
| (1,976,331) |
| 218,264 |
| (1,758,067) |
Other operation income, net |
| 1,752,222 |
| — |
| 1,752,222 |
Operating result |
| (1,500,388) |
| 218,264 |
| (1,282,124) |
|
|
|
|
|
|
|
Earnings before equity income and net financial revenue |
| 7,483,843 |
| — |
| 7,483,843 |
Explanatory Notes to the Financial Statement
(In thousands of Reais, except when otherwise indicated)
The Company's senior management (the Chief Operating Decision Maker) uses segment information to evaluate the performance of operating segments and make resource allocation decisions. This information is prepared in a manner consistent with the accounting policies used in the preparation of the individual and consolidated financial statements. Earnings before interest, taxes, depreciation, and amortization ("EBITDA") are used by the Company to evaluate the performance of its operating segments.
Reported segments:
| i. | Raízen: operates in (i) the production, commercialization, origination, and trading of ethanol, (ii) production and commercialization of bioenergy, (iii) resale and trading of electricity, (iv) production and commercialization of other product from renewable sources (solar energy and biogas), (v) production, marketing, origination and trading of sugar and (vi) distribution and commercialization of fuels and lubricants and operations related to the Shell Select convenience store business and proximity OXXO of the Nós Group, a joint venture with FEMSA Comércio. |
| ii. | Compass: (i) distribution of piped natural gas throughout Brazil to industrial, residential, commercial, automotive, and cogeneration customers; (ii) commercialization of electricity and natural gas; (iii) development of infrastructure projects in a regasification terminal and offshore gas pipeline; and (iv) development of thermal generation projects utilizing natural gas. |
| iii. | Moove: production and distribution of licensed Mobil lubricants in Brazil, Bolivia, Uruguay, Paraguay, Argentina, the United States of American, and the European market. Additionally, under the Comma brand, it manufactures and distributes products for European and Asian markets and corporate activities. |
| iv. | Rumo: logistics services for rail transport, port storage and loading of goods, primarily grains and sugar, leasing of locomotives, wagons, and other railroad equipment, as well as operation of containers. |
| v. | Radar: A reference in agricultural property management, Radar invests in a diversified portfolio with high potential for appreciation, through participation in the companies Radar, Tellus and Janus. |
Reconciliation:
| i. | Cosan Corporate: represents the reconciliation of Cosan's corporate structure, which is composed of: (i) senior management and corporate teams, which incur general and administrative expenses and other expenses (operating income), including pre-operational investments; (ii) equity income from assets, including the interest in Vale S.A.; and (iii) financial result attributed to cash and debts of the controlling company, intermediary holding companies (Cosan Oito, Cosan Nove and Cosan Dez) and offshore financial companies, and mining projects and investment in the Climate Tech Fund, a fund managed by Fifth Wall, specialized in technologic innovation. |
Although Raízen S.A. is a joint venture registered under the equity method and is not proportionally consolidated, Management continues to review the information by segment. The reconciliation of these segments is presented in the column “Deconsolidation of jointly owned subsidiary”.
The Company reassessed its structure of segments presented as reconciliation items and added the companies Cosan Dez and Cosan Investments to the Cosan Corporative structure.
Explanatory Notes to the Financial Statement
(In thousands of Reais, except when otherwise indicated)
| 12/31/2023 | ||||||||||||||||
| Reported segments |
| Reconciliation |
| |||||||||||||
| Raízen |
| Compass |
| Moove |
| Rumo |
| Radar |
| Cosan Corporate |
| Deconsolidation of Joint Ventures |
| Elimination Between Segments |
| Consolidated |
Result |
|
|
|
|
|
|
|
|
|
|
|
|
|
|
|
|
|
Net operating revenue | 221,693,298 |
| 17,767,327 |
| 10,078,626 |
| 10,937,716 |
| 743,411 |
| 2,709 |
| (221,693,298) |
| (61,292) |
| 39,468,497 |
Cost of goods sold and services provided | (202,926,764) |
| (14,256,031) |
| (7,359,606) |
| (6,838,433) |
| (153,470) |
| (3,648) |
| 202,926,764 |
| 61,292 |
| (28,549,896) |
Gross profit | 18,766,534 |
| 3,511,296 |
| 2,719,020 |
| 4,099,283 |
| 589,941 |
| (939) |
| (18,766,534) |
| — |
| 10,918,601 |
Selling expenses | (5,773,538) |
| (164,399) |
| (1,144,957) |
| (40,658) |
| — |
| (556) |
| 5,773,538 |
| — |
| (1,350,570) |
General and administrative expenses | (2,815,532) |
| (788,015) |
| (645,634) |
| (559,973) |
| (74,355) |
| (459,997) |
| 2,815,532 |
| — |
| (2,527,974) |
Other operating income (expenses), net | 1,968,248 |
| 607,226 |
| (336) |
| (100,780) |
| 2,253,803 |
| 1,164,464 |
| (1,968,248) |
| — |
| 3,924,377 |
Equity in associates’ earnings | (219,896) |
| 178,978 |
| — |
| 75,333 |
| 20,015 |
| 2,647,255 |
| 219,896 |
| (2,571,182) |
| 350,399 |
Equity income in joint ventures | — |
| — |
| — |
| 1,266 |
| — |
| 1,694,679 |
| — |
| — |
| 1,695,945 |
Financial result | (5,962,849) |
| (730,954) |
| (319,136) |
| (2,555,382) |
| 30,798 |
| (4,322,353) |
| 5,962,849 |
| — |
| (7,897,027) |
Financial expenses | (6,241,261) |
| (1,658,582) |
| (242,751) |
| (3,621,093) |
| (6,776) |
| (5,808,228) |
| 6,241,261 |
| — |
| (11,337,430) |
Financial revenue | 797,560 |
| 1,283,024 |
| 116,408 |
| 1,190,685 |
| 37,577 |
| 400,440 |
| (797,560) |
| — |
| 3,028,134 |
Foreign exchange variation | 1,240,924 |
| 152,592 |
| (155,618) |
| 368,259 |
| (3) |
| 1,412,208 |
| (1,240,924) |
| — |
| 1,777,438 |
Derivatives | (1,760,072) |
| (507,988) |
| (37,175) |
| (493,233) |
| — |
| (326,773) |
| 1,760,072 |
| — |
| (1,365,169) |
Income tax and social contribution | (1,936,598) |
| (859,311) |
| (332,090) |
| (197,174) |
| (147,636) |
| 1,261,785 |
| 1,936,598 |
| — |
| (274,426) |
Income for the year | 4,026,369 |
| 1,754,821 |
| 276,867 |
| 721,915 |
| 2,672,566 |
| 1,984,338 |
| (4,026,369) |
| (2,571,182) |
| 4,839,325 |
Profit (loss) from discontinued operations | — |
| 45,419 |
| — |
| — |
| — |
| 20,384 |
| — |
| (20,384) |
| 45,419 |
|
|
|
|
|
|
|
|
|
|
|
|
|
|
|
|
|
|
Result attributed to: |
|
|
|
|
|
|
|
|
|
|
|
|
|
|
|
|
|
Controlling shareholders | 3,863,605 |
| 1,410,630 |
| 193,888 |
| 218,886 |
| 768,162 |
| 1,094,391 |
| (3,863,605) |
| (2,591,566) |
| 1,094,391 |
Non-controlling shareholders | 162,764 |
| 389,610 |
| 82,979 |
| 503,029 |
| 1,904,404 |
| 910,331 |
| (162,764) |
| — |
| 3,790,353 |
| 4,026,369 |
| 1,800,240 |
| 276,867 |
| 721,915 |
| 2,672,566 |
| 2,004,722 |
| (4,026,369) |
| (2,591,566) |
| 4,884,744 |
Other selected information |
|
|
|
|
|
|
|
|
|
|
|
|
|
|
|
|
|
Depreciation and amortization | 8,071,288 |
| 899,635 |
| 273,772 |
| 2,175,834 |
| 275 |
| 15,427 |
| (8,071,288) |
| — |
| 3,364,943 |
EBITDA | 19,997,104 |
| 4,244,721 |
| 1,201,865 |
| 5,650,305 |
| 2,789,679 |
| 5,060,333 |
| (19,997,104) |
| (2,571,182) |
| 16,375,721 |
Additions to fixed assets, intangible assets and contract assets | 11,396,056 |
| 2,317,889 |
| 177,971 |
| 3,689,877 |
| 39,892 |
| 42,333 |
| (11,396,056) |
| — |
| 6,267,962 |
|
|
|
|
|
|
|
|
|
|
|
|
|
|
|
|
|
|
EBITDA reconciliation |
|
|
|
|
|
|
|
|
|
|
|
|
|
|
|
|
|
Income for the year | 4,026,369 |
| 1,754,821 |
| 276,867 |
| 721,915 |
| 2,672,566 |
| 1,984,338 |
| (4,026,369) |
| (2,571,182) |
| 4,839,325 |
Income taxes and social contribution | 1,936,598 |
| 859,311 |
| 332,090 |
| 197,174 |
| 147,636 |
| (1,261,785) |
| (1,936,598) |
| — |
| 274,426 |
Financial result | 5,962,849 |
| 730,954 |
| 319,136 |
| 2,555,382 |
| (30,798) |
| 4,322,353 |
| (5,962,849) |
| — |
| 7,897,027 |
Depreciation and amortization | 8,071,288 |
| 899,635 |
| 273,772 |
| 2,175,834 |
| 275 |
| 15,427 |
| (8,071,288) |
| — |
| 3,364,943 |
EBITDA | 19,997,104 |
| 4,244,721 |
| 1,201,865 |
| 5,650,305 |
| 2,789,679 |
| 5,060,333 |
| (19,997,104) |
| (2,571,182) |
| 16,375,721 |
Explanatory Notes to the Financial Statement
(In thousands of Reais, except when otherwise indicated)
| 12/31/2022 (Restated) | ||||||||||||||||
| Reported segments |
| Reconciliation |
| |||||||||||||
| Raízen |
| Compass |
| Moove |
| Rumo |
| Radar |
| Cosan Corporate |
| Deconsolidation of Joint Ventures |
| Elimination Between Segments |
| Consolidated |
Result |
|
|
|
|
|
|
|
|
|
|
|
|
|
|
|
|
|
Net operating revenue | 244,293,722 |
| 19,719,205 |
| 8,980,077 |
| 9,841,508 |
| 834,616 |
| 10,416 |
| (244,293,722) |
| (63,036) |
| 39,322,786 |
Cost of goods sold and services provided | (233,658,136) |
| (16,364,835) |
| (6,990,171) |
| (6,695,147) |
| (560,274) |
| (9,428) |
| 233,658,136 |
| 63,036 |
| (30,556,819) |
Gross profit | 10,635,586 |
| 3,354,370 |
| 1,989,906 |
| 3,146,361 |
| 274,342 |
| 988 |
| (10,635,586) |
| — |
| 8,765,967 |
Selling expenses | (5,148,014) |
| (163,256) |
| (1,072,488) |
| (30,619) |
| — |
| (9,916) |
| 5,148,014 |
| — |
| (1,276,279) |
General and administrative expenses | (2,425,318) |
| (563,466) |
| (347,591) |
| (468,574) |
| (45,535) |
| (332,901) |
| 2,425,318 |
| — |
| (1,758,067) |
Other operating income (expenses), net | 283,606 |
| (91,905) |
| 29,002 |
| 348,543 |
| 1,302,442 |
| 164,140 |
| (283,606) |
| — |
| 1,752,222 |
Equity in associates’ earnings | (119,338) |
| 98,033 |
| — |
| 40,462 |
| 20,799 |
| 3,109,119 |
| 119,338 |
| (2,849,516) |
| 418,897 |
Equity income in joint ventures | — |
| — |
| — |
| — |
| — |
| (92,179) |
| — |
| — |
| (92,179) |
Financial result | (4,105,064) |
| (377,136) |
| (101,872) |
| (2,329,035) |
| 4,106 |
| (2,353,999) |
| 4,105,064 |
| — |
| (5,157,936) |
Financial expenses | (3,010,398) |
| (1,291,850) |
| (114,249) |
| (1,521,478) |
| (3,550) |
| (1,775,408) |
| 3,010,398 |
| — |
| (4,706,535) |
Financial revenue | 811,948 |
| 898,100 |
| 75,817 |
| 1,108,620 |
| 7,656 |
| 3,687,328 |
| (811,948) |
| — |
| 5,777,521 |
Foreign exchange variation | 963,060 |
| 102,655 |
| (15,394) |
| 374,859 |
| — |
| (201,374) |
| (963,060) |
| — |
| 260,746 |
Derivatives | (2,869,674) |
| (86,041) |
| (48,046) |
| (2,291,036) |
| — |
| (4,064,545) |
| 2,869,674 |
| — |
| (6,489,668) |
Income tax and social contribution | 864,710 |
| (329,185) |
| (10,062) |
| (193,116) |
| (74,915) |
| 725,682 |
| (864,710) |
| — |
| 118,404 |
Income for the year | (13,832) |
| 1,927,455 |
| 486,895 |
| 514,022 |
| 1,481,239 |
| 1,210,934 |
| 13,832 |
| (2,849,516) |
| 2,771,029 |
Profit (loss) from discontinued operations | — |
| 49,846 |
| — |
| — |
|
|
| 17,180 |
| — |
| (17,180) |
| 49,846 |
|
|
|
|
|
|
|
|
|
|
|
|
|
|
|
|
|
|
Result attributed to: |
|
|
|
|
|
|
|
|
|
|
|
|
|
|
|
|
|
Controlling shareholders | (66,054) |
| 1,834,528 |
| 340,914 |
| 156,380 |
| 749,840 |
| 961,066 |
| 66,054 |
| (2,866,696) |
| 1,176,032 |
Non-controlling shareholders | 52,222 |
| 142,773 |
| 145,981 |
| 357,642 |
| 731,399 |
| 267,048 |
| (52,222) |
| — |
| 1,644,843 |
| (13,832) |
| 1,977,301 |
| 486,895 |
| 514,022 |
| 1,481,239 |
| 1,228,114 |
| 13,832 |
| (2,866,696) |
| 2,820,875 |
Other selected information |
|
|
|
|
|
|
|
|
|
|
|
|
|
|
|
|
|
Depreciation and amortization | 9,297,498 |
| 776,248 |
| 251,886 |
| 1,966,945 |
| 238 |
| 19,163 |
| (9,297,498) |
| — |
| 3,014,480 |
EBITDA | 12,524,020 |
| 3,410,024 |
| 850,715 |
| 5,003,118 |
| 1,552,286 |
| 2,858,414 |
| (12,524,020) |
| (2,849,516) |
| 10,825,041 |
Additions to fixed assets, intangible assets and contract assets | 9,339,898 |
| 1,659,202 |
| 109,263 |
| 2,717,745 |
| 19,212 |
| 25,952 |
| (9,339,898) |
| — |
| 4,531,374 |
|
|
|
|
|
|
|
|
|
|
|
|
|
|
|
|
| — |
EBITDA reconciliation |
|
|
|
|
|
|
|
|
|
|
|
|
|
|
|
| — |
Income for the year | (13,832) |
| 1,927,455 |
| 486,895 |
| 514,022 |
| 1,481,239 |
| 1,210,934 |
| 13,832 |
| (2,849,516) |
| 2,771,029 |
Income taxes and social contribution | (864,710) |
| 329,185 |
| 10,062 |
| 193,116 |
| 74,915 |
| (725,682) |
| 864,710 |
| — |
| (118,404) |
Financial result | 4,105,064 |
| 377,136 |
| 101,872 |
| 2,329,035 |
| (4,106) |
| 2,353,999 |
| (4,105,064) |
| — |
| 5,157,936 |
Depreciation and amortization | 9,297,498 |
| 776,248 |
| 251,886 |
| 1,966,945 |
| 238 |
| 19,163 |
| (9,297,498) |
| — |
| 3,014,480 |
EBITDA | 12,524,020 |
| 3,410,024 |
| 850,715 |
| 5,003,118 |
| 1,552,286 |
| 2,858,414 |
| (12,524,020) |
| (2,849,516) |
| 10,825,041 |
Explanatory Notes to the Financial Statement
(In thousands of Reais, except when otherwise indicated)
12/31/2023 | |||||||||||||||||
| Reported segments |
| Reconciliation |
|
| ||||||||||||
| Raízen |
| Compass |
| Moove |
| Rumo |
| Radar |
| Cosan Corporate |
| Deconsolidation of Joint Ventures |
| Elimination Between Segments |
| Consolidated |
Statement of financial position: |
|
|
|
|
|
|
|
|
|
|
|
|
|
|
|
|
|
Cash and cash equivalents | 7,915,876 |
| 3,931,532 |
| 773,552 |
| 7,233,993 |
| 39,946 |
| 2,679,458 |
| (7,915,876) |
| — |
| 14,658,481 |
Marketable securities | 349,584 |
| 800,267 |
| 77,814 |
| 1,396,107 |
| 239,361 |
| 990,412 |
| (349,584) |
| — |
| 3,503,961 |
Trade receivables | 13,438,430 |
| 1,550,973 |
| 1,101,854 |
| 556,298 |
| 234,801 |
| 710 |
| (13,438,430) |
| — |
| 3,444,636 |
Derivative financial instruments | 10,888,050 |
| 175,655 |
| — |
| 1,561,493 |
| — |
| 809,651 |
| (10,888,050) |
| — |
| 2,546,799 |
Inventories | 17,310,692 |
| 292,335 |
| 1,284,773 |
| 215,605 |
| — |
| 1 |
| (17,310,692) |
| — |
| 1,792,714 |
Sectorial financial assets | — |
| 548,700 |
| — |
| — |
| — |
| — |
| — |
| — |
| 548,700 |
Other financial assets | 103,774 |
| 2,423 |
| 690 |
| — |
| — |
| — |
| (103,774) |
| — |
| 3,113 |
Other current assets | 8,478,292 |
| 1,553,524 |
| 193,836 |
| 841,417 |
| 375,716 |
| 3,152,651 |
| (8,478,292) |
| (1,106,687) |
| 5,010,457 |
Other non-current assets | 13,957,596 |
| 1,166,991 |
| 209,823 |
| 3,528,375 |
| 14,378 |
| 3,832,013 |
| (13,957,596) |
| (180,880) |
| 8,570,700 |
Investments in associates | — |
| 1,630,124 |
| 2 |
| 312,302 |
| 88,656 |
| 32,792,891 |
| — |
| (17,212,606) |
| 17,611,369 |
Investments in joint ventures | 1,321,982 |
| — |
| — |
| 48,566 |
| — |
| 11,693,876 |
| (1,321,982) |
| — |
| 11,742,442 |
Biological assets | 3,818,316 |
| — |
| — |
| — |
| — |
| — |
| (3,818,316) |
| — |
| — |
investment properties | — |
| — |
| — |
| — |
| 15,976,126 |
| — |
| — |
| — |
| 15,976,126 |
Contract assets | 3,108,696 |
| 1,041,421 |
| 10,684 |
| — |
| — |
| — |
| (3,108,696) |
| — |
| 1,052,105 |
Right-of-use assets | 9,645,522 |
| 1,588,292 |
| 195,953 |
| 7,703,754 |
| 3,319 |
| 22,200 |
| (9,645,522) |
| — |
| 9,513,518 |
Fixed assets | 30,144,420 |
| 1,255,012 |
| 755,955 |
| 19,176,386 |
| 24 |
| 52,597 |
| (30,144,420) |
| — |
| 21,239,974 |
Intangible assets | 9,677,254 |
| 13,299,255 |
| 2,679,983 |
| 6,664,143 |
| — |
| 6,906 |
| (9,677,254) |
| — |
| 22,650,287 |
Loans, borrowings and debentures | (39,634,986) |
| (10,017,150) |
| (2,207,028) |
| (18,964,841) |
| — |
| (25,715,635) |
| 39,634,986 |
| — |
| (56,904,654) |
Derivative financial instruments - liabilities | (7,870,706) |
| (360,784) |
| (742) |
| (1,471,795) |
| — |
| (1,581,824) |
| 7,870,706 |
| — |
| (3,415,145) |
Suppliers | (20,150,654) |
| (1,534,041) |
| (1,494,568) |
| (1,084,931) |
| (68,422) |
| (2,563) |
| 20,150,654 |
| — |
| (4,184,525) |
Employee benefits payables | (966,452) |
| (301,560) |
| (147,313) |
| (318,550) |
| — |
| (61,906) |
| 966,452 |
| — |
| (829,329) |
Sectorial financial liabilities | — |
| (1,810,698) |
| — |
| — |
| — |
| — |
| — |
| — |
| (1,810,698) |
Other current liabilities | (10,642,734) |
| (1,703,128) |
| (336,080) |
| (1,583,216) |
| (182,298) |
| (1,239,688) |
| 10,642,734 |
| 571,201 |
| (4,473,209) |
Lease liabilities | (11,304,874) |
| (1,636,943) |
| (198,964) |
| (3,406,843) |
| (3,502) |
| (29,542) |
| 11,304,874 |
| — |
| (5,275,794) |
Other non-current liabilities | (12,284,662) |
| (2,678,578) |
| (580,103) |
| (6,537,271) |
| (543,490) |
| (2,367,850) |
| 12,284,662 |
| 716,444 |
| (11,990,848) |
Total assets (net of liabilities) allocated by segment | 27,303,416 |
| 8,793,622 |
| 2,320,121 |
| 15,870,992 |
| 16,174,615 |
| 25,034,358 |
| (27,303,416) |
| (17,212,528) |
| 50,981,180 |
Total assets | 130,158,484 |
| 28,836,504 |
| 7,284,919 |
| 49,238,439 |
| 16,972,327 |
| 56,033,366 |
| (130,158,484) |
| (18,500,173) |
| 139,865,382 |
|
|
|
|
|
|
|
|
|
|
|
|
|
|
|
|
|
|
Shareholders’ equity attributable to: |
|
|
|
|
|
|
|
|
|
|
|
|
|
|
|
|
|
Controlling shareholders | 26,561,384 |
| 5,798,294 |
| 1,624,273 |
| 4,766,403 |
| 5,023,574 |
| 20,955,291 |
| (26,561,384) |
| (17,212,528) |
| 20,955,307 |
Non-controlling shareholders | 742,032 |
| 2,995,328 |
| 695,848 |
| 11,104,589 |
| 11,151,041 |
| 4,079,067 |
| (742,032) |
| — |
| 30,025,873 |
Total shareholders’ equity | 27,303,416 |
| 8,793,622 |
| 2,320,121 |
| 15,870,992 |
| 16,174,615 |
| 25,034,358 |
| (27,303,416) |
| (17,212,528) |
| 50,981,180 |
Explanatory Notes to the Financial Statement
(In thousands of Reais, except when otherwise indicated)
| 12/31/2022 (Restated) | ||||||||||||||||
| Reported segments |
| Reconciliation |
|
| ||||||||||||
| Raízen |
| Compass |
| Moove |
| Rumo |
| Radar |
| Cosan Corporate |
| Deconsolidation of Joint Ventures |
| Elimination Between Segments |
| Consolidated |
Balance sheet items: |
|
|
|
|
|
|
|
|
|
|
|
|
|
|
|
|
|
Cash and cash equivalents | 4,902,800 |
| 3,403,634 |
| 865,370 |
| 7,385,421 |
| 25,582 |
| 1,621,709 |
| (4,902,800) |
| — |
| 13,301,716 |
Marketable securities | 126,206 |
| 578,358 |
| 62,919 |
| 840,061 |
| 217,061 |
| 20,401,367 |
| (126,206) |
| — |
| 22,099,766 |
Trade receivables | 10,316,720 |
| 1,931,205 |
| 1,101,336 |
| 578,324 |
| 314,834 |
| 1,843 |
| (10,316,720) |
| — |
| 3,927,542 |
Derivative financial instruments - assets | 7,023,284 |
| 391,863 |
| — |
| 874,843 |
| — |
| 2,885,046 |
| (7,023,284) |
| — |
| 4,151,752 |
Inventories | 16,043,114 |
| 133,881 |
| 1,509,357 |
| 225,813 |
| — |
| 8 |
| (16,043,114) |
| — |
| 1,869,059 |
Sectorial financial assets | — |
| 342,333 |
| — |
| — |
| — |
| — |
| — |
| — |
| 342,333 |
Other financial assets | 230,780 |
| 277 |
| 450 |
| — |
| — |
| 88,511 |
| (230,780) |
| — |
| 89,238 |
Other current assets | 10,285,568 |
| 1,037,586 |
| 405,314 |
| 724,415 |
| 74,623 |
| 1,690,662 |
| (10,285,568) |
| (1,042,433) |
| 2,890,167 |
Other non-current assets | 8,938,318 |
| 897,654 |
| 297,616 |
| 3,385,624 |
| 7,643 |
| 3,041,082 |
| (8,938,318) |
| (266,513) |
| 7,363,106 |
Investments in associates | — |
| 2,525,292 |
| — |
| 381,469 |
| 74,505 |
| 16,118,992 |
| — |
| (16,186,315) |
| 2,913,943 |
Investments in joint ventures | 1,371,430 |
| — |
| — |
| — |
| — |
| 11,221,356 |
| (1,371,430) |
| — |
| 11,221,356 |
Biological assets | 3,254,850 |
| — |
| — |
| — |
| 9,992 |
| — |
| (3,254,850) |
| — |
| 9,992 |
investment properties | — |
| — |
| — |
| — |
| 14,103,060 |
| — |
| — |
| — |
| 14,103,060 |
Contract assets | 3,297,856 |
| 1,110,335 |
| 8,380 |
| — |
| — |
| — |
| (3,297,856) |
| — |
| 1,118,715 |
Right-of-use assets | 9,556,152 |
| 83,059 |
| 170,120 |
| 7,732,284 |
| 3,584 |
| 23,822 |
| (9,556,152) |
| — |
| 8,012,869 |
Fixed assets | 25,210,448 |
| 671,573 |
| 805,377 |
| 17,049,188 |
| 34 |
| 422,264 |
| (25,210,448) |
| — |
| 18,948,436 |
Intangible assets | 9,337,192 |
| 12,015,135 |
| 2,854,874 |
| 6,774,306 |
| — |
| 477,627 |
| (9,337,192) |
| — |
| 22,121,942 |
Loans, borrowings and debentures | (33,551,302) |
| (8,278,839) |
| (2,862,154) |
| (16,758,088) |
| — |
| (25,088,135) |
| 33,551,302 |
| — |
| (52,987,216) |
Derivative financial instruments - liabilities | (4,909,074) |
| (400,351) |
| (18,146) |
| (1,412,945) |
| — |
| (3,459,490) |
| 4,909,074 |
| — |
| (5,290,932) |
Suppliers | (18,789,160) |
| (1,842,810) |
| (1,602,936) |
| (746,433) |
| (71,684) |
| (115,988) |
| 18,789,160 |
| — |
| (4,379,851) |
Employee benefits payables | (837,208) |
| (193,585) |
| (112,590) |
| (296,833) |
| — |
| (56,513) |
| 837,208 |
| — |
| (659,521) |
Sectorial financial liabilities | — |
| (1,616,616) |
| — |
| — |
| — |
| — |
| — |
| — |
| (1,616,616) |
Other current liabilities | (7,176,122) |
| (779,928) |
| (397,704) |
| (1,786,009) |
| (905,816) |
| (1,235,770) |
| 7,176,122 |
| 484,407 |
| (4,620,820) |
Lease liabilities | (10,568,042) |
| (76,606) |
| (166,651) |
| (3,254,011) |
| (3,708) |
| (31,182) |
| 10,568,042 |
| — |
| (3,532,158) |
Other non-current liabilities | (7,983,554) |
| (3,326,667) |
| (571,672) |
| (6,286,975) |
| (465,486) |
| (3,402,216) |
| 7,983,554 |
| 824,537 |
| (13,228,479) |
Total assets (net of liabilities) allocated by segment | 26,080,256 |
| 8,606,783 |
| 2,349,260 |
| 15,410,454 |
| 13,384,224 |
| 24,604,995 |
| (26,080,256) |
| (16,186,317) |
| 48,169,399 |
Total assets | 109,894,718 |
| 25,122,185 |
| 8,081,113 |
| 45,951,748 |
| 14,830,918 |
| 57,994,289 |
| (109,894,718) |
| (17,495,261) |
| 134,484,992 |
|
|
|
|
|
|
|
|
|
|
|
|
|
|
|
|
|
|
Shareholders’ equity attributable to: |
|
|
|
|
|
|
|
|
|
|
|
|
|
|
|
|
|
Controlling shareholders | 22,507,108 |
| 5,738,714 |
| 1,647,259 |
| 4,613,308 |
| 4,187,415 |
| 20,652,788 |
| (22,507,108) |
| (16,186,317) |
| 20,653,167 |
Non-controlling shareholders | 3,573,148 |
| 2,868,069 |
| 702,001 |
| 10,797,146 |
| 9,196,809 |
| 3,952,207 |
| (3,573,148) |
| — |
| 27,516,232 |
Total shareholders’ equity | 26,080,256 |
| 8,606,783 |
| 2,349,260 |
| 15,410,454 |
| 13,384,224 |
| 24,604,995 |
| (26,080,256) |
| (16,186,317) |
| 48,169,399 |
Explanatory Notes to the Financial Statement
(In thousands of Reais, except when otherwise indicated)
4.1 NET SALES BY SEGMENT
| 12/31/2023 (Restated) |
| 12/31/2022 (Restated) |
Reported segment |
|
|
|
Raízen |
|
|
|
Ethanol | 23,312,258 |
| 29,652,112 |
Sugar | 29,070,524 |
| 23,695,768 |
Gasoline | 66,267,702 |
| 66,586,914 |
Diesel | 90,281,586 |
| 106,684,577 |
Cogeneration | 3,724,090 |
| 3,688,108 |
Other | 9,037,138 |
| 13,986,243 |
| 221,693,298 |
| 244,293,722 |
Compass |
|
|
|
Natural gas distribution |
|
|
|
Industrial | 11,411,212 |
| 12,945,164 |
Residential | 2,202,348 |
| 2,200,849 |
Cogeneration | 710,288 |
| 943,907 |
Automotive | 592,917 |
| 928,468 |
Commercial | 820,685 |
| 814,962 |
Construction revenue | 1,494,142 |
| 1,217,818 |
Others | 535,735 |
| 429,493 |
| 17,767,327 |
| 19,480,661 |
Electricity trading | — |
| 238,544 |
| 17,767,327 |
| 19,719,205 |
|
|
|
|
Moove |
|
|
|
Finished product | 8,520,267 |
| 8,050,310 |
Base oil | 765,408 |
| 596,443 |
Services | 792,951 |
| 333,324 |
| 10,078,626 |
| 8,980,077 |
|
|
|
|
Rumo |
|
|
|
North operations | 8,346,314 |
| 7,635,243 |
South operations | 2,032,703 |
| 1,739,391 |
Container operations | 558,699 |
| 466,874 |
| 10,937,716 |
| 9,841,508 |
|
|
|
|
Radar |
|
|
|
Lease and sale of lands | 743,411 |
| 834,616 |
|
|
|
|
Reconciliation |
|
|
|
Cosan Corporate | 2,709 |
| 10,416 |
|
|
|
|
Deconsolidation of joint venture, adjustments and eliminations | (221,754,590) |
| (244,356,758) |
Total | 39,468,497 |
| 39,322,786 |
Explanatory Notes to the Financial Statement
(In thousands of Reais, except when otherwise indicated)
4.2. INFORMATION ON GEOGRAPHICAL AREA
| Net sales |
| Other non-current assets | ||||
| 12/31/2023 |
| 12/31/2022 (Restated) |
| 12/31/2023 |
| 12/31/2022 (Restated) |
Brazil | 33,816,723 |
| 33,714,249 |
| 12,584,481 |
| 11,957,039 |
Europe (i) | 3,050,235 |
| 3,080,840 |
| 8,969 |
| 7,762 |
Latin America (ii) | 144,853 |
| 697,117 |
| 3,275 |
| 7,294 |
North America (iii) | 2,456,686 |
| 1,770,487 |
| 10,087 |
| 17,173 |
Asia and other | — |
| 60,093 |
| — |
| — |
Total | 39,468,497 |
| 39,322,786 |
| 12,606,812 |
| 11,989,268 |
| Main countries: |
| (i) England, France, Spain and Portugal; |
| (ii) Argentina, Bolivia, Uruguay and Paraguay, and |
| (iii) United States of America. |
4.3. MAIN CUSTOMERS
As at December 31, 2023, the subsidiary Rumo had a client who individually contributed a portion of 10.42% of its net operating revenue, with an approximate amount of R$1,213,263. In 2022, this same client individually contributed a portion of 9.89% of the subsidiary's net operating revenue with an approximate amount of R$858,831.
Explanatory Notes to the Financial Statement
(In thousands of Reais, except when otherwise indicated)
Accounting policy: Measurement of financial assets and liabilities The Company initially measures a financial asset at its fair value plus (in case of a financial asset that is not measured at fair value through profit and loss) transaction costs, except for those measured at amortized cost and maintained within a business model with the goal of obtaining contractual cash flows that meet the principal and interest only criterion. Debt financial instruments are subsequently measured at fair value through profit or loss, amortized cost or fair value through other comprehensive income. The classification is based on two criteria: (i) the Company's business model for managing the assets; and (ii) whether the contractual cash flows from the instruments represent only principal and interest payments on the outstanding principal amount. The Company started recognizing its financial assets at amortized cost for financial assets held within a business model with the objective of obtaining contractual cash flows that satisfy the "Principal and Interest" criterion. This category includes trade receivables, cash and cash equivalents, receivables from related parties, other financial assets, dividends and interest on equity receivable, and other financial assets. Purchases or sales of financial assets that require the delivery of assets within a period established by regulation or market convention (regular trades) are recorded on the trade date, i.e., the date on which the Company enters into an agreement to buy or sell the asset. Financial assets are derecognized when the rights to receive cash flows from these assets have expired or when the Company has transferred substantially all risks and rewards associated with ownership. Financial liabilities are categorized based on whether they are measured at amortized cost or fair value through profit and loss. A financial liability is categorized as measured at fair value through profit or loss if it is held for trading, is a derivative, or was designated as such upon initial recognition. Financial liabilities are measured at fair value and the net result, including interest, is included in the income (loss). Other financial liabilities are subsequently measured using the effective interest method at their amortized cost. Interest expense and foreign exchange gains and losses are accounted for in the financial result. The Company derecognizes a financial liability when its contractual obligations are discharged, cancelled, or expired, or when its terms are modified and the cash flows of the modified liability are materially different, in which case a new financial liability is recognized at fair value based on the modified terms. Any gain or loss on derecognition is accounted for in the income (loss). |
Explanatory Notes to the Financial Statement
(In thousands of Reais, except when otherwise indicated)
Financial assets and liabilities are stated as classified below:
|
|
| Parent Company |
| Consolidated | ||||
| Note |
| 12/31/2023 |
| 12/31/2022 |
| 12/31/2023 |
| 12/31/2022 |
Assets |
|
|
|
|
|
|
|
|
|
Fair value through profit and loss |
|
|
|
|
|
|
|
|
|
Cash and cash equivalents | 5.2 |
| 1,667,155 |
| 759,965 |
| 3,298,142 |
| 1,134,030 |
Marketable securities | 5.3 |
| 705,777 |
| 724,050 |
| 3,503,961 |
| 22,099,766 |
Derivative financial instruments | 5.6 |
| 157,816 |
| 1,368,809 |
| 2,546,799 |
| 4,151,752 |
Other financial assets |
|
| — |
| — |
| 3,113 |
| 89,238 |
|
|
| 2,530,748 |
| 2,852,824 |
| 9,352,015 |
| 27,474,786 |
Amortized cost |
|
|
|
|
|
|
|
|
|
Cash and cash equivalents | 5.2 |
| 102,821 |
| 588,496 |
| 11,360,339 |
| 12,167,686 |
Trade receivables | 5.7 |
| — |
| — |
| 3,444,636 |
| 3,927,542 |
Restricted cash | 5.3 |
| 81,621 |
| 35,039 |
| 203,252 |
| 139,933 |
Receivables from related parties | 5.8 |
| 348,096 |
| 737,340 |
| 340,091 |
| 476,542 |
Sectorial financial assets | 5.10 |
| — |
| — |
| 548,700 |
| 342,333 |
Dividends and interest on equity receivable | 17 |
| 319,135 |
| 609,456 |
| 255,777 |
| 161,147 |
|
|
| 851,673 |
| 1,970,331 |
| 16,152,795 |
| 17,215,183 |
Total |
|
| 3,382,421 |
| 4,823,155 |
| 25,504,810 |
| 44,689,969 |
Liabilities |
|
|
|
|
|
|
|
|
|
Amortized cost |
|
|
|
|
|
|
|
|
|
Loans, borrowings and debentures |
|
| (13,496,324) |
| (5,475,628) |
| (33,952,162) |
| (21,620,197) |
Trade payables | 5.9 |
| (2,431) |
| (115,146) |
| (4,184,525) |
| (4,379,851) |
Consideration payable |
|
| — |
| — |
| (203,094) |
| (223,960) |
Other financial liabilities |
|
| — |
| — |
| (476,895) |
| (954,547) |
Leases | 5.5 |
| (29,543) |
| (30,365) |
| (5,275,794) |
| (3,532,158) |
Concession payable | 13 |
| — |
| — |
| (3,565,373) |
| (3,351,410) |
Related parties payable | 5.8 |
| (6,648,867) |
| (10,458,897) |
| (323,238) |
| (387,736) |
Dividends payable | 17 |
| (276,065) |
| (279,979) |
| (549,054) |
| (892,006) |
Sectorial financial liabilities | 5.10 |
| — |
| — |
| (1,810,698) |
| (1,616,616) |
Installment of tax debts | 14 |
| (211,226) |
| (202,140) |
| (217,348) |
| (208,760) |
|
|
| (20,664,456) |
| (16,562,155) |
| (50,558,181) |
| (37,167,241) |
Fair value through profit and loss |
|
|
|
|
|
|
|
|
|
Loans, borrowings and debentures |
|
| — |
| — |
| (22,952,492) |
| (31,367,019) |
Derivative financial instruments | 5.6 |
| (645,985) |
| (618,947) |
| (3,415,145) |
| (5,290,932) |
|
|
| (645,985) |
| (618,947) |
| (26,367,637) |
| (36,657,951) |
Total |
|
| (21,310,441) |
| (17,181,102) |
| (76,925,818) |
| (73,825,192) |
| (i) | The Company's subsidiaries have operations that seek ways to improve working capital efficiency and generally negotiate the extension of payment terms with their suppliers and enter into structured payment agreements (also known as reverse factoring or cashed risk) with intermediaries third parties, such as financial institutions. |
| As at December 31, 2023, the balance advanced by Rumo and Moove with financial institutions was R$342,276 and R$175 (R$817,869 and R$64,099 as at December 31, 2022), respectively. These operations had top-tier banks as counterparties, at an average rate of 12.42% per year (14.53% per year as at December 31, 2022) for Rumo and CDI + 2.5% per year (CDI + 2.5% per year as at December 31, 2022) for Moove. The average term of these operations, which are recorded at present value at the previously mentioned rate, is around 111 and 103 days (109 and 102 days as at December 31, 2022), respectively. Financial charges embedded in the transaction are recorded in the financial result, representing R$95,356 in the year ended December 31, 2023 (R$96,752 as of December 31, 2022). | |
| The settlement flow of the balance of credits assigned by suppliers to financial agents is classified in the statement of cash flows in operating activities, as it better represents the cash expenditure from the perspective of the Company's operations. |
Explanatory Notes to the Financial Statement
(In thousands of Reais, except when otherwise indicated)
Under the terms of the main loan lines, the Company and its subsidiaries are required to comply with the following financial clauses:
Company | Debt | Triggers | Ratio |
Cosan Corporate |
|
|
|
Cosan S.A. | * 1st issue debenture | Net debt (i) / EBITDA (ii) cannot exceed 4.0x | 2.42 |
Cosan Luxembourg S.A. | * Senior Notes 2027 | Proforma net debt (iv) / pro forma EBITDA (iv) cannot exceed 3.5x | 2.00 |
* Senior Notes 2029 | |||
* Senior Notes 2030 | |||
Compass |
|
|
|
Comgás S.A. | * 4th issue debenture | Short-term debt / total debt (iii) cannot exceed 0.6x | 0.17 |
Comgás S.A. | * Debenture 4th to 9th issues | Net debt (i) / EBITDA (ii) cannot exceed 4.0x | 1.32 |
* BNDES | |||
* Resolution 4131 | |||
Sulgás | * BNDES | Net debt (i) / EBITDA (ii) cannot exceed 3.5x | (0.02) |
Short-term debt / Total debt (iii) cannot exceed 0.8x
| 0.69 | ||
Moove |
|
|
|
MLH | *Syndicated Loan | Net debt (i) / EBITDA (ii) cannot exceed 3.5x at the end of each quarter | 1.13 |
ICSD (x) cannot be less than 2.5x at the end of each quarter | 5.25 | ||
Rumo |
|
|
|
Rumo S.A. | * Debenture (11th, 12th, 13th and 14th) (viii) | ICJ (ix) = EBITDA(ii) / Financial result (v) cannot be less than 2.0x | 3.84 |
* ECA | |||
Rumo S.A. | * NCE | Net debt (i) / EBITDA (ii) cannot exceed 3.5x | 1.81 |
* ECA | |||
Rumo Luxembourg S.à r.l. | * Senior Notes 2028 (vi) | Net debt (i) / EBITDA (ii) cannot exceed 3.5x | 1.81 |
* Senior Notes 2032 (vii) | |||
* Debentures (vii) | |||
Brado | * NCE | Net debt (i) / EBITDA (ii) cannot exceed 3.3x | 1.18 |
| 258 |
Explanatory Notes to the Financial Statement
(In thousands of Reais, except when otherwise indicated)
| (i) | Net debt is composed of current and non-current loans, financing and debentures, obligations with preferred shareholders in subsidiaries (“Gross Debt”), net of cash and cash equivalents, marketable securities and derivative financial instruments on debt. |
| (ii) | Corresponds to the EBITDA accumulated over the previous twelve months. |
| (iii) | Total debt is the sum of current and non-current loans, borrowings and debentures, and current and non-current derivative financial instruments. |
| (iv) | Net debt and EBITDA Proforma, including the equivalent of 50% of the joint venture financial information as determined in the contracts. Net debt and EBITDA Proforma are a non-GAAP measure. EBITDA Proforma corresponds to the accumulated period of the last 12 months. For senior Notes covenants the values of unrestricted subsidies are excluded. |
| (v) | The financial result of net debt is represented by the cost of net debt. |
| (vi) | Senior Notes due 2028 was the first green issuance in the Latin American freight rail sector. The subsidiary Rumo is committed to using the resources to fully or partially finance ongoing and future projects that contribute to the promotion of a resource-efficient, low-carbon transport sector in Brazil. Eligible projects include "acquisition, replacement, and modernization of rolling stock," "Infrastructure for duplication of railway sections, new yards, and yard extensions," and "railway modernization." The subsidiary publishes an annual report detailing the progress of projects, which is available on the investor relations page. |
| (vii) | Senior Notes due 2032 was an issue of Sustainability-Linked Bonds (SLBs), with the following sustainable targets: reduction of 17.6% by 2026 in greenhouse gas emissions per Ton per useful kilometer (“TKU”) with the base date of December 2020 as the starting point. The company is subject to a step-up of 25 basis points from July 2027 if it does not reach this target, which would increase the interest rate to 4.45% per year. |
| (viii) | The 11th, 12th and 13th issues debentures have a contractual leverage ratio limited to 3.0x. However, they have a prior consent (waiver) that allows the broadcaster to extrapolate this index up to the limit of 3.5x until December 31, 2027. |
| (ix) | Interest Coverage Ratio (“ICJ”). |
| (x) | Debt Service Coverage Ratio. |
Explanatory Notes to the Financial Statement
(In thousands of Reais, except when otherwise indicated)
The Company has non-financial covenants controlled for the Debentures in which a Financial Statement is expected to be issued within 90 days, and after 90 days the Company has another 30 days of “cure” period to carry out the issuance and not breach with the obligation towards debenture holders. Therefore, with the issuance of the Financial Statements on April 26, 2024, the Company is within the cure period and has no breach of agreements.
Accounting policy: Cash and cash equivalents consist of cash on hand, demand deposits, and highly liquid investments with maturities of three months or less from the date of acquisition and are subject to an insignificant risk of devaluation. |
| Parent Company |
| Consolidated | ||||
| 12/31/2023 |
| 12/31/2022 |
| 12/31/2023 |
| 12/31/2022 |
Cash and bank accounts | 251 |
| 147 |
| 209,479 |
| 307,819 |
Savings account | 102,400 |
| 184,386 |
| 431,011 |
| 974,198 |
Financial Investments | 1,667,325 |
| 1,163,928 |
| 14,017,991 |
| 12,019,699 |
| 1,769,976 |
| 1,348,461 |
| 14,658,481 |
| 13,301,716 |
Financial investments include the following:
| Parent Company |
| Consolidated | ||||
| 12/31/2023 |
| 12/31/2022 |
| 12/31/2023 |
| 12/31/2022 |
Investment fund |
|
|
|
|
|
|
|
Repurchase Agreements (i) | 1,667,155 |
| 759,965 |
| 3,259,210 |
| 1,181,280 |
Certificate of bank deposits | — |
| — |
| — |
| 123,052 |
Other investments | — |
| — |
| 38,932 |
| — |
| 1,667,155 |
| 759,965 |
| 3,298,142 |
| 1,304,332 |
Bank Investments |
|
|
|
|
|
|
|
Repurchase agreements | — |
| — |
| 616,633 |
| 96,841 |
Certificate of bank deposits - CDB | — |
| 403,823 |
| 9,807,983 |
| 10,396,376 |
Other | 170 |
| 140 |
| 295,233 |
| 222,150 |
| 170 |
| 403,963 |
| 10,719,849 |
| 10,715,367 |
| 1,667,325 |
| 1,163,928 |
| 14,017,991 |
| 12,019,699 |
(i) The repurchase agreements are allocated to the WG Renda Fixa Crédito Privado Fundo de Investimento (“WG”), which was created in the form of an open condominium and is managed by Itaú Unibanco Asset Management Ltda. (“Itaú Asset”). The fund's portfolio is composed of investments in public bonds and repurchase agreements backed by federal public bonds.
The Company's onshore financial investments bear interest at rates approximating 100% of the Brazilian interbank offered rate (Certificado de Depósito Interbancário, or "CDI") as of December 31, 2023, and December 31, 2022. Offshore financial investments are remunerated at rates around 100% of the Fed funds (Federal Reserve System). The sensitivity analysis of interest rate risks is in 5.12.
Explanatory Notes to the Financial Statement
(In thousands of Reais, except when otherwise indicated)
Accounting policy: The valuation and classification of marketable securities are based on their fair value, as determined by the financial result. Securities consist of all equity instruments with readily ascertainable fair values. The fair values of equity instruments are deemed readily determinable if the securities are listed or if a current market value or fair value can be determined even without a direct listing (for example, prices of shares in mutual funds). Restricted cash is measured and classified at amortized cost, with an average maturity of between two and five years for government bonds, but they can be redeemed quickly and are subject to an insignificant risk of change in value. |
| Parent Company |
| Consolidated | ||||
| 12/31/2023 |
| 12/31/2022 |
| 12/31/2023 |
| 12/31/2022 |
Marketable securities |
|
|
|
|
|
|
|
Financial investment in listed entities (i) | — |
| — |
| — |
| 19,586,193 |
Government securities (ii) | 705,777 |
| 724,050 |
| 3,107,813 |
| 2,059,325 |
Certificate of bank deposits (CDB) | — |
| — |
| 300,142 |
| 363,145 |
ESG Funds | — |
| — |
| 96,006 |
| 91,103 |
| 705,777 |
| 724,050 |
| 3,503,961 |
| 22,099,766 |
Current | 705,777 |
| 724,050 |
| 3,407,955 |
| 2,422,470 |
Non-current | — |
| — |
| 96,006 |
| 19,677,296 |
Total | 705,777 |
| 724,050 |
| 3,503,961 |
| 22,099,766 |
| Restricted cash | |||||||
| Securities pledged as collateral | 81,621 | 35,039 | 203,252 | 139,933 | |||
| 81,621 | 35,039 | 203,252 | 139,933 | ||||
| Current | — | — | 7,860 | 8,024 | |||
| Non-current | 81,621 | 35,039 | 195,392 | 131,909 | |||
| Total | 81,621 | 35,039 | 203,252 | 139,933 | |||
| (i) | After obtaining significant influence in Vale S.A, the balances of financial assets were transferred to investments in subsidiaries and associates. See more details in note 1.1. |
| (ii) | The sovereign debt securities declared interest linked to the Special System of Liquidation and Custody (Sistema Especial de Liquidação e Custódia), or “SELIC”, with a yield of approximately 100% of the CDI., or “SELIC”, with a yield of approximately 100% of the CDI. |
Explanatory Notes to the Financial Statement
(In thousands of Reais, except when otherwise indicated)
Accounting policy: Initial measurement is at fair value, net of transaction costs, and subsequent measurement is at amortized cost. When the obligation specified in the contract is satisfied, canceled, or expires, they are derecognized. The difference between the carrying amount of a financial liability that has been extinguished or transferred to another party and the consideration paid, including any non-monetary assets transferred or liabilities assumed, is recorded as other financial revenue or expense in the income statement. Classified as current liabilities unless there is an unconditional right to defer settlement for at least one year after the date of the balance sheet. Initial measurement of financial guaranteed contracts issued by the Company is at fair value, and if not designated at fair value in the financial result, the financial guarantee contracts are subsequently measured at the higher amount between:
|
a) Composition
|
| Finance Charges |
| Parent Company |
|
|
|
| ||||||
Description |
| Index |
| Annual |
| Currency |
| 12/31/2023 |
| 12/31/2022 |
| Maturity |
| Objective |
No Warranty |
|
|
|
|
|
|
|
|
|
|
|
|
|
|
Debentures |
| CDI + 2.65% |
| 14.61% |
| Real |
| 1,208,141 |
| 1,819,837 |
| Aug-25 |
| Investments |
|
| CDI + 1.65% |
| 13.49% |
| Real |
| 784,475 |
| 787,519 |
| Aug-28 |
| Capital management |
|
| CDI + 1.50% |
| 13.32% |
| Real |
| 406,471 |
| 407,308 |
| May-28 |
| Capital management |
|
| CDI + 1.90% |
| 13.77% |
| Real |
| 1,117,966 |
| 1,120,577 |
| May-32 |
| Capital management |
|
| CDI + 2.00% |
| 13.88% |
| Real |
| 942,010 |
| 946,379 |
| Aug-31 |
| Capital management |
|
| CDI + 2.40% |
| 14.33% |
| Real |
| 1,020,673 |
| — |
| Apr-28 |
| Capital management |
|
| CDI + 2.40% |
| 14.33% |
| Real |
| 998,542 |
| — |
| Jun-28 |
| Capital management |
|
| CDI + 1.80% |
| 13.66% |
| Real |
| 1,260,684 |
| — |
| Jan-31 |
| Capital management |
|
| IPCA + 5.75% |
| 10.43% |
| Real |
| 412,478 |
| 394,008 |
| Aug-31 |
| Capital management |
|
| 8.02% + exchange rate variation (i) |
| 16.04% |
| Dollar |
| 1,451,867 |
| — |
| Sep-29 |
| Capital management |
|
| 7.52% base 360 |
| 7.52% |
| Dollar |
| 2,897,097 |
| — |
| Jun-30 |
| Capital management |
Commercial bank notes |
| CDI + 1.75% |
| 13.60% |
| Real |
| 547,755 |
| — |
| Dec-28 |
| Capital management |
|
| CDI + 1.80% |
| 13.66% |
| Real |
| 448,165 |
| — |
| Jan-31 |
| Capital management |
Total |
|
|
|
|
|
|
| 13,496,324 |
| 5,475,628 |
|
|
|
|
Current |
|
|
|
|
|
|
| 800,987 |
| 802,549 |
|
|
|
|
Non-current |
|
|
|
|
|
|
| 12,695,337 |
| 4,673,079 |
|
|
|
|
| (i) | The operation has an interest rate for the first interest flow of 16.04% per year, while for the other flows it will be 8.02% per year. |
Explanatory Notes to the Financial Statement
(In thousands of Reais, except when otherwise indicated)
|
| Finance Charges |
| Consolidated |
|
|
|
|
|
| ||||||
Description |
| Index |
| Currency |
| Annual |
| 12/31/2023 |
| 12/31/2022 |
| Maturity |
| Objective |
| Segments |
With guarantee |
|
|
|
|
|
|
|
|
|
|
|
|
|
|
|
|
Resolution 4131 |
|
|
|
|
|
|
|
|
|
|
|
|
|
|
|
|
|
| Prefixed |
| Euro |
| — |
| — |
| 868,367 |
| Oct-24 |
| Investments |
| Cosan Corporate |
|
| Prefixed |
| Yen |
| — |
| — |
| 578,708 |
| Oct-24 |
| Investments |
| Cosan Corporate |
|
| Prefixed |
| Euro |
| 3.20% |
| 860,658 |
| 2,009,452 |
| Oct-25 |
| Investments |
| Cosan Corporate |
|
| Prefixed |
| Yen |
| 0.25% |
| 602,487 |
| 1,338,697 |
| Oct-25 |
| Investments |
| Cosan Corporate |
|
| Prefixed |
| Euro |
| 3.40% |
| 1,954,022 |
| 1,966,061 |
| Oct-26 |
| Investments |
| Cosan Corporate |
|
| Prefixed |
| Yen |
| 0.25% |
| 1,135,226 |
| 1,309,330 |
| Oct-26 |
| Investments |
| Cosan Corporate |
|
| Prefixed |
| Euro |
| 3.56% |
| 812,496 |
| 816,172 |
| Oct-27 |
| Investments |
| Cosan Corporate |
|
| Prefixed |
| Yen |
| 0.25% |
| 470,951 |
| 543,160 |
| Oct-27 |
| Investments |
| Cosan Corporate |
BNDES |
| URTJLP |
| Real |
| 8.60% |
| 2,210,390 |
| 2,221,900 |
| Jul-31 |
| Investments |
| Rumo |
|
| Prefixed |
| Real |
| 6.00% |
| 128,494 |
| 280,919 |
| Dec-24 |
| Investments |
| Rumo |
|
| Prefixed |
| Real |
| 3.50% |
| 29 |
| 378 |
| Jan-24 |
| Investments |
| Rumo |
|
| IPCA + 5.74% |
| Real |
| 10.42% |
| 295,058 |
| — |
| Dec-36 |
| Investments |
| Compass |
|
| IPCA + 6.01% |
| Real |
| 10.71% |
| 304,276 |
| — |
| Dec-36 |
| Investments |
| Compass |
|
| 99.98% of CDI |
| Real |
| 7.82% |
| 1,547,664 |
| 1,653,501 |
| Jun-34 |
| Investments |
| Compass |
|
| IPCA + 4.10% |
| Real |
| 8.71% |
| 112,946 |
| 131,885 |
| Apr-29 |
| Investments |
| Compass |
|
| IPCA + 5.74% |
| Real |
| 10.42% |
| 598,752 |
| 544,925 |
| Dec-36 |
| Investments |
| Compass |
Export credit note |
| CDI + 1.03% |
| Real |
| 15.39% |
| 78,965 |
| 98,003 |
| Feb-26 |
| Investments |
| Rumo |
|
| CDI + 2.25% |
| Real |
| 15.16% |
| 60,774 |
| 62,760 |
| May-26 |
| Investments |
| Rumo |
|
| CDI + 2.20% |
| Real |
| 14.20% |
| 30,252 |
| — |
| Mar-26 |
| Capital management |
| Rumo |
|
| CDI + 2.07% |
| Real |
| 14.85% |
| 52,101 |
| 50,467 |
| Mar-25 |
| Capital management |
| Rumo |
|
| CDI + 0.80% |
| Real |
| - |
| — |
| 355,770 |
| Dec-23 |
| Investments |
| Rumo |
|
| SOFR + 1.30% |
| Dollar |
| 6.65% |
| 487,544 |
| — |
| Jan-25 |
| Investments |
| Rumo |
Bank credit note |
| IPCA |
| Real |
| 5.41% |
| 954,205 |
| 806,028 |
| Jan-48 |
| Investments |
| Rumo |
Debentures |
| CDI + 1.79% |
| Real |
| 13.65% |
| 753,435 |
| 754,785 |
| Jun-27 |
| Investments |
| Rumo |
|
| CDI + 1.30% |
| Real |
| 13.10% |
| 759,390 |
| 759,175 |
| Oct-27 |
| Investments |
| Rumo |
|
| IPCA + 4.77% |
| Real |
| 9.41% |
| 773,556 |
| 632,440 |
| Jun-31 |
| Investments |
| Rumo |
Export Credit Agency (“ECA”) |
| Euribor + 0.58% |
| Euro |
| 4.52% |
| 48,849 |
| 68,455 |
| Sep-26 |
| Investments |
| Rumo |
|
| IPCA + 4.10% |
| Real |
| 10.63% |
| 140,016 |
| 73,717 |
| Jan-30 |
| Investments |
| Compass |
|
|
|
|
|
|
|
| 15,172,536 |
| 17,925,055 |
|
|
|
|
|
|
No Warranty |
|
|
|
|
|
|
|
|
|
|
|
|
|
|
|
|
|
| Prefixed |
| Pound |
| - |
| — |
| 125,707 |
| Dec-23 |
| Investments |
| Moove |
Resolution 4131 |
| Prefixed |
| Dollar |
| 5.50% |
| 31,920 |
| 45,124 |
| Mar-25 |
| Investments |
| Moove |
|
| Prefixed |
| Dollar |
| - |
| — |
| 395,285 |
| May-23 |
| Investments |
| Compass |
|
| Prefixed |
| Dollar |
| 2.13% |
| 943,486 |
| 1,000,957 |
| Feb-25 |
| Investments |
| Compass |
|
| Prefixed |
| Dollar |
| 4.04% |
| 734,191 |
| — |
| May-26 |
| Investments |
| Compass |
|
| Prefixed |
| Dollar |
| 1.36% |
| 362,774 |
| 377,705 |
| Feb-24 |
| Investments |
| Compass |
Perpetual Notes |
| Prefixed |
| Dollar |
| 8.25% |
| 2,451,160 |
| 2,641,732 |
| Nov-40 |
| Acquisition |
| Cosan Corporate |
Senior Notes Due 2027 |
| Prefixed |
| Dollar |
| 7.00% |
| 2,016,330 |
| 3,587,265 |
| Jan-27 |
| Acquisition |
| Cosan Corporate |
Senior Notes Due 2028 |
| Prefixed |
| Dollar |
| 5.25% |
| 2,178,449 |
| 2,196,083 |
| Jan-28 |
| Acquisition |
| Rumo |
Senior Notes Due 2029 |
| Prefixed |
| Dollar |
| 5.50% |
| 3,622,922 |
| 3,953,564 |
| Sep-29 |
| Acquisition |
| Cosan Corporate |
Senior Notes Due 2030 |
| Prefixed |
| Dollar |
| 7.50% |
| 2,642,023 |
| — |
| Jun-30 |
| Capital management |
| Cosan Corporate |
Senior Notes Due 2032 |
| Prefixed |
| Dollar |
| 4.20% |
| 2,066,885 |
| 2,124,051 |
| Jan-32 |
| Acquisition |
| Rumo |
Prepayment |
| 3M Libor + 1.00% |
| Dollar |
| - |
| — |
| 104,667 |
| Oct-23 |
| Capital management |
| Moove |
|
| 1.27% |
| Dollar |
| - |
| — |
| 151,871 |
| Jul-23 |
| Capital management |
| Moove |
Explanatory Notes to the Financial Statement
(In thousands of Reais, except when otherwise indicated)
|
| Finance Charges |
| Consolidated |
|
|
|
|
|
| ||||||
Description |
| Index |
| Currency |
| Annual |
| 12/31/2023 |
| 12/31/2022 |
| Maturity |
| Objective |
| Segments |
Debentures |
| IPCA + 4.68% |
| Real |
| 9.32% |
| 396,201 |
| 518,680 |
| Feb-26 |
| Investments |
| Rumo |
|
| IPCA + 4.50% |
| Real |
| 9.13% |
| 1,596,910 |
| 1,523,382 |
| Jun-31 |
| Investments |
| Rumo |
|
| IPCA + 3.60% |
| Real |
| 8.19% |
| 413,881 |
| 367,476 |
| Dec-30 |
| Capital management |
| Rumo |
|
| CDI + 2.65% |
| Real |
| 14.61% |
| 1,208,141 |
| 1,819,837 |
| Aug-25 |
| Investments |
| Cosan Corporate |
|
| IPCA + 6.80% |
| Real |
| 11.53% |
| 1,004,762 |
| 893,852 |
| Apr-30 |
| Investments |
| Rumo |
|
| IPCA + 3.90% |
| Real |
| 8.50% |
| 1,113,820 |
| 1,048,252 |
| Oct-29 |
| Investments |
| Rumo |
|
| IPCA + 5.73% |
| Real |
| 10.41% |
| 551,709 |
| 537,261 |
| Oct-33 |
| Investments |
| Rumo |
|
| IPCA + 4.00% |
| Real |
| 8.61% |
| 1,077,141 |
| 941,203 |
| Dec-35 |
| Investments |
| Rumo |
|
| IPCA + 4.54% |
| Real |
| 9.17% |
| 254,232 |
| 80,987 |
| Jun-36 |
| Investments |
| Rumo |
|
| IPCA + 5.99% |
| Real |
| 10.69% |
| 470,177 |
| 435,780 |
| Jun-32 |
| Investments |
| Rumo |
|
| IPCA + 5.76% |
| Real |
| 10.45% |
| 753,439 |
| — |
| Aug-29 |
| Investments |
| Rumo |
|
| IPCA + 6.18% |
| Real |
| 10.88% |
| 749,252 |
| — |
| May-33 |
| Investments |
| Rumo |
|
| IPCA + 5.87% |
| Real |
| - |
| — |
| 907,366 |
| Dec-23 |
| Investments |
| Compass |
|
| IPCA + 4.33% |
| Real |
| 8.95% |
| 554,147 |
| 523,837 |
| Oct-24 |
| Investments |
| Compass |
|
| IGPM + 6.10% |
| Real |
| 6.10% |
| 359,639 |
| 372,171 |
| May-28 |
| Investments |
| Compass |
|
| CDI + 1.90% |
| Real |
| 13.77% |
| 1,117,966 |
| 1,120,577 |
| May-32 |
| Investments |
| Cosan Corporate |
|
| CDI + 1.50% |
| Real |
| 13.32% |
| 406,471 |
| 407,308 |
| May-28 |
| Investments |
| Cosan Corporate |
|
| CDI + 1.95% |
| Real |
| 13.83% |
| 735,565 |
| 824,866 |
| Aug-24 |
| Investments |
| Compass |
|
| CDI + 1.45% |
| Real |
| 13.27% |
| 399,457 |
| 399,616 |
| Dec-26 |
| Investments |
| Compass |
|
| CDI + 1.55% |
| Real |
| 13.38% |
| 1,764,022 |
| — |
| Nov-30 |
| Investments |
| Compass |
|
| 109.20% of CDI |
| Real |
| 9.78% |
| 550,342 |
| 491,153 |
| Aug-31 |
| Investments |
| Compass |
|
| IPCA + 7.36% |
| Real |
| 12.12% |
| 80,960 |
| 114,014 |
| Dec-25 |
| Investments |
| Compass |
|
| IPCA + 5.22% |
| Real |
| 9.88% |
| 533,854 |
| 467,841 |
| Aug-36 |
| Investments |
| Compass |
|
| CDI + 1.65% |
| Real |
| 13.49% |
| 784,475 |
| 787,519 |
| Aug-28 |
| Capital management |
| Cosan Corporate |
|
| CDI + 2.40% |
| Real |
| 14.33% |
| 1,020,673 |
| — |
| Apr-28 |
| Capital management |
| Cosan Corporate |
|
| CDI + 2.40% |
| Real |
| 14.33% |
| 998,542 |
| — |
| Jun-28 |
| Capital management |
| Cosan Corporate |
|
| CDI + 2.00% |
| Real |
| 13.88% |
| 942,011 |
| 946,379 |
| Aug-31 |
| Capital management |
| Cosan Corporate |
|
| CDI + 1.80% |
| Real |
| 13.66% |
| 1,260,684 |
| — |
| Jan-31 |
| Capital management |
| Cosan Corporate |
|
| IPCA + 5.75% |
| Real |
| 10.43% |
| 412,478 |
| 394,008 |
| Aug-31 |
| Capital management |
| Cosan Corporate |
Capital Management |
| CDI + 1.60% |
| Real |
| - |
| — |
| 100,170 |
| Jun-23 |
| Capital management |
| Moove |
|
| SOFR + 1.50% |
| Dollar |
| 1.50% |
| 2,175,107 |
| 2,334,615 |
| May-27 |
| Acquisition |
| Moove |
Commercial bank notes |
| CDI + 1.75% |
| Real |
| 13.60% |
| 547,755 |
| — |
| Dec-28 |
| Capital management |
| Cosan Corporate |
|
| CDI + 1.80% |
| Real |
| 13.66% |
| 448,165 |
| — |
| Jan-31 |
| Capital management |
| Cosan Corporate |
|
|
|
|
|
|
|
| 41,732,118 |
| 35,062,161 |
|
|
|
|
|
|
Total |
|
|
|
|
|
|
| 56,904,654 |
| 52,987,216 |
|
|
|
|
|
|
Current |
|
|
|
|
|
|
| 4,882,398 |
| 4,542,205 |
|
|
|
|
|
|
Non-current |
|
|
|
|
|
|
| 52,022,256 |
| 48,445,011 |
|
|
|
|
|
|
Explanatory Notes to the Financial Statement
(In thousands of Reais, except when otherwise indicated)
For debts linked to derivatives, the effective rates are shown in the explanatory note 5.6.
To calculate the average rates, on an annual basis, the average annual CDI rate of 11.65% per year was considered. (13.65% per year. As at December 31, 2022) and TJLP of 6.55% per year. (7.20% per year as at December 31, 2022).
All debts with maturity dates denominate in foreign currency are hedged against foreign exchange risk through derivatives (note 5.6), except for perpetual notes.
Loans, borrowings and debentures that are classified as non-current have the following maturities:
| Parent Company |
| Consolidated | ||||
| 12/31/2023 |
| 12/31/2022 |
| 12/31/2023 |
| 12/31/2022 |
1 to 2 years | 569,067 |
| 571,971 |
| 4,800,498 |
| 4,534,638 |
2 to 3 years | — |
| 571,564 |
| 6,255,752 |
| 6,663,907 |
3 to 4 years | 360,698 |
| — |
| 6,626,698 |
| 5,631,841 |
4 to 5 years | 3,319,442 |
| 372,687 |
| 7,554,468 |
| 8,550,932 |
5 to 6 years | 3,327,245 |
| 772,925 |
| 8,143,128 |
| 4,836,087 |
6 to 7 years | 3,101,714 |
| 428,001 |
| 6,777,099 |
| 6,527,516 |
7 to 8 years | 1,650,648 |
| 794,668 |
| 2,599,593 |
| 2,180,672 |
Over 8 years | 366,523 |
| 1,161,263 |
| 9,265,020 |
| 9,519,418 |
| 12,695,337 |
| 4,673,079 |
| 52,022,256 |
| 48,445,011 |
b) Movement
| Parent Company |
| Consolidated |
At January 1, 2022 | 8,164,256 |
| 45,659,037 |
Business combination | — |
| 12,825 |
Funding | 9,450,210 |
| 23,886,960 |
Amortization of principal | — |
| (15,278,378) |
Interest payment | (830,380) |
| (3,441,978) |
Transfer | (12,196,109) |
| — |
Interest, foreign exchange variation and fair value | 887,651 |
| 2,148,750 |
Balance as of December 31, 2022 | 5,475,628 |
| 52,987,216 |
Funding | 8,636,528 |
| 12,785,628 |
Amortization of principal | (579,942) |
| (8,054,763) |
Interest payment | (973,919) |
| (3,552,292) |
Payment of interest on work in progress | — |
| (288,569) |
Interest, foreign exchange variation and fair value | 938,029 |
| 3,027,434 |
Balance as of December 31, 2023 | 13,496,324 |
| 56,904,654 |
Explanatory Notes to the Financial Statement
(In thousands of Reais, except when otherwise indicated)
c) Guarantees
The subsidiary Rumo has entered into financing contracts with development banks, intended for investments with a bank guarantee, according to each contract, with an average cost of 0.70% per year or by real guarantees (assets) and escrow account. As of December 31, 2023, the balance of bank guarantees contracted was R$3,120,034 (R$3,037,453 as of December 31, 2022).
The subsidiary CLI has a bank guarantee for a loan from Cosan Lubrificantes S.R.L. (“Moove Argentina”), with an average annual cost of 0.18%, and guarantee with top-tier banks for payment to third parties, with an average annual cost of 3.90%. As at December 31, 2023, the balance of contracted guarantees was R$31,931 (R$ 44,813 as at December 31, 2022).
The subsidiary Cosan Oito has loans in foreign currency (Resolution 4,131) with top banking institutions, which are guaranteed by 100% of the Vale shares that are in the Collar structure.
d) Available credit line
As of December 31, 2023, the Company had credit lines with banks rated AA, which were not used, in the amount of R$2,102,756 (R$3,052,287 as of December 31, 2022). The use of these lines of credit is subject to certain contractual conditions.
e) Offset of assets and liabilities
INTERNALIZATION OF SENIOR NOTES 2030
In June 2023, the Company, through its subsidiary Cosan Luxembourg S.A. (“Cosan Lux”), carried out an offering of senior notes in the amount of US$550,000 thousand with a coupon of 7.50% and maturing in 2030 (“Senior Notes 2030”).
On September 29, 2023, the Company internalized the remaining resources arising from this debt, through the issuance of debentures by Cosan S.A., referenced in US dollars in the amount of R$ 1,491 million (equivalent to US$ 300,000 thousand), with coupon annual rate of 16.04% per year for first interest payment and 8.02% per year for the others. In return, Cosan Luxembourg contracted a Total Return Swap (“TRS”) with the same amount and counterparty in US dollars, with semi-annual payment frequency and annual remuneration of 15.52% per year for the first interest remuneration and 7.50% per year for the others, which has the 7th issue of the debenture as the underlying asset.
INTERNALIZATION OF SENIOR NOTES 2029
In July 2019, Cosan Limited ("Cosan Limited") held a senior Notes offer for a total volume of US$750,000, equivalent to R$4,147,650, with a coupon of 5.5% and expiry date 2029 ("Bond 2029").
The Company carried out the reverse incorporation of Cosan Limited, approved in January 2021, being certain that the Company succeeded Cosan Limited in all rights and obligations arising, as amended in the First Supplemental Indenture, dated February 2021.
Subsequently, the Company ceded its rights and obligations to Cosan Luxembourg ("Cosan Lux") pursuant to the Second Supplemental Indenture, dated May 2022, in conjunction with the Third Supplemental Indenture, dated July 2022. In the assignment of rights, the Company and Cosan Lux signed a mutual contract (July 2022), with the commitment of payment by the Company in the amount of interest and principal, exactly equal to Bond 2029. Two additions were made, where the Company prepaid US$30,000, equivalent to R$164,250, and US$121,313, equivalent to R$641,090, made in July and August 2022, respectively. The balance of the main contract was US$ 598,687 thousand, equivalent to R$ 2,919,557.
On December 2023 the Company carried out the internalization operation with Banco Santander acquiring a position in a Total Return Swap ("TRS") with Banco Santander (Brazil) S.A. Grand Cayman Branch ("Santander Cayman"), which will have as underlying asset foreign exchange debentures, referenced in USD, issued by the Company, in the amount of US$598,000, equivalent to R$2,919,557, pursuant to CVM Resolution 160 ("Debentures") which were fully subscribed by Banco Santander (Brazil) S.A. ("Santander"), and with this the total liquidation of the intercompany was carried out, remitting the recourse to Cosan Lux, and acquiring the position of TRS.
Since the Company has the legally enforceable right to offset the amounts and have the intention to settle them simultaneously, for consolidation purposes, the Company made the compensation in the balance sheet of the asset related to the contracting of TRS with the debt liability arising from the debentures, presenting them at net value, and their respective impacts on the income statement. In this way, sensitivity analysis is also not performed because both transactions have no risk to the Company.
Explanatory Notes to the Financial Statement
(In thousands of Reais, except when otherwise indicated)
| Consolidated | ||||
| Gross value |
| Compensated amount |
| Net value |
TRS (Notional) | 4,347,487 |
| (4,347,487) |
| — |
TRS (Interest) | 6,704 |
| (6,704) |
| — |
| 4,354,191 |
| (4,354,191) |
| — |
|
|
|
|
|
|
Debentures principal and exchange rate variation) (i) | (4,347,487) |
| 4,347,487 |
| — |
Debentures (interest) | (6,704) |
| 6,704 |
| — |
| (4,354,191) |
| 4,354,191 |
| — |
| (i) | The amounts are equivalent to US$898,000 thousand, with the PTAX conversion rate of September 29,2023 being R$4.8413. |
f) Fair value and exposure to financial risk
The fair value of loans is determined by discounting future cash flows at their implied discount rate. Due to the use of unobservable inputs, including own credit risk, they are classified as fair value at level 2 of the hierarchy (Note 5.12).
Details of the Company's exposure to risks arising from loans are shown in Note 5.12.
Explanatory Notes to the Financial Statement
(In thousands of Reais, except when otherwise indicated)
Accounting policy: Upon inception or modification of a contract, the Company assesses whether the contract is or contains a lease. The lease liability is initially measured at the present value of the lease payments that are not made on the commencement date, discounted at the interest rate implicit in the lease or, if that rate cannot be determined easily, at the Company's incremental borrowing rate. The Company's incremental borrowing rate is generally used as the discount rate. The lease payments included in calculating the lease liability are as follows:
To calculate the incremental borrowing rate, the Company:
The incremental (nominal) interest rate used by the Company and its subsidiaries was determined based on interest rates, adjusted for functional currency and the terms of its contracts. Rates between 8.23% and 13.73% were used, according to the term and currency of each contract. In addition, for the measurement of the lease liability, the Company may account for two or more contracts together provided that:
Variable lease payments that do not depend on an index or rate are recognized as expenses in the period in which the event or condition that generates these payments occurs. The Company is exposed to potential future increases in variable lease payments based on an index or rate, which are not included in the lease liability until they come into effect. When adjustments to lease payments based on an index or rate come into effect, the lease liability is revalued and adjusted against the right of use asset. Lease payments are allocated between the principal and the financial cost. The financial cost is debited to profit over the lease period to produce a constant periodic interest rate on the remaining balance of the liability in each period. Payments associated with short-term leases of equipment and vehicles and all leases of low value assets are recognized by the linear method as an expense in the result. Short-term leases are leases with a lease term of 12 months or less. Low-value assets comprise IT equipment and small items of office furniture. In determining the term of the lease, the Company considers all facts and circumstances that create an economic incentive to exercise the option of extension, or not to exercise the option of termination. Extension options (or periods after termination options) are only included in the lease term if there is reasonable certainty that it will be extended (or not terminated). |
Explanatory Notes to the Financial Statement
(In thousands of Reais, except when otherwise indicated)
For warehouse rentals, retail stores and equipment, the following factors are usually the most relevant:
Most of the extension options in offices and car rentals were not included in the rental liability because the Company could replace the assets without significant cost or business interruption. The subsequent valuation of the lease liability is at amortized cost, using the effective interest rate method. It is revalued when there is a change in future lease payments resulting from a change in index or rate, if there is a change in the amounts expected to be paid according to the residual value guarantee, if the Company changes its valuation, one the option will be exercised in the purchase, extension or termination or if there is an essentially fixed revised lease payment. |
| Parent Company |
| Consolidated |
At January 1, 2022 | 40,047 |
| 3,267,678 |
Business combination | — |
| 174,229 |
Additions | 542 |
| 224,714 |
Write-offs | (7,769) |
| (116,157) |
Settlement interest and foreign exchange variation | 3,437 |
| 377,449 |
Repayment of principal | (5,051) |
| (400,248) |
Payment of interest | (3,933) |
| (211,611) |
Contractual adjustment | 3,092 |
| 221,077 |
Transfers between liabilities | — |
| (4,973) |
At December 31, 2022 | 30,365 |
| 3,532,158 |
Additions (i) | — |
| 1,923,138 |
Write-offs | — |
| (15,329) |
Settlement interest and foreign exchange variation | 7,566 |
| 458,507 |
Repayment of principal | (5,524) |
| (490,012) |
Payment of interest | (3,615) |
| (236,948) |
Contractual adjustment | 751 |
| 104,280 |
At December 31, 2023 | 29,543 |
| 5,275,794 |
Current | 8,959 |
| 733,063 |
Non-current | 20,584 |
| 4,542,731 |
| 29,543 |
| 5,275,794 |
| (i) | The addition of the period is mainly composed of the contract related to the charter of the floating storage and regasification unit (“FRSU”) see note 2. |
Explanatory Notes to the Financial Statement
(In thousands of Reais, except when otherwise indicated)
The lease agreements have different terms, with the last due date occurring in December 2058. The amounts are updated annually by inflation indexes (such as IGPM and IPCA) or may incur interest calculated based on the TJLP or CDI and some of the contracts have renewal or purchase options that were considered in determining the term and classification as finance lease.
In addition to the amortization and appropriation of interest and exchange variation highlighted in the previous tables, the following impacts on income were recorded for the other lease contracts that were not included in the measurement of lease liabilities.
| 12/31/2023 |
| 12/31/2022 |
Variable lease payments not included in the recognition of lease obligations | 43,115 |
| 56,612 |
Expenses related to short-term leases | 37,739 |
| 14,986 |
Low asset leasing costs, excluding short-term leases | 5,376 |
| 1,445 |
| 86,230 |
| 73,043 |
The lease balances recorded by the Company include the contract for the indirect subsidiary Rumo Malha Central and the amendment to renew the contract for the indirect subsidiary Rumo Malha Paulista, which have an identified implicit rate and are, therefore, readily determinable in such cases. In other words, in these cases the valuation does not generate the distortions in the liabilities and right of use object of CVM Circular Letter 2/2019. This particularity of the Company means that the effects on the balances (of lease liabilities, right of use, financial expenses and depreciation expenses) if the measurement were made by the present value of the expected installments plus projected future inflation, would not are relevant to influence users' decisions and, consequently, to be presented in the financial statements.
The Company recorded lease liabilities at the present value of the installments due, that is, including any tax credits to which it will be entitled at the time of payment of the leases. The potential PIS/COFINS credit included in liabilities as at December 31, 2023, is R$32,244 (R$6,318 as at December 31, 2022).
Accounting policy: Initial recognition of derivatives at fair value occurs on the date a derivative contract is entered into, and derivatives are subsequently remeasured at fair value at the end of each reporting period. Whether subsequent changes in fair value are recorded depends on whether the derivative is designated as a hedging instrument and, if so, the nature of the item being hedged. The Company identifies certain derivatives as:
At the inception of the hedging relationship, the Company documents the economic relationship between the hedging instruments and the hedged items, including expected changes in the cash flows of the hedging instruments. The Company documents its risk management objective and strategy for hedging transactions. Changes in the fair value of any derivative instrument that do not qualify for hedge accounting are immediately registered in the income statement and included in other financial revenue (expenses). The fair values of derivative financial instruments designated in hedging relationships are disclosed below. The total fair value of a hedging derivative is classified as a non-current asset or liability when the remaining maturity of the hedged item is greater than 12 months; it is classified as a current asset or liability when the remaining maturity of the hedged item is less than 12 months. The Company evaluates, both at the beginning of the hedging relationship and on an ongoing basis, whether the hedging instruments are anticipated to be highly effective in offsetting changes in the fair value or cash flows of the respective attributable hedged items. The actual results of each hedge for the hedged risk fall between 60% and 140%. The Company maintains a portfolio of energy contracts (purchase and sale) designed to meet supply and demand for energy consumption or supply. In addition, there is a portfolio of forward positions comprising contracts. There is no purchase commitment associated with this portfolio's sales contract. |
Explanatory Notes to the Financial Statement
(In thousands of Reais, except when otherwise indicated)
Considering its policies and risk limits, the Company has the flexibility to manage the contracts in this portfolio in order to profit from changes in market prices. This portfolio contains contracts that may be settled net in cash or another financial instrument (for example: by entering an offsetting contract with the counterparty; or by "unwinding a position" from the contract prior to its exercise or expiration; or shortly after purchase, selling for the purpose of generating a profit from short-term fluctuations in price or gain on resale margin). These energy purchase and sale transactions occur on an active market and qualify as financial instruments because they are settled at net cash value and are easily convertible to cash. These contracts are treated as derivatives and are recognized in the balance sheet at fair value on the date the derivative is entered into and remeasured at fair value on the balance sheet date. Financial assets and liabilities are offset, and the net amount is reported in the balance sheet, when there is a legal right to offset the recognized amounts and intent to settle them on a net basis, or when the asset is realized and the liability is settled simultaneously. The legal right must be enforceable in the ordinary course of business and in the event of default, insolvency, or bankruptcy of the company or the counterparty. The estimated fair value of these derivatives is based in part on price quotations published in active markets, to the extent that such observable market data exists, and in part on valuation techniques that consider: (i) prices established in recent purchase and sale transactions, (ii) margin of risk in the supply, and (iii) projected market price in the availability period. A fair value gain or loss is recognized at the base date whenever the fair value at initial recognition for these contracts differs from the transaction price. A financial asset previously accounted for in accordance with IFRS 9/CPC 48 may become an investee accounted for by equity when: • the investor acquires an additional stake; or • There is a change in circumstances that results in obtaining significant influence or joint control. |
The Company uses swap instruments, whose fair value is determined from discounted cash flows discounted cash flows based on market curves, to hedge the exposure to foreign exchange risk and exposure to foreign exchange risk and interest and inflation risk. The consolidated data are presented below:
Explanatory Notes to the Financial Statement
(In thousands of Reais, except when otherwise indicated)
| Parent Company |
| Consolidated | ||||||||||||
| Notional |
| Fair value |
| Notional |
| Fair value | ||||||||
| 12/31/2023 |
| 12/31/2022 |
| 12/31/2023 |
| 12/31/2022 |
| 12/31/2023 |
| 12/31/2022 |
| 12/31/2023 |
| 12/31/2022 |
Exchange rate derivatives |
|
|
|
|
|
|
|
|
|
|
|
|
|
|
|
Forward agreements (i) | — |
| — |
| — |
| — |
| 6,716 |
| 53,012 |
| (147) |
| (485) |
FX option agreements | — |
| — |
| — |
| — |
| 363,098 |
| 676,214 |
| 30,677 |
| 25,360 |
| — |
| — |
| — |
| — |
| 369,814 |
| 729,226 |
| 30,530 |
| 24,875 |
Commodity derivatives |
|
|
|
|
|
|
|
|
|
|
|
|
|
|
|
Contracts for gas options | — |
| — |
| — |
| — |
| 28,494 |
| — |
| 4,333 |
| — |
Option agreements (ii) | — |
| — |
| — |
| — |
| — |
| — |
| — |
| 21,744 |
| — |
| — |
| — |
| — |
| 28,494 |
| — |
| 4,333 |
| 21,744 |
Interest rate and exchange rate risk |
|
|
|
|
|
|
|
|
|
|
|
|
|
|
|
Swap agreements (interest rate) (iii) | 7,038,443 |
| 9,255,278 |
| (9,945) |
| (195,017) |
| 7,209,400 |
| 9,255,278 |
| (10,686) |
| (155,518) |
Swap agreements (interest and FX) (iv) | 10,434,580 |
| 7,318,840 |
| (562,802) |
| 901,749 |
| 18,260,969 |
| 17,191,070 |
| (1,546,736) |
| 790,840 |
Forward agreements (interest and FX) (v) | 126,472 |
| — |
| (3,720) |
| — |
| 8,985,594 |
| 12,811,427 |
| (939,559) |
| 760,152 |
Swap agreements (interest and inflation) (iii) | — |
| — |
| — |
| — |
| 14,307,844 |
| 10,070,343 |
| 853,639 |
| (500,444) |
| 17,599,495 |
| 16,574,118 |
| (576,467) |
| 706,732 |
| 48,763,807 |
| 49,328,118 |
| (1,643,342) |
| 895,030 |
Share price risk |
|
|
|
|
|
|
|
|
|
|
|
|
|
|
|
Swap agreements - (TRS) (vi) | 1,775,341 |
| 1,515,827 |
| 88,298 |
| 43,130 |
| 1,775,341 |
| 1,515,827 |
| 88,297 |
| 43,130 |
Call Spread (v) | — |
| — |
| — |
| — |
| 5,594,212 |
| 5,594,212 |
| 366,296 |
| 1,954,493 |
Collar (Vale Shares) (v) | — |
| — |
| — |
| — |
| 13,114,720 |
| 16,931,662 |
| 285,540 |
| (4,078,452) |
| 1,775,341 |
| 1,515,827 |
| 88,298 |
| 43,130 |
| 20,484,273 |
| 24,041,701 |
| 740,133 |
| (2,080,829) |
Total financial instruments |
| (488,169) |
| 749,862 |
|
|
|
|
| (868,346) |
| (1,139,180) | |||
Current assets |
|
|
|
| 54,935 |
| — |
|
|
|
|
| 202,399 |
| 1,086,698 |
Non-current assets |
|
|
|
| 102,881 |
| 1,368,809 |
|
|
|
|
| 2,344,400 |
| 3,065,054 |
Current liabilities |
|
|
|
| (364,747) |
| — |
|
|
|
|
| (1,250,520) |
| (1,039,357) |
Non-current liabilities |
|
|
|
| (281,238) |
| (618,947) |
|
|
|
|
| (2,164,625) |
| (4,251,575) |
Total |
|
|
|
| (488,169) |
| 749,862 |
|
|
|
|
| (868,346) |
| (1,139,180) |
| (i) | To hedge exposures and expenses in foreign currency, the Company and its subsidiaries have foreign exchange forward agreements and/or options indexed to foreign exchange. | |
| (ii) | Call options on Brent for hedging purposes, intended to provide protection in the event that the commodity's price rises above the agreed-upon price due to the Ukraine-Russia war. | |
| (iii) | The Company structured derivatives to protect against exposure to pre-fixed interest in Reais in order to convert such debt into post-fixed debt. | |
| (iv) | The Company and its subsidiary Rumo conduct interest and foreign exchange swap operations, making the Company active in U.S. Dollar + fixed interest and passive in a portion of the CDI. In interest and inflation Swap operations, the Company is active in Extended National Consumer Price Index (Índice Nacional de Preços ao Consumidor Amplo) ("IPCA") + fixed interest and passive in CDI percentage. | |
| (v) | The Company structured derivatives, as described in Note 1.1, to protect against price fluctuations in Vale's shares. | |
| (vi) | The Company entered into a Total Return Swap ("TRS") agreement with commercial banks. According to the TRS, which will have a financial settlement, Cosan will receive the return on the price variation of CSAN3 shares, adjusted for dividends for the period, and will pay annual interest referenced to CDI + Spread. The contracted equivalent quantity of CSAN3 shares with TRS was 97,215,812 shares, and the initial total was R$1,265,790. The Company's mark-to-market result for financial revenue as at December 31, 2023 was R$83,390 (a financial revenue of R$375,693 as at December 31, 2022). |
Explanatory Notes to the Financial Statement
(In thousands of Reais, except when otherwise indicated)
Below, we demonstrate the opening value of derivative debt and non-debt derivative financial instruments:
|
|
| Parent company |
| Consolidated | ||||
| Note |
| 12/31/2023 |
| 12/31/2022 |
| 12/31/2023 |
| 12/31/2022 |
Derivative financial instruments | 5.12 |
| (576,467) |
| 706,733 |
| (990,764) |
| (1,228,928) |
Non-derivative financial instruments |
|
| 88,298 |
| 43,129 |
| 122,418 |
| 89,748 |
|
|
| (488,169) |
| 749,862 |
| (868,346) |
| (1,139,180) |
Derivatives are only used for economic hedging purposes and not as speculative investments.
a) Fair value hedge
The Company adopts fair value hedge accounting for some of its operations, both the hedging instruments and the hedged items are measured and recognized at fair value through profit or loss.
There is an economic relationship between the hedged item and the hedging instrument as the terms of the interest rate and exchange rate swap correspond to the terms of the fixed rate loan, i.e. notional amount, term and payment. The Company established a 1:1 coverage ratio for the hedging relationships, as the underlying risk of the interest rate and exchange rate swap is identical to the hedged risk component. To test the effectiveness of the hedge, the Company uses the discounted cash flow method and compares changes in the fair value of the hedging instrument with changes in the fair value of the hedged item attributable to the hedged risk. The sources of hedge ineffectiveness that are expected to affect the hedging relationship during its term evaluated by the Company are mainly: (i) reduction or modification of the hedged item; and (ii) a change in the credit risk of the Company or the counterparty of the contracted swaps. The amounts related to the items designated as hedging instruments were as follows:
|
|
| Registered value |
| Accumulated fair value adjustment | ||||
| Notional |
| 12/31/2023 |
| 12/31/2022 |
| 12/31/2023 |
| 12/31/2022 |
FX rate risk hedge |
|
|
|
|
|
|
|
|
|
Designated items |
|
|
|
|
|
|
|
|
|
Senior notes 2028 (Rumo Luxembourg) | (2,791,600) |
| (2,178,449) |
| (2,196,083) |
| 167,874 |
| (336,161) |
Senior notes 2032 (Rumo Luxembourg) | (2,259,375) |
| (2,066,885) |
| (2,124,051) |
| 126,408 |
| (629,220) |
NCE USD (Rumo Malha Norte) | (483,400) |
| (487,544) |
| — |
| 3,147 |
| — |
PPE 1 – (Export prepayment) 1 (Moove) | — |
| — |
| (156,884) |
| — |
| 2,389 |
PPE 2 – (Export prepayment) 2 (Moove) | — |
| — |
| (104,667) |
| — |
| 2,624 |
Total debt | (5,534,375) |
| (4,732,878) |
| (4,581,685) |
| 297,429 |
| (960,368) |
Derivative financial instruments |
|
|
|
|
|
|
|
|
|
Swaps Senior Notes 2028 (Rumo Luxembourg) | 2,791,600 |
| (460,939) |
| (418,674) |
| 42,265 |
| 685,200 |
Swaps Senior Notes 2032 (Rumo Luxembourg) | 2,259,375 |
| (239,630) |
| (128,986) |
| 110,644 |
| 804,558 |
Swap exchange rate and interest (Rumo Malha Norte) | 483,400 |
| 5,293 |
| — |
| (5,293) |
| — |
SWAP - Export prepayment - PPE 1 (Moove) | — |
| — |
| (11,079) |
| — |
| (11,079) |
SWAP - Export prepayment - PPE 2 (Moove) | — |
| — |
| (7,067) |
| — |
| (7,067) |
Total derivatives | 5,534,375 |
| (695,276) |
| (565,806) |
| 147,616 |
| 1,471,612 |
Total | — |
| (5,428,154) |
| (5,147,491) |
| 445,045 |
| 511,244 |
Explanatory Notes to the Financial Statement
(In thousands of Reais, except when otherwise indicated)
|
| Registered value |
| Accumulated fair value adjustment | |||||
| Notional |
| 12/31/2023 |
| 12/31/2022 |
| 12/31/2023 |
| 12/31/2022 |
Interest rate risk hedge |
|
|
|
|
|
|
|
|
|
Designated items |
|
|
|
|
|
|
|
|
|
Debenture 5th issue - single series (Comgás) | — |
| — |
| (907,366) |
| — |
| (33,892) |
BNDES Project VIII (Comgás) | (1,000,000) |
| (803,990) |
| (851,689) |
| 54,807 |
| 70,260 |
Debenture (Rumo) | (7,485,276) |
| (7,973,671) |
| (5,755,679) |
| 397,073 |
| (327,290) |
Finem (Rumo) | (28,107) |
| (36,301) |
| (28,115) |
| 971 |
| (1,644) |
CCB (Rumo) | (975,292) |
| (954,205) |
| (785,366) |
| (10,088) |
| (4,418) |
Total debt | (9,488,675) |
| (9,768,167) |
| (8,328,215) |
| 442,763 |
| (296,984) |
Derivative financial instruments |
|
|
|
|
|
|
|
|
|
Debenture 5th issue - single series (Comgás) | — |
| — |
| 221,000 |
| (221,000) |
| 1,248 |
BNDES Project VIII (Comgás) | 1,000,000 |
| (56,085) |
| (90,193) |
| 34,108 |
| (61,242) |
Swaps Debenture (Rumo) | 7,485,276 |
| 559,964 |
| (148,662) |
| (708,626) |
| 72,856 |
Finem (Rumo) | 28,107 |
| 1,600 |
| (558) |
| (2,158) |
| 558 |
CCB (Rumo) | 975,292 |
| (15,221) |
| (6,976) |
| 8,245 |
| 6,976 |
Derivative total | 9,488,675 |
| 490,258 |
| (25,389) |
| (889,431) |
| 20,396 |
Total | — |
| (9,277,909) |
| (8,353,604) |
| (446,668) |
| (276,588) |
b) Fair value options
Certain derivative instruments were not designated to documented hedging structures.
The Company chose to designate the hedged liabilities (hedge objects) to be recorded at fair value through profit or loss. Considering that derivative instruments are always accounted for at fair value through profit or loss, the accounting effects are the same as those that would be obtained through hedging documentation:
|
|
|
|
| Registered Value |
| Accumulated fair value | ||||
|
|
| Notional |
| 12/31/2023 (Restated) |
| 12/31/2022 |
| 12/31/2023 (Restated) |
| 12/31/2022 |
FX rate risk |
|
|
|
|
|
|
|
|
|
|
|
Items |
|
|
|
|
|
|
|
|
|
|
|
Senior Notes 2027 (Cosan Luxembourg) | USD+7.0% |
| (1,897,790) |
| (2,016,330) |
| (3,587,265) |
| 528,855 |
| 967,778 |
Export Credit Agreement (Rumo) | EUR + 0.58% |
| (38,054) |
| (48,849) |
| (68,455) |
| (1,444) |
| 377 |
Resolution 4131 (Rumo) | USD + 2.20% |
| — |
| — |
| — |
| — |
| 247 |
Resolution 4131 (Comgás - 2021) | USD + 1.60% |
| (407,250) |
| (362,774) |
| (377,705) |
| 2,106 |
| 15,545 |
Resolution 4131 (Comgás - 2022) | USD + 2.51% |
| (1,097,400) |
| (943,486) |
| (1,000,957) |
| 33,324 |
| 51,798 |
Resolution 4131 (Comgás - 2022) | USD + 4.76% |
| (749,310) |
| (734,191) |
| — |
| (5,468) |
| — |
Resolution 4131 (Comgás - 2018) | USD + 4.32% |
| — |
| — |
| (395,285) |
| — |
| (2,680) |
Total |
|
| (4,189,804) |
| (4,105,630) |
| (5,429,667) |
| 557,373 |
| 1,033,065 |
|
|
|
|
|
|
|
|
|
|
|
|
Derivative instruments |
|
|
|
|
|
|
|
|
|
|
|
Swap Senior Notes 2027 (Cosan Luxembourg) | 113.15% CDI |
| 1,897,790 |
| (46,214) |
| 1,285,454 |
| (379,397) |
| (736,466) |
FX and interest rate swaps (Rumo) | 108% CDI |
| 38,054 |
| 9,316 |
| 15,468 |
| 6,153 |
| 15,067 |
FX and interest rate swaps (Rumo) | 118% CDI |
| — |
| — |
| — |
| — |
| 47,527 |
Resolution 4131 (Comgás - 2021) | CDI + 1.25% |
| 407,250 |
| (63,184) |
| (50,245) |
| (12,939) |
| (88,612) |
Resolution 4131 (Comgás - 2022) | CDI + 1.20% |
| 1,097,400 |
| (212,180) |
| (160,369) |
| (51,811) |
| (217,215) |
Resolution 4131 (Comgás - 2023) | CDI + 1.30% |
| 749,310 |
| (22,611) |
| — |
| (22,611) |
| — |
Resolution 4131 (Comgás - 2018) | 107.9% of CDI |
| — |
| — |
| 123,760 |
| (123,760) |
| (61,685) |
Total derivatives |
|
| 4,189,804 |
| (334,873) |
| 1,214,068 |
| (584,365) |
| (1,041,384) |
Total |
|
| — |
| (4,440,503) |
| (4,215,599) |
| (26,992) |
| (8,319) |
Explanatory Notes to the Financial Statement
(In thousands of Reais, except when otherwise indicated)
|
|
|
|
| Registered Value |
| Accumulated fair value adjustment | ||||
|
|
| Notional |
| 12/31/2023 (Restated) |
| 12/31/2022 |
| 12/31/2023 (Restated) |
| 12/31/2022 |
Interest rate risk |
|
|
|
|
|
|
|
|
|
|
|
Items |
|
|
|
|
|
|
|
|
|
|
|
Debenture 4th issue - 3rd series (Comgás) | IPCA + 7.36% |
| (114,818) |
| (80,960) |
| (114,014) |
| (708) |
| (114,014) |
Debenture 6th issue - single series (Comgás) | IPCA + 4.33% |
| (523,993) |
| (554,147) |
| (523,837) |
| 3,509 |
| (523,837) |
Debenture 9th issue - 1st series (Comgás) | IPCA + 5.12% |
| (500,000) |
| (550,342) |
| (491,153) |
| 19,868 |
| (6,179) |
Debenture 9th issue - 2nd series (Comgás) | IPCA + 5.22% |
| (500,000) |
| (533,854) |
| (467,841) |
| 34,919 |
| 9,737 |
BNDES Projects VI and VII (Comgás) | IPCA + 4.10% |
| (160,126) |
| (112,946) |
| (131,885) |
| (150) |
| (131,885) |
BNDES Project VIII (Comgás) | IPCA + 3.25% |
| (870,149) |
| (743,674) |
| (801,812) |
| 5,967 |
| (801,812) |
BNDES Project IX (Comgás) | IPCA + 5.74% |
| (565,582) |
| (598,752) |
| (544,925) |
| (19,875) |
| (544,925) |
Debenture (Rumo) | IPCA + 4.68% |
| (300,000) |
| (396,201) |
| (518,680) |
| 13,474 |
| (6,070) |
Debenture (Rumo) | IPCA + 4.50% |
| (600,000) |
| (774,939) |
| (704,954) |
| 34,721 |
| (34,745) |
Total |
|
| (4,134,668) |
| (4,345,815) |
| (4,299,101) |
| 91,725 |
| (2,153,730) |
Derivative instruments |
|
|
|
|
|
|
|
|
|
|
|
Debenture 4th issue - 3rd series (Comgás) | 94.64% CDI |
| — |
| — |
| — |
| — |
| (3,900) |
Debenture 4th issue - 3rd series (Comgás) | 112.49% CDI |
| 114,818 |
| 4,567 |
| (778) |
| 5,345 |
| (5,096) |
Debenture 6th issue - single series (Comgás) | 89.9% CDI |
| 523,993 |
| 20,116 |
| (10,419) |
| 30,535 |
| (26,161) |
Debenture 9th issue - 1st series (Comgás) | 109.20% CDI |
| 500,000 |
| 42,093 |
| (17,705) |
| 59,798 |
| (37,517) |
Debenture 9th issue - 2nd series (Comgás) | 110.60% CDI |
| 500,000 |
| 26,901 |
| (40,441) |
| 67,342 |
| (53,304) |
BNDES Projects VI and VII (Comgás) | 87.50% CDI |
| 160,126 |
| 64 |
| (2,046) |
| 2,110 |
| (6,923) |
BNDES Project VIII (Comgás) | 82.94% CDI |
| 870,149 |
| (6,578) |
| (21,039) |
| 14,461 |
| (48,613) |
BNDES Project IX (Comgás) | 98.9% CDI |
| 565,582 |
| 46,904 |
| (6,632) |
| 53,536 |
| (6,632) |
Debenture (Rumo) | 107% CDI |
| 300,000 |
| 81,885 |
| 76,194 |
| (5,691) |
| (4,819) |
Debenture (Rumo) | 103% CDI |
| 600,000 |
| 147,429 |
| 74,092 |
| (73,337) |
| 8,252 |
Total derivatives |
|
| 4,134,668 |
| 363,381 |
| 51,226 |
| 154,099 |
| (184,713) |
Total |
|
| — |
| (3,982,434) |
| (4,247,875) |
| 245,824 |
| (2,338,443) |
c) Cash flow hedge
Compass
Natural gas purchase and sale contracts
The indirect subsidiary Compass Comercialização S.A. entered natural gas purchase (JKM risk) and sale agreements (BRENT risk) with a third party and related party. To protect and mitigate the risks arising from fluctuations in natural gas indexes, the subsidiary designated this operation subject to hedge accounting for the respective cash flow protection.
In this contracting, the expected benefits are: reducing the financial risk associated with fluctuations in natural gas prices, avoiding fluctuations in the financial result of hedge instruments, protecting the subsidiary's margins, as well as maintaining predictability in its costs or revenues, ensuring greater stability in operating results.
Highly probable revenues in US dollars (Leasing)
The indirect subsidiary TRSP adopted a hedge accounting strategy to protect its results from exposure to variability in cash flows arising from the exchange rate effects of highly probable revenues in US dollars projected for a period of 20 years, through non-derivative hedging instruments – lease liabilities in US dollars already contracted.
Explanatory Notes to the Financial Statement
(In thousands of Reais, except when otherwise indicated)
Rumo
Investment costs
The subsidiary Rumo S.A contracted certain derivative instruments to protect certain investment costs contracted for the period of 2023 and opted to link the instruments to documented hedge structures:
As at December 31, 2023, there was no ineffective portion reclassified to profit or loss. The impacts recognized in the subsidiary's shareholders' equity and the estimated realization in shareholders' equity are shown below:
a) Composition
Financial instruments |
| Subsidiary |
| Risk |
| Unit |
| Notional R$ |
| Fair value 12/31/2023 |
| Book value 12/31/2023 |
Future |
| Compass |
| BRENT |
| Barrel |
| 368,000 |
| (2,843) |
| (2,843) |
Leasing |
| Compass |
| FX rate |
| BRL |
| 1,548,942 |
| (18,071) |
| (18,071) |
Effect on balance sheet |
|
|
|
|
|
|
| 1,916,942 |
| (20,914) |
| (20,914) |
b) Movement
Financial instruments | Net financial result |
| Comprehensive income (i) |
| Gains or (losses) realized |
Future (BRENT) | (9,785) |
| (2,843) |
| — |
Future (JKM) (ii) | — |
| — |
| 12,012 |
Leasing | — |
| (18,071) |
| — |
NDF (Non deliverable forwards) (ii) | — |
| — |
| (2,280) |
December 31, 2023 | (9,785) |
| (20,914) |
| 9,732 |
| (i) | Effect of deferred income tax and social contribution is R$7,110. | |
| (ii) | Operations settled in December 2023. |
Explanatory Notes to the Financial Statement
(In thousands of Reais, except when otherwise indicated)
Accounting policy: Trade receivables are initially recognized at the unconditional consideration amount unless they contain significant financing components, in which case they are recognized at fair value. The Company holds trade receivables with the intention of collecting the contractual cash flows, and subsequently measuring them at amortized cost using the effective interest rate method. For the purpose of estimating credit losses, trade receivables have been categorized according to their credit risk characteristics and days overdue. A loss allowance for anticipated credit losses is recognized as a component of selling expenses. The expected loss rates are derived from historical credit losses incurred during the period. Historical loss rates may be modified to reflect current and forecasted information regarding macroeconomic factors that influence the ability of customers to settle receivables. The Company has determined that the implied interest rate in the agreement is the most significant factor, and as a result, it adjusts historical loss rates based on the anticipated changes to this factor. |
| Consolidated | ||
| 12/31/2023 |
| 12/31/2022 |
Domestic market | 2,790,623 |
| 3,085,227 |
Unbilled receivables (i) | 782,813 |
| 968,147 |
Foreign market - foreign currency | 32,308 |
| 28,786 |
| 3,605,744 |
| 4,082,160 |
Expected credit losses | (161,108) |
| (154,618) |
| 3,444,636 |
| 3,927,542 |
Current | 3,330,488 |
| 3,769,908 |
Non-current | 114,148 |
| 157,634 |
Total | 3,444,636 |
| 3,927,542 |
| (i) | Unbilled revenue refers to the portion of the monthly gas supply for which measurement and billing have not been completed. |
The aging of accounts receivable is as follows:
| Consolidated | ||
| 12/31/2023 |
| 12/31/2022 |
Not overdue | 3,181,795 |
| 3,514,756 |
Overdue |
|
|
|
Up to 30 days | 203,143 |
| 376,868 |
From 31 to 60 days | 48,968 |
| 40,389 |
From 61 to 90 days | 18,146 |
| 20,254 |
More than 90 days | 153,692 |
| 129,893 |
Expected credit losses | (161,108) |
| (154,618) |
| 3,444,636 |
| 3,927,542 |
Explanatory Notes to the Financial Statement
(In thousands of Reais, except when otherwise indicated)
Changes in the expected credit losses are as follows:
| Consolidated |
Balance as of January 1, 2022 | (115,052) |
Business combination | (31,923) |
Additions/reversals | (28,463) |
Exchange rate variation | (4,905) |
Write-offs | 25,725 |
Balance as of December 31, 2022 | (154,618) |
Additions/reversals | (31,053) |
Exchange rate variation | 1,353 |
Write-offs | 23,210 |
Balance as of December 31, 2023 | (161,108) |
Accounting policy The transactions between related parties are conducted at standard market prices. Unpaid balances at the end of the year are not guaranteed, do not accrue interest, and are settled in cash. There were no given or received guarantees on any accounts receivable or payable involving related parties. At the end of each period, a recovery of amounts and receivables analysis is performed, but no provision was recognized in this year. |
Explanatory Notes to the Financial Statement
(In thousands of Reais, except when otherwise indicated)
a) Accounts receivable and payable with related parties:
Parent Company |
| Consolidated | |||||
| 12/31/2023 |
| 12/31/2022 |
| 12/31/2023 |
| 12/31/2022 |
Current assets |
|
|
|
|
|
|
|
Commercial operations |
|
|
|
|
|
|
|
Raízen S.A. (i) | 7,798 |
| 7,555 |
| 63,004 |
| 79,297 |
Rumo S.A. | 6,214 |
| 3,045 |
| — |
| — |
Elevações Portuárias S.A. | 10 |
| — |
| 21,633 |
| 5,424 |
Cosan Lubrificantes e Especialidades S.A. (ii) | 5,722 |
| 3,418 |
| — |
| — |
Aguassanta Participações S.A. | 88 |
| 2,184 |
| 88 |
| 2,184 |
Compass Gás e Energia S.A. | 4,253 |
| 996 |
| — |
| — |
Termag - Terminal Marítimo de Guarujá S.A. | — |
| — |
| 9,286 |
| 14,286 |
Vale S.A. |
|
|
|
| 5,000 |
| — |
Norgás S.A. | — |
| — |
| 8,976 |
| — |
Other | 121 |
| 7,269 |
| 452 |
| 6,512 |
| 24,206 |
| 24,467 |
| 108,439 |
| 107,703 |
Financial and corporate operations |
|
|
|
|
|
|
|
Raízen S.A. (i) | 36,020 |
| 20,585 |
| 36,032 |
| 20,586 |
Cosan Oito S.A. | — |
| 6,742 |
| — |
| — |
Cosan Nove Participações S.A. (iii) | — |
| 121,621 |
| — |
| — |
Cosan Dez Participações S.A. (iii) | 111,659 |
| 111,659 |
| — |
| — |
Ligga S.A. (iv) | — |
| — |
| 107,000 |
| 107,252 |
Cosan Lubrificantes e Especialidades S.A. (ii) | — |
| 96,473 |
| — |
| — |
Other | 1,466 |
| — |
| — |
| — |
| 149,145 |
| 357,080 |
| 143,032 |
| 127,838 |
Total current assets | 173,351 |
| 381,547 |
| 251,471 |
| 235,541 |
Non-current assets |
|
|
|
|
|
|
|
Commercial operations |
|
|
|
|
|
|
|
Raízen S.A. (i) | — |
| — |
| — |
| 47,731 |
Termag - Terminal Marítimo de Guarujá S.A. | — |
| — |
| 36,952 |
| 43,810 |
| — |
| — |
| 36,952 |
| 91,541 |
Financial and corporate operations |
|
|
|
|
|
|
|
Raízen S.A. (i) | 46,911 |
| 149,347 |
| 46,935 |
| 149,347 |
Cosan Lubrificantes e Especialidades S.A. (ii) | 127,834 |
| 206,446 |
| — |
| — |
Other | — |
| — |
| 4,733 |
| 113 |
| 174,745 |
| 355,793 |
| 51,668 |
| 149,460 |
Total non-current assets | 174,745 |
| 355,793 |
| 88,620 |
| 241,001 |
Related parties receivables | 348,096 |
| 737,340 |
| 340,091 |
| 476,542 |
Explanatory Notes to the Financial Statement
(In thousands of Reais, except when otherwise indicated)
| Parent Company |
| Consolidated | ||||
| 12/31/2023 |
| 12/31/2022 |
| 12/31/2023 |
| 12/31/2022 |
Current liabilities |
|
|
|
|
|
|
|
Commercial operations |
|
|
|
|
|
|
|
Raízen S.A. (i) | 4,099 |
| 6,208 |
| 232,713 |
| 296,051 |
Termag - Terminal Marítimo de Guarujá S.A. | — |
| — |
| 10,500 |
| — |
Aguassanta Participações S.A. | — |
| — |
| 984 |
| 6,419 |
Cosan Lubrificantes e Especialidades S.A. (ii) | 1,065 |
| 1,855 |
| — |
| — |
Vale S.A. |
|
|
|
| 4,000 |
| — |
Other | 6,065 |
| 3,038 |
| 39,542 |
| 20,569 |
| 11,229 |
| 11,101 |
| 287,739 |
| 323,039 |
Financial and corporate operations |
|
|
|
|
|
|
|
Raízen S.A. (i) | 32,405 |
| 60,866 |
| 34,421 |
| 64,697 |
Cosan Overseas Limited | 31,282 |
| 33,715 |
| — |
| — |
Cosan Luxembourg S.A (v) | 123,983 |
| 1,085,617 |
| — |
| — |
Other | — |
| 46,191 |
| — |
| — |
| 187,670 |
| 1,226,389 |
| 34,421 |
| 64,697 |
Total current liabilities | 198,899 |
| 1,237,490 |
| 322,160 |
| 387,736 |
Non-current liabilities |
|
|
|
|
|
|
|
Financial and corporate operations |
|
|
|
|
|
|
|
Cosan Lubrificantes e Especialidades S.A. (ii) | 655,683 |
| 765,148 |
| — |
| — |
Cosan Luxembourg S.A (v) | 3,355,612 |
| 5,829,147 |
| — |
| — |
Cosan Overseas Limited (v) | 2,437,595 |
| 2,627,112 |
| — |
| — |
Raízen S.A. (i) | 1,078 |
| — |
| 1,078 |
| — |
Total non-current liabilities | 6,449,968 |
| 9,221,407 |
| 1,078 |
| — |
Payables to related parties | 6,648,867 |
| 10,458,897 |
| 323,238 |
| 387,736 |
| (i) | Current and non-current assets receivable from Raízen S.A. and its subsidiaries are, substantially, tax credits that will be reimbursed to the Company when realized. The preferred shares are used by Raízen to reimburse Cosan, with preferred dividends, when the net operating loss is consumed in Raízen. Current liabilities represent Cosan S.A.'s obligation to reimburse Raízen S.A. and its subsidiaries for expenses related to settled legal disputes and other liabilities incurred prior to the formation of the joint venture. |
| (ii) | On December 31, 2018, an agreement for the assumption of rights and obligations was entered into between the Company and the subsidiary Cosan Lubrificantes e Especialidades S.A. (“CLE”) and assets and liabilities related to the fuel business were transferred from the acquisition of Esso Brasileira de Petroleum Ltd. (“Esso”) in 2008, which were not contributed to the formation of Raízen, a fact that generated an increase in the Company’s related parties’ assets and liabilities accounts in that year and which has been changing as transactions are settled. This transfer of assets and liabilities does not impact the Company's consolidated position, nor the segment information. |
| (iii) | The highlighted amounts refer to expenses incurred by Cosan S.A. in the process of issuing preferred shares of Cosan Nove and Cosan Dez while they were in the process of incorporation, and which will be reimbursed by these entities. |
| (iv) | Advance for future capital increase. |
| (v) | These operations serve as a vehicle for transferring funds from the Company to the subsidiaries, which are the holders of Senior Notes and are responsible for honoring their obligations. The increases observed in these liability balances refer to the creation of a loan arising from the transfer of the Senior Notes due 2029 debt and foreign exchange rate variation, which was levied on the Export Prepayment (“PPE”) operations that we have today between the Companies and the subsidiaries Cosan Lux and Cosan Overseas Limited (“Cosan Overseas”). |
Explanatory Notes to the Financial Statement
(In thousands of Reais, except when otherwise indicated)
b) Transactions with related parties:
Parent Company | Consolidated | ||||||
| 12/31/2023 |
| 12/31/2022 |
| 12/31/2023 |
| 12/31/2022 |
Operating income |
|
|
|
|
|
|
|
Raízen S.A. (i) | — |
| — |
| 974,612 |
| 908,588 |
Elevações Portuárias S.A. | — |
| — |
| 15,434 |
| — |
Vale S.A. | — |
| — |
| 56,000 |
| — |
Other | — |
| — |
| — |
| 6,910 |
| — |
| — |
| 1,046,046 |
| 915,498 |
Purchase of products / inputs / services |
|
|
|
|
|
|
|
Raízen S.A. (i) | — |
| — |
| (2,251,896) |
| (2,528,022) |
Elevações Portuárias S.A. | — |
| — |
| (16,536) |
| — |
Vale S.A. | — |
| — |
| (52,000) |
| — |
Terminal Marítimo do Guarujá S.A. | — |
| — |
| (74,785) |
| — |
| — |
| — |
| (2,395,217) |
| (2,528,022) |
Shared income (expenses) |
|
|
|
|
|
|
|
Companhia de Gás de São Paulo - COMGÁS | (176) |
| (1,425) |
| — |
| — |
Compass Gás e Energia S.A. | 10,908 |
| 6,001 |
| — |
| — |
Cosan Lubrificantes e Especialidades S.A. | 5,275 |
| 3,816 |
| — |
| — |
Elevações Portuárias S.A. | — |
| — |
| (753) |
| — |
Payly Soluções de Pagamentos S.A. | — |
| 280 |
| — |
| — |
Raízen S.A. | (4,887) |
| (1,701) |
| (83,054) |
| (68,120) |
Rumo S.A. | 6,195 |
| 4,365 |
| — |
| — |
Sinlog Tecnologia em Logística S.A. | 129 |
| 138 |
| — |
| — |
Other | 56 |
| — |
| (2) |
| 96 |
| 17,500 |
| 11,474 |
| (83,809) |
| (68,024) |
Financial result |
|
|
|
|
|
|
|
Cosan Luxembourg S.A. | (269,661) |
| 102,283 |
| — |
| — |
Cosan Overseas Limited | (14,199) |
| (28,818) |
| — |
| — |
Raízen S.A. | — |
| (106) |
| — |
| (106) |
Aldwych Temple Venturec Capital Limited | 46,191 |
| 2,472 |
| — |
| — |
Other | — |
| 12 |
| — |
| (92) |
| (237,669) |
| 75,843 |
| — |
| (198) |
Total | (220,169) |
| 87,317 |
| (1,432,980) |
| (1,680,746) |
| (i) | The amount is related to the purchase of fuels and provision of logistics transport by the subsidiary Rumo. |
Explanatory Notes to the Financial Statement
(In thousands of Reais, except when otherwise indicated)
c) Managers’ and directors’ compensation:
The Company has a compensation policy approved by the Board of Directors. Compensation of the Company's key management personnel includes salaries, contributions to a defined post-employment benefit plan and stock-based compensation. On April 27, 2023, the Annual General Meeting approved the global annual compensation of the managers and members of the Fiscal Council for the 2023 fiscal year. We present below the result of the Parent Company as at December 31, 2023, as follows:
| 12/31/2023 |
| 12/31/2022 |
Short-term benefits to employees and managers | 44,465 |
| 38,227 |
Share-based compensation | 73,513 |
| 59,015 |
Post-employment benefits | 532 |
| 464 |
| 118,510 |
| 97,706 |
Accounting policy: Due to the short-term nature of suppliers, their carrying amounts are the same as their fair values, and they are generally paid within 30 to 45 days of recognition. |
| Parent Company |
| Consolidated | ||||
12/31/2023 |
| 12/31/2022 |
| 12/31/2023 |
| 12/31/2022 | |
Material and services suppliers | 2,431 |
| 115,146 |
| 3,110,114 |
| 2,923,486 |
Natural gas(i)/ transport and logistics suppliers | — |
| — |
| 1,074,411 |
| 1,456,365 |
| 2,431 |
| 115,146 |
| 4,184,525 |
| 4,379,851 |
Current | 2,431 |
| 115,146 |
| 3,920,273 |
| 4,318,362 |
Non-current | — |
| — |
| 264,252 |
| 61,489 |
Total | 2,431 |
| 115,146 |
| 4,184,525 |
| 4,379,851 |
| (i) | The open balance of natural gas supply primarily refers to the natural gas supply contracts with Petróleo Brasileiro S.A. (“Petrobras”). |
The carrying amounts of suppliers and other payables are the same as their fair values due to their short-term nature.
Explanatory Notes to the Financial Statement
(In thousands of Reais, except when otherwise indicated)
Accounting policy: The purpose of sectoral financial assets and liabilities is to neutralize the economic impacts on the distributors' results, due to the difference between gas cost and tax rates contained in the ordinances issued by regulatory agencies, and those contemplated in the tariff, each adjustment/ tariff revision.
These differences between the actual cost and the cost considered in the tariff adjustments generate a right as the realized cost is greater than that contemplated in the tariff, or an obligation, when the costs are lower than those contemplated in the tariff. The differences are considered in the subsequent tariff readjustment and become part of the rate readjustment index of the distributors.
In the case of distributors regulated by the Agência Reguladora de Serviços Públicos do Estado de São Paulo ("ARSESP"), as provided for in resolution 1010 of the ARSESP, any balances in the existing graphic accounts at the end of the concession will be indemnified to the distributors or returned to the users at the end of the concession period. The balance consists of: (i) the previous cycle (in amortization), which represents the balance approved by the ARSESP already contemplated in the tariff and (ii) the cycle in constitution, which are the differences that will be approved by the ARSESP in the next tariff adjustment.
Still, this resolution was about the balance contained in the current tax account, which accumulated values related to tax credits used by distributors, but that essentially are part of the tariff composition and should be subsequently passed on via tariff.
With the advent of such deliberation, the subsidiaries Comgás and Necta understand that there is no more significant uncertainty that is impeding the recognition of sectoral financial assets and liabilities as values effectively to be received or payable. In this way, it recognizes sector financial assets and liabilities in its financial statements.
However, for other distributors operating in the other states of the country the recognition of sectoral financial assets and liabilities will only be registered after the resolution of the regulatory body.
|
The following demonstrates the change in net sectorial financial assets (liabilities) for the year ending as at December 31, 2023:
| Sectorial Assets |
| Sectorial liabilities |
| Total |
At January 1, 2022 | 558,310 |
| (1,372,283) |
| (813,973) |
Cost of gas (i) | (466,743) |
| — |
| (466,743) |
Credits taxes (ii) | — |
| 16,876 |
| 16,876 |
Monetary variation (iii) | 80,996 |
| (120,804) |
| (39,808) |
Deferral of IGP-M (v) | 110,013 |
| — |
| 110,013 |
Business combination | 59,757 |
| (140,405) |
| (80,648) |
At December 31, 2022 | 342,333 |
| (1,616,616) |
| (1,274,283) |
Cost of gas (i) | (v) | 27,954 |
| — |
| 27,954 |
Tax credits (ii) | 12,425 |
| (47,144) |
| (34,719) |
Monetary update (iii) | 49,098 |
| (146,938) |
| (97,840) |
Deferral of IGP-M (iv) | 116,890 |
| — |
| 116,890 |
At December 31, 2023 | 548,700 |
| (1,810,698) |
| (1,261,998) |
|
|
|
|
|
|
Current | 207,005 |
| (70,013) |
| 136,992 |
Non-current | 341,695 |
| (1,740,685) |
| (1,398,990) |
Total | 548,700 |
| (1,810,698) |
| (1,261,998) |
Explanatory Notes to the Financial Statement
(In thousands of Reais, except when otherwise indicated)
| (i) | Refers to the cost of gas purchased in comparison to that contained in the tariffs, fully classified in current assets, since the regulator's deliberation provides for tariff recovery on an annual basis for the residential and commercial customer categories and quarterly for the others customer categories. | |
| (ii) | Refers to the net value of tax credits in the year, as per deliberation no. 1,359 of December 10, 2022. | |
| (iii) | Monetary update on the gas current account and extemporaneous credit, based on the SELIC rate. | |
| (iv) | Appropriation of the IGP-M deferral for the categories of residential and commercial customers, recognized in non-current assets, as per deliberation no. 1,162 of May 26, 2021, and 7th Addendum of the Concession Agreement on October 1, 2021. | |
| (v) | Includes the effects of R$34,193 on June 30, 2023, R$75,158 on September 26, 2023, and R$68,063 on November 24, 2023, referring to amounts redistributed to consumers. |
In view of the public hearing held by ARSESP on January 9, 2023, related to the topic of returning PIS/COFINS credits to customers, resulting from the exclusion of ICMS from their bases, subsidiaries and sector representatives presented important contributions to be considered by the agency during the analysis period. According to deliberation No. 1,491 of January 24, 2024, the availability of the Detailed Report regarding the contributions received was extended by up to 120 days, counting from the day following the end date of the previous extension, that is, January 27, 2024. Therefore, until the analysis of these contributions by the regulatory agency is completed, the topic remains open and without any specification regarding next steps, thus having no impact on this financial statement.
Accounting policy: When the fair value of financial assets and liabilities cannot be derived from active markets, their fair value is determined by means of valuation techniques, such as the discounted cash flow model. When possible, inputs to these models are obtained from observable markets; however, when this is not possible, some judgment is required to determine fair values. In determining data such as liquidity risk, credit risk, and volatility, judgment is required. Variations in these variables may impact the reported fair value of financial instruments. Specific valuation techniques used to value financial instruments include:
Level 2 includes all resulting estimates of fair value when fair values are determined based on present values and discount rates are adjusted for counterparty or own credit risk. The Company has an established control structure regarding the measurement of fair values. Significant unobservable inputs and valuation adjustments are reviewed by Management on a regular basis. If third-party information, such as brokerage quotes or pricing services, is used to measure fair values, Treasury evaluates evidence obtained from third parties to support the conclusion that these valuations comply with the Company's policy, including the market level. |
Explanatory Notes to the Financial Statement
(In thousands of Reais, except when otherwise indicated)
The Board of Directors is informed of significant valuation issues. When determining the fair value of an asset or liability, the Company makes extensive use of observable market data. A fair value hierarchy categorizes fair values into different levels based on the inputs used in valuation techniques, as follows:
If the inputs used to measure the fair value of an asset or liability fall into different levels of the fair value hierarchy, then the entire fair value measurement is classified at the same level as the lowest-level entry that is significant to the entire measurement. Among the specific techniques used to value financial instruments are:
|
All resulting fair value estimates are included in level 2, except for contingent consideration payables for which fair values have been determined using present values and discount rates adjusted for counterparty or own credit risk.
Explanatory Notes to the Financial Statement
(In thousands of Reais, except when otherwise indicated)
The carrying amounts and fair value of consolidated assets and liabilities are as follows:
|
|
| Carrying amount |
| Assets and liabilities measured at fair value | ||||||||||||
|
|
| 12/31/2023 |
| 12/31/2022 |
| 12/31/2023 |
| 12/31/2022 | ||||||||
| Note |
|
|
|
|
| Level 1 |
| Level 2 |
| Level 3 |
| Level 1 |
| Level 2 |
| Level 3 |
Assets |
|
|
|
|
|
|
|
|
|
|
|
|
|
|
|
|
|
Investment funds | 5.2 |
| 3,298,142 |
| 1,304,332 |
| — |
| 3,298,142 |
| — |
| — |
| 1,304,332 |
| — |
Marketable securities | 5.3 |
| 3,503,961 |
| 22,099,766 |
| — |
| 3,503,961 |
| — |
| 19,586,193 |
| 2,513,573 |
| — |
Other financial assets |
|
| 3,113 |
| 89,238 |
| 3,113 |
| — |
| — |
| 89,238 |
| — |
| — |
Investment properties (i) | 11.5 |
| 15,976,126 |
| 14,103,060 |
| — |
| — |
| 15,976,126 |
| — |
| — |
| 14,103,060 |
Derivate financial instruments | 5.6 |
| 2,546,799 |
| 4,151,752 |
| — |
| 2,546,799 |
| — |
| — |
| 4,151,752 |
| — |
Total |
|
| 25,328,141 |
| 41,748,148 |
| 3,113 |
| 9,348,902 |
| 15,976,126 |
| 19,675,431 |
| 7,969,657 |
| 14,103,060 |
Liabilities |
|
|
|
|
|
|
|
|
|
|
|
|
|
|
|
|
|
Loans, financing and debentures (ii) | 5.4 |
| (56,904,654) |
| (52,987,216) |
| — |
| (22,952,492) |
| — |
| — |
| (31,367,019) |
| — |
Derivative financial instruments | 5.6 |
| (3,415,145) |
| (5,290,932) |
| — |
| (3,415,145) |
| — |
| — |
| (5,290,932) |
| — |
Total |
|
| (60,319,799) |
| (58,278,148) |
| — |
| (26,367,637) |
| — |
| — |
| (36,657,951) |
| — |
| (i) | The fair value of investment properties was determined using the direct comparative method of market data applied to transactions involving similar properties (type, location, and quality of property) and, to a lesser extent, sales quotes for potential transactions involving comparable assets (level 3). The methodology used to determine fair value incorporates direct comparisons of market information, such as market research, homogenization of values, spot market prices, sales, distances, facilities, access to land, topography and soil, land use (crop type), and rainfall, among other data, in accordance with the standards issued by the Brazilian Association of Technical Standards ("ABNT"). The discount rates used vary between 11.12% per year and 11.20% per year as at December 31, 2023 (11.20% to 13.75% per year as at December 31, 2022). |
| For fair value assessments of investment properties in the periods between annual assessments, management considers regional market trends presented by the S&P Global Commodity Insights report for the Brazilian rural real estate market. If Management reasonably believes that property values have changed differently from the variation in the S&P Global Commodity Insights report, based on its understanding of current market conditions and evidence of proposals received for the assets, considerations may be made to determine fair value property market. | |
| (ii) | The fair value of the Company’s loans does not differ significantly from their carrying value except for the debts that are designated at fair value through the result. |
| For debts having a market value quoted on the Luxembourg Stock Exchange the measurement of fair value for disclosure purposes is based on the quoted market price as follows: |
Debt |
| Company |
| 12/31/2023 |
| 12/31/2022 |
Senior Notes 2028 |
| Rumo Luxembourg S.à r.l. |
| 96.41% |
| 95.04% |
Senior Notes 2032 |
| Rumo Luxembourg S.à r.l. |
| 85.65% |
| 80.36% |
Senior Notes 2027 |
| Cosan Luxembourg S.A. |
| 100.92% |
| 100.92% |
Explanatory Notes to the Financial Statement
(In thousands of Reais, except when otherwise indicated)
This note describes the group's exposure to financial risks and how these risks may affect future financial performance. To provide more context, current year profit and loss information has been included where applicable:
Risk | Exposure arising from | Measurement | Management |
Market risk - foreign exchange |
|
| Foreign currency |
Market risk - interest | Cash and cash equivalents, securities, loans, borrowings and debentures, leases and derivative financial instruments. | Sensitivity analysis | Interest rate swap |
Market risk – price |
|
|
|
Credit risk | Cash and cash equivalents, marketable securities, trade receivables, derivatives, receivables from related parties, dividends and investment property |
| Availability and lines of credit |
Liquidity risk | Loans, borrowings and debentures, accounts payable to suppliers, other financial liabilities, REFIS, leases, derivatives, payables to related parties and dividends. | Cash flow forecasting | Availability and lines of credit |
The Company's Management identifies, evaluates, and hedges financial risks in close collaboration with operating units. The Board of Directors provides written principles for managing global risk in addition to policies covering specific areas such as currency risk, interest rate risk, credit risk, use of derivative and non-derivative financial instruments, and excess investment of liquidity.
When all applicable criteria are satisfied, hedge accounting is used to eliminate the accounting mismatch between the hedging instrument and the hedged item. This will result in the effective recognition of interest expense at a fixed interest rate for hedged floating rate loans and inventory at the fixed foreign exchange rate for purchases hedged against foreign exchange risk.
The Company may opt for formal designation of new debt transactions for which it has swap-type derivative hedging instruments for foreign exchange rate variation and interest, as measured at fair value. The Fair Value Option is intended to eliminate inconsistencies caused by disparities between the measurement credits of certain liabilities and their hedging instruments. Consequently, both swaps and respective debts are now valued at fair value. This option is irrevocable and must be exercised upon the operation's initial accounting entry.
The policy of the Company is to maintain a sufficient capital base to foster the confidence of investors, creditors, and the market, and to ensure the business's future growth. Each of its businesses' rate of return on capital is monitored by Management.
An analysis of the risk exposure that Management intends to cover determines the use of financial instruments to protect against these areas of volatility.
a) Market risk
The objective of market risk management is to manage and control exposures to market risk within acceptable parameters, optimizing returns.
The Company uses derivatives to manage market risks. All these transactions are carried out within the guidelines defined by the Risk Management Committee. Generally, the Company seeks to apply hedge accounting to manage volatility in profit or loss.
Explanatory Notes to the Financial Statement
(In thousands of Reais, except when otherwise indicated)
- Foreign exchange risk
As of December 31, 2023, and 2022, the Company had the following net exposure to foreign exchange variation on assets and liabilities denominated in US Dollars, Euros, Yen and Pound Sterling:
| 12/31/2023 |
| 12/31/2022 |
Cash and cash equivalents | 284,956 |
| 1,138,948 |
Trade payables | (441,768) |
| (97,259) |
Loans, borrowings and debentures | (24,861,084) |
| (13,698,102) |
Leases | (1,627,104) |
| (94,716) |
Consideration payable | (203,094) |
| (223,960) |
Derivative financial instruments | 14,182,102 |
| 7,728,609 |
FX exposure, net | (12,665,992) |
| (5,246,480) |
The probable scenario considers the estimated foreign exchange rates, carried out by a specialized third party, at the maturity of transactions for companies with real functional currency (positive and negative, before tax effects), as follows:
|
|
|
|
|
| Scenarios | ||||||
Instrument |
| Risk factor |
| Probable |
| 25% |
| 50% |
| (25%) |
| (50%) |
Cash and cash equivalents |
| Low FX rate |
| 43,130 |
| 116,704 |
| 190,278 |
| (30,445) |
| (104,019) |
Trade receivables |
| Low FX rate |
| 252 |
| 2,234 |
| 4,217 |
| (1,731) |
| (3,713) |
Trade payables |
| High FX rate |
| (32) |
| (285) |
| (538) |
| 221 |
| 473 |
Derivative financial instruments |
| Low FX rate |
| 1,637,844 |
| 7,019,308 |
| 11,124,823 |
| (1,168,664) |
| (5,211,482) |
Loans, borrowings and debentures |
| High FX rate |
| (3,156,486) |
| (7,857,863) |
| (13,541,119) |
| 3,606,358 |
| 9,319,729 |
Leases |
| High FX rate |
| (1,602,279) |
| (2,022,389) |
| (2,442,499) |
| (1,182,168) |
| (500,436) |
Consideration payable |
| High FX rate |
| (6,658) |
| (14,979) |
| (23,301) |
| 1,664 |
| 9,986 |
Impacts on profit or loss before taxes |
|
|
| (3,084,229) |
| (2,757,270) |
| (4,688,139) |
| 1,225,235 |
| 3,510,538 |
The probable scenario considers the estimated exchange rates, made by a specialized third party, upon maturity of the transactions for the companies with functional currency Reais (positive and negative, before tax effects), as follows:
|
| Exchange rate sensitivity analysis | ||||||||||
|
| 12/31/2023 |
| Scenarios | ||||||||
|
|
| Probable |
| 25% |
| 50% |
| (25%) |
| (50%) | |
US$ |
| 4.8413 |
| 5.0000 |
| 6.2500 |
| 7.5000 |
| 3.7500 |
| 2.5000 |
Euro |
| 5.3516 |
| 5.6500 |
| 7.0625 |
| 8.4750 |
| 4.2375 |
| 2.8250 |
GBP |
| 6.1586 |
| 6.5000 |
| 8.1250 |
| 9.7500 |
| 4.8750 |
| 3.2500 |
JPY |
| 0.0342 |
| 0.0379 |
| 0.0473 |
| 0.0568 |
| 0.0284 |
| 0.0189 |
ii. Interest rate risk
The Company and its subsidiaries monitor fluctuations in variable interest rates related to their financing and use derivative instruments to minimize the risk of fluctuations in variable interest rates.
A sensitivity analysis on interest rates on loans and borrowings to offset investments in CDI with pre-tax increases and decreases of 25% and 50% is presented below:
|
|
|
| Scenarios | ||||||
Interest rate exposure |
| Probable |
| 25% |
| 50% |
| (25%) |
| (50%) |
Cash and cash equivalents |
| 1,341,723 |
| 1,677,154 |
| 2,012,584 |
| 1,006,292 |
| 670,861 |
Marketable securities |
| 301,620 |
| 377,026 |
| 452,431 |
| 226,215 |
| 150,810 |
Restricted cash |
| 20,131 |
| 25,164 |
| 30,197 |
| 15,098 |
| 10,066 |
Lease and concession in installments |
| (107,615) |
| (134,519) |
| (161,422) |
| (80,711) |
| (53,807) |
Leases liabilities |
| (441,671) |
| (442,081) |
| (442,493) |
| (441,262) |
| (440,855) |
Derivative financial instruments |
| (1,928,668) |
| 1,463,062 |
| 1,184,732 |
| 1,171,704 |
| 2,301,380 |
Loans, borrowings and debentures |
| (2,031,467) |
| (3,271,263) |
| (3,793,309) |
| (2,227,171) |
| (1,705,125) |
Other financial liabilities |
| (39,589) |
| (48,132) |
| (56,674) |
| (31,046) |
| (22,504) |
Impacts on the income (loss) before taxes |
| (2,885,536) |
| (353,589) |
| (773,954) |
| (360,881) |
| 910,826 |
Explanatory Notes to the Financial Statement
(In thousands of Reais, except when otherwise indicated)
The probable scenario considers the estimated interest rate, made by a specialized third party and the Central Bank of Brazil (Banco Central do Brasil or “BACEN”) as follows:
|
|
|
| Scenarios | ||||||
|
| Probable |
| 25% |
| 50% |
| (25%) |
| (50%) |
SELIC |
| 10.08% |
| 12.60% |
| 15.13% |
| 7.56% |
| 5.04% |
CDI |
| 9.98% |
| 12.48% |
| 14.98% |
| 7.49% |
| 4.99% |
TJLP462 (TJLP + 1% per year) |
| 7.20% |
| 8.75% |
| 10.30% |
| 5.65% |
| 4.10% |
TJLP |
| 6.20% |
| 7.75% |
| 9.30% |
| 4.65% |
| 3.10% |
IPCA |
| 3.85% |
| 4.82% |
| 5.78% |
| 2.89% |
| 1.93% |
IGPM |
| 3.34% |
| 4.17% |
| 5.01% |
| 2.50% |
| 1.67% |
Fed Funds |
| 4.25% |
| 5.31% |
| 6.38% |
| 3.19% |
| 2.13% |
SOFR |
| 4.20% |
| 5.25% |
| 6.30% |
| 3.15% |
| 2.10% |
iii. Price risk
- Natural gas
Natural gas derivative transactions were conducted with bank counterparties and recognized at fair value through profit or loss, based on the difference between the contracted price and the market price of outstanding contracts as of the date of the balance sheet.
These are our open positions in natural gas derivatives:
Instrument |
| Risk factor |
| Probable |
| 25% |
| 50% |
| -25% |
| -50% |
Brent derivatives – options |
| Price variation US$ /bbl |
| 7,375 |
| 9,216 |
| 11,067 |
| 5,527 |
| 3,689 |
- Options
We use derivative financial instruments called options to limit our exposure to changes in the value of Vale shares. The widely accepted methodology used to calculate the fair value of options is based on the Black & Scholes pricing model. The values calculated in the sensitivity analysis of the framework mentioned reflect the impacts of the intrinsic values of the options as the shares appreciate or depreciate.
|
|
|
| Scenarios | ||||||||
Instrument |
| Interest |
| Probable |
| 25% |
| 50% |
| (25%) |
| (50%) |
VALE3 (Collar) (i) |
| 2.20% |
| 7,788,856 |
| 8,158,058 |
| 8,434,888 |
| 7,361,797 |
| 7,006,051 |
VALE3 (Call Spread) |
| 1.60% |
| 563,903 |
| 826,670 |
| 1,004,452 |
| 272,147 |
| 72,611 |
(i)As mentioned in note 1.1 (c), 100% of Collar derivatives were settled in April 2024.
- Total Return Swap (TRS)
We are exposed to risks linked to CSAN3 share prices. To mitigate such exposures, total return swap derivatives of 96,185,412 shares of CSAN3 were contracted in which the Company receives the variation of the share price and proceeds on the active side and pays CDI + 1.65% on the passive side.
The sensitivity analysis considers the closing share price as shown below:
Explanatory Notes to the Financial Statement
(In thousands of Reais, except when otherwise indicated)
|
|
|
| Scenarios |
| |||||||||||||||||||
Instrument |
| Probable |
| 25% |
| 50% |
| (25%) |
| (50%) |
| |||||||||||||
Value of the investment |
| 41,557 |
| 470,525 |
| 941,049 |
| (470,525) |
| (941,049) |
| |||||||||||||
Value of the share (CSAN3) |
| 19.36 |
| 24.20 |
| 29.04 |
| 14.52 |
| 9.68 |
| |||||||||||||
b) Credit risk
The Company's regular operations expose it to the risk of default when customers, suppliers, and counterparties are unable to fulfill their financial commitments or other obligations. The Company seeks to mitigate this risk by conducting transactions with a diverse group of counterparties. However, the Company's operations remain susceptible to the unanticipated financial failures of third parties. The credit risk exposure was as follows:
| 12/31/2023 |
| 12/31/2022 |
Cash and cash equivalents | 14,658,481 |
| 13,301,716 |
Trade receivables | 3,444,636 |
| 3,927,542 |
Marketable securities | 3,503,961 |
| 2,513,574 |
Restricted cash | 203,252 |
| 139,933 |
Derivative financial instruments | 2,546,799 |
| 4,151,752 |
Receivables from related parties | 340,091 |
| 476,542 |
Receivable dividends and interest on equity | 255,777 |
| 161,147 |
Other financial assets | 3,113 |
| 89,238 |
| 24,956,110 |
| 24,761,444 |
The Company is exposed to risks related to its cash management activities and temporary investments.
The majority of liquid assets are invested in government bonds and other bank investments. The treasury department manages the credit risk of bank and financial institution balances in accordance with the Company's policy.
The credit risk associated with lease receivables is divided into two customer categories: (i) Level 1 and (ii) Level 2. The majority of subsidiary investment properties are leased to customers classified as Level 1, with no history of late payments or default and a solid financial standing. To mitigate the credit risk associated with lease receivables, the Company's policy restricts its exposure to Level 2 customers. The risk associated with accounts receivable related to the sale of investment properties is mitigated by granting land ownership to the customer only after receiving a down payment for the transaction. In addition, the transfer of ownership is contingent upon receipt of all outstanding payments.
Only approved counterparties and within the credit limits assigned to each counterparty may invest surplus funds. Credit limits for counterparties are reviewed annually and may be modified throughout the period. The limits are established to minimize the concentration of risks and, consequently, to mitigate financial loss caused by potential counterparty default. The credit risk of cash and cash equivalents, marketable securities, restricted cash, and derivative financial instruments is determined by widely accepted market rating instruments and is structured as follows:
Explanatory Notes to the Financial Statement
(In thousands of Reais, except when otherwise indicated)
| 12/31/2023 |
| 12/31/2022 |
AAA | 20,475,536 |
| 16,769,858 |
AA | 172,871 |
| 3,133,455 |
A | 124,932 |
| 138,478 |
Not rated | 139,154 |
| 65,184 |
| 20,912,493 |
| 20,106,975 |
c) Liquidity risk
The Company's strategy for managing liquidity is to ensure, whenever possible, that it has sufficient liquidity to meet its liabilities when they are due, under normal and stressed conditions, without incurring unacceptable losses or risking reputational harm.
The Company's financial liabilities (based on contracted undiscounted cash flows) are categorized by maturity dates as follows:
| 12/31/2023 |
| 12/31/2022 | ||||||||
| Up to 1 year |
| 1 - 2 years |
| 2 - 5 years |
| More than 5 years |
| Total |
| Total |
Loans, borrowings and debentures | (5,504,188) |
| (5,300,723) |
| (23,711,254) |
| (33,419,306) |
| (67,935,471) |
| (63,200,127) |
Trade payables | (3,920,273) |
| (264,252) |
| — |
| — |
| (4,184,525) |
| (4,379,851) |
Other financial liabilities | (476,895) |
| — |
| — |
| — |
| (476,895) |
| (924,562) |
Installment of tax debts | (53,210) |
| (1,505) |
| (1,810) |
| (160,742) |
| (217,267) |
| (208,760) |
Leases liabilities | (658,131) |
| (818,888) |
| (1,233,690) |
| (18,164,132) |
| (20,874,841) |
| (16,436,839) |
Lease and concession in installments | (266,814) |
| (291,161) |
| (579,320) |
| — |
| (1,137,295) |
| (1,137,173) |
Payables to related parties | (322,160) |
| — |
| — |
| — |
| (322,160) |
| (387,736) |
Dividends payable | (549,054) |
| — |
| — |
| — |
| (549,054) |
| (892,006) |
Derivative financial instruments | (2,149,524) |
| (1,327,485) |
| (3,146,345) |
| 1,705,459 |
| (4,917,895) |
| (84,126) |
| (13,900,249) |
| (8,004,014) |
| (28,672,419) |
| (50,038,721) |
| (100,615,403) |
| (87,651,180) |
d) Capital management risk
The group manages the capital structure and adjusts it considering changes in economic conditions and requirements of financial covenants. To maintain or adjust the capital structure, the Group may adjust the payment of dividends to shareholders, return capital to them or issue new shares. The Company monitors capital mainly through the leverage index, calculated as net debt on EBITDA. The group policy is to keep this index up to 3.3x, which represents the lowest covenants ratio of the group components.
The Company's policy is to maintain a solid capital base to foster the confidence of its parent companies, creditors, and the market, and to ensure the business's future growth.
To achieve this general objective, the Group’s capital management, among other things, aims to ensure compliance with the financial commitments associated with loans and borrowings that define capital structure requirements.
Explanatory Notes to the Financial Statement
(In thousands of Reais, except when otherwise indicated)
Accounting Policy: Tax assets are measured at cost and primarily consist of (i) tax effects that are recognized when the asset is sold to a third party or recovered through amortization over the remaining economic life of the asset; and (ii) tax receivables that are expected to be recovered as refunds from tax authorities or as a reduction for future tax liabilities. |
| Parent Company |
| Consolidated | ||||
| 12/31/2023 |
| 12/31/2022 |
| 12/31/2023 |
| 12/31/2022 |
COFINS | 3,699 |
| 3,699 |
| 487,160 |
| 975,878 |
PIS | — |
| — |
| 110,904 |
| 350,867 |
Tax credits | 33,639 |
| 31,774 |
| 33,639 |
| 31,774 |
ICMS | — |
| — |
| 924,180 |
| 845,450 |
ICMS - CIAP | — |
| — |
| 189,813 |
| 118,809 |
Other | 4,647 |
| 4,667 |
| 132,863 |
| 76,348 |
| 41,985 |
| 40,140 |
| 1,878,559 |
| 2,399,126 |
|
|
|
|
|
|
|
|
Current | 8,346 |
| 8,366 |
| 745,856 |
| 1,324,203 |
Non-current | 33,639 |
| 31,774 |
| 1,132,703 |
| 1,074,923 |
Total | 41,985 |
| 40,140 |
| 1,878,559 |
| 2,399,126 |
Accounting policy: Inventories are stated at the lower of cost and net realizable value (it is the estimated selling price in the normal course of business, minus the estimated completion costs and estimated costs necessary to make the sale). The cost of finished and work-in-progress goods comprises direct materials, direct labor and an appropriate proportion of variable and fixed overheads, the latter of which are allocated based on normal operating capacity. Costs are assigned to individual inventory items based on weighted average costs. The provision for obsolete inventories is made for risks associated with the realization and sale of obsolete inventories, and is measured at net realizable value or cost, whichever is lower. |
| Consolidated | ||
| 12/31/2023 |
| 12/31/2022 |
Finished products | 1,254,818 |
| 1,504,134 |
Parts and accessories | 178,260 |
| 168,777 |
Construction Materials | 316,370 |
| 152,789 |
Warehouse and other | 43,266 |
| 43,359 |
| 1,792,714 |
| 1,869,059 |
The balances are presented net of a provision of R$ 78,709 for obsolete inventories as at December 31, 2023 (R$38,747 as at December 31, 2022).
Explanatory Notes to the Financial Statement
(In thousands of Reais, except when otherwise indicated)
Accounting policy: The Company classifies non-current assets and disposal groups as held for sale if their carrying values are recovered mainly through a sale transaction and not through continuous use. Non-current assets and disposal groups classified as held for sale (except investment properties measured at fair value) are measured at the lower of carrying value and fair value less costs to sell. Selling costs are the incremental costs directly attributable to the disposal of an asset (disposal group), excluding financial expenses and income tax expenses. The criteria for classifying held for sale are considered met only when the sale is highly probable and the asset or group for disposal is available for immediate sale in its current condition. The actions required to complete the sale must indicate that it is unlikely that significant changes to the sale will be made or that the decision to sell will be withdrawn. Management must be committed to the asset sale plan and the sale is expected to be completed within one year of the classification date. Assets and liabilities classified as held for sale are presented separately in the balance sheet. |
a) Assets held for sale:
| Properties held for sale |
| Other assets held for sale |
| Total |
At January 1, 2022 | — |
| — |
| — |
Business combination | 268,385 |
| — |
| 268,385 |
Transfers | 322,430 |
| — |
| 322,430 |
Sale of agricultural properties held for sale | (550,432) |
| — |
| (550,432) |
At December 31, 2022 | 40,383 |
| — |
| 40,383 |
Additions | — |
| 1,795,773 |
| 1,795,773 |
Transfers (i) | 444,782 |
| — |
| 444,782 |
Sale of agricultural properties held for sale | (142,773) |
| — |
| (142,773) |
At December 31, 2023 | 342,392 |
| 1,795,773 |
| 2,138,165 |
| (i) | Transfers arising from the group of investment properties as per note 11.5, arising from the proposed sales of Fazendas Grão de Ouro and Dourados (Tellus Brasil Participações S.A.); Fazenda Santa Rita Cana (Duguetiapar Empreendimentos e Participações S.A.); Gleba Macaé (Radar II Properties Agrícolas S.A.). |
Other assets held for sale
As mentioned in explanatory note 2, the balances corresponding to Norgás’ and TUP Porto São Luis S.A balance sheet were reclassified to the heading of assets and liabilities held for sale are shown below:
| Norgás |
| TUP Porto São Luis S.A |
| Total |
Cash and cash equivalents | — |
| 48,231 |
| 48,231 |
Other current tax receivable | — |
| 3,030 |
| 3,030 |
Dividends and interest on equity capital receivable | 18,646 |
| — |
| 18,646 |
Investments in associates | 892,854 |
| — |
| 892,854 |
Property, plant and equipment | — |
| 395,757 |
| 395,757 |
Intangible assets | — |
| 437,220 |
| 437,220 |
Other assets | — |
| 35 |
| 35 |
Total | 911,500 |
| 884,273 |
| 1,795,773 |
The balance of R$2,998 at the parent company is composed of receivables from parties related to TUP Porto São Luis S.A.
Explanatory Notes to the Financial Statement
(In thousands of Reais, except when otherwise indicated)
b) Liabilities held for sale:
| Norgás |
| TUP Porto São Luis S.A |
| Total |
Trade payables | — |
| 17,248 |
| 17,248 |
Employee benefits payables | — |
| 1,828 |
| 1,828 |
Other liabilities | — |
| 456 |
| 456 |
Deferred income and social contribution taxes | 152,255 |
| 66,606 |
| 218,861 |
Total | 152,255 |
| 86,138 |
| 238,393 |
c) Discontinued operation result:
As mentioned in Explanatory Note 2, the balances corresponding to Norgás’s income statements were reclassified to the profit and loss item of discontinued transactions as follows:
| Parent company |
| Consolidated | ||||
| 12/31/2023 |
| 12/31/2022 |
| 12/31/2023 |
| 12/31/2022 |
Equity income (loss) | 15,654 |
| 17,180 |
| 45,419 |
| 49,846 |
Controlling shareholders | 15,654 |
| 17,180 |
| 23,164 |
| 25,421 |
Non-controlling shareholders | — |
| — |
| 22,255 |
| 24,425 |
Comparative balance reclassification:
|
| Parent company | ||||
|
| 12/31/2022 (Originally presented) |
| Reclassification |
| 12/31/2022 (Restated) |
Income before equity income (loss) and net financial result |
| (162,865) |
| — |
| (162,865) |
Equity income (loss) in associates |
| 3,926,759 |
| (17,180) |
| 3,909,579 |
Equity income (loss) of jointly controlled companies |
| (333,622) |
| — |
| (333,622) |
Equity income (loss) |
| 3,593,137 |
| (17,180) |
| 3,575,957 |
Net financial result |
| (3,342,443) |
| — |
| (3,342,443) |
Profit before income tax and social contribution |
| 87,829 |
| (17,180) |
| 70,649 |
Income tax and social contribution |
| 1,088,203 |
| — |
| 1,088,203 |
Net profit from continuing operations |
| 1,176,032 |
| (17,180) |
| 1,158,852 |
Profit for the year from discontinued operations, net of taxes |
| — |
| 17,180 |
| 17,180 |
Net profit for the year |
| 1,176,032 |
| — |
| 1,176,032 |
Explanatory Notes to the Financial Statement
(In thousands of Reais, except when otherwise indicated)
| Consolidated | ||||
| 12/31/2022 (Originally presented) |
| Reclassification |
| 12/31/2022 (Restated) |
Income before equity income (loss) and net financial result | 7,483,843 |
| — |
| 7,483,843 |
Equity income (loss) in associates | 468,743 |
| (49,846) |
| 418,897 |
Equity income (loss) of jointly controlled companies | (92,179) |
| — |
| (92,179) |
Equity income (loss) | 376,564 |
| (49,846) |
| 326,718 |
Net financial result | (5,157,936) |
| — |
| (5,157,936) |
Profit before income tax and social contribution | 2,702,471 |
| (49,846) |
| 2,652,625 |
Income tax and social contribution | 118,404 |
| — |
| 118,404 |
Net profit from continuing operations | 2,820,875 |
| (49,846) |
| 2,771,029 |
Profit for the year from discontinued operations, net of taxes | — |
| 49,846 |
| 49,846 |
Net profit for the year | 2,820,875 |
| — |
| 2,820,875 |
d) Reclassification of comparative cash flow balance:
| Parent company | ||||
| 12/31/2022 (Originally presented) |
| Reclassification |
| 12/31/2022 (Restated) |
Cash flow from operating activities |
|
|
|
|
|
Profit before income tax and social contribution | 87,829 |
| (17,180) |
| 70,649 |
Equity income (loss) in subsidiaries and associates | (3,926,759) |
| 17,180 |
| (3,909,579) |
Other items of operating activities | 3,391,360 |
| — |
| 3,391,360 |
Net cash (used) generated in operating activities | (447,570) |
| — |
| (447,570) |
|
|
|
|
|
|
Net cash used in investing activities | (5,653,626) |
| — |
| (5,653,626) |
|
|
|
|
|
|
| Net cash generated in financing activities | 5,923,951 | — | 5,923,951 | ||
Decrease in cash and cash equivalents | (177,245) |
| — |
| (177,245) |
|
|
|
|
|
|
Cash and cash equivalents at beginning of year | 1,718,077 |
| — |
| 1,718,077 |
Effect of exchange rate variation on the balanceof cash and cash equivalents | (192,371) |
| — |
| (192,371) |
Cash and cash equivalents at end of year | 1,348,461 |
| — |
| 1,348,461 |
Explanatory Notes to the Financial Statement
(In thousands of Reais, except when otherwise indicated)
| Consolidated | ||||
| 12/31/2022 (Originally presented) |
| Reclassification |
| 12/31/2022 (Restated) |
Cash flow from operating activities |
|
|
|
|
|
Profit before income tax and social contribution | 2,702,471 |
| (49,846) |
| 2,652,625 |
Equity income (loss) in subsidiaries and associates | (468,743) |
| 49,846 |
| (418,897) |
Other items of operating | 7,738,504 |
| — |
| 7,738,504 |
Net cash (used) generated in Operating activities | 9,972,232 |
| — |
| 9,972,232 |
|
|
|
|
|
|
Cash flow from investing activities |
|
|
|
|
|
Dividends received from subsidiaries and associates | 323,096 |
| (44,969) |
| 278,127 |
Discontinued operation | — |
| 44,969 |
| 44,969 |
Other items of investing activities | (21,068,877) |
| — |
| (21,068,877) |
Net cash used in investing activities | (20,745,781) |
| — |
| (20,745,781) |
|
|
|
|
|
|
Net cash generated in financing activities | 8,305,476 |
| — |
| 8,305,476 |
|
|
|
|
|
|
Decrease in cash and cash equivalents | (2,468,073) |
| — |
| (2,468,073) |
|
|
|
|
|
|
Cash and cash equivalents at beginning of year | 16,174,130 |
| — |
| 16,174,130 |
Effect of exchange rate variation on the balance of cash and cash equivalents | (404,341) |
| — |
| (404,341) |
Cash and cash equivalents at end of year | 13,301,716 |
| — |
| 13,301,716 |
Explanatory Notes to the Financial Statement
(In thousands of Reais, except when otherwise indicated)
Accounting policy:
Subsidiaries are all entities over which the Company has control, are fully consolidated from the date of acquisition of control and deconsolidated when control ceases to exist. Control is obtained when the Company is exposed or entitled to variable returns based on its involvement with the investee and has the ability to affect those returns through the power exercised in relation to the investee. Specifically, the Company controls an investee if, and only if, it has: • Power over the investee (i.e., existing rights that give it the current ability to direct the relevant activities of the investee); • Exposure or right to variable returns arising from its involvement with the investee; and • The ability to use its power over the investee to affect the value of its returns. There is usually a presumption that a majority of voting rights results in control. To support this presumption and when the Company has less than a majority of the voting rights of an investee, we consider all relevant facts and circumstances when assessing whether it has power over an investee, including: • The contractual agreement between the investor and other holders of voting rights; • Rights arising from other contractual agreements; and • The Company's voting rights and potential voting rights. Using consistent accounting policies, subsidiaries' financial statements are prepared for the same reporting period as the parent company. Adjustments are made to the financial statements of the subsidiaries in order to conform their accounting policies to those of the Company. On consolidation, all transactions between related parties are eliminated. Unrealized gains resulting from transactions with investees recorded using the equity method are written off against the investment in proportion to the Company's ownership interest in the investee. Unrealized losses are eliminated in the same manner, but only if no evidence of impairment exists. ii. Associates Associates are entities over whose financial and operating policies the Company has significant influence, but neither control nor joint control. In preparing the consolidated financial statements, intragroup balances and transactions, as well as any unrealized income or expenses arising from intragroup transactions, are written off. In accordance with the equity method, the equity interest of associates attributable to the Company in the profit or loss for the exercise of such investments is recorded in the income statement, under “Equity in earnings”. Unrealized gains and losses arising from transactions between the Company and its investees are written off in proportion to the Company's ownership stake in these investees. Other comprehensive income of subsidiaries, associates, and joint ventures is recorded directly under "Other comprehensive income" in the Company's shareholders' equity. iii. Investments in affiliates with significant influence Significant influence is the power to participate in decisions about financial and operational policies of an investee, but without individual or joint control of these policies. If the investor holds directly or indirectly less than twenty per cent of the investee’s voting power, it is presumed that he has no significant influence unless that influence can be clearly demonstrated. For investments with a stake of less than 20 percent, the company conducts the appropriate valuations to determine whether it has significant influence. Participations in investments with significant influence are valued by the equity method and, when applicable, deducted from provision for losses by recoverable value (impairment). Unrealized gains resulting from transactions with investments recorded using the equity method are written off in proportion to the Company's ownership interest in the investee. Unrealized losses are written off in the same manner, but only if there is no evidence of an impairment loss. |
Explanatory Notes to the Financial Statement
(In thousands of Reais, except when otherwise indicated)
The Company's subsidiaries and associates are listed below:
| 12/31/2023 |
| 12/31/2022 |
Directly owned subsidiaries excluding treasury shares |
|
|
|
Cosan Corporate |
|
|
|
Cosan Corretora de Seguros Ltda | 100.00% |
| 100.00% |
Cosan Nove Participações S.A. | 73.09% |
| 73.09% |
Cosan Luxembourg S.A. (i) | 100.00% |
| 100.00% |
Cosan Overseas Limited | 100.00% |
| 100.00% |
Pasadena Empreendimentos e Participações S.A. | 100.00% |
| 100.00% |
Cosan Limited Partners Brasil Consultoria Ltda. | 97.50% |
| 97.50% |
Barrapar Participaçoes Ltda. | 100.00% |
| 100.00% |
Aldwych Temple | 100.00% |
| 100.00% |
Vale S.A (vi) | 4.90% |
| — |
Cosan Oito S.A. | 100.00% |
| 100.00% |
Cosan Global Limited | 100.00% |
| 100.00% |
Atlântico Participações Ltda. | 100.00% |
| 100.00% |
Sinlog Tecnologia em Logística S.A. (ii) | - |
| 57.48% |
Cosan Dez Participações S.A. | 76.80% |
| 76.80% |
Radar |
|
|
|
Radar Propriedades Agrícolas S.A. (iii) | 50.00% |
| 50.00% |
Radar II Propriedades Agrícolas S.A. (iii) | 50.00% |
| 50.00% |
Nova Agrícola Ponte Alta S.A. (iii) | 50.00% |
| 50.00% |
Nova Amaralina S.A Propriedades Agrícolas (iii) | 50.00% |
| 50.00% |
Nova Santa Bárbara Agrícola S.A.(iii) | 50.00% |
| 50.00% |
Terras da Ponta Alta S.A. (iii) | 50.00% |
| 50.00% |
Castanheira Propriedades Agrícolas S.A. (iii) | 50.00% |
| 50.00% |
Manacá Propriedades Agrícolas S.A. (iii) | 50.00% |
| 50.00% |
Paineira Propriedades Agrícolas S.A. (iii) | 50.00% |
| 50.00% |
Tellus Brasil Participações S.A. (iv) | 20.00% |
| 20.00% |
Janus Brasil Participações S.A. (iv) | 20.00% |
| 20.00% |
Duguetiapar Empreendimentos e Participações S.A. (iv) | 20.00% |
| 20.00% |
Gamiovapar Empreendimentos e Participações S.A. (iv) | 20.00% |
| 20.00% |
Moove |
|
|
|
Moove Lubricants Holdings | 70.00% |
| 70.00% |
Rumo |
|
|
|
Rumo S.A. (v) | 30.42% |
| 30.35% |
| (i) | Despite presenting an unsecured liability amount of R$146,276 as at December 31, 2023, as shown below, no other events or conditions were identified that, individually or collectively, may raise relevant doubts as to the ability to maintenance of its operational continuity. Subsidiaries have financial support from the Company. | |
| (ii) | Sale of interest completed on May 2, 2023, for R$45,000. | |
| (iii) | The Company is the majority shareholder, holding 50% of the capital stock plus one share. | |
| (iv) | The Company holds more than 60.00% of the voting shares of each entity, has decision-making power over the relevant activities of each entity and has the right to appoint a majority of the members of the board of directors of each entity pursuant to a shareholders' agreement entered with certain other shareholders of these entities. | |
| (v) | The Company is the largest shareholder. In addition, the Company has decision-making power over the relevant activities of this entity and has the right to appoint a majority of the members of the board of directors in accordance with the shareholders' agreement entered with certain other shareholders of the entity. | |
| (vi) | From November 30, 2023, the Company began to have significant influence in Vale S.A as explained in note 1.1, recognizing equity under its equity through Cosan Oito. The value of 4.9% refers to the percentage of participation excluding treasury shares to calculate equity and receive dividends. |
Explanatory Notes to the Financial Statement
(In thousands of Reais, except when otherwise indicated)
The following are investments in subsidiaries and related companies as of December 31, 2023, which are relevant to the Company:
a) Parent company
| Shares issued by the associate |
| Shares held by Cosan |
| Cosan ownership interest |
| Economic benefit (%) |
Cosan Corporate |
|
|
|
|
|
|
|
Cosan Corretora de Seguros Ltda | 5,000 |
| 4,999 |
| 100.00% |
| 100.00% |
Cosan Nove Participações S.A. (i) | 7,663,761,735 |
| 5,601,178,095 |
| 73.09% |
| 66.16% |
Cosan Luxembourg S.A. | 500,010 |
| 500,010 |
| 100.00% |
| 100.00% |
Cosan Overseas Limited | 4,850,000 |
| 4,850,000 |
| 100.00% |
| 100.00% |
Pasadena Empreendimentos e Participações S.A. | 41,481,296 |
| 41,481,046 |
| 100.00% |
| 100.00% |
Cosan Limited Partners Brasil Consultoria Ltda | 160,000 |
| 156,000 |
| 97.50% |
| 97.50% |
Cosan Oito S.A. | 8,194,005,000 |
| 8,194,005,000 |
| 100.00% |
| 100.00% |
Cosan Global Limited | 300 |
| 300 |
| 100.00% |
| 100.00% |
Atlântico Participações Ltda. | 928,005,000 |
| 928,004,997 |
| 100.00% |
| 100.00% |
Cosan Dez Participações S.A. (i) | 3,473,458,687 |
| 2,667,494,858 |
| 76.80% |
| 72.00% |
Radar |
|
|
|
|
|
|
|
Radar Propriedades Agrícolas S.A. | 737,500 |
| 305,694 |
| 41.45% |
| 41.45% |
Radar II Propriedades Agrícolas S.A. | 81,440,221 |
| 40,720,111 |
| 50.00% |
| 50.00% |
Nova Agrícola Ponte Alta S.A. | 160,693,378 |
| 66,607,405 |
| 41.45% |
| 41.45% |
Nova Amaralina S.A Propriedades Agrícolas | 30,603,159 |
| 12,685,010 |
| 41.45% |
| 41.45% |
Nova Santa Bárbara Agrícola S.A. | 32,336,994 |
| 13,403,684 |
| 41.45% |
| 41.45% |
Terras da Ponte Alta S.A. | 16,066,329 |
| 6,659,494 |
| 41.45% |
| 41.45% |
Castanheira Propriedades Agrícolas S.A. | 83,850,938 |
| 34,756,214 |
| 41.45% |
| 41.45% |
Manacá Propriedades Agrícolas S.A. | 128,977,921 |
| 53,461,349 |
| 41.45% |
| 41.45% |
Paineira Propriedade Agrícolas S.A. | 132,667,061 |
| 54,990,497 |
| 41.45% |
| 41.45% |
Tellus Brasil Participações S.A. | 119,063,044 |
| 71,609,945 |
| 60.14% |
| 19.57% |
Janus Brasil Participações S.A. | 286,370,051 |
| 173,464,883 |
| 60.57% |
| 19.57% |
Duguetiapar Empreendimentos e Participações S.A. | 3,573,842 |
| 2,163,979 |
| 60.55% |
| 19.57% |
Gamiovapar Empreendimentos e Participações S.A. | 12,912,970 |
| 7,819,194 |
| 60.55% |
| 19.57% |
Moove |
|
|
|
|
|
|
|
Moove Lubricants Holdings | 34,963,764 |
| 24,474,635 |
| 70.00% |
| 70.00% |
Rumo |
|
|
|
|
|
|
|
Rumo S.A. (ii) | 1,854,868,949 |
| 562,529,490 |
| 30.42% |
| 30.42% |
| (i) | The participation related to economic benefit differs from the corporate participation exclusively on account of dividend distribution as explanatory note 1.1. | |
| (ii) | On July 19, 2023, the subsidiary Rumo S.A. and the indirect subsidiary Rumo Malha Norte called their respective Extraordinary General Assemblies – AGEs, approving the corporate acts relating to the Corporate Reorganization, as communicated by Rumo S.A to the market on the dates of 20 April, June 2nd and June 19th, 2023. |
Explanatory Notes to the Financial Statement
(In thousands of Reais, except when otherwise indicated)
| At January 1, 2023 |
| Interest in earnings of subsidiaries |
| Discontinued operation |
| Change of equity interest in subsidiary |
| Asset and liability valuation adjustment |
| Dividends |
| Capital (reduction) increase |
| Gain (loss) with capital increase in subsidiary |
| Other |
| At December 31, 2023 |
| Dividend receivable |
Rumo |
|
|
|
|
|
|
|
|
|
|
|
|
|
|
|
|
|
|
|
|
|
Rumo S.A. | 4,613,248 |
| 218,623 |
| — |
| 6,323 |
| (391) |
| (51,986) |
| 3,984 |
| — |
| (23,335) |
| 4,766,466 |
| 51,986 |
Cosan Corporate |
|
|
|
|
|
|
|
|
|
|
|
|
|
|
|
|
|
|
|
|
|
Cosan Corretora de Seguros Ltda | 244 |
| 1,013 |
| — |
| — |
| — |
| — |
| — |
| — |
| — |
| 1,257 |
| — |
Cosan Nove Participações S.A. | 7,153,764 |
| 661,434 |
| — |
| — |
| (39,996) |
| (88,496) |
| 121,621 |
| (32,732) |
| 35,183 |
| 7,810,778 |
| — |
Cosan Dez Participações S.A. | 4,311,213 |
| 825,074 |
| 15,654 |
| — |
| 1,502 |
| 33,456 |
| 5 |
| — |
| (7,740) |
| 5,179,164 |
| 11,717 |
Pasadena Empreendimentos e Participações S.A. | 1,486 |
| (34) |
| — |
| — |
| — |
| — |
| — |
| — |
| — |
| 1,452 |
| — |
Cosan Limited Partners Brasil Consultoria Ltda | 346 |
| (68) |
| — |
| — |
| — |
| — |
| — |
| — |
| — |
| 278 |
| — |
Other | 73,565 |
| (45,030) |
| — |
| — |
| (1,055) |
| — |
| — |
| — |
| (2,368) |
| 25,112 |
| — |
Cosan Oito S.A. | 8,258,622 |
| (346,359) |
| — |
| — |
| 11,230 |
| (246,384) |
| 2,716,500 |
| — |
| (17,326) |
| 10,376,283 |
| — |
Atlântico Participações Ltda | 911,342 |
| (8,921) |
| — |
| — |
| — |
| — |
| — |
| — |
| — |
| 902,421 |
| 190 |
Cosan Global | 128,868 |
| (9,513) |
| — |
| — |
| — |
| — |
| — |
| — |
| — |
| 119,355 |
| — |
Sinlog Tecnologia em Logística S.A. (i) | 20,155 |
| (2,661) |
| — |
| — |
| — |
| — |
| — |
| 12,622 |
| (30,116) |
| — |
| — |
Radar |
|
|
|
|
|
|
|
|
|
|
|
|
|
|
|
|
|
|
|
|
|
Radar II Propriedades Agrícolas S.A. | 943,255 |
| 174,346 |
| — |
| — |
| — |
| 37,831 |
| (1,902) |
| — |
| — |
| 1,153,530 |
| 8,199 |
Radar Propriedades Agrícolas S.A. | 222,967 |
| 4,331 |
| — |
| — |
| — |
| (4,677) |
| (7,275) |
| — |
| — |
| 215,346 |
| — |
Nova Agrícola Ponte Alta S.A. | 390,615 |
| 35,196 |
| — |
| — |
| — |
| 16,010 |
| — |
| — |
| — |
| 441,821 |
| 1,960 |
Nova Santa Bárbara Agrícola S.A. | 31,504 |
| (3,141) |
| — |
| — |
| — |
| (415) |
| — |
| — |
| — |
| 27,948 |
| 1,712 |
Nova Amaralina S.A. Propriedades Agrícolas | 192,332 |
| 12,971 |
| — |
| — |
| — |
| 14,881 |
| — |
| — |
| — |
| 220,184 |
| — |
Terras da Ponte Alta S.A. | 81,292 |
| 14,440 |
| — |
| — |
| — |
| (3,610) |
| — |
| — |
| — |
| 92,122 |
| 11,072 |
Paineira Propriedades Agrícolas S.A. | 169,216 |
| 40,115 |
| — |
| — |
| — |
| 1,404 |
| — |
| — |
| — |
| 210,735 |
| 4,433 |
Manacá Propriedades Agrícolas S.A. | 170,613 |
| 40,163 |
| — |
| — |
| — |
| 19 |
| (1,151) |
| — |
| — |
| 209,644 |
| 2,694 |
Castanheira Propriedades Agrícolas S.A. | 251,370 |
| 52,944 |
| — |
| — |
| — |
| 27,139 |
| — |
| — |
| — |
| 331,453 |
| 4,863 |
Tellus Brasil Participações S.A. | 634,068 |
| 138,418 |
| — |
| — |
| — |
| (9,970) |
| (4,526) |
| — |
| 16,847 |
| 774,837 |
| — |
Janus Brasil Participações S.A. | 884,053 |
| 227,451 |
| — |
| — |
| — |
| (18,407) |
| — |
| — |
| 29,595 |
| 1,122,692 |
| — |
Duguetiapar Empreendimentos e Participações S.A. | 18,740 |
| 6,441 |
| — |
| — |
| — |
| (7,458) |
| — |
| — |
| (2) |
| 17,721 |
| — |
Gamiovapar Empreendimentos e Participações S.A. | 122,561 |
| 4,731 |
| — |
| — |
| — |
| (11,654) |
| (1,231) |
| — |
| (71) |
| 114,336 |
| — |
Moove |
|
|
|
|
|
|
|
|
|
|
|
|
|
|
|
|
|
|
|
|
|
Moove Lubricants Holdings | 1,644,170 |
| 193,618 |
| — |
| — |
| (183,732) |
| (35,808) |
| — |
| — |
| 7,968 |
| 1,626,216 |
| 368 |
Other | 762 |
| 290 |
| — |
| — |
| (57) |
| (368) |
| — |
| — |
| — |
| 627 |
| — |
Total investments in associates | 31,230,371 |
| 2,235,872 |
| 15,654 |
| 6,323 |
| (212,499) |
| (348,493) |
| 2,826,025 |
| (20,110) |
| 8,635 |
| 35,741,778 |
| 99,194 |
Cosan Corporate |
|
|
|
|
|
|
|
|
|
|
|
|
|
|
|
|
|
|
|
|
|
Cosan Luxembourg S.A. | (146,473) |
| 197 |
| — |
| — |
| — |
| — |
| — |
| — |
| — |
| (146,276) |
| — |
Total provision for uncovered liability of associates | (146,473) |
| 197 |
| — |
| — |
| — |
| — |
| — |
| — |
| — |
| (146,276) |
| — |
Total | 31,083,898 |
| 2,236,069 |
| 15,654 |
| 6,323 |
| (212,499) |
| (348,493) |
| 2,826,025 |
| (20,110) |
| 8,635 |
| 35,595,502 |
| 99,194 |
| (i) | On March 10, 2023, Sinlog Tecnologia was transferred to Logística S.A. for assets held for sale, and consequently their definitive sale as detailed in the explanatory note 2. | |
| (ii) | Dividends receivable by Cosan S.A. from its subsidiaries. |
Explanatory Notes to the Financial Statement
(In thousands of Reais, except when otherwise indicated)
| At January 1, 2022 |
| Interest in earnings of subsidiaries |
| Discontinued operation |
| Change of equity interest in subsidiary |
| Asset and liability valuation adjustment |
| Dividends |
| Capital increase |
| Investment reclassification |
| Contributed capital |
| Bargain purchase |
| Business combination |
| Other |
| At December 31, 2022 |
| Dividend receivable |
Rumo |
|
|
|
|
|
|
|
|
|
|
|
|
|
|
|
|
|
|
|
|
|
|
|
|
|
|
|
Rumo S.A. | 4,490,787 |
| 156,420 |
| — |
| 1,344 |
| 1,837 |
| (37,140) |
| — |
| — |
| — |
| — |
| — |
| — |
| 4,613,248 |
| 37,131 |
Cosan Corporate |
|
|
|
|
|
|
|
|
|
|
|
|
|
|
|
|
|
|
|
|
|
|
|
|
|
|
|
Compass Gás e Energia | — |
| — |
| — |
| — |
| — |
| — |
| — |
| — |
| — |
| — |
| — |
| — |
| — |
| — |
Cosan Corretora de Seguros Ltda | — |
| 239 |
| — |
| — |
| — |
| — |
| 5 |
| — |
| — |
| — |
| — |
| — |
| 244 |
| — |
Cosan Nove Participações S.A. | — |
| 142,169 |
| — |
| 1,416,657 |
| 27,530 |
| (33,765) |
| — |
| — |
| 5,601,173 |
| — |
| — |
| — |
| 7,153,764 |
| 33,765 |
Cosan Dez Participações S.A. | — |
| 32,154 |
| 17,180 |
| 2,558,635 |
| 16,882 |
| (11,717) |
| 138,933 |
| — |
| 1,559,146 |
| — |
| — |
| — |
| 4,311,213 |
| 48,745 |
Pasadena Empreendimentos e Participações S.A. | 879 |
| (93) |
| — |
| — |
| — |
| — |
| 700 |
| — |
| — |
| — |
| — |
| — |
| 1,486 |
| — |
Cosan Limited Partners Brasil Consultoria Ltda | 555 |
| (209) |
| — |
| — |
| — |
| — |
| — |
| — |
| — |
| — |
| — |
| — |
| 346 |
| — |
Other | 68,768 |
| 1,871 |
| — |
| — |
| 1,959 |
| — |
| — |
| — |
| — |
| — |
| — |
| 1,729 |
| 74,327 |
| — |
Cosan Oito S.A. | — |
| 522,783 |
| — |
| — |
| — |
| (124,161) |
| 7,860,000 |
| — |
| — |
| — |
| — |
| — |
| 8,258,622 |
| 124,161 |
Atlântico Participações Ltda | 433,615 |
| (1,497) |
| — |
| — |
| — |
| — |
| 479,224 |
| — |
| — |
| — |
| — |
| — |
| 911,342 |
| 190 |
Cosan Global | 137,527 |
| (8,659) |
| — |
| — |
| — |
| — |
| — |
| — |
| — |
| — |
| — |
| — |
| 128,868 |
| — |
Sinlog Tecnologia em Logística S.A. | 17,052 |
| (12,318) |
| — |
| 9,339 |
| — |
| — |
| 6,082 |
| — |
| — |
| — |
| — |
| — |
| 20,155 |
| — |
Radar |
|
|
|
|
|
|
|
|
|
|
|
|
|
|
|
|
|
|
|
|
|
|
|
|
|
|
|
Radar II Propriedades Agrícolas S.A. | — |
| 246,698 |
| — |
| — |
| 108 |
| (60,482) |
| — |
| 756,931 |
| — |
| — |
| — |
| — |
| 943,255 |
| 85,517 |
Radar Propriedades Agrícolas S.A. | — |
| 34,002 |
| — |
| — |
| — |
| (9,614) |
| — |
| 198,579 |
| — |
| — |
| — |
| — |
| 222,967 |
| 11,797 |
Nova Agrícola Ponte Alta S.A. | — |
| 97,035 |
| — |
| — |
| — |
| (25,459) |
| — |
| 319,039 |
| — |
| — |
| — |
| — |
| 390,615 |
| 30,069 |
Nova Santa Bárbara Agrícola S.A. | — |
| 8,000 |
| — |
| — |
| — |
| (1,981) |
| — |
| 25,485 |
| — |
| — |
| — |
| — |
| 31,504 |
| 1,981 |
Nova Amaralina S.A. Propriedades Agrícolas | — |
| 53,686 |
| — |
| — |
| — |
| (14,098) |
| — |
| 152,744 |
| — |
| — |
| — |
| — |
| 192,332 |
| 19,358 |
Terras da Ponte Alta S.A. | — |
| 39,890 |
| — |
| — |
| — |
| (8,907) |
| — |
| 50,309 |
| — |
| — |
| — |
| — |
| 81,292 |
| 8,990 |
Paineira Propriedades Agrícolas S.A. | — |
| 58,604 |
| — |
| — |
| — |
| (15,790) |
| — |
| 126,402 |
| — |
| — |
| — |
| — |
| 169,216 |
| 13,028 |
Manacá Propriedades Agrícolas S.A. | — |
| 46,793 |
| — |
| — |
| — |
| (13,259) |
| — |
| 137,079 |
| — |
| — |
| — |
| — |
| 170,613 |
| 12,347 |
Castanheira Propriedades Agrícolas S.A. | — |
| 77,819 |
| — |
| — |
| — |
| (25,776) |
| — |
| 199,327 |
| — |
| — |
| — |
| — |
| 251,370 |
| 40,831 |
Violeta Fundo de Investimento Multimercado | 2,119,143 |
| 107,133 |
| — |
| — |
| 11,035 |
| (132,885) |
| — |
| (2,104,426) |
| — |
| — |
| — |
| — |
| — |
|
|
Tellus Brasil Participações S.A. | 142,795 |
| 99,855 |
| — |
| — |
| — |
| (26,410) |
| — |
| 58,806 |
| — |
| 37,578 |
| 363,211 |
| (41,767) |
| 634,068 |
| 5,086 |
Janus Brasil Participações S.A. | 183,356 |
| 126,508 |
| — |
| — |
| — |
| (122,661) |
| — |
| 79,725 |
| — |
| 49,224 |
| 567,901 |
| — |
| 884,053 |
| — |
Duguetiapar Empreendimentos e Participações S.A. | — |
| 1,453 |
| — |
| — |
| — |
| — |
| — |
| — |
| — |
| 1,798 |
| 10,022 |
| 5,467 |
| 18,740 |
| — |
Gamiovapar Empreendimentos e Participações S.A. | — |
| 9,020 |
| — |
| — |
| — |
| — |
| — |
| — |
| — |
| 10,741 |
| 66,500 |
| 36,300 |
| 122,561 |
| — |
Payly Soluções de Pagamentos S.A. | 9,607 |
| (3,748) |
| — |
| — |
| — |
| — |
| — |
| — |
| — |
| — |
| — |
| (5,859) |
| — |
| — |
Moove |
|
|
|
|
|
|
|
|
|
|
|
|
|
|
|
|
|
|
|
|
|
|
|
|
|
|
|
Moove Lubricants Holdings | 1,600,170 |
| 340,621 |
| — |
| — |
| 11,801 |
| (308,422) |
| — |
| — |
| — |
| — |
| — |
| — |
| 1,644,170 |
| 136,460 |
Other | — |
| — |
| — |
| — |
| — |
| — |
| — |
| — |
| — |
| — |
| — |
| — |
| — |
| — |
Compass |
|
|
|
|
|
|
|
|
|
|
|
|
|
|
|
|
|
|
|
|
|
|
|
|
|
|
|
Compass Gás e Energia | 5,583,215 |
| 1,523,381 |
| — |
| (891) |
| (11,688) |
| (1,437,213) |
| — |
| — |
| (5,656,804) |
| — |
| — |
| — |
| — |
|
|
Total investments in associates | 14,787,469 |
| 3,699,610 |
| 17,180 |
| 3,985,084 |
| 59,464 |
| (2,409,740) |
| 8,484,944 |
| — |
| 1,503,515 |
| 99,341 |
| 1,007,634 |
| (4,130) |
| 31,230,371 |
| 609,456 |
Cosan Corporate |
|
|
|
|
|
|
|
|
|
|
|
|
|
|
|
|
|
|
|
|
|
|
|
|
|
|
|
Cosan Luxembourg S.A. | (356,442) |
| 209,969 |
| — |
| — |
| — |
| — |
| — |
| — |
| — |
| — |
| — |
| — |
| (146,473) |
| — |
Total provision for uncovered liability of associates | (356,442) |
| 209,969 |
| — |
| — |
| — |
| — |
| — |
| — |
| — |
| — |
| — |
| — |
| (146,473) |
| — |
Total | 14,431,027 |
| 3,909,579 |
| 17,180 |
| 3,985,084 |
| 59,464 |
| (2,409,740) |
| 8,484,944 |
| — |
| 1,503,515 |
| 99,341 |
| 1,007,634 |
| (4,130) |
| 31,083,898 |
| 609,456 |
Explanatory Notes to the Financial Statement
(In thousands of Reais, except when otherwise indicated)
Financial information of subsidiaries and associates:
| Balance as of December 31, 2023 |
| Balance as of December 31, 2022 | ||||||||||||
| Assets |
| Liabilities |
| Shareholders' equity and unsecured liabilities |
| Net income for the year |
| Assets |
| Liabilities |
| Shareholders' equity and unsecured liabilities |
| Net income for the year |
Rumo |
|
|
|
|
|
|
|
|
|
|
|
|
|
|
|
Rumo S.A. | 49,238,439 |
| (33,367,447) |
| 15,870,992 |
| 721,915 |
| 45,951,748 |
| (30,541,294) |
| 15,410,454 |
| 514,022 |
Cosan Corporate |
|
|
|
|
|
|
|
|
|
|
|
|
|
|
|
Cosan Corretora de Seguros Ltda | 1,475 |
| (218) |
| 1,257 |
| 1,013 |
| 245 |
| (2) |
| 243 |
| 239 |
Cosan Nove Participações S.A. | 10,378,188 |
| (393) |
| 10,377,795 |
| 999,748 |
| 9,957,152 |
| (169,079) |
| 9,788,073 |
| 194,522 |
Cosan Dez Participações S.A. | 29,394,359 |
| (19,707,826) |
| 9,686,533 |
| 1,804,326 |
| 25,124,201 |
| (16,642,318) |
| 8,481,883 |
| 62,650 |
Pasadena Empreendimentos e Participações S.A. | 2,013 |
| (561) |
| 1,452 |
| (33) |
| 2,048 |
| (562) |
| 1,486 |
| (93) |
Cosan Limited Partners Brasil Consultoria Ltda | 287 |
| — |
| 287 |
| (69) |
| 357 |
| (1) |
| 356 |
| 214 |
Cosan Luxembourg S.A. | 8,141,418 |
| (8,287,693) |
| (146,275) |
| 198 |
| 7,394,386 |
| (7,540,859) |
| (146,473) |
| 209,969 |
Cosan Oito S.A. | 17,148,403 |
| (6,772,114) |
| 10,376,289 |
| (346,359) |
| 21,105,355 |
| (12,846,728) |
| 8,258,627 |
| 522,783 |
Atlântico Participações Ltda | 992,412 |
| (89,991) |
| 902,421 |
| (8,921) |
| 981,457 |
| (70,115) |
| 911,342 |
| (1,497) |
Cosan Global | 119,355 |
| — |
| 119,355 |
| (9,513) |
| 128,868 |
| — |
| 128,868 |
| (8,659) |
Sinlog Tecnologia em Logística S.A. | — |
| — |
| — |
| — |
| 18,503 |
| (8,901) |
| 9,602 |
| (1,764) |
Radar |
|
|
|
|
|
|
|
|
|
|
|
|
|
|
|
Radar II Propriedades Agrícolas S.A. | 2,378,123 |
| (91,077) |
| 2,287,046 |
| 332,222 |
| 2,089,843 |
| (224,131) |
| 1,865,712 |
| 509,131 |
Radar Propriedades Agrícolas S.A. | 549,223 |
| (29,692) |
| 519,531 |
| 10,448 |
| 590,386 |
| (52,469) |
| 537,917 |
| 97,663 |
Nova Agrícola Ponte Alta S.A. | 1,108,509 |
| (42,596) |
| 1,065,913 |
| 84,912 |
| 1,039,678 |
| (97,302) |
| 942,377 |
| 245,687 |
Nova Santa Bárbara Agrícola S.A. | 78,808 |
| (11,380) |
| 67,428 |
| (7,577) |
| 86,364 |
| (10,360) |
| 76,005 |
| 20,127 |
Nova Amaralina S.A. Propriedades Agrícolas | 563,096 |
| (31,890) |
| 531,206 |
| 31,292 |
| 534,096 |
| (70,085) |
| 464,012 |
| 136,048 |
Terras da Ponte Alta S.A. | 259,687 |
| (37,436) |
| 222,251 |
| 34,838 |
| 224,952 |
| (28,830) |
| 196,122 |
| 96,754 |
Paineira Propriedades Agrícolas S.A. | 537,119 |
| (28,711) |
| 508,408 |
| 96,780 |
| 453,093 |
| (44,851) |
| 408,242 |
| 152,373 |
Manacá Propriedades Agrícolas S.A. | 530,358 |
| (24,585) |
| 505,773 |
| 96,894 |
| 451,728 |
| (40,117) |
| 411,611 |
| 127,955 |
Castanheira Propriedades Agrícolas S.A. | 840,064 |
| (40,418) |
| 799,646 |
| 127,731 |
| 729,294 |
| (122,854) |
| 606,440 |
| 248,744 |
Tellus Brasil Participações Ltda | 4,129,945 |
| (171,300) |
| 3,958,645 |
| 707,176 |
| 3,533,817 |
| (294,358) |
| 3,239,459 |
| 1,424,072 |
Janus Brasil Participações S.A. | 6,017,992 |
| (282,158) |
| 5,735,834 |
| 1,162,047 |
| 5,031,454 |
| (514,828) |
| 4,516,626 |
| 1,910,077 |
Duguetiapar Empreendimentos e Participações S.A. | 97,542 |
| (7,008) |
| 90,534 |
| 32,906 |
| 98,862 |
| (3,124) |
| 95,739 |
| 19,403 |
Gamiovapar Empreendimentos e Participações S.A. | 617,029 |
| (32,890) |
| 584,139 |
| 24,170 |
| 644,621 |
| (21,462) |
| 623,159 |
| 119,273 |
Moove |
|
|
|
|
|
|
|
|
|
|
|
|
|
|
|
Moove Lubricants Holdings | 7,969,260 |
| (5,649,161) |
| 2,320,099 |
| 276,938 |
| 8,969,378 |
| (6,620,118) |
| 2,349,260 |
| 486,897 |
Explanatory Notes to the Financial Statement
(In thousands of Reais, except when otherwise indicated)
b) Consolidated
| Shares issued by the investee |
| Shares held by Cosan |
| Cosan ownership interest |
Rumo |
|
|
|
|
|
Rhall Terminais Ltda | 28,580 |
| 8,574 |
| 30.00% |
Termag - Terminal Marítimo de Guarujá S.A. | 500,000 |
| 99,246 |
| 19.85% |
TGG - Terminal de Granéis do Guarujá S.A. | 79,747,000 |
| 7,914,609 |
| 9.92% |
Elevações Portuárias S.A. | 672,397,254 |
| 134,479,451 |
| 20.00% |
Terminal XXXIX S.A. | 200,000 |
| 99,246 |
| 49.62% |
Compass |
|
|
|
|
|
Gás de Alagoas S.A. – ALGÁS | 810,896,963 |
| 238,728,878 |
| 29.44% |
Companhia de Gás do Ceará – Cegás | 39,400,000 |
| 11,599,428 |
| 29.44% |
CEG Rio S.A. | 1,995,022,625 |
| 746,251,086 |
| 37.41% |
Companhia Paranaense de Gás - Compagás | 33,600,000 |
| 8,232,000 |
| 24.50% |
Companhia Potiguar de Gás – Potigas | 4,245,000 |
| 3,523,350 |
| 83.00% |
Companhia de Gás de Mato Grosso do Sul - Msgás | 61,610,000 |
| 30,188,900 |
| 49.00% |
Companhia de Gás de Santa Catarina - Scgás | 10,749,497 |
| 4,407,293 |
| 41.00% |
Sergipe Gás S.A. – SERGÁS | 1,593,656 |
| 661,363 |
| 41.50% |
Companhia Pernambucana de Gás - Copergás | 163,485,912 |
| 67,846,653 |
| 41.50% |
Cosan Corporate |
|
|
|
|
|
Vale S.A | 4,539,007,580 |
| 190,965,062 |
| 4.90% |
Explanatory Notes to the Financial Statement
(In thousands of Reais, except when otherwise indicated)
| At January 1, 2023 |
| Interest in earnings of subsidiaries |
| Discontinued operation |
| Dividends |
| Capital reduction |
| Reclassification to held for sale |
| Reclassification of financial assets |
| Other (ii) |
| At December 31, 2023 |
| Dividend receivable (i) |
Rumo |
|
|
|
|
|
|
|
|
|
|
|
|
|
|
|
|
|
|
|
Rhall Terminais Ltda | 5,654 |
| 1,716 |
| — |
| (1,200) |
| — |
| — |
| — |
| — |
| 6,170 |
| — |
Termag - Terminal Marítimo de Guarujá S.A. | 8,464 |
| (2,446) |
| — |
| — |
| — |
| — |
| — |
| — |
| 6,018 |
| — |
TGG - Terminal de Granéis do Guarujá S.A. | 17,468 |
| 8,826 |
| — |
| (10,334) |
| — |
| — |
| — |
| — |
| 15,960 |
| — |
Elevações Portuárias S.A. | 296,746 |
| 38,992 |
| — |
| (18,960) |
| (99,040) |
| — |
| — |
| — |
| 217,738 |
| — |
Terminal XXXIX S.A. | 53,136 |
| 28,247 |
| — |
| (14,968) |
| — |
| — |
| — |
| — |
| 66,415 |
| — |
Compass |
|
|
|
|
|
|
|
|
|
|
|
|
|
|
|
|
|
|
|
Companhia Paranaense de Gás - Compagás | 424,837 |
| 36,300 |
| — |
| (57,956) |
| — |
| — |
| — |
| 351 |
| 403,532 |
| 5,636 |
Companhia Pernambucana de Gás - Copergás | 415,301 |
| — |
| 5,921 |
| (19,238) |
| — |
| (401,984) |
| — |
| — |
| — |
| — |
Companhia de Gás de Santa Catarina - Scgás | 627,829 |
| 37,028 |
| — |
| (24,525) |
| — |
| — |
| — |
| — |
| 640,332 |
| 6,957 |
Sergipe Gás S.A. - SERGÁS | 69,430 |
| — |
| 3,230 |
| (5,466) |
| — |
| (67,194) |
| — |
| — |
| — |
| — |
Companhia de Gás do Ceará - Cegás | 184,537 |
| — |
| 11,573 |
| (13,676) |
| — |
| (183,880) |
| — |
| 1,446 |
| — |
| — |
CEG Rio S.A. | 274,480 |
| 84,822 |
| — |
| (70,916) |
| — |
| — |
| — |
| — |
| 288,386 |
| 20,708 |
Companhia de Gás de Mato Grosso do Sul - Msgás | 291,543 |
| 20,828 |
| — |
| (14,497) |
| — |
| — |
| — |
| — |
| 297,874 |
| 2,496 |
Companhia Potiguar de Gás - Potigas | 168,887 |
| — |
| 14,371 |
| (13,118) |
| — |
| (170,140) |
| — |
| — |
| — |
| — |
Gás de Alagoas S.A. - Algás | 68,448 |
| — |
| 10,324 |
| (8,492) |
| — |
| (69,656) |
| — |
| (624) |
| — |
| — |
Cosan Corporate |
|
|
|
|
|
|
|
|
|
|
|
|
|
|
|
|
|
|
|
Vale S.A | — |
| 96,075 |
| — |
| — |
| — |
| — |
| 16,274,081 |
| (707,671) |
| 15,662,485 |
| — |
Other | 7,183 |
| 11 |
| — |
| — |
| — |
| — |
| — |
| (735) |
| 6,459 |
| 39 |
| 2,913,943 |
| 350,399 |
| 45,419 |
| (273,346) |
| (99,040) |
| (892,854) |
| 16,274,081 |
| (707,233) |
| 17,611,369 |
| 35,836 |
| (i) | Dividends receivable by the controlling companies of the subsidiaries disclosed in the table, which are consolidated in Cosan S.A. | |
| (ii) | The balance of others is mainly composed of the cost of the shares sold by Vale S.A. in the amount of R$701,575. |
Explanatory Notes to the Financial Statement
(In thousands of Reais, except when otherwise indicated)
| At January 1, 2022 |
| Interest in earnings of subsidiaries |
| Discontinued operation |
| Change of equity interest in subsidiary |
| Asset valuation adjustment |
| Declared dividends |
| Disposal of investment |
| Contributed capital |
| Business combination |
| Other |
| At December 31, 2022 |
| Dividend receivable (i) |
Rumo |
|
|
|
|
|
|
|
|
|
|
|
|
|
|
|
|
|
|
|
|
|
|
|
Rhall Terminais Ltda | 4,907 |
| 1,647 |
| — |
| — |
| — |
| (900) |
| — |
| — |
| — |
| — |
| 5,654 |
| 71 |
Termag - Terminal Marítimo de Guarujá S.A. | 4,725 |
| 4,445 |
| — |
| — |
| — |
| — |
| — |
| — |
| — |
| (706) |
| 8,464 |
| 151 |
TGG - Terminal de Granéis do Guarujá S.A. | 17,563 |
| 5,689 |
| — |
| — |
| — |
| (5,784) |
| — |
| — |
| — |
| — |
| 17,468 |
| 118 |
Elevações Portuárias S.A. | — |
| 6,190 |
| — |
| 135,159 |
| — |
| — |
| 155,397 |
| — |
| — |
| — |
| 296,746 |
| 717 |
Terminal XXXIX S.A. | 30,649 |
| 22,487 |
| — |
| — |
| — |
| — |
| — |
| — |
| — |
| — |
| 53,136 |
| — |
Compass |
|
|
|
|
|
|
|
|
|
|
|
|
|
|
|
|
|
|
|
|
|
|
|
Companhia Paranaense de Gás - Compagás | — |
| 19,931 |
| — |
| — |
| — |
| (6,831) |
| — |
| — |
| 411,737 |
| — |
| 424,837 |
| 44,121 |
Companhia Pernambucana de Gás - Copergás | — |
| — |
| 19,094 |
| — |
| — |
| (9,493) |
| — |
| — |
| 405,700 |
| — |
| 415,301 |
| 8,300 |
Companhia de Gás de Santa Catarina - Scgás | — |
| 34,885 |
| — |
| — |
| — |
| (15,524) |
| — |
| — |
| 608,468 |
| — |
| 627,829 |
| 16,214 |
Sergipe Gás S.A. - SERGÁS | — |
| — |
| 9,015 |
| — |
| — |
| (3,441) |
| — |
| — |
| 63,856 |
| — |
| 69,430 |
| 3,202 |
Companhia de Gás do Ceará - Cegás | — |
| — |
| 6,717 |
| — |
| — |
| (4,189) |
| — |
| — |
| 182,009 |
| — |
| 184,537 |
| — |
CEG Rio S.A. | — |
| 29,686 |
| — |
| — |
| — |
| (16,542) |
| — |
| — |
| 261,336 |
| — |
| 274,480 |
| 14,968 |
Companhia de Gás de Mato Grosso do Sul - Msgás | — |
| 13,530 |
| — |
| — |
| — |
| (6,160) |
| — |
| — |
| 284,173 |
| — |
| 291,543 |
| 3,837 |
Companhia Potiguar de Gás - Potigas | — |
| — |
| 9,066 |
| — |
| — |
| (8,390) |
| — |
| — |
| 168,211 |
| — |
| 168,887 |
| 7,674 |
Gás de Alagoas S.A. - Algás | — |
| — |
| 5,954 |
| — |
| — |
| (2,985) |
| — |
| — |
| 66,001 |
| (522) |
| 68,448 |
| 2,711 |
Radar |
|
|
|
|
|
|
|
|
|
|
|
|
|
|
|
|
|
|
|
|
|
|
|
Tellus Brasil Participações S.A. | 142,798 |
| 128,860 |
| — |
| — |
| — |
| (30,756) |
| — |
| 58,806 |
| (299,708) |
| — |
| — |
| — |
Janus Brasil Participações S.A. | 183,357 |
| 150,687 |
| — |
| — |
| — |
| (35,559) |
| — |
| 79,725 |
| (378,210) |
| — |
| — |
| — |
Cosan Corporate |
|
|
|
|
|
|
|
|
|
|
|
|
|
|
|
|
|
|
|
|
|
|
|
TUP Porto São Luis S.A. | 394,380 |
| 49 |
| — |
| — |
| — |
| — |
| — |
| — |
| (393,579) |
| (850) |
| — |
| — |
Other | 1,688 |
| 811 |
| — |
| — |
| 5,536 |
| — |
| — |
| — |
| — |
| (852) |
| 7,183 |
| — |
| 780,067 |
| 418,897 |
| 49,846 |
| 135,159 |
| 5,536 |
| (146,554) |
| 155,397 |
| 138,531 |
| 1,379,994 |
| (2,930) |
| 2,913,943 |
| 102,084 |
| (i) | Dividends receivable by the parent companies of the subsidiaries disclosed in the table, which are consolidated in Cosan S.A. |
Explanatory Notes to the Financial Statement
(In thousands of Reais, except when otherwise indicated)
Financial information of subsidiaries and associates
| Balance as of December 31, 2023 |
| Balance as of December 31, 2022 | ||||||||||||
| Assets |
| Liabilities |
| Shareholders' equity and unsecured liabilities |
| Profit for the year |
| Assets |
| Liabilities |
| Shareholders' equity and unsecured liabilities |
| Profit for the year |
Rumo |
|
|
|
|
|
|
|
|
|
|
|
|
|
|
|
Rhall Terminais Ltda. | 33,060 |
| (12,491) |
| 20,569 |
| 5,983 |
| 33,382 |
| (14,534) |
| 18,848 |
| 5,811 |
Elevações Portuárias S.A. | 1,251,643 |
| (444,748) |
| 806,895 |
| 194,954 |
| 950,538 |
| (243,797) |
| 706,741 |
| 127,554 |
Termag - Terminal Marítimo de Guarujá S.A. | 298,815 |
| (268,730) |
| 30,085 |
| 4,721 |
| 273,760 |
| (231,119) |
| 42,641 |
| 19,881 |
TGG - Terminal de Granéis do Guarujá S.A. | 242,779 |
| (73,216) |
| 169,563 |
| 88,867 |
| 254,748 |
| (78,657) |
| 176,091 |
| 58,139 |
Terminal XXXIX S.A. | 481,569 |
| (326,731) |
| 154,838 |
| 53,986 |
| 433,412 |
| (388,882) |
| 44,530 |
| 44,530 |
Compass |
|
|
|
|
|
|
|
|
|
|
|
|
|
|
|
Companhia Paranaense de Gás - Compagás | 1,208,959 |
| (685,288) |
| 523,671 |
| 96,866 |
| 1,115,974 |
| (458,322) |
| 657,652 |
| 161,467 |
Companhia de Gás de Santa Catarina - Scgás | 1,118,237 |
| (399,252) |
| 718,985 |
| 153,217 |
| 1,093,210 |
| (453,632) |
| 639,578 |
| 161,504 |
CEG Rio S.A. | 1,944,385 |
| (1,326,484) |
| 617,901 |
| 233,099 |
| 1,910,875 |
| (1,351,937) |
| 558,938 |
| 150,969 |
Companhia de Gás de Mato Grosso do Sul - Msgás | 390,976 |
| (193,298) |
| 197,678 |
| 56,649 |
| 339,695 |
| (164,774) |
| 174,921 |
| 11,448 |
Cosan Corporate |
|
|
|
|
|
|
|
|
|
|
|
|
|
|
|
Vale S.A. | 423,626,000 |
| (232,661,000) |
| 190,965,000 |
| 39,940,000 |
| — |
| — |
| — |
| — |
Explanatory Notes to the Financial Statement
(In thousands of Reais, except when otherwise indicated)
Accounting policy: Combinations of businesses are recorded using the acquisition method. In general, the consideration transferred in an acquisition, as well as the identifiable net assets acquired and liabilities assumed, are measured at fair value. Any goodwill that develops is annually evaluated for impairment. Unless related to the issuance of debt or equity, transaction expenses are recorded as incurred in the income statement. For each business combination, the Company measures non-controlling interests in the acquisition using one of the following methods:
The transferred consideration excludes amounts related to the liquidation of preexisting relationships. Typically, these amounts are recognized in profit or loss Contingent consideration depends on an acquired business meeting targets within a fixed period. To calculate obligations at the time of acquisition and at each subsequent reporting date, projections of future performance are required. In addition, estimates are required to value the assets and liabilities acquired in business combinations. Intangible assets, such as brands, are frequently a crucial component of an acquired business because they enable us to derive greater value than would be possible otherwise. Measurement of fair values In measuring fair values, valuation techniques were used considering market prices for similar items, discounted cash flow, among others. Since this is a fair value measurement, the accounting for the acquisition will be revisited if new information obtained within one year of the acquisition date regarding the facts and circumstances that existed at the acquisition date indicates adjustments to the amounts mentioned above or any additional provision that existed at the acquisition date. Management's expectation is that only the measurements of intangible assets could have some kind of impact on this evaluation. |
BIOMETANO VERDE PAULÍNIA S.A.
On October 20, 2023, Compass Comercialização acquired a 51% stake in Biometano Verde Paulínia S.A. (“BVP”) for R$247,152, of which R$100,000 via capital contribution, R$135,000 paid in a single installment to the former controlling shareholders and R$12,152 referring to contingent consideration.
BVP is a privately held company based in Brazil whose activities will involve the purification and treatment of Biogas and the production, movement and sale of Biomethane. Compass Comercialização carried out the acquisition in line with the objective of expanding the Marketing & Services segment, offering increasingly complete solutions to its customers towards a safe and efficient energy transition.
In the evaluation carried out by the Company, the acquisition price was allocated as a biogas supply contract, lending contract and licenses for a fair value of R$384,277. Intangible assets will be amortized until 2045.
The fair value of the assets and liabilities acquired is shown below:
Explanatory Notes to the Financial Statement
(In thousands of Reais, except when otherwise indicated)
Consideration transferred |
| 12/31/2023 |
Capital contribution |
| 100,000 |
Cash transfer |
| 135,000 |
Contingent consideration |
| 12,152 |
Consideration transferred |
| 247,152 |
Identifiable assets acquired and liabilities assumed |
|
|
Cash, cash equivalents and restricted cash |
| 100,341 |
Intangible assets |
| 582,238 |
Trade payables |
| (5) |
Other obligations |
| (1) |
Deferred Income Tax (IR) and social contribution (CS) |
| (197,961) |
Non-controlling interest |
| (237,460) |
Liquid and acquired assets |
| 247,152 |
Contingent consideration |
| (12,152) |
Returns on financial investments |
| 341 |
Cash received |
| (100,341) |
Transferred consideration, net of cash |
| 135,000 |
The consolidated income statement includes net profit in the amount of R$1,104 since the acquisition date, respectively generated by BVP. If the acquired subsidiary had been consolidated since January 1, 2023, the consolidated income statement for the year ended December 31, 2023, would show a net profit of R$2,826 (unaudited).
For the purposes of annual procedures, Management evaluated the factors of the business combination and the estimates used.
Explanatory Notes to the Financial Statement
(In thousands of Reais, except when otherwise indicated)
Accounting policy: Transactions with non-controlling equity interests that do not result in a loss of control are accounted for as equity transactions – that is, as transactions with owners in their capacity as owners. |
Below is summarized financial information for each subsidiary that has non-controlling interests that are material to the group. The amounts disclosed for each subsidiary are before intercompany eliminations.
| Shares issued by the subsidiary |
| Shares held by non-controlling shareholders |
| Non-controlling interest |
Radar |
|
|
|
|
|
Tellus Brasil Participações S.A. | 119,063,044 |
| 95,250,435 |
| 80.00% |
Janus Brasil Participações S.A. | 286,370,051 |
| 229,096,041 |
| 80.00% |
Duguetiapar Empreendimentos e Participações S.A. | 3,573,842 |
| 2,859,074 |
| 80.00% |
Gamiovapar Empreendimentos e Participações S.A. | 12,912,970 |
| 10,330,376 |
| 80.00% |
Radar Propriedades Agrícolas S.A. | 737,500 |
| 368,750 |
| 50.00% |
Nova Agrícola Ponte Alta S.A. | 160,693,378 |
| 80,346,689 |
| 50.00% |
Terras da Ponte Alta S.A. | 16,066,329 |
| 8,033,165 |
| 50.00% |
Nova Santa Bárbara Agrícola S.A. | 32,336,994 |
| 16,168,497 |
| 50.00% |
Nova Amaralina S.A. | 30,603,159 |
| 15,301,580 |
| 50.00% |
Paineira Propriedades Agrícolas S.A. | 132,667,061 |
| 66,333,531 |
| 50.00% |
Manacá Propriedades Agrícolas S.A. | 128,977,921 |
| 64,488,961 |
| 50.00% |
Castanheira Propriedades Agrícolas S.A. | 83,850,938 |
| 41,925,469 |
| 50.00% |
Radar II Propriedades Agrícolas S.A. | 81,440,221 |
| 40,720,111 |
| 50.00% |
Rumo |
|
|
|
|
|
Rumo S.A. | 1,854,868,949 |
| 1,291,629,301 |
| 69.58% |
Moove |
|
|
|
|
|
Cosan Lubes Investments Limited | 34,963,764 |
| 10,489,129 |
| 30.00% |
Cosan Corporate |
|
|
|
|
|
Cosan Nove Participações S.A. | 7,663,761,735 |
| 2,062,583,640 |
| 26.91% |
Cosan Dez Participações S.A. | 3,473,458,687 |
| 805,963,829 |
| 23.20% |
The following table summarizes information relating to each of the Company's subsidiaries that has material non-controlling interests, prior to any intra-group elimination.
Explanatory Notes to the Financial Statement
(In thousands of Reais, except when otherwise indicated)
On January 1, 2023 | Interest in earnings of subsidiaries | Capital (reduction) increase | Gain (loss) with capital increase | Asset and liability valuation adjustment | Dividends | Business combination | Reclassification | Other | On December 31, 2023 | ||||||||||
Compass |
|
|
|
|
|
|
|
|
|
|
|
|
|
|
|
|
|
|
|
Comgás | 27,151 |
| 11,419 |
| — |
| — |
| 444 |
| (6,869) |
| — |
| — |
| — |
| 32,145 |
Commit Gás S.A. | 2,058,651 |
| 185,312 |
| — |
| — |
| — |
| (309,324) |
| — |
| (372,030) |
| (109) |
| 1,562,500 |
Norgás S.A. | — |
| — |
| — |
| — |
| — |
| — |
| — |
| 372,030 |
| — |
| 372,030 |
Biometano Verde Paulínia S.A | — |
| 521 |
| — |
| — |
| — |
| — |
| 237,460 |
| — |
| — |
| 237,981 |
Compass Gás e Energia | 782,583 |
| 192,358 |
| — |
| — |
| 132 |
| (183,126) |
| — |
| — |
| (1,275) |
| 790,672 |
Rumo |
|
|
|
|
|
|
|
|
|
|
|
|
|
|
|
|
|
|
|
Rumo S.A. | 10,797,146 |
| 503,029 |
| (12,250) |
| (9,280) |
| 704 |
| (122,165) |
| — |
| — |
| (52,595) |
| 11,104,589 |
Moove |
|
|
|
|
|
|
|
|
|
|
|
|
|
|
|
|
|
|
|
Cosan Lubes Investments Limited | 702,001 |
| 82,979 |
| — |
| — |
| (78,742) |
| (15,346) |
| — |
| — |
| 4,956 |
| 695,848 |
Cosan Corporate |
|
|
|
|
|
|
|
|
|
|
|
|
|
|
|
|
|
|
|
Cosan Limited Partners Brasil | 9 |
| (2) |
| — |
| — |
| — |
| — |
| — |
| — |
| — |
| 7 |
Cosan Nove Participações S.A. | 2,634,310 |
| 338,315 |
| — |
| 32,732 |
| (14,728) |
| (436,566) |
| — |
| — |
| 12,956 |
| 2,567,019 |
Cosan Dez Participações S.A. | 1,302,661 |
| 573,987 |
| 1 |
| — |
| 454 |
| (372,772) |
| — |
| — |
| 7,710 |
| 1,512,041 |
Sinlog Tecnologia em Logística S.A. | 14,911 |
| (1,969) |
| 21,959 |
| (12,622) |
| — |
| — |
| — |
| — |
| (22,279) |
| — |
Radar |
|
|
|
|
|
|
|
|
|
|
|
|
|
|
|
|
|
|
|
Janus Brasil Participações S.A. | 3,773,279 |
| 924,908 |
| — |
| — |
| — |
| (74,830) |
| — |
| — |
| 119,844 |
| 4,743,201 |
Tellus Brasil Participações S.A. | 2,584,058 |
| 562,713 |
| (18,400) |
| — |
| — |
| (40,531) |
| — |
| — |
| 68,488 |
| 3,156,328 |
Gamiovapar Empreendimentos e Participações S.A. | 505,681 |
| 19,233 |
| (5,004) |
| — |
| — |
| (47,377) |
| — |
| — |
| (289) |
| 472,244 |
Duguetiapar Empreendimentos e Participações S.A. | 70,857 |
| 26,185 |
| — |
| — |
| — |
| (30,319) |
| — |
| — |
| (8) |
| 66,715 |
Radar II Propriedades Agrícolas S.A. | 878,879 |
| 174,346 |
| (1,902) |
| — |
| — |
| 37,831 |
| — |
| — |
| — |
| 1,089,154 |
Radar Propriedades Agrícolas S.A. | 212,065 |
| 4,331 |
| (7,275) |
| — |
| — |
| (4,677) |
| — |
| — |
| — |
| 204,444 |
Nova Agrícola Ponte Alta S.A. | 365,807 |
| 35,196 |
| — |
| — |
| — |
| 16,010 |
| — |
| — |
| — |
| 417,013 |
Nova Amaralina S.A. Propriedades Agrícolas | 2,041 |
| 12,971 |
| — |
| — |
| — |
| 14,881 |
| — |
| — |
| — |
| 29,893 |
Nova Santa Bárbara Agrícola S.A. | 201,389 |
| (3,141) |
| — |
| — |
| — |
| (415) |
| — |
| — |
| — |
| 197,833 |
Terras da Ponte Alta S.A. | 73,421 |
| 14,440 |
| — |
| — |
| — |
| (3,610) |
| — |
| — |
| — |
| 84,251 |
Paineira Propriedades Agrícolas S.A. | 157,784 |
| 40,115 |
| — |
| — |
| — |
| 1,404 |
| — |
| — |
| — |
| 199,303 |
Manacá Propriedades Agrícolas S.A. | 160,553 |
| 40,163 |
| (1,151) |
| — |
| — |
| 19 |
| — |
| — |
| — |
| 199,584 |
Castanheira Propriedades Agrícolas S.A. | 210,995 |
| 52,944 |
| — |
| — |
| — |
| 27,139 |
| — |
| — |
| — |
| 291,078 |
| 27,516,232 |
| 3,790,353 |
| (24,022) |
| 10,830 |
| (91,736) |
| (1,550,643) |
| 237,460 |
| — |
| 137,399 |
| 30,025,873 |
Explanatory Notes to the Financial Statement
(In thousands of Reais, except when otherwise indicated)
| On January 1, 2022 |
| Interest in earnings of subsidiaries |
| Change of equity interest in subsidiary |
| Asset and liability valuation adjustment |
| Dividends |
| Capital increase |
| Acquisition of non-controlling interests |
| Business combination |
| Other |
| On December 31, 2022 |
Compass |
|
|
|
|
|
|
|
|
|
|
|
|
|
|
|
|
|
|
|
Comgás | 28,466 |
| 14,881 |
| — |
| — |
| (16,926) |
| — |
| — |
| — |
| 730 |
| 27,151 |
Commit Gás S.A. | — |
| 107,593 |
| — |
| — |
| (64,435) |
| — |
| — |
| 2,015,493 |
| — |
| 2,058,651 |
Compass Gás e Energia | 761,432 |
| 221,871 |
| (78) |
| 3,197 |
| (201,024) |
| — |
| — |
| — |
| (2,815) |
| 782,583 |
Sulgás | — |
| 6,466 |
| — |
| — |
| (26,701) |
| — |
| (888,450) |
| 908,883 |
| (198) |
| — |
Rumo |
|
|
|
|
|
|
|
|
|
|
|
|
|
|
|
|
|
|
|
Rumo S.A. | 10,527,777 |
| 357,642 |
| (21,358) |
| 2,061 |
| (89,194) |
| — |
| — |
| — |
| 20,218 |
| 10,797,146 |
Moove |
|
|
|
|
|
|
|
|
|
|
|
|
|
|
|
|
|
|
|
Cosan Lubes Investments Limited | 683,143 |
| 145,981 |
| — |
| (127,123) |
| — |
| — |
| — |
| — |
| — |
| 702,001 |
Cosan Corporate |
|
|
|
|
|
|
|
|
|
|
|
|
|
|
|
|
|
|
|
Cosan Limited Partners Brasil | 14 |
| (5) |
| — |
| — |
| — |
| — |
| — |
| — |
| — |
| 9 |
Cosan Nove Participações S.A. | — |
| 53,353 |
| (1,416,657) |
| 10,070 |
| (12,434) |
| 4,115,000 |
| — |
| — |
| (115,022) |
| 2,634,310 |
Cosan Dez Participações S.A. | — |
| 14,965 |
| (2,592,096) |
| 5,073 |
| (3,540) |
| 4,000,000 |
| — |
| — |
| (121,741) |
| 1,302,661 |
Sinlog Tecnologia em Logística S.A. | 6,549 |
| (7,677) |
| 16,039 |
| — |
| — |
| — |
| — |
| — |
| — |
| 14,911 |
Payly | 2,602 |
| (1,626) |
| — |
| — |
| — |
| — |
| — |
| — |
| (976) |
| — |
Radar |
|
|
|
|
|
|
|
|
|
|
|
|
|
|
|
|
|
|
|
Janus Brasil Participações S.A. | — |
| (10,971) |
| — |
| — |
| — |
| — |
| (196,857) |
| 3,981,107 |
| — |
| 3,773,279 |
Tellus Brasil Participações S.A. | — |
| 8,531 |
| — |
| — |
| — |
| — |
| (7,508) |
| 2,583,035 |
| — |
| 2,584,058 |
Gamiovapar Empreendimentos e Participações S.A. | — |
| 2,900 |
| — |
| — |
| — |
| — |
| 4,975 |
| 497,806 |
| — |
| 505,681 |
Duguetiapar Empreendimentos e Participações S.A. | — |
| (788) |
| — |
| — |
| — |
| — |
| (4,534) |
| 76,179 |
| — |
| 70,857 |
Radar II Propriedades Agrícolas S.A. | — |
| 246,698 |
| — |
| 108 |
| (124,858) |
| — |
| — |
| — |
| 756,931 |
| 878,879 |
Radar Propriedades Agrícolas S.A. | — |
| 34,002 |
| — |
| — |
| (20,516) |
| — |
| — |
| — |
| 198,579 |
| 212,065 |
Nova Agrícola Ponte Alta S.A. | — |
| 97,035 |
| — |
| — |
| (50,267) |
| — |
| — |
| — |
| 319,039 |
| 365,807 |
Nova Amaralina S.A. Propriedades Agrícolas | — |
| 8,000 |
| — |
| — |
| (31,444) |
| — |
| — |
| — |
| 25,485 |
| 2,041 |
Nova Santa Bárbara Agrícola S.A. | — |
| 53,686 |
| — |
| — |
| (5,041) |
| — |
| — |
| — |
| 152,744 |
| 201,389 |
Terras da Ponte Alta S.A. | — |
| 39,890 |
| — |
| — |
| (16,778) |
| — |
| — |
| — |
| 50,309 |
| 73,421 |
Paineira Propriedades Agrícolas S.A. | — |
| 58,604 |
| — |
| — |
| (27,222) |
| — |
| — |
| — |
| 126,402 |
| 157,784 |
Manacá Propriedades Agrícolas S.A. | — |
| 46,793 |
| — |
| — |
| (23,319) |
| — |
| — |
| — |
| 137,079 |
| 160,553 |
Castanheira Propriedades Agrícolas S.A. | — |
| 77,819 |
| — |
| — |
| (66,151) |
| — |
| — |
| — |
| 199,327 |
| 210,995 |
Violeta Fundo de Investimento Multimercado | 2,119,102 |
| 69,200 |
| (107,359) |
| 11,143 |
| (132,885) |
| — |
| — |
| — |
| (1,959,201) |
| — |
| 14,129,085 |
| 1,644,843 |
| (4,121,509) |
| (95,471) |
| (912,735) |
| 8,115,000 |
| (1,092,374) |
| 10,062,503 |
| (213,110) |
| 27,516,232 |
Explanatory Notes to the Financial Statement
(In thousands of Reais, except when otherwise indicated)
Summary statement of financial position:
| Cosan Dez |
| Cosan Nove |
| Moove |
| Rumo |
| Radar | ||||||||||
| 12/31/2023 |
| 12/31/2022 |
| 12/31/2023 |
| 12/31/2022 |
| 12/31/2023 |
| 12/31/2022 |
| 12/31/2023 |
| 12/31/2022 |
| 12/31/2023 |
| 12/31/2022 |
Current |
|
|
|
|
|
|
|
|
|
|
|
|
|
|
|
|
|
|
|
Assets | 1,020,790 |
| 2,015 |
| 4,903 |
| 2,721 |
| 91,412 |
| 1,777,104 |
| 3,846,647 |
| 2,474,218 |
| 819,887 |
| 514,788 |
Liabilities | (127,876) |
| (126,916) |
| (392) |
| (169,079) |
| (3,603) |
| (1,341,106) |
| (1,135,917) |
| (852,071) |
| (184,004) |
| (916,363) |
Current net assets | 892,914 |
| (124,901) |
| 4,511 |
| (166,358) |
| 87,809 |
| 435,998 |
| 2,710,730 |
| 1,622,147 |
| 635,883 |
| (401,575) |
Non-current |
|
|
|
|
|
|
|
|
|
|
|
|
|
|
|
|
|
|
|
Assets | 5,798,291 |
| 5,738,715 |
| 10,373,285 |
| 9,954,431 |
| 2,218,429 |
| 2,204,878 |
| 22,572,211 |
| 20,971,764 |
| 16,152,441 |
| 14,316,130 |
Liabilities | — |
| — |
| — |
| — |
| — |
| (1,208,604) |
| (9,611,588) |
| (7,402,742) |
| (613,705) |
| (530,331) |
Non-current net assets | 5,798,291 |
| 5,738,715 |
| 10,373,285 |
| 9,954,431 |
| 2,218,429 |
| 996,274 |
| 12,960,623 |
| 13,569,022 |
| 15,538,736 |
| 13,785,799 |
Shareholders’ equity | 6,691,205 |
| 5,613,814 |
| 10,377,796 |
| 9,788,073 |
| 2,306,238 |
| 1,432,272 |
| 15,671,353 |
| 15,191,169 |
| 16,174,619 |
| 13,384,224 |
Summary statements of profit or loss and other comprehensive income:
| Cosan Dez | Cosan Nove |
| Moove |
| Rumo | Radar | ||||||||||||||||||
| 12/31/2023 |
| 12/31/2022 |
| 12/31/2023 |
| 12/31/2022 |
| 12/31/2023 |
| 12/31/2022 |
| 12/31/2023 |
| 12/31/2022 |
| 12/31/2023 |
| 12/31/2022 | ||||||
Net revenue | — |
| — |
| — |
| — |
| — |
| 3,842,981 |
| 1,013,446 |
| 984,597 |
| 743,411 |
| 834,616 | ||||||
Income before taxes | 1,396,633 |
| 63,578 |
| 1,005,640 |
| 194,522 |
| 207,982 |
| 485,729 |
| 769,233 |
| 633,164 |
| 2,820,202 |
| 1,556,155 | ||||||
Income tax and social contribution | (2,301) |
| — |
| (5,892) |
| — |
| — |
| 11,665 |
| (49,569) |
| (118,224) |
| (147,636) |
| (74,915) | ||||||
Income (loss) for the year | 1,394,332 |
| 63,578 |
| 999,748 |
| 194,522 |
| 207,982 |
| 497,394 |
| 719,664 |
| 514,940 |
| 2,672,566 |
| 1,481,240 | ||||||
Other comprehensive income (loss) | 1,957 |
| — |
| (54,731) |
| — |
| (262,473) |
| — |
| 1,011 |
| 2,961 |
| — |
| — | ||||||
Total comprehensive results | 1,396,289 |
| 63,578 |
| 945,017 |
| 194,522 |
| (54,491) |
| 497,394 |
| 720,675 |
| 517,901 |
| 2,672,566 |
| 1,481,240 | ||||||
Comprehensive income attributable to non-controlling shareholders | 454 |
| 14,965 |
| (14,728) |
| 52,353 |
| (78,742) |
| 149,218 |
| 704 |
| 360,776 |
| — |
| — | ||||||
Dividends paid | 372,772 |
| — |
| 571,261 |
| — |
| — |
| 150,000 |
| 122,231 |
| 35,733 |
| 530,576 |
| 948,967 | ||||||
Summary Cash Flow Statement:
| Cosan Dez |
| Cosan Nove |
| Moove |
| Rumo |
| Radar | ||||||||||
| 12/31/2023 |
| 12/31/2022 |
| 12/31/2023 |
| 12/31/2022 |
| 12/31/2023 |
| 12/31/2022 |
| 12/31/2023 |
| 12/31/2022 |
| 12/31/2023 |
| 12/31/2022 |
Cash (generated (used in) in operating activities | (176) |
| 3 |
| 14,941 |
| 2 |
| (359) |
| 292,204 |
| 674,137 |
| 94,522 |
| 626,057 |
| 791,779 |
Cash (generated (used in) in investing activities | 757,196 |
| — |
| 555,408 |
| (19,217) |
| (5,683) |
| (41,004) |
| (175,273) |
| 2,518,699 |
| (30,681) |
| 175,611 |
Cash generated (used in) in financing activities | (372,772) |
| 2,011 |
| (571,261) |
| 21,936 |
| 7,976 |
| (197,994) |
| 445,843 |
| (1,235,688) |
| (581,012) |
| (949,277) |
Reduction of cash and cash equivalents | 384,248 |
| 2,014 |
| (912) |
| 2,721 |
| 1,934 |
| 53,206 |
| 944,707 |
| 1,377,533 |
| 14,364 |
| 18,113 |
Cash and cash equivalents at the beginning of the year | 2,014 |
| — |
| 2,721 |
| — |
| — |
| 761,698 |
| 2,169,335 |
| 791,802 |
| 25,582 |
| 7,469 |
Effect of FX variation on the cash balance and cash equivalents | — |
| — |
| — |
| — |
| (76) |
| — |
| — |
| — |
| — |
| — |
Cash and cash equivalents at the end of the year | 386,262 |
| 2,014 |
| 1,809 |
| 2,721 |
| 1,858 |
| 814,904 |
| 3,114,042 |
| 2,169,335 |
| 39,946 |
| 25,582 |
9.4. INVESTMENTS IN AFFILIATES WITH SIGNIFICANT INFLUENCE
On November 30, 2023, through the subsidiary Cosan Oito, the Company obtained sufficient to conclude evidence that it had ability to exert significant influence on Vale’s policies and operations as a result of the member appointed by Cosan to the board of directors of Vale being able to participate in policy-making processes, including decisions on dividends and other distributions. Accordingly, from this date onwards, Cosan began to consider Vale as a related company with significant influence, accounting for the investment using the equity method as required by CPC 18/IAS 28. See also note 1.1 (b).
Vale is a publicly traded corporation headquartered in the city of Rio de Janeiro, Brazil. Together with its subsidiaries, it is one of the largest producers of iron ore and nickel in the world, also producing iron ore and copper pellets.
Explanatory Notes to the Financial Statement
(In thousands of Reais, except when otherwise indicated)
The Company’s equity interest in Vale is detailed in the following table:
| Vale S.A. |
Shares issued by the investee | 4,539,007,580 |
Treasury shares by the investee | 239,153,280 |
Shares held by Cosan | 210,866,700 |
Cosan ownership interest | 4.90% |
Cosan ownership interest (total shares) | 4.65% |
Market price at December 31, 2023 (in R$) | 73.89 |
Fair value on the quoted market | 15,580,940 |
Dividends received (i) | 1,305,410 |
| (i) | Dividends and interest on equity received before obtaining significant influence. |
Summarized financial position:
The summarized financial information presented below reflects the adjustments to fair value made by the Company at the time of acquisition of significant influence.
| Fair value at December 31, 2023 |
Current assets | 71,488,000 |
Non-current assets held for sale | 19,041,000 |
Non-current assets | 559,608,737 |
Current liabilities | 69,424,316 |
Liabilities related to assets held for sale | 2,714,000 |
Non-current liabilities | 234,756,474 |
Revenue | 208,066,000 |
Other comprehensive income | (2,467,000) |
| Total comprehensive income | 38,087,000 |
| Equity | 326,980,947 |
| Cosan’s share in equity | 4.90% |
| Equity interest of Cosan’s Investment | 16,022,066 |
| Equity method of one month period (i) |
Profit for the period of one month | 2,189,734 |
Cosan's share in equity | 4.90% |
Cosan's share of one month period | 107,297 |
Amortization of fair value adjustments | (11,222) |
Equity in earnings | 96,075 |
| (i) | Equity in earnings related to the one-month period since the Company obtained significant influence at Vale on November 30, 2023. |
Explanatory Notes to the Financial Statement
(In thousands of Reais, except when otherwise indicated)
Accounting policy: A joint venture is an agreement whereby the parties that have joint control of the agreement have rights to the net assets of the agreement. The Company, through its subsidiary Cosan Nove, has an investment in a joint venture shown in the balance sheet as the share of net assets under the equity method of accounting, less any impairment losses. If applicable, adjustments are made to align any different accounting policies that may exist. The Company’s share of the results and shareholder’s equity of the joint venture is included in the income statement, comprehensive income statement and shareholder’s equity, respectively. Unrealized gains and losses resulting from transactions between the Company and its joint venture are eliminated to the extent of the Company’s investment in the joint venture, except where unrealized losses provide evidence of an impairment of the transferred asset. Goodwill arising from the acquisition of joint venture is included as part of the Company’s investment in the joint venture and, when necessary, the entire book value of the investment (including goodwill) is tested for impairment in accordance with CPC 01/IAS 36 Impairment of Assets as a single asset by comparing its recoverable amount (whichever is higher between the value in use and fair value less costs of disposal) with its book value. The investment in joint venture is considered as non-current assets and are shown at cost less any impairment losses. When an investment in a joint venture is classified as held for sale, it is accounted for in accordance with CPC 31/IFRS 5 Non-current Assets Held for Sale and Discontinued Operations. |
Changes to the investments in joint ventures were as follows:
| Raízen S.A. |
| Terminal Alvorada S.A |
| Total |
Shares issued by the investee | 10,352,509,484 |
| 100,197,076 |
|
|
Shares held by Cosan | 4,557,597,117 |
| 50,098,538 |
|
|
|
|
|
|
|
|
Cosan ownership interest | 5.02% |
| 50.00% |
|
|
Cosan's indirect shareholding | 25.90% |
| — |
|
|
Total (i) | 30.92% |
| 50.00% |
|
|
On January 1, 2022 | 10,936,663 |
| — |
| 10,936,663 |
Interest in earnings of joint ventures | (92,179) |
| — |
| (92,179) |
Asset and liability valuation adjustment | 1,053,226 |
| — |
| 1,053,226 |
Dividends | (676,354) |
| — |
| (676,354) |
On January 1, 2023 | 11,221,356 |
| — |
| 11,221,356 |
Interest in earnings of joint ventures (ii) | 1,694,679 |
| 1,266 |
| 1,695,945 |
Asset and liability valuation adjustment | (7,428) |
| — |
| (7,428) |
Capital increase (iv) | — |
| 47,300 |
| 47,300 |
Dividends (iii) | (1,214,731) |
| — |
| (1,214,731) |
At December 31, 2023 | 11,693,876 |
| 48,566 |
| 11,742,442 |
Explanatory Notes to the Financial Statement
(In thousands of Reais, except when otherwise indicated)
Raízen S.A
| (i) | The Company's total interest in Raízen S.A. is made up of 5.02% direct participation and 39.15% indirect participation through Cosan Nove. The disclosed percentage of 25.90% refers to the economic benefit calculated by the result of Cosan S.A's participation in its subsidiary Cosan Nove of 66.16% multiplied by the participation of 39.15%. For the Company's consolidated information, direct and indirect interests are added together and the impact relating to the participation of non-controlling shareholders in Cosan Nove is shown in the result line attributed to non-controlling shareholders. |
| (ii) | Raízen measured and recognized on September 30, 2023, PIS and COFINS credits in the consolidated amount of R$3,765,456 relating to Complementary Law 192/22 and R$1,465,726 relating to Complementary Law 194/22, totaling R $5,231,182, which impacted the equity income for the year by R$1,617,481, net of income tax and social contribution. |
| (iii) | Amount proposed and allocated in the year. In year ended as at December 31, 2023, dividends constituted in the period were paid in the amount of R$906,534. The joint venture’s statement of financial position and income statement are disclosed in the explanatory note 4 - Information by segment. As of December 31, 2023, the Company was in compliance with the covenants of the agreement governing the joint venture. |
Terminal Alvorada S.A. | |
| (iv) | On July 7, 2023, the subsidiary Rumo S.A contributed R$47,300 to form the joint venture Terminal Alvorada S.A with CHS Agronegócio Indústria e Comércio Ltda “CHS”, whose objective is to transform the CHS road transshipment warehouse in Alvorada (TO) in a road-rail transshipment terminal. |
Accounting policy:
Reduction to recoverable value
The recoverable amount is determined through value in use calculations, using the discounted cash flow determined by Management based on budgets that take into account the assumptions related to each business, using information available in the market and past performance. Discounted cash flows were prepared over a ten-year period and carried forward in perpetuity without considering an actual growth rate. Management understands the use of periods greater than five years in the preparation of discounted cash flows is appropriate for the purpose of calculating the recoverable amount, because it reflects the estimated time of use of the asset and of the business groups.
The Company reviews impairment indicators for intangible assets with defined useful lives and fixed assets on an annual basis. In addition, goodwill and intangible assets with an indefinite useful life are subjected to an impairment test. An impairment occurs when the carrying amount of an asset or cash-generating unit exceeds its recoverable amount, which is the greater of its fair value less costs to sell and its value in use.
The assumptions used in discounted cash flow projections - estimates of future business performance, cash generation, long-term growth, and discount rates - are utilized in our assessment of impairment of assets as of the date of the balance sheet. No plausible change to a central premise would be harmful. The primary assumptions used to determine the recoverable value of the various cash-generating units to which goodwill is allocated are described in the following section. |
Explanatory Notes to the Financial Statement
(In thousands of Reais, except when otherwise indicated)
Accounting policy:
Identification and evaluation
Cost, less accumulated depreciation and any accumulated impairment losses is used to value fixed assets.
Subsequent expenditures are only capitalized when it is probable that the associated future economic benefits will accrue to the company. Ongoing repairs and maintenance expenses are recorded as they are incurred.
Depreciated from the date of availability for use or, for constructed assets, from the date of completion and readiness for use.
Unless it is capitalized as part of the cost of another asset, depreciation is calculated on the book value of fixed assets less estimated residual values using the straight-line method over its estimated useful life and recognized in profit or loss. Land is not depreciated.
Methods of depreciation, such as useful lives and residual values, are reviewed at the end of each fiscal year or when there is a significant change without an expected consumption pattern, such as a relevant incident or technical obsolescence. If applicable, any adjustments are recorded as changes to accounting estimates. Depreciation is calculated on a straight-line basis over the estimated useful lives of the assets, as follows: |
Buildings and improvements | 4% - 5% | ||
Machinery, equipment and installations | 8% - 11% | ||
Furniture and fixtures | 10% - 15% | ||
Wagons | 2.9% - 6% | ||
Locomotives | 3.3% - 8% | ||
Permanent ways | 3% - 4% | ||
IT equipment | 20% | ||
Others | 10% - 20% |
Explanatory Notes to the Financial Statement
(In thousands of Reais, except when otherwise indicated)
a) Reconciliation of carrying amount:
| Consolidated |
| Parent Company | ||||||||||||
| Land, buildings and improvements |
| Machines, equipment and installations |
| Wagons and locomotives (i) |
| Permanent easement |
| Construction in progress |
| Other assets |
| Total |
| Total |
Cost |
|
|
|
|
|
|
|
|
|
|
|
|
|
|
|
On January 1, 2022 | 2,001,165 |
| 1,974,614 |
| 7,738,889 |
| 8,755,001 |
| 3,244,653 |
| 441,742 |
| 24,156,064 |
| 81,406 |
Business combination | 310,730 |
| 227,257 |
| — |
| — |
| 133,474 |
| 163,427 |
| 834,888 |
| — |
Additions | 5,442 |
| 12,208 |
| 772 |
| 11,120 |
| 3,387,758 |
| (2,253) |
| 3,415,047 |
| 1,636 |
Write-offs | (3,368) |
| (15,368) |
| (61,536) |
| (52) |
| (9,024) |
| (52,056) |
| (141,404) |
| (608) |
Transfers (ii) | 182,504 |
| 141,379 |
| 316,211 |
| 1,650,431 |
| (2,419,014) |
| 32,921 |
| (95,568) |
| (340) |
Exchange differences | 35,544 |
| 131,160 |
| — |
| — |
| 684 |
| 142,215 |
| 309,603 |
| — |
Write-off by disposal of investment | (396,614) |
| (528,452) |
| — |
| — |
| (23,444) |
| (5,043) |
| (953,553) |
| — |
On December 31, 2022 | 2,135,403 |
| 1,942,798 |
| 7,994,336 |
| 10,416,500 |
| 4,315,087 |
| 720,953 |
| 27,525,077 |
| 82,094 |
Additions | 11,356 |
| 18,671 |
| 898 |
| 710 |
| 4,577,377 |
| 15,497 |
| 4,624,509 |
| 1,380 |
Write-offs | (199,080) |
| (34,872) |
| (118,414) |
| (116,957) |
| (2,157) |
| (16,961) |
| (488,441) |
| — |
Transfers (ii) | 281,621 |
| 196,158 |
| 821,701 |
| 2,552,077 |
| (3,710,146) |
| 33,451 |
| 174,862 |
| (28) |
Exchange differences | (11,626) |
| (23,492) |
| — |
| — |
| 1,944 |
| (13,668) |
| (46,842) |
| — |
Assets held for sale | (89) |
| — |
| — |
| — |
| (396,150) |
| (535) |
| (396,774) |
| — |
On December 31, 2023 | 2,217,585 |
| 2,099,263 |
| 8,698,521 |
| 12,852,330 |
| 4,785,955 |
| 738,737 |
| 31,392,391 |
| 83,446 |
|
|
|
|
|
|
|
|
|
|
|
|
|
|
|
|
Depreciation |
|
|
|
|
|
|
|
|
|
|
|
|
|
|
|
On January 1, 2022 | (618,618) |
| (882,542) |
| (2,842,050) |
| (3,115,641) |
| (13,379) |
| (35,281) |
| (7,507,511) |
| (28,399) |
Additions | (73,712) |
| (187,599) |
| (566,999) |
| (670,921) |
| — |
| (66,064) |
| (1,565,295) |
| (8,058) |
Transfers (ii) | — |
| 8,170 |
| 51,591 |
| 8 |
| — |
| 53,031 |
| 112,800 |
| 407 |
Write-offs | (16,135) |
| 26,732 |
| 139 |
| 23,931 |
| — |
| (514) |
| 34,153 |
| — |
Exchange differences | (22,244) |
| (120,943) |
| — |
| — |
| — |
| (127,215) |
| (270,402) |
| — |
Write-off by disposal of investment | 208,661 |
| 406,945 |
| — |
| — |
| — |
| 4,008 |
| 619,614 |
| — |
On December 31, 2022 | (522,048) |
| (749,237) |
| (3,357,319) |
| (3,762,623) |
| (13,379) |
| (172,035) |
| (8,576,641) |
| (36,050) |
Additions | (76,599) |
| (183,965) |
| (613,033) |
| (806,398) |
| — |
| (74,695) |
| (1,754,690) |
| (7,579) |
Transfers (ii) | (49,649) |
| 5,476 |
| (6,838) |
| (31,199) |
| — |
| (45) |
| (82,255) |
| — |
Write-offs | 17,769 |
| 14,870 |
| 110,237 |
| 89,725 |
| — |
| 15,192 |
| 247,793 |
| — |
Exchange differences | 3,536 |
| 4,684 |
| — |
| — |
| — |
| 3,775 |
| 11,995 |
| — |
Assets held for sale | 40 |
| 937 |
| — |
| — |
| — |
| 404 |
| 1,381 |
| — |
On December 31, 2023 | (626,951) |
| (907,235) |
| (3,866,953) |
| (4,510,495) |
| (13,379) |
| (227,404) |
| (10,152,417) |
| (43,629) |
On December 31, 2022 | 1,613,355 |
| 1,193,561 |
| 4,637,017 |
| 6,653,877 |
| 4,301,708 |
| 548,918 |
| 18,948,436 |
| 46,044 |
On December 31, 2023 | 1,590,634 |
| 1,192,028 |
| 4,831,568 |
| 8,341,835 |
| 4,772,576 |
| 511,333 |
| 21,239,974 |
| 39,817 |
| (i) | As at December 31, 2023, assets, mainly wagons and locomotives in the amount of R$ 1,390,404 (R$745,203 as at December 31, 2022), were pledged to guarantee bank loans. |
| (ii) | Transfers of property, plant and equipment resulting from capitalization and other reclassifications of those assets. |
b) Capitalization of borrowing costs
In the year ended December 31, 2023, loan costs capitalized in the subsidiary Rumo were R$41,304 (R$86,614 as of December 31, 2022), using an average rate of 12.30% per year (13.25% per year as of 31 December 2022), while in the subsidiary Compass the capitalized costs were R$98,214 at a weighted average rate of 8.87% per year (R$62,365 and 6.27% per year in the year ended December 31, 2022).
Explanatory Notes to the Financial Statement
(In thousands of Reais, except when otherwise indicated)
Accounting policy: a) Goodwill Goodwill is initially recognized in accordance with the accounting policy for business combinations (see Note 9.2). Its value is determined by deducting accumulated impairment losses from its cost. Goodwill acquired in a business combination is assigned to the Company's CGUs or groups of CGUs that are anticipated to benefit from the synergies created by the business combination. b)Other intangible assets Other acquired intangible assets with a short useful life are measured at cost, less accumulated amortization and any accumulated impairment losses. c)Customer relationships Costs incurred in developing gas systems for new customers (including pipelines, valves, and other equipment) are considered intangible assets and amortized over the contract's term. The costs associated with the customer portfolio and right-of-use and operation contracts are considered as intangible assets and amortized over the contract's term. d)Concession rights Some subsidiaries of the Cosan group have public concession contracts for the gas distribution service in which the Granting Authority controls which services will be provided and the price, in addition to holding significant participation in the infrastructure at the end of the concession. These concession contracts represent the right to charge users for gas supply during the contract term. Thus, the subsidiaries recognize this right as an intangible. The assets acquired or constructed underlying the concession necessary for the distribution of gas, are amortized to correspond to the period in which the future economic benefits of the asset are expected to be reverted to the subsidiaries, or the final term of the concession, whatever happens first. This period reflects the economic life of each of the underlying assets that make up the concession. This economic service life is also used by regulatory bodies to determine the basis of measurement of the tariff for the provision of the services object of the concession. The amortization is recognized by the linear method and reflects the expected standard for the use of future economic benefits, which corresponds to the useful life of the assets that make up the infrastructure according to the provisions of the regulatory body. The amortization of assets is discontinued when the respective asset is used or downloaded in full and is no longer included in the basis of calculation of the tariff for the provision of concession services, whichever occurs first. e)Rumo’s concession rights Rumo's concession rights resulting from the business combination with Rumo Malha Norte were fully allocated to the Rumo Malha Norte concession and amortized in a straight-line basis. f)Port authorization and license The subsidiary TUP possesses a license that authorizes the installation of a private port terminal, with no expiration date as long as the property is used for this purpose. Given this entity's core activity, the Company allocated a significant portion of the purchase price to this authorization, which is classified as an intangible asset with an indefinite useful life. As mentioned in note 8, this investment was reclassified to assets available for sale. g)Contract of supply The indirect subsidiary Biometano Verde Paulínia has a signed contract for the purchase and sale of biogas produced in the landfill of Paulínia, where the purification plant is located. The term of the contract is 20 years and was calculated from the start date of the operation. h)Subsequent expenses Subsequent expenses are capitalized only if they increase the future economic benefits embodied in the particular asset to which they pertain. All other expenses are recorded in profit or loss as incurred. i)Amortization Except for goodwill and intangible assets with indefinite useful life, intangible assets are amortized using a straight-line method over their estimated useful lives, beginning on the date they are acquired or made available for use. At each reporting date, the depreciation methods, useful lives, and residual values are evaluated and adjusted as necessary. |
Explanatory Notes to the Financial Statement
(In thousands of Reais, except when otherwise indicated)
Consolidated |
| Parent Company | |||||||||||||||
| Goodwill |
| Concession right |
| Licenses |
| Brands and patents |
| Customer relationships |
| Other |
| Supply Agreement |
| Total |
| Total |
Cost |
|
|
|
|
|
|
|
|
|
|
|
|
|
|
|
|
|
On January 1, 2022 | 1,132,817 |
| 19,616,524 |
| 379,182 |
| 66,640 |
| 1,604,067 |
| 509,053 |
| — |
| 23,308,283 |
| 15,731 |
Additions | 10,031 |
| — |
| 2,605 |
| — |
| 113,497 |
| 16,622 |
| — |
| 142,755 |
| 835 |
Business combination | 402,055 |
| 2,508,558 |
| 436,594 |
| 98,382 |
| 1,062,832 |
| 388 |
| — |
| 4,508,809 |
| — |
Write-offs | — |
| (57,723) |
| — |
| — |
| (19) |
| 579 |
| — |
| (57,163) |
| — |
Transfers (i) | — |
| 837,788 |
| (1,911) |
| — |
| (6) |
| 61,295 |
| — |
| 897,166 |
| 340 |
Exchange differences | (21,909) |
| — |
| 771 |
| (1,099) |
| 47,613 |
| (2,110) |
| — |
| 23,266 |
| — |
Write-off by disposal of investment | (62,922) |
| (5,403) |
| (317,148) |
| — |
| — |
| (26,169) |
| — |
| (411,642) |
| — |
On December 31, 2022 | 1,460,072 |
| 22,899,744 |
| 500,093 |
| 163,923 |
| 2,827,984 |
| 559,658 |
| — |
| 28,411,474 |
| 16,906 |
Additions | 4,731 |
| — |
| — |
| — |
| 121,806 |
| 67,600 |
| — |
| 194,137 |
| 5,422 |
Write-offs | — |
| (62,272) |
| — |
| — |
| (64) |
| (2,075) |
| — |
| (64,411) |
| — |
Transfers (i) | — |
| 1,460,012 |
| 183,996 |
| — |
| (219,318) |
| 14,067 |
| — |
| 1,438,757 |
| 28 |
Exchange differences | (42,012) |
| — |
| (4,451) |
| (8,443) |
| (97,642) |
| 5,315 |
| — |
| (147,233) |
| — |
Assets held for sale | (30,817) |
| — |
| (436,594) |
| — |
| (1,819) |
| (17,060) |
| — |
| (486,290) |
| — |
Business Combination | — |
| — |
| — |
| — |
| — |
| 7,875 |
| 574,363 |
| 582,238 |
| — |
On December 31, 2023 | 1,391,974 |
| 24,297,484 |
| 243,044 |
| 155,480 |
| 2,630,947 |
| 635,380 |
| 574,363 |
| 29,928,672 |
| 22,356.00 |
|
|
|
|
|
|
|
|
|
|
|
|
|
|
|
|
|
|
Amortization |
|
|
|
|
|
|
|
|
|
|
|
|
|
|
|
|
|
On January 1, 2022 | — |
| (3,910,259) |
| (167,287) |
| (9,201) |
| (1,028,608) |
| (411,430) |
| — |
| (5,526,785) |
| (13,927) |
Additions | — |
| (773,765) |
| (8,879) |
| — |
| (164,843) |
| (35,667) |
| — |
| (983,154) |
| (732) |
Write-offs | — |
| 25,658 |
| — |
| — |
| 1 |
| (155) |
| — |
| 25,504 |
| — |
Transfers (i) | — |
| — |
| — |
| — |
| — |
| (60) |
| — |
| (60) |
| — |
Exchange differences | — |
| — |
| (771) |
| — |
| 22,956 |
| (2,838) |
| — |
| 19,347 |
| — |
Write-off by disposal of investment | — |
| 5,403 |
| 157,743 |
| — |
| — |
| 12,470 |
| — |
| 175,616 |
| — |
On December 31, 2022 | — |
| (4,652,963) |
| (19,194) |
| (9,201) |
| (1,170,494) |
| (437,680) |
| — |
| (6,289,532) |
| (14,659) |
Additions | — |
| (861,103) |
| (6,969) |
| — |
| (196,995) |
| (28,436) |
| — |
| (1,093,503) |
| (834) |
Write-offs | — |
| 37,148 |
| — |
| — |
| 2 |
| 71 |
| — |
| 37,221 |
| — |
Transfers (i) | — |
| — |
| (37,209) |
| — |
| 75,265 |
| 19,873 |
| — |
| 57,929 |
| — |
Exchange differences | — |
| — |
| 156 |
| — |
| 2,453 |
| 1,526 |
| — |
| 4,135 |
| — |
Assets held for sale | — |
| — |
| — |
| — |
| 1,213 |
| 4,152 |
| — |
| 5,365 |
| — |
On December 31, 2023 | — |
| (5,476,918) |
| (63,216) |
| (9,201) |
| (1,288,556) |
| (440,494) |
| — |
| (7,278,385) |
| (15,493) |
On December 31, 2022 | 1,460,072 |
| 18,246,781 |
| 480,899 |
| 154,722 |
| 1,657,490 |
| 121,978 |
| — |
| 22,121,942 |
| 2,247 |
On December 31, 2023 | 1,391,974 |
| 18,820,566 |
| 179,828 |
| 146,279 |
| 1,342,391 |
| 194,886 |
| 574,363 |
| 22,650,287 |
| 6,863 |
| (i) | The number of transfers also includes a portion of R$103,084 of intangible assets that was reclassified to financial assets (R$35,057, year ended December 31, 2022). |
Explanatory Notes to the Financial Statement
(In thousands of Reais, except when otherwise indicated)
a) Amortization methods and useful lives:
Intangible assets (except goodwill) |
| Annual amortization rate | 12/31/2023 |
| 12/31/2022 | |
Concession rights: |
|
|
|
|
| |
Compass (i) |
| From 3.54% to 4.58% | 12,307,964 |
| 11,614,163 | |
Rumo (ii) |
| 1.59% | 6,512,602 |
| 6,632,618 | |
|
|
| 18,820,566 |
| 18,246,781 | |
Licenses and authorizations |
|
|
|
|
| |
Operating license for port terminal |
| 3.70% | 47,610 |
| 44,305 | |
Moove |
| 5.00% | 132,218 |
| 139,905 | |
Licenses and authorizations (iii) |
| Indefinity | — |
| 436,594 | |
|
|
| 179,828 |
| 620,804 | |
Trademarks |
|
|
|
|
| |
Comma |
| Indefinity | 47,015 |
| 47,929 | |
Petrochoice (iii) |
| Indefinity | 96,826 |
| 104,354 | |
Tirreno (iii) |
| Indefinity | 2,438 |
| 2,439 | |
|
|
| 146,279 |
| 154,722 | |
Customers relationship |
|
|
|
|
| |
Compass |
| 20.00% | 280,111 |
| 285,423 | |
Moove (iii) |
| 5% to 30% | 1,062,280 |
| 1,227,588 | |
Other |
|
| — |
| 4,574 | |
|
|
| 1,342,391 |
| 1,517,585 | |
Contract of supply |
|
|
|
|
| |
Compass |
| 5.00% | 574,363 |
| — | |
|
|
| 574,363 |
| — | |
Others |
|
|
|
|
| |
Software license |
| 20.00% | 90,162 |
| 65,108 | |
Others |
| 20.00% | 104,724 |
| 56,870 | |
|
|
| 194,886 |
| 121,978 | |
Total |
|
| 21,258,314 |
| 20,661,870 |
| (i) | Intangible asset of the public gas distribution service concession, which represents the right to charge users for the supply of gas, comprising: (i) the concession rights recognized in the business combination and (ii) the assets of the concession. | |
| (ii) | Refers to Rumo's railway concession agreement. The amount will be amortized until the end of the concession in 2079. | |
| (iii) | Authorization for: (i) installation of port terminal activities; operation of the port facility by the subsidiary TUP Porto São Luís, (ii) lubrication and contamination control solutions, (iii) production and sale of lubricating oils, additives and fluids |
Explanatory Notes to the Financial Statement
(In thousands of Reais, except when otherwise indicated)
b) Goodwill paid for expected future profitability and intangibles with an indefinite useful life
Below we show the carrying amount of goodwill and intangible assets with indefinite useful lives allocated to each of the cash generating units:
|
| 12/31/2023 |
| 12/31/2022 | ||||||||
|
| Goodwill |
| Brands and patents |
| Licenses and authorizations |
| Goodwill |
| Brands and patents |
| Licenses and authorizations |
UGC Moove |
| 1,254,253 |
| 146,279 |
| — |
| 1,296,266 |
| 154,722 |
| — |
UGC Compass |
| 100,192 |
| — |
| — |
| 100,192 |
| — |
| — |
UGC Rumo |
| 37,529 |
| — |
| — |
| 37,529 |
| — |
| — |
UGC Cosan corporate |
| — |
| — |
| — |
| 26,085 |
| — |
| 436,594 |
|
| 1,391,974 |
| 146,279 |
| — |
| 1,460,072 |
| 154,722 |
| 436,594 |
In general, future cash flow projections for the Company assume growth rates of 3.5% (2.7% in 2022), which are neither higher nor greater than the long-term average growth rates for the sector and country.
To determine the present value of cash flows, a pre-tax discount rate is utilized. Before taxes and in nominal terms, discount rates ranged between 11.80% and 12.40% (between 10.10% and 24.80% in 2022).
The main assumptions for the first part of the financial model consider inflation and GDP by region where the CGU is located, plus the Cosan Group's strategies and market opportunities. For the remaining years of the model, the main assumptions relate to inflation and market expansion. The discount rate used is the weighted average cost of capital, or “WACC”, for which the main assumptions are risk-free rate (return rate of an investment without risk of loss), market risk premium (excess return earned by an investment in the stock market at a risk-free rate) and inflation. Most assumptions are obtained from external sources of information.
Future cash flows were constructed considering the following factors: (i) EBITDA for the cash-generating unit, adjusted for other relevant operating cash items and recurring capital expenditures; (ii) the Cosan Group discount rate (WACC) before taxes; and (iii) a growth rate calculated using the inflation index by region.
The annual impairment test utilized the following assumptions:
Premises |
| % Yearly |
Risk-free rate (T-Note 10y) |
| 3.51% |
Inflation (BR) |
| 3.76% |
Inflation (US) |
| 2.00% |
Inflation (UK) |
| 2.00% |
Country risk premium (BR) |
| 4.40% |
Country risk premium (UK) |
| 0.88% |
Country risk premium (ARG) |
| 17.55% |
Market risk premium |
| 4.60% |
Tax rate (BR) |
| 34.00% |
Tax rate (UK) |
| 19.00% |
Tax rate (ARG) |
| 30.00% |
Explanatory Notes to the Financial Statement
(In thousands of Reais, except when otherwise indicated)
Determining the recoverability of assets depends on certain key assumptions that are influenced by the market, technological, and economic conditions prevailing at the time this recovery is tested; therefore, it is not possible to predict whether there will be future losses due to a reduction in recoverability and, if so, whether they would be material.
During the year ended December 31, 2023, the Company did not identify any additional indicators of impairment, so no impairment test was required for tangible and intangible assets with defined useful lives. Consequently, no impairment expense was recorded for goodwill and assets with indefinite and definite useful lives as at December 31, 2023, and 2022
Accounting policy
Contract assets are measured based on their acquisition cost, which includes capitalized borrowing costs. The depreciable amounts in the concession contract are transferred to intangible assets when the assets are put into operation. The indirect affiliate Comgás reassesses the useful life, and whenever this assessment reveals that the amortization period will exceed the term of the concession agreement, a portion of the asset is converted into a financial asset because it represents a receivable from the granting authority. This classification follows IFRIC 12 - Concession Agreements. |
| Compass |
| Moove |
| Total |
On January 1, 2022 | 684,970 |
| 21,012 |
| 705,982 |
Additions | 1,217,818 |
| 10,823 |
| 1,228,641 |
Write-offs | — |
| (25,156) |
| (25,156) |
Business combination | 87,735 |
| — |
| 87,735 |
Transfers (i) | (880,188) |
| 1,701 |
| (878,487) |
On December 31, 2022 | 1,110,335 |
| 8,380 |
| 1,118,715 |
Additions | 1,494,142 |
| 33,952 |
| 1,528,094 |
Write-offs | — |
| (31,648) |
| (31,648) |
Transfers (i) | (1,563,056) |
| — |
| (1,563,056) |
On December 31, 2023 | 1,041,421 |
| 10,684 |
| 1,052,105 |
| (i) | The amount of transfers also includes a portion of the intangible asset that was reclassified to a financial asset. |
Explanatory Notes to the Financial Statement
(In thousands of Reais, except when otherwise indicated)
During the year ended December 31, 2023, through its subsidiaries, R$126,522 were added to internally generated intangible assets (R$109,265 in the year ended December 31, 2022), through the capitalization of labor.
a) Investment commitments
The indirect subsidiary Comgás assumed commitments in its concession contract for investments (expansion, improvements, and maintenance) to be carried out during the estimated concession period until 2049. In addition to investments in administrative support, the investment values for expansion projects and operational support exceed R$20,000,000, with an expected disbursement of approximately R$3,000,000.
Considering that the concession contract provides for incentive regulation, defining an efficient business plan at each five-year cycle in light of a capital return rate defined at the time to ensure that the concessionaire is able to obtain adequate remuneration for its investments, Comgás will propose a binding regulatory plan for each tariff revision, taking into account the reality at the time and the rate of return on capital defined by the regulator.
The other distributors operating in another state do not have investment commitments to be made during the concession period.
b) Capitalization of borrowing costs
During the year ended December 31, 2023, the indirect subsidiary Comgás capitalized R$82,441 at a weighted average rate of 12.70% per year (R$70,884 at 12.06% per year in the year ended December 31, 2022).
During the year ended December 31, 2023, the indirect subsidiary Sulgás capitalized R$973 at a weighted average rate of 5.81% per year (R$217 at 4.10% per year in the year ended December 31, 2022).
Accounting policy:
The right-of-use asset is initially measured at cost, which includes the initial measurement value of the lease liability, adjusted for any lease payments made up to the commencement date, any initial direct costs incurred by the lessee, and an estimate of the costs to be incurred by the lessee in dismantling and removing the underlying asset, restoring the site where it is located, or restoring the underlying asset to the condition required by the terms and conditions of the lease, less any lease incentives received.
The right-of-use asset is then depreciated on a straight-line basis from the date of commencement until the end of the lease term, unless the lease transfers ownership of the underlying asset to the lessee at the end of the lease term, or if the cost of the lease right-of-use asset reflects the likelihood that the lessee will exercise the purchase option. In this instance, the right-of-use asset will be depreciated over the useful life of the underlying asset, which is determined in the same manner as property, plant, and equipment. In addition, the right-of-use asset is periodically adjusted for certain remeasurements of the lease liability and impairment losses, if any.
The subsidiary Rumo evaluated its railway concessions within the scope of interpretation IFRIC 12 / CPC 01 Concession Contracts and, since it did not meet the terms of this interpretation, recorded its concession contracts as a right-of-use. |
Explanatory Notes to the Financial Statement
(In thousands of Reais, except when otherwise indicated)
| Consolidated |
| Parent company | ||||||||||||||
| Land, buildings and improvements |
| Machine, equipment, and installations |
| Wagons and locomotives |
| Software |
| Vehicles |
| Floating storage and regasification |
| Railway and port infrastructure |
| Total |
| Total |
Cost |
|
|
|
|
|
|
|
|
|
|
|
|
|
|
|
|
|
On January 1, 2022 | 254,883 |
| 142,449 |
| 938,610 |
| 87,028 |
| 29,099 |
| — |
| 7,800,313 |
| 9,252,382 |
| 49,529 |
Business combination | 116,919 |
| 2,693 |
| — |
| — |
| 43 |
| — |
| — |
| 119,655 |
| — |
Additions (i) | 91,799 |
| 73,317 |
| 1,006 |
| — |
| 4,561 |
| — |
| 111,457 |
| 282,140 |
| 541 |
Contractual readjustments | 9,008 |
| 52,972 |
| 3,480 |
| (1,079) |
| 1,540 |
| — |
| 155,734 |
| 221,655 |
| 3,092 |
Write-offs | (24,005) |
| (724) |
| — |
| — |
| (218) |
| — |
| (106,363) |
| (131,310) |
| (15,261) |
Exchange differences | 5,114 |
| (2,237) |
| — |
| — |
| (282) |
| — |
| — |
| 2,595 |
| — |
On December 31, 2022 | 453,718 |
| 268,470 |
| 943,096 |
| 85,949 |
| 34,743 |
| — |
| 7,961,141 |
| 9,747,117 |
| 37,901 |
Additions (i) | 81,911 |
| 233,155 |
| — |
| — |
| 25,541 |
| 1,533,969 |
| 45,271 |
| 1,919,847 |
| — |
Contractual readjustments | 17,917 |
| 3,426 |
| 332 |
| — |
| — |
| — |
| 96,257 |
| 117,932 |
| 4,754 |
Write-offs | (25,110) |
| (7,084) |
| — |
| — |
| — |
| — |
| (6,384) |
| (38,578) |
| — |
Transfers | — |
| 34,742 |
| — |
| — |
| — |
| — |
| — |
| 34,742 |
| — |
Exchange differences | (11,347) |
| (11,589) |
| — |
| — |
| (120) |
| — |
| — |
| (23,056) |
| — |
On December 31, 2023 | 517,089 |
| 521,120 |
| 943,428 |
| 85,949 |
| 60,164 |
| 1,533,969 |
| 8,096,285 |
| 11,758,004 |
| 42,655 |
Amortization | — |
| — |
| — |
| — |
| — |
| — |
| — |
| — |
| — |
On January 1, 2022 | (67,919) |
| (29,258) |
| (399,218) |
| (16,959) |
| (15,125) |
| — |
| (776,636) |
| (1,305,115) |
| (15,358) |
Additions | (65,254) |
| (81,349) |
| (34,990) |
| (4,015) |
| (7,713) |
| — |
| (267,094) |
| (460,415) |
| (5,146) |
Write-offs | 6,099 |
| 710 |
| — |
| — |
| 943 |
| — |
| 20,535 |
| 28,287 |
| 5,635 |
Exchange differences | 1,577 |
| 1,246 |
| — |
| — |
| 172 |
| — |
| — |
| 2,995 |
| — |
On December 31, 2022 | (125,497) |
| (108,651) |
| (434,208) |
| (20,974) |
| (21,723) |
| — |
| (1,023,195) |
| (1,734,248) |
| (14,869) |
Additions | (74,850) |
| (47,435) |
| (34,347) |
| (4,380) |
| (13,128) |
| (38,349) |
| (320,280) |
| (532,769) |
| (5,586) |
Write-offs | 10,166 |
| 1,151 |
| — |
| — |
| — |
| — |
| — |
| 11,317 |
| — |
Exchange differences | 2,913 |
| 8,187 |
| — |
| — |
| 114 |
| — |
| — |
| 11,214 |
| — |
On December 31, 2023 | (187,268) |
| (146,748) |
| (468,555) |
| (25,354) |
| (34,737) |
| (38,349) |
| (1,343,475) |
| (2,244,486) |
| (20,455) |
On December 31, 2022 | 328,221 |
| 159,819 |
| 508,888 |
| 64,975 |
| 13,020 |
| — |
| 6,937,946 |
| 8,012,869 |
| 23,032 |
On December 31, 2023 | 329,821 |
| 374,372 |
| 474,873 |
| 60,595 |
| 25,427 |
| 1,495,620 |
| 6,752,810 |
| 9,513,518 |
| 22,200 |
| (i) | The addition of the period is mainly composed of the contract related to the charter of the floating storage and regasification unit (“FRSU”) according to note 2. |
Explanatory Notes to the Financial Statement
(In thousands of Reais, except when otherwise indicated)
Accounting policy:
Investment properties are initially value at cost, including transaction costs. Upon initial recognition, investment properties are measured at fair value, which reflects market conditions at the date of the balance sheet, with changes recorded in the income statement. Revenue from the sale of agricultural properties is not recognized in income until I the sale is complete, (ii) the Company determines that payment by the buyer is probable, (iii) the revenue can be reliably measured, and (iv) the Company has transferred all risks associated with the property to the buyer and no longer has any involvement with the property. The gains from the sale of agricultural properties are reported as net income on the income statement, while the costs are reported as cost of properties sold.
The fair value of agricultural properties was determined using the direct comparative method of market data applied to transactions involving comparable properties (type, location, and quality of property) and, to a lesser extent, using sales quotes for potential transactions involving comparable assets (level 3). In accordance with the standards issued by the Brazilian Association of Technical Standards (Associação Brasileira de Normas Técnicas – “ABNT”), the methodology used to determine fair value takes into account direct comparisons of market information, such as market research, homogenization of values, spot market prices, sales, distances, facilities, access to land, topography and soil, use of land (type of crop), and rainfall, among other data. As at December 31, 2023, discount rates range between 11.12% per year and 11.20% per year (11.20% per year and 13.75% per year as at December 31, 2022).
The portfolio is evaluated annually by external specialists and periodically by internal professionals who are technically qualified to conduct this type of evaluation. |
| Investment properties |
On January 1, 2022 | 3,886,696 |
Change in the fair value of investment properties | 1,311,691 |
Business combination | 9,209,626 |
Additions | 17,477 |
Transfers (i) | (322,430) |
On December 31, 2022 | 14,103,060 |
Change in the fair value of investment properties | 2,259,924 |
Additions | 58,506 |
Transfers (i) | (444,782) |
Write off | (582) |
On December 31, 2023 | 15,976,126 |
| (i) | Transfers to the group of properties maintained for sale as explanatory note 8, resulting from the sales proposals of Fazendas Grão de Ouro e Dourados (Tellus Brasil Participações S.A.); Fazenda Santa Rita Cana (Duguetiapar Empreendimentos e Participações S.A.); Gleba Macaé (Radar II Propriedades Agrícolas S.A.). |
Explanatory Notes to the Financial Statement
(In thousands of Reais, except when otherwise indicated)
Considering the current gas supply contracts, the subsidiaries have financial commitment that totaled an estimated present value of R$44,057,687, the amount of which includes the minimum volume established in the contract, both in commodities and in transportation, with a term until December 2034.
The sub-concession agreements for which Rumo, through its subsidiaries, generally include commitments to execute investments with certain characteristics during the term of the agreement. We can highlight:
| (i) | The amendment to renew the Malha Paulista concession, which provides for the execution throughout the concession of a set of investment projects to increase capacity and reduce urban conflicts, estimated by the agency at R$6,100,000 (value updated until December 2017). Of this amount, around R$3,000,000 make up the bond book, the physical execution of which was 26.99% up to the balance sheet date. | |
| (ii) | The Malha Central sub concession contract provides for investments with a fixed term (from one to three years from the signing of the contract), estimated by ANTT at R$645,573. As of December 31, 2023, the physical execution of the projects in the book of obligations was 96.41%. |
Accounting policy: This account contains the balance of lease payments at issue in disputes with the granting authority. Upon transfer from the "lease liabilities" account, the initial registration is completed at the value of the installment at maturity. These values are then adjusted using the SELIC rate. In this account, balances are maintained in installments with the Granting Authority. The initial registration is for the balance owed following the resolution of the dispute. These values are then adjusted using the SELIC rate. Balances payable for granted concession rights ("Concessions and Grants"), initially recorded as a counterpart to intangible assets, are also recorded in this account (Note 11.2). The following measurement is performed at the effective rate. |
| 12/31/2023 |
| 12/31/2022 |
Disputed lease and concession: |
|
|
|
Rumo Malha Oeste S.A. | 2,206,945 |
| 1,957,149 |
| 2,206,945 |
| 1,957,149 |
|
|
|
|
Lease installment payments: |
|
|
|
Rumo Malha Paulista S.A. | 1,067,256 |
| 1,138,076 |
| 1,067,256 |
| 1,138,076 |
|
|
|
|
Concessions and grants: |
|
|
|
Rumo Malha Sul S.A. | 76,191 |
| 81,112 |
Rumo Malha Paulista S.A. | 190,282 |
| 156,497 |
Rumo Malha Central S.A. | 24,699 |
| 18,576 |
| 291,172 |
| 256,185 |
|
|
|
|
Total | 3,565,373 |
| 3,351,410 |
|
|
|
|
Current | 250,971 |
| 256,759 |
Non-current | 3,314,402 |
| 3,094,651 |
| 3,565,373 |
| 3,351,410 |
Explanatory Notes to the Financial Statement
(In thousands of Reais, except when otherwise indicated)
a) Disputed lease and concession:
On July 21, 2020, Rumo filed with the National Land Transport Agency (Agência Nacional de Transportes Terrestres – “ANTT”) a request to participate in a third-party re-bidding process for the Concession Agreement entered into between Malha Oeste and the Federal Government, through the Ministry of Transport ("Rebidding Process"), in accordance with Law No. 13,448 of June 5, 2017, and Decree No. 9,957 of August 8, 2019. An amendment to the concession agreement was signed, and as a result, the economic and financial rebalancing action filed by Rumo Malha Oeste against the Union, which had a decision of origin from the lower court and was awaiting a ruling from the Federal Regional Court, was suspended by joint decision of the parties.
The total amount of judicial deposits related to the cases is R$26,064 (R$24,125 as at December 31, 2022).
b) Leases and grants within the scope of CPC 06 R2/IFRS 16
| 12/31/2023 |
| 12/31/2022 |
Leases: |
|
|
|
Rumo Malha Sul S.A. | 452,701 |
| 542,996 |
Rumo Malha Paulista S.A. | 422,173 |
| 539,900 |
Rumo Malha Oeste S.A. | 131,038 |
| 185,324 |
Portofer Transporte Ferroviário Ltda. | — |
| 11,658 |
| 1,005,912 |
| 1,279,878 |
|
|
|
|
Grants: |
|
|
|
Rumo Malha Paulista S.A. (renewal) | 919,011 |
| 732,727 |
Rumo Malha Central S.A. | 940,456 |
| 792,374 |
| 1,859,467 |
| 1,525,101 |
|
|
|
|
Total | 2,865,379 |
| 2,804,979 |
|
|
|
|
Current | 358,464 |
| 350,719 |
Non-current | 2,506,915 |
| 2,454,260 |
| 2,865,379 |
| 2,804,979 |
Explanatory Notes to the Financial Statement
(In thousands of Reais, except when otherwise indicated)
Accounting policy: The Company incurs various taxes and contributions, including municipal, state, and federal taxes, taxes on bank deposits and withdrawals, turnover taxes, regulatory fees, and income tax, among others. Additionally, it is subject to other taxes on its activities that do not generally represent an expense. |
| Parent Company |
| Consolidated | ||||
| 12/31/2023 |
| 12/31/2022 |
| 12/31/2023 |
| 12/31/2022 |
Tax debts installments | 211,226 |
| 202,140 |
| 217,348 |
| 208,760 |
ICMS | — |
| 43 |
| 190,474 |
| 271,688 |
COFINS | 96,905 |
| 48,982 |
| 177,720 |
| 246,501 |
PIS | 12,951 |
| 2,579 |
| 27,073 |
| 43,524 |
Social Security charges | 62,249 |
| 29,416 |
| 87,214 |
| 42,186 |
IRRF | — |
| — |
| 14,133 |
| 14,553 |
Other | 2,082 |
| 6,676 |
| 122,998 |
| 86,517 |
|
|
|
|
|
|
|
|
| 385,413 |
| 289,836 |
| 836,960 |
| 913,729 |
|
|
|
|
|
|
|
|
Current | 226,556 |
| 141,216 |
| 673,718 |
| 760,041 |
Non-current | 158,857 |
| 148,620 |
| 163,242 |
| 153,688 |
Total | 385,413 |
| 289,836 |
| 836,960 |
| 913,729 |
The amounts due in non-current liabilities have the following maturity schedule:
| Parent Company |
| Consolidated | ||||
| 12/31/2023 |
| 12/31/2022 |
| 12/31/2023 |
| 12/31/2022 |
From 13 to 24 months | — |
| 1,599 |
| 881 |
| 2,255 |
From 25 to 36 months | — |
| — |
| 572 |
| 656 |
From 37 to 48 months | — |
| — |
| 572 |
| 656 |
From 49 to 60 months | — |
| — |
| 572 |
| 656 |
Over 60 months | 158,857 |
| 147,021 |
| 160,645 |
| 149,465 |
| 158,857 |
| 148,620 |
| 163,242 |
| 153,688 |
Explanatory Notes to the Financial Statement
(In thousands of Reais, except when otherwise indicated)
Accounting policy The total rate of income tax and social contribution is 34%. Current tax and deferred tax are recognized in profit or loss, with the exception of certain transactions which are directly recognized in shareholder’s equity or other comprehensive income. a)Current tax It is the expected tax payable or receivable on taxable profit or loss for the year, using tax rates enacted or substantively enacted as of the date of the balance sheet, as well as any adjustments to tax payable in respect of prior years. b)Deferred tax Deferred tax is recognized as temporary differences between the carrying amounts of assets and liabilities for financial reporting purposes and the amounts used for taxation and tax loss. The measurement of deferred tax reflects how the Company expects, at the end of the reporting period, to realize or settle the carrying value of its assets and liabilities. Deferred tax is measured at the rates anticipated to be applied to temporary differences upon their reversal, using rates enacted or substantively enacted as of the date of the balance sheet. If there is a legally enforceable right to offset current tax assets and liabilities, and if they relate to taxes imposed by the same tax authority on the same taxable entity, deferred tax assets and liabilities are offset. c)Tax exposure In calculating the amount of current and deferred tax, the Company considers the impact of uncertain tax positions and the possibility of additional taxes and interest being owed. This evaluation is based on estimates and hypotheses and may involve a series of future event judgments. New information may become available, causing the Company to change its opinion regarding the sufficiency of existing tax liabilities; such changes in tax obligations will have an impact on tax expenses in the period in which the determination is made. d)Recoverability of deferred income tax and social contribution When evaluating the recoverability of deferred taxes, Management takes future taxable income projections and changes in temporary differences into account. The recoverability of the deferred tax asset in the parent company depends on taxable income projections. When it is unlikely that a portion or all the tax liability will be realized, the tax asset is reversed. No deadline exists for the utilization of tax losses and negative bases, but the utilization of these accumulated losses from prior years is limited to 30% of annual taxable income. The Company and its subsidiaries adhere to both the letter and spirit of the tax laws and regulations of the countries in which they conduct business, being committed to good tax practices. They are also committed to the practice of transfer pricing that respects the principles of full competition and the rules defined by the tax legislation of the jurisdictions in which they operate, with transparency of operations, business ethics, and no use of practices that result in an artificial reduction in taxation. |
Explanatory Notes to the Financial Statement
(In thousands of Reais, except when otherwise indicated)
a) Reconciliation of income tax and social contribution expenses:
|
| Parent Company |
| Consolidated | ||||
|
| 12/31/2023 |
| 12/31/2022 (Restated) |
| 12/31/2023 |
| 12/31/2022 (Restated) |
Income before income tax and social contribution |
| 430,447 |
| 70,649 |
| 5,113,751 |
| 2,652,625 |
Income tax and social contribution at nominal rate (34%) |
| (146,352) |
| (24,021) |
| (1,738,675) |
| (901,893) |
Adjustments for calculating the effective rate |
|
|
|
|
|
|
|
|
Equity income |
| 825,704 |
| 1,226,979 |
| 672,947 |
| 122,238 |
Result of companies abroad |
| (44,101) |
| (28,539) |
| (62,870) |
| (16,973) |
Operating profit |
| — |
| — |
| 279,941 |
| 197,307 |
Share-based payment transactions |
| — |
| (73) |
| — |
| (73) |
Interest on equity capital |
| (22,709) |
| (66,544) |
| (191,763) |
| (26,058) |
Goodwill amortization effect |
| — |
| — |
| 1,271 |
| — |
Permanent differences |
| — |
| — |
| (16,787) |
| (13,788) |
Unrecognized tax losses and temporary differences |
| — |
| — |
| (308,358) |
| (228,579) |
ICMS benefit - extemporaneous |
| — |
| — |
| 5,506 |
| 345,067 |
ICMS benefit - current year |
| — |
| — |
| 68,409 |
| 242,694 |
Dividend income (i) |
| — |
| — |
| 254,260 |
| — |
Provision for non-realization of the benefit of the Federative covenant (ii) |
| — |
| — |
| (307,099) |
| — |
Provision for non-realization of the benefit of the Federative covenant - Interest and Fine (iii) |
| — |
| — |
| 100,731 |
| — |
Selic on indebtedness |
| 16,203 |
| 11,206 |
| 147,741 |
| 22,103 |
Rate differential (iv) |
| — |
| — |
| 805,725 |
| 446,293 |
Benefit Membership Program Zero Litigation (iii) |
| 19,710 |
| — |
| 23,276 |
| — |
Other |
| (165) |
| (30,805) |
| (8,681) |
| (69,934) |
Income tax and social contribution (current and deferred) |
| 648,290 |
| 1,088,203 |
| (274,426) |
| 118,404 |
|
|
|
|
|
|
|
|
|
Effective rate - % |
| 150.61% |
| 1540.29% |
| (5.37%) |
| 4.46% |
Explanatory Notes to the Financial Statement
(In thousands of Reais, except when otherwise indicated)
| (i) | Refers to dividends received from Vale S.A. | |
| (ii) | From the 1st quarter of 2021, the subsidiaries Comgás and Moove began to calculate and use current and extemporaneous credits resulting from the non-taxation of the benefit of the ICMS calculation base reduction. The subsidiary Comgás uses the base reduction of ICMS calculation in the State of São Paulo, pursuant to art. 8th of Annex II of the ICMS Regulation, approved by State Decree nº 45.490/2000, as amended by State Decrees nº 62.399/2016 and 67.383/2022. Natural gas outlets within the State of São Paulo are subject to ICMS at the effective rate of 15% instead of the general rate of 18%. The subsidiary Moove, makes use of deferrals of ICMS provided by art. 44, Book IV of RICMS/ RJ1 and art. 1st of Decree 44.637/2014, in the internal acquisition and import of basic oil, input for the production of lubricating oil. These credits were recognized by the Company in 2021 based on its better understanding of the subject, embodied by the opinion of its external legal advisors, which took into account all the jurisprudence then applicable to the subject. On April 26, 2023, the Supreme Court ruled that tax benefits as a base reduction of ICMS calculation can only be excluded from the IRPJ/CSLL if the requirements of Complementary Law 160/2017 are met (art. 30 of Law 12.973/2014), that is, with the constitution of reserve. Based on this decision, the Company’s directors, observing the technical interpretation that governs the treatment of uncertainties regarding taxes on profit (ICPC22 and IFRIC 23), decided to establish a provision on March 31, 2023, in the historical amount of R$1,370,304 (R$1,074,989 of principal registered in the current income tax line, R$138,526 of interest and R$156,790 of fine recorded in the financial result line). The updated amount used by the Company for extemporaneous and current credit totals R$1,681,795 (R$1,122,358 principal, R$281,565 fine and R$277,871 interest) which also includes the assessments received for the year 2018 and the other credits used in the following years until March 31, 2023, plus the respective legal charges. On December 29, 2023, Law 14,789/2023 was published, which granted a discount of 80% for payment of all debts, charges and not charged by the RFB on this subject. With the regulation of the portion referring to the debits not charged, through IN 2.184/2024, the Company will follow the administrative procedures for the effective settlement of this portion and awaits the regulation of the portion referring to the debits charged, to complete the discharge of liabilities. Because of the discount granted, there was a chargeback of liabilities in the amount of R$1,345,435 and the balance of the Company’s updated liabilities in the year ended December 31, 2023, is R$336,359 (R$224,472 principal, R$56,312 fine and R$55,574 interest). | |
| (iii) | Adherence to the Tax Litigation Reduction Program, (Joint Ordinance PGFN/RFB No. 01/2023), as defined in art. 11 § 12 of Law 13,988/2020, which establishes the requirements and conditions for dispute resolution transactions with the Public Treasury. | |
| (iv) | Difference in rate between the nominal rate of 34% and the effective rate applicable to entities that calculate the tax under the presumed profit regime. |
Explanatory Notes to the Financial Statement
(In thousands of Reais, except when otherwise indicated)
b)Deferred income tax assets and liabilities
Below are presented the tax effects of temporary differences that give rise to significant parts of the company's deferred tax assets and liabilities:
| Parent Company |
| Consolidated | |||||
|
| 12/31/2023 |
| 12/31/2022 |
| 12/31/2023 |
| 12/31/2022 |
Deferred tax assets from: |
|
|
|
|
|
|
|
|
Income tax losses |
| 945,685 |
| 697,179 |
| 2,714,996 |
| 2,244,654 |
Social contribution tax losses |
| 340,981 |
| 251,519 |
| 929,055 |
| 809,556 |
Temporary differences |
|
|
|
|
|
|
|
|
Foreign exchange variation - Loans and borrowings |
| 1,165,734 |
| 1,299,577 |
| 1,292,954 |
| 1,701,529 |
Provision for lawsuits |
| 95,780 |
| 78,190 |
| 218,881 |
| 204,303 |
Impairment provision (Rumo Malha Oeste) |
| — |
| — |
| 27,072 |
| 34,469 |
Post-employment benefit obligation |
| — |
| — |
| 150,336 |
| 152,373 |
Provisions for expected credit losses |
| — |
| — |
| 34,511 |
| 31,880 |
Provision for unrealized taxes |
| 6,985 |
| 6,985 |
| 73,641 |
| 70,815 |
Share-based payment transactions |
| 64,065 |
| 26,846 |
| 157,825 |
| 82,480 |
Lease |
| 2,497 |
| 2,493 |
| 161,840 |
| 167,962 |
Unrealized loss with derivatives |
| 165,978 |
| — |
| 823,286 |
| 674,554 |
Provisions for profit sharing |
| 36,020 |
| 18,322 |
| 159,994 |
| 124,833 |
Business Combination - Intangible assets |
| — |
| — |
| 124,379 |
| 119,060 |
Business combination – Property, plant and equipment |
| — |
| — |
| 24,795 |
| 36,535 |
Selic on indebtedness |
| — |
| 77,645 |
| — |
| 100,264 |
Other provisions |
| — |
| 196,671 |
| 691,162 |
| 581,059 |
Deferred tax on pre-operating income |
| — |
| — |
| 87,454 |
| 14,009 |
Regulatory asset (liability) |
| — |
| — |
| 6,661 |
| 4,843 |
Other |
| 208,331 |
| 1,607 |
| 391,444 |
| 488,299 |
Total |
| 3,032,056 |
| 2,657,034 |
| 8,070,286 |
| 7,643,477 |
|
|
|
|
|
|
|
|
|
Deferred tax liabilities from: |
|
|
|
|
|
|
|
|
Temporary differences |
|
|
|
|
|
|
|
|
Exchange rate variation - Loans and borrowings |
| — |
| — |
| (195,232) |
| — |
Provision for lawsuits |
| — |
| — |
| (408) |
| — |
Useful life review |
| — |
| — |
| (456,093) |
| (401,926) |
Business combination – Property, plant and equipment |
| — |
| — |
| (148,872) |
| (76,263) |
Tax goodwill amortized |
| — |
| — |
| (618,758) |
| (359,100) |
Unrealized income with derivatives |
| — |
| (249,206) |
| (299,965) |
| (226,243) |
Fair value adjustment on debt |
| — |
| — |
| (281,784) |
| (548,726) |
Marketable securities |
| — |
| — |
| (77,437) |
| (1,150,916) |
Investment properties |
| — |
| — |
| (455,773) |
| (391,382) |
Goods intended for sale |
| — |
| — |
| (10,546) |
| — |
Capitalized interest |
| — |
| — |
| — |
| (108,616) |
Effects on the formation of joint ventures |
| (103,992) |
| (106,254) |
| (103,992) |
| (106,254) |
Business Combination – Intangible assets |
| — |
| — |
| (4,426,881) |
| (4,486,211) |
Post-employment obligations |
| — |
| — |
| (4,641) |
| (4,594) |
Lease |
| — |
| 495 |
| (10,034) |
| (11,797) |
Provisions |
| — |
| 815 |
| (449,153) |
| (79,092) |
Other (i) |
| (449,153) |
| (445,264) |
| (147,120) |
| (687,601) |
Total |
| (553,145) |
| (799,414) |
| (7,686,689) |
| (8,638,721) |
Total deferred taxes recorded |
| 2,478,911 |
| 1,857,620 |
| 383,597 |
| (995,244) |
Deferred tax assets (ii) |
| 2,478,911 |
| 1,857,620 |
| 5,609,030 |
| 4,474,124 |
Deferred tax liabilities |
| — |
| — |
| (5,225,433) |
| (5,469,368) |
Total deferred, net |
| 2,478,911 |
| 1,857,620 |
| 383,597 |
| (995,244) |
Explanatory Notes to the Financial Statement
(In thousands of Reais, except when otherwise indicated)
| (i) | Refers mainly to the tax loss recognized on the capital contribution in a controlled company. | |
| (ii) | Total amount of the balance of deferred income tax and social contribution consolidated assets, R$1,869,877 corresponds to the balance of the subsidiary Rumo S.A. |
The Company determined the period for offsetting its deferred tax assets on tax losses, social contribution negative basis and temporary differences based on the projection of its taxable income and long-term strategic planning, with the following realization expected as at December 31, 2023:
| Parent company |
| Consolidated |
Within 1 year | 98,926 |
| 808,979 |
1 to 2 years | 1,006,146 |
| 1,308,994 |
2 to 3 years | 81,466 |
| 384,929 |
3 to 4 years | 567,216 |
| 823,923 |
4 to 5 years | 65,210 |
| 328,555 |
5 to 8 years | 312,183 |
| 950,882 |
8 to 10 years | 347,764 |
| 1,002,768 |
| 2,478,911 |
| 5,609,030 |
Deferred income tax and social contribution inactivated
As of December 31, 2023, the balance of inactivated income tax and social contribution is R$2,678,299 and refers mainly to tax losses and temporary differences of the subsidiary Rumo S.A, of the indirect subsidiaries Rumo Malha Sul and Rumo Malha Oeste, which under current conditions do not meet the requirements for the accounting of said deferred income tax and social contribution asset due to the lack of predictability of future generation of tax profits.
Explanatory Notes to the Financial Statement
(In thousands of Reais, except when otherwise indicated)
c)Changes in deferred tax assets and liabilities:
ASSETS
| Parent Company | |||||||||||||
| Income and Social contribution tax losses |
| Employee benefits |
| Unrealized loss with derivatives |
| Provisions |
| Leases |
| Other |
| Total |
On January 1, 2022 | 721,109 |
| 34,986 |
| — |
| 268,874 |
| 1,998 |
| 1,559,777 |
| 2,586,744 |
Credited / charged from income for the year | 227,589 |
| 10,182 |
| — |
| 12,972 |
| 495 |
| 9,876 |
| 261,114 |
Recognized in equity | — |
| — |
| — |
| — |
| — |
| (8,269) |
| (8,269) |
Foreign exchange differences | — |
| — |
| — |
| — |
| — |
| (182,555) |
| (182,555) |
On December 31, 2022 | 948,698 |
| 45,168 |
| — |
| 281,846 |
| 2,493 |
| 1,378,829 |
| 2,657,034 |
Credited / charged from income for the year | 337,968 |
| 54,917 |
| 165,978 |
| (179,081) |
| 4 |
| 129,079 |
| 508,865 |
Foreign exchange differences | — |
| — |
| — |
| — |
| — |
| (133,843) |
| (133,843) |
On December 31, 2023 | 1,286,666 |
| 100,085 |
| 165,978 |
| 102,765 |
| 2,497 |
| 1,374,065 |
| 3,032,056 |
LIABILITIES
Parent Company | |||||||
| Effects on the formation of joint venture |
| Unrealized income with derivatives |
| Other |
| Total |
On January 1, 2023 | (602,673) |
| (748,873) |
| (457,512) |
| (1,809,058) |
Credited / charged from income for the year | 496,419 |
| 499,667 |
| 13,558 |
| 1,009,644 |
On December 31, 2022 | (106,254) |
| (249,206) |
| (443,954) |
| (799,414) |
Credited / charged from income for the year | 2,262 |
| 249,206 |
| (8,762) |
| 242,706 |
Other comprehensive income (loss) | — |
| — |
| 3,563 |
| 3,563 |
On December 31, 2023 | (103,992) |
| — |
| (449,153) |
| (553,145) |
|
|
|
|
|
|
|
|
Total deferred taxes recognized |
|
|
|
|
| 2,478,911 | |
Explanatory Notes to the Financial Statement
(In thousands of Reais, except when otherwise indicated)
Assets:
| Consolidated | ||||||||||||||||
| Income and Social contribution tax losses |
| Post-employment obligations |
| Employee benefits |
| Provisions |
| Leases |
| Unrealized gains on derivatives |
| Intangible assets |
| Other |
| Total |
On January 1, 2022 | 2,367,707 |
| 160,082 |
| 148,338 |
| 688,972 |
| 189,890 |
| — |
| 111,590 |
| 2,024,834 |
| 5,691,413 |
Credited / charged from income for the year | 686,503 |
| (7,709) |
| 58,975 |
| 233,554 |
| (21,928) |
| 674,554 |
| 7,470 |
| 299,687 |
| 1,931,106 |
Recognized in equity | — |
| — |
| — |
| — |
| — |
| — |
| — |
| (13,071) |
| (13,071) |
Foreign exchange differences | — |
| — |
| — |
| — |
| — |
| — |
| — |
| 34,029 |
| 34,029 |
On December 31, 2022 | 3,054,210 |
| 152,373 |
| 207,313 |
| 922,526 |
| 167,962 |
| 674,554 |
| 119,060 |
| 2,345,479 |
| 7,643,477 |
Credited / charged from income for the year | 589,841 |
| (2,037) |
| 110,506 |
| 122,741 |
| (6,122) |
| 148,732 |
| 5,319 |
| (133,596) |
| 835,384 |
Foreign exchange differences | — |
| — |
| — |
| — |
| — |
| — |
| — |
| (408,575) |
| (408,575) |
On December 31, 2023 | 3,644,051 |
| 150,336 |
| 317,819 |
| 1,045,267 |
| 161,840 |
| 823,286 |
| 124,379 |
| 1,803,308 |
| 8,070,286 |
Liabilities:
| Consolidated | ||||||||||||||||||
| Effects on the formation of joint ventures |
| Post-employment obligations |
| Intangible assets |
| Unrealized gains on derivatives |
| Property, plant and equipment |
| Fair value adjustment |
| Leases |
| Provisions |
| Other |
| Total |
On January 1, 2022 | (602,673) |
| — |
| (3,492,345) |
| (1,028,058) |
| (350,110) |
| (126,174) |
| (3,219) |
| (11,427) |
| (843,835) |
| (6,457,841) |
Credited / charged from income for the year | 496,419 |
| (4,594) |
| 369,455 |
| 807,391 |
| (51,816) |
| (355,946) |
| (8,578) |
| (67,665) |
| (1,784,407) |
| (599,741) |
Other comprehensive income | — |
| — |
| — |
| (5,576) |
| — |
| — |
| — |
| — |
| (1,469) |
| (7,045) |
Business combination | — |
| — |
| (1,363,321) |
| — |
| — |
| (66,606) |
| — |
| — |
| (144,167) |
| (1,574,094) |
On December 31, 2022 | (106,254) |
| (4,594) |
| (4,486,211) |
| (226,243) |
| (401,926) |
| (548,726) |
| (11,797) |
| (79,092) |
| (2,773,878) |
| (8,638,721) |
Credited / charged from income for the year | 2,262 |
| (47) |
| 59,330 |
| (73,722) |
| (54,167) |
| 200,336 |
| 1,763 |
| (370,469) |
| 1,178,542 |
| 943,828 |
Other comprehensive income | — |
| — |
| — |
| — |
| — |
| — |
| — |
| — |
| (58,402) |
| (58,402) |
Liabilities available for sale | — |
| — |
| — |
| — |
| — |
| 66,606 |
| — |
| — |
| — |
| 66,606 |
On December 31, 2023 | (103,992) |
| (4,641) |
| (4,426,881) |
| (299,965) |
| (456,093) |
| (281,784) |
| (10,034) |
| (449,561) |
| (1,653,738) |
| (7,686,689) |
|
|
|
|
|
|
|
|
|
|
|
|
|
|
|
|
|
|
|
|
Total deferred taxes recognized |
|
|
|
|
|
|
|
|
|
|
|
|
|
|
|
|
| 383,597 | |
Explanatory Notes to the Financial Statement
(In thousands of Reais, except when otherwise indicated)
Accounting policy: They are recognized as other expenses when the Company has a present or constructive obligation as a result of previous events, it is expected that an outflow of resources will be required to settle the obligation, and the amount can be estimated with reasonable certainty. The chance of loss evaluation is comprised of existing facts, the hierarchy of laws, case law, the most recent court decisions, the legal system's relevance, and the opinion of outside counsel. Provisions are examined and altered for conditions, such as the expiration of the statute of limitations, the conclusion of tax audits, or the identification of additional exposures based on new matters or judicial decisions. Provisions for lawsuits stemming from business combinations are valued at fair market value. |
As of December 31, 2023, and December 31, 2022, the Corporation had contingent liabilities and judicial deposits pertaining to:
|
| ||||||
| Provision for lawsuits | ||||||
| Parent Company |
| Consolidated | ||||
| 12/31/2023 |
| 12/31/2022 |
| 12/31/2023 |
| 12/31/2022 |
Tax | 272,063 |
| 227,481 |
| 813,732 |
| 747,647 |
Civil, environmental and regulatory | 73,744 |
| 53,835 |
| 512,979 |
| 662,052 |
Labor | 55,286 |
| 68,041 |
| 387,692 |
| 391,487 |
| 401,093 |
| 349,357 |
| 1,714,403 |
| 1,801,186 |
| Judicial deposit | ||||||
| Parent Company |
| Consolidated | ||||
| 12/31/2023 |
| 12/31/2022 |
| 12/31/2023 |
| 12/31/2022 |
Tax | 373,779 |
| 327,354 |
| 652,236 |
| 585,988 |
Civil, environmental and regulatory | 16,126 |
| 15,644 |
| 114,724 |
| 92,411 |
Labor | 13,584 |
| 17,565 |
| 128,941 |
| 136,045 |
| 403,489 |
| 360,563 |
| 895,901 |
| 814,444 |
Explanatory Notes to the Financial Statement
(In thousands of Reais, except when otherwise indicated)
Changes in provisions for lawsuits:
| Parent Company | ||||||
| Tax |
| Civil, environmental, and regulatory |
| Labor |
| Total |
On January 1, 2022 | 164,652 |
| 123,420 |
| 73,787 |
| 361,859 |
Provisioned in the year | 42,295 |
| 20,386 |
| 4,332 |
| 67,013 |
Write-offs by reversal / payment | (31,243) |
| (86,308) |
| (15,821) |
| (133,372) |
Interest (i) | 51,777 |
| (3,663) |
| 5,743 |
| 53,857 |
On December 31,2022 | 227,481 |
| 53,835 |
| 68,041 |
| 349,357 |
Provisioned in the year | 17,579 |
| 29,080 |
| 2,899 |
| 49,558 |
Write-offs by reversal / payment | (3,180) |
| (20,768) |
| (15,469) |
| (39,417) |
Interest (i) | 30,183 |
| 11,597 |
| (185) |
| 41,595 |
On December 31,2023 | 272,063 |
| 73,744 |
| 55,286 |
| 401,093 |
|
|
|
|
|
|
|
|
| Consolidated | ||||||
| Tax |
| Civil, environmental, and regulatory |
| Labor |
| Total |
On January 1, 2022 | 647,610 |
| 585,034 |
| 411,417 |
| 1,644,061 |
Provisioned in the year | 71,063 |
| 159,758 |
| 153,789 |
| 384,610 |
Write-offs by reversal / payment | (56,447) |
| (238,912) |
| (225,044) |
| (520,403) |
Conversion effect | 3,994 |
| 15,786 |
| 52 |
| 19,832 |
Interest (i) | 81,427 |
| 140,386 |
| 51,273 |
| 273,086 |
On December 31,2022 | 747,647 |
| 662,052 |
| 391,487 |
| 1,801,186 |
Provisioned in the year | 44,812 |
| 105,526 |
| 113,151 |
| 263,489 |
Write-offs by reversal / payment | (33,427) |
| (258,021) |
| (168,160) |
| (459,608) |
Transfer | — |
| 3,793 |
| 607 |
| 4,400 |
Interest (i) | 54,700 |
| (371) |
| 50,607 |
| 104,936 |
On December 31,2023 | 813,732 |
| 512,979 |
| 387,692 |
| 1,714,403 |
| (i) | Includes write-off of interest due to reversal. |
The Company has debts secured by assets or by means of cash deposits, bank guarantees or guarantee insurance.
The Company has probable indemnity lawsuits in addition to those mentioned, and as they represent contingent assets, they were not reported.
Explanatory Notes to the Financial Statement
(In thousands of Reais, except when otherwise indicated)
a) Probable losses
Tax: The main tax proceedings for which the risk of loss is probable are described below:
|
|
|
|
|
|
|
|
| Parent Company |
| Consolidated | ||||
| 12/31/2023 |
| 12/31/2022 |
| 12/31/2023 |
| 12/31/2022 |
Compensation with FINSOCIAL (i) | — |
| — |
| 326,220 |
| 312,721 |
INSS (ii) | 77,254 |
| 72,389 |
| 100,149 |
| 98,657 |
ICMS credit (iii) | 99,864 |
| 63,093 |
| 174,860 |
| 125,723 |
PIS and COFINS | 32,832 |
| 27,954 |
| 33,244 |
| 30,446 |
IPI | 56,638 |
| 54,430 |
| 63,358 |
| 60,852 |
IRPJ and CSLL | 1,102 |
| 1,065 |
| 10,698 |
| 11,676 |
Other | 4,373 |
| 8,550 |
| 105,203 |
| 107,572 |
| 272,063 |
| 227,481 |
| 813,732 |
| 747,647 |
| (i) | Offset of FINSOCIAL with federal taxes, based on a September 2003 final and non-appealable court ruling in the case records where the constitutionality of FINSOCIAL was discussed. Compensation of taxes remains a topic of administrative discussion. | |
| (ii) | Amount provisioned as INSS, the majority of which is comprised of amounts related to social security contributions levied on billing in accordance with article 22-A of Law 8.212/91, the constitutionality of which is being litigated. The amounts are deposited with the court. The leading case – RE 611.601 (topic 281) was judged unfavorably by the Federal Supreme Court, recognizing the constitutionality of art. 22-A of Law No. 8,212/91. | |
| (iii) | ICMS required by the State of São Paulo resulting from disallowances of credits for diesel oil used in the agro-industrial production process. The Motions on Execution were dismissed as unfounded, as were the appeals that followed; and infraction notices relating to ICMS credits arising from materials used in the production process classified as “use and consumption”, which would not generate the right to credit |
- Labor claims: The Company and its subsidiaries are parties to labor claims filed by former employees and outsourced service providers claiming among other things, compensation and indemnities. Additionally, the Company has public civil actions filed by the Labor Prosecutor's Office regarding alleged non-compliance with labor standards, working conditions and working environment. For claims deemed to have merit, the Company has signed Conduct Adjustment Agreements with the Brazilian authorities.
- Civil, environmental and regulatory lawsuits: The Company and its subsidiaries are involved in a number of Indemnity Lawsuits, Public Civil Actions, and Administrative Proceedings where, in the opinion of its legal counsel, the risk of loss is probable.
Explanatory Notes to the Financial Statement
(In thousands of Reais, except when otherwise indicated)
b) Possible losses
The main lawsuits for which we anticipate a risk of loss as possible are outlined below:
| Parent Company |
| Consolidated | ||||
| 12/31/2023 |
| 12/31/2022 |
| 12/31/2023 |
| 12/31/2022 |
Tax | 4,934,309 |
| 5,034,867 |
| 15,703,294 |
| 16,079,589 |
Civil, environmental and regulatory | 1,045,171 |
| 1,015,125 |
| 7,166,011 |
| 6,597,105 |
Labor | 9,168 |
| 23,972 |
| 805,222 |
| 782,080 |
| 5,988,648 |
| 6,073,964 |
| 23,674,527 |
| 23,458,774 |
Tax:
| Parent Company |
| Consolidated | ||||
| 12/31/2023 |
| 12/31/2022 |
| 12/31/2023 |
| 12/31/2022 |
Isolated fine - Federal tax (i) | — |
| — |
| 792,496 |
| 762,613 |
IRPJ/CSLL (ii) | 1,280,245 |
| 1,296,481 |
| 6,316,155 |
| 6,297,550 |
ICMS -Tax on circulation of goods (iii) | 1,205,621 |
| 1,264,685 |
| 2,962,716 |
| 2,987,853 |
IRRF (iv) | — |
| 1,389 |
| 1,226,223 |
| 1,366,268 |
PIS and COFINS (v) | 1,286,634 |
| 1,322,277 |
| 2,293,933 |
| 2,556,050 |
MP 470 installment of debts (vi) | 232,104 |
| 246,000 |
| 381,060 |
| 388,166 |
Stock Grant Plan | — |
| — |
| 60,863 |
| 68,846 |
IOF on loans (vii) | — |
| — |
| 154,606 |
| 149,323 |
Reward Credit Compensation (viii) | 143,322 |
| 138,753 |
| 143,322 |
| 138,753 |
IPI - Tax on industrialized products (ix) | 233,464 |
| 227,184 |
| 374,471 |
| 374,274 |
INSS | 79,019 |
| 90,049 |
| 159,007 |
| 161,037 |
Other | 473,900 |
| 448,049 |
| 838,442 |
| 828,856 |
| 4,934,309 |
| 5,034,867 |
| 15,703,294 |
| 16,079,589 |
| (i) | Among the demands related to the isolated fine, there is a fine resulting from disregard of REPORTO's tax benefits with the consequent application of the isolated fine corresponding to 50% of the value of the goods acquired. | |
| (ii) | Infraction notices and lawsuits have been issued by the Special Department of Federal Revenue of Brazil regarding (a) disallowance of amortization of goodwill expenses based on future profitability resulting from corporate operations; (b) capital gains on the sale of an equity interest; (c) labor provisions; and (d) still, there are infraction notices issued by the Federal Revenue Service in 2011, 2013 and 2019. | |
| (iii) | The ICMS demands are substantially related to (a) the disallowance of ICMS credits related to the acquisition of diesel oil; goods supposedly classified as use and consumption and suppliers who had their state registration revoked (declared unsuitable), among others; (b) proof of delivery of goods sold with FOB clause; (c) ICMS on transport services for export; (d) divergence in the application of legislation governing operations with tax substitution; and (e) acquisition of wagons as a result of the alleged non-exemption provided for by the Tax Regime for Incentives for the Modernization and Expansion of the Port Structure. | |
| (iv) | Collection of IRRF on (a) alleged capital gain from the acquisition of foreign companies and (b) disallowance of IRRF compensation on swap transactions. |
Explanatory Notes to the Financial Statement
(In thousands of Reais, except when otherwise indicated)
| (v) | Disallowances of PIS and COFINS credits calculated in the non-cumulative system as a result of divergence in the definition of inputs. | |
| (vi) | Applications for the payment in installment of federal tax debts are partially denied by the Special Department of Federal Revenue of Brazil due to insufficient tax losses to settle the respective debts. | |
| (vii) | IOF charges related primarily to (a) current accounts maintained by the Company's subsidiaries and (b) financial transactions between group companies. | |
| (viii) | Offset statements via the PERD/COMP electronic system that reference "premium credit" are considered as not declared by the Special Department of Federal Revenue of Brazil. | |
| (ix) | Claim for credit disallowance regarding IPI credits related to the acquisition of raw materials used in the manufacturing of immune products. |
Except for the effect noted in Note 15.a, item (ii), we have not identified any other effects of IFRIC 23 / ICPC 22 - Uncertainty over Income Tax Treatments that could significantly affect the accounting policies of the Company and its subsidiaries and these annual financial statements.
Civil, environmental and regulatory:
| Parent Company |
| Consolidated | ||||
| 12/31/2023 |
| 12/31/2022 |
| 12/31/2023 |
| 12/31/2022 |
Civil | 983,867 |
| 972,966 |
| 3,184,240 |
| 3,336,284 |
Environmental | 60,549 |
| 42,159 |
| 2,330,683 |
| 1,764,671 |
Regulatory | 755 |
| — |
| 1,651,088 |
| 1,496,150 |
| 1,045,171 |
| 1,015,125 |
| 7,166,011 |
| 6,597,105 |
Several civil, environmental, and regulatory judicial and administrative proceedings involving the Company and its subsidiaries present a potential for loss. The majority of civil litigation consists of contractual and extracontractual claims for damages. In the environmental realm, the processes involve commitment terms, civil investigations, and public civil actions. Regarding cases involving substantial sums, the following are the most pertinent:
Explanatory Notes to the Financial Statement
(In thousands of Reais, except when otherwise indicated)
Civil:
| (i) | The Company is litigating an action for the collection of legal fees filed by Alexandre Saddy Chade and others, where they request that the Company and other defendants be ordered to pay alleged legal fees that would be owed to the plaintiffs and that would amount to amounts close to R$366,110. The case awaits judgment on the Plaintiffs' Appeal and the Company's Adhesive Appeal, which seeks to increase the sentence in succumbing amounts. | |
| (ii) | The subsidiary Moove is a party to a lawsuit filed by Petroleum Comércio e Representações Ltda., seeking to order the company to pay material damages, loss of profits and a fine, alleging breach of contract. This process involves a total value of R$160,508. The judgment on the merits in the first instance is awaited. | |
| (iii) | The indirect subsidiary Rumo Malha Sul is a party to the execution of a conduct adjustment agreement signed with the Federal Public Ministry, in which the latter alleges that Rumo would not be transporting cargo in the Presidente Prudente region and, as a result of this, requested the execution of a daily fine, as well as an increase in the value of the fine. Rumo, in turn, filed a declaratory action to give the correct interpretation to the TAC, since its commitment was to try to obtain cargo in sufficient volume to carry out transportation. Periodically, the Company holds seminars in the region, but so far it has not been able to attract anyone interested in providing services. The demands are in the first instance, awaiting a court decision. There was a request to suspend the demand to attempt an agreement and, in parallel, Malha Sul, União and ANTT signed an agreement with a view to be adapting the criteria used to determine the value for return of the section. The total contingency of the case is R$130,239, with 50% of the amounts provisioned and the remainder classified as possible. | |
| (iv) | In November 2021, CADE, in the judgment of the administrative proceeding initiated based on the representation of a former client, among other points, condemned the subsidiary Rumo to pay a fine in the updated amount of R$339,811, a decision that was maintained in the judgment of the declaration embargoes. The establishment of such a value contradicts CADE's own precedents, whether in relation to the calculation basis or in relation to the rate used, which is why the Company filed an action to annul such decision, which is currently under appeal. Based on the technical analysis of its external legal team, Rumo assesses the risk of losing a portion in the amount of R$31,262 (for which it recorded a provision) as probable and classifies the difference as a possible contingency. | |
| (v) | The indirect subsidiary Rumo Malha Paulista is a defendant, together with the Municipality of Jales and others, in a public civil action, in which the MPF alleges a lack of level crossing structure throughout the municipalities of the Jales subsection, as well as indiscriminate use of horn. The estimated risk is R$137,210. |
Environmental:
| (vi) | On December 31, 2023, the subsidiary Moove was a defendant in a Public Civil Action (ACP) seeking payment of compensation for environmental pollution in the company Usina de Passivos area. Various PCAs were filed against different companies. In February 2024, there was a change in one of the PCAs, in which the amount attributed by the Public Prosecutor's Office was R$ 365,319 and the action was extinguished and filed. In another ACP, the company's liability was delimited and the amount, which was R$ 441,142, was increased to R$ 2,062. | |
| (vii) | The indirect subsidiary Rumo Malha Paulista was fined, in 2013, by IBAMA (Brazilian Institute of the Environment and Natural Resources) for alleged damage to water resources. There was a defense presentation. In September 2021, the Company requested recognition of intercurrent prescription. Analysis of the merits of the matter is awaited. The amount involved is R$221,256. | |
| (viii) | The indirect subsidiary Rumo Malha Sul was fined, in 2014, by IBAMA for alleged oil spills that did not comply with regulations. An administrative appeal was filed and a decision has been awaited at the administrative level since 2015. The amount involved is R$106,120. |
Regulatory:
| (ix) | The indirect subsidiary Rumo Malha Sul was fined, in 2014, by IBAMA for alleged oil spills that did not comply with regulations. An administrative appeal was presented and a decision has been awaited at the administrative level since 2015. The amount involved is R$176,867. | |
| (x) | The indirect subsidiary Malha Paulista is a party to a compensation action, filed by the former Rede Ferroviária Federal S/A (RFFSA), succeeded by the Union, due to the deactivation of the railway's electric traction system, the value of which claims totals R$356,284, for the which there is no provision. In February 2023, a judgment of unfoundedness was handed down. Awaiting judgment on the Union's appeal. |
Explanatory Notes to the Financial Statement
(In thousands of Reais, except when otherwise indicated)
Labor:
| Parent Company |
| Consolidated | ||||
| 12/31/2023 |
| 12/31/2022 |
| 12/31/2023 |
| 12/31/2022 |
Labor claims | 9,168 |
| 23,972 |
| 805,222 |
| 782,080 |
| 9,168 |
| 23,972 |
| 805,222 |
| 782,080 |
The indirect subsidiary Rumo Malha Paulista is currently party to a Public Civil Action that is being processed before the Labor Court. This process originated from an inspection carried out against the company MS Teixeira, which was subcontracted by Prumo Engenharia Ltda. (“Prumo Engenharia”) which, in turn, was hired by Rumo. The inspection alleged that MS Teixeira workers worked in degrading conditions like slavery. Prumo Engenharia assumed full responsibility for the condition of these employees, including labor and contractual responsibilities, as well as all losses arising from the alleged working conditions established by its subcontractors. Prumo Engenharia terminated the employment contracts of these workers, which were approved by the then Ministry of Labor and Employment, highlighting that there was no participation by Rumo in these acts. Furthermore, a criminal investigation was launched against Rumo, which was archived. Notwithstanding the above, the Public Ministry of Labor still filed a public civil action (ACP) against Malha Paulista, without the inclusion of Prumo in the dispute, requesting the payment of compensation for collective moral damages in the amount of R$100,000 (among other commitments), judged partially valid, condemning the subsidiary to obligations to do and not to do, as well as collective moral damages of R$15,000. Rumo entered into an agreement with the Public Ministry of Labor, in which it assumed the fulfillment of various obligations linked to working conditions, as well as paying compensation in the amount of R$20,000, allocated to various social entities. The agreement was judicially approved by the Superior Labor Court. After approval, the Attorney General's Office filed an appeal questioning, solely and solely, the allocation of the compensation, since, in the view of the Attorney General's Office, the compensation should be allocated to the FAT. The Union's appeal was not known. Final and unappealable approval of the agreement on 11/08/23. Process sent to origin.
a) Share capital
Accounting policy: Equity is reduced by the incremental costs directly attributable to the issuance of common shares. In accordance with the policy outlined in Note 15 - Income tax and social contribution, transaction costs related to income tax are accounted for in accordance with Note 15 - Income tax and social contribution. Transactions involving group shareholders are allocated within Equity Transactions, such as share-based payments and changes in interests in subsidiaries. |
The subscribed capital as at December 31, 2023, is R$8,682,544 (R$8,402,544 as at December 31, 2022), fully paid in, represented by 1,874,070,932 registered, book-entry common shares with no par value. According to the statute, the authorized share capital can be increased up to the limit of R$9,000,000.
On April 27, 2023, the Extraordinary General Meeting approved the increase in the Company's share capital, in the amount of R$280,000, distribution of dividends of R$628,979, allocations of the legal reserve of R$58,802 and statutory reserve in the amount of R$488,252.
As of December 31, 2023, the Company's share capital consists of the following:
|
| Ordinary actions | ||
Shareholding structure |
| Amount |
| % |
Controlling shareholders |
| 672,312,942 |
| 35.87% |
Administrators |
| 25,745,154 |
| 1.37% |
Free float |
| 1,169,498,325 |
| 62.41% |
Outstanding shares |
| 1,867,556,421 |
| 99.65% |
Treasury stock |
| 6,514,511 |
| 0.35% |
Total |
| 1,874,070,932 |
| 100.00% |
Explanatory Notes to the Financial Statement
(In thousands of Reais, except when otherwise indicated)
b) Treasury shares
Accounting policy Treasury shares consists of shares that have been repurchased by the company for specific and limited purposes. Cosan holds the necessary number of shares for future employee share-based payment plans, and the volume is treated similarly to treasury shares for accounting purposes. |
On August 14, 2023, the Company's Board of Directors approved the new Share Buyback Program of up to 116,000,000 common shares, representing 9.93% of the total shares available on the market, with a term of up to 18 months. The repurchased shares may be used to meet obligations arising from potential exercises of share-based compensation plans, holding in treasury, disposal or cancellations in accordance with applicable legislation.
As at December 31, 2023, the Company had 6,514,511 shares in treasury (7,432,832 shares as at December 31, 2022), whose market price was R$19.36.
c) Statutory reserve - special reserve
Accounting policy: Its purpose is to strengthen working capital and finance the maintenance, expansion, and development of the company's core activities. |
d) Legal reserve
Accounting policy: In accordance with Law 6,404, it is created by appropriating 5% of net income for the year up to a maximum of 20% of capital. |
e) Dividends
Accounting policy: In accordance with corporate law, a mandatory minimum dividend equal to 25% of the company's annual net profit is allocated, adjusted for changes in the reserves. The next Ordinary General Meeting will discuss dividends, allocation of net income for the year, and excess of profit reserves, as determined by article 199 of the Corporate Law. |
Explanatory Notes to the Financial Statement
(In thousands of Reais, except when otherwise indicated)
- Receivable
Parent Company |
| Investments in associates (i) |
| Investments in joint venture |
| Total |
On January 1, 2022 |
| 22,747 |
| 517,344 |
| 540,091 |
Declared Dividends |
| 2,340,514 |
| 549,883 |
| 2,890,397 |
Proposed interest on equity capital |
| 95,846 |
| 107,544 |
| 203,390 |
Dividends received |
| (1,849,651) |
| (1,174,771) |
| (3,024,422) |
On December 31, 2022 |
| 609,456 |
| — |
| 609,456 |
Declared Dividends |
| 348,493 |
| 571,033 |
| 919,526 |
Other movements |
| (3,567) |
| — |
| (3,567) |
Dividends received |
| (855,188) |
| (351,092) |
| (1,206,280) |
On December 31, 2023 |
| 99,194 |
| 219,941 |
| 319,135 |
(i) See composition of the balance in note 9.1.a.
Consolidated |
| Investments in associates (ii) |
| Investments in joint venture |
| Total |
On January 1, 2022 |
| 2,621 |
| 517,344 |
| 519,965 |
Declared Dividends |
| 278,654 |
| 549,883 |
| 828,537 |
Interest on own capital |
| — |
| 107,544 |
| 107,544 |
Other movements |
| 202,968 |
| — |
| 202,968 |
Discontinued operation |
| (44,969) |
| — |
| (44,969) |
Dividends received |
| (278,127) |
| (1,174,771) |
| (1,452,898) |
On December 31, 2022 |
| 161,147 |
| — |
| 161,147 |
Declared Dividends |
| 273,346 |
| 626,653 |
| 899,999 |
Proposed interest on own capital |
| — |
| 588,078 |
| 588,078 |
Income tax |
| — |
| (88,256) |
| (88,256) |
Discontinued operation |
| (62,699) |
| — |
| (62,699) |
Other movements |
| (81,053) |
| — |
| (81,053) |
Dividends received |
| (254,905) |
| (906,534) |
| (1,161,439) |
On December 31, 2023 |
| 35,836 |
| 219,941 |
| 255,777 |
(ii) See composition of the balance in note 9.1.b
Explanatory Notes to the Financial Statement
(In thousands of Reais, except when otherwise indicated)
ii. Payable
|
| Parent Company |
|
|
| 12/31/2023 |
|
Net income for the year |
| 1,094,391 |
|
Calculation basis for dividend distribution |
| 1,094,391 |
|
Minimum mandatory dividends - 25% |
| (273,598) |
|
Statutory Reserve |
| 820,793 |
|
Movement of dividends payable
|
| Parent Company |
| Consolidated |
On January 1, 2022 |
| 754,282 |
| 799,634 |
Dividends for the year |
| 279,308 |
| 2,000,543 |
Dividends complementary to the previous year |
| 45,736 |
| — |
Dividends paid |
| (799,347) |
| (1,908,171) |
On December 31, 2022 |
| 279,979 |
| 892,006 |
Declared dividends (i) |
| 794,289 |
| 2,239,495 |
Dividends paid |
| (798,203) |
| (2,582,447) |
On December 31, 2023 |
| 276,065 |
| 549,054 |
| (i) | The value of the dividend per share in the year ended December 31, 2023, was R$ 1.27 real. (R$ 0.66 cents as at December 31, 2022). |
Explanatory Notes to the Financial Statement
(In thousands of Reais, except when otherwise indicated)
f) Other comprehensive income
|
| 12/31/2022 |
| Comprehensive (loss) income |
| 12/31/2023 |
Cash flow hedge result |
| (1,361,895) |
| (125,233) |
| (1,487,128) |
Exchange rate differences on conversion of operations abroad |
| 2,010,914 |
| (172,501) |
| 1,838,413 |
Actuarial losses of defined benefit plan |
| (219,663) |
| (71,550) |
| (291,213) |
Deferred tax on actuarial losses of defined benefit plan |
| 74,685 |
| 24,327 |
| 99,012 |
Loss on measurement of derivative financial instrument |
| (45,631) |
| — |
| (45,631) |
Change in the fair value of a financial asset |
| 77,152 |
| — |
| 77,152 |
Deferred income tax on financial asset |
| (26,232) |
| — |
| (26,232) |
Total |
| 509,330 |
| (344,957) |
| 164,373 |
|
|
|
|
|
|
|
Attributable to: |
|
|
|
|
|
|
Controlling shareholders |
| 567,546 |
| (253,221) |
| 314,325 |
Non-controlling shareholders |
| (58,216) |
| (91,736) |
| (149,952) |
|
| 12/31/2021 |
| Comprehensive (loss) income |
| 12/31/2022 |
Cash flow hedge result |
| (1,362,618) |
| 723 |
| (1,361,895) |
Exchange rate differences on conversion of operations abroad |
| 1,093,366 |
| 917,548 |
| 2,010,914 |
Actuarial losses of defined benefit plan |
| (299,993) |
| 80,330 |
| (219,663) |
Deferred tax on actuarial losses of defined benefit plan |
| 101,997 |
| (27,312) |
| 74,685 |
Loss on measurement of derivative financial instrument |
| (45,631) |
| — |
| (45,631) |
Change in the fair value of a financial asset |
| 43,220 |
| 33,932 |
| 77,152 |
Deferred income tax on financial asset |
| (14,695) |
| (11,537) |
| (26,232) |
Total |
| (484,354) |
| 993,684 |
| 509,330 |
|
|
|
|
|
|
|
Attributable to: |
|
|
|
|
|
|
Owners of the Company |
| (521,609) |
| 1,089,155 |
| 567,546 |
Non-controlling interests |
| 37,255 |
| (95,471) |
| (58,216) |
Explanatory Notes to the Financial Statement
(In thousands of Reais, except when otherwise indicated)
Accounting policy: a)Basic earnings per share Basic earnings per share is calculated by dividing:
b)Diluted earnings per share Diluted earnings per share adjusts the values used in determining basic earnings per share to account for:
|
Basic earnings per share is calculated by dividing net income by the weighted average number of common shares outstanding during the period. Earnings per share after potentially dilutive instruments is computed by adjusting earnings and the number of shares for the impact of potentially dilutive instruments.
The following table presents the calculation of earnings per share (in thousands of reais, except for amounts per share):
Basic and diluted - Continued operation |
|
|
|
| 12/31/2023 |
| 12/31/2022 |
Net income attributable to holders of common shares of Company used in calculating basic earnings per share | 1,078,737 |
| 1,158,852 |
Diluting effect of the share-based plan of subsidiaries | (814) |
| (1,739) |
Net income attributable to holders of common shares of Company used in the calculation of diluted earnings per share | 1,077,923 |
| 1,157,113 |
|
|
|
|
Weighted average number of common shares outstanding - basic (in thousands of shares) |
|
|
|
Basic | 1,867,005 |
| 1,869,077 |
Dilutive effect of the share-based plan | 7,341 |
| 5,503 |
Diluted | 1,874,346 |
| 1,874,580 |
|
|
|
|
Earnings per share |
|
|
|
Basic | R$0.5778 |
| R$0.6200 |
Diluted | R$0.5751 |
| R$0.6173 |
Explanatory Notes to the Financial Statement
(In thousands of Reais, except when otherwise indicated)
Basic and diluted - Discontinued operation |
|
|
|
| 12/31/2023 |
| 12/31/2022 |
Net income attributable to holders of common shares of Company used in calculating basic earnings per share | 15,654 |
| 17,180 |
|
|
|
|
Weighted average number of common shares outstanding - basic (in thousands of shares) |
|
|
|
Basic | 1,867,005 |
| 1,869,077 |
Dilutive effect of the share-based plan | 7,341 |
| 5,503 |
Diluted | 1,874,346 |
| 1,874,580 |
|
|
|
|
Earnings per share |
|
|
|
Basic | R$0.0084 |
| R$0.0092 |
Diluted | R$0.0084 |
| R$0.0092 |
Diluting instruments
The Company and its subsidiaries have two categories of possible dilutive effects: stock grants and put options. For stock grants, a calculation is performed to determine the impact of dilution on the profit attributable to the Parent Company's shareholders as a result of the exercise of stock grants in subsidiaries. It is assumed that the put option was converted into common stock, and the profit attributable to the Parent Company's shareholders is adjusted accordingly.
Anti-dilution instruments
In the year ended December 31, 2023, 12,269,677 (61,540,876 as at December 31, 2022) shares related to the Company's stock option plan were considered in the earnings per share analysis, but did not affect calculations, as they increase earnings per share.
Explanatory Notes to the Financial Statement
(In thousands of Reais, except when otherwise indicated)
Accounting policy: The Company presents gross revenue from sales and services, sales deductions, rebates and taxes, as required for Brazilian companies in accordance with law no. 6,404/76, section V, Art. 187. The main sources of revenue are:
The Company records sales revenue upon customer delivery. Delivery is regarded as occurring when the customer accepts the goods and ownership risks and benefits are transferred. This is the point at which revenue is recognized if revenue and costs can be reliably measured, receipt of consideration is probable, and there is no ongoing management involvement with the products. The subsidiary Moove is responsible for the production and distribution of lubricants, including Mobil and Comma brands. Products are sold under identified contracts with individual or multiple customers, as a bundle of goods or services. Some lubricant sales contracts are not available for purchase outside of a service package. However, contracts clearly distinguish between goods and services. This type of sale represents two separate performance obligations; consequently, revenue will be recognized for each performance obligation upon transfer of control of the respective goods and services to the customer. On the basis of the standalone sale price, the transaction price is allocated to various performance obligations in which revenues are separately identified, measured, and recorded. Trade incentives, such as cash incentives, volume discounts and rebates, and free or discounted goods and services, are recorded as a revenue reduction. ii. Billed revenue Through distributors controlled directly and indirectly by Compass Gás e Energia, the Company provides natural gas distribution services in areas where it has concession rights. In general, the fair value and selling price of individual services are comparable. Gas distribution revenue is recognized when its amount can be reliably measured, with income recognized in the same period that volumes are delivered to customers on the basis of monthly measurements. iii. Unbilled revenue Unbilled gas revenue refers to the amount of gas delivered that has not yet been metered and billed to customers. This estimate is based on the period between the last measurement date and the last day of the month. Actual volume billed may vary from estimates. The Company believes, based on past experience with similar operations, that the estimated amount of unbilled services will not differ significantly from the actual amount. iv. Concession construction revenue The construction of the necessary infrastructure for gas distribution is regarded as a construction service provided to the Granting Authority, and revenue is recognized over time using the incurred cost method. The costs are deducted from income when they are incurred. Advances received are accounted for as contractual liabilities. v. Provided services As services are performed, revenue is recorded over time. The stage of completion for determining the amount of revenue to be recognized is determined based on work-in-progress evaluations. If the performance of services under a single contract spans multiple time periods, consideration is allocated based on their individual selling prices. Individual sales prices are based on the list prices at which the Cosan Group sells its services in separate transactions. |
Explanatory Notes to the Financial Statement
(In thousands of Reais, except when otherwise indicated)
vi. Energy trading Through the delivery of electricity in a given period, the Company recognizes revenue from the sale of electricity at the fair value of the consideration. The measurement of the amount of energy delivered to the purchaser occurs monthly. As soon as they consume electricity, customers gain control over it. Monthly invoices are typically paid within 30 days of issuance. Energy trading revenue is recorded based on bilateral contracts signed with market agents and duly registered with the Electric Energy Trading Chamber (Câmara de Comercialização de Energia Elétrica – “CCEE”). Revenue is recognized based on the energy sold and the prices specified in the terms of the supply and supply agreements. The subsidiary Compass Comercialização will be able to sell the generated energy in two environments: (i) in the Free Contracting Environment (Ambiente de Contratação Livre – ACL), where the commercialization of electric energy takes place through the free negotiation of prices and conditions between the parties, via bilateral contracts; and (ii) in the Regulated Contracting Environment (Ambiente de Contratação Regulada – ACR), where electricity is sold to distribution agents.
When transactions on the short-term market occur, the Company records revenue at the fair value of the consideration to be received. The energy cost for these operations is tied to the Differences Settlement Price (Preço de Liquidação de Diferenças – PLD). b. Energy trading operations Energy trading transactions occur on an active market and, for accounting measurement purposes, satisfy the definition of fair-value financial instruments. The Company records revenue at the fair value of the consideration upon delivery of energy to the customer. In addition, unrealized net gains resulting from mark-to-market, which is the difference between contracted and market prices, are recognized as income for outstanding contracted net operations as of the date of the financial statements. vii. Logistics services provided Income from services rendered is recognized when the subsidiary transfers to the counterparty the significant risks and benefits inherent in the provision of services, when it is probable that the economic benefits associated with the transaction will flow to the subsidiary, and when the related amount and costs can be reliably measured. According to service orders or contracts, prices for services are fixed. Revenue consists primarily of rail freight, road freight, container transport, and port lifting services; consequently, the aforementioned criteria are typically met to the extent that the logistics service is offered. viii. Lease income Rental income is recognized on a straight-line basis over the term of each contract since the contracts transfer to customers the right to use the assets for a period in exchange for payments that can be reliably measured. ix. Sale of investment properties Income consists of the fair value of the consideration received or receivable for the sale of investment properties in the ordinary course of the subsidiaries' operations. The revenues are presented net of taxes, returns, rebates, and discounts, and in the consolidated financial statements, sales within the subsidiary are eliminated. Revenue is recorded when the subsidiary satisfies all obligations and promises outlined in the contract for the transfer of goods to the customer. |
Explanatory Notes to the Financial Statement
(In thousands of Reais, except when otherwise indicated)
| Consolidated | ||
| 12/31/2023 |
| 12/31/2022 (Restated) |
Gross revenue from the sale of products and services | 45,298,287 |
| 45,977,407 |
Construction revenue | 1,494,142 |
| 1,217,818 |
Indirect taxes and other deductions | (7,323,932) |
| (7,872,439) |
Net sales | 39,468,497 |
| 39,322,786 |
In the following table, revenue is disaggregated by products and service lines and timing of revenue recognition:
| Consolidated | ||
| 12/31/2023 (Restated) |
| 12/31/2022 (Restated) |
At a point in time |
|
|
|
Natural gas distribution | 15,737,450 |
| 17,854,412 |
Lubricants, base oil and other | 9,285,675 |
| 8,646,753 |
Lease and sale of property | 743,411 |
| 834,616 |
Electricity trading | — |
| 238,544 |
Other | 538,445 |
| 418,847 |
| 26,304,981 |
| 27,993,172 |
Over time |
|
|
|
Railroad transportation services | 10,379,017 |
| 9,503,965 |
Construction revenue | 1,494,141 |
| 1,217,818 |
Container operations | 558,699 |
| 337,543 |
Other services | 792,951 |
| 333,324 |
| 13,224,808 |
| 11,392,650 |
Eliminations | (61,292) |
| (63,036) |
Total net sales | 39,468,497 |
| 39,322,786 |
Explanatory Notes to the Financial Statement
(In thousands of Reais, except when otherwise indicated)
Accounting policy:
The Company and its subsidiaries account for natural gas distribution concession contracts using the intangible asset model in accordance with ICPC 01/IFRIC 12 and CPC 04/IAS 38 and classify the amortization of the concession contract as cost of sales. |
The costs and expenses are presented in the statement of profit and loss by function. The reconciliation of costs and expenses by nature/purpose is as follows:
| Parent Company |
| Consolidated | ||||
| 12/31/2023 |
| 12/31/2022 |
| 12/31/2023 |
| 12/31/2022 |
Raw material and material for use in the provision of services | — |
| — |
| (7,291,453) |
| (6,588,465) |
Gas and transportation cost | — |
| — |
| (11,919,415) |
| (13,892,505) |
Electricity purchased for resale | — |
| — |
| — |
| (260,891) |
Railroad transport and port elevation expenses | — |
| — |
| (2,696,333) |
| (3,074,624) |
Other transport | — |
| — |
| (523,747) |
| (137,255) |
Depreciation and amortization | (14,401) |
| (13,936) |
| (3,364,943) |
| (3,014,480) |
Personnel expenses | (317,936) |
| (180,929) |
| (2,893,919) |
| (2,498,912) |
Construction cost | — |
| — |
| (1,494,141) |
| (1,217,818) |
Expenses with third-party services | (46,816) |
| (28,260) |
| (952,294) |
| (888,195) |
Business expenses | (29) |
| — |
| (37,451) |
| (23,505) |
Cost of properties sold (Note 10.5) | — |
| — |
| (153,470) |
| (550,432) |
Other expenses | (58,208) |
| (77,137) |
| (1,101,274) |
| (1,444,083) |
| (437,390) |
| (300,262) |
| (32,428,440) |
| (33,591,165) |
|
|
|
|
|
|
|
|
Cost of goods sold and services rendered | — |
| — |
| (28,549,896) |
| (30,556,819) |
Selling expenses | — |
| — |
| (1,350,570) |
| (1,276,279) |
General and administrative expenses | (437,390) |
| (300,262) |
| (2,527,974) |
| (1,758,067) |
| (437,390) |
| (300,262) |
| (32,428,440) |
| (33,591,165) |
| Parent Company |
| Consolidated | ||||
| 12/31/2023 |
| 12/31/2022 |
| 12/31/2023 |
| 12/31/2022 |
Gain from bargain purchase | — |
| 99,341 |
| — |
| 99,341 |
Result on the sale of investments | — |
| 54,707 |
| — |
| 988,077 |
Extemporaneous tax credits | — |
| — |
| 43,835 |
| 114,812 |
Change in fair value of investment properties – Note 11.5 | — |
| — |
| 2,259,924 |
| 1,311,691 |
Loss on disposals of non-current assets and intangible assets (i) | 13,563 |
| (2,323) |
| (17,016) |
| (13,035) |
Net effect of provisions for legal proceedings and tax installments | (86,619) |
| (41,463) |
| (204,158) |
| (370,765) |
Settlement of disputes in the renewal process and grant review | — |
| — |
| — |
| (90,022) |
Result in the termination of the legal agreement | — |
| — |
| — |
| (396,818) |
Dividends received from Vale S.A – Note 1.1 (f) | — |
| — |
| 1,339,340 |
| — |
Realization of deferred revenue – Note 2 | — |
| — |
| 923,214 |
| — |
Other income | 66,850 |
| — |
| 160,604 |
| — |
Other | (63,050) |
| 27,135 |
| (581,366) |
| 108,941 |
| (69,256) |
| 137,397 |
| 3,924,377 |
| 1,752,222 |
(i) | Includes the gain relating to the sale of SINLOG TECNOLOGIA EM LOGÍSTICA S.A in the amount of R$14,884, see note 2.1. |
Explanatory Notes to the Financial Statement
(In thousands of Reais, except when otherwise indicated)
Accounting policy:
Financial income consists of interest income on invested funds, dividends, gains in the fair value of financial assets measured at fair value through profit or loss, gains on remeasurement of any pre-existing interest in an acquisition in a business combination, gains on hedging instruments recognized in the results, and reclassifications of net gains previously recognized in other comprehensive income. Using the effective interest rate method, interest income is recorded as it is recognized in the results. Dividend income is recognized in the results on the date that the Company's right to receive payment is established, which is typically the ex-dividend date for listed securities.
Financial expenses consist of interest expenses on borrowings, settlement of discount provisions and deferrals, losses on the disposal of available-for-sale financial assets, dividends on preferred shares categorized as liabilities, losses on the fair value of financial assets at fair value through profit or loss contingent consideration and loss, impairment losses recognized in financial assets (other than accounts receivable), losses on hedging instruments that are recognized in income (loss) and reclassifications of net losses previously recognized in other comprehensive income.
The effective interest rate method is used to account for borrowing costs that are not directly attributable to the acquisition, construction, or production of an eligible asset.
Foreign exchange gains and losses on financial assets and liabilities are reported net as financial income or financial expense, based on whether net foreign currency fluctuations result in a gain or loss. |
Explanatory Notes to the Financial Statement
(In thousands of Reais, except when otherwise indicated)
The details of financial income and expenses are as follows:
| Parent Company |
| Consolidated | |||||||
|
| 12/31/2023 |
| 12/31/2022 |
|
| 12/31/2023 |
| 12/31/2022 |
Gross debt cost |
|
|
|
|
|
|
|
|
|
Interest and monetary variation (i) |
| (969,613) |
| (954,320) |
|
| (4,267,829) |
| (4,464,754) |
Net foreign exchange variation on debts (i) |
| 60,798 |
| 135,445 |
|
| 1,921,632 |
| 549,682 |
Financial result with derivatives and fair value (ii)|(iii) |
| (1,253,705) |
| (2,000,888) |
|
| (2,684,111) |
| (4,203,149) |
Amortization of borrowing costs |
| (9,529) |
| (78,112) |
|
| (64,588) |
| (244,344) |
Guarantees and warranties |
| — |
| — |
|
| (38,773) |
| (41,505) |
|
| (2,172,049) |
| (2,897,875) |
|
| (5,133,669) |
| (8,404,070) |
Income from financial investments and exchange rate variation in cash and cash equivalents |
| 222,839 |
| 191,315 |
|
| 2,057,369 |
| 1,788,477 |
Changes in fair value of investments in listed entities (iv) |
| — |
| — |
|
| (3,147,031) |
| 3,385,047 |
|
| 222,839 |
| 191,315 |
|
| (1,089,662) |
| 5,173,524 |
Cost of debt, net |
| (1,949,210) |
| (2,706,560) |
|
| (6,223,331) |
| (3,230,546) |
|
|
|
|
|
|
|
|
|
|
Other charges and monetary variations |
|
|
|
|
|
|
|
|
|
Interest on other receivables |
| 45,285 |
| 37,210 |
|
| 450,478 |
| 355,634 |
Update of other financial assets |
| 1,777 |
| (1,405) |
|
| 1,777 |
| (1,405) |
Monetary variation on leases and concessions agreements |
| — |
| — |
|
| (514,236) |
| (417,703) |
Interest on leases |
| (3,574) |
| (3,858) |
|
| (444,850) |
| (374,177) |
Interest on equity capital |
| 481,753 |
| 33,134 |
|
| (46,212) |
| 33,134 |
Interest on contingencies and contracts |
| (217,481) |
| (138,513) |
|
| (781,087) |
| (593,144) |
Interest on sectoral assets and liabilities |
| — |
| — |
|
| (97,845) |
| (36,670) |
Bank charges and other |
| (36,319) |
| (151,214) |
|
| (107,747) |
| (145,200) |
Foreign exchange and non-debt derivatives |
| 186,321 |
| (411,237) |
|
| (133,974) |
| (747,859) |
|
| 457,762 |
| (635,883) |
|
| (1,673,696) |
| (1,927,390) |
Financial result, net |
| (1,491,448) |
| (3,342,443) |
|
| (7,897,027) |
| (5,157,936) |
|
|
|
|
|
|
|
|
|
|
Reconciliation |
|
|
|
|
|
|
|
|
|
Financial expenses |
| (1,934,520) |
| (1,970,687) |
|
| (11,337,430) |
| (4,706,535) |
Financial income |
| 829,235 |
| 277,734 |
|
| 3,028,134 |
| 5,777,521 |
Exchange variation |
| 712,582 |
| 649,899 |
|
| 1,777,438 |
| 260,746 |
Net effect of derivatives |
| (1,098,745) |
| (2,299,389) |
|
| (1,365,169) |
| (6,489,668) |
Financial result, net |
| (1,491,448) |
| (3,342,443) |
|
| (7,897,027) |
| (5,157,936) |
|
|
|
|
|
|
|
|
|
|
| (i) | At December 31, 2023, the amount of interest for monetary variation and exchange variation of debts linked to the purchase of assets from Vale was R$ 599,515. |
| (ii) | At December 31, 2023, the cost of banking operations with derivatives was R$ 554,998. |
| (iii) | At December 31, 2023, the result with derivatives and fair value of the securities linked to the protection of the investment in Vale shares was R$ 880,795. |
| (iv) | The gross balance of the financial investment’s accrual in listed entities without effects of PIS and COFINS in the nine months ended December 31, 2023, is R$ 3,312,112. |
Explanatory Notes to the Financial Statement
(In thousands of Reais, except when otherwise indicated)
Accounting policy Using actuarial valuations, the cost of defined benefit pension plans and other post-employment benefits, as well as the present value of the retirement obligation, are determined. A valuation based on actuarial principles is based on a number of assumptions that may differ from actual results in the future. These include determining the discount rate, salary increases in the future, death rates, and future pension increases. The sensitivity of a defined benefit obligation to changes in these assumptions is high. Management reviews all assumptions at each balance sheet date.
A defined contribution plan is a post-employment benefit plan in which the Company pays fixed contributions to a separate entity and has no legal or constructive obligation to pay additional amounts. Obligations for contributions to defined contribution plans are recorded as an employee benefit expense in the financial results during the periods in which the related services are rendered by employees. Contributions to a defined contribution plan that are due more than 12 months after the end of the service period are discounted to their present value. The Company sponsors a defined contribution private pension plan named Plano de Aposentadoria FuturaFlex (for the employees of Compass, Comgás and Commit), managed by FuturaMais – Complementary Pension Fund Entity (Entidade de Previdência Complementar) (formerly named RaizPrev – Private Pension Fund Entity (Entidade de Previdência Privada), which merged Futura II –Entidade de Previdência Complementar). The Entity has administrative, asset and financial autonomy, and has as object the management and execution of social security benefit plans, as defined in the Regulation of Benefit Pension Plans. ii. Variable contribution A variable contribution plan is also known as a mixed plan that brings together aspects of the BD – defined benefit and the DC – defined contribution. The other companies of the Group sponsor a supplementary pension plan structured in the Variable Contribution modality, called the Future Retirement Plan II, also managed by FuturaMais – Complementary Pension Fund Entity (formerly called RaizPrev – Private Pension Entity, which incorporated Futura II – Complementary Pension Entity). It brings together the characteristics of the Defined Contribution for scheduled benefits (normal and early retirement) and the Defined Benefit for risk benefits (sickness benefit, disability, savings and death pension). iii. Defined benefit The defined benefit plan is a plan in which the participants have the due benefit established by means of regulatory provisions. The cost is determined through actuarial evaluations, which are conducted at least annually based on assumptions. The Pension Plan, managed by Futura – Entidade de Previdência Complementar, is sponsored by Cosan Lubrificantes e Especialidades S.A., and is closed since 2011. According to the regulation, which leads the Company to adopt such a provision in the present value of benefits and that assisted participants receive annuity according to the plan. The main actuarial risks are: a) life expectancy longer than specified in the mortality table; b) the return on equity under the actuarial discount rate plus the accrued IGP-DI; and c) real family structure of different hypotheses of established retirement. |
Explanatory Notes to the Financial Statement
(In thousands of Reais, except when otherwise indicated)
iv. Health insurance The Comgás subsidiary provides a post-employment health care benefit to retired employees and their dependents who retired until May 31, 2000. After that date, only employees with 20 years of contribution to the INSS and 15 years of uninterrupted work at the Company as of May 31, 2000 are eligible for this defined benefit plan, provided they are still employed by the Company on the date the retirement is granted. Independent actuaries calculate annually the liability reported in the balance sheet in relation to the defined benefit post-employment plan. The amount recognized in the balance sheet in respect of post-employment benefit plan liabilities represents the present value of the obligations less the fair value of the assets, including actuarial gains and losses. Remeasurements of the net obligation, which include: actuarial gains and losses, return on plan assets (excluding interest) and the effect of the asset ceiling (if any, excluding interest), are recognized immediately in other comprehensive income. Net interest and other expenses related to the defined benefit plan are recognized in the result. Actuarial gains and losses resulting from adjustments based on experience and changes in actuarial assumptions are recorded as other comprehensive income directly in shareholder’s equity when they occur. |
| Consolidated | ||
| 12/31/2023 |
| 12/31/2022 |
Defined contribution |
|
|
|
Futura II | 333 |
| 332 |
Defined benefit |
|
|
|
Futura | 175,150 |
| 127,351 |
Health Insurance | 442,164 |
| 448,157 |
| 617,314 |
| 575,508 |
| 617,647 |
| 575,840 |
| a) | Defined contribution |
| During the year ended December 31, 2023, the amount of employee contributions was R$103 (R$303 as at December 31, 2022). | |
| b) | Defined benefit |
| Futura: The subsidiary CLE sponsors Futura - Entidade de Previdência Complementar ("Futura"), formerly known as Previd Exxon - Entidade de Previdência Complementar, whose primary objective is to provide supplemental benefits within certain limits established by the Retirement Plan regulations. On 5 May 2011, the competent authorities authorized a modification to this plan to exclude new participants. The contributions totaled R$13,199 for the year ending December 31, 2023 (R$60,827 for the year ended on December 31, 2022). The obligation's weighted average duration is 8.9 years (8.7 years as of December 31, 2022). | |
| c) | Health insurance |
| Comgás: Obligations related to post-employment benefit plans, which include medical assistance and retirement incentives, sick pay and disability pension. | |
| The defined benefit pension plan is governed by Brazilian labor laws, which mandate that final salary payments during retirement be adjusted for the consumer price index at the time of payment. The level of benefits provided is dependent on the member's length of service and final salary. During the year ended December 31, 2023, the contributions amounted to R$27,088 (R$27,118 for the year ended December 31, 2022). The weighted average duration of the obligation is 10,9 years (10.6 years in 2022). |
Explanatory Notes to the Financial Statement
(In thousands of Reais, except when otherwise indicated)
Details of the present value of the defined benefit obligation and the fair value of plan assets are as follows:
| 12/31/2023 |
| 12/31/2022 |
Actuarial obligation at beginning of the year | 1,097,982 |
| 1,161,693 |
Current service cost | 157 |
| 219 |
Cost of past services | — |
| 319 |
Interest on actuarial obligation | 107,057 |
| 98,343 |
Early settlement in the plan | — |
| (3,081) |
Actuarial (gain) loss arising from financial assumptions | 62,807 |
| (88,709) |
Actuarial loss (gain) arising from experience adjustment | (62,889) |
| 14,319 |
Actuarial gains arising from demographic assumptions | 22,116 |
|
|
Benefit payments | (85,389) |
| (85,121) |
Actuarial obligation at the end of the year | 1,141,841 |
| 1,097,982 |
|
|
|
|
Fair value of plan assets at the beginning of the year | (521,568) |
| (492,408) |
Interest income | (49,720) |
| (42,224) |
Return on assets higher than the discount rate | 2,443 |
| 11,405 |
Early settlement in the plan | — |
| 3,698 |
Employer contributions | (40,287) |
| (87,945) |
Benefit payments | 85,389 |
| 85,000 |
Fair value of plan assets at the end of the year | (523,743) |
| (522,474) |
Net defined benefit liability | 618,098 |
| 575,508 |
The total expense recognized in the financial results is as follows:
| 12/31/2023 |
| 12/31/2022 |
Current service cost | (157) |
| (219) |
Interest on actuarial obligation | (57,337) |
| (56,119) |
| (57,494) |
| (56,338) |
Total amount recognized as accumulated other comprehensive income:
| 12/31/2023 |
| 12/31/2022 |
Accumulated at the beginning of the year | 204,788 |
| 141,803 |
Actuarial gain (loss) arising from financial assumptions | (62,807) |
| 88,709 |
Actuarial (loss) gain arising from experience adjustment | 62,889 |
| (14,319) |
Actuarial loss arising from demographic assumptions | (22,116) |
| — |
Return on assets higher than the discount rate | (2,443) |
| (11,405) |
Accumulated at the end of the year | 180,311 |
| 204,788 |
Explanatory Notes to the Financial Statement
(In thousands of Reais, except when otherwise indicated)
The plan's assets consist of the following:
| 12/31/2023 |
| 12/31/2022 | ||||
| Value |
| % |
| Value |
| % |
Fixed income | 523,743 |
| 100.00% |
| 496,950 |
| 95.28% |
Others | — |
| — |
| 24,618 |
| 4.72% |
| 523,743 |
| 100.00% |
| 521,568 |
| 100.00% |
Plan assets consist of financial assets quoted on active markets and are therefore classified as Levels 1 and 2 in the fair value hierarchy. The expected rate of return on plan assets is determined based on market expectations applicable to the period during which the obligation is to be settled at the time the rate is determined.
The following are the primary assumptions used to determine the Company's and its subsidiaries' benefit obligations:
| Futura |
| Health insurance | ||||
| 12/31/2023 |
| 12/31/2022 |
| 12/31/2023 |
| 12/31/2022 |
Discount rate | 9.29% |
| 10.03% |
| 10.12% per year |
| 10.45% |
Inflation rate | 3.50% |
| 3.50% |
| 4.50% per year |
| 4.25% |
Future salary increases | N/A |
| N/A |
| N/A |
| N/A |
Morbidity (aging factor) | N/A |
| N/A |
| 3.00% |
| 3.00% |
Future pension increases | 3.50% |
| 3.50% |
| 3.00% per year |
| 3.00% |
Overall mortality (segregated by sex) | N/A |
| N/A |
| AT-2000 (smoothed in 10%) |
| AT-2000 |
Disability mortality | N/A |
| N/A |
| IAPB-1957 |
| IAPB-1957 |
Entry into disability (modified) | N/A |
| N/A |
| UP-84 modified |
| UP-84 modified |
Turnover | N/A |
| N/A |
| 0.60/ (service time +1) |
| 0.60/(service time +1) |
Sensitivity analysis
Changes in the discount rate to the date of the balance sheet is one of the relevant actuarial assumptions, while other assumptions are maintained, as it impacts the defined benefit obligation as shown below:
| Discount rate | ||
| Increase 0.50% |
| Reduction (0.50)% |
Futura | 672,044 |
| 727,827 |
Health insurance | (23,123) |
| 20,998 |
There have been no changes regarding the biometric and demographic assumptions compared to previous years and the methods adopted in preparing the sensitivity analysis.
Explanatory Notes to the Financial Statement
(In thousands of Reais, except when otherwise indicated)
Accounting policy: The fair value of share-based payment benefits at the grant date is recognized, as personnel expenses, with a corresponding increase in equity, for the period in which employees unconditionally acquire the right to the benefits. The amount recognized as an expense is adjusted to reflect the number of shares for which there is an expectation that the service conditions and non-market acquisition conditions will be met, such that the amount ultimately recognized as an expense is based on the number of shares that actually meet the service conditions and non-market acquisition conditions on the date the payment rights are acquired (vesting date). For share-based payment benefits with a non-vesting condition, the grant date fair value of the share-based payment is measured to reflect such conditions and there is no modification for differences between expected and actual benefits. The fair value of the amount payable to employees in respect of share appreciation rights, which are settled in cash, is recognized as an expense with a corresponding increase in liabilities during the period in which employees unconditionally acquire the right to payment. Liabilities are remeasured at each balance sheet date and settlement date, based on the fair value of share appreciation rights. Any changes in the fair value of the liability are recognized in profit or loss as personnel expenses. |
The Company and its subsidiaries have Share-Based Compensation Plans that are payable in shares and cash. As of December 31, 2023, the Group has the following share-based payment arrangements:
Plans before 2022
| (i) | Share grant plans (settled in share), without lock-up, with delivery of shares at the end of the 5-year grace period, conditioned only on the maintenance of the employment relationship (service condition). |
| (ii) | Share grant plans (settled in share), without lock-up, with delivery of shares throughout or at the end of the grace period of 3 to 5 years, subject to i) part of the options on maintaining the employment relationship (service condition) and ii) starting from the achievement of each of the metrics that make up the performance goals (performance conditions). |
| (iii) | Share-based remuneration plan (cash-settled) where beneficiaries are allocated a certain number of units referenced to a theoretical share price calculated based on the Cosan Group's EBITDA each year. The units will be paid in cash, upon compliance with the contractual conditions of a 3 to 5 year vesting period. Payments take place at the end of each cycle (3 to 5 years after the grant date), based on the converted reference value of the share at that time. |
Explanatory Notes to the Financial Statement
(In thousands of Reais, except when otherwise indicated)
Grants made in 2023
- Share grant program (liquidated in shares)
In the year ended of December 31, 2023, the following Grant Program was established:
Program | Conditions for vesting | |
Cosan Partners 2023. | Grants January 30, 2023. The incentive program is conditioned on length of service (service condition) and performance targets (performance conditions). Of the program's total shares, 60% are related to length of service for a period of 3 years, with shares being granted annually. The remainder, equivalent to 40% of the program, are related to performance goals, requiring the achievement of specific metrics that can vary between 0% and 110% (to calculate the fair value, reaching 100% was considered). Stocks stay in lock-up for a year. Grant March 28, 2023. The incentive program is conditioned on length of service (service condition) and performance targets (performance conditions). Of the program's total shares, 49% are related to length of service for a period of 3 years, with shares being granted annually. The remainder, equivalent to 51% of the program, are related to performance goals, requiring the achievement of specific metrics that can vary between 0% and 110%. (to calculate the fair value was considered the achievement of 100%). Shares are in lock-up for one year. The total value of shares granted in the two plans is 12,472,325. | |
Cosan Invest. | Grant July 31, 2023. The incentive program is conditioned on length of service (service condition) and performance targets (performance conditions). Of the program's total shares, 41% are related to length of service for a period of 3 years, with shares being granted annually. The remainder, equivalent to 59% of the program, are related to performance goals, requiring the achievement of specific metrics that can vary between 50% and 150%. |
Explanatory Notes to the Financial Statement
(In thousands of Reais, except when otherwise indicated)
Program | Conditions for vesting | |
Investe Cosan III - Partners | Grant December 01, 2023. The incentive program in the matching model is conditioned on service time (service condition) and the investment made by the beneficiary with own resources, which must be maintained in shares during the grace period. Of the total actions of the program 50% are related to service time of 3 years and the rest, equivalent to 50% of the program, related to service time of 5 years. | |
Rumo Invest. | Grant September 1, 2023. Option programs, without lock-up, with delivery of the shares at the end of the three-year grace period, conditioned on i) part of the options to the maintenance of the employment relationship (service condition) and ii) part to the achievement of each of the metrics that make up the performance goals, and the number of performance options granted may vary between 0% and 200% depending on performance. | |
SOP Moove. | Grant July 1, 2023. The incentive program is conditioned on length of service (service condition) and linked to the occurrence of a liquidity event defined in the program (performance conditions). The options granted to participants may only be exercised after they become vested options, and the maximum period for exercising the Options will be 6 (six) years from the date of grant. The exercise price of the options covered by this Program is R$50.05 for Model A options, R$106.28 for Model B options and R$135.05 for Models C and D options (“Exercise Price”) and must be paid in cash, simultaneously with the formalization of the subscription or purchase. To measure fair value, the binomial model is used with premises such as price of the base asset, distribution of dividends (0% dividend yield), exercise price according to each Model within the program, expected average exit rate, risk-free rate, volatility and effect of lock-up linked to the exercise of options. |
Explanatory Notes to the Financial Statement
(In thousands of Reais, except when otherwise indicated)
Award Type / Award Date |
| Company |
| Life expectancy (months) |
| Grants under plans |
| Exercised / Canceled / Transferred |
| Available |
| Fair value as of grant date - R$ |
Share grant program |
|
|
|
|
|
|
|
|
|
| ||
7/31/2018 |
| Cosan S.A. |
| 60 |
| 842,408 |
| (842,408) |
| — |
| 9.65 |
7/31/2019 |
| Cosan S.A. |
| 60 |
| 229,020 |
| (41,714) |
| 187,306 |
| 13.44 |
7/31/2020 |
| Cosan S.A. |
| 60 |
| 68,972 |
| (6,704) |
| 62,268 |
| 20.93 |
7/31/2021 - Invest I |
| Cosan S.A. |
| 36 |
| 424,839 |
| (25,722) |
| 399,117 |
| 24.38 |
9/10/2021 - Invest II |
| Cosan S.A. |
| 48 |
| 5,283,275 |
| (1,981,231) |
| 3,302,044 |
| 22.24 |
10/11/2021 - Invest III |
| Cosan S.A. |
| 60 |
| 806,752 |
| — |
| 806,752 |
| 23.20 |
7/31/2022 - Invest I |
| Cosan S.A. |
| 36 |
| 846,506 |
| (11,208) |
| 835,298 |
| 18.74 |
11/22/2022 - Invests Partners |
| Cosan S.A. |
| 60 |
| 377,173 |
| — |
| 377,173 |
| 17.14 |
1/30/2023 - Invest Partners |
| Cosan S.A. |
| 36 |
| 12,472,325 |
| — |
| 12,472,325 |
| 15.26 |
7/31/2023 - Invest Cosan I - Regular |
| Cosan S.A. |
| 36 |
| 1,047,845 |
| — |
| 1,047,845 |
| 17.53 |
12/01/2023 - Invest Cosan III - Associates |
| Cosan S.A. |
| 60 |
| 546,734 |
| — |
| 546,734 |
| 17.68 |
|
|
|
|
|
| 22,945,849 |
| (2,908,987) |
| 20,036,862 |
|
|
|
|
|
|
|
|
|
|
|
|
|
|
|
7/31/2019 |
| Comgás |
| 48 |
| 83,683 |
| (83,683) |
| — |
| 79.00 |
|
|
|
|
|
|
|
|
|
|
|
|
|
7/01/2023 - Program SOP A |
| Moove |
| 72 |
| 699,276 |
| — |
| 699,276 |
| 142.62 |
7/01/2023 - Program SOP B |
| Moove |
| 72 |
| 279,710 |
| — |
| 279,710 |
| 88.32 |
7/01/2023 - Program SOP C |
| Moove |
| 72 |
| 223,768 |
| — |
| 223,768 |
| 76.54 |
7/01/2023 - Program SOP D |
| Moove |
| 72 |
| 139,855 |
| — |
| 139,855 |
| 71.45 |
|
|
|
|
|
| 1,342,609 |
| — |
| 1,342,609 |
|
|
|
|
|
|
|
|
|
|
|
|
|
|
|
8/1/2018 |
| Rumo S.A. |
| 60 |
| 1,149,544 |
| (1,149,544) |
| — |
| 13.94 |
8/15/2019 |
| Rumo S.A. |
| 60 |
| 843,152 |
| (267,977) |
| 575,175 |
| 22.17 |
11/11/2020 |
| Rumo S.A. |
| 60 |
| 776,142 |
| (249,747) |
| 526,395 |
| 20.01 |
5/5/2021 |
| Rumo S.A. |
| 60 |
| 1,481,000 |
| (977,523) |
| 503,477 |
| 20.84 |
9/15/2021 |
| Rumo S.A. |
| 36 |
| 1,560,393 |
| (191,959) |
| 1,368,434 |
| 18.19 |
9/1/2022 |
| Rumo S.A. |
| 36 |
| 1,781,640 |
| (53,959) |
| 1,727,681 |
| 20.36 |
9/1/2022 |
| Rumo S.A. |
| - |
| 146,909 |
| (146,909) |
| — |
| 20.36 |
9/1/2023 |
| Rumo S.A. |
| 36 |
| 1,724,867 |
| — |
| 1,724,867 |
| 21.86 |
|
|
|
|
|
| 9,463,647 |
| (3,037,618) |
| 6,426,029 |
|
|
Explanatory Notes to the Financial Statement
(In thousands of Reais, except when otherwise indicated)
Share-based compensation plan (settled in cash) |
|
|
|
|
|
|
|
| ||||
07/31/2019 - Invest I |
| Moove |
| 60 |
| 132,670 |
| (26,285) |
| 106,385 |
| 50.79 |
07/31/2020 - Invest II |
| Moove |
| 60 |
| 106,952 |
| (17,695) |
| 89,257 |
| 61.89 |
07/31/2021 - Invest III |
| Moove |
| 36 |
| 80,729 |
| (13,628) |
| 67,101 |
| 102.73 |
07/31/2022 - Invest IV |
| Moove |
| 36 |
| 77,967 |
| (3,779) |
| 74,188 |
| 135.05 |
07/31/2023 - Invest V |
| Moove |
| 36 |
| 82,204 |
| (233) |
| 81,971 |
| 150.98 |
8/1/2021 |
| Compass Gás e Energia |
| 24 |
| 29,492 |
| (29,492) |
| — |
| 25.46 |
8/1/2021 |
| Compass Comercialização |
| 36 |
| 35,075 |
| (6,001) |
| 29,074 |
| 25.46 |
8/1/2021 |
| Compass Gás e Energia |
| 36 |
| 170,647 |
| — |
| 170,647 |
| 25.46 |
8/1/2021 |
| Compass Gás e Energia |
| 36 |
| 37,572 |
| — |
| 37,572 |
| 25.46 |
11/1/2021 |
| Compass Gás e Energia |
| 32 |
| 192,405 |
| — |
| 192,405 |
| 25.46 |
11/1/2021 |
| Compass Gás e Energia |
| 32 |
| 1,646,411 |
| (17,873) |
| 1,628,538 |
| 25.46 |
2/1/2022 |
| Compass Gás e Energia |
| 29 |
| 90,087 |
| — |
| 90,087 |
| 25.59 |
8/1/2022 |
| Compass Gás e Energia |
| 36 |
| 837,439 |
| — |
| 837,439 |
| 25.59 |
8/1/2022 |
| Compass |
| 36 |
| 30,651 |
| (6,460) |
| 24,191 |
| 25.59 |
8/1/2022 |
| TRSP |
| 36 |
| 31,675 |
| — |
| 31,675 |
| 25.59 |
8/1/2023 |
| Compass Gás e Energia |
| 36 |
| 242,802 |
| — |
| 242,802 |
| 34.12 |
8/1/2023 |
| Compass |
| 36 |
| 25,716 |
| — |
| 25,716 |
| 34.12 |
8/1/2023 |
| TRSP |
| 36 |
| 22,950 |
| — |
| 22,950 |
| 34.12 |
|
|
|
|
|
| 3,873,444 |
| (121,446) |
| 3,751,998 |
|
|
Total |
|
|
|
|
| 37,709,232 |
| (6,151,734) |
| 31,557,498 |
|
|
Explanatory Notes to the Financial Statement
(In thousands of Reais, except when otherwise indicated)
a) Reconciliation of outstanding share options
The change in outstanding share options is as follows:
|
| Parent company |
| Consolidated |
On January 1, 2022 |
| 7,801,240 |
| 15,592,511 |
Granted |
| 1,223,679 |
| 5,156,829 |
Exercised/cancels/other |
| (1,597,962) |
| (2,872,832) |
On December 31, 2022 |
| 7,426,957 |
| 17,876,508 |
Granted |
| 14,066,904 |
| 16,868,466 |
Exercised/cancels/other |
| (1,456,999) |
| (3,187,476) |
On December 31, 2023 |
| 20,036,862 |
| 31,557,498 |
|
|
|
|
|
b) Fair value measurement
The weighted average fair value of the programs granted during December 31, 2023 and 2022 and the main assumptions used in applying the Black-Scholes and Binominal model were as follows:
|
| Average market price on the grant date |
| Interest rate |
| Volatility | |
Cosan S.A | 12/31/2023 | 16.82 |
| N/A |
| N/A | |
12/31/2022 | 17.14 |
| 6.82% |
| 36.50% | ||
|
|
|
|
|
|
| |
Compass | 12/31/2023 | 42.21 |
| N/A |
| N/A | |
12/31/2022 | 29.20 |
| N/A |
| N/A | ||
|
|
|
|
|
|
| |
Comgás | 12/31/2023 | - |
| N/A |
| N/A | |
12/31/2022 | 79.00 |
| N/A |
| N/A | ||
|
|
|
|
|
|
| |
TRSP | 12/31/2023 | 42.21 |
| N/A |
| N/A | |
12/31/2022 | 29.20 |
| N/A |
| N/A | ||
|
|
|
|
|
|
| |
Rumo (i) | 12/31/2023 | 21.87 |
| 10.41% |
| 25.84% | |
12/31/2022 | 20.56 |
| 11.53% |
| 27.70% | ||
|
|
|
|
|
|
| |
Moove (ii) | 12/31/2022 | 105.98 |
| 4.05% |
| 42.85% | |
|
|
|
|
|
|
|
| (i) | Volatility was determined based on the historical volatility of the share price in the last thirty days prior to the grant date. |
| (ii) | Volatility was determined based on the historical volatility of the parent company's share price, since Moove is not yet publicly traded, taking as a measure the period proportional to the term of the plan. |
c) Expenses recognized in profit or loss
Share-based compensation expenses included in the income statement for the periods ended December 31, 2023, and 2022 were R$207,713 and R$99,098, respectively.
Explanatory Notes to the Financial Statement
(In thousands of Reais, except when otherwise indicated)
ISSUANCE OF SENIOR NOTES 2031
On January 26, 2024, the Company issued a senior Notes offering for a total volume of US$600,000 equivalent to R$2,947,500, through its wholly owned subsidiary Cosan Luxembourg S.A ("Cosan Luxembourg"). The issuance of senior Notes occurred with an annual interest rate of US$ + 7.25%, maturing in June 2031 and semi-annual interest payments.
On February 16, 2024, the Company committed the remaining funds from Senior Notes 2031, through the issuance of debt modality Resolution 4131 ("4131") by Cosan S.A. On February 16, 2024, the Company committed the remaining funds from Senior Notes 2031, through the issuance of debt modality Resolution 4131 ("4131") by Cosan S.A
DISTRIBUTION OF DIVIDENDS FROM VALE
The Board of Directors of Vale approved on February 22, 2024 the remuneration of shareholders in the amount of R$11,721,894. The declared amount corresponds in full to dividends in the total amount of R$ 2.738548374 per share. The payment occurred on March 19, 2024 and the amount received by the subsidiary Cosan Oito was R$577,469.
TENTH EMISSION OF COMGÁS DEBENTURES
On February 29, 2024, the Board of Directors of the indirect subsidiary Comgás approved the public offer of the 10th issue of simple debentures, under a firm guarantee of placement, not convertible into shares, of the chirographer species, in a single series. The issue will be in the total amount of R$ 1,500,000, with incidence of half-yearly interest at a rate equal to DI plus a spread of 0.80% per year and with maturity of the principal on March 15, 2029, with amortization on the due date. The net proceeds obtained from the Issuance will be allocated to the ordinary management of the business of the indirect subsidiary Comgás.
RENEWAL OF THE SUDAM TAX BENEFIT
On December 20, 2023, Rumo Malha Norte S.A. presented the incorporation report number 143/2023 to the Federal Revenue of Brazil – RFB, issued by SUDAM on December 6, 2023, attesting to compliance with the legal conditions and requirements required to renew the tax benefit for another 10 years. In view of the above, the RFB, through the use of its powers, decided on March 13, 2024, through executive declaratory act number 024213308, to recognize the right to a 75% reduction in income tax and additional amounts referred to in art. 1 of Provisional Measure No. 2,199-14, of August 24, 2001, calculated based on the exploration profit, of the legal entity Rumo Malha Norte.
THIRD ISSUE OF COMPASS DEBENTURES
On March 15, 2024, the subsidiary Compass Gás e Energia S.A. disbursed its 3rd issue of simple and non-convertible debentures, in the amount of R$ 1,500,000 with remuneration of CDI + 1.08% per year, semi-annual interest and principal with maturity on March 15, 2029. The funds obtained with the issue will be intended for general purposes and strengthening working capital.
COMPASS GAS AND ENERGY DIVIDEND RESOLUTION
On March 27, 2024, the Board of Directors of the indirect subsidiary Compass Gas and Energy approved the distribution of dividends in the amount of R$1,500,000. The payment occurred on April 12, 2024 and the amount received by the subsidiary Cosan Dez was R$1,320,000.
Explanatory Notes to the Financial Statement
(In thousands of Reais, except when otherwise indicated)
COMPASS AND TRSP TRADE NOTES
On March 20, 2024, Compass and its subsidiary TRSP signed the 1st Issuance of Commercial Notes in the amount of R$ 200,000, with its maturity in March 2026 and its remuneration at 100% CDI + 1,7% per year. The contract was concluded through the depositary Laqus Depositary of Securities S.A. following the market conditions for the respective transaction.
COMPASS MARKETING LOAN
On March 21, 2024. Compass and its subsidiary Compass commercialized a loan agreement "Uncommitted Term Loan Facility Agreement - Loan Agreement" with the bank BNP Paribas S.A., for funding in accordance with the terms of Law Nº 4.131. On March 22, 2024, the Company completed the fundraising in the amount of EUR 78 million with maturity in March 2025 and interest rate of 4.879% per year.
ISSUANCE OF DEBENTURES RUMO MALHA PAULISTA S.A.
On March 25, 2024, Rumo Malha Paulista raised R$ 1,200,000 with the 5th issuance of simple debentures, not convertible into shares, of the chirographer species, divided into two series, the first having an amount of R$ 532,243, with IPCA + 5 fee,7970% per year, 10-year term, semi-annual interest payments and Bullet amortization, while the second is R$ 667,757 with IPCA + 5.9284% per year, 15-year term, semi-annual interest payments and amortizations in the last three years.
PORT TERMINAL PROJECT - SEEDS
On March 25, 2024, the Companies Rumo S.A. and EMBRAPORT - Empresa Brasileira de Terminais Portuários S.A., signed a binding agreement for the implementation of a new project (terminal) for grain and fertilizer elevations in the port of Santos. The estimated investment for the construction of the Terminal is R$ 2,5 billion and will be financed with loans, in addition to the possibility of potential strategic partnerships throughout the course of implementation of the Project. The start of construction is conditional on compliance with previous conditions for this type of operation, including licensing and legal and regulatory approvals. After the fulfillment of all the previous conditions, the period of 30 months for construction is estimated.
SALE SHARES VALE S.A AND UNWIND OF DEBTS AND COLLAR FINANCING
On April 19, 2024, the Company sold a further 33.525 million shares equivalent to 0.74% of the total shares in the Collar Financing structure, together with the early settlement of the remaining balance of the debt. With this last advance payment, the company settled 100% of the debts linked to the collar operation and derivatives, and now only holds a direct stake in Vale. After the sale, Cosan's direct stake in Vale's total shares became 3.91% and 4.14% of the voting capital, i.e. excluding treasury shares.
Explanatory Notes to the Financial Statement
(In thousands of Reais, except when otherwise indicated)
UNWIND CALL SPREAD - OPERATION VALE S.A
On May 8, 2024, the Company settled the 2024 tranche of the call spread structure, in which it obtained a cash inflow gain of R$ 14,499 and now holds the optionality of 1.35%, against the 1.60% held until then.
CLIMATE EVENTS IN RIO GRANDE DO SUL - SULGÁS
Following the weather events that recently hit the state of Rio Grande do Sul, the company is monitoring possible impacts on the operations of its indirect subsidiary Companhia de Gás do Estado do Rio Grande do Sul S.A. - “Sulgás”. The company has set up a crisis committee to monitor and guarantee the safety of employees and their families, monitor the impacts on the distribution networks in the areas most at risk, guarantee continuity of supply and timely communication with its customers. In addition, the company and Sulgás have made themselves available to support the state government. To date, this event has not generated any material impacts for the purposes of the Company's financial statements.
INCORPORATION OF ELEVATIONS PORT S.A.
On April 30, 2024, CLI SUL S.A. (“CLI SUL”) completed the process of incorporating Elevações Portuárias S.A. (“EPSA”), after obtaining the necessary regulatory approvals. As a result of this corporate reorganization, the subsidiary Rumo S.A. (“Rumo”) received from CLI SUL, on the same date, the amount of R$168,855. This amount refers to the additional acquisition price that CLI SUL undertook to pay to Rumo, under the terms of the share purchase agreement signed between the parties on July 15, 2022, and corresponds to 20% of the outstanding balance of the acquisition financing, plus accrued interest and other charges, deducted from the cash held by CLI SUL. After the merger, CLI SUL's shareholders became CORREDOR LOGÍSTICA E INFRAESTRUTURA S.A. (“CLI”) and Rumo, with the shareholding split remaining at 80% for CLI and 20% for Rumo.
EXCLUSION OF ICMS FROM THE PIS AND COFINS CALCULATION BASIS
On April 10, 2024, joint venture Raízen S.A, through the indirect subsidiary Blueway, obtained approval from the Brazilian Federal Revenue Service for the request to qualify for a tax credit in the amount of R$1,824,019, determining the exclusion of ICMS from the PIS and COFINS calculation basis.
GOAL ESG COMPLIANCE - 2ND DEBENTURE OF MALHA PAULISTA
As indicated in note 3.3, the 2nd Malha Paulista Debenture of the subsidiary Rumo is linked to the sustainable goal of reducing greenhouse gas emissions per ton of useful kilometer (TKU) by 15% by 2023, with the base date of December 2019 as the starting point. Compliance with the Rate Step Down Condition was verified based on Rumo's Annual Sustainability Report (“ASR”), which contains the consolidated data of Malha Paulista for the fiscal year ending December 31, 2023. Therefore, the company will benefit from a step-down of 25 basis points in each series, which will reduce the rate from the next Capitalization Period to CDI + 1.54% in the 1st series and IPCA + 4.52% in the 2nd series.
Explanatory Notes to the Financial Statement
(In thousands of Reais, except when otherwise indicated)
26.1 RECENT ACCOUNTING STANDARDS ADOPTED BY THE COMPANY
Applicable standard | Main requirements | Impact |
Amendments to IAS 8/CPC 23 - Accounting Policies, Change of Estimate and Error Rectification Effective as of January 1, 2023 | IAS 8/CPC 23 introduces the new definition of accounting estimate "Accounting estimates are monetary amounts in financial statements that are subject to measurement uncertainty" and clarifies how entities should distinguish changes in accounting estimates from changes in accounting policies. The impacted paragraphs are items 5, 32, 34, 38 and 48 and the title of item 32. A distinction is made between accounting estimates (which are applied prospectively) and accounting policies (which are applied retrospectively). | These changes had no impact on the Cosan Group’s individual and consolidated financial statements because the Company’s accounting estimates already met the new definition. |
Amendments to IAS 1/ CPC 26 - Presentation of Financial Statements Effective as of January 1, 2023. | IAS 1/CPC 26 introduces guidance for deciding which accounting policies to disclose in your financial statements. The paragraphs impacted to support the identification of material accounting policy are items 114, 117, 122, 117A, 117E, 139V and exclusion of items 118, 119 and 121. | These changes had no impact on the individual and consolidated financial statements of the Cosan Group because the policies disclosed by the Company already met the new definition of material policies. |
Amendments to IAS 12/CPC 32 -Taxes on Profit Effective as of January 1, 2023. | Change of scope of initial recognition exemption and clarifies how entities should account for deferred tax in certain transactions such as: leases and liabilities for disassembly and removal. The impacted paragraphs are: Alteration of items (i) and (ii) of letter b of item 15, letters b and c of item 22 and b of item 24; includes item (iii) of letter b of item 15, item 22A, letter c of item 24, items 98K and 98L and example 8 of Appendix B | These changes had no impact on the individual and consolidated financial statements of the Cosan Group as it is not applicable to the Company. |
Explanatory Notes to the Financial Statement
(In thousands of Reais, except when otherwise indicated)
Applicable standard | Main requirements | Impact |
Amendments to Standard IFRS 17/CPC 50 - Insurance Contracts | The amendment adds a new transition option to IFRS 17 (the ‘classification overlay’) to alleviate operational complexities and one-time accounting mismatches in comparative information between insurance contract liabilities and related financial assets on the initial application of IFRS 17. It allows presentation of comparative information about financial assets to be presented in a manner that is more consistent with IFRS 9 Financial Instruments. | These amendments had no impact on the individual and consolidated financial statements of Grupo Cosan as it is not applicable to the Company. |
Amendment CPC 32 - item 4A referring to the new tax rule Pillar Two In force as of 2023 | Given that in 2023 many countries enacted tax regulation aimed at implementing the rules of global models against erosion of the tax base at the global level (Globe model Rules) members of the project called "Pillar Two" and coordinated by the Organization for Economic Cooperation and Development (OECD), this legislation caused uncertainties in the calculation of deferred tax assets and liabilities in the context of CPC 32 ("Taxes on Profit"). In view of this scenario, the IASB and the AASB proposed changes in IAS 12, which were implemented in Brazil through the publication of CVM Resolution 197, on 12/28/2023, introducing changes in the corresponding Brazilian standard (CPC 32). These changes introduced a mandatory temporary exemption with respect to the recognition and disclosure of deferred tax assets and liabilities related to Pillar Two income taxes (item 4A of CPC 32). CVM Resolution 197/2023 also introduced in CPC 32 obligations to disclose information about the entity’s exposure to Pillar Two taxes, without presenting specific requirements regarding the level of detail and allowing the fulfillment of this obligation with the disclosure of information on the progress of the entity in assessing its exposure. | The Company applied this temporary exemption for the financial statements ending December 31, 2023. Additionally, we assess what is in the scope of tax regulations that have been enacted or substantially enacted in some of the countries in which certain entities consolidated by the group operate. In spite of the fact that the implementation of these regulations is still very recent and that no country applied a concrete minimum global tax requirement in 2023, the Company, considering the points above, carried out a preliminary assessment, supported by expert advice, and concluded that there are no expected significant impacts in relation to the jurisdictions where it operates. However, the Company will continue with the studies and further evaluation of the application of the new rules, for disclosure of any exposure, if any, in the financial statements of the coming quarters. |
Explanatory Notes to the Financial Statement
(In thousands of Reais, except when otherwise indicated)
26.2 NEW STANDARDS AND INTERPRETATIONS NOT YET IN FORCE
The following new standards, interpretations and amendments were issued by CPC and by IASB but are not effective for annual periods started after January 1, 2023. Early adoption is not allowed.
Additionally, based on an initial review, the Company currently believes that the adoption of these following standards/amendments will not significantly affect the consolidated result or financial position of the Company.
Applicable standard | Key requirements or changes in accounting policy |
Amendments to IFRS 16/ CPC 06 (R2) - Leases Effective as of January 1, 2024. | Inclusion of requirements on variable payments for a sale-leaseback that aims to provide guidance on how to account for variable payments to the seller-lessee in a Sales and leaseback transaction. These changes did not have a significant impact on the individual and consolidated financial statements of the Cosan Group, as it is not applicable to the Company. |
Changes to IAS 1/CPC 26 (R1) - Presentation of Financial Statements Effective as of January 1, 2024. | The change in the standard provides further clarification for classification of debt between circulating and non-circulating aimed at the right of an entity to defer settlement should exist on the base date, exclusion of the application for the right to be unconditional and included the application to have substance. It also carried out further clarification for liabilities with covenants that guides only the covenants that must comply to the base date affect the classification of a liability as circulating or non-circulating. For covenants after the base date do not affect the classification of liabilities. For December 2023, the Company did not implement it in advance, however, no significant impacts are expected, since the classification between short and long term is already carried out within the new definitions. As for covenants, the Company constantly monitors and will make any required disclosures, if applicable. |
Amendments to CPC 03/IAS 7 and CPC 40/IFRS 7) - Supplier financing agreements ("Risk Taken")
Effective as of January 1, 2024. | The changes introduce two new disclosure objectives - one in IAS 7 and one in IFRS 7 - for the company to provide information on its supplier financing arrangements that would allow the reader of the statements to assess the effects of those arrangements on liabilities and cash flows of the company. It will also be necessary to disclose the type and effect of non-monetary changes in the book values of financial liabilities that are part of a supplier financing agreement. For December 2023, the Company did not implement it in advance, however, we do not expect significant changes. |
Explanatory Notes to the Financial Statement
(In thousands of Reais, except when otherwise indicated)
Applicable standard | Key requirements or changes in accounting policy |
Changes to IAS 21/ CPC 02 - Effects of Changes in Exchange Rates and Conversion of Financial Statements Effective as of January 1, 2025. | The changes bring greater clarification about an entity being able to perform activities abroad in two ways: (i) carrying out transactions in foreign currency or (ii) owning entities abroad. The purpose of the standard is to determine how to include transactions in foreign currency and how to convert the financial statements of this entity into another currency. For December 2023, the Company did not implement it in advance, but is evaluating all the impacts for adoption of the standard. |
New Accounting Standard - IFRS 18 - Presentation and Disclosure in Financial Statements
Effective from January 1, 2027. | This new standard aims to provide investors with a deeper understanding of companies' financial performance by offering consistent benchmarks for their analyses, enabling better investment decisions. Given that the standard was only published in April 2024, there are no impacts for December 2023. Therefore, the Company has not yet assessed the impacts, but this will be done for future fiscal years, considering that the standard takes effect in 2027. |
| 371 |