Exhibit 99.1

April 28, 2022
Mr. Roger Wurtele
Torchlight Energy Resources, Inc.
5700 W. Plano Parkway #3600
Plano, TX 75093
Dear Mr. Wurtele,
At your request PeTech Enterprises, Inc. (“PEI”) has prepared an estimate of certain hydrocarbon reserves owned by Torchlight Energy Resources, Inc. (“TER”) in the State of Texas as of December 31, 2021. This evaluation was completed by April 28, 2022.
These estimates include only Proved and Producing reserves and were prepared following the United States Securities and Exchange Commission (“SEC”) guidelines rule 4-10 Regulation S-X for evaluating and reporting oil and gas reserves. Rule 4-10 defines reserves as “…those quantities of oil and gas, which by analysis of geoscience and engineering data, can be estimated with reasonable certainty to be economically producible from a given date forward, from known reservoirs, and under existing economic conditions, operating methods, and government regulations before the time at which contracts providing the right to operate expire, unless evidence indicates that renewal is reasonably certain, regardless of whether deterministic or probabilistic methods are used for estimation.……..Reserves which can be produced through the application of improved recovery techniques…..Existing economic conditions include prices and costs at which economic producibility from a reservoir is to be determined. The price shall be the average price during the 12 months before the ending date of the period covered by the report, determined as an unweighted arithmetic average of the first-day-of-the-month price for each month within such period, unless prices are defined by contractual arrangements, excluding escalations based upon future conditions. Undeveloped oil and gas reserves are reserves of any category that are expected to be recovered from new wells on undrilled acreage,
or from existing wells where a relatively major expenditure is required for completion. A complete ruling is available on the SEC website.
Acceptable evaluation geological, engineering, and accounting (cost, taxes, etc.) practice principles were utilized to reach the results of this evaluation. Results were based on historical oil production information, geological maps, logs, and offsetting lease analogs. The evaluation is based on information provided by or through TER. Data such as production rates, lease operating costs, ownership interests, and projections for future activities were relied on to be true. In all cases, PEI has reviewed the data to ensure reasonable values, consistency, and dependability.
OPERATIONS
TEXAS
The Hazel project is located in Sterling and Tom Green counties, TX. The company drilled five wells of which the Flying “B” Ranch #3H and #4H are producing. Production is from the Wolfcamp formation. The properties are operated by Maverick Operating. The company drilled or converted a well to be used for saltwater disposal. The currently operating expenses reflect a substantial reduction from previous years as water is now disposed of on location and electric power is available. Initial gross oil production reached 8,319 bbl per month and 31,613 bbl per month of water. It is anticipated that the well has an ultimate oil recovery of 154 Mbbl. The Flying B well 4H had an initial production rate of 4,200 bbl of oil and has an ultimate oil recovery of 192 Mbbl.
PRODUCTS PRICE
PRODUCTS PRICE The twelve months unweighted average of the first day of the month prices for oil (WTI) was used in calculating the 2021 average price resulting in $63.04 per barrel.
Oil and gas price differentials were calculated from the actual prices realized and were utilized in this evaluation. The average oil and gas prices were held constant throughout the economic life of the leases
OPERATING EXPENSES and CAPITAL COSTS reoccurring lease operating expenses were provided by the company and accepted when they seemed reasonable for the type of operation and area. Lease operating expenses were held constant throughout the life of the reserve.
TAXES
Production and ad valorem taxes were based on the Texas regulatory rates.
Hedge values were not considered in this evaluation.
Note that oil and gas reserves, as well as gross and net revenues, are ESTIMATES that may change as additional production and other technical data become available or due to prices change. All estimates are subject to change due to the inherent uncertainty in the application of judgmental factors as well as the regulatory environment.
PEI did not physically visit the field, PEI accepted as true all ownership interests. PEI has not evaluated any potential environmental liability. PEI does not own an economic interest in any of the company’s assets.
As of December 31, 2021
|
| PROVED DEVELOPED PRODUCING |
| PROVED UNDEVELOPED | ||||||
|
| OIL, Mbbl |
|
| GAS MMcf |
| OIL, Mbbl |
| GAS, MMcf | |
GROSS ULTIMATE RESERVES |
|
| 346.3 |
|
| NA |
| NA |
| NA |
GROSS REMAINING RESERVES |
|
| 253.1 |
|
| NA |
| NA |
| NA |
NET REMAINING RESERVES |
|
| 151.9 |
|
| NA |
| NA |
| NA |
Values of the proved reserves in this report are expressed in terms of ESTIMATED future gross revenue, future net revenue, and present worth using a discount factor of 10%. Future gross revenue is the revenue that will accrue to the appraised interests from the production and sale of the estimated net reserves. Net revenue is the gross revenue less production and ad valorem taxes, operating expenses, and capital costs. Operating expenses include direct field expenses but exclude general administration costs. Federal income tax was not included in this analysis.
AS OF DECEMBER 31, 2021
|
| PROVED | ||||
|
| DEVELOPED |
|
| UNDEVELOPED | |
|
| PRODUCING |
|
|
| |
FUTURE GROSS INCOME, M$ |
|
| 9098.1 |
|
| NA |
PRODUCTION AND ADVALOREM TAX, M$ |
|
| 419.8 |
|
| NA |
OPERATING EXPENSES, M$ |
|
| 4361.8 |
|
| NA |
CAPITAL COST, M$ |
|
| 0 |
|
| NA |
FUTURE NET REVENUE, M$ |
|
| 4316.6 |
|
| NA |
PRESENT VALUE, DISC AT 10%, M$ |
|
| 2896.8 |
|
| NA |
This report is followed by detailed cash flow for each well, followed by production plots. Qualifications of the evaluator are also attached.
Submitted, |
|
|
|
|


Amiel David, Ph.D., P.E. #50970
For PeTech Enterprises, Inc. Registration # F-15360
Date : 04/28/2022 1:04:40 PM | TORCHLIGHT ENERGY, INC Reserve and Economic Projection As of 12/31/2021 Custom Selection | Total |
|
|
|
| ------------ Estimated 8/8 Ths Production ----------- |
|
| ------------ Net Production ----------- |
|
|
|
|
|
|
|
|
|
|
|
|
| ||||||||||||||||||
Year |
| Wells |
| Oil ---- Mbbl ---- |
|
| NGL ---- Mgal ---- |
|
| Gas ----- MMcf----- |
|
| Oil ----- Mbbl ----- |
|
| NGL ----- Mgal ----- |
|
| Gas ----- MMcf ----- |
|
| Oil - $/bbl - |
|
| NGL - $/gal - |
|
| Gas - $/Mcf - |
| |||||||||
2021 |
| 0 |
|
| 0.12 |
|
|
| 0.00 |
|
|
| 0.00 |
|
|
| 0.07 |
|
|
| 0.00 |
|
|
| 0.00 |
|
|
| 59.86 |
|
|
| 0.00 |
|
|
| 0.00 |
|
2022 |
| 2 |
|
| 32.86 |
|
|
| 0.00 |
|
|
| 0.00 |
|
|
| 19.71 |
|
|
| 0.00 |
|
|
| 0.00 |
|
|
| 59.88 |
|
|
| 0.00 |
|
|
| 0.00 |
|
2023 |
| 2 |
|
| 24.05 |
|
|
| 0.00 |
|
|
| 0.00 |
|
|
| 14.43 |
|
|
| 0.00 |
|
|
| 0.00 |
|
|
| 59.89 |
|
|
| 0.00 |
|
|
| 0.00 |
|
2024 |
| 2 |
|
| 19.94 |
|
|
| 0.00 |
|
|
| 0.00 |
|
|
| 11.97 |
|
|
| 0.00 |
|
|
| 0.00 |
|
|
| 59.89 |
|
|
| 0.00 |
|
|
| 0.00 |
|
2025 |
| 2 |
|
| 17.35 |
|
|
| 0.00 |
|
|
| 0.00 |
|
|
| 10.41 |
|
|
| 0.00 |
|
|
| 0.00 |
|
|
| 59.89 |
|
|
| 0.00 |
|
|
| 0.00 |
|
2026 |
| 2 |
|
| 15.59 |
|
|
| 0.00 |
|
|
| 0.00 |
|
|
| 9.35 |
|
|
| 0.00 |
|
|
| 0.00 |
|
|
| 59.89 |
|
|
| 0.00 |
|
|
| 0.00 |
|
2027 |
| 2 |
|
| 14.27 |
|
|
| 0.00 |
|
|
| 0.00 |
|
|
| 8.56 |
|
|
| 0.00 |
|
|
| 0.00 |
|
|
| 59.89 |
|
|
| 0.00 |
|
|
| 0.00 |
|
2028 |
| 2 |
|
| 13.28 |
|
|
| 0.00 |
|
|
| 0.00 |
|
|
| 7.97 |
|
|
| 0.00 |
|
|
| 0.00 |
|
|
| 59.89 |
|
|
| 0.00 |
|
|
| 0.00 |
|
2029 |
| 2 |
|
| 12.41 |
|
|
| 0.00 |
|
|
| 0.00 |
|
|
| 7.45 |
|
|
| 0.00 |
|
|
| 0.00 |
|
|
| 59.89 |
|
|
| 0.00 |
|
|
| 0.00 |
|
2030 |
| 2 |
|
| 11.72 |
|
|
| 0.00 |
|
|
| 0.00 |
|
|
| 7.03 |
|
|
| 0.00 |
|
|
| 0.00 |
|
|
| 59.89 |
|
|
| 0.00 |
|
|
| 0.00 |
|
2031 |
| 2 |
|
| 11.12 |
|
|
| 0.00 |
|
|
| 0.00 |
|
|
| 6.67 |
|
|
| 0.00 |
|
|
| 0.00 |
|
|
| 59.89 |
|
|
| 0.00 |
|
|
| 0.00 |
|
2032 |
| 2 |
|
| 10.59 |
|
|
| 0.00 |
|
|
| 0.00 |
|
|
| 6.36 |
|
|
| 0.00 |
|
|
| 0.00 |
|
|
| 59.89 |
|
|
| 0.00 |
|
|
| 0.00 |
|
2033 |
| 2 |
|
| 10.04 |
|
|
| 0.00 |
|
|
| 0.00 |
|
|
| 6.02 |
|
|
| 0.00 |
|
|
| 0.00 |
|
|
| 59.89 |
|
|
| 0.00 |
|
|
| 0.00 |
|
2034 |
| 2 |
|
| 9.53 |
|
|
| 0.00 |
|
|
| 0.00 |
|
|
| 5.72 |
|
|
| 0.00 |
|
|
| 0.00 |
|
|
| 59.89 |
|
|
| 0.00 |
|
|
| 0.00 |
|
2035 |
| 2 |
|
| 9.06 |
|
|
| 0.00 |
|
|
| 0.00 |
|
|
| 5.43 |
|
|
| 0.00 |
|
|
| 0.00 |
|
|
| 59.89 |
|
|
| 0.00 |
|
|
| 0.00 |
|
Sub-T |
|
|
|
| 211.93 |
|
|
| 0.00 |
|
|
| 0.00 |
|
|
| 127.16 |
|
|
| 0.00 |
|
|
| 0.00 |
|
|
| 59.89 |
|
|
| 0.00 |
|
|
| 0.00 |
|
After |
|
|
|
| 41.17 |
|
|
| 0.00 |
|
|
| 0.00 |
|
|
| 24.70 |
|
|
| 0.00 |
|
|
| 0.00 |
|
|
| 60.03 |
|
|
| 0.00 |
|
|
| 0.00 |
|
Total |
|
|
|
| 253.10 |
|
|
| 0.00 |
|
|
| 0.00 |
|
|
| 151.86 |
|
|
| 0.00 |
|
|
| 0.00 |
|
|
| 59.91 |
|
|
| 0.00 |
|
|
| 0.00 |
|
Cum. |
|
|
|
| 93.25 |
|
|
| 0.00 |
|
|
| 0.00 |
|
|
|
|
|
|
|
|
|
|
|
|
|
|
|
|
|
|
|
|
|
|
|
|
|
Ult. |
|
|
|
| 346.34 |
|
|
| 0.00 |
|
|
| 0.00 |
|
|
|
|
|
|
|
|
|
|
|
|
|
|
|
|
|
|
|
|
|
|
|
|
|
|
| ----------------------------------- Company Future Gross Revenue ---------------------------------- |
|
| ------- Prod & Adv Taxes ------- |
|
| ----- Revenue ---- |
| |||||||||||||||||||||||
Year |
| Oil |
|
| NGL |
|
| Gas |
|
| Other |
|
| Total |
|
| Prod Tax |
|
| Adv Tax |
|
| after Sev & Adv |
| ||||||||
|
| ------ M$ ------ |
|
| ------ M$ ------ |
|
| ------ M$ ------ |
|
| ------ M$ ------ |
|
| ------ M$ ------ |
|
| ------ M$ ------ |
|
| ------ M$ ------ |
|
| ------ M$ ------ |
| ||||||||
2021 |
|
| 4.41 |
|
|
| 0.00 |
|
|
| 0.00 |
|
|
| 0.00 |
|
|
| 4.41 |
|
|
| 0.20 |
|
|
| 0.00 |
|
|
| 4.20 |
|
2022 |
|
| 1,180.49 |
|
|
| 0.00 |
|
|
| 0.00 |
|
|
| 0.00 |
|
|
| 1,180.49 |
|
|
| 54.46 |
|
|
| 0.00 |
|
|
| 1,126.02 |
|
2023 |
|
| 864.20 |
|
|
| 0.00 |
|
|
| 0.00 |
|
|
| 0.00 |
|
|
| 864.20 |
|
|
| 39.87 |
|
|
| 0.00 |
|
|
| 824.33 |
|
2024 |
|
| 716.60 |
|
|
| 0.00 |
|
|
| 0.00 |
|
|
| 0.00 |
|
|
| 716.60 |
|
|
| 33.06 |
|
|
| 0.00 |
|
|
| 683.54 |
|
2025 |
|
| 623.30 |
|
|
| 0.00 |
|
|
| 0.00 |
|
|
| 0.00 |
|
|
| 623.30 |
|
|
| 28.76 |
|
|
| 0.00 |
|
|
| 594.55 |
|
2026 |
|
| 560.10 |
|
|
| 0.00 |
|
|
| 0.00 |
|
|
| 0.00 |
|
|
| 560.10 |
|
|
| 25.84 |
|
|
| 0.00 |
|
|
| 534.26 |
|
2027 |
|
| 512.94 |
|
|
| 0.00 |
|
|
| 0.00 |
|
|
| 0.00 |
|
|
| 512.94 |
|
|
| 23.66 |
|
|
| 0.00 |
|
|
| 489.28 |
|
2028 |
|
| 477.27 |
|
|
| 0.00 |
|
|
| 0.00 |
|
|
| 0.00 |
|
|
| 477.27 |
|
|
| 22.02 |
|
|
| 0.00 |
|
|
| 455.25 |
|
2029 |
|
| 445.99 |
|
|
| 0.00 |
|
|
| 0.00 |
|
|
| 0.00 |
|
|
| 445.99 |
|
|
| 20.58 |
|
|
| 0.00 |
|
|
| 425.42 |
|
2030 |
|
| 421.09 |
|
|
| 0.00 |
|
|
| 0.00 |
|
|
| 0.00 |
|
|
| 421.09 |
|
|
| 19.43 |
|
|
| 0.00 |
|
|
| 401.66 |
|
2031 |
|
| 399.63 |
|
|
| 0.00 |
|
|
| 0.00 |
|
|
| 0.00 |
|
|
| 399.63 |
|
|
| 18.44 |
|
|
| 0.00 |
|
|
| 381.19 |
|
2032 |
|
| 380.67 |
|
|
| 0.00 |
|
|
| 0.00 |
|
|
| 0.00 |
|
|
| 380.67 |
|
|
| 17.56 |
|
|
| 0.00 |
|
|
| 363.11 |
|
2033 |
|
| 360.64 |
|
|
| 0.00 |
|
|
| 0.00 |
|
|
| 0.00 |
|
|
| 360.64 |
|
|
| 16.64 |
|
|
| 0.00 |
|
|
| 344.00 |
|
2034 |
|
| 342.62 |
|
|
| 0.00 |
|
|
| 0.00 |
|
|
| 0.00 |
|
|
| 342.62 |
|
|
| 15.81 |
|
|
| 0.00 |
|
|
| 326.81 |
|
2035 |
|
| 325.50 |
|
|
| 0.00 |
|
|
| 0.00 |
|
|
| 0.00 |
|
|
| 325.50 |
|
|
| 15.02 |
|
|
| 0.00 |
|
|
| 310.48 |
|
Sub-T |
|
| 7,615.45 |
|
|
| 0.00 |
|
|
| 0.00 |
|
|
| 0.00 |
|
|
| 7,615.45 |
|
|
| 351.34 |
|
|
| 0.00 |
|
|
| 7,264.10 |
|
After |
|
| 1,482.69 |
|
|
| 0.00 |
|
|
| 0.00 |
|
|
| 0.00 |
|
|
| 1,482.69 |
|
|
| 68.40 |
|
|
| 0.00 |
|
|
| 1,414.28 |
|
Total |
|
| 9,098.13 |
|
|
| 0.00 |
|
|
| 0.00 |
|
|
| 0.00 |
|
|
| 9,098.13 |
|
|
| 419.75 |
|
|
| 0.00 |
|
|
| 8,678.39 |
|
|
| ----------------------------------- Deductions ---------------------------------- |
|
| -------------------- Future Net Income Before Income Taxes ------------------- |
| ||||||||||||||||||||||||||
|
| Lease |
|
| Net |
|
| Trans. |
|
| Net |
|
| Undiscounted |
|
| Discounted Ann |
|
| Disc. Cum. |
| |||||||||||
Year |
| Net Costs |
|
| Investments |
|
| Costs |
|
| Profits |
|
| Annual |
|
| Cumulative |
|
| @ 10.00% |
|
| Annual @ 10.00% |
| ||||||||
|
| ------ M$ ------ |
|
| ------ M$ ------ |
|
| ------ M$ ------ |
|
| ------ M$ ------ |
|
| ------ M$ ------ |
|
| ------ M$ ------ |
|
| ------ M$ ------ |
|
| ------ M$ ------ |
| ||||||||
2021 |
|
| 0.62 |
|
|
| 0.00 |
|
|
| 0.00 |
|
|
| 0.00 |
|
|
| 3.58 |
|
|
| 3.58 |
|
|
| 3.58 |
|
|
| 3.58 |
|
2022 |
|
| 230.40 |
|
|
| 0.00 |
|
|
| 0.00 |
|
|
| 0.00 |
|
|
| 895.62 |
|
|
| 889.21 |
|
|
| 857.36 |
|
|
| 860.94 |
|
2023 |
|
| 230.40 |
|
|
| 0.00 |
|
|
| 0.00 |
|
|
| 0.00 |
|
|
| 593.93 |
|
|
| 1,493.14 |
|
|
| 516.13 |
|
|
| 1,377.07 |
|
2024 |
|
| 230.40 |
|
|
| 0.00 |
|
|
| 0.00 |
|
|
| 0.00 |
|
|
| 453.14 |
|
|
| 1,946.28 |
|
|
| 357.74 |
|
|
| 1,734.82 |
|
2025 |
|
| 230.40 |
|
|
| 0.00 |
|
|
| 0.00 |
|
|
| 0.00 |
|
|
| 364.15 |
|
|
| 2,310.43 |
|
|
| 261.22 |
|
|
| 1,996.04 |
|
2026 |
|
| 230.40 |
|
|
| 0.00 |
|
|
| 0.00 |
|
|
| 0.00 |
|
|
| 303.86 |
|
|
| 2,614.28 |
|
|
| 198.13 |
|
|
| 2,194.16 |
|
2027 |
|
| 230.40 |
|
|
| 0.00 |
|
|
| 0.00 |
|
|
| 0.00 |
|
|
| 258.88 |
|
|
| 2,873.16 |
|
|
| 153.44 |
|
|
| 2,347.60 |
|
2028 |
|
| 230.40 |
|
|
| 0.00 |
|
|
| 0.00 |
|
|
| 0.00 |
|
|
| 224.85 |
|
|
| 3,098.01 |
|
|
| 121.14 |
|
|
| 2,468.75 |
|
2029 |
|
| 230.40 |
|
|
| 0.00 |
|
|
| 0.00 |
|
|
| 0.00 |
|
|
| 195.02 |
|
|
| 3,293.03 |
|
|
| 95.49 |
|
|
| 2,564.24 |
|
2030 |
|
| 230.40 |
|
|
| 0.00 |
|
|
| 0.00 |
|
|
| 0.00 |
|
|
| 171.26 |
|
|
| 3,464.29 |
|
|
| 76.24 |
|
|
| 2,640.48 |
|
2031 |
|
| 230.40 |
|
|
| 0.00 |
|
|
| 0.00 |
|
|
| 0.00 |
|
|
| 150.79 |
|
|
| 3,615.08 |
|
|
| 61.02 |
|
|
| 2,701.50 |
|
2032 |
|
| 230.40 |
|
|
| 0.00 |
|
|
| 0.00 |
|
|
| 0.00 |
|
|
| 132.71 |
|
|
| 3,747.79 |
|
|
| 48.83 |
|
|
| 2,750.33 |
|
2033 |
|
| 230.40 |
|
|
| 0.00 |
|
|
| 0.00 |
|
|
| 0.00 |
|
|
| 113.60 |
|
|
| 3,861.39 |
|
|
| 37.99 |
|
|
| 2,788.33 |
|
2034 |
|
| 230.40 |
|
|
| 0.00 |
|
|
| 0.00 |
|
|
| 0.00 |
|
|
| 96.41 |
|
|
| 3,957.80 |
|
|
| 29.32 |
|
|
| 2,817.64 |
|
2035 |
|
| 230.40 |
|
|
| 0.00 |
|
|
| 0.00 |
|
|
| 0.00 |
|
|
| 80.08 |
|
|
| 4,037.88 |
|
|
| 22.14 |
|
|
| 2,839.79 |
|
Sub-T |
|
| 3,226.22 |
|
|
| 0.00 |
|
|
| 0.00 |
|
|
| 0.00 |
|
|
| 4,037.88 |
|
|
| 4,037.88 |
|
|
| 2,839.79 |
|
|
| 2,839.79 |
|
After |
|
| 1,135.59 |
|
|
| 0.00 |
|
|
| 0.00 |
|
|
| 0.00 |
|
|
| 278.69 |
|
|
| 278.69 |
|
|
| 57.02 |
|
|
| 57.02 |
|
Total |
|
| 4,361.81 |
|
|
| 0.00 |
|
|
| 0.00 |
|
|
| 0.00 |
|
|
| 4,316.58 |
|
|
| 4,316.58 |
|
|
| 2,896.81 |
|
|
| 2,896.81 |
|
Eco. Indicators |
|
|
|
|
|
|
|
|
|
|
|
|
|
|
|
| Present Worth Profile (M$) |
| |||
Return on Investment (disc) : |
| 0.000 |
|
|
| PW | 5.00% : |
| 3,451.35 |
|
Return on Investment (undisc) : |
| 0.000 |
|
|
| PW | 8.00% : |
| 3,092.24 |
|
Years to Payout : |
| 0.00 |
|
|
| PW | 9.00% : |
| 2,990.77 |
|
Internal Rate of Return (%): |
| 0.00 |
|
|
| PW | 12.00% : |
| 2,728.45 |
|
|
|
|
|
|
| PW | 15.00% : |
| 2,515.83 |
|
|
|
|
|
|
| PW | 20.00% : |
| 2,239.27 |
|
TRC Eco Detailed2.rpt | 4 |
|
Date : 04/28/2022 1:04:40 PM FLYING 'B' RANCH 3H - 3H GARDEN CITY, S. Field, STERLING (TX) Co., TX Operator : MAVERICK OPERATING, LLC Reservoir : WOLFCAMP | TORCHLIGHT ENERGY, INC Reserve and Economic Projection As of 12/31/2021 Custom Selection |
Proved Producing |
|
|
|
| ----------- Estimated 8/8 Ths Production ----------- |
|
| ---------------------- Net Production ---------------------- |
|
|
|
|
|
|
|
|
|
|
|
|
| ||||||||||||||||||
Year |
| Wells |
| Oil ---- Mbbl ---- |
|
| NGL ---- Mgal ---- |
|
| Gas ----- MMcf----- |
|
| Oil ----- Mbbl ----- |
|
| NGL ----- Mgal ----- |
|
| Gas ----- MMcf ----- |
|
| Oil - $/bbl - |
|
| NGL - $/gal - |
|
| Gas - $/Mcf - |
| |||||||||
2021 |
| 0 |
|
| 0.06 |
|
|
| 0.00 |
|
|
| 0.00 |
|
|
| 0.03 |
|
|
| 0.00 |
|
|
| 0.00 |
|
|
| 59.64 |
|
|
| 0.00 |
|
|
| 0.00 |
|
2022 |
| 1 |
|
| 13.86 |
|
|
| 0.00 |
|
|
| 0.00 |
|
|
| 8.32 |
|
|
| 0.00 |
|
|
| 0.00 |
|
|
| 59.64 |
|
|
| 0.00 |
|
|
| 0.00 |
|
2023 |
| 1 |
|
| 9.90 |
|
|
| 0.00 |
|
|
| 0.00 |
|
|
| 5.94 |
|
|
| 0.00 |
|
|
| 0.00 |
|
|
| 59.64 |
|
|
| 0.00 |
|
|
| 0.00 |
|
2024 |
| 1 |
|
| 8.11 |
|
|
| 0.00 |
|
|
| 0.00 |
|
|
| 4.87 |
|
|
| 0.00 |
|
|
| 0.00 |
|
|
| 59.64 |
|
|
| 0.00 |
|
|
| 0.00 |
|
2025 |
| 1 |
|
| 7.02 |
|
|
| 0.00 |
|
|
| 0.00 |
|
|
| 4.21 |
|
|
| 0.00 |
|
|
| 0.00 |
|
|
| 59.64 |
|
|
| 0.00 |
|
|
| 0.00 |
|
2026 |
| 1 |
|
| 6.28 |
|
|
| 0.00 |
|
|
| 0.00 |
|
|
| 3.77 |
|
|
| 0.00 |
|
|
| 0.00 |
|
|
| 59.64 |
|
|
| 0.00 |
|
|
| 0.00 |
|
2027 |
| 1 |
|
| 5.74 |
|
|
| 0.00 |
|
|
| 0.00 |
|
|
| 3.44 |
|
|
| 0.00 |
|
|
| 0.00 |
|
|
| 59.64 |
|
|
| 0.00 |
|
|
| 0.00 |
|
2028 |
| 1 |
|
| 5.33 |
|
|
| 0.00 |
|
|
| 0.00 |
|
|
| 3.20 |
|
|
| 0.00 |
|
|
| 0.00 |
|
|
| 59.64 |
|
|
| 0.00 |
|
|
| 0.00 |
|
2029 |
| 1 |
|
| 4.97 |
|
|
| 0.00 |
|
|
| 0.00 |
|
|
| 2.98 |
|
|
| 0.00 |
|
|
| 0.00 |
|
|
| 59.64 |
|
|
| 0.00 |
|
|
| 0.00 |
|
2030 |
| 1 |
|
| 4.69 |
|
|
| 0.00 |
|
|
| 0.00 |
|
|
| 2.82 |
|
|
| 0.00 |
|
|
| 0.00 |
|
|
| 59.64 |
|
|
| 0.00 |
|
|
| 0.00 |
|
2031 |
| 1 |
|
| 4.45 |
|
|
| 0.00 |
|
|
| 0.00 |
|
|
| 2.67 |
|
|
| 0.00 |
|
|
| 0.00 |
|
|
| 59.64 |
|
|
| 0.00 |
|
|
| 0.00 |
|
2032 |
| 1 |
|
| 4.24 |
|
|
| 0.00 |
|
|
| 0.00 |
|
|
| 2.54 |
|
|
| 0.00 |
|
|
| 0.00 |
|
|
| 59.64 |
|
|
| 0.00 |
|
|
| 0.00 |
|
2033 |
| 1 |
|
| 4.02 |
|
|
| 0.00 |
|
|
| 0.00 |
|
|
| 2.41 |
|
|
| 0.00 |
|
|
| 0.00 |
|
|
| 59.64 |
|
|
| 0.00 |
|
|
| 0.00 |
|
2034 |
| 1 |
|
| 3.82 |
|
|
| 0.00 |
|
|
| 0.00 |
|
|
| 2.29 |
|
|
| 0.00 |
|
|
| 0.00 |
|
|
| 59.64 |
|
|
| 0.00 |
|
|
| 0.00 |
|
2035 |
| 1 |
|
| 3.63 |
|
|
| 0.00 |
|
|
| 0.00 |
|
|
| 2.18 |
|
|
| 0.00 |
|
|
| 0.00 |
|
|
| 59.64 |
|
|
| 0.00 |
|
|
| 0.00 |
|
Sub-T |
|
|
|
| 86.11 |
|
|
| 0.00 |
|
|
| 0.00 |
|
|
| 51.67 |
|
|
| 0.00 |
|
|
| 0.00 |
|
|
| 59.64 |
|
|
| 0.00 |
|
|
| 0.00 |
|
After |
|
|
|
| 3.17 |
|
|
| 0.00 |
|
|
| 0.00 |
|
|
| 1.90 |
|
|
| 0.00 |
|
|
| 0.00 |
|
|
| 59.64 |
|
|
| 0.00 |
|
|
| 0.00 |
|
Total |
|
|
|
| 89.28 |
|
|
| 0.00 |
|
|
| 0.00 |
|
|
| 53.57 |
|
|
| 0.00 |
|
|
| 0.00 |
|
|
| 59.64 |
|
|
| 0.00 |
|
|
| 0.00 |
|
Cum. |
|
|
|
| 64.89 |
|
|
| 0.00 |
|
|
| 0.00 |
|
|
|
|
|
|
|
|
|
|
|
|
|
|
|
|
|
|
|
|
|
|
|
|
|
Ult. |
|
|
|
| 154.17 |
|
|
| 0.00 |
|
|
| 0.00 |
|
|
|
|
|
|
|
|
|
|
|
|
|
|
|
|
|
|
|
|
|
|
|
|
|
|
| ----------------------------------- Company Future Gross Revenue ---------------------------------- |
|
| ------- Prod & Adv Taxes ------- |
|
| ----- Revenue ---- |
| |||||||||||||||||||||||
Year |
| Oil |
|
| NGL |
|
| Gas |
|
| Other |
|
| Total |
|
| Prod Tax |
|
| Adv Tax |
|
| after Sev & Adv |
| ||||||||
|
| ------ M$ ------ |
|
| ------ M$ ------ |
|
| ------ M$ ------ |
|
| ------ M$ ------ |
|
| ------ M$ ------ |
|
| ------ M$ ------ |
|
| ------ M$ ------ |
|
| ------ M$ ------ |
| ||||||||
2021 |
|
| 2.07 |
|
|
| 0.00 |
|
|
| 0.00 |
|
|
| 0.00 |
|
|
| 2.07 |
|
|
| 0.10 |
|
|
| 0.00 |
|
|
| 1.98 |
|
2022 |
|
| 496.05 |
|
|
| 0.00 |
|
|
| 0.00 |
|
|
| 0.00 |
|
|
| 496.05 |
|
|
| 22.89 |
|
|
| 0.00 |
|
|
| 473.16 |
|
2023 |
|
| 354.17 |
|
|
| 0.00 |
|
|
| 0.00 |
|
|
| 0.00 |
|
|
| 354.17 |
|
|
| 16.34 |
|
|
| 0.00 |
|
|
| 337.83 |
|
2024 |
|
| 290.32 |
|
|
| 0.00 |
|
|
| 0.00 |
|
|
| 0.00 |
|
|
| 290.32 |
|
|
| 13.39 |
|
|
| 0.00 |
|
|
| 276.93 |
|
2025 |
|
| 251.04 |
|
|
| 0.00 |
|
|
| 0.00 |
|
|
| 0.00 |
|
|
| 251.04 |
|
|
| 11.58 |
|
|
| 0.00 |
|
|
| 239.46 |
|
2026 |
|
| 224.78 |
|
|
| 0.00 |
|
|
| 0.00 |
|
|
| 0.00 |
|
|
| 224.78 |
|
|
| 10.37 |
|
|
| 0.00 |
|
|
| 214.41 |
|
2027 |
|
| 205.36 |
|
|
| 0.00 |
|
|
| 0.00 |
|
|
| 0.00 |
|
|
| 205.36 |
|
|
| 9.47 |
|
|
| 0.00 |
|
|
| 195.89 |
|
2028 |
|
| 190.75 |
|
|
| 0.00 |
|
|
| 0.00 |
|
|
| 0.00 |
|
|
| 190.75 |
|
|
| 8.80 |
|
|
| 0.00 |
|
|
| 181.95 |
|
2029 |
|
| 178.01 |
|
|
| 0.00 |
|
|
| 0.00 |
|
|
| 0.00 |
|
|
| 178.01 |
|
|
| 8.21 |
|
|
| 0.00 |
|
|
| 169.80 |
|
2030 |
|
| 167.90 |
|
|
| 0.00 |
|
|
| 0.00 |
|
|
| 0.00 |
|
|
| 167.90 |
|
|
| 7.75 |
|
|
| 0.00 |
|
|
| 160.15 |
|
2031 |
|
| 159.26 |
|
|
| 0.00 |
|
|
| 0.00 |
|
|
| 0.00 |
|
|
| 159.26 |
|
|
| 7.35 |
|
|
| 0.00 |
|
|
| 151.92 |
|
2032 |
|
| 151.71 |
|
|
| 0.00 |
|
|
| 0.00 |
|
|
| 0.00 |
|
|
| 151.71 |
|
|
| 7.00 |
|
|
| 0.00 |
|
|
| 144.71 |
|
2033 |
|
| 143.73 |
|
|
| 0.00 |
|
|
| 0.00 |
|
|
| 0.00 |
|
|
| 143.73 |
|
|
| 6.63 |
|
|
| 0.00 |
|
|
| 137.09 |
|
2034 |
|
| 136.54 |
|
|
| 0.00 |
|
|
| 0.00 |
|
|
| 0.00 |
|
|
| 136.54 |
|
|
| 6.30 |
|
|
| 0.00 |
|
|
| 130.24 |
|
2035 |
|
| 129.72 |
|
|
| 0.00 |
|
|
| 0.00 |
|
|
| 0.00 |
|
|
| 129.72 |
|
|
| 5.98 |
|
|
| 0.00 |
|
|
| 123.74 |
|
Sub-T |
|
| 3,081.42 |
|
|
| 0.00 |
|
|
| 0.00 |
|
|
| 0.00 |
|
|
| 3,081.42 |
|
|
| 142.17 |
|
|
| 0.00 |
|
|
| 2,939.25 |
|
After |
|
| 113.35 |
|
|
| 0.00 |
|
|
| 0.00 |
|
|
| 0.00 |
|
|
| 113.35 |
|
|
| 5.23 |
|
|
| 0.00 |
|
|
| 108.12 |
|
Total |
|
| 3,194.77 |
|
|
| 0.00 |
|
|
| 0.00 |
|
|
| 0.00 |
|
|
| 3,194.77 |
|
|
| 147.39 |
|
|
| 0.00 |
|
|
| 3,047.37 |
|
|
| ----------------------------------- Deductions ---------------------------------- |
|
| -------------------- Future Net Income Before Income Taxes ------------------- |
| ||||||||||||||||||||||||||
|
| Lease |
|
| Net |
|
| Trans. |
|
| Net |
|
| Undiscounted |
|
| Discounted Ann |
|
| Disc. Cum. |
| |||||||||||
Year |
| Net Costs |
|
| Investments |
|
| Costs |
|
| Profits |
|
| Annual |
|
| Cumulative |
|
| @ 10.00% |
|
| Annual @ 10.00% |
| ||||||||
|
| ------ M$ ------ |
|
| ------ M$ ------ |
|
| ------ M$ ------ |
|
| ------ M$ ------ |
|
| ------ M$ ------ |
|
| ------ M$ ------ |
|
| ------ M$ ------ |
|
| ------ M$ ------ |
| ||||||||
2021 |
|
| 0.31 |
|
|
| 0.00 |
|
|
| 0.00 |
|
|
| 0.00 |
|
|
| 1.67 |
|
|
| 1.67 |
|
|
| 1.67 |
|
|
| 1.67 |
|
2022 |
|
| 115.20 |
|
|
| 0.00 |
|
|
| 0.00 |
|
|
| 0.00 |
|
|
| 357.96 |
|
|
| 359.63 |
|
|
| 342.78 |
|
|
| 344.45 |
|
2023 |
|
| 115.20 |
|
|
| 0.00 |
|
|
| 0.00 |
|
|
| 0.00 |
|
|
| 222.63 |
|
|
| 582.26 |
|
|
| 193.54 |
|
|
| 537.99 |
|
2024 |
|
| 115.20 |
|
|
| 0.00 |
|
|
| 0.00 |
|
|
| 0.00 |
|
|
| 161.73 |
|
|
| 743.99 |
|
|
| 127.72 |
|
|
| 665.72 |
|
2025 |
|
| 115.20 |
|
|
| 0.00 |
|
|
| 0.00 |
|
|
| 0.00 |
|
|
| 124.26 |
|
|
| 868.25 |
|
|
| 89.16 |
|
|
| 754.88 |
|
2026 |
|
| 115.20 |
|
|
| 0.00 |
|
|
| 0.00 |
|
|
| 0.00 |
|
|
| 99.21 |
|
|
| 967.46 |
|
|
| 64.71 |
|
|
| 819.59 |
|
2027 |
|
| 115.20 |
|
|
| 0.00 |
|
|
| 0.00 |
|
|
| 0.00 |
|
|
| 80.69 |
|
|
| 1,048.14 |
|
|
| 47.84 |
|
|
| 867.42 |
|
2028 |
|
| 115.20 |
|
|
| 0.00 |
|
|
| 0.00 |
|
|
| 0.00 |
|
|
| 66.75 |
|
|
| 1,114.89 |
|
|
| 35.97 |
|
|
| 903.40 |
|
2029 |
|
| 115.20 |
|
|
| 0.00 |
|
|
| 0.00 |
|
|
| 0.00 |
|
|
| 54.60 |
|
|
| 1,169.49 |
|
|
| 26.74 |
|
|
| 930.14 |
|
2030 |
|
| 115.20 |
|
|
| 0.00 |
|
|
| 0.00 |
|
|
| 0.00 |
|
|
| 44.95 |
|
|
| 1,214.44 |
|
|
| 20.02 |
|
|
| 950.15 |
|
2031 |
|
| 115.20 |
|
|
| 0.00 |
|
|
| 0.00 |
|
|
| 0.00 |
|
|
| 36.72 |
|
|
| 1,251.16 |
|
|
| 14.86 |
|
|
| 965.02 |
|
2032 |
|
| 115.20 |
|
|
| 0.00 |
|
|
| 0.00 |
|
|
| 0.00 |
|
|
| 29.51 |
|
|
| 1,280.67 |
|
|
| 10.87 |
|
|
| 975.88 |
|
2033 |
|
| 115.20 |
|
|
| 0.00 |
|
|
| 0.00 |
|
|
| 0.00 |
|
|
| 21.89 |
|
|
| 1,302.56 |
|
|
| 7.33 |
|
|
| 983.21 |
|
2034 |
|
| 115.20 |
|
|
| 0.00 |
|
|
| 0.00 |
|
|
| 0.00 |
|
|
| 15.04 |
|
|
| 1,317.61 |
|
|
| 4.58 |
|
|
| 987.79 |
|
2035 |
|
| 115.20 |
|
|
| 0.00 |
|
|
| 0.00 |
|
|
| 0.00 |
|
|
| 8.54 |
|
|
| 1,326.15 |
|
|
| 2.37 |
|
|
| 990.16 |
|
Sub-T |
|
| 1,613.11 |
|
|
| 0.00 |
|
|
| 0.00 |
|
|
| 0.00 |
|
|
| 1,326.15 |
|
|
| 1,326.15 |
|
|
| 990.16 |
|
|
| 990.16 |
|
After |
|
| 105.60 |
|
|
| 0.00 |
|
|
| 0.00 |
|
|
| 0.00 |
|
|
| 2.52 |
|
|
| 2.52 |
|
|
| 0.64 |
|
|
| 0.64 |
|
Total |
|
| 1,718.71 |
|
|
| 0.00 |
|
|
| 0.00 |
|
|
| 0.00 |
|
|
| 1,328.66 |
|
|
| 1,328.66 |
|
|
| 990.80 |
|
|
| 990.80 |
|
Eco. Indicators |
|
|
|
|
|
|
| Ownership Interests |
|
| Present Worth Profile (M$) |
| |||||||||||||
Return on Investment (disc) : |
|
| 0.000 |
|
|
|
| Initial |
|
| 1st Rev. |
|
| 2nd Rev. |
|
| PW | 5.00% : |
|
| 1,131.93 |
| |||
Return on Investment (undisc) : |
|
| 0.000 |
|
| W.I. : |
|
| 0.80000000 |
|
|
| 0.00000000 |
|
|
| 0.00000000 |
|
| PW | 8.00% : |
|
| 1,042.08 |
|
Years to Payout : |
|
| 0.00 |
|
| Net R. I. : |
|
| 0.60000000 |
|
|
| 0.00000000 |
|
|
| 0.00000000 |
|
| PW | 9.00% : |
|
| 1,015.67 |
|
Internal Rate of Return (%): |
|
| 0.00 |
|
| Rev. Date : |
|
|
|
|
|
|
|
|
|
|
|
|
| PW | 12.00% : |
|
| 945.17 |
|
|
|
|
|
|
|
|
|
|
|
|
|
|
|
|
|
|
|
|
| PW | 15.00% : |
|
| 885.50 |
|
|
|
|
|
|
|
|
|
|
|
|
|
|
|
|
|
|
|
|
| PW | 20.00% : |
|
| 804.29 |
|
TRC Eco Detailed2.rpt | 5 |
|
Date : 04/28/2022 1:04:40 PM FLYING 'B' RANCH 4H - 4 H GARDEN CITY, S. Field, TOM GREEN Co., TX Operator : Reservoir : WOLFCAMP | TORCHLIGHT ENERGY, INC Reserve and Economic Projection As of 12/31/2021 Custom Selection |
Proved Producing |
|
|
|
| ------------ Estimated 8/8 Ths Production ----------- |
|
| ------------ Net Production ----------- |
|
|
|
|
|
|
|
|
|
|
|
|
| ||||||||||||||||||
Year |
| Wells |
| Oil ---- Mbbl ----- |
|
| NGL ---- Mgal ---- |
|
| Gas ----- MMcf----- |
|
| Oil ----- Mbbl ----- |
|
| NGL ----- Mgal ----- |
|
| Gas ----- MMcf ----- |
|
| Oil - $/bbl - |
|
| NGL - $/gal - |
|
| Gas - $/Mcf - |
| |||||||||
2021 |
| 0 |
|
| 0.06 |
|
|
| 0.00 |
|
|
| 0.00 |
|
|
| 0.04 |
|
|
| 0.00 |
|
|
| 0.00 |
|
|
| 60.06 |
|
|
| 0.00 |
|
|
| 0.00 |
|
2022 |
| 1 |
|
| 18.99 |
|
|
| 0.00 |
|
|
| 0.00 |
|
|
| 11.40 |
|
|
| 0.00 |
|
|
| 0.00 |
|
|
| 60.06 |
|
|
| 0.00 |
|
|
| 0.00 |
|
2023 |
| 1 |
|
| 14.15 |
|
|
| 0.00 |
|
|
| 0.00 |
|
|
| 8.49 |
|
|
| 0.00 |
|
|
| 0.00 |
|
|
| 60.06 |
|
|
| 0.00 |
|
|
| 0.00 |
|
2024 |
| 1 |
|
| 11.83 |
|
|
| 0.00 |
|
|
| 0.00 |
|
|
| 7.10 |
|
|
| 0.00 |
|
|
| 0.00 |
|
|
| 60.06 |
|
|
| 0.00 |
|
|
| 0.00 |
|
2025 |
| 1 |
|
| 10.33 |
|
|
| 0.00 |
|
|
| 0.00 |
|
|
| 6.20 |
|
|
| 0.00 |
|
|
| 0.00 |
|
|
| 60.06 |
|
|
| 0.00 |
|
|
| 0.00 |
|
2026 |
| 1 |
|
| 9.31 |
|
|
| 0.00 |
|
|
| 0.00 |
|
|
| 5.58 |
|
|
| 0.00 |
|
|
| 0.00 |
|
|
| 60.06 |
|
|
| 0.00 |
|
|
| 0.00 |
|
2027 |
| 1 |
|
| 8.54 |
|
|
| 0.00 |
|
|
| 0.00 |
|
|
| 5.12 |
|
|
| 0.00 |
|
|
| 0.00 |
|
|
| 60.06 |
|
|
| 0.00 |
|
|
| 0.00 |
|
2028 |
| 1 |
|
| 7.95 |
|
|
| 0.00 |
|
|
| 0.00 |
|
|
| 4.77 |
|
|
| 0.00 |
|
|
| 0.00 |
|
|
| 60.06 |
|
|
| 0.00 |
|
|
| 0.00 |
|
2029 |
| 1 |
|
| 7.44 |
|
|
| 0.00 |
|
|
| 0.00 |
|
|
| 4.46 |
|
|
| 0.00 |
|
|
| 0.00 |
|
|
| 60.06 |
|
|
| 0.00 |
|
|
| 0.00 |
|
2030 |
| 1 |
|
| 7.03 |
|
|
| 0.00 |
|
|
| 0.00 |
|
|
| 4.22 |
|
|
| 0.00 |
|
|
| 0.00 |
|
|
| 60.06 |
|
|
| 0.00 |
|
|
| 0.00 |
|
2031 |
| 1 |
|
| 6.67 |
|
|
| 0.00 |
|
|
| 0.00 |
|
|
| 4.00 |
|
|
| 0.00 |
|
|
| 0.00 |
|
|
| 60.06 |
|
|
| 0.00 |
|
|
| 0.00 |
|
2032 |
| 1 |
|
| 6.35 |
|
|
| 0.00 |
|
|
| 0.00 |
|
|
| 3.81 |
|
|
| 0.00 |
|
|
| 0.00 |
|
|
| 60.06 |
|
|
| 0.00 |
|
|
| 0.00 |
|
2033 |
| 1 |
|
| 6.02 |
|
|
| 0.00 |
|
|
| 0.00 |
|
|
| 3.61 |
|
|
| 0.00 |
|
|
| 0.00 |
|
|
| 60.06 |
|
|
| 0.00 |
|
|
| 0.00 |
|
2034 |
| 1 |
|
| 5.72 |
|
|
| 0.00 |
|
|
| 0.00 |
|
|
| 3.43 |
|
|
| 0.00 |
|
|
| 0.00 |
|
|
| 60.06 |
|
|
| 0.00 |
|
|
| 0.00 |
|
2035 |
| 1 |
|
| 5.43 |
|
|
| 0.00 |
|
|
| 0.00 |
|
|
| 3.26 |
|
|
| 0.00 |
|
|
| 0.00 |
|
|
| 60.06 |
|
|
| 0.00 |
|
|
| 0.00 |
|
Sub-T |
|
|
|
| 125.82 |
|
|
| 0.00 |
|
|
| 0.00 |
|
|
| 75.49 |
|
|
| 0.00 |
|
|
| 0.00 |
|
|
| 60.06 |
|
|
| 0.00 |
|
|
| 0.00 |
|
After |
|
|
|
| 38.00 |
|
|
| 0.00 |
|
|
| 0.00 |
|
|
| 22.80 |
|
|
| 0.00 |
|
|
| 0.00 |
|
|
| 60.06 |
|
|
| 0.00 |
|
|
| 0.00 |
|
Total |
|
|
|
| 163.82 |
|
|
| 0.00 |
|
|
| 0.00 |
|
|
| 98.29 |
|
|
| 0.00 |
|
|
| 0.00 |
|
|
| 60.06 |
|
|
| 0.00 |
|
|
| 0.00 |
|
Cum. |
|
|
|
| 28.36 |
|
|
| 0.00 |
|
|
| 0.00 |
|
|
|
|
|
|
|
|
|
|
|
|
|
|
|
|
|
|
|
|
|
|
|
|
|
Ult. |
|
|
|
| 192.18 |
|
|
| 0.00 |
|
|
| 0.00 |
|
|
|
|
|
|
|
|
|
|
|
|
|
|
|
|
|
|
|
|
|
|
|
|
|
|
| ----------------------------------- Company Future Gross Revenue ---------------------------------- |
|
| ------- Prod & Adv Taxes ------- |
|
| ----- Revenue ---- |
| |||||||||||||||||||||||
Year |
| Oil |
|
| NGL |
|
| Gas |
|
| Other |
|
| Total |
|
| Prod Tax |
|
| Adv Tax |
|
| after Sev & Adv |
| ||||||||
|
| ------ M$ ------ |
|
| ------ M$ ------ |
|
| ------ M$ ------ |
|
| ------ M$ ------ |
|
| ------ M$ ------ |
|
| ------ M$ ------ |
|
| ------ M$ ------ |
|
| ------ M$ ------ |
| ||||||||
2021 |
|
| 2.33 |
|
|
| 0.00 |
|
|
| 0.00 |
|
|
| 0.00 |
|
|
| 2.33 |
|
|
| 0.11 |
|
|
| 0.00 |
|
|
| 2.23 |
|
2022 |
|
| 684.44 |
|
|
| 0.00 |
|
|
| 0.00 |
|
|
| 0.00 |
|
|
| 684.44 |
|
|
| 31.58 |
|
|
| 0.00 |
|
|
| 652.86 |
|
2023 |
|
| 510.03 |
|
|
| 0.00 |
|
|
| 0.00 |
|
|
| 0.00 |
|
|
| 510.03 |
|
|
| 23.53 |
|
|
| 0.00 |
|
|
| 486.50 |
|
2024 |
|
| 426.28 |
|
|
| 0.00 |
|
|
| 0.00 |
|
|
| 0.00 |
|
|
| 426.28 |
|
|
| 19.67 |
|
|
| 0.00 |
|
|
| 406.61 |
|
2025 |
|
| 372.26 |
|
|
| 0.00 |
|
|
| 0.00 |
|
|
| 0.00 |
|
|
| 372.26 |
|
|
| 17.17 |
|
|
| 0.00 |
|
|
| 355.08 |
|
2026 |
|
| 335.32 |
|
|
| 0.00 |
|
|
| 0.00 |
|
|
| 0.00 |
|
|
| 335.32 |
|
|
| 15.47 |
|
|
| 0.00 |
|
|
| 319.85 |
|
2027 |
|
| 307.58 |
|
|
| 0.00 |
|
|
| 0.00 |
|
|
| 0.00 |
|
|
| 307.58 |
|
|
| 14.19 |
|
|
| 0.00 |
|
|
| 293.39 |
|
2028 |
|
| 286.52 |
|
|
| 0.00 |
|
|
| 0.00 |
|
|
| 0.00 |
|
|
| 286.52 |
|
|
| 13.22 |
|
|
| 0.00 |
|
|
| 273.31 |
|
2029 |
|
| 267.98 |
|
|
| 0.00 |
|
|
| 0.00 |
|
|
| 0.00 |
|
|
| 267.98 |
|
|
| 12.36 |
|
|
| 0.00 |
|
|
| 255.62 |
|
2030 |
|
| 253.19 |
|
|
| 0.00 |
|
|
| 0.00 |
|
|
| 0.00 |
|
|
| 253.19 |
|
|
| 11.68 |
|
|
| 0.00 |
|
|
| 241.51 |
|
2031 |
|
| 240.36 |
|
|
| 0.00 |
|
|
| 0.00 |
|
|
| 0.00 |
|
|
| 240.36 |
|
|
| 11.09 |
|
|
| 0.00 |
|
|
| 229.27 |
|
2032 |
|
| 228.96 |
|
|
| 0.00 |
|
|
| 0.00 |
|
|
| 0.00 |
|
|
| 228.96 |
|
|
| 10.56 |
|
|
| 0.00 |
|
|
| 218.40 |
|
2033 |
|
| 216.91 |
|
|
| 0.00 |
|
|
| 0.00 |
|
|
| 0.00 |
|
|
| 216.91 |
|
|
| 10.01 |
|
|
| 0.00 |
|
|
| 206.90 |
|
2034 |
|
| 206.07 |
|
|
| 0.00 |
|
|
| 0.00 |
|
|
| 0.00 |
|
|
| 206.07 |
|
|
| 9.51 |
|
|
| 0.00 |
|
|
| 196.57 |
|
2035 |
|
| 195.78 |
|
|
| 0.00 |
|
|
| 0.00 |
|
|
| 0.00 |
|
|
| 195.78 |
|
|
| 9.03 |
|
|
| 0.00 |
|
|
| 186.74 |
|
Sub-T |
|
| 4,534.03 |
|
|
| 0.00 |
|
|
| 0.00 |
|
|
| 0.00 |
|
|
| 4,534.03 |
|
|
| 209.18 |
|
|
| 0.00 |
|
|
| 4,324.85 |
|
After |
|
| 1,369.34 |
|
|
| 0.00 |
|
|
| 0.00 |
|
|
| 0.00 |
|
|
| 1,369.34 |
|
|
| 63.17 |
|
|
| 0.00 |
|
|
| 1,306.16 |
|
Total |
|
| 5,903.37 |
|
|
| 0.00 |
|
|
| 0.00 |
|
|
| 0.00 |
|
|
| 5,903.37 |
|
|
| 272.35 |
|
|
| 0.00 |
|
|
| 5,631.01 |
|
|
| ----------------------------------- Deductions ---------------------------------- |
|
| -------------------- Future Net Income Before Income Taxes ------------------- |
| ||||||||||||||||||||||||||
|
| Lease |
|
| Net |
|
| Trans. |
|
| Net |
|
| Undiscounted |
|
| Discounted Ann |
|
| Disc. Cum. |
| |||||||||||
Year |
| Net Costs |
|
| Investments |
|
| Costs |
|
| Profits |
|
| Annual |
|
| Cumulative |
|
| @ 10.00% |
|
| Annual @ 10.00% |
| ||||||||
|
| ------ M$ ------ |
|
| ------ M$ ------ |
|
| ------ M$ ------ |
|
| ------ M$ ------ |
|
| ------ M$ ------ |
|
| ------ M$ ------ |
|
| ------ M$ ------ |
|
| ------ M$ ------ |
| ||||||||
2021 |
|
| 0.31 |
|
|
| 0.00 |
|
|
| 0.00 |
|
|
| 0.00 |
|
|
| 1.92 |
|
|
| 1.92 |
|
|
| 1.92 |
|
|
| 1.92 |
|
2022 |
|
| 115.20 |
|
|
| 0.00 |
|
|
| 0.00 |
|
|
| 0.00 |
|
|
| 537.66 |
|
|
| 539.58 |
|
|
| 514.58 |
|
|
| 516.49 |
|
2023 |
|
| 115.20 |
|
|
| 0.00 |
|
|
| 0.00 |
|
|
| 0.00 |
|
|
| 371.30 |
|
|
| 910.88 |
|
|
| 322.58 |
|
|
| 839.08 |
|
2024 |
|
| 115.20 |
|
|
| 0.00 |
|
|
| 0.00 |
|
|
| 0.00 |
|
|
| 291.41 |
|
|
| 1,202.29 |
|
|
| 230.02 |
|
|
| 1,069.10 |
|
2025 |
|
| 115.20 |
|
|
| 0.00 |
|
|
| 0.00 |
|
|
| 0.00 |
|
|
| 239.88 |
|
|
| 1,442.18 |
|
|
| 172.06 |
|
|
| 1,241.16 |
|
2026 |
|
| 115.20 |
|
|
| 0.00 |
|
|
| 0.00 |
|
|
| 0.00 |
|
|
| 204.65 |
|
|
| 1,646.82 |
|
|
| 133.42 |
|
|
| 1,374.58 |
|
2027 |
|
| 115.20 |
|
|
| 0.00 |
|
|
| 0.00 |
|
|
| 0.00 |
|
|
| 178.19 |
|
|
| 1,825.02 |
|
|
| 105.60 |
|
|
| 1,480.18 |
|
2028 |
|
| 115.20 |
|
|
| 0.00 |
|
|
| 0.00 |
|
|
| 0.00 |
|
|
| 158.11 |
|
|
| 1,983.12 |
|
|
| 85.17 |
|
|
| 1,565.35 |
|
2029 |
|
| 115.20 |
|
|
| 0.00 |
|
|
| 0.00 |
|
|
| 0.00 |
|
|
| 140.42 |
|
|
| 2,123.54 |
|
|
| 68.75 |
|
|
| 1,634.10 |
|
2030 |
|
| 115.20 |
|
|
| 0.00 |
|
|
| 0.00 |
|
|
| 0.00 |
|
|
| 126.31 |
|
|
| 2,249.85 |
|
|
| 56.22 |
|
|
| 1,690.32 |
|
2031 |
|
| 115.20 |
|
|
| 0.00 |
|
|
| 0.00 |
|
|
| 0.00 |
|
|
| 114.07 |
|
|
| 2,363.92 |
|
|
| 46.16 |
|
|
| 1,736.48 |
|
2032 |
|
| 115.20 |
|
|
| 0.00 |
|
|
| 0.00 |
|
|
| 0.00 |
|
|
| 103.20 |
|
|
| 2,467.12 |
|
|
| 37.97 |
|
|
| 1,774.45 |
|
2033 |
|
| 115.20 |
|
|
| 0.00 |
|
|
| 0.00 |
|
|
| 0.00 |
|
|
| 91.70 |
|
|
| 2,558.83 |
|
|
| 30.67 |
|
|
| 1,805.12 |
|
2034 |
|
| 115.20 |
|
|
| 0.00 |
|
|
| 0.00 |
|
|
| 0.00 |
|
|
| 81.37 |
|
|
| 2,640.20 |
|
|
| 24.74 |
|
|
| 1,829.85 |
|
2035 |
|
| 115.20 |
|
|
| 0.00 |
|
|
| 0.00 |
|
|
| 0.00 |
|
|
| 71.54 |
|
|
| 2,711.74 |
|
|
| 19.78 |
|
|
| 1,849.63 |
|
Sub-T |
|
| 1,613.11 |
|
|
| 0.00 |
|
|
| 0.00 |
|
|
| 0.00 |
|
|
| 2,711.74 |
|
|
| 2,711.74 |
|
|
| 1,849.63 |
|
|
| 1,849.63 |
|
After |
|
| 1,029.99 |
|
|
| 0.00 |
|
|
| 0.00 |
|
|
| 0.00 |
|
|
| 276.18 |
|
|
| 276.18 |
|
|
| 56.38 |
|
|
| 56.38 |
|
Total |
|
| 2,643.10 |
|
|
| 0.00 |
|
|
| 0.00 |
|
|
| 0.00 |
|
|
| 2,987.92 |
|
|
| 2,987.92 |
|
|
| 1,906.01 |
|
|
| 1,906.01 |
|
Eco. Indicators |
|
|
|
|
|
|
| Ownership Interests |
|
| Present Worth Profile (M$) |
| |||||||||||||
Return on Investment (disc) : |
|
| 0.000 |
|
|
|
| Initial |
|
| 1st Rev. |
|
| 2nd Rev. |
|
| PW | 5.00% : |
|
| 2,319.42 |
| |||
Return on Investment (undisc) : |
|
| 0.000 |
|
| W. I. : |
|
| 0.80000000 |
|
|
| 0.00000000 |
|
|
| 0.00000000 |
|
| PW | 8.00% : |
|
| 2,050.16 |
|
Years to Payout : |
|
| 0.00 |
|
| Net R. I. : |
|
| 0.60000000 |
|
|
| 0.00000000 |
|
|
| 0.00000000 |
|
| PW | 9.00% : |
|
| 1,975.10 |
|
Internal Rate of Return (%): |
|
| 0.00 |
|
| Rev. Date : |
|
|
|
|
|
|
|
|
|
|
|
|
| PW | 12.00% : |
|
| 1,783.28 |
|
|
|
|
|
|
|
|
|
|
|
|
|
|
|
|
|
|
|
|
| PW | 15.00% : |
|
| 1,630.33 |
|
|
|
|
|
|
|
|
|
|
|
|
|
|
|
|
|
|
|
|
| PW | 20.00% : |
|
| 1,434.98 |
|
TRC Eco Detailed2.rpt | 6 |
|
4/28/2022 1:06:44PM |
|
| |
Project Name : Ownership Group: |
TORCHLIGHT ENERGY, INC. All Cases | Economic One-Liners As of Date: 12/31/2021 |
|
|
|
|
| Net Reserves |
|
| Net Revenue |
|
|
|
|
|
|
|
|
|
| Cash Flow |
|
|
|
|
| |||||||||||||||||||
|
|
|
| Oil, Cond, |
|
|
|
|
|
| Oil, Cond, |
|
|
|
|
|
|
|
|
|
| Expense |
|
|
|
|
|
|
|
|
|
|
|
|
|
|
|
|
| |||
Lease Name |
| Reserve Category |
| NGL * |
|
| Gas |
|
| NGL * |
|
| Gas |
|
| Other |
|
| & Tax |
|
| Invest. |
|
| Non-Disc. |
|
| Disc. CF |
|
| Life |
| ||||||||||
Risked / UnRisked |
|
|
| (Mbbl) |
|
| (MMcf) |
|
| (M$) |
|
| (M$) |
|
| (M$) |
|
| (M$) |
|
| (M$) |
|
| (M$) |
|
| (M$) |
|
| (years) |
| ||||||||||
FLYING 'B' RANCH 3H - 3H |
| P-DP |
|
| 53.57 |
|
|
| 0.00 |
|
|
| 3,194.77 |
|
|
| 0.00 |
|
|
| 0.00 |
|
|
| 1,866.10 |
|
|
| 0.00 |
|
|
| 1,328.66 |
|
|
| 990.80 |
|
|
| 14.92 |
|
Grand Total |
| Total |
|
| 98.29 |
|
|
| 0.00 |
|
|
| 5,903.37 |
|
|
| 0.00 |
|
|
| 0.00 |
|
|
| 2,915.45 |
|
|
| 0.00 |
|
|
| 2,987.92 |
|
|
| 1,906.01 |
|
|
| 22.94 |
|
FLYING 'B' RANCH 4H - 4 H |
| P-DP |
|
| 98.29 |
|
|
| 0.00 |
|
|
| 5,903.37 |
|
|
| 0.00 |
|
|
| 0.00 |
|
|
| 2,915.45 |
|
|
| 0.00 |
|
|
| 2,987.92 |
|
|
| 1,906.01 |
|
|
| 22.94 |
|
TRC Eco One Liner 2.rpt |
| * Assumes Oil, Condensate and NGL are all using the same units. |
| 1 |
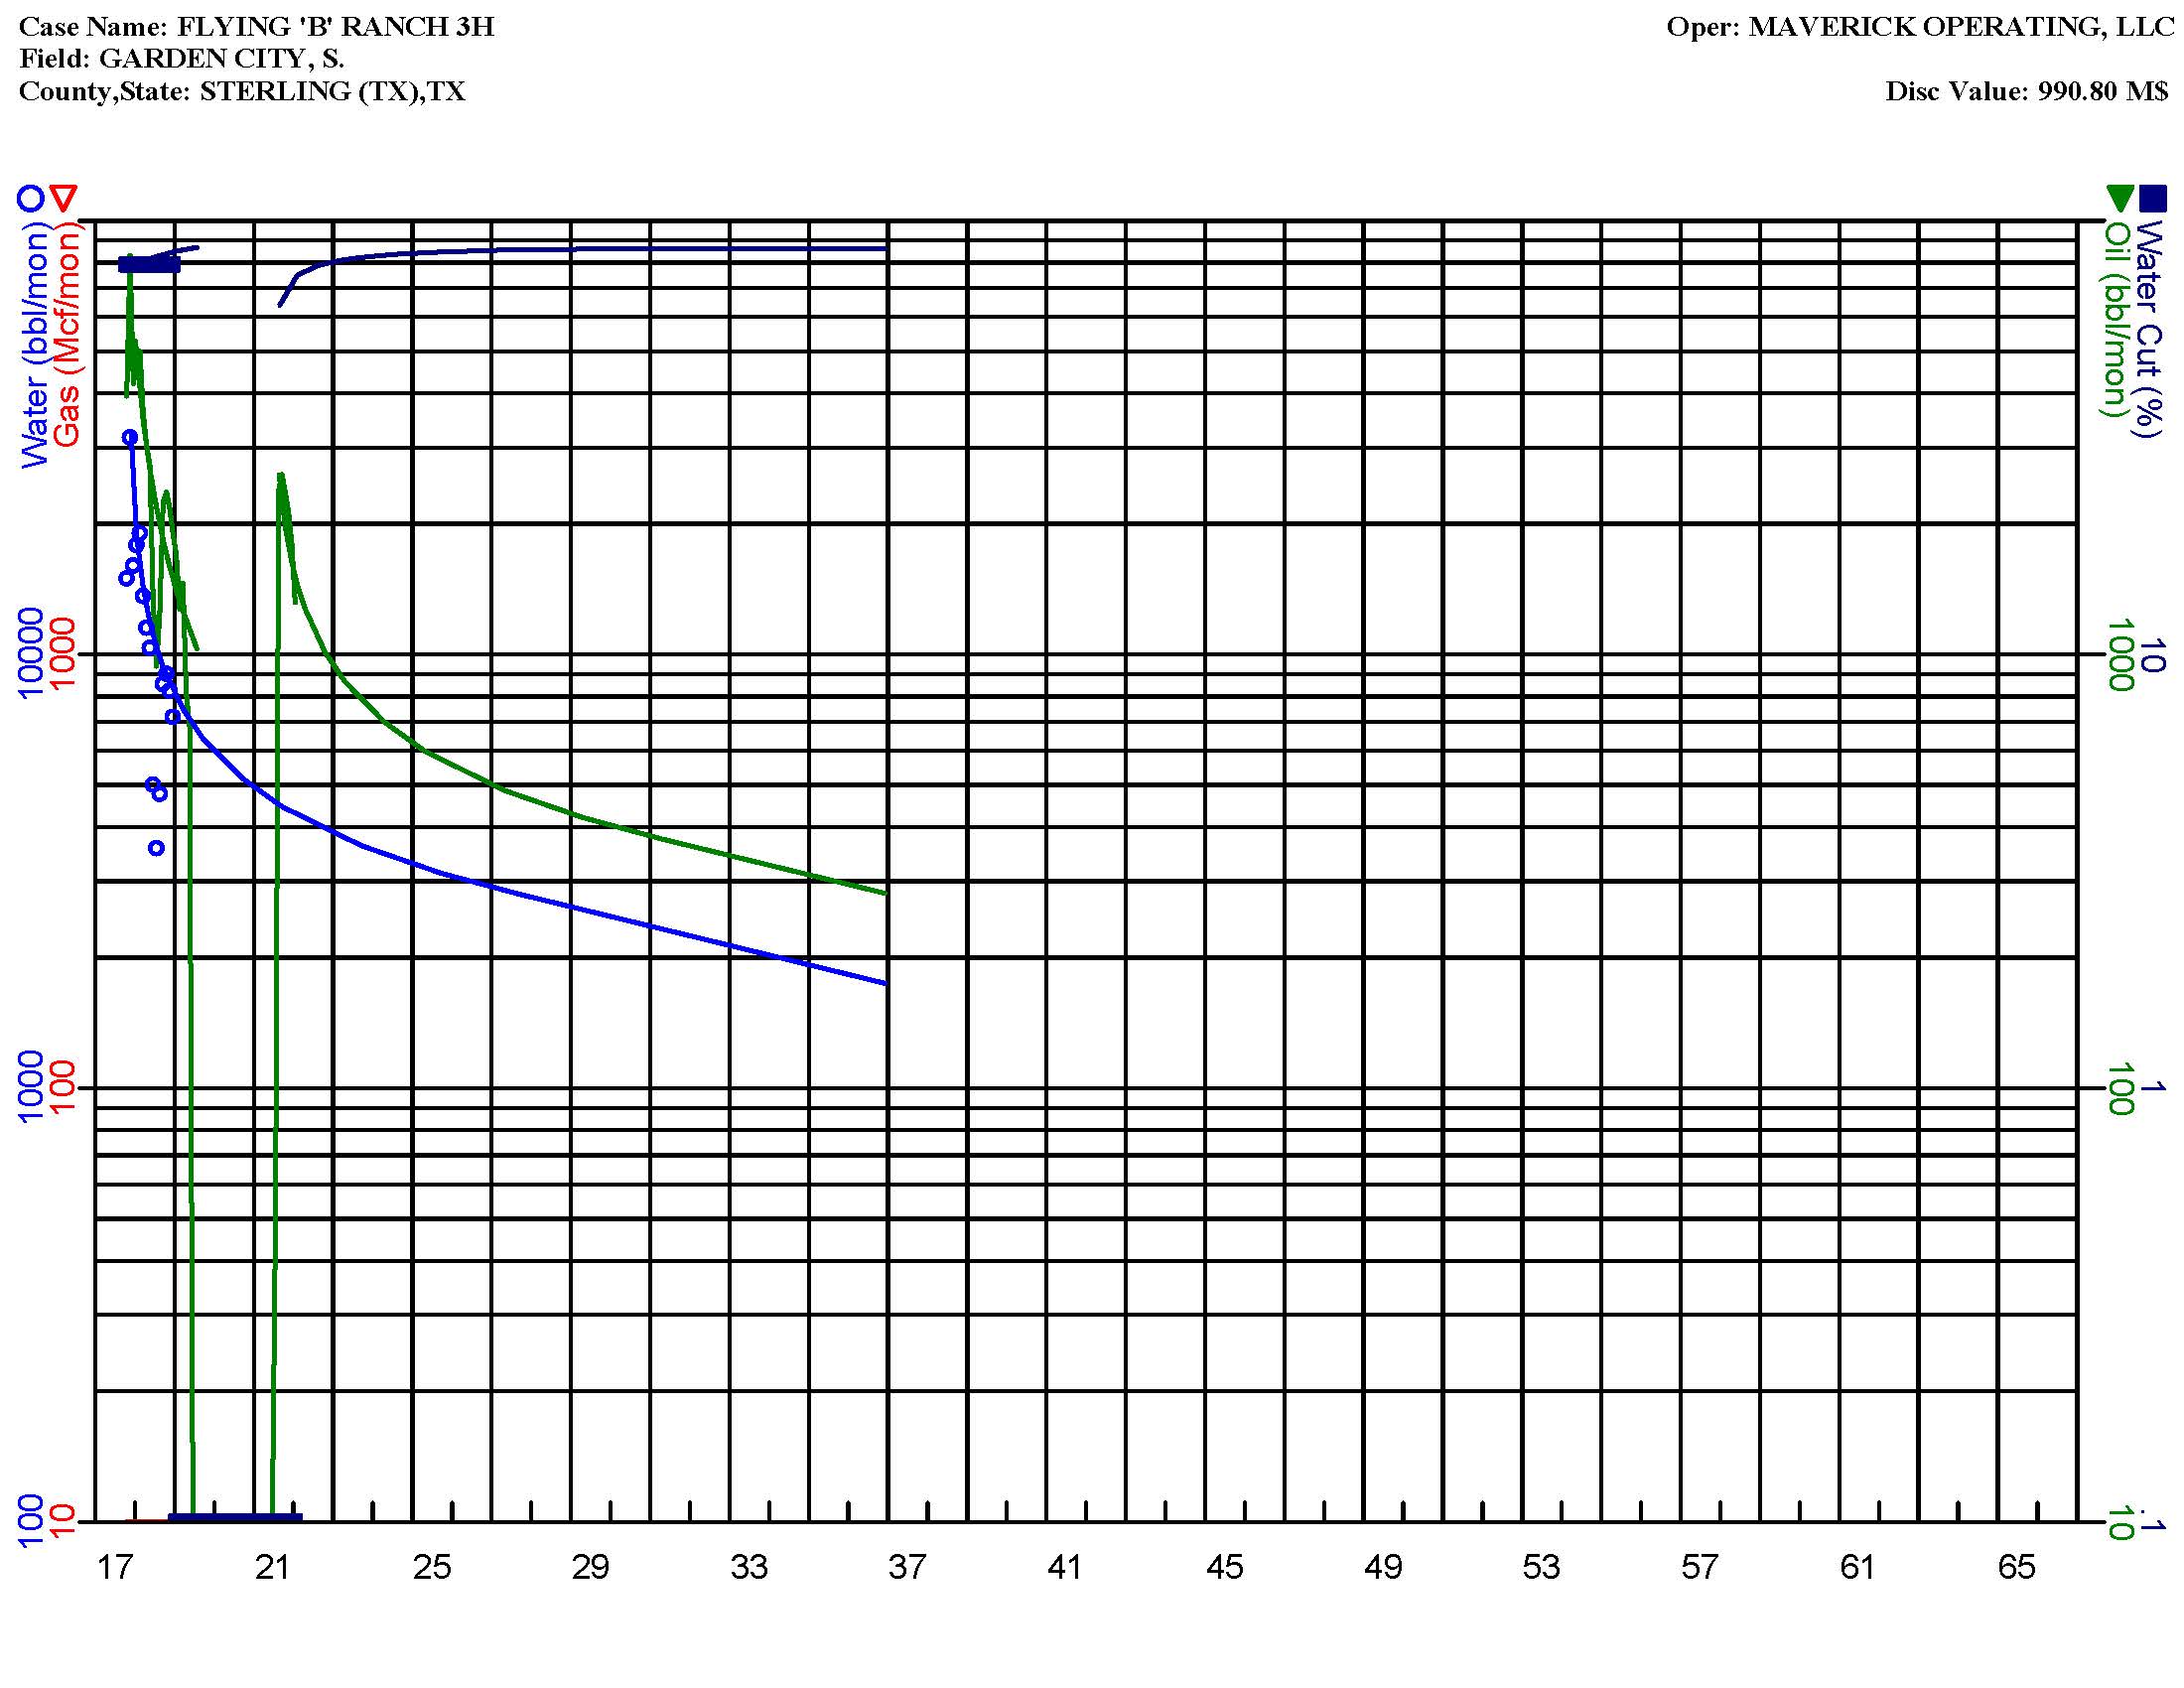
Case Name: FLYING 'B' RANCH 3H Field: GARDEN CITY, S. County,State: STERLING (TX),TX Oper: MAVERICK OPERATING, LLC Disc Value: 990.80 M$ 10 100 1000101001000 100 1000 10000.1110 Gas (Mcf/mon) Oil (bbl/mon) Water (bbl/mon) Water Cut (%) 17 21 25 29 33 37 41 45 49 53 57 61 65
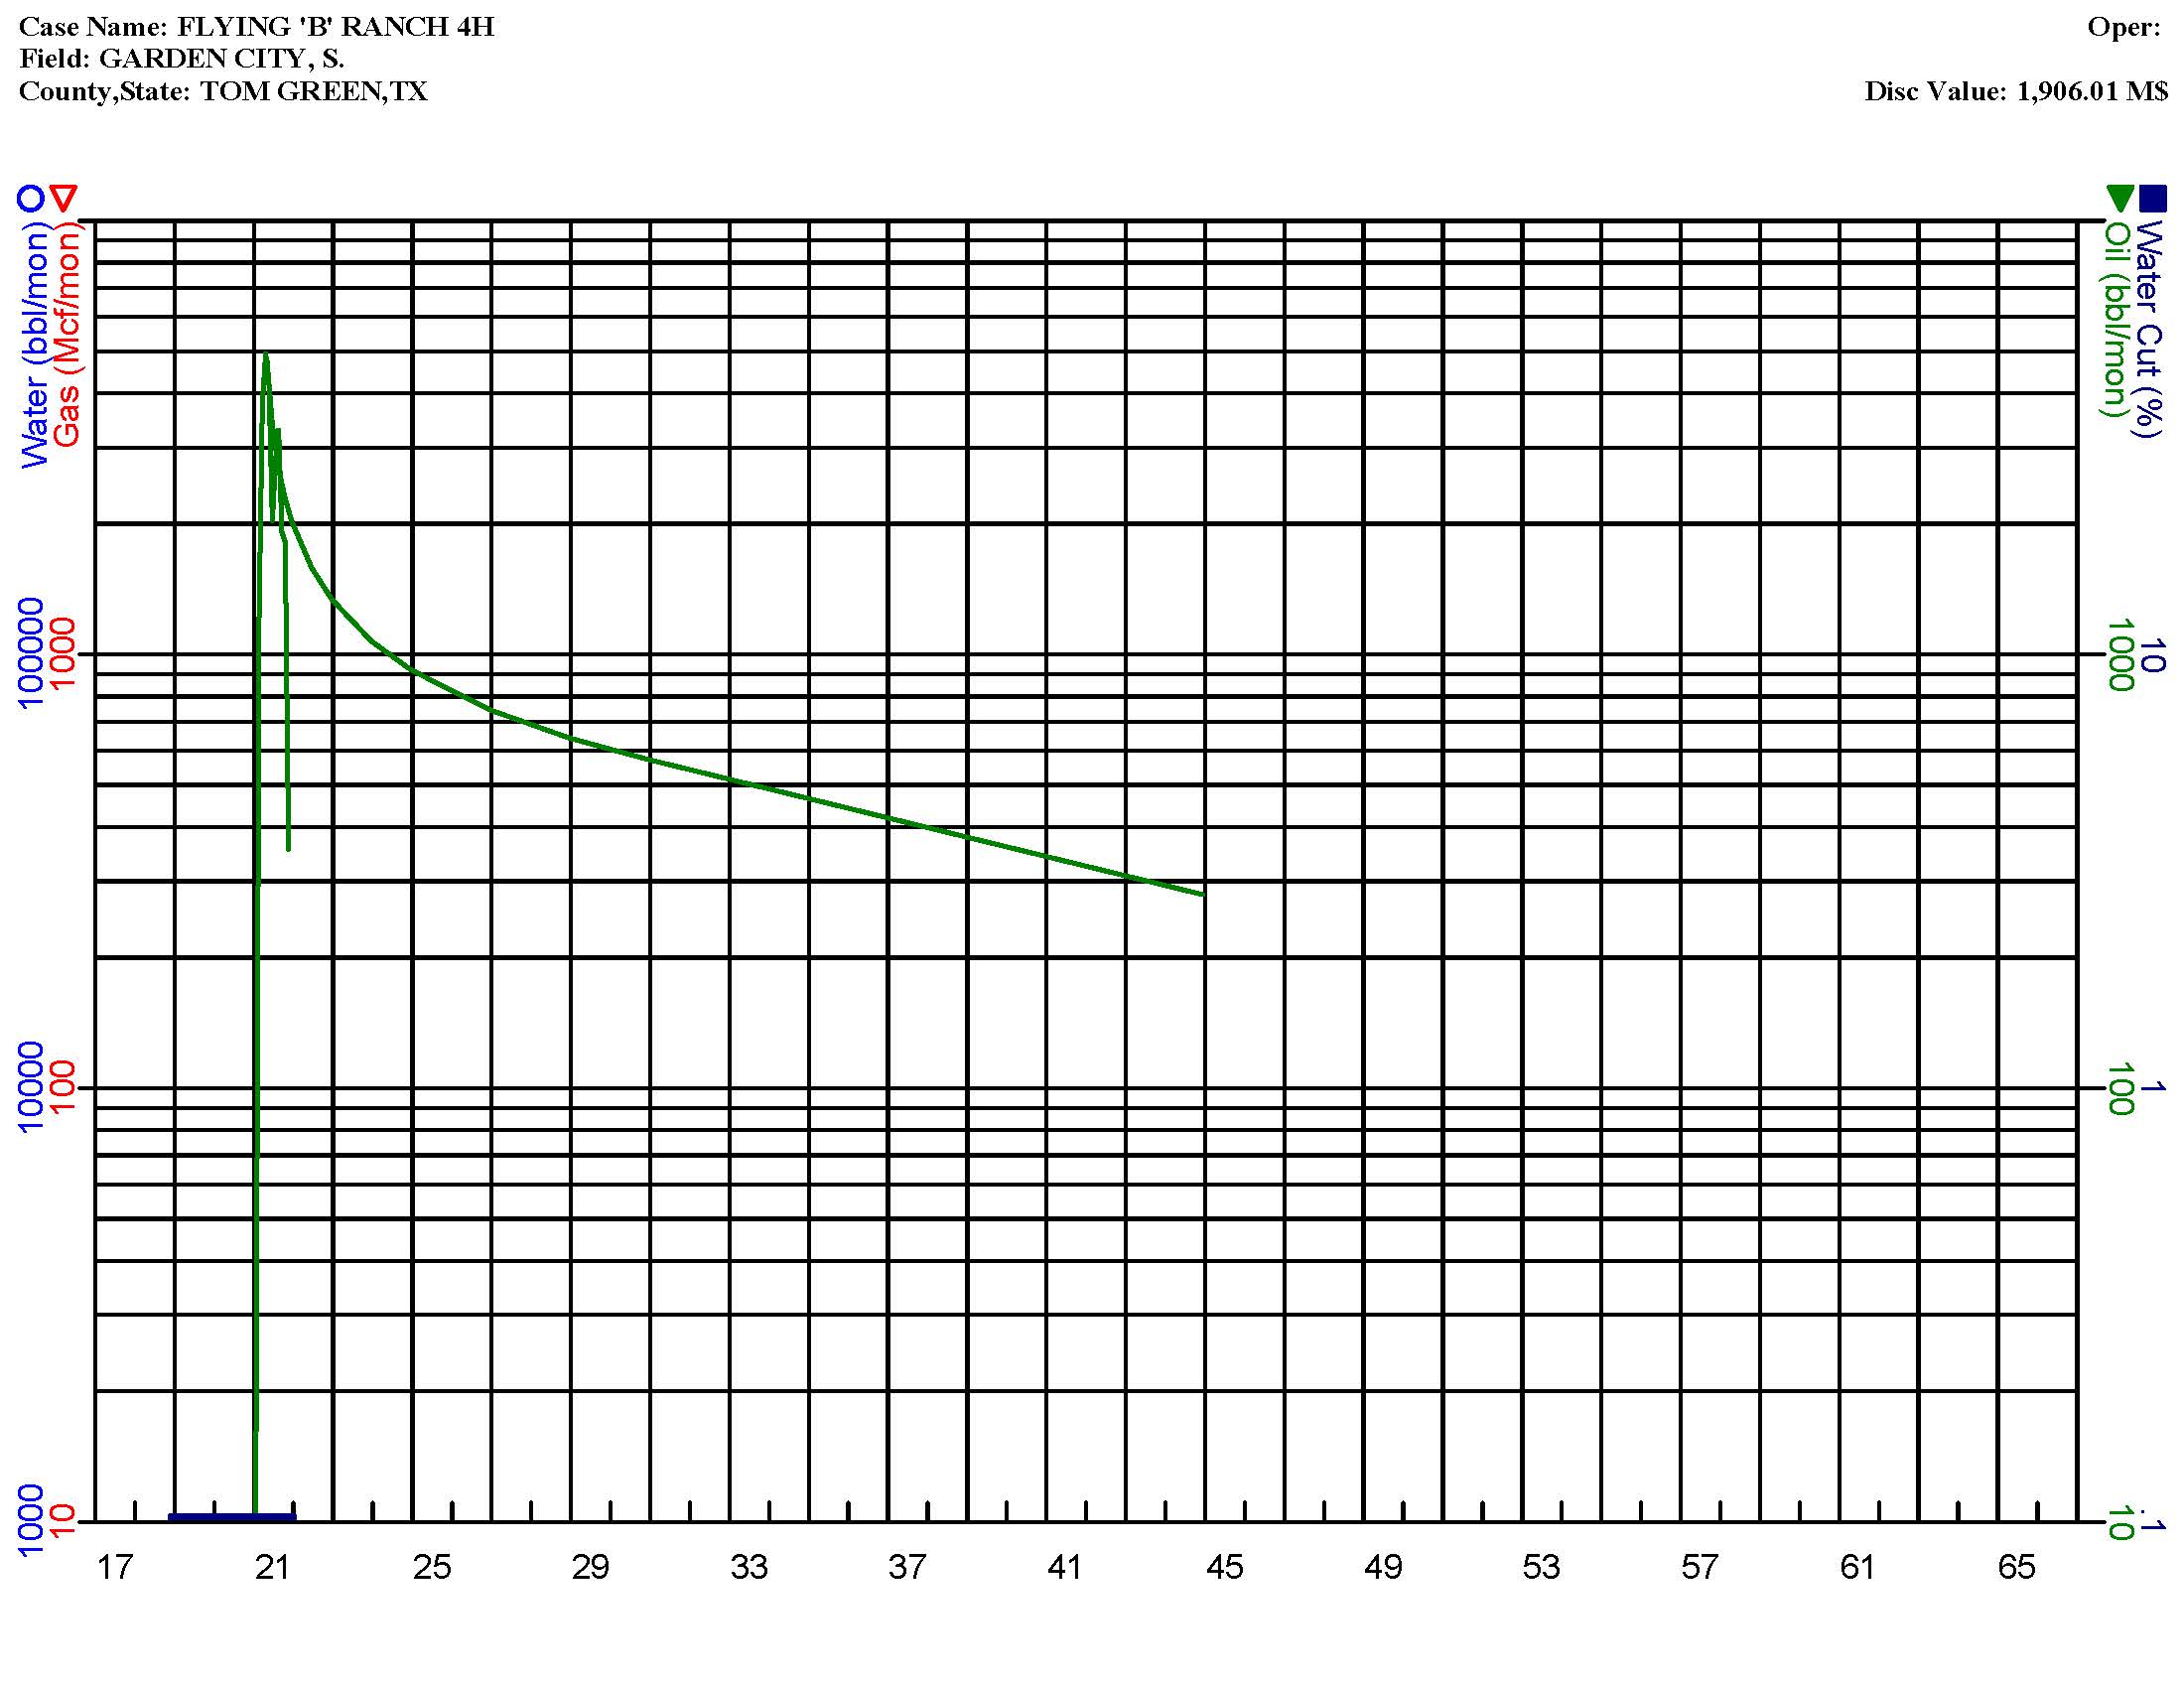
Case Name: FLYING 'B' RANCH 4H Oper: Field: GARDEN CITY, S. County,State: TOM GREEN,TX Disc Value: 1,906.01 M$ 10 100 1000101001000 1000 10000 100000.1110 Gas (Mcf/mon) Oil (bbl/mon) Water (bbl/mon) Water Cut (%) 17 21 25 29 33 37 41 45 49 53 57 61 65
Appraiser Qualifications
Amiel David Amiel David is a Registered Petroleum Engineer in the State of Texas, having a license # 50970. Amiel is the owner of PeTech Enterprises, Inc having a Firm Registration number F-15360. Amiel has been practicing petroleum engineering since his college graduation and as a Professional Registered Engineer since 1982. His consulting practice covers all major basins in the US and Canada. He also performed evaluation on assets outside North America. Amiel graduated from the U of Tulsa with a BS in Petroleum Engineering, from the U of Pennsylvania with a MSE in Chemical Engineering, from Stanford U with a PhD in Petroleum Engineering and an MBA from the U of Pittsburgh. Amiel is a member of the Society of Petroleum Engineers and The Society of Petroleum Evaluation Engineers. He has authored over twenty papers on subjects related to his profession.