UNITED STATES
SECURITIES AND EXCHANGE COMMISSION
Washington, D.C. 20549
FORM N-CSR
CERTIFIED SHAREHOLDER REPORT OF REGISTERED MANAGEMENT
INVESTMENT COMPANIES
Investment Company Act file number 811-22209
Global X Funds
(Exact name of registrant as specified in charter)
605 Third Avenue, 43rd floor
New York, NY 10158
(Address of principal executive offices) (Zip code)
Thomas Park
Global X Management Company LLC
605 Third Avenue, 43rd floor
New York, NY 10158
(Name and address of agent for service)
With a copy to:
Global X Management Company LLC 605 Third Avenue, 43rd floor New York, NY 10158 | Eric S. Purple, Esq. Stradley Ronon Stevens & Young, LLP 2000 K Street, N.W., Suite 700 Washington, DC 20006-1871 |
Registrant’s telephone number, including area code: (212) 644-6440
Date of fiscal year end: November 30, 2023
Date of reporting period: November 30, 2023
Item 1. Reports to Stockholders.
(a) A copy of the report transmitted to stockholders pursuant to Rule 30e-1 under the Investment Company Act of 1940, as amended (the “Act”) (17 CFR § 270.30e-1), is attached hereto.

Global X Millennial Consumer ETF (ticker: MILN)
Global X Aging Population ETF (ticker: AGNG)
Global X Health & Wellness ETF (ticker: BFIT)
Global X Robotics & Artificial Intelligence ETF (ticker: BOTZ)
Global X FinTech ETF (ticker: FINX)
Global X Internet of Things ETF (ticker: SNSR)
Global X U.S. Infrastructure Development ETF (ticker: PAVE)
Global X Autonomous & Electric Vehicles ETF (ticker: DRIV)
Global X Artificial Intelligence & Technology ETF (ticker: AIQ)
Global X Genomics & Biotechnology ETF (ticker: GNOM)
Global X Cloud Computing ETF (ticker: CLOU)
Global X Cannabis ETF (ticker: POTX)
Global X Thematic Growth ETF (ticker: GXTG)
Global X Video Games & Esports ETF (ticker: HERO)
Global X Cybersecurity ETF (ticker: BUG)
Global X Telemedicine & Digital Health ETF (ticker: EDOC)
Global X China Biotech Innovation ETF (ticker: CHB)
Global X CleanTech ETF (ticker: CTEC)
Global X Data Center REITs & Digital Infrastructure ETF (ticker: VPN)
Global X Clean Water ETF (ticker: AQWA)
Global X AgTech & Food Innovation ETF (ticker: KROP)
Global X Blockchain ETF (ticker: BKCH)
Global X Hydrogen ETF (ticker: HYDR)
Global X Solar ETF (ticker: RAYS)
Global X Wind Energy ETF (ticker: WNDY)
Global X Green Building ETF (ticker: GRNR)
Global X Metaverse ETF (ticker: VR)
Global X PropTech ETF (ticker: PTEC)
Global X Carbon Credits Strategy ETF (ticker: NTRL)
Global X Defense Tech ETF (ticker: SHLD)
Annual Report
November 30, 2023
As permitted by regulations adopted by the Securities and Exchange Commission, paper copies of the Funds’ (defined below) shareholder reports will no longer be sent by mail, unless you specifically request paper copies of the reports from your financial intermediary (such as a broker-dealer or bank). Instead, shareholder reports will be available on the Funds’ website (www. globalxetfs.com/explore), and you will be notified by mail each time a report is posted and provided with a website link to access the report.
If you already elected to receive shareholder reports electronically, you will not be affected by this change and you need not take any action. You may elect to receive shareholder reports and other communications from the Funds electronically anytime by contacting your financial intermediary.
You may elect to receive all future Fund shareholder reports in paper free of charge. Please contact your financial intermediary to inform them that you wish to continue receiving paper copies of Fund shareholder reports and for details about whether your election to receive reports in paper will apply to all funds held with your financial intermediary.

Table of Contents
Table of Contents
Shares are bought and sold at market price (not NAV) and are not individually redeemed from a Fund. Shares may only be redeemed directly from a Fund by Authorized Participants, in very large creation/redemption units. Brokerage commissions will reduce returns.
The Funds file their complete schedules of Fund holdings with the Securities and Exchange Commission (the “SEC” or “Commission”) for the first and third quarters of each fiscal year as an exhibit to its reports on Form N-PORT. The Funds’ Form N-PORT is available on the Commission’s website at https://www.sec.gov, and may be reviewed and copied at the Commission’s Public Reference Room in Washington, DC. Information on the operation of the Public Reference Room may be obtained by calling 1-800-SEC-0330.
A description of the policies and procedures that Global X Funds uses to determine how to vote proxies relating to Fund securities, as well as information relating to how the Funds voted proxies relating to Fund securities during the most recent 12-month period ended June 30, is available (i) without charge, upon request, by calling 1-888-493-8631; and (ii) on the Commission’s website at https://www.sec.gov
Management Discussion of Fund Performance (unaudited)
Global X Millennial Consumer ETF
Global X Millennial Consumer ETF
Global X Millennial Consumer ETF (the “Fund”) seeks to provide investment results that correspond generally to the price and yield performance, before fees and expenses, of the Indxx Millennials Thematic Index (“Underlying Index”). The Fund is passively managed, and the investment adviser does not attempt to take defensive positions in declining markets. The Fund generally seeks to fully replicate the Underlying Index.
The Underlying Index measures the performance of U.S. listed companies that provide exposure to the Millennial generation, (“Millennial Companies”). The Millennial generation refers to the demographic cohort in the US with birth years ranging from 1980 to 2000.
For the 12-month period ended November 30, 2023 (the “reporting period”), the Fund increased 15.87%, while the Underlying Index increased 16.42%. The Fund had a net asset value of $28.43 per share on November 30, 2022 and ended the reporting period with a net asset value of $32.86 on November 30, 2023.
During the reporting period, the highest returns came from Carvana Co. Class A and Meta Platforms Inc. Class A, which returned 306.23% and 177.01%, respectively. The worst performers were Bed Bath & Beyond Inc and 2U Inc., which returned -91.37% and -87.77%, respectively.
The Fund recorded positive returns during the reporting period, capitalizing on the evolving preferences of Millennial and Gen Z consumers, a significant global demographic. These cohorts increasingly favored cutting-edge technology and convenience, driven by heightened social media consumption that propelled mobile shopping and alternative payment methods during the reporting period. Noteworthy trends included a preference for experiential pursuits (such as travel) over material possessions and a discernible shift toward access over ownership, observed in the popularity of ridesharing and collaborative consumption. These trends not only presented lucrative opportunities for modern companies but also contributed to the enduring success of established legacy businesses, fueled by the growing spending capacity of these consumer groups. During the reporting period, the Fund had the highest sector exposure to Consumer Discretionary at 42.78% and Communication Services at 23.77%.
| | AVERAGE ANNUAL TOTAL RETURN FOR THE YEAR ENDED
NOVEMBER 30, 2023 |
| | One Year Return | Three Year Return | Five Year Return | Annualized
Inception to Date* |
| | Net
Asset
Value | Market
Price | Net
Asset
Value | Market
Price | Net
Asset
Value | Market
Price | Net
Asset
Value | Market
Price |
| Global X Millennial Consumer ETF | 15.87% | 15.97% | -2.11% | -2.10% | 9.11% | 9.10% | 11.35% | 11.29% |
| Indxx Millennials Thematic Index | 16.42% | 16.42% | -1.66% | -1.66% | 9.65% | 9.65% | 11.87% | 11.87% |
| S&P 500® Index | 13.84% | 13.84% | 9.76% | 9.76% | 12.51% | 12.51% | 13.19% | 13.19% |
1
Management Discussion of Fund Performance (unaudited)
Global X Millennial Consumer ETF
Growth of a 10,000 Investment
(at Net Asset Value)
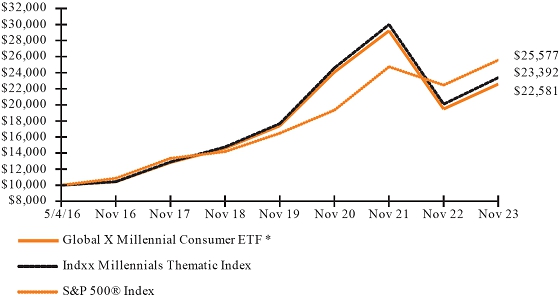
* The Fund commenced operations on May 4, 2016.
The S&P 500® Index is a market capitalization weighted composite index of 500 large capitalization U.S. companies.
The performance data quoted herein represents past performance and the return and value of an investment in the Fund will fluctuate so that, when sold, it may be worth less than its original cost. Past performance is no guarantee of future performance and should not be considered as a representation of the future results of the Fund. The Fund’s performance assumes the reinvestment of all dividends and all capital gains. Index returns assume reinvestment of dividends and, unlike the Fund’s returns, do not reflect any fees or expenses. If such fees and expenses were included in the index returns, the performance would have been lower. Please note that one cannot invest directly in an unmanaged index.
Performance figures for the periods shown may reflect contractual fee waivers and/or expense reimbursements. In the absence of fee waivers and/or expense reimbursements (if applicable), returns would have been lower.
There are no assurances that the Fund will meet its stated objectives.
The Fund’s holdings and allocations are subject to change and should not be considered recommendations to buy individual securities.
The graph and table do not reflect the deduction of taxes that a shareholder would pay on Fund distributions or the redemption or sale of Fund shares.
See definition of comparative indices on the previous page and above.
2
Management Discussion of Fund Performance (unaudited)
Global X Aging Population ETF
Global X Aging Population ETF
Global X Aging Population ETF (the “Fund”) seeks to provide investment results that correspond generally to the price and yield performance, before fees and expenses, of the Indxx Aging Population Thematic Index (“Underlying Index”). The Fund is passively managed, and the investment adviser does not attempt to take defensive positions in declining markets. The Fund generally seeks to fully replicate the Underlying Index.
The Underlying Index is designed to track the performance of companies listed in developed markets that are expected to directly or indirectly contribute to increasing the life-spans of the senior population of the world. The Underlying Index provides access to companies involved in biotechnology, medical devices, pharmaceuticals, senior living facilities and specialized health care services, which respond to the needs of this demographic.
For the 12-month period ended November 30, 2023 (the “reporting period”), the Fund increased 2.42%, while the Underlying Index increased 2.80%. The Fund had a net asset value of $26.46 per share on November 30, 2022 and ended the reporting period with a net asset value of $26.93 on November 30, 2023.
During the reporting period, the highest returns came from Seagen, Inc. and Novo Nordisk A/S Class B, which returned 75.64% and 68.44%, respectively. The worst performers were FibroGen, Inc. and Cano Health, Inc. Class A, which returned -96.16% and -96.12%, respectively.
The Fund recorded modestly positive returns during the reporting period as advances in medical science and technology supported growth of the healthcare industry. Continued growth of the aging population theme resulted in increased demand for medical care and healthcare services, leading to positive investor sentiment. Growing focus on research and development (R&D) in the medical industry towards addressing age-related disorders like cardiovascular illnesses and type 2 diabetes also played a role in growing returns. Furthermore, senior living facilities benefited from increased demand for round-the-clock care and operational improvements to better scale care. Ongoing supply chain and macroeconomic headwinds limited upside in the Fund during the reporting period, with inflationary pressures impacting margins in the medical devices sector. The Fund also benefitted from a slower-than-expected rebound for aging-related surgical procedures following the COVID-19 pandemic.
| | AVERAGE ANNUAL TOTAL RETURN FOR THE YEAR ENDED
NOVEMBER 30, 2023 |
| | One Year Return | Three Year Return | Five Year Return | Annualized
Inception to Date* |
| | Net
Asset
Value | Market
Price | Net
Asset
Value | Market
Price | Net
Asset
Value | Market
Price | Net
Asset
Value | Market
Price |
| Global X Aging Population ETF | 2.42% | 1.54% | 0.79% | 0.63% | 6.28% | 6.10% | 8.62% | 8.86% |
| Indxx Aging Population Thematic Index | 2.80% | 2.80% | 1.03% | 1.03% | 6.51% | 6.51% | 8.90% | 8.90% |
| MSCI ACWI Index (Net) | 12.01% | 12.01% | 5.69% | 5.69% | 9.07% | 9.07% | 9.71% | 9.71% |
3
Management Discussion of Fund Performance (unaudited)
Global X Aging Population ETF
Growth of a 10,000 Investment
(at Net Asset Value)
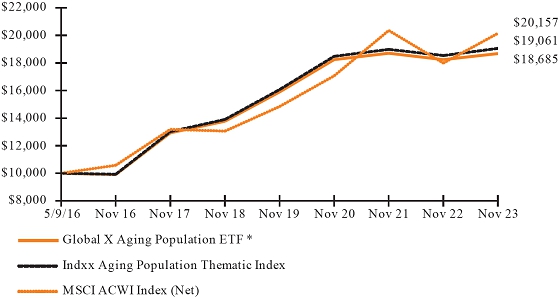
* The Fund commenced operations on May 9, 2016.
The MSCI ACWI (Net) (All Country World Index) Index is a free float-adjusted market capitalization weighted index that is designed to measure the equity market performance of developed and emerging markets.
The performance data quoted herein represents past performance and the return and value of an investment in the Fund will fluctuate so that, when sold, it may be worth less than its original cost. Past performance is no guarantee of future performance and should not be considered as a representation of the future results of the Fund. The Fund’s performance assumes the reinvestment of all dividends and all capital gains. Index returns assume reinvestment of dividends and, unlike the Fund’s returns, do not reflect any fees or expenses. If such fees and expenses were included in the index returns, the performance would have been lower. Please note that one cannot invest directly in an unmanaged index.
Performance figures for the periods shown may reflect contractual fee waivers and/or expense reimbursements. In the absence of fee waivers and/or expense reimbursements (if applicable), returns would have been lower.
There are no assurances that the Fund will meet its stated objectives.
The Fund’s holdings and allocations are subject to change and should not be considered recommendations to buy individual securities.
The graph and table do not reflect the deduction of taxes that a shareholder would pay on Fund distributions or the redemption or sale of Fund shares.
See definition of comparative indices on the previous page and above.
4
Management Discussion of Fund Performance (unaudited)
Global X Health & Wellness ETF
Global X Health & Wellness ETF
Global X Health & Wellness ETF (the “Fund”) seeks to provide investment results that correspond generally to the price and yield performance, before fees and expenses, of the Indxx Global Health & Wellness Thematic Index (“Underlying Index”). The Fund is passively managed, and the investment adviser does not attempt to take defensive positions in declining markets. The Fund generally seeks to fully replicate the Underlying Index.
The Underlying Index is designed to track the performance of companies listed in developed markets that provide products and services aimed at promoting physical wellness through active and healthy lifestyles, including but not limited to fitness equipment and technology, athletic apparel, nutritional supplements, and organic/ natural food offerings.
For the 12-month period ended November 30, 2023 (the “reporting period”), the Fund increased 5.64%, while the Underlying Index increased 6.04%. The Fund had a net asset value of $21.37 per share on November 30, 2022 and ended the reporting period with a net asset value of $22.35 on November 30, 2023.
During the reporting period, the highest returns came from BellRing Brands, Inc. and WW International, Inc., which returned 112.36% and 105.08%, respectively. The worst performers were F45 Training Holdings, Inc. and Li Ning Company Limited, which returned -66.17% and -63.76%, respectively.
The Fund recorded positive returns during the reporting period as increased focus on health, prevention, and self-care among consumers supported the global health and wellness market. Higher consumer spending on products and services geared towards maintaining a healthy and active lifestyle further supported investor sentiment. Technological advancements and integration of digital devices in the health and wellness industry increased demand for fitness wearable devices. Furthermore, the wellness economy continued to grow amid increased government expenditure on the development of sophisticated healthcare infrastructure and new medical technologies. Ongoing supply chain and recessionary concerns limited upside in the Fund during the reporting period, with slower-than-expected demand for high end home workout equipment and athletic apparel. During the reporting period, the Fund had an average approximate stock exposure of 39.93% in the United States and 14.72% in Japan. By sector, the Fund had its highest exposures, on average, to Consumer Discretionary at 70.84%, followed by Consumer Staples at 23.61%.
| | AVERAGE ANNUAL TOTAL RETURN FOR THE YEAR ENDED
NOVEMBER 30, 2023 |
| | One Year Return | Three Year Return | Five Year Return | Annualized
Inception to Date* |
| | Net
Asset
Value | Market
Price | Net
Asset
Value | Market
Price | Net
Asset
Value | Market
Price | Net
Asset
Value | Market
Price |
| Global X Health & Wellness ETF | 5.64% | 5.36% | -1.71% | -1.93% | 4.52% | 4.35% | 6.27% | 6.34% |
| Indxx Global Health & Wellness Thematic Index | 6.04% | 6.04% | -1.38% | -1.38% | 4.90% | 4.90% | 6.70% | 6.70% |
| MSCI ACWI Index (Net) | 12.01% | 12.01% | 5.69% | 5.69% | 9.07% | 9.07% | 9.71% | 9.71% |
5
Management Discussion of Fund Performance (unaudited)
Global X Health & Wellness ETF
Growth of a 10,000 Investment
(at Net Asset Value)

* The Fund commenced operations on May 9, 2016.
The MSCI ACWI (Net) (All Country World Index) Index is a free float-adjusted market capitalization weighted index that is designed to measure the equity market performance of developed and emerging markets.
The performance data quoted herein represents past performance and the return and value of an investment in the Fund will fluctuate so that, when sold, it may be worth less than its original cost. Past performance is no guarantee of future performance and should not be considered as a representation of the future results of the Fund. The Fund’s performance assumes the reinvestment of all dividends and all capital gains. Index returns assume reinvestment of dividends and, unlike the Fund’s returns, do not reflect any fees or expenses. If such fees and expenses were included in the index returns, the performance would have been lower. Please note that one cannot invest directly in an unmanaged index.
Performance figures for the periods shown may reflect contractual fee waivers and/or expense reimbursements. In the absence of fee waivers and/or expense reimbursements (if applicable), returns would have been lower.
There are no assurances that the Fund will meet its stated objectives.
The Fund’s holdings and allocations are subject to change and should not be considered recommendations to buy individual securities.
The graph and table do not reflect the deduction of taxes that a shareholder would pay on Fund distributions or the redemption or sale of Fund shares.
See definition of comparative indices on the previous page and above.
6
Management Discussion of Fund Performance (unaudited)
Global X Robotics & Artificial Intelligence ETF
Global X Robotics & Artificial Intelligence ETF
Global X Robotics & Artificial Intelligence ETF (the “Fund”) seeks to provide investment results that correspond generally to the price and yield performance, before fees and expenses, of the Indxx Global Robotics & Artificial Intelligence Thematic Index (“Underlying Index”). The Fund is passively managed and the investment adviser does not attempt to take defensive positions in declining markets. The Fund generally seeks to fully replicate the Underlying Index.
The Underlying Index seeks to invest in companies that potentially stand to benefit from increased adoption and utilization of robotics and artificial intelligence (AI), including those involved with industrial robotics and automation, non-industrial robots, and autonomous vehicles.
For the 12-month period ended November 30, 2023 (the “reporting period”), the Fund increased 25.75%, while the Underlying Index increased 26.09%. The Fund had a net asset value of $21.09 per share on November 30, 2022 and ended the reporting period with a net asset value of $26.47 on November 30, 2023.
During the reporting period, the highest returns came from Rainbow Robotics and Symbotic Inc., which returned 448.70% and 199.60%, respectively. The worst performers were Tusimple Holdings Inc. Class A and Faro Technologies Inc., which returned -62.18% and -38.60%, respectively.
The Fund recorded positive returns during the reporting period amid heightened adoption rates of automation to combat labor shortages and supply chain inefficiencies in artificial intelligence, alongside other advancements. Industrial robotics installations experienced momentum worldwide over the course of the reporting period. This trend was fueled by the increasing affordability and sophistication of robots, which led to higher precision and productivity across various industries. Concurrently, the shift towards reshoring and supply chain diversification spurred demand for automated manufacturing. This demand proved crucial in enhancing quality, reducing costs, and maintaining global competitiveness. In the U.S. specifically, substantial investment in chip manufacturing also propelled automation. Similarly, service robots, especially those used in delivery and healthcare, also expanded their presence due to advancements in generative AI technology and the growing use of internet of things devices. During the reporting period, the Fund had an average approximate stock exposure of 46.74% in United States and 32.29% in Japan. By sector, the Fund had its highest average sector exposure to Information Technology at 42.77%, followed by Industrials at 39.46%).
| | AVERAGE ANNUAL TOTAL RETURN FOR THE YEAR ENDED
NOVEMBER 30, 2023 |
| | One Year Return | Three Year Return | Five Year Return | Annualized
Inception to Date* |
| | Net
Asset
Value | Market
Price | Net
Asset
Value | Market
Price | Net
Asset
Value | Market
Price | Net
Asset
Value | Market
Price |
| Global X Robotics & Artificial Intelligence ETF | 25.75% | 23.56% | -5.73% | -5.65% | 6.76% | 6.69% | 8.83% | 8.81% |
| Indxx Global Robotics & Artificial Intelligence Thematic Index | 26.09% | 26.09% | -5.24% | -5.24% | 7.22% | 7.22% | 9.22% | 9.22% |
| MSCI ACWI Index (Net) | 12.01% | 12.01% | 5.69% | 5.69% | 9.07% | 9.07% | 9.32% | 9.32% |
7
Management Discussion of Fund Performance (unaudited)
Global X Robotics & Artificial Intelligence ETF
Growth of a 10,000 Investment
(at Net Asset Value)

* The Fund commenced operations on September 12, 2016.
The MSCI ACWI (Net) (All Country World Index) Index is a free float-adjusted market capitalization weighted index that is designed to measure the equity market performance of developed and emerging markets.
The performance data quoted herein represents past performance and the return and value of an investment in the Fund will fluctuate so that, when sold, it may be worth less than its original cost. Past performance is no guarantee of future performance and should not be considered as a representation of the future results of the Fund. The Fund’s performance assumes the reinvestment of all dividends and all capital gains. Index returns assume reinvestment of dividends and, unlike the Fund’s returns, do not reflect any fees or expenses. If such fees and expenses were included in the index returns, the performance would have been lower. Please note that one cannot invest directly in an unmanaged index.
Performance figures for the periods shown may reflect contractual fee waivers and/or expense reimbursements. In the absence of fee waivers and/or expense reimbursements (if applicable), returns would have been lower.
There are no assurances that the Fund will meet its stated objectives.
The Fund’s holdings and allocations are subject to change and should not be considered recommendations to buy individual securities.
The graph and table do not reflect the deduction of taxes that a shareholder would pay on Fund distributions or the redemption or sale of Fund shares.
See definition of comparative indices on the previous page and above.
8
Management Discussion of Fund Performance (unaudited)
Global X FinTech ETF
Global X FinTech ETF
The Global X FinTech ETF (the “Fund”) seeks to provide investment results that correspond generally to the price and yield performance, before fees and expenses, of the Indxx Global FinTech Thematic Index (“Underlying Index”). The Fund is passively managed, and the investment adviser does not attempt to take defensive positions in declining markets. The Fund generally seeks to fully replicate the Underlying Index.
The Underlying Index is designed to provide exposure to exchange-listed companies in developed markets that provide financial technology products and services, including companies involved in mobile payments, peer-to-peer (“P2P”) and marketplace lending, financial analytics software and alternative currencies (collectively, “FinTech Companies”), as defined by Indxx, LLC, the provider of the Underlying Index.
For the 12-month period ended November 30, 2023 (the “reporting period”), the Fund increased 9.70%, while the Underlying Index increased 10.00%. The Fund had a net asset value of $20.44 per share on November 30, 2022 and ended the reporting period with a net asset value of $22.37 on November 30, 2023.
During the reporting period, the highest returns came from Coinbase Global Inc. Class-A and Riot Platforms Inc., which returned 172.73% and 169.89%, respectively. The worst performers were Sunlight Financial Holdings Inc. Class A and Linklogis Inc. Class-B, which returned -61.33% and -55.42%, respectively.
The Fund recorded positive performance during the reporting period as digital wallet adoption and point-of-sale (POS) systems generated additional revenues for FinTech Companie. In response to the U.S. Federal Reserve’s increase in interest rates and borrowing costs, market players adapted to the economic environment by embracing new features and functionalities to stabilize revenues, with a focus on improving margins. Furthermore, the rise of artificial intelligence and machine learning reduced costs for financial institutions in assessing the credibility of borrowers and their spending behaviors. Lastly, the broader improvement in the crypto industry further helped boost revenues and profits in crypto exposed franchises of FinTech Companies. Companies that supply financial software and technology to traditional banks and legacy financial institutions also saw strong performance, and banks continued to spend incremental dollars on digitizing their information technology. During the reporting period, the Fund had an average approximate stock exposure of 62.90% in United States. By sector, it had the highest exposure to Financials at 66.39% and Information Technology at 27.47%.
| | AVERAGE ANNUAL TOTAL RETURN FOR THE YEAR ENDED
NOVEMBER 30, 2023 |
| | One Year Return | Three Year Return | Five Year Return | Annualized
Inception to Date* |
| | Net
Asset
Value | Market
Price | Net
Asset
Value | Market
Price | Net
Asset
Value | Market
Price | Net
Asset
Value | Market
Price |
| Global X FinTech ETF | 9.70% | 8.82% | -17.87% | -17.92% | -0.68% | -0.73% | 6.49% | 6.46% |
| Indxx Global Fintech Thematic Index | 10.00% | 10.00% | -17.58% | -17.58% | -0.22% | -0.22% | 7.04% | 7.04% |
| MSCI ACWI Index (Net) | 12.01% | 12.01% | 5.69% | 5.69% | 9.07% | 9.07% | 9.32% | 9.32% |
9
Management Discussion of Fund Performance (unaudited)
Global X FinTech ETF
Growth of a 10,000 Investment
(at Net Asset Value)

* The Fund commenced operations on September 12, 2016.
The MSCI ACWI (Net) (All Country World Index) Index is a free float-adjusted market capitalization weighted index that is designed to measure the equity market performance of developed and emerging markets.
The performance data quoted herein represents past performance and the return and value of an investment in the Fund will fluctuate so that, when sold, it may be worth less than its original cost. Past performance is no guarantee of future performance and should not be considered as a representation of the future results of the Fund. The Fund’s performance assumes the reinvestment of all dividends and all capital gains. Index returns assume reinvestment of dividends and, unlike the Fund’s returns, do not reflect any fees or expenses. If such fees and expenses were included in the index returns, the performance would have been lower. Please note that one cannot invest directly in an unmanaged index.
Performance figures for the periods shown may reflect contractual fee waivers and/or expense reimbursements. In the absence of fee waivers and/or expense reimbursements (if applicable), returns would have been lower.
There are no assurances that the Fund will meet its stated objectives.
The Fund’s holdings and allocations are subject to change and should not be considered recommendations to buy individual securities.
The graph and table do not reflect the deduction of taxes that a shareholder would pay on Fund distributions or the redemption or sale of Fund shares.
See definition of comparative indices on the previous page and above.
10
Management Discussion of Fund Performance (unaudited)
Global X Internet of Things ETF
Global X Internet of Things ETF
Global X Internet of Things ETF (the “Fund”) seeks to provide investment results that correspond generally to the price and yield performance, before fees and expenses, of the Indxx Global Internet of Things Thematic Index (“Underlying Index”). The Fund is passively managed, and the investment adviser does not attempt to take defensive positions in declining markets. The Fund generally seeks to fully replicate the Underlying Index.
The Underlying Index seeks to invest in companies that stand to potentially benefit from the broader adoption of the Internet of Things (“IoT”). This includes the development and manufacturing of semiconductors and sensors, integrated products and solutions, and applications serving smart grids, smart homes, connected cars, and the industrial internet.
For the 12-month period ended November 30, 2023 (the “reporting period”), the Fund increased 7.26%, while the Underlying Index increased 7.78%. The Fund had a net asset value of $30.54 per share on November 30, 2022 and ended the reporting period with a net asset value of $32.45 on November 30, 2023.
During the reporting period, the highest returns came from Samsara Inc. CL-A and Arlo Technologies Inc., which returned 188.98% and 137.96%, respectively. The worst performers were Butterfly Network Inc. and Spirent Communications Plc, which returned -70.52% and -55.14%, respectively.
The Fund recorded positive returns during the reporting period amid heightened industrial and automotive demand due to increased spending on industrial automation and growing use of semiconductors in autonomous vehicles. Furthermore, businesses benefitted through the synergy between IoT, data analytics, and generative artificial intelligence (AI) to optimize operations and improve customer experiences. Enhanced connectivity through high-speed internet, including 5G networks, provided greater network reliability and opened new possibilities for IoT applications in areas such as smart cities and healthcare. Lastly, increased deployments of IoT solutions amid development of more robust encryption protocols and security measures further supported IoT growth. During the reporting period, by sector, the Fund had the highest average exposure to Information Technology at 65.51% and Industrials at 17.10%.
11
Management Discussion of Fund Performance (unaudited)
Global X Internet of Things ETF
| | AVERAGE ANNUAL TOTAL RETURN FOR THE YEAR ENDED
NOVEMBER 30, 2023 |
| | One Year Return | Three Year Return | Five Year Return | Annualized
Inception to Date* |
| | Net
Asset
Value | Market
Price | Net
Asset
Value | Market
Price | Net
Asset
Value | Market
Price | Net
Asset
Value | Market
Price |
| Global X Internet of Things ETF | 7.26% | 6.64% | 3.33% | 3.34% | 13.42% | 13.45% | 12.12% | 12.12% |
| Indxx Global Internet of Things Thematic Index | 7.78% | 7.78% | 3.72% | 3.72% | 13.80% | 13.80% | 12.50% | 12.50% |
| MSCI ACWI Index (Net) | 12.01% | 12.01% | 5.69% | 5.69% | 9.07% | 9.07% | 9.32% | 9.32% |
Growth of a 10,000 Investment
(at Net Asset Value)

* The Fund commenced operations on September 12, 2016.
The MSCI ACWI (Net) (All Country World Index) Index is a free float-adjusted market capitalization weighted index that is designed to measure the equity market performance of developed and emerging markets.
The performance data quoted herein represents past performance and the return and value of an investment in the Fund will fluctuate so that, when sold, it may be worth less than its original cost. Past performance is no guarantee of future performance and should not be considered as a representation of the future results of the Fund. The Fund’s performance assumes the reinvestment of all dividends and all capital gains. Index returns assume reinvestment of dividends and, unlike the Fund’s returns, do not reflect any fees or expenses. If such fees and expenses were included in the index returns, the performance would have been lower. Please note that one cannot invest directly in an unmanaged index.
Performance figures for the periods shown may reflect contractual fee waivers and/or expense reimbursements. In the absence of fee waivers and/or expense reimbursements (if applicable), returns would have been lower.
12
Management Discussion of Fund Performance (unaudited)
Global X Internet of Things ETF
There are no assurances that the Fund will meet its stated objectives.
The Fund’s holdings and allocations are subject to change and should not be considered recommendations to buy individual securities.
The graph and table do not reflect the deduction of taxes that a shareholder would pay on Fund distributions or the redemption or sale of Fund shares.
See definition of comparative indices on the previous pages.
13
Management Discussion of Fund Performance (unaudited)
Global X U.S. Infrastructure Development ETF
Global X U.S. Infrastructure Development ETF
Global X U.S. Infrastructure Development ETF (the “Fund”) seeks to provide investment results that correspond generally to the price and yield performance, before fees and expenses, of the Indxx U.S. Infrastructure Development Index (“Underlying Index”). The Fund is passively managed, and the investment adviser does not attempt to take defensive positions in declining markets. The Fund generally seeks to fully replicate the Underlying Index.
The Underlying Index is designed to measure the performance of U.S. listed companies that provide exposure to domestic infrastructure development, including companies involved in construction and engineering; production of infrastructure raw materials, composites and products; industrial transportation; and producers/distributors of heavy construction equipment (collectively, “U.S. Infrastructure Development Companies”), as defined by Indxx, LLC, the provider of the Underlying Index.
For the 12-month period ended November 30, 2023 (the “reporting period”), the Fund increased 13.63%, while the Underlying Index increased 14.31%. The Fund had a net asset value of $27.94 per share on November 30, 2022 and ended the reporting period with a net asset value of $31.50 on November 30, 2023.
During the reporting period, the highest returns came from Powell Industries Inc. and Atlas Technical Consultants, which returned 221.37% and 124.21%, respectively. The worst performers were Titan Machinery Inc. and Calix Inc., which returned -48.08% and -45.88%, respectively.
The Fund recorded a positive performance during the reporting period as U.S. Infrastructure Development Companies continued to benefit from high demand for construction work and positive sentiments toward the Infrastructure Investment and Jobs Act (IIJA), Inflation Reduction Act (IRA), and CHIPS Act. The United States also experienced a surge in manufacturing construction spending as companies reoriented their supply chains in the fallout from disruptive events such as the COVID-19 pandemic and conflict in Ukraine. Infrastructure companies with the expertise to build out industrial capacity also benefitted from this onshoring trend. Lastly, after softening around the beginning of the reporting period, construction input prices stabilized, providing support for materials suppliers within the Fund. During the reporting period, by sector, the Fund had the highest exposure to Industrials at 71.80% and Materials at 22.00%.
| | AVERAGE ANNUAL TOTAL RETURN FOR THE YEAR ENDED
NOVEMBER 30, 2023 |
| | One Year
Return | Three Year
Return | Five Year
Return | Annualized
Inception to Date* |
| | Net
Asset
Value | Market
Price | Net
Asset
Value | Market
Price | Net
Asset
Value | Market
Price | Net
Asset
Value | Market
Price |
| Global X U.S. Infrastructure Development ETF | 13.63% | 13.59% | 16.62% | 16.53% | 15.98% | 15.95% | 12.31% | 12.31% |
| Indxx U.S. Infrastructure Development Index | 14.31% | 14.31% | 17.32% | 17.32% | 16.60% | 16.60% | 12.90% | 12.90% |
| S&P 500® Index | 13.84% | 13.84% | 9.76% | 9.76% | 12.51% | 12.51% | 12.17% | 12.17% |
14
Management Discussion of Fund Performance (unaudited)
Global X U.S. Infrastructure Development ETF
Growth of a 10,000 Investment
(at Net Asset Value)

* The Fund commenced operations on March 6, 2017.
The S&P 500® Index is a market capitalization weighted composite index of 500 large capitalization U.S. companies.
The performance data quoted herein represents past performance and the return and value of an investment in the Fund will fluctuate so that, when sold, it may be worth less than its original cost. Past performance is no guarantee of future performance and should not be considered as a representation of the future results of the Fund. The Fund’s performance assumes the reinvestment of all dividends and all capital gains. Index returns assume reinvestment of dividends and, unlike the Fund’s returns, do not reflect any fees or expenses. If such fees and expenses were included in the index returns, the performance would have been lower. Please note that one cannot invest directly in an unmanaged index.
Performance figures for the periods shown may reflect contractual fee waivers and/or expense reimbursements. In the absence of fee waivers and/or expense reimbursements (if applicable), returns would have been lower.
There are no assurances that the Fund will meet its stated objectives.
The Fund’s holdings and allocations are subject to change and should not be considered recommendations to buy individual securities.
The graph and table do not reflect the deduction of taxes that a shareholder would pay on Fund distributions or the redemption or sale of Fund shares.
See definition of comparative indices on the previous page and above.
15
Management Discussion of Fund Performance (unaudited)
Global X Autonomous & Electric Vehicles ETF
Global X Autonomous & Electric Vehicles ETF
Global X Autonomous & Electric Vehicles ETF (the “Fund”) seeks to provide investment results that correspond generally to the price and yield performance, before fees and expenses, of the Solactive Autonomous & Electric Vehicles Index (“Underlying Index”). The Fund is passively managed, and the investment adviser does not attempt to take defensive positions in declining markets. The Fund generally seeks to fully replicate the Underlying Index.
The Underlying Index is designed to provide exposure to exchange-listed companies that are involved in the development of electric vehicles and/or autonomous vehicles, including companies that produce electric/hybrid vehicles, electric/hybrid vehicle components and materials, autonomous driving technology, and network connected services for transportation, as defined by Solactive AG, the provider of the Underlying Index.
For the 12-month period ended November 30, 2023 (the “reporting period”), the Fund increased 2.71%, while the Underlying Index increased 2.64%. The Fund had a net asset value of $22.89 per share on November 30, 2022 and ended the reporting period with a net asset value of $23.19 on November 30, 2023.
During the reporting period, the highest returns came from NVIDIA Corporation and Hyster-Yale Materials Handling, Inc. Class A, which returned 176.47% and 67.61%, respectively. The worst performers were Plug Power Inc. and Innoviz Technologies Ltd., which returned -74.69% and -68.16%, respectively.
The Fund recorded modestly positive returns during the reporting period due to strong performances from big tech companies that are aligned with autonomous vehicle development as well as continued growth for the electric vehicle (“EV”) industry. A combination of accommodative government policy, technological innovation, deployment of charging infrastructure, and expanded commitments from traditional automakers continued to support progress in EV adoption. Declining battery-related commodity costs and price wars between automakers improved EV affordability, although they continue to sell at an upfront premium to internal combustion engine vehicles. EV sales did not grow as quickly as expected during the reporting period due to economic headwinds in China and elevated borrowing costs for consumers around the world. During the reporting period, the Fund had an average approximate stock exposure of 55.50% in the United States and 10.81% in Japan. By sector, it had the highest average exposure to Consumer Discretionary at 35.39%, followed by Information Technology at 29.80%.
| | AVERAGE ANNUAL TOTAL RETURN FOR THE YEAR ENDED
NOVEMBER 30, 2023 |
| | One Year Return | Three Year Return | Five Year Return | Annualized
Inception to Date* |
| | Net
Asset
Value | Market
Price | Net
Asset
Value | Market
Price | Net
Asset
Value | Market
Price | Net
Asset
Value | Market
Price |
| Global X Autonomous & Electric Vehicles ETF | 2.71% | 1.65% | 2.94% | 2.75% | 13.34% | 13.32% | 9.33% | 9.27% |
| Solactive Autonomous & Electric Vehicles Index | 2.64% | 2.64% | 3.17% | 3.17% | 13.53% | 13.53% | 9.49% | 9.49% |
| MSCI ACWI Index (Net) | 12.01% | 12.01% | 5.69% | 5.69% | 9.07% | 9.07% | 7.51% | 7.51% |
16
Management Discussion of Fund Performance (unaudited)
Global X Autonomous & Electric Vehicles ETF
Growth of a 10,000 Investment
(at Net Asset Value)

* The Fund commenced operations on April 13, 2018.
The MSCI ACWI (Net) (All Country World Index) Index is a free float-adjusted market capitalization weighted index that is designed to measure the equity market performance of developed and emerging markets.
The performance data quoted herein represents past performance and the return and value of an investment in the Fund will fluctuate so that, when sold, it may be worth less than its original cost. Past performance is no guarantee of future performance and should not be considered as a representation of the future results of the Fund. The Fund’s performance assumes the reinvestment of all dividends and all capital gains. Index returns assume reinvestment of dividends and, unlike the Fund’s returns, do not reflect any fees or expenses. If such fees and expenses were included in the index returns, the performance would have been lower. Please note that one cannot invest directly in an unmanaged index.
Performance figures for the periods shown may reflect contractual fee waivers and/or expense reimbursements. In the absence of fee waivers and/or expense reimbursements (if applicable), returns would have been lower.
There are no assurances that the Fund will meet its stated objectives.
The Fund’s holdings and allocations are subject to change and should not be considered recommendations to buy individual securities.
The graph and table do not reflect the deduction of taxes that a shareholder would pay on Fund distributions or the redemption or sale of Fund shares.
See definition of comparative indices on the previous page and above.
17
Management Discussion of Fund Performance (unaudited)
Global X Artificial Intelligence & Technology ETF
Global X Artificial Intelligence & Technology ETF
Global X Artificial Intelligence & Technology ETF (the “Fund”) seeks to provide investment results that correspond generally to the price and yield performance, before fees and expenses, of the Indxx Artificial Intelligence & Big Data Index (“Underlying Index”). The Fund is passively managed and the investment adviser does not attempt to take defensive positions in declining markets. The Fund generally seeks to fully replicate the Underlying Index.
The Underlying Index is designed to provide exposure to exchange-listed companies in developed markets that are positioned to benefit from the further development and implementation of artificial intelligence technology, as well as to companies that provide critical technology and services for the analysis of large and complex data sets (collectively, “Artificial Intelligence & Big Data Companies”).
For the 12-month period ended November 30, 2023 (the “reporting period”), the Fund increased 38.56%, while the Underlying Index increased 39.45%. The Fund had a net asset value of $21.54 per share on November 30, 2022 and ended the reporting period with a net asset value of $29.73 on November 30, 2023.
During the reporting period, the highest returns came from Alchip Technologies Ltd. and Super Micro Computer Inc., which returned 233.68% and 203.08%, respectively. The worst performers were Meituan-Class B and Envestnet Inc., which returned -44.66% and -41.49%, respectively.
The Fund recorded positive performance during the reporting period as strong growth in the artificial intelligence (“AI”) market and its positive impact on productivity supported economic gains. The growing use of AI-as-a-service gave an opportunity for cloud computing companies to monetize their services by partnering with emerging AI startups and upselling additional cloud infrastructure to their expansive user bases. Additionally, the introduction of new generative AI tools to enhance user experiences contributed to the Fund’s performance. Multi-sectoral applications of AI for automation, productivity enhancement, and quality control gave investors confidence in companies looking to utilize AI for improving profit margins. Investor confidence was also boosted as the technology companies operating in this realm prioritized cost-cutting measures and workforce reductions to enhance margins and improve bottom-line performance. During the reporting period, the Fund had the highest average sector exposure to Information Technology at 61.36%, followed by Communication Services at 14.79%.
| | AVERAGE ANNUAL TOTAL RETURN FOR THE YEAR ENDED
NOVEMBER 30, 2023 |
| | One Year Return | Three Year Return | Five Year Return | Annualized
Inception to Date* |
| | Net
Asset
Value | Market
Price | Net
Asset
Value | Market
Price | Net
Asset
Value | Market
Price | Net
Asset
Value | Market
Price |
| Global X Artificial Intelligence & Technology ETF | 38.56% | 37.28% | 5.14% | 4.98% | 16.43% | 16.45% | 13.60% | 13.60% |
| Indxx Artificial Intelligence & Big Data Index | 39.45% | 39.45% | 5.67% | 5.67% | 16.94% | 16.94% | 14.09% | 14.09% |
| MSCI ACWI Index (Net) | 12.01% | 12.01% | 5.69% | 5.69% | 9.07% | 9.07% | 7.23% | 7.23% |
18
Management Discussion of Fund Performance (unaudited)
Global X Artificial Intelligence & Technology ETF
Growth of a 10,000 Investment
(at Net Asset Value)

* The Fund commenced operations on May 11, 2018.
The MSCI ACWI (Net) (All Country World Index) Index is a free float-adjusted market capitalization weighted index that is designed to measure the equity market performance of developed and emerging markets.
The performance data quoted herein represents past performance and the return and value of an investment in the Fund will fluctuate so that, when sold, it may be worth less than its original cost. Past performance is no guarantee of future performance and should not be considered as a representation of the future results of the Fund. The Fund’s performance assumes the reinvestment of all dividends and all capital gains. Index returns assume reinvestment of dividends and, unlike the Fund’s returns, do not reflect any fees or expenses. If such fees and expenses were included in the index returns, the performance would have been lower. Please note that one cannot invest directly in an unmanaged index.
Performance figures for the periods shown may reflect contractual fee waivers and/or expense reimbursements. In the absence of fee waivers and/or expense reimbursements (if applicable), returns would have been lower.
There are no assurances that the Fund will meet its stated objectives.
The Fund’s holdings and allocations are subject to change and should not be considered recommendations to buy individual securities.
The graph and table do not reflect the deduction of taxes that a shareholder would pay on Fund distributions or the redemption or sale of Fund shares.
See definition of comparative indices on the previous page and above.
19
Management Discussion of Fund Performance (unaudited)
Global X Genomics & Biotechnology ETF
Global X Genomics & Biotechnology ETF
Global X Genomics & Biotechnology ETF (the “Fund”) seeks to provide investment results that correspond generally to the price and yield performance, before fees and expenses, of the Solactive Genomics Index (“Underlying Index”). The Fund is passively managed and the investment adviser does not attempt to take defensive positions in declining markets. The Fund generally seeks to fully replicate the Underlying Index.
The Underlying Index is designed to provide exposure to exchange-listed companies that are positioned to benefit from further advances in the field of genomic science and biotechnology, as well as applications thereof (collectively, “Genomics & Biotechnology Companies”), as defined by Solactive AG, the provider of the Underlying Index (“Index Provider”). In order to be eligible for inclusion in the Underlying Index, a company is considered by the Index Provider to be a Genomics & Biotechnology Company if it derives at least 50% of its revenue, operating income, or assets from genomics and/or biotechnology.
For the 12-month period ended November 30, 2023 (the “reporting period”), the Fund decreased 22.60%, while the Underlying Index decreased 22.22%. The Fund had a net asset value of $13.45 per share on November 30, 2022 and ended the reporting period with a net asset value of $10.41 on November 30, 2023.
During the reporting period, the highest returns came from Avidity Biosciences Inc. and Natera Inc., which returned 42.52% and 36.07%, respectively. The worst performers were Bionano Genomics Inc. and Sangamo Therapeutics Inc., which returned -93.53% and -91.88%, respectively.
The Fund recorded negative returns during the reporting period on account of challenges faced by biotechnology companies due to growing inflationary pressures and regulatory scrutiny. Rising interest rates affected biotech companies that rely on debt financing to fund their research and development expenses. This forced the industry to prioritize operational efficiencies to expand cash runway and accelerate the path towards profitability, in turn, deprioritizing product innovation. Genomics & Biotechnology Companies were also impacted by a slowdown in mergers and acquisitions (M&A) amid growing scrutiny from regulatory bodies that has put a hold on potential exit opportunities for smaller genomics companies. Continued supply chain constraints also hampered the industry during the reporting period, resulting in shortages of key medications and more costly manufacturing of complex treatment categories.
| | AVERAGE ANNUAL TOTAL RETURN FOR THE YEAR
ENDED
NOVEMBER 30, 2023 |
| | One Year
Return | Three Year
Return | Annualized
Inception to Date* |
| | Net Asset
Value | Market
Price | Net Asset
Value | Market
Price | Net Asset
Value | Market
Price |
| Global X Genomics & Biotechnology ETF | -22.60% | -22.81% | -20.83% | -20.83% | -7.88% | -7.49% |
| Solactive Genomics Index | -22.22% | -22.22% | -20.49% | -20.49% | -7.42% | -7.42% |
| MSCI ACWI Index (Net) | 12.01% | 12.01% | 5.69% | 5.69% | 8.30% | 8.30% |
20
Management Discussion of Fund Performance (unaudited)
Global X Genomics & Biotechnology ETF
Growth of a 10,000 Investment
(at Net Asset Value)

* The Fund commenced operations on April 5, 2019.
The MSCI ACWI (Net) (All Country World Index) Index is a free float-adjusted market capitalization weighted index that is designed to measure the equity market performance of developed and emerging markets.
The performance data quoted herein represents past performance and the return and value of an investment in the Fund will fluctuate so that, when sold, it may be worth less than its original cost. Past performance is no guarantee of future performance and should not be considered as a representation of the future results of the Fund. The Fund’s performance assumes the reinvestment of all dividends and all capital gains. Index returns assume reinvestment of dividends and, unlike the Fund’s returns, do not reflect any fees or expenses. If such fees and expenses were included in the index returns, the performance would have been lower. Please note that one cannot invest directly in an unmanaged index.
Performance figures for the periods shown may reflect contractual fee waivers and/or expense reimbursements. In the absence of fee waivers and/or expense reimbursements (if applicable), returns would have been lower.
There are no assurances that the Fund will meet its stated objectives.
The Fund’s holdings and allocations are subject to change and should not be considered recommendations to buy individual securities.
The graph and table do not reflect the deduction of taxes that a shareholder would pay on Fund distributions or the redemption or sale of Fund shares.
See definition of comparative indices on the previous page and above.
21
Management Discussion of Fund Performance (unaudited)
Global X Cloud Computing ETF
Global X Cloud Computing ETF
Global X Cloud Computing ETF (the “Fund”) seeks to provide investment results that correspond generally to the price and yield performance, before fees and expenses, of the Indxx Global Cloud Computing Index (“Underlying Index”). The Fund is passively managed, and the investment adviser does not attempt to take defensive positions in declining markets. The Fund generally seeks to fully replicate the Underlying Index.
The Underlying Index is designed to provide exposure to exchange-listed companies in developed and emerging markets that are positioned to benefit from the increased adoption of cloud computing technology, including but not limited to companies whose principal business is in offering computing Software-as-a-Service (SaaS), Platform-as-a-Service (PaaS), Infrastructure-as-a-Service (IaaS), managed server storage space and data center REITs, and/or cloud and edge computing infrastructure and hardware (collectively, “Cloud Computing Companies”), as defined by Indxx LLC, the provider of the Indxx Global Cloud Computing Index.
For the 12-month period ended November 30, 2023 (the “reporting period”), the Fund increased 23.97%, while the Underlying Index increased 24.77%. The Fund had a net asset value of $16.77 per share on November 30, 2022 and ended the reporting period with a net asset value of $20.79 on November 30, 2023.
During the reporting period, the highest returns came from Shopify Inc. Class-A and Fastly Inc. Class-A, which returned 78.13% and 71.95%, respectively. The worst performers were 2U Inc. and Paycom Software Inc., which returned -87.77% and -46.17%, respectively.
The Fund recorded positive returns during the reporting period resulting from a broad uplift in profitability for companies as well as an increased adoption of cloud technology and generative artificial intelligence (“AI”)-based products and services. Hyperscale cloud platforms capitalized on the generative AI platform shift by quickly enabling access to emerging large-language models through their platforms, and cross selling cloud services to new customers. Similarly, software companies were able to incrementally monetize their offerings by building automated and AI-driven end solutions to clients looking to improve efficiency. Lastly, technology companies operating in the cloud computing market also focused on cost-cutting measures and workforce reductions to enhance margins and improve bottom-line performance, which helped boost broad investor confidence. The continued rise and use of data-heavy assets further helped drive spending on cloud computing services during the period.
| | AVERAGE ANNUAL TOTAL RETURN FOR THE YEAR
ENDED
NOVEMBER 30, 2023 |
| | One Year
Return | Three Year
Return | Annualized
Inception to Date* |
| | Net Asset
Value | Market
Price | Net Asset
Value | Market
Price | Net Asset
Value | Market
Price |
| Global X Cloud Computing ETF | 23.97% | 23.78% | -6.45% | -6.53% | 7.61% | 7.68% |
| Indxx Global Cloud Computing Index | 24.77% | 24.77% | -5.85% | -5.85% | 8.28% | 8.28% |
| MSCI ACWI Index (Net) | 12.01% | 12.01% | 5.69% | 5.69% | 8.23% | 8.23% |
22
Management Discussion of Fund Performance (unaudited)
Global X Cloud Computing ETF
Growth of a 10,000 Investment
(at Net Asset Value)

* The Fund commenced operations on April 12, 2019.
The MSCI ACWI (Net) (All Country World Index) Index is a free float-adjusted market capitalization weighted index that is designed to measure the equity market performance of developed and emerging markets.
The performance data quoted herein represents past performance and the return and value of an investment in the Fund will fluctuate so that, when sold, it may be worth less than its original cost. Past performance is no guarantee of future performance and should not be considered as a representation of the future results of the Fund. The Fund’s performance assumes the reinvestment of all dividends and all capital gains. Index returns assume reinvestment of dividends and, unlike the Fund’s returns, do not reflect any fees or expenses. If such fees and expenses were included in the index returns, the performance would have been lower. Please note that one cannot invest directly in an unmanaged index.
Performance figures for the periods shown may reflect contractual fee waivers and/or expense reimbursements. In the absence of fee waivers and/or expense reimbursements (if applicable), returns would have been lower.
There are no assurances that the Fund will meet its stated objectives.
The Fund’s holdings and allocations are subject to change and should not be considered recommendations to buy individual securities.
The graph and table do not reflect the deduction of taxes that a shareholder would pay on Fund distributions or the redemption or sale of Fund shares.
See definition of comparative indices on the previous page and above.
23
Management Discussion of Fund Performance (unaudited)
Global X Cannabis ETF
Global X Cannabis ETF
Global X Cannabis ETF (the “Fund”) seeks to provide investment results that correspond generally to the price and yield performance, before fees and expenses, of the Solactive Cannabis Index (“Underlying Index”). The Fund is passively managed and the investment adviser does not attempt to take defensive positions in declining markets. The Fund generally seeks to fully replicate the Underlying Index.
The Underlying Index, designed to provide exposure to exchange-listed companies that are active in the cannabis industry (collectively, “Cannabis Companies”). In order to be eligible for inclusion in the Cannabis Index, a company is considered by the Index Provider to be a Cannabis Company if it derives at least 50% of its revenue, operating income, or assets from the cannabis industry. These companies include those involved in the following areas of the cannabis industry: (i) the legal production, growth and distribution of marijuana, as well as extracts, derivative products or synthetic versions thereof; (ii) the legal production, growth and distribution of hemp, as well as extracts, derivative products or synthetic versions thereof; (iii) financial services (insurance offerings, property leasing, financing, capital markets activity and investments) provided to companies involved in the production, growth and distribution of cannabis; (iv) pharmaceutical applications of cannabis; (v) cannabidiol (better known as CBD) and cannabis oil products, edibles, topicals, drinks and other products; and (vi) products that may be used to consume cannabis; and (vii) the provision of software and/or online marketplaces or platforms primarily for the cannabis sector.
For the 12-month period ended November 30, 2023 (the “reporting period”), the Fund decreased 61.63%, while the Underlying Index decreased 63.58%. The Fund had a net asset value of $14.95 per share on November 30, 2022 and ended the reporting period with a net asset value of $5.52 on November 30, 2023.
During the reporting period, the highest returns came from Hexo Corp. and Organigram holdings Inc., which returned 325.84% and 26.60%, respectively. The worst performers were Flora Growth Corp. and MYMD Pharmaceuticals Inc., which returned -87.50% and -86.92%, respectively.
The Fund recorded negative performance during the reporting period amid challenges of a large illicit cannabis market and varied regulatory landscape across key markets. Increased supply in the cannabis market and stringent tax requirements in legal jurisdictions hampered investor sentiment towards Cannabis Companies. Additionally, limited accessibility of capital amid a high interest rate environment and complicated regulatory landscape reduced growth prospects of Cannabis Companies. Slower-than-expected regulatory actions in key markets like the United States and Germany have delayed consolidation efforts from key market players to improve margins and achieve profitability. Lastly, chances of a recession decreased consumer spending on perceived non-essential items, including cannabis products. During the reporting period, the Fund had an average approximate stock exposure of 54.94% in Canada and 34.06% in United States. By sector, it had the highest exposure to Health Care at 65.51% and Real Estate at 18.48%.
24
Management Discussion of Fund Performance (unaudited)
Global X Cannabis ETF
| | | | | | | |
| | AVERAGE ANNUAL TOTAL RETURN FOR THE YEAR
ENDED
NOVEMBER 30, 2023 |
| | One Year
Return | Three Year
Return | Annualized
Inception to Date* |
| | Net Asset
Value | Market
Price | Net Asset
Value | Market
Price | Net Asset
Value | Market
Price |
| Global X Cannabis ETF | -61.63% | -62.50% | -56.06% | -56.37% | -52.38% | -52.86% |
| Solactive Cannabis Index | -63.58% | -63.58% | -57.51% | -57.51% | -54.61% | -54.61% |
| MSCI ACWI Index (Net) | 12.01% | 12.01% | 5.69% | 5.69% | 8.61% | 8.61% |
Growth of a 10,000 Investment
(at Net Asset Value)
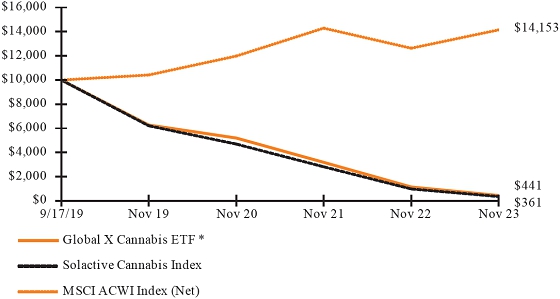
* The Fund commenced operations on September 17, 2019.
The MSCI ACWI (Net) (All Country World Index) Index is a free float-adjusted market capitalization weighted index that is designed to measure the equity market performance of developed and emerging markets.
The performance data quoted herein represents past performance and the return and value of an investment in the Fund will fluctuate so that, when sold, it may be worth less than its original cost. Past performance is no guarantee of future performance and should not be considered as a representation of the future results of the Fund. The Fund’s performance assumes the reinvestment of all dividends and all capital gains. Index returns assume reinvestment of dividends and, unlike the Fund’s returns, do not reflect any fees or expenses. If such fees and expenses were included in the index returns, the performance would have been lower. Please note that one cannot invest directly in an unmanaged index.
Performance figures for the periods shown may reflect contractual fee waivers and/or expense reimbursements. In the absence of fee waivers and/or expense reimbursements (if applicable), returns would have been lower.
25
Management Discussion of Fund Performance (unaudited)
Global X Cannabis ETF
There are no assurances that the Fund will meet its stated objectives.
The Fund’s holdings and allocations are subject to change and should not be considered recommendations to buy individual securities.
The graph and table do not reflect the deduction of taxes that a shareholder would pay on Fund distributions or the redemption or sale of Fund shares.
See definition of comparative indices on the previous page and above.
26
Management Discussion of Fund Performance (unaudited)
Global X Thematic Growth ETF
Global X Thematic Growth ETF
The Global X Thematic Growth ETF (the “Fund”) seeks to provide investment results that correspond generally to the price and yield performance, before fees and expenses, of the Solactive Thematic Growth Index (“Underlying Index”). The Fund is passively managed and the investment adviser does not attempt to take defensive positions in declining markets. The Fund generally seeks to fully replicate the Underlying Index.
The Underlying Index seeks to provide broad exposure to thematic growth strategies using a portfolio of exchange-traded funds (each, an “Underlying ETF”). The Underlying Index allocates index weights among the Underlying ETFs based on a quantitative methodology developed by Solactive AG, the provider of the Underlying Index, which is designed to determine the selection and weighting of the eligible Underlying ETFs.
For the 12-month period ended November 30, 2023 (the “reporting period”), the Fund decreased 10.30%, while the Underlying Index decreased 10.39%. The Fund had a net asset value of $26.14 per share on November 30, 2022 and ended the reporting period with a net asset value of $23.05 on November 30, 2023.
During the reporting period, the highest returns came from Global X Blockchain ETF and Global X Social Media ETF, which returned 68.55% and 25.11%, respectively. The worst performers were Global X Cannabis ETF and Global X Lithium & Battery ETF, which returned -62.50% and -30.53%, respectively.
The Fund performed negatively during the reporting period on account of the performance of its underlying themes. A portion of the Fund’s negative returns were due to higher interest rates, elevated material costs and permit delays associated with renewable energy companies. Additionally, inflationary pressures, regulatory scrutiny and competition from generic manufacturers adversely impacted the performance of the biotechnology stocks. Within the disruptive materials space, dampened demand leading to higher supply levels amid an uncertain macroeconomic environment negatively contributed to the Fund’s performance. Meanwhile, lithium prices were weighed down by performance in the Chinese spot market, amid weakened demand and bearish sentiment.
| | AVERAGE ANNUAL TOTAL RETURN FOR THE YEAR
ENDED
NOVEMBER 30, 2023 |
| | One Year
Return | Three Year
Return | Annualized
Inception to Date* |
| | Net Asset
Value | Market
Price | Net Asset
Value | Market
Price | Net Asset
Value | Market
Price |
| Global X Thematic Growth ETF | -10.30% | -10.78% | -17.39% | -17.45% | -1.18% | -0.99% |
| Solactive Thematic Growth Index | -10.39% | -10.39% | -17.63% | -17.63% | -1.41% | -1.41% |
| MSCI ACWI Index (Net) | 12.01% | 12.01% | 5.69% | 5.69% | 8.52% | 8.52% |
27
Management Discussion of Fund Performance (unaudited)
Global X Thematic Growth ETF
Growth of a 10,000 Investment
(at Net Asset Value)

* The Fund commenced operations on October 25, 2019.
The MSCI ACWI (Net) (All Country World Index) Index is a free float-adjusted market capitalization weighted index that is designed to measure the equity market performance of developed and emerging markets.
The performance data quoted herein represents past performance and the return and value of an investment in the Fund will fluctuate so that, when sold, it may be worth less than its original cost. Past performance is no guarantee of future performance and should not be considered as a representation of the future results of the Fund. The Fund’s performance assumes the reinvestment of all dividends and all capital gains. Index returns assume reinvestment of dividends and, unlike the Fund’s returns, do not reflect any fees or expenses. If such fees and expenses were included in the index returns, the performance would have been lower. Please note that one cannot invest directly in an unmanaged index.
Performance figures for the periods shown may reflect contractual fee waivers and/or expense reimbursements. In the absence of fee waivers and/or expense reimbursements (if applicable), returns would have been lower.
There are no assurances that the Fund will meet its stated objectives.
The Fund’s holdings and allocations are subject to change and should not be considered recommendations to buy individual securities.
The graph and table do not reflect the deduction of taxes that a shareholder would pay on Fund distributions or the redemption or sale of Fund shares.
See definition of comparative indices on the previous pages.
28
Management Discussion of Fund Performance (unaudited)
Global X Video Games & Esports ETF
Global X Video Games & Esports ETF
Global X Video Games & Esports ETF (the “Fund”) seeks to provide investment results that correspond generally to the price and yield performance, before fees and expenses, of the Solactive Video Games & Esports Index (“Underlying Index”). The Fund is passively managed, and the investment adviser does not attempt to take defensive positions in declining markets. The Fund generally seeks to fully replicate the Underlying Index.
The Underlying Index is designed to provide exposure to exchange-listed companies that are positioned to benefit from increased consumption related to video games and esports, including companies whose principal business is in video game development/publishing, video game and esports content distribution and streaming, operating/owning esports leagues/teams, and producing video game/ esports hardware, as defined by Solactive AG, the provider of the Underlying Index.
For the 12-month period ended November 30, 2023 (the “reporting period”), the Fund increased 5.29%, while the Underlying Index increased 5.71%. The Fund had a net asset value of $18.96 per share on November 30, 2022 and ended the reporting period with a net asset value of $19.93 on November 30, 2023.
During the reporting period, the highest returns came from Applovin Corp. Class-A and International Games System Co Ltd., which returned 160.10% and 79.18%, respectively. The worst performers were Skillz Inc. Class A and Gumi Inc., which returned -69.56% and -55.60%, respectively.
The Fund recorded positive returns during the reporting period due to the launch of new generations of hardware, improvements in supply chains and back-log orders, continued adoption and innovation in mobile gaming, and the increased use of virtual and augmented reality technologies. Casual mobile gaming continues to remain popular, attracting a significant number of players worldwide. Key mobile platforms brought increasingly media-rich and high-fidelity gaming experiences on smaller devices, driving a resurgence of in-app purchases and rise in the popularity of online multiplayer games. Higher investments and increased merger and acquisition (M&A) activity helped drive growth both for the acquiring companies and broader industry. Lastly, consumer access to games on the go without having to carry around a console or gaming personal computer (PC) weighed positively for mobile cloud gaming industry. During the reporting period, the Fund had an average approximate stock exposure of 33.21% in United States and 27.40% in Japan. By sector, it had the highest exposure to Communication Services at 88.90%.
| | AVERAGE ANNUAL TOTAL RETURN FOR THE YEAR
ENDED
NOVEMBER 30, 2023 |
| | One Year
Return | Three Year
Return | Annualized
Inception
to Date* |
| | Net Asset
Value | Market
Price | Net Asset
Value | Market
Price | Net Asset
Value | Market
Price |
| Global X Video Games & Esports ETF | 5.29% | 3.13% | -10.78% | -11.04% | 7.72% | 7.53% |
| Solactive Video Games & Esports Index | 5.71% | 5.71% | -10.38% | -10.38% | 8.21% | 8.21% |
| MSCI ACWI Index (Net) | 12.01% | 12.01% | 5.69% | 5.69% | 8.52% | 8.52% |
29
Management Discussion of Fund Performance (unaudited)
Global X Video Games & Esports ETF
Growth of a 10,000 Investment
(at Net Asset Value)

* The Fund commenced operations on October 25, 2019.
The MSCI ACWI (Net) (All Country World Index) Index is a free float-adjusted market capitalization weighted index that is designed to measure the equity market performance of developed and emerging markets.
The performance data quoted herein represents past performance and the return and value of an investment in the Fund will fluctuate so that, when sold, it may be worth less than its original cost. Past performance is no guarantee of future performance and should not be considered as a representation of the future results of the Fund. The Fund’s performance assumes the reinvestment of all dividends and all capital gains. Index returns assume reinvestment of dividends and, unlike the Fund’s returns, do not reflect any fees or expenses. If such fees and expenses were included in the index returns, the performance would have been lower. Please note that one cannot invest directly in an unmanaged index.
Performance figures for the periods shown may reflect contractual fee waivers and/or expense reimbursements. In the absence of fee waivers and/or expense reimbursements (if applicable), returns would have been lower.
There are no assurances that the Fund will meet its stated objectives.
The Fund’s holdings and allocations are subject to change and should not be considered recommendations to buy individual securities.
The graph and table do not reflect the deduction of taxes that a shareholder would pay on Fund distributions or the redemption or sale of Fund shares.
See definition of comparative indices on the previous page and above.
30
Management Discussion of Fund Performance (unaudited)
Global X Cybersecurity ETF
Global X Cybersecurity ETF
Global X Cybersecurity ETF (the “Fund”) seeks to provide investment results that correspond generally to the price and yield performance, before fees and expenses, of the Indxx Cybersecurity Index (“Underlying Index”). The Fund is passively managed, and the investment adviser does not attempt to take defensive positions in declining markets. The Fund generally seeks to fully replicate the Underlying Index.
The Underlying Index is designed to provide exposure to exchange-listed companies that are positioned to benefit from increased adoption of cybersecurity technology, including but not limited to companies whose principal business is in the development and management of security protocols preventing intrusion and attacks to systems, networks, applications, computers, and mobile devices, as determined by Indxx LLC, the provider of the Underlying Index.
For the 12-month period ended November 30, 2023 (the “reporting period”), the Fund increased 19.29%, while the Underlying Index increased 19.89%. The Fund had a net asset value of $22.85 per share on November 30, 2022 and ended the reporting period with a net asset value of $26.84 on November 30, 2023.
During the reporting period, the highest returns came from Crowdstrike Holdings Inc. A and Varonis Systems Inc., which returned 101.44% and 97.22%, respectively. The worst performers were Arqit Quantum Inc. and A10 Networks Inc., which returned -93.55% and -32.08%, respectively.
The Fund recorded positive returns during the reporting period as increased digitalization and interconnectedness in the economy drove growth of the cybersecurity market. Spending on cybersecurity solutions was boosted by increasing attacks on corporations and governments, digital warfare emanating from major global conflicts, and emerging new possibilities with the rise of technologies like generative artificial intelligence (AI). Corporations responded to the escalating trend of targeted cyber-attacks by increasing investments in security technologies that suit a cloud-native deployment model of information technology (IT), cutting costs. Rising cases of complex cyber threats led to implementation of new technologies for enhancing threat detection and automating security processes. Government programs enacted in the wake of the COVID-19 pandemic to broadly safeguard citizens from a complex and worsening IT landscape also helped drive the market forward, contributing to the Fund’s positive returns. During the reporting period, the Fund had an average approximate stock exposure of 68.02% in United States and 14.06% in Israel.
| | AVERAGE ANNUAL TOTAL RETURN FOR THE YEAR
ENDED
NOVEMBER 30, 2023 |
| | One Year
Return | Three Year
Return | Annualized
Inception to Date* |
| | Net Asset
Value | Market
Price | Net Asset
Value | Market
Price | Net Asset
Value | Market
Price |
| Global X Cybersecurity ETF | 19.29% | 18.46% | 6.47% | 6.25% | 15.60% | 16.03% |
| Indxx Cybersecurity Index | 19.89% | 19.89% | 6.89% | 6.89% | 16.12% | 16.12% |
| MSCI ACWI Index (Net) | 12.01% | 12.01% | 5.69% | 5.69% | 8.52% | 8.52% |
31
Management Discussion of Fund Performance (unaudited)
Global X Cybersecurity ETF
Growth of a 10,000 Investment
(at Net Asset Value)

* The Fund commenced operations on October 25, 2019.
The MSCI ACWI (Net) (All Country World Index) Index is a free float-adjusted market capitalization weighted index that is designed to measure the equity market performance of developed and emerging markets.
The performance data quoted herein represents past performance and the return and value of an investment in the Fund will fluctuate so that, when sold, it may be worth less than its original cost. Past performance is no guarantee of future performance and should not be considered as a representation of the future results of the Fund. The Fund’s performance assumes the reinvestment of all dividends and all capital gains. Index returns assume reinvestment of dividends and, unlike the Fund’s returns, do not reflect any fees or expenses. If such fees and expenses were included in the index returns, the performance would have been lower. Please note that one cannot invest directly in an unmanaged index.
Performance figures for the periods shown may reflect contractual fee waivers and/or expense reimbursements. In the absence of fee waivers and/or expense reimbursements (if applicable), returns would have been lower.
There are no assurances that the Fund will meet its stated objectives.
The Fund’s holdings and allocations are subject to change and should not be considered recommendations to buy individual securities.
The graph and table do not reflect the deduction of taxes that a shareholder would pay on Fund distributions or the redemption or sale of Fund shares.
See definition of comparative indices on the previous page and above.
32
Management Discussion of Fund Performance (unaudited)
Global X Telemedicine & Digital Health ETF
Global X Telemedicine & Digital Health ETF
Global X Telemedicine & Digital Health ETF (the “Fund”) seeks to provide investment results that correspond generally to the price and yield performance, before fees and expenses, of the Solactive Telemedicine & Digital Health Index (“Underlying Index”). The Fund is passively managed and the investment adviser does not attempt to take defensive positions in declining markets. The Fund generally seeks to fully replicate the Underlying Index.
The Underlying Index is designed to provide exposure to exchange-listed companies that are positioned to benefit from further advances in the field of telemedicine and digital health, as well as applications thereof (collectively, “Telemedicine & Digital Health Companies”), as defined by Solactive AG, the provider of the Underlying Index (the “Index Provider”). In order to be eligible for inclusion in the Underlying Index, a company is considered by the Index Provider to be a Telemedicine & Digital Health Company if it derives at least 50% of its revenue, operating income, or assets from telemedicine and/ or digital health. Telemedicine & Digital Health Companies include those involved in the following business activities: (i) telemedicine, (ii) healthcare analytics, (iii) connected healthcare devices, and/ or (iv) administrative digitization.
For the 12-month period ended November 30, 2023 (the “reporting period”), the Fund decreased 26.82%, while the Underlying Index decreased 26.69%. The Fund had a net asset value of $12.23 per share on November 30, 2022 and ended the reporting period with a net asset value of $8.95 on November 30, 2023.
During the reporting period, the highest returns came from Hims & Hers Health, Inc. Class A. and GoodRx Holdings, Inc. Class A, which returned 43.62% and 37.39%, respectively. The worst performers were Bionano Genomics Inc. and Invitae Corp., which returned -92.74% and -84.18%, respectively.
The Fund recorded negative returns during the reporting period as contracting operating margins, slower-than-expected regulatory activity, and ongoing inflationary concerns slowed industry growth which impacted the performance of Telemedicine & Digital Health Companies. A high interest rate environment and limited debt availability slowed innovation in the sector and delayed interoperability timelines for digital health firms. This, in turn, slowed adoption by healthcare professionals and delayed mergers and acquisitions (M&A) activity that would help consolidate and streamline a fragmented industry. Continued inflationary pressures increased the cost of medical equipment and pharmaceutical drugs, limiting physician and hospital budgets for increased digitization and automation.
| | AVERAGE ANNUAL TOTAL RETURN FOR THE YEAR
ENDED
NOVEMBER 30, 2023 |
| | One Year
Return | Three Year
Return | Annualized
Inception to Date* |
| | Net Asset
Value | Market
Price | Net Asset
Value | Market
Price | Net Asset
Value | Market
Price |
| Global X Telemedicine & Digital Health ETF | -26.82% | -26.89% | -21.36% | -21.48% | -14.71% | -14.79% |
| Solactive Telemedicine & Digital Health Index | -26.69% | -26.69% | -21.01% | -21.01% | -14.32% | -14.32% |
| MSCI ACWI Index (Net) | 12.01% | 12.01% | 5.69% | 5.69% | 8.68% | 8.68% |
33
Management Discussion of Fund Performance (unaudited)
Global X Telemedicine & Digital Health ETF
Growth of a 10,000 Investment
(at Net Asset Value)

* The Fund commenced operations on July 29, 2020.
The MSCI ACWI (Net) (All Country World Index) Index is a free float-adjusted market capitalization weighted index that is designed to measure the equity market performance of developed and emerging markets.
The performance data quoted herein represents past performance and the return and value of an investment in the Fund will fluctuate so that, when sold, it may be worth less than its original cost. Past performance is no guarantee of future performance and should not be considered as a representation of the future results of the Fund. The Fund’s performance assumes the reinvestment of all dividends and all capital gains. Index returns assume reinvestment of dividends and, unlike the Fund’s returns, do not reflect any fees or expenses. If such fees and expenses were included in the index returns, the performance would have been lower. Please note that one cannot invest directly in an unmanaged index.
Performance figures for the periods shown may reflect contractual fee waivers and/or expense reimbursements. In the absence of fee waivers and/or expense reimbursements (if applicable), returns would have been lower.
There are no assurances that the Fund will meet its stated objectives.
The Fund’s holdings and allocations are subject to change and should not be considered recommendations to buy individual securities.
The graph and table do not reflect the deduction of taxes that a shareholder would pay on Fund distributions or the redemption or sale of Fund shares.
See definition of comparative indices on the previous page and above.
34
Management Discussion of Fund Performance (unaudited)
Global X China Biotech Innovation ETF
Global X China Biotech Innovation ETF
Global X China Biotech Innovation ETF (the “Fund”) seeks to provide investment results that correspond generally to the price and yield performance, before fees and expenses, of the Solactive China Biotech Innovation Index (“Underlying Index”). The Fund is passively managed, and the investment adviser does not attempt to take defensive positions in declining markets. The Fund generally seeks to fully replicate the Underlying Index.
The Underlying Index is designed to provide exposure to exchange-listed companies that are directly involved in China’s biotechnology industry. In constructing the Underlying Index, the Solactive AG, the provider of the Underlying Index utilizes FactSet Industry classifications to identify companies that are directly involved in the biotechnology industry. Only those securities classified in the biotechnology industry according to FactSet as of each rebalance date are eligible for inclusion in the index. The Underlying Index is weighted according to a modified capitalization weighting methodology and is reconstituted and re-weighted semi-annually.
For the 12-month period ended November 30, 2023 (the “reporting period”), the Fund decreased 11.66%, while the Underlying Index decreased 11.00%. The Fund had a net asset value of $9.68 per share on November 30, 2022 and ended the reporting period with a net asset value of $8.51 on November 30, 2023.
During the reporting period, the highest returns came from Hebei Changshan Biochemical Pharmaceutical Co., Ltd. Class A and Pacific Shuanglin Bio-pharmacy Co., Ltd. Class A, which returned 161.33% and 48.71%, respectively. The worst performers were Kintor Pharmaceutical Ltd. and CanSino Biologics, Inc. Class A, which returned -75.35% and -62.06%, respectively.
The Fund recorded negative returns during the reporting period amid growing inflationary pressures and regulatory scrutiny. Demand for contract research services and lab equipment declined amid tightening budgets and limited availability of funding. Enforcement of global regulatory reforms for drug manufacturing companies adversely impacted market sentiment. In a parallel development, China’s biotech IPO volumes declined against the backdrop of reduced investor confidence and earnings volatility. Investments in Chinese drugmaker companies declined, as investors from the US and other countries remained cautious of the stringent financing environment within the biotech industry. This also slowed down mergers and acquisitions (M&A) activity in the industry, putting a hold to potential exit opportunities for smaller healthcare firms.
| | AVERAGE ANNUAL TOTAL RETURN FOR THE YEAR
ENDED
NOVEMBER 30, 2023 |
| | One Year
Return | Three Year
Return | Annualized
Inception to Date* |
| | Net Asset
Value | Market
Price | Net Asset
Value | Market
Price | Net Asset
Value | Market
Price |
| Global X China Biotech Innovation ETF | -11.66% | -12.91% | -16.81% | -17.06% | -16.27% | -16.45% |
| Solactive China Biotech Innovation Index | -11.00% | -11.00% | -16.24% | -16.24% | -15.69% | -15.69% |
| MSCI Emerging Markets Index (Net) | 4.21% | 4.21% | -4.04% | -4.04% | -0.48% | -0.48% |
35
Management Discussion of Fund Performance (unaudited)
Global X China Biotech Innovation ETF
Growth of a 10,000 Investment
(at Net Asset Value)
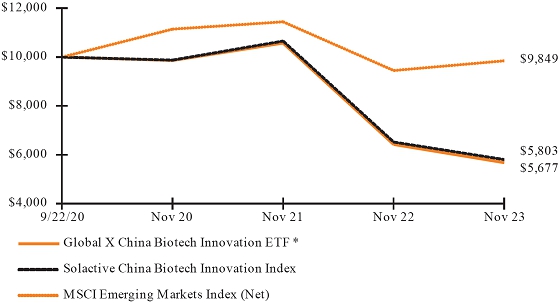
* The Fund commenced operations on September 22, 2020.
The MSCI Emerging Markets Index (Net) is a free float-adjusted market capitalization index that is designed to measure equity market performance of emerging markets.
The performance data quoted herein represents past performance and the return and value of an investment in the Fund will fluctuate so that, when sold, it may be worth less than its original cost. Past performance is no guarantee of future performance and should not be considered as a representation of the future results of the Fund. The Fund’s performance assumes the reinvestment of all dividends and all capital gains. Index returns assume reinvestment of dividends and, unlike the Fund’s returns, do not reflect any fees or expenses. If such fees and expenses were included in the index returns, the performance would have been lower. Please note that one cannot invest directly in an unmanaged index.
Performance figures for the periods shown may reflect contractual fee waivers and/or expense reimbursements. In the absence of fee waivers and/or expense reimbursements (if applicable), returns would have been lower.
There are no assurances that the Fund will meet its stated objectives.
The Fund’s holdings and allocations are subject to change and should not be considered recommendations to buy individual securities.
The graph and table do not reflect the deduction of taxes that a shareholder would pay on Fund distributions or the redemption or sale of Fund shares.
See definition of comparative indices on the previous page and above.
36
Management Discussion of Fund Performance (unaudited)
Global X CleanTech ETF
Global X CleanTech ETF
The Global X CleanTech ETF (the “Fund”) seeks to provide investment results that correspond generally to the price and yield performance, before fees and expenses, of the Indxx Global CleanTech Index (“Underlying Index”). The Fund is passively managed and the investment adviser does not attempt to take defensive positions in declining markets. The Fund generally seeks to fully replicate the Underlying Index.
The Underlying Index is designed to provide exposure to exchange-listed companies that are positioned to benefit from the increased adoption of technologies focused on improving the efficiency of renewable energy production and/or mitigating the adverse environmental effects of resource consumption (“CleanTech”), including, but not limited to, companies whose principal business is in developing technology relating to renewable energy, energy efficiency and storage, smart grid, lithium-ion batteries and/or fuel cells, and/or pollution prevention/amelioration (collectively, “CleanTech Companies”), as defined by Indxx LLC, the provider of the Underlying Index (“Index Provider”).
For the 12-month period ended November 30, 2023 (the “reporting period”), the Fund decreased 38.90%, while the Underlying Index decreased 38.76%. The Fund had a net asset value of $16.20 per share on November 30, 2022 and ended the reporting period with a net asset value of $9.88 on November 30, 2023.
During the reporting period, the highest returns came from Fluence Energy, Inc. Class A and Simplo Technology Co. Ltd., which returned 45.98% and 36.03%, respectively. The worst performers were Sunpower Corporation and Maxeon Solar Technologies, Ltd., which returned -82.89% and -81.74%, respectively.
The Fund performed negatively during the reporting period as CleanTech equipment manufacturers continued to have their performance impacted by rising inflation, supply bottlenecks, and elevated materials costs. Slow permitting timelines in the United States and European Union remained a significant detractor to realizing full growth potential within the wind and solar power industries. Elevated project costs and high interest rates also dampened renewable energy growth prospects across major markets and reduced equipment demand, particularly for the offshore wind and residential solar power segments. Furthermore, companies throughout the hydrogen value chain had their performances weighed down by elevated hydrogen prices, supply constraints, higher interest rates, and continued investments towards scaling production for future expected demand. During the reporting period, the Fund had an average approximate stock exposure of 33.97% in United States, 13.73% in South Korea and 12.17% in China. By sector, it had the highest average exposure to Information Technology at 47.66% and Industrials at 42.20%.
| | AVERAGE ANNUAL TOTAL RETURN FOR THE YEAR
ENDED
NOVEMBER 30, 2023 |
| | One Year
Return | Three Year
Return | Annualized
Inception to Date* |
| | Net Asset
Value | Market
Price | Net Asset
Value | Market
Price | Net Asset
Value | Market
Price |
| Global X CleanTech ETF | -38.90% | -39.44% | -19.44% | -19.46% | -12.57% | -12.63% |
| Indxx Global CleanTech Index | -38.76% | -38.76% | -19.87% | -19.87% | -13.02% | -13.02% |
| MSCI ACWI Index (Net) | 12.01% | 12.01% | 5.69% | 5.69% | 8.28% | 8.28% |
37
Management Discussion of Fund Performance (unaudited)
Global X CleanTech ETF
Growth of a 10,000 Investment
(at Net Asset Value)

* The Fund commenced operations on October 27, 2020.
The MSCI ACWI (Net) (All Country World Index) Index is a free float-adjusted market capitalization weighted index that is designed to measure the equity market performance of developed and emerging markets.
The performance data quoted herein represents past performance and the return and value of an investment in the Fund will fluctuate so that, when sold, it may be worth less than its original cost. Past performance is no guarantee of future performance and should not be considered as a representation of the future results of the Fund. The Fund’s performance assumes the reinvestment of all dividends and all capital gains. Index returns assume reinvestment of dividends and, unlike the Fund’s returns, do not reflect any fees or expenses. If such fees and expenses were included in the index returns, the performance would have been lower. Please note that one cannot invest directly in an unmanaged index.
Performance figures for the periods shown may reflect contractual fee waivers and/or expense reimbursements. In the absence of fee waivers and/or expense reimbursements (if applicable), returns would have been lower.
There are no assurances that the Fund will meet its stated objectives.
The Fund’s holdings and allocations are subject to change and should not be considered recommendations to buy individual securities.
The graph and table do not reflect the deduction of taxes that a shareholder would pay on Fund distributions or the redemption or sale of Fund shares.
See definition of comparative indices on the previous page and above.
38
Management Discussion of Fund Performance (unaudited)
Global X Data Center REITs & Digital Infrastructure ETF
Global X Data Center REITs & Digital Infrastructure ETF
The Global X Data Center REITs & Digital Infrastructure ETF (the “Fund”) seeks to provide investment results that correspond generally to the price and yield performance, before fees and expenses, of the Solactive Data Center REITs & Digital Infrastructure Index (“Underlying Index”). The Fund is passively managed and the investment adviser does not attempt to take defensive positions in declining markets. The Fund generally seeks to fully replicate the Underlying Index.
The Solactive Data Center REITs & Digital Infrastructure Index is designed to provide exposure to companies that have business operations in the fields of data centers, cellular towers, and/or digital infrastructure hardware. Specifically, the Solactive Data Center REITs & Digital Infrastructure Index will include securities issued by “Data Center REITs & Digital Infrastructure Companies” as defined by Solactive AG, the provider of the Solactive Data Center REITs & Digital Infrastructure Index.
For the 12-month period ended November 30, 2023 (the “reporting period”), the Fund increased 8.46%, while the Underlying Index increased 8.33%. The Fund had a net asset value of $13.52 per share on November 30, 2022 and ended the reporting period with a net asset value of $14.30 on November 30, 2023.
During the reporting period, the highest returns came from Nvidia Corp. and Advanced Micro Devices, which returned 176.47% and 56.07%, respectively. The worst performers were Cyxtera Technologies Inc. and VNET Group Inc-ADR, which returned -97.95% and -44.11%, respectively.
The Fund recorded positive performance during the reporting period as growth in data usage and increased adoption of artificial intelligence (AI) positively impacted data center REITs. This led to improved earnings and dividend distributions by many Data Center REITs & Digital Infrastructure Companies. Simultaneously, the global adoption of 5G technology increased, generating positive revenue growth for communications service providers. Furthermore, demand for data storage and cloud computing services increased investor optimism toward the industry. Lastly, with an uncertain macroeconomic environment, the stock prices of companies maintaining data infrastructure reflected resilience in revenues due to the essential services they provide. During the reporting period, the Fund had an average approximate stock exposure of 72.14% in United States. By sector, it had the highest exposure to Real Estate at 58.37% and Information Technology at 29.80%.
| | AVERAGE ANNUAL TOTAL RETURN FOR THE YEAR
ENDED
NOVEMBER 30, 2023 |
| | One Year
Return | Three Year
Return | Annualized
Inception to Date* |
| | Net Asset
Value | Market
Price | Net Asset
Value | Market
Price | Net Asset
Value | Market
Price |
| Global X Data Center REITs & Digital Infrastructure ETF | 8.46% | 9.37% | 0.07% | -0.07% | 0.01% | 0.08% |
| Solactive Data Center REITs & Digital Infrastructure Index | 8.33% | 8.33% | 0.04% | 0.04% | -0.02% | -0.02% |
| MSCI ACWI Index (Net) | 12.01% | 12.01% | 5.69% | 5.69% | 8.28% | 8.28% |
39
Management Discussion of Fund Performance (unaudited)
Global X Data Center REITs & Digital Infrastructure ETF
Growth of a 10,000 Investment
(at Net Asset Value)
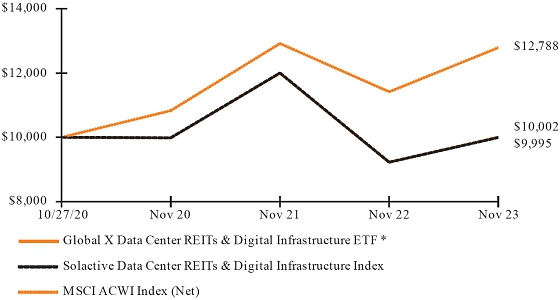
* The Fund commenced operations on October 27, 2020.
The MSCI ACWI (Net) (All Country World Index) Index is a free float-adjusted market capitalization weighted index that is designed to measure the equity market performance of developed and emerging markets.
The performance data quoted herein represents past performance and the return and value of an investment in the Fund will fluctuate so that, when sold, it may be worth less than its original cost. Past performance is no guarantee of future performance and should not be considered as a representation of the future results of the Fund. The Fund’s performance assumes the reinvestment of all dividends and all capital gains. Index returns assume reinvestment of dividends and, unlike the Fund’s returns, do not reflect any fees or expenses. If such fees and expenses were included in the index returns, the performance would have been lower. Please note that one cannot invest directly in an unmanaged index.
Performance figures for the periods shown may reflect contractual fee waivers and/or expense reimbursements. In the absence of fee waivers and/or expense reimbursements (if applicable), returns would have been lower.
There are no assurances that the Fund will meet its stated objectives.
The Fund’s holdings and allocations are subject to change and should not be considered recommendations to buy individual securities.
The graph and table do not reflect the deduction of taxes that a shareholder would pay on Fund distributions or the redemption or sale of Fund shares.
See definition of comparative indices on the previous page and above.
40
Management Discussion of Fund Performance (unaudited)
Global X Clean Water ETF
Global X Clean Water ETF
The Global X Clean Water ETF (the “Fund”) seeks to provide investment results that correspond generally to the price and yield performance, before fees and expenses, of the Solactive Global Clean Water Industry Index (“Underlying Index”). The Fund is passively managed and the investment adviser does not attempt to take defensive positions in declining markets. The Fund generally seeks to fully replicate the Underlying Index.
The Underlying Index is designed to provide exposure to exchange-listed companies expected to benefit from further advances in the provision of clean water, including, but not limited to, companies whose principal business is in water treatment, recycling (including water reclamation), purification, desalination, storage, distribution, and/or sustainability (collectively, “Clean Water Companies”), as defined by Solactive AG, the provider of the Underlying Index.
For the 12-month period ended November 30, 2023 (the “reporting period”), the Fund increased 9.50%, while the Underlying Index increased 9.83%. The Fund had a net asset value of $14.30 per share on November 30, 2022 and ended the reporting period with a net asset value of $15.40 on November 30, 2023.
During the reporting period, the highest returns came from Nomura Micro Science Co. Ltd. and Organo Corp., which returned 137.73% and 106.89%, respectively. The worst performers were Calix Ltd. and Middlesex Water Company, which returned -31.85% and -30.47%, respectively.
The Fund performed positively during the reporting period as continued investments in water technology insulated Clean Water Companies against the broader uncertain macroeconomic environment. Broadening commitment to sustainable development goals (SDGs) from the private sector as well as continued federal investments in U.S. water infrastructure from the Infrastructure Investment and Jobs Act (IIJA) lifted investor sentiment toward the clean water space. Water utility companies were able to drive consistent earnings growth and healthy dividend payouts despite an increase in costs and inflationary pressures. Lastly, high profile instances of drought and water insecurity continued to draw attention to the Clean Water Companies. During the reporting period, the Fund had an average approximate stock exposure of 62.62% in United States and 22.58% in Britain. By sector, it had the highest exposure to Industrials at 49.17% and Utilities at 37.99%.
| | AVERAGE ANNUAL TOTAL RETURN FOR THE YEAR ENDED
NOVEMBER 30, 2023 |
| | One Year
Return | Annualized Inception to Date* |
| | Net Asset Value | Market Price | Net Asset Value | Market Price |
| Global X Clean Water ETF | 9.50% | 9.55% | 2.24% | 2.36% |
| Solactive Global Clean Water Industry Index | 9.83% | 9.83% | 2.55% | 2.55% |
| MSCI ACWI (Net) | 12.01% | 12.01% | 1.81% | 1.81% |
41
Management Discussion of Fund Performance (unaudited)
Global X Clean Water ETF
Growth of a 10,000 Investment
(at Net Asset Value)

* The Fund commenced operations on April 8, 2021.
The MSCI ACWI (Net) (All Country World Index) Index is a free float-adjusted market capitalization weighted index that is designed to measure the equity market performance of developed and emerging markets.
The performance data quoted herein represents past performance and the return and value of an investment in the Fund will fluctuate so that, when sold, it may be worth less than its original cost. Past performance is no guarantee of future performance and should not be considered as a representation of the future results of the Fund. The Fund’s performance assumes the reinvestment of all dividends and all capital gains. Index returns assume reinvestment of dividends and, unlike the Fund’s returns, do not reflect any fees or expenses. If such fees and expenses were included in the index returns, the performance would have been lower. Please note that one cannot invest directly in an unmanaged index.
Performance figures for the periods shown may reflect contractual fee waivers and/or expense reimbursements. In the absence of fee waivers and/or expense reimbursements (if applicable), returns would have been lower.
There are no assurances that the Fund will meet its stated objectives.
The Fund’s holdings and allocations are subject to change and should not be considered recommendations to buy individual securities.
The graph and table do not reflect the deduction of taxes that a shareholder would pay on Fund distributions or the redemption or sale of Fund shares.
See definition of comparative indices on the previous page and above.
42
Management Discussion of Fund Performance (unaudited)
Global X AgTech & Food Innovation ETF
Global X AgTech & Food Innovation ETF
The Global X AgTech & Food Innovation ETF (the “Fund”) seeks to provide investment results that correspond generally to the price and yield performance, before fees and expenses, of the Solactive AgTech & Food Innovation Index (“Underlying Index”). The Fund is passively managed and the investment adviser does not attempt to take defensive positions in declining markets. The Fund generally seeks to fully replicate the Underlying Index.
The Underlying Index is designed to provide exposure to companies that are positioned to benefit from further advances in the fields of agricultural technology (“AgTech”) and food innovation. Specifically, the Underlying Index will include securities issued by “AgTech & Food Innovation Companies” as defined by Solactive AG, the provider of the Underlying Index.
For the 12-month period ended November 30, 2023 (the “reporting period”), the Fund decreased 34.41%, while the Underlying Index decreased 34.22%. The Fund had a net asset value of $15.63 per share on November 30, 2022 and ended the reporting period with a net asset value of $10.17 on November 30, 2023.
During the reporting period, the highest returns came from Sprouts Farmers Market Inc. and Ingredion Inc., which returned 25.49% and 7.66%, respectively. The worst performers were Appharvest Inc. and Benson Hill Inc., which returned -95.68% and -93.52%, respectively.
The Fund generated negative returns during the reporting period. The agriculture technology industry experienced a decline in capital investment as investors moved to more mature investment avenues. Consumer purchasing power was compressed during the reporting period due to inflation and rising borrowing costs, leading many to purchase less expensive, more traditional foods. As a result, demand for food innovation technologies and products declined. Despite higher revenue growth, companies in the plant-based food sector reported lower-than-expected earnings as they faced challenges in reducing costs and scaling operations. During the reporting period, the Fund had an average approximate stock exposure of 43.90% in United States and 27.55% in China. By sector, it had the highest exposure to Consumer Staples at 50.59% and Materials at 32.48%.
| | AVERAGE ANNUAL TOTAL RETURN FOR THE YEAR ENDED
NOVEMBER 30, 2023 |
| | One Year
Return | Annualized Inception to Date* |
| | Net Asset Value | Market Price | Net Asset Value | Market Price |
| Global X AgTech & Food Innovation ETF | -34.41% | -34.56% | -31.26% | -31.23% |
| Solactive AgTech & Food Innovation Index | -34.22% | -34.22% | -31.01% | -31.01% |
| MSCI ACWI Index (Net) | 12.01% | 12.01% | -0.25% | -0.25% |
43
Management Discussion of Fund Performance (unaudited)
Global X AgTech & Food Innovation ETF
Growth of a 10,000 Investment
(at Net Asset Value)

* The Fund commenced operations on July 12, 2021.
The MSCI ACWI (Net) (All Country World Index) Index is a free float-adjusted market capitalization weighted index that is designed to measure the equity market performance of developed and emerging markets.
The performance data quoted herein represents past performance and the return and value of an investment in the Fund will fluctuate so that, when sold, it may be worth less than its original cost. Past performance is no guarantee of future performance and should not be considered as a representation of the future results of the Fund. The Fund’s performance assumes the reinvestment of all dividends and all capital gains. Index returns assume reinvestment of dividends and, unlike the Fund’s returns, do not reflect any fees or expenses. If such fees and expenses were included in the index returns, the performance would have been lower. Please note that one cannot invest directly in an unmanaged index.
Performance figures for the periods shown may reflect contractual fee waivers and/or expense reimbursements. In the absence of fee waivers and/or expense reimbursements (if applicable), returns would have been lower.
There are no assurances that the Fund will meet its stated objectives.
The Fund’s holdings and allocations are subject to change and should not be considered recommendations to buy individual securities.
The graph and table do not reflect the deduction of taxes that a shareholder would pay on Fund distributions or the redemption or sale of Fund shares.
See definition of comparative indices on the previous page and above.
44
Management Discussion of Fund Performance (unaudited)
Global X Blockchain ETF
Global X Blockchain ETF
Global X Blockchain ETF (the “Fund”) seeks to provide investment results that correspond generally to the price and yield performance, before fees and expenses, of the Solactive Blockchain Index (“Underlying Index”). The Fund is passively managed, and the investment adviser does not attempt to take defensive positions in declining markets. The Fund generally seeks to fully replicate the Underlying Index.
The Underlying Index is designed to provide exposure to companies that are positioned to benefit from further advances in the field of blockchain technology. Specifically, the Underlying Index will include securities issued by “Blockchain Companies” as defined by Solactive AG, the provider of the Underlying Index. “Blockchain Companies” are those companies that derive at least 50% of their revenues, operating income, or assets from the following business activities: (i) digital asset mining; (ii) blockchain & digital asset transactions; (iii) blockchain applications; (iv) blockchain & digital asset hardware; and (v) blockchain & digital asset integration.
For the 12-month period ended November 30, 2023 (the “reporting period”), the Fund increased 88.92%, while the Underlying Index increased 85.88%. The Fund had a net asset value of $16.39 per share on November 30, 2022 and ended the reporting period with a net asset value of $30.72 on November 30, 2023, following a 1:4 reverse share split on December 19, 2022.
During the reporting period, the highest returns came from Cipher Mining Inc. and Northern Data AG, which returned 254.40% and 248.95%, respectively. The worst performers were SAI. TECH Global Corp. and Core Scientific Inc., which returned -63.51% and -51.99%, respectively.
The Fund recorded positive returns during the reporting period, primarily driven by positive sentiment amongst leading crypto assets. Additionally, the U.S. Federal Reserve’s decision to slow down its rate hiking activities alleviated pressure on digital asset miners while various spot bitcoin ETF applications by a handful of asset managers boosted the optimism toward and the legitimacy of cryptocurrencies. The embrace of blockchain applications expanded as banks and asset managers delved into tokenization projects, while technology companies explored innovative payment solutions using stablecoins (cryptocurrencies geared towards maintaining a stable price). Furthermore, incrementally positive regulatory developments in the EU, including the passage of the Markets in Crypto-Assets Regulation (MiCA) framework, also provided tailwinds to some of the Fund’s constituent holdings. During the reporting period, the Fund had an average approximate stock exposure of 74.26% in United States and 15.77% in Canada. By sector, it had the highest exposure to Information Technology at 67.24% and Financials at 31.64%.
| | AVERAGE ANNUAL TOTAL RETURN FOR THE YEAR ENDED |
| | NOVEMBER 30, 2023 |
| | One Year
Return | Annualized Inception to Date* |
| | Net Asset Value | Market Price | Net Asset Value | Market Price |
| Global X Blockchain ETF | 88.92%(1) | 88.82% | -37.58% | -37.41% |
| Solactive Blockchain Index | 85.88% | 85.88% | -38.50% | -38.50% |
| MSCI ACWI Index (Net) | 12.01% | 12.01% | -0.25% | -0.25% |
45
Management Discussion of Fund Performance (unaudited)
Global X Blockchain ETF
Growth of a 10,000 Investment
(at Net Asset Value)

* The Fund commenced operations on July 12, 2021.
(1) The total return disclosed in the Financial Highlights of the Annual Report may reflect adjustments due to the rounding of the NAV after the 1:4 reverse share split on December 19, 2022.
The MSCI ACWI (Net) (All Country World Index) Index is a free float-adjusted market capitalization weighted index that is designed to measure the equity market performance of developed and emerging markets.
The performance data quoted herein represents past performance and the return and value of an investment in the Fund will fluctuate so that, when sold, it may be worth less than its original cost. Past performance is no guarantee of future performance and should not be considered as a representation of the future results of the Fund. The Fund’s performance assumes the reinvestment of all dividends and all capital gains. Index returns assume reinvestment of dividends and, unlike the Fund’s returns, do not reflect any fees or expenses. If such fees and expenses were included in the index returns, the performance would have been lower. Please note that one cannot invest directly in an unmanaged index.
Performance figures for the periods shown may reflect contractual fee waivers and/or expense reimbursements. In the absence of fee waivers and/or expense reimbursements (if applicable), returns would have been lower.
There are no assurances that the Fund will meet its stated objectives.
The Fund’s holdings and allocations are subject to change and should not be considered recommendations to buy individual securities.
46
Management Discussion of Fund Performance (unaudited)
Global X Blockchain ETF
The graph and table do not reflect the deduction of taxes that a shareholder would pay on Fund distributions or the redemption or sale of Fund shares.
See definition of comparative indices on the previous page and above.
47
Management Discussion of Fund Performance (unaudited)
Global X Hydrogen ETF
Global X Hydrogen ETF
The Global X Hydrogen ETF (the “Fund”) seeks to provide investment results that correspond generally to the price and yield performance, before fees and expenses, of the Solactive Global Hydrogen Index (“Underlying Index”).The Fund is passively managed and the investment adviser does not attempt to take defensive positions in declining markets. The Fund generally seeks to fully replicate the Underlying Index.
The Underlying index is designed to provide exposure to companies that are positioned to benefit from further advances in the field of hydrogen technology. Hydrogen technology includes products and services focused on the development and implementation of hydrogen gas as a renewable fuel source. Specifically, the Underlying Index will include securities issued by “Hydrogen Companies” as defined by Solactive AG, the provider of the Underlying Index. Hydrogen Companies are those companies that derive at least 50% of their revenues, operating income, or assets from the following business activities: (i) hydrogen production; (ii) hydrogen fuel cells; (iii) hydrogen technology; and (iv) hydrogen integration
For the 12-month period ended November 30, 2023 (the “reporting period”), the Fund decreased 46.86%, while the Underlying Index decreased 46.36%. The Fund had a net asset value of $12.27 per share on November 30, 2022 and ended the reporting period with a net asset value of $6.52 on November 30, 2023.
During the reporting period, the highest returns came from Hyster-Yale Materials Handling, Inc. Class A and Toyota Motor Corp., which returned 67.61% and 35.17%, respectively. The worst performers were Advent Technologies Holdings, Inc. Class A and Nikola Corp., which returned -83.24% and -76.18%, respectively.
The Fund performed negatively during the reporting period as Hydrogen Companies were impacted by a range of factors including inflation, supply chain challenges, and increased prices on raw materials. In particular, elevated natural gas prices and hydrogen supply constraints negatively impacted performances of hydrogen producers and service providers. In addition, high costs for the manufacturing of nascent electrolyzer technologies weighed on electrolyzer producers. Hydrogen Companies’ investments into expanding manufacturing capabilities to meet expected future hydrogen demand also contributed to net losses. During the reporting period, the Fund had an average approximate stock exposure of 38.86% in United States and 15.11% in Britain. By sector, it had the highest exposure to Industrials at 91.86%.
| | AVERAGE ANNUAL TOTAL RETURN FOR THE YEAR ENDED |
| | NOVEMBER 30, 2023 |
| | One Year
Return | Annualized Inception to Date* |
| | Net Asset Value | Market Price | Net Asset Value | Market Price |
| Global X Hydrogen ETF | -46.86% | -46.08% | -43.09% | -43.05% |
| Solactive Global Hydrogen Index | -46.36% | -46.36% | -42.80% | -42.80% |
| MSCI ACWI Index (Net) | 12.01% | 12.01% | -0.25% | -0.25% |
48
Management Discussion of Fund Performance (unaudited)
Global X Hydrogen ETF
Growth of a 10,000 Investment
(at Net Asset Value)
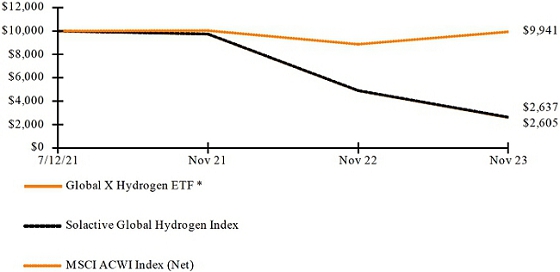
* The Fund commenced operations on July 12, 2021.
The MSCI ACWI (Net) (All Country World Index) Index is a free float-adjusted market capitalization weighted index that is designed to measure the equity market performance of developed and emerging markets.
The performance data quoted herein represents past performance and the return and value of an investment in the Fund will fluctuate so that, when sold, it may be worth less than its original cost. Past performance is no guarantee of future performance and should not be considered as a representation of the future results of the Fund. The Fund’s performance assumes the reinvestment of all dividends and all capital gains. Index returns assume reinvestment of dividends and, unlike the Fund’s returns, do not reflect any fees or expenses. If such fees and expenses were included in the index returns, the performance would have been lower. Please note that one cannot invest directly in an unmanaged index.
Performance figures for the periods shown may reflect contractual fee waivers and/or expense reimbursements. In the absence of fee waivers and/or expense reimbursements (if applicable), returns would have been lower.
There are no assurances that the Fund will meet its stated objectives.
The Fund’s holdings and allocations are subject to change and should not be considered recommendations to buy individual securities.
The graph and table do not reflect the deduction of taxes that a shareholder would pay on Fund distributions or the redemption or sale of Fund shares.
See definition of comparative indices on the previous page and above.
49
Management Discussion of Fund Performance (unaudited)
Global X Solar ETF
Global X Solar ETF
Global X Solar ETF (the “Fund”) seeks to provide investment results that correspond generally to the price and yield performance, before fees and expenses, of the Solactive Solar Index (“Underlying Index”). The Fund is passively managed, and the investment adviser does not attempt to take defensive positions in declining markets. The Fund generally seeks to fully replicate the Underlying Index.
The Underlying Index is designed to provide exposure to companies that are positioned to benefit from further advances in the field of solar technology. Specifically, the Underlying Index consists of securities issued by “Solar Companies” as defined by Solactive AG, the provider of the Underlying Index. Solar Companies are those companies that derive at least 50% of their revenues from the following business activities: (i) solar energy materials; (ii) solar energy systems & components; (iii) solar power production; (iv) solar technology; (v) solar installation, integration & maintenance.
For the 12-month period ended November 30, 2023 (the “reporting period”), the Fund decreased 46.92%, while the Underlying Index decreased 46.62%. The Fund had a net asset value of $22.06 per share on November 30, 2022 and ended the reporting period with a net asset value of $11.71 on November 30, 2023.
During the reporting period, the highest returns came from Abalance Corp. and Motech Industries Inc., which returned 19.57% and 9.25%, respectively. The worst performers were Sunpower Corp. and Maxeon Solar Technologies, which returned -82.89% and -82.06%, respectively.
The Fund recorded negative returns during the reporting period as the performances of Solar Companies were hindered by increased costs and lower than expected demand. Both solar equipment manufacturers and project developers faced dampened residential and commercial solar demand in key markets such as the U.S. and China. High polysilicon costs translated to higher costs across the entire solar power value chain, which impacted many projects already under development. Combined with high interest rates and the current macroeconomic environment, this caused some customers and developers to delay projects until prices improve. In the U.S., policy uncertainty over tariffs at the Federal level and shifting policies for residential solar in California also created headwinds. During the reporting period, the Fund had an average approximate stock exposure of 53.78% in China and 26.33% in United States. By sector, it had the highest exposure to Information Technology at 64.89% and Industrials at 23.91%.
| | AVERAGE ANNUAL TOTAL RETURN FOR THE YEAR ENDED |
| | NOVEMBER 30, 2023 |
| | One Year
Return | Annualized Inception to Date* |
| | Net Asset Value | Market Price | Net Asset Value | Market Price |
| Global X Solar ETF | -46.92% | -47.16% | -27.79% | -27.71% |
| Solactive Solar Index | -46.62% | -46.62% | -27.39% | -27.39% |
| MSCI ACWI Index (Net) | 12.01% | 12.01% | -1.31% | -1.31% |
50
Management Discussion of Fund Performance (unaudited)
Global X Solar ETF
Growth of a 10,000 Investment
(at Net Asset Value)
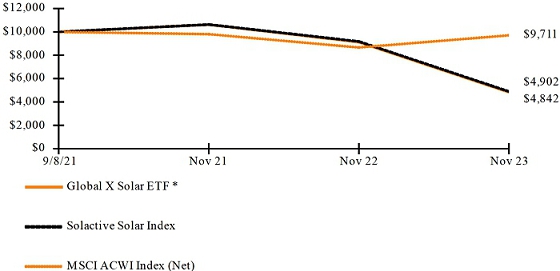
* The Fund commenced operations on September 8, 2021.
The MSCI ACWI (Net) (All Country World Index) Index is a free float-adjusted market capitalization weighted index that is designed to measure the equity market performance of developed and emerging markets.
The performance data quoted herein represents past performance and the return and value of an investment in the Fund will fluctuate so that, when sold, it may be worth less than its original cost. Past performance is no guarantee of future performance and should not be considered as a representation of the future results of the Fund. The Fund’s performance assumes the reinvestment of all dividends and all capital gains. Index returns assume reinvestment of dividends and, unlike the Fund’s returns, do not reflect any fees or expenses. If such fees and expenses were included in the index returns, the performance would have been lower. Please note that one cannot invest directly in an unmanaged index.
Performance figures for the periods shown may reflect contractual fee waivers and/or expense reimbursements. In the absence of fee waivers and/or expense reimbursements (if applicable), returns would have been lower.
There are no assurances that the Fund will meet its stated objectives.
The Fund’s holdings and allocations are subject to change and should not be considered recommendations to buy individual securities.
The graph and table do not reflect the deduction of taxes that a shareholder would pay on Fund distributions or the redemption or sale of Fund shares.
See definition of comparative indices on the previous page and above.
51
Management Discussion of Fund Performance (unaudited)
Global X Wind Energy ETF
Global X Wind Energy ETF
The Global X Wind Energy ETF (the “Fund”) seeks to provide investment results that correspond generally to the price and yield performance, before fees and expenses, of the Solactive Wind Energy Index (“Underlying Index”). The Fund is passively managed and the investment adviser does not attempt to take defensive positions in declining markets. The Fund generally seeks to fully replicate the Underlying Index.
The Underlying Index is designed to provide exposure to companies that are positioned to benefit from further advances in the field of wind energy technology. Specifically, the Underlying Index will include securities issued by “Wind Energy Companies” as defined by Solactive AG, the provider of the Underlying Index (the “Index Provider”). Wind Energy Companies are those companies that derive at least 50% of their revenues from the following business activities: (i) wind energy systems; (ii) wind power production; (iii) wind energy technology; and (iv) wind power integration & maintenance.
For the 12-month period ended November 30, 2023 (the “reporting period”), the Fund decreased 25.94%, while the Underlying Index decreased 25.69%. The Fund had a net asset value of $17.58 per share on November 30, 2022 and ended the reporting period with a net asset value of $12.88 on November 30, 2023.
During the reporting period, the highest returns came from Century Iron & Steel Industries and Cadeler A/S, which returned 93.80% and 20.52%, respectively. The worst performers were TPI Composites Inc. and Ming Yang Smart Energy Gro-A, which returned -82.53% and -48.66%, respectively.
The Fund performed negatively during the reporting period as Wind Energy Companies were impacted by higher interest rates, project delays and cancellations, and elevated material costs. For developers, complex permitting procedures, particularly in the European Union and United States slowed project timelines in both the onshore and offshore wind power industries. Furthermore, in the offshore segment, elevated costs coupled with low contracted prices put pressure on developers and led to some notable and costly project cancellations. For wind power equipment providers (such as wind turbine manufacturers), lower short-term demand due to project delays and cancellations, elevated materials costs, and supply chain challenges weighed on the Fund’s performance. During the reporting period, the Fund had an average approximate stock exposure of 33.07% in China, 25.02% in Denmark and 18.34% in Canada. By sector, it had the highest exposure to Utilities at 51.56% and Industrials at 46.60%.
| | AVERAGE ANNUAL TOTAL RETURN FOR THE YEAR ENDED |
| | NOVEMBER 30, 2023 |
| | One Year
Return | Annualized Inception to Date* |
| | Net Asset Value | Market Price | Net Asset Value | Market Price |
| Global X Wind Energy ETF | -25.94% | -27.45% | -25.05% | -25.15% |
| Solactive Wind Energy Index | -25.69% | -25.69% | -24.72% | -24.72% |
| MSCI ACWI Index (Net) | 12.01% | 12.01% | -1.31% | -1.31% |
52
Management Discussion of Fund Performance (unaudited)
Global X Wind Energy ETF
Growth of a 10,000 Investment
(at Net Asset Value)
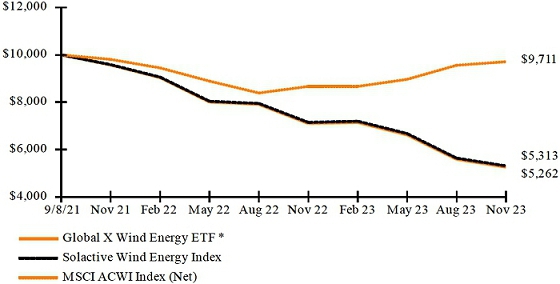
* The Fund commenced operations on September 8, 2021.
The MSCI ACWI (Net) (All Country World Index) Index is a free float-adjusted market capitalization weighted index that is designed to measure the equity market performance of developed and emerging markets.
The performance data quoted herein represents past performance and the return and value of an investment in the Fund will fluctuate so that, when sold, it may be worth less than its original cost. Past performance is no guarantee of future performance and should not be considered as a representation of the future results of the Fund. The Fund’s performance assumes the reinvestment of all dividends and all capital gains. Index returns assume reinvestment of dividends and, unlike the Fund’s returns, do not reflect any fees or expenses. If such fees and expenses were included in the index returns, the performance would have been lower. Please note that one cannot invest directly in an unmanaged index.
Performance figures for the periods shown may reflect contractual fee waivers and/or expense reimbursements. In the absence of fee waivers and/or expense reimbursements (if applicable), returns would have been lower.
There are no assurances that the Fund will meet its stated objectives.
The Fund’s holdings and allocations are subject to change and should not be considered recommendations to buy individual securities.
The graph and table do not reflect the deduction of taxes that a shareholder would pay on Fund distributions or the redemption or sale of Fund shares.
See definition of comparative indices on the previous page and above.
53
Management Discussion of Fund Performance (unaudited)
Global X Green Building ETF
Global X Green Building ETF
Global X Green Building ETF (the “Fund”) seeks to provide investment results that correspond generally to the price and yield performance, before fees and expenses, of the Solactive Green Building Index (“Underlying Index”). The Fund is passively managed, and the investment adviser does not attempt to take defensive positions in declining markets. The Fund generally seeks to fully replicate the Underlying Index.
The Underlying Index is designed to provide exposure to companies that are positioned to benefit from increased demand for buildings that reduce or eliminate negative impacts, and/or create positive impacts, on the natural environment (“Green Building”). Specifically, the Underlying Index will include securities issued by “Green Building Companies” as defined by Solactive AG, the provider of the Underlying Index. Green Building Companies are those companies that derive at least 50% of their revenues from one or more of the following business activities, as determined by the Index Provider: (i) green building development; (ii) green building management; and (iii) green building technologies & materials.
For the 12-month period ended November 30, 2023 (the “reporting period”), the Fund increased 6.95%, while the Underlying Index increased 7.49%. The Fund had a net asset value of $20.95 per share on November 30, 2022 and ended the reporting period with a net asset value of $21.66 on November 30, 2023.
During the reporting period, the highest returns came from M/I Homes, Inc. and TopBuild Corp., which returned 107.59% and 91.97%, respectively. The worst performers were Hudson Pacific Properties, Inc. and CIFI Holdings (Group) Co. Ltd., which returned -44.44% and -34.27%, respectively.
The Fund recorded positive returns during the reporting period. Notably, demand for sustainable buildings outweighed supply in some major markets, such as the U.S. and Canada, amid more stringent regulations and concerns over risks from climate change. Additionally, buildings with green certifications were often able to command premiums over traditional buildings across major global cities. Green building service providers and technology producers, such as heating, ventilation, and air conditioning (HVAC) system manufacturers, also saw robust demand amid growing momentum for more sustainable buildings. Furthermore, a stabilization in the cost of key building materials and labor contributed to positive performances for some building developers and owners. During the reporting period, the Fund had an average approximate stock exposure of 33.19% in the United States and 14.43% in Japan. By sector, it had the highest exposure to Real Estate at 58.92%, followed by Industrials at 33.47%.
| | AVERAGE ANNUAL TOTAL RETURN FOR THE YEAR ENDED
NOVEMBER 30, 2023 |
| | One Year
Return | Annualized Inception to Date* |
| | Net Asset Value | Market Price | Net Asset Value | Market Price |
| Global X Green Building ETF | 6.95% | 6.55% | -6.89% | -6.94% |
| Solactive Green Building Index | 7.49% | 7.49% | -6.69% | -6.69% |
| MSCI ACWI Index (Net) | 12.01% | 12.01% | 1.98% | 1.98% |
54
Management Discussion of Fund Performance (unaudited)
Global X Green Building ETF
Growth of a 10,000 Investment
(at Net Asset Value)

* The Fund commenced operations on April 11, 2022.
The MSCI ACWI (Net) (All Country World Index) Index is a free float-adjusted market capitalization weighted index that is designed to measure the equity market performance of developed and emerging markets.
The performance data quoted herein represents past performance and the return and value of an investment in the Fund will fluctuate so that, when sold, it may be worth less than its original cost. Past performance is no guarantee of future performance and should not be considered as a representation of the future results of the Fund. The Fund’s performance assumes the reinvestment of all dividends and all capital gains. Index returns assume reinvestment of dividends and, unlike the Fund’s returns, do not reflect any fees or expenses. If such fees and expenses were included in the index returns, the performance would have been lower. Please note that one cannot invest directly in an unmanaged index.
Performance figures for the periods shown may reflect contractual fee waivers and/or expense reimbursements. In the absence of fee waivers and/or expense reimbursements (if applicable), returns would have been lower.
There are no assurances that the Fund will meet its stated objectives.
The Fund’s holdings and allocations are subject to change and should not be considered recommendations to buy individual securities.
The graph and table do not reflect the deduction of taxes that a shareholder would pay on Fund distributions or the redemption or sale of Fund shares.
See definition of comparative indices on the previous page and above.
55
Management Discussion of Fund Performance (unaudited)
Global X Metaverse ETF
Global X Metaverse ETF
Global X Metaverse ETF (the “Fund”) seeks to provide investment results that correspond generally to the price and yield performance, before fees and expenses, of the Global X Metaverse Index (“Underlying Index”). The Fund is passively managed, and the investment adviser does not attempt to take defensive positions in declining markets. The Fund generally seeks to fully replicate the Underlying Index.
The Underlying Index is designed to provide exposure to companies that are positioned to benefit from the development and commercialization of the metaverse. The metaverse is a set of virtual, three dimensional (“3D”), real-time rendered spaces, simulations, and platforms that can be experienced simultaneously by users regardless of the users’ physical location.
For the 12-month period ended November 30, 2023 (the “reporting period”), the Fund increased 38.78%, while the Underlying Index increased 39.29%. The Fund had a net asset value of $19.20 per share on November 30, 2022 and ended the reporting period with a net asset value of $24.90 on November 30, 2023.
During the reporting period, the highest returns came from Meta Platforms Inc. Class-A and Nvidia Corp., which returned 177.01% and 176.47%, respectively. The worst performers were Keywords Studios Plc and NCsoft Corp., which returned -50.63% and -42.20%, respectively.
The Fund recorded positive returns during the reporting period amid substantial growth and progress in the underlying sub-segments and sub-industries of the metaverse, driven by the success of emerging hardware and the continued popularity of platforms. Increased demand for online gaming, blockchain technology and advancements in digital personalization led to growth and innovation opportunities in the metaverse industry. The industrial metaverse market advanced as organizations focused on the adaptation of virtual environments for a diverse set of use cases, including research and development, product development, monitoring and optimizing supply chains, and visualizing manufacturing operations, which helped boost productivity and operational effectiveness. Lastly, positive trends in the broader cryptocurrency market supported the growth prospects of companies involved in the creation and distribution of non-fungible tokens, further aiding the Fund’s performance. During the reporting period, the Fund had an average approximate stock exposure of 51.85% in United States, 20.57% in Japan, and 14.04% in China. By sector, it had the highest exposure to Communication Services at 67.69% and Information Technology at 24.28%.
| | AVERAGE ANNUAL TOTAL RETURN FOR THE YEAR ENDED |
| | NOVEMBER 30, 2023 |
| | One Year
Return | Annualized Inception to Date* |
| | Net Asset Value | Market Price | Net Asset Value | Market Price |
| Global X Metaverse ETF | 38.78% | 36.84% | 7.71% | 7.32% |
| Global X Metaverse Index | 39.29% | 39.29% | 8.10% | 8.10% |
| MSCI ACWI Index (Net) | 12.01% | 12.01% | 5.63% | 5.63% |
56
Management Discussion of Fund Performance (unaudited)
Global X Metaverse ETF
Growth of a 10,000 Investment
(at Net Asset Value)

* The Fund commenced operations on April 26, 2022.
The MSCI ACWI (Net) (All Country World Index) Index is a free float-adjusted market capitalization weighted index that is designed to measure the equity market performance of developed and emerging markets.
The performance data quoted herein represents past performance and the return and value of an investment in the Fund will fluctuate so that, when sold, it may be worth less than its original cost. Past performance is no guarantee of future performance and should not be considered as a representation of the future results of the Fund. The Fund’s performance assumes the reinvestment of all dividends and all capital gains. Index returns assume reinvestment of dividends and, unlike the Fund’s returns, do not reflect any fees or expenses. If such fees and expenses were included in the index returns, the performance would have been lower. Please note that one cannot invest directly in an unmanaged index.
Performance figures for the periods shown may reflect contractual fee waivers and/or expense reimbursements. In the absence of fee waivers and/or expense reimbursements (if applicable), returns would have been lower.
There are no assurances that the Fund will meet its stated objectives.
The Fund’s holdings and allocations are subject to change and should not be considered recommendations to buy individual securities.
The graph and table do not reflect the deduction of taxes that a shareholder would pay on Fund distributions or the redemption or sale of Fund shares.
See definition of comparative indices on the previous page and above.
57
Management Discussion of Fund Performance (unaudited)
Global X PropTech ETF
Global X PropTech ETF
Global X PropTech ETF (the “Fund”) seeks to provide investment results that correspond generally to the price and yield performance, before fees and expenses, of the Global X PropTech Index (“Underlying Index”). The Fund is passively managed, and the investment adviser does not attempt to take defensive positions in declining markets. The Fund generally seeks to fully replicate the Underlying Index.
The Underlying Index is owned and was developed by Global X Management Company LLC (the “Index Provider”), an affiliate of the Fund and the Fund’s investment adviser. The Underlying Index is administered and calculated by Mirae Asset Global Indices Pvt. Ltd. (the “Index Administrator”), an affiliate of the Index Provider. The Underlying Index is designed to provide exposure to property technology (“PropTech”) companies that are positioned to benefit from technology that optimizes the way people buy, sell, rent, design, construct, manage, and research/market residential and commercial properties. Specifically, the Underlying Index consists of securities issued by “PropTech Companies”, as determined by the Index Administrator. “PropTech Companies” are those companies that derive at least 50% of their revenues from one or more of the following business activities in aggregate, as determined by the Index Administrator: (i) property management; (ii) real estate marketplace and platforms; and (iii) real estate research and analytics.
From the inception of the Fund through the period ending November 30, 2023 (the “reporting period”), the Fund increased 8.71%, while the Underlying Index increased 8.94%. The Fund had a net asset value of $25.08 per share on April 11, 2023 and ended the reporting period with a net asset value of $27.26 on November 30, 2023.
During the reporting period, the highest returns came from Opendoor Technologies Inc. and AppFolio Inc. Class A, which returned 65.38% and 48.15%, respectively. The worst performers were WeWork Inc. Class A and Hippo Holdings Inc, which returned -92.84% and -52.89%, respectively.
The Fund recorded positive returns during the reporting period amid increased technological adoption coupled with emerging demographic trends that helped improve how the real estate sector is developed, marketed, managed, and occupied. Online real estate applications offered a comprehensive platform to search properties based on specific criteria, allowing investors to make informed decisions with less or no need for physical visits. Furthermore, digital payment systems and secure transaction portals streamlined the process of property transactions and created a transparent and immutable record of ownership, reducing fraud. Lastly, the Fund benefitted from increased adoption of property management software and mobile applications enhanced operational efficiency via a simplification of tasks such as rent collection and tenant communication.
| | AVERAGE ANNUAL TOTAL RETURN FOR THE PERIOD
ENDED NOVEMBER 30, 2023 |
| | Cumulative Inception to Date* |
| | Net Asset Value | Market Price |
| Global X Prop Tech ETF | 8.71% | 8.47% |
| Global X PropTech Index | 8.94% | 8.94% |
| MSCI ACWI Index (Net) | 8.35% | 8.35% |
58
Management Discussion of Fund Performance (unaudited)
Global X PropTech ETF
Growth of a 10,000 Investment
(at Net Asset Value)
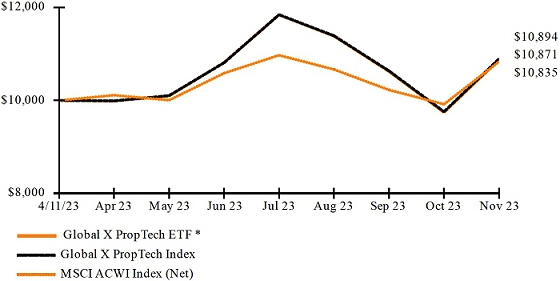
* The Fund commenced operations on April 11, 2023.
The MSCI ACWI (Net) (All Country World Index) Index is a free float-adjusted market capitalization weighted index that is designed to measure the equity market performance of developed and emerging markets.
The performance data quoted herein represents past performance and the return and value of an investment in the Fund will fluctuate so that, when sold, it may be worth less than its original cost. Past performance is no guarantee of future performance and should not be considered as a representation of the future results of the Fund. The Fund’s performance assumes the reinvestment of all dividends and all capital gains. Index returns assume reinvestment of dividends and, unlike the Fund’s returns, do not reflect any fees or expenses. If such fees and expenses were included in the index returns, the performance would have been lower. Please note that one cannot invest directly in an unmanaged index.
Performance figures for the periods shown may reflect contractual fee waivers and/or expense reimbursements. In the absence of fee waivers and/or expense reimbursements (if applicable), returns would have been lower.
There are no assurances that the Fund will meet its stated objectives.
The Fund’s holdings and allocations are subject to change and should not be considered recommendations to buy individual securities.
The graph and table do not reflect the deduction of taxes that a shareholder would pay on Fund distributions or the redemption or sale of Fund shares.
See definition of comparative indices on the previous page and above.
59
Management Discussion of Fund Performance (unaudited)
Global X Carbon Credits Strategy ETF
Global X Carbon Credits Strategy ETF
Global X Carbon Credits Strategy ETF (the “Fund”) seeks to provide investment results that correspond generally to the price and yield performance, before fees and expenses, of the ICE Global Carbon Futures Index (“Underlying Index”). The Fund is passively managed, and the investment adviser does not attempt to take defensive positions in declining markets. The Fund generally seeks to fully replicate the Underlying Index.
The Underlying Index seeks to provide exposure to the most actively traded carbon credit futures that require “physical delivery” of emission allowances and that are issued under “cap and trade” regimes, as determined by ICE Data Indices, LLC, the provider of the Underlying Index. A cap and trade regime is a market-based mechanism that governments or regulatory bodies use to reduce carbon dioxide and other greenhouse gases from entering the atmosphere.
From the inception of the fund through the period ending November 30, 2023 (the “reporting period”), the Fund decreased 8.99%, while the Underlying Index decreased 6.09%. The Fund had a net asset value of $34.88 per share on May 24, 2023 and ended the reporting period with a net asset value of $31.67 on November 30, 2023.
The Fund recorded negative returns during the reporting period due to lower demand for carbon allowances and policy developments that led to a temporary increase in supply. In Europe, the European Commission confirmed plans to sell an increased amount of allowances over the next few years to support the transition away from reliance on fossil fuels. Though the UK proposed to tighten the overall limit of carbon emissions, it also proposed to distribute additional allowances until 2027, which resulted in a significant decrease in the price of carbon credits futures. Separately, California carbon allowances saw a rise in price due to legislation related to tightening supply and emissions caps. There has been uncertainty in the global macroeconomic environment amidst concerns of a reduction in industrial output and recession fears. This resulted in weak demand during the reporting period which led to decreases in purchases in the voluntary carbon markets.
| | AVERAGE ANNUAL TOTAL RETURN FOR THE PERIOD |
| | ENDED NOVEMBER 30, 2023 |
| | Cumulative Inception to Date* |
| | Net Asset Value | Market Price |
| Global X Carbon Credits Strategy ETF | -8.99% | -8.50% |
| ICE Global Carbon Futures Index | -6.09% | -6.09% |
| Bloomberg Commodity Index | 4.10% | 4.10% |
60
Management Discussion of Fund Performance (unaudited)
Global X Carbon Credits Strategy ETF
Growth of a 10,000 Investment
(at Net Asset Value)

* The Fund commenced operations on May 24, 2023.
Bloomberg Commodity Index (BCOM) is made up of 23 exchange-traded futures on physical commodities, representing 21 commodities which are weighted to account for economic significance and market liquidity. Weighting restrictions on individual commodities and commodity groups promote diversification.
The performance data quoted herein represents past performance and the return and value of an investment in the Fund will fluctuate so that, when sold, it may be worth less than its original cost. Past performance is no guarantee of future performance and should not be considered as a representation of the future results of the Fund. The Fund’s performance assumes the reinvestment of all dividends and all capital gains. Index returns assume reinvestment of dividends and, unlike the Fund’s returns, do not reflect any fees or expenses. If such fees and expenses were included in the index returns, the performance would have been lower. Please note that one cannot invest directly in an unmanaged index.
Performance figures for the periods shown may reflect contractual fee waivers and/or expense reimbursements. In the absence of fee waivers and/or expense reimbursements (if applicable), returns would have been lower.
There are no assurances that the Fund will meet its stated objectives.
The Fund’s holdings and allocations are subject to change and should not be considered recommendations to buy individual securities.
The graph and table do not reflect the deduction of taxes that a shareholder would pay on Fund distributions or the redemption or sale of Fund shares.
See definition of comparative indices on the previous page and above.
61
Management Discussion of Fund Performance (unaudited)
Global X Defense Tech ETF
Global X Defense Tech ETF
The Global X Defense Tech ETF (the “Fund”) seeks to provide investment results that correspond generally to the price and yield performance, before fees and expenses, of the Global X Defense Tech Index (“Underlying Index”). The Fund is passively managed and the investment adviser does not attempt to take defensive positions in declining markets. The Fund generally seeks to fully replicate the Underlying Index.
The Underlying Index is owned and was developed by Global X Management Company LLC (the “Index Provider”), an affiliate of the Fund and the Fund’s investment adviser. The Underlying Index is administered and calculated by Mirae Asset Global Indices Pvt. Ltd. (the “Index Administrator”), an affiliate of the Index Provider. The Underlying Index is designed to provide exposure to defense technology (“Defense Tech”) companies that are positioned to benefit from technology, services, systems and hardware that cater to the defense and military sector. Specifically, the Underlying Index consists of securities issued by “Defense Tech Companies”, as determined by the Index Administrator. “Defense Tech Companies” are those companies that derive at least 50% of their revenues from one or more of the following business activities in aggregate, as determined by the Index Administrator: (i) cybersecurity; (ii) defense technology; and (iii) Advanced Military Systems and Hardware.
From the inception of the Fund to the period ended November 30, 2023 (the “reporting period”), the Fund increased 8.90%, while the Underlying Index increased 9.04%. The Fund had a net asset value of $24.82 per share on September 11, 2023 and ended the reporting period with a net asset value of $27.03 on November 30, 2023.
During the reporting period, the highest returns came from Kratos Defense & Security Solutions Inc. and Palantir Technologies Inc. Class A, which returned 29.15% and 26.98%, respectively. The worst performers were Terran Orbital Corp. and Hensoldt AG, which returned -42.14% and -18.37%, respectively.
The Fund performed positively during the reporting period, fueled by government initiatives that benefitted Defense Tech Companies such as the CHIPS and Science Act, which actively promoted investments in semiconductors and industrial development for enhancing national security. Additionally, recent international restrictions spurred growth in the domestic aerospace and defense space. Additionally, many companies began to prioritize investing in cybersecurity amid escalating cyber threats and rising geopolitical tensions, especially due to the surge in artificial intelligence implementation.
| | AVERAGE ANNUAL TOTAL RETURN FOR THE PERIOD |
| | ENDED |
| | NOVEMBER 30, 2023 |
| | Cumulative Inception to Date* |
| | Net Asset Value | Market Price |
| Global X Defense Tech ETF | 8.90% | 9.02% |
| Global X Defense Tech Index | 9.04% | 9.04% |
| MSCI ACWI Index (Net) | 2.07% | 2.07% |
62
Management Discussion of Fund Performance (unaudited)
Global X Defense Tech ETF
Growth of a $10,000 Investment
(At Net Asset Value)

* The Fund commenced operations on September 11, 2023.
The MSCI ACWI (Net) (All Country World Index) Index is a free float-adjusted market capitalization weighted index that is designed to measure the equity market performance of developed and emerging markets.
The performance data quoted herein represents past performance and the return and value of an investment in the Fund will fluctuate so that, when redeemed, it may be worth less than its original cost. Past performance is no guarantee of future performance and should not be considered as a representation of the future results of the Fund. The Fund’s performance assumes the reinvestment of all dividends and all capital gains. Index returns assume reinvestment of dividends and, unlike the Fund’s returns, do not reflect any fees or expenses. If such fees and expenses were included in the index returns, the performance would have been lower. Please note that one cannot invest directly in an unmanaged index. Performance figures for the periods shown may reflect contractual fee waivers and/or expense reimbursements. In the absence of fee waiver sand/or expense reimbursements (if applicable), returns would have been lower.
There are no assurances that the Fund will meet its stated objectives.
The Fund’s holdings and allocations are subject to change and should not be considered recommendations to buy individual securities.
The graph and table do not reflect the deduction of taxes that a shareholder would pay on Fund distributions or the redemption or sale of Fund shares.
See definition of comparative indices on the previous page.
63
| Schedule of Investments | November 30, 2023 |
Global X Millennial Consumer ETF
Sector Weightings (Unaudited)†:

† Sector weightings percentages are based on the total market value of investments. Total investments do not include derivatives such as options, futures contracts, forward contracts, and swap contracts, if applicable.
| | | Shares | | | Value | |
| COMMON STOCK — 99.9% | | | | | | | | |
| SINGAPORE — 1.2% | | | | | | | | |
| Communication Services — 1.2% | | | | | | | | |
| Sea ADR * | | | 35,357 | | | $ | 1,280,631 | |
| | | | | | | | | |
| UNITED STATES — 98.7% | | | | | | | | |
| Communication Services — 21.5% | | | | | | | | |
| Alphabet, Cl A * | | | 27,699 | | | | 3,670,949 | |
| Angi, Cl A * | | | 138,088 | | | | 310,698 | |
| Cargurus, Cl A * | | | 16,412 | | | | 354,827 | |
| Cars.com * | | | 14,920 | | | | 277,810 | |
| iHeartMedia, Cl A * | | | 75,645 | | | | 198,190 | |
| Match Group * | | | 23,751 | | | | 769,057 | |
| Meta Platforms, Cl A * | | | 13,505 | | | | 4,418,161 | |
| Netflix * | | | 8,596 | | | | 4,074,246 | |
| Snap, Cl A * | | | 112,849 | | | | 1,560,702 | |
| Spotify Technology * | | | 16,472 | | | | 3,049,132 | |
| TripAdvisor * | | | 16,118 | | | | 287,384 | |
| Vimeo * | | | 82,469 | | | | 290,291 | |
| Walt Disney * | | | 29,505 | | | | 2,734,818 | |
| Yelp, Cl A * | | | 9,658 | | | | 422,151 | |
The accompanying notes are an integral part of the financial statements.
64
| Schedule of Investments | November 30, 2023 |
Global X Millennial Consumer ETF
| | | Shares | | | Value | |
| COMMON STOCK — continued | | | | | | |
| Communication Services — continued | | | | | | |
| ZipRecruiter, Cl A * | | | 17,085 | | | $ | 229,110 | |
| | | | | | | | 22,647,526 | |
| Consumer Discretionary — 42.8% | | | | | | | | |
| 2U * | | | 52,196 | | | | 51,277 | |
| Airbnb, Cl A * | | | 26,113 | | | | 3,299,116 | |
| Amazon.com * | | | 29,061 | | | | 4,245,521 | |
| AutoNation * | | | 3,988 | | | | 539,457 | |
| Booking Holdings * | | | 1,131 | | | | 3,535,167 | |
| Capri Holdings * | | | 10,690 | | | | 517,824 | |
| CarMax * | | | 13,436 | | | | 859,098 | |
| Carter’s | | | 4,211 | | | | 287,148 | |
| Carvana, Cl A * | | | 31,684 | | | | 992,343 | |
| Chegg * | | | 16,419 | | | | 163,041 | |
| Children’s Place * | | | 9,487 | | | | 215,829 | |
| Chipotle Mexican Grill, Cl A * | | | 1,733 | | | | 3,816,499 | |
| Columbia Sportswear | | | 5,288 | | | | 414,209 | |
| Coursera * | | | 26,391 | | | | 521,222 | |
| Designer Brands, Cl A (A) | | | 33,854 | | | | 394,061 | |
| Dick’s Sporting Goods | | | 5,277 | | | | 686,538 | |
| eBay | | | 45,651 | | | | 1,872,148 | |
| Etsy * | | | 10,599 | | | | 803,510 | |
| Expedia Group * | | | 12,570 | | | | 1,711,783 | |
| GoPro, Cl A * | | | 62,037 | | | | 223,954 | |
| Graham Holdings, Cl B | | | 496 | | | | 311,066 | |
| Home Depot | | | 10,184 | | | | 3,192,582 | |
| Laureate Education, Cl A | | | 24,948 | | | | 327,567 | |
| Life Time Group Holdings * | | | 17,132 | | | | 259,721 | |
| Lowe’s | | | 14,768 | | | | 2,936,321 | |
| Lululemon Athletica * | | | 8,167 | | | | 3,649,016 | |
| NIKE, Cl B | | | 23,532 | | | | 2,594,874 | |
| Peloton Interactive, Cl A * | | | 29,166 | | | | 165,080 | |
| Perdoceo Education | | | 21,798 | | | | 379,721 | |
| Planet Fitness, Cl A * | | | 7,216 | | | | 490,255 | |
| Skechers USA, Cl A * | | | 11,433 | | | | 673,518 | |
| Starbucks | | | 27,810 | | | | 2,761,533 | |
| Strategic Education | | | 3,141 | | | | 279,455 | |
| Stride * | | | 7,693 | | | | 466,042 | |
| Under Armour, Cl A * | | | 32,433 | | | | 264,005 | |
The accompanying notes are an integral part of the financial statements.
65
| Schedule of Investments | November 30, 2023 |
Global X Millennial Consumer ETF
| | | Shares | | | Value | |
| COMMON STOCK — continued | | | | | | | | |
| Consumer Discretionary — continued | | | | | | | | |
| VF | | | 33,047 | | | $ | 552,876 | |
| Victoria’s Secret * | | | 9,050 | | | | 243,897 | |
| Wayfair, Cl A * | | | 8,454 | | | | 471,733 | |
| | | | | | | | 45,169,007 | |
| Consumer Staples — 3.9% | | | | | | | | |
| Costco Wholesale | | | 5,976 | | | | 3,542,214 | |
| Medifast | | | 3,008 | | | | 199,671 | |
| Sprouts Farmers Market * | | | 8,764 | | | | 377,553 | |
| | | | | | | | 4,119,438 | |
| Financials — 8.9% | | | | | | | | |
| Block, Cl A * | | | 46,086 | | | | 2,923,235 | |
| Fiserv * | | | 25,713 | | | | 3,358,375 | |
| LendingClub * | | | 40,995 | | | | 258,268 | |
| Nelnet, Cl A | | | 3,274 | | | | 274,689 | |
| PayPal Holdings * | | | 39,393 | | | | 2,269,431 | |
| SLM | | | 21,592 | | | | 324,528 | |
| | | | | | | | 9,408,526 | |
| Health Care — 0.6% | | | | | | | | |
| Accolade * | | | 19,881 | | | | 173,561 | |
| American Well, Cl A * | | | 134,828 | | | | 171,231 | |
| Hims & Hers Health * | | | 29,458 | | | | 261,882 | |
| | | | | | | | 606,674 | |
| Industrials — 6.0% | | | | | | | | |
| Avis Budget Group * | | | 3,357 | | | | 613,827 | |
| Lyft, Cl A * | | | 31,416 | | | | 368,510 | |
| Uber Technologies * | | | 94,656 | | | | 5,336,705 | |
| | | | | | | | 6,319,042 | |
| Information Technology — 7.2% | | | | | | | | |
| Apple | | | 17,973 | | | | 3,413,971 | |
| Intuit | | | 6,735 | | | | 3,848,783 | |
| PowerSchool Holdings, Cl A * | | | 14,823 | | | | 345,673 | |
| | | | | | | | 7,608,427 | |
| Real Estate — 7.8% | | | | | | | | |
| AvalonBay Communities ‡ | | | 11,921 | | | | 2,061,618 | |
The accompanying notes are an integral part of the financial statements.
66
| Schedule of Investments | November 30, 2023 |
Global X Millennial Consumer ETF
| | | Shares | | | Value | |
| COMMON STOCK — continued | | | | | | | | |
| Real Estate — continued | | | | | | | | |
| Camden Property Trust ‡ | | | 9,073 | | | $ | 818,929 | |
| Centerspace ‡ | | | 5,382 | | | | 287,076 | |
| Equity Residential ‡ | | | 32,193 | | | | 1,829,850 | |
| Independence Realty Trust ‡ | | | 19,075 | | | | 259,801 | |
| Invitation Homes ‡ | | | 51,988 | | | | 1,734,320 | |
| UDR ‡ | | | 27,989 | | | | 934,832 | |
| Zillow Group, Cl A * | | | 6,607 | | | | 260,250 | |
| | | | | | | | 8,186,676 | |
| TOTAL UNITED STATES | | | | | | | 104,065,316 | |
TOTAL COMMON STOCK
(Cost $140,756,267) | | | | | | | 105,345,947 | |
| | | | | | | | | |
| SHORT-TERM INVESTMENT(B) — 0.0% | | | | | | | | |
Fidelity Investments Money Market Government Portfolio, Cl Institutional, 5.280%
(Cost $7,792) | | | 7,792 | | | | 7,792 | |
| | | | | | | | | |
| | Face Amount | | | | |
| REPURCHASE AGREEMENT(C) — 0.0% | | | | | | | | |
BNP Paribas
5.220%, dated 11/30/2023, to be repurchased on 12/01/2023, repurchase price $25,532 (collateralized by U.S. Treasury Obligations, ranging in par value $127 - $3,003, 2.000%, 08/15/2025, with a total market value of $26,018)
(Cost $25,528) | | $ | 25,528 | | | | 25,528 | |
TOTAL INVESTMENTS — 99.9%
(Cost $140,789,587) | | | | | | $ | 105,379,267 | |
Percentages are based on Net Assets of $105,493,357.
| * | Non-income producing security. |
| ‡ | Real Estate Investment Trust |
| (A) | This security or a partial position of this security is on loan at November 30, 2023. The total market value of securities on loan at November 30, 2023 was $32,592. |
The accompanying notes are an integral part of the financial statements.
67
| Schedule of Investments | November 30, 2023 |
Global X Millennial Consumer ETF
| (B) | The rate reported on the Schedule of Investments is the 7-day effective yield as of November 30, 2023. |
| (C) | These securities were purchased with cash collateral held from securities on loan. The total value of such securities as of November 30, 2023 was $25,528. The total value of non-cash collateral held from securities on loan as of November 30, 2023 was $–. |
The following is a summary of the level of inputs used as of November 30, 2023, in valuing the Fund’s investments carried at value:
| Investments in Securities | | Level 1 | | | Level 2 | | | Level 3 | | | Total | |
| Common Stock | | $ | 105,345,947 | | | $ | — | | | $ | — | | | $ | 105,345,947 | |
| Short-Term Investment | | | 7,792 | | | | — | | | | — | | | | 7,792 | |
| Repurchase Agreement | | | — | | | | 25,528 | | | | — | | | | 25,528 | |
| Total Investments in Securities | | $ | 105,353,739 | | | $ | 25,528 | | | $ | — | | | $ | 105,379,267 | |
Amounts designated as “—“are $0 or have been rounded to $0.
See “Glossary” for abbreviations.
The accompanying notes are an integral part of the financial statements.
68
| Schedule of Investments | November 30, 2023 |
Global X Aging Population ETF
Sector Weightings (Unaudited)†:

† Sector weightings percentages are based on the total market value of investments. Total investments do not include derivatives such as options, futures contracts, forward contracts, and swap contracts, if applicable.
| | | Shares | | | Value | |
| COMMON STOCK — 99.8% | | | | | | | | |
| AUSTRALIA — 0.9% | | | | | | | | |
| Health Care — 0.9% | | | | | | | | |
| Cochlear | | | 2,566 | | | $ | 464,547 | |
| | | | | | | | | |
| BELGIUM — 1.3% | | | | | | | | |
| Health Care — 1.0% | | | | | | | | |
| UCB | | | 7,567 | | | | 560,109 | |
| | | | | | | | | |
| Real Estate — 0.3% | | | | | | | | |
| Aedifica ‡ | | | 2,424 | | | | 152,209 | |
| | | | | | | | | |
| TOTAL BELGIUM | | | | | | | 712,318 | |
| CANADA — 0.7% | | | | | | | | |
| Health Care — 0.7% | | | | | | | | |
| Chartwell Retirement Residences | | | 26,035 | | | | 208,533 | |
| Sienna Senior Living | | | 20,443 | | | | 161,029 | |
| | | | | | | | | |
| TOTAL CANADA | | | | | | | 369,562 | |
| CHINA — 4.0% | | | | | | | | |
| Health Care — 4.0% | | | | | | | | |
| AK Medical Holdings | | | 124,189 | | | | 111,941 | |
| BeiGene ADR * | | | 4,092 | | | | 764,958 | |
| Beijing Chunlizhengda Medical Instruments, Cl H | | | 61,866 | | | | 106,935 | |
| Hansoh Pharmaceutical Group | | | 232,643 | | | | 471,225 | |
| Lifetech Scientific * | | | 410,292 | | | | 126,077 | |
| Luye Pharma Group * | | | 331,324 | | | | 165,444 | |
| Microport Scientific * | | | 72,802 | | | | 116,702 | |
The accompanying notes are an integral part of the financial statements.
69
| Schedule of Investments | November 30, 2023 |
Global X Aging Population ETF
| | | Shares | | | Value | |
| COMMON STOCK — continued | | | | | | | | |
| Health Care — continued | | | | | | | | |
| SciClone Pharmaceuticals Holdings | | | 114,300 | | | $ | 199,029 | |
| Venus MedTech Hangzhou, Cl H *(A)(B) | | | 105,440 | | | | 75,871 | |
| | | | | | | | | |
| TOTAL CHINA | | | | | | | 2,138,182 | |
| DENMARK — 6.4% | | | | | | | | |
| Consumer Discretionary — 0.3% | | | | | | | | |
| GN Store Nord * | | | 7,167 | | | | 168,971 | |
| | | | | | | | | |
| Health Care — 6.1% | | | | | | | | |
| Demant * | | | 8,995 | | | | 382,276 | |
| Genmab * | | | 2,575 | | | | 814,350 | |
| Novo Nordisk, Cl B | | | 20,308 | | | | 2,067,013 | |
| | | | | | | | 3,263,639 | |
| TOTAL DENMARK | | | | | | | 3,432,610 | |
| FRANCE — 0.1% | | | | | | | | |
| Health Care — 0.1% | | | | | | | | |
| Clariane | | | 21,365 | | | | 50,399 | |
| | | | | | | | | |
| GERMANY — 0.9% | | | | | | | | |
| Health Care — 0.9% | | | | | | | | |
| Fresenius Medical Care | | | 11,387 | | | | 467,527 | |
| | | | | | | | | |
| IRELAND — 0.2% | | | | | | | | |
| Health Care — 0.2% | | | | | | | | |
| Amarin ADR * | | | 118,249 | | | | 92,471 | |
| | | | | | | | | |
| ITALY — 0.5% | | | | | | | | |
| Health Care — 0.5% | | | | | | | | |
| Amplifon | | | 8,842 | | | | 275,242 | |
| | | | | | | | | |
| JAPAN — 8.2% | | | | | | | | |
| Health Care — 8.2% | | | | | | | | |
| Astellas Pharma | | | 70,183 | | | | 853,343 | |
| Chugai Pharmaceutical | | | 67,164 | | | | 2,370,628 | |
| Nipro | | | 21,749 | | | | 164,476 | |
| SUNWELS | | | 6,644 | | | | 102,423 | |
The accompanying notes are an integral part of the financial statements.
70
| Schedule of Investments | November 30, 2023 |
Global X Aging Population ETF
| | | Shares | | | Value | |
| COMMON STOCK — continued | | | | | | | | |
| Health Care — continued | | | | | | | | |
| Terumo | | | 29,000 | | | $ | 925,505 | |
| | | | | | | | | |
| TOTAL JAPAN | | | | | | | 4,416,375 | |
| NEW ZEALAND — 0.3% | | | | | | | | |
| Health Care — 0.3% | | | | | | | | |
| Ryman Healthcare | | | 49,151 | | | | 163,934 | |
| | | | | | | | | |
| SOUTH KOREA — 1.6% | | | | | | | | |
| Health Care — 1.6% | | | | | | | | |
| Celltrion | | | 5,742 | | | | 724,995 | |
| Dentium | | | 1,448 | | | | 141,079 | |
| | | | | | | | | |
| TOTAL SOUTH KOREA | | | | | | | 866,074 | |
| SPAIN — 0.3% | | | | | | | | |
| Health Care — 0.3% | | | | | | | | |
| Pharma Mar | | | 3,586 | | | | 153,377 | |
| | | | | | | | | |
| SWEDEN — 0.3% | | | | | | | | |
| Health Care — 0.3% | | | | | | | | |
| Elekta, Cl B | | | 20,217 | | | | 157,818 | |
| | | | | | | | | |
| SWITZERLAND — 6.2% | | | | | | | | |
| Health Care — 6.2% | | | | | | | | |
| Alcon | | | 23,395 | | | | 1,773,559 | |
| Sonova Holding | | | 2,382 | | | | 691,138 | |
| Straumann Holding | | | 6,210 | | | | 858,780 | |
| | | | | | | | | |
| TOTAL SWITZERLAND | | | | | | | 3,323,477 | |
| UNITED KINGDOM — 3.5% | | | | | | | | |
| Health Care — 3.5% | | | | | | | | |
| AstraZeneca ADR | | | 22,488 | | | | 1,452,500 | |
| Smith & Nephew | | | 34,059 | | | | 441,303 | |
| | | | | | | | | |
| TOTAL UNITED KINGDOM | | | | | | | 1,893,803 | |
The accompanying notes are an integral part of the financial statements.
71
| Schedule of Investments | November 30, 2023 |
Global X Aging Population ETF
| | | Shares | | | Value | |
| COMMON STOCK — continued | | | | | | | | |
| UNITED STATES — 64.4% | | | | | | | | |
| Health Care — 57.7% | | | | | | | | |
| AbbVie | | | 10,335 | | | $ | 1,471,601 | |
| ACADIA Pharmaceuticals * | | | 9,100 | | | | 202,748 | |
| agilon health * | | | 16,100 | | | | 170,982 | |
| Agios Pharmaceuticals * | | | 7,429 | | | | 165,147 | |
| Alector * | | | 25,316 | | | | 137,213 | |
| Alphatec Holdings * | | | 10,553 | | | | 125,264 | |
| Amedisys * | | | 2,114 | | | | 197,828 | |
| Amgen | | | 6,690 | | | | 1,803,892 | |
| AngioDynamics * | | | 17,702 | | | | 115,594 | |
| Biogen * | | | 5,827 | | | | 1,363,984 | |
| Blueprint Medicines * | | | 3,553 | | | | 247,431 | |
| Boston Scientific * | | | 32,755 | | | | 1,830,677 | |
| Bristol-Myers Squibb | | | 23,885 | | | | 1,179,441 | |
| Brookdale Senior Living * | | | 40,071 | | | | 212,376 | |
| Cano Health * | | | 1,183 | | | | 8,734 | |
| DaVita * | | | 3,543 | | | | 359,473 | |
| Deciphera Pharmaceuticals * | | | 11,140 | | | | 140,475 | |
| Denali Therapeutics * | | | 6,747 | | | | 124,954 | |
| Dexcom * | | | 14,463 | | | | 1,670,766 | |
| Edwards Lifesciences * | | | 19,862 | | | | 1,344,856 | |
| Eli Lilly | | | 4,485 | | | | 2,650,814 | |
| Embecta | | | 5,804 | | | | 106,445 | |
| Ensign Group | | | 2,160 | | | | 231,271 | |
| Exact Sciences * | | | 6,946 | | | | 444,544 | |
| Exelixis * | | | 12,701 | | | | 277,009 | |
| FibroGen * | | | 8,476 | | | | 4,682 | |
| Glaukos * | | | 3,392 | | | | 216,715 | |
| Halozyme Therapeutics * | | | 5,310 | | | | 205,019 | |
| Incyte * | | | 8,688 | | | | 472,106 | |
| Insulet * | | | 2,724 | | | | 515,081 | |
| Integer Holdings * | | | 2,126 | | | | 185,430 | |
| Johnson & Johnson | | | 10,123 | | | | 1,565,623 | |
| LivaNova * | | | 3,872 | | | | 173,659 | |
| MannKind * | | | 40,009 | | | | 144,833 | |
| Medtronic | | | 20,611 | | | | 1,633,834 | |
| Merit Medical Systems * | | | 2,234 | | | | 159,865 | |
| National HealthCare | | | 2,857 | | | | 218,761 | |
| Neurocrine Biosciences * | | | 3,762 | | | | 438,612 | |
The accompanying notes are an integral part of the financial statements.
72
| Schedule of Investments | November 30, 2023 |
Global X Aging Population ETF
| | | Shares | | | Value | |
| COMMON STOCK — continued | | | | | | | | |
| Health Care — continued | | | | | | | | |
| Novocure * | | | 4,093 | | | $ | 50,221 | |
| Regeneron Pharmaceuticals * | | | 2,032 | | | | 1,673,982 | |
| Roche Holding | | | 4,168 | | | | 1,197,362 | |
| Seagen * | | | 8,179 | | | | 1,743,845 | |
| Sight Sciences * | | | 18,001 | | | | 61,383 | |
| Silk Road Medical * | | | 4,061 | | | | 37,889 | |
| Stryker | | | 5,785 | | | | 1,714,269 | |
| Teleflex | | | 1,853 | | | | 418,204 | |
| Theravance Biopharma * | | | 14,001 | | | | 146,730 | |
| United Therapeutics * | | | 1,827 | | | | 438,480 | |
| Zimmer Biomet Holdings | | | 8,217 | | | | 955,719 | |
| | | | | | | | 30,955,823 | |
| Real Estate — 6.7% | | | | | | | | |
| LTC Properties ‡ | | | 4,854 | | | | 158,337 | |
| National Health Investors ‡ | | | 3,303 | | | | 179,221 | |
| Omega Healthcare Investors ‡ | | | 9,178 | | | | 291,402 | |
| Sabra Health Care REIT ‡ | | | 14,139 | | | | 206,429 | |
| Ventas ‡ | | | 15,658 | | | | 717,763 | |
| Welltower ‡ | | | 22,639 | | | | 2,017,135 | |
| | | | | | | | 3,570,287 | |
| TOTAL UNITED STATES | | | | | | | 34,526,110 | |
TOTAL COMMON STOCK
(Cost $60,371,029) | | | | | | | 53,503,826 | |
| | | | | | | | |
| | | Number of
Rights | | | | | |
| RIGHTS — 0.0% | | | | | | | | |
| United States — 0.0% | | | | | | | | |
| Radius Health#(A)(B) | | | 19,104 | | | | — | |
TOTAL RIGHTS
(Cost $–) | | | | | | | — | |
TOTAL INVESTMENTS — 99.8%
(Cost $60,371,029) | | | | | | $ | 53,503,826 | |
Percentages are based on Net Assets of $53,595,633.
| * | Non-income producing security. |
The accompanying notes are an integral part of the financial statements.
73
| Schedule of Investments | November 30, 2023 |
Global X Aging Population ETF
| ‡ | Real Estate Investment Trust |
| # | Expiration date not available. |
| (A) | Level 3 security in accordance with fair value hierarchy. |
| (B) | Security considered illiquid. The total value of such securities as of November 30, 2023 was $75,871 and represented 0.1% of Net Assets. |
The following is a summary of the level of inputs used as of November 30, 2023, in valuing the Fund’s investments carried at value:
| Investments in Securities | | Level 1 | | | Level 2 | | | Level 3(1) | | | Total | |
| Common Stock | | $ | 53,427,955 | | | $ | — | | | $ | 75,871 | | | $ | 53,503,826 | |
| Rights | | | — | | | | — | | | | — | ^ | | | — | |
| Total Investments in Securities | | $ | 53,427,955 | | | $ | — | | | $ | 75,871 | | | $ | 53,503,826 | |
(1) A reconciliation of Level 3 investments and disclosures of significant unobservable inputs are presented when the Fund has a significant amount of Level 3 investments at the end of the period in relation to Net Assets. Management has concluded that Level 3 investments are not material in relation to Net Assets.
^ Security is fair valued at zero.
Amounts designated as “—” are $0 or have been rounded to $0.
See “Glossary” for abbreviations.
The accompanying notes are an integral part of the financial statements.
74
| Schedule of Investments | November 30, 2023 |
Global X Health & Wellness ETF
Sector Weightings (Unaudited)†:

† Sector weightings percentages are based on the total market value of investments. Total investments do not include derivatives such as options, futures contracts, forward contracts, and swap contracts, if applicable.
| | | Shares | | | Value | |
| COMMON STOCK — 99.7% | | | | | | |
| CANADA — 3.0% | | | | | | |
| Consumer Discretionary — 3.0% | | | | | | |
| Gildan Activewear | | | 7,679 | | | $ | 278,196 | |
| | | | | | | | | |
| CHINA — 6.5% | | | | | | | | |
| Consumer Discretionary — 6.5% | | | | | | | | |
| ANTA Sports Products | | | 20,444 | | | | 213,201 | |
| Li Ning | | | 38,014 | | | | 105,861 | |
| Topsports International Holdings | | | 265,570 | | | | 215,916 | |
| Xtep International Holdings | | | 111,901 | | | | 64,616 | |
| | | | | | | | | |
| TOTAL CHINA | | | | | | | 599,594 | |
| FRANCE — 3.1% | | | | | | | | |
| Consumer Staples — 3.1% | | | | | | | | |
| Danone | | | 4,442 | | | | 285,807 | |
| | | | | | | | | |
| GERMANY — 7.1% | | | | | | | | |
| Consumer Discretionary — 7.1% | | | | | | | | |
| adidas | | | 1,612 | | | | 337,945 | |
| Puma | | | 4,791 | | | | 309,360 | |
| | | | | | | | | |
| TOTAL GERMANY | | | | | | | 647,305 | |
| IRELAND — 2.1% | | | | | | | | |
| Consumer Staples — 2.1% | | | | | | | | |
| Glanbia | | | 11,579 | | | | 195,571 | |
The accompanying notes are an integral part of the financial statements.
75
| Schedule of Investments | November 30, 2023 |
Global X Health & Wellness ETF
| | | Shares | | | Value | |
| COMMON STOCK — continued | | | | | | |
| ITALY — 0.8% | | | | | | |
| Consumer Discretionary — 0.8% | | | | | | |
| Technogym | | | 8,521 | | | $ | 74,285 | |
| | | | | | | | | |
| JAPAN — 14.0% | | | | | | | | |
| Consumer Discretionary — 11.0% | | | | | | | | |
| ABC-Mart | | | 10,532 | | | | 173,865 | |
| Asics | | | 8,113 | | | | 290,309 | |
| Descente | | | 3,265 | | | | 93,974 | |
| Goldwin | | | 2,036 | | | | 158,861 | |
| Shimano | | | 1,636 | | | | 251,816 | |
| Yonex | | | 4,004 | | | | 37,322 | |
| | | | | | | | 1,006,147 | |
| Consumer Staples — 2.4% | | | | | | | | |
| Ariake Japan | | | 1,387 | | | | 43,298 | |
| Yakult Honsha | | | 7,792 | | | | 174,093 | |
| | | | | | | | 217,391 | |
| Health Care — 0.6% | | | | | | | | |
| Tsumura | | | 3,260 | | | | 61,634 | |
| | | | | | | | | |
| TOTAL JAPAN | | | | | | | 1,285,172 | |
| NETHERLANDS — 0.9% | | | | | | | | |
| Consumer Discretionary — 0.9% | | | | | | | | |
| Basic-Fit * | | | 2,830 | | | | 80,839 | |
| | | | | | | | | |
| SOUTH KOREA — 1.5% | | | | | | | | |
| Consumer Discretionary — 1.5% | | | | | | | | |
| Fila Holdings | | | 2,579 | | | | 76,461 | |
| Youngone | | | 1,900 | | | | 64,357 | |
| | | | | | | | | |
| TOTAL SOUTH KOREA | | | | | | | 140,818 | |
| SWITZERLAND — 3.1% | | | | | | | | |
| Consumer Discretionary — 3.1% | | | | | | | | |
| On Holding, Cl A * | | | 9,663 | | | | 280,324 | |
The accompanying notes are an integral part of the financial statements.
76
| Schedule of Investments | November 30, 2023 |
Global X Health & Wellness ETF
| | | Shares | | �� | Value | |
| COMMON STOCK — continued | | | | | | | | |
| TAIWAN — 7.2% | | | | | | | | |
| Consumer Discretionary — 6.8% | | | | | | | | |
| Feng TAY Enterprise | | | 42,875 | | | $ | 251,841 | |
| Fulgent Sun International Holding | | | 8,365 | | | | 39,495 | |
| Giant Manufacturing | | | 16,546 | | | | 100,632 | |
| Johnson Health Tech | | | 13,400 | | | | 30,240 | |
| Merida Industry | | | 12,960 | | | | 77,785 | |
| Pou Chen | | | 126,286 | | | | 124,912 | |
| | | | | | | | 624,905 | |
| Consumer Staples — 0.4% | | | | | | | | |
| Grape King Bio | | | 6,300 | | | | 30,955 | |
| | | | | | | | | |
| TOTAL TAIWAN | | | | | | | 655,860 | |
| UNITED KINGDOM — 5.5% | | | | | | | | |
| Consumer Discretionary — 5.5% | | | | | | | | |
| Frasers Group * | | | 20,115 | | | | 225,107 | |
| JD Sports Fashion | | | 138,804 | | | | 275,967 | |
| | | | | | | | | |
| TOTAL UNITED KINGDOM | | | | | | | 501,074 | |
| UNITED STATES — 44.9% | | | | | | | | |
| Consumer Discretionary — 24.1% | | | | | | | | |
| Columbia Sportswear | | | 2,667 | | | | 208,906 | |
| Dick’s Sporting Goods | | | 2,096 | | | | 272,689 | |
| Foot Locker | | | 3,962 | | | | 106,697 | |
| Hibbett | | | 550 | | | | 34,402 | |
| Lululemon Athletica * | | | 796 | | | | 355,653 | |
| NIKE, Cl B | | | 2,288 | | | | 252,298 | |
| Peloton Interactive, Cl A * | | | 14,092 | | | | 79,761 | |
| Planet Fitness, Cl A * | | | 3,631 | | | | 246,690 | |
| Shoe Carnival | | | 1,134 | | | | 27,545 | |
| Skechers USA, Cl A * | | | 5,784 | | | | 340,735 | |
| Under Armour, Cl A * | | | 8,002 | | | | 65,136 | |
| VF | | | 13,227 | | | | 221,288 | |
| | | | | | | | 2,211,800 | |
| Consumer Staples — 16.0% | | | | | | | | |
| BellRing Brands * | | | 5,718 | | | | 302,482 | |
| Calavo Growers | | | 958 | | | | 20,779 | |
The accompanying notes are an integral part of the financial statements.
77
| Schedule of Investments | November 30, 2023 |
Global X Health & Wellness ETF
| | | Shares | | | Value | |
| COMMON STOCK — continued | | | | | | | | |
| Consumer Staples — continued | | | | | | | | |
| Cal-Maine Foods | | | 1,904 | | | $ | 91,240 | |
| Celsius Holdings * | | | 9,903 | | | | 490,298 | |
| Hain Celestial Group * | | | 3,840 | | | | 40,589 | |
| Herbalife * | | | 4,158 | | | | 53,555 | |
| Medifast | | | 475 | | | | 31,530 | |
| Nu Skin Enterprises, Cl A | | | 2,078 | | | | 35,368 | |
| Simply Good Foods * | | | 4,269 | | | | 165,381 | |
| Sprouts Farmers Market * | | | 4,434 | | | | 191,017 | |
| USANA Health Sciences * | | | 825 | | | | 38,989 | |
| | | | | | | | 1,461,228 | |
| Health Care — 4.5% | | | | | | | | |
| Dexcom * | | | 2,485 | | | | 287,067 | |
| Prestige Consumer Healthcare * | | | 2,139 | | | | 122,672 | |
| | | | | | | | 409,739 | |
| Industrials — 0.3% | | | | | | | | |
| Healthcare Services Group * | | | 3,133 | | | | 30,421 | |
| | | | | | | | | |
| TOTAL UNITED STATES | | | | | | | 4,113,188 | |
TOTAL COMMON STOCK
(Cost $13,176,443) | | | | | | | 9,138,033 | |
TOTAL INVESTMENTS — 99.7%
(Cost $13,176,443) | | | | | | $ | 9,138,033 | |
Percentages are based on Net Assets of $9,162,013.
| * | Non-income producing security. |
As of November 30, 2023, all of the Fund’s investments were considered Level 1, in accordance with authoritative guidance on fair value measurements and disclosure under U.S. GAAP.
See “Glossary” for abbreviations.
The accompanying notes are an integral part of the financial statements.
78
| Schedule of Investments | November 30, 2023 |
Global X Robotics & Artificial Intelligence ETF
Sector Weightings (Unaudited)†:

† Sector weightings percentages are based on the total market value of investments. Total investments do not include derivatives such as options, futures contracts, forward contracts, and swap contracts, if applicable.
| | | Shares | | | Value | |
| COMMON STOCK — 99.6% | | | | | | |
| CANADA — 1.6% | | | | | | |
| Industrials — 1.6% | | | | | | |
| ATS * | | | 951,961 | | | $ | 37,499,898 | |
| | | | | | | | | |
| CHINA — 1.6% | | | | | | | | |
| Consumer Discretionary — 0.5% | | | | | | | | |
| Hesai Group ADR * (A) | | | 1,028,900 | | | | 10,906,340 | |
| | | | | | | | | |
| Health Care — 1.1% | | | | | | | | |
| Shanghai MicroPort MedBot Group * (A) | | | 9,807,900 | | | | 25,178,085 | |
| | | | | | | | | |
| TOTAL CHINA | | | | | | | 36,084,425 | |
| FINLAND — 1.3% | | | | | | | | |
| Industrials — 1.3% | | | | | | | | |
| Cargotec, Cl B | | | 571,314 | | | | 28,836,549 | |
| | | | | | | | | |
| ISRAEL — 0.5% | | | | | | | | |
| Consumer Discretionary — 0.5% | | | | | | | | |
| Maytronics | | | 1,132,910 | | | | 10,951,575 | |
The accompanying notes are an integral part of the financial statements.
79
| Schedule of Investments | November 30, 2023 |
Global X Robotics & Artificial Intelligence ETF
| | | Shares | | | Value | |
| COMMON STOCK — continued | | | | | | |
| JAPAN — 28.3% | | | | | | |
| Health Care — 0.1% | | | | | | |
| CYBERDYNE * (A) | | | 1,387,970 | | | $ | 2,206,331 | |
| | | | | | | | | |
| Industrials — 17.5% | | | | | | | | |
| Daifuku | | | 3,946,608 | | | | 74,295,059 | |
| FANUC | | | 4,754,721 | | | | 132,315,908 | |
| Hirata | | | 108,371 | | | | 4,676,883 | |
| Shibaura Machine | | | 274,634 | | | | 7,087,149 | |
| SMC | | | 180,360 | | | | 90,829,655 | |
| Yaskawa Electric | | | 2,290,617 | | | | 87,899,822 | |
| | | | | | | | 397,104,476 | |
| Information Technology — 10.7% | | | | | | | | |
| ExaWizards * (A) | | | 830,630 | | | | 2,230,596 | |
| Keyence | | | 380,349 | | | | 162,986,499 | |
| Omron | | | 1,710,795 | | | | 71,736,857 | |
| PKSHA Technology * (A) | | | 315,731 | | | | 6,695,415 | |
| | | | | | | | 243,649,367 | |
| TOTAL JAPAN | | | | | | | 642,960,174 | |
| NORWAY — 2.6% | | | | | | | | |
| Industrials — 2.6% | | | | | | | | |
| AutoStore Holdings * | | | 35,307,033 | | | | 58,780,635 | |
| | | | | | | | | |
| SOUTH KOREA — 1.3% | | | | | | | | |
| Industrials — 1.3% | | | | | | | | |
| Hyulim ROBOT * | | | 1,578,311 | | | | 1,739,611 | |
| Rainbow Robotics * | | | 197,207 | | | | 27,116,631 | |
| | | | | | | | | |
| TOTAL SOUTH KOREA | | | | | | | 28,856,242 | |
| SWITZERLAND — 10.8% | | | | | | | | |
| Health Care — 2.2% | | | | | | | | |
| Tecan Group | | | 132,262 | | | | 48,521,164 | |
| | | | | | | | | |
| Industrials — 8.6% | | | | | | | | |
| ABB | | | 4,910,309 | | | | 196,005,779 | |
| | | | | | | | | |
| TOTAL SWITZERLAND | | | | | | | 244,526,943 | |
The accompanying notes are an integral part of the financial statements.
80
| Schedule of Investments | November 30, 2023 |
Global X Robotics & Artificial Intelligence ETF
| | | Shares | | | Value | |
| COMMON STOCK — continued | | | | | | |
| UNITED KINGDOM — 1.3% | | | | | | |
| Information Technology — 1.3% | | | | | | |
| Renishaw | | | 754,367 | | | $ | 29,948,538 | |
| | | | | | | | | |
| UNITED STATES — 50.3% | | | | | | | | |
| Consumer Discretionary — 0.4% | | | | | | | | |
| iRobot * | | | 281,879 | | | | 10,178,651 | |
| | | | | | | | | |
| Energy — 0.6% | | | | | | | | |
| Helix Energy Solutions Group * | | | 1,568,340 | | | | 14,616,929 | |
| | | | | | | | | |
| Financials — 1.0% | | | | | | | | |
| Upstart Holdings * (A) | | | 843,025 | | | | 22,559,349 | |
| | | | | | | | | |
| Health Care — 11.3% | | | | | | | | |
| Intuitive Surgical * | | | 718,769 | | | | 223,422,156 | |
| Omnicell * | | | 461,947 | | | | 15,410,552 | |
| PROCEPT BioRobotics * | | | 461,163 | | | | 17,095,312 | |
| | | | | | | | 255,928,020 | |
| Industrials — 4.6% | | | | | | | | |
| AeroVironment * | | | 261,121 | | | | 35,932,861 | |
| John Bean Technologies | | | 330,876 | | | | 34,179,491 | |
| Symbotic, Cl A * (A) | | | 623,659 | | | | 32,979,088 | |
| TuSimple Holdings, Cl A * (A) | | | 2,039,029 | | | | 1,735,213 | |
| | | | | | | | 104,826,653 | |
| Information Technology — 32.4% | | | | | | | | |
| Appian, Cl A * | | | 424,305 | | | | 15,376,813 | |
| C3.ai, Cl A * (A) | | | 1,107,572 | | | | 32,252,497 | |
| Cerence * | | | 410,952 | | | | 7,105,360 | |
| Cognex | | | 1,794,085 | | | | 67,637,005 | |
| Dynatrace * | | | 2,194,293 | | | | 117,504,390 | |
| FARO Technologies * | | | 185,039 | | | | 3,399,166 | |
| NVIDIA | | | 705,008 | | | | 329,732,242 | |
| Pegasystems | | | 847,801 | | | | 44,068,696 | |
| PROS Holdings * | | | 473,789 | | | | 17,316,988 | |
| SoundHound AI, Cl A * (A) | | | 1,593,839 | | | | 3,410,815 | |
The accompanying notes are an integral part of the financial statements.
81
| Schedule of Investments | November 30, 2023 |
Global X Robotics & Artificial Intelligence ETF
| | | Shares | | | Value | |
| COMMON STOCK — continued | | | | | | |
| Information Technology — continued | | | | | | |
| UiPath, Cl A * | | | 4,891,791 | | | $ | 96,661,790 | |
| | | | | | | | 734,465,762 | |
| TOTAL UNITED STATES | | | | | | | 1,142,575,364 | |
TOTAL COMMON STOCK
(Cost $2,305,066,743) | | | | | | | 2,261,020,343 | |
| | | | | | | | | |
| SHORT-TERM INVESTMENT(B) — 0.9% | | | | | | | | |
Fidelity Investments Money Market Government Portfolio, Cl Institutional, 5.280%
(Cost $20,180,420) | | | 20,180,420 | | | | 20,180,420 | |
| | | | | | | | | |
| | | Face Amount | | | | | |
| REPURCHASE AGREEMENT(C) — 2.9% | | | | | | | | |
BNP Paribas
5.220%, dated 11/30/2023, to be repurchased on 12/01/2023, repurchase price $66,126,589 (collateralized by U.S. Treasury Obligations, ranging in par value $330,118 - $7,778,471, 2.000%, 08/15/2025, with a total market value of $67,377,523)
(Cost $66,117,002) | | $ | 66,117,002 | | | | 66,117,002 | |
TOTAL INVESTMENTS — 103.4%
(Cost $2,391,364,165) | | | | | | $ | 2,347,317,765 | |
Percentages are based on Net Assets of $2,269,823,632.
| * | Non-income producing security. |
| (A) | This security or a partial position of this security is on loan at November 30, 2023.The total market value of securities on loan at November 30, 2023 was $81,818,095. |
| (B) | The rate reported on the Schedule of Investments is the 7-day effective yield as of November 30, 2023. |
| (C) | These securities were purchased with cash collateral held from securities on loan. The total value of such securities as of November 30, 2023 was $66,117,002. The total value of non-cash collateral held from securities on loan as of November 30, 2023 was $–. |
The accompanying notes are an integral part of the financial statements.
82
| Schedule of Investments | November 30, 2023 |
Global X Robotics & Artificial Intelligence ETF
The open futures contracts held by the Fund at November 30, 2023, are as follows:
| Type of Contract | | Number of
Contracts | | Expiration
Date | | Notional Amount | | Value | | Unrealized
Appreciation | |
| Long Contracts | | | | | | | | | | | | | | | | |
| | | | | | | | | | | | | | | | | |
| NASDAQ 100 Index E-MINI | | 26 | | Dec-2023 | | $ | 7,998,220 | | | $ | 8,312,460 | | | $ | 314,240 | |
The following is a summary of the level of inputs used as of November 30, 2023, in valuing the Fund’s investments and other financial instruments carried at value:
| Investments in Securities | | Level 1 | | | Level 2 | | | Level 3 | | | Total | |
| Common Stock | | $ | 2,261,020,343 | | | $ | — | | | $ | — | | | $ | 2,261,020,343 | |
| Short-Term Investment | | | 20,180,420 | | | | — | | | | — | | | | 20,180,420 | |
| Repurchase Agreement | | | — | | | | 66,117,002 | | | | — | | | | 66,117,002 | |
| Total Investments in Securities | | $ | 2,281,200,763 | | | $ | 66,117,002 | | | $ | — | | | $ | 2,347,317,765 | |
| | | | | | | | | | | | | | | | | |
| Other Financial Instruments | | Level 1 | | | Level 2 | | | Level 3 | | | Total | |
| Futures Contracts* | | | | | | | | | | | | | | | | |
| Unrealized Appreciation | | $ | 314,240 | | | $ | — | | | $ | — | | | $ | 314,240 | |
| Total Other Financial Instruments | | $ | 314,240 | | | $ | — | | | $ | — | | | $ | 314,240 | |
* Futures contracts are valued at the unrealized appreciation on the instrument.
Amounts designated as “—” are $0 or have been rounded to $0.
See “Glossary” for abbreviations.
The accompanying notes are an integral part of the financial statements.
83
| | |
| Schedule of Investments | November 30, 2023 |
| | |
| Global X FinTech ETF |
Sector Weightings (Unaudited)†:

† Sector weightings percentages are based on the total market value of investments. Total investments do not include derivatives such as options, futures contracts, forward contracts, and swap contracts, if applicable.
| | | Shares | | | Value | |
| COMMON STOCK — 99.8% | | | | | | | | |
| AUSTRALIA — 0.9% | | | | | | | | |
| Financials — 0.6% | | | | | | | | |
| HUB24 | | | 92,406 | | | $ | 2,064,182 | |
| Zip * (A) | | | 867,164 | | | | 232,864 | |
| | | | | | | | 2,297,046 | |
| Information Technology — 0.3% | | | | | | | | |
| IRESS | | | 212,335 | | | | 989,746 | |
| | | | | | | | | |
| TOTAL AUSTRALIA | | | | | | | 3,286,792 | |
| BRAZIL — 2.1% | | | | | | | | |
| Financials — 2.1% | | | | | | | | |
| Pagseguro Digital, Cl A * | | | 230,624 | | | | 2,324,690 | |
| StoneCo, Cl A * | | | 324,160 | | | | 5,056,896 | |
| | | | | | | | | |
| TOTAL BRAZIL | | | | | | | 7,381,586 | |
| CANADA — 0.5% | | | | | | | | |
| Financials — 0.4% | | | | | | | | |
| Nuvei (A) | | | 75,232 | | | | 1,544,757 | |
| | | | | | | | | |
| Information Technology — 0.1% | | | | | | | | |
| Hut 8 * (A) | | | 218,679 | | | | 419,342 | |
| | | | | | | | | |
| TOTAL CANADA | | | | | | | 1,964,099 | |
| CHINA — 1.0% | | | | | | | | |
| Financials — 0.9% | | | | | | | | |
| Lufax Holding ADR | | | 2,639,933 | | | | 2,241,039 | |
The accompanying notes are an integral part of the financial statements.
84
| | |
| Schedule of Investments | November 30, 2023 |
| | |
| Global X FinTech ETF |
| | | Shares | | | Value | |
| COMMON STOCK — continued | | | | | | | | |
| Financials — continued | | | | | | | | |
| Yeahka * | | | 513,914 | | | $ | 919,877 | |
| | | | | | | | 3,160,916 | |
| Information Technology — 0.1% | | | | | | | | |
| Linklogis, Cl B (A) | | | 2,313,000 | | | | 479,759 | |
| | | | | | | | | |
| TOTAL CHINA | | | | | | | 3,640,675 | |
| GERMANY — 0.3% | | | | | | | | |
| Financials — 0.3% | | | | | | | | |
| Hypoport * (A) | | | 7,922 | | | | 1,175,538 | |
| | | | | | | | | |
| ISRAEL — 0.5% | | | | | | | | |
| Information Technology — 0.5% | | | | | | | | |
| Sapiens International | | | 63,655 | | | | 1,637,843 | |
| | | | | | | | | |
| ITALY — 3.4% | | | | | | | | |
| Financials — 3.4% | | | | | | | | |
| Nexi * | | | 1,518,655 | | | | 11,847,534 | |
| | | | | | | | | |
| JAPAN — 0.2% | | | | | | | | |
| Financials — 0.2% | | | | | | | | |
| WealthNavi * (A) | | | 55,878 | | | | 651,630 | |
| | | | | | | | | |
| NETHERLANDS — 4.9% | | | | | | | | |
| Financials — 4.9% | | | | | | | | |
| Adyen * | | | 14,617 | | | | 17,080,891 | |
| | | | | | | | | |
| NEW ZEALAND — 3.4% | | | | | | | | |
| Information Technology — 3.4% | | | | | | | | |
| Xero * | | | 173,900 | | | | 11,882,133 | |
| | | | | | | | | |
| SOUTH KOREA — 1.6% | | | | | | | | |
| Financials — 1.6% | | | | | | | | |
| Kakaopay * | | | 155,106 | | | | 5,542,291 | |
The accompanying notes are an integral part of the financial statements.
85
| | |
| Schedule of Investments | November 30, 2023 |
| | |
| Global X FinTech ETF |
| | | Shares | | | Value | |
| COMMON STOCK — continued | | | | | | | | |
| SWITZERLAND — 2.4% | | | | | | | | |
| Financials — 0.3% | | | | | | | | |
| Leonteq | | | 21,809 | | | $ | 979,405 | |
| | | | | | | | | |
| Information Technology — 2.1% | | | | | | | | |
| Temenos | | | 86,750 | | | | 7,384,549 | |
| | | | | | | | | |
| TOTAL SWITZERLAND | | | | | | | 8,363,954 | |
| UNITED KINGDOM — 3.3% | | | | | | | | |
| Financials — 3.3% | | | | | | | | |
| Wise, Cl A * | | | 1,186,024 | | | | 11,723,308 | |
| | | | | | | | | |
| UNITED STATES — 74.4% | | | | | | | | |
| Financials — 49.6% | | | | | | | | |
| Affirm Holdings, Cl A * | | | 270,877 | | | | 9,320,878 | |
| Bakkt Holdings * (A) | | | 78,908 | | | | 118,362 | |
| Block, Cl A * | | | 268,122 | | | | 17,006,978 | |
| Coinbase Global, Cl A * | | | 207,235 | | | | 25,846,349 | |
| Fidelity National Information Services | | | 327,518 | | | | 19,205,655 | |
| Fiserv * | | | 178,766 | | | | 23,348,627 | |
| Flywire * | | | 120,539 | | | | 2,808,559 | |
| Galaxy Digital Holdings * (A) | | | 119,010 | | | | 726,779 | |
| Global Payments | | | 141,738 | | | | 16,503,973 | |
| I3 Verticals, Cl A * | | | 26,525 | | | | 533,948 | |
| Jack Henry & Associates | | | 84,559 | | | | 13,418,668 | |
| Lemonade * (A) | | | 79,835 | | | | 1,410,684 | |
| LendingClub * | | | 122,514 | | | | 771,838 | |
| LendingTree * | | | 14,468 | | | | 256,084 | |
| Open Lending, Cl A * | | | 145,492 | | | | 929,694 | |
| Paymentus Holdings, Cl A * | | | 21,799 | | | | 376,469 | |
| Payoneer Global * | | | 404,480 | | | | 2,095,206 | |
| PayPal Holdings * | | | 282,377 | | | | 16,267,739 | |
| Paysafe * | | | 69,756 | | | | 705,233 | |
| Shift4 Payments, Cl A * | | | 61,215 | | | | 4,029,171 | |
| SoFi Technologies * (A) | | | 1,074,658 | | | | 7,834,257 | |
| Toast, Cl A * | | | 408,572 | | | | 6,075,466 | |
| Upstart Holdings * (A) | | | 93,979 | | | | 2,514,878 | |
The accompanying notes are an integral part of the financial statements.
86
| | |
| Schedule of Investments | November 30, 2023 |
| | |
| Global X FinTech ETF |
| | | Shares | | | Value | |
| COMMON STOCK — continued | | | | | | | | |
| Financials — continued | | | | | | | | |
| Virtu Financial, Cl A | | | 115,294 | | | $ | 2,072,986 | |
| | | | | | | | 174,178,481 | |
| Health Care — 1.9% | | | | | | | | |
| HealthEquity * | | | 98,014 | | | | 6,568,898 | |
| | | | | | | | | |
| Industrials — 4.2% | | | | | | | | |
| SS&C Technologies Holdings | | | 265,215 | | | | 14,920,996 | |
| | | | | | | | | |
| Information Technology — 18.7% | | | | | | | | |
| ACI Worldwide * | | | 129,747 | | | | 3,469,435 | |
| BILL Holdings * | | | 123,212 | | | | 8,066,690 | |
| Blend Labs, Cl A * | | | 242,139 | | | | 307,516 | |
| Envestnet * | | | 63,868 | | | | 2,428,900 | |
| Guidewire Software * | | | 94,836 | | | | 9,477,910 | |
| Intuit | | | 52,271 | | | | 29,870,786 | |
| Marathon Digital Holdings * (A) | | | 134,926 | | | | 1,615,064 | |
| MeridianLink * | | | 93,495 | | | | 1,778,275 | |
| Mitek Systems * | | | 51,280 | | | | 578,951 | |
| nCino * | | | 128,202 | | | | 3,542,221 | |
| Pagaya Technologies, Cl A * | | | 582,574 | | | | 739,869 | |
| Riot Platforms * (A) | | | 193,211 | | | | 2,424,798 | |
| Vertex, Cl A * | | | 56,279 | | | | 1,579,189 | |
| | | | | | | | 65,879,604 | |
| TOTAL UNITED STATES | | | | | | | 261,547,979 | |
| URUGUAY — 0.9% | | | | | | | | |
| Financials — 0.9% | | | | | | | | |
| Dlocal, Cl A * | | | 187,019 | | | | 3,226,078 | |
| | | | | | | | | |
TOTAL COMMON STOCK
(Cost $556,912,402) | | | | | | | 350,952,331 | |
The accompanying notes are an integral part of the financial statements.
87
| | |
| Schedule of Investments | November 30, 2023 |
| | |
| Global X FinTech ETF |
| | | Face Amount | | | Value | |
| REPURCHASE AGREEMENTS(B) — 2.1% | | | | | | | | |
Bank of America
5.320%, dated 11/30/2023, to be repurchased on 12/01/2023, repurchase price $434,901 (collateralized by various U.S. Government Obligations and U.S. Treasury Obligations, ranging in par value $46 - $153,383, 1.500% - 7.000%, 08/01/2027 - 09/20/2063, with a total market value of $443,534) | | $ | 434,837 | | | $ | 434,837 | |
Citigroup Global Markets Securities
5.320%, dated 11/30/2023, to be repurchased on 12/01/2023, repurchase price $1,703,362 (collateralized by various U.S. Government Obligations and U.S. Treasury Obligations, ranging in par value $14,631 - $515,279, 2.000% - 7.028%, 11/20/2043 - 01/20/2072, with a total market value of $1,737,172) | | | 1,703,110 | | | | 1,703,110 | |
Daiwa Capital Markets
5.340%, dated 11/30/2023, to be repurchased on 12/01/2023, repurchase price $1,703,363 (collateralized by various U.S. Government Obligations and U.S. Treasury Obligations, ranging in par value $107 - $235,294, 0.000% - 7.000%, 01/25/2024 - 12/01/2053, with a total market value of $1,737,266) | | | 1,703,110 | | | | 1,703,110 | |
Deutsche Bank Securities
5.320%, dated 11/30/2023, to be repurchased on 12/01/2023, repurchase price $1,703,362 (collateralized by various U.S. Government Obligations and U.S. Treasury Obligations, ranging in par value $5,109 - $514,567, 2.500% - 7.500%, 06/01/2042 - 11/01/2053, with a total market value of $1,737,172) | | | 1,703,110 | | | | 1,703,110 | |
The accompanying notes are an integral part of the financial statements.
88
| | |
| Schedule of Investments | November 30, 2023 |
| | |
| Global X FinTech ETF |
| | | Face Amount | | | Value | |
| REPURCHASE AGREEMENTS — continued | | | | | | | | |
RBC Dominion Securities
5.320%, dated 11/30/2023, to be repurchased on 12/01/2023, repurchase price $1,703,362 (collateralized by various U.S. Government Obligations and U.S. Treasury Obligations, ranging in par value $99 - $446,405, 0.000% - 6.500%, 12/14/2023 - 09/01/2053, with a total market value of $1,737,172) | | $ | 1,703,110 | | | $ | 1,703,110 | |
TOTAL REPURCHASE AGREEMENTS
(Cost $7,247,277) | | | | | | | 7,247,277 | |
TOTAL INVESTMENTS — 101.9%
(Cost $564,159,679) | | | | | | $ | 358,199,608 | |
Percentages are based on Net Assets of $351,477,666.
| * | Non-income producing security. |
| (A) | This security or a partial position of this security is on loan at November 30, 2023. The total market value of securities on loan at November 30, 2023 was $8,549,815. |
| (B) | These securities were purchased with cash collateral held from securities on loan. The total value of such securities as of November 30, 2023 was $7,247,277. The total value of non-cash collateral held from securities on loan as of November 30, 2023 was $1,624,982. |
The following is a summary of the level of inputs used as of November 30, 2023, in valuing the Fund’s investments carried at value:
| Investments in Securities | | Level 1 | | | Level 2 | | | Level 3 | | | Total | |
| Common Stock | | $ | 350,952,331 | | | $ | — | | | $ | — | | | $ | 350,952,331 | |
| Repurchase Agreements | | | — | | | | 7,247,277 | | | | — | | | | 7,247,277 | |
| Total Investments in Securities | | $ | 350,952,331 | | | $ | 7,247,277 | | | $ | — | | | $ | 358,199,608 | |
Amounts designated as “—” are $0 or have been rounded to $0.
See “Glossary” for abbreviations.
The accompanying notes are an integral part of the financial statements.
89
| | |
| Schedule of Investments | November 30, 2023 |
| | |
| Global X Internet of Things ETF |
Sector Weightings (Unaudited)†:
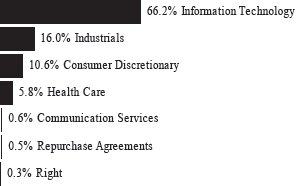
† Sector weightings percentages are based on the total market value of investments. Total investments do not include derivatives such as options, futures contracts, forward contracts, and swap contracts, if applicable.
| | | Shares | | | Value | |
| COMMON STOCK — 98.9% | | | | | | | | |
| AUSTRIA — 1.3% | | | | | | | | |
| Information Technology — 1.3% | | | | | | | | |
| ams-OSRAM * (A) | | | 481,866 | | | $ | 947,606 | |
| Kontron | | | 117,455 | | | | 2,804,023 | |
| | | | | | | | | |
| TOTAL AUSTRIA | | | | | | | 3,751,629 | |
| CANADA — 0.3% | | | | | | | | |
| Information Technology — 0.3% | | | | | | | | |
| BlackBerry * | | | 215,713 | | | | 791,667 | |
| | | | | | | | | |
| CHINA — 2.2% | | | | | | | | |
| Information Technology — 2.2% | | | | | | | | |
| NXP Semiconductors | | | 31,674 | | | | 6,464,030 | |
| | | | | | | | | |
| FRANCE — 1.0% | | | | | | | | |
| Industrials — 1.0% | | | | | | | | |
| Legrand | | | 29,859 | | | | 2,880,637 | |
The accompanying notes are an integral part of the financial statements.
90
| | |
| Schedule of Investments | November 30, 2023 |
| | |
| Global X Internet of Things ETF |
| | | Shares | | | Value | |
| COMMON STOCK — continued | | | | | | | | |
| JAPAN — 1.7% | | | | | | | | |
| Information Technology — 1.7% | | | | | | | | |
| Nippon Ceramic | | | 48,622 | | | $ | 964,974 | |
| Renesas Electronics * | | | 220,145 | | | | 3,876,941 | |
| | | | | | | | | |
| TOTAL JAPAN | | | | | | | 4,841,915 | |
| NORWAY — 1.1% | | | | | | | | |
| Information Technology — 1.1% | | | | | | | | |
| Nordic Semiconductor * | | | 342,823 | | | | 3,136,003 | |
| | | | | | | | | |
| SINGAPORE — 6.0% | | | | | | | | |
| Information Technology — 6.0% | | | | | | | | |
| STMicroelectronics | | | 366,430 | | | | 17,373,750 | |
| | | | | | | | | |
| SWITZERLAND — 3.9% | | | | | | | | |
| Industrials — 2.4% | | | | | | | | |
| ABB | | | 171,156 | | | | 6,832,068 | |
| | | | | | | | | |
| Information Technology — 1.5% | | | | | | | | |
| Landis+Gyr Group | | | 51,253 | | | | 4,326,341 | |
| | | | | | | | | |
| TOTAL SWITZERLAND | | | | | | | 11,158,409 | |
| TAIWAN — 12.1% | | | | | | | | |
| Information Technology — 12.1% | | | | | | | | |
| Advantech | | | 1,522,644 | | | | 17,229,660 | |
| eMemory Technology | | | 135,682 | | | | 10,923,183 | |
| MediaTek | | | 179,080 | | | | 5,417,112 | |
| Sercomm | | | 309,800 | | | | 1,229,680 | |
| | | | | | | | | |
| TOTAL TAIWAN | | | | | | | 34,799,635 | |
| UNITED KINGDOM — 0.2% | | | | | | | | |
| Information Technology — 0.2% | | | | | | | | |
| Spirent Communications | | | 333,763 | | | | 482,527 | |
| | | | | | | | | |
| UNITED STATES — 69.1% | | | | | | | | |
| Communication Services — 0.6% | | | | | | | | |
| Globalstar * | | | 716,506 | | | | 1,139,245 | |
The accompanying notes are an integral part of the financial statements.
91
| | |
| Schedule of Investments | November 30, 2023 |
| | |
| Global X Internet of Things ETF |
| | | Shares | | | Value | |
| COMMON STOCK — continued | | | | | | | | |
| Communication Services — continued | | | | | | | | |
| Iridium Communications | | | 14,004 | | | $ | 533,552 | |
| | | | | | | | 1,672,797 | |
| Consumer Discretionary — 10.5% | | | | | | | | |
| ADT | | | 1,526,657 | | | | 8,961,476 | |
| Garmin | | | 175,190 | | | | 21,415,226 | |
| | | | | | | | 30,376,702 | |
| Health Care — 5.8% | | | | | | | | |
| Butterfly Network * | | | 371,854 | | | | 354,117 | |
| Dexcom * | | | 141,812 | | | | 16,382,122 | |
| | | | | | | | 16,736,239 | |
| Industrials — 12.6% | | | | | | | | |
| Emerson Electric | | | 68,265 | | | | 6,068,758 | |
| Honeywell International | | | 29,413 | | | | 5,762,595 | |
| Johnson Controls International | | | 89,740 | | | | 4,738,272 | |
| Resideo Technologies * | | | 45,527 | | | | 748,009 | |
| Rockwell Automation | | | 12,806 | | | | 3,527,285 | |
| Schneider Electric | | | 35,224 | | | | 6,480,530 | |
| Sensata Technologies Holding | | | 271,070 | | | | 8,812,486 | |
| | | | | | | | 36,137,935 | |
| Information Technology — 39.6% | | | | | | | | |
| Alarm.com Holdings * | | | 88,596 | | | | 4,826,710 | |
| Ambarella * | | | 69,074 | | | | 4,055,335 | |
| Analog Devices | | | 30,984 | | | | 5,681,846 | |
| Arlo Technologies * | | | 231,447 | | | | 2,103,853 | |
| Badger Meter | | | 52,058 | | | | 7,671,787 | |
| Belden | | | 75,988 | | | | 5,048,643 | |
| Cisco Systems | | | 117,851 | | | | 5,701,631 | |
| Digi International * | | | 63,528 | | | | 1,495,449 | |
| GLOBALFOUNDRIES * | | | 61,147 | | | | 3,282,982 | |
| Impinj * | | | 46,584 | | | | 3,893,957 | |
| InterDigital | | | 52,665 | | | | 5,262,287 | |
| International Business Machines | | | 44,385 | | | | 7,037,686 | |
| Itron * | | | 80,198 | | | | 5,403,741 | |
| Lattice Semiconductor * | | | 15,391 | | | | 901,143 | |
| NETGEAR * | | | 51,723 | | | | 705,502 | |
The accompanying notes are an integral part of the financial statements.
92
| | |
| Schedule of Investments | November 30, 2023 |
| | |
| Global X Internet of Things ETF |
| | | Shares | | | Value | |
| COMMON STOCK — continued | | | | | | | | |
| Information Technology — continued | | | | | | | | |
| PTC * | | | 13,218 | | | $ | 2,079,984 | |
| QUALCOMM | | | 46,212 | | | | 5,963,659 | |
| Rambus * | | | 191,852 | | | | 12,982,625 | |
| Samsara, Cl A * | | | 223,810 | | | | 6,163,727 | |
| Semtech * | | | 27,054 | | | | 442,874 | |
| Silicon Laboratories * | | | 56,645 | | | | 5,968,684 | |
| Skyworks Solutions | | | 153,784 | | | | 14,906,283 | |
| SmartRent, Cl A * | | | 350,464 | | | | 1,096,952 | |
| Synaptics * | | | 7,272 | | | | 736,217 | |
| Vuzix * (A) | | | 217,006 | | | | 455,713 | |
| | | | | | | | 113,869,270 | |
| TOTAL UNITED STATES | | | | | | | 198,792,943 | |
TOTAL COMMON STOCK
(Cost $268,469,642) | | | | | | | 284,473,145 | |
| | | | | | | | |
| | | Number of
Rights | | | | | |
| RIGHT — 0.3% | | | | | | | | |
| Switzerland — 0.3% | | | | | | | | |
ams-OSRAM* (A)
Expires 12/09/2023 | | | 490,134 | | | | 823,231 | |
TOTAL RIGHT
(Cost $3,991,052) | | | | | | | 823,231 | |
| | | | | | | | |
| | | Face Amount | | | | | |
| REPURCHASE AGREEMENTS(B) — 0.5% | | | | | | | | |
Citigroup Global Markets
5.320%, dated 11/30/2023, to be repurchased on 12/01/2023, repurchase price $321,259 (collateralized by various U.S. Government Obligations and U.S. Treasury Obligations, ranging in par value $2,759 - $97,183, 2.000% - 7.028%, 11/20/2043 - 01/20/2072, with a total market value of $327,636) | | $ | 321,212 | | | | 321,212 | |
The accompanying notes are an integral part of the financial statements.
93
| | |
| Schedule of Investments | November 30, 2023 |
| | |
| Global X Internet of Things ETF |
| | | Face Amount | | | Value | |
| REPURCHASE AGREEMENTS — continued | | | | | | | | |
Daiwa Capital Markets
5.340%, dated 11/30/2023, to be repurchased on 12/01/2023, repurchase price $321,260 (collateralized by various U.S. Government Obligations and U.S. Treasury Obligations, ranging in par value $20 - $44,377, 0.000% - 7.000%, 01/25/2024 - 12/01/2053, with a total market value of $327,654) | | $ | 321,212 | | | $ | 321,212 | |
Deutsche Bank Securities
5.320%, dated 11/30/2023, to be repurchased on 12/01/2023, repurchase price $88,451 (collateralized by various U.S. Government Obligations and U.S. Treasury Obligations, ranging in par value $265 - $26,720, 2.500% - 7.500%, 06/01/2042 - 11/01/2053, with a total market value of $90,207) | | | 88,438 | | | | 88,438 | |
HSBC Securities
5.320%, dated 11/30/2023, to be repurchased on 12/01/2023, repurchase price $314,835 (collateralized by various U.S. Government Obligations and U.S. Treasury Obligations, ranging in par value $3,148 - $372,714, 0.000% - 7.500%, 11/15/2031 - 10/20/2073, with a total market value of $321,084) | | | 314,788 | | | | 314,788 | |
RBC Dominion Securities
5.310%, dated 11/30/2023, to be repurchased on 12/01/2023, repurchase price $321,259 (collateralized by various U.S. Government Obligations and U.S. Treasury Obligations, ranging in par value $19 - $84,193, 0.000% - 6.500%, 12/14/2023 - 09/01/2053, with a total market value of $327,636) | | | 321,212 | | | | 321,212 | |
TOTAL REPURCHASE AGREEMENTS
(Cost $1,366,862) | | | | | | | 1,366,862 | |
TOTAL INVESTMENTS — 99.7%
(Cost $273,827,556) | | | | | | $ | 286,663,238 | |
Percentages are based on Net Assets of $287,487,218.
The accompanying notes are an integral part of the financial statements.
94
| | |
| Schedule of Investments | November 30, 2023 |
| | |
| Global X Internet of Things ETF |
| * | Non-income producing security. |
| (A) | This security or a partial position of this security is on loan at November 30, 2023. The total market value of securities on loan at November 30, 2023 was $1,242,244. |
| (B) | These securities were purchased with cash collateral held from securities on loan. The total value of such securities as of November 30, 2023 was $1,366,862. The total value of non-cash collateral held from securities on loan as of November 30, 2023 was $–. |
The following is a summary of the level of inputs used as of November 30, 2023, in valuing the Fund’s investments carried at value:
| Investments in Securities | | Level 1 | | | Level 2 | | | Level 3 | | | Total | |
| Common Stock | | $ | 284,473,145 | | | $ | — | | | $ | — | | | $ | 284,473,145 | |
| Right | | | 823,231 | | | | — | | | | — | | | | 823,231 | |
| Repurchase Agreements | | | — | | | | 1,366,862 | | | | — | | | | 1,366,862 | |
| Total Investments in Securities | | $ | 285,296,376 | | | $ | 1,366,862 | | | $ | — | | | $ | 286,663,238 | |
Amounts designated as “—” are $0 or have been rounded to $0.
See “Glossary” for abbreviations.
The accompanying notes are an integral part of the financial statements.
95
| Schedule of Investments | November 30, 2023 |
| Global X U.S. Infrastructure Development ETF |
Sector Weightings (Unaudited)†:

† Sector weightings percentages are based on the total market value of investments. Total investments do not include derivatives such as options, futures contracts, forward contracts, and swap contracts, if applicable.
| | | Shares | | | Value | |
| COMMON STOCK — 98.9% | | | | | | | | |
| Consumer Discretionary — 0.9% | | | | | | | | |
| TopBuild * | | | 158,869 | | | $ | 46,990,273 | |
| | | | | | | | | |
| Industrials — 72.1% | | | | | | | | |
| Acuity Brands | | | 158,869 | | | | 28,478,857 | |
| Advanced Drainage Systems | | | 414,968 | | | | 50,256,774 | |
| AECOM | | | 694,256 | | | | 61,691,588 | |
| Arcosa | | | 253,133 | | | | 18,782,469 | |
| Argan | | | 365,383 | | | | 17,041,463 | |
| Astec Industries | | | 347,412 | | | | 10,801,039 | |
| Atkore * | | | 197,862 | | | | 25,702,274 | |
| Builders FirstSource * | | | 736,131 | | | | 98,722,528 | |
| Carlisle | | | 257,562 | | | | 72,222,960 | |
| Columbus McKinnon | | | 390,073 | | | | 13,621,349 | |
| Construction Partners, Cl A * | | | 520,119 | | | | 21,824,193 | |
| Crane | | | 280,776 | | | | 29,672,408 | |
| CSW Industrials | | | 110,015 | | | | 19,508,960 | |
| CSX | | | 4,334,472 | | | | 140,003,446 | |
| Custom Truck One Source * | | | 1,998,228 | | | | 11,609,705 | |
| Deere | | | 339,411 | | | | 123,684,763 | |
| DXP Enterprises * | | | 470,879 | | | | 13,787,337 | |
| Dycom Industries * | | | 145,548 | | | | 15,118,071 | |
| Eaton | | | 873,842 | | | | 198,965,085 | |
| EMCOR Group | | | 238,827 | | | | 50,755,514 | |
| Emerson Electric | | | 1,560,649 | | | | 138,741,696 | |
| Exponent | | | 249,514 | | | | 19,202,597 | |
| Fastenal | | | 2,835,167 | | | | 170,024,965 | |
| Fortive | | | 1,770,070 | | | | 122,099,429 | |
| Gibraltar Industries * | | | 193,537 | | | | 13,003,751 | |
The accompanying notes are an integral part of the financial statements.
96
| Schedule of Investments | November 30, 2023 |
| Global X U.S. Infrastructure Development ETF |
| | | Shares | | | Value | |
| COMMON STOCK — continued | | | | | | | | |
| Industrials — continued | | | | | | | | |
| Gorman-Rupp | | | 501,129 | | | $ | 15,825,654 | |
| Graco | | | 843,194 | | | | 68,113,211 | |
| Granite Construction | | | 349,328 | | | | 16,051,622 | |
| Greenbrier | | | 483,363 | | | | 18,227,619 | |
| H&E Equipment Services | | | 276,778 | | | | 12,264,033 | |
| Herc Holdings | | | 145,042 | | | | 17,935,894 | |
| Howmet Aerospace | | | 2,070,260 | | | | 108,895,676 | |
| Hubbell, Cl B | | | 268,737 | | | | 80,621,100 | |
| IDEX | | | 377,506 | | | | 76,135,410 | |
| Insteel Industries | | | 486,774 | | | | 16,560,051 | |
| Jacobs Solutions | | | 633,802 | | | | 80,606,938 | |
| Lincoln Electric Holdings | | | 287,834 | | | | 57,008,402 | |
| MasTec * | | | 310,707 | | | | 18,841,272 | |
| MDU Resources Group | | | 1,010,891 | | | | 19,348,454 | |
| MRC Global * | | | 1,135,158 | | | | 11,737,534 | |
| Mueller Industries | | | 560,406 | | | | 23,273,661 | |
| Mueller Water Products, Cl A | | | 1,131,469 | | | | 15,037,223 | |
| MYR Group * | | | 146,497 | | | | 18,227,157 | |
| Norfolk Southern | | | 517,018 | | | | 112,792,647 | |
| Northwest Pipe * | | | 384,430 | | | | 10,425,742 | |
| NOW * | | | 1,058,240 | | | | 10,550,653 | |
| Parker-Hannifin | | | 445,522 | | | | 192,991,220 | |
| Pentair | | | 817,436 | | | | 52,757,319 | |
| Powell Industries | | | 352,699 | | | | 29,330,449 | |
| Primoris Services | | | 535,055 | | | | 16,244,270 | |
| Quanta Services | | | 714,985 | | | | 134,638,825 | |
| RBC Bearings * | | | 144,562 | | | | 37,259,410 | |
| Regal Rexnord | | | 332,049 | | | | 39,779,470 | |
| Rockwell Automation | | | 504,026 | | | | 138,828,921 | |
| SPX Technologies * | | | 223,415 | | | | 19,059,534 | |
| Sterling Infrastructure * | | | 425,610 | | | | 27,030,491 | |
| Terex | | | 334,027 | | | | 16,534,336 | |
| Tetra Tech | | | 263,066 | | | | 41,603,888 | |
| Titan Machinery * | | | 335,533 | | | | 7,670,284 | |
| Trane Technologies | | | 812,590 | | | | 183,165,912 | |
| Trinity Industries | | | 500,258 | | | | 12,486,440 | |
| Tutor Perini * | | | 1,574,705 | | | | 13,180,281 | |
| Union Pacific | | | 660,959 | | | | 148,894,234 | |
| United Rentals | | | 354,386 | | | | 168,694,824 | |
The accompanying notes are an integral part of the financial statements.
97
| Schedule of Investments | November 30, 2023 |
| Global X U.S. Infrastructure Development ETF |
| | | Shares | | | Value | |
| COMMON STOCK — continued | | | | | | | | |
| Industrials — continued | | | | | | | | |
| Valmont Industries | | | 105,578 | | | $ | 23,181,761 | |
| Wabash National | | | 536,188 | | | | 11,753,241 | |
| WESCO International | | | 254,971 | | | | 39,737,230 | |
| Woodward | | | 296,645 | | | | 40,100,471 | |
| Zurn Elkay Water Solutions | | | 903,340 | | | | 26,594,330 | |
| | | | | | | | 3,715,320,315 | |
| Information Technology — 1.9% | | | | | | | | |
| Badger Meter | | | 145,084 | | | | 21,381,029 | |
| Calix * | | | 322,674 | | | | 12,451,990 | |
| Crane NXT | | | 281,065 | | | | 14,463,605 | |
| Trimble * | | | 1,133,977 | | | | 52,616,533 | |
| | | | | | | | 100,913,157 | |
| Materials — 21.5% | | | | | | | | |
| Alcoa | | | 673,987 | | | | 18,103,291 | |
| ATI * | | | 640,724 | | | | 28,159,820 | |
| Carpenter Technology | | | 309,397 | | | | 21,908,402 | |
| Century Aluminum * | | | 488,153 | | | | 3,836,883 | |
| Cleveland-Cliffs * | | | 2,241,022 | | | | 38,455,937 | |
| Commercial Metals | | | 582,399 | | | | 26,400,147 | |
| Eagle Materials | | | 182,685 | | | | 33,075,119 | |
| Haynes International | | | 258,757 | | | | 12,699,793 | |
| Knife River * | | | 252,600 | | | | 15,075,153 | |
| Louisiana-Pacific | | | 363,499 | | | | 22,169,804 | |
| Martin Marietta Materials | | | 310,649 | | | | 144,324,419 | |
| Materion | | | 152,510 | | | | 17,250,406 | |
| Minerals Technologies | | | 113,499 | | | | 7,109,577 | |
| Nucor | | | 902,814 | | | | 153,451,296 | |
| Reliance Steel & Aluminum | | | 293,795 | | | | 80,870,012 | |
| RPM International | | | 646,269 | | | | 66,520,468 | |
| Ryerson Holding | | | 407,290 | | | | 12,613,771 | |
| Steel Dynamics | | | 878,775 | | | | 104,688,466 | |
| Summit Materials, Cl A * | | | 587,451 | | | | 20,378,675 | |
| TimkenSteel * | | | 696,845 | | | | 14,159,890 | |
| United States Steel | | | 1,163,948 | | | | 41,785,733 | |
| Vulcan Materials | | | 665,001 | | | | 142,017,614 | |
| Westlake | | | 638,380 | | | | 81,961,608 | |
| | | | | | | | 1,107,016,284 | |
The accompanying notes are an integral part of the financial statements.
98
| Schedule of Investments | November 30, 2023 |
| Global X U.S. Infrastructure Development ETF |
| | | Shares | | | Value | |
| COMMON STOCK — continued | | | | | | | | |
| Utilities — 2.5% | | | | | | | | |
| Sempra | | | 1,750,128 | | | $ | 127,531,827 | |
TOTAL COMMON STOCK
(Cost $4,544,979,466) | | | | | | | 5,097,771,856 | |
TOTAL INVESTMENTS — 98.9%
(Cost $4,544,979,466) | | | | | | $ | 5,097,771,856 | |
Percentages are based on Net Assets of $5,153,795,826.
| * | Non-income producing security. |
As of November 30, 2023, all of the Fund’s investments were considered Level 1, in accordance with authoritative guidance on fair value measurements and disclosure under U.S. GAAP.
Amounts designated as “—” are $0 or have been rounded to $0.
See “Glossary” for abbreviations.
The accompanying notes are an integral part of the financial statements.
99
| Schedule of Investments | November 30, 2023 |
| Global X Autonomous & Electric Vehicles ETF |
Sector Weightings (Unaudited)†:

† Sector weightings percentages are based on the total market value of investments. Total investments do not include derivatives such as options, futures contracts, forward contracts, and swap contracts, if applicable.
| | | Shares | | | Value | |
| COMMON STOCK — 98.4% | | | | | | | | |
| AUSTRALIA — 2.2% | | | | | | | | |
| Materials — 2.2% | | | | | | | | |
| Allkem * | | | 769,716 | | | $ | 4,389,103 | |
| IGO | | | 818,572 | | | | 4,656,837 | |
| Pilbara Minerals (A) | | | 2,596,523 | | | | 6,266,721 | |
| | | | | | | | | |
| TOTAL AUSTRALIA | | | | | | | 15,312,661 | |
| CANADA — 3.1% | | | | | | | | |
| Industrials — 0.9% | | | | | | | | |
| Ballard Power Systems * (A) | | | 1,798,682 | | | | 6,313,374 | |
| | | | | | | | | |
| Information Technology — 0.9% | | | | | | | | |
| BlackBerry * | | | 1,693,205 | | | | 6,214,062 | |
| | | | | | | | | |
| Materials — 1.3% | | | | | | | | |
| Lithium Americas * (A) | | | 406,321 | | | | 2,616,206 | |
| Lithium Americas Argentina * (A) | | | 406,321 | | | | 2,172,679 | |
| Standard Lithium * (A) | | | 1,810,057 | | | | 4,036,427 | |
| | | | | | | | 8,825,312 | |
| TOTAL CANADA | | | | | | | 21,352,748 | |
The accompanying notes are an integral part of the financial statements.
100
| Schedule of Investments | November 30, 2023 |
| Global X Autonomous & Electric Vehicles ETF |
| | | Shares | | | Value | |
| COMMON STOCK — continued | | | | | | | | |
| CHILE — 1.8% | | | | | | | | |
| Industrials — 0.8% | | | | | | | | |
| Sociedad Quimica y Minera de Chile ADR (A) | | | 118,030 | | | $ | 5,929,827 | |
| | | | | | | | | |
| Materials — 1.0% | | | | | | | | |
| Lundin Mining | | | 1,004,409 | | | | 6,963,488 | |
| | | | | | | | | |
| TOTAL CHILE | | | | | | | 12,893,315 | |
| CHINA — 9.3% | | | | | | | | |
| Communication Services — 1.3% | | | | | | | | |
| Baidu ADR * | | | 79,325 | | | | 9,412,704 | |
| | | | | | | | | |
| Consumer Discretionary — 4.7% | | | | | | | | |
| Geely Automobile Holdings | | | 7,075,400 | | | | 7,709,263 | |
| Nexteer Automotive Group | | | 12,110,600 | | | | 7,814,991 | |
| NIO ADR * (A) | | | 892,064 | | | | 6,485,305 | |
| XPeng ADR, Cl A * (A) | | | 652,388 | | | | 10,836,165 | |
| | | | | | | | 32,845,724 | |
| Information Technology — 2.7% | | | | | | | | |
| indie Semiconductor, Cl A * | | | 872,123 | | | | 6,506,037 | |
| NXP Semiconductors | | | 60,787 | | | | 12,405,411 | |
| | | | | | | | 18,911,448 | |
| Materials — 0.6% | | | | | | | | |
| Ganfeng Lithium Group, Cl H | | | 1,280,733 | | | | 4,099,500 | |
| | | | | | | | | |
| TOTAL CHINA | | | | | | | 65,269,376 | |
| FRANCE — 2.1% | | | | | | | | |
| Consumer Discretionary — 2.1% | | | | | | | | |
| Forvia * | | | 329,245 | | | | 6,478,853 | |
| Renault | | | 209,890 | | | | 8,242,072 | |
| | | | | | | | | |
| TOTAL FRANCE | | | | | | | 14,720,925 | |
| GERMANY — 3.0% | | | | | | | | |
| Consumer Discretionary — 1.3% | | | | | | | | |
| Continental | | | 115,783 | | | | 8,971,979 | |
The accompanying notes are an integral part of the financial statements.
101
| Schedule of Investments | November 30, 2023 |
| Global X Autonomous & Electric Vehicles ETF |
| | | Shares | | | Value | |
| COMMON STOCK — continued | | | | | | | | |
| Information Technology — 1.7% | | | | | | | | |
| Infineon Technologies | | | 303,617 | | | $ | 11,776,832 | |
| | | | | | | | | |
| TOTAL GERMANY | | | | | | | 20,748,811 | |
| ISRAEL — 0.6% | | | | | | | | |
| Information Technology — 0.6% | | | | | | | | |
| Innoviz Technologies * (A) | | | 2,474,149 | | | | 4,230,795 | |
| | | | | | | | | |
| JAPAN — 10.9% | | | | | | | | |
| Consumer Discretionary — 8.0% | | | | | | | | |
| Denso | | | 631,845 | | | | 9,890,008 | |
| Honda Motor | | | 1,175,085 | | | | 11,994,476 | |
| Nissan Motor | | | 2,196,838 | | | | 8,661,933 | |
| Toyota Motor | | | 1,317,835 | | | | 24,910,812 | |
| | | | | | | | 55,457,229 | |
| Industrials — 2.9% | | | | | | | | |
| GS Yuasa | | | 416,654 | | | | 6,125,731 | |
| Hitachi | | | 205,757 | | | | 14,314,680 | |
| | | | | | | | 20,440,411 | |
| TOTAL JAPAN | | | | | | | 75,897,640 | |
| LUXEMBOURG — 1.2% | | | | | | | | |
| Materials — 1.2% | | | | | | | | |
| APERAM | | | 254,397 | | | | 8,474,256 | |
| | | | | | | | | |
| NETHERLANDS — 1.0% | | | | | | | | |
| Information Technology — 1.0% | | | | | | | | |
| TomTom * | | | 1,036,983 | | | | 6,867,887 | |
| | | | | | | | | |
| SINGAPORE — 1.5% | | | | | | | | |
| Information Technology — 1.5% | | | | | | | | |
| STMicroelectronics | | | 214,298 | | | | 10,160,631 | |
| | | | | | | | | |
| SOUTH KOREA — 3.8% | | | | | | | | |
| Consumer Discretionary — 2.7% | | | | | | | | |
| Hyundai Motor | | | 64,027 | | | | 9,146,360 | |
The accompanying notes are an integral part of the financial statements.
102
| Schedule of Investments | November 30, 2023 |
| Global X Autonomous & Electric Vehicles ETF |
| | | Shares | | | Value | |
| COMMON STOCK — continued | | | | | | | | |
| Consumer Discretionary — continued | | | | | | | | |
| Kia Motors | | | 141,593 | | | $ | 9,427,461 | |
| | | | | | | | 18,573,821 | |
| Industrials — 1.1% | | | | | | | | |
| LG Energy Solution * | | | 22,495 | | | | 7,924,642 | |
| | | | | | | | | |
| TOTAL SOUTH KOREA | | | | | | | 26,498,463 | |
| TAIWAN — 1.3% | | | | | | | | |
| Industrials — 1.3% | | | | | | | | |
| Advanced Energy Solution Holding | | | 364,800 | | | | 8,816,389 | |
| | | | | | | | | |
| UNITED KINGDOM — 1.0% | | | | | | | | |
| Materials — 1.0% | | | | | | | | |
| Johnson Matthey | | | 372,735 | | | | 7,313,896 | |
| | | | | | | | | |
| UNITED STATES — 55.6% | | | | | | | | |
| Communication Services — 3.8% | | | | | | | | |
| Alphabet, Cl A * | | | 197,730 | | | | 26,205,157 | |
| | | | | | | | | |
| Consumer Discretionary — 14.8% | | | | | | | | |
| American Axle & Manufacturing Holdings * | | | 948,871 | | | | 6,604,142 | |
| Aptiv * | | | 98,021 | | | | 8,120,060 | |
| Ford Motor | | | 885,216 | | | | 9,082,316 | |
| General Motors | | | 324,781 | | | | 10,263,080 | |
| Gentherm * | | | 152,799 | | | | 7,016,530 | |
| Lear | | | 58,989 | | | | 7,889,779 | |
| Lucid Group * (A) | | | 1,201,228 | | | | 5,069,182 | |
| Luminar Technologies, Cl A * (A) | | | 1,117,768 | | | | 2,794,420 | |
| QuantumScape, Cl A * (A) | | | 827,536 | | | | 5,246,578 | |
| Stellantis | | | 626,042 | | | | 13,594,492 | |
| Tesla * | | | 88,719 | | | | 21,299,657 | |
| Visteon * | | | 55,505 | | | | 6,586,778 | |
| | | | | | | | 103,567,014 | |
| Industrials — 10.3% | | | | | | | | |
| Bloom Energy, Cl A * (A) | | | 478,466 | | | | 6,909,049 | |
| EnerSys | | | 78,283 | | | | 6,926,480 | |
| Honeywell International | | | 97,446 | | | | 19,091,620 | |
The accompanying notes are an integral part of the financial statements.
103
| Schedule of Investments | November 30, 2023 |
| Global X Autonomous & Electric Vehicles ETF |
| | | Shares | | | Value | |
| COMMON STOCK — continued | | | | | | | | |
| Industrials — continued | | | | | | | | |
| Hyster-Yale Materials Handling | | | 174,264 | | | $ | 8,307,165 | |
| ITT | | | 91,616 | | | | 9,919,264 | |
| Microvast Holdings * (A) | | | 3,124,566 | | | | 3,655,742 | |
| Nikola * (A) | | | 3,818,008 | | | | 3,712,631 | |
| Plug Power * (A) | | | 723,545 | | | | 2,923,122 | |
| Westinghouse Air Brake Technologies | | | 89,156 | | | | 10,392,024 | |
| | | | | | | | 71,837,097 | |
| Information Technology — 22.3% | | | | | | | | |
| Ambarella * | | | 101,781 | | | | 5,975,562 | |
| Apple | | | 129,265 | | | | 24,553,887 | |
| CEVA * | | | 316,843 | | | | 6,894,504 | |
| Coherent * | | | 169,524 | | | | 6,236,788 | |
| Intel | | | 604,529 | | | | 27,022,446 | |
| Microsoft | | | 48,074 | | | | 18,215,719 | |
| MicroVision * (A) | | | 1,909,902 | | | | 4,812,953 | |
| NVIDIA | | | 53,537 | | | | 25,039,255 | |
| ON Semiconductor * | | | 118,955 | | | | 8,485,060 | |
| QUALCOMM | | | 163,418 | | | | 21,089,093 | |
| SiTime * | | | 64,756 | | | | 7,162,014 | |
| | | | | | | | 155,487,281 | |
| Materials — 4.4% | | | | | | | | |
| Albemarle | | | 44,361 | | | | 5,379,658 | |
| ATI * | | | 189,390 | | | | 8,323,691 | |
| Cabot | | | 123,966 | | | | 9,409,019 | |
| Livent * | | | 307,625 | | | | 4,232,920 | |
| Piedmont Lithium * | | | 141,760 | | | | 3,673,002 | |
| | | | | | | | 31,018,290 | |
| TOTAL UNITED STATES | | | | | | | 388,114,839 | |
TOTAL COMMON STOCK
(Cost $910,779,536) | | | | | | | 686,672,632 | |
| PREFERRED STOCK — 1.3% | | | | | | | | |
| GERMANY— 1.3% | | | | | | | | |
| Consumer Discretionary — 1.3% | | | | | | | | |
| Volkswagen (B) | | | 77,089 | | | | 8,951,142 | |
TOTAL PREFERRED STOCK
(Cost $16,339,026) | | | | | | | 8,951,142 | |
The accompanying notes are an integral part of the financial statements.
104
| Schedule of Investments | November 30, 2023 |
| Global X Autonomous & Electric Vehicles ETF |
| | | Shares | | | Value | |
| SHORT-TERM INVESTMENT(C) — 2.0% | | | | | | | | |
Fidelity Investments Money Market Government Portfolio, Cl Institutional, 5.280%
(Cost $14,221,842) | | | 14,221,842 | | | $ | 14,221,842 | |
| | | | | | | | | |
| | | Face Amount | | | | | |
| REPURCHASE AGREEMENT(D) — 6.7% | | | | | | | | |
| BNP Paribas | | | | | | | | |
5.220%, Dated 11/30/2023, to be repurchased on 12/01/2023, repurchase price $46,601,699 (collateralized by U.S. Treasury Obligations, ranging in par value $5,481,758 - $232,646, 2.000% - 2.000%, 08/15/2025 - 08/15/2025, with a total market value of $47,483,275)
(Cost $46,594,943) | | $ | 46,594,943 | | | | 46,594,943 | |
TOTAL INVESTMENTS — 108.4%
(Cost $987,935,347) | | | | | | $ | 756,440,559 | |
Percentages are based on Net Assets of $697,744,909.
| * | Non-income producing security. |
| (A) | This security or a partial position of this security is on loan at November 30, 2023. The total market value of securities on loan at November 30, 2023 was $57,928,613. |
| (B) | There is currently no stated interest rate. |
| (C) | The rate reported on the Schedule of Investments is the 7-day effective yield as of November 30, 2023. |
| (D) | These securities were purchased with cash collateral held from securities on loan. The total value of such securities as of November 30, 2023 was $46,594,943. The total value of non-cash collateral held from securities on loan as of November 30, 2023 was $–. |
The accompanying notes are an integral part of the financial statements.
105
| Schedule of Investments | November 30, 2023 |
| Global X Autonomous & Electric Vehicles ETF |
The following is a summary of the level of inputs used as of November 30, 2023, in valuing the Fund’s investments carried at value:
| Investments in Securities | | Level 1 | | | Level 2 | | | Level 3 | | | Total | |
| Common Stock | | $ | 686,672,632 | | | $ | — | | | $ | — | | | $ | 686,672,632 | |
| Preferred Stock | | | 8,951,142 | | | | — | | | | — | | | | 8,951,142 | |
| Short-Term Investment | | | 14,221,842 | | | | — | | | | — | | | | 14,221,842 | |
| Repurchase Agreement | | | — | | | | 46,594,943 | | | | — | | | | 46,594,943 | |
| Total Investments in Securities | | $ | 709,845,616 | | | $ | 46,594,943 | | | $ | — | | | $ | 756,440,559 | |
Amounts designated as “—” are $0 or have been rounded to $0.
See “Glossary” for abbreviations.
The accompanying notes are an integral part of the financial statements.
106
| Schedule of Investments | | November 30, 2023 |
| Global X Artificial Intelligence & Technology ETF |
Sector Weightings (Unaudited)†:
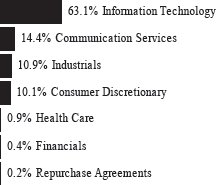
† Sector weightings percentages are based on the total market value of investments. Total investments do not include derivatives such as options, futures contracts, forward contracts, and swap contracts, if applicable.
| | | Shares | | | Value | |
| COMMON STOCK — 99.8% | | | | | | | | |
| BRAZIL — 0.4% | | | | | | | | |
| Financials — 0.4% | | | | | | | | |
| StoneCo, Cl A * | | | 176,788 | | | $ | 2,757,893 | |
| | | | | | | | | |
| CANADA — 3.1% | | | | | | | | |
| Industrials — 1.3% | | | | | | | | |
| Thomson Reuters | | | 73,758 | | | | 10,319,482 | |
| | | | | | | | | |
| Information Technology — 1.8% | | | | | | | | |
| Shopify, Cl A * | | | 194,363 | | | | 14,153,513 | |
| | | | | | | | | |
| TOTAL CANADA | | | | | | | 24,472,995 | |
| CHINA — 8.6% | | | | | | | | |
| Communication Services — 3.8% | | | | | | | | |
| Baidu ADR * | | | 45,349 | | | | 5,381,112 | |
| Kanzhun ADR | | | 146,429 | | | | 2,420,471 | |
| Tencent Holdings | | | 534,243 | | | | 22,367,574 | |
| | | | | | | | 30,169,157 | |
| Consumer Discretionary — 3.7% | | | | | | | | |
| Alibaba Group Holding ADR | | | 247,443 | | | | 18,528,532 | |
The accompanying notes are an integral part of the financial statements.
107
| Schedule of Investments | | November 30, 2023 |
| Global X Artificial Intelligence & Technology ETF |
| | | Shares | | | Value | |
| COMMON STOCK — continued | | | | | | | | |
| Consumer Discretionary — continued | | | | | | | | |
| Meituan, Cl B * | | | 895,915 | | | $ | 10,392,674 | |
| | | | | | | | 28,921,206 | |
| Information Technology — 1.1% | | | | | | | | |
| NXP Semiconductors | | | 42,241 | | | | 8,620,543 | |
| | | | | | | | | |
| TOTAL CHINA | | | | | | | 67,710,906 | |
| FINLAND — 0.3% | | | | | | | | |
| Information Technology — 0.3% | | | | | | | | |
| TietoEVRY | | | 91,921 | | | | 2,019,933 | |
| | | | | | | | | |
| GERMANY — 3.9% | | | | | | | | |
| Industrials — 2.9% | | | | | | | | |
| Siemens | | | 135,482 | | | | 22,764,867 | |
| | | | | | | | | |
| Information Technology — 1.0% | | | | | | | | |
| Infineon Technologies | | | 212,532 | | | | 8,243,786 | |
| | | | | | | | | |
| TOTAL GERMANY | | | | | | | 31,008,653 | |
| ISRAEL — 0.3% | | | | | | | | |
| Information Technology — 0.3% | | | | | | | | |
| Wix.com * | | | 26,916 | | | | 2,731,974 | |
| | | | | | | | | |
| ITALY — 0.3% | | | | | | | | |
| Health Care — 0.3% | | | | | | | | |
| Amplifon | | | 64,737 | | | | 2,015,195 | |
| | | | | | | | | |
| JAPAN — 2.3% | | | | | | | | |
| Industrials — 1.1% | | | | | | | | |
| FANUC | | | 163,873 | | | | 4,560,311 | |
| Fujikura | | | 277,679 | | | | 2,138,448 | |
| Toshiba * | | | 71,606 | | | | 2,228,076 | |
| | | | | | | | 8,926,835 | |
| Information Technology — 1.2% | | | | | | | | |
| Fujitsu | | | 34,337 | | | | 4,905,452 | |
| NEC | | | 47,354 | | | | 2,639,409 | |
The accompanying notes are an integral part of the financial statements.
108
| Schedule of Investments | | November 30, 2023 |
| Global X Artificial Intelligence & Technology ETF |
| | | Shares | | | Value | |
| COMMON STOCK — continued | | | | | | | | |
| Information Technology — continued | | | | | | | | |
| Socionext | | | 23,103 | | | $ | 2,070,651 | |
| | | | | | | | 9,615,512 | |
| TOTAL JAPAN | | | | | | | 18,542,347 | |
| NETHERLANDS — 0.7% | | | | | | | | |
| Industrials — 0.7% | | | | | | | | |
| Wolters Kluwer | | | 42,382 | | | | 5,840,467 | |
| | | | | | | | | |
| NEW ZEALAND — 0.2% | | | | | | | | |
| Information Technology — 0.2% | | | | | | | | |
| Xero * | | | 27,194 | | | | 1,858,095 | |
| | | | | | | | | |
| SINGAPORE — 0.9% | | | | | | | | |
| Information Technology — 0.9% | | | | | | | | |
| STMicroelectronics | | | 148,655 | | | | 7,047,451 | |
| | | | | | | | | |
| SOUTH KOREA — 4.5% | | | | | | | | |
| Information Technology — 4.5% | | | | | | | | |
| Samsung Electronics | | | 416,854 | | | | 23,522,049 | |
| SK Hynix | | | 118,263 | | | | 12,274,089 | |
| | | | | | | | | |
| TOTAL SOUTH KOREA | | | | | | | 35,796,138 | |
| SWEDEN — 0.3% | | | | | | | | |
| Information Technology — 0.3% | | | | | | | | |
| Telefonaktiebolaget LM Ericsson ADR (A) | | | 499,238 | | | | 2,441,274 | |
| | | | | | | | | |
| SWITZERLAND — 0.3% | | | | | | | | |
| Information Technology — 0.3% | | | | | | | | |
| Temenos | | | 26,497 | | | | 2,255,544 | |
| | | | | | | | | |
| TAIWAN — 1.4% | | | | | | | | |
| Industrials — 0.3% | | | | | | | | |
| Bizlink Holding | | | 240,568 | | | | 2,032,969 | |
| | | | | | | | | |
| Information Technology — 1.1% | | | | | | | | |
| Acer | | | 2,046,000 | | | | 2,305,352 | |
The accompanying notes are an integral part of the financial statements.
109
| Schedule of Investments | | November 30, 2023 |
| Global X Artificial Intelligence & Technology ETF |
| | | Shares | | | Value | |
| COMMON STOCK — continued | | | | | | | | |
| Information Technology — continued | | | | | | | | |
| Advantech | | | 181,657 | | | $ | 2,055,562 | |
| Alchip Technologies | | | 27,690 | | | | 2,756,591 | |
| Global Unichip | | | 31,200 | | | | 1,647,887 | |
| | | | | | | | 8,765,392 | |
| TOTAL TAIWAN | | | | | | | 10,798,361 | |
| UNITED STATES — 72.3% | | | | | | | | |
| Communication Services — 10.6% | | | | | | | | |
| Alphabet, Cl A * | | | 190,278 | | | | 25,217,543 | |
| Meta Platforms, Cl A * | | | 77,380 | | | | 25,314,867 | |
| Netflix * | | | 53,298 | | | | 25,261,653 | |
| Snap, Cl A * | | | 219,507 | | | | 3,035,782 | |
| Trade Desk, Cl A * | | | 71,843 | | | | 5,062,058 | |
| | | | | | | | 83,891,903 | |
| Consumer Discretionary — 6.4% | | | | | | | | |
| Amazon.com * | | | 175,493 | | | | 25,637,772 | |
| eBay | | | 86,755 | | | | 3,557,823 | |
| Tesla * | | | 87,742 | | | | 21,065,099 | |
| | | | | | | | 50,260,694 | |
| Health Care — 0.6% | | | | | | | | |
| GE HealthCare Technologies | | | 73,913 | | | | 5,060,084 | |
| | | | | | | | | |
| Industrials — 4.6% | | | | | | | | |
| Booz Allen Hamilton Holding, Cl A | | | 21,283 | | | | 2,663,142 | |
| Experian | | | 148,933 | | | | 5,473,370 | |
| Genpact | | | 60,125 | | | | 2,041,845 | |
| Hubbell, Cl B | | | 8,370 | | | | 2,511,000 | |
| Rockwell Automation | | | 18,607 | | | | 5,125,112 | |
| Uber Technologies * | | | 328,802 | | | | 18,537,857 | |
| | | | | | | | 36,352,326 | |
| Information Technology — 50.1% | | | | | | | | |
| Accenture, Cl A | | | 72,224 | | | | 24,060,703 | |
| Adobe * | | | 44,152 | | | | 26,977,314 | |
| Ambarella * | | | 28,874 | | | | 1,695,193 | |
| Apple | | | 119,149 | | | | 22,632,353 | |
| Cadence Design Systems * | | | 44,426 | | | | 12,140,293 | |
The accompanying notes are an integral part of the financial statements.
110
| Schedule of Investments | | November 30, 2023 |
| Global X Artificial Intelligence & Technology ETF |
| | | Shares | | | Value | |
| COMMON STOCK — continued | | | | | | | | |
| Information Technology — continued | | | | | | | | |
| CCC Intelligent Solutions Holdings * | | | 206,350 | | | $ | 2,410,168 | |
| Cisco Systems | | | 433,450 | | | | 20,970,311 | |
| Cognex | | | 40,260 | | | | 1,517,802 | |
| CyberArk Software * | | | 15,223 | | | | 3,033,487 | |
| Datadog, Cl A * | | | 47,722 | | | | 5,562,954 | |
| DXC Technology * | | | 81,618 | | | | 1,887,824 | |
| Envestnet * | | | 37,006 | | | | 1,407,338 | |
| Freshworks, Cl A * | | | 134,282 | | | | 2,688,326 | |
| Hewlett Packard Enterprise | | | 208,360 | | | | 3,523,368 | |
| Informatica, Cl A * | | | 121,936 | | | | 3,059,374 | |
| Intel | | | 671,395 | | | | 30,011,356 | |
| International Business Machines | | | 164,440 | | | | 26,073,606 | |
| IonQ * (A) | | | 158,130 | | | | 1,933,930 | |
| Microsoft | | | 66,403 | | | | 25,160,761 | |
| NVIDIA | | | 51,217 | | | | 23,954,191 | |
| Okta, Cl A * | | | 32,204 | | | | 2,159,278 | |
| Oracle | | | 193,981 | | | | 22,542,532 | |
| Pegasystems | | | 41,934 | | | | 2,179,729 | |
| Procore Technologies * | | | 32,004 | | | | 1,891,116 | |
| QUALCOMM | | | 183,123 | | | | 23,632,023 | |
| Salesforce * | | | 100,201 | | | | 25,240,632 | |
| Seagate Technology Holdings | | | 37,730 | | | | 2,984,443 | |
| ServiceNow * | | | 39,336 | | | | 26,974,269 | |
| Smartsheet, Cl A * | | | 53,716 | | | | 2,276,484 | |
| Splunk * | | | 26,556 | | | | 4,024,296 | |
| Super Micro Computer * | | | 8,291 | | | | 2,267,340 | |
| Synopsys * | | | 24,457 | | | | 13,285,776 | |
| Teradata * | | | 41,662 | | | | 1,968,530 | |
| Twilio, Cl A * | | | 36,695 | | | | 2,373,433 | |
| UiPath, Cl A * | | | 129,884 | | | | 2,566,508 | |
| Verint Systems * | | | 60,551 | | | | 1,487,738 | |
| Viasat * | | | 72,173 | | | | 1,475,938 | |
| Workday, Cl A * | | | 33,809 | | | | 9,152,772 | |
| Zebra Technologies, Cl A * | | | 8,049 | | | | 1,907,452 | |
| Zscaler * | | | 23,608 | | | | 4,663,288 | |
| | | | | | | | 395,754,229 | |
| TOTAL UNITED STATES | | | | | | | 571,319,236 | |
TOTAL COMMON STOCK
(Cost $741,265,645) | | | | | | | 788,616,462 | |
The accompanying notes are an integral part of the financial statements.
111
| Schedule of Investments | | November 30, 2023 |
| Global X Artificial Intelligence & Technology ETF |
| | | Face Amount | | | Value | |
| REPURCHASE AGREEMENTS(B) — 0.2% | | | | | | | | |
Bank of America
5.320%, dated 11/30/2023, to be repurchased on 12/01/2023, repurchase price $96,864 (collateralized by various U.S. Government Obligations and U.S. Treasury Obligations, ranging in par value $10 - $34,163, 1.500% - 7.000%, 08/01/2027 - 09/20/2063, with a total market value of $98,787) | | $ | 96,850 | | | $ | 96,850 | |
Daiwa Capital Markets
5.340%, dated 11/30/2023, to be repurchased on 12/01/2023, repurchase price $351,821 (collateralized by various U.S. Government Obligations and U.S. Treasury Obligations, ranging in par value $22 - $48,599, 0.000% - 7.000%, 01/25/2024 - 12/01/2053, with a total market value of $358,824) | | | 351,769 | | | | 351,769 | |
Deutsche Bank Securities
5.320%, dated 11/30/2023, to be repurchased on 12/01/2023, repurchase price $351,821 (collateralized by various U.S. Government Obligations and U.S. Treasury Obligations, ranging in par value $1,055 - $106,281, 2.500% - 7.500%, 06/01/2042 - 11/01/2053, with a total market value of $358,804) | | | 351,769 | | | | 351,769 | |
HSBC Securities
5.320%, dated 11/30/2023, to be repurchased on 12/01/2023, repurchase price $344,785 (collateralized by various U.S. Government Obligations and U.S. Treasury Obligations, ranging in par value $3,447 - $408,171, 0.000% - 7.500%, 11/15/2031 - 10/20/2073, with a total market value of $351,629) | | | 344,734 | | | | 344,734 | |
The accompanying notes are an integral part of the financial statements.
112
| Schedule of Investments | | November 30, 2023 |
| Global X Artificial Intelligence & Technology ETF |
| | | Face Amount | | | Value | |
| REPURCHASE AGREEMENTS — continued | | | | | | | | |
RBC Dominion Securities
5.320%, dated 11/30/2023, to be repurchased on 12/01/2023, repurchase price $351,821 (collateralized by various U.S. Government Obligations and U.S. Treasury Obligations, ranging in par value $21 - $92,203, 0.000% - 6.500%, 12/14/2023 - 09/01/2053, with a total market value of $358,804) | | $ | 351,769 | | | $ | 351,769 | |
TOTAL REPURCHASE AGREEMENTS
(Cost $1,496,891) | | | | | | | 1,496,891 | |
TOTAL INVESTMENTS — 100.0%
(Cost $742,762,536) | | | | | | $ | 790,113,353 | |
Percentages are based on Net Assets of $789,875,233.
| * | Non-income producing security. |
| (A) | This security or a partial position of this security is on loan at November 30, 2023. The total market value of securities on loan at November 30, 2023 was $2,961,248. |
| (B) | These securities were purchased with cash collateral held from securities on loan. The total value of such securities as of November 30, 2023 was $1,496,891. The total value of non-cash collateral held from securities on loan as of November 30, 2023 was $1,534,472. |
The following is a summary of the level of inputs used as of November 30, 2023, in valuing the Fund’s investments carried at value:
| Investments in Securities | | Level 1 | | | Level 2 | | | Level 3 | | | Total | |
| Common Stock | | $ | 788,616,462 | | | $ | — | | | $ | — | | | $ | 788,616,462 | |
| Repurchase Agreements | | | — | | | | 1,496,891 | | | | — | | | | 1,496,891 | |
| Total Investments in Securities | | $ | 788,616,462 | | | $ | 1,496,891 | | | $ | — | | | $ | 790,113,353 | |
Amounts designated as “—” are $0 or have been rounded to $0.
See “Glossary” for abbreviations.
The accompanying notes are an integral part of the financial statements.
113
| Schedule of Investments | | November 30, 2023 |
| Global X Genomics & Biotechnology ETF |
Sector Weightings (Unaudited)†:

† Sector weightings percentages are based on the total market value of investments. Total investments do not include derivatives such as options, futures contracts, forward contracts, and swap contracts, if applicable.
| | | Shares | | | Value | |
| COMMON STOCK — 99.9% | | | | | | | | |
| CHINA — 3.8% | | | | | | | | |
| Health Care — 3.8% | | | | | | | | |
| Genscript Biotech * | | | 1,267,418 | | | $ | 3,521,372 | |
| | | | | | | | | |
| GERMANY — 3.6% | | | | | | | | |
| Health Care — 3.6% | | | | | | | | |
| BioNTech ADR * | | | 33,717 | | | | 3,385,524 | |
| | | | | | | | | |
| JAPAN — 0.7% | | | | | | | | |
| Health Care — 0.7% | | | | | | | | |
| Takara Bio | | | 82,536 | | | | 682,240 | |
| | �� | | | | | | | |
| NETHERLANDS — 0.6% | | | | | | | | |
| Health Care — 0.6% | | | | | | | | |
| uniQure * | | | 75,909 | | | | 514,663 | |
| | | | | | | | | |
| SWITZERLAND — 5.9% | | | | | | | | |
| Health Care — 5.9% | | | | | | | | |
| CRISPR Therapeutics * (A) | | | 81,993 | | | | 5,471,393 | |
| | | | | | | | | |
| UNITED STATES — 85.3% | | | | | | | | |
| Health Care — 85.3% | | | | | | | | |
| 10X Genomics, Cl A * | | | 86,750 | | | | 3,775,360 | |
| 2seventy bio * (A) | | | 78,303 | | | | 143,295 | |
| Agilent Technologies | | | 31,060 | | | | 3,969,468 | |
| Allogene Therapeutics * | | | 189,509 | | | | 445,346 | |
| Alnylam Pharmaceuticals * | | | 20,136 | | | | 3,387,882 | |
| Arrowhead Pharmaceuticals * | | | 133,939 | | | | 2,839,507 | |
| Avidity Biosciences * | | | 127,256 | | | | 993,869 | |
| Beam Therapeutics * (A) | | | 119,896 | | | | 3,366,680 | |
The accompanying notes are an integral part of the financial statements.
114
| Schedule of Investments | | November 30, 2023 |
| Global X Genomics & Biotechnology ETF |
| | | Shares | | | Value | |
| COMMON STOCK — continued | | | | | | | | |
| Health Care — continued | | | | | | | | |
| BioMarin Pharmaceutical * | | | 39,276 | | | $ | 3,577,258 | |
| Bio-Techne | | | 52,402 | | | | 3,296,086 | |
| Bluebird Bio * (A) | | | 186,085 | | | | 710,845 | |
| CareDx * | | | 92,582 | | | | 898,971 | |
| Caribou Biosciences * | | | 135,632 | | | | 796,160 | |
| Editas Medicine, Cl A * | | | 145,436 | | | | 1,531,441 | |
| Fulgent Genetics * | | | 34,137 | | | | 941,498 | |
| Gilead Sciences | | | 20,454 | | | | 1,566,776 | |
| Illumina * | | | 28,186 | | | | 2,873,563 | |
| Intellia Therapeutics * | | | 131,730 | | | | 3,903,160 | |
| Legend Biotech ADR * | | | 50,193 | | | | 3,052,738 | |
| Lyell Immunopharma * | | | 217,186 | | | | 375,732 | |
| Moderna * | | | 41,832 | | | | 3,250,346 | |
| Myriad Genetics * | | | 141,315 | | | | 2,697,703 | |
| Natera * | | | 80,180 | | | | 4,486,071 | |
| Pacific Biosciences of California * | | | 435,654 | | | | 3,694,346 | |
| Poseida Therapeutics, Cl A * | | | 113,014 | | | | 301,747 | |
| QIAGEN * | | | 87,106 | | | | 3,585,283 | |
| REGENXBIO * | | | 71,444 | | | | 1,394,587 | |
| Rocket Pharmaceuticals * | | | 133,893 | | | | 3,123,724 | |
| Sana Biotechnology * | | | 175,947 | | | | 714,345 | |
| Sarepta Therapeutics * | | | 29,932 | | | | 2,432,873 | |
| Scilex Holding *(B)(C) | | | 226,071 | | | | 141,294 | |
| Ultragenyx Pharmaceutical * | | | 97,827 | | | | 3,800,579 | |
| Veracyte * | | | 129,274 | | | | 3,309,414 | |
| Vertex Pharmaceuticals * | | | 4,417 | | | | 1,567,196 | |
| Verve Therapeutics * | | | 76,945 | | | | 867,940 | |
| Vir Biotechnology * | | | 156,803 | | | | 1,488,060 | |
| | | | | | | | | |
| TOTAL UNITED STATES | | | | | | | 79,301,143 | |
TOTAL COMMON STOCK
(Cost $143,898,128) | | | | | | | 92,876,335 | |
The accompanying notes are an integral part of the financial statements.
115
| Schedule of Investments | | November 30, 2023 |
| Global X Genomics & Biotechnology ETF |
| | | Face Amount | | | Value | |
| REPURCHASE AGREEMENTS(D) — 4.3% | | | | | | | | |
Citigroup Global Markets
5.320%, dated 11/30/2023, to be repurchased on 12/01/2023, repurchase price $948,326 (collateralized by various U.S. Government Obligations and U.S. Treasury Obligations, ranging in par value $8,146 - $286,876, 2.000% - 7.028%, 11/20/2043 - 01/20/2072, with a total market value of $967,150) | | $ | 948,186 | | | $ | 948,186 | |
Daiwa Capital Markets
5.340%, dated 11/30/2023, to be repurchased on 12/01/2023, repurchase price $948,327 (collateralized by various U.S. Government Obligations and U.S. Treasury Obligations, ranging in par value $60 - $130,997, 0.000% - 7.000%, 01/25/2024 - 12/01/2053, with a total market value of $967,202) | | | 948,186 | | | | 948,186 | |
Deutsche Bank Securities
5.320%, dated 11/30/2023, to be repurchased on 12/01/2023, repurchase price $261,093 (collateralized by various U.S. Government Obligations and U.S. Treasury Obligations, ranging in par value $783 - $78,873, 2.500% - 7.500%, 06/01/2042 - 11/01/2053, with a total market value of $266,275) | | | 261,054 | | | | 261,054 | |
HSBC Securities
5.320%, dated 11/30/2023, to be repurchased on 12/01/2023, repurchase price $929,359 (collateralized by various U.S. Government Obligations and U.S. Treasury Obligations, ranging in par value $9,292 - $1,100,214, 0.000% - 7.500%, 11/15/2031 - 10/20/2073, with a total market value of $947,806) | | | 929,222 | | | | 929,222 | |
The accompanying notes are an integral part of the financial statements.
116
| Schedule of Investments | | November 30, 2023 |
| Global X Genomics & Biotechnology ETF |
| | | Face Amount | | | Value | |
| REPURCHASE AGREEMENTS — continued | | | | | | | | |
RBC Dominion Securities
5.320%, dated 11/30/2023, to be repurchased on 12/01/2023, repurchase price $948,326 (collateralized by various U.S. Government Obligations and U.S. Treasury Obligations, ranging in par value $55 - $248,531, 0.000% - 6.500%, 12/14/2023 - 09/01/2053, with a total market value of $967,150) | | $ | 948,186 | | | $ | 948,186 | |
TOTAL REPURCHASE AGREEMENTS
(Cost $4,034,834) | | | | | | | 4,034,834 | |
TOTAL INVESTMENTS — 104.2%
(Cost $147,932,962) | | | | | | $ | 96,911,169 | |
Percentages are based on Net Assets of $93,029,046.
| * | Non-income producing security. |
| (A) | This security or a partial position of this security is on loan at November 30, 2023. The total market value of securities on loan at November 30, 2023 was $3,790,397. |
| (B) | Level 3 security in accordance with fair value hierarchy. |
| (C) | Security considered illiquid. The total value of such securities as of November 30, 2023 was $141,294 and represented 0.2% of Net Assets. |
| (D) | These securities were purchased with cash collateral held from securities on loan. The total value of such securities as of November 30, 2023 was $4,034,834. The total value of non-cash collateral held from securities on loan as of November 30, 2023 was $–. |
The following is a summary of the level of inputs used as of November 30, 2023, in valuing the Fund’s investments carried at value:
| Investments in Securities | | Level 1 | | | Level 2 | | | Level 3(1) | | | Total | |
| Common Stock | | $ | 92,735,041 | | | $ | — | | | $ | 141,294 | | | $ | 92,876,335 | |
| Repurchase Agreements | | | — | | | | 4,034,834 | | | | — | | | | 4,034,834 | |
| Total Investments in Securities | | $ | 92,735,041 | | | $ | 4,034,834 | | | $ | 141,294 | | | $ | 96,911,169 | |
(1) A reconciliation of Level 3 investments and disclosures of significant unobservable inputs are presented when the Fund has a significant amount of Level 3 investments at
The accompanying notes are an integral part of the financial statements.
117
| Schedule of Investments | | November 30, 2023 |
| Global X Genomics & Biotechnology ETF |
the end of the period in relation to Net Assets. Management has concluded that Level 3 investments are not material in relation to Net Assets.
Amounts designated as “—” are $0 or have been rounded to $0.
See “Glossary” for abbreviations.
The accompanying notes are an integral part of the financial statements.
118
| Schedule of Investments | | November 30, 2023 |
| | | |
| | Global X Cloud Computing ETF | |
Sector Weightings (Unaudited)†:

† Sector weightings percentages are based on the total market value of investments. Total investments do not include derivatives such as options, futures contracts, forward contracts, and swap contracts, if applicable.
| | | Shares | | | Value | |
| COMMON STOCK — 99.9% | | | | | | | | |
| CANADA — 4.2% | | | | | | | | |
| Information Technology — 4.2% | | | | | | | | |
| Shopify, Cl A * | | | 335,758 | | | $ | 24,449,898 | |
| | | | | | | | | |
| CHINA — 1.2% | | | | | | | | |
| Consumer Discretionary — 0.3% | | | | | | | | |
| Alibaba Group Holding ADR * | | | 25,544 | | | | 1,912,735 | |
| | | | | | | | | |
| Information Technology — 0.9% | | | | | | | | |
| Kingsoft Cloud Holdings ADR * (A) | | | 297,174 | | | | 1,298,650 | |
| Vnet Group ADR * | | | 1,295,940 | | | | 3,628,632 | |
| | | | | | | | 4,927,282 | |
| TOTAL CHINA | | | | | | | 6,840,017 | |
| ISRAEL — 4.3% | | | | | | | | |
| Information Technology — 4.3% | | | | | | | | |
| Wix.com * | | | 246,297 | | | | 24,999,145 | |
The accompanying notes are an integral part of the financial statements.
119
| Schedule of Investments | | November 30, 2023 |
| | | |
| | Global X Cloud Computing ETF | |
| | | Shares | | | Value | |
| COMMON STOCK — continued | | | | | | | | |
| SINGAPORE — 0.3% | | | | | | | | |
| Real Estate — 0.3% | | | | | | | | |
| Digital Core REIT Management Pte ‡ | | | 2,682,325 | | | $ | 1,649,630 | |
| | | | | | | | | |
| UNITED STATES — 89.9% | | | | | | | | |
| Communication Services — 7.2% | | | | | | | | |
| Alphabet, Cl A * | | | 60,026 | | | | 7,955,246 | |
| Netflix * | | | 47,197 | | | | 22,369,962 | |
| PubMatic, Cl A * | | | 386,116 | | | | 6,451,998 | |
| Vimeo * | | | 1,424,250 | | | | 5,013,360 | |
| | | | | | | | 41,790,566 | |
| Consumer Discretionary — 1.9% | | | | | | | | |
| 2U * | | | 728,444 | | | | 715,623 | |
| Amazon.com * | | | 72,487 | | | | 10,589,626 | |
| | | | | | | | 11,305,249 | |
| Health Care — 1.2% | | | | | | | | |
| HealthStream | | | 274,354 | | | | 6,858,850 | |
| | | | | | | | | |
| Industrials — 3.9% | | | | | | | | |
| Paycom Software | | | 123,235 | | | | 22,386,870 | |
| | | | | | | | | |
| Information Technology — 72.0% | | | | | | | | |
| Akamai Technologies * | | | 190,421 | | | | 21,999,338 | |
| Box, Cl A * | | | 797,951 | | | | 20,882,378 | |
| DigitalOcean Holdings * | | | 807,087 | | | | 23,905,917 | |
| Dropbox, Cl A * | | | 758,388 | | | | 21,371,374 | |
| Everbridge * | | | 369,367 | | | | 7,520,312 | |
| Fastly, Cl A * | | | 1,173,598 | | | | 19,493,463 | |
| Five9 * | | | 354,996 | | | | 27,057,795 | |
| Freshworks, Cl A * | | | 1,098,808 | | | | 21,998,136 | |
| International Business Machines | | | 10,044 | | | | 1,592,577 | |
| Microsoft | | | 28,734 | | | | 10,887,600 | |
| Procore Technologies * | | | 397,150 | | | | 23,467,593 | |
| Qualys * | | | 131,266 | | | | 24,263,207 | |
| Salesforce * | | | 96,317 | | | | 24,262,252 | |
| Sinch * | | | 7,687,376 | | | | 21,872,545 | |
| SPS Commerce * | | | 122,845 | | | | 21,163,737 | |
The accompanying notes are an integral part of the financial statements.
120
| Schedule of Investments | | November 30, 2023 |
| | | |
| | Global X Cloud Computing ETF | |
| | | Shares | | | Value | |
| COMMON STOCK — continued | | | | | | | | |
| Information Technology — continued | | | | | | | | |
| Twilio, Cl A * | | | 384,101 | | | $ | 24,843,653 | |
| Workday, Cl A * | | | 94,148 | | | | 25,487,747 | |
| Workiva, Cl A * | | | 229,339 | | | | 22,055,532 | |
| Yext * | | | 1,127,830 | | | | 7,477,513 | |
| Zoom Video Communications, Cl A * | | | 327,092 | | | | 22,186,650 | |
| Zscaler * | | | 125,927 | | | | 24,874,360 | |
| | | | | | | | 418,663,679 | |
| Real Estate — 3.7% | | | | | | | | |
| Digital Realty Trust ‡ | | | 153,899 | | | | 21,358,103 | |
| | | | | | | | | |
| TOTAL UNITED STATES | | | | | | | 522,363,317 | |
TOTAL COMMON STOCK
(Cost $812,208,684) | | | | | | | 580,302,007 | |
| | | | | | | | | |
| SHORT-TERM INVESTMENT(B) — 0.0% | | | | | | | | |
Fidelity Investments Money Market Government Portfolio, Cl Institutional, 5.280%
(Cost $239,222) | | | 239,222 | | | | 239,222 | |
| | | | | | | | |
| | | Face Amount | | | | | |
| REPURCHASE AGREEMENT(C) — 0.1% | | | | | | | | |
| BNP Paribas | | | | | | | | |
5.220%, Dated 11/30/2023, to be repurchased on 12/01/2023, repurchase price $783,876 (collateralized by U.S. Treasury Obligations, ranging in par value $92,207 - $3,913, 2.000% - 2.000%, 08/15/2025 - 08/15/2025, with a total market value of $798,703)
(Cost $783,762) | | $ | 783,762 | | | | 783,762 | |
TOTAL INVESTMENTS — 100.0%
(Cost $813,231,668) | | | | | | $ | 581,324,991 | |
Percentages are based on Net Assets of $581,162,442.
| * | Non-income producing security. |
| ‡ | Real Estate Investment Trust |
The accompanying notes are an integral part of the financial statements.
121
| Schedule of Investments | | November 30, 2023 |
| | | |
| | Global X Cloud Computing ETF | |
| (A) | This security or a partial position of this security is on loan at November 30, 2023. The total market value of securities on loan at November 30, 2023 was $973,636. |
| (B) | The rate reported on the Schedule of Investments is the 7-day effective yield as of November 30, 2023. |
| (C) | These securities were purchased with cash collateral held from securities on loan. The total value of such securities as of November 30, 2023 was $783,762. The total value of non-cash collateral held from securities on loan as of November 30, 2023 was $–. |
The following is a summary of the level of inputs used as of November 30, 2023, in valuing the Fund’s investments carried at value:
| Investments in Securities | | Level 1 | | | Level 2 | | | Level 3 | | | Total | |
| Common Stock | | $ | 580,302,007 | | | $ | — | | | $ | — | | | $ | 580,302,007 | |
| Short-Term Investment | | | 239,222 | | | | — | | | | — | | | | 239,222 | |
| Repurchase Agreement | | | — | | | | 783,762 | | | | — | | | | 783,762 | |
| Total Investments in Securities | | $ | 580,541,229 | | | $ | 783,762 | | | $ | — | | | $ | 581,324,991 | |
Amounts designated as “—” are $0 or have been rounded to $0.
See “Glossary” for abbreviations.
The accompanying notes are an integral part of the financial statements.
122
| Schedule of Investments | | November 30, 2023 |
| | | |
| | Global X Cannabis ETF | |
Sector Weightings (Unaudited)†:

† Sector weightings percentages are based on the total market value of investments. Total investments do not include derivatives such as options, futures contracts, forward contracts, and swap contracts, if applicable.
| | | Shares | | | Value | |
| COMMON STOCK — 98.4% | | | | | | | | |
| CANADA — 54.3% | | | | | | | | |
| Consumer Staples — 4.1% | | | | | | | | |
| Flora Growth *(A) | | | 1,013,509 | | | $ | 1,165,535 | |
| | | | | | | | | |
| Health Care — 50.2% | | | | | | | | |
| Aurora Cannabis * | | | 2,692,243 | | | | 1,238,432 | |
| Canopy Growth * (B) | | | 2,197,230 | | | | 1,215,417 | |
| Cronos Group * | | | 693,793 | | | | 1,412,301 | |
| Organigram Holdings * (B) | | | 1,184,323 | | | | 1,537,344 | |
| SNDL * (B) | | | 3,019,296 | | | | 4,317,593 | |
| Tilray Brands * (B) | | | 2,513,220 | | | | 4,548,928 | |
| | | | | | | | 14,270,015 | |
| TOTAL CANADA | | | | | | | 15,435,550 | |
| ISRAEL — 10.2% | | | | | | | | |
| Health Care — 5.0% | | | | | | | | |
| Intercure * | | | 1,177,368 | | | | 1,436,389 | |
| | | | | | | | | |
| Information Technology — 5.2% | | | | | | | | |
| BYND Cannasoft Enterprises * | | | 1,667,620 | | | | 1,467,506 | |
| | | | | | | | | |
| TOTAL ISRAEL | | | | | | | 2,903,895 | |
The accompanying notes are an integral part of the financial statements.
123
| Schedule of Investments | | November 30, 2023 |
| | | |
| | Global X Cannabis ETF | |
| | | Shares | | | Value | |
| COMMON STOCK — continued | | | | | | | | |
| UNITED STATES — 33.9% | | | | | | | | |
| Financials — 4.6% | | | | | | | | |
| AFC Gamma ‡ | | | 115,686 | | | $ | 1,313,036 | |
| | | | | | | | | |
| Health Care — 8.8% | | | | | | | | |
| Bright Green * | | | 3,430,374 | | | | 941,981 | |
| Incannex Healthcare * | | | 81,747 | | | | 653,159 | |
| MyMD Pharmaceuticals *(A) | | | 3,165,264 | | | | 886,274 | |
| | | | | | | | 2,481,414 | |
| Information Technology — 3.3% | | | | | | | | |
| WM Technology * | | | 1,126,937 | | | | 937,386 | |
| | | | | | | | | |
| Real Estate — 17.2% | | | | | | | | |
| Innovative Industrial Properties, Cl A ‡ | | | 59,902 | | | | 4,891,597 | |
| | | | | | | | | |
| TOTAL UNITED STATES | | | | | | | 9,623,433 | |
TOTAL COMMON STOCK
(Cost $49,443,808) | | | | | | | 27,962,878 | |
| | | | | | | | |
| | | Face Amount | | | | | |
| U.S. TREASURY OBLIGATION — 7.0% | | | | | | | | |
| U.S. Treasury Bill | | | | | | | | |
| 5.312%, 01/02/24(C) | | $ | 2,000,000 | | | | 1,990,613 | |
TOTAL U.S. TREASURY OBLIGATION
(Cost $1,991,771) | | | | | | | 1,990,613 | |
| | | | | | | | | |
| REPURCHASE AGREEMENTS(D) — 9.7% | | | | | | | | |
Bank of America
5.320%, dated 11/30/2023, to be repurchased on 12/01/2023, repurchase price $179,035 (collateralized by various U.S. Government Obligations, ranging in par value $19 - $63,143, 1.500% - 7.000%, 08/01/2027 – 09/20/2063, with total market value $182,589) | | | 179,009 | | | | 179,009 | |
The accompanying notes are an integral part of the financial statements.
124
| Schedule of Investments | | November 30, 2023 |
| | | |
| | Global X Cannabis ETF | |
| | | Face Amount | | | Value | |
| REPURCHASE AGREEMENTS — continued | | | | | | | | |
Daiwa Capital Markets
5.340%, dated 11/30/2023, to be repurchased on 12/01/2023, repurchase price $650,280 (collateralized by various U.S. Government obligations and U.S. Treasury Obligations, ranging in par value $41 - $89,826, 0.000% - 7.000%, 01/25/2024 - 12/01/2053, with a total market value $663,224) | | $ | 650,184 | | | $ | 650,184 | |
Deutsche Bank Securities
5.320%, dated 11/30/2023, to be repurchased on 12/01/2023, repurchase price $650,280 (collateralized by various U.S. Government Obligations, ranging in par value $1,951 - $196,443, 2.500% - 7.500%, 06/01/2042 - 11/01/2053, with a total market value $663,188) | | | 650,184 | | | | 650,184 | |
HSBC Securities
5.320%, dated 11/30/2023, to be repurchased on 12/01/2023, repurchase price $637,274 (collateralized by various U.S. Government Obligations and U.S. Treasury Obligations, ranging in par value $6,372 - $754,431, 0.000% - 7.500%, 11/15/2031 - 10/20/2073, with a total market value $649,924) | | | 637,180 | | | | 637,180 | |
RBC Dominion Securities
5.320%, dated 11/30/2023, to be repurchased on 12/01/2023, repurchase price $650,280 (collateralized by various U.S. Government Obligations and U.S. Treasury Obligations, ranging in par value $38 - $170,421, 0.000% - 6.500%, 12/14/2023 - 09/01/2053, with a total market value $663,188) | | | 650,184 | | | | 650,184 | |
TOTAL REPURCHASE AGREEMENTS
(Cost $2,766,741) | | | | | | | 2,766,741 | |
TOTAL INVESTMENTS — 115.1%
(Cost $54,202,320) | | | | | | $ | 32,720,232 | |
Percentages are based on Net Assets of $28,423,694.
The accompanying notes are an integral part of the financial statements.
125
| Schedule of Investments | | November 30, 2023 |
| | | |
| | Global X Cannabis ETF | |
| * | Non-income producing security. |
| ‡ | Real Estate Investment Trust |
| (A) | Affiliated investment. |
| (B) | This security or a partial position of this security is on loan at November 30, 2023. The total market value of securities on loan at November 30, 2023 was $2,101,655. |
| (C) | Interest rate represents the security’s effective yield at the time of purchase. |
| (D) | These securities were purchased with cash collateral held from securities on loan. The total value of such securities as of November 30, 2023 was $2,766,741. The total value of non-cash collateral held from securities on loan as of November 30, 2023 was $–. |
The following is a summary of the level of inputs used as of November 30, 2023, in valuing the Fund’s investments carried at value:
| Investments in Securities | | Level 1 | | | Level 2 | | | Level 3 | | | Total | |
| Common Stock | | $ | 27,962,878 | | | $ | — | | | $ | — | | | $ | 27,962,878 | |
| U.S. Treasury Obligation | | | — | | | | 1,990,613 | | | | — | | | | 1,990,613 | |
| Repurchase Agreements | | | — | | | | 2,766,741 | | | | — | | | | 2,766,741 | |
| Total Investments in Securities | | $ | 27,962,878 | | | $ | 4,757,354 | | | $ | — | | | $ | 32,720,232 | |
The following is a summary of the transactions with affiliates for the year ended November 30, 2023:
Value at
11/30/22 | | | Purchases at
Cost | | | Proceeds from
Sales | | | Changes in
Unrealized
Appreciation
(Depreciation) | | | Realized Gain
(Loss) | | | Value at
11/30/23 | | | Dividend
Income | | | Capital Gain | |
| Flora Growth | | | | | | | | | | | | | | | | | | | | | | | | | | |
| $ | 592,812 | | | $ | 3,117,592 | | | $ | (185,372 | ) | | $ | (1,175,559 | ) | | $ | (1,183,938 | ) | | $ | 1,165,535 | | | $ | - | | | $ | - | |
| MyMD Pharmaceuticals | | | | | | | | | | | | | | | | | | | | | | | | |
| | 1,320,594 | | | | 1,631,038 | | | | (224,134 | ) | | | (801,991 | ) | | | (1,039,233 | ) | | | 86,274 | | | | - | | | | - | |
| Totals: | | | | | | | | | | | | | | | | | | | | | | | | | | | | |
| $ | 1,913,406 | | | $ | 4,748,630 | | | $ | (409,506 | ) | | $ | (1,977,550 | ) | | $ | (2,223,171 | ) | | $ | 2,051,809 | | | $ | - | | | $ | - | |
Amounts designated as “—” are $0 or have been rounded to $0.
See “Glossary” for abbreviations.
The accompanying notes are an integral part of the financial statements.
126
| Schedule of Investments | November 30, 2023 |
| Global X Thematic Growth ETF |
| |
Sector Weightings (Unaudited)†:

† Sector weightings percentages are based on the total market value of investments. Total investments do not include derivatives such as options, futures contracts, forward contracts, and swap contracts, if applicable.
| | | Shares | | | Value | |
| EXCHANGE TRADED FUNDS — 99.9% | | | | | | | | |
| Global X Cannabis ETF(A) | | | 560,343 | | | $ | 3,042,663 | |
| Global X Data Center REITs & Digital Infrastructure ETF(A) | | | 297,561 | | | | 4,264,049 | |
| Global X Disruptive Materials ETF(A) | | | 231,283 | | | | 3,261,090 | |
| Global X FinTech ETF(A) | | | 183,981 | | | | 4,106,456 | |
| Global X Genomics & Biotechnology ETF(A) | | | 355,392 | | | | 3,701,656 | |
| Global X Lithium & Battery Tech ETF(A) (B) | | | 66,898 | | | | 3,189,028 | |
| Global X Renewable Energy Producers ETF(A) | | | 353,747 | | | | 3,671,894 | |
| Global X Solar ETF(A) | | | 257,008 | | | | 3,017,274 | |
| Global X Video Games & Esports ETF (A) | | | 201,161 | | | | 3,982,988 | |
TOTAL EXCHANGE TRADED FUNDS
(Cost $58,411,426) | | | | | | | 32,237,098 | |
| | | | | | | | | |
| | | Face Amount | | | | | |
| REPURCHASE AGREEMENTS(C) — 1.6% | | | | | | | | |
Citigroup Global Markets Securities
5.320%, dated 11/30/2023, to be repurchased on 12/01/2023, repurchase price $34,399 (collateralized by various U.S. Government Obligations, ranging in par value $295 - $10,406, 2.000% - 7.028%, 11/20/2043 – 01/20/2072, with total market value $35,082) | | $ | 34,394 | | | | 34,394 | |
Daiwa Capital Markets
5.340%, dated 11/30/2023, to be repurchased on 12/01/2023, repurchase price $249,037 (collateralized by various U.S. Government Obligations and U.S. Treasury Obligations, ranging in par value $16 - $34,401, 0.000% - 7.000%, 01/25/2024 - 12/01/2053, with a total market value $253,994) | | | 249,000 | | | | 249,000 | |
The accompanying notes are an integral part of the financial statements.
127
| Schedule of Investments | November 30, 2023 |
| Global X Thematic Growth ETF |
| |
| | | Face Amount | | | Value | |
| REPURCHASE AGREEMENTS — continued | | | | | | | | |
RBC Dominion Securities
5.320%, dated 11/30/2023, to be repurchased on 12/01/2023, repurchase price $249,037 (collateralized by various U.S. Government Obligations and U.S. Treasury Obligations, ranging in par value $15 - $65,266, 0.000% - 6.500%, 12/14/2023 - 09/01/2053, with a total market value $253,980) | | $ | 249,000 | | | $ | 249,000 | |
| | | | | | | | | |
TOTAL REPURCHASE AGREEMENTS
(Cost $532,394) | | | | | | | 532,394 | |
TOTAL INVESTMENTS — 101.5%
(Cost $58,943,820) | | | | | | $ | 32,769,492 | |
Percentages are based on Net Assets of $32,269,888.
| (A) | Affiliated investment. |
| (B) | This security or a partial position of this security is on loan at November 30, 2023. The total market value of securities on loan at November 30, 2023 was $519,603. |
| (C) | These securities were purchased with cash collateral held from securities on loan. The total value of such securities as of November 30, 2023 was $532,394. The total value of non-cash collateral held from securities on loan as of November 30, 2023 was $–. |
The following is a summary of the level of inputs used as of November 30, 2023, in valuing the Fund’s investments carried at value:
| Investments in Securities | | Level 1 | | | Level 2 | | | Level 3 | | | Total | |
| Exchange Traded Funds | | $ | 32,237,098 | | | $ | — | | | $ | — | | | $ | 32,237,098 | |
| Repurchase Agreements | | | — | | | | 532,394 | | | | — | | | | 532,394 | |
| Total Investments in Securities | | $ | 32,237,098 | | | $ | 532,394 | | | $ | — | | | $ | 32,769,492 | |
The accompanying notes are an integral part of the financial statements.
128
| Schedule of Investments | November 30, 2023 |
| Global X Thematic Growth ETF |
| |
The following is a summary of the transactions with affiliates for the year ended November 30, 2023:
Value at
11/30/22 | | | Purchases at
Cost | | | Proceeds from
Sales | | | Changes in
Unrealized
Appreciation
(Depreciation) | | | Realized Gain
(Loss) | | | Value at
11/30/23 | | | Dividend
Income | | | Capital Gain | |
| Global X Cannabis ETF | | | | | | | | | | | | | | | | | | | | | | | | | |
| $ | 7,421,653 | | | $ | 2,895,135 | | | $ | (2,447,665 | ) | | $ | (2,002,323 | ) | | $ | (2,824,137 | ) | | $ | 3,042,663 | | | $ | 111,651 | | | $ | 1,088 | |
| Global X Data Center REITs & Digital Infrastructure ETF | | | | | | | | | | | | | | | | | | | | | |
| | 3,870,478 | | | | 2,396,516 | | | | (2,312,363 | ) | | | 332,024 | | | | (22,606 | ) | | | 4,264,049 | | | | 92,896 | | | | 2,994 | |
| Global X Disruptive Materials ETF | | | | | | | | | | | | | | | | | | | | | | | | | |
| | — | | | | 4,376,861 | | | | (394,183 | ) | | | (674,030 | ) | | | (47,558 | ) | | | 3,261,090 | | | | — | | | | — | |
| Global X FinTech ETF | | | | | | | | | | | | | | | | | | | | | | | | | |
| | 3,581,922 | | | | 2,510,223 | | | | (2,303,995 | ) | | | 1,002,421 | | | | (684,115 | ) | | | 4,106,456 | | | | (9,246 | ) | | | 12,883 | |
| Global X Genomics & Biotechnology ETF | | | | | | | | | | | | | | | | | | | | | | | | | |
| | 4,046,936 | | | | 2,982,709 | | | | (2,261,735 | ) | | | (685,884 | ) | | | (380,370 | ) | | | 3,701,656 | | | | — | | | | — | |
| Global X Lithium & Battery Tech ETF | | | | | | | | | | | | | | | | | | | | | | | | | |
| | 8,163,639 | | | | 2,051,009 | | | | (5,110,826 | ) | | | (915,128 | ) | | | (999,666 | ) | | | 3,189,028 | | | | 73,446 | | | | — | |
| Global X Renewable Energy Producers ETF | | | | | | | | | | | | | | | | | | | | | | | | | |
| | 8,267,442 | | | | 1,950,219 | | | | (4,957,275 | ) | | | (680,199 | ) | | | (908,293 | ) | | | 3,671,894 | | | | 64,218 | | | | — | |
| Global X Solar ETF | | | | | | | | | | | | | | | | | | | | | | | | | |
| | — | | | | 4,264,904 | | | | (370,313 | ) | | | (823,467 | ) | | | (53,850 | ) | | | 3,017,274 | | | | — | | | | — | |
| Global X Video Games & Esports ETF | | | | | | | | | | | | | | | | | | | | | | | | | |
| | — | | | | 4,437,882 | | | | (458,591 | ) | | | (5,488 | ) | | | 9,185 | | | | 3,982,988 | | | | — | | | | — | |
| Totals: | | | | | | | | | | | | | | | | | | | | | | | | | |
| $ | 35,352,070 | | | $ | 27,865,458 | | | $ | (20,616,946 | ) | | $ | (4,452,074 | ) | | $ | (5,911,410 | ) | | $ | 32,237,098 | | | $ | 332,965 | | | $ | 16,965 | |
Amounts designated as “—” are $0 or have been rounded to $0.
See “Glossary” for abbreviations.
The accompanying notes are an integral part of the financial statements.
129
| Schedule of Investments | November 30, 2023 |
| Global X Video Games & Esports ETF |
| |
Sector Weightings (Unaudited)†:

† Sector weightings percentages are based on the total market value of investments. Total investments do not include derivatives such as options, futures contracts, forward contracts, and swap contracts, if applicable.
| | | Shares | | | Value | |
| COMMON STOCK — 99.8% | | | | | | | | |
| CHINA — 12.2% | | | | | | | | |
| Communication Services — 12.2% | | | | | | | | |
| Archosaur Games * (A) | | | 725,600 | | | $ | 182,090 | |
| Bilibili ADR * (A) | | | 415,238 | | | | 4,704,647 | |
| HUYA ADR * | | | 141,629 | | | | 480,122 | |
| iDreamSky Technology Holdings * | | | 1,142,000 | | | | 361,156 | |
| NetEase ADR | | | 86,741 | | | | 9,843,369 | |
| XD * | | | 388,700 | | | | 627,072 | |
| | | | | | | | | |
| TOTAL CHINA | | | | | | | 16,198,456 | |
| FRANCE — 2.8% | | | | | | | | |
| Communication Services — 2.8% | | | | | | | | |
| Ubisoft Entertainment * | | | 128,564 | | | | 3,665,402 | |
| | | | | | | | | |
| IRELAND — 1.5% | | | | | | | | |
| Information Technology — 1.5% | | | | | | | | |
| Keywords Studios | | | 112,744 | | | | 1,952,524 | |
| | | | | | | | | |
| JAPAN — 28.2% | | | | | | | | |
| Communication Services — 28.2% | | | | | | | | |
| Capcom | | | 169,490 | | | | 5,712,914 | |
| DeNA | | | 106,868 | | | | 1,087,222 | |
| Gumi (A) | | | 89,066 | | | | 250,627 | |
| GungHo Online Entertainment * | | | 59,070 | | | | 915,808 | |
| Koei Tecmo Holdings | | | 167,267 | | | | 2,048,479 | |
| Konami Group | | | 127,853 | | | | 6,326,274 | |
| Nexon | | | 344,996 | | | | 7,463,031 | |
| Nintendo | | | 200,694 | | | | 9,383,414 | |
The accompanying notes are an integral part of the financial statements.
130
| Schedule of Investments | November 30, 2023 |
| Global X Video Games & Esports ETF |
| |
| | | Shares | | | Value | |
| COMMON STOCK — continued | | | | | | | | |
| Communication Services — continued | | | | | | | | |
| Square Enix Holdings | | | 120,343 | | | $ | 4,177,632 | |
| | | | | | | | | |
| TOTAL JAPAN | | | | | | | 37,365,401 | |
| POLAND — 1.9% | | | | | | | | |
| Communication Services — 1.9% | | | | | | | | |
| CD Projekt (A) | | | 93,672 | | | | 2,555,278 | |
| | | | | | | | | |
| SINGAPORE — 0.4% | | | | | | | | |
| Communication Services — 0.4% | | | | | | | | |
| IGG * | | | 1,112,400 | | | | 470,010 | |
| | | | | | | | | |
| SOUTH KOREA — 14.6% | | | | | | | | |
| Communication Services — 14.6% | | | | | | | | |
| Com2uS Holdings * | | | 15,953 | | | | 431,546 | |
| Com2uSCorp | | | 11,470 | | | | 439,632 | |
| Devsisters * | | | 14,574 | | | | 553,522 | |
| JoyCity * | | | 162,093 | | | | 344,879 | |
| Kakao Games * | | | 53,946 | | | | 1,101,792 | |
| Krafton * | | | 40,535 | | | | 6,692,210 | |
| NCSoft | | | 23,190 | | | | 4,709,359 | |
| Neowiz * | | | 17,402 | | | | 358,790 | |
| Netmarble * | | | 31,803 | | | | 1,464,247 | |
| Nexon Games * | | | 30,000 | | | | 368,097 | |
| Pearl Abyss * | | | 41,215 | | | | 1,207,555 | |
| Wemade | | | 26,682 | | | | 1,108,519 | |
| Wemade Max * | | | 56,217 | | | | 529,424 | |
| | | | | | | | | |
| TOTAL SOUTH KOREA | | | | | | | 19,309,572 | |
| SWEDEN — 3.3% | | | | | | | | |
| Communication Services — 3.3% | | | | | | | | |
| Embracer Group, Cl B * (A) | | | 1,054,790 | | | | 2,319,685 | |
| Enad Global 7 * | | | 173,708 | | | | 295,402 | |
| Modern Times Group MTG, Cl B * | | | 129,246 | | | | 1,044,689 | |
| Stillfront Group * | | | 667,694 | | | | 743,911 | |
| | | | | | | | | |
| TOTAL SWEDEN | | | | | | | 4,403,687 | |
The accompanying notes are an integral part of the financial statements.
131
| Schedule of Investments | November 30, 2023 |
| Global X Video Games & Esports ETF |
| |
| | | Shares | | | Value | |
| COMMON STOCK — continued | | | | | | | | |
| TAIWAN — 3.5% | | | | | | | | |
| Communication Services — 3.5% | | | | | | | | |
| Gamania Digital Entertainment | | | 177,200 | | | $ | 435,626 | |
| International Games System | | | 164,000 | | | | 3,496,287 | |
| Soft-World International | | | 141,800 | | | | 721,709 | |
| | | | | | | | | |
| TOTAL TAIWAN | | | | | | | 4,653,622 | |
| UNITED STATES — 31.4% | | | | | | | | |
| Communication Services — 21.0% | | | | | | | | |
| Electronic Arts | | | 66,667 | | | | 9,200,713 | |
| Playtika Holding * | | | 73,895 | | | | 642,147 | |
| ROBLOX, Cl A * | | | 207,247 | | | | 8,146,880 | |
| Skillz, Cl A * (A) | | | 39,092 | | | | 232,991 | |
| Take-Two Interactive Software * | | | 60,339 | | | | 9,545,630 | |
| | | | | | | | 27,768,361 | |
| Consumer Discretionary — 0.2% | | | | | | | | |
| Inspired Entertainment * | | | 35,618 | | | | 279,957 | |
| | | | | | | | | |
| Information Technology — 10.2% | | | | | | | | |
| AppLovin, Cl A * | | | 220,836 | | | | 8,276,933 | |
| Corsair Gaming * | | | 62,159 | | | | 802,473 | |
| Unity Software * (A) | | | 149,928 | | | | 4,424,375 | |
| | | | | | | | 13,503,781 | |
| TOTAL UNITED STATES | | | | | | | 41,552,099 | |
TOTAL COMMON STOCK
(Cost $208,001,048) | | | | | | | 132,126,051 | |
| | | | | | | | |
| | | Face Amount | | | | | |
| REPURCHASE AGREEMENTS(B) — 5.6% | | | | | | | | |
Bank of America
5.320%, dated 11/30/2023, to be repurchased on 12/01/2023, repurchase price $443,462 (collateralized by various U.S. Government Obligations, ranging in par value $47 - $156,402, 1.500% - 7.000%, 08/01/2027 – 09/20/2063, with total market value $452,264) | | $ | 443,396 | | | | 443,396 | |
The accompanying notes are an integral part of the financial statements.
132
| Schedule of Investments | November 30, 2023 |
| Global X Video Games & Esports ETF |
| |
| | | Face Amount | | | Value | |
| REPURCHASE AGREEMENTS — continued | | | | | | | | |
Citigroup Global Markets Securities
5.320%, dated 11/30/2023, to be repurchased on 12/01/2023, repurchase price $1,736,880 (collateralized by various U.S. Government Obligations, ranging in par value $14,919 - $525,419, 2.000% - 7.028%, 11/20/2043 - 01/20/2072, with a total market value $1,771,355) | | $ | 1,736,623 | | | $ | 1,736,623 | |
Daiwa Capital Markets
5.340%, dated 11/30/2023, to be repurchased on 12/01/2023, repurchase price $1,736,881 (collateralized by various U.S. Government obligations and U.S. Treasury Obligations, ranging in par value $109 - $239,924, 0.000% - 7.000%, 01/25/2024 - 12/01/2053, with a total market value $1,771,451) | | | 1,736,623 | | | | 1,736,623 | |
Deutsche Bank Securities
5.320%, dated 11/30/2023, to be repurchased on 12/01/2023, repurchase price $1,736,880 (collateralized by various U.S. Government Obligations, ranging in par value $5,210 - $524,693, 2.500% - 7.500%, 06/01/2042 - 11/01/2053, with a total market value $1,771,355) | | | 1,736,623 | | | | 1,736,623 | |
RBC Dominion Securities
5.320%, dated 11/30/2023, to be repurchased on 12/01/2023, repurchase price $1,736,880 (collateralized by various U.S. Government Obligations and U.S. Treasury Obligations, ranging in par value $101 - $455,190, 0.000% - 6.500%, 12/14/2023 - 09/01/2053, with a total market value $1,771,356) | | | 1,736,623 | | | | 1,736,623 | |
TOTAL REPURCHASE AGREEMENTS
(Cost $7,389,888) | | | | | | | 7,389,888 | |
TOTAL INVESTMENTS — 105.4%
(Cost $215,390,936) | | | | | | $ | 139,515,939 | |
Percentages are based on Net Assets of $132,339,112.
The accompanying notes are an integral part of the financial statements.
133
| Schedule of Investments | November 30, 2023 |
| Global X Video Games & Esports ETF |
| |
| * | Non-income producing security. |
| (A) | This security or a partial position of this security is on loan at November 30, 2023. The total market value of securities on loan at November 30, 2023 was $7,200,617. |
| (B) | These securities were purchased with cash collateral held from securities on loan. The total value of such securities as of November 30, 2023 was $7,389,888. The total value of non-cash collateral held from securities on loan as of November 30, 2023 was $97,644. |
The following is a summary of the level of inputs used as of November 30, 2023, in valuing the Fund’s investments carried at value:
| Investments in Securities | | Level 1 | | | Level 2 | | | Level 3 | | | Total | |
| Common Stock | | $ | 132,126,051 | | | $ | — | | | $ | — | | | $ | 132,126,051 | |
| Repurchase Agreements | | | — | | | | 7,389,888 | | | | — | | | | 7,389,888 | |
| Total Investments in Securities | | $ | 132,126,051 | | | $ | 7,389,888 | | | $ | — | | | $ | 139,515,939 | |
Amounts designated as “—” are $0 or have been rounded to $0.
See “Glossary” for abbreviations.
The accompanying notes are an integral part of the financial statements.
134
| Schedule of Investments | November 30, 2023 |
| Global X Cybersecurity ETF |
| |
Sector Weightings (Unaudited)†:

† Sector weightings percentages are based on the total market value of investments. Total investments do not include derivatives such as options, futures contracts, forward contracts, and swap contracts, if applicable.
| | | Shares | | | Value | |
| COMMON STOCK — 99.9% | | | | | | | | |
| CANADA — 3.9% | | | | | | | | |
| Information Technology — 3.9% | | | | | | | | |
| BlackBerry * | | | 6,777,295 | | | $ | 24,872,673 | |
| | | | | | | | | |
| ISRAEL — 9.2% | | | | | | | | |
| Information Technology — 9.2% | | | | | | | | |
| Check Point Software Technologies * | | | 245,561 | | | | 35,851,906 | |
| Radware * | | | 1,571,023 | | | | 23,958,101 | |
| | | | | | | | | |
| TOTAL ISRAEL | | | | | | | 59,810,007 | |
| JAPAN — 9.1% | | | | | | | | |
| Information Technology — 9.1% | | | | | | | | |
| Digital Arts | | | 492,638 | | | | 16,045,266 | |
| Hennge * | | | 1,127,156 | | | | 9,416,158 | |
| Trend Micro (A) | | | 658,283 | | | | 33,458,508 | |
| | | | | | | | | |
| TOTAL JAPAN | | | | | | | 58,919,932 | |
| SOUTH KOREA — 2.9% | | | | | | | | |
| Information Technology — 2.9% | | | | | | | | |
| Ahnlab | | | 351,021 | | | | 18,800,567 | |
| | | | | | | | | |
| UNITED KINGDOM — 4.2% | | | | | | | | |
| Information Technology — 4.2% | | | | | | | | |
| Arqit Quantum * | | | 3,447,744 | | | | 1,698,014 | |
| Darktrace * | | | 5,830,774 | | | | 25,606,333 | |
| | | | | | | | | |
| TOTAL UNITED KINGDOM | | | | | | | 27,304,347 | |
| UNITED STATES — 70.6% | | | | | | | | |
| Information Technology — 70.6% | | | | | | | | |
| A10 Networks | | | 2,311,375 | | | | 28,869,074 | |
| Crowdstrike Holdings, Cl A * | | | 183,490 | | | | 43,485,295 | |
The accompanying notes are an integral part of the financial statements.
135
| Schedule of Investments | November 30, 2023 |
| Global X Cybersecurity ETF |
| |
| | | Shares | | | Value | |
| COMMON STOCK — continued | | | | | | | | |
| Information Technology — continued | | | | | | | | |
| CyberArk Software * | | | 144,943 | | | $ | 28,882,792 | |
| Fortinet * | | | 582,262 | | | | 30,603,691 | |
| Gen Digital | | | 1,953,515 | | | | 43,133,611 | |
| Okta, Cl A * | | | 369,840 | | | | 24,797,772 | |
| OneSpan * | | | 1,386,454 | | | | 13,906,134 | |
| Palo Alto Networks * | | | 133,960 | | | | 39,530,256 | |
| Qualys * | | | 164,670 | | | | 30,437,603 | |
| Rapid7 * | | | 533,465 | | | | 28,887,130 | |
| SentinelOne, Cl A * | | | 1,659,881 | | | | 31,687,128 | |
| Telos * | | | 2,411,540 | | | | 9,911,429 | |
| Tenable Holdings * | | | 711,768 | | | | 29,460,077 | |
| Varonis Systems, Cl B * | | | 754,264 | | | | 31,596,119 | |
| Zscaler * | | | 210,712 | | | | 41,621,941 | |
| | | | | | | | | |
| TOTAL UNITED STATES | | | | | | | 456,810,052 | |
TOTAL COMMON STOCK
(Cost $743,242,888) | | | | | | | 646,517,578 | |
| | | | | | | | |
| | | Face Amount | | | | | |
| REPURCHASE AGREEMENTS(B) — 2.1% | | | | | | | | |
Bank of America
5.320%, dated 11/30/2023, to be repurchased on 12/01/2023, repurchase price $3,228,495 (collateralized by various U.S. Government Obligations, ranging in par value $344 - $1,138,642, 1.500% - 7.000%, 08/01/2027 – 09/20/2063, with total market value $3,292,578) | | $ | 3,228,018 | | | | 3,228,018 | |
Daiwa Capital Markets
5.340%, dated 11/30/2023, to be repurchased on 12/01/2023, repurchase price $3,228,497 (collateralized by various U.S. Government obligations and U.S. Treasury Obligations, ranging in par value $203 - $445,968, 0.000% - 7.000%, 01/25/2024 - 12/01/2053, with a total market value $3,292,756) | | | 3,228,018 | | | | 3,228,018 | |
The accompanying notes are an integral part of the financial statements.
136
| Schedule of Investments | November 30, 2023 |
| Global X Cybersecurity ETF |
| |
| | | Face Amount | | | Value | |
| REPURCHASE AGREEMENTS — continued | | | | | | | | |
Deutsche Bank Securities
5.320%, dated 11/30/2023, to be repurchased on 12/01/2023, repurchase price $3,228,495 (collateralized by various U.S. Government Obligations, ranging in par value $9,684 - $975,293, 2.500% - 7.500%, 06/01/2042 - 11/01/2053, with a total market value $3,292,578) | | $ | 3,228,018 | | | $ | 3,228,018 | |
Nomura Securities International
5.310%, dated 11/30/2023, to be repurchased on 12/01/2023, repurchase price $824,297 (collateralized by various U.S. Government Obligations and U.S. Treasury Obligations, ranging in par value $515 - $238,619, 2.000% - 6.500%, 11/01/2029 - 06/01/2062, with a total market value $840,660) | | | 824,175 | | | | 824,175 | |
RBC Dominion Securities
5.320%, dated 11/30/2023, to be repurchased on 12/01/2023, repurchase price $3,228,495 (collateralized by various U.S. Government Obligations and U.S. Treasury Obligations, ranging in par value $188 - $846,102, 0.000% - 6.500%, 12/14/2023 - 09/01/2053, with a total market value $3,292,578) | | | 3,228,018 | | | | 3,228,018 | |
TOTAL REPURCHASE AGREEMENTS
(Cost $13,736,247) | | | | | | | 13,736,247 | |
TOTAL INVESTMENTS — 102.0%
(Cost $756,979,135) | | | | | | $ | 660,253,825 | |
Percentages are based on Net Assets of $647,551,244.
| * | Non-income producing security. |
| (A) | This security or a partial position of this security is on loan at November 30, 2023. The total market value of securities on loan at November 30, 2023 was $13,011,695. |
| (B) | These securities were purchased with cash collateral held from securities on loan. The total value of such securities as of November 30, 2023 was $13,736,247. The total value of non-cash collateral held from securities on loan as of November 30, 2023 was $–. |
The accompanying notes are an integral part of the financial statements.
137
| Schedule of Investments | November 30, 2023 |
| Global X Cybersecurity ETF |
| |
The following is a summary of the level of inputs used as of November 30, 2023, in valuing the Fund’s investments carried at value:
| Investments in Securities | | Level 1 | | | Level 2 | | | Level 3 | | | Total | |
| Common Stock | | $ | 646,517,578 | | | $ | — | | | $ | — | | | $ | 646,517,578 | |
| Repurchase Agreements | | | — | | | | 13,736,247 | | | | — | | | | 13,736,247 | |
| Total Investments in Securities | | $ | 646,517,578 | | | $ | 13,736,247 | | | $ | — | | | $ | 660,253,825 | |
Amounts designated as “—” are $0 or have been rounded to $0.
See “Glossary” for abbreviations.
The accompanying notes are an integral part of the financial statements.
138
| Schedule of Investments | | November 30, 2023 |
| Global X Telemedicine & Digital Health ETF |
Sector Weightings (Unaudited)†:

† Sector weightings percentages are based on the total market value of investments. Total investments do not include derivatives such as options, futures contracts, forward contracts, and swap contracts, if applicable.
| | | Shares | | | Value | |
| COMMON STOCK — 99.9% | | | | | | | | |
| CHINA — 10.6% | | | | | | | | |
| Consumer Staples — 10.6% | | | | | | | | |
| Alibaba Health Information Technology * | | | 4,377,100 | | | $ | 2,488,294 | |
| JD Health International * | | | 569,150 | | | | 2,714,472 | |
| Ping An Healthcare and Technology * | | | 750,400 | | | | 1,677,526 | |
| | | | | | | | | |
| TOTAL CHINA | | | | | | | 6,880,292 | |
| GERMANY — 2.3% | | | | | | | | |
| Health Care — 2.3% | | | | | | | | |
| CompuGroup Medical | | | 38,493 | | | | 1,484,264 | |
| | | | | | | | | |
| JAPAN — 3.4% | | | | | | | | |
| Health Care — 3.4% | | | | | | | | |
| JMDC | | | 44,860 | | | | 1,309,068 | |
| Medley * | | | 29,125 | | | | 871,770 | |
| | | | | | | | | |
| TOTAL JAPAN | | | | | | | 2,180,838 | |
| SOUTH KOREA — 0.5% | | | | | | | | |
| Health Care — 0.5% | | | | | | | | |
| Genomictree * | | | 24,092 | | | | 311,666 | |
| | | | | | | | | |
| UNITED STATES — 83.1% | | | | | | | | |
| Financials — 2.8% | | | | | | | | |
| eHealth * | | | 33,689 | | | | 250,309 | |
| Oscar Health, Cl A * | | | 183,121 | | | | 1,556,529 | |
| | | | | | | | 1,806,838 | |
The accompanying notes are an integral part of the financial statements.
139
| Schedule of Investments | | November 30, 2023 |
| Global X Telemedicine & Digital Health ETF |
| | | Shares | | | Value | |
| COMMON STOCK — continued | | | | | | | | |
| Health Care — 80.3% | | | | | | | | |
| 23andMe Holding, Cl A * | | | 412,145 | | | $ | 354,651 | |
| Agilent Technologies | | | 23,714 | | | | 3,030,649 | |
| American Well, Cl A * | | | 320,591 | | | | 407,151 | |
| AMN Healthcare Services * | | | 33,305 | | | | 2,258,079 | |
| Computer Programs and Systems * | | | 19,684 | | | | 206,879 | |
| Definitive Healthcare, Cl A * | | | 64,477 | | | | 531,935 | |
| Dexcom * | | | 29,113 | | | | 3,363,134 | |
| DocGo * | | | 129,918 | | | | 734,037 | |
| Doximity, Cl A * | | | 112,767 | | | | 2,621,833 | |
| GoodRx Holdings, Cl A * | | | 106,614 | | | | 638,618 | |
| Hims & Hers Health * | | | 194,616 | | | | 1,730,136 | |
| Illumina * | | | 21,511 | | | | 2,193,046 | |
| iRhythm Technologies * | | | 32,523 | | | | 2,773,561 | |
| Laboratory Corp of America Holdings | | | 12,426 | | | | 2,695,324 | |
| LifeStance Health Group * | | | 101,762 | | | | 699,105 | |
| Masimo * | | | 29,819 | | | | 2,795,829 | |
| Omnicell * | | | 63,917 | | | | 2,132,271 | |
| Pacific Biosciences of California * | | | 349,213 | | | | 2,961,326 | |
| Phreesia * | | | 74,616 | | | | 1,149,833 | |
| Privia Health Group * | | | 111,320 | | | | 2,299,871 | |
| R1 RCM * | | | 213,317 | | | | 2,256,894 | |
| ResMed | | | 173,588 | | | | 2,801,477 | |
| Senseonics Holdings * | | | 662,186 | | | | 390,822 | |
| Sharecare * | | | 408,308 | | | | 382,830 | |
| Tandem Diabetes Care * | | | 93,141 | | | | 1,885,174 | |
| Teladoc Health * | | | 140,909 | | | | 2,556,089 | |
| Twist Bioscience * | | | 79,776 | | | | 1,918,613 | |
| Veracyte * | | | 103,659 | | | | 2,653,670 | |
| Veradigm * | | | 152,611 | | | | 1,751,974 | |
| | | | | | | | 52,174,811 | |
| TOTAL UNITED STATES | | | | | | | 53,981,649 | |
TOTAL COMMON STOCK
(Cost $151,908,389) | | | | | | | 64,838,709 | |
TOTAL INVESTMENTS — 99.9%
(Cost $151,908,389) | | | | | | $ | 64,838,709 | |
Percentages are based on Net Assets of $64,919,314.
The accompanying notes are an integral part of the financial statements.
140
| Schedule of Investments | | November 30, 2023 |
| Global X Telemedicine & Digital Health ETF |
| * | Non-income producing security. |
As of November 30, 2023, all of the Fund’s investments were considered Level 1, in accordance with authoritative guidance on fair value measurements and disclosure under U.S. GAAP.
See “Glossary” for abbreviations.
The accompanying notes are an integral part of the financial statements.
141
| Schedule of Investments | November 30, 2023 |
| Global X China Biotech Innovation ETF |
Sector Weightings (Unaudited)†:

† Sector weightings percentages are based on the total market value of investments. Total investments do not include derivatives such as options, futures contracts, forward contracts, and swap contracts, if applicable.
| | | Shares | | | Value | |
| COMMON STOCK — 100.0% | | | | | | | | |
| CHINA — 100.0% | | | | | | | | |
| Consumer Staples — 0.3% | | | | | | | | |
| Beijing Scitop Bio-tech, Cl A | | | 2,500 | | | $ | 7,229 | |
| | | | | | | | | |
| Health Care — 96.8% | | | | | | | | |
| 3SBio | | | 56,500 | | | | 52,519 | |
| Alphamab Oncology * | | | 14,100 | | | | 11,392 | |
| Ascentage Pharma Group International * | | | 6,900 | | | | 22,572 | |
| Beijing Bohui Innovation Biotechnology Group, Cl A * | | | 13,400 | | | | 12,816 | |
| Beijing SL Pharmaceutical, Cl A | | | 19,800 | | | | 31,470 | |
| Beijing Tiantan Biological Products, Cl A | | | 25,200 | | | | 113,031 | |
| Beijing Wantai Biological Pharmacy Enterprise, Cl A | | | 6,921 | | | | 47,316 | |
| BGI Genomics, Cl A | | | 8,138 | | | | 58,474 | |
| CanSino Biologics, Cl A * | | | 2,181 | | | | 25,851 | |
| Changchun BCHT Biotechnology, Cl A | | | 1,669 | | | | 14,086 | |
| Changchun High & New Technology Industry Group, Cl A | | | 8,477 | | | | 190,991 | |
| Chengdu Kanghua Biological Products, Cl A | | | 2,250 | | | | 24,680 | |
| Chengdu Olymvax Biopharmaceuticals, Cl A * | | | 5,767 | | | | 15,926 | |
| China Animal Husbandry Industry, Cl A | | | 15,600 | | | | 25,188 | |
| Chongqing Zhifei Biological Products, Cl A | | | 21,450 | | | | 195,907 | |
| CSPC Pharmaceutical Group | | | 212,300 | | | | 191,634 | |
| Daan Gene, Cl A | | | 29,980 | | | | 43,494 | |
| Frontier Biotechnologies, Cl A * | | | 5,096 | | | | 7,757 | |
| Genscript Biotech * | | | 34,450 | | | | 95,715 | |
| Getein Biotech, Cl A | | | 8,220 | | | | 13,514 | |
| Guangzhou Wondfo Biotech, Cl A | | | 7,800 | | | | 33,304 | |
The accompanying notes are an integral part of the financial statements.
142
| Schedule of Investments | | November 30, 2023 |
| Global X China Biotech Innovation ETF |
| | | Shares | | | Value | |
| COMMON STOCK — continued | | | | | | | | |
| Health Care — continued | | | | | | | | |
| Hebei Changshan Biochemical Pharmaceutical, Cl A | | | 17,000 | | | $ | 30,091 | |
| HitGen, Cl A * | | | 4,240 | | | | 9,779 | |
| Hualan Biological Engineering, Cl A | | | 29,300 | | | | 99,171 | |
| Hualan Biological Vaccine, Cl A | | | 2,350 | | | | 10,419 | |
| Jacobio Pharmaceuticals Group * | | | 11,700 | | | | 5,693 | |
| Joinn Laboratories China, Cl A | | | 10,906 | | | | 40,638 | |
| Liaoning Chengda Biotechnology, Cl A | | | 4,958 | | | | 23,467 | |
| Mabwell Shanghai Bioscience, Cl A * | | | 4,253 | | | | 17,552 | |
| Nanjing Vazyme Biotech, Cl A | | | 2,282 | | | | 12,242 | |
| Pacific Shuanglin Bio-pharmacy, Cl A | | | 4,700 | | | | 18,955 | |
| Shanghai RAAS Blood Products, Cl A | | | 101,300 | | | | 112,776 | |
| Shanghai ZJ Bio-Tech, Cl A | | | 3,685 | | | | 11,874 | |
| Shenzhen Kangtai Biological Products, Cl A | | | 17,493 | | | | 78,683 | |
| Shenzhen Weiguang Biological Products, Cl A | | | 1,500 | | | | 8,026 | |
| Sichuan Kelun Pharmaceutical, Cl A | | | 25,800 | | | | 103,619 | |
| Walvax Biotechnology, Cl A | | | 41,500 | | | | 143,777 | |
| Wuhan Keqian Biology, Cl A | | | 3,460 | | | | 9,390 | |
| Wuxi Biologics Cayman * | | | 27,850 | | | | 155,113 | |
| Xiamen Amoytop Biotech, Cl A | | | 2,925 | | | | 19,166 | |
| Zai Lab ADR * | | | 3,162 | | | | 86,291 | |
| | | | | | | | 2,224,359 | |
| Materials — 2.9% | | | | | | | | |
| Anhui Huaheng Biotechnology, Cl A | | | 3,036 | | | | 47,661 | |
| Zhejiang Huge Leaf, Cl A * | | | 50,300 | | | | 17,398 | |
| | | | | | | | 65,059 | |
| TOTAL CHINA | | | | | | | 2,296,647 | |
TOTAL COMMON STOCK
(Cost $2,963,513) | | | | | | | 2,296,647 | |
TOTAL INVESTMENTS — 100.0%
(Cost $2,963,513) | | | | | | $ | 2,296,647 | |
Percentages are based on Net Assets of $2,297,453.
| * | Non-income producing security. |
The accompanying notes are an integral part of the financial statements.
143
| Schedule of Investments | | November 30, 2023 |
| Global X China Biotech Innovation ETF |
As of November 30, 2023, all of the Fund’s investments were considered Level 1, in accordance with authoritative guidance on fair value measurements and disclosure under U.S. GAAP.
See “Glossary” for abbreviations.
The accompanying notes are an integral part of the financial statements.
144
| Schedule of Investments | November 30, 2023 |
| Global X CleanTech ETF |
Sector Weightings (Unaudited)†:

† Sector weightings percentages are based on the total market value of investments. Total investments do not include derivatives such as options, futures contracts, forward contracts, and swap contracts, if applicable.
| | | Shares | | | Value | |
| COMMON STOCK — 99.7% | | | | | | | | |
| CANADA — 3.1% | | | | | | | | |
| Industrials — 1.4% | | | | | | | | |
| Ballard Power Systems * (A) | | | 225,290 | | | $ | 790,768 | |
| | | | | | | | | |
| Information Technology — 1.7% | | | | | | | | |
| Canadian Solar * (A) | | | 48,720 | | | | 1,024,582 | |
| | | | | | | | | |
| TOTAL CANADA | | | | | | | 1,815,350 | |
| CHINA — 13.7% | | | | | | | | |
| Industrials — 3.4% | | | | | | | | |
| China Everbright Environment Group | | | 4,611,300 | | | | 1,517,361 | |
| Dongfang Electric, Cl H | | | 253,200 | | | | 226,931 | |
| Goldwind Science & Technology, Cl H | | | 597,100 | | | | 273,692 | |
| | | | | | | | 2,017,984 | |
| Information Technology — 10.3% | | | | | | | | |
| Daqo New Energy ADR * | | | 56,286 | | | | 1,331,727 | |
| Flat Glass Group, Cl H (A) | | | 334,200 | | | | 549,419 | |
| JinkoSolar Holding ADR | | | 37,768 | | | | 1,185,915 | |
| Xinyi Solar Holdings | | | 5,234,500 | | | | 3,009,219 | |
| | | | | | | | 6,076,280 | |
| TOTAL CHINA | | | | | | | 8,094,264 | |
| DENMARK — 9.3% | | | | | | | | |
| Industrials — 9.3% | | | | | | | | |
| Vestas Wind Systems * | | | 196,805 | | | | 5,459,613 | |
The accompanying notes are an integral part of the financial statements.
145
| Schedule of Investments | | November 30, 2023 |
| Global X CleanTech ETF |
| | | Shares | | | Value | |
| COMMON STOCK — continued | | | | | | | | |
| GERMANY — 7.2% | | | | | | | | |
| Industrials — 4.5% | | | | | | | | |
| Nordex * (A) | | | 177,550 | | | $ | 1,969,205 | |
| Varta * (A) | | | 31,785 | | | | 695,690 | |
| | | | | | | | 2,664,895 | |
| Information Technology — 2.7% | | | | | | | | |
| SMA Solar Technology * | | | 26,046 | | | | 1,581,499 | |
| | | | | | | | | |
| TOTAL GERMANY | | | | | | | 4,246,394 | |
| NETHERLANDS — 1.4% | | | | | | | | |
| Industrials — 1.4% | | | | | | | | |
| Alfen * (A) | | | 16,242 | | | | 820,686 | |
| | | | | | | | | |
| NORWAY — 1.5% | | | | | | | | |
| Industrials — 1.5% | | | | | | | | |
| NEL * | | | 1,247,224 | | | | 916,661 | |
| | | | | | | | | |
| SOUTH KOREA — 9.7% | | | | | | | | |
| Industrials — 3.8% | | | | | | | | |
| CS Wind | | | 31,466 | | | | 1,304,834 | |
| Doosan Fuel Cell * | | | 48,817 | | | | 919,469 | |
| | | | | | | | 2,224,303 | |
| Information Technology — 5.9% | | | | | | | | |
| Samsung SDI | | | 9,517 | | | | 3,481,784 | |
| | | | | | | | | |
| TOTAL SOUTH KOREA | | | | | | | 5,706,087 | |
| SWITZERLAND — 4.2% | | | | | | | | |
| Information Technology — 4.2% | | | | | | | | |
| Landis+Gyr Group | | | 21,725 | | | | 1,833,839 | |
| Meyer Burger Technology * (A) | | | 2,687,545 | | | | 631,746 | |
| | | | | | | | | |
| TOTAL SWITZERLAND | | | | | | | 2,465,585 | |
| TAIWAN — 4.0% | | | | | | | | |
| Information Technology — 4.0% | | | | | | | | |
| Simplo Technology | | | 145,064 | | | | 1,766,865 | |
The accompanying notes are an integral part of the financial statements.
146
| Schedule of Investments | | November 30, 2023 |
| Global X CleanTech ETF |
| | | Shares | | | Value | |
| COMMON STOCK — continued | | | | | | | | |
| Information Technology — continued | | | | | | | | |
| United Renewable Energy | | | 1,214,700 | | | $ | 575,466 | |
| | | | | | | | | |
| TOTAL TAIWAN | | | | | | | 2,342,331 | |
| UNITED KINGDOM — 5.7% | | | | | | | | |
| Industrials — 1.1% | | | | | | | | |
| Ceres Power Holdings * (A) | | | 143,564 | | | | 341,317 | |
| ITM Power * | | | 458,037 | | | | 297,348 | |
| | | | | | | | 638,665 | |
| Materials — 4.6% | | | | | | | | |
| Johnson Matthey | | | 137,582 | | | | 2,699,667 | |
| | | | | | | | | |
| TOTAL UNITED KINGDOM | | | | | | | 3,338,332 | |
| UNITED STATES — 39.9% | | | | | | | | |
| Consumer Discretionary — 3.4% | | | | | | | | |
| QuantumScape, Cl A * (A) | | | 315,289 | | | | 1,998,932 | |
| | | | | | | | | |
| Industrials — 20.2% | | | | | | | | |
| Ameresco, Cl A * (A) | | | 25,799 | | | | 772,938 | |
| Array Technologies * | | | 113,364 | | | | 1,753,741 | |
| Bloom Energy, Cl A * (A) | | | 157,675 | | | | 2,276,827 | |
| Fluence Energy, Cl A * (A) | | | 88,941 | | | | 2,230,640 | |
| FuelCell Energy * (A) | | | 340,393 | | | | 415,280 | |
| Microvast Holdings * (A) | | | 230,260 | | | | 269,404 | |
| Plug Power * (A) | | | 384,659 | | | | 1,554,022 | |
| Shoals Technologies Group, Cl A * | | | 127,550 | | | | 1,766,568 | |
| Stem * (A) | | | 116,029 | | | | 333,003 | |
| SunPower, Cl A * (A) | | | 130,736 | | | | 542,555 | |
| | | | | | | | 11,914,978 | |
| Information Technology — 16.3% | | | | | | | | |
| Enphase Energy * | | | 34,799 | | | | 3,515,395 | |
| First Solar * | | | 23,565 | | | | 3,718,086 | |
| Maxeon Solar Technologies * | | | 39,208 | | | | 161,929 | |
The accompanying notes are an integral part of the financial statements.
147
| Schedule of Investments | | November 30, 2023 |
| Global X CleanTech ETF |
| | | Shares | | | Value | |
| COMMON STOCK — continued | | | | | | | | |
| Information Technology — continued | | | | | | | | |
| SolarEdge Technologies * | | | 27,941 | | | $ | 2,217,956 | |
| | | | | | | | 9,613,366 | |
| TOTAL UNITED STATES | | | | | | | 23,527,276 | |
TOTAL COMMON STOCK
(Cost $139,007,603) | | | | | | | 58,732,579 | |
| | | | | | | | |
| | | Face Amount | | | | | |
| REPURCHASE AGREEMENTS(B) — 15.4% | | | | | | | | |
Bank of America
5.320%, dated 11/30/2023, to be repurchased on 12/01/2023, repurchase price $2,126,394 (collateralized by various U.S. Government Obligations, ranging in par value $227 - $749,948, 1.500% - 7.000%, 08/01/2027 – 09/20/2063, with total market value $2,168,602) | | $ | 2,126,080 | | | | 2,126,080 | |
Daiwa Capital Markets
5.340%, dated 11/30/2023, to be repurchased on 12/01/2023, repurchase price $2,126,395 (collateralized by various U.S. Government Obligations and U.S. Treasury Obligations, ranging in par value $134 - $293,729, 0.000% - 7.000%, 01/25/2024 - 12/01/2053, with a total market value $2,168,719) | | | 2,126,080 | | | | 2,126,080 | |
Deutsche Bank Securities
5.320%, dated 11/30/2023, to be repurchased on 12/01/2023, repurchase price $2,126,394 (collateralized by various U.S. Government Obligations, ranging in par value $6,378 - $642,361, 2.500% - 7.500%, 06/01/2042 - 11/01/2053, with a total market value $2,168,602) | | | 2,126,080 | | | | 2,126,080 | |
The accompanying notes are an integral part of the financial statements.
148
| Schedule of Investments | | November 30, 2023 |
| Global X CleanTech ETF |
| | | Face Amount | | | Value | |
| REPURCHASE AGREEMENTS — continued | | | | | | | | |
Nomura Securities International
5.310%, dated 11/30/2023, to be repurchased on 12/01/2023, repurchase price $542,909 (collateralized by various U.S. Government Obligations and U.S. Treasury Obligations, ranging in par value $339 - $157,162, 2.000% - 6.500%, 11/01/2029 - 06/01/2062, with a total market value $553,686) | | $ | 542,829 | | | $ | 542,829 | |
RBC Dominion Securities
5.320%, dated 11/30/2023, to be repurchased on 12/01/2023, repurchase price $2,126,394 (collateralized by various U.S. Government Obligations and U.S. Treasury Obligations, ranging in par value $124 - $557,271, 0.000% - 6.500%, 12/14/2023 - 09/01/2053, with a total market value $2,168,602) | | | 2,126,080 | | | | 2,126,080 | |
| | | | | | | | | |
TOTAL REPURCHASE AGREEMENTS
(Cost $9,047,149) | | | | | | | 9,047,149 | |
TOTAL INVESTMENTS — 115.1%
(Cost $148,054,752) | | | | | | $ | 67,779,728 | |
Percentages are based on Net Assets of $58,874,222.
| * | Non-income producing security. |
| (A) | This security or a partial position of this security is on loan at November 30, 2023. The total market value of securities on loan at November 30, 2023 was $10,058,238. |
| (B) | These securities were purchased with cash collateral held from securities on loan. The total value of such securities as of November 30, 2023 was $9,047,149. The total value of non-cash collateral held from securities on loan as of November 30, 2023 was $1,190,852. |
The accompanying notes are an integral part of the financial statements.
149
| Schedule of Investments | | November 30, 2023 |
| Global X CleanTech ETF |
The following is a summary of the level of inputs used as of November 30, 2023, in valuing the Fund’s investments carried at value:
| Investments in Securities | | Level 1 | | | Level 2 | | | Level 3 | | | Total | |
| Common Stock | | $ | 58,732,579 | | | $ | — | | | $ | — | | | $ | 58,732,579 | |
| Repurchase Agreements | | | — | | | | 9,047,149 | | | | — | | | | 9,047,149 | |
| Total Investments in Securities | | $ | 58,732,579 | | | $ | 9,047,149 | | | $ | — | | | $ | 67,779,728 | |
Amounts designated as “—” are $0 or have been rounded to $0.
See “Glossary” for abbreviations.
The accompanying notes are an integral part of the financial statements.
150
| Schedule of Investments | November 30, 2023 |
| Global X Data Center REITs & Digital Infrastructure ETF |
Sector Weightings (Unaudited)†:

† Sector weightings percentages are based on the total market value of investments. Total investments do not include derivatives such as options, futures contracts, forward contracts, and swap contracts, if applicable.
| | | Shares | | | Value | |
| COMMON STOCK — 99.8% | | | | | | | | |
| AUSTRALIA — 4.4% | | | | | | | | |
| Information Technology — 4.4% | | | | | | | | |
| NEXTDC * | | | 201,700 | | | $ | 1,742,598 | |
| | | | | | | | | |
| CHINA — 8.0% | | | | | | | | |
| Communication Services — 4.2% | | | | | | | | |
| China Tower, Cl H | | | 15,924,700 | | | | 1,651,538 | |
| | | | | | | | | |
| Information Technology — 3.8% | | | | | | | | |
| GDS Holdings ADR * | | | 120,925 | | | | 1,239,481 | |
| Vnet Group ADR * | | | 90,452 | | | | 253,266 | |
| | | | | | | | 1,492,747 | |
| TOTAL CHINA | | | | | | | 3,144,285 | |
| INDONESIA — 3.6% | | | | | | | | |
| Communication Services — 3.6% | | | | | | | | |
| Sarana Menara Nusantara | | | 15,343,761 | | | | 989,282 | |
| Tower Bersama Infrastructure | | | 3,100,318 | | | | 409,777 | |
| | | | | | | | | |
| TOTAL INDONESIA | | | | | | | 1,399,059 | |
| SINGAPORE — 3.5% | | | | | | | | |
| Real Estate — 3.5% | | | | | | | | |
| Keppel ‡ | | | 983,656 | | | | 1,356,157 | |
| | | | | | | | | |
| TAIWAN — 3.6% | | | | | | | | |
| Information Technology — 3.6% | | | | | | | | |
| Kinsus Interconnect Technology | | | 198,100 | | | | 627,148 | |
The accompanying notes are an integral part of the financial statements.
151
| Schedule of Investments | November 30, 2023 |
| Global X Data Center REITs & Digital Infrastructure ETF |
| | | Shares | | | Value | |
| COMMON STOCK — continued | | | | | | | | |
| Information Technology — continued | | | | | | | | |
| Winbond Electronics | | | 879,376 | | | $ | 798,025 | |
| | | | | | | | | |
| TOTAL TAIWAN | | | | | | | 1,425,173 | |
| UNITED STATES — 76.7% | | | | | | | | |
| Information Technology — 17.3% | | | | | | | | |
| Advanced Micro Devices * | | | 6,759 | | | | 818,920 | |
| Intel | | | 23,087 | | | | 1,031,989 | |
| Lam Research | | | 1,205 | | | | 862,684 | |
| Marvell Technology | | | 11,968 | | | | 666,977 | |
| Micron Technology | | | 12,116 | | | | 922,270 | |
| NVIDIA | | | 1,704 | | | | 796,961 | |
| Super Micro Computer * | | | 2,692 | | | | 736,181 | |
| Western Digital * | | | 19,907 | | | | 961,707 | |
| | | | | | | | 6,797,689 | |
| Real Estate — 59.4% | | | | | | | | |
| American Tower ‡ | | | 23,975 | | | | 5,005,500 | |
| Crown Castle ‡ | | | 40,931 | | | | 4,800,387 | |
| Digital Realty Trust ‡ | | | 29,941 | | | | 4,155,212 | |
| DigitalBridge Group | | | 112,068 | | | | 1,934,294 | |
| Equinix ‡ | | | 5,872 | | | | 4,785,739 | |
| SBA Communications, Cl A ‡ | | | 7,220 | | | | 1,783,051 | |
| Uniti Group ‡ | | | 163,309 | | | | 903,099 | |
| | | | | | | | 23,367,282 | |
| TOTAL UNITED STATES | | | | | | | 30,164,971 | |
TOTAL COMMON STOCK
(Cost $47,900,022) | | | | | | | 39,232,243 | |
| | | | | | | | | |
| | | Face Amount | | | | | |
| U.S. TREASURY OBLIGATION — 2.5% | | | | | | | | |
U.S. Treasury Bill
5.312%, 01/02/24(A) | | $ | 1,000,000 | | | | 995,307 | |
TOTAL U.S. TREASURY OBLIGATION
(Cost $995,886) | | | | | | | 995,307 | |
TOTAL INVESTMENTS — 102.3%
(Cost $48,895,908) | | | | | | $ | 40,227,550 | |
Percentages are based on Net Assets of $39,322,875.
The accompanying notes are an integral part of the financial statements.
152
| Schedule of Investments | November 30, 2023 |
| Global X Data Center REITs & Digital Infrastructure ETF |
| * | Non-income producing security. |
| ‡ | Real Estate Investment Trust |
| (A) | Interest rate represents the security’s effective yield at the time of purchase. |
The following is a summary of the level of inputs used as of November 30, 2023, in valuing the Fund’s investments carried at value:
| Investments in Securities | | Level 1 | | | Level 2 | | | Level 3 | | | Total | |
| Common Stock | | $ | 39,232,243 | | | $ | — | | | $ | — | | | $ | 39,232,243 | |
| U.S. Treasury Obligation | | | — | | | | 995,307 | | | | — | | | | 995,307 | |
| Total Investments in Securities | | $ | 39,232,243 | | | $ | 995,307 | | | $ | — | | | $ | 40,227,550 | |
Amounts designated as “—” are $0 or have been rounded to $0.
See “Glossary” for abbreviations.
The accompanying notes are an integral part of the financial statements.
153
| Schedule of Investments | November 30, 2023 |
| Global X Clean Water ETF |
Sector Weightings (Unaudited)†:

† Sector weightings percentages are based on the total market value of investments. Total investments do not include derivatives such as options, futures contracts, forward contracts, and swap contracts, if applicable.
| | | Shares | | | Value | |
| COMMON STOCK — 99.7% | | | | | | | | |
| BRAZIL — 3.6% | | | | | | | | |
| Utilities — 3.6% | | | | | | | | |
| Cia de Saneamento Basico do Estado de Sao Paulo SABESP | | | 21,194 | | | $ | 290,307 | |
| Cia de Saneamento de Minas Gerais Copasa MG | | | 11,585 | | | | 43,899 | |
| | | | | | | | | |
| TOTAL BRAZIL | | | | | | | 334,206 | |
| CAYMAN ISLANDS — 0.5% | | | | | | | | |
| Utilities — 0.5% | | | | | | | | |
| Consolidated Water | | | 1,225 | | | | 44,210 | |
| | | | | | | | | |
| CHINA — 4.5% | | | | | | | | |
| Industrials — 0.8% | | | | | | | | |
| Beijing Originwater Technology, Cl A | | | 65,600 | | | | 46,667 | |
| BGT Group, Cl A | | | 17,700 | | | | 27,166 | |
| | | | | | | | 73,833 | |
| Materials — 0.3% | | | | | | | | |
| Shandong Taihe Technologies, Cl A | | | 12,300 | | | | 28,196 | |
| | | | | | | | | |
| Utilities — 3.4% | | | | | | | | |
| Beijing Capital Eco-Environment Protection Group, Cl A | | | 238,900 | | | | 90,328 | |
| Beijing Enterprises Water Group | | | 252,740 | | | | 50,805 | |
| Chengdu Xingrong Environment, Cl A | | | 75,100 | | | | 58,473 | |
The accompanying notes are an integral part of the financial statements.
154
| Schedule of Investments | November 30, 2023 |
| Global X Clean Water ETF |
| | | Shares | | | Value | |
| COMMON STOCK — continued | | | | | | | | |
| Utilities — continued | | | | | | | | |
| Guangdong Investment | | | 176,200 | | | $ | 122,275 | |
| | | | | | | | 321,881 | |
| TOTAL CHINA | | | | | | | 423,910 | |
| JAPAN — 3.5% | | | | | | | | |
| Industrials — 3.5% | | | | | | | | |
| Kurita Water Industries | | | 6,105 | | | | 216,309 | |
| Nomura Micro Science | | | 690 | | | �� | 53,348 | |
| Organo | | | 1,564 | | | | 64,111 | |
| | | | | | | | | |
| TOTAL JAPAN | | | | | | | 333,768 | |
| SAUDI ARABIA — 0.3% | | | | | | | | |
| Utilities — 0.3% | | | | | | | | |
| AlKhorayef Water & Power Technologies* | | | 715 | | | | 29,885 | |
| | | | | | | | | |
| SINGAPORE — 1.0% | | | | | | | | |
| Utilities — 1.0% | | | | | | | | |
| Keppel Infrastructure Trust | | | 267,718 | | | | 94,281 | |
| | | | | | | | | |
| SOUTH KOREA — 1.4% | | | | | | | | |
| Consumer Discretionary — 1.4% | | | | | | | | |
| Coway | | | 3,347 | | | | 129,714 | |
| | | | | | | | | |
| UNITED KINGDOM — 9.9% | | | | | | | | |
| Utilities — 9.9% | | | | | | | | |
| Severn Trent | | | 13,749 | | | | 452,719 | |
| United Utilities Group | | | 34,501 | | | | 476,511 | |
| | | | | | | | | |
| TOTAL UNITED KINGDOM | | | | | | | 929,230 | |
| UNITED STATES — 75.0% | | | | | | | | |
| Industrials — 45.8% | | | | | | | | |
| A O Smith | | | 5,880 | | | | 443,117 | |
| Advanced Drainage Systems | | | 3,253 | | | | 393,971 | |
| Core & Main, Cl A * | | | 5,558 | | | | 194,697 | |
| Energy Recovery * | | | 3,395 | | | | 64,709 | |
| Ferguson | | | 4,695 | | | | 804,441 | |
| Franklin Electric | | | 2,463 | | | | 219,207 | |
The accompanying notes are an integral part of the financial statements.
155
| Schedule of Investments | November 30, 2023 |
| Global X Clean Water ETF |
| | | Shares | | | Value | |
| COMMON STOCK — continued | | | | | | | | |
| Industrials — continued | | | | | | | | |
| Mueller Water Products, Cl A | | | 9,503 | | | $ | 126,295 | |
| Pentair | | | 9,264 | | | | 597,898 | |
| Reliance Worldwide | | | 41,804 | | | | 106,438 | |
| Watts Water Technologies, Cl A | | | 1,681 | | | | 323,609 | |
| Xylem | | | 7,340 | | | | 771,654 | |
| Zurn Elkay Water Solutions | | | 8,806 | | | | 259,249 | |
| | | | | | | | 4,305,285 | |
| Information Technology — 2.9% | | | | | | | | |
| Badger Meter | | | 1,818 | | | | 267,919 | |
| | | | | | | | | |
| Materials — 8.3% | | | | | | | | |
| Ecolab | | | 4,074 | | | | 781,108 | |
| | | | | | | | | |
| Utilities — 18.0% | | | | | | | | |
| American States Water | | | 2,273 | | | | 181,613 | |
| American Water Works | | | 5,357 | | | | 706,267 | |
| Artesian Resources, Cl A | | | 594 | | | | 24,978 | |
| California Water Service Group | | | 3,548 | | | | 179,422 | |
| Essential Utilities | | | 10,642 | | | | 378,961 | |
| Middlesex Water | | | 1,076 | | | | 68,756 | |
| SJW Group | | | 1,787 | | | | 117,299 | |
| York Water | | | 866 | | | | 32,977 | |
| | | | | | | | 1,690,273 | |
| TOTAL UNITED STATES | | | | | | | 7,044,585 | |
TOTAL COMMON STOCK
(Cost $9,187,254) | | | | | | | 9,363,789 | |
TOTAL INVESTMENTS — 99.7%
(Cost $9,187,254) | | | | | | $ | 9,363,789 | |
Percentages are based on Net Assets of $9,393,530.
| * | Non-income producing security. |
As of November 30, 2023, all of the Fund’s investments were considered Level 1, in accordance with authoritative guidance on fair value measurements and disclosure under U.S. GAAP.
See “Glossary” for abbreviations.
The accompanying notes are an integral part of the financial statements.
156
| Schedule of Investments | November 30, 2023 |
| Global X AgTech & Food Innovation ETF |
Sector Weightings (Unaudited)†:
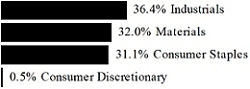
† Sector weightings percentages are based on the total market value of investments. Total investments do not include derivatives such as options, futures contracts, forward contracts, and swap contracts, if applicable.
| | | Shares | | | Value | |
| COMMON STOCK — 102.6% | | | | | | | | |
| ARGENTINA — 1.0% | | | | | | | | |
| Materials — 1.0% | | | | | | | | |
| Bioceres Crop Solutions * | | | 3,541 | | | $ | 43,200 | |
| | | | | | | | | |
| AUSTRALIA — 3.3% | | | | | | | | |
| Materials — 3.3% | | | | | | | | |
| Nufarm | | | 47,279 | | | | 148,591 | |
| | | | | | | | | |
| CANADA — 13.3% | | | | | | | | |
| Consumer Staples — 1.9% | | | | | | | | |
| Maple Leaf Foods | | | 706 | | | | 12,565 | |
| SunOpta * | | | 14,976 | | | | 73,981 | |
| | | | | | | | 86,546 | |
| Materials — 11.4% | | | | | | | | |
| Nutrien | | | 9,524 | | | | 509,248 | |
| | | | | | | | | |
| TOTAL CANADA | | | | | | | 595,794 | |
| CHINA — 13.5% | | | | | | | | |
| Consumer Staples — 13.5% | | | | | | | | |
| Cheng De Lolo, Cl A | | | 161,680 | | | | 185,431 | |
| Hebei Yangyuan Zhihui Beverage, Cl A | | | 60,400 | | | | 190,563 | |
| Yuan Longping High-tech Agriculture, Cl A * | | | 89,900 | | | | 212,759 | |
| Zhe Jiang Li Zi Yuan Food, Cl A | | | 6,200 | | | | 13,770 | |
| | | | | | | | | |
| TOTAL CHINA | | | | | | | 602,523 | |
The accompanying notes are an integral part of the financial statements.
157
| Schedule of Investments | November 30, 2023 |
| Global X AgTech & Food Innovation ETF |
| | | Shares | | | Value | |
| COMMON STOCK — continued | | | | | | | | |
| ISRAEL — 0.6% | | | | | | | | |
| Materials — 0.6% | | | | | | | | |
| ICL Group | | | 5,546 | | | $ | 27,908 | |
| | | | | | | | | |
| JAPAN — 12.5% | | | | | | | | |
| Industrials — 12.5% | | | | | | | | |
| Kubota | | | 39,000 | | | | 559,008 | |
| | | | | | | | | |
| PHILIPPINES — 0.3% | | | | | | | | |
| Consumer Staples — 0.3% | | | | | | | | |
| Monde Nissin | | | 92,905 | | | | 14,064 | |
| | | | | | | | | |
| UNITED KINGDOM — 8.9% | | | | | | | | |
| Consumer Staples — 4.0% | | | | | | | | |
| Unilever | | | 3,801 | | | | 181,384 | |
| | | | | | | | | |
| Industrials — 4.9% | | | | | | | | |
| CNH Industrial | | | 20,284 | | | | 217,850 | |
| | | | | | | | | |
| TOTAL UNITED KINGDOM | | | | | | | 399,234 | |
| UNITED STATES — 49.2% | | | | | | | | |
| Consumer Discretionary — 0.5% | | | | | | | | |
| GrowGeneration * | | | 8,188 | | | | 21,780 | |
| | | | | | | | | |
| Consumer Staples — 12.0% | | | | | | | | |
| Archer-Daniels-Midland | | | 2,453 | | | | 180,860 | |
| Benson Hill * | | | 58,192 | | | | 11,726 | |
| Beyond Meat * | | | 9,894 | | | | 72,127 | |
| Hain Celestial Group * | | | 1,250 | | | | 13,212 | |
| Ingredion | | | 487 | | | | 49,913 | |
| Kellanova | | | 2,289 | | | | 120,264 | |
| Oatly Group ADR * | | | 61,375 | | | | 55,851 | |
| Sprouts Farmers Market * | | | 812 | | | | 34,981 | |
| | | | | | | | 538,934 | |
| Industrials — 20.0% | | | | | | | | |
| AGCO | | | 1,750 | | | | 198,678 | |
| Deere | | | 1,439 | | | | 524,386 | |
The accompanying notes are an integral part of the financial statements.
158
| Schedule of Investments | November 30, 2023 |
| Global X AgTech & Food Innovation ETF |
| | | Shares | | | Value | |
| COMMON STOCK — continued | | | | | | | | |
| Industrials — continued | | | | | | | | |
| Hydrofarm Holdings Group * | | | 115,353 | | | $ | 98,373 | |
| Titan Machinery * | | | 3,242 | | | | 74,112 | |
| | | | | | | | 895,549 | |
| Materials — 16.7% | | | | | | | | |
| Corteva | | | 11,596 | | | | 524,139 | |
| FMC | | | 3,804 | | | | 204,123 | |
| Scotts Miracle-Gro, Cl A | | | 305 | | | | 16,976 | |
| | | | | | | | 745,238 | |
| TOTAL UNITED STATES | | | | | | | 2,201,501 | |
TOTAL COMMON STOCK
(Cost $5,179,159) | | | | | | | 4,591,823 | |
TOTAL INVESTMENTS — 102.6%
(Cost $5,179,159) | | | | | | $ | 4,591,823 | |
Percentages are based on Net Assets of $4,475,696.
| * | Non-income producing security. |
As of November 30, 2023, all of the Fund’s investments were considered Level 1, in accordance with authoritative guidance on fair value measurements and disclosure under U.S. GAAP.
See “Glossary” for abbreviations.
The accompanying notes are an integral part of the financial statements.
159
| Schedule of Investments | November 30, 2023 |
Global X Blockchain ETF
Sector Weightings (Unaudited)†:

† Sector weightings percentages are based on the total market value of investments. Total investments do not include derivatives such as options, futures contracts, forward contracts, and swap contracts, if applicable.
| | | Shares | | | Value | |
| COMMON STOCK — 99.9% | | | | | | |
| AUSTRALIA — 4.9% | | | | | | |
| Information Technology — 4.9% | | | | | | |
| Iris Energy * (A) | | | 865,353 | | | $ | 4,270,517 | |
| | | | | | | | | |
| CANADA — 10.5% | | | | | | | | |
| Information Technology — 10.5% | | | | | | | | |
| Bitfarms * (A) | | | 2,744,005 | | | | 3,966,700 | |
| Hive Digital Technologies * | | | 807,557 | | | | 2,483,691 | |
| Hut 8 * (A) | | | 1,422,595 | | | | 2,727,991 | |
| | | | | | | | | |
| TOTAL CANADA | | | | | | | 9,178,382 | |
| CHINA — 8.4% | | | | | | | | |
| Financials — 1.3% | | | | | | | | |
| BC Technology Group * | | | 956,300 | | | | 1,157,066 | |
| | | | | | | | | |
| Information Technology — 7.1% | | | | | | | | |
| Bit Digital * (A) | | | 1,464,710 | | | | 3,778,952 | |
| Canaan ADR * | | | 1,574,319 | | | | 2,377,222 | |
| | | | | | | | 6,156,174 | |
| TOTAL CHINA | | | | | | | 7,313,240 | |
| GERMANY — 1.2% | | | | | | | | |
| Information Technology — 1.2% | | | | | | | | |
| Northern Data * (A) | | | 40,192 | | | | 1,074,406 | |
The accompanying notes are an integral part of the financial statements.
160
| Schedule of Investments | November 30, 2023 |
Global X Blockchain ETF
| | | Shares | | | Value | |
| COMMON STOCK — continued | | | | | | |
| JAPAN — 1.4% | | | | | | |
| Financials — 1.1% | | | | | | |
| SBI Holdings | | | 44,306 | | | $ | 961,135 | |
| | | | | | | | | |
| Information Technology — 0.3% | | | | | | | | |
| GMO internet group | | | 13,543 | | | | 217,708 | |
| | | | | | | | | |
| TOTAL JAPAN | | | | | | | 1,178,843 | |
| THAILAND — 0.4% | | | | | | | | |
| Information Technology — 0.4% | | | | | | | | |
| Jasmine Technology Solution NVDR * | | | 217,900 | | | | 340,687 | |
| | | | | | | | | |
| UNITED KINGDOM — 0.4% | | | | | | | | |
| Information Technology — 0.4% | | | | | | | | |
| Argo Blockchain * (A) | | | 3,435,558 | | | | 369,686 | |
| | | | | | | | | |
| UNITED STATES — 72.7% | | | | | | | | |
| Financials — 28.1% | | | | | | | | |
| Bakkt Holdings * (A) | | | 1,488,101 | | | | 2,232,151 | |
| Block, Cl A * | | | 33,357 | | | | 2,115,835 | |
| Coinbase Global, Cl A * (A) | | | 113,632 | | | | 14,172,183 | |
| Galaxy Digital Holdings * (A) | | | 509,000 | | | | 3,108,397 | |
| PayPal Holdings * | | | 26,479 | | | | 1,525,455 | |
| Robinhood Markets, Cl A * | | | 149,805 | | | | 1,318,284 | |
| | | | | | | | 24,472,305 | |
| Information Technology — 44.6% | | | | | | | | |
| Applied Digital * (A) | | | 625,770 | | | | 2,922,346 | |
| Cipher Mining * | | | 553,421 | | | | 1,532,976 | |
| Cleanspark * | | | 1,451,489 | | | | 9,057,291 | |
| Marathon Digital Holdings * (A) | | | 906,732 | | | | 10,853,582 | |
| NVIDIA | | | 3,298 | | | | 1,542,475 | |
| Riot Platforms * (A) | | | 842,099 | | | | 10,568,342 | |
| Terawulf * | | | 2,018,222 | | | | 2,341,138 | |
| | | | | | | | 38,818,150 | |
| TOTAL UNITED STATES | | | | | | | 63,290,455 | |
TOTAL COMMON STOCK
(Cost $89,108,744) | | | | | | | 87,016,216 | |
The accompanying notes are an integral part of the financial statements.
161
| Schedule of Investments | November 30, 2023 |
Global X Blockchain ETF
| | | Face Amount | | | Value | |
| REPURCHASE AGREEMENTS(B) — 19.6% | | | | | | | | |
Bank of America
5.320%, dated 11/30/2023, to be repurchased on 12/01/2023, repurchase price $4,012,434 (collateralized by various U.S. Government Obligations and U.S. Treasury Obligations, ranging in par value $428 - $1,415,126, 1.500% - 7.000%, 08/01/2027 - 09/20/2063, with a total market value of $4,092,078) | | $ | 4,011,841 | | | $ | 4,011,841 | |
Daiwa Capital Markets
5.340%, dated 11/30/2023, to be repurchased on 12/01/2023, repurchase price $4,012,436 (collateralized by various U.S. Government Obligations and U.S. Treasury Obligations, ranging in par value $252 - $554,257, 0.000% - 7.000%, 01/25/2024 - 12/01/2053, with a total market value of $4,092,299) | | | 4,011,841 | | | | 4,011,841 | |
Deutsche Bank Securities
5.320%, dated 11/30/2023, to be repurchased on 12/01/2023, repurchase price $4,012,434 (collateralized by various U.S. Government Obligations and U.S. Treasury Obligations, ranging in par value $12,036 - $1,212,113, 2.500% - 7.500%, 06/01/2042 - 11/01/2053, with a total market value of $4,092,078) | | | 4,011,841 | | | | 4,011,841 | |
Nomura Securities International
5.310%, dated 11/30/2023, to be repurchased on 12/01/2023, repurchase price $1,024,452 (collateralized by various U.S. Government Obligations and U.S. Treasury Obligations, ranging in par value $640 - $296,561, 2.000% - 6.500%, 11/01/2029 - 06/01/2062, with a total market value of $1,044,789) | | | 1,024,301 | | | | 1,024,301 | |
The accompanying notes are an integral part of the financial statements.
162
| Schedule of Investments | November 30, 2023 |
Global X Blockchain ETF
| | | Face Amount | | | Value | |
| REPURCHASE AGREEMENTS — continued | | | | | | |
RBC Dominion Securities
5.320%, dated 11/30/2023, to be repurchased on 12/01/2023, repurchase price $4,012,434 (collateralized by various U.S. Government Obligations and U.S. Treasury Obligations, ranging in par value $234 - $1,051,551, 0.000% - 6.500%, 12/14/2023 - 09/01/2053, with a total market value of $4,092,078) | | $ | 4,011,841 | | | $ | 4,011,841 | |
TOTAL REPURCHASE AGREEMENTS
(Cost $17,071,665) | | | | | | | 17,071,665 | |
TOTAL INVESTMENTS — 119.5%
(Cost $106,180,409) | | | | | | $ | 104,087,881 | |
Percentages are based on Net Assets of $87,124,421.
| * | Non-income producing security. |
| (A) | This security or a partial position of this security is on loan at November 30, 2023. The total market value of securities on loan at November 30, 2023 was $15,198,593. |
| (B) | These securities were purchased with cash collateral held from securities on loan. The total value of such securities as of November 30, 2023 was $17,071,665. The total value of non-cash collateral held from securities on loan as of November 30, 2023 was $–. |
The following is a summary of the level of inputs used as of November 30, 2023, in valuing the Fund’s investments carried at value:
| Investments in Securities | | Level 1 | | | Level 2 | | | Level 3 | | | Total | |
| Common Stock | | $ | 87,016,216 | | | $ | — | | | $ | — | | | $ | 87,016,216 | |
| Repurchase Agreements | | | — | | | | 17,071,665 | | | | — | | | | 17,071,665 | |
| Total Investments in Securities | | $ | 87,016,216 | | | $ | 17,071,665 | | | $ | — | | | $ | 104,087,881 | |
Amounts designated as “—” are $0 or have been rounded to $0.
See “Glossary” for abbreviations.
The accompanying notes are an integral part of the financial statements.
163
| Schedule of Investments | November 30, 2023 |
Global X Hydrogen ETF
Sector Weightings (Unaudited)†:
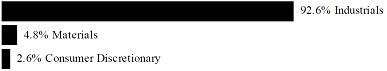
† Sector weightings percentages are based on the total market value of investments. Total investments do not include derivatives such as options, futures contracts, forward contracts, and swap contracts, if applicable.
| | | Shares | | | Value | |
| COMMON STOCK — 97.2% | | | | | | | | |
| CANADA — 8.9% | | | | | | | | |
| Industrials — 8.9% | | | | | | | | |
| Ballard Power Systems * | | | 876,565 | | | $ | 3,076,743 | |
| NFI Group * | | | 10,325 | | | | 98,693 | |
| | | | | | | | | |
| TOTAL CANADA | | | | | | | 3,175,436 | |
| DENMARK — 2.9% | | | | | | | | |
| Industrials — 2.9% | | | | | | | | |
| Green Hydrogen Systems, Cl A * | | | 1,031,167 | | | | 1,038,237 | |
| | | | | | | | | |
| FRANCE — 2.7% | | | | | | | | |
| Consumer Discretionary — 0.3% | | | | | | | | |
| Cie Plastic Omnium | | | 8,706 | | | | 108,289 | |
| | | | | | | | | |
| Industrials — 2.4% | | | | | | | | |
| McPhy Energy * | | | 218,393 | | | | 850,687 | |
| | | | | | | | | |
| TOTAL FRANCE | | | | | | | 958,976 | |
| GERMANY — 4.7% | | | | | | | | |
| Industrials — 4.7% | | | | | | | | |
| SFC Energy * | | | 75,724 | | | | 1,673,098 | |
| | | | | | | | | |
| JAPAN — 1.9% | | | | | | | | |
| Consumer Discretionary — 1.9% | | | | | | | | |
| Toyota Motor | | | 36,822 | | | | 696,040 | |
The accompanying notes are an integral part of the financial statements.
164
| Schedule of Investments | November 30, 2023 |
Global X Hydrogen ETF
| | | Shares | | | Value | |
| COMMON STOCK — continued | | | | | | | | |
| NORWAY — 13.3% | | | | | | | | |
| Industrials — 13.3% | | | | | | | | |
| Hexagon Purus * | | | 743,811 | | | $ | 607,950 | |
| NEL * | | | 5,651,186 | | | | 4,153,403 | |
| | | | | | | | | |
| TOTAL NORWAY | | | | | | | 4,761,353 | |
| SOUTH KOREA — 6.2% | | | | | | | | |
| Consumer Discretionary — 0.3% | | | | | | | | |
| Iljin Hysolus ltd * | | | 5,999 | | | | 107,876 | |
| | | | | | | | | |
| Industrials — 5.9% | | | | | | | | |
| Doosan | | | 1,613 | | | | 115,147 | |
| Doosan Fuel Cell * | | | 105,966 | | | | 1,995,872 | |
| | | | | | | | 2,111,019 | |
| TOTAL SOUTH KOREA | | | | | | | 2,218,895 | |
| SWEDEN — 4.1% | | | | | | | | |
| Industrials — 4.1% | | | | | | | | |
| PowerCell Sweden * | | | 370,956 | | | | 1,479,031 | |
| | | | | | | | | |
| UNITED KINGDOM — 13.4% | | | | | | | | |
| Industrials — 12.6% | | | | | | | | |
| AFC Energy * | | | 8,224,895 | | | | 1,516,033 | |
| Ceres Power Holdings * | | | 622,000 | | | | 1,478,778 | |
| ITM Power * | | | 2,297,126 | | | | 1,491,247 | |
| | | | | | | | 4,486,058 | |
| Materials — 0.8% | | | | | | | | |
| Johnson Matthey | | | 14,871 | | | | 291,802 | |
| | | | | | | | | |
| TOTAL UNITED KINGDOM | | | | | | | 4,777,860 | |
| UNITED STATES — 39.1% | | | | | | | | |
| Industrials — 35.1% | | | | | | | | |
| Advent Technologies Holdings * | | | 40,124 | | | | 14,926 | |
| Bloom Energy, Cl A * | | | 341,712 | | | | 4,934,321 | |
| Cummins | | | 3,155 | | | | 707,225 | |
| FuelCell Energy * | | | 1,308,345 | | | | 1,596,181 | |
| Hyster-Yale Materials Handling | | | 2,210 | | | | 105,351 | |
The accompanying notes are an integral part of the financial statements.
165
| Schedule of Investments | November 30, 2023 |
Global X Hydrogen ETF
| | | Shares | | | Value | |
| COMMON STOCK — continued | | | | | | | | |
| Industrials — continued | | | | | | | | |
| Hyzon Motors * | | | 1,020,478 | | | $ | 1,112,321 | |
| Plug Power * | | | 1,015,176 | | | | 4,101,311 | |
| | | | | | | | 12,571,636 | |
| Materials — 4.0% | | | | | | | | |
| Air Products & Chemicals | | | 2,576 | | | | 696,937 | |
| Linde | | | 1,726 | | | | 714,167 | |
| | | | | | | | 1,411,104 | |
| TOTAL UNITED STATES | | | | | | | 13,982,740 | |
TOTAL COMMON STOCK
(Cost $64,544,614) | | | | | | | 34,761,666 | |
TOTAL INVESTMENTS — 97.2%
(Cost $64,544,614) | | | | | | $ | 34,761,666 | |
Percentages are based on Net Assets of $35,777,194.
| * | Non-income producing security. |
As of November 30, 2023, all of the Fund’s investments were considered Level 1, in accordance with authoritative guidance on fair value measurements and disclosure under U.S. GAAP.
See “Glossary” for abbreviations.
The accompanying notes are an integral part of the financial statements.
166
| Schedule of Investments | | November 30, 2023 |
| | | |
| | Global X Solar ETF | |
Sector Weightings (Unaudited)†:

† Sector weightings percentages are based on the total market value of investments. Total investments do not include derivatives such as options, futures contracts, forward contracts, and swap contracts, if applicable.
| | | Shares | | | Value | |
| COMMON STOCK — 99.8% | | | | | | | | |
| CANADA — 1.2% | | | | | | | | |
| Information Technology — 1.2% | | | | | | | | |
| Canadian Solar * | | | 3,497 | | | $ | 73,542 | |
| | | | | | | | | |
| CHINA — 50.3% | | | | | | | | |
| Industrials — 15.7% | | | | | | | | |
| Ginlong Technologies, Cl A | | | 16,650 | | | | 155,401 | |
| GoodWe Technologies, Cl A | | | 1,841 | | | | 27,797 | |
| Lingda Group, Cl A * | | | 11,900 | | | | 23,047 | |
| Ningbo Deye Technology, Cl A | | | 24,000 | | | | 211,903 | |
| Sineng Electric, Cl A | | | 12,061 | | | | 46,160 | |
| Sungrow Power Supply, Cl A | | | 40,500 | | | | 471,867 | |
| | | | | | | | 936,175 | |
| Information Technology — 31.7% | | | | | | | | |
| Changzhou Almaden Stock, Cl A | | | 6,000 | | | | 22,442 | |
| EGing Photovoltaic Technology, Cl A * | | | 56,300 | | | | 40,287 | |
| Flat Glass Group, Cl H (A) | | | 26,800 | | | | 44,059 | |
| GCL System Integration Technology, Cl A * | | | 238,900 | | | | 90,662 | |
| Hainan Drinda New Energy Technology, Cl A | | | 8,300 | | | | 98,982 | |
| Hangzhou First Applied Material, Cl A | | | 43,132 | | | | 140,310 | |
| JA Solar Technology, Cl A | | | 91,304 | | | | 254,439 | |
| LONGi Green Energy Technology, Cl A | | | 150,160 | | | | 446,422 | |
| Risen Energy, Cl A | | | 57,600 | | | | 130,187 | |
| Shanghai Aiko Solar Energy, Cl A | | | 80,040 | | | | 181,354 | |
| Shenzhen SC New Energy Technology, Cl A | | | 18,400 | | | | 181,166 | |
| Shenzhen Topraysolar, Cl A | | | 48,900 | | | | 30,541 | |
| Xinyi Solar Holdings | | | 274,600 | | | | 157,862 | |
The accompanying notes are an integral part of the financial statements.
167
| Schedule of Investments | | November 30, 2023 |
| | | |
| | Global X Solar ETF | |
| | | Shares | | | Value | |
| COMMON STOCK — continued | | | | | | | | |
| Information Technology — continued | | | | | | | | |
| Zhejiang Akcome New Energy Technology, Cl A * | | | 251,100 | | | $ | 76,304 | |
| | | | | | | | 1,895,017 | |
| Materials — 1.1% | | | | | | | | |
| Henan Yicheng New Energy, Cl A * | | | 97,000 | | | | 64,657 | |
| | | | | | | | | |
| Utilities — 1.8% | | | | | | | | |
| CECEP Solar Energy, Cl A | | | 115,100 | | | | 89,778 | |
| Xinyi Energy Holdings | | | 126,000 | | | | 21,134 | |
| | | | | | | | 110,912 | |
| TOTAL CHINA | | | | | | | 3,006,761 | |
| GERMANY — 3.4% | | | | | | | | |
| Information Technology — 1.7% | | | | | | | | |
| SMA Solar Technology * | | | 1,707 | | | | 103,648 | |
| | | | | | | | | |
| Utilities — 1.7% | | | | | | | | |
| Encavis * | | | 6,853 | | | | 102,140 | |
| | | | | | | | | |
| TOTAL GERMANY | | | | | | | 205,788 | |
| JAPAN — 0.8% | | | | | | | | |
| Industrials — 0.3% | | | | | | | | |
| Abalance | | | 668 | | | | 17,035 | |
| | | | | | | | | |
| Utilities — 0.5% | | | | | | | | |
| West Holdings | | | 1,450 | | | | 30,405 | |
| | | | | | | | | |
| TOTAL JAPAN | | | | | | | 47,440 | |
| SOUTH KOREA — 3.0% | | | | | | | | |
| Information Technology — 0.3% | | | | | | | | |
| HD Hyundai Energy Solutions* | | | 984 | | | | 18,267 | |
| | | | | | | | | |
| Materials — 2.7% | | | | | | | | |
| Hanwha Solutions * | | | 6,184 | | | | 160,094 | |
| | | | | | | | | |
| TOTAL SOUTH KOREA | | | | | | | 178,361 | |
The accompanying notes are an integral part of the financial statements.
168
| Schedule of Investments | | November 30, 2023 |
| | | |
| | Global X Solar ETF | |
| | | Shares | | | Value | |
| COMMON STOCK — continued | | | | | | | | |
| SPAIN — 2.7% | | | | | | | | |
| Utilities — 2.7% | | | | | | | | |
| Atlantica Sustainable Infrastructure | | | 4,516 | | | $ | 85,894 | |
| Solaria Energia y Medio Ambiente * | | | 3,942 | | | | 73,828 | |
| | | | | | | | | |
| TOTAL SPAIN | | | | | | | 159,722 | |
| SWITZERLAND — 0.8% | | | | | | | | |
| Information Technology — 0.8% | | | | | | | | |
| Meyer Burger Technology * | | | 191,177 | | | | 44,939 | |
| | | | | | | | | |
| TAIWAN — 1.9% | | | | | | | | |
| Information Technology — 1.9% | | | | | | | | |
| Motech Industries | | | 23,090 | | | | 20,806 | |
| Tainergy Tech * | | | 21,300 | | | | 19,330 | |
| TSEC | | | 32,677 | | | | 30,857 | |
| United Renewable Energy | | | 92,918 | | | | 44,020 | |
| | | | | | | | | |
| TOTAL TAIWAN | | | | | | | 115,013 | |
| TURKEY — 0.5% | | | | | | | | |
| Utilities — 0.5% | | | | | | | | |
| Esenboga Elektrik Uretim | | | 21,661 | | | | 15,796 | |
| Margun Enerji Uretim Sanayi VE Ticaret | | | 27,233 | | | | 14,442 | |
| | | | | | | | | |
| TOTAL TURKEY | | | | | | | 30,238 | |
| UNITED STATES — 35.2% | | | | | | | | |
| Industrials — 10.9% | | | | | | | | |
| Array Technologies * | | | 11,381 | | | | 176,064 | |
| NEXTracker, Cl A * | | | 3,079 | | | | 125,130 | |
| Shoals Technologies Group, Cl A * | | | 10,995 | | | | 152,281 | |
| SunPower, Cl A * | | | 5,933 | | | | 24,622 | |
| Sunrun * | | | 13,230 | | | | 170,667 | |
| | | | | | | | 648,764 | |
| Information Technology — 22.5% | | | | | | | | |
| Enphase Energy * | | | 5,417 | | | | 547,225 | |
| First Solar * | | | 3,179 | | | | 501,583 | |
| Maxeon Solar Technologies * | | | 3,510 | | | | 14,496 | |
The accompanying notes are an integral part of the financial statements.
169
| Schedule of Investments | | November 30, 2023 |
| | | |
| | Global X Solar ETF | |
| | | Shares | | | Value | |
| COMMON STOCK — continued | | | | | | | | |
| Information Technology — continued | | | | | | | | |
| SolarEdge Technologies * | | | 3,565 | | | $ | 282,990 | |
| | | | | | | | 1,346,294 | |
| Utilities — 1.8% | | | | | | | | |
| Altus Power, Cl A * | | | 5,847 | | | | 29,235 | |
| Sunnova Energy International * | | | 6,939 | | | | 80,493 | |
| | | | | | | | 109,728 | |
| TOTAL UNITED STATES | | | | | | | 2,104,786 | |
TOTAL COMMON STOCK
(Cost $7,860,120) | | | | | | | 5,966,590 | |
| | | | | | | | |
| | | Face Amount | | | | | |
| REPURCHASE AGREEMENT(B) — 0.7% | | | | | | | | |
| Daiwa Capital Markets | | | | | | | | |
5.340%, dated 11/30/2023, to be repurchased on 12/01/2023, repurchase price $40,482 (collateralized by various U.S. Government Obligations and U.S. Treasury Obligations, ranging in par value $3 - $5,592, 0.000% - 7.000%, 01/25/2024 - 12/01/2053, with a total market value of $41,288)
(Cost $40,476) | | $ | 40,476 | | | | 40,476 | |
TOTAL INVESTMENTS — 100.5%
(Cost $7,900,596) | | | | | | $ | 6,007,066 | |
Percentages are based on Net Assets of $5,974,466.
| * | Non-income producing security. |
| (A) | This security or a partial position of this security is on loan at November 30, 2023. The total market value of securities on loan at November 30, 2023 was $37,976. |
| (B) | These securities were purchased with cash collateral held from securities on loan. The total value of such securities as of November 30, 2023 was $40,476. The total value of non-cash collateral held from securities on loan as of November 30, 2023 was $–. |
The accompanying notes are an integral part of the financial statements.
170
| Schedule of Investments | | November 30, 2023 |
| | | |
| | Global X Solar ETF | |
The following is a summary of the level of inputs used as of November 30, 2023, in valuing the Fund’s investments carried at value:
| Investments in Securities | | Level 1 | | | Level 2 | | | Level 3 | | | Total | |
| Common Stock | | $ | 5,966,590 | | | $ | — | | | $ | — | | | $ | 5,966,590 | |
| Repurchase Agreement | | | — | | | | 40,476 | | | | — | | | | 40,476 | |
| Total Investments in Securities | | $ | 5,966,590 | | | $ | 40,476 | | | $ | — | | | $ | 6,007,066 | |
Amounts designated as “—” are $0 or have been rounded to $0.
See “Glossary” for abbreviations.
The accompanying notes are an integral part of the financial statements.
171
| Schedule of Investments | | November 30, 2023 |
| | | |
| | Global X Wind Energy ETF | |
Sector Weightings (Unaudited)†:

† Sector weightings percentages are based on the total market value of investments. Total investments do not include derivatives such as options, futures contracts, forward contracts, and swap contracts, if applicable.
| | | Shares | | | Value | |
| COMMON STOCK — 99.3% | | | | | | | | |
| CANADA — 17.6% | | | | | | | | |
| Utilities — 17.6% | | | | | | | | |
| Boralex, Cl A | | | 5,476 | | | $ | 124,516 | |
| Innergex Renewable Energy | | | 11,430 | | | | 81,014 | |
| Northland Power | | | 16,689 | | | | 271,534 | |
| | | | | | | | | |
| TOTAL CANADA | | | | | | | 477,064 | |
| CHINA — 35.9% | | | | | | | | |
| Industrials — 25.9% | | | | | | | | |
| Dajin Heavy Industry, Cl A | | | 30,750 | | | | 108,170 | |
| Jiangsu Haili Wind Power Equipment Technology, Cl A | | | 5,000 | | | | 43,656 | |
| Jinlei Technology, Cl A | | | 16,550 | | | | 67,118 | |
| Ming Yang Smart Energy Group, Cl A | | | 104,300 | | | | 196,740 | |
| Qingdao Tianneng Heavy Industries, Cl A | | | 53,900 | | | | 53,364 | |
| Shanghai Taisheng Wind Power Equipment, Cl A | | | 68,800 | | | | 93,262 | |
| Titan Wind Energy Suzhou, Cl A * | | | 63,900 | | | | 111,765 | |
| Windey Energy Technology Group, Cl A | | | 18,400 | | | | 27,132 | |
| | | | | | | | 701,207 | |
| Utilities — 10.0% | | | | | | | | |
| CECEP Wind-Power, Cl A | | | 272,460 | | | | 117,515 | |
| China Datang Renewable Power, Cl H | | | 57,300 | | | | 11,885 | |
| China Longyuan Power Group, Cl H | | | 139,500 | | | | 104,487 | |
| Jiangsu New Energy Development, Cl A | | | 23,100 | | | | 36,619 | |
| | | | | | | | 270,506 | |
| TOTAL CHINA | | | | | | | 971,713 | |
The accompanying notes are an integral part of the financial statements.
172
| Schedule of Investments | | November 30, 2023 |
| | | |
| | Global X Wind Energy ETF | |
| | | Shares | | | Value | |
| COMMON STOCK — continued | | | | | | | | |
| DENMARK — 25.7% | | | | | | | | |
| Industrials — 13.0% | | | | | | | | |
| Vestas Wind Systems * | | | 12,695 | | | $ | 352,175 | |
| | | | | | | | | |
| Utilities — 12.7% | | | | | | | | |
| Orsted | | | 7,256 | | | | 342,351 | |
| | | | | | | | | |
| TOTAL DENMARK | | | | | | | 694,526 | |
| GERMANY — 3.4% | | | | | | | | |
| Industrials — 3.4% | | | | | | | | |
| Nordex * | | | 8,348 | | | | 92,587 | |
| | | | | | | | | |
| TOTAL GERMANY | | | | | | | 92,587 | |
| GREECE — 2.4% | | | | | | | | |
| Utilities — 2.4% | | | | | | | | |
| Terna Energy | | | 3,853 | | | | 65,961 | |
| | | | | | | | | |
| INDIA — 2.7% | | | | | | | | |
| Utilities — 2.7% | | | | | | | | |
| ReNew Energy Global, Cl A * (A) | | | 11,239 | | | | 72,379 | |
| | | | | | | | | |
| SOUTH KOREA — 2.7% | | | | | | | | |
| Industrials — 2.7% | | | | | | | | |
| CS Bearing * | | | 987 | | | | 7,421 | |
| CS Wind | | | 1,575 | | | | 65,312 | |
| | | | | | | | | |
| TOTAL SOUTH KOREA | | | | | | | 72,733 | |
| SPAIN — 4.4% | | | | | | | | |
| Utilities — 4.4% | | | | | | | | |
| ACCIONA Energias Renovables | | | 3,987 | | | | 118,499 | |
| | | | | | | | | |
| SWEDEN — 1.5% | | | | | | | | |
| Industrials — 1.5% | | | | | | | | |
| OX2, Cl B * | | | 8,343 | | | | 39,172 | |
The accompanying notes are an integral part of the financial statements.
173
| Schedule of Investments | | November 30, 2023 |
| | | |
| | Global X Wind Energy ETF | |
| | | Shares | | | Value | |
| COMMON STOCK — continued | | | | | | | | |
| TAIWAN — 1.9% | | | | | | | | |
| Materials — 1.9% | | | | | | | | |
| Century Iron & Steel Industrial | | | 9,400 | | | $ | 49,949 | |
| | | | | | | | | |
| TURKEY — 0.4% | | | | | | | | |
| Utilities — 0.4% | | | | | | | | |
| Galata Wind Enerji | | | 12,040 | | | | 10,958 | |
| | | | | | | | | |
| UNITED STATES — 0.7% | | | | | | | | |
| Industrials — 0.7% | | | | | | | | |
| Eneti | | | 1,784 | | | | 19,356 | |
| | | | | | | | | |
TOTAL COMMON STOCK
(Cost $4,144,509) | | | | | | | 2,684,897 | |
| | | | | | | | |
| | | Face Amount | | | | | |
| REPURCHASE AGREEMENT(B) — 2.1% | | | | | | | | |
| Daiwa Capital Markets | | | | | | | | |
5.340%, dated 11/30/2023, to be repurchased on 12/01/2023, repurchase price $57,392 (collateralized by various U.S. Government Obligations and U.S. Treasury Obligations, ranging in par value $4 - $7,928, 0.000% - 7.000%, 01/25/2024 - 12/01/2053, with a total market value of $58,534)
(Cost $57,383) | | $ | 57,383 | | | | 57,383 | |
TOTAL INVESTMENTS — 101.4%
(Cost $4,201,892) | | | | | | $ | 2,742,280 | |
Percentages are based on Net Assets of $2,705,387.
| * | Non-income producing security. |
| (A) | This security or a partial position of this security is on loan at November 30, 2023. The total market value of securities on loan at November 30, 2023 was $54,740. |
| (B) | These securities were purchased with cash collateral held from securities on loan. The total value of such securities as of November 30, 2023 was $57,383. The total value of non-cash collateral held from securities on loan as of November 30, 2023 was $–. |
The accompanying notes are an integral part of the financial statements.
174
| Schedule of Investments | | November 30, 2023 |
| | | |
| | Global X Wind Energy ETF | |
The following is a summary of the level of inputs used as of November 30, 2023, in valuing the Fund’s investments carried at value:
| Investments in Securities | | Level 1 | | | Level 2 | | | Level 3 | | | Total | |
| Common Stock | | $ | 2,684,897 | | | $ | — | | | $ | — | | | $ | 2,684,897 | |
| Repurchase Agreement | | | — | | | | 57,383 | | | | — | | | | 57,383 | |
| Total Investments in Securities | | $ | 2,684,897 | | | $ | 57,383 | | | $ | — | | | $ | 2,742,280 | |
Amounts designated as “—” are $0 or have been rounded to $0.
See “Glossary” for abbreviations.
The accompanying notes are an integral part of the financial statements.
175
| Schedule of Investments | | November 30, 2023 |
| Global X Green Building ETF |
Sector Weightings (Unaudited)†:
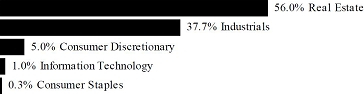
† Sector weightings percentages are based on the total market value of investments. Total investments do not include derivatives such as options, futures contracts, forward contracts, and swap contracts, if applicable.
| | | Shares | | | Value | |
| COMMON STOCK — 99.5% | | | | | | | | |
| AUSTRALIA — 3.9% | | | | | | | | |
| Real Estate — 3.9% | | | | | | | | |
| Charter Hall Retail ‡ | | | 2,844 | | | $ | 6,034 | |
| Scentre Group ‡ | | | 30,094 | | | | 52,878 | |
| Vicinity ‡ | | | 20,967 | | | | 26,345 | |
| | | | | | | | | |
| TOTAL AUSTRALIA | | | | | | | 85,257 | |
| AUSTRIA — 0.3% | | | | | | | | |
| Real Estate — 0.3% | | | | | | | | |
| Immobilien Anlagen | | | 214 | | | | 7,005 | |
| | | | | | | | | |
| CHINA — 2.3% | | | | | | | | |
| Consumer Staples — 0.3% | | | | | | | | |
| Opple Lighting, Cl A | | | 2,400 | | | | 6,157 | |
| | | | | | | | | |
| Real Estate — 2.0% | | | | | | | | |
| China Overseas Land & Investment | | | 21,500 | | | | 39,750 | |
| KWG Group Holdings * | | | 42,000 | | | | 3,764 | |
| | | | | | | | 43,514 | |
| TOTAL CHINA | | | | | | | 49,671 | |
| DENMARK — 0.6% | | | | | | | | |
| Industrials — 0.6% | | | | | | | | |
| ROCKWOOL, Cl B | | | 51 | | | | 13,800 | |
The accompanying notes are an integral part of the financial statements.
176
| Schedule of Investments | | November 30, 2023 |
| Global X Green Building ETF |
| | | Shares | | | Value | |
| COMMON STOCK — continued | | | | | | | | |
| FRANCE — 7.8% | | | | | | | | |
| Real Estate — 7.8% | | | | | | | | |
| Covivio ‡ | | | 430 | | | $ | 21,028 | |
| Gecina ‡ | | | 429 | | | | 47,557 | |
| ICADE ‡ | | | 265 | | | | 9,623 | |
| Klepierre ‡ | | | 1,288 | | | | 32,463 | |
| Mercialys ‡ | | | 756 | | | | 7,477 | |
| Unibail-Rodamco-Westfield ‡ * | | | 808 | | | | 51,468 | |
| | | | | | | | | |
| TOTAL FRANCE | | | | | | | 169,616 | |
| HONG KONG — 1.2% | | | | | | | | |
| Real Estate — 1.2% | | | | | | | | |
| Hang Lung Properties | | | 9,933 | | | | 13,278 | |
| Swire Properties | | | 6,060 | | | | 11,778 | |
| | | | | | | | | |
| TOTAL HONG KONG | | | | | | | 25,056 | |
| IRELAND — 3.3% | | | | | | | | |
| Industrials — 3.3% | | | | | | | | |
| Kingspan Group | | | 889 | | | | 70,615 | |
| | | | | | | | | |
| JAPAN — 17.8% | | | | | | | | |
| Industrials — 3.7% | | | | | | | | |
| Daikin Industries | | | 500 | | | | 74,932 | |
| Hazama Ando | | | 800 | | | | 5,909 | |
| | | | | | | | 80,841 | |
| Information Technology — 1.0% | | | | | | | | |
| Azbil | | | 649 | | | | 20,949 | |
| | | | | | | | | |
| Real Estate — 13.1% | | | | | | | | |
| Activia Properties ‡ | | | 4 | | | | 10,999 | |
| AEON Investment ‡ | | | 9 | | | | 8,754 | |
| CRE Logistics ‡ | | | 6 | | | | 6,668 | |
| Daiwa Office Investment, Cl A ‡ | | | 2 | | | | 9,159 | |
| Frontier Real Estate Investment ‡ | | | 3 | | | | 9,203 | |
| Fukuoka ‡ | | | 6 | | | | 6,753 | |
| Global One Real Estate Investment ‡ | | | 8 | | | | 6,212 | |
| GLP J-Reit ‡ | | | 26 | | | | 24,569 | |
| Japan Metropolitan Fund Invest ‡ | | | 41 | | | | 27,318 | |
The accompanying notes are an integral part of the financial statements.
177
| Schedule of Investments | | November 30, 2023 |
| Global X Green Building ETF |
| | | Shares | | | Value | |
| COMMON STOCK — continued | | | | | | | | |
| Real Estate — continued | | | | | | | | |
| Japan Prime Realty Investment ‡ | | | 5 | | | $ | 12,548 | |
| LaSalle Logiport ‡ | | | 11 | | | | 11,727 | |
| Mitsubishi Estate Logistics REIT Investment ‡ | | | 3 | | | | 7,772 | |
| Mori Hills REIT Investment ‡ | | | 9 | | | | 8,560 | |
| Nippon Building Fund ‡ | | | 9 | | | | 37,806 | |
| Nippon Prologis ‡ | | | 13 | | | | 24,657 | |
| Nomura Real Estate Master Fund ‡ | | | 24 | | | | 27,566 | |
| NTT UD REIT Investment ‡ | | | 8 | | | | 6,900 | |
| Orix JREIT ‡ | | | 15 | | | | 17,695 | |
| Sekisui House Reit ‡ | | | 24 | | | | 13,750 | |
| SOSiLA Logistics ‡ | | | 7 | | | | 5,734 | |
| | | | | | | | 284,350 | |
| TOTAL JAPAN | | | | | | | 386,140 | |
| SINGAPORE — 5.3% | | | | | | | | |
| Real Estate — 5.3% | | | | | | | | |
| Capitaland India Trust | | | 7,856 | | | | 6,063 | |
| CapitaLand Integrated Commercial Trust ‡ | | | 35,000 | | | | 47,730 | |
| Frasers Centrepoint Trust ‡ | | | 6,168 | | | | 10,075 | |
| Frasers Logistics & Commercial Trust ‡ | | | 15,983 | | | | 13,293 | |
| Keppel ‡ | | | 12,012 | | | | 7,785 | |
| Lendlease Global Commercial ‡ | | | 13,524 | | | | 6,131 | |
| Mapletree Pan Asia Commercial Trust ‡ | | | 13,200 | | | | 13,550 | |
| Suntec Real Estate Investment Trust ‡ | | | 11,300 | | | | 9,737 | |
| | | | | | | | | |
| TOTAL SINGAPORE | | | | | | | 114,364 | |
| SPAIN — 1.3% | | | | | | | | |
| Real Estate — 1.3% | | | | | | | | |
| Inmobiliaria Colonial Socimi ‡ | | | 1,454 | | | | 9,582 | |
| Merlin Properties Socimi ‡ | | | 1,805 | | | | 18,237 | |
| | | | | | | | | |
| TOTAL SPAIN | | | | | | | 27,819 | |
| SWEDEN — 0.5% | | | | | | | | |
| Real Estate — 0.5% | | | | | | | | |
| Fabege | | | 1,223 | | | | 10,959 | |
The accompanying notes are an integral part of the financial statements.
178
| Schedule of Investments | | November 30, 2023 |
| Global X Green Building ETF |
| |
| | | Shares | | | Value | |
| COMMON STOCK — continued | | | | | | | | |
| SWITZERLAND — 3.7% | | | | | | | | |
| Industrials — 3.7% | | | | | | | | |
| Belimo Holding | | | 57 | | | $ | 27,951 | |
| Schindler Holding | | | 237 | | | | 53,353 | |
| | | | | | | | | |
| TOTAL SWITZERLAND | | | | | | | 81,304 | |
| UNITED KINGDOM — 5.2% | | | | | | | | |
| Industrials — 0.3% | | | | | | | | |
| Volution Group | | | 1,303 | | | | 6,509 | |
| | | | | | | | | |
| Real Estate — 4.9% | | | | | | | | |
| Land Securities Group ‡ | | | 4,262 | | | | 33,679 | |
| Segro ‡ | | | 6,991 | | | | 71,882 | |
| | | | | | | | 105,561 | |
| TOTAL UNITED KINGDOM | | | | | | | 112,070 | |
| UNITED STATES — 46.3% | | | | | | | | |
| Consumer Discretionary — 5.0% | | | | | | | | |
| KB Home | | | 452 | | | | 23,549 | |
| Meritage Homes | | | 208 | | | | 29,390 | |
| TopBuild * | | | 183 | | | | 54,128 | |
| | | | | | | | 107,067 | |
| Industrials — 25.9% | | | | | | | | |
| AAON | | | 392 | | | | 24,508 | |
| Apogee Enterprises | | | 127 | | | | 5,728 | |
| Carlisle | | | 288 | | | | 80,758 | |
| Carrier Global | | | 1,585 | | | | 82,357 | |
| JELD-WEN Holding * | | | 467 | | | | 7,463 | |
| Lennox International | | | 185 | | | | 75,232 | |
| Otis Worldwide | | | 1,007 | | | | 86,390 | |
| Owens Corning | | | 518 | | | | 70,230 | |
| PGT Innovations * | | | 312 | | | | 10,043 | |
| Signify | | | 722 | | | | 21,002 | |
| Trane Technologies | | | 433 | | | | 97,603 | |
| | | | | | | | 561,314 | |
| Real Estate — 15.4% | | | | | | | | |
| American Assets Trust ‡ | | | 286 | | | | 5,760 | |
The accompanying notes are an integral part of the financial statements.
179
| Schedule of Investments | | November 30, 2023 |
| Global X Green Building ETF |
| | | Shares | | | Value | |
| COMMON STOCK — continued | | | | | | | | |
| Real Estate — continued | | | | | | | | |
| Boston Properties ‡ | | | 910 | | | $ | 51,806 | |
| Brandywine Realty Trust ‡ | | | 1,337 | | | | 5,963 | |
| Cousins Properties ‡ | | | 876 | | | | 17,976 | |
| Digital Realty Trust ‡ | | | 731 | | | | 101,448 | |
| Douglas Emmett ‡ | | | 929 | | | | 11,352 | |
| Elme Communities ‡ | | | 489 | | | | 6,425 | |
| Empire State Realty Trust, Cl A ‡ | | | 737 | | | | 6,604 | |
| Equity Commonwealth ‡ * | | | 609 | | | | 11,443 | |
| Franklin Street Properties ‡ | | | 3,169 | | | | 7,796 | |
| Highwoods Properties ‡ | | | 604 | | | | 11,446 | |
| Hudson Pacific Properties ‡ * | | | 1,008 | | | | 5,917 | |
| JBG SMITH Properties ‡ | | | 584 | | | | 8,012 | |
| Kilroy Realty ‡ | | | 671 | | | | 22,130 | |
| Paramount Group ‡ | | | 1,291 | | | | 6,068 | |
| Piedmont Office Realty Trust, Cl A ‡ | | | 889 | | | | 5,530 | |
| SL Green Realty ‡ | | | 372 | | | | 13,604 | |
| Sunstone Hotel Investors ‡ | | | 1,189 | | | | 11,747 | |
| Vornado Realty Trust ‡ * | | | 963 | | | | 22,669 | |
| | | | | | | | 333,696 | |
| TOTAL UNITED STATES | | | | | | | 1,002,077 | |
TOTAL COMMON STOCK
(Cost $2,139,515) | | | | | | | 2,155,753 | |
TOTAL INVESTMENTS — 99.5%
(Cost $2,139,515) | | | | | | $ | 2,155,753 | |
Percentages are based on Net Assets of $2,165,675.
| * | Non-income producing security. |
| ‡ | Real Estate Investment Trust |
As of November 30, 2023, all of the Fund’s investments were considered Level 1, in accordance with authoritative guidance on fair value measurements and disclosure under U.S. GAAP.
See “Glossary” for abbreviations.
The accompanying notes are an integral part of the financial statements.
180
| Schedule of Investments | | November 30, 2023 |
| Global X Metaverse ETF |
Sector Weightings (Unaudited)†:

† Sector weightings percentages are based on the total market value of investments. Total investments do not include derivatives such as options, futures contracts, forward contracts, and swap contracts, if applicable.
| | | Shares | | | Value | |
| COMMON STOCK — 99.9% | | | | | | | | |
| CHINA — 12.8% | | | | | | | | |
| Communication Services — 12.5% | | | | | | | | |
| Hello Group ADR | | | 1,799 | | | $ | 11,621 | |
| HUYA ADR * | | | 1,867 | | | | 6,329 | |
| NetEase ADR | | | 1,268 | | | | 143,893 | |
| Tencent Holdings | | | 3,540 | | | | 148,212 | |
| | | | | | | | 310,055 | |
| Consumer Discretionary — 0.3% | | | | | | | | |
| Alibaba Group Holding ADR | | | 108 | | | | 8,087 | |
| | | | | | | | | |
| TOTAL CHINA | | | | | | | 318,142 | |
| FRANCE — 1.8% | | | | | | | | |
| Communication Services — 1.8% | | | | | | | | |
| Ubisoft Entertainment * | | | 1,558 | | | | 44,419 | |
| | | | | | | | | |
| IRELAND — 0.6% | | | | | | | | |
| Information Technology — 0.6% | | | | | | | | |
| Keywords Studios | | | 959 | | | | 16,608 | |
| | | | | | | | | |
| JAPAN — 21.6% | | | | | | | | |
| Communication Services — 21.6% | | | | | | | | |
| Capcom | | | 3,214 | | | | 108,333 | |
| Cover * | | | 740 | | | | 16,218 | |
| DeNA | | | 1,477 | | | | 15,026 | |
| GungHo Online Entertainment * | | | 1,064 | | | | 16,496 | |
| Koei Tecmo Holdings | | | 4,129 | | | | 50,567 | |
| MIXI | | | 895 | | | | 14,633 | |
The accompanying notes are an integral part of the financial statements.
181
| Schedule of Investments | | November 30, 2023 |
| Global X Metaverse ETF |
| | | Shares | | | Value | |
| COMMON STOCK — continued | | | | | | | | |
| Communication Services — continued | | | | | | | | |
| Nexon | | | 5,337 | | | $ | 115,451 | |
| Nintendo | | | 3,183 | | | | 148,821 | |
| Square Enix Holdings | | | 1,501 | | | | 52,106 | |
| | | | | | | | | |
| TOTAL JAPAN | | | | | | | 537,651 | |
| SOUTH KOREA — 10.2% | | | | | | | | |
| Communication Services — 9.6% | | | | | | | | |
| Krafton * | | | 590 | | | | 97,407 | |
| NCSoft | | | 268 | | | | 54,424 | |
| Netmarble * | | | 1,048 | | | | 48,251 | |
| Pearl Abyss * | | | 782 | | | | 22,912 | |
| Wemade | | | 410 | | | | 17,034 | |
| | | | | | | | 240,028 | |
| Information Technology — 0.6% | | | | | | | | |
| Samsung Electronics | | | 255 | | | | 14,389 | |
| | | | | | | | | |
| TOTAL SOUTH KOREA | | | | | | | 254,417 | |
| SWEDEN — 1.5% | | | | | | | | |
| Communication Services — 1.5% | | | | | | | | |
| Modern Times Group MTG, Cl B * | | | 1,516 | | | | 12,254 | |
| Paradox Interactive | | | 1,288 | | | | 25,812 | |
| | | | | | | | | |
| TOTAL SWEDEN | | | | | | | 38,066 | |
| TAIWAN — 0.9% | | | | | | | | |
| Information Technology — 0.9% | | | | | | | | |
| Taiwan Semiconductor Manufacturing ADR | | | 222 | | | | 21,603 | |
| | | | | | | | | |
| TOTAL TAIWAN | | | | | | | 21,603 | |
| UNITED STATES — 50.5% | | | | | | | | |
| Communication Services — 23.0% | | | | | | | | |
| Alphabet, Cl A * | | | 254 | | | | 33,663 | |
| Meta Platforms, Cl A * | | | 438 | | | | 143,292 | |
| ROBLOX, Cl A * | | | 3,016 | | | | 118,559 | |
| Snap, Cl A * | | | 9,182 | | | | 126,987 | |
| Take-Two Interactive Software * | | | 948 | | | | 149,973 | |
| | | | | | | | 572,474 | |
The accompanying notes are an integral part of the financial statements.
182
| Schedule of Investments | | November 30, 2023 |
| Global X Metaverse ETF |
| | | Shares | | | Value | |
| COMMON STOCK — continued | | | | | | | | |
| Consumer Discretionary — 2.6% | | | | | | | | |
| Amazon.com * | | | 444 | | | $ | 64,864 | |
| | | | | | | | | |
| Financials — 5.3% | | | | | | | | |
| Coinbase Global, Cl A * | | | 1,050 | | | | 130,956 | |
| | | | | | | | | |
| Information Technology — 19.6% | | | | | | | | |
| Adobe * | | | 19 | | | | 11,609 | |
| Advanced Micro Devices * | | | 69 | | | | 8,360 | |
| Apple | | | 516 | | | | 98,014 | |
| Cisco Systems | | | 172 | | | | 8,322 | |
| Matterport * | | | 3,703 | | | | 9,332 | |
| Microsoft | | | 264 | | | | 100,032 | |
| NVIDIA | | | 296 | | | | 138,439 | |
| Unity Software * | | | 3,896 | | | | 114,971 | |
| | | | | | | | 489,079 | |
| TOTAL UNITED STATES | | | | | | | 1,257,373 | |
TOTAL COMMON STOCK
(Cost $2,371,799) | | | | | | | 2,488,279 | |
TOTAL INVESTMENTS — 99.9%
(Cost $2,371,799) | | | | | | $ | 2,488,279 | |
Percentages are based on Net Assets of $2,489,890.
| * | Non-income producing security. |
As of November 30, 2023, all of the Fund’s investments were considered Level 1, in accordance with authoritative guidance on fair value measurements and disclosure under U.S. GAAP.
See “Glossary” for abbreviations.
The accompanying notes are an integral part of the financial statements.
183
| Schedule of Investments | | November 30, 2023 |
| Global X Proptech ETF |
Sector Weightings (Unaudited)†:

† Sector weightings percentages are based on the total market value of investments. Total investments do not include derivatives such as options, futures contracts, forward contracts, and swap contracts, if applicable.
| | | Shares | | | Value | |
| COMMON STOCK — 99.9% | | | | | | | | |
| AUSTRALIA — 7.2% | | | | | | | | |
| Communication Services — 5.4% | | | | | | | | |
| Domain Holdings Australia | | | 11,933 | | | $ | 27,060 | |
| REA Group | | | 1,183 | | | | 121,776 | |
| | | | | | | | 148,836 | |
| Real Estate — 1.8% | | | | | | | | |
| PEXA Group * | | | 6,086 | | | | 48,343 | |
| TOTAL AUSTRALIA | | | | | | | 197,179 | |
| CHINA — 8.9% | | | | | | | | |
| Information Technology — 0.4% | | | | | | | | |
| Ming Yuan Cloud Group Holdings * | | | 27,690 | | | | 11,558 | |
| | | | | | | | | |
| Real Estate — 8.5% | | | | | | | | |
| KE Holdings ADR | | | 14,555 | | | | 231,861 | |
| TOTAL CHINA | | | | | | | 243,419 | |
The accompanying notes are an integral part of the financial statements.
184
| Schedule of Investments | November 30, 2023 |
Global X Proptech ETF
| | | Shares | | | Value | |
| COMMON STOCK — continued | | | | | | | | |
| GERMANY — 11.5% | | | | | | | | |
| Communication Services — 4.7% | | | | | | | | |
| Scout24 | | | 1,831 | | | $ | 127,859 | |
| | | | | | | | | |
| Financials — 1.0% | | | | | | | | |
| Hypoport * | | | 188 | | | | 27,897 | |
| | | | | | | | | |
| Information Technology — 5.8% | | | | | | | | |
| Nemetschek | | | 1,822 | | | | 159,118 | |
| | | | | | | | | |
| TOTAL GERMANY | | | | | | | 314,874 | |
| JAPAN — 0.6% | | | | | | | | |
| Communication Services — 0.3% | | | | | | | | |
| GA Technologies * | | | 780 | | | | 6,479 | |
| | | | | | | | | |
| Real Estate — 0.3% | | | | | | | | |
| SRE Holdings * | | | 490 | | | | 9,195 | |
| | | | | | | | | |
| TOTAL JAPAN | | | | | | | 15,674 | |
| SWEDEN — 3.0% | | | | | | | | |
| Communication Services — 3.0% | | | | | | | | |
| Hemnet Group | | | 3,612 | | | | 82,106 | |
| | | | | | | | | |
| SWITZERLAND — 2.3% | | | | | | | | |
| Real Estate — 2.3% | | | | | | | | |
| IWG * | | | 34,349 | | | | 62,095 | |
| | | | | | | | | |
| UNITED KINGDOM — 4.4% | | | | | | | | |
| Communication Services — 4.4% | | | | | | | | |
| Rightmove | | | 17,323 | | | | 119,431 | |
| | | | | | | | | |
| UNITED STATES — 62.0% | | | | | | | | |
| Communication Services — 0.3% | | | | | | | | |
| Angi, Cl A * | | | 3,691 | | | | 8,305 | |
| | | | | | | | | |
| Consumer Discretionary — 11.3% | | | | | | | | |
| ADT | | | 15,219 | | | | 89,336 | |
The accompanying notes are an integral part of the financial statements.
185
| Schedule of Investments | November 30, 2023 |
Global X Proptech ETF
| | | Shares | | | Value | |
| COMMON STOCK — continued | | | | | | | | |
| Consumer Discretionary — continued | | | | | | | | |
| Airbnb, Cl A * | | | 1,718 | | | $ | 217,052 | |
| | | | | | | | 306,388 | |
| Financials — 2.8% | | | | | | | | |
| Hippo Holdings * | | | 586 | | | | 5,010 | |
| Rocket, Cl A * | | | 5,316 | | | | 49,652 | |
| UWM Holdings | | | 4,038 | | | | 22,007 | |
| | | | | | | | 76,669 | |
| Industrials — 4.2% | | | | | | | | |
| Resideo Technologies * | | | 6,989 | | | | 114,829 | |
| | | | | | | | | |
| Information Technology — 25.9% | | | | | | | | |
| Alarm.com Holdings * | | | 2,113 | | | | 115,116 | |
| Appfolio, Cl A * | | | 724 | | | | 137,017 | |
| Arlo Technologies * | | | 4,211 | | | | 38,278 | |
| Blend Labs, Cl A * | | | 7,453 | | | | 9,465 | |
| Guidewire Software * | | | 1,526 | | | | 152,508 | |
| Matterport * | | | 11,934 | | | | 30,074 | |
| Procore Technologies * | | | 3,394 | | | | 200,552 | |
| SmartRent, Cl A * | | | 7,426 | | | | 23,243 | |
| | | | | | | | 706,253 | |
| Real Estate — 17.5% | | | | | | | | |
| CoStar Group * | | | 2,745 | | | | 227,945 | |
| Opendoor Technologies * | | | 25,234 | | | | 75,954 | |
| Zillow Group, Cl C * | | | 4,223 | | | | 172,890 | |
| | | | | | | | 476,789 | |
| TOTAL UNITED STATES | | | | | | | 1,689,233 | |
TOTAL COMMON STOCK
(Cost $2,569,341) | | | | | | | 2,724,011 | |
The accompanying notes are an integral part of the financial statements.
186
| Schedule of Investments | November 30, 2023 |
Global X Proptech ETF
| | | Face Amount | | | Value | |
| U.S. TREASURY OBLIGATION — 3.7% | | | | | | | | |
U.S. Treasury Bill
5.312%, 01/02/24(A) | | $ | 100,000 | | | $ | 99,531 | |
TOTAL U.S. TREASURY OBLIGATION
(Cost $99,589) | | | | | | | 99,531 | |
TOTAL INVESTMENTS — 103.6%
(Cost $2,668,930) | | | | | | $ | 2,823,542 | |
Percentages are based on Net Assets of $2,725,991.
| * | Non-income producing security. |
| (A) | Interest rate represents the security’s effective yield at the time of purchase. |
The following is a summary of the level of inputs used as of November 30, 2023, in valuing the Fund’s investments carried at value:
| Investments in Securities | | Level 1 | | | Level 2 | | | Level 3 | | | Total | |
| Common Stock | | $ | 2,724,011 | | | $ | — | | | $ | — | | | $ | 2,724,011 | |
| U.S. Treasury Obligation | | | — | | | | 99,531 | | | | — | | | | 99,531 | |
| Total Investments in Securities | | $ | 2,724,011 | | | $ | 99,531 | | | $ | — | | | $ | 2,823,542 | |
Amounts designated as “—” are $0 or have been rounded to $0.
See “Glossary” for abbreviations.
The accompanying notes are an integral part of the financial statements.
187
| Consolidated Schedule of Investments | November 30, 2023 |
Global X Carbon Credits Strategy ETF
Sector Weightings (Unaudited)†:

† Sector weightings percentages are based on the total market value of investments. Total investments do not include derivatives such as options, futures contracts, forward contracts, and swap contracts, if applicable.
| | | Shares | | | Value | |
| EXCHANGE TRADED FUND — 47.6% | | | | | | | | |
| Global X 1-3 Month T-Bill ETF (A) | | | 30,000 | | | $ | 753,900 | |
TOTAL EXCHANGE TRADED FUND
(Cost $752,721) | | | | | | | 753,900 | |
| | | | | | | | |
| | | Face Amount | | | | | |
| SOVEREIGN BONDS — 26.3% | | | | | | | | |
| Belgium — 3.4% | | | | | | | | |
Kingdom of Belgium Treasury Bill
3.514%, 03/07/24(B) | | $ | 50,000 | | | | 54,020 | |
| France — 10.9% | | | | | | | | |
France Treasury Bill BTF DN
3.494%, 04/04/24(B) | | | 160,000 | | | | 172,373 | |
| Supranational — 6.9% | | | | | | | | |
European Stability Mechanism Treasury Bill
3.452%, 02/08/24(B) | | | 50,000 | | | | 54,178 | |
European Union Bill
3.468%, 12/08/23(B) | | | 50,000 | | | | 54,532 | |
| | | | | | | | 108,710 | |
| United Kingdom — 5.1% | | | | | | | | |
United Kingdom Treasury Bill
4.292%, 02/12/24(B) | | | 65,000 | | | | 81,427 | |
TOTAL SOVEREIGN BONDS
(Cost $408,795) | | | | | | | 416,530 | |
| | | | | | | | | |
| U.S. TREASURY OBLIGATIONS — 15.6% | | | | | | | | |
U.S. Treasury Bills
5.327%, 02/15/24(B)^ | | | 125,000 | | | | 123,618 | |
The accompanying notes are an integral part of the financial statements.
188
| Consolidated Schedule of Investments | November 30, 2023 |
Global X Carbon Credits Strategy ETF
| | | Face Amount | | | Value | |
| U.S. TREASURY OBLIGATIONS — continued | | | | | | | | |
| 5.330%, 02/08/24(B)^ | | $ | 125,000 | | | $ | 123,746 | |
TOTAL U.S. TREASURY OBLIGATIONS
(Cost $247,354) | | | | | | | 247,364 | |
TOTAL INVESTMENTS — 89.5%
(Cost $1,408,870) | | | | | | $ | 1,417,794 | |
Percentages are based on Net Assets of $1,583,550.
A list of open futures contracts held by the Fund at November 30, 2023, was as follows:
| Type of Contract | | Number of
Contracts | | Expiration
Date | | Notional Amount | | | Value | | | Unrealized
Appreciation/
(Depreciation) | |
| Long Contracts | | | | | | | | | | | | | | | | |
| UK EMISS Allowance^ | | 7 | | Dec-2024 | | $ | 388,138 | | | $ | 382,203 | | | $ | (15,647 | ) |
| British Pound^ | | 4 | | Dec-2023 | | | 306,752 | | | | 315,625 | | | | 8,873 | |
| CA Carbon Allowance^ | | 9 | | Dec-2024 | | | 362,555 | | | | 372,690 | | | | 10,135 | |
| Euro FX^ | | 3 | | Dec-2023 | | | 404,813 | | | | 408,638 | | | | 3,825 | |
| ICE ECX Emission^ | | 9 | | Dec-2024 | | | 810,892 | | | | 726,866 | | | | (106,792 | ) |
| RGGI VINTAGE^ | | 5 | | Dec-2024 | | | 78,005 | | | | 78,750 | | | | 745 | |
| | | | | | | $ | 2,351,155 | | | $ | 2,284,772 | | | $ | (98,861 | ) |
| (A) | Affiliated investment. |
| (B) | Interest rate represents the security’s effective yield at the time of purchase. |
| ^ | Security is held by the Global X Carbon Credit Strategy Subsidiary Limited, as of November 30, 2023. |
The accompanying notes are an integral part of the financial statements.
189
| Consolidated Schedule of Investments | November 30, 2023 |
Global X Carbon Credits Strategy ETF
The following is a summary of the level of inputs used as of November 30, 2023, in valuing the Fund’s investments and other financial instruments carried at value:
| Investments in Securities | | Level 1 | | Level 2 | | Level 3 | | Total |
| Exchange Traded Fund | | $ | 753,900 | | | $ | — | | | $ | — | | | $ | 753,900 | |
| Sovereign Bonds | | | — | | | | 416,530 | | | | — | | | | 416,530 | |
| U.S. Treasury Obligations | | | — | | | | 247,364 | | | | — | | | | 247,364 | |
| Total Investments in Securities | | $ | 753,900 | | | $ | 663,894 | | | $ | — | | | $ | 1,417,794 | |
| | | | | | | | | | | | | | | | | |
| Other Financial Instruments | | | Level 1 | | | Level 2 | | | Level 3 | | | Total |
| Futures Contracts* | | | | | | | | | | | | | | | | |
| Unrealized Appreciation | | $ | 23,578 | | | $ | — | | | $ | — | | | $ | 23,578 | |
| Unrealized Depreciation | | | (122,439 | ) | | | — | | | | — | | | | (122,439 | ) |
| Total Other Financial Instruments | | $ | (98,861 | ) | | $ | — | | | $ | — | | | $ | (98,861 | ) |
| * | Futures contracts are valued at the unrealized appreciation (depreciation) on the instrument. |
The following is a summary of the transactions with affiliates for the year ended November 30, 2023:
| | | Value at
11/30/22 | | | Purchases at
Cost | | | Proceeds from
Sales | | | Changes in
Unrealized
Appreciation
(Depreciation) | | | Realized Gain
(Loss) | | | Value at
11/30/23 | | | Dividend
Income | | | Capital Gain | |
| Global X 1-3 Month T-Bill ETF | | | | | | | | | | | | | | | | | | | | | | | | |
| | | $ | — | | | $ | 752,721 | | | $ | — | | | $ | 1,179 | | | $ | — | | | $ | 753,900 | | | $ | 6,449 | | | $ | — | |
| Totals: | | | | | | | | | | | | | | | | | | | | | | | | | | | | | |
| | | $ | — | | | $ | 752,721 | | | $ | — | | | $ | 1,179 | | | $ | — | | | $ | 753,900 | | | $ | 6,449 | | | $ | — | |
Amounts designated as ” —” are $0 or have been rounded to $0.
See “Glossary” for abbreviations.
The accompanying notes are an integral part of the financial statements.
190
| Schedule of Investments | November 30, 2023 |
Global X Defense Tech ETF
Sector Weightings (Unaudited)†:

† Sector weightings percentages are based on the total market value of investments. Total investments do not include derivatives such as options, futures contracts, forward contracts, and swap contracts, if applicable.
| | | Shares | | | Value | |
| COMMON STOCK — 99.7% | | | | | | | | |
| FRANCE — 6.4% | | | | | | | | |
| Industrials — 6.4% | | | | | | | | |
| Dassault Aviation | | | 471 | | | $ | 93,737 | |
| Thales | | | 1,359 | | | | 203,069 | |
| | | | | | | | | |
| TOTAL FRANCE | | | | | | | 296,806 | |
| GERMANY — 5.1% | | | | | | | | |
| Industrials — 5.1% | | | | | | | | |
| Hensoldt | | | 1,229 | | | | 32,344 | |
| Rheinmetall | | | 672 | | | | 202,368 | |
| | | | | | | | | |
| TOTAL GERMANY | | | | | | | 234,712 | |
| ISRAEL — 2.5% | | | | | | | | |
| Industrials — 2.5% | | | | | | | | |
| Elbit Systems | | | 588 | | | | 117,265 | |
| | | | | | | | | |
| ITALY — 3.2% | | | | | | | | |
| Industrials — 3.2% | | | | | | | | |
| Leonardo | | | 9,472 | | | | 145,411 | |
| | | | | | | | | |
| SOUTH KOREA — 3.9% | | | | | | | | |
| Industrials — 3.9% | | | | | | | | |
| Hanwha Aerospace | | | 790 | | | | 77,093 | |
| Hanwha Systems | | | 1,512 | | | | 18,868 | |
| Korea Aerospace Industries | | | 1,663 | | | | 59,745 | |
| LIG Nex1 | | | 288 | | | | 21,765 | |
| | | | | | | | | |
| TOTAL SOUTH KOREA | | | | | | | 177,471 | |
The accompanying notes are an integral part of the financial statements.
191
| Schedule of Investments | November 30, 2023 |
Global X Defense Tech ETF
| | | Shares | | | Value | |
| COMMON STOCK — continued | | | | | | | | |
| SWEDEN — 2.4% | | | | | | | | |
| Industrials — 2.4% | | | | | | | | |
| Saab, Cl B | | | 2,132 | | | $ | 109,704 | |
| | | | | | | | | |
| TURKEY — 1.0% | | | | | | | | |
| Industrials — 1.0% | | | | | | | | |
| Aselsan Elektronik Sanayi Ve Ticaret | | | 27,801 | | | | 47,061 | |
| | | | | | | | | |
| UNITED KINGDOM — 10.7% | | | | | | | | |
| Industrials — 10.7% | | | | | | | | |
| Babcock International Group | | | 11,146 | | | | 55,707 | |
| BAE Systems | | | 27,701 | | | | 368,215 | |
| Chemring Group | | | 6,624 | | | | 26,457 | |
| QinetiQ Group | | | 10,615 | | | | 39,777 | |
| | | | | | | | | |
| TOTAL UNITED KINGDOM | | | | | | | 490,156 | |
| UNITED STATES — 64.5% | | | | | | | | |
| Industrials — 59.1% | | | | | | | | |
| AeroVironment * | | | 616 | | | | 84,768 | |
| BWX Technologies | | | 2,174 | | | | 169,637 | |
| General Dynamics | | | 1,487 | | | | 367,244 | |
| Huntington Ingalls Industries | | | 863 | | | | 204,548 | |
| Kratos Defense & Security Solutions * | | | 3,024 | | | | 57,607 | |
| L3Harris Technologies | | | 1,101 | | | | 210,082 | |
| Leidos Holdings | | | 1,947 | | | | 208,952 | |
| Lockheed Martin | | | 818 | | | | 366,276 | |
| Mercury Systems * | | | 1,306 | | | | 44,783 | |
| Moog, Cl A | | | 667 | | | | 93,387 | |
| National Presto Industries | | | 126 | | | | 9,415 | |
| Northrop Grumman | | | 783 | | | | 372,050 | |
| Parsons * | | | 2,468 | | | | 153,732 | |
| RTX | | | 4,563 | | | | 371,793 | |
| Terran Orbital * | | | 2,810 | | | | 2,276 | |
| | | | | | | | 2,716,550 | |
| Information Technology — 5.4% | | | | | | | | |
| BigBear.ai Holdings * | | | 918 | | | | 1,561 | |
| OSI Systems * | | | 378 | | | | 46,604 | |
The accompanying notes are an integral part of the financial statements.
192
| Schedule of Investments | November 30, 2023 |
Global X Defense Tech ETF
| | | Shares | | | Value | |
| COMMON STOCK — continued | | | | | | | | |
| Information Technology — continued | | | | | | | | |
| Palantir Technologies, Cl A * | | | 9,989 | | | $ | 200,279 | |
| | | | | | | | 248,444 | |
| TOTAL UNITED STATES | | | | | | | 2,964,994 | |
TOTAL COMMON STOCK
(Cost $4,303,848) | | | | | | | 4,583,580 | |
| | | | | | | | | |
| | | Face Amount | | | | | |
| U.S. TREASURY OBLIGATION — 2.2% | | | | | | | | |
U.S. Treasury Bill
5.312%, 01/02/24(A) | | $ | 100,000 | | | | 99,531 | |
TOTAL U.S. TREASURY OBLIGATION
(Cost $99,588) | | | | | | | 99,531 | |
TOTAL INVESTMENTS — 101.9%
(Cost $4,403,436) | | | | | | $ | 4,683,111 | |
Percentages are based on Net Assets of $4,594,859.
| * | Non-income producing security. |
| (A) | Interest rate represents the security’s effective yield at the time of purchase. |
The following is a summary of the level of inputs used as of November 30, 2023, in valuing the Fund’s investments carried at value:
| Investments in Securities | | Level 1 | | | Level 2 | | | Level 3 | | | Total | |
| Common Stock | | $ | 4,583,580 | | | $ | — | | | $ | — | | | $ | 4,583,580 | |
| U.S. Treasury Obligation | | | — | | | | 99,531 | | | | — | | | | 99,531 | |
| Total Investments in Securities | | $ | 4,583,580 | | | $ | 99,531 | | | $ | — | | | $ | 4,683,111 | |
Amounts designated as ” —” are $0 or have been rounded to $0.
See “Glossary” for abbreviations.
The accompanying notes are an integral part of the financial statements.
193
| Schedule of Investments | November 30, 2023 |
Glossary (abbreviations which may be used in the preceding Schedules of Investments):
Fund Abbreviations
ADR — American Depositary Receipt
Cl — Class
ETF — Exchange-Traded Fund
REIT — Real Estate Investment Trust
194
Statements of Assets and Liabilities
November 30, 2023
| | | Global X
Millennial
Consumer ETF | | | Global X Aging
Population ETF | | | Global X Health
& Wellness ETF | | | Global X
Robotics &
Artificial
Intelligence ETF | |
| Assets: | | | | | | | | | | | | | | | | |
| Cost of Investments | | $ | 140,764,059 | | | $ | 60,371,029 | | | $ | 13,176,443 | | | $ | 2,325,247,163 | |
| Cost of Repurchase Agreement | | | 25,528 | | | | — | | | | — | | | | 66,117,002 | |
| Cost/(Proceeds) of Foreign Currency | | | — | | | | — | | | | 1,727 | | | | (19,465 | ) |
| Investments, at Value | | $ | 105,353,739 | * | | $ | 53,503,826 | | | $ | 9,138,033 | | | $ | 2,281,200,763 | * |
| Repurchase Agreement, at Value | | | 25,528 | | | | — | | | | — | | | | 66,117,002 | |
| Cash | | | 146,476 | | | | 13,993 | | | | 2,649 | | | | 1,649,509 | |
| Foreign Currency, at Value | | | — | | | | — | | | | 650 | | | | — | |
| Dividend, Interest, and Securities Lending Income Receivable | | | 42,805 | | | | 52,352 | | | | 6,006 | | | | 3,468,376 | |
| Unrealized Appreciation on Spot Contracts | | | — | | | | — | | | | — | | | | 42 | |
| Receivable for Capital Shares Sold | | | — | | | | 1,525 | | | | 19,137 | | | | 30,173,935 | |
| Reclaim Receivable | | | — | | | | 62,494 | | | | 18,707 | | | | 4,889,791 | |
| Due from Broker | | | — | | | | 71 | | | | — | | | | 460,539 | |
| Total Assets | | | 105,568,548 | | | | 53,634,261 | | | | 9,185,182 | | | | 2,387,959,957 | |
| Liabilities: | | | | | | | | | | | | | | | | |
| Obligation to Return Securities Lending Collateral | | | 33,320 | | | | — | | | | — | | | | 86,297,422 | |
| Payable due to Investment Adviser | | | 41,871 | | | | 21,496 | | | | 3,969 | | | | 1,165,838 | |
| Payable for Investment Securities Purchased | | | — | | | | — | | | | — | | | | 30,170,547 | |
| Payable for Capital Shares Redeemed | | | — | | | | — | | | | — | | | | 460,539 | |
| Payable for Variation Margin on Futures Contracts | | | — | | | | — | | | | — | | | | 19,890 | |
| Unrealized Depreciation on Spot Contracts | | | — | | | | 7 | | | | 2 | | | | — | |
| Cash Overdraft | | | — | | | | — | | | | — | | | | 19,730 | |
| Due to Custodian | | | — | | | | — | | | | 61 | | | | 2,359 | |
| Due to Broker | | | — | | | | 17,125 | | | | 19,137 | | | | — | |
| Total Liabilities | | | 75,191 | | | | 38,628 | | | | 23,169 | | | | 118,136,325 | |
| Net Assets | | $ | 105,493,357 | | | $ | 53,595,633 | | | $ | 9,162,013 | | | $ | 2,269,823,632 | |
| Net Assets Consist of: | | | | | | | | | | | | | | | | |
| Paid-in Capital | | $ | 149,225,858 | | | $ | 62,390,755 | | | $ | 15,600,580 | | | $ | 2,708,671,320 | |
| Total Accumulated Losses | | | (43,732,501 | ) | | | (8,795,122 | ) | | | (6,438,567 | ) | | | (438,847,688 | ) |
| Net Assets | | $ | 105,493,357 | | | $ | 53,595,633 | | | $ | 9,162,013 | | | $ | 2,269,823,632 | |
| Outstanding Shares of Beneficial Interest (unlimited authorization — no par value) | | | 3,210,000 | | | | 1,990,000 | | | | 410,000 | | | | 85,760,000 | |
| Net Asset Value, Offering and Redemption Price Per Share | | | $32.86 | | | | $26.93 | | | | $22.35 | | | | $26.47 | |
| *Includes Market Value of Securities on Loan | | $ | 32,592 | | | $ | — | | | $ | — | | | $ | 81,818,095 | |
The accompanying notes are an integral part of the financial statements.
195
Statements of Assets and Liabilities
November 30, 2023
| | | Global X FinTech
ETF | | | Global X Internet
of Things ETF | | | Global X U.S.
Infrastructure
Development
ETF | | | Global X
Autonomous &
Electric Vehicles
ETF | |
| Assets: | | | | | | | | | | | | |
| Cost of Investments | | $ | 556,912,402 | | | $ | 272,460,694 | | | $ | 4,544,979,466 | | | $ | 941,340,404 | |
| Cost of Repurchase Agreement | | | 7,247,277 | | | | 1,366,862 | | | | — | | | | 46,594,943 | |
| Cost/(Proceeds) of Foreign Currency | | | 358 | | | | 5,840 | | | | — | | | | 62,381 | |
| Investments, at Value | | $ | 350,952,331 | * | | $ | 285,296,376 | * | | $ | 5,097,771,856 | | | $ | 709,845,616 | * |
| Repurchase Agreement, at Value | | | 7,247,277 | | | | 1,366,862 | | | | — | | | | 46,594,943 | |
| Cash | | | 1,165,211 | | | | 1,774,860 | | | | 52,036,240 | | | | 584,402 | |
| Foreign Currency, at Value | | | 358 | | | | 6,034 | | | | — | | | | 62,147 | |
| Reclaim Receivable | | | 251,421 | | | | 241,264 | | | | 121,889 | | | | 445,216 | |
| Dividend, Interest, and Securities Lending Income Receivable | | | 152,710 | | | | 322,012 | | | | 5,874,545 | | | | 1,412,554 | |
| Unrealized Appreciation on Spot Contracts | | | — | | | | — | | | | — | | | | 242 | |
| Receivable for Capital Shares Sold | | | — | | | | 2,087 | | | | — | | | | 61,404 | |
| Receivable for Investment Securities Sold | | | — | | | | — | | | | 23,039,141 | | | | — | |
| Due from Broker | | | 10,291 | | | | — | | | | — | | | | — | |
| Total Assets | | | 359,779,599 | | | | 289,009,495 | | | | 5,178,843,671 | | | | 759,006,524 | |
| Liabilities: | | | | | | | | | | | | | | | | |
| Obligation to Return Securities Lending Collateral | | | 7,247,277 | | | | 1,366,862 | | | | — | | | | 60,816,785 | |
| Payable for Investment Securities Purchased | | | 872,005 | | | | — | | | | — | | | | — | |
| Payable due to Investment Adviser | | | 182,647 | | | | 153,328 | | | | 1,994,402 | | | | 383,251 | |
| Payable for Capital Shares Redeemed | | | — | | | | — | | | | 23,053,443 | | | | — | |
| Due to Custodian | | | 4 | | | | — | | | | — | | | | 175 | |
| Due to Broker | | | — | | | | 2,087 | | | | — | | | | 61,404 | |
| Total Liabilities | | | 8,301,933 | | | | 1,522,277 | | | | 25,047,845 | | | | 61,261,615 | |
| Net Assets | | $ | 351,477,666 | | | $ | 287,487,218 | | | $ | 5,153,795,826 | | | $ | 697,744,909 | |
| Net Assets Consist of: | | | | | | | | | | | | | | | | |
| Paid-in Capital | | $ | 731,770,517 | | | $ | 290,234,849 | | | $ | 4,604,839,660 | | | $ | 1,024,707,657 | |
| Total Distributable Earnings (Accumulated Losses) | | | (380,292,851 | ) | | | (2,747,631 | ) | | | 548,956,166 | | | | (326,962,748 | ) |
| Net Assets | | $ | 351,477,666 | | | $ | 287,487,218 | | | $ | 5,153,795,826 | | | $ | 697,744,909 | |
| Outstanding Shares of Beneficial Interest (unlimited authorization — no par value) | | | 15,710,000 | | | | 8,860,000 | | | | 163,590,000 | | | | 30,090,002 | |
| Net Asset Value, Offering and Redemption Price Per Share | | | $22.37 | | | | $32.45 | | | | $31.50 | | | | $23.19 | |
| *Includes Market Value of Securities on Loan | | $ | 8,549,815 | | | $ | 1,242,244 | | | $ | — | | | $ | 57,928,613 | |
The accompanying notes are an integral part of the financial statements.
196
Statements of Assets and Liabilities
November 30, 2023
| | | Global X
Artificial
Intelligence &
Technology ETF | | | Global X
Genomics &
Biotechnology
ETF | | | Global X Cloud
Computing ETF | | | Global X
Cannabis ETF | |
| Assets: | | | | | | | | | | | | | | | | |
| Cost of Investments | | $ | 741,265,645 | | | $ | 143,898,128 | | | $ | 812,447,906 | | | $ | 45,263,178 | |
| Cost of Repurchase Agreement | | | 1,496,891 | | | | 4,034,834 | | | | 783,762 | | | | 2,766,741 | |
| Cost of Affiliated Investments | | | — | | | | — | | | | — | | | | 6,172,401 | |
| Cost/(Proceeds) of Foreign Currency | | | 60,248 | | | | — | | | | — | | | | — | |
| Investments, at Value | | $ | 788,616,462 | * | | $ | 92,876,335 | * | | $ | 580,541,229 | * | | $ | 27,901,682 | * |
| Repurchase Agreement, at Value | | | 1,496,891 | | | | 4,034,834 | | | | 783,762 | | | | 2,766,741 | |
| Affiliated Investments, at Value | | | — | | | | — | | | | — | | | | 2,051,809 | |
| Cash | | | 706,855 | | | | 187,053 | | | | 1,078,039 | | | | 203,139 | |
| Foreign Currency, at Value | | | 60,236 | | | | — | | | | — | | | | — | |
| Receivable for Capital Shares Sold | | | 12,822,908 | | | | — | | | | — | | | | — | |
| Dividend, Interest, and Securities Lending Income Receivable | | | 757,254 | | | | 2,410 | | | | 87,337 | | | | 10,766 | |
| Reclaim Receivable | | | 57,200 | | | | — | | | | — | | | | — | |
| Receivable for Investment Securities Sold | | | — | | | | — | | | | — | | | | 532,103 | |
| Due from Broker | | | 2,268 | | | | — | | | | — | | | | 35,761 | |
| Total Assets | | | 804,520,074 | | | | 97,100,632 | | | | 582,490,367 | | | | 33,502,001 | |
| Liabilities: | | | | | | | | | | | | | | | | |
| Obligation to Return Securities Lending Collateral | | | 1,496,891 | | | | 4,034,834 | | | | 1,022,984 | | | | 2,766,741 | |
| Payable for Investment Securities Purchased | | | 12,702,793 | | | | — | | | | — | | | | 2,263,971 | |
| Payable due to Investment Adviser | | | 396,202 | | | | 36,752 | | | | 304,819 | | | | 11,812 | |
| Unrealized Depreciation on Spot Contracts | | | 426 | | | | — | | | | — | | | | 22 | |
| Payable for Capital Shares Redeemed | | | — | | | | — | | | | — | | | | 35,761 | |
| Due to Custodian | | | — | | | | — | | | | 122 | | | | — | |
| Due to Broker | | | 48,529 | | | | — | | | | — | | | | — | |
| Total Liabilities | | | 14,644,841 | | | | 4,071,586 | | | | 1,327,925 | | | | 5,078,307 | |
| Net Assets | | $ | 789,875,233 | | | $ | 93,029,046 | | | $ | 581,162,442 | | | $ | 28,423,694 | |
| Net Assets Consist of: | | | | | | | | | | | | | | | | |
| Paid-in Capital | | $ | 752,499,709 | | | $ | 242,788,706 | | | $ | 976,040,704 | | | $ | 323,349,760 | |
| Total Distributable Earnings (Accumulated Losses) | | | 37,375,524 | | | | (149,759,660 | ) | | | (394,878,262 | ) | | | (294,926,066 | ) |
| Net Assets | | $ | 789,875,233 | | | $ | 93,029,046 | | | $ | 581,162,442 | | | $ | 28,423,694 | |
| Outstanding Shares of Beneficial Interest (unlimited authorization — no par value) | | | 26,570,002 | | | | 8,940,000 | | | | 27,960,000 | | | | 5,148,357 | |
| Net Asset Value, Offering and Redemption Price Per Share | | | $29.73 | | | | $10.41 | | | | $20.79 | | | | $5.52 | |
| *Includes Market Value of Securities on Loan | | $ | 2,961,248 | | | $ | 3,790,397 | | | $ | 973,636 | | | $ | 2,101,655 | |
The accompanying notes are an integral part of the financial statements.
197
Statements of Assets and Liabilities
November 30, 2023
| | | Global X
Thematic Growth
ETF | | | Global X Video
Games & Esports
ETF | | | Global X
Cybersecurity
ETF | | | Global X
Telemedicine &
Digital Health
ETF | |
| Assets: | | | | | | | | | | | | | | | | |
| Cost of Investments | | $ | — | | | $ | 208,001,048 | | | $ | 743,242,888 | | | $ | 151,908,389 | |
| Cost of Repurchase Agreement | | | 532,394 | | | | 7,389,888 | | | | 13,736,247 | | | | — | |
| Cost of Affiliated Investments | | | 58,411,426 | | | | — | | | | — | | | | — | |
| Cost/(Proceeds) of Foreign Currency | | | — | | | | 14,349 | | | | — | | | | 1 | |
| Investments, at Value | | $ | — | | | $ | 132,126,051 | * | | $ | 646,517,578 | * | | $ | 64,838,709 | |
| Repurchase Agreement, at Value | | | 532,394 | | | | 7,389,888 | | | | 13,736,247 | | | | — | |
| Affiliated Investments, at Value | | | 32,237,098 | * | | | — | | | | — | | | | — | |
| Cash | | | 28,610 | | | | — | | | | 794,752 | | | | 88,067 | |
| Foreign Currency, at Value | | | — | | | | 15,293 | | | | — | | | | 1 | |
| Dividend, Interest, and Securities Lending Income Receivable | | | 2,200 | | | | 154,708 | | | | 485,672 | | | | 20,538 | |
| Unrealized Appreciation on Spot Contracts | | | — | | | | 946 | | | | — | | | | — | |
| Receivable for Capital Shares Sold | | | — | | | | 3,110,293 | | | | — | | | | — | |
| Receivable for Investment Securities Sold | | | — | | | | 709,727 | | | | — | | | | — | |
| Reclaim Receivable | | | — | | | | 2,772 | | | | 3,775 | | | | 10,999 | |
| Receivable due from Investment Adviser | | | 1,980 | | | | — | | | | — | | | | — | |
| Total Assets | | | 32,802,282 | | | | 143,509,678 | | | | 661,538,024 | | | | 64,958,314 | |
| Liabilities: | | | | | | | | | | | | | | | | |
| Obligation to Return Securities Lending Collateral | | | 532,394 | | | | 7,389,888 | | | | 13,736,247 | | | | — | |
| Payable due to Investment Adviser | | | — | | | | 50,608 | | | | 230,066 | | | | 38,903 | |
| Cash Overdraft | | | — | | | | 614,831 | | | | — | | | | — | |
| Custodian Fees Payable | | | — | | | | 4,946 | | | | 20,467 | | | | 97 | |
| Due to Broker | | | — | | | | 3,110,293 | | | | — | | | | — | |
| Total Liabilities | | | 532,394 | | | | 11,170,566 | | | | 13,986,780 | | | | 39,000 | |
| Net Assets | | $ | 32,269,888 | | | $ | 132,339,112 | | | $ | 647,551,244 | | | $ | 64,919,314 | |
| Net Assets Consist of: | | | | | | | | | | | | | | | | |
| Paid-in Capital | | $ | 94,312,941 | | | $ | 276,155,727 | | | $ | 950,052,780 | | | $ | 250,521,391 | |
| Total Accumulated Losses | | | (62,043,053 | ) | | | (143,816,615 | ) | | | (302,501,536 | ) | | | (185,602,077 | ) |
| Net Assets | | $ | 32,269,888 | | | $ | 132,339,112 | | | $ | 647,551,244 | | | $ | 64,919,314 | |
| Outstanding Shares of Beneficial Interest (unlimited authorization — no par value) | | | 1,400,000 | | | | 6,640,000 | | | | 24,130,000 | | | | 7,250,000 | |
| Net Asset Value, Offering and Redemption Price Per Share | | | $23.05 | | | | $19.93 | | | | $26.84 | | | | $8.95 | |
| *Includes Market Value of Securities on Loan | | $ | 519,603 | | | $ | 7,200,617 | | | $ | 13,011,695 | | | $ | — | |
The accompanying notes are an integral part of the financial statements.
198
Statements of Assets and Liabilities
November 30, 2023
| | | Global X
China Biotech
Innovation ETF | | | Global X
CleanTech ETF | | | Global X Data
Center REITs
& Digital
Infrastructure
ETF | | | Global X Clean
Water ETF | |
| Assets: | | | | | | | | | | | | | | | | |
| Cost of Investments | | $ | 2,963,513 | | | $ | 139,007,603 | | | $ | 48,895,908 | | | $ | 9,187,254 | |
| Cost of Repurchase Agreement | | | — | | | | 9,047,149 | | | | — | | | | — | |
| Investments, at Value | | $ | 2,296,647 | | | $ | 58,732,579 | * | | $ | 40,227,550 | | | $ | 9,363,789 | |
| Repurchase Agreement, at Value | | | — | | | | 9,047,149 | | | | — | | | | — | |
| Cash | | | 2,005 | | | | 50,168 | | | | 74,618 | | | | 10,521 | |
| Dividend, Interest, and Securities Lending Income Receivable | | | — | | | | 113,008 | | | | 30,132 | | | | 22,459 | |
| Reclaim Receivable | | | — | | | | 19,673 | | | | — | | | | 492 | |
| Due from Broker | | | — | | | | 13,524 | | | | — | | | | — | |
| Total Assets | | | 2,298,652 | | | | 67,976,101 | | | | 40,332,300 | | | | 9,397,261 | |
| Liabilities: | | | | | | | | | | | | | | | | |
| Obligation to Return Securities Lending Collateral | | | — | | | | 9,047,149 | | | | — | | | | — | |
| Payable due to Investment Adviser | | | 1,199 | | | | 23,386 | | | | 13,539 | | | | 3,731 | |
| Payable for Investment Securities Purchased | | | — | | | | 31,344 | | | | 995,886 | | | | — | |
| Total Liabilities | | | 1,199 | | | | 9,101,879 | | | | 1,009,425 | | | | 3,731 | |
| Net Assets | | $ | 2,297,453 | | | $ | 58,874,222 | | | $ | 39,322,875 | | | $ | 9,393,530 | |
| Net Assets Consist of: | | | | | | | | | | | | | | | | |
| Paid-in Capital | | $ | 4,625,600 | | | $ | 170,840,705 | | | $ | 49,930,693 | | | $ | 9,822,406 | |
| Total Accumulated Losses | | | (2,328,147 | ) | | | (111,966,483 | ) | | | (10,607,818 | ) | | | (428,876 | ) |
| Net Assets | | $ | 2,297,453 | | | $ | 58,874,222 | | | $ | 39,322,875 | | | $ | 9,393,530 | |
| Outstanding Shares of Beneficial Interest (unlimited authorization — no par value) | | | 270,000 | | | | 5,960,000 | | | | 2,750,000 | | | | 610,000 | |
| Net Asset Value, Offering and Redemption Price Per Share | | | $8.51 | | | | $9.88 | | | | $14.30 | | | | $15.40 | |
| *Includes Market Value of Securities on Loan | | $ | — | | | $ | 10,058,238 | | | $ | — | | | $ | — | |
The accompanying notes are an integral part of the financial statements.
199
Statements of Assets and Liabilities
November 30, 2023
| | | Global X
AgTech & Food
Innovation ETF | | | Global X
Blockchain ETF | | | Global X
Hydrogen ETF | | | Global X Solar
ETF | |
| Assets: | | | | | | | | | | | | | | | | |
| Cost of Investments | | $ | 5,179,159 | | | $ | 89,108,744 | | | $ | 64,544,614 | | | $ | 7,860,120 | |
| Cost of Repurchase Agreement | | | — | | | | 17,071,665 | | | | — | | | | 40,476 | |
| Cost/(Proceeds) of Foreign Currency | | | 38 | | | | — | | | | — | | | | 25 | |
| Investments, at Value | | $ | 4,591,823 | | | $ | 87,016,216 | * | | $ | 34,761,666 | | | $ | 5,966,590 | * |
| Repurchase Agreement, at Value | | | — | | | | 17,071,665 | | | | — | | | | 40,476 | |
| Cash | | | 866,847 | | | | 104,988 | | | | 67,604 | | | | 260,113 | |
| Foreign Currency, at Value | | | 39 | | | | — | | | | — | | | | 26 | |
| Dividend, Interest, and Securities Lending Income Receivable | | | 7,612 | | | | 42,767 | | | | 14,877 | | | | 2,104 | |
| Reclaim Receivable | | | 2,520 | | | | — | | | | 965 | | | | 236 | |
| Unrealized Appreciation on Spot Contracts | | | — | | | | — | | | | 1,071 | | | | — | |
| Receivable for Capital Shares Sold | | | — | | | | 2,218,477 | | | | — | | | | — | |
| Receivable for Investment Securities Sold | | | — | | | | — | | | | 4,644,365 | | | | 147,939 | |
| Total Assets | | | 5,468,841 | | | | 106,454,113 | | | | 39,490,548 | | | | 6,417,484 | |
| Liabilities: | | | | | | | | | | | | | | | | |
| Obligation to Return Securities Lending Collateral | | | — | | | | 17,071,665 | | | | — | | | | 40,476 | |
| Payable for Investment Securities Purchased | | | 990,820 | | | | 2,227,752 | | | | 3,699,380 | | | | 399,878 | |
| Payable due to Investment Adviser | | | 1,832 | | | | 30,251 | | | | 13,974 | | | | 2,473 | |
| Unrealized Depreciation on Spot Contracts | | | 493 | | | | 24 | | | | — | | | | 191 | |
| Total Liabilities | | | 993,145 | | | | 19,329,692 | | | | 3,713,354 | | | | 443,018 | |
| Net Assets | | $ | 4,475,696 | | | $ | 87,124,421 | | | $ | 35,777,194 | | | $ | 5,974,466 | |
| Net Assets Consist of: | | | | | | | | | | | | | | | | |
| Paid-in Capital | | $ | 9,642,270 | | | $ | 225,955,558 | | | $ | 86,029,598 | | | $ | 9,751,783 | |
| Total Accumulated Losses | | | (5,166,574 | ) | | | (138,831,137 | ) | | | (50,252,404 | ) | | | (3,777,317 | ) |
| Net Assets | | $ | 4,475,696 | | | $ | 87,124,421 | | | $ | 35,777,194 | | | $ | 5,974,466 | |
| Outstanding Shares of Beneficial Interest (unlimited authorization — no par value) | | | 440,000 | | | | 2,835,860 | | | | 5,490,000 | | | | 510,000 | |
| Net Asset Value, Offering and Redemption Price Per Share | | | $10.17 | | | | $30.72 | | | | $6.52 | | | | $11.71 | |
| *Includes Market Value of Securities on Loan | | $ | — | | | $ | 15,198,593 | | | $ | — | | | $ | 37,976 | |
The accompanying notes are an integral part of the financial statements.
200
Statements of Assets and Liabilities
November 30, 2023
| | | Global X Wind
Energy ETF | | | Global X Green
Building ETF | | | Global X
Metaverse ETF | | | Global X
PropTech ETF | |
| Assets: | | | | | | | | | | | | | | | | |
| Cost of Investments | | $ | 4,144,509 | | | $ | 2,139,515 | | | $ | 2,371,799 | | | $ | 2,668,930 | |
| Cost of Repurchase Agreement | | | 57,383 | | | | — | | | | — | | | | — | |
| Cost/(Proceeds) of Foreign Currency | | | 1,561 | | | | 367 | | | | 783 | | | | 1 | |
| Investments, at Value | | $ | 2,684,897 | * | | $ | 2,155,753 | | | $ | 2,488,279 | | | $ | 2,823,542 | |
| Repurchase Agreement, at Value | | | 57,383 | | | | — | | | | — | | | | — | |
| Cash | | | 22,824 | | | | 2,659 | | | | 77,340 | | | | 2,842 | |
| Foreign Currency, at Value | | | 1,580 | | | | 366 | | | | 783 | | | | 2 | |
| Receivable for Investment Securities Sold | | | 309,411 | | | | — | | | | 382,173 | | | | — | |
| Reclaim Receivable | | | 5,410 | | | | 2,580 | | | | — | | | | 268 | |
| Dividend, Interest, and Securities Lending Income Receivable | | | 2,910 | | | | 5,090 | | | | 2,727 | | | | — | |
| Unrealized Appreciation on Spot Contracts | | | 96 | | | | — | | | | 33 | | | | — | |
| Due from Broker | | | — | | | | — | | | | 172,258 | | | | — | |
| Total Assets | | | 3,084,511 | | | | 2,166,448 | | | | 3,123,593 | | | | 2,826,654 | |
| Liabilities: | | | | | | | | | | | | | | | | |
| Obligation to Return Securities Lending Collateral | | | 57,383 | | | | — | | | | — | | | | — | |
| Payable for Investment Securities Purchased | | | 320,659 | | | | — | | | | 211,484 | | | | 99,589 | |
| Payable due to Investment Adviser | | | 1,082 | | | | 773 | | | | 978 | | | | 1,074 | |
| Payable for Capital Shares Redeemed | | | — | | | | — | | | | 421,241 | | | | — | |
| Total Liabilities | | | 379,124 | | | | 773 | | | | 633,703 | | | | 100,663 | |
| Net Assets | | $ | 2,705,387 | | | $ | 2,165,675 | | | $ | 2,489,890 | | | $ | 2,725,991 | |
| Net Assets Consist of: | | | | | | | | | | | | | | | | |
| Paid-in Capital | | $ | 5,855,987 | | | $ | 2,399,988 | | | $ | 2,534,940 | | | $ | 2,508,000 | |
| Total Distributable Earnings (Accumulated Losses) | | | (3,150,600 | ) | | | (234,313 | ) | | | (45,050 | ) | | | 217,991 | |
| Net Assets | | $ | 2,705,387 | | | $ | 2,165,675 | | | $ | 2,489,890 | | | $ | 2,725,991 | |
| Outstanding Shares of Beneficial Interest (unlimited authorization — no par value) | | | 210,000 | | | | 100,000 | | | | 100,000 | | | | 100,000 | |
| Net Asset Value, Offering and Redemption Price Per Share | | | $12.88 | | | | $21.66 | | | | $24.90 | | | | $27.26 | |
| *Includes Market Value of Securities on Loan | | $ | 54,740 | | | $ | — | | | $ | — | | | $ | — | |
The accompanying notes are an integral part of the financial statements.
201
Consolidated Statement of Assets and Liabilities/Statement of Assets and Liabilities
November 30, 2023
| | | Global X
Carbon Credits
Strategy ETF
(Consolidated) | | | Global X Defense
Tech ETF | |
| Assets: | | | | | | | | |
| Cost of Investments | | $ | 656,149 | | | $ | 4,403,436 | |
| Cost of Affiliated Investments | | | 752,721 | | | | — | |
| Cost/(Proceeds) of Foreign Currency | | | 81,843 | | | | 3,010 | |
| Investments, at Value | | $ | 663,894 | | | $ | 4,683,111 | |
| Affiliated Investments, at Value | | | 753,900 | | | | — | |
| Cash | | | 104,398 | | | | 5,878 | |
| Foreign Currency, at Value | | | 81,843 | | | | 3,007 | |
| Receivable for Investment Securities Sold | | | — | | | | 364,099 | |
| Dividend and Interest Receivable | | | — | | | | 9,166 | |
| Due from Broker | | | — | | | | 175,133 | |
| Total Assets | | | 1,604,035 | | | | 5,240,394 | |
| Liabilities: | | | | | | | | |
| Payable for Variation Margin on Futures Contracts | | | 19,971 | | | | — | |
| Payable due to Investment Adviser | | | 485 | | | | 1,865 | |
| Unrealized Depreciation on Spot Contracts | | | 29 | | | | 116 | |
| Payable for Investment Securities Purchased | | | — | | | | 198,121 | |
| Payable for Capital Shares Redeemed | | | — | | | | 445,433 | |
| Total Liabilities | | | 20,485 | | | | 645,535 | |
| Net Assets | | $ | 1,583,550 | | | $ | 4,594,859 | |
| Net Assets Consist of: | | | | | | | | |
| Paid-in Capital | | $ | 1,669,329 | | | $ | 4,305,836 | |
| Total Distributable Earnings (Accumulated Losses) | | | (85,779 | ) | | | 289,023 | |
| Net Assets | | $ | 1,583,550 | | | $ | 4,594,859 | |
| Outstanding Shares of Beneficial Interest (unlimited authorization — no par value) | | | 50,000 | | | | 170,000 | |
| Net Asset Value, Offering and Redemption Price Per Share | | | $31.67 | | | | $27.03 | |
The accompanying notes are an integral part of the financial statements.
202
Statements of Operations
For the year ended November 30, 2023
| | | Global X
Millennial
Consumer ETF | | Global X Aging
Population ETF | | Global X Health
& Wellness ETF | | Global X
Robotics &
Artificial
Intelligence ETF |
| Investment Income: | | | | | | | | | | | | | | | | |
| Dividend Income | | $ | 709,580 | | | $ | 760,105 | | | $ | 277,195 | | | $ | 13,808,207 | |
| Interest Income | | | 6,595 | | | | 1,365 | | | | 286 | | | | 127,609 | |
| Security Lending Income | | | 15,121 | | | | — | | | | — | | | | 5,865,532 | |
| Less: Foreign Taxes Withheld | | | — | | | | (37,529 | ) | | | (23,035 | ) | | | (1,673,078 | ) |
| Total Investment Income | | | 731,296 | | | | 723,941 | | | | 254,446 | | | | 18,128,270 | |
| Expenses: | | | | | | | | | | | | | | | | |
| Supervision and Administration Fees(1) | | | 503,082 | | | | 264,003 | | | | 87,138 | | | | 13,028,034 | |
| Custodian Fees(2) | | | — | | | | 363 | | | | 391 | | | | 27,142 | |
| Total Expenses | | | 503,082 | | | | 264,366 | | | | 87,529 | | | | 13,055,176 | |
| Net Investment Income | | | 228,214 | | | | 459,575 | | | | 166,917 | | | | 5,073,094 | |
| Net Realized Gain (Loss) on: | | | | | | | | | | | | | | | | |
| Investments(3) | | | (5,682,630 | ) | | | 1,614,142 | | | | (3,174,634 | ) | | | 83,039,166 | |
| Futures Contracts | | | — | | | | — | | | | — | | | | 1,279,688 | |
| Foreign Currency Transactions | | | — | | | | (2,213 | ) | | | (684 | ) | | | (99,541 | ) |
| Net Realized Gain (Loss) | | | (5,682,630 | ) | | | 1,611,929 | | | | (3,175,318 | ) | | | 84,219,313 | |
| Net Change in Unrealized Appreciation (Depreciation) on: | | | | | | | | | | | | | | | | |
| Investments | | | 20,164,143 | | | | (830,630 | ) | | | 3,987,015 | | | | 235,493,424 | |
| Futures Contracts | | | — | | | | — | | | | — | | | | 314,240 | |
| Foreign Currency Translations | | | — | | | | 3,519 | | | | 530 | | | | 319,634 | |
| Net Change in Unrealized Appreciation (Depreciation) | | | 20,164,143 | | | | (827,111 | ) | | | 3,987,545 | | | | 236,127,298 | |
| Net Realized and Unrealized Gain (Loss) | | | 14,481,513 | | | | 784,818 | | | | 812,227 | | | | 320,346,611 | |
| Net Increase in Net Assets Resulting from Operations | | $ | 14,709,727 | | | $ | 1,244,393 | | | $ | 979,144 | | | $ | 325,419,705 | |
| (1) | The Supervision and Administration fees includes fees paid by the Funds for the investment advisory services provided by the Adviser. (See Note 3 in Notes to Financial Statements/Notes to Consolidated Financial Statements.) |
| (2) | See Note 2 in the Notes to Financial Statements/Notes to Consolidated Financial Statements. |
| (3) | Includes realized gains (losses) as a result of in-kind redemptions. (See Note 4 in Notes to Financial Statements/Notes to Consolidated Financial Statements.) |
The accompanying notes are an integral part of the financial statements.
203
Statements of Operations
For the year ended November 30, 2023
| | | Global X
FinTech ETF | | Global X
Internet of
Things ETF | | Global X U.S.
Infrastructure
Development
ETF | | Global X
Autonomous &
Electric Vehicles
ETF |
| Investment Income: | | | | | | | | | | | | | | | | |
| Dividend Income | | $ | 2,269,658 | | | $ | 4,853,443 | | | $ | 56,536,133 | | | $ | 15,318,245 | |
| Interest Income | | | 15,371 | | | | 9,667 | | | | 266,990 | | | | 26,800 | |
| Security Lending Income | | | 1,300,615 | | | | 127,040 | | | | 567 | | | | 4,866,427 | |
| Less: Foreign Taxes Withheld | | | (47,625 | ) | | | (359,858 | ) | | | — | | | | (1,341,954 | ) |
| Total Investment Income | | | 3,538,019 | | | | 4,630,292 | | | | 56,803,690 | | | | 18,869,518 | |
| Expenses: | | | | | | | | | | | | | | | | |
| Supervision and Administration Fees(1) | | | 2,623,792 | | | | 2,133,803 | | | | 20,652,659 | | | | 5,555,285 | |
| Custodian Fees(2) | | | 13,236 | | | | 3,059 | | | | 926 | | | | 10,573 | |
| Total Expenses | | | 2,637,028 | | | | 2,136,862 | | | | 20,653,585 | | | | 5,565,858 | |
| Net Investment Income | | | 900,991 | | | | 2,493,430 | | | | 36,150,105 | | | | 13,303,660 | |
| Net Realized Gain (Loss) on: | | | | | | | | | | | | | | | | |
| Investments(3) | | | (49,993,973 | ) | | | 21,592,570 | | | | 132,455,324 | | | | 3,938,757 | |
| Foreign Currency Transactions | | | 2,918 | | | | (54,689 | ) | | | — | | | | (88,953 | ) |
| Net Realized Gain (Loss) | | | (49,991,055 | ) | | | 21,537,881 | | | | 132,455,324 | | | | 3,849,804 | |
| Net Change in Unrealized Appreciation (Depreciation) on: | | | | | | | | | | | | | | | | |
| Investments | | | 81,040,506 | | | | (4,870,559 | ) | | | 362,554,425 | | | | 10,848,204 | |
| Foreign Currency Translations | | | 17,871 | | | | 16,735 | | | | — | | | | 8,886 | |
| Net Change in Unrealized Appreciation (Depreciation) | | | 81,058,377 | | | | (4,853,824 | ) | | | 362,554,425 | | | | 10,857,090 | |
| Net Realized and Unrealized Gain (Loss) | | | 31,067,322 | | | | 16,684,057 | | | | 495,009,749 | | | | 14,706,894 | |
| Net Increase in Net Assets Resulting from Operations | | $ | 31,968,313 | | | $ | 19,177,487 | | | $ | 531,159,854 | | | $ | 28,010,554 | |
| (1) | The Supervision and Administration fees includes fees paid by the Funds for the investment advisory services provided by the Adviser. (See Note 3 in Notes to Financial Statements/Notes to Consolidated Financial Statements.) |
| (2) | See Note 2 in the Notes to Financial Statements/Notes to Consolidated Financial Statements. |
| (3) | Includes realized gains (losses) as a result of in-kind redemptions. (See Note 4 in Notes to Financial Statements/Notes to Consolidated Financial Statements.) |
The accompanying notes are an integral part of the financial statements.
204
Statements of Operations
For the year ended November 30, 2023
| | | Global X
Artificial
Intelligence &
Technology ETF | | Global X
Genomics &
Biotechnology
ETF | | Global X Cloud
Computing ETF | | Global X
Cannabis ETF |
| Investment Income: | | | | | | | | | | | | | | | | |
| Dividend Income | | $ | 3,260,447 | | | $ | 281,057 | | | $ | 708,434 | | | $ | 920,690 | |
| Interest Income | | | 16,130 | | | | 7,062 | | | | 30,971 | | | | 7,649 | |
| Security Lending Income | | | 10,779 | | | | 32,794 | | | | 35,582 | | | | 1,225,986 | |
| Less: Foreign Taxes Withheld | | | (163,273 | ) | | | (20,497 | ) | | | — | | | | — | |
| Total Investment Income | | | 3,124,083 | | | | 300,416 | | | | 774,987 | | | | 2,154,325 | |
| Expenses: | | | | | | | | | | | | | | | | |
| Supervision and Administration Fees(1) | | | 2,218,954 | | | | 926,079 | | | | 3,814,991 | | | | 187,535 | |
| Custodian Fees(2) | | | 2,293 | | | | 3,835 | | | | 122 | | | | 3,201 | |
| Total Expenses | | | 2,221,247 | | | | 929,914 | | | | 3,815,113 | | | | 190,736 | |
| Net Investment Income (Loss) | | | 902,836 | | | | (629,498 | ) | | | (3,040,126 | ) | | | 1,963,589 | |
| Net Realized Gain (Loss) on: | | | | | | | | | | | | | | | | |
| Investments(3) | | | (3,416,503 | ) | | | (51,135,612 | ) | | | (61,704,747 | ) | | | (53,537,861 | ) |
| Affiliated Investments | | | — | | | | — | | | | — | | | | (2,223,171 | ) |
| Foreign Currency Transactions | | | (30,822 | ) | | | (2,310 | ) | | | (2,455 | ) | | | (1,989 | ) |
| Net Realized Gain (Loss) | | | (3,447,325 | ) | | | (51,137,922 | ) | | | (61,707,202 | ) | | | (55,763,021 | ) |
| Net Change in Unrealized Appreciation (Depreciation) on: | | | | | | | | | | | | | | | | |
| Investments | | | 94,134,707 | | | | (7,072,660 | ) | | | 183,037,358 | | | | 16,013,010 | |
| Affiliated Investments | | | — | | | | — | | | | — | | | | (1,977,550 | ) |
| Foreign Currency Translations | | | 1,579 | | | | (1,137 | ) | | | 361 | | | | 11 | |
| Net Change in Unrealized Appreciation (Depreciation) | | | 94,136,286 | | | | (7,073,797 | ) | | | 183,037,719 | | | | 14,035,471 | |
| Net Realized and Unrealized Gain (Loss) | | | 90,688,961 | | | | (58,211,719 | ) | | | 121,330,517 | | | | (41,727,550 | ) |
| Net Increase (Decrease) in Net Assets Resulting from Operations | | $ | 91,591,797 | | | $ | (58,841,217 | ) | | $ | 118,290,391 | | | $ | (39,763,961 | ) |
| (1) | The Supervision and Administration fees includes fees paid by the Funds for the investment advisory services provided by the Adviser. (See Note 3 in Notes to Financial Statements/Notes to Consolidated Financial Statements.) |
| (2) | See Note 2 in the Notes to Financial Statements/Notes to Consolidated Financial Statements. |
| (3) | Includes realized gains (losses) as a result of in-kind redemptions. (See Note 4 in Notes to Financial Statements/Notes to Consolidated Financial Statements.) |
The accompanying notes are an integral part of the financial statements.
205
Statements of Operations
For the year ended November 30, 2023
| | | Global X
Thematic
Growth ETF | | | Global X Video
Games &
Esports ETF | | | Global X
Cybersecurity
ETF | | | Global X
Telemedicine &
Digital Health
ETF | |
| Investment Income: | | | | | | | | | | | | | | | | |
| Dividend Income, from Affiliated Investments | | $ | 332,965 | | | $ | — | | | $ | — | | | $ | — | |
| Dividend Income | | | 52,280 | | | | 1,702,164 | | | | 2,809,424 | | | | 287,161 | |
| Interest Income | | | 1,714 | | | | 4,087 | | | | 73,468 | | | | 10,632 | |
| Security Lending Income | | | 7,093 | | | | 100,632 | | | | 1,843 | | | | 101,177 | |
| Less: Foreign Taxes Withheld | | | — | | | | (189,504 | ) | | | (185,578 | ) | | | (19,667 | ) |
| Total Investment Income | | | 394,052 | | | | 1,617,379 | | | | 2,699,157 | | | | 379,303 | |
| Expenses: | | | | | | | | | | | | | | | | |
| Supervision and Administration Fees(1) | | | 207,806 | | | | 817,513 | | | | 3,530,829 | | | | 801,902 | |
| Custodian Fees(2) | | | 47 | | | | 4,946 | | | | 20,467 | | | | 191 | |
| Total Expenses | | | 207,853 | | | | 822,459 | | | | 3,551,296 | | | | 802,093 | |
| Net Investment Income (Loss) | | | 186,199 | | | | 794,920 | | | | (852,139 | ) | | | (422,790 | ) |
| Net Realized Gain (Loss) on: | | | | | | | | | | | | | | | | |
| Investments(3) | | | (7,287,760 | ) | | | (38,513,404 | ) | | | (150,120,356 | ) | | | (52,676,031 | ) |
| Affiliated Investments | | | (5,911,410 | ) | | | — | | | | — | | | | — | |
| Foreign Currency Transactions | | | — | | | | (60,106 | ) | | | 20,378 | | | | 386 | |
| Capital Gain Distribution from Affiliated Investments | | | 16,965 | | | | — | | | | — | | | | — | |
| Payment from Adviser(4) | | | 247,624 | | | | — | | | | — | | | | — | |
| Net Realized Gain (Loss) | | | (12,934,581 | ) | | | (38,573,510 | ) | | | (150,099,978 | ) | | | (52,675,645 | ) |
| Net Change in Unrealized Appreciation (Depreciation) on: | | | | | | | | | | | | | | | | |
| Investments | | | 12,576,168 | | | | 44,040,481 | | | | 254,799,756 | | | | 19,467,445 | |
| Affiliated Investments | | | (4,452,074 | ) | | | — | | | | — | | | | — | |
| Foreign Currency Translations | | | — | | | | (858 | ) | | | 2,416 | | | | 349 | |
| Net Change in Unrealized Appreciation (Depreciation) | | | 8,124,094 | | | | 44,039,623 | | | | 254,802,172 | | | | 19,467,794 | |
| Net Realized and Unrealized Gain (Loss) | | | (4,810,487 | ) | | | 5,466,113 | | | | 104,702,194 | | | | (33,207,851 | ) |
| Net Increase (Decrease) in Net Assets Resulting from Operations | | $ | (4,624,288 | ) | | $ | 6,261,033 | | | $ | 103,850,055 | | | $ | (33,630,641 | ) |
| (1) | The Supervision and Administration fees includes fees paid by the Funds for the investment advisory services provided by the Adviser. (See Note 3 in Notes to Financial Statements/Notes to Consolidated Financial Statements.) |
| (2) | See Note 2 in the Notes to Financial Statements/Notes to Consolidated Financial Statements. |
| (3) | Includes realized gains (losses) as a result of in-kind redemptions. (See Note 4 in Notes to Financial Statements/Notes to Consolidated Financial Statements.) |
| (4) | See Note 3 in the Notes to Financial Statements/Notes to Consolidated Financial Statements. |
The accompanying notes are an integral part of the financial statements.
206
Statements of Operations
For the year ended November 30, 2023
| | | Global X
China Biotech
Innovation ETF | | Global X
CleanTech ETF | | Global X Data
Center REITs
& Digital
Infrastructure
ETF | | Global X Clean
Water ETF |
| Investment Income: | | | | | | | | | | | | | | | | |
| Dividend Income | | $ | 27,865 | | | $ | 819,866 | | | $ | 825,567 | | | $ | 191,439 | |
| Interest Income | | | 250 | | | | 2,592 | | | | 6,940 | | | | 368 | |
| Security Lending Income | | | — | | | | 95,200 | | | | — | | | | — | |
| Less: Foreign Taxes Withheld | | | (2,190 | ) | | | (43,790 | ) | | | (29,811 | ) | | | (1,987 | ) |
| Total Investment Income | | | 25,925 | | | | 873,868 | | | | 802,696 | | | | 189,820 | |
| Expenses: | | | | | | | | | | | | | | | | |
| Supervision and Administration Fees(1) | | | 15,227 | | | | 493,442 | | | | 190,867 | | | | 42,823 | |
| Custodian Fees(2) | | | 116 | | | | 618 | | | | 1,571 | | | | 176 | |
| Total Expenses | | | 15,343 | | | | 494,060 | | | | 192,438 | | | | 42,999 | |
| Net Investment Income | | | 10,582 | | | | 379,808 | | | | 610,258 | | | | 146,821 | |
| Net Realized Gain (Loss) on: | | | | | | | | | | | | | | | | |
| Investments(3) | | | (534,643 | ) | | | (8,560,231 | ) | | | (6,531,319 | ) | | | (210,370 | ) |
| Foreign Currency Transactions | | | (154 | ) | | | (18,741 | ) | | | 16,601 | | | | 968 | |
| Net Realized Gain (Loss) | | | (534,797 | ) | | | (8,578,972 | ) | | | (6,514,718 | ) | | | (209,402 | ) |
| Net Change in Unrealized Appreciation (Depreciation) on: | | | | | | | | | | | | | | | | |
| Investments | | | 219,185 | | | | (34,327,440 | ) | | | 8,246,620 | | | | 839,375 | |
| Foreign Currency Translations | | | — | | | | 1,105 | | | | — | | | | 15 | |
| Net Change in Unrealized Appreciation (Depreciation) | | | 219,185 | | | | (34,326,335 | ) | | | 8,246,620 | | | | 839,390 | |
| Net Realized and Unrealized Gain (Loss) | | | (315,612 | ) | | | (42,905,307 | ) | | | 1,731,902 | | | | 629,988 | |
| Net Increase (Decrease) in Net Assets Resulting from Operations | | $ | (305,030 | ) | | $ | (42,525,499 | ) | | $ | 2,342,160 | | | $ | 776,809 | |
| (1) | The Supervision and Administration fees includes fees paid by the Funds for the investment advisory services provided by the Adviser. (See Note 3 in Notes to Financial Statements/Notes to Consolidated Financial Statements.) |
| (2) | See Note 2 in the Notes to Financial Statements/Notes to Consolidated Financial Statements. |
| (3) | Includes realized gains (losses) as a result of in-kind redemptions. (See Note 4 in Notes to Financial Statements/Notes to Consolidated Financial Statements.) |
The accompanying notes are an integral part of the financial statements.
207
Statements of Operations
For the year ended November 30, 2023
| | | Global X
AgTech & Food
Innovation ETF | | Global X
Blockchain ETF | | Global X
Hydrogen ETF | | Global X Solar
ETF |
| Investment Income: | | | | | | | | | | | | | | | | |
| Dividend Income | | $ | 84,498 | | | $ | 716 | | | $ | 115,810 | | | $ | 16,985 | |
| Interest Income | | | 526 | | | | 4,576 | | | | 3,874 | | | | 596 | |
| Security Lending Income | | | — | | | | 1,094,526 | | | | — | | | | — | |
| Less: Foreign Taxes Withheld | | | (6,170 | ) | | | — | | | | (5,318 | ) | | | (1,355 | ) |
| Total Investment Income | | | 78,854 | | | | 1,099,818 | | | | 114,366 | | | | 16,226 | |
| Expenses: | | | | | | | | | | | | | | | | |
| Supervision and Administration Fees(1) | | | 28,767 | | | | 330,793 | | | | 196,696 | | | | 24,091 | |
| Custodian Fees(2) | | | 448 | | | | 486 | | | | 1,943 | | | | 123 | |
| Total Expenses | | | 29,215 | | | | 331,279 | | | | 198,639 | | | | 24,214 | |
| Net Investment Income (Loss) | | | 49,639 | | | | 768,539 | | | | (84,273 | ) | | | (7,988 | ) |
| Net Realized Gain (Loss) on: | | | | | | | | | | | | | | | | |
| Investments(3) | | | (3,366,130 | ) | | | (28,402,903 | ) | | | (11,214,127 | ) | | | (360,211 | ) |
| Foreign Currency Transactions | | | 3,661 | | | | 16,356 | | | | (365 | ) | | | 1,818 | |
| Net Realized Gain (Loss) | | | (3,362,469 | ) | | | (28,386,547 | ) | | | (11,214,492 | ) | | | (358,393 | ) |
| Net Change in Unrealized Appreciation (Depreciation) on: | | | | | | | | | | | | | | | | |
| Investments | | | 927,645 | | | | 69,258,255 | | | | (14,541,211 | ) | | | (2,846,815 | ) |
| Foreign Currency Translations | | | (3,567 | ) | | | (2 | ) | | | 16,148 | | | | (1,478 | ) |
| Net Change in Unrealized Appreciation (Depreciation) | | | 924,078 | | | | 69,258,253 | | | | (14,525,063 | ) | | | (2,848,293 | ) |
| Net Realized and Unrealized Gain (Loss) | | | (2,438,391 | ) | | | 40,871,706 | | | | (25,739,555 | ) | | | (3,206,686 | ) |
| Net Increase (Decrease) in Net Assets Resulting from Operations | | $ | (2,388,752 | ) | | $ | 41,640,245 | | | $ | (25,823,828 | ) | | $ | (3,214,674 | ) |
| (1) | The Supervision and Administration fees includes fees paid by the Funds for the investment advisory services provided by the Adviser. (See Note 3 in Notes to Financial Statements/Notes to Consolidated Financial Statements.) |
| (2) | See Note 2 in the Notes to Financial Statements/Notes to Consolidated Financial Statements. |
| (3) | Includes realized gains (losses) as a result of in-kind redemptions. (See Note 4 in Notes to Financial Statements/Notes to Consolidated Financial Statements.) |
The accompanying notes are an integral part of the financial statements.
208
Statements of Operations
For the year/period ended November 30, 2023
| | | Global X Wind
Energy ETF | | Global X Green
Building ETF | | Global X
Metaverse ETF | | Global X
PropTech ETF(1) |
| Investment Income: | | | | | | | | | | | | | | | | |
| Dividend Income | | $ | 98,708 | | | $ | 79,870 | | | $ | 25,403 | | | $ | 10,427 | |
| Interest Income | | | 926 | | | | 60 | | | | 170 | | | | 128 | |
| Reclaim Income | | | 7,791 | | | | — | | | | — | | | | — | |
| Less: Foreign Taxes Withheld | | | (21,394 | ) | | | (5,811 | ) | | | (1,832 | ) | | | (667 | ) |
| Total Investment Income | | | 86,031 | | | | 74,119 | | | | 23,741 | | | | 9,888 | |
| Expenses: | | | | | | | | | | | | | | | | |
| Supervision and Administration Fees(2) | | | 29,409 | | | | 9,391 | | | | 11,122 | | | | 8,446 | |
| Custodian Fees(3) | | | 696 | | | | 119 | | | | 4 | | | | 148 | |
| Total Expenses | | | 30,105 | | | | 9,510 | | | | 11,126 | | | | 8,594 | |
| Net Investment Income | | | 55,926 | | | | 64,609 | | | | 12,615 | | | | 1,294 | |
| Net Realized Gain (Loss) on: | | | | | | | | | | | | | | | | |
| Investments(4) | | | (2,000,129 | ) | | | (293,397 | ) | | | (27,100 | ) | | | 62,604 | |
| Foreign Currency Transactions | | | (3,907 | ) | | | (1,107 | ) | | | (491 | ) | | | (66 | ) |
| Net Realized Gain (Loss) | | | (2,004,036 | ) | | | (294,504 | ) | | | (27,591 | ) | | | 62,538 | |
| Net Change in Unrealized Appreciation (Depreciation) on: | | | | | | | | | | | | | | | | |
| Investments | | | (603,476 | ) | | | 363,447 | | | | 746,676 | | | | 154,612 | |
| Foreign Currency Translations | | | (372 | ) | | | 93 | | | | 120 | | | | — | |
| Net Change in Unrealized Appreciation (Depreciation) | | | (603,848 | ) | | | 363,540 | | | | 746,796 | | | | 154,612 | |
| Net Realized and Unrealized Gain (Loss) | | | (2,607,884 | ) | | | 69,036 | | | | 719,205 | | | | 217,150 | |
| Net Increase (Decrease) in Net Assets Resulting from Operations | | $ | (2,551,958 | ) | | $ | 133,645 | | | $ | 731,820 | | | $ | 218,444 | |
| (1) | The Fund commenced operations on April 11, 2023. |
| (2) | The Supervision and Administration fees includes fees paid by the Funds for the investment advisory services provided by the Adviser. (See Note 3 in Notes to Financial Statements/Notes to Consolidated Financial Statements.) |
| (3) | See Note 2 in the Notes to Financial Statements/Notes to Consolidated Financial Statements. |
| (4) | Includes realized gains (losses) as a result of in-kind redemptions. (See Note 4 in Notes to Financial Statements/Notes to Consolidated Financial Statements.) |
The accompanying notes are an integral part of the financial statements.
209
Consolidated Statement of Operations/Statement of Operations
For the period ended November 30, 2023
| | | Global X
Carbon Credits
Strategy ETF
(Consolidated)(1) | | Global X
Defense Tech
ETF(2) |
| Investment Income: | | | | | | | | |
| Dividend Income, from Affiliated Investments | | $ | 6,449 | | | $ | — | |
| Dividend Income | | | 130 | | | | 14,087 | |
| Interest Income | | | 29,248 | | | | 6 | |
| Less: Foreign Taxes Withheld | | | — | | | | (36 | ) |
| Total Investment Income | | | 35,827 | | | | 14,057 | |
| Expenses: | | | | | | | | |
| Supervision and Administration Fees(3) | | | 3,261 | | | | 3,698 | |
| Custodian Fees(4) | | | 78 | | | | — | |
| Total Expenses | | | 3,339 | | | | 3,698 | |
| Net Investment Income | | | 32,488 | | | | 10,359 | |
| Net Realized Gain (Loss) on: | | | | | | | | |
| Investments(5) | | | 4,069 | | | | 48,802 | |
| Futures Contracts | | | (96,318 | ) | | | — | |
| Foreign Currency Transactions | | | (19,621 | ) | | | (484 | ) |
| Payment from Adviser(6) | | | 100 | | | | — | |
| Net Realized Gain (Loss) | | | (111,770 | ) | | | 48,318 | |
| Net Change in Unrealized Appreciation (Depreciation) on: | | | | | | | | |
| Investments | | | 7,745 | | | | 279,675 | |
| Affiliated Investments | | | 1,179 | | | | — | |
| Futures Contracts | | | (98,861 | ) | | | — | |
| Foreign Currency Translations | | | (31 | ) | | | (116 | ) |
| Net Change in Unrealized Appreciation (Depreciation) | | | (89,968 | ) | | | 279,559 | |
| Net Realized and Unrealized Gain (Loss) | | | (201,738 | ) | | | 327,877 | |
| Net Increase (Decrease) in Net Assets Resulting from Operations | | $ | (169,250 | ) | | $ | 338,236 | |
| (1) | The Fund commenced operations on May 24, 2023. |
| (2) | The Fund commenced operations on September 11, 2023. |
| (3) | The Supervision and Administration fees includes fees paid by the Funds for the investment advisory services provided by the Adviser. (See Note 3 in Notes to Financial Statements/Notes to Consolidated Financial Statements.) |
| (4) | See Note 2 in the Notes to Financial Statements/Notes to Consolidated Financial Statements. |
| (5) | Includes realized gains (losses) as a result of in-kind redemptions. (See Note 4 in Notes to Financial Statements/Notes to Consolidated Financial Statements.) |
| (6) | See Note 3 in the Notes to Financial Statements/Notes to Consolidated Financial Statements. |
The accompanying notes are an integral part of the financial statements.
210
Statements of Changes in Net Assets
| | | Global X Millennial Consumer ETF | | Global X Aging Population ETF |
| | | Year Ended
November 30,
2023 | | Year Ended
November 30,
2022 | | Year Ended
November 30,
2023 | | Year Ended
November 30,
2022 |
| Operations: | | | | | | | | | | | | | | | | |
| Net Investment Income | | $ | 228,214 | | | $ | 236,942 | | | $ | 459,575 | | | $ | 386,802 | |
| Net Realized Gain (Loss) | | | (5,682,630 | ) | | | 9,451,209 | | | | 1,611,929 | | | | 2,044,291 | |
| Net Change in Unrealized Appreciation (Depreciation) | | | 20,164,143 | | | | (76,800,075 | ) | | | (827,111 | ) | | | (4,447,220 | ) |
| Net Increase (Decrease) in Net Assets Resulting from Operations | | | 14,709,727 | | | | (67,111,924 | ) | | | 1,244,393 | | | | (2,016,127 | ) |
| Distributions: | | | (234,244 | ) | | | (343,441 | ) | | | (279,995 | ) | | | (543,653 | ) |
| Return of Capital: | | | — | | | | — | | | | — | | | | (47,506 | ) |
| Capital Share Transactions: | | | | | | | | | | | | | | | | |
| Issued | | | 4,599,684 | | | | 14,445,330 | | | | 37,583,461 | | | | 2,011,132 | |
| Redeemed | | | (19,040,816 | ) | | | (68,606,325 | ) | | | (26,752,713 | ) | | | (17,359,342 | ) |
| Increase (Decrease) in Net Assets from Capital Share Transactions | | | (14,441,132 | ) | | | (54,160,995 | ) | | | 10,830,748 | | | | (15,348,210 | ) |
| Total Increase (Decrease) in Net Assets | | | 34,351 | | | | (121,616,360 | ) | | | 11,795,146 | | | | (17,955,496 | ) |
| Net Assets: | | | | | | | | | | | | | | | | |
| Beginning of Year | | | 105,459,006 | | | | 227,075,366 | | | | 41,800,487 | | | | 59,755,983 | |
| End of Year | | $ | 105,493,357 | | | $ | 105,459,006 | | | $ | 53,595,633 | | | $ | 41,800,487 | |
| Share Transactions: | | | | | | | | | | | | | | | | |
| Issued | | | 150,000 | | | | 420,000 | | | | 1,390,000 | | | | 70,000 | |
| Redeemed | | | (650,000 | ) | | | (2,030,000 | ) | | | (980,000 | ) | | | (670,000 | ) |
| Net Increase (Decrease) in Shares Outstanding from Share Transactions | | | (500,000 | ) | | | (1,610,000 | ) | | | 410,000 | | | | (600,000 | ) |
The accompanying notes are an integral part of the financial statements.
211
Statements of Changes in Net Assets
| | | Global X Health & Wellness ETF | | Global X Robotics & Artificial
Intelligence ETF |
| | | Year Ended
November 30,
2023 | | Year Ended
November 30,
2022 | | Year Ended
November 30,
2023 | | Year Ended
November 30,
2022 |
| Operations: | | | | | | | | | | | | | | | | |
| Net Investment Income | | $ | 166,917 | | | $ | 248,911 | | | $ | 5,073,094 | | | $ | 2,801,530 | |
| Net Realized Gain (Loss) | | | (3,175,318 | ) | | | (1,169,220 | ) | | | 84,219,313 | | | | (177,211,794 | ) |
| Net Change in Unrealized Appreciation (Depreciation) | | | 3,987,545 | | | | (7,991,033 | ) | | | 236,127,298 | | | | (914,255,469 | ) |
| Net Increase (Decrease) in Net Assets Resulting from Operations | | | 979,144 | | | | (8,911,342 | ) | | | 325,419,705 | | | | (1,088,665,733 | ) |
| Distributions: | | | (195,346 | ) | | | (287,193 | ) | | | (4,618,009 | ) | | | (2,507,983 | ) |
| Return of Capital: | | | — | | | | — | | | | — | | | | (547,284 | ) |
| Capital Share Transactions: | | | | | | | | | | | | | | | | |
| Issued | | | 2,883 | | | | — | | | | 956,017,585 | | | | 55,949,780 | |
| Redeemed | | | (14,276,257 | ) | | | (8,241,206 | ) | | | (348,937,384 | ) | | | (325,775,436 | ) |
| Increase (Decrease) in Net Assets from Capital Share Transactions | | | (14,273,374 | ) | | | (8,241,206 | ) | | | 607,080,201 | | | | (269,825,656 | ) |
| Total Increase (Decrease) in Net Assets | | | (13,489,576 | ) | | | (17,439,741 | ) | | | 927,881,897 | | | | (1,361,546,656 | ) |
| Net Assets: | | | | | | | | | | | | | | | | |
| Beginning of Year | | | 22,651,589 | | | | 40,091,330 | | | | 1,341,941,735 | | | | 2,703,488,391 | |
| End of Year | | $ | 9,162,013 | | | $ | 22,651,589 | | | $ | 2,269,823,632 | | | $ | 1,341,941,735 | |
| Share Transactions: | | | | | | | | | | | | | | | | |
| Issued | | | — | | | | — | | | | 35,920,000 | | | | 2,360,000 | |
| Redeemed | | | (650,000 | ) | | | (370,000 | ) | | | (13,790,000 | ) | | | (13,320,000 | ) |
| Net Increase (Decrease) in Shares Outstanding from Share Transactions | | | (650,000 | ) | | | (370,000 | ) | | | 22,130,000 | | | | (10,960,000 | ) |
The accompanying notes are an integral part of the financial statements.
212
Statements of Changes in Net Assets
| | | Global X FinTech ETF | | Global X Internet of Things ETF |
| | | Year Ended
November 30,
2023 | | Year Ended
November 30,
2022 | | Year Ended
November 30,
2023 | | Year Ended
November 30,
2022 |
| Operations: | | | | | | | | | | | | | | | | |
| Net Investment Income | | $ | 900,991 | | | $ | 2,431,454 | | | $ | 2,493,430 | | | $ | 2,432,495 | |
| Net Realized Gain (Loss) | | | (49,991,055 | ) | | | (55,309,208 | ) | | | 21,537,881 | | | | 22,615,599 | |
| Net Change in Unrealized Appreciation (Depreciation) | | | 81,058,377 | | | | (570,594,245 | ) | | | (4,853,824 | ) | | | (124,255,011 | ) |
| Net Increase (Decrease) in Net Assets Resulting from Operations | | | 31,968,313 | | | | (623,471,999 | ) | | | 19,177,487 | | | | (99,206,917 | ) |
| Distributions: | | | (887,181 | ) | | | (61,756,013 | ) | | | (2,946,458 | ) | | | (2,272,300 | ) |
| Return of Capital: | | | (28,497 | ) | | | (1,435,476 | ) | | | — | | | | — | |
| Capital Share Transactions: | | | | | | | | | | | | | | | | |
| Issued | | | 10,050,968 | | | | 92,458,761 | | | | 91,298,646 | | | | 5,234,626 | |
| Redeemed | | | (145,088,625 | ) | | | (239,338,117 | ) | | | (125,739,142 | ) | | | (115,349,802 | ) |
| Decrease in Net Assets from Capital Share Transactions | | | (135,037,657 | ) | | | (146,879,356 | ) | | | (34,440,496 | ) | | | (110,115,176 | ) |
| Total Decrease in Net Assets | | | (103,985,022 | ) | | | (833,542,844 | ) | | | (18,209,467 | ) | | | (211,594,393 | ) |
| Net Assets: | | | | | | | | | | | | | | | | |
| Beginning of Year | | | 455,462,688 | | | | 1,289,005,532 | | | | 305,696,685 | | | | 517,291,078 | |
| End of Year | | $ | 351,477,666 | | | $ | 455,462,688 | | | $ | 287,487,218 | | | $ | 305,696,685 | |
| Share Transactions: | | | | | | | | | | | | | | | | |
| Issued | | | 450,000 | | | | 2,990,000 | | | | 2,750,000 | | | | 150,000 | |
| Redeemed | | | (7,020,000 | ) | | | (9,030,000 | ) | | | (3,900,000 | ) | | | (3,870,000 | ) |
| Net Decrease in Shares Outstanding from Share Transactions | | | (6,570,000 | ) | | | (6,040,000 | ) | | | (1,150,000 | ) | | | (3,720,000 | ) |
The accompanying notes are an integral part of the financial statements.
213
Statements of Changes in Net Assets
| | | Global X U.S. Infrastructure
Development ETF | | Global X Autonomous & Electric
Vehicles ETF |
| | | Year Ended
November 30,
2023 | | Year Ended
November 30,
2022 | | Year Ended
November 30,
2023 | | Year Ended
November 30,
2022 |
| Operations: | | | | | | | | | | | | | | | | |
| Net Investment Income | | $ | 36,150,105 | | | $ | 32,095,675 | | | $ | 13,303,660 | | | $ | 7,982,083 | |
| Net Realized Gain (Loss) | | | 132,455,324 | | | | 228,588,104 | | | | 3,849,804 | | | | (9,795,757 | ) |
| Net Change in Unrealized Appreciation (Depreciation) | | | 362,554,425 | | | | (278,686,344 | ) | | | 10,857,090 | | | | (338,571,837 | ) |
| Net Increase (Decrease) in Net Assets Resulting from Operations | | | 531,159,854 | | | | (18,002,565 | ) | | | 28,010,554 | | | | (340,385,511 | ) |
| Distributions: | | | (30,856,526 | ) | | | (31,995,449 | ) | | | (11,305,718 | ) | | | (6,444,185 | ) |
| Capital Share Transactions: | | | | | | | | | | | | | | | | |
| Issued | | | 1,599,704,351 | | | | 324,468,536 | | | | 52,145,898 | | | | 351,709,374 | |
| Redeemed | | | (694,905,086 | ) | | | (1,712,274,023 | ) | | | (254,584,131 | ) | | | (444,947,400 | ) |
| Increase (Decrease) in Net Assets from Capital Share Transactions | | | 904,799,265 | | | | (1,387,805,487 | ) | | | (202,438,233 | ) | | | (93,238,026 | ) |
| Total Increase (Decrease) in Net Assets | | | 1,405,102,593 | | | | (1,437,803,501 | ) | | | (185,733,397 | ) | | | (440,067,722 | ) |
| Net Assets: | | | | | | | | | | | | | | | | |
| Beginning of Year | | | 3,748,693,233 | | | | 5,186,496,734 | | | | 883,478,306 | | | | 1,323,546,028 | |
| End of Year | | $ | 5,153,795,826 | | | $ | 3,748,693,233 | | | $ | 697,744,909 | | | $ | 883,478,306 | |
| Share Transactions: | | | | | | | | | | | | | | | | |
| Issued | | | 53,210,000 | | | | 11,680,000 | | | | 2,050,000 | | | | 12,430,000 | |
| Redeemed | | | (23,790,000 | ) | | | (68,280,000 | ) | | | (10,550,000 | ) | | | (17,360,000 | ) |
| Net Increase (Decrease) in Shares Outstanding from Share Transactions | | | 29,420,000 | | | | (56,600,000 | ) | | | (8,500,000 | ) | | | (4,930,000 | ) |
The accompanying notes are an integral part of the financial statements.
214
Statements of Changes in Net Assets
| | | Global X Artificial Intelligence &
Technology ETF | | Global X Genomics &
Biotechnology ETF |
| | | Year Ended
November 30,
2023 | | Year Ended
November 30,
2022 | | Year Ended
November 30,
2023 | | Year Ended
November 30,
2022 |
| Operations: | | | | | | | | | | | | | | | | |
| Net Investment Income (Loss) | | $ | 902,836 | | | $ | 691,949 | | | $ | (629,498 | ) | | $ | (418,967 | ) |
| Net Realized Gain (Loss) | | | (3,447,325 | ) | | | (2,705,217 | ) | | | (51,137,922 | ) | | | (62,425,028 | ) |
| Net Change in Unrealized Appreciation (Depreciation) | | | 94,136,286 | | | | (62,316,345 | ) | | | (7,073,797 | ) | | | (16,208,310 | ) |
| Net Increase (Decrease) in Net Assets Resulting from Operations | | | 91,591,797 | | | | (64,329,613 | ) | | | (58,841,217 | ) | | | (79,052,305 | ) |
| Distributions: | | | (724,994 | ) | | | (441,670 | ) | | | — | | | | (81,403 | ) |
| Capital Share Transactions: | | | | | | | | | | | | | | | | |
| Issued | | | 606,811,271 | | | | 47,368,029 | | | | 92,535,940 | | | | 95,288,092 | |
| Redeemed | | | (38,321,292 | ) | | | (38,412,762 | ) | | | (150,006,428 | ) | | | (62,385,729 | ) |
| Increase (Decrease) in Net Assets from Capital Share Transactions | | | 568,489,979 | | | | 8,955,267 | | | | (57,470,488 | ) | | | 32,902,363 | |
| Total Increase (Decrease) in Net Assets | | | 659,356,782 | | | | (55,816,016 | ) | | | (116,311,705 | ) | | | (46,231,345 | ) |
| Net Assets: | | | | | | | | | | | | | | | | |
| Beginning of Year | | | 130,518,451 | | | | 186,334,467 | | | | 209,340,751 | | | | 255,572,096 | |
| End of Year | | $ | 789,875,233 | | | $ | 130,518,451 | | | $ | 93,029,046 | | | $ | 209,340,751 | |
| Share Transactions: | | | | | | | | | | | | | | | | |
| Issued | | | 22,120,000 | | | | 1,830,000 | | | | 8,310,000 | | | | 7,440,000 | |
| Redeemed | | | (1,610,000 | ) | | | (1,670,000 | ) | | | (14,930,000 | ) | | | (4,280,000 | ) |
| Net Increase (Decrease) in Shares Outstanding from Share Transactions | | | 20,510,000 | | | | 160,000 | | | | (6,620,000 | ) | | | 3,160,000 | |
The accompanying notes are an integral part of the financial statements.
215
Statements of Changes in Net Assets
| | | Global X Cloud Computing ETF | | Global X Cannabis ETF |
| | | Year Ended
November 30,
2023 | | Year Ended
November 30,
2022 | | Year Ended
November 30,
2023 | | Year Ended
November 30,
2022‡ |
| Operations: | | | | | | | | | | | | | | | | |
| Net Investment Income (Loss) | | $ | (3,040,126 | ) | | $ | (5,837,330 | ) | | $ | 1,963,589 | | | $ | 2,076,091 | |
| Net Realized Gain (Loss) | | | (61,707,202 | ) | | | (32,796,967 | ) | | | (55,763,021 | ) | | | (121,608,211 | ) |
| Net Change in Unrealized Appreciation (Depreciation) | | | 183,037,719 | | | | (435,747,939 | ) | | | 14,035,471 | | | | 42,541,932 | |
| Net Increase (Decrease) in Net Assets Resulting from Operations | | | 118,290,391 | | | | (474,382,236 | ) | | | (39,763,961 | ) | | | (76,990,188 | ) |
| Distributions: | | | — | | | | (21,230,047 | ) | | | (1,215,573 | ) | | | (3,318,441 | ) |
| Return of Capital: | | | — | | | | — | | | | — | | | | (93,835 | ) |
| Capital Share Transactions: | | | | | | | | | | | | | | | | |
| Issued | | | 27,666,566 | | | | 214,938,579 | | | | 15,051,038 | | | | 32,580,931 | |
| Redeemed | | | (153,879,041 | ) | | | (447,785,742 | ) | | | (1,552,079 | ) | | | (1,823,041 | ) |
| Increase (Decrease) in Net Assets from Capital Share Transactions | | | (126,212,475 | ) | | | (232,847,163 | ) | | | 13,498,959 | | | | 30,757,890 | |
| Total Decrease in Net Assets | | | (7,922,084 | ) | | | (728,459,446 | ) | | | (27,480,575 | ) | | | (49,644,574 | ) |
| Net Assets: | | | | | | | | | | | | | | | | |
| Beginning of Year | | | 589,084,526 | | | | 1,317,543,972 | | | | 55,904,269 | | | | 105,548,843 | |
| End of Year | | $ | 581,162,442 | | | $ | 589,084,526 | | | $ | 28,423,694 | | | $ | 55,904,269 | |
| Share Transactions: | | | | | | | | | | | | | | | | |
| Issued | | | 1,470,000 | | | | 11,620,000 | | | | 1,620,000 | | | | 1,351,667 | |
| Redeemed | | | (8,640,000 | ) | | | (22,920,000 | ) | | | (210,000 | ) | | | (48,310 | ) |
| Net Increase (Decrease) in Shares Outstanding from Share Transactions | | | (7,170,000 | ) | | | (11,300,000 | ) | | | 1,410,000 | | | | 1,303,357 | |
‡ Share transactions have been adjusted to reflect the effect of a 1 for 6 reverse share split on June 10, 2022. (See Note 11 in the Notes to Financial Statements/Notes to Consolidated Financial Statements.)
The accompanying notes are an integral part of the financial statements.
216
Statements of Changes in Net Assets
| | | Global X Thematic Growth ETF | | Global X Video Games & Esports
ETF |
| | | Year Ended
November 30,
2023 | | Year Ended
November 30,
2022 | | Year Ended
November 30,
2023 | | Year Ended
November 30,
2022 |
| Operations: | | | | | | | | | | | | | | | | |
| Net Investment Income | | $ | 186,199 | | | $ | 1,047,562 | | | $ | 794,920 | | | $ | 972,755 | |
| Net Realized Gain (Loss) | | | (12,934,581 | ) | | | (30,828,958 | ) | | | (38,573,510 | ) | | | (68,135,773 | ) |
| Net Change in Unrealized Appreciation (Depreciation) | | | 8,124,094 | | | | (20,455,146 | ) | | | 44,039,623 | | | | (62,793,437 | ) |
| Net Increase (Decrease) in Net Assets Resulting from Operations | | | (4,624,288 | ) | | | (50,236,542 | ) | | | 6,261,033 | | | | (129,956,455 | ) |
| Distributions: | | | (746,536 | ) | | | (1,542,588 | ) | | | (275,496 | ) | | | (2,992,635 | ) |
| Return of Capital: | | | — | | | | — | | | | — | | | | (526,728 | ) |
| Capital Share Transactions: | | | | | | | | | | | | | | | | |
| Issued | | | 10,020,607 | | | | 22,705,538 | | | | 26,104,928 | | | | 35,827,260 | |
| Redeemed | | | (23,359,129 | ) | | | (30,028,614 | ) | | | (73,826,120 | ) | | | (213,511,657 | ) |
| Decrease in Net Assets from Capital Share Transactions | | | (13,338,522 | ) | | | (7,323,076 | ) | | | (47,721,192 | ) | | | (177,684,397 | ) |
| Total Decrease in Net Assets | | | (18,709,346 | ) | | | (59,102,206 | ) | | | (41,735,655 | ) | | | (311,160,215 | ) |
| Net Assets: | | | | | | | | | | | | | | | | |
| Beginning of Year | | | 50,979,234 | | | | 110,081,440 | | | | 174,074,767 | | | | 485,234,982 | |
| End of Year | | $ | 32,269,888 | | | $ | 50,979,234 | | | $ | 132,339,112 | | | $ | 174,074,767 | |
| Share Transactions: | | | | | | | | | | | | | | | | |
| Issued | | | 380,000 | | | | 600,000 | | | | 1,300,000 | | | | 1,680,000 | |
| Redeemed | | | (930,000 | ) | | | (960,000 | ) | | | (3,840,000 | ) | | | (8,940,000 | ) |
| Net Decrease in Shares Outstanding from Share Transactions | | | (550,000 | ) | | | (360,000 | ) | | | (2,540,000 | ) | | | (7,260,000 | ) |
The accompanying notes are an integral part of the financial statements.
217
Statements of Changes in Net Assets
| | | Global X Cybersecurity ETF | | Global X Telemedicine & Digital
Health ETF |
| | | Year Ended
November 30,
2023 | | Year Ended
November 30,
2022 | | Year Ended
November 30,
2023 | | Year Ended
November 30,
2022 |
| Operations: | | | | | | | | | | | | | | | | |
| Net Investment Loss | | $ | (852,139 | ) | | $ | (1,214,033 | ) | | $ | (422,790 | ) | | $ | (111,032 | ) |
| Net Realized Gain (Loss) | | | (150,099,978 | ) | | | (27,318,877 | ) | | | (52,675,645 | ) | | | (71,776,175 | ) |
| Net Change in Unrealized Appreciation (Depreciation) | | | 254,802,172 | | | | (350,784,382 | ) | | | 19,467,794 | | | | 5,693,308 | |
| Net Increase (Decrease) in Net Assets Resulting from Operations | | | 103,850,055 | | | | (379,317,292 | ) | | | (33,630,641 | ) | | | (66,193,899 | ) |
| Distributions: | | | (12,980,811 | ) | | | (7,499,545 | ) | | | — | | | | — | |
| Capital Share Transactions: | | | | | | | | | | | | | | | | |
| Issued | | | 86,862,534 | | | | 439,627,711 | | | | 2,471,288 | | | | 9,701,359 | |
| Redeemed | | | (498,122,796 | ) | | | (216,958,896 | ) | | | (53,996,403 | ) | | | (269,008,305 | ) |
| Increase (Decrease) in Net Assets from Capital Share Transactions | | | (411,260,262 | ) | | | 222,668,815 | | | | (51,525,115 | ) | | | (259,306,946 | ) |
| Total Decrease in Net Assets | | | (320,391,018 | ) | | | (164,148,022 | ) | | | (85,155,756 | ) | | | (325,500,845 | ) |
| Net Assets: | | | | | | | | | | | | | | | | |
| Beginning of Year | | | 967,942,262 | | | | 1,132,090,284 | | | | 150,075,070 | | | | 475,575,915 | |
| End of Year | | $ | 647,551,244 | | | $ | 967,942,262 | | | $ | 64,919,314 | | | $ | 150,075,070 | |
| Share Transactions: | | | | | | | | | | | | | | | | |
| Issued | | | 3,850,000 | | | | 15,260,000 | | | | 200,000 | | | | 720,000 | |
| Redeemed | | | (22,080,000 | ) | | | (8,560,000 | ) | | | (5,220,000 | ) | | | (17,590,000 | ) |
| Net Increase (Decrease) in Shares Outstanding from Share Transactions | | | (18,230,000 | ) | | | 6,700,000 | | | | (5,020,000 | ) | | | (16,870,000 | ) |
The accompanying notes are an integral part of the financial statements.
218
Statements of Changes in Net Assets
| | | Global X China Biotech Innovation
ETF | | Global X CleanTech ETF |
| | | Year Ended
November 30,
2023 | | Year Ended
November 30,
2022 | | Year Ended
November 30,
2023 | | Year Ended
November 30,
2022 |
| Operations: | | | | | | | | | | | | | | | | |
| Net Investment Income | | $ | 10,582 | | | $ | 3,948 | | | $ | 379,808 | | | $ | 198,871 | |
| Net Realized Gain (Loss) | | | (534,797 | ) | | | (776,005 | ) | | | (8,578,972 | ) | | | (7,329,070 | ) |
| Net Change in Unrealized Appreciation (Depreciation) | | | 219,185 | | | | (918,709 | ) | | | (34,326,335 | ) | | | (27,310,251 | ) |
| Net Decrease in Net Assets Resulting from Operations | | | (305,030 | ) | | | (1,690,766 | ) | | | (42,525,499 | ) | | | (34,440,450 | ) |
| Distributions: | | | (9,997 | ) | | | — | | | | (205,777 | ) | | | (499,449 | ) |
| Return of Capital: | | | — | | | | (5,370 | ) | | | — | | | | — | |
| Capital Share Transactions: | | | | | | | | | | | | | | | | |
| Issued | | | — | | | | — | | | | 1,315,432 | | | | 31,320,380 | |
| Redeemed | | | — | | | | — | | | | (27,551,925 | ) | | | (43,996,875 | ) |
| Decrease in Net Assets from Capital Share Transactions | | | — | | | | — | | | | (26,236,493 | ) | | | (12,676,495 | ) |
| Total Decrease in Net Assets | | | (315,027 | ) | | | (1,696,136 | ) | | | (68,967,769 | ) | | | (47,616,394 | ) |
| Net Assets: | | | | | | | | | | | | | | | | |
| Beginning of Year | | | 2,612,480 | | | | 4,308,616 | | | | 127,841,991 | | | | 175,458,385 | |
| End of Year | | $ | 2,297,453 | | | $ | 2,612,480 | | | $ | 58,874,222 | | | $ | 127,841,991 | |
| Share Transactions: | | | | | | | | | | | | | | | | |
| Issued | | | — | | | | — | | | | 80,000 | | | | 1,910,000 | |
| Redeemed | | | — | | | | — | | | | (2,010,000 | ) | | | (2,610,000 | ) |
| Net Decrease in Shares Outstanding from Share Transactions | | | — | | | | — | | | | (1,930,000 | ) | | | (700,000 | ) |
The accompanying notes are an integral part of the financial statements.
219
Statements of Changes in Net Assets
| | | Global X Data Center REITs &
Digital Infrastructure ETF | | Global X Clean Water ETF |
| | Year Ended
November 30,
2023 | | Year Ended
November 30,
2022 | | Year Ended
November 30,
2023 | | Year Ended
November 30,
2022 |
| Operations: | | | | | | | | | | | | |
| Net Investment Income | | $ | 610,258 | | | $ | 758,014 | | | $ | 146,821 | | | $ | 112,669 | |
| Net Realized Gain (Loss) | | | (6,514,718 | ) | | | 371,952 | | | | (209,402 | ) | | | (320,139 | ) |
| Net Change in Unrealized Appreciation (Depreciation) | | | 8,246,620 | | | | (21,885,940 | ) | | | 839,390 | | | | (784,043 | ) |
| Net Increase (Decrease) in Net Assets Resulting from Operations | | | 2,342,160 | | | | (20,755,974 | ) | | | 776,809 | | | | (991,513 | ) |
| Distributions: | | | (1,330,542 | ) | | | (1,090,368 | ) | | | (138,123 | ) | | | (123,205 | ) |
| Capital Share Transactions: | | | | | | | | | | | | | | | | |
| Issued | | | 17,159,209 | | | | 30,021,389 | | | | 1,634,453 | | | | 1,075,120 | |
| Redeemed | | | (41,991,240 | ) | | | (23,129,344 | ) | | | (459,899 | ) | | | (1,079,551 | ) |
| Increase (Decrease) in Net Assets from Capital Share Transactions | | | (24,832,031 | ) | | | 6,892,045 | | | | 1,174,554 | | | | (4,431 | ) |
| Total Increase (Decrease) in Net Assets | | | (23,820,413 | ) | | | (14,954,297 | ) | | | 1,813,240 | | | | (1,119,149 | ) |
| Net Assets: | | | | | | | | | | | | | | | | |
| Beginning of Year | | | 63,143,288 | | | | 78,097,585 | | | | 7,580,290 | | | | 8,699,439 | |
| End of Year | | $ | 39,322,875 | | | $ | 63,143,288 | | | $ | 9,393,530 | | | $ | 7,580,290 | |
| Share Transactions: | | | | | | | | | | | | | | | | |
| Issued | | | 1,280,000 | | | | 1,900,000 | | | | 110,000 | | | | 80,000 | |
| Redeemed | | | (3,200,000 | ) | | | (1,610,000 | ) | | | (30,000 | ) | | | (70,000 | ) |
| Net Increase (Decrease) in Shares Outstanding from Share Transactions | | | (1,920,000 | ) | | | 290,000 | | | | 80,000 | | | | 10,000 | |
The accompanying notes are an integral part of the financial statements.
220
Statements of Changes in Net Assets
| | | Global X AgTech & Food
Innovation ETF | | Global X Blockchain ETF‡ |
| | | Year Ended
November 30,
2023 | | Year Ended
November 30,
2022 | | Year Ended
November 30,
2023 | | Year Ended
November 30,
2022 |
| | | | | | | | | | | | | | | | | |
| Operations: | | | | | | | | | | | | | | | | |
| Net Investment Income | | $ | 49,639 | | | $ | 38,231 | | | $ | 768,539 | | | $ | 910,880 | |
| Net Realized Gain (Loss) | | | (3,362,469 | ) | | | (801,019 | ) | | | (28,386,547 | ) | | | (99,270,593 | ) |
| Net Change in Unrealized Appreciation (Depreciation) | | | 924,078 | | | | (596,572 | ) | | | 69,258,253 | | | | (74,900,532 | ) |
| Net Increase (Decrease) in Net Assets Resulting from Operations | | | (2,388,752 | ) | | | (1,359,360 | ) | | | 41,640,245 | | | | (173,260,245 | ) |
| Distributions: | | | (45,738 | ) | | | (61,689 | ) | | | (602,091 | ) | | | (4,767,818 | ) |
| Return of Capital: | | | — | | | | — | | | | — | | | | (90,192 | ) |
| Capital Share Transactions: | | | | | | | | | | | | | | | | |
| Issued | | | 312,756 | | | | 4,114,321 | | | | 26,723,951 | | | | 106,151,308 | |
| Redeemed | | | (123,074 | ) | | | (1,506,248 | ) | | | (25,864,601 | ) | | | (10,526,348 | ) |
| Increase in Net Assets from Capital Share Transactions | | | 189,682 | | | | 2,608,073 | | | | 859,350 | | | | 95,624,960 | |
| Total Increase (Decrease) in Net Assets | | | (2,244,808 | ) | | | 1,187,024 | | | | 41,897,504 | | | | (82,493,295 | ) |
| Net Assets: | | | | | | | | | | | | | | | | |
| Beginning of Year | | | 6,720,504 | | | | 5,533,480 | | | | 45,226,917 | | | | 127,720,212 | |
| End of Year | | $ | 4,475,696 | | | $ | 6,720,504 | | | $ | 87,124,421 | | | $ | 45,226,917 | |
| Share Transactions: | | | | | | | | | | | | | | | | |
| Issued | | | 20,000 | | | | 230,000 | | | | 1,127,500 | | | | 2,045,000 | |
| Redeemed | | | (10,000 | ) | | | (80,000 | ) | | | (1,051,640 | ) | | | (272,500 | ) |
| Net Increase in Shares Outstanding from Share Transactions | | | 10,000 | | | | 150,000 | | | | 75,860 | | | | 1,772,500 | |
| ‡ | Share transactions have been adjusted to reflect the effect of a 1 for 4 reverse share split on December 19, 2022. (See Note 11 in the Notes to Financial Statements/Notes to Consolidated Financial Statements). |
The accompanying notes are an integral part of the financial statements.
221
Statements of Changes in Net Assets
| | | Global X Hydrogen ETF | | Global X Solar ETF |
| | | Year Ended
November 30,
2023 | | Year Ended
November 30,
2022 | | Year Ended
November 30,
2023 | | Year Ended
November 30,
2022 |
| Operations: | | | | | | | | | | | | | | | | |
| Net Investment Loss | | $ | (84,273 | ) | | $ | (75,851 | ) | | $ | (7,988 | ) | | $ | (15,160 | ) |
| Net Realized Gain (Loss) | | | (11,214,492 | ) | | | (8,989,433 | ) | | | (358,393 | ) | | | (1,875,069 | ) |
| Net Change in Unrealized Appreciation (Depreciation) | | | (14,525,063 | ) | | | (14,734,793 | ) | | | (2,848,293 | ) | | | 927,409 | |
| Net Decrease in Net Assets Resulting from Operations | | | (25,823,828 | ) | | | (23,800,077 | ) | | | (3,214,674 | ) | | | (962,820 | ) |
| Distributions: | | | — | | | | (15,749 | ) | | | — | | | | (748 | ) |
| Return of Capital: | | | — | | | | — | | | | — | | | | (1,369 | ) |
| Capital Share Transactions: | | | | | | | | | | | | | | | | |
| Issued | | | 27,125,045 | | | | 32,016,528 | | | | 4,287,533 | | | | 14,360,783 | |
| Redeemed | | | (3,558,594 | ) | | | (2,593,499 | ) | | | (1,053,849 | ) | | | (16,435,003 | ) |
| Increase (Decrease) in Net Assets from Capital Share Transactions | | | 23,566,451 | | | | 29,423,029 | | | | 3,233,684 | | | | (2,074,220 | ) |
| Total Increase (Decrease) in Net Assets | | | (2,257,377 | ) | | | 5,607,203 | | | | 19,010 | | | | (3,039,157 | ) |
| Net Assets: | | | | | | | | | | | | | | | | |
| Beginning of Year | | | 38,034,571 | | | | 32,427,368 | | | | 5,955,456 | | | | 8,994,613 | |
| End of Year | | $ | 35,777,194 | | | $ | 38,034,571 | | | $ | 5,974,466 | | | $ | 5,955,456 | |
| Share Transactions: | | | | | | | | | | | | | | | | |
| Issued | | | 2,670,000 | | | | 1,960,000 | | | | 290,000 | | | | 740,000 | |
| Redeemed | | | (280,000 | ) | | | (190,000 | ) | | | (50,000 | ) | | | (820,000 | ) |
| Net Increase (Decrease) in Shares Outstanding from Share Transactions | | | 2,390,000 | | | | 1,770,000 | | | | 240,000 | | | | (80,000 | ) |
The accompanying notes are an integral part of the financial statements.
222
Statements of Changes in Net Assets
| | | Global X Wind Energy ETF | | Global X Green Building ETF |
| | Year Ended
November 30,
2023 | | Year Ended
November 30,
2022 | | Year Ended
November 30,
2023 | | Period Ended
November 30,
2022(1) |
| Operations: | | | | | | | | | | | | |
| Net Investment Income | | $ | 55,926 | | | $ | 25,770 | | | $ | 64,609 | | | $ | 49,324 | |
| Net Realized Gain (Loss) | | | (2,004,036 | ) | | | (530,941 | ) | | | (294,504 | ) | | | (128,565 | ) |
| Net Change in Unrealized Appreciation (Depreciation) | | | (603,848 | ) | | | (656,340 | ) | | | 363,540 | | | | (347,200 | ) |
| Net Increase (Decrease) in Net Assets Resulting from Operations | | | (2,551,958 | ) | | | (1,161,511 | ) | | | 133,645 | | | | (426,441 | ) |
| Distributions: | | | (47,859 | ) | | | (11,474 | ) | | | (70,340 | ) | | | (15,947 | ) |
| Capital Share Transactions: | | | | | | | | | | | | | | | | |
| Issued | | | 13,712,475 | | | | — | | | | 1,528,470 | | | | 2,537,580 | |
| Redeemed | | | (11,748,196 | ) | | | — | | | | (1,521,292 | ) | | | — | |
| Increase in Net Assets from Capital Share Transactions | | | 1,964,279 | | | | — | | | | 7,178 | | | | 2,537,580 | |
| Total Increase (Decrease) in Net Assets | | | (635,538 | ) | | | (1,172,985 | ) | | | 70,483 | | | | 2,095,192 | |
| Net Assets: | | | | | | | | | | | | | | | | |
| Beginning of Year/Period | | | 3,340,925 | | | | 4,513,910 | | | | 2,095,192 | | | | — | |
| End of Year/Period | | $ | 2,705,387 | | | $ | 3,340,925 | | | $ | 2,165,675 | | | $ | 2,095,192 | |
| Share Transactions: | | | | | | | | | | | | | | | | |
| Issued | | | 730,000 | | | | — | | | | 70,000 | | | | 100,000 | |
| Redeemed | | | (710,000 | ) | | | — | | | | (70,000 | ) | | | — | |
| Net Increase in Shares Outstanding from Share Transactions | | | 20,000 | | | | — | | | | — | | | | 100,000 | |
(1) The Fund commenced operations on April 11, 2022.
The accompanying notes are an integral part of the financial statements.
223
Statements of Changes in Net Assets
| | | Global X Metaverse ETF | | Global X
PropTech ETF |
| | | Year Ended
November 30,
2023 | | Period Ended
November 30,
2022(1) | | Period Ended
November 30,
2023(2) |
| Operations: | | | | | | | | | | | | |
| Net Investment Income | | $ | 12,615 | | | $ | 38,718 | | | $ | 1,294 | |
| Net Realized Gain (Loss) | | | (27,591 | ) | | | 140,098 | | | | 62,538 | |
| Net Change in Unrealized Appreciation (Depreciation) | | | 746,796 | | | | (630,117 | ) | | | 154,612 | |
| Net Increase (Decrease) in Net Assets Resulting from Operations | | | 731,820 | | | | (451,301 | ) | | | 218,444 | |
| Distributions: | | | (163,393 | ) | | | (38,313 | ) | | | (453 | ) |
| Capital Share Transactions: | | | | | | | | | | | | |
| Issued | | | 250,060 | | | | 2,410,000 | | | | 2,508,000 | |
| Redeemed | | | (248,983 | ) | | | — | | | | — | |
| Increase in Net Assets from Capital Share Transactions | | | 1,077 | | | | 2,410,000 | | | | 2,508,000 | |
| Total Increase in Net Assets | | | 569,504 | | | | 1,920,386 | | | | 2,725,991 | |
| Net Assets: | | | | | | | | | | | | |
| Beginning of Year/Period | | | 1,920,386 | | | | — | | | | — | |
| End of Year/Period | | $ | 2,489,890 | | | $ | 1,920,386 | | | $ | 2,725,991 | |
| Share Transactions: | | | | | | | | | | | | |
| Issued | | | 10,000 | | | | 100,000 | | | | 100,000 | |
| Redeemed | | | (10,000 | ) | | | — | | | | — | |
| Net Increase in Shares Outstanding from Share Transactions | | | — | | | | 100,000 | | | | 100,000 | |
(1) The Fund commenced operations on April 26, 2022.
(2) The Fund commenced operations on April 11, 2023.
The accompanying notes are an integral part of the financial statements.
224
Consolidated Statement of Changes in Net Assets/Statement of
Changes in Net Assets
| | | Global X
Carbon Credits
Strategy ETF
(Consolidated) | | Global X
Defense Tech
ETF |
| | | Period Ended
November 30,
2023(1) | | Period Ended
November 30,
2023(2) |
| Operations: | | | | | | | | |
| Net Investment Income | | $ | 32,488 | | | $ | 10,359 | |
| Net Realized Gain (Loss) | | | (111,770 | ) | | | 48,318 | |
| Net Change in Unrealized Appreciation (Depreciation) | | | (89,968 | ) | | | 279,559 | |
| Net Increase (Decrease) in Net Assets Resulting from Operations | | | (169,250 | ) | | | 338,236 | |
| Distributions: | | | (3,332 | ) | | | — | |
| Capital Share Transactions: | | | | | | | | |
| Issued | | | 1,756,132 | | | | 4,526,923 | |
| Redeemed | | | — | | | | (270,300 | ) |
| Increase in Net Assets from Capital Share Transactions | | | 1,756,132 | | | | 4,256,623 | |
| Total Increase in Net Assets | | | 1,583,550 | | | | 4,594,859 | |
| Net Assets: | | | | | | | | |
| Beginning of Period | | | — | | | | — | |
| End of Period | | $ | 1,583,550 | | | $ | 4,594,859 | |
| Share Transactions: | | | | | | | | |
| Issued | | | 50,000 | | | | 180,000 | |
| Redeemed | | | — | | | | (10,000 | ) |
| Net Increase in Shares Outstanding from Share Transactions | | | 50,000 | | | | 170,000 | |
(1) The Fund commenced operations on May 24, 2023.
(2) The Fund commenced operations on September 11, 2023.
The accompanying notes are an integral part of the financial statements.
225
Financial Highlights
Selected Per Share Data & Ratios
For a Share Outstanding Throughout the Period |
| | | Net
Asset Value,
Beginning
of Period
($) | | Net Investment
Income
($)* | | Net Realized
and Unrealized
Gain (Loss) on
Investments
($) | | Total from
Operations
($) | | Distribution
from Net
Investment
Income ($) | | Distribution
from Capital
Gains ($) | | Return of
Capital ($) |
| Global X Millennial Consumer ETF | | | | | | | | | | | | | | | | | | | | | | | | |
| 2023 | | | 28.43 | | | | 0.07 | | | | 4.43 | | | | 4.50 | | | | (0.07 | ) | | | — | | | | — | |
| 2022 | | | 42.68 | | | | 0.05 | | | | (14.23 | ) | | | (14.18 | ) | | | (0.07 | ) | | | — | | | | — | |
| 2021 | | | 35.23 | | | | 0.08 | | | | 7.43 | | | | 7.51 | | | | (0.06 | ) | | | — | | | | — | |
| 2020 | | | 25.55 | | | | 0.05 | | | | 9.74 | | | | 9.79 | | | | (0.10 | ) | | | (0.01 | ) | | | — | |
| 2019 | | | 21.57 | | | | 0.10 | | | | 3.99 | | | | 4.09 | | | | (0.10 | ) | | | (0.01 | ) | | | — | |
| Global X Aging Population ETF | | | | | | | | | | | | | | | | | | | | | | | | |
| 2023 | | | 26.46 | | | | 0.23 | | | | 0.41 | | | | 0.64 | | | | (0.17 | ) | | | — | | | | — | |
| 2022 | | | 27.41 | | | | 0.20 | | | | (0.87 | ) | | | (0.67 | ) | | | (0.26 | ) | | | — | | | | (0.02 | ) |
| 2021 | | | 26.82 | | | | 0.13 | | | | 0.55 | | | | 0.68 | | | | (0.09 | ) | | | — | | | | — | |
| 2020 | | | 23.55 | | | | 0.10 | | | | 3.35 | | | | 3.45 | | | | (0.13 | ) | | | (0.05 | ) | | | — | |
| 2019 | | | 20.67 | | | | 0.13 | | | | 2.99 | | | | 3.12 | | | | (0.18 | ) | | | (0.06 | ) | | | — | |
| Global X Health & Wellness ETF | | | | | | | | | | | | | | | | | | | | | | | | |
| 2023 | | | 21.37 | | | | 0.21 | | | | 0.99 | | | | 1.20 | | | | (0.22 | ) | | | — | | | | — | |
| 2022 | | | 28.04 | | | | 0.21 | | | | (6.66 | ) | | | (6.45 | ) | | | (0.22 | ) | | | — | | | | — | |
| 2021 | | | 24.11 | | | | 0.20 | | | | 3.87 | | | | 4.07 | | | | (0.14 | ) | | | — | | | | — | |
| 2020 | | | 21.17 | | | | 0.10 | | | | 2.92 | | | | 3.02 | | | | (0.08 | ) | | | — | | | | — | |
| 2019 | | | 18.59 | | | | 0.14 | | | | 2.60 | | | | 2.74 | | | | (0.16 | ) | | | — | | | | — | |
| * | Per share data calculated using average shares method. |
| ** | Total Return is for the period indicated and has not been annualized. The return shown does not reflect the deduction of taxes that a shareholder would pay on Fund distributions or the redemption of Fund shares. |
| †† | Portfolio turnover rate is for the period indicated and periods of less than one year have not been annualized. Excludes effect of in-kind transfers. |
| ‡ | Effective April 1, 2020, the Fund’s fees were permanently lowered to 0.50%. Prior to April 1, 2020, the ratio of Expenses to Average Net Assets included the effect of a waiver. If these offsets were excluded, the ratio would have been 0.57% and 0.68%, for the years ended November 30, 2020 and 2019, respectively. |
| ^ | Effective April 1, 2020, the Fund’s fees were permanently lowered to 0.50%. Prior to April 1, 2020, the ratio of Expenses to Average Net Assets included the effect of a waiver. If these offsets were excluded, the ratio would have been 0.56% and 0.68%, for the years ended November 30, 2020 and 2019, respectively. |
| ^^ | Effective April 1, 2020, the Fund’s fees were permanently lowered to 0.50%. Prior to April 1, 2020, the ratio of Expenses to Average Net Assets included the effect of a waiver. If these offsets were excluded, the ratio would have been 0.55% and 0.68%, for the years ended November 30, 2020 and 2019, respectively. |
Amounts designated as “—” are either $0 or have been rounded to $0.
The accompanying notes are an integral part of the financial statements.
226
Financial Highlights
Total from
Distributions ($) | | Net
Asset Value,
End of
Period ($) | | Total
Return
(%)** | | Net Assets, End of
Period ($)(000) | | Ratio of Expenses
to Average Net
Assets (%) | | Ratio of Net
Investment Income
to Average Net
Assets (%) | | Portfolio
Turnover (%)†† |
| | | | | | | | | | | | | | | | | | | | | | | | | | | |
| | (0.07 | ) | | | 32.86 | | | | 15.87 | | | | 105,493 | | | | 0.50 | | | | 0.23 | | | | 16.60 | |
| | (0.07 | ) | | | 28.43 | | | | (33.29 | ) | | | 105,459 | | | | 0.50 | | | | 0.17 | | | | 14.75 | |
| | (0.06 | ) | | | 42.68 | | | | 21.33 | | | | 227,075 | | | | 0.50 | | | | 0.18 | | | | 11.59 | |
| | (0.11 | ) | | | 35.23 | | | | 38.47 | | | | 114,511 | | | | 0.50 | ^ | | | 0.19 | | | | 7.11 | |
| | (0.11 | ) | | | 25.55 | | | | 19.07 | | | | 75,383 | | | | 0.50 | ^ | | | 0.42 | | | | 10.44 | |
| | | | | | | | | | | | | | | | | | | | | | | | | | | |
| | (0.17 | ) | | | 26.93 | | | | 2.42 | | | | 53,596 | | | | 0.50 | | | | 0.87 | | | | 13.34 | |
| | (0.28 | ) | | | 26.46 | | | | (2.47 | ) | | | 41,800 | | | | 0.50 | | | | 0.76 | | | | 13.50 | |
| | (0.09 | ) | | | 27.41 | | | | 2.51 | | | | 59,756 | | | | 0.50 | | | | 0.43 | | | | 19.57 | |
| | (0.18 | ) | | | 26.82 | | | | 14.79 | | | | 42,907 | | | | 0.50 | ^^ | | | 0.43 | | | | 9.10 | |
| | (0.24 | ) | | | 23.55 | | | | 15.38 | | | | 23,548 | | | | 0.50 | ^^ | | | 0.62 | | | | 14.18 | |
| | | | | | | | | | | | | | | | | | | | | | | | | | | |
| | (0.22 | ) | | | 22.35 | | | | 5.64 | | | | 9,162 | | | | 0.50 | | | | 0.96 | | | | 10.10 | |
| | (0.22 | ) | | | 21.37 | | | | (23.11 | ) | | | 22,652 | | | | 0.50 | | | | 0.90 | | | | 13.49 | |
| | (0.14 | ) | | | 28.04 | | | | 16.90 | | | | 40,091 | | | | 0.50 | | | | 0.71 | | | | 14.90 | |
| | (0.08 | ) | | | 24.11 | | | | 14.34 | | | | 20,496 | | | | 0.50 | ‡ | | | 0.48 | | | | 20.54 | |
| | (0.16 | ) | | | 21.17 | | | | 14.89 | | | | 20,115 | | | | 0.50 | ‡ | | | 0.74 | | | | 18.05 | |
The accompanying notes are an integral part of the financial statements.
227
Financial Highlights
Selected Per Share Data & Ratios
For a Share Outstanding Throughout the Period |
| | | Net
Asset Value,
Beginning
of Period
($) | | Net Investment
Income (Loss)
($)* | | Net Realized
and Unrealized
Gain (Loss) on
Investments
($) | | Total from
Operations
($) | | Distribution
from Net
Investment
Income ($) | | Distribution
from Capital
Gains ($) | | Return of
Capital ($) |
| Global X Robotics & Artificial Intelligence ETF | | | | | | | | | | | | | | | | | | | | | | |
| 2023 | | | 21.09 | | | | 0.07 | | | | 5.36 | | | | 5.43 | | | | (0.05 | ) | | | — | | | | — | |
| 2022 | | | 36.24 | | | | 0.04 | | | | (15.14 | ) | | | (15.10 | ) | | | (0.04 | ) | | | — | | | | (0.01 | ) |
| 2021 | | | 31.78 | | | | 0.02 | | | | 4.50 | | | | 4.52 | | | | (0.02 | ) | | | — | | | | (0.04 | ) |
| 2020 | | | 21.43 | | | | 0.05 | | | | 10.39 | | | | 10.44 | | | | (0.08 | ) | | | — | | | | (0.01 | ) |
| 2019 | | | 19.70 | | | | 0.19 | | | | 1.93 | | | | 2.12 | | | | (0.39 | ) | | | — | | | | — | |
| Global X FinTech ETF | | | | | | | | | | | | | | | | | | | | | | | |
| 2023 | | | 20.44 | | | | 0.05 | | | | 1.93 | | | | 1.98 | | | | (0.05 | ) | | | — | | | | — | *** |
| 2022 | | | 45.52 | | | | 0.09 | | | | (22.96 | ) | | | (22.87 | ) | | | (2.16 | ) | | | — | | | | (0.05 | ) |
| 2021 | | | 42.75 | | | | (0.13 | ) | | | 2.90 | | | | 2.77 | | | | — | | | | — | | | | — | |
| 2020 | | | 30.49 | | | | (0.11 | ) | | | 12.37 | | | | 12.26 | | | | — | | | | — | | | | — | |
| 2019 | | | 24.55 | | | | (0.08 | ) | | | 6.06 | | | | 5.98 | | | | — | | | | — | | | | (0.04 | ) |
| Global X Internet of Things ETF | | | | | | | | | | | | | | | | | | | | | | | |
| 2023 | | | 30.54 | | | | 0.25 | | | | 1.95 | | | | 2.20 | | | | (0.29 | ) | | | — | | | | — | |
| 2022 | | | 37.68 | | | | 0.21 | | | | (7.17 | ) | | | (6.96 | ) | | | (0.13 | ) | | | (0.05 | ) | | | — | |
| 2021 | | | 29.95 | | | | 0.13 | | | | 7.72 | | | | 7.85 | | | | (0.12 | ) | | | — | | | | — | |
| 2020 | | | 22.89 | | | | 0.17 | | | | 7.08 | | | | 7.25 | | | | (0.19 | ) | | | — | | | | — | |
| 2019 | | | 18.04 | | | | 0.20 | | | | 4.93 | | | | 5.13 | | | | (0.28 | ) | | | — | | | | — | |
| * | Per share data calculated using average shares method. |
| ** | Total Return is for the period indicated and has not been annualized. The return shown does not reflect the deduction of taxes that a shareholder would pay on Fund distributions or the redemption of Fund shares. |
| *** | Amount is less than $0.005. |
| †† | Portfolio turnover rate is for the period indicated and periods of less than one year have not been annualized. Excludes effect of in-kind transfers. |
Amounts designated as “—” are either $0 or have been rounded to $0.
The accompanying notes are an integral part of the financial statements.
228
Financial Highlights
Total from Distributions ($) | | Net
Asset Value,
End of
Period ($) | | Total
Return
(%)** | | Net Assets, End of
Period ($)(000) | | Ratio of Expenses
to Average Net
Assets (%) | | Ratio of Net
Investment Income
(Loss) to Average
Net Assets (%) | | Portfolio
Turnover (%)†† |
| | | | | | | | | | | | | | | | | | | | | | | | | | | |
| | (0.05 | ) | | | 26.47 | | | | 25.75 | | | | 2,269,824 | | | | 0.68 | | | | 0.26 | | | | 8.28 | |
| | (0.05 | ) | | | 21.09 | | | | (41.67 | ) | | | 1,341,942 | | | | 0.69 | | | | 0.16 | | | | 29.86 | |
| | (0.06 | ) | | | 36.24 | | | | 14.23 | | | | 2,703,488 | | | | 0.68 | | | | 0.06 | | | | 22.66 | |
| | (0.09 | ) | | | 31.78 | | | | 48.90 | | | | 2,158,175 | | | | 0.68 | | | | 0.21 | | | | 22.27 | |
| | (0.39 | ) | | | 21.43 | | | | 11.16 | | | | 1,479,984 | | | | 0.68 | | | | 0.98 | | | | 10.97 | |
| | | | | | | | | | | | | | | | | | | | | | | | | | | |
| | (0.05 | ) | | | 22.37 | | | | 9.70 | | | | 351,478 | | | | 0.68 | | | | 0.23 | | | | 13.12 | |
| | (2.21 | ) | | | 20.44 | | | | (52.58 | ) | | | 455,463 | | | | 0.68 | | | | 0.33 | | | | 38.15 | |
| | — | | | | 45.52 | | | | 6.48 | | | | 1,289,006 | | | | 0.68 | | | | (0.28 | ) | | | 29.60 | |
| | — | | | | 42.75 | | | | 40.21 | | | | 874,175 | | | | 0.68 | | | | (0.33 | ) | | | 15.75 | |
| | (0.04 | ) | | | 30.49 | | | | 24.42 | | | | 413,152 | | | | 0.68 | | | | (0.29 | ) | | | 16.40 | |
| | | | | | | | | | | | | | | | | | | | | | | | | | | |
| | (0.29 | ) | | | 32.45 | | | | 7.26 | | | | 287,487 | | | | 0.68 | | | | 0.79 | | | | 11.12 | |
| | (0.18 | ) | | | 30.54 | | | | (18.52 | ) | | | 305,697 | | | | 0.68 | | | | 0.67 | | | | 8.40 | |
| | (0.12 | ) | | | 37.68 | | | | 26.24 | | | | 517,291 | | | | 0.68 | | | | 0.37 | | | | 9.25 | |
| | (0.19 | ) | | | 29.95 | | | | 31.88 | | | | 296,508 | | | | 0.68 | | | | 0.71 | | | | 14.28 | |
| | (0.28 | ) | | | 22.89 | | | | 29.01 | | | | 131,627 | | | | 0.68 | | | | 1.04 | | | | 11.71 | |
The accompanying notes are an integral part of the financial statements.
229
Financial Highlights
Selected Per Share Data & Ratios
For a Share Outstanding Throughout the Period |
| | | Net
Asset Value,
Beginning
of Period
($) | | Net Investment
Income
($)* | | Net Realized
and Unrealized
Gain (Loss) on
Investments
($) | | Total from
Operations
($) | | Distribution
from Net
Investment
Income ($) | | Distribution
from Capital
Gains ($) | | Return of
Capital ($) |
| Global X U.S. Infrastructure Development ETF | | | | | | | | | | | | | | | | | | | | | | |
| 2023 | | | 27.94 | | | | 0.24 | | | | 3.54 | | | | 3.78 | | | | (0.22 | ) | | | — | | | | — | |
| 2022 | | | 27.19 | | | | 0.19 | | | | 0.74 | | | | 0.93 | | | | (0.17 | ) | | | (0.01 | ) | | | — | |
| 2021 | | | 20.24 | | | | 0.17 | | | | 6.87 | | | | 7.04 | | | | (0.09 | ) | | | — | *** | | | — | |
| 2020 | | | 17.43 | | | | 0.16 | | | | 2.74 | | | | 2.90 | | | | (0.09 | ) | | | — | | | | — | |
| 2019 | | | 15.57 | | | | 0.13 | | | | 1.90 | | | | 2.03 | | | | (0.17 | ) | | | — | | | | — | |
| Global X Autonomous & Electric Vehicles ETF | | | | | | | | | | | | | | | | | | | | | | |
| 2023 | | | 22.89 | | | | 0.38 | | | | 0.23 | | | | 0.61 | | | | (0.31 | ) | | | — | | | | — | |
| 2022 | | | 30.41 | | | | 0.19 | | | | (7.56 | ) | | | (7.37 | ) | | | (0.13 | ) | | | (0.02 | ) | | | — | |
| 2021 | | | 21.75 | | | | 0.09 | | | | 8.65 | | | | 8.74 | | | | (0.08 | ) | | | — | | | | — | |
| 2020 | | | 14.15 | | | | 0.11 | | | | 7.61 | | | | 7.72 | | | | (0.12 | ) | | | — | | | | — | |
| 2019 | | | 13.26 | | | | 0.22 | | | | 1.11 | | | | 1.33 | | | | (0.44 | ) | | | — | | | | — | |
| Global X Artificial Intelligence & Technology ETF | | | | | | | | | | | | | | | | | | | | | | |
| 2023 | | | 21.54 | | | | 0.07 | | | | 8.21 | | | | 8.28 | | | | (0.09 | ) | | | — | | | | — | |
| 2022 | | | 31.58 | | | | 0.11 | | | | (10.08 | ) | | | (9.97 | ) | | | (0.07 | ) | | | — | | | | — | |
| 2021 | | | 25.84 | | | | 0.05 | | | | 5.78 | | | | 5.83 | | | | (0.09 | ) | | | — | | | | — | |
| 2020 | | | 17.35 | | | | 0.17 | | | | 8.44 | | | | 8.61 | | | | (0.12 | ) | | | — | | | | — | |
| 2019 | | | 14.24 | | | | 0.10 | | | | 3.13 | | | | 3.23 | | | | (0.12 | ) | | | — | | | | — | |
| * | Per share data calculated using average shares method. |
| ** | Total Return is for the period indicated and has not been annualized. The return shown does not reflect the deduction of taxes that a shareholder would pay on Fund distributions or the redemption of Fund shares. |
| *** | Amount is less than $0.005. |
| †† | Portfolio turnover rate is for the period indicated and periods of less than one year have not been annualized. Excludes effect of in-kind transfers. |
| ^ | Effective April 1, 2019, the Fund’s fees were permanently lowered to 0.47%. Prior to April 1, 2019, the ratio of Expenses to Average Net Assets included the effect of a waiver. If these offsets were excluded, the ratio would have been 0.50% for the year ended November 30, 2019. |
Amounts designated as “—” are either $0 or have been rounded to $0.
The accompanying notes are an integral part of the financial statements.
230
Financial Highlights
Total from
Distributions ($) | | Net
Asset Value,
End of
Period ($) | | Total
Return
(%)** | | Net Assets, End of
Period ($)(000) | | Ratio of Expenses
to Average Net
Assets (%) | | Ratio of Net
Investment Income
to Average Net
Assets (%) | | Portfolio
Turnover (%)†† |
| | | | | | | | | | | | | | | | | | | | | | | | | | | |
| | (0.22 | ) | | | 31.50 | | | | 13.63 | | | | 5,153,796 | | | | 0.47 | | | | 0.82 | | | | 5.99 | |
| (0.18 | ) | | | 27.94 | | | | 3.48 | | | | 3,748,693 | | | | 0.47 | | | | 0.74 | | | | 9.78 | |
| | (0.09 | ) | | | 27.19 | | | | 34.90 | | | | 5,186,497 | | | | 0.47 | | | | 0.64 | | | | 10.07 | |
| | (0.09 | ) | | | 20.24 | | | | 16.77 | | | | 653,635 | | | | 0.47 | | | | 0.96 | | | | 9.08 | |
| | (0.17 | ) | | | 17.43 | | | | 13.28 | | | | 183,065 | | | | 0.47 | ^ | | | 0.81 | | | | 9.18 | |
| | | | | | | | | | | | | | | | | | | | | | | | | | | |
| | (0.31 | ) | | | 23.19 | | | | 2.71 | | | | 697,745 | | | | 0.68 | | | | 1.63 | | | | 26.60 | |
| | (0.15 | ) | | | 22.89 | | | | (24.25 | ) | | | 883,478 | | | | 0.68 | | | | 0.74 | | | | 34.76 | |
| | (0.08 | ) | | | 30.41 | | | | 40.22 | | | | 1,323,546 | | | | 0.68 | | | | 0.33 | | | | 18.17 | |
| | (0.12 | ) | | | 21.75 | | | | 54.98 | | | | 135,923 | | | | 0.68 | | | | 0.67 | | | | 13.76 | |
| | (0.44 | ) | | | 14.15 | | | | 10.61 | | | | 14,855 | | | | 0.68 | | | | 1.67 | | | | 31.26 | |
| | | | | | | | | | | | | | | | | | | | | | | | | | | |
| | (0.09 | ) | | | 29.73 | | | | 38.56 | | | | 789,875 | | | | 0.68 | | | | 0.28 | | | | 19.08 | |
| | (0.07 | ) | | | 21.54 | | | | (31.58 | ) | | | 130,518 | | | | 0.68 | | | | 0.46 | | | | 21.28 | |
| | (0.09 | ) | | | 31.58 | | | | 22.60 | | | | 186,334 | | | | 0.68 | | | | 0.17 | | | | 26.37 | |
| | (0.12 | ) | | | 25.84 | | | | 49.84 | | | | 120,169 | | | | 0.68 | | | | 0.79 | | | | 19.45 | |
| | (0.12 | ) | | | 17.35 | | | | 22.87 | | | | 44,245 | | | | 0.68 | | | | 0.61 | | | | 16.34 | |
The accompanying notes are an integral part of the financial statements.
231
Financial Highlights
Selected Per Share Data & Ratios
For a Share Outstanding Throughout the Period |
| | | Net
Asset Value,
Beginning
of Period
($) | | Net Investment
Income (Loss)
($)* | | Net Realized
and Unrealized
Gain (Loss) on
Investments
($) | | Total from
Operations
($) | | Distribution
from Net
Investment
Income ($) | | Distribution
from Capital
Gains ($) | | Return of
Capital ($) |
| Global X Genomics & Biotechnology ETF | | | | | | | | | | | | | | | | | | | | | | | |
| 2023 | | | 13.45 | | | | (0.04 | ) | | | (3.00 | ) | | | (3.04 | ) | | | — | | | | — | | | | — | |
| 2022 | | | 20.61 | | | | (0.03 | ) | | | (7.12 | ) | | | (7.15 | ) | | | (0.01 | ) | | | — | | | | — | |
| 2021 | | | 21.01 | | | | (0.08 | ) | | | (0.29 | ) | | | (0.37 | ) | | | — | | | | (0.03 | ) | | | — | |
| 2020 | | | 15.61 | | | | (0.07 | ) | | | 5.47 | | | | 5.40 | | | | — | | | | — | | | | — | |
| 2019(1) | | | 15.28 | | | | (0.05 | ) | | | 0.38 | | | | 0.33 | | | | — | | | | — | | | | — | |
| Global X Cloud Computing ETF | | | | | | | | | | | | | | | | | | | | | | | |
| 2023 | | | 16.77 | | | | (0.10 | ) | | | 4.12 | | | | 4.02 | | | | — | | | | — | | | | — | |
| 2022 | | | 28.38 | | | | (0.15 | ) | | | (10.99 | ) | | | (11.14 | ) | | | — | | | | (0.47 | ) | | | — | |
| 2021 | | | 25.84 | | | | (0.15 | ) | | | 2.69 | | | | 2.54 | | | | — | | | | — | | | | — | |
| 2020 | | | 15.99 | | | | (0.11 | ) | | | 9.97 | | | | 9.86 | | | | — | | | | (0.01 | ) | | | — | |
| 2019(2) | | | 15.06 | | | | (0.04 | ) | | | 0.97 | | | | 0.93 | | | | — | | | | — | | | | — | |
| Global X Cannabis ETF | | | | | | | | | | | | | | | | | | | | | | | |
| 2023 | | | 14.95 | | | | 0.43 | | | | (9.58 | ) | | | (9.15 | ) | | | (0.28 | ) | | | — | | | | — | |
| 2022(3) | | | 43.32 | | | | 0.69 | | | | (27.82 | ) | | | (27.13 | ) | | | (1.21 | ) | | | — | | | | (0.03 | ) |
| 2021(3) | | | 72.30 | | | | 1.32 | | | | (28.86 | ) | | | (27.54 | ) | | | (1.44 | ) | | | — | | | | — | |
| 2020(3) | | | 91.86 | | | | 4.86 | | | | (20.76 | ) | | | (15.90 | ) | | | (3.66 | ) | | | — | | | | — | |
| 2019(3)(4) | | | 146.46 | | | | 1.32 | | | | (55.92 | ) | | | (54.60 | ) | | | — | | | | — | | | | — | |
| * | Per share data calculated using average shares method. |
| ** | Total Return is for the period indicated and has not been annualized. The return shown does not reflect the deduction of taxes that a shareholder would pay on Fund distributions or the redemption of Fund shares. |
| † | Annualized. |
| †† | Portfolio turnover rate is for the period indicated and periods of less than one year have not been annualized. Excludes effect of in-kind transfers. |
| ‡ | Effective June 15 2020, the Fund’s fees were permanently lowered to 0.50%. |
| (1) | The Fund commenced operations on April 5, 2019. |
| (2) | The Fund commenced operations on April 12, 2019. |
| (3) | Per share amounts have been adjusted for a 1 for 6 reverse share split on June 10, 2022. (See Note 11 in the Notes to Financial Statements/Notes to Consolidated Financial Statements.) |
| (4) | The Fund commenced operations on September 17, 2019. |
Amounts designated as “—” are either $0 or have been rounded to $0.
The accompanying notes are an integral part of the financial statements.
232
Financial Highlights
Total from
Distributions ($) | | Net
Asset Value,
End of
Period ($) | | Total
Return
(%)** | | Net Assets, End of
Period ($)(000) | | Ratio of Expenses
to Average Net
Assets (%) | | Ratio of Net
Investment Income
(Loss) to Average
Net Assets (%) | | Portfolio
Turnover (%)†† |
| | | | | | | | | | | | | | | | | | | | | | | | | | | |
| | — | | | | 10.41 | | | | (22.60 | ) | | | 93,029 | | | | 0.50 | | | | (0.34 | ) | | | 16.59 | |
| | (0.01 | ) | | | 13.45 | | | | (34.72 | ) | | | 209,341 | | | | 0.50 | | | | (0.21 | ) | | | 39.39 | |
| | (0.03 | ) | | | 20.61 | | | | (1.77 | ) | | | 255,572 | | | | 0.50 | | | | (0.35 | ) | | | 29.25 | |
| | — | | | | 21.01 | | | | 34.59 | | | | 81,951 | | | | 0.56 | ‡ | | | (0.40 | ) | | | 29.76 | |
| | — | | | | 15.61 | | | | 2.16 | | | | 18,734 | | | | 0.68 | † | | | (0.59 | )† | | | 23.12 | |
| | | | | | | | | | | | | | | | | | | | | | | | | | | |
| | — | | | | 20.79 | | | | 23.97 | | | | 581,162 | | | | 0.68 | | | | (0.54 | ) | | | 21.60 | |
| | (0.47 | ) | | | 16.77 | | | | (39.88 | ) | | | 589,085 | | | | 0.68 | | | | (0.74 | ) | | | 31.21 | |
| | — | | | | 28.38 | | | | 9.83 | | | | 1,317,544 | | | | 0.68 | | | | (0.53 | ) | | | 23.77 | |
| | (0.01 | ) | | | 25.84 | | | | 61.68 | | | | 1,405,489 | | | | 0.68 | | | | (0.53 | ) | | | 23.03 | |
| | — | | | | 15.99 | | | | 6.18 | | | | 472,386 | | | | 0.68 | † | | | (0.44 | )† | | | 12.52 | |
| | | | | | | | | | | | | | | | | | | | | | | | | | | |
| | (0.28 | ) | | | 5.52 | | | | (61.63 | ) | | | 28,424 | | | | 0.51 | | | | 5.24 | | | | 53.56 | |
| | (1.24 | ) | | | 14.95 | | | | (63.88 | ) | | | 55,904 | | | | 0.51 | | | | 3.05 | | | | 65.14 | |
| | (1.44) | | | | 43.32 | | | | (38.79 | ) | | | 105,549 | | | | 0.50 | | | | 1.76 | | | | 113.26 | |
| | (3.66 | ) | | | 72.30 | | | | (17.03 | ) | | | 36,160 | | | | 0.51 | | | | 8.11 | | | | 59.79 | |
| | — | | | | 91.86 | | | | (37.28 | ) | | | 4,594 | | | | 0.50 | † | | | 6.19 | † | | | 11.40 | |
The accompanying notes are an integral part of the financial statements.
233
Financial Highlights
Selected Per Share Data & Ratios
For a Share Outstanding Throughout the Period |
| | | Net
Asset Value,
Beginning
of Period
($) | | Net Investment
Income (Loss)
($)* | | Net Realized
and Unrealized
Gain (Loss) on
Investments
($) | | Total from
Operations
($) | | Distribution
from Net
Investment
Income ($) | | Distribution
from Capital
Gains ($) | | Return of
Capital ($) |
| Global X Thematic Growth ETF | | | | | | | | | | | | | | | | | | | | | | | |
| 2023 | | | 26.14 | | | | 0.11 | | | | (2.79 | ) | | | (2.68 | ) | | | (0.41 | ) | | | — | | | | — | |
| 2022 | | | 47.65 | | | | 0.44 | | | | (21.33 | ) | | | (20.89 | ) | | | (0.62 | ) | | | — | | | | — | |
| 2021 | | | 42.45 | | | | 0.39 | | | | 5.10 | | | | 5.49 | | | | (0.29 | ) | | | — | | | | — | |
| 2020 | | | 26.50 | | | | 0.10 | | | | 15.96 | | | | 16.06 | | | | (0.11 | ) | | | — | | | | — | |
| 2019(1) | | | 25.23 | | | | — | | | | 1.27 | | | | 1.27 | | | | — | | | | — | | | | — | |
| Global X Video Games & Esports ETF | | | | | | | | | | | | | | | | | | | | | | | |
| 2023 | | | 18.96 | | | | 0.10 | | | | 0.90 | | | | 1.00 | | | | (0.03 | ) | | | — | | | | — | |
| 2022 | | | 29.52 | | | | 0.08 | | | | (10.39 | ) | | | (10.31 | ) | | | (0.14 | ) | | | (0.07 | ) | | | (0.04 | ) |
| 2021 | | | 28.57 | | | | 0.04 | | | | 1.14 | | | | 1.18 | | | | (0.23 | ) | | | — | *** | | | — | |
| 2020 | | | 15.73 | | | | 0.02 | | | | 12.86 | | | | 12.88 | | | | (0.04 | ) | | | — | | | | — | |
| 2019(1) | | | 14.99 | | | | — | | | | 0.74 | | | | 0.74 | | | | — | | | | — | | | | — | |
| Global X Cybersecurity ETF | | | | | | | | | | | | | | | | | | | | | | | |
| 2023 | | | 22.85 | | | | (0.03 | ) | | | 4.34 | | | | 4.31 | | | | — | | | | (0.32 | ) | | | — | |
| 2022 | | | 31.75 | | | | (0.03 | ) | | | (8.66 | ) | | | (8.69 | ) | | | (0.09 | ) | | | (0.12 | ) | | | — | |
| 2021 | | | 22.75 | | | | 0.12 | | | | 8.90 | | | | 9.02 | | | | (0.01 | ) | | | (0.01 | ) | | | — | |
| 2020 | | | 17.14 | | | | 0.09 | | | | 5.67 | | | | 5.76 | | | | (0.13 | ) | | | (0.02 | ) | | | — | |
| 2019(1) | | | 15.27 | | | | — | | | | 1.87 | | | | 1.87 | | | | — | | | | — | | | | — | |
| * | Per share data calculated using average shares method. |
| ** | Total Return is for the period indicated and has not been annualized. The return shown does not reflect the deduction of taxes that a shareholder would pay on Fund distributions or the redemption of Fund shares. |
| *** | Amount is less than $0.005. |
| † | Annualized. |
| †† | Portfolio turnover rate is for the period indicated and periods of less than one year have not been annualized. Excludes effect of in-kind transfers. |
| ‡ | Effective for the fiscal year ended November 30, 2022, the Fund began presenting acquired fund fees borne by the Adviser as part of its unitary fee agreement (See Note 3 in Notes to Financial Statements/Notes to Consolidated Financial Statements) as a realized gain on the Statement of Operations as compared to a contra-expense as in prior fiscal years. If such amounts had been presented as a realized gain in years prior to 2022, the ratio of Expenses to Average Net Assets would have been 0.50% each year. |
| ^ | Effective April 1, 2021, the Fund’s management fees were permanently lowered to 0.50%. Prior to April 1, 2021, the ratio of Expenses to Average Net Assets included the effect of a waiver. If these offsets were excluded, the ratio would have been 0.52%, 0.60% and 0.60% for the years ended November 30, 2021, 2020 and 2019, respectively. |
| # | Excludes fees and expenses incurred indirectly as a result of investments in underlying funds. |
| (1) | The Fund commenced operations on October 25, 2019. |
Amounts designated as “—” are either $0 or have been rounded to $0.
The accompanying notes are an integral part of the financial statements.
234
Financial Highlights
Total from
Distributions ($) | | Net
Asset Value,
End of
Period ($) | | Total
Return
(%)** | | Net Assets, End of
Period ($)(000) | | Ratio of Expenses
to Average Net
Assets (%) | | Ratio of Net
Investment Income
(Loss) to Average
Net Assets (%) | | Portfolio
Turnover (%)†† |
| | | | | | | | | | | | | | | | | | | | | | | | | | | |
| | (0.41 | ) | | | 23.05 | | | | (10.30 | ) | | | 32,270 | | | | 0.50 | | | | 0.45 | | | | 54.28 | |
| | (0.62 | ) | | | 26.14 | | | | (44.36 | ) | | | 50,979 | | | | 0.50 | # | | | 1.32 | | | | 55.00 | |
| | (0.29 | ) | | | 47.65 | | | | 12.95 | | | | 110,081 | | | | (0.13 | )#‡ | | | 0.77 | | | | 32.16 | |
| | (0.11 | ) | | | 42.45 | | | | 60.81 | | | | 36,081 | | | | (0.12 | )#‡ | | | 0.29 | | | | 103.23 | |
| | — | | | | 26.50 | | | | 5.03 | | | | 2,650 | | | | (0.15 | )#†‡ | | | 0.15 | † | | | — | |
| | | | | | | | | | | | | | | | | | | | | | | | | | | |
| | (0.03 | ) | | | 19.93 | | | | 5.29 | | | | 132,339 | | | | 0.50 | | | | 0.49 | | | | 26.11 | |
| | (0.25 | ) | | | 18.96 | | | | (35.19 | ) | | | 174,075 | | | | 0.50 | | | | 0.36 | | | | 55.72 | |
| | (0.23 | ) | | | 29.52 | | | | 4.09 | | | | 485,235 | | | | 0.50 | | | | 0.09 | | | | 23.45 | |
| | (0.04 | ) | | | 28.57 | | | | 82.04 | | | | 481,341 | | | | 0.50 | | | | 0.04 | | | | 12.02 | |
| | — | | | | 15.73 | | | | 4.94 | | | | 1,573 | | | | 0.50 | † | | | (0.45 | )† | | | 0.27 | |
| | | | | | | | | | | | | | | | | | | | | | | | | | | |
| | (0.32 | ) | | | 26.84 | | | | 19.29 | | | | 647,551 | | | | 0.50 | | | | (0.12 | ) | | | 18.77 | |
| | (0.21 | ) | | | 22.85 | | | | (27.56 | ) | | | 967,942 | | | | 0.51 | | | | (0.11 | ) | | | 57.81 | |
| | (0.02 | ) | | | 31.75 | | | | 39.68 | | | | 1,132,090 | | | | 0.50 | ^ | | | 0.41 | | | | 26.34 | |
| | (0.15 | ) | | | 22.75 | | | | 33.78 | | | | 46,634 | | | | 0.50 | ^ | | | 0.43 | | | | 21.29 | |
| | — | | | | 17.14 | | | | 12.25 | | | | 1,714 | | | | 0.50 | ^† | | | (0.16 | )† | | | 3.57 | |
The accompanying notes are an integral part of the financial statements.
235
Financial Highlights
Selected Per Share Data & Ratios
For a Share Outstanding Throughout the Period |
| | | Net
Asset Value,
Beginning
of Period
($) | | Net Investment
Income (Loss)
($)* | | Net Realized
and Unrealized
Gain (Loss) on
Investments
($) | | Total from
Operations
($) | | Distribution
from Net
Investment
Income ($) | | Distribution
from Capital
Gains ($) | | Return of
Capital ($) |
| Global X Telemedicine & Digital Health ETF | | | | | | | | | | | | | | | | | | |
| 2023 | | | 12.23 | | | | (0.04 | ) | | | (3.24 | ) | | | (3.28 | ) | | | — | | | | — | | | | — | |
| 2022 | | | 16.32 | | | | (0.01 | ) | | | (4.08 | ) | | | (4.09 | ) | | | — | | | | — | | | | — | |
| 2021 | | | 18.41 | | | | (0.10 | ) | | | (1.98 | ) | | | (2.08 | ) | | | (0.01 | ) | | | — | | | | — | |
| 2020(1) | | | 15.23 | | | | 0.01 | | | | 3.17 | | | | 3.18 | | | | — | | | | — | | | | — | |
| Global X China Biotech Innovation ETF | | | | | | | | | | | | | | | | | | |
| 2023 | | | 9.68 | | | | 0.04 | | | | (1.17 | ) | | | (1.13 | ) | | | (0.04 | ) | | | — | | | | — | |
| 2022 | | | 15.96 | | | | 0.01 | | | | (6.27 | ) | | | (6.26 | ) | | | — | | | | — | | | | (0.02 | ) |
| 2021 | | | 14.88 | | | | (0.05 | ) | | | 1.13 | | | | 1.08 | | | | — | | | | — | | | | — | |
| 2020(2) | | | 15.09 | | | | (0.02 | ) | | | (0.19 | ) | | | (0.21 | ) | | | — | | | | — | | | | — | |
| Global X CleanTech ETF | | | | | | | | | | | | | | | | | | |
| 2023 | | | 16.20 | | | | 0.05 | | | | (6.34 | ) | | | (6.29 | ) | | | (0.03 | ) | | | — | | | | — | |
| 2022 | | | 20.43 | | | | 0.03 | | | | (4.19 | ) | | | (4.16 | ) | | | (0.07 | ) | | | — | | | | — | |
| 2021 | | | 19.02 | | | | 0.02 | | | | 1.40 | | | | 1.42 | | | | (0.01 | ) | | | — | | | | — | |
| 2020(3) | | | 15.07 | | | | 0.02 | | | | 3.93 | | | | 3.95 | | | | — | | | | — | | | | — | |
| * | Per share data calculated using average shares method. |
| ** | Total Return is for the period indicated and has not been annualized. The return shown does not reflect the deduction of taxes that a shareholder would pay on Fund distributions or the redemption of Fund shares. |
| † | Annualized. |
| †† | Portfolio turnover rate is for the period indicated and periods of less than one year have not been annualized. Excludes effect of in-kind transfers. |
| (1) | The Fund commenced operations on July 29, 2020. |
| (2) | The Fund commenced operations on September 22, 2020. |
| (3) | The Fund commenced operations on October 27, 2020. |
Amounts designated as “—” are either $0 or have been rounded to $0.
The accompanying notes are an integral part of the financial statements.
236
Financial Highlights
Total from
Distributions ($) | | Net
Asset Value,
End of
Period ($) | | Total
Return
(%)** | | Net Assets, End of
Period ($)(000) | | Ratio of Expenses
to Average Net
Assets (%) | | Ratio of Net
Investment Income
(Loss) to Average
Net Assets (%) | | Portfolio
Turnover (%)†† |
| | | | | | | | | | | | | | | | | | | | | | | | | | | |
| | — | | | | 8.95 | | | | (26.82 | ) | | | 64,919 | | | | 0.68 | | | | (0.36 | ) | | | 29.92 | |
| | — | | | | 12.23 | | | | (25.06 | ) | | | 150,075 | | | | 0.68 | | | | (0.05 | ) | | | 43.26 | |
| | (0.01 | ) | | | 16.32 | | | | (11.32 | ) | | | 475,576 | | | | 0.68 | | | | (0.52 | ) | | | 42.39 | |
| | — | | | | 18.41 | | | | 20.88 | | | | 490,675 | | | | 0.68 | † | | | 0.18 | † | | | 9.67 | |
| | | | | | | | | | | | | | | | | | | | | | | | | | | |
| | (0.04 | ) | | | 8.51 | | | | (11.66 | ) | | | 2,297 | | | | 0.65 | | | | 0.45 | | | | 31.98 | |
| | (0.02 | ) | | | 9.68 | | | | (39.24 | ) | | | 2,612 | | | | 0.65 | | | | 0.13 | | | | 41.26 | |
| | — | | | | 15.96 | | | | 7.26 | | | | 4,309 | | | | 0.65 | | | | (0.31 | ) | | | 50.08 | |
| | — | | | | 14.88 | | | | (1.39 | ) | | | 2,232 | | | | 0.67 | † | | | (0.65 | )† | | | 10.48 | |
| | | | | | | | | | | | | | | | | | | | | | | | | | | |
| | (0.03 | ) | | | 9.88 | | | | (38.90 | ) | | | 58,874 | | | | 0.50 | | | | 0.38 | | | | 23.91 | |
| | (0.07 | ) | | | 16.20 | | | | (20.38 | ) | | | 127,842 | | | | 0.50 | | | | 0.17 | | | | 15.72 | |
| | (0.01 | ) | | | 20.43 | | | | 7.48 | | | | 175,458 | | | | 0.50 | | | | 0.09 | | | | 35.53 | |
| | — | | | | 19.02 | | | | 26.21 | | | | 28,523 | | | | 0.50 | † | | | 1.18 | † | | | — | |
The accompanying notes are an integral part of the financial statements.
237
Financial Highlights
Selected Per Share Data & Ratios
For a Share Outstanding Throughout the Period |
| | | Net
Asset Value,
Beginning
of Period
($) | | Net Investment
Income
($)* | | Net Realized
and Unrealized
Gain (Loss) on
Investments
($) | | Total from
Operations
($) | | Distribution
from Net
Investment
Income ($) | | Distribution
from Capital
Gains ($) | | Return of
Capital ($) |
| Global X Data Center REITs & Digital Infrastructure ETF | | | | | | | | | | | | | | | | | | |
| 2023 | | | 13.52 | | | | 0.21 | | | | 0.90 | | | | 1.11 | | | | (0.22 | ) | | | (0.11 | ) | | | — | |
| 2022 | | | 17.83 | | | | 0.15 | | | | (4.22 | ) | | | (4.07 | ) | | | (0.16 | ) | | | (0.08 | ) | | | — | |
| 2021 | | | 14.94 | | | | 0.16 | | | | 2.84 | | | | 3.00 | | | | (0.11 | ) | | | — | | | | — | |
| 2020(1) | | | 14.97 | | | | — | | | | (0.03 | ) | | | (0.03 | ) | | | — | | | | — | | | | — | |
| Global X Clean Water ETF | | | | | | | | | | | | | | | | | | |
| 2023 | | | 14.30 | | | | 0.25 | | | | 1.09 | | | | 1.34 | | | | (0.24 | ) | | | — | | | | — | |
| 2022 | | | 16.73 | | | | 0.23 | | | | (2.41 | ) | | | (2.18 | ) | | | (0.25 | ) | | | — | *** | | | — | |
| 2021(2) | | | 15.04 | | | | 0.26 | | | | 1.47 | | | | 1.73 | | | | (0.04 | ) | | | — | | | | — | |
| Global X AgTech & Food Innovation ETF | | | | | | | | | | | | | | | | | | |
| 2023 | | | 15.63 | | | | 0.11 | | | | (5.47 | ) | | | (5.36 | ) | | | (0.10 | ) | | | — | | | | — | |
| 2022 | | | 19.76 | | | | 0.11 | | | | (4.04 | ) | | | (3.93 | ) | | | (0.10 | ) | | | (0.10 | ) | | | — | |
| 2021(3) | | | 25.34 | | | | 0.05 | | | | (5.63 | ) | | | (5.58 | ) | | | — | | | | — | | | | — | |
| * | Per share data calculated using average shares method. |
| ** | Total Return is for the period indicated and has not been annualized. The return shown does not reflect the deduction of taxes that a shareholder would pay on Fund distributions or the redemption of Fund shares. |
| *** | Amount is less than $0.005. |
| † | Annualized. |
| †† | Portfolio turnover rate is for the period indicated and periods of less than one year have not been annualized. Excludes effect of in-kind transfers. |
| (1) | The Fund commenced operations on October 27, 2020. |
| (2) | The Fund commenced operations on April 8, 2021. |
| (3) | The Fund commenced operations on July 12, 2021. |
Amounts designated as “—” are either $0 or have been rounded to $0.
The accompanying notes are an integral part of the financial statements.
238
Financial Highlights
Total from
Distributions ($) | | Net
Asset Value,
End of
Period ($) | | Total
Return
(%)** | | Net Assets, End of
Period ($)(000) | | Ratio of Expenses
to Average Net
Assets (%) | | Ratio of Net
Investment Income
to Average Net
Assets (%) | | Portfolio
Turnover (%)†† |
| | | | | | | | | | | | | | | | | | | | | | | | | | | |
| | (0.33 | ) | | | 14.30 | | | | 8.46 | | | | 39,323 | | | | 0.50 | | | | 1.60 | | | | 62.01 | |
| | (0.24 | ) | | | 13.52 | | | | (23.11 | ) | | | 63,143 | | | | 0.50 | | | | 0.99 | | | | 36.96 | |
| | (0.11 | ) | | | 17.83 | | | | 20.17 | | | | 78,098 | | | | 0.50 | | | | 0.93 | | | | 15.80 | |
| | — | | | | 14.94 | | | | (0.20 | ) | | | 3,736 | | | | 0.50 | † | | | 0.26 | † | | | — | |
| | | | | | | | | | | | | | | | | | | | | | | | | | | |
| | (0.24 | ) | | | 15.40 | | | | 9.50 | | | | 9,394 | | | | 0.50 | | | | 1.71 | | | | 15.27 | |
| | (0.25 | ) | | | 14.30 | | | | (13.18 | ) | | | 7,580 | | | | 0.50 | | | | 1.58 | | | | 28.19 | |
| | (0.04 | ) | | | 16.73 | | | | 11.52 | | | | 8,699 | | | | 0.50 | † | | | 2.44 | † | | | 4.84 | |
| | | | | | | | | | | | | | | | | | | | | | | | | | | |
| | (0.10 | ) | | | 10.17 | | | | (34.41 | ) | | | 4,476 | | | | 0.51 | | | | 0.86 | | | | 54.45 | |
| | (0.20 | ) | | | 15.63 | | | | (20.06 | ) | | | 6,721 | | | | 0.50 | | | | 0.62 | | | | 55.85 | |
| | — | | | | 19.76 | | | | (22.02 | ) | | | 5,533 | | | | 0.51 | † | | | 0.58 | † | | | 32.72 | |
The accompanying notes are an integral part of the financial statements.
239
Financial Highlights
Selected Per Share Data & Ratios
For a Share Outstanding Throughout the Period |
| | | Net
Asset Value,
Beginning
of Period
($) | | Net Investment
Income (Loss)
($)* | | Net Realized
and Unrealized
Gain (Loss) on
Investments
($) | | Total from
Operations
($) | | Distribution
from Net
Investment
Income ($) | | Distribution
from Capital
Gains ($) | | Return of
Capital ($) |
| Global X Blockchain ETF | | | | | | | | | | | | | | | | | | |
| 2023(1) | | | 16.39 | | | | 0.28 | | | | 14.27 | | | | 14.55 | | | | (0.22 | ) | | | — | | | | — | |
| 2022(1) | | | 129.32 | | | | 0.46 | | | | (109.52 | ) | | | (109.06 | ) | | | (3.80 | ) | | | — | | | | (0.07 | ) |
| 2021(1)(2) | | | 100.04 | | | | 0.24 | | | | 29.04 | | | | 29.28 | | | | — | | | | — | | | | — | |
| Global X Hydrogen ETF | | | | | | | | | | | | | | | | | | |
| 2023 | | | 12.27 | | | | (0.02 | ) | | | (5.73 | ) | | | (5.75 | ) | | | — | | | | — | | | | — | |
| 2022 | | | 24.38 | | | | (0.03 | ) | | | (12.07 | ) | | | (12.10 | ) | | | — | | | | (0.01 | ) | | | — | |
| 2021(2) | | | 25.04 | | | | (0.03 | ) | | | (0.63 | ) | | | (0.66 | ) | | | — | | | | — | | | | — | |
| Global X Solar ETF | | | | | | | | | | | | | | | | | | |
| 2023 | | | 22.06 | | | | (0.03 | ) | | | (10.32 | ) | | | (10.35 | ) | | | — | | | | — | | | | — | |
| 2022 | | | 25.70 | | | | (0.04 | ) | | | (3.60 | ) | | | (3.64 | ) | | | — | | | | — | *** | | | — | *** |
| 2021(3) | | | 24.19 | | | | (0.01 | ) | | | 1.52 | | | | 1.51 | | | | — | | | | — | | | | — | |
| * | Per share data calculated using average shares method. |
| ** | Total Return is for the period indicated and has not been annualized. The return shown does not reflect the deduction of taxes that a shareholder would pay on Fund distributions or the redemption of Fund shares. |
| *** | Amount is less than $0.005. |
| † | Annualized. |
| †† | Portfolio turnover rate is for the period indicated and periods of less than one year have not been annualized. Excludes effect of in-kind transfers. |
| (1) | Per share amounts have been adjusted for a 1 for 4 reverse share split on December 19, 2022. (See Note 10 in the Notes to Financial Statements/Notes to Consolidated Financial Statements.) |
| (2) | The Fund commenced operations on July 12, 2021. |
| (3) | The Fund commenced operations on September 8, 2021. |
Amounts designated as “—” are either $0 or have been rounded to $0.
The accompanying notes are an integral part of the financial statements.
240
Financial Highlights
Total from
Distributions ($) | | Net
Asset Value,
End of
Period ($) | | Total
Return
(%)** | | Net Assets, End of
Period ($)(000) | | Ratio of Expenses
to Average Net
Assets (%) | | Ratio of Net
Investment Income
(Loss) to Average
Net Assets (%) | | Portfolio
Turnover (%)†† |
| | | | | | | | | | | | | | | | | | | | | | | | | | | |
| | (0.22 | ) | | | 30.72 | | | | 89.03 | | | | 87,124 | | | | 0.50 | | | | 1.16 | | | | 39.77 | |
| | (3.87 | ) | | | 16.39 | | | | (86.70 | ) | | | 45,227 | | | | 0.50 | | | | 1.15 | | | | 36.47 | |
| | — | | | | 129.32 | | | | 29.27 | | | | 127,720 | | | | 0.50 | † | | | 0.52 | † | | | 19.49 | |
| | | | | | | | | | | | | | | | | | | | | | | | | | | |
| | — | | | | 6.52 | | | | (46.86 | ) | | | 35,777 | | | | 0.50 | | | | (0.21 | ) | | | 27.79 | |
| | (0.01 | ) | | | 12.27 | | | | (49.64 | ) | | | 38,035 | | | | 0.50 | | | | (0.24 | ) | | | 36.44 | |
| | — | | | | 24.38 | | | | (2.64 | ) | | | 32,427 | | | | 0.51 | † | | | (0.33 | )† | | | 40.38 | |
| | | | | | | | | | | | | | | | | | | | | | | | | | | |
| | — | | | | 11.71 | | | | (46.92 | ) | | | 5,974 | | | | 0.50 | | | | (0.17 | ) | | | 50.01 | |
| | — | *** | | | 22.06 | | | | (14.14 | ) | | | 5,955 | | | | 0.51 | | | | (0.20 | ) | | | 128.22 | |
| | — | | | | 25.70 | | | | 6.24 | | | | 8,995 | | | | 0.50 | † | | | (0.22 | )† | | | 9.85 | |
The accompanying notes are an integral part of the financial statements.
241
Financial Highlights
Selected Per Share Data & Ratios
For a Share Outstanding Throughout the Period |
| | | Net
Asset Value,
Beginning
of Period
($) | | Net Investment
Income (Loss)
($)* | | Net Realized
and Unrealized
Gain (Loss) on
Investments
($) | | Total from
Operations
($) | | Distribution
from Net
Investment
Income ($) | | Distribution
from Capital
Gains ($) | | Return of
Capital ($) |
| Global X Wind Energy ETF |
| 2023 | | | 17.58 | | | | 0.16 | | | | (4.68 | ) | | | (4.52 | ) | | | (0.18 | ) | | | — | | | | — | |
| 2022 | | | 23.76 | | | | 0.14 | | | | (6.26 | ) | | | (6.12 | ) | | | (0.06 | ) | | | — | | | | — | |
| 2021(1) | | | 24.82 | | | | (0.01 | ) | | | (1.05 | ) | | | (1.06 | ) | | | — | | | | — | | | | — | |
| Global X Green Building ETF |
| 2023 | | | 20.95 | | | | 0.65 | | | | 0.76 | | | | 1.41 | | | | (0.70 | ) | | | — | | | | — | |
| 2022(2) | | | 25.37 | | | | 0.50 | | | | (4.76 | ) | | | (4.26 | ) | | | (0.16 | ) | | | — | | | | — | |
| Global X Metaverse ETF |
| 2023 | | | 19.20 | | | | 0.13 | | | | 7.20 | | | | 7.33 | | | | (1.63 | ) | | | — | | | | — | |
| 2022(3) | | | 24.10 | | | | 0.39 | | | | (4.91 | ) | | | (4.52 | ) | | | (0.38 | ) | | | — | | | | — | |
| * | Per share data calculated using average shares method. |
| ** | Total Return is for the period indicated and has not been annualized. The return shown does not reflect the deduction of taxes that a shareholder would pay on Fund distributions or the redemption of Fund shares. |
| † | Annualized. |
| †† | Portfolio turnover rate is for the period indicated and periods of less than one year have not been annualized. Excludes effect of in-kind transfers. |
| (1) | The Fund commenced operations on September 8, 2021. |
| (2) | The Fund commenced operations on April 11, 2022. |
| (3) | The Fund commenced operations on April 26, 2022. |
Amounts designated as “—” are either $0 or have been rounded to $0.
The accompanying notes are an integral part of the financial statements.
242
Financial Highlights
Total from
Distributions ($) | | Net
Asset Value,
End of
Period ($) | | Total
Return
(%)** | | Net Assets, End of
Period ($)(000) | | Ratio of Expenses
to Average Net
Assets (%) | | Ratio of Net
Investment Income
(Loss) to Average
Net Assets (%) | | Portfolio
Turnover (%)†† |
| | | | | | | | | | | | | | | | | | | | | | | | | | | |
| | (0.18 | ) | | | 12.88 | | | | (25.94 | ) | | | 2,705 | | | | 0.51 | | | | 0.95 | | | | 94.18 | |
| | (0.06 | ) | | | 17.58 | | | | (25.79 | ) | | | 3,341 | | | | 0.50 | | | | 0.68 | | | | 34.53 | |
| | — | | | | 23.76 | | | | (4.27 | ) | | | 4,514 | | | | 0.50 | † | | | (0.10 | )† | | | 23.01 | |
| | | | | | | | | | | | | | | | | | | | | | | | | | | |
| | (0.70 | ) | | | 21.66 | | | | 6.95 | | | | 2,166 | | | | 0.46 | | | | 3.10 | | | | 76.69 | |
| | (0.16 | ) | | | 20.95 | | | | (16.82 | ) | | | 2,095 | | | | 0.45 | † | | | 3.68 | † | | | 30.18 | |
| | | | | | | | | | | | | | | | | | | | | | | | | | | |
| | (1.63 | ) | | | 24.90 | | | | 38.78 | | | | 2,490 | | | | 0.50 | | | | 0.57 | | | | 21.53 | |
| | (0.38 | ) | | | 19.20 | | | | (18.87 | ) | | | 1,920 | | | | 0.50 | † | | | 3.13 | † | | | 30.52 | |
The accompanying notes are an integral part of the financial statements.
243
Financial Highlights/Consolidated Financial Highlights
Selected Per Share Data & Ratios
For a Share Outstanding Throughout the Period |
| | | Net
Asset Value,
Beginning
of Period
($) | | Net Investment
Income
($)* | | Net Realized
and Unrealized
Gain (Loss) on
Investments
($) | | Total from
Operations
($) | | Distribution
from Net
Investment
Income ($) | | Distribution
from Capital
Gains ($) | | Return of
Capital ($) |
| Global X PropTech ETF |
| 2023(1) | | | 25.08 | | | | 0.01 | | | | 2.17 | | | | 2.18 | | | | — | *** | | | — | | | | — | |
| Global X Carbon Credits Strategy ETF (Consolidated) |
| 2023(2) | | | 34.88 | | | | 0.69 | | | | (3.82 | ) | | | (3.13 | ) | | | (0.08 | ) | | | — | | | | — | |
| Global X Defense Tech ETF |
| 2023(3) | | | 24.82 | | | | 0.08 | | | | 2.13 | | | | 2.21 | | | | — | | | | — | | | | — | |
| * | Per share data calculated using average shares method. |
| ** | Total Return is for the period indicated and has not been annualized. The return shown does not reflect the deduction of taxes that a shareholder would pay on Fund distributions or the redemption of Fund shares. |
| *** | Amount is less than $0.005. |
| † | Annualized. |
| †† | Portfolio turnover rate is for the period indicated and periods of less than one year have not been annualized. Excludes effect of in-kind transfers. |
| (1) | The Fund commenced operations on April 11, 2023. |
| (2) | The Fund commenced operations on May 24, 2023. |
| (3) | The Fund commenced operations on September 11, 2023. |
Amounts designated as “—” are either $0 or have been rounded to $0.
The accompanying notes are an integral part of the financial statements.
244
Financial Highlights/Consolidated Financial Highlights
Total from
Distributions ($) | | Net
Asset Value,
End of
Period ($) | | Total
Return
(%)** | | Net Assets, End of
Period ($)(000) | | Ratio of Expenses
to Average Net
Assets (%) | | Ratio of Net
Investment Income
to Average Net
Assets (%) | | Portfolio
Turnover (%)†† |
| | | | | | | | | | | | | | | | | | | | | | | | | | | |
| | — | | | | 27.26 | | | | 8.71 | | | | 2,726 | | | | 0.51 | † | | | 0.08 | † | | | 13.73 | |
| | | | | | | | | | | | | | | | | | | | | | | | | | | |
| | (0.08 | ) | | | 31.67 | | | | (8.99 | ) | | | 1,584 | | | | 0.40 | † | | | 3.86 | † | | | — | |
| | | | | | | | | | | | | | | | | | | | | | | | | | | |
| | — | | | | 27.03 | | | | 8.90 | | | | 4,595 | | | | 0.50 | † | | | 1.39 | † | | | 2.94 | |
The accompanying notes are an integral part of the financial statements.
245
Notes to Financial Statements/Notes to Consolidated Financial Statements
November 30, 2023
1. ORGANIZATION
The Global X Funds (the “Trust”) is a Delaware statutory trust formed on March 6, 2008. The Trust is registered under the Investment Company Act of 1940, as amended, (the “1940 Act”) as an open-end management investment company. As of November 30, 2023, the Trust had one hundred and thirteen portfolios, one hundred and nine of which were operational. The financial statements herein and the related notes pertain to the Global X Millennial Consumer ETF, Global X Aging Population ETF, Global X Health & Wellness ETF, Global X Robotics & Artificial Intelligence ETF, Global X FinTech ETF, Global X Internet of Things ETF, Global X U.S. Infrastructure Development ETF, Global X Autonomous & Electric Vehicles ETF, Global X Artificial Intelligence & Technology ETF, Global X Genomics & Biotechnology ETF, Global X Cloud Computing ETF, Global X Cannabis ETF, Global X Thematic Growth ETF, Global X Video Games & Esports ETF, Global X Cybersecurity ETF, Global X Telemedicine & Digital Health ETF, Global X China Biotech Innovation ETF, Global X CleanTech ETF, Global X Data Center REITs & Digital Infrastructure ETF, Global X Clean Water ETF, Global X AgTech & Food Innovation ETF, Global X Blockchain ETF, Global X Hydrogen ETF, Global X Solar ETF, Global X Wind Energy ETF, Global X Green Building ETF, Global X Metaverse ETF, Global X PropTech ETF, Global X Carbon Credits Strategy ETF and Global X Defense Tech ETF (each a “Fund” and collectively, the “Funds”).
Each Fund, other than the Global X Millennial Consumer ETF, Global X Aging Population ETF, Global X Health & Wellness ETF, Global X U.S. Infrastructure Development ETF and Global X Thematic Growth ETF, has elected non-diversified status under the 1940 Act.
Global X PropTech ETF commenced operations on April 11, 2023, Global X Carbon Credits Strategy ETF commenced operations on May 24, 2023, and Global X Defense Tech ETF commenced operations on September 11, 2023.
2. SIGNIFICANT ACCOUNTING POLICIES
The following is a summary of the significant accounting policies followed by the Funds:
USE OF ESTIMATES — The Funds are investment companies that apply the accounting and reporting guidance issued in Topic 946 by the U.S. Financial Accounting Standards Board. The preparation of financial statements in conformity with U.S. generally accepted accounting principles (“U.S. GAAP”) requires management to make estimates and assumptions that affect the reported amounts of assets and liabilities and disclosure of contingent assets and liabilities at the date of the financial statements and the reported amounts of increases and decreases in net assets from operations during the reporting period. Actual results could materially differ from those estimates.
RETURN OF CAPITAL ESTIMATES – Distributions received by the Funds from underlying master limited partnership (“MLP”) and real estate investment trust (“REIT”) investments generally are comprised of income and return of capital. The Funds record
246
Notes to Financial Statements/Notes to Consolidated Financial Statements (Continued)
November 30, 2023
2. SIGNIFICANT ACCOUNTING POLICIES (continued)
investment income and return of capital based on estimates made at the time such distributions are received. Such estimates are based on historical information available from the MLPs, REITs and other industry sources. These estimates may subsequently be revised based on information received from the MLPs and REITs after their tax reporting periods are concluded.
SECURITY VALUATION — Securities listed on a securities exchange, market or automated quotation system for which quotations are readily available (except for securities traded on the NASDAQ Stock Market (“NASDAQ”)), including securities traded over the counter, are valued at the last quoted sale price on the primary exchange or market (foreign or domestic) on which they are traded (or at approximately 4:00 pm Eastern Time if a security’s primary exchange is normally open at that time), or, if there is no such reported sale, at the most recent mean between the quoted bid and asked prices, which approximates fair value (absent both bid and asked prices on such exchange, the bid price may be used).
For securities traded on NASDAQ, the NASDAQ Official Closing Price will be used. The prices for foreign securities are reported in local currencies and converted to U.S. dollars using currency exchange rates as of the reporting date. The exchange rates used by the Trust for valuation are captured as of the New York or London close each day.
Securities for which market prices are not “readily available” are valued in accordance with fair value procedures (the “Fair Value Procedures”) established by Global X Management Company LLC, the Funds’ investment adviser (the “Adviser”), and approved by the Funds’ Board of Trustees (the “Board”). Pursuant to Rule 2a-5 under the 1940 Act, the Board has designated the Adviser as the “valuation designee” to determine the fair value of securities and other instruments for which no readily available market quotations are available. The Fair Value Procedures are implemented through a Fair Value Committee (the “Committee”) of the Adviser. Some of the more common reasons that may necessitate that a security be valued using the Fair Value Procedures include: the security’s trading has been halted or suspended; the security has been de-listed from its primary trading exchange; the security’s primary trading market is temporarily closed at a time when, under normal conditions, it would be open; the security has not been traded for an extended period of time; the security’s primary pricing source is not able or willing to provide a price; or trading of the security is subject to local government-imposed restrictions. In addition, each Fund may fair value a security if an event that may materially affect the value of the Fund’s security that is traded outside of the United States (a “Significant Event”) has occurred between the time of the security’s last close and the time the Fund calculates its net asset value (“NAV”). A Significant Event may relate to a single issuer or to an entire market sector. Events that may be Significant Events include: government actions, natural disasters, armed conflict, acts of terrorism and significant market fluctuations. If the Adviser becomes aware of a Significant Event that has occurred with respect to a security or group of securities after the closing of the exchange or market on which the security or securities principally trade, but before
247
Notes to Financial Statements/Notes to Consolidated Financial Statements (Continued)
November 30, 2023
2. SIGNIFICANT ACCOUNTING POLICIES (continued)
the time at which the Funds calculate their NAVs, it may request that a Committee meeting be called. When a security is valued in accordance with the Fair Value Procedures, the Committee will determine the value after taking into consideration all relevant information reasonably available to the Committee.
If available, debt securities are priced based upon valuations provided by independent, third-party pricing agents. Such values generally reflect the last reported sales price if the security is actively traded. The third-party pricing agents may also value debt securities at an evaluated bid price by employing methodologies that utilize actual market transactions, broker-supplied valuations, or other methodologies designed to identify the market value for such securities. Debt obligations with remaining maturities of sixty days or less will be valued at their market value. Prices for most securities held by the Funds are provided daily by recognized independent pricing agents. If a security price cannot be obtained from an independent, third-party pricing agent, the Funds seek to obtain a bid price from at least one independent broker.
In accordance with the authoritative guidance on fair value measurements and disclosure under U.S. GAAP, the Funds disclose the fair value of their investments in a hierarchy that prioritizes the inputs to valuation techniques used to measure the fair value. The objective of a fair value measurement is to determine the price that would be received upon the sale of an asset or paid to transfer a liability in an orderly transaction between market participants at the measurement date (an exit price). Accordingly, the fair value hierarchy gives the highest priority to quoted prices (unadjusted) in active markets for identical assets or liabilities (Level 1) and the lowest priority to unobservable inputs (Level 3). The three levels of the fair value hierarchy are described below:
Level 1 – Unadjusted quoted prices in active markets for identical, unrestricted assets or liabilities that the Funds have the ability to access at the measurement date;
Level 2 – Other significant observable inputs (including quoted prices in non-active markets, quoted prices for similar investments, fair value of investments for which the Funds have the ability to fully redeem tranches at NAV as of the measurement date or within the near term, and short-term investments valued at amortized cost); and
Level 3 – Significant unobservable inputs (including the Funds’ own assumptions in determining the fair value of investments and fair value of investments for which the Funds do not have the ability to fully redeem tranches at NAV as of the measurement date or within the near term).
Investments are classified within the level of the lowest significant input considered in determining fair value. Investments classified within Level 3 whose fair value measurement
248
Notes to Financial Statements/Notes to Consolidated Financial Statements (Continued)
November 30, 2023
2. SIGNIFICANT ACCOUNTING POLICIES (continued)
considers several inputs may include Level 1 or Level 2 inputs as components of the overall fair value measurement. For details of the investment classification, reference the Schedule of Investments/Consolidated Schedule of Investments.
The unobservable inputs used to determine fair value of Level 3 assets may have similar or diverging impacts on valuation. Significant increases and decreases in these inputs in isolation and interrelationships between those inputs could result in significantly higher or lower fair value measurement.
DUE TO/FROM BROKERS — Due to/from brokers includes cash and collateral balances with the Funds’ clearing brokers or counterparties as of November 30, 2023. The Funds continuously monitor the credit standing of each broker or counterparty with whom they conduct business. In the event a broker or counterparty is unable to fulfill its obligations, the Funds would be subject to counterparty credit risk.
REPURCHASE AGREEMENTS — Securities pledged as collateral for repurchase agreements by BNP Paribas are held by Brown Brothers Harriman & Co. (“BBH”) or the Bank of New York Mellon (“BNY Mellon”), as appropriate, in their roles as Custodian to respective Funds (each, a “Custodian” and together, the “Custodians”), and are designated as being held on each Fund’s behalf by the Custodian under a book-entry system. Each Fund monitors the adequacy of the collateral on a daily basis and can require the seller to provide additional collateral in the event the market value of the securities pledged falls below the carrying value of the repurchase agreement, including accrued interest.
It is the Funds’ policy to only enter into repurchase agreements with banks and other financial institutions which are deemed by the Adviser to be creditworthy. The Funds bear the risk of loss in the event that the counterparty to a repurchase agreement defaults on its obligations and the Funds are prevented from exercising their rights to dispose of the underlying securities received as collateral. For financial statement purposes, the Funds record the securities lending collateral (included in repurchase agreements, at value or restricted cash) as an asset and the obligation to return securities lending collateral as a liability on the Statements of Assets and Liabilities/Consolidated Statement of Asset and Liabilities. Repurchase agreements are entered into by the Funds under Master Repurchase Agreements (“MRA”) which permit the Funds, under certain circumstances, including an event of default (such as bankruptcy or insolvency), to offset payables and/or receivables under the MRA with collateral held and/or posted to the counterparty and create one single net payment due to or from the Funds.
FEDERAL INCOME TAXES — It is each Fund’s intention to qualify, or continue to qualify, as a regulated investment company for Federal income tax purposes by complying with the appropriate provisions of Subchapter M of the Internal Revenue Code of 1986, as amended (the “Code”). Accordingly, no provisions for Federal income taxes have been made in the financial statements except as described below.
249
Notes to Financial Statements/Notes to Consolidated Financial Statements (Continued)
November 30, 2023
2. SIGNIFICANT ACCOUNTING POLICIES (continued)
The Funds evaluate tax positions taken or expected to be taken in the course of preparing the Funds’ tax returns to determine whether it is “more-likely-than-not” (i.e., greater than 50%) that each tax position will be sustained upon examination by a taxing authority based on the technical merits of the position. Tax positions not deemed to meet the more-likely-than-not threshold are recorded as a tax benefit or expense in the current year. The Funds did not record any tax positions in the current period, however Management’s conclusions regarding tax positions may be subject to review and adjustment at a later date based on factors including, but not limited to, examination by tax authorities (i.e., the last three tax year ends, as applicable), and on-going analysis of and changes to tax laws and regulations, and interpretations thereof.
If a Fund has foreign tax filings that have not been made, the tax years that remain subject to examination may date back to the inception of the Fund.
As of and during the reporting period ended November 30, 2023, the Funds did not have a liability for any unrecognized tax benefits. The Funds recognize interest and penalties, if any, related to unrecognized tax benefits as income tax expense on the Statements of Operations/Consolidated Statement of Operations. During the reporting period, the Funds did not incur any interest or penalties. The Funds are also not aware of any tax positions for which it is reasonably possible that the total amounts of unrecognized tax benefits will significantly change in the next 12 months.
The Funds file withholding tax reclaims in certain jurisdictions to recover a portion of amounts previously withheld. The Funds may record a reclaim receivable based on collectability, which includes factors such as the jurisdiction’s applicable laws, payment history and market convention. The Statements of Operations/Consolidated Statement of Operations includes tax reclaims recorded as well as professional and other fees, if any, associated with recovery of foreign withholding taxes.
SECURITY TRANSACTIONS AND INVESTMENT INCOME — Security transactions are accounted for on the trade date for financial reporting purposes. Costs used in determining realized gains and losses on the sale of investment securities are based on specific identification. Dividend income is recorded on the ex-dividend date. Interest income is recognized on the accrual basis from the settlement date. Amortization of premiums and accretion of discounts is included in interest income.
DIVIDENDS AND DISTRIBUTIONS TO SHAREHOLDERS — The Funds distribute their net investment income on a pro rata basis. Any net investment income and net realized capital gains are distributed at least annually. All distributions are recorded on the ex-dividend date.
INVESTMENTS IN REITs – With respect to the Funds, dividend income is recorded based on the income included in distributions received from REIT investments using published
250
Notes to Financial Statements/Notes to Consolidated Financial Statements (Continued)
November 30, 2023
2. SIGNIFICANT ACCOUNTING POLICIES (continued)
REIT reclassifications, including some management estimates when actual amounts are not available. Distributions received in excess of these estimated amounts are recorded as a reduction of the cost of investments or reclassified to capital gains. The actual amounts of income, return of capital, and capital gains are only determined by each REIT after its fiscal year end, and may differ from the estimated amounts.
CASH OVERDRAFT CHARGES – Per the terms of an agreement with BBH, if a Fund for which BBH is Custodian has a cash overdraft on a given day, it will be assessed an overdraft charge equal to the applicable BBH Base Rate plus 2.00%. Per the terms of an agreement with BNY Mellon, if a Fund for which BNY Mellon is Custodian has a cash overdraft, it will be charged interest at a rate then charged by BNY Mellon to its institutional custody clients in the relevant currency. Cash overdraft charges are included in custodian fees on the Statements of Operations/Consolidated Statement of Operations.
FOREIGN CURRENCY TRANSACTIONS AND TRANSLATION — The books and records of the Funds are maintained in U.S. dollars. Investment securities and other assets and liabilities denominated in a foreign currency are translated into U.S. dollars on the date of valuation. Purchases and sales of investment securities, income and expenses are translated into U.S. dollars at the relevant rates of exchange prevailing on the respective dates of such transactions. The Funds do not isolate that portion of realized or unrealized gains and losses resulting from changes in the foreign exchange rate from fluctuations arising from changes in the market prices of the securities. These gains and losses are included in net realized and unrealized gains and losses on investments on the Statements of Operations/Consolidated Statement of Operations. Net realized and unrealized gains and losses on foreign currency transactions and translations represent net foreign exchange gains or losses from foreign currency spot contracts, disposition of foreign currencies, currency gains or losses realized between trade and settlement dates on securities transactions and the difference between the amount of the investment income and foreign withholding taxes recorded on the Funds’ books and the U.S. dollar equivalent amounts actually received or paid.
FUTURES CONTRACTS — To the extent consistent with its investment objective and strategies, each Fund may use futures contracts for tactical hedging purposes as well as to enhance the Fund’s returns. Initial margin deposits of cash or securities are made upon entering into futures contracts. The contracts are marked to market daily and the resulting changes in value are accounted for as unrealized gains and losses. Variation margin payments are paid or received, depending upon whether unrealized gains or losses are incurred. When the contract is closed, the Fund records a realized gain or loss equal to the difference between the proceeds from (or cost of) the closing transaction and the amount invested in the contract.
251
Notes to Financial Statements/Notes to Consolidated Financial Statements (Continued)
November 30, 2023
2. SIGNIFICANT ACCOUNTING POLICIES (continued)
Risks of entering into futures contracts include the possibility that there will be an imperfect price correlation between the futures and the underlying securities. Second, it is possible that a lack of liquidity for futures contracts could exist in the secondary market, resulting in an inability to close a position prior to its maturity date. Third, a futures contract involves the risk that the Fund could lose more than the original margin deposit required to initiate a futures transaction.
Futures contracts shall be valued at the settlement price established each day by the board of the exchange on which they are traded. The daily settlement prices for financial futures are provided by an independent source.
Finally, the risk exists that losses could exceed amounts disclosed on the Statements of Assets and Liabilities/Consolidated Statement of Asset and Liabilities. Refer to the Funds’ Schedule of Investments/Consolidated Schedule of Investments for details regarding open futures contracts as of November 30, 2023, if applicable.
CREATION UNITS —The Funds issue and redeem their shares (“Shares”) on a continuous basis at NAV and only in large blocks of 10,000 Shares, referred to as “Creation Units”. Purchasers of Creation Units (“Authorized Participants”) at NAV must pay a standard creation transaction fee per transaction. The fee is a single charge and will be the same regardless of the number of Creation Units purchased by an Authorized Participant on the same day. An Authorized Participant who holds Creation Units and wishes to redeem at NAV would also pay a standard redemption fee per transaction to the Fund’s Custodian, on the date of such redemption, regardless of the number of Creation Units redeemed that day.
252
Notes to Financial Statements/Notes to Consolidated Financial Statements (Continued)
November 30, 2023
2. SIGNIFICANT ACCOUNTING POLICIES (continued)
If a Creation Unit is purchased or redeemed for cash, an additional variable fee may be charged. The following table discloses Creation Unit breakdown:
| | | Creation
Unit
Shares | | Creation Fee | | Value at
November
30, 2023 | | Redemption
Fee |
| Global X Millennial Consumer ETF | | 10,000 | | | $ | 300 | | | $ | 328,600 | | | $ | 300 | |
| Global X Aging Population ETF | | 10,000 | | | | 800 | | | | 269,300 | | | | 800 | |
| Global X Health & Wellness ETF | | 10,000 | | | | 700 | | | | 223,500 | | | | 700 | |
| Global X Robotics & Artificial Intelligence ETF | | 10,000 | | | | 600 | | | | 264,700 | | | | 600 | |
| Global X FinTech ETF | | 10,000 | | | | 400 | | | | 223,700 | | | | 400 | |
| Global X Internet of Things ETF | | 10,000 | | | | 500 | | | | 324,500 | | | | 500 | |
| Global X U.S. Infrastructure Development ETF | | 10,000 | | | | 400 | | | | 315,000 | | | | 400 | |
| Global X Autonomous & Electric Vehicles ETF | | 10,000 | | | | 600 | | | | 231,900 | | | | 600 | |
| Global X Artificial Intelligence & Technology ETF | | 10,000 | | | | 600 | | | | 297,300 | | | | 600 | |
| Global X Genomics & Biotechnology ETF | | 10,000 | | | | 250 | | | | 104,100 | | | | 250 | |
| Global X Cloud Computing ETF | | 10,000 | | | | 250 | | | | 207,900 | | | | 250 | |
| Global X Cannabis ETF | | 10,000 | | | | 250 | | | | 55,200 | | | | 250 | |
| Global X Thematic Growth ETF | | 10,000 | | | | 250 | | | | 230,500 | | | | 250 | |
| Global X Video Games & Esports ETF | | 10,000 | | | | 600 | | | | 199,300 | | | | 600 | |
| Global X Cybersecurity ETF | | 10,000 | | | | 250 | | | | 268,400 | | | | 250 | |
| Global X Telemedicine & Digital Health ETF | | 10,000 | | | | 250 | | | | 89,500 | | | | 250 | |
| Global X China Biotech Innovation ETF | | 10,000 | | | | 600 | | | | 85,100 | | | | 600 | |
| Global X CleanTech ETF | | 10,000 | | | | 500 | | | | 98,800 | | | | 500 | |
| Global X Data Center REITs & Digital Infrastructure ETF | | 10,000 | | | | 300 | | | | 143,000 | | | | 300 | |
| Global X Clean Water ETF | | 10,000 | | | | 500 | | | | 154,000 | | | | 500 | |
| Global X AgTech & Food Innovation ETF | | 10,000 | | | | 300 | | | | 101,700 | | | | 300 | |
| Global X Blockchain ETF | | 10,000 | | | | 250 | | | | 307,200 | | | | 250 | |
| Global X Hydrogen ETF | | 10,000 | | | | 250 | | | | 65,200 | | | | 250 | |
| Global X Solar ETF | | 10,000 | | | | 900 | | | | 117,100 | | | | 900 | |
| Global X Wind Energy ETF | | 10,000 | | | | 600 | | | | 128,800 | | | | 600 | |
| Global X Green Building ETF | | 10,000 | | | | 1,000 | | | | 216,600 | | | | 1,000 | |
| Global X Metaverse ETF | | 10,000 | | | | 400 | | | | 249,000 | | | | 400 | |
| Global X PropTech ETF | | 10,000 | | | | 250 | | | | 272,600 | | | | 250 | |
| Global X Carbon Credits Strategy ETF | | 10,000 | | | | 50 | | | | 316,700 | | | | 50 | |
| Global X Defense Tech ETF | | 10,000 | | | | 250 | | | | 270,300 | | | | 250 | |
3. RELATED PARTY TRANSACTIONS AND SERVICE PROVIDER TRANSACTIONS
On July 2, 2018, the Adviser consummated a transaction pursuant to which it became an indirect, wholly-owned subsidiary of Mirae Asset Global Investments Co., Ltd. (“Mirae”). In this manner, the Adviser is ultimately controlled by Mirae.
253
Notes to Financial Statements/Notes to Consolidated Financial Statements (Continued)
November 30, 2023
3. RELATED PARTY TRANSACTIONS AND SERVICE PROVIDER TRANSACTIONS (continued)
The Adviser serves as the investment adviser and the administrator for the Funds. Subject to the supervision of the Board, the Adviser is responsible for managing the investment activities of the Funds and the Funds’ business affairs and other administrative matters and provides, or causes to be furnished, all supervisory, administrative and other services reasonably necessary for the operation of the Funds, including certain distribution services (provided pursuant to a separate distribution services agreement), certain shareholder and distribution-related services (provided pursuant to a separate Rule 12b-1 Plan and related agreements) and investment advisory services (provided pursuant to a separate Investment Advisory Agreement), under what is essentially an “all-in” fee structure.
For the Adviser’s services to the Funds, under a supervision and administration agreement (the “Supervision and Administration Agreement”), each Fund pays a monthly fee to the Adviser at the annual rate below (stated as a percentage of the average daily net assets of the respective Fund) (“Supervision and Administration Fee”). In addition, the Funds bear other expenses, directly and indirectly, that are not covered by the Supervision and Administration Agreement, which may vary and affect the total expense ratios of the Funds, such as taxes, brokerage fees, commissions, certain custodian fees, acquired fund fees and expenses (except for Global X Thematic Growth ETF and Global X Carbon Credits Strategy ETF with respect to investments in affiliated investment companies), and other transaction expenses, interest expenses, and extraordinary expenses (such as litigation and indemnification expenses).
The Supervision and Administration Agreement for the Global X Thematic Growth ETF and Global X Carbon Credits Strategy ETF provides that the Adviser also bears the costs for acquired fund fees and expenses generated by investments by the Fund in affiliated investment companies. For the year ended November 30, 2023, the Adviser paid acquired fund fees and expenses of $247,624 and $100 and made such reimbursement payments to the Global X Thematic Growth ETF and Global X Carbon Credits Strategy ETF, respectively, on a monthly basis.
254
Notes to Financial Statements/Notes to Consolidated Financial Statements (Continued)
November 30, 2023
3. RELATED PARTY TRANSACTIONS AND SERVICE PROVIDER TRANSACTIONS (continued)
The following table discloses the supervision and administration fees payable pursuant to the Supervision and Administration Agreement:
| | | Supervision and
Administration Fee |
| Global X Millennial Consumer ETF | | 0.50% |
| Global X Aging Population ETF | | 0.50% |
| Global X Health & Wellness ETF | | 0.50% |
| Global X Robotics & Artificial Intelligence ETF | | 0.68% |
| Global X FinTech ETF | | 0.68% |
| Global X Internet of Things ETF | | 0.68% |
| Global X U.S. Infrastructure Development ETF | | 0.47% |
| Global X Autonomous & Electric Vehicles ETF | | 0.68% |
| Global X Artificial Intelligence & Technology ETF | | 0.68% |
| Global X Genomics & Biotechnology ETF | | 0.50% |
| Global X Cloud Computing ETF | | 0.68% |
| Global X Cannabis ETF | | 0.50% |
| Global X Thematic Growth ETF | | 0.50% |
| Global X Video Games & Esports ETF | | 0.50% |
| Global X Cybersecurity ETF | | 0.50% |
| Global X Telemedicine & Digital Health ETF | | 0.68% |
| Global X China Biotech Innovation ETF | | 0.65% |
| Global X CleanTech ETF | | 0.50% |
| Global X Data Center REITs & Digital Infrastructure ETF | | 0.50% |
| Global X Clean Water ETF | | 0.50% |
| Global X AgTech & Food Innovation ETF | | 0.50% |
| Global X Blockchain ETF | | 0.50% |
| Global X Hydrogen ETF | | 0.50% |
| Global X Solar ETF | | 0.50% |
| Global X Wind Energy ETF | | 0.50% |
| Global X Green Building ETF | | 0.45% |
| Global X Metaverse ETF | | 0.50% |
| Global X PropTech ETF | | 0.50% |
| Global X Carbon Credits Strategy ETF | | 0.39% |
| Global X Defense Tech ETF | | 0.50% |
255
Notes to Financial Statements/Notes to Consolidated Financial Statements (Continued)
November 30, 2023
3. RELATED PARTY TRANSACTIONS AND SERVICE PROVIDER TRANSACTIONS (continued)
SEI Investments Global Funds Services (“SEIGFS”) serves as sub-administrator to the Funds. As sub-administrator, SEIGFS provides the Funds with all required general administrative services, including, without limitation: office space, equipment, and personnel; clerical and general back office services; bookkeeping, internal accounting and secretarial services; the calculation of NAV; and assistance with the preparation and filing of reports, registration statements, proxy statements and other materials required to be filed or furnished by the Funds under Federal and state securities laws. As compensation for these services, SEIGFS receives certain out-of-pocket costs, transaction fees and asset-based fees which are accrued daily and paid monthly by the Adviser.
SEI Investments Distribution Co. (“SIDCO”) serves as the Funds’ underwriter and distributor of Creation Units pursuant to a distribution agreement (the “Distribution Agreement”). SIDCO has no obligation to sell any specific quantity of Shares of the funds.
SIDCO bears the following costs and expenses relating to the distribution of Shares: (i) the costs of processing and maintaining records of creations of Creation Units; (ii) all costs of maintaining the records required of a registered broker/dealer; (iii) the expenses of maintaining its registration or qualification as a dealer or broker under federal or state laws; (iv) filing fees; and (v) all other expenses incurred in connection with the distribution services as contemplated in the Distribution Agreement. SIDCO receives no fee from the Funds for its distribution services under the Distribution Agreement; rather, the Adviser compensates SIDCO for certain expenses, out-of-pocket costs, and transaction fees.
BBH serves as the Custodian and transfer agent of the Global X Millennial Consumer ETF, Global X Health & Wellness ETF, Global X Robotics & Artificial Intelligence ETF, Global X U.S. Infrastructure Development ETF, Global X Autonomous & Electric Vehicles ETF, Global X Cloud Computing ETF, Global X Telemedicine & Digital Health ETF and Global X China Biotech Innovation ETF. As Custodian, BBH has agreed to (1) make receipts and disbursements of money on behalf of the Funds; (2) collect and receive all income and other payments and distributions on account of the Funds’ portfolio investments; (3) respond to correspondence from shareholders, security brokers and others relating to its duties; and (4) make periodic reports to the Funds concerning the Funds’ operations. BBH does not exercise any supervisory function over the purchase and sale of securities. As compensation for these services, BBH receives certain out-of-pocket costs, transaction fees and asset-based fees which are accrued daily and paid monthly by the Adviser from its fees. As compensation for these services, BBH receives certain out-of-pocket costs, transaction fees and asset-based fees which are accrued daily and paid monthly by the Adviser from its fees. As transfer agent, BBH has agreed to (1) issue and redeem Shares of each Fund; (2) make dividend and other distributions to shareholders of each Fund; (3) respond to correspondence by shareholders and others relating to its duties; (4) maintain shareholder accounts; and (5) make periodic reports to the Funds. As compensation for these services,
256
Notes to Financial Statements/Notes to Consolidated Financial Statements (Continued)
November 30, 2023
3. RELATED PARTY TRANSACTIONS AND SERVICE PROVIDER TRANSACTIONS (continued)
BBH receives certain out-of-pocket costs, transaction fees and asset-based fees which are accrued daily and paid monthly by the Adviser from its fees.
The Bank of New York Mellon (“BNY Mellon”) is the custodian of the Trust’s portfolio securities and cash with respect to all Funds except the Global X Millennial Consumer ETF, Global X Health & Wellness ETF, Global X Robotics & Artificial Intelligence ETF, Global X U.S. Infrastructure Development ETF, Global X Autonomous & Electric Vehicles ETF, Global X Cloud Computing ETF, Global X Telemedicine & Digital Health ETF and Global X China Biotech Innovation ETF. As custodian, BNY Mellon may appoint domestic and foreign sub-custodians and use depositories from time to time to hold securities and other instruments purchased by the Trust in foreign countries and to hold cash and currencies for the Trust. BNY Mellon also serves as the Trust’s transfer agent on behalf of the Funds. Under its transfer agency agreement with the Trust, BNY Mellon has undertaken with the Trust to provide the following services with respect to the Funds for which it serves as transfer agent: (i) perform and facilitate the performance of purchases and redemptions of Creation Units, (ii) prepare and transmit by means of Depository Trust Company’s (“DTC”) book-entry system payments for dividends and distributions on or with respect to the Shares declared by the Trust on behalf of the Fund, as applicable, (iii) prepare and deliver reports, information and documents as specified in the transfer agency agreement, (iv) perform the customary services of a transfer agent and dividend disbursing agent, and (v) render certain other miscellaneous services as specified in the transfer agency agreement or as otherwise agreed upon.
The custodian, transfer agent and securities lending agent for the Global X Cannabis ETF, Global X Blockchain ETF, Global X Genomics & Biotechnology ETF and Global X Thematic Growth ETF transitioned from BBH to BNY on or about June 12, 2023.
The custodian, transfer agent and securities lending agent for the Global X AgTech & Food Innovation ETF transitioned from BBH to BNY on or about June 26, 2023.
The custodian, transfer agent and securities lending agent for the Global X FinTech ETF, Global X Internet of Things ETF, Global X Artificial Intelligence & Technology ETF, Global X Video Games & Esports ETF, Global X Cybersecurity ETF, Global X CleanTech ETF, Global X Data Center REITs & Digital Infrastructure ETF, Global X Hydrogen ETF, Global X Solar ETF, Global X Wind Energy ETF, Global X Green Building ETF and Global X Metaverse ETF transitioned from BBH to BNY on or about July 10, 2023.
The custodian, transfer agent and securities lending agent for the Global X Aging Population ETF and Global X Clean Water ETF transitioned from BBH to BNY on or about July 24, 2023.
257
Notes to Financial Statements/Notes to Consolidated Financial Statements (Continued)
November 30, 2023
4. INVESTMENT TRANSACTIONS
For the year ended November 30, 2023, the purchases and sales of investments in securities excluding in-kind transactions, long-term U.S. Government, and short-term securities, were:
| | | Purchases | | Sales and
Maturities |
| Global X Millennial Consumer ETF | | $ | 16,829,472 | | | $ | 16,765,378 | |
| Global X Aging Population ETF | | | 8,355,499 | | | | 6,984,321 | |
| Global X Health & Wellness ETF | | | 1,728,689 | | | | 3,024,385 | |
| Global X Robotics & Artificial Intelligence ETF | | | 181,442,130 | | | | 158,328,109 | |
| Global X FinTech ETF | | | 51,140,798 | | | | 53,631,770 | |
| Global X Internet of Things ETF | | | 34,621,647 | | | | 40,679,264 | |
| Global X U.S. Infrastructure Development ETF | | | 262,656,949 | | | | 295,131,937 | |
| Global X Autonomous & Electric Vehicles ETF | | | 216,737,588 | | | | 219,852,308 | |
| Global X Artificial Intelligence & Technology ETF | | | 124,484,028 | | | | 64,446,396 | |
| Global X Genomics & Biotechnology ETF | | | 32,247,033 | | | | 29,952,963 | |
| Global X Cloud Computing ETF | | | 122,080,397 | | | | 125,516,849 | |
| Global X Cannabis ETF | | | 21,410,831 | | | | 20,201,349 | |
| Global X Thematic Growth ETF | | | 22,725,186 | | | | 23,004,264 | |
| Global X Video Games & Esports ETF | | | 41,972,865 | | | | 48,875,109 | |
| Global X Cybersecurity ETF | | | 134,090,428 | | | | 152,848,850 | |
| Global X Telemedicine & Digital Health ETF | | | 34,738,059 | | | | 35,531,436 | |
| Global X China Biotech Innovation ETF | | | 751,494 | | | | 749,914 | |
| Global X CleanTech ETF | | | 23,490,824 | | | | 27,681,226 | |
| Global X Data Center REITs & Digital Infrastructure ETF | | | 24,282,819 | | | | 25,929,611 | |
| Global X Clean Water ETF | | | 1,434,668 | | | | 1,306,337 | |
| Global X AgTech & Food Innovation ETF | | | 3,422,513 | | | | 3,142,603 | |
| Global X Blockchain ETF | | | 27,662,691 | | | | 26,723,576 | |
| Global X Hydrogen ETF | | | 11,983,458 | | | | 10,907,331 | |
| Global X Solar ETF | | | 4,283,725 | | | | 2,408,570 | |
| Global X Wind Energy ETF | | | 6,887,127 | | | | 5,200,200 | |
| Global X Green Building ETF | | | 1,665,715 | | | | 1,603,009 | |
| Global X Metaverse ETF | | | 477,248 | | | | 529,376 | |
| Global X PropTech ETF | | | 367,438 | | | | 366,740 | |
| Global X Carbon Credits Strategy ETF | | | 752,721 | | | | — | |
| Global X Defense Tech ETF | | | 268,282 | | | | 110,885 | |
258
Notes to Financial Statements/Notes to Consolidated Financial Statements (Continued)
November 30, 2023
4. INVESTMENT TRANSACTIONS (continued)
For each of the year ended November 30, 2023, in-kind transactions associated with creations and redemptions were:
| 2023 | | Purchases | | | Sales | | | Realized
Gain/(Loss) | |
| Global X Millennial Consumer ETF | | $ | 4,583,089 | | | $ | 18,994,630 | | | $ | (782,859 | ) |
| Global X Aging Population ETF | | | 35,784,704 | | | | 26,166,016 | | | | 2,864,845 | |
| Global X Health & Wellness ETF | | | – | | | | 12,989,886 | | | | (2,120,833 | ) |
| Global X Robotics & Artificial Intelligence ETF | | | 928,434,084 | | | | 344,405,984 | | | | 117,732,909 | |
| Global X FinTech ETF | | | 9,811,451 | | | | 141,940,324 | | | | (16,560,835 | ) |
| Global X Internet of Things ETF | | | 82,082,603 | | | | 112,641,065 | | | | 29,459,777 | |
| Global X U.S. Infrastructure Development ETF | | | 1,588,809,435 | | | | 694,411,720 | | | | 131,851,758 | |
| Global X Autonomous & Electric Vehicles ETF | | | 47,454,475 | | | | 245,283,038 | | | | 27,048,974 | |
| Global X Artificial Intelligence & Technology ETF | | | 543,335,409 | | | | 35,793,775 | | | | 2,857,168 | |
| Global X Genomics & Biotechnology ETF | | | 89,215,729 | | | | 149,863,985 | | | | (10,361,741 | ) |
| Global X Cloud Computing ETF | | | 27,576,459 | | | | 153,524,152 | | | | 16,231,808 | |
| Global X Cannabis ETF | | | 14,161,897 | | | | 1,559,538 | | | | 35,463 | |
| Global X Thematic Growth ETF | | | 9,937,318 | | | | 23,257,377 | | | | (3,942,561 | ) |
| Global X Video Games & Esports ETF | | | 21,624,277 | | | | 62,043,930 | | | | (6,435,572 | ) |
| Global X Cybersecurity ETF | | | 84,813,373 | | | | 486,868,156 | | | | (8,116,978 | ) |
| Global X Telemedicine & Digital Health ETF | | | 2,490,161 | | | | 53,540,190 | | | | (14,842,826 | ) |
| Global X China Biotech Innovation ETF | | | – | | | | – | | | | – | |
| Global X CleanTech ETF | | | 956,427 | | | | 22,956,702 | | | | 162,825 | |
| Global X Data Center REITs & Digital Infrastructure ETF | | | 15,628,943 | | | | 39,470,113 | | | | (5,070,247 | ) |
| Global X Clean Water ETF | | | 1,466,248 | | | | 425,073 | | | | 85,801 | |
| Global X AgTech & Food Innovation ETF | | | 232,095 | | | | 92,401 | | | | 11,041 | |
| Global X Blockchain ETF | | | 26,378,606 | | | | 26,328,600 | | | | 8,353,437 | |
| Global X Hydrogen ETF | | | 25,669,610 | | | | 3,371,479 | | | | 499,161 | |
| Global X Solar ETF | | | 1,877,642 | | | | 521,625 | | | | 137,080 | |
| Global X Wind Energy ETF | | | 8,068,053 | | | | 7,805,159 | | | | (857,581 | ) |
| Global X Green Building ETF | | | 1,414,294 | | | | 1,477,811 | | | | (143,816 | ) |
| Global X Metaverse ETF | | | 172,258 | | | | 262,899 | | | | 130,184 | |
| Global X PropTech ETF | | | 2,506,044 | | | | – | | | | – | |
| Global X Carbon Credits Strategy ETF | | | – | | | | – | | | | – | |
| Global X Defense Tech ETF | | | 4,355,034 | | | | 257,385 | | | | 49,213 | |
For the year ended November 30, 2023, there were no purchases or sales of long-term U.S. Government securities by the Funds.
5. BASIS FOR CONSOLIDATION FOR THE GLOBAL X CARBON CREDIT STRATEGY SUBSIDIARY LIMITED
The Consolidated Schedule of Investments, Consolidated Statement of Assets and Liabilities, Consolidated Statement of Operations, Consolidated Statement of Changes in Net Assets, and the Consolidated Financial Highlights of the Global X Carbon Credits Strategy ETF include the accounts of the Global X Carbon Credit Strategy Subsidiary Limited (the “Subsidiary”). All intercompany accounts and transactions have been eliminated in consolidation for the Global X Carbon Credits Strategy ETF. The Subsidiary
259
Notes to Financial Statements/Notes to Consolidated Financial Statements (Continued)
November 30, 2023
5. BASIS FOR CONSOLIDATION FOR THE GLOBAL X CARBON CREDIT STRATEGY SUBSIDIARY LIMITED (continued)
has a fiscal year end and conforming tax year end of November 30 for financial statement consolidation purposes.
The Subsidiary is classified as controlled foreign corporation under the Code. The Subsidiary’s taxable income is included in the calculation of the Fund’s taxable income. Net losses of the Subsidiary are not deductible by the Fund either in the current period or carried forward to future periods.
The Fund may invest up to 25% of its total assets in the Subsidiary.
A summary of the Fund’s investments in the Subsidiary are as follows:
| | | Inception Date of
Subsidiary | | Subsidiary Net
Assets at
November 30,
2023 | | % of Total Net
Assets at
November 30,
2023 |
| Global X Carbon Credit Strategy Subsidiary Limited | | May 24, 2023 | | $260,236 | | 16.4% |
Gains and losses attributed to the Fund’s investments in the Subsidiary are as follows:
| | | | Global X
Carbon Credit
Strategy
Subsidiary
Limited | |
| Investment Income: | | | | |
| Dividend Income | | $ | 130 | |
| Interest Income | | | 5,867 | |
| Total Investment Income | | | 5,997 | |
| Custodian Fees | | | 24 | |
| Total Expenses | | | 24 | |
| Net Investment Income | | | 5,973 | |
| Net Realized Gain (Loss) on: | | | | |
| Investments | | | 4,012 | |
| Futures Contracts | | | (96,318 | ) |
| Foreign Currency Transactions | | | 202 | |
| Net Realized Loss | | | (92,104 | ) |
| Net Change in Unrealized Appreciation (Depreciation) on: | | | | |
| Investments | | | 11 | |
| Futures Contracts | | | (98,861 | ) |
| Net Change in Unrealized Depreciation | | | (98,850 | ) |
| Net Realized and Unrealized Loss | | | (190,954 | ) |
| Net Decrease in Net Assets Resulting from Operations | | $ | (184,981 | ) |
260
Notes to Financial Statements/Notes to Consolidated Financial Statements (Continued)
November 30, 2023
6. DERIVATIVE TRANSACTIONS
The following tables show the derivatives categorized by underlying risk exposure.
The fair value of derivative instruments as of November 30, 2023 was as follows:
| | | Asset Derivatives | | | | | | | Liability Derivatives | | | |
| | | Statements of Assets
and Liabilities/
Consolidated Statement
of Asset and Liabilities
Location | | Fair Value | | | | Statements of Assets
and Liabilities/
Consolidated Statement
of Asset and Liabilities
Location | | Fair Value |
| Derivatives not accounted for as hedging instruments: |
| |
| Global X Robotics & Artificial Intelligence ETF |
| |
| Equity contracts | | Unrealized appreciation on Futures Contracts | | $ | 314,240 | † | | Equity contracts | | Unrealized depreciation on Futures Contracts | | $ | — | |
| Total Derivatives not accounted for as hedging instruments | | $ | 314,240 | | | | | | | $ | — | |
| | | Asset Derivatives | | | | | | | Liability Derivatives | | | |
| | | Statements of Assets
and Liabilities/
Consolidated Statement
of Asset and Liabilities
Location | | Fair Value | | | | Statements of Assets
and Liabilities/
Consolidated Statement
of Asset and Liabilities
Location | | Fair Value |
| Derivatives not accounted for as hedging instruments: |
| |
| Global X Carbon Credits Strategy ETF |
| |
| Commodity contracts | | Unrealized appreciation on Futures Contracts | | $ | 23,578 | † | | Commodity contracts | | Unrealized depreciation on Futures Contracts | | $ | 122,439 | † |
| Total Derivatives not accounted for as hedging instruments | | $ | 23,578 | | | | | | | $ | 122,439 | |
†Includes cumulative appreciation (depreciation) of futures contracts as reported in the Schedules of Investments/Consolidated Schedule of Investments. Only current day’s variation margin, if any, is reported within the Statements of Assets & Liabilities/Consolidated Statement of Assets & Liabilities.
The effect of derivative instruments on the Statements of Operations/Consolidated Statement of Operations for the year ended November 30, 2023:
Change in realized appreciation or (depreciation) on derivatives recognized in income:
261
Notes to Financial Statements/Notes to Consolidated Financial Statements (Continued)
November 30, 2023
6. DERIVATIVE TRANSACTIONS (continued)
| | | | Futures | |
| Global X Robotics & Artificial Intelligence ETF | | | | |
| Equity contracts | | $ | 1,279,688 | |
| | | | | |
| Global X Carbon Credits Strategy ETF | | | | |
| Commodity contracts | | $ | (96,318 | ) |
Change in unrealized appreciation or (depreciation) on derivatives recognized in income:
| | | | Futures | |
| Global X Robotics & Artificial Intelligence ETF | | | | |
| Equity contracts | | $ | 314,240 | |
| Global X Carbon Credits Strategy ETF | | | | |
| Commodity contracts | | $ | (98,861 | ) |
For the year ended November 30, 2023, the average monthly notional values of futures contracts held were as follows:
| | | Short
Average | | | | Long
Average | |
| Global X Robotics & Artificial Intelligence ETF | | $ | – | | | $ | 8,856,855 | |
| | | | | | | | | |
| Global X Carbon Credits Strategy ETF | | | – | | | | 2,184,224 | |
7. TAX INFORMATION
The amount and character of income and capital gain distributions to be paid, if any, are determined in accordance with Federal income tax regulations, which may differ from U.S. GAAP.As a result, net investment income (loss) and net realized gain (loss) on investment transactions for a reporting period may differ significantly from distributions during such period. These book/tax differences may be temporary or permanent. To the extent these differences are permanent in nature, they are charged or credited to undistributed net investment income (loss), accumulated net realized gain (loss) or paid-in capital, as appropriate, in the period that the differences arise.
The permanent differences primarily consist of foreign currency, reclassification of distributions, partnerships adjustments, distributions in excess, net operating losses, return of capital distributions, and sales of passive foreign investment companies. The permanent differences that are credited or charged to Paid In Capital and distributable earnings are primarily related to redemptions in-kind, net operating losses, and return of capital distributions and have been reclassified to/from the following accounts during the fiscal year ended November 30, 2023:
262
Notes to Financial Statements/Notes to Consolidated Financial Statements (Continued)
November 30, 2023
7. TAX INFORMATION (continued)
| Global X Funds | | Paid-in
Capital | | Total
Distributable
Earnings
(Accumulated
Losses) |
| Global X Millennial Consumer ETF | | $(1,156,024) | | $1,156,024 |
| Global X Aging Population ETF | | 2,806,783 | | (2,806,783) |
| Global X Health & Wellness ETF | | (2,172,318) | | 2,172,318 |
| Global X Robotics & Artificial Intelligence ETF | | 112,251,740 | | (112,251,740) |
| Global X FinTech ETF | | (19,199,428) | | 19,199,428 |
| Global X Internet of Things ETF | | 28,932,464 | | (28,932,464) |
| Global X U.S. Infrastructure Development ETF | | 124,975,642 | | (124,975,642) |
| Global X Autonomous & Electric Vehicles ETF | | 25,024,128 | | (25,024,128) |
| Global X Artificial Intelligence & Technology ETF | | 2,592,116 | | (2,592,116) |
| Global X Genomics & Biotechnology ETF | | (22,603,374) | | 22,603,374 |
| Global X Cloud Computing ETF | | 8,133,028 | | (8,133,028) |
| Global X Cannabis ETF | | (643,524) | | 643,524 |
| Global X Thematic Growth ETF | | (5,580,704) | | 5,580,704 |
| Global X Video Games & Esports ETF | | (6,984,950) | | 6,984,950 |
| Global X Cybersecurity ETF | | (21,602,335) | | 21,602,335 |
| Global X Telemedicine & Digital Health ETF | | (17,132,926) | | 17,132,926 |
| Global X CleanTech ETF | | (503,529) | | 503,529 |
| Global X Data Center REITs & Digital Infrastructure ETF | | (5,286,977) | | 5,286,977 |
| Global X Clean Water ETF | | 85,801 | | (85,801) |
| Global X AgTech & Food Innovation ETF | | (40,281) | | 40,281 |
| Global X Blockchain ETF | | 4,017,458 | | (4,017,458) |
| Global X Hydrogen ETF | | (60,939) | | 60,939 |
| Global X Solar ETF | | 24,141 | | (24,141) |
| Global X Wind Energy ETF | | (875,683) | | 875,683 |
| Global X Green Building ETF | | (144,770) | | 144,770 |
| Global X Metaverse ETF | | 123,863 | | (123,863) |
| Global X Carbon Credits Strategy ETF | | (86,803) | | 86,803 |
| Global X Defense Tech ETF | | 49,213 | | (49,213) |
These reclassifications have no impact on net assets or NAV per share.
The tax character of dividends and distributions declared during the years or periods ended November 30, 2023 and November 30, 2022 were as follows:
| Global X Funds | | Ordinary Income | | | Long-Term
Capital Gain | | | Return of Capital | | | Totals | |
| Global X Millennial Consumer ETF | | | | | | | | | | | | | | | | |
| 2023 | | $ | 234,244 | | | $ | – | | | $ | – | | | $ | 234,244 | |
| 2022 | | | 343,441 | | | | – | | | | – | | | | 343,441 | |
| Global X Aging Population ETF | | | | | | | | | | | | | | | | |
| 2023 | | $ | 279,995 | | | $ | – | | | $ | – | | | $ | 279,995 | |
263
Notes to Financial Statements/Notes to Consolidated Financial Statements (Continued)
November 30, 2023
7. TAX INFORMATION (continued)
| Global X Funds | | Ordinary Income | | | Long-Term
Capital Gain | | | Return of Capital | | | Totals | |
| 2022 | | | 543,653 | | | | – | | | | 47,506 | | | | 591,159 | |
| Global X Health & Wellness ETF | | | | | | | | | | | | | | | | |
| 2023 | | $ | 195,346 | | | $ | – | | | $ | – | | | $ | 195,346 | |
| 2022 | | | 287,193 | | | | – | | | | – | | | | 287,193 | |
| Global X Robotics & Artificial Intelligence ETF | | | | | | | | | | | | | | | | |
| 2023 | | $ | 4,618,009 | | | $ | – | | | $ | – | | | $ | 4,618,009 | |
| 2022 | | | 2,507,983 | | | | – | | | | 547,284 | | | | 3,055,267 | |
| Global X FinTech ETF | | | | | | | | | | | | | | | | |
| 2023 | | $ | 887,181 | | | $ | – | | | $ | 28,497 | | | $ | 915,678 | |
| 2022 | | | 61,756,013 | | | | – | | | | 1,435,476 | | | | 63,191,489 | |
| Global X Internet of Things ETF | | | | | | | | | | | | | | | | |
| 2023 | | $ | 2,946,458 | | | $ | – | | | $ | – | | | $ | 2,946,458 | |
| 2022 | | | 1,635,436 | | | | 636,864 | | | | – | | | | 2,272,300 | |
| Global X U.S. Infrastructure Development ETF | | | | | | | | | | | | | | | | |
| 2023 | | $ | 30,856,526 | | | $ | – | | | $ | – | | | $ | 30,856,526 | |
| 2022 | | | 31,995,449 | | | | – | | | | – | | | | 31,995,449 | |
| Global X Autonomous & Electric Vehicles ETF | | | | | | | | | | | | | | | | |
| 2023 | | $ | 11,305,718 | | | $ | – | | | $ | – | | | $ | 11,305,718 | |
| 2022 | | | 5,897,108 | | | | 547,077 | | | | – | | | | 6,444,185 | |
| Global X Artificial Intelligence & Technology ETF | | | | | | | | | | | | | | | | |
| 2023 | | $ | 724,994 | | | $ | – | | | $ | – | | | $ | 724,994 | |
| 2022 | | | 441,670 | | | | – | | | | – | | | | 441,670 | |
| Global X Genomics & Biotechnology ETF | | | | | | | | | | | | | | | | |
| 2023 | | $ | – | | | $ | – | | | $ | – | | | $ | – | |
| 2022 | | | 81,403 | | | | – | | | | – | | | | 81,403 | |
| Global X Cloud Computing ETF | | | | | | | | | | | | | | | | |
| 2023 | | $ | – | | | $ | – | | | $ | – | | | $ | – | |
| 2022 | | | – | | | | 21,230,047 | | | | – | | | | 21,230,047 | |
| Global X Cannabis ETF | | | | | | | | | | | | | | | | |
| 2023 | | $ | 1,215,573 | | | $ | – | | | $ | – | | | $ | 1,215,573 | |
| 2022 | | | 3,318,441 | | | | – | | | | 93,835 | | | | 3,412,276 | |
| Global X Thematic Growth ETF | | | | | | | | | | | | | | | | |
| 2023 | | $ | 746,536 | | | $ | – | | | $ | – | | | $ | 746,536 | |
| 2022 | | | 1,542,588 | | | | – | | | | – | | | | 1,542,588 | |
| Global X Video Games & Esports ETF | | | | | | | | | | | | | | | | |
| 2023 | | $ | 275,496 | | | $ | – | | | $ | – | | | $ | 275,496 | |
| 2022 | | | 1,985,253 | | | | 1,007,382 | | | | 526,728 | | | | 3,519,363 | |
| Global X Cybersecurity ETF | | | | | | | | | | | | | | | | |
| 2023 | | $ | 684,512 | | | $ | 12,296,299 | | | $ | – | | | $ | 12,980,811 | |
| 2022 | | | 7,417,970 | | | | 81,575 | | | | – | | | | 7,499,545 | |
| Global X Telemedicine & Digital Health ETF | | | | | | | | | | | | | | | | |
| 2023 | | $ | – | | | $ | – | | | $ | – | | | $ | – | |
| 2022 | | | – | | | | – | | | | – | | | | – | |
264
Notes to Financial Statements/Notes to Consolidated Financial Statements (Continued)
November 30, 2023
7. TAX INFORMATION (continued)
| Global X Funds | | Ordinary Income | | | Long-Term
Capital Gain | | | Return of Capital | | | Totals | |
| Global X China Biotech Innovation ETF | | | | | | | | | | | | | | | | |
| 2023 | | $ | 9,997 | | | $ | – | | | $ | – | | | $ | 9,997 | |
| 2022 | | | – | | | | – | | | | 5,370 | | | | 5,370 | |
| Global X CleanTech ETF | | | | | | | | | | | | | | | | |
| 2023 | | $ | 205,777 | | | $ | – | | | $ | – | | | $ | 205,777 | |
| 2022 | | | 499,449 | | | | – | | | | – | | | | 499,449 | |
| Global X Data Center REITs & Digital Infrastructure ETF | | | | | | | | | | | | |
| 2023 | | $ | 1,286,237 | | | $ | 44,305 | | | $ | – | | | $ | 1,330,542 | |
| 2022 | | | 1,014,681 | | | | 75,687 | | | | – | | | | 1,090,368 | |
| Global X Clean Water ETF | | | | | | | | | | | | | | | | |
| 2023 | | $ | 138,123 | | | $ | – | | | $ | – | | | $ | 138,123 | |
| 2022 | | | 123,205 | | | | – | | | | – | | | | 123,205 | |
| Global X AgTech & Food Innovation ETF | | | | | | | | | | | | | | |
| 2023 | | $ | 45,738 | | | $ | – | | | $ | – | | | $ | 45,738 | |
| 2022 | | | 61,689 | | | | – | | | | – | | | | 61,689 | |
| Global X Blockchain ETF | | | | | | | | | | | | | | | | |
| 2023 | | $ | 602,091 | | | $ | – | | | $ | – | | | $ | 602,091 | |
| 2022 | | | 4,767,818 | | | | – | | | | 90,192 | | | | 4,858,010 | |
| Global X Hydrogen ETF | | | | | | | | | | | | | | | | |
| 2023 | | $ | – | | | $ | – | | | $ | – | | | $ | – | |
| 2022 | | | 15,749 | | | | – | | | | – | | | | 15,749 | |
| Global X Solar ETF | | | | | | | | | | | | | | | | |
| 2023 | | $ | – | | | $ | – | | | $ | – | | | $ | – | |
| 2022 | | | 748 | | | | – | | | | 1,369 | | | | 2,117 | |
| Global X Wind Energy ETF | | | | | | | | | | | | | | | | |
| 2023 | | $ | 47,859 | | | $ | – | | | $ | – | | | $ | 47,859 | |
| 2022 | | | 11,474 | | | | – | | | | – | | | | 11,474 | |
| Global X Green Building ETF | | | | | | | | | | | | | | | | |
| 2023 | | $ | 70,340 | | | $ | – | | | $ | – | | | $ | 70,340 | |
| 2022 | | | 15,947 | | | | – | | | | – | | | | 15,947 | |
| Global X Metaverse ETF | | | | | | | | | | | | | | | | |
| 2023 | | $ | 163,393 | | | $ | – | | | $ | – | | | $ | 163,393 | |
| 2022 | | | 38,313 | | | | – | | | | – | | | | 38,313 | |
| Global X PropTech ETF | | | | | | | | | | | | | | | | |
| 2023 | | $ | 453 | | | $ | – | | | $ | – | | | $ | 453 | |
| Global X Carbon Credits Strategy ETF | | | | | | | | | | | | | | | | |
| 2023 | | $ | 3,332 | | | $ | – | | | $ | – | | | $ | 3,332 | |
| Global X Defense Tech ETF | | | | | | | | | | | | | | | | |
| 2023 | | $ | – | | | $ | – | | | $ | – | | | $ | – | |
265
Notes to Financial Statements/Notes to Consolidated Financial Statements (Continued)
November 30, 2023
7. TAX INFORMATION (continued)
As of November 30, 2023, the components of tax basis distributable earnings (accumulated losses) were as follows:
| | | Global X Funds |
| | | Global X
Millennial
Consumer ETF | | Global X Aging
Population
ETF | | Global X
Health &
Wellness ETF |
| Undistributed Ordinary Income | | $ | 194,672 | | | $ | 194,273 | | | $ | 91,161 | |
| Capital Loss Carryforwards | | | (7,877,205 | ) | | | (1,817,888 | ) | | | (2,408,807 | ) |
| Unrealized Depreciation on Investments and Foreign Currency | | | (36,049,970 | ) | | | (7,171,506 | ) | | | (4,120,919 | ) |
| Other Temporary Differences | | | 2 | | | | (1 | ) | | | (2 | ) |
| Total Accumulated Losses | | $ | (43,732,501 | ) | | $ | (8,795,122 | ) | | $ | (6,438,567 | ) |
| | | Global X Funds |
| | | Global X
Robotics &
Artificial
Intelligence
ETF | | Global X
FinTech ETF | | Global X
Internet of
Things ETF |
| Undistributed Ordinary Income | | $ | 355,545 | | | $ | – | | | $ | 1,128,069 | |
| Capital Loss Carryforwards | | | (362,550,597 | ) | | | (163,535,159 | ) | | | (14,937,305 | ) |
| Unrealized Appreciation (Depreciation) on Investments and Foreign Currency | | | (76,652,636 | ) | | | (216,757,697 | ) | | | 11,061,610 | |
| Other Temporary Differences | | | – | | | | 5 | | | | (5 | ) |
| Total Accumulated Losses | | $ | (438,847,688 | ) | | $ | (380,292,851 | ) | | $ | (2,747,631 | ) |
| | | Global X Funds |
| | | Global X U.S.
Infrastructure
Development
ETF | | Global X
Autonomous
& Electric
Vehicles ETF | | Global X
Artificial
Intelligence
& Technology
ETF |
| Undistributed Ordinary Income | | $ | 20,949,309 | | | $ | 6,458,212 | | | $ | 473,555 | |
| Capital Loss Carryforwards | | | (10,409,498 | ) | | | (84,987,935 | ) | | | (5,357,078 | ) |
| Unrealized Appreciation (Depreciation) on Investments and Foreign Currency | | | 538,416,361 | | | | (248,433,023 | ) | | | 42,259,053 | |
| Other Temporary Differences | | | (6 | ) | | | (2 | ) | | | (6 | ) |
| Total Distributable Earnings (Accumulated Losses) | | $ | 548,956,166 | | | $ | (326,962,748 | ) | | $ | 37,375,524 | |
266
Notes to Financial Statements/Notes to Consolidated Financial Statements (Continued)
November 30, 2023
7. TAX INFORMATION (continued)
| | | Global X Funds |
| | | Global X
Genomics &
Biotechnology
ETF | | Global X Cloud
Computing
ETF | | Global X
Cannabis ETF |
| Undistributed Ordinary Income | | $ | – | | | $ | – | | | $ | 688,319 | |
| Capital Loss Carryforwards | | | (91,157,377 | ) | | | (137,743,579 | ) | | | (240,932,755 | ) |
| Unrealized Depreciation on Investments and Foreign Currency | | | (58,003,193 | ) | | | (254,683,980 | ) | | | (54,681,631 | ) |
| Late Year Loss Deferral | | | (599,083 | ) | | | (2,450,707 | ) | | | – | |
| Other Temporary Differences | | | (7 | ) | | | 4 | | | | 1 | |
| Total Accumulated Losses | | $ | (149,759,660 | ) | | $ | (394,878,262 | ) | | $ | (294,926,066 | ) |
| | | Global X Funds |
| | | Global X
Thematic
Growth ETF | | Global X Video
Games &
Esports ETF | | Global X
Cybersecurity
ETF |
| Undistributed Ordinary Income | | $ | 51,831 | | | $ | 801,972 | | | $ | – | |
| Capital Loss Carryforwards | | | (34,533,615 | ) | | | (57,802,242 | ) | | | (181,778,507 | ) |
| Unrealized Depreciation on Investments and Foreign Currency | | | (27,561,266 | ) | | | (86,816,346 | ) | | | (119,203,710 | ) |
| Late Year Loss Deferral | | | – | | | | – | | | | (1,519,320 | ) |
| Other Temporary Differences | | | (3 | ) | | | 1 | | | | 1 | |
| Total Accumulated Losses | | $ | (62,043,053 | ) | | $ | (143,816,615 | ) | | $ | (302,501,536 | ) |
| | | Global X Funds |
| | | Global X
Telemedicine &
Digital Health
ETF | | Global X
China Biotech
Innovation
ETF | | Global X
CleanTech
ETF |
| Undistributed Ordinary Income | | $ | – | | | $ | 432 | | | $ | 265,087 | |
| Capital Loss Carryforwards | | | (96,234,732 | ) | | | (1,617,473 | ) | | | (27,530,160 | ) |
| Unrealized Depreciation on Investments and Foreign Currency | | | (88,992,353 | ) | | | (711,104 | ) | | | (84,701,408 | ) |
| Late Year Loss Deferral | | | (374,990 | ) | | | – | | | | – | |
| Other Temporary Differences | | | (2 | ) | | | (2 | ) | | | (2 | ) |
| Total Accumulated Losses | | $ | (185,602,077 | ) | | $ | (2,328,147 | ) | | $ | (111,966,483 | ) |
267
Notes to Financial Statements/Notes to Consolidated Financial Statements (Continued)
November 30, 2023
7. TAX INFORMATION (continued)
| | | Global X Funds |
| | | Global X Data
Center REITs
& Digital
Infrastructure
ETF | | Global X Clean
Water ETF | | Global X
AgTech
& Food
Innovation
ETF |
| Undistributed Ordinary Income | | $ | 170,095 | | | $ | 72,726 | | | $ | 22,351 | |
| Capital Loss Carryforwards | | | (1,482,945 | ) | | | (505,130 | ) | | | (4,134,995 | ) |
| Unrealized Appreciation (Depreciation) on Investments and Foreign Currency | | | (9,294,969 | ) | | | 3,530 | | | | (1,053,934 | ) |
| Other Temporary Differences | | | 1 | | | | (2 | ) | | | 4 | |
| Total Accumulated Losses | | $ | (10,607,818 | ) | | $ | (428,876 | ) | | $ | (5,166,574 | ) |
| | | Global X Funds |
| | | Global X
Blockchain
ETF | | Global X
Hydrogen ETF | | Global X Solar
ETF |
| Undistributed Ordinary Income | | $ | 3,111,798 | | | $ | – | | | $ | – | |
| Capital Loss Carryforwards | | | (121,973,428 | ) | | | (11,089,314 | ) | | | (884,729 | ) |
| Unrealized Depreciation on Investments and Foreign Currency | | | (19,969,505 | ) | | | (39,085,426 | ) | | | (2,891,833 | ) |
| Late Year Loss Deferral | | | – | | | | (77,661 | ) | | | (755 | ) |
| Other Temporary Differences | | | (2 | ) | | | (3 | ) | | | – | |
| Total Accumulated Losses | | $ | (138,831,137 | ) | | $ | (50,252,404 | ) | | $ | (3,777,317 | ) |
| | | Global X Funds |
| | | Global X Wind
Energy ETF | | Global X
Green Building
ETF | | Global X
Metaverse ETF |
| Undistributed Ordinary Income | | $ | 16,582 | | | $ | 30,238 | | | $ | 4,339 | |
| Capital Loss Carryforwards | | | (1,582,899 | ) | | | (265,504 | ) | | | (103,870 | ) |
| Unrealized Appreciation (Depreciation) on Investments and Foreign Currency | | | (1,584,283 | ) | | | 952 | | | | 54,478 | |
| Other Temporary Differences | | | – | | | | 1 | | | | 3 | |
| Total Accumulated Losses | | $ | (3,150,600 | ) | | $ | (234,313 | ) | | $ | (45,050 | ) |
| | | Global X Funds |
| | | Global X
PropTech ETF | | Global X
Carbon Credits
Strategy ETF | | Global X
Defense Tech
ETF |
| Undistributed Ordinary Income | | $ | 63,379 | | | $ | 4,187 | | | $ | 10,808 | |
| Unrealized Appreciation (Depreciation) on Investments and Foreign Currency | | | 154,612 | | | | (89,968 | ) | | | 278,217 | |
| Other Temporary Differences | | | – | | | | 2 | | | | (2 | ) |
| Total Distributable Earnings (Accumulated Losses) | | $ | 217,991 | | | $ | (85,779 | ) | | $ | 289,023 | |
Qualified late year ordinary (including currency and specified gain/loss items) and Post-October capital losses represent losses realized from January 1, 2023 through November 30, 2023 and November 1, 2023 through November 30, 2023, respectively, that in accordance
268
Notes to Financial Statements/Notes to Consolidated Financial Statements (Continued)
November 30, 2023
7. TAX INFORMATION (continued)
with federal income tax regulations, the Funds have elected to defer and treat as having arisen in the following fiscal year.
For taxable years beginning after December 22, 2010, a registered investment company is permitted to carry forward net capital losses to offset capital gains realized in later years, and the losses carried forward retain their original character as either long-term or short-term losses. Losses carried forward under these provisions are as follows:
| | | Short-Term
Loss | | | Long-Term
Loss | | | Total | |
| Global X Millennial Consumer ETF | | $ | 2,726,565 | | | $ | 5,150,640 | | | $ | 7,877,205 | |
| Global X Aging Population ETF | | | 97,754 | | | | 1,720,134 | | | | 1,817,888 | |
| Global X Health & Wellness ETF | | | 975,854 | | | | 1,432,953 | | | | 2,408,807 | |
| Global X Robotics & Artificial Intelligence ETF | | | 233,294,632 | | | | 129,255,965 | | | | 362,550,597 | |
| Global X FinTech ETF | | | 86,789,499 | | | | 76,745,660 | | | | 163,535,159 | |
| Global X Internet of Things ETF | | | 6,701,765 | | | | 8,235,540 | | | | 14,937,305 | |
| Global X U.S. Infrastructure Development ETF | | | 10,409,498 | | | | – | | | | 10,409,498 | |
| Global X Autonomous & Electric Vehicles ETF | | | 55,830,405 | | | | 29,157,530 | | | | 84,987,935 | |
| Global X Artificial Intelligence & Technology ETF | | | – | | | | 5,357,078 | | | | 5,357,078 | |
| Global X Genomics & Biotechnology ETF | | | 19,413,804 | | | | 71,743,573 | | | | 91,157,377 | |
| Global X Cloud Computing ETF | | | 31,025,039 | | | | 106,718,540 | | | | 137,743,579 | |
| Global X Cannabis ETF | | | 105,047,985 | | | | 135,884,770 | | | | 240,932,755 | |
| Global X Thematic Growth ETF | | | 13,035,416 | | | | 21,498,199 | | | | 34,533,615 | |
| Global X Video Games & Esports ETF | | | 13,222,627 | | | | 44,579,615 | | | | 57,802,242 | |
| Global X Cybersecurity ETF | | | 57,642,952 | | | | 124,135,555 | | | | 181,778,507 | |
| Global X Telemedicine & Digital Health ETF | | | 19,209,414 | | | | 77,025,318 | | | | 96,234,732 | |
| Global X China Biotech Innovation ETF | | | 518,448 | | | | 1,099,025 | | | | 1,617,473 | |
| Global X CleanTech ETF | | | 14,228,754 | | | | 13,301,406 | | | | 27,530,160 | |
| Global X Data Center REITs & Digital Infrastructure ETF | | | – | | | | 1,482,945 | | | | 1,482,945 | |
| Global X Clean Water ETF | | | 195,478 | | | | 309,652 | | | | 505,130 | |
| Global X AgTech & Food Innovation ETF | | | 1,018,671 | | | | 3,116,324 | | | | 4,134,995 | |
| Global X Blockchain ETF | | | 74,648,426 | | | | 47,325,002 | | | | 121,973,428 | |
| Global X Hydrogen ETF | | | 6,892,012 | | | | 4,197,302 | | | | 11,089,314 | |
| Global X Solar ETF | | | 531,503 | | | | 353,226 | | | | 884,729 | |
| Global X Wind Energy ETF | | | 921,931 | | | | 660,968 | | | | 1,582,899 | |
| Global X Green Building ETF | | | 200,582 | | | | 64,922 | | | | 265,504 | |
| Global X Metaverse ETF | | | 103,870 | | | | – | | | | 103,870 | |
269
Notes to Financial Statements/Notes to Consolidated Financial Statements (Continued)
November 30, 2023
7. TAX INFORMATION (continued)
During the year ended November 30, 2023, the following Funds utilized capital loss carryforwards to offset capital gains amounting to:
| | | Short-Term
Loss | | | Long-Term
Loss | | | Total | |
| Global X Millennial Consumer ETF | | $ | 22,422 | | | $ | – | | | $ | 22,422 | |
| Global X Aging Population ETF | | | 273,111 | | | | – | | | | 273,111 | |
| Global X U.S. Infrastructure Development ETF | | | 11,204,492 | | | | – | | | | 11,204,492 | |
| Global X Artificial Intelligence & Technology ETF | | | 1,786,484 | | | | – | | | | 1,786,484 | |
| Global X Cloud Computing ETF | | | 2,880,076 | | | | – | | | | 2,880,076 | |
The Federal tax cost and aggregated gross unrealized appreciation and depreciation on investments held by the Funds at November 30, 2023, were as follows:
| Global X Funds | | Federal Tax
Cost | | Aggregated
Gross
Unrealized
Appreciation | | Aggregated
Gross
Unrealized
Depreciation | | Net Unrealized
Appreciation
(Depreciation) |
| Global X Millennial Consumer ETF | | | $141,429,237 | | | | $9,814,641 | | | $(45,864,611) | | | $(36,049,970) |
| Global X Aging Population ETF | | | 60,677,156 | | | | 3,658,211 | | | (10,829,717) | | | (7,171,506) |
| Global X Health & Wellness ETF | | | 13,258,681 | | | | 1,065,956 | | | (5,186,875) | | | (4,120,919) |
| Global X Robotics & Artificial Intelligence ETF | | | 2,424,342,799 | | | | 426,030,350 | | | (502,682,986) | | | (76,652,636) |
| Global X FinTech ETF | | | 574,963,641 | | | | 27,374,463 | | | (244,132,160) | | | (216,757,697) |
| Global X Internet of Things ETF | | | 275,614,843 | | | | 52,681,280 | | | (41,619,670) | | | 11,061,610 |
| Global X U.S. Infrastructure Development ETF | | | 4,559,355,495 | | | | 745,764,588 | | | (207,348,227) | | | 538,416,361 |
| Global X Autonomous & Electric Vehicles ETF | | | 1,004,875,561 | | | | 52,757,767 | | | (301,190,790) | | | (248,433,023) |
| Global X Artificial Intelligence & Technology ETF | | | 747,854,562 | | | | 80,537,392 | | | (38,278,339) | | | 42,259,053 |
| Global X Genomics & Biotechnology ETF | | | 154,914,362 | | | | 2,092,543 | | | (60,095,736) | | | (58,003,193) |
| Global X Cloud Computing ETF | | | 836,008,971 | | | | 65,822,587 | | | (320,506,567) | | | (254,683,980) |
| Global X Cannabis ETF | | | 87,401,871 | | | | – | | | (54,681,631) | | | (54,681,631) |
| Global X Thematic Growth ETF | | | 60,330,758 | | | | – | | | (27,561,266) | | | (27,561,266) |
| Global X Video Games & Esports ETF | | | 226,335,249 | | | | 3,291,784 | | | (90,108,130) | | | (86,816,346) |
| Global X Cybersecurity ETF | | | 779,458,280 | | | | 50,840,836 | | | (170,044,546) | | | (119,203,710) |
| Global X Telemedicine & Digital Health ETF | | | 153,829,986 | | | | 676,034 | | | (89,668,387) | | | (88,992,353) |
| Global X China Biotech Innovation ETF | | | 3,007,752 | | | | 137,750 | | | (848,854) | | | (711,104) |
| Global X CleanTech ETF | | | 152,479,436 | | | | 2,527,635 | | | (87,229,043) | | | (84,701,408) |
| Global X Data Center REITs & Digital Infrastructure ETF | | | 49,522,519 | | | | 1,261,201 | | | (10,556,170) | | | (9,294,969) |
270
Notes to Financial Statements/Notes to Consolidated Financial Statements (Continued)
November 30, 2023
7. TAX INFORMATION (continued)
| Global X Funds | | Federal Tax
Cost | | Aggregated
Gross
Unrealized
Appreciation | | Aggregated
Gross
Unrealized
Depreciation | | Net Unrealized
Appreciation
(Depreciation) |
| Global X Clean Water ETF | | | $9,360,224 | | | $876,027 | | | $(872,497) | | | $3,530 |
| Global X AgTech & Food Innovation ETF | | | 5,645,389 | | | 51,699 | | | (1,105,633) | | | (1,053,934) |
| Global X Blockchain ETF | | | 124,057,384 | | | 11,254,087 | | | (31,223,592) | | | (19,969,505) |
| Global X Hydrogen ETF | | | 73,848,134 | | | 379,023 | | | (39,464,449) | | | (39,085,426) |
| Global X Solar ETF | | | 8,898,717 | | | 78,060 | | | (2,969,893) | | | (2,891,833) |
| Global X Wind Energy ETF | | | 4,326,753 | | | 28,839 | | | (1,613,122) | | | (1,584,283) |
| Global X Green Building ETF | | | 2,154,903 | | | 157,771 | | | (156,819) | | | 952 |
| Global X Metaverse ETF | | | 2,433,999 | | | 328,504 | | | (274,026) | | | 54,478 |
| Global X PropTech ETF | | | 2,668,930 | | | 274,425 | | | (119,813) | | | 154,612 |
| Global X Carbon Credits Strategy ETF | | | 1,408,870 | | | 8,936 | | | (98,904) | | | (89,968) |
| Global X Defense Tech ETF | | | 4,404,778 | | | 298,828 | | | (20,611) | | | 278,217 |
The difference between book-basis and tax-basis unrealized appreciation (depreciation) is due to differences in the timing of recognition of gains and losses on investments for tax and book purposes. The Funds’ net unrealized appreciation difference is attributable primarily to wash sales, mark-to-market treatment of passive foreign investment companies and partnership adjustments.
8. CONCENTRATION OF RISKS
The Funds invest in securities of foreign issuers in various countries. These investments may involve certain considerations and risks not typically associated with investments in the United States as a result of, among other factors, the possibility of future political and economic developments and the level of governmental supervision and regulation of securities markets in the respective countries.
The Funds may invest in companies focused on business activities in emerging economic themes. Such thematic companies typically face intense competition and potentially rapid product obsolescence. Thematic companies may have limited product lines, markets, financial resources or personnel. These companies typically engage in significant amounts of spending on research and development, capital expenditures and mergers and acquisitions, and there is no guarantee that the products or services produced by these companies will be successful. These companies are also frequently dependent on intellectual property rights and may be adversely affected by loss or impairment of those rights. There can be no assurance these companies will be able to successfully protect their intellectual property to prevent the misappropriation of their technology, or that competitors will not develop technology that is substantially similar or superior to such companies’ technology. Such companies may be potential targets for cyberattacks, which can have a materially adverse impact on the performance of these companies. The emergent nature of many economic
271
Notes to Financial Statements/Notes to Consolidated Financial Statements (Continued)
November 30, 2023
8. CONCENTRATION OF RISKS (continued)
themes could result in increasing regulatory scrutiny in the future, which may impede the growth of companies that develop and/or focus on such economic themes. Similarly, the collection of data from consumers and other sources is frequently a critical component in emerging economic themes which could lead to increased scrutiny as regulators consider how the data is collected, stored, safeguarded and used. Finally, these companies may be involved in young, fast evolving industries with increased exposure to the risks associated with changes in applicable laws (including regulation, other rule changes, and related federal and state enforcement activities), as well as market developments, which may cause businesses to contract or close suddenly and negatively impact the value of these companies.
Special Risk Considerations of Investing in China – Variable Interest Entity Investments. For purposes of raising capital offshore on exchanges outside of China, including on U.S. exchanges, many Chinese-based operating companies are structured as Variable Interest Entities (“VIEs”). In this structure, the Chinese-based operating company is the VIE and establishes a shell company in a foreign jurisdiction, such as the Cayman Islands. The shell company lists on a foreign exchange and enters into contractual arrangements with the VIE. This structure allows Chinese companies in which the government restricts foreign ownership to raise capital from foreign investors. While the shell company has no equity ownership of the VIE, these contractual arrangements permit the shell company to consolidate the VIE’s financial statements with its own for accounting purposes and provide for economic exposure to the performance of the underlying Chinese operating company. Therefore, an investor in the listed shell company, such as certain of the Funds, will have exposure to the Chinese-based operating company only through contractual arrangements and has no ownership in the Chinese-based operating company. Furthermore, because the shell company only has specific rights provided for in these service agreements with the VIE, its abilities to control the activities at the Chinese-based operating company are limited and the operating company may engage in activities that negatively impact investment value. While the VIE structure has been widely adopted, it is not formally recognized under Chinese law and therefore there is a risk that the Chinese government could prohibit the existence of such structures or negatively impact the VIE’s contractual arrangements with the listed shell company by declaring them invalid. If these contracts were found to be unenforceable under Chinese law, investors in the listed shell company, such as the Fund, may suffer significant losses with little or no recourse available. If the Chinese government determines that the agreements establishing the VIE structures do not comply with Chinese law and regulations, including those related to restrictions on foreign ownership, it could subject a Chinese-based issuer to penalties, revocation of business and operating licenses, or forfeiture of ownership interest. In addition, the listed shell company’s control over a VIE may also be jeopardized if a natural person who holds the equity interest in the VIE breaches the terms of the agreement, is subject to legal proceedings or if any physical instruments for authenticating documentation, such as chops and seals, are used without the Chinese-based issuer’s authorization to enter into contractual arrangements
272
Notes to Financial Statements/Notes to Consolidated Financial Statements (Continued)
November 30, 2023
8. CONCENTRATION OF RISKS (continued)
in China. Chops and seals, which are carved stamps used to sign documents, represent a legally binding commitment by the company. Moreover, any future regulatory action may prohibit the ability of the shell company to receive the economic benefits of the Chinese based operating company, which may cause the value of a Fund’s investment in the listed shell company to suffer a significant loss. For example, in 2021, the Chinese government prohibited use of the VIE structure for investment in after-school tutoring companies. There is no guarantee that the government will not place similar restrictions on other industries.
These actions, any future sanctions or other actions, or even the threat of further sanctions or other actions, may negatively affect the value and liquidity of certain of the Funds’ investments. For example, a Fund may be prohibited from investing in securities issued by companies subject to such sanctions. In addition, sanctions may require a Fund to freeze its existing investments, prohibiting such Fund from buying, selling or otherwise transacting in these investments.
Each Fund may be subject to taxes imposed by countries in which they invest. Such taxes are generally based on either income or gains earned or repatriated. The Funds accrue and apply such taxes to net investment income, net realized gains and net unrealized gains as income and/or capital gains are earned.
The Funds (other than the Global X Cannabis ETF) use a replication strategy. A replication strategy is an indexing strategy that involves investing in the securities of the underlying index in approximately the same proportions as in the underlying index. The Funds may utilize a representative sampling strategy with respect to their underlying index when a replication strategy might be detrimental to their shareholders, such as when there are practical difficulties or substantial costs involved in compiling a portfolio of equity securities to follow its underlying index, or, in certain instances, when securities in the underlying index become temporarily illiquid, unavailable or less liquid, or due to legal restrictions (such as diversification requirements that apply to the Funds but not to the underlying indexes).
Commodity related securities are susceptible to fluctuations in certain commodity markets. Any negative changes in commodity markets could have a substantial impact on these Funds.
Certain Funds may have investments in financial instruments that utilize the London Interbank Offered Rate (“LIBOR”) as the reference or benchmark rate for variable interest rate calculations. LIBOR was intended to measure the rate generally at which banks can lend and borrow from one another in the relevant currency on an unsecured basis. The UK Financial Conduct Authority (“FCA”), the regulator that oversees LIBOR, announced that the majority of LIBOR rates would cease to be published or would no longer be representative on January 1, 2022. The publication of most LIBOR rates ceased at the end of 2021, and the remaining USD LIBOR rates ceased to be published after June 2023. There
273
Notes to Financial Statements/Notes to Consolidated Financial Statements (Continued)
November 30, 2023
8. CONCENTRATION OF RISKS (continued)
remains uncertainty and risks relating to the continuing LIBOR transition and its effects on the Funds and the instruments in which the Funds invest. There can be no assurance that the composition or characteristics of any alternative reference rates (“ARRs”) or financial instruments in which the Funds invest that utilize ARRs will be similar to or produce the same value or economic equivalence as LIBOR or that these instruments will have the same volume or liquidity. Additionally, there remains uncertainty and risks relating to certain “legacy” USD LIBOR instruments that were issued or entered into before December 31, 2021 and the process by which a replacement interest rate will be identified and implemented into these instruments when USD LIBOR is ultimately discontinued. On December 16, 2022, the Federal Reserve Board adopted regulations implementing the Adjustable Interest Rate Act. The regulations provide a statutory fallback mechanism to replace LIBOR, by identifying benchmark rates based on the Secured Overnight Financing Rate (“SOFR”) that replaced LIBOR in certain financial contracts after June 30, 2023. These regulations apply only to contracts governed by U.S. law, among other limitations. The Funds may have instruments linked to other interbank offered rates that may also cease to be published in the future. The effects of such uncertainty and risks in “legacy” USD LIBOR instruments held by the Funds could result in losses to the Funds.
Economic conditions, such as volatile currency exchange rates and interest rates, political events, military action and other conditions may, without prior warning, lead to foreign government intervention (including intervention by the U.S. Government with respect to foreign governments, economic sectors, foreign companies and related securities and interests) and the imposition of capital controls (i.e., government measures designed to limit the flow of foreign capital in and out of the domestic economy) and/or sanctions, which may also include retaliatory actions of one government against another government, such as the seizure of assets. Capital controls and/or sanctions include the prohibition of, or restrictions on, the ability to transfer currency, securities or other assets. Capital controls and/or sanctions may also impact the ability of a Fund to buy, sell or otherwise transfer securities or currency, negatively impact the value and/or liquidity of such instruments, adversely affect the trading market and price for Shares of a Fund, and cause a Fund to decline in value.
Please refer to each Fund’s prospectus and statement of additional information (“SAI”) for a more complete description of risks.
9. LOANS OF PORTFOLIO SECURITIES
Each Fund may lend portfolio securities having a market value up to one-third of its total assets. Security loans made pursuant to securities lending agreements with BBH and BNY Mellon are initially required to be secured by collateral equal to at least 102% of the value of domestic equity securities and American Depositary Receipts (“ADRs”) and 105% of the value of foreign equity securities (other than ADRs). Such collateral received in connection with these loans will be cash and can be invested in repurchase
274
Notes to Financial Statements/Notes to Consolidated Financial Statements (Continued)
November 30, 2023
9. LOANS OF PORTFOLIO SECURITIES (continued)
agreements, short-term investments, or U.S. Treasury obligations and is recognized in the Schedules of Investments/Consolidated Schedule of Investments and Statements of Assets and Liabilities/Consolidated Statement of Asset and Liabilities. The obligation to return securities lending collateral is also recognized as a liability in the Statements of Assets and Liabilities/Consolidated Statement of Asset and Liabilities. It is the Funds’ policy to obtain additional collateral from or return excess collateral to the borrower by the end of the next business day, following the valuation date of the securities loaned. Therefore, the value of the collateral held may be temporarily less than the value of the securities on loan.
Securities pledged as collateral for repurchase agreements held in Global X FinTech ETF, Global X Internet of Things ETF, Global X Artificial Intelligence & Technology ETF, Global X Genomics & Biotechnology ETF, Global X Cannabis ETF, Global X Thematic Growth ETF, Global X Video Games & Esports ETF, Global X Cybersecurity ETF, Global X CleanTech ETF, Global X Blockchain ETF, Global X Solar ETF and Global X Wind Energy ETF are held by BNY and are designated as being held on the Fund’s behalf under a book-entry system. The Funds monitor the adequacy of the collateral on a daily basis and can require the seller to provide additional collateral in the event the market value of the securities pledged falls below the carrying value of the repurchase agreement, including accrued interest. It is the Funds’ policy to only enter into repurchase agreements with banks and other financial institutions which are deemed by the Adviser to be creditworthy. The Funds bear the risk of loss in the event the other party to a repurchase agreement defaults on its obligations and the Fund is prevented from exercising its rights to dispose of the underlying securities received as collateral and the risk of a possible decline in the value of the underlying securities during the period. For financial statement purposes, the Funds record the securities lending collateral (including in repurchase agreements, at value or restricted cash) as an asset and the obligation to return securities lending collateral as a liability on the Statements of Assets and Liabilities.
Cash collateral received in connection with securities lending is invested in repurchase agreements and short-term investments by the lending agent. The Funds do not have effective control of the non-cash collateral and therefore it is not disclosed in the Fund’s Schedule of Investments.
Securities lending transactions are entered into by the Funds under the Securities Lending Agreement, which permits a Fund, under certain circumstances such as an event of default, to offset amounts payable by the Fund to the same counterparty against amounts receivable from the counterparty to create a net payment due to or from the Fund.
The following is a summary of securities lending agreements held by the Funds, with cash collateral of overnight maturities and non-cash collateral, which would be subject to offset as of November 30, 2023.
275
Notes to Financial Statements/Notes to Consolidated Financial Statements (Continued)
November 30, 2023
9. LOANS OF PORTFOLIO SECURITIES (continued)
| | | Gross Amount
of Recognized
Assets (Value
of Securities on
Loan) | | Value of
Cash
Collateral
Received(1) | | Value of
Non-Cash
Collateral
Received(1) | | Net Amount |
| Global X Millennial Consumer ETF | | $ | 32,592 | | | $ | 32,592 | | | $ | — | | | $ | — | |
| Global X Robotics & Artificial Intelligence ETF | | | 81,818,095 | | | | 81,818,095 | | | | — | | | | — | |
| Global X FinTech ETF | | | 8,549,815 | | | | 6,924,833 | | | | 1,624,982 | | | | — | |
| Global X Internet of Things ETF | | | 1,242,244 | | | | 1,242,244 | | | | — | | | | — | |
| Global X Autonomous & Electric Vehicles ETF | | | 57,928,613 | | | | 57,928,613 | | | | — | | | | — | |
| Global X Artificial Intelligence & Technology ETF | | | 2,961,248 | | | | 1,426,776 | | | | 1,534,472 | | | | — | |
| Global X Genomics & Biotechnology ETF | | | 3,790,397 | | | | 3,790,397 | | | | — | | | | — | |
| Global X Cloud Computing ETF | | | 973,636 | | | | 973,636 | | | | — | | | | — | |
| Global X Cannabis ETF | | | 2,101,655 | | | | 2,101,655 | | | | — | | | | — | |
| Global X Thematic Growth ETF | | | 519,603 | | | | 519,603 | | | | — | | | | — | |
| Global X Video Games & Esports ETF | | | 7,200,617 | | | | 7,102,973 | | | | 97,644 | | | | — | |
| Global X Cybersecurity ETF | | | 13,011,695 | | | | 13,011,695 | | | | — | | | | — | |
| Global X CleanTech ETF | | | 10,058,238 | | | | 8,867,386 | | | | 1,190,852 | | | | — | |
| Global X Blockchain ETF | | | 15,198,593 | | | | 15,198,593 | | | | — | | | | — | |
| Global X Solar ETF | | | 37,976 | | | | 37,976 | | | | — | | | | — | |
| Global X Wind Energy ETF | | | 54,740 | | | | 54,740 | | | | — | | | | — | |
| (1) | Collateral and non-cash collateral received in excess of market value of securities on loan is not presented in this table. The total cash collateral received by the Fund is disclosed in the Statements of Assets and Liabilities. |
The value of loaned securities and related collateral outstanding at November 30, 2023 are shown in the Schedules of Investments. The value of the collateral held may be temporarily less than that required under the lending contract. As of November 30, 2023, the cash collateral was invested in repurchase agreements and the non-cash collateral consisted of U.S. Treasury Bills, Notes, Bonds and U.S. Treasury Inflation Indexed Bonds with the following maturities:
276
Notes to Financial Statements/Notes to Consolidated Financial Statements (Continued)
November 30, 2023
9. LOANS OF PORTFOLIO SECURITIES (continued)
| | | Overnight and
Continuous | | | <30 Days | | | Between
30 & 90
Days | | | >90 Days | | | Total | |
| Global X Millennial Consumer ETF | | | | | | | | | | | | | | | | | | | | |
| Repurchase Agreements | | $ | 25,528 | | | | $— | | | | $— | | | | $— | | | | $25,528 | |
| Total | | $ | 25,528 | | | | $— | | | | $— | | | | $— | | | | $25,528 | |
| Global X Robotics & Artificial Intelligence ETF | | | | | | | | | | | | | | | | | | | | |
| Repurchase Agreements | | $ | 66,117,002 | | | | $— | | | | $— | | | | $— | | | | $66,117,002 | |
| Total | | $ | 66,117,002 | | | | $— | | | | $— | | | | $— | | | | $66,117,002 | |
| Global X FinTech ETF | | | | | | | | | | | | | | | | | | | | |
| Repurchase Agreements | | $ | 7,247,277 | | | | $— | | | | $— | | | | $— | | | | $7,247,277 | |
| U.S. Government Securities | | | — | | | | — | | | | 613 | | | | 1,624,369 | | | | 1,624,982 | |
| Total | | $ | 7,247,277 | | | | $— | | | | $613 | | | | $1,624,369 | | | | $8,872,259 | |
| Global X Internet of Things ETF | | | | | | | | | | | | | | | | | | | | |
| Repurchase Agreements | | $ | 1,366,862 | | | | $— | | | | $— | | | | $— | | | | $1,366,862 | |
| Total | | $ | 1,366,862 | | | | $— | | | | $— | | | | $— | | | | $1,366,862 | |
| Global X Autonomous & Electric Vehicles ETF | | | | | | | | | | | | | | | | | | | | |
| Repurchase Agreements | | $ | 46,594,943 | | | | $— | | | | $— | | | | $— | | | | $46,594,943 | |
| Total | | $ | 46,594,943 | | | | $— | | | | $— | | | | $— | | | | $46,594,943 | |
| Global X Artificial Intelligence & Technology ETF | | | | | | | | | | | | | | | | | | | | |
| Repurchase Agreements | | $ | 1,496,891 | | | | $— | | | | $— | | | | $— | | | | $1,496,891 | |
| U.S. Government Securities | | | — | | | | 51,524 | | | | 54,706 | | | | 1,428,242 | | | | 1,534,472 | |
| Total | | $ | 1,496,891 | | | | $51,524 | | | | $54,706 | | | | $1,428,242 | | | | $3,031,363 | |
| Global X Genomics & Biotechnology ETF | | | | | | | | | | | | | | | | | | | | |
| Repurchase Agreements | | $ | 4,034,834 | | | | $— | | | | $— | | | | $— | | | | $4,034,834 | |
| Total | | $ | 4,034,834 | | | | $— | | | | $— | | | | $— | | | | $4,034,834 | |
| Global X Cloud Computing ETF | | | | | | | | | | | | | | | | | | | | |
| Repurchase Agreements | | $ | 783,762 | | | | $— | | | | $— | | | | $— | | | | $783,762 | |
| Total | | $ | 783,762 | | | | $— | | | | $— | | | | $— | | | | $783,762 | |
| Global X Cannabis ETF | | | | | | | | | | | | | | | | | | | | |
| Repurchase Agreements | | $ | 2,766,741 | | | | $— | | | | $— | | | | $— | | | | $2,766,741 | |
| Total | | $ | 2,766,741 | | | | $— | | | | $— | | | | $— | | | | $2,766,741 | |
| Global X Thematic Growth ETF | | | | | | | | | | | | | | | | | | | | |
| Repurchase Agreements | | $ | 532,394 | | | | $— | | | | $— | | | | $— | | | | $532,394 | |
| Total | | $ | 532,394 | | | | $— | | | | $— | | | | $— | | | | $532,394 | |
277
Notes to Financial Statements/Notes to Consolidated Financial Statements (Continued)
November 30, 2023
9. LOANS OF PORTFOLIO SECURITIES (continued)
| | | Overnight and
Continuous | | | <30 Days | | | Between
30 & 90
Days | | | >90 Days | | | Total | |
| Global X Video Games & Esports ETF | | | | | | | | | | | | | | | | | | | | |
| Repurchase Agreements | | $ | 7,389,888 | | | | $— | | | | $— | | | | $— | | | | $7,389,888 | |
| U.S. Government Securities | | | — | | | | — | | | | — | | | | 97,644 | | | | 97,644 | |
| Total | | $ | 7,389,888 | | | | $— | | | | $— | | | | $97,644 | | | | $7,487,532 | |
| Global X Cybersecurity ETF | | | | | | | | | | | | | | | | | | | | |
| Repurchase Agreements | | $ | 13,736,247 | | | | $— | | | | $— | | | | $— | | | | $13,736,247 | |
| Total | | $ | 13,736,247 | | | | $— | | | | $— | | | | $— | | | | $13,736,247 | |
| Global X CleanTech ETF | | | | | | | | | | | | | | | | | | | | |
| Repurchase Agreements | | $ | 9,047,149 | | | | $— | | | | $— | | | | $— | | | | $9,047,149 | |
| U.S. Government Securities | | | — | | | | 9,973 | | | | 21,810 | | | | 1,159,069 | | | | 1,190,852 | |
| Total | | $ | 9,047,149 | | | | $9,973 | | | | $21,810 | | | | $1,159,069 | | | | $10,238,001 | |
| Global X Blockchain ETF | | | | | | | | | | | | | | | | | | | | |
| Repurchase Agreements | | $ | 17,071,665 | | | | $— | | | | $— | | | | $— | | | | $17,071,665 | |
| Total | | $ | 17,071,665 | | | | $— | | | | $— | | | | $— | | | | $17,071,665 | |
| Global X Solar ETF | | | | | | | | | | | | | | | | | | | | |
| Repurchase Agreements | | $ | 40,476 | | | | $— | | | | $— | | | | $— | | | | $40,476 | |
| Total | | $ | 40,476 | | | | $— | | | | $— | | | | $— | | | | $40,476 | |
| Global X Wind Energy ETF | | | | | | | | | | | | | | | | | | | | |
| Repurchase Agreements | | $ | 57,383 | | | | $— | | | | $— | | | | $— | | | | $57,383 | |
| Total | | $ | 57,383 | | | | $— | | | | $— | | | | $— | | | | $57,383 | |
10. CONTRACTUAL OBLIGATIONS
The Funds enter into contracts in the normal course of business that contain a variety of indemnifications. The Funds’ maximum exposure under these contracts is unknown. However, the Funds have not had prior gains or losses pursuant to these contracts. Management has reviewed the Funds’ existing contracts and expects the risk of loss to be remote.
Pursuant to the Trust’s organizational documents, the Trustees of the Trust and the Trust’s officers are indemnified against certain liabilities that may arise out of the performance of their duties.
11. REVERSE SHARE SPLIT
Effective June 10, 2022, the Global X Cannabis ETF executed a one to six (1:6) reverse share split for shareholders of record after the close of markets on June 10, 2022. The effect of this transaction was to divide the number of outstanding Shares of the Fund by six, resulting in a corresponding increase in the NAV per Share. The capital share activity
278
Notes to Financial Statements/Notes to Consolidated Financial Statements (Concluded)
November 30, 2023
11. REVERSE SHARE SPLIT (continued)
presented in the Statement of Changes in Net Assets for each of the years in the period then ended, and per share data in the financial highlights for each of the years in the period then ended, have been given retroactive effect to reflect these reverse share splits. There were no changes in net assets, results of operations or total return as a result of this transaction.
Effective December 19, 2022, the Board of the Trust approved a reverse share split at the ratio of one to four (1:4) of the issued and outstanding shares of the Global X Blockchain ETF (the “Reverse Share Split”). The Reverse Share Split was completed after the close of business on December 19, 2022. The effect of this transaction for the Fund was to divide the number of outstanding Shares of the Fund by a one to four ratio, resulting in a corresponding increase in the NAV per Share. The capital share activity presented on the Statement of Changes in Net Assets for each of the years in the period then ended, and the per share data in the financial highlights for each of the years in the period then ended have been given retroactive effect to reflect this reverse share split. There were no changes in net assets, results of operations or total return as a result of this transaction.
12. SUBSEQUENT EVENTS
The Funds have been evaluated by management regarding the need for additional disclosures and/or adjustments resulting from subsequent events.
In preparing these financial statements, management has evaluated the need for additional disclosures and/or adjustments resulting from subsequent events through the date the financial statements were issued. On January 19, 2024, the Board approved the liquidation of the Global X Health & Wellness ETF, Global X Green Building ETF, Global X China Biotech Innovation ETF, Global X Cannabis ETF, Global X Metaverse ETF and Global X Carbon Credits Strategy ETF. The Funds will be liquidated on or about February 23, 2024.
Based on this evaluation, no additional adjustments were required to the financial statements.
279
Report of Independent Registered Public Accounting Firm
To the Board of Trustees of Global X Funds and Shareholders of each of the Funds listed in the table below
Opinions on the Financial Statements
We have audited the accompanying statements of assets and liabilities, including the schedules of investments, of each of the funds listed in the table below (thirty of the funds constituting Global X Funds, hereafter collectively referred to as the “Funds”) as of November 30, 2023, the related statements of operations and of changes in net assets for each of the periods indicated in the table below, including the related notes, and the financial highlights for each of the periods indicated in the table below (collectively referred to as the “financial statements”). In our opinion, the financial statements present fairly, in all material respects, the financial position of each of the Funds as of November 30, 2023, the results of each of their operations, the changes in each of their net assets and each of the financial highlights for each of the periods indicated in the table below, in conformity with accounting principles generally accepted in the United States of America.
| Global X Aging Population ETF (1) | Global X CleanTech ETF (6) |
| Global X Artificial Intelligence & Technology ETF (1) | Global X Data Center REITs & Digital Infrastructure ETF (6) |
| Global X Autonomous & Electric Vehicles ETF (1) | Global X China Biotech Innovation ETF (7) |
| Global X Health & Wellness ETF (1) | Global X Telemedicine & Digital Health ETF (8) |
| Global X Internet of Things ETF (1) | Global X AgTech & Food Innovation ETF (9) |
| Global X Millennial Consumer ETF (1) | Global X Blockchain ETF (9) |
| Global X FinTech ETF (1) | Global X Hydrogen ETF (9) |
| Global X Robotics & Artificial Intelligence ETF (1) | Global X Solar ETF (10) |
| Global X U.S. Infrastructure Development ETF (1) | Global X Wind Energy ETF (10) |
| Global X Thematic Growth ETF (2) | Global X Clean Water ETF (11) |
| Global X Cybersecurity ETF (2) | Global X Green Building ETF (12) |
| Global X Video Games & Esports ETF (2) | Global X Metaverse ETF (13) |
| Global X Cannabis ETF (3) | Global X Carbon Credits Strategy ETF (14) |
| Global X Cloud Computing ETF (4) | Global X PropTech ETF (15) |
| Global X Genomics & Biotechnology ETF (5) | Global X Defense Tech ETF (16) |
280
Report of Independent Registered Public Accounting Firm
| 1. | Statements of operations for the year ended November 30, 2023, statements of changes in net assets for each of the two years in the period ended November 30, 2023 and the financial highlights for each of the five years in the period ended November 30, 2023. |
| 2. | Statements of operations for the year ended November 30, 2023, statements of changes in net assets for each of the two years in the period ended November 30, 2023 and the financial highlights for each of the four years in the period ended November 30, 2023 and for the period October 25, 2019 (commencement of operations) through November 30, 2019. |
| 3. | Statement of operations for the year ended November 30, 2023, statement of changes in net assets for each of the two years in the period ended November 30, 2023 and the financial highlights for each of the four years in the period ended November 30, 2023 and for the period September 17, 2019 (commencement of operations) through November 30, 2019. |
| 4. | Statement of operations for the year ended November 30, 2023, statement of changes in net assets for each of the two years in the period ended November 30, 2023 and the financial highlights for each of the four years in the period ended November 30, 2023 and for the period April 12, 2019 (commencement of operations) through November 30, 2019. |
| 5. | Statement of operations for the year ended November 30, 2023, statement of changes in net assets for each of the two years in the period ended November 30, 2023 and the financial highlights for each of the four years in the period ended November 30, 2023 and for the period April 5, 2019 (commencement of operations) through November 30, 2019. |
| 6. | Statements of operations for the year ended November 30, 2023, statements of changes in net assets for each of the two years in the period ended November 30, 2023 and the financial highlights for each of the three years in the period ended November 30, 2023 and for the period October 27, 2020 (commencement of operations) through November 30, 2020. |
| 7. | Statement of operations for the year ended November 30, 2023, statement of changes in net assets for each of the two years in the period ended November 30, 2023 and the financial highlights for each of the three years in the period ended November 30, 2023 and for the period September 22, 2020 (commencement of operations) through November 30, 2020. |
| 8. | Statement of operations for the year ended November 30, 2023, statement of changes in net assets for each of the two years in the period ended November 30, 2023 and the financial highlights for each of the three years in the period ended November 30, 2023 and for the period July 29, 2020 (commencement of operations) through November 30, 2020. |
| 9. | Statements of operations for the year ended November 30, 2023, statements of changes in net assets for each of the two years in the period ended November 30, 2023 and the financial highlights for each of the two years in the period ended November 30, 2023 and for the period July 12, 2021 (commencement of operations) through November 30, 2021. |
| 10. | Statements of operations for the year ended November 30, 2023, statements of changes in net assets for each of the two years in the period ended November 30, 2023 and the financial highlights for each of the two years in the period ended November 30, 2023 and for the period September 8, 2021 (commencement of operations) through November 30, 2021. |
| 11. | Statement of operations for the year ended November 30, 2023, statement of changes in net assets for each of the two years in the period ended November 30, 2023 and the financial highlights for each of the two years in the period ended November 30, 2023 and for the period April 8, 2021 (commencement of operations) through November 30, 2021. |
| 12. | Statement of operations for the year ended November 30, 2023, statement of changes in net assets and the financial highlights for the year ended November 30, 2023 and for the period April 11, 2022 (commencement of operations) through November 30, 2022. |
| 13. | Statement of operations for the year ended November 30, 2023, statement of changes in net assets and the financial highlights for the year ended November 30, 2023 and for the period April 26, 2022 (commencement of operations) through November 30, 2022. |
281
Report of Independent Registered Public Accounting Firm
| 14. | Consolidated statements of operations and of changes in net assets and the consolidated financial highlights for the period May 24, 2023 (commencement of operations) through November 30, 2023. |
| 15. | Statements of operations and of changes in net assets and the financial highlights for the period April 11, 2023 (commencement of operations) through November 30, 2023. |
| 16. | Statements of operations and of changes in net assets and the financial highlights for the period September 11, 2023 (commencement of operations) through November 30, 2023. |
Basis for Opinions
These financial statements are the responsibility of the Funds’ management. Our responsibility is to express an opinion on the Funds’ financial statements based on our audits. We are a public accounting firm registered with the Public Company Accounting Oversight Board (United States) (PCAOB) and are required to be independent with respect to the Funds in accordance with the U.S. federal securities laws and the applicable rules and regulations of the Securities and Exchange Commission and the PCAOB.
We conducted our audits of these financial statements in accordance with the standards of the PCAOB. Those standards require that we plan and perform the audit to obtain reasonable assurance about whether the financial statements are free of material misstatement, whether due to error or fraud.
Our audits included performing procedures to assess the risks of material misstatement of the financial statements, whether due to error or fraud, and performing procedures that respond to those risks. Such procedures included examining, on a test basis, evidence regarding the amounts and disclosures in the financial statements. Our audits also included evaluating the accounting principles used and significant estimates made by management, as well as evaluating the overall presentation of the financial statements. Our procedures included confirmation of securities owned as of November 30, 2023, by correspondence with the custodians, transfer agent, and brokers; when replies were not received from brokers, we performed other auditing procedures. We believe that our audits provide a reasonable basis for our opinions.
/s/PricewaterhouseCoopers LLP
Philadelphia, Pennsylvania
February 8, 2024
We have served as the auditor of one or more investment companies in Global X Funds since 2016.
282
Disclosure of Fund Expenses (unaudited)
ETFs (such as the Funds) have operating expenses. As a shareholder of an ETF, your investment is affected by these ongoing costs, which include (among others) costs for ETF management, administrative services, brokerage fees, and shareholder reports like this one. It is important for you to understand the impact of these costs on your investment returns. In addition, a shareholder is responsible for brokerage fees as a result of the shareholder’s investment in a Fund.
Operating expenses such as these are deducted from a Fund’s gross income and directly reduce your final investment returns. These expenses are expressed as a percentage of the Fund’s average net assets; this percentage is known as the Fund’s expense ratio.
The following examples use the expense ratio and are intended to help you understand the ongoing costs (in dollars) of investing in a Fund and to compare these costs with those of other funds. The examples are based on an investment of $1,000 made at the beginning of the period shown and held for the entire period from June 1, 2023 to November 30, 2023.
The table on the next page illustrates the Funds’ costs in two ways:
Actual Fund Return. This section helps you to estimate the actual expenses that your Fund incurred over the period. The “Expenses Paid During Period” column shows the actual dollar expense cost incurred by a $1,000 investment in the Fund, and the “Ending Account Value” number is derived from deducting that expense cost from the Fund’s gross investment return.
You can use this information, together with the actual amount you invested in a Fund, to estimate the expenses you paid over that period. Simply divide your actual account value by $1,000 to arrive at a ratio (for example, an $8,600 account value divided by $1,000 = 8.6), then multiply that ratio by the number shown for your Fund under “Expenses Paid During Period.”
Hypothetical 5% Return. This section helps you compare your Fund’s costs with those of other funds. It assumes that the Fund had an annual 5% return before expenses during the year, but that the expense ratio (Column 3) for the period is unchanged. This example is useful in making comparisons because the Securities and Exchange Commission requires all funds to make this 5% calculation. You can assess your Fund’s comparative cost by comparing the hypothetical result for your Fund in the “Expenses Paid During Period” column with those that appear in the same charts in the shareholder reports for other funds.
NOTE: Because the return is set at 5% for comparison purposes — NOT your Fund’s actual return — the account values shown may not apply to your specific investment.
283
Disclosure of Fund Expenses (unaudited) (Continued)
| | | Beginning
Account Value
6/1/2023 | | Ending
Account
Value
11/30/2023 | | Annualized
Expense
Ratios | | Expenses
Paid During
Period(1) |
| Global X Millennial Consumer ETF | | | | | | | | | | | | |
| Actual Fund Return | | $ | 1,000.00 | | | $ | 966.40 | | | | 0.50 | % | | $ | 2.46 | |
| Hypothetical 5% Return | | | 1,000.00 | | | | 1,022.56 | | | | 0.50 | | | | 2.54 | |
| | | | | | | | | | | | | | | | | |
| Global X Aging Population ETF | | | | | | | | | | | | | | | | |
| Actual Fund Return | | $ | 1,000.00 | | | $ | 888.00 | | | | 0.48 | % | | $ | 2.27 | |
| Hypothetical 5% Return | | | 1,000.00 | | | | 1,022.66 | | | | 0.48 | | | | 2.43 | |
| | | | | | | | | | | | | | | | | |
| Global X Health & Wellness ETF | | | | | | | | | | | | | | | | |
| Actual Fund Return | | $ | 1,000.00 | | | $ | 875.30 | | | | 0.44 | % | | $ | 2.07 | |
| Hypothetical 5% Return | | | 1,000.00 | | | | 1,022.86 | | | | 0.44 | | | | 2.23 | |
| | | | | | | | | | | | | | | | | |
| Global X Robotics & Artificial Intelligence ETF | | | | | | | | | | | | | | | | |
| Actual Fund Return | | $ | 1,000.00 | | | $ | 913.00 | | | | 0.69 | % | | $ | 3.31 | |
| Hypothetical 5% Return | | | 1,000.00 | | | | 1,021.61 | | | | 0.69 | | | | 3.50 | |
| | | | | | | | | | | | | | | | | |
| Global X FinTech ETF | | | | | | | | | | | | | | | | |
| Actual Fund Return | | $ | 1,000.00 | | | $ | 901.70 | | | | 0.67 | % | | $ | 3.19 | |
| Hypothetical 5% Return | | | 1,000.00 | | | | 1,021.71 | | | | 0.67 | | | | 3.40 | |
| | | | | | | | | | | | | | | | | |
| Global X Internet of Things ETF | | | | | | | | | | | | | | | | |
| Actual Fund Return | | $ | 1,000.00 | | | $ | 925.80 | | | | 0.67 | % | | $ | 3.23 | |
| Hypothetical 5% Return | | | 1,000.00 | | | | 1,021.71 | | | | 0.67 | | | | 3.40 | |
| | | | | | | | | | | | | | | | | |
| Global X U.S. Infrastructure Development ETF | | | | | | | | | | | | | | | | |
| Actual Fund Return | | $ | 1,000.00 | | | $ | 1,045.40 | | | | 0.49 | % | | $ | 2.51 | |
| Hypothetical 5% Return | | | 1,000.00 | | | | 1,022.61 | | | | 0.49 | | | | 2.48 | |
| | | | | | | | | | | | | | | | | |
| Global X Autonomous & Electric Vehicles ETF | | | | | | | | | | | | | | | | |
| Actual Fund Return | | $ | 1,000.00 | | | $ | 937.90 | | | | 0.66 | % | | $ | 3.21 | |
| Hypothetical 5% Return | | | 1,000.00 | | | | 1,021.76 | | | | 0.66 | | | | 3.35 | |
| | | | | | | | | | | | | | | | | |
| Global X Artificial Intelligence & Technology ETF | | | | | | | | | | | | | | | | |
| Actual Fund Return | | $ | 1,000.00 | | | $ | 1,102.40 | | | | 0.82 | % | | $ | 4.32 | |
| Hypothetical 5% Return | | | 1,000.00 | | | | 1,020.96 | | | | 0.82 | | | | 4.15 | |
284
Disclosure of Fund Expenses (unaudited) (Continued)
| | | Beginning
Account Value
6/1/2023 | | Ending
Account
Value
11/30/2023 | | Annualized
Expense
Ratios | | Expenses
Paid During
Period(1) |
| Global X Genomics & Biotechnology ETF | | | | | | | | |
| Actual Fund Return | | $ | 1,000.00 | | | $ | 723.30 | | | | 0.45 | % | | $ | 1.94 | |
| Hypothetical 5% Return | | | 1,000.00 | | | | 1,022.81 | | | | 0.45 | | | | 2.28 | |
| | | | | | | | | | | | | | | | | |
| Global X Cloud Computing ETF | | | | | | | | | | | | | | | | |
| Actual Fund Return | | $ | 1,000.00 | | | $ | 1,058.90 | | | | 0.68 | % | | $ | 3.51 | |
| Hypothetical 5% Return | | | 1,000.00 | | | | 1,021.66 | | | | 0.68 | | | | 3.45 | |
| | | | | | | | | | | | | | | | | |
| Global X Cannabis ETF | | | | | | | | | | | | | | | | |
| Actual Fund Return | | $ | 1,000.00 | | | $ | 787.10 | | | | 0.51 | % | | $ | 2.28 | |
| Hypothetical 5% Return | | | 1,000.00 | | | | 1,022.51 | | | | 0.51 | | | | 2.59 | |
| | | | | | | | | | | | | | | | | |
| Global X Thematic Growth ETF | | | | | | | | | | | | | | | | |
| Actual Fund Return | | $ | 1,000.00 | | | $ | 917.30 | | | | 0.50 | % | | $ | 2.40 | |
| Hypothetical 5% Return | | | 1,000.00 | | | | 1,022.56 | | | | 0.50 | | | | 2.54 | |
| | | | | | | | | | | | | | | | | |
| Global X Video Games & Esports ETF | | | | | | | | | | | | | | | | |
| Actual Fund Return | | $ | 1,000.00 | | | $ | 1,015.60 | | | | 0.50 | % | | $ | 2.53 | |
| Hypothetical 5% Return | | | 1,000.00 | | | | 1,022.56 | | | | 0.50 | | | | 2.54 | |
| | | | | | | | | | | | | | | | | |
| Global X Cybersecurity ETF | | | | | | | | | | | | | | | | |
| Actual Fund Return | | $ | 1,000.00 | | | $ | 1,102.30 | | | | 0.50 | % | | $ | 2.64 | |
| Hypothetical 5% Return | | | 1,000.00 | | | | 1,022.56 | | | | 0.50 | | | | 2.54 | |
| | | | | | | | | | | | | | | | | |
| Global X Telemedicine & Digital Health ETF | | | | | | | | | | | | | | | | |
| Actual Fund Return | | $ | 1,000.00 | | | $ | 803.40 | | | | 0.68 | % | | $ | 3.07 | |
| Hypothetical 5% Return | | | 1,000.00 | | | | 1,021.66 | | | | 0.68 | | | | 3.45 | |
| | | | | | | | | | | | | | | | | |
| Global X China Biotech Innovation ETF | | | | | | | | | | | | | | | | |
| Actual Fund Return | | $ | 1,000.00 | | | $ | 1,042.90 | | | | 0.65 | % | | $ | 3.33 | |
| Hypothetical 5% Return | | | 1,000.00 | | | | 1,021.81 | | | | 0.65 | | | | 3.29 | |
| | | | | | | | | | | | | | | | | |
| Global X CleanTech ETF | | | | | | | | | | | | | | | | |
| Actual Fund Return | | $ | 1,000.00 | | | $ | 690.90 | | | | 0.50 | % | | $ | 2.12 | |
| Hypothetical 5% Return | | | 1,000.00 | | | | 1,022.56 | | | | 0.50 | | | | 2.54 | |
285
Disclosure of Fund Expenses (unaudited) (Continued)
| | | Beginning
Account Value
6/1/2023 | | Ending
Account
Value
11/30/2023 | | Annualized
Expense
Ratios | | Expenses
Paid During
Period(1) |
| Global X Data Center REITs & Digital Infrastructure ETF | | | | | | | | |
| Actual Fund Return | | $ | 1,000.00 | | | $ | 1,109.70 | | | | 0.50 | % | | $ | 2.64 | |
| Hypothetical 5% Return | | | 1,000.00 | | | | 1,022.56 | | | | 0.50 | | | | 2.54 | |
| | | | | | | | | | | | | | | | | |
| Global X Clean Water ETF | | | | | | | | | | | | | | | | |
| Actual Fund Return | | $ | 1,000.00 | | | $ | 1,065.80 | | | | 0.50 | % | | $ | 2.59 | |
| Hypothetical 5% Return | | | 1,000.00 | | | | 1,022.56 | | | | 0.50 | | | | 2.54 | |
| | | | | | | | | | | | | | | | | |
| Global X AgTech & Food Innovation ETF | | | | | | | | | | | | | | | | |
| Actual Fund Return | | $ | 1,000.00 | | | $ | 853.80 | | | | 0.50 | % | | $ | 2.32 | |
| Hypothetical 5% Return | | | 1,000.00 | | | | 1,022.56 | | | | 0.50 | | | | 2.54 | |
| | | | | | | | | | | | | | | | | |
| Global X Blockchain ETF | | | | | | | | | | | | | | | | |
| Actual Fund Return | | $ | 1,000.00 | | | $ | 1,202.00 | | | | 0.50 | % | | $ | 2.76 | |
| Hypothetical 5% Return | | | 1,000.00 | | | | 1,022.56 | | | | 0.50 | | | | 2.54 | |
| | | | | | | | | | | | | | | | | |
| Global X Hydrogen ETF | | | | | | | | | | | | | | | | |
| Actual Fund Return | | $ | 1,000.00 | | | $ | 751.20 | | | | 0.50 | % | | $ | 2.19 | |
| Hypothetical 5% Return | | | 1,000.00 | | | | 1,022.56 | | | | 0.50 | | | | 2.54 | |
| | | | | | | | | | | | | | | | | |
| Global X Solar ETF | | | | | | | | | | | | | | | | |
| Actual Fund Return | | $ | 1,000.00 | | | $ | 655.30 | | | | 0.50 | % | | $ | 2.07 | |
| Hypothetical 5% Return | | | 1,000.00 | | | | 1,022.56 | | | | 0.50 | | | | 2.54 | |
| | | | | | | | | | | | | | | | | |
| Global X Wind Energy ETF | | | | | | | | | | | | | | | | |
| Actual Fund Return | | $ | 1,000.00 | | | $ | 794.30 | | | | 0.50 | % | | $ | 2.25 | |
| Hypothetical 5% Return | | | 1,000.00 | | | | 1,022.56 | | | | 0.50 | | | | 2.54 | |
| | | | | | | | | | | | | | | | | |
| Global X Green Building ETF | | | | | | | | | | | | | | | | |
| Actual Fund Return | | $ | 1,000.00 | | | $ | 1,118.20 | | | | 0.45 | % | | $ | 2.39 | |
| Hypothetical 5% Return | | | 1,000.00 | | | | 1,022.81 | | | | 0.45 | | | | 2.28 | |
| | | | | | | | | | | | | | | | | |
| Global X Metaverse ETF | | | | | | | | | | | | | | | | |
| Actual Fund Return | | $ | 1,000.00 | | | $ | 1,124.80 | | | | 0.50 | % | | $ | 2.66 | |
| Hypothetical 5% Return | | | 1,000.00 | | | | 1,022.56 | | | | 0.50 | | | | 2.54 | |
286
Disclosure of Fund Expenses (unaudited) (Concluded)
| | | Beginning
Account Value
6/1/2023 | | Ending
Account
Value
11/30/2023 | | Annualized
Expense
Ratios | | Expenses
Paid During
Period(1) |
| Global X PropTech ETF | | | | | | | | |
| Actual Fund Return | | $ | 1,000.00 | | | $ | 1,076.80 | | | | 0.51 | % | | $ | 2.66 | |
| Hypothetical 5% Return | | | 1,000.00 | | | | 1,022.51 | | | | 0.51 | | | | 2.59 | |
| | | | | | | | | | | | | | | | | |
| Global X Carbon Credits Strategy ETF | | | | | | | | | | | | | | | | |
| Actual Fund Return | | $ | 1,000.00 | | | $ | 942.30 | | | | 0.40 | % | | $ | 1.95 | |
| Hypothetical 5% Return | | | 1,000.00 | | | | 1,023.06 | | | | 0.40 | | | | 2.03 | |
| | | | | | | | | | | | | | | | | |
| Global X Defense Tech ETF* | | | | | | | | | | | | | | | | |
| Actual Fund Return | | $ | 1,000.00 | | | $ | 1,089.00 | | | | 0.50 | % | | $ | 1.16 | (2) |
| Hypothetical 5% Return | | | 1,000.00 | | | | 1,009.99 | | | | 0.50 | | | | 1.12 | |
| (1) | Expenses are equal to the Fund’s annualized expense ratio multiplied by the average account value over the period, multiplied by 183/365 (to reflect the one-half year period). |
| (2) | Expenses are equal to the Fund’s annualized expense ratio multiplied by the average account value over the period, multiplied by 81/365 (to reflect the period from inception to date). |
| * | The Fund commenced operations on September 11, 2023. |
287
Approval of Investment Advisory Agreement (unaudited)
Section 15(c) of the Investment Company Act of 1940, as amended (“1940 Act”), requires that the board of trustees of an exchange-traded fund (“ETF”), including a majority of those trustees who are not “interested persons” of the ETF, as defined in the 1940 Act (“Independent Trustees”), consider on an initial basis and periodically thereafter (as required by the 1940 Act), at an in person meeting called for such purpose, the terms of each ETF’s investment advisory agreement and whether to approve entering into, or renewing, each agreement.
At a Board meeting of the Global X Funds (the “Trust”) held on May 19, 2023 (the “New Fund Board Meeting”), the Board of Trustees (the “Board”) (including the Trust’s Independent Trustees, voting separately) considered and unanimously approved (i) the initial Investment Advisory Agreement (“New Investment Advisory Agreement”) for the Global X Defense Tech ETF (“New Fund”) and (ii) the initial Supervision and Administration Agreement between the Trust (“New Supervision and Administration Agreement”), on behalf of the New Fund, and Global X Management Company LLC, the Trust’s investment adviser (“Global X Management”). The New Investment Advisory Agreement and New Supervision and Administration Agreement are referred to collectively as the “New Fund Agreements.”
At a Board meeting of the Trust held on November 16, 2023, called for such purpose, the Board (including the Trust’s Independent Trustees, voting separately) considered and unanimously approved the continuation of (i) the Investment Advisory Agreement (“Renewal Investment Advisory Agreement”) for each Fund included in this Annual Report (each, a “Renewal Fund” and referred to collectively as the “Renewal Funds”); and (ii) the Supervision and Administration Agreement between the Trust (“Renewal Supervision and Administration Agreement”), on behalf of each Renewal Fund, and Global X Management. The Renewal Investment Advisory Agreement and the Renewal Supervision and Administration Agreement are referred to herein as the “Renewal Agreements.”
In advance of the November 16, 2023 Board meeting, the Board (including the Trust’s Independent Trustees) and the Independent Trustees’ independent legal counsel requested (in writing) detailed information from Global X Management in connection with the Board’s consideration of the Renewal Agreements, and received and reviewed written responses from Global X Management, as well as supporting materials relating to those requests for information. Subsequent to the receipt of that information, the Independent Trustees requested additional information regarding certain changes in senior management of Global X Management, which was provided to them in advance of the November 16, 2023 Board meeting.
At the November 16, 2023 Board meeting, the Board approved the Renewal Agreements, for the period ending February 29, 2024, in order to ensure continuity of management of the Renewal Funds. However, the Independent Trustees also determined to postpone a vote on the renewal of the Renewal Agreements for a full annual period in order to provide the Independent Trustees with the opportunity to further consider certain changes in Global X Management’s senior leadership, which occurred approximately contemporaneously with
288
Approval of Investment Advisory Agreement (unaudited) (Continued)
the Board’s consideration of the Renewal Agreements, and in order to permit Global X Management to confirm certain information provided in advance of the November 16, 2023 Board meeting. Global X Management subsequently provided additional information to the Board in advance of a second meeting called for the purpose of considering the extension of the Renewal Agreements for a full year. At a Board meeting of the Trust held on December 21, 2023, the Trust’s Board, which was comprised entirely of Independent Trustees, unanimously approved the continuation of the Renewal Agreements for an aggregate one-year period ending November 30, 2024.
In the course of their consideration of the New Fund Agreements and Renewal Agreements, the Trust’s Independent Trustees were advised by their independent legal counsel and, in addition to meetings with management of Global X Management, the Independent Trustees met separately in executive sessions with their counsel.
NEW FUND AGREEMENTS
In determining to approve the New Fund Agreements for the New Fund, the Board considered a variety of factors, including the factors discussed in greater detail below.
Nature, Extent and Quality of Services
With respect to this factor, the Board considered:
| • | the terms of the New Fund Agreements and the range of services proposed to be provided to the New Fund in accordance with the New Fund Agreements; |
| | |
| • | Global X Management’s key personnel and the portfolio managers who would provide investment advisory, supervision and administrative services to the New Fund; |
| | |
| • | Global X Management’s responsibilities under the New Fund Agreements to, among other things, (i) manage the investment operations of the New Fund and the composition of the New Funds’ assets, including the purchase, retention and disposition of its holdings, (ii) provide quarterly reports to the Trust’s officers and the Board and other reports as the Board deems necessary or appropriate, (iii) vote proxies, exercise consents, and exercise all other rights appertaining to securities and assets held by the New Fund, (iv) select broker-dealers to execute portfolio transactions for the New Fund when necessary, (v) assist in the preparation and filing of reports and proxy statements (if any) to the shareholders of the New Fund, and the periodic updating of the registration statements, prospectuses, statements of additional information, and other reports and documents for the New Fund that are required to be filed by the Trust with the U.S. Securities and Exchange Commission (“SEC”) and other regulatory or governmental bodies, and (vi) monitor anticipated purchases and redemptions of the shares (including Creation Units) of the New Fund by shareholders and new investors; |
| | |
| • | the nature, extent and quality of all of the services (including advisory, administrative and compliance services) that are proposed to be provided by Global X Management |
289
Approval of Investment Advisory Agreement (unaudited) (Continued)
| | or made available to the New Fund; and |
| | |
| • | the quality of Global X Management’s resources and personnel that would be made available to the New Fund, including Global X Management’s experience and the professional qualifications of Global X Management’s key personnel. |
Based on these considerations, the Board concluded, at the New Fund Board Meeting, that it was satisfied with the nature, extent and quality of the services proposed to be provided to the New Fund by Global X Management.
Performance
The Board determined that, because the New Fund had not yet begun investment operations as of the date of the New Fund Board Meeting, meaningful data relating to the investment performance of the New Fund was not available and, therefore, could not be a factor in approving the New Fund Agreements.
Cost of Services and Profitability
With respect to this factor, the Board considered:
| • | Global X Management’s expected costs to provide investment management, supervision and administrative and related services to each New Fund; |
| | |
| • | the management fee (including the proposed investment advisory fee) (“Management Fee”) that was proposed to be borne by each New Fund under the respective New Fund Agreement for the various investment advisory, supervisory and administrative services that the New Fund requires under a unitary fee structure (including the types of fees and expenses that are not included within the unitary fee and would be borne by the New Fund); and |
| | |
| • | the expected profitability to Global X Management, if any, from all of the services proposed to be provided to the New Fund by Global X Management and all aspects of the relationship between Global X Management and the New Fund. |
Based on these considerations, the Board concluded that the proposed Management Fee to be paid by each New Fund to Global X Management, in light of the nature, extent and quality of the services to be provided, was reasonable and in the best interests of the New Fund’s shareholders.
Comparison of Fees and Services
With respect to this factor, the Board considered:
| • | comparative information with respect to the proposed Management Fee to be paid to Global X Management by each New Fund. In connection with this consideration, Global X Management provided the Board with comparative expense data for each New Fund, including fees and expenses paid by unaffiliated similar specialized and/or |
290
Approval of Investment Advisory Agreement (unaudited) (Continued)
| | focused ETFs, and/or other similar registered funds. The Board considered Global X Management’s detailed explanation of the proposed fee structures of any New Fund that was above the average or median for the New Fund’s peer group; |
| | |
| • | the structure of the proposed unitary Management Fee (which includes as one component the proposed investment advisory fee for the New Fund) and the expected total expense ratios for the New Fund. In this regard, the Board took into consideration that the purpose of adopting a unitary Management Fee structure for the New Fund was to create a simple, all-inclusive fee that would provide a level of predictability with respect to the overall expense ratios (i.e., the total fees) of the New Fund and that the proposed Management Fee for each New Fund was set at a competitive level to make the New Fund viable in the marketplace; and |
| | |
| • | that, under the proposed unified Management Fee structure, Global X Management would be responsible for most ordinary expenses of the New Fund, including the costs of various third-party services required by the New Fund, including investment advisory, administrative, audit, certain custody, portfolio accounting, legal, transfer agency and printing costs, but that each New Fund would bear other expenses not covered under the proposed all-inclusive Management Fee, such as taxes, brokerage fees, commissions, and other transaction expenses, interest expenses, and extraordinary expenses. |
Based on these considerations, the Board concluded, at the New Fund Board Meeting, that the services to be received and the fees to be charged under the applicable New Fund Agreements were reasonable on a comparative basis.
Economies of Scale
With respect to this factor, the Board considered:
| • | the extent to which economies of scale would be realized as the New Fund grows and whether the proposed unitary Management Fees for the New Fund reflected these economies of scale; |
| | |
| • | the significant investment of time, personnel and other resources that Global X Management intends to make in the New Fund in order to seek to assure that the New Fund is attractive to investors; and |
| | |
| • | that the proposed unitary Management Fee would provide a high level of certainty as to the total level of expenses for each New Fund and its shareholders. |
Based on these considerations, the Board concluded, at the New Fund Board Meeting, that the proposed unitary Management Fees for the New Fund appropriately addressed economies of scale.
291
Approval of Investment Advisory Agreement (unaudited) (Continued)
Other Benefits
In considering each New Fund Agreement, in addition to the factors discussed above, the Board considered other benefits that may be realized by Global X Management as a result of its relationships with the New Fund. As a result, the Board concluded that, in the case of each New Fund, in the exercise of the Board’s business judgement, all information the Board considered supported approval of the applicable New Fund Agreements.
Conclusion
After full consideration of the factors above, as well as other factors that were instructive in their consideration, the Board, including all of the Trust’s Independent Trustees voting separately, concluded, in the exercise of its business judgement, that the New Fund Agreements were fair and reasonable and in the best interest of the New Fund.
In reaching this decision, the Board did not assign relative weights to the factors above nor did the Board deem any one factor or group of them to be controlling in and of themselves. Each member of the Board may have assigned different weights to the various factors.
RENEWAL AGREEMENTS
In determining to approve the continuation of the Renewal Agreements for the Renewal Funds, the Board considered a variety of factors, including the factors discussed in greater detail below.
Nature, Extent and Quality of Services
With respect to this factor, the Board considered:
| • | the terms of the Renewal Agreements and the range of services that would continue to be provided to each Renewal Fund in accordance with the Renewal Agreements; |
| | |
| • | Global X Management’s key personnel and the portfolio managers who would continue to provide investment advisory, supervision and administrative services to each Renewal Fund; |
| | |
| • | Global X Management’s responsibilities under the Renewal Agreements, among other things, to: (i) manage the investment operations of the Renewal Funds and the composition of the Renewal Funds’ assets, including the purchase, retention and disposition of their holdings, (ii) provide quarterly reports to the Trust’s officers and the Board and other reports as the Board deems necessary or appropriate, (iii) vote proxies, exercise consents, and exercise all other rights relating to securities and assets held by the Renewal Funds, (iv) select broker-dealers to execute portfolio transactions for the Renewal Funds when necessary, (v) assist in the preparation and filing of reports and proxy statements (if any) to the shareholders of the Renewal Funds, and the periodic updating of the registration statement, prospectuses, statements of additional information, and other reports and documents for the Renewal Funds that are required |
292
Approval of Investment Advisory Agreement (unaudited) (Continued)
| | to be filed by the Trust with the SEC and other regulatory and governmental bodies, and (vi) monitor anticipated purchases and redemptions of the shares (including Creation Units) of the Renewal Funds by shareholders and new investors; |
| | |
| • | the nature, extent and quality of all of the services (including advisory, administrative and compliance services) that have been provided by Global X Management or made available to the Renewal Funds; and |
| | |
| • | the quality of Global X Management’s resources and personnel that would continue to be made available to the Renewal Funds, including Global X Management’s experience and the professional qualifications of Global X Management’s key personnel. |
Based on these considerations, the Board concluded that it was satisfied with the nature, extent and quality of the services provided to the Renewal Funds by Global X Management.
Performance
The Board considered the performance of each Renewal Fund. They examined the performance of the Renewal Funds for the one-year, three-year, five-year and since-inception periods, as applicable. Also, the Board considered the total return and investments performance of the Renewal Funds relative to (i) the performance of unaffiliated comparable ETFs and/or other registered funds, which performance information is publicly available from such registered funds, as well as other third party sources; and (ii) the performance of pertinent indexes. The Board considered instances of under-performance and over-performance with respect to the competitor funds. The Board also considered the Renewal Funds’ tracking against their underlying indexes in absolute terms.
Based on these considerations and comparisons, the Board concluded that the investment performance of the Renewal Funds did not adversely affect the Board’s approval of the continuance of the Renewal Agreements.
Cost of Services and Profitability
The Board considered Global X Management’s cost to provide investment management, supervision and administrative and related services to the Renewal Funds. In this regard, the Board considered the management fee (“Management Fee”) that has been borne or is expected to be borne by the Renewal Funds under the Renewal Agreements for the various investment advisory, supervisory and administrative services that the Renewal Funds require under a unitary fee structure (including the types of fees and expenses that are not included within the unitary fee and would be borne by the Renewal Funds).
In addition, the Board considered expected profitability to Global X Management, as applicable, from all services provided or expected to be provided to the Renewal Funds and all aspects of Global X Management’s relationship with the Renewal Funds. In connection with these considerations, Global X Management provided the Board with financial information regarding its operations and the services provided to the Renewal Funds and
293
Approval of Investment Advisory Agreement (unaudited) (Continued)
discussed with the Board its current and expected, as applicable, profitability with respect to the Renewal Funds.
Based on these considerations, the Board concluded that the Management Fee rate paid by the Renewal Funds to Global X Management, in light of the nature, extent and quality of the services provided, was reasonable and in the best interests of the Renewal Funds’ shareholders.
Comparison of Fees and Services
With respect to this factor, the Board considered:
| • | comparative information with respect to the Management Fee paid to Global X Management by the Renewal Funds. In connection with this consideration, Global X Management provided the Board with comparative expense data for the Renewal Funds, including fees and expenses paid by unaffiliated similar specialized and/or focused ETFs and/or other comparable registered funds. The Board considered the Global X Management’s detailed explanation of the fee structures of any Renewal Fund that was above the average or median for its peer group; |
| | |
| • | the structure of the unitary Management Fee (which includes as one component the investment advisory fee for the Renewal Funds) and the current total expense ratios for the Renewal Funds. In this regard, the Board took into consideration that the purpose of adopting a unitary Management Fee structure for the Renewal Funds was to create a simple, all-inclusive fee that would provide a level of predictability with respect to the overall expense ratio (i.e., the total fees) of the Renewal Funds and that the proposed Management Fees for the Renewal Funds were set at a competitive levels to make the Renewal Funds viable in the marketplace; and |
| | |
| • | that, under the unified Management Fee structure, Global X Management is responsible for most ordinary expenses of the Renewal Funds, including the costs of various third-party services required by the Renewal Funds, including investment advisory, administrative, audit, certain custody, portfolio accounting, legal, transfer agency and printing costs, but that the Renewal Funds would bear other expenses not covered under the proposed all-inclusive Management Fee, such as taxes, brokerage fees, commissions, and other transaction expenses, interest expenses, and extraordinary expenses. |
Based on these considerations, the Board concluded that the services received and the fees charged under the Renewal Agreements were reasonable on a comparative basis.
Economies of Scale
With respect to this factor, the Board considered:
| • | the extent to which economies of scale would be realized as the Renewal Funds grow and whether the unitary Management Fee for the Renewal Funds reflected these |
294
Approval of Investment Advisory Agreement (unaudited) (Concluded)
| | economies of scale; |
| | |
| • | the significant investment of time, personnel and other resources that Global X Management has made and intends to continue to make in the Renewal Funds in order to seek to assure that the Renewal Funds are attractive to investors; and |
| | |
| • | that the unitary Management Fee would provide a high level of certainty as to the total level of expenses for the Renewal Funds and their shareholders. |
Based on these considerations, the Board concluded that the unitary Management Fee for the Renewal Funds appropriately addressed economies of scale.
Other Benefits
In considering the Renewal Agreements, in addition to the factors above, the Board considered any other benefits realized by Global X Management as a result of its relationships with the Renewal Funds and concluded that, in the exercise of the Board’s business judgement, all information the Board considered supported approval of the continuation of the Renewal Agreements.
Conclusion
After full consideration of the factors above, as well as other factors that were instructive in its consideration, the Board, including all of the Trust’s Independent Trustees voting separately, concluded, in the exercise of its business judgement, that the Renewal Agreements were fair and reasonable and in the best interest of each Renewal Fund.
In reaching this decision, the Board did not assign relative weights to the factors above nor did the Board deem any one factor or group of them to be controlling in and of themselves. Each member of the Board may have assigned different weights to the various factors.
295
Supplemental Information (UNAUDITED)
NAV is the price per Share at which the Funds issue and redeem Shares. It is calculated in accordance with the standard formula for valuing mutual fund shares. The “Market Price” of a Fund generally is determined using the midpoint between the highest bid and the lowest offer on the stock exchange on which the Shares of a Fund are listed for trading, as of the time that the Fund’s NAV is calculated. A Funds’ Market Price may be at, above or below its NAV. The NAV of a Fund will fluctuate with changes in the market value of the Fund’s holdings. The Market Price of a Fund will fluctuate in accordance with changes in its NAV, as well as market supply and demand.
Premiums or discounts are the differences (expressed as a percentage) between the NAV and Market Price of a Fund on a given day, generally at the time NAV is calculated. A premium is the amount that a Fund is trading above the reported NAV, expressed as a percentage of the NAV. A discount is the amount that a Fund is trading below the reported NAV, expressed as a percentage of the NAV.
Further information regarding premiums and discounts is available on the Funds’ website at www.globalxetfs.com.
296
Trustees and Officers of the Trust (UNAUDITED)
The Trustees and officers are identified in the table below, which provides information as to their principal business occupations held during the last five years and certain other information. Each Trustee serves until his or her death, resignation or removal and replacement. The Trust’s Statement of Additional Information (“SAI”) includes additional information about the Trustees and officers. The SAI may be obtained without charge by calling 1-888-493-8631. The address for all Trustees and officers is c/o Global X Funds®, 605 3rd Avenue, 43rd Floor, New York, New York 10158. The following chart lists Trustees and Officers as of December 15, 2023.
Name
(Year of Birth) | Position(s)
Held
with Trust | Principal Occupation(s) During the Past
5 Years | Number of Funds in
Trust Overseen by
Trustee4 | Other Directorships
Held by Trustees |
| Independent Trustees1,2 |
Charles A. Baker
(1953) | Trustee (since 07/2018) | Chief Executive Officer of Investment Innovations LLC (investment consulting) (since 2013); Managing Director of NYSE Euronext (2003 to 2012). | 113 funds (109 of which were operational) | Trustee of OSI ETF Trust (2016-2022). |
Susan M. Ciccarone
(1973) | Trustee (since 09/2019) | Partner, Further Global Capital Management (private equity) (since 2017); formerly Chief Operating Officer (2014-2016) and Chief Financial Officer (2012-2016), Emerging Global Advisors, LLC (ETF issuer). | 113 funds (109 of which were operational) | Director of E78 Partners (since 2022); Director of ProSight Global, Inc. (since 2021); Director of Casa Holdco LP, parent of Celink (since 2018); Chairman, Payment Alliance International, Inc. (2019-2021). |
Clifford J. Weber
(1963) | Trustee (since 07/2018) | Owner, Financial Products Consulting Group LLC (consulting services to financial institutions) (since 2015); Formerly, Executive Vice President of Global Index and Exchange-Traded Products, NYSE Market, Inc., a subsidiary of Intercontinental Exchange (ETF/ETP listing exchange) (2013- 2015). | 113 funds (109 of which were operational) | Chairman and Trustee of Clayton Street Trust (since 2016); Chairman and Trustee of Janus Detroit Street Trust (since 2016); Trustee of Clough Global Equity Fund (since 2017); Trustee of Clough Global Dividend and Income Fund (since 2017); Trustee of Clough Global Opportunities Fund (since 2017); Chairman (2017-2023) and Trustee (2015- 2023) of Clough Funds Trust; and Chairman and Trustee of Elevation ETF Trust (2016-2018). |
297
Trustees and Officers of the Trust (UNAUDITED)
Name
(Year of Birth) | Position(s)
Held
with Trust | Principal Occupation(s) During the Past
5 Years | Number of Funds in
Trust Overseen by
Trustee | Other Directorships
Held by Trustees |
| Interested Trustee/Officers1,2 |
Thomas Park
(1978) | President (since 11/2023) | Chief Executive Officer, GXMC (since 11/2023); Co-Chief Executive Officer Mirae Asset Global Investments (USA) (since 12/2022); President of Mirae Asset Global Investments (USA) (1/2020- 12/2022); and Executive Managing Director of Mirae Asset Global Investments (USA) (2011- 2022). | N/A | N/A |
Alex Ashby
(1986) | Chief Operating Officer (since 11/2023) | Head of Product Development, GXMC (since 2019); Vice President, Director of Product Development (2015 - 2018). | N/A | N/A |
Susan Lively
(1981) | Secretary (since 09/2020) | General Counsel, GXMC (since 9/2020); Senior Corporate Counsel at Franklin Templeton (previously, Managing Director and Associate General Counsel at Legg Mason & Co., LLC) (2014-2020). | N/A | N/A |
Eric Griffith3
(1969) | Assistant Secretary (since 02/2020) | Counsel, SEI Investments (since 10/2019); Vice President and Assistant General Counsel, JPMorgan Chase & Co. (2012-2018). | N/A | N/A |
Joe Costello
(1974) | Chief Compliance Officer (since 09/2016) | Chief Compliance Officer, GXMC (since 09/2016). | N/A | N/A |
Ronnie Riven
(1984) | Chief Financial Officer (since 11/2023); Treasurer and Principal Accounting Officer (since 12/2020) | Head of Finance & Business Management, GXMC (since 01/2022); Treasurer, GXMC (since 02/2022); Director of Finance, GXMC (08/2018- 12/2021); Director of Accounting and Finance at Barclays Center (2016-2018). | N/A | N/A |
Eric Olsen3
(1970) | Assistant Treasurer (since 05/2021) | Director of Accounting, SEI Investment Manager Services (March 2021 to present); Deputy Head of Fund Operations, Traditional Assets, Aberdeen Standard Investments (2013-2021). | N/A | N/A |
| 1 | Each Trustee serves until his or her successor is duly elected or appointed and qualified. |
| 2 | Luis Berruga served as an Interested Trustee of the Trust until December 15, 2023, and as President of the Trust until November 21, 2023. John Belanger served as Chief Operating Officer of the Trust and as Chief Financial Officer of the Trust until November 28, 2023. |
| 3 | These officers of the Trust also serve as officers of one or more funds for which SEI Investments Company or an affiliate acts as investment manager, administrator or distributor. |
| 4 | As of November 30, 2023. |
298
Notice to Shareholders (UNAUDITED)
For shareholders that do not have a November 30, 2023 tax year end, this notice is for informational purposes only. For shareholders with a November 30, 2023 tax year end, please consult your tax advisor as to the pertinence of this notice. For the fiscal year ended November 30, 2023, the Funds have designated the following items with regard to distributions paid during the year.
| | Return of Capital | | Long-Term
Capital
Gain
Distributions | | Ordinary Income
Distributions | | Total
Distributions | | Qualifying
for Corporate
Dividends
Received
Deduction (1) |
| Global X Millennial Consumer ETF | | | | | | |
| | | 0.00% | | 0.00% | | 100.00% | | 100.00% | | 100.00% |
| Global X Aging Population ETF | | | | | | |
| | | 0.00% | | 0.00% | | 100.00% | | 100.00% | | 58.65% |
| Global X Health & Wellness ETF | | | | | | | |
| | | 0.00% | | 0.00% | | 100.00% | | 100.00% | | 49.75% |
| Global X Robotics & Artificial Intelligence ETF | | | | | | |
| | | 0.00% | | 0.00% | | 100.00% | | 100.00% | | 13.76% |
| Global X FinTech ETF | | | | | | | | |
| | | 3.21% | | 0.00% | | 96.79% | | 100.00% | | 100.00% |
| Global X Internet of Things ETF | | | | | | |
| | | 0.00% | | 0.00% | | 100.00% | | 100.00% | | 79.28% |
| Global X U.S. Infrastructure Development ETF | | | | | | |
| | | 0.00% | | 0.00% | | 100.00% | | 100.00% | | 100.00% |
| Global X Autonomous & Electric Vehicles ETF | | | | |
| | | 0.00% | | 0.00% | | 100.00% | | 100.00% | | 39.67% |
| Global X Artificial Intelligence & Technology ETF | | | | | | | |
| | | 0.00% | | 0.00% | | 100.00% | | 100.00% | | 100.00% |
| Global X Genomics & Biotechnology ETF | | | | | | | |
| | | 0.00% | | 0.00% | | 0.00% | | 0.00% | | 0.00% |
| Global X Cloud Computing ETF | | | | | | | |
| | | 0.00% | | 0.00% | | 0.00% | | 0.00% | | 0.00% |
| Global X Cannabis ETF | | | | | | |
| | | 0.00% | | 0.00% | | 100.00% | | 100.00% | | 24.33% |
| Global X Thematic Growth ETF | | | | | | |
| | | 0.00% | | 0.00% | | 100.00% | | 100.00% | | 37.14% |
| Global X Video Games & Esports ETF | | | | | | |
| | | 0.00% | | 0.00% | | 100.00% | | 100.00% | | 12.13% |
| Global X Cybersecurity ETF | | | | | | |
| | | 0.00% | | 94.73% | | 5.27% | | 100.00% | | 100.00% |
| Global X Telemedicine & Digital Health ETF | | | | | | |
| | | 0.00% | | 0.00% | | 0.00% | | 0.00% | | 0.00% |
| Global X China Biotech Innovation ETF | | | | | | |
| | | 0.00% | | 0.00% | | 100.00% | | 100.00% | | 0.00% |
| Global X CleanTech ETF | | | | | | |
| | | 0.00% | | 0.00% | | 100.00% | | 100.00% | | 0.00% |
| Global X Data Center REITS & Digital Infrastructure ETF | | | | | | |
| | | 0.00% | | 3.33% | | 96.67% | | 100.00% | | 8.32% |
| Global X Clean Water ETF | | | | | | |
| | | 0.00% | | 0.00% | | 100.00% | | 100.00% | | 47.34% |
| Global X AgTech & Food Innovation ETF | | | | | | |
| | | 0.00% | | 0.00% | | 100.00% | | 100.00% | | 34.07% |
| Global X Blockchain ETF | | | | | | |
| | | 0.00% | | 0.00% | | 100.00% | | 100.00% | | 0.02% |
| Global X Hydrogen ETF | | | | | | |
| | | 0.00% | | 0.00% | | 0.00% | | 0.00% | | 0.00% |
| Global X Solar ETF | | | | | | |
| | | 0.00% | | 0.00% | | 0.00% | | 0.00% | | 0.00% |
| Global X Wind Energy ETF | | | | | | |
| | | 0.00% | | 0.00% | | 100.00% | | 100.00% | | 0.00% |
| Global X Green Building ETF | | | | | | |
| | | 0.00% | | 0.00% | | 100.00% | | 100.00% | | 4.65% |
| Global X Metaverse ETF | | | | | | |
| | | 0.00% | | 0.00% | | 100.00% | | 100.00% | | 4.00% |
| Global X PropTech ETF | | | | | | |
| | | 0.00% | | 0.00% | | 100.00% | | 100.00% | | 2.69% |
| Global X Carbon Credits Strategy ETF | | | | | | |
| | | 0.00% | | 0.00% | | 100.00% | | 100.00% | | 85.77% |
299
Notice to Shareholders (UNAUDITED)
| | Return of Capital | | Long-Term
Capital
Gain
Distributions | | Ordinary Income
Distributions | | Total
Distributions | | Qualifying
for Corporate
Dividends
Received
Deduction (1) |
| Global X Defense Tech ETF | | | | | | |
| | | 0.00% | | 0.00% | | 0.00% | | 0.00% | | 0.00% |
(1) Qualifying dividends represent dividends which qualify for the corporate dividends received deduction and is reflected as a percentage of ordinary income distributions (the total of short term capital gain and net investment income distributions).
300
Notice to Shareholders (UNAUDITED)
| | Qualifying
Dividend
Income (2) | | U.S. Government
Interest(3) | | Interest Related
Dividends(4) | | Short Term
Capital Gain
Dividends(5) | | Qualifying
Business
Income(6) | | Foreign Tax
Credit |
| Global X Millennial Consumer ETF | | | | | | | | | | |
| | | 100.00% | | 0.00% | | 0.51% | | 0.00% | | 0.00% | | 0.00% |
| Global X Aging Population ETF | | | | | | | | | |
| | | 100.00% | | 0.00% | | 0.23% | | 0.00% | | 0.00% | | 0.00% |
| Global X Health & Wellness ETF | | | | | | | | |
| | | 100.00% | | 0.00% | | 0.06% | | 0.00% | | 0.00% | | 9.63% |
| Global X Robotics & Artificial Intelligence ETF | | | | | | | | |
| | | 100.00% | | 0.00% | | 0.65% | | 0.00% | | 0.00% | | 0.00% |
| Global X FinTech ETF | | | | |
| | | 100.00% | | 0.00% | | 0.35% | | 0.00% | | 0.00% | | 0.00% |
| Global X Internet of Things ETF | | | | |
| | | 100.00% | | 0.00% | | 0.09% | | 0.00% | | 0.00% | | 0.00% |
| Global X U.S. Infrastructure Development ETF | | | | | | | | |
| | | 100.00% | | 0.00% | | 0.26% | | 0.00% | | 0.00% | | 0.00% |
| Global X Autonomous & Electric Vehicles ETF | | | | | | | | |
| | | 96.11% | | 0.00% | | 0.10% | | 0.00% | | 0.00% | | 0.00% |
| Global X Artificial Intelligence & Technology ETF | | | | | | | | |
| | | 100.00% | | 0.00% | | 0.12% | | 0.00% | | 0.00% | | 0.00% |
| Global X Genomics & Biotechnology ETF | | | | | | | | |
| | | 0.00% | | 0.00% | | 0.00% | | 0.00% | | 0.00% | | 0.00% |
| Global X Cloud Computing ETF | | | | |
| | | 0.00% | | 0.00% | | 0.00% | | 0.00% | | 0.00% | | 0.00% |
| Global X Cannabis ETF | | | | |
| | | 24.33% | | 0.00% | | 0.29% | | 0.00% | | 0.00% | | 0.00% |
| Global X Thematic Growth ETF | | | | |
| | | 42.84% | | 0.00% | | 0.25% | | 0.00% | | 0.00% | | 0.00% |
| Global X Video Games & Esports ETF | | | | | | | | |
| | | 96.62% | | 0.00% | | 0.13% | | 0.00% | | 0.00% | | 40.36% |
| Global X Cybersecurity ETF | | | | | | | | |
| | | 100.00% | | 0.18% | | 1.51% | | 0.00% | | 0.00% | | 0.00% |
| Global X Telemedicine & Digital Health ETF | | | | | | | | |
| | | 0.00% | | 0.00% | | 0.00% | | 0.00% | | 0.00% | | 0.00% |
| Global X China Biotech Innovation ETF | | | | | | | | |
| | | 100.00% | | 0.00% | | 0.89% | | 0.00% | | 0.00% | | 0.00% |
| Global X CleanTech ETF | | | | | | | | |
| | | 86.17% | | 0.00% | | 0.08% | | 0.00% | | 0.00% | | 0.00% |
| Global X Data Center REITS & Digital Infrastructure ETF | | | | | | | | |
| | | 21.10% | | 0.00% | | 0.34% | | 100.00% | | 0.00% | | 0.00% |
| Global X Clean Water ETF | | | | |
| | | 97.14% | | 0.06% | | 0.07% | | 0.00% | | 0.00% | | 0.00% |
| Global X AgTech & Food Innovation ETF | | | | |
| | | 88.59% | | 0.31% | | 0.36% | | 0.00% | | 0.00% | | 0.00% |
| Global X Blockchain ETF | | | | | | | | |
| | | 0.02% | | 0.00% | | 0.06% | | 0.00% | | 0.00% | | 0.00% |
| Global X Hydrogen ETF | | | | | | | | |
| | | 0.00% | | 0.00% | | 0.00% | | 0.00% | | 0.00% | | 0.00% |
| Global X Solar ETF | | | | | | | | |
| | | 0.00% | | 0.00% | | 0.00% | | 0.00% | | 0.00% | | 0.00% |
| Global X Wind Energy ETF | | | | |
| | | 100.00% | | 0.00% | | 0.78% | | 0.00% | | 0.00% | | 21.75% |
| Global X Green Building ETF | | | | | | | | |
| | | 52.83% | | 0.00% | | 0.04% | | 0.00% | | 0.00% | | 4.55% |
| Global X Metaverse ETF | | | | |
| | | 16.11% | | 0.00% | | 0.04% | | 100.00% | | 0.00% | | 0.00% |
| Global X PropTech ETF | | | | | | | | |
| | | 12.90% | | 9.83% | | 0.07% | | 0.00% | | 0.00% | | 0.00% |
| Global X Carbon Credits Strategy ETF | | | | | | | | |
| | | 83.54% | | 100.00% | | 100.00% | | 0.00% | | 0.00% | | 0.00% |
| Global X Defense Tech ETF | | | | |
| | | 0.00% | | 0.00% | | 0.00% | | 0.00% | | 0.00% | | 0.00% |
(2) The percentage in this column represents the amount of “Qualifying Dividend Income” as created by the Jobs and Growth Relief Reconciliation Act of 2003 and it is reflected as a percentage of ordinary income distributions (the total of short term capital gain and net investment income distributions). It is the intention of each of the aforementioned Funds to designate the maximum amount permitted by law.
(3) “U.S. Government Interest” represents the amount of interest that was derived from U.S. Government obligations and distributed during the fiscal year. Generally, interest from direct U.S. Government obligations is exempt from state income tax. However, for shareholders who are residents of California, Connecticut and New
301
Notice to Shareholders (UNAUDITED)
York, the statutory threshold requirements were not satisfied to permit exemption of these amounts from state income.
(4) The percentage in this column represents the amount of “Interest Related Dividends” as created by the American Jobs Creation Act of 2004 and is a percentage of net investment income that is exempt from U.S. withholding tax when paid for foreign investors.
(5) The percentage of this column represents the amount of “Short Term Capital Gain Dividend’’ and is reflected as a percentage of short term capital gain distribution that is exempted from U.S. withholding tax when paid to foreign investors.
(6) The percentage of this column represents that amount of ordinary dividend income that qualified for 20% Business Income Deduction.
The Funds intend to pass through a foreign tax credit to shareholders. For the fiscal year ended November 30, 2023, the total amount of foreign source income and foreign tax credit are as follows:
| Fund Name | | Foreign Source Income | | Foreign Tax Credit Pass
Through |
| Global X Health & Wellness ETF | | $ | 122,801 | | | $ | 20,828 | |
| Global X Video Games & Esports ETF | | | 925,226 | | | | 186,447 | |
| Global X Wind Energy ETF | | | 67,367 | | | | 13,305 | |
| Global X Green Building ETF | | | 68,811 | | | | 3,351 | |
The information reported herein may differ from the information and distributions taxable to the shareholders for the calendar year ending December 31, 2023. Complete information will be computed and reported in conjunction with your 2023 Form 1099- DIV.
302
Notes
303
605 Third Avenue, 43rd Floor
New York, NY 10158
1-888-493-8631
www.globalxetfs.com
Investment Adviser and Administrator:
Global X Management Company LLC
605 3rd Avenue, 43rd Floor
New York, NY 10158
Distributor:
SEI Investments Distribution Co.
One Freedom Valley Drive
Oaks, PA 19456
Sub-Administrator:
SEI Investments Global Funds Services
One Freedom Valley Drive
Oaks, PA 19456
Counsel for Global X Funds and the Independent Trustees:
Stradley Ronon Stevens & Young, LLP
2000 K Street, N.W.
Suite 700
Washington, DC 20006
Custodians and Transfer Agents:
Brown Brothers Harriman & Co.
40 Water Street
Boston, MA 02109
The Bank of New York Mellon
240 Greenwich Street
New York, New York 10286
Independent Registered Public Accounting Firm:
PricewaterhouseCoopers LLP
Two Commerce Square
Suite 1800
2001 Market Street
Philadelphia, PA 19103
This information must be preceded or accompanied by a current prospectus for the Funds described.
GLX-AR-007-0800
(b) Not applicable.
Item 2. Code of Ethics.
The registrant has adopted a code of ethics that applies to the registrant’s principal executive officer, principal financial officer, controller or principal accounting officer, and any person who performs a similar function.
Item 3. Audit Committee Financial Expert.
(a)(1) The registrant’s board of trustees has determined that the registrant has at least one audit committee financial expert serving on the audit committee.
(a)(2) The audit committee financial experts are Charles A. Baker and Susan M. Ciccarone and each is independent as defined in Form N-CSR Item 3(a)(2).
Item 4. Principal Accountant Fees and Services.
Fees billed by PricewaterhouseCoopers LLP (“PwC”) relate to the registrant.
PwC billed the registrant aggregate fees for services rendered to the registrant for the last two fiscal years as follows:
| | 2023 | 2022 |
| | | All fees and
services to
the Trust
that were
pre-
approved | All fees and
services to
service
affiliates
that were
pre-
approved | All other
fees and
services to
service
affiliates
that did not
require pre-
approval | All fees and
services to
the Trust
that were
pre-
approved | All fees and
services to
service
affiliates
that were
pre-
approved | All other
fees and
services to
service
affiliates
that did not
require pre-
approval |
| (a) | Audit Fees | $1,235,693 | $0 | $0 | $1,148,958 | $0 | $0 |
| (b) | Audit-Related Fees | $0 | $0 | $0 | $0 | $0 | $0 |
| (c) | Tax Fees(1) | $392,972 | $0 | $0 | $406,447 | $0 | $0 |
| (d) | All Other Fees | $0 | $0 | $0 | $0 | $0 | $0 |
Notes:
| (1) | Tax Compliance and excise distribution services. |
(e) (1) Not applicable.
(e)(2) Percentage of fees billed applicable to non-audit services pursuant to waiver of pre-approval requirement were as follows (PwC):
| | 2023 | 2022 |
Audit-Related Fees | 0% | 0% |
| Tax Fees | 0% | 0% |
All Other Fees | 0% | 0% |
(f) Not applicable.
(g) The aggregate non-audit fees and services billed by PwC for the last two fiscal years were $392,972 and $406,447, respectively.
(h) During the past fiscal year, all non-audit services provided by registrant’s principal accountant to either registrant’s investment adviser or to any entity controlling, controlled by, or under common control with registrant’s investment adviser that provides ongoing services to registrant were pre-approved by the audit committee of registrant’s Board of Trustees. Included in the audit committee’s pre-approval was the review and consideration as to whether the provision of these non-audit services is compatible with maintaining the principal accountant’s independence.
(i) Not applicable.
(j) Not applicable.
Item 5. Audit Committee of Listed Registrants.
The registrant has a separately-designated standing Audit Committee, which is composed of the registrant's Independent Trustees, Charles A. Baker, Susan M. Ciccarone and Clifford J. Weber.
Item 6. Investments.
Schedule of Investments is included as part of the report to shareholders filed under Item 1 of this form.
Item 7. Disclosure of Proxy Voting Policies and Procedures for Closed-End Management Investment Companies.
Not applicable to open-end management investment companies.
Item 8. Portfolio Managers of Closed-End Management Investment Companies.
Not applicable to open-end management investment companies.
Item 9. Purchases of Equity Securities by Closed-End Management Investment Company and Affiliated Purchasers.
Not applicable to open-end management investment companies.
Item 10. Submission of Matters to a Vote of Security Holders.
There have been no material changes to the procedures by which shareholders may recommend nominees to the registrant’s board of directors.
Item 11. Controls and Procedures.
The Registrant's disclosure controls and procedures are designed to ensure that information required to be disclosed in the reports that the Registrant files or submits under the Securities Exchange Act of 1934, as amended (the “Exchange Act”), and the Investment Company Act of 1940, as amended, is recorded, processed, summarized and reported within the time periods specified in the rules and forms of the Securities and Exchange Commission. Disclosure controls and procedures include, without limitation, controls and procedures designed to ensure that such information is accumulated and communicated to the Registrant's management (“Management”), including its principal executive officer and principal financial officer, as appropriate, to allow timely decisions regarding required disclosure. Management, including the principal executive officer and principal financial officer, recognizes that any set of controls and procedures, no matter how well designed and operated, can provide only reasonable assurance of achieving the desired control objectives.
Within 90 days prior to the filing date of the Shareholder Report on Form N-CSR, Management carried out an evaluation of the effectiveness of the design and operation of the Registrant's disclosure controls and procedures. Based on such evaluation, the principal executive officer and principal financial officer concluded that the Registrant's disclosure controls and procedures were not effective due to a material weakness. A material weakness (as defined in Rule 12b-2 under the Exchange Act) is a deficiency, or a combination of deficiencies, in internal control over financial reporting such that there is a reasonable possibility that a material misstatement of the Registrant's annual or interim financial statements will not be prevented or detected on a timely basis.
The Global X Aging Population ETF, Global X Cannabis ETF and Global X Genomics & Biotechnology ETF did not design or maintain effective controls to address the valuation, and associated fair value leveling disclosures, of certain fair valued investments in accordance with U.S. GAAP. Specifically, controls were not designed or maintained to evaluate reasonably available observable inputs related to the valuation of certain securities for which trading on a recognized exchange were halted. This material weakness did not result in a misstatement of previously issued financial statements. This material weakness resulted in audit adjustments, which adjustments are reflected in the financial statements of the Global X Cannabis ETF included herein, to increase Investments, at value and Net change in unrealized appreciation (depreciation) on investments for the year ended November 30, 2023. Additionally, this material weakness could result in a misstatement of the aforementioned account balances or disclosures that would result in a material misstatement of the annual or interim financial statements that would not be prevented or detected.
Management's Remediation Plan
Management is implementing enhancements to its disclosure controls and procedures to remediate the material weakness described above. In addition to the fair value committee meetings that presently occur on a monthly basis, management will perform a periodic, interim evaluation of all securities for which trading on a recognized exchange is halted to determine whether any additional reasonably observable inputs have become available, and, if available, such observable inputs will be considered in the valuation of those halted securities.
Item 12. Disclosure of Securities Lending Activities for Closed-End Management Investment Companies.
Not applicable to open-end management investment companies.
Item 18. Recovery of Erroneously Awarded Compensation.
(a) Not applicable.
(b) Not applicable.
Item 19. Exhibits.
(a)(1) Code of Ethics attached hereto.
(a)(2) Not applicable.
(a)(3) A separate certification for the principal executive officer and the principal financial officer of the registrant as required by Rule 30a-2(a) under the Investment Company Act of 1940, as amended (17 CFR § 270.30a-2(a)), are filed herewith.
(b) Officer certifications as required by Rule 30a-2(b) under the Investment Company Act of 1940, as amended (17 CFR § 270.30a-2(b)) also accompany this filing as exhibits.
SIGNATURES
Pursuant to the requirements of the Securities Exchange Act of 1934 and the Investment Company Act of 1940, the registrant has duly caused this report to be signed on its behalf by the undersigned, thereunto duly authorized.
| (Registrant) | | Global X Funds | |
| | | | |
| By (Signature and Title) | | /s/ Thomas Park | |
| | | Thomas Park | |
| | | President | |
Date: February 8, 2024
Pursuant to the requirements of the Securities Exchange Act of 1934 and the Investment Company Act of 1940, this report has been signed below by the following persons on behalf of the registrant and in the capacities and on the dates indicated.
| By (Signature and Title) | | /s/ Thomas Park | |
| | | Thomas Park | |
| | | President | |
Date: February 8, 2024
| By (Signature and Title) | | /s/ Ronnie Riven | |
| | | Ronnie Riven | |
| | | Chief Financial Officer | |
Date: February 8, 2024