UNITED STATES
SECURITIES AND EXCHANGE COMMISSION
Washington, D.C. 20549
FORM N-CSRS
CERTIFIED SHAREHOLDER REPORT OF REGISTERED MANAGEMENT
INVESTMENT COMPANIES
Investment Company Act file number 811-22209
Global X Funds
(Exact name of registrant as specified in charter)
623 Fifth Avenue, 15th Floor
New York, NY 10022 (Address of principal executive offices) (Zip code)
Bruno del Ama
Global X Management Company LLC
623 Fifth Avenue, 15th Floor
New York, NY 10022
(Name and address of agent for service)
With a copy to:
| Daphne Tippens Chisolm, Esq. | Eric S. Purple, Esq. |
| Global X Management Company LLC | K&L Gates LLP |
| 623 Fifth Ave, 15th floor | 1601 K Street, NW |
| New York, NY 10022 | Washington, DC 20006 |
Registrant’s telephone number, including area code: (212) 644-6440
Date of fiscal year end: October 31, 2015
Date of reporting period: April 30, 2015
Item 1. Reports to Stockholders.
| Global X Silver Miners ETF (ticker: SIL) |
| Global X Gold Explorers ETF (ticker: GLDX) |
| Global X Copper Miners ETF (ticker: COPX) |
| Global X Uranium ETF (ticker: URA) |
| Global X Lithium ETF (ticker: LIT) |
| Global X Fertilizers/Potash ETF (ticker: SOIL) |
| Global X Junior Miners ETF (ticker: JUNR) |
Semi-Annual Report
April 30, 2015

The Funds file their complete schedules of Fund holdings with the Securities and Exchange Commission (the “Commission”) for the first and third quarters of each fiscal year on Form N-Q within sixty days after the end of the period. The Funds’ Forms N-Q are available on the Commission’s website at http://www.sec.gov, and may be reviewed and copied at the Commission's Public Reference Room in Washington, DC. Information on the operation of the Public Reference Room may be obtained by calling 1-800-SEC-0330.
A description of the policies and procedures that Global X Funds uses to determine how to vote proxies relating to Fund securities, as well as information relating to how the Funds voted proxies relating to Fund securities during the most recent 12-month period ended June 30, is available (i) without charge, upon request, by calling 1-888-GXFund-1; and (ii) on the Commission’s website at http://www.sec.gov.
| Schedule of Investments | April 30, 2015 (Unaudited) |
| | |
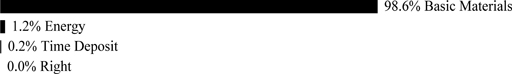
| Global X Silver Miners ETF |
† Sector weightings percentages are based on the total market value of investments. Repurchase agreements purchased from cash collateral received for securities lending activity are included in total investments. Please see Note 7 in Notes to Financial Statements for more detailed information.
| | | Shares | | | Value | |
| COMMON STOCK — 99.7% |
| | | | | | | | | |
| CANADA— 58.8% | | | | | | | | |
| Basic Materials — 58.8% | | | | |
| Alexco Resource * | | | 1,292,476 | | | $ | 539,738 | |
| AuRico Gold | | | 2,602,822 | | | | 9,083,849 | |
| Bear Creek Mining * | | | 1,768,363 | | | | 1,649,742 | |
| Endeavour Silver * | | | 3,033,245 | | | | 6,127,155 | |
| First Majestic Silver * (A) | | | 132,000 | | | | 640,793 | |
| Fortuna Silver Mines * | | | 2,384,801 | | | | 8,997,763 | |
| MAG Silver * | | | 1,317,676 | | | | 9,184,202 | |
| Pan American Silver | | | 935,900 | | | | 8,909,768 | |
| Primero Mining * | | | 2,418,911 | | | | 8,886,815 | |
| Silver Standard Resources * (A) | | | 1,580,228 | | | | 8,604,341 | |
| Silver Wheaton | | | 1,194,236 | | | | 23,574,219 | |
| Silvercorp Metals | | | 4,184,673 | | | | 5,188,994 | |
| SilverCrest Mines * | | | 3,007,115 | | | | 3,227,450 | |
| Tahoe Resources | | | 735,442 | | | | 10,352,352 | |
| TOTAL CANADA | | | | | | | 104,967,181 | |
| | | | | | | | | |
| MEXICO— 15.7% | | | | | | | | |
| Basic Materials — 15.7% | | | | |
| Fresnillo | | | 745,939 | | | | 8,247,835 | |
| Industrias Penoles | | | 1,167,172 | | | | 19,755,660 | |
| TOTAL MEXICO | | | | | | | 28,003,495 | |
| | | | | | | | | |
| PERU— 3.6% | | | | | | | | |
| Basic Materials — 3.6% | | | | |
| Hochschild Mining * | | | 4,303,936 | | | | 6,415,690 | |
| | | | | | | | | |
| UNITED KINGDOM— 5.1% | | | | | | | | |
| Basic Materials — 5.1% | | | | |
| Polymetal International | | | 1,114,408 | | | | 9,068,094 | |
| | | | | | | | | |
| UNITED STATES— 16.5% | | | | | | | | |
| Basic Materials — 16.5% | | | | |
| Coeur d'Alene Mines * (A) | | | 1,452,064 | | | | 7,579,774 | |
| First Majestic Silver * (A) | | | 1,482,847 | | | | 7,221,465 | |
| Great Panther Silver * | | | 2,795,791 | | | | 1,481,769 | |
| Hecla Mining | | | 2,665,028 | | | | 8,048,385 | |
The accompanying notes are an integral part of the financial statements.
Schedule of Investments | April 30, 2015 (Unaudited) |
| | |
| Global X Silver Miners ETF |
| | | Shares/ Face
Amount(1) | | | Value | |
| COMMON STOCK — continued |
| | | | | | | | | |
| Basic Materials — continued | | | | | | | | |
| McEwen Mining * (A) | | | 5,059,569 | | | $ | 5,059,569 | |
| TOTAL UNITED STATES | | | | | | | 29,390,962 | |
| TOTAL COMMON STOCK | | | | | | | | |
| (Cost $288,165,728) | | | | | | | 177,845,422 | |
| |
| REPURCHASE AGREEMENTS — 4.1% |
| Barclays | | | | | | | | |
| 0.100%, dated 04/30/15, to be repurchased on 05/01/15, repurchase price $5,000,014 (collateralized by U.S. Treasury Obligations, ranging in par value $0 - $4,845,632, 0.000%-3.000%, 05/31/15-05/15/37 with a total market value of $5,100,002 (B) | | | 5,000,000 | | | | 5,000,000 | |
| Deutsche Bank | | | | | | | | |
| 0.100%, dated 04/30/15, to be repurchased on 05/01/15, repurchase price $2,406,477 (collateralized by U.S. Treasury Notes, ranging in par value $2,423,732, 1.500%, 11/13/19 with a total market value of $2,406,477)(B) | | | 2,406,470 | | | | 2,406,470 | |
| TOTAL REPURCHASE AGREEMENTS | | | | | | | | |
| (Cost $7,406,470) | | | | | | | 7,406,470 | |
| |
| TIME DEPOSITS — 0.4% |
| Brown Brothers Harriman | | | | | | | | |
| 0.030%, 05/01/15 | | | 546,530 | | | | 546,530 | |
| 0.150%, 05/01/15, CAD | | | 143,554 | | | | 118,517 | |
| 0.080%, 05/01/15, GBP | | | 23,923 | | | | 36,764 | |
| TOTAL TIME DEPOSITS | | | | | | | | |
| (Cost $701,811) | | | | | | | 701,811 | |
| | | | | | | | | |
| TOTAL INVESTMENTS — 104.2% | | | | | | | | |
| (Cost $296,274,009) | | | | | | $ | 185,953,703 | |
Percentages are based on Net Assets of $178,436,763.
| * | Non-income producing security. |
| (1) | In U.S. Dollars unless otherwise indicated. |
| (A) | This security or a partial position of this security is on loan at April 30, 2015. The total value of securities on loan at April 30, 2015 was $6,492,409. |
| (B) | These securities were purchased with cash collateral held from securities on loan. The total value of such securities as of April 30, 2015 was $7,406,470. |
CAD — Canadian Dollar
GBP — British Pound Sterling
The accompanying notes are an integral part of the financial statements.
| Schedule of Investments | April 30, 2015 (Unaudited) |
| | |
| Global X Silver Miners ETF |
The following is a summary of the inputs used as of April 30, 2015, in valuing the Fund's investments carried at value:
| Investments in Securities | | Level 1 | | | Level 2 | | | Level 3 | | | Total | |
| Common Stock | | $ | 177,845,422 | | | $ | — | | | $ | — | | | $ | 177,845,422 | |
| Repurchase Agreements | | | — | | | | 7,406,470 | | | | — | | | | 7,406,470 | |
| Time Deposits | | | — | | | | 701,811 | | | | — | | | | 701,811 | |
| Total Investments in Securities | | $ | 177,845,422 | | | $ | 8,108,281 | | | $ | — | | | $ | 185,953,703 | |
For the year ended April 30, 2015, there have been no transfers between Level 1, Level 2 and Level 3 investments.
As of April 30, 2015, there were no Level 3 investments.
The accompanying notes are an integral part of the financial statements.
| Schedule of Investments | April 30, 2015 (Unaudited) |
| | |
| Global X Gold Explorers ETF |
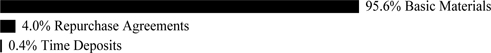
Sector Weightings †:

† Sector weightings percentages are based on the total market value of investments. Repurchase agreements purchased from cash collateral received for securities lending activity are included in total investments. Please see Note 7 in Notes to Financial Statements for more detailed information.
| | | Shares | | | Value | |
| COMMON STOCK — 100.1% |
| | | | | | | | | |
| AUSTRALIA— 4.6% | | | | | | | | |
| Basic Materials — 4.6% | | | | |
| Gryphon Minerals *(C) | | | 28,083,503 | | | $ | 1,484,107 | |
| | | | | | | | | |
| CANADA— 93.6% | | | | | | | | |
| Basic Materials — 93.6% | | | | |
| Asanko Gold * (A) | | | 1,089,316 | | | | 1,600,811 | |
| Atac Resources * | | | 3,345,681 | | | | 1,491,573 | |
| Chesapeake Gold * | | | 1,000,022 | | | | 1,642,967 | |
| Continental Gold * | | | 912,584 | | | | 1,657,531 | |
| Exeter Resource * | | | 2,918,724 | | | | 1,692,860 | |
| Gold Canyon Resources *(C) | | | 17,566,769 | | | | 4,350,903 | |
| Guyana Goldfields * | | | 723,900 | | | | 1,864,659 | |
| International Tower Hill Mines * | | | 3,227,897 | | | | 1,226,601 | |
| Kaminak Gold, Cl A * | | | 2,465,636 | | | | 1,913,476 | |
| Lydian International, Cl A * (A) | | | 3,775,919 | | | | 1,589,861 | |
| Newstrike Capital * | | | 2,098,081 | | | | 1,143,227 | |
| Novagold Resources * | | | 577,791 | | | | 2,218,717 | |
| Pretium Resources * (A) | | | 283,482 | | | | 1,626,584 | |
| Probe Metals * | | | 216,913 | | | | 63,574 | |
| Rubicon Minerals * | | | 373,785 | | | | 410,431 | |
| Rubicon Minerals * | | | 1,333,401 | | | | 1,466,741 | |
| Sabina Gold & Silver * | | | 5,916,024 | | | | 1,685,059 | |
| Seabridge Gold * | | | 204,969 | | | | 1,299,503 | |
| Torex Gold Resources * | | | 1,644,450 | | | | 1,520,565 | |
| TOTAL CANADA | | | | | | | 30,465,643 | |
| | | | | | | | | |
| UNITED STATES— 1.9% | | | | | | | | |
| Basic Materials — 1.9% | | | | | | | | |
| Coeur d'Alene Mines * | | | 105,806 | | | | 552,305 | |
| Paramount Gold Nevada * (A) | | | 32,858 | | | | 56,844 | |
| TOTAL UNITED STATES | | | | | | | 609,149 | |
| TOTAL COMMON STOCK | | | | | | | | |
| (Cost $53,608,807) | | | | | | | 32,558,899 | |
The accompanying notes are an integral part of the financial statements.
Schedule of Investments | April 30, 2015 (Unaudited) |
| | |
| Global X Gold Explorers ETF |
| | | Face Amount | | | Value | |
| REPURCHASE AGREEMENT — 3.5% |
| Deutsche Bank | | | | | | | | |
| 0.100%, dated 04/30/15, to be repurchased on 05/01/15, repurchase price $1,131,941 (collateralized by U.S. Treasury Notes, ranging in par value $1,140,058, 1.500%, 11/13/19 with a total market value of $1,150,307)(B) | | | | | | | | |
| (Cost $1,131,938) | | $ | 1,131,938 | | | $ | 1,131,938 | |
| | | | | | | | | |
| TOTAL INVESTMENTS — 103.6% | | | | | | | | |
| (Cost $54,740,745) | | | | | | $ | 33,690,837 | |
Percentages are based on Net Assets of $32,534,090.
| * | Non-income producing security. |
| (A) | This security or a partial position of this security is on loan at April 30, 2015. The total value of securities on loan at April 30, 2015 was $1,016,203. |
| (B) | These securities were purchased with cash collateral held from securities on loan. The total value of such securities as of April 30, 2015 was $1,131,938. |
| (C) | Affiliated investment (see Note 3). |
Cl— Class
The following is a summary of the inputs used as of April 30, 2015, in valuing the Fund's investments carried at value:
| Investments in Securities | | Level 1 | | | Level 2 | | | Level 3 | | | Total | |
| Common Stock | | $ | 32,558,899 | | | $ | — | | | $ | — | | | $ | 32,558,899 | |
| Repurchase Agreement | | | — | | | | 1,131,938 | | | | — | | | | 1,131,938 | |
| Total Investments in Securities | | $ | 32,558,899 | | | $ | 1,131,938 | | | $ | — | | | $ | 33,690,837 | |
For the period ended April 30, 2015, the transfer into Level 1 from Level 2 was due to changes in the availability of observable inputs to determine fair value. Transfers between Levels are recognized at period end.
As of April 30, 2015, there were no Level 3 investments.
The accompanying notes are an integral part of the financial statements.
| Schedule of Investments | April 30, 2015 (Unaudited) |
| | |
| Global X Copper Miners ETF |
Sector Weightings †:
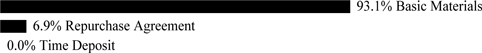
† Sector weightings percentages are based on the total market value of investments. Repurchase agreements purchased from cash collateral received for securities lending activity are included in total investments. Please see Note 7 in Notes to Financial Statements for more detailed information.
| | | Shares | | | Value | |
| COMMON STOCK — 99.8% |
| |
| AUSTRALIA— 16.6% | | | | | | | | |
| Basic Materials — 16.6% | | | | |
| Cudeco * (A) | | | 510,147 | | | $ | 425,515 | |
| OZ Minerals | | | 396,849 | | | | 1,468,037 | |
| PanAust | | | 897,777 | | | | 1,235,671 | |
| Sandfire Resources | | | 356,146 | | | | 1,382,077 | |
| TOTAL AUSTRALIA | | | | | | | 4,511,300 | |
| | | | | | | | | |
| CANADA— 40.6% | | | | | | | | |
| Basic Materials — 40.6% | | | | |
| Capstone Mining * | | | 1,103,794 | | | | 1,530,959 | |
| Copper Mountain Mining *^ | | | 12,300 | | | | 14,047 | |
| Copper Mountain Mining * (B) | | | 981,399 | | | | 1,174,843 | |
| First Quantum Minerals | | | 83,250 | | | | 1,270,142 | |
| HudBay Minerals, Cl B | | | 143,287 | | | | 1,411,281 | |
| Imperial Metals * (B) | | | 120,540 | | | | 1,302,678 | |
| Lundin Mining, Cl Common Subscription Receipt * | | | 292,097 | | | | 1,446,920 | |
| Taseko Mines * | | | 374,406 | | | | 299,899 | |
| Teck Resources, Cl B | | | 88,915 | | | | 1,342,626 | |
| Turquoise Hill Resources * | | | 300,549 | | | | 1,250,284 | |
| TOTAL CANADA | | | | | | | 11,043,679 | |
| | | | | | | | | |
| CHINA— 4.4% | | | | | | | | |
| Basic Materials — 4.4% | | | | |
| Jiangxi Copper, Cl H | | | 578,914 | | | | 1,200,975 | |
| | | | | | | | | |
| MEXICO— 4.6% | | | | | | | | |
| Basic Materials — 4.6% | | | | |
| Grupo Mexico, Cl B | | | 402,314 | | | | 1,241,705 | |
| | | | | | | | | |
| PERU— 4.9% | | | | | | | | |
| Basic Materials — 4.9% | | | | |
| Southern Copper (B) | | | 40,492 | | | | 1,319,229 | |
| | | | | | | | | |
| POLAND— 4.9% | | | | | | | | |
| Basic Materials — 4.9% | | | | |
| KGHM Polska Miedz | | | 37,999 | | | | 1,331,350 | |
| | | | | | | | | |
| SWITZERLAND— 4.7% | | | | | | | | |
| Basic Materials — 4.7% | | | | |
| Glencore Xstrata | | | 270,470 | | | | 1,289,546 | |
The accompanying notes are an integral part of the financial statements.
| Schedule of Investments | April 30, 2015 (Unaudited) |
| | |
| Global X Copper Miners ETF |
| | | Shares/Face
Amount | | | Value | |
| COMMON STOCK — continued |
| |
| TURKEY— 0.2% | | | | | | | | |
| Basic Materials — 0.2% | | | | |
| Park Elektrik Uretim Madencilik Sanayi ve Ticaret | | | 41,951 | | | $ | 58,963 | |
| | | | | | | | | |
| UNITED KINGDOM— 14.9% | | | | | | | | |
| Basic Materials — 14.9% | | | | |
| Antofagasta | | | 109,443 | | | | 1,314,385 | |
| KAZ Minerals | | | 338,087 | | | | 1,356,567 | |
| Vedanta Resources | | | 142,377 | | | | 1,375,153 | |
| TOTAL UNITED KINGDOM | | | | | | | 4,046,105 | |
| | | | | | | | | |
| UNITED STATES— 4.0% | | | | | | | | |
| Basic Materials — 4.0% | | | | | | | | |
| Freeport-McMoRan Copper & Gold | | | 46,180 | | | | 1,074,609 | |
| TOTAL COMMON STOCK | | | | | | | | |
| (Cost $35,576,078) | | | | | | | 27,117,461 | |
| |
| REPURCHASE AGREEMENT — 7.4% |
| Deutsche Bank | | | | | | | | |
| 0.100%, dated 04/30/15, to be repurchased on 05/01/15, repurchase price $1,998,498 (collateralized by U.S. Treasury Notes, ranging in par value $2,012,828, 1.500%, 11/13/19 with a total market value of $2,030,923)(C) | | | | | | | | |
| (Cost $1,998,492) | | $ | 1,998,492 | | | | 1,998,492 | |
| | | | | | | | | |
| TIME DEPOSIT — 0.0% |
| Brown Brothers Harriman, 0.030%, 05/01/15 | | | | | | | | |
| (Cost $2,516) | | | 2,516 | | | | 2,516 | |
| | | | | | | | | |
| TOTAL INVESTMENTS — 107.2% | | | | | | | | |
| (Cost $37,577,086) | | | | | | $ | 29,118,469 | |
Percentages are based on Net Assets of $27,167,336.
| * | Non-income producing security. |
| ^ | Traded on U.S. stock exchange. |
| (A) | Security is fair valued using methods determined in good faith by the Fair Value Committee of the Fund. The total value of such securities as of April 30, 2015 was $425,515 and represents 1.5% of Net Assets. |
| (B) | This security or a partial position of this security is on loan at April 30, 2015. The total value of securities on loan at April 30, 2015 was $1,822,630. |
| (C) | This security was purchased with cash collateral held from securities on loan. The total value of such a security as of April 30, 2015 was $1,998,492. |
Cl — Class
The accompanying notes are an integral part of the financial statements.
| Schedule of Investments | April 30, 2015 (Unaudited) |
| | |
| Global X Copper Miners ETF |
The following is a summary of the inputs used as of April 30, 2015, in valuing the Fund's investments carried at value:
| Investments in Securities | | Level 1 | | | Level 2 | | | Level 3 | | | Total | |
| Common Stock | | $ | 26,691,946 | | | $ | — | | | $ | 425,515 | | | $ | 27,117,461 | |
| Repurchase Agreement | | | — | | | | 1,998,492 | | | | — | | | | 1,998,492 | |
| Time Deposit | | | — | | | | 2,516 | | | | — | | | | 2,516 | |
| Total Investments in Securities | | $ | 26,691,946 | | | $ | 2,001,008 | | | $ | 425,515 | | | $ | 29,118,469 | |
For the year ended April 30, 2015, the transfers into Level 2 from Level 1 were due to changes in the availability of observable inputs to determine fair value. Transfers between Levels are recognized at period end.
The following is a reconciliation of investments in which significant unobservable inputs (Level 3) were used in determining fair value:
| | | Investments in | |
| | | Common Stock | |
| Beginning Balance as of October 31, 2014 | | $ | - | |
| Transfers into Level 3 | | | 425,515 | |
| Ending Balance as of April 30, 2015 | | $ | 425,515 | |
Net change in unrealized appreciation/(depreciation) from investments (Level 3) still held as of April 30, 2015 is $0.
For the year ended April 30, 2015, the transfers into Level 3 were due to changes in the availability of observable inputs to determine fair value. Transfers between levels are recognized at period end.
The accompanying notes are an integral part of the financial statements.
| Schedule of Investments | April 30, 2015 (Unaudited) |
| | |
| Global X Uranium ETF |
Sector Weightings †:

† Sector weightings percentages are based on the total market value of investments. Repurchase agreements purchased from cash collateral received for securities lending activity are included in total investments. Please see Note 7 in Notes to Financial Statements for more detailed information.
| | | Shares | | | Value | |
| COMMON STOCK — 99.9% |
| |
| AUSTRALIA— 15.0% | | | | | | | | |
| Basic Materials — 15.0% | | | | |
| Bannerman Resources *(B) | | | 25,376,663 | | | $ | 1,200,949 | |
| Berkeley Resources * (A)(B) | | | 12,386,258 | | | | 2,295,868 | |
| Energy Resources of Australia * | | | 11,512,213 | | | | 12,167,535 | |
| Greenland Minerals & Energy * (A)(B) | | | 54,431,879 | | | | 3,563,448 | |
| Paladin Energy * (A) | | | 39,254,520 | | | | 10,836,691 | |
| Silex Systems * (A)(B) | | | 12,208,616 | | | | 5,055,507 | |
| TOTAL AUSTRALIA | | | | | | | 35,119,998 | |
| | | | | | | | | |
| CANADA— 62.8% | | | | | | | | |
| Basic Materials — 62.8% | | | | |
| Cameco | | | 3,230,520 | | | | 56,595,777 | |
| Denison Mines * (A)(B) | | | 28,089,786 | | | | 24,814,094 | |
| Energy Fuels * (A)(B) | | | 1,735,131 | | | | 8,566,426 | |
| Fission 3.0 * | | | 14,859,350 | | | | 1,349,456 | |
| Fission Uranium * | | | 12,158,733 | | | | 11,644,277 | |
| Laramide Resources *(B) | | | 7,586,282 | | | | 1,910,271 | |
| Mega Uranium * (A)(B) | | | 26,870,211 | | | | 2,440,225 | |
| Uex *(B) | | | 19,416,719 | | | | 4,728,943 | |
| Uranium Participation * (A) | | | 7,546,403 | | | | 34,827,156 | |
| TOTAL CANADA | | | | | | | 146,876,625 | |
| | | | | | | | | |
| FRANCE— 2.2% | | | | | | | | |
| Utilities — 2.2% | | | | | | | | |
| Areva * | | | 587,956 | | | | 5,105,958 | |
| | | | | | | | | |
| UNITED STATES— 19.9% | | | | | | | | |
| Basic Materials — 19.9% | | | | | | | | |
| Centrus Energy, Cl A * | | | 46,479 | | | | 242,621 | |
| Uranerz Energy * (A)(B) | | | 8,704,633 | | | | 10,358,513 | |
| Uranium Energy * (A)(B) | | | 8,386,187 | | | | 21,804,086 | |
| Uranium Resources * (A)(B) | | | 2,694,264 | | | | 3,529,486 | |
The accompanying notes are an integral part of the financial statements.
| Schedule of Investments | April 30, 2015 (Unaudited) |
| | |
| Global X Uranium ETF |
| | | Shares/Number of Warrants/Face Amount(1) | | | Value | |
| COMMON STOCK — continued | | | | | | | | |
| | | | | | | | | |
| Basic Materials — continued | | | | | | | | |
| Ur-Energy * (A)(B) | | | 11,006,117 | | | $ | 10,565,872 | |
| TOTAL UNITED STATES | | | | | | | 46,500,578 | |
| TOTAL COMMON STOCK | | | | | | | | |
| (Cost $322,624,421) | | | | | | | 233,603,159 | |
| | | | | | | | | |
| WARRANT — 0.0% | | | | | | | | |
| Australia — 0.0% | | | | | | | | |
| Greenland Minerals & Energy*(B) | | | | | | | | |
| 0.200%, 06/30/16 | | | | | | | | |
| (Cost $–) | | | 655,000 | | | | 8,266 | |
| | | | | | | | | |
| U.S. TREASURY OBLIGATION — 10.7% | | | | | | | | |
| United States Treasury Bills | | | | | | | | |
| 0.001%, 05/14/15(C) | | | | | | | | |
| (Cost $25,000,135) | | | 25,000,000 | | | | 24,999,950 | |
| | | | | | | | | |
| REPURCHASE AGREEMENTS — 8.5% | | | | | | | | |
| Barclays | | | | | | | | |
| 0.100%, dated 04/30/15, to be repurchased on 05/01/15, repurchase price $15,000,042 (collateralized by U.S. Treasury Obligations, ranging in par value $0 - $4,845,632, 0.000%-3.000%, 05/31/15-05/15/37 with a total market value of $15,300,006)(D) | | | 15,000,000 | | | | 15,000,000 | |
| Deutsche Bank | | | | | | | | |
| 0.100%, dated 04/30/15, to be repurchased on 05/01/15, repurchase price $4,929,849 (collateralized by U.S. Treasury Notes, par value $4,965,198, 1.500%, 11/13/19 with a total market value of $5,009,835)(D) | | | 4,929,835 | | | | 4,929,835 | |
| TOTAL REPURCHASE AGREEMENTS | | | | | | | | |
| (Cost $19,929,835) | | | | | | | 19,929,835 | |
| TIME DEPOSIT — 0.0% | | | | | | | | |
| Brown Brothers Harriman, 0.150%, 05/01/15, CAD | | | | | | | | |
| (Cost $25) | | | 30 | | | | 25 | |
| TOTAL INVESTMENTS — 119.1% | | | | | | | | |
| (Cost $367,554,416) | | | | | | $ | 278,541,235 | |
Percentages are based on Net Assets of $233,926,626.
| * | Non-income producing security. |
| (1) | In U.S. Dollars unless otherwise indicated. |
| (A) | This security or a partial position of this security is on loan at April 30, 2015. The total value of securities on loan at April 30, 2015 was $16,373,711. |
| (B) | Affiliated investment (see Note 3). |
| (C) | The rate reported on the Schedule of Investments is the effective yield at time of purchase. |
| (D) | These securities were purchased with cash collateral held from securities on loan. The total value of such securities as of April 30, 2015 was $19,929,835. |
Amounts designated as “—“ are $0 or have been rounded to $0.
CAD — Canadian Dollar
Cl — Class
The accompanying notes are an integral part of the financial statements.
| Schedule of Investments | April 30, 2015 (Unaudited) |
| | |
| Global X Uranium ETF |
The following is a summary of the inputs used as of April 30, 2015, in valuing the Fund's investments carried at value:
| Investments in Securities | | Level 1 | | | Level 2 | | | Level 3 | | | Total | |
| Common Stock | | $ | 233,603,159 | | | $ | — | | | $ | — | | | $ | 233,603,159 | |
| Warrant | | | — | | | | 8,266 | | | | — | | | | 8,266 | |
| U.S. Treasury Obligation | | | — | | | | 24,999,950 | | | | — | | | | 24,999,950 | |
| Repurchase Agreements | | | — | | | | 19,929,835 | | | | — | | | | 19,929,835 | |
| Time Deposit | | | — | | | | 25 | | | | — | | | | 25 | |
| Total Investments in Securities | | $ | 233,603,159 | | | $ | 44,938,076 | | | $ | — | | | $ | 278,541,235 | |
For the year ended April 30, 2015, there have been no transfers between Level 1, Level 2 or Level 3 investments.
As of April 30, 2015, there were no Level 3 investments.
The accompanying notes are an integral part of the financial statements.
| Schedule of Investments | April 30, 2015 (Unaudited) |
| | |
| Global X Lithium ETF |
Sector Weightings †:
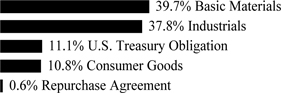
† Sector weightings percentages are based on the total market value of investments. Repurchase agreements purchased from cash collateral received for securities lending activity are included in total investments. Please see Note 7 in Notes to Financial Statements for more detailed information.
| | | Shares | | | Value | |
| COMMON STOCK — 99.8% |
| |
| AUSTRALIA— 1.8% | | | | | | | | |
| Basic Materials — 1.8% | | | | |
| Galaxy Resources * | | | 4,379,272 | | | $ | 103,624 | |
| Orocobre * | | | 401,754 | | | | 773,195 | |
| TOTAL AUSTRALIA | | | | | | | 876,819 | |
| | | | | | | | | |
| CANADA— 1.1% | | | | | | | | |
| Basic Materials — 1.1% | | | | |
| Avalon Rare Metals * (A) | | | 498,107 | | | | 135,707 | |
| Western Lithium USA * (A) | | | 588,255 | | | | 364,245 | |
| TOTAL CANADA | | | | | | | 499,952 | |
| | | | | | | | | |
| CHILE— 8.2% | | | | | | | | |
| Basic Materials — 8.2% | | | | |
| Sociedad Quimica y Minera de Chile ADR | | | 179,541 | | | | 3,921,176 | |
| | | | | | | | | |
| CHINA— 4.2% | | | | | | | | |
| Industrials — 4.2% | | | | |
| BYD, Cl H | | | 331,000 | | | | 2,013,463 | |
| | | | | | | | | |
| FRANCE— 6.5% | | | | | | | | |
| Industrials — 6.5% | | | | |
| Blue Solutions * | | | 16,746 | | | | 448,477 | |
| Saft Groupe | | | 66,854 | | | | 2,666,908 | |
| TOTAL FRANCE | | | | | | | 3,115,385 | |
| | | | | | | | | |
| HONG KONG— 8.8% | | | | | | | | |
| Consumer Goods — 7.9% | | | | |
| FDG Electric Vehicles * | | | 37,814,300 | | | | 3,756,476 | |
| Industrials — 0.9% | | | | |
| Coslight Technology International Group * | | | 735,373 | | | | 439,261 | |
| TOTAL HONG KONG | | | | | | | 4,195,737 | |
| | | | | | | | | |
| JAPAN— 10.2% | | | | | | | | |
| Industrials — 10.2% | | | | | | | | |
| GS Yuasa | | | 435,194 | | | | 2,054,689 | |
| Panasonic | | | 196,400 | | | | 2,829,394 | |
| TOTAL JAPAN | | | | | | | 4,884,083 | |
The accompanying notes are an integral part of the financial statements.
| Schedule of Investments | April 30, 2015 (Unaudited) |
| | |
| Global X Lithium ETF |
| | | Shares/Face
Amount | | | Value | |
| COMMON STOCK — continued |
| |
| SOUTH KOREA— 10.2% | | | | | | | | |
| Basic Materials — 5.3% | | | | |
| LG Chemical | | | 9,862 | | | $ | 2,511,498 | |
| Industrials — 4.9% | | | | |
| Samsung SDI | | | 21,006 | | | | 2,351,418 | |
| TOTAL SOUTH KOREA | | | | | | | 4,862,916 | |
| | | | | | | | | |
| TAIWAN— 9.9% | | | | | | | | |
| Industrials — 9.9% | | | | | | | | |
| Advanced Lithium Electrochemistry Cayman * | | | 509,329 | | | | 671,876 | |
| Changs Ascending Enterprise * | | | 199,117 | | | | 218,128 | |
| Dynapack International Technology | | | 679,600 | | | | 1,653,177 | |
| Simplo Technology | | | 439,500 | | | | 2,188,459 | |
| TOTAL TAIWAN | | | | | | | 4,731,640 | |
| | | | | | | | | |
| UNITED STATES— 38.9% | | | | | | | | |
| Basic Materials — 28.7% | | | | | | | | |
| Albemarle | | | 95,226 | | | | 5,684,992 | |
| Avalon Rare Metals * | | | 157,966 | | | | 42,651 | |
| FMC | | | 134,971 | | | | 8,005,130 | |
| | | | | | | | 13,732,773 | |
| Consumer Goods — 4.3% | | | | |
| Tesla Motors * | | | 9,147 | | | | 2,067,679 | |
| Industrials — 5.9% | | | | |
| Johnson Controls | | | 51,085 | | | | 2,573,662 | |
| Ultralife * | | | 59,392 | | | | 242,320 | |
| | | | | | | | 2,815,982 | |
| TOTAL UNITED STATES | | | | | | | 18,616,434 | |
| TOTAL COMMON STOCK | | | | | | | | |
| (Cost $48,308,898) | | | | | | | 47,717,605 | |
| |
| U.S. TREASURY OBLIGATION — 12.6% |
| United States Treasury Bills | | | | | | | | |
| 0.001%, 05/14/15(B) | | | | | | | | |
| (Cost $6,000,033) | | $ | 6,000,000 | | | | 5,999,988 | |
| |
| REPURCHASE AGREEMENT — 0.6% |
| Deutsche Bank | | | | | | | | |
| 0.100%, dated 04/30/15, to be repurchased on 05/01/15 repurchase price $299,891 (collateralized by U.S. Treasury Notes, ranging in par value $302,041, 1.500%, 11/13/19 with a total market value of $304,757)(C) | | | | | | | | |
| (Cost $299,890) | | | 299,890 | | | | 299,890 | |
| | | | | | | | | |
| TOTAL INVESTMENTS — 113.0% | | | | | | | | |
| (Cost $54,608,821) | | | | | | $ | 54,017,483 | |
Percentages are based on Net Assets of $47,820,364.
The accompanying notes are an integral part of the financial statements.
| Schedule of Investments | April 30, 2015 (Unaudited) |
| | |
| Global X Lithium ETF |
| * | Non-income producing security. |
| (A) | This security or a partial position of this security is on loan at April 30, 2015. The total value of securities on loan at April 30, 2015 was $230,578. |
| (B) | The rate reported on the Schedule of Investments is the effective yield at time of purchase. |
| (C) | These securities were purchased with cash collateral held from securities on loan. The total value of such securities as of April 30, 2015 was $299,890. |
ADR — American Depositary Receipt
Cl — Class
The following is a summary of the inputs used as of April 30, 2015, in valuing the Fund's investments carried at value:
| Investments in Securities | | Level 1 | | | Level 2 | | | Level 3 | | | Total | |
| Common Stock | | $ | 47,717,605 | | | $ | — | | | $ | — | | | $ | 47,717,605 | |
| U.S. Treasury Obligation | | | — | | | | 5,999,988 | | | | — | | | | 5,999,988 | |
| Repurchase Agreement | | | — | | | | 299,890 | | | | — | | | | 299,890 | |
| Total Investments in Securities | | $ | 47,717,605 | | | $ | 6,299,878 | | | $ | — | | | $ | 54,017,483 | |
The following is a reconciliation of investments in which significant unobservable inputs (Level 3) were used in determining fair value:.
| | | Investments in | |
| | | Common Stock | |
| | | | |
| Beginning Balance as of October 31, 2014 | | $ | 2,701,427 | |
| Accrued discounts/premiums | | | - | |
| Realized gain/(loss) | | | - | |
| Change in unrealized appreciation/(depreciation) | | | - | |
| Net purchases | | | - | |
| Net sales | | | - | |
| Transfers into Level 3 | | | - | |
| Transfers out of Level 3 | | | (2,701,427 | ) |
| Ending Balance as of April 30, 2015 | | $ | - | |
For the period ended April 30, 2015, the transfers out of Level 3 were due to the lifting of trading halts in the shares of the affected companies. Transfers between levels are recognized at period end
As of April 30, 2015, there were no Level 3 investments.
The accompanying notes are an integral part of the financial statements.
| Schedule of Investments | April 30, 2015 (Unaudited) |
| | |
| Global X Fertilizers/Potash ETF |
Sector Weightings †:

† Sector weightings percentages are based on the total market value of investments.
| | | Shares | | | Value | |
| COMMON STOCK — 99.7% |
| |
| AUSTRALIA— 11.2% | | | | | | | | |
| Basic Materials — 11.2% | | | | |
| Incitec Pivot | | | 243,629 | | | $ | 766,727 | |
| Nufarm | | | 151,575 | | | | 871,554 | |
| TOTAL AUSTRALIA | | | | | | | 1,638,281 | |
| | | | | | | | | |
| CANADA— 8.6% | | | | | | | | |
| Basic Materials — 8.6% | | | | |
| Agrium | | | 282 | | | | 29,102 | |
| Agrium^ | | | 6,099 | | | | 632,039 | |
| Potash Corp of Saskatchewan | | | 18,451 | | | | 602,241 | |
| TOTAL CANADA | | | | | | | 1,263,382 | |
| | | | | | | | | |
| CHILE— 3.9% | | | | | | | | |
| Basic Materials — 3.9% | | | | | | | | |
| Sociedad Quimica y Minera de Chile ADR | | | 26,074 | | | | 569,456 | |
| | | | | | | | | |
| CHINA— 11.4% | | | | | | | | |
| Basic Materials — 11.4% | | | | | | | | |
| China BlueChemical | | | 2,012,216 | | | | 898,224 | |
| Sinofert Holdings | | | 2,772,285 | | | | 765,395 | |
| TOTAL CHINA | | | | | | | 1,663,619 | |
| | | | | | | | | |
| GERMANY— 4.9% | | | | | | | | |
| Basic Materials — 4.9% | | | | | | | | |
| K+S | | | 21,915 | | | | 720,006 | |
| | | | | | | | | |
| ISRAEL— 9.0% | | | | | | | | |
| Basic Materials — 7.7% | | | | | | | | |
| Israel Chemicals | | | 92,441 | | | | 647,169 | |
| The Israel Corp | | | 1,315 | | | | 484,642 | |
| | | | | | | | 1,131,811 | |
| Financials — 1.3% | | | | | | | | |
| Kenon Holdings * | | | 8,827 | | | | 191,033 | |
| TOTAL ISRAEL | | | | | | | 1,322,844 | |
| | | | | | | | | |
| NETHERLANDS— 3.8% | | | | | | | | |
| Industrials — 3.8% | | | | | | | | |
| OCI * | | | 18,585 | | | | 554,060 | |
The accompanying notes are an integral part of the financial statements.
| Schedule of Investments | April 30, 2015 (Unaudited) |
| | |
| Global X Fertilizers/Potash ETF |
| | | Shares | | | Value | |
| COMMON STOCK — continued |
| |
| NORWAY— 4.7% | | | | | | | | |
| Basic Materials — 4.7% | | | | |
| Yara International | | | 13,529 | | | $ | 693,730 | |
| | | | | | | | | |
| RUSSIA— 3.8% | | | | | | | | |
| Basic Materials — 3.8% | | | | |
| Uralkali GDR | | | 37,040 | | | | 548,562 | |
| | | | | | | | | |
| SOUTH KOREA— 2.0% | | | | | | | | |
| Basic Materials — 2.0% | | | | |
| Namhae Chemical | | | 31,208 | | | | 286,170 | |
| | | | | | | | | |
| SWITZERLAND— 4.5% | | | | | | | | |
| Basic Materials — 4.5% | | | | |
| Syngenta | | | 1,981 | | | | 664,774 | |
| | | | | | | | | |
| TAIWAN— 4.9% | | | | | | | | |
| Basic Materials — 4.9% | | | | |
| Taiwan Fertilizer | | | 386,682 | | | | 712,103 | |
| | | | | | | | | |
| TURKEY— 4.4% | | | | | | | | |
| Basic Materials — 4.4% | | | | |
| Bagfas Bandirma Gubre Fabrik | | | 68,155 | | | | 347,762 | |
| Gubre Fabrikalari | | | 108,388 | | | | 289,694 | |
| TOTAL TURKEY | | | | | | | 637,456 | |
| | | | | | | | | |
| UNITED STATES— 22.6% | | | | | | | | |
| Basic Materials — 22.6% | | | | |
| CF Industries Holdings | | | 2,412 | | | | 693,377 | |
| Intrepid Potash * | | | 45,945 | | | | 575,691 | |
| Mosaic | | | 13,913 | | | | 612,172 | |
| Scotts Miracle-Gro, Cl A | | | 10,924 | | | | 704,707 | |
| Terra Nitrogen | | | 5,364 | | | | 717,489 | |
| TOTAL UNITED STATES | | | | | | | 3,303,436 | |
| TOTAL COMMON STOCK | | | | | | | | |
| (Cost $19,041,063) | | | | | | | 14,577,879 | |
| TOTAL INVESTMENTS — 99.7% | | | | | | | | |
| (Cost $19,041,063) | | | | | | $ | 14,577,879 | |
Percentages are based on Net Assets of $14,628,498.
The accompanying notes are an integral part of the financial statements.
| Schedule of Investments | April 30, 2015 (Unaudited) |
| | |
| Global X Fertilizers/Potash ETF |
| * | Non-income producing security. |
| ^ | Traded on U.S. Stock Exchange. |
ADR — American Depositary Receipt
Cl — Class
GDR — Global Depositary Receipt
As of April 30, 2015, all of the Fund’s investments were considered Level 1, in accordance with the authoritative guidance on fair value measurements and disclosure under U.S. GAAP.
For the period ended April 30, 2015, there have been no transfers between Level 1, Level 2 or Level 3 investments.
As of April 30, 2015, there were no Level 3 investments.
The accompanying notes are an integral part of the financial statements.
| Schedule of Investments | April 30, 2015 (Unaudited) |
| | |
| Global X Junior Miners ETF |
Sector Weightings †:
† Sector weightings percentages are based on the total market value of investments.
| | | Shares | | | Value | |
| COMMON STOCK — 99.7% |
| |
| AUSTRALIA— 14.7% | | | | | | | | |
| Basic Materials — 14.7% | | | | |
| Arrium | | | 181,307 | | | $ | 25,026 | |
| Beadell Resources | | | 54,977 | | | | 9,757 | |
| Evolution Mining | | | 28,672 | | | | 22,615 | |
| Independence Group | | | 14,966 | | | | 69,646 | |
| Jacana Minerals *(A)(B) | | | 2,200 | | | | 89 | |
| Mineral Resources | | | 9,140 | | | | 46,860 | |
| Mount Gibson Iron | | | 37,869 | | | | 6,123 | |
| Northern Star Resources | | | 32,359 | | | | 56,406 | |
| OceanaGold | | | 15,670 | | | | 29,910 | |
| OZ Minerals | | | 18,300 | | | | 67,696 | |
| Paladin Energy * | | | 71,205 | | | | 19,657 | |
| PanAust | | | 30,189 | | | | 41,551 | |
| Regis Resources * | | | 20,000 | | | | 19,798 | |
| Sandfire Resources | | | 6,613 | | | | 25,663 | |
| Sirius Resources NL * | | | 20,600 | | | | 47,120 | |
| Syrah Resources * | | | 6,336 | | | | 19,540 | |
| Western Areas | | | 12,740 | | | | 37,080 | |
| Whitehaven Coal * | | | 32,400 | | | | 42,167 | |
| TOTAL AUSTRALIA | | | | | | | 586,704 | |
| | | | | | | | | |
| BELGIUM— 1.7% | | | | | | | | |
| Basic Materials — 1.7% | | | | |
| Nyrstar | | | 16,940 | | | | 66,437 | |
| | | | | | | | | |
| BERMUDA— 1.8% | | | | | | | | |
| Basic Materials — 1.8% | | | | |
| Petra Diamonds * | | | 29,289 | | | | 71,116 | |
| | | | | | | | | |
| CANADA— 41.2% | | | | | | | | |
| Basic Materials — 41.2% | | | | |
| Acacia Mining | | | 9,617 | | | | 42,697 | |
| Alamos Gold | | | 8,450 | | | | 58,182 | |
| Argonaut Gold, * | | | 10,289 | | | | 17,244 | |
| Asanko Gold * | | | 10,000 | | | | 14,696 | |
The accompanying notes are an integral part of the financial statements.
Schedule of Investments | April 30, 2015 (Unaudited) |
| | |
| Global X Junior Miners ETF |
| | | Shares | | | Value | |
| COMMON STOCK — continued |
| |
| Basic Materials — continued | | | | | | | | |
| AuRico Gold | | | 16,680 | | | $ | 58,213 | |
| B2Gold * | | | 58,618 | | | | 91,466 | |
| Capstone Mining * | | | 22,067 | | | | 30,607 | |
| Centerra Gold | | | 10,627 | | | | 54,747 | |
| China Gold International Resources * | | | 15,611 | | | | 26,034 | |
| Continental Gold * | | | 7,831 | | | | 14,224 | |
| Denison Mines * | | | 28,871 | | | | 25,504 | |
| Detour Gold * | | | 10,387 | | | | 109,337 | |
| Dominion Diamond | | | 5,293 | | | | 103,915 | |
| Dundee Precious Metals * | | | 6,670 | | | | 16,025 | |
| Endeavour Silver * | | | 6,503 | | | | 13,136 | |
| Fission Uranium * | | | 23,116 | | | | 22,138 | |
| Fortuna Silver Mines * | | | 8,328 | | | | 31,421 | |
| HudBay Minerals, Cl B | | | 15,469 | | | | 152,359 | |
| IAMGOLD * | | | 5,313 | | | | 11,843 | |
| IAMGOLD *^ | | | 19,576 | | | | 43,850 | |
| Ivanhoe Mines, Cl A * | | | 33,323 | | | | 31,913 | |
| Lake Shore Gold * | | | 28,119 | | | | 27,626 | |
| MAG Silver * | | | 3,668 | | | | 25,377 | |
| Nevsun Resources *^ | | | 2,788 | | | | 10,956 | |
| Nevsun Resources * | | | 10,429 | | | | 40,882 | |
| Novagold Resources * | | | 15,418 | | | | 59,205 | |
| Osisko Gold Royalties | | | 5,354 | | | | 71,475 | |
| Pan American Silver | | | 9,970 | | | | 94,914 | |
| Premier Gold Mines * | | | 9,951 | | | | 20,210 | |
| Primero Mining * | | | 10,717 | | | | 39,373 | |
| Romarco Minerals * | | | 46,500 | | | | 17,468 | |
| Rubicon Minerals *^ | | | 3,930 | | | | 4,315 | |
| Rubicon Minerals * | | | 19,943 | | | | 21,937 | |
| Sandstorm Gold *^ | | | 1,240 | | | | 4,392 | |
| Sandstorm Gold * | | | 5,969 | | | | 21,369 | |
| Seabridge Gold * | | | 2,611 | | | | 16,554 | |
| SEMAFO * | | | 18,460 | | | | 56,542 | |
| Sherritt International | | | 18,286 | | | | 37,742 | |
| Silver Standard Resources * | | | 5,228 | | | | 28,466 | |
| Silvercorp Metals | | | 10,669 | | | | 13,230 | |
| Thompson Creek Metals * | | | 12,904 | | | | 16,259 | |
| Torex Gold Resources * | | | 52,235 | | | | 48,300 | |
| TOTAL CANADA | | | | | | | 1,646,143 | |
The accompanying notes are an integral part of the financial statements.
Schedule of Investments | April 30, 2015 (Unaudited) |
| | |
| Global X Junior Miners ETF |
| | | Shares | | | Value | |
| COMMON STOCK — continued |
| |
| CHINA— 0.9% | | | | | | | | |
| Basic Materials — 0.9% | | | | |
| Zhaojin Mining Industry | | | 52,900 | | | $ | 37,809 | |
| | | | | | | | | |
| EGYPT— 1.7% | | | | | | | | |
| Basic Materials — 1.7% | | | | |
| Centamin | | | 68,089 | | | | 66,444 | |
| | | | | | | | | |
| HONG KONG— 2.3% | | | | | | | | |
| Basic Materials — 1.1% | | | | |
| China Precious Metal Resources Holdings * | | | 256,900 | | | | 21,875 | |
| North Mining Shares, Cl C * | | | 460,500 | | | | 22,576 | |
| | | | | | | | 44,451 | |
| Energy — 1.2% | | | | |
| Shougang Fushan Resources Group | | | 181,336 | | | | 46,555 | |
| TOTAL HONG KONG | | | | | | | 91,006 | |
| | | | | | | | | |
| INDONESIA— 2.0% | | | | | | | | |
| Basic Materials — 2.0% | | | | | | | | |
| Aneka Tambang Persero * | | | 216,068 | | | | 13,252 | |
| Bumi Resources * | | | 1,976,700 | | | | 10,979 | |
| Indo Tambangraya Megah | | | 25,700 | | | | 24,981 | |
| Tambang Batubara Bukit Asam Persero | | | 43,900 | | | | 31,666 | |
| TOTAL INDONESIA | | | | | | | 80,878 | |
| | | | | | | | | |
| JAPAN— 2.6% | | | | | | | | |
| Basic Materials — 2.6% | | | | | | | | |
| Pacific Metals | | | 9,065 | | | | 27,725 | |
| Toho Zinc | | | 8,247 | | | | 31,907 | |
| UACJ | | | 15,862 | | | | 46,259 | |
| TOTAL JAPAN | | | | | | | 105,891 | |
| | | | | | | | | |
| MONGOLIA— 0.4% | | | | | | | | |
| Basic Materials — 0.4% | | | | |
| Mongolian Mining * | | | 277,300 | | | | 15,384 | |
| | | | | | | | | |
| PERU— 0.4% | | | | | | | | |
| Basic Materials — 0.4% | | | | |
| Hochschild Mining | | | 10,800 | | | | 16,099 | |
| | | | | | | | | |
| POLAND— 0.3% | | | | | | | | |
| Basic Materials — 0.3% | | | | |
| Jastrzebska Spolka Weglowa | | | 3,400 | | | | 13,519 | |
The accompanying notes are an integral part of the financial statements.
| Schedule of Investments | April 30, 2015 (Unaudited) |
| | |
| Global X Junior Miners ETF |
| | | Shares | | | Value | |
| COMMON STOCK — continued |
| |
| RUSSIA— 0.2% | | | | | | | | |
| Basic Materials — 0.2% | | | | |
| Raspadskaya * | | | 9,217 | | | $ | 6,562 | |
| | | | | | | | | |
| SOUTH AFRICA— 5.7% | | | | | | | | |
| Basic Materials — 5.7% | | | | |
| Assore | | | 1,600 | | | | 15,436 | |
| Harmony Gold Mining ADR * | | | 14,502 | | | | 28,134 | |
| Northam Platinum * | | | 15,217 | | | | 62,148 | |
| Sibanye Gold ADR | | | 13,000 | | | | 122,850 | |
| TOTAL SOUTH AFRICA | | | | | | | 228,568 | |
| | | | | | | | | |
| THAILAND— 2.7% | | | | | | | | |
| Basic Materials — 2.7% | | | | |
| Banpu^ | | | 4,200 | | | | 3,695 | |
| Banpu | | | 116,700 | | | | 102,663 | |
| TOTAL THAILAND | | | | | | | 106,358 | |
| | | | | | | | | |
| TURKEY— 0.7% | | | | | | | | |
| Basic Materials — 0.7% | | | | |
| Koza Altin Isletmeleri | | | 2,260 | | | | 23,528 | |
| Park Elektrik Uretim Madencilik Sanayi ve Ticaret | | | 3,200 | | | | 4,498 | |
| TOTAL TURKEY | | | | | | | 28,026 | |
| | | | | | | | | |
| UNITED KINGDOM— 4.4% | | | | | | | | |
| Basic Materials — 4.4% | | | | |
| African Minerals *(A)(B) | | | 17,933 | | | | 3 | |
| Ferrexpo | | | 21,416 | | | | 25,671 | |
| KAZ Minerals | | | 24,076 | | | | 96,604 | |
| Vedanta Resources | | | 5,395 | | | | 52,108 | |
| TOTAL UNITED KINGDOM | | | | | | | 174,386 | |
| | | | | | | | | |
| UNITED STATES— 16.0% | | | | | | | | |
| Basic Materials — 16.0% | | | | |
| Alacer Gold | | | 19,193 | | | | 43,259 | |
| Alpha Natural Resources * | | | 13,969 | | | | 11,315 | |
| Arch Coal | | | 13,625 | | | | 13,274 | |
| Century Aluminum * | | | 3,407 | | | | 43,916 | |
| Cloud Peak Energy * | | | 3,906 | | | | 25,350 | |
| Coeur d'Alene Mines * | | | 6,656 | | | | 34,744 | |
| First Majestic Silver * | | | 7,533 | | | | 36,686 | |
| Hecla Mining | | | 24,223 | | | | 73,153 | |
| Lonmin | | | 27,337 | | | | 60,537 | |
| McEwen Mining * | | | 12,554 | | | | 12,554 | |
| RTI International Metals * | | | 2,003 | | | | 75,413 | |
The accompanying notes are an integral part of the financial statements.
| Schedule of Investments | April 30, 2015 (Unaudited) |
| | |
| Global X Junior Miners ETF |
| | | Shares/Number of
Rights/Face Value | | | Value | |
| COMMON STOCK — continued |
| |
| Basic Materials — continued | | | | | | | | |
| Stillwater Mining * | | | 7,823 | | | $ | 105,063 | |
| SunCoke Energy | | | 4,247 | | | | 74,450 | |
| Westmoreland Coal * | | | 1,044 | | | | 29,670 | |
| TOTAL UNITED STATES | | | | | | | 639,384 | |
| TOTAL COMMON STOCK | | | | | | | | |
| (Cost $5,404,618) | | | | | | | 3,980,714 | |
| |
| RIGHT — 0.0% |
| South Africa — 0.0% | | | | |
| Northam Platinum Limited, Expires 05/11/2015, Exercise Price 41.00, ZAR* (Costs $—) | | | 4,294 | | | | 75 | |
| | | | | | | | | |
| TIME DEPOSIT — 0.2% |
| Brown Brothers Harriman, 0.030%, 05/01/15 | | | | | | | | |
| (Cost $9,035) | | $ | 9,035 | | | | 9,035 | |
| | | | | | | | | |
| TOTAL INVESTMENTS — 99.9% | | | | | | | | |
| (Cost $5,413,653) | | | | | | $ | 3,989,824 | |
Percentages are based on Net Assets of $3,993,742.
| * | Non-income producing security. |
| ^ | Traded on U.S. Stock Exchange. |
| (A) | Security is fair valued using methods determined in good faith by the Fair Value Committee of the Fund. The total value of such securities as of April 30, 2015 was $92 and represents 0.0% of Net Assets. |
| (B) | Security considered illiquid. The total value of such security as of April 30, 2015 was $92 and represented 0.0% of Net Assets. |
Amounts designated as” —“ are $0 have been rounded to $0.
ADR — American Depositary Receipt
Cl — Class
ZAR — South African Rand
The following is a summary of the inputs used as of April 30, 2015, in valuing the Fund's investments carried at value:
| Investments in Securities | | Level 1 | | | Level 2 | | | Level 3(a) | | | Total | |
| Common Stock | | $ | 3,980,622 | | | $ | — | | | $ | 92 | | | $ | 3,980,714 | |
| Time Deposit | | | — | | | | 9,035 | | | | — | | | | 9,035 | |
| Rights | | | 75 | | | | — | | | | — | | | | 75 | |
| Total Investments in Securities | | $ | 3,980,697 | | | $ | 9,035 | | | $ | 92 | | | $ | 3,989,824 | |
| (a) | A reconciliation of Level 3 investments and disclosures of significant unobservable inputs are presented when the Fund has a significant amount of Level 3 investments at the beginning and/or end of the period in relation to net assets. |
Management has concluded that Level 3 investments are not material in relation to net assets.
For the period ended April 30, 2015, there have been no transfers between Level 1, Level 2 or Level 3 investments.
The accompanying notes are an integral part of the financial statements.
| Statements of Assets and Liabilities |
| April 30, 2015 (Unaudited) |
| | | Global X Silver
Miners ETF | | | Global X Gold Explorers ETF | | | Global X Copper
Miners ETF | | | Global X Uranium
ETF | |
| Assets: | | | | | | | | | | | | | | | | |
| Cost of Investments | | $ | 288,867,539 | | | $ | 45,770,952 | | | $ | 35,578,594 | | | $ | 195,903,222 | |
| Cost of Repurchase Agreements | | | 7,406,470 | | | | 1,131,938 | | | | 1,998,492 | | | | 19,929,835 | |
| Cost of Affiliated Investments | | | — | | | | 7,837,855 | | | | — | | | | 151,721,359 | |
| Cost of Foreign Currency | | | 32,867 | | | | — | | | | — | | | | — | |
| | | | | | | | | | | | | | | | | |
| Investments, at Value | | $ | 178,547,233 | * | | $ | 28,207,996 | * | | $ | 27,119,977 | * | | $ | 157,629,204 | * |
| Repurchase Agreement, at Value | | | 7,406,470 | | | | 1,131,938 | | | | 1,998,492 | | | | 19,929,835 | |
| Affiliated Investments, at Value | | | — | | | | 4,350,903 | | | | — | | | | 100,982,196 | |
| Foreign Currency, at Value | | | — | | | | 5 | | | | 5 | | | | 9 | |
| Receivable for Investment Securities Sold | | | 11,029,707 | | | | 274,137 | | | | 2,144,607 | | | | — | |
| Dividend and Interest Receivable | | | 166,104 | | | | 25,120 | | | | 46,047 | | | | 150,473 | |
| Unrealized Appreciation on Spot Contracts | | | — | | | | 20 | | | | — | | | | — | |
| Receivable for Capital Shares Sold | | | — | | | | — | | | | — | | | | 1,789,197 | |
| Reclaim Receivable | | | — | | | | — | | | | 20,742 | | | | — | |
| Total Assets | | | 197,149,514 | | | | 33,990,119 | | | | 31,329,870 | | | | 280,480,914 | |
| Liabilities: | | | | | | | | | | | | | | | | |
| Payable for Investment Securities Purchased | | | 10,898,027 | | | | 281,822 | | | | 2,150,984 | | | | 1,785,768 | |
| Obligation to Return Securities Lending Collateral | | | 7,406,470 | | | | 1,131,938 | | | | 1,998,492 | | | | 19,929,835 | |
| Cash Overdraft | | | 283,213 | | | | 25,979 | | | | — | | | | 24,720,400 | |
| Payable due to Investment Adviser | | | 92,009 | | | | 16,279 | | | | 13,046 | | | | 118,285 | |
| Overdraft of Foreign Currency* | | | 32,867 | | | | — | | | | — | | | | — | |
| Unrealized Depreciation on Spot Contracts | | | 165 | | | | 11 | | | | 12 | | | | — | |
| Total Liabilities | | | 18,712,751 | | | | 1,456,029 | | | | 4,162,534 | | | | 46,554,288 | |
| Net Assets | | $ | 178,436,763 | | | $ | 32,534,090 | | | $ | 27,167,336 | | | $ | 233,926,626 | |
| Net Assets Consist of: | | | | | | | | | | | | | | | | |
| Paid-in Capital | | $ | 468,746,663 | | | $ | 90,118,768 | | | $ | 49,248,027 | | | $ | 554,854,001 | |
| Undistributed (Distributions in Excess of) Net Investment Income | | | 216,966 | | | | 234,926 | | | | (173,090 | ) | | | 413,498 | |
| Accumulated Net Realized Loss on Investments and Foreign Currency Transactions | | | (180,210,185 | ) | | | (36,770,171 | ) | | | (13,460,398 | ) | | | (232,327,693 | ) |
| Net Unrealized Appreciation/Depreciation on Investments | | | (110,320,306 | ) | | | (21,049,908 | ) | | | (8,458,617 | ) | | | (89,013,181 | ) |
| Net Unrealized Appreciation/Depreciation on Foreign Currency Translation | | | 3,625 | | | | 475 | | | | 11,414 | | | | 1 | |
| Net Assets | | $ | 178,436,763 | | | $ | 32,534,090 | | | $ | 27,167,336 | | | $ | 233,926,626 | |
| Outstanding Shares of Beneficial Interest | | | | | | | | | | | | | | | | |
| (unlimited authorization — no par value) | | | 20,100,000 | | | | 2,924,758 | | | | 3,400,000 | | | | 20,015,071 | |
| Net Asset Value, Offering and Redemption Price Per Share | | $ | 8.88 | | | $ | 11.12 | | | $ | 7.99 | | | $ | 11.69 | |
| *Includes Market Value of Securities on Loan | | $ | 6,492,409 | | | $ | 1,016,203 | | | $ | 1,822,630 | | | $ | 16,373,711 | |
The accompanying notes are an integral part of the financial statements.
| Statements of Assets and Liabilities |
| April 30, 2015 (Unaudited) |
| | | Global X Lithium
ETF | | | Global X
Fertilizers/Potash
ETF | | | Global X Junior
Miners ETF | |
| Assets: | | | | | | | | | | | | |
| Cost of Investments | | $ | 54,308,931 | | | $ | 19,041,063 | | | $ | 5,413,653 | |
| Cost of Repurchase Agreement | | | 299,890 | | | | — | | | | — | |
| Cost of Foreign Currency | | | 3 | | | | 3,983 | | | | 3,751 | |
| | | | | | | | | | | | | |
| Investments, at Value | | $ | 53,717,593 | * | | $ | 14,577,879 | | | $ | 3,989,824 | |
| Repurchase Agreement, at Value | | | 299,890 | | | | — | | | | — | |
| Foreign Currency, at Value | | | 3 | | | | 3,980 | | | | 3,745 | |
| Dividend and Interest Receivable | | | 64,399 | | | | 29,406 | | | | 4,187 | |
| Reclaim Receivable | | | 3,255 | | | | 26,146 | | | | 1,393 | |
| Unrealized Appreciation on Spot Contracts | | | — | | | | 3,975 | | | | — | |
| Total Assets | | | 54,085,140 | | | | 14,641,386 | | | | 3,999,149 | |
| Liabilities: | | | | | | | | | | | | |
| Cash Overdraft | | | 5,936,555 | | | | 403 | | | | 3,250 | |
| Obligation to Return Securities Lending Collateral | | | 299,890 | | | | — | | | | — | |
| Payable due to Investment Adviser | | | 28,331 | | | | 8,512 | | | | 2,157 | |
| Unrealized Depreciation on Spot Contracts | | | — | | | | 3,973 | | | | — | |
| Total Liabilities | | | 6,264,776 | | | | 12,888 | | | | 5,407 | |
| Net Assets | | $ | 47,820,364 | | | $ | 14,628,498 | | | $ | 3,993,742 | |
| Net Assets Consist of: | | | | | | | | | | | | |
| Paid-in Capital | | $ | 98,171,887 | | | $ | 21,636,935 | | | $ | 9,667,511 | |
| Undistributed (Distributions in Excess of) Net Investment Income | | | (27,618 | ) | | | 229,523 | | | | (23,532 | ) |
| Accumulated Net Realized (Loss) on Investments and Foreign Currency Transactions | | | (49,732,476 | ) | | | (2,773,596 | ) | | | (4,226,392 | ) |
| Net Unrealized Depreciation on Investments | | | (591,338 | ) | | | (4,463,184 | ) | | | (1,423,829 | ) |
| Net Unrealized Depreciation on Foreign Currency Translations | | | (91 | ) | | | (1,180 | ) | | | (16 | ) |
| Net Assets | | $ | 47,820,364 | | | $ | 14,628,498 | | | $ | 3,993,742 | |
| Outstanding Shares of Beneficial Interest | | | | | | | | | | | | |
| (unlimited authorization — no par value) | | | 3,800,000 | | | | 1,250,000 | | | | 333,201 | |
| Net Asset Value, Offering and Redemption Price Per Share | | $ | 12.58 | | | $ | 11.70 | | | $ | 11.99 | |
| *Includes Market Value of Securities on Loan | | $ | 230,578 | | | $ | — | | | $ | — | |
The accompanying notes are an integral part of the financial statements.
| Statements of Operations |
| For the period ended April 30, 2015 (Unaudited) |
| | | Global X Silver
Miners ETF | | | Global X Gold
Explorers ETF | | | Global X Copper
Miners ETF | | | Global X Uranium
ETF | |
| Investment Income: | | | | | | | | | | | | | | | | |
| Dividend Income | | $ | 1,056,743 | | | $ | 135,893 | | | $ | 141,031 | | | $ | 520,495 | |
| Interest Income | | | 98 | | | | — | | | | 3 | | | | 46 | |
| Security Lending Income | | | 35,333 | | | | 245,651 | | | | 13,556 | | | | 1,062,271 | |
| Less: Foreign Taxes Withheld | | | (95,362 | ) | | | — | | | | (6,387 | ) | | | (78,074 | ) |
| Total Investment Income | | | 996,812 | | | | 381,544 | | | | 148,203 | | | | 1,504,738 | |
| Supervision and Administration Fees(1) | | | 595,000 | | | | 99,758 | | | | 75,111 | | | | 729,893 | |
| Total Expenses | | | 595,000 | | | | 99,758 | | | | 75,111 | | | | 729,893 | |
| Net Investment Income | | | 401,812 | | | | 281,786 | | | | 73,092 | | | | 774,845 | |
| Net Realized Gain on: | | | | | | | | | | | | | | | | |
| Investments (2) | | | (40,771,610 | ) | | | (6,386,781 | ) | | | (2,315,429 | ) | | | (5,044,114 | ) |
| Affiliated Investments | | | — | | | | — | | | | — | | | | (5,970,528 | ) |
| Foreign Currency Translations | | | 20,312 | | | | (28,286 | ) | | | (8,186 | ) | | | (17,483 | ) |
| Net Realized Loss on Investments and Foreign Currency Transactions | | | (40,751,298 | ) | | | (6,415,067 | ) | | | (2,323,615 | ) | | | (11,032,125 | ) |
| Net Change in Unrealized Appreciation on: | | | | | | | | | | | | | | | | |
| Investments | | | 43,757,111 | | | | 8,822,648 | | | | 2,042,004 | | | | 4,614,201 | |
| Affiliated Investments | | | — | | | | 1,658,509 | | | | — | | | | 15,574,393 | |
| Foreign Currency Translations | | | 10,725 | | | | 475 | | | | 2,861 | | | | — | |
| Net Change in Unrealized Appreciation on Investments and Foreign Currency Translations | | | 43,767,836 | | | | 10,481,632 | | | | 2,044,865 | | | | 20,188,594 | |
| Net Realized and Unrealized Gain (Loss) on Investments and Foreign Currency Transactions and Translations | | | 3,016,538 | | | | 4,066,565 | | | | (278,750 | ) | | | 9,156,469 | |
| Net Increase (Decrease) in Net Assets Resulting from Operations | | $ | 3,418,350 | | | $ | 4,348,351 | | | $ | (205,658 | ) | | $ | 9,931,314 | |
| (1) | The Supervision and Administration fees reflect the supervisory and administrative fee, which includes fees paid by the Funds for the investment advisory services provided by the Adviser. (See Note 3 in Notes to Financial Statements.) |
| (2) | Includes realized gains (losses) as a result of in-kind redemptions. (See Note 4 in Notes to Financial Statements.) |
The accompanying notes are an integral part of the financial statements.
| Statements of Operations |
| For the period ended April 30, 2015 (Unaudited) |
| | | Global X Lithium
ETF | | | Global X
Fertilizers/Potash
ETF | | | Global X Junior
Miners ETF | |
| Investment Income: | | | | | | | | | | | | |
| Dividend Income | | $ | 348,726 | | | $ | 342,632 | | | $ | 25,148 | |
| Interest Income | | | 22 | | | | 3 | | | | 2 | |
| Security Lending Income | | | 7,030 | | | | — | | | | — | |
| Less: Foreign Taxes Withheld | | | (30,092 | ) | | | (15,367 | ) | | | (3,521 | ) |
| Total Investment Income | | | 325,686 | | | | 327,268 | | | | 21,629 | |
| Supervision and Administration Fees(1) | | | 171,116 | | | | 52,715 | | | | 13,836 | |
| Total Expenses | | | 171,116 | | | | 52,715 | | | | 13,836 | |
| Net Investment Income | | | 154,570 | | | | 274,553 | | | | 7,793 | |
| Net Realized Gain (Loss) on: | | | | | | | | | | | | |
| Investments (2) | | | 2,255,280 | | | | (325,689 | ) | | | (988,397 | ) |
| Foreign Currency Transactions | | | (16,241 | ) | | | (3,717 | ) | | | (952 | ) |
| Net Realized Gain (Loss) on Investments and Foreign Currency Translations | | | 2,239,039 | | | | (329,406 | ) | | | (989,349 | ) |
| Net Change in Unrealized Appreciation on: | | | | | | | | | | | | |
| Investments | | | 154,331 | | | | 1,525,991 | | | | 1,056,625 | |
| Foreign Currency Transactions | | | (10 | ) | | | 242 | | | | (78 | ) |
| Net Change in Unrealized Appreciation on Investments and Foreign Currency Translations | | | 154,321 | | | | 1,526,233 | | | | 1,056,547 | |
| Net Realized and Unrealized Gain on Investments and Foreign Currency Transactions and Translations | | | 2,393,360 | | | | 1,196,827 | | | | 67,198 | |
| Net Increase in Net Assets Resulting from Operations | | $ | 2,547,930 | | | $ | 1,471,380 | | | $ | 74,991 | |
| (1) | The Supervision and Administration fees reflect the supervisory and administrative fee, which includes fees paid by the Funds for the investment advisory services provided by the Adviser. (See Note 3 in Notes to Financial Statements.) |
| (2) | Includes realized gains (losses) as a result of in-kind redemptions. (See Note 4 in Notes to Financial Statements.) |
The accompanying notes are an integral part of the financial statements.
| Statements of Changes in Net Assets |
| | | Global X Silver Miners ETF | | | Global X Gold Explorers ETF | |
| | | Period Ended
April 30, 2015
(Unaudited) | | | Year Ended
October 31, 2014 | | | Period Ended
April 30, 2015
(Unaudited) | | | Year Ended
October 31, 2014 | |
| Operations: | | | | | | | | | | | | | | | | |
| Net Investment Income | | $ | 401,812 | | | $ | 559,003 | | | $ | 281,786 | | | $ | 9,678 | |
| Net Realized Loss on Investments and Foreign Currency Transactions | | | (40,751,298 | ) | | | (57,363,296 | ) | | | (6,415,067 | ) | | | (6,993,259 | ) |
| Net Change in Unrealized Appreciation (Depreciation) on Investments and Foreign Currency Translations | | | 43,767,836 | | | | (23,879,356 | ) | | | 10,481,632 | | | | (6,020,331 | ) |
| Net Increase (Decrease) in Net Assets Resulting from Operations | | | 3,418,350 | | | | (80,683,649 | ) | | | 4,348,351 | | | | (13,003,912 | ) |
| Dividends and Distributions from: | | | | | | | | | | | | | | | | |
| Net Investment Income | | | (129,601 | ) | | | (1,275,569 | ) | | | (40,294 | ) | | | — | |
| Total Dividends and Distributions | | | (129,601 | ) | | | (1,275,569 | ) | | | (40,294 | ) | | | — | |
| Capital Share Transactions: | | | | | | | | | | | | | | | | |
| Issued | | | 13,985,934 | | | | 50,580,032 | | | | 512,018 | | | | 16,427,825 | |
| Redeemed | | | (9,802,921 | ) | | | (15,895,569 | ) | | | — | | | | (7,729,518 | ) |
| Increase in Net Assets from Capital Share Transactions | | | 4,183,013 | | | | 34,684,463 | | | | 512,018 | | | | 8,698,307 | |
| Total Increase (Decrease) in Net Assets | | | 7,471,762 | | | | (47,274,755 | ) | | | 4,820,075 | | | | (4,305,605 | ) |
| Net Assets: | | | | | | | | | | | | | | | | |
| Beginning of Period | | | 170,965,001 | | | | 218,239,756 | | | | 27,714,015 | | | | 32,019,620 | |
| End of Period | | $ | 178,436,763 | | | $ | 170,965,001 | | | $ | 32,534,090 | | | $ | 27,714,015 | |
| Undistributed (Distributions in Excess of) Net Investment Income/Accumulated Net Investment Loss | | $ | 216,966 | | | $ | (55,245 | ) | | $ | 234,926 | | | $ | (6,566 | ) |
| Share Transactions: | | | | | | | | | | | | | | | | |
| Issued | | | 1,550,000 | | | | 4,000,000 | | | | 50,000 | | | | 1,050,000 | |
| Redeemed | | | (1,050,000 | ) | | | (1,350,000 | ) | | | — | | | | (550,000 | ) |
| Net Increase in Shares Outstanding from Share Transactions | | | 500,000 | | | | 2,650,000 | | | | 50,000 | | | | 500,000 | |
| (1) | Includes realized gain (loss) as a result of in-kind transactions. (See Note 4 in Notes to Financial Statements.) |
The accompanying notes are an integral part of the financial statements.
Statements of Changes in Net Assets
| | | Global X Copper Miners ETF | | | Global X Uranium ETF | |
| | | Period Ended
April 30, 2015
(Unaudited) | | | Year Ended
October 31, 2014 | | | Period Ended
April 30, 2015
(Unaudited) | | | Year Ended
October 31, 2014 | |
| Operations: | | | | | | | | | | | | | | | | |
| Net Investment Income | | $ | 73,092 | | | $ | 520,075 | | | $ | 774,845 | | | $ | 625,871 | |
| Net Realized Loss on Investments and Foreign Currency Transactions | | | (2,323,615 | ) | | | (4,443,768 | ) | | | (11,032,125 | ) | | | (15,576,876 | ) |
| Net Change in Unrealized Appreciation (Depreciation) on Investments and Foreign Currency Translations | | | 2,044,865 | | | | (631,833 | ) | | | 20,188,594 | | | | (53,291,525 | ) |
| Net Increase (Decrease) in Net Assets Resulting from Operations | | | (205,658 | ) | | | (4,555,526 | ) | | | 9,931,314 | | | | (68,242,530 | ) |
| Dividends and Distributions from: | | | | | | | | | | | | | | | | |
| Net Investment Income | | | (509,286 | ) | | | (225,417 | ) | | | (9,307,517 | ) | | | (734,117 | ) |
| Total Dividends and Distributions | | | (509,286 | ) | | | (225,417 | ) | | | (9,307,517 | ) | | | (734,117 | ) |
| Capital Share Transactions: | | | | | | | | | | | | | | | | |
| Issued | | | 2,979,045 | | | | 4,282,425 | | | | 26,496,989 | | | | 170,458,752 | |
| Redeemed | | | (2,149,530 | ) | | | (5,276,910 | ) | | | (5,550,772 | ) | | | (7,996,486 | ) |
| Increase (Decrease) in Net Assets from Capital Share Transactions | | | 829,515 | | | | (994,485 | ) | | | 20,946,217 | | | | 162,462,266 | |
| Total Increase (Decrease) in Net Assets | | | 114,571 | | | | (5,775,428 | ) | | | 21,570,014 | | | | 93,485,619 | |
| Net Assets: | | | | | | | | | | | | | | | | |
| Beginning of Period | | | 27,052,765 | | | | 32,828,193 | | | | 212,356,612 | | | | 118,870,993 | |
| End of Period | | $ | 27,167,336 | | | $ | 27,052,765 | | | $ | 233,926,626 | | | $ | 212,356,612 | |
| Undistributed (Distributions in Excess of) Net Investment Income/Accumulated Net Investment Loss | | $ | (173,090 | ) | | $ | 263,104 | | | $ | 413,498 | | | $ | 15,720 | |
| Share Transactions: | | | | | | | | | | | | | | | | |
| Issued | | | 450,000 | | | | 450,000 | | | | 2,250,000 | | | | 10,600,000 | |
| Redeemed | | | (300,000 | ) | | | (550,000 | ) | | | (500,000 | ) | | | (550,000 | ) |
| Net Increase (Decrease) in Shares Outstanding from Share Transactions | | | 150,000 | | | | (100,000 | ) | | | 1,750,000 | | | | 10,050,000 | |
| (1) | Includes realized gain (loss) as a result of in-kind transactions. (See Note 4 in Notes to Financial Statements.) |
The accompanying notes are an integral part of the financial statements.
Statements of Changes in Net Assets
| | | Global X Lithium ETF | | | Global X Fertilizers/Potash ETF | |
| | | Period Ended
April 30, 2015
(Unaudited) | | | Year Ended
October 31, 2014 | | | Period Ended
April 30, 2015
(Unaudited) | | | Year Ended
October 31, 2014 | |
| Operations: | | | | | | | | | | | | | | | | |
| Net Investment Income | | $ | 154,570 | | | $ | 414,582 | | | $ | 274,553 | | | $ | 386,118 | |
| Net Realized Gain (Loss) on Investments and Foreign Currency Translations | | | 2,239,039 | | | | (9,617,499 | ) | | | (329,406 | ) | | | (926,245 | ) |
| Net Change in Unrealized Appreciation (Depreciation) on Investments and Foreign Currency Translations | | | 154,321 | | | | 4,632,660 | | | | 1,526,233 | | | | (642,621 | ) |
| Net Increase (Decrease) in Net Assets Resulting from Operations | | | 2,547,930 | | | | (4,570,257 | ) | | | 1,471,380 | | | | (1,182,748 | ) |
| Dividends and Distributions from: | | | | | | | | | | | | | | | | |
| Net Investment Income | | | (471,239 | ) | | | (160,079 | ) | | | (350,078 | ) | | | (366,898 | ) |
| Total Dividends and Distributions | | | (471,239 | ) | | | (160,079 | ) | | | (350,078 | ) | | | (366,898 | ) |
| Capital Share Transactions: | | | | | | | | | | | | | | | | |
| Issued | | | — | | | | 10,505,000 | | | | — | | | | — | |
| Redeemed | | | (4,645,550 | ) | | | (6,490,918 | ) | | | (2,253,868 | ) | | | (5,553,179 | ) |
| Increase (Decrease) in Net Assets from Capital Share Transactions | | | (4,645,550 | ) | | | 4,014,082 | | | | (2,253,868 | ) | | | (5,553,179 | ) |
| Total Decrease in Net Assets | | | (2,568,859 | ) | | | (716,254 | ) | | | (1,132,566 | ) | | | (7,102,825 | ) |
| Net Assets: | | | | | | | | | | | | | | | | |
| Beginning of Period | | | 50,389,223 | | | | 51,105,477 | | | | 15,761,064 | | | | 22,863,889 | |
| End of Period | | $ | 47,820,364 | | | $ | 50,389,223 | | | $ | 14,628,498 | | | $ | 15,761,064 | |
| Undistributed (Distributions in Excess of) Net Investment Income/Accumulated Net Investment Loss | | $ | (27,618 | ) | | $ | 289,051 | | | $ | 229,523 | | | $ | 305,048 | |
| Share Transactions: | | | | | | | | | | | | | | | | |
| Issued | | | — | | | | 750,000 | | | | — | | | | — | |
| Redeemed | | | (400,000 | ) | | | (500,000 | ) | | | (200,000 | ) | | | (500,000 | ) |
| Net Increase (Decrease) in Shares Outstanding from Share Transactions | | | (400,000 | ) | | | 250,000 | | | | (200,000 | ) | | | (500,000 | ) |
| (1) | Includes realized gain (loss) as a result of in-kind transactions. (See Note 4 in Notes to Financial Statements.) |
The accompanying notes are an integral part of the financial statements.
Statements of Changes in Net Assets
| | | Global X Junior Miners ETF | |
| | | Period Ended
April 30, 2015
(Unaudited) | | | Year Ended
October 31, 2014 | |
| Operations: | | | | | | | | |
| Net Investment Income | | $ | 7,793 | | | $ | 24,705 | |
| Net Realized Loss on Investments and Foreign Currency Transactions | | | (989,349 | ) | | | (456,727 | ) |
| Net Change in Unrealized Appreciation (Depreciation) on Investments and Foreign Currency Translations | | | 1,056,547 | | | | (1,428,513 | ) |
| Net Increase (Decrease) in Net Assets Resulting from Operations | | | 74,991 | | | | (1,860,535 | ) |
| Dividends and Distributions from: | | | | | | | | |
| Net Investment Income | | | (28,543 | ) | | | — | |
| Total Dividends and Distributions | | | (28,543 | ) | | | — | |
| Capital Share Transactions: | | | | | | | | |
| Issued | | | — | | | | 2,436,603 | |
| Redeemed | | | (551,450 | ) | | | (1,614,086 | ) |
| Increase (Decrease) in Net Assets from Capital Share Transactions | | | (551,450 | ) | | | 822,517 | |
| Total Decrease in Net Assets | | | (505,002 | ) | | | (1,038,018 | ) |
| Net Assets: | | | | | | | | |
| Beginning of Period | | | 4,498,744 | | | | 5,536,762 | |
| End of Period | | $ | 3,993,742 | | | $ | 4,498,744 | |
| Undistributed (Distributions in Excess of) Net Investment Income/Accumulated Net Investment Loss | | $ | (23,532 | ) | | $ | (2,782 | ) |
| Share Transactions: | | | | | | | | |
| Issued | | | — | | | | 150,000 | |
| Redeemed | | | (50,000 | ) | | | (100,000 | ) |
| Net Increase (Decrease) in Shares Outstanding from Share Transactions | | | (50,000 | ) | | | 50,000 | |
| (1) | Includes realized gain (loss) as a result of in-kind transactions. (See Note 4 in Notes to Financial Statements.) |
The accompanying notes are an integral part of the financial statements.
Financial Highlights
Selected Per Share Data & Ratios
For a Share Outstanding Throughout the Period
| | | Net Asset
Value,
Beginning
of Period
($) | | | Net
Investment
Income
(Loss) ($)* | | | Net
Realized
and
Unrealized
Gain (Loss)
on
Investments
($) | | | Total from
Operations
($) | | | Distribution
from Net
Investment
Income ($) | | | Distribution
from
Capital
Gains ($) | | | Total from
Distributions
($) | | | Net Asset
Value,
End of
Period
($) | | | Total
Return
(%)** | | | Net
Assets
End of
Period
($)(000) | | | Ratio of
Expenses
to
Average
Net
Assets
(%) | | | Ratio of
Net
Investment
Income
(Loss) to
Average
Net Assets
(%) | | | Portfolio
Turnover
(%)†† | |
| Global X Silver Miners ETF | | | | | | | | | | | | | | | | | | | | | | | | | | | | | | | | | | | | | | | | | | |
| 2015(Unaudited) | | | 8.72 | | | | 0.02 | | | | 0.15 | | | | 0.17 | | | | (0.01 | ) | | | — | | | | (0.01 | ) | | | 8.88 | | | | 1.91 | | | | 178,437 | | | | 0.65 | † | | | 0.44 | † | | | 13.47 | |
| 2014 | | | 12.88 | | | | 0.03 | | | | (4.12 | ) | | | (4.09 | ) | | | (0.07 | ) | | | — | | | | (0.07 | ) | | | 8.72 | | | | (31.85 | ) | | | 170,965 | | | | 0.65 | | | | 0.24 | | | | 24.23 | |
| 2013 | | | 24.98 | | | | 0.11 | | | | (12.01 | ) | | | (11.90 | ) | | | (0.20 | ) | | | — | | | | (0.20 | ) | | | 12.88 | | | | (47.97 | ) | | | 218,240 | | | | 0.65 | | | | 0.67 | | | | 23.79 | |
| 2012 | | | 23.66 | | | | 0.13 | | | | 1.23 | | | | 1.36 | | | | (0.04 | ) | | | — | | | | (0.04 | ) | | | 24.98 | | | | 5.76 | | | | 385,967 | | | | 0.65 | | | | 0.62 | | | | 18.13 | |
| 2011 | | | 20.20 | | | | 0.04 | | | | 3.66 | | | | 3.70 | | | | (0.24 | ) | | | — | | | | (0.24 | ) | | | 23.66 | | | | 18.20 | | | | 363,106 | | | | 0.65 | | | | 0.16 | | | | 26.50 | |
| 2010(1) | | | 14.50 | | | | 0.05 | | | | 5.65 | | | | 5.70 | | | | — | | | | — | | | | — | | | | 20.20 | | | | 39.31 | | | | 171,672 | | | | 0.65 | † | | | 0.61 | † | | | 0.35 | |
| Global X Gold Explorers ETF | | | | | | | | | | | | | | | | | | | | | | | | | | | | | | | | | | | | | | | | | | |
| 2015(Unaudited) | | | 9.64 | | | | 0.10 | | | | 1.39 | | | | 1.49 | | | | (0.01 | ) | | | — | | | | (0.01 | ) | | | 11.12 | | | | 15.52 | | | | 32,534 | | | | 0.65 | † | | | 1.84 | † | | | 35.55 | |
| 2014 | | | 13.48 | | | | — | | | | (3.84 | ) | | | (3.84 | ) | | | — | | | | — | | | | — | | | | 9.64 | | | | (28.49 | ) | | | 27,714 | | | | 0.65 | | | | 0.02 | | | | 29.94 | |
| 2013(2) | | | 34.72 | | | | (0.12 | ) | | | (19.68 | ) | | | (19.80 | ) | | | (1.44 | ) | | | — | | | | (1.44 | ) | | | 13.48 | | | | (59.16 | ) | | | 32,020 | | | | 0.65 | | | | (0.65 | ) | | | 31.73 | |
| 2012(2) | | | 53.44 | | | | (0.24 | ) | | | (17.46 | ) | | | (17.70 | ) | | | (1.02 | ) | | | — | | | | (1.02 | ) | | | 34.72 | | | | (33.42 | ) | | | 41,251 | | | | 0.65 | | | | (0.65 | ) | | | 43.12 | |
| 2011(2)(3) | | | 61.96 | | | | (0.42 | ) | | | (8.10 | ) | | | (8.52 | ) | | | — | | | | — | | | | — | | | | 53.44 | | | | (13.75 | ) | | | 27,392 | | | | 0.65 | † | | | (0.65 | )† | | | 29.96 | |
| Global X Copper Miners ETF | | | | | | | | | | | | | | | | | | | | | | | | | | | | | | | | | | | | | | | | | | |
| 2015(Unaudited) | | | 8.32 | | | | 0.02 | | | | (0.18 | ) | | | (0.16 | ) | | | (0.17 | ) | | | — | | | | (0.17 | ) | | | 7.99 | | | | (1.75 | ) | | | 27,167 | | | | 0.65 | † | | | 0.63 | † | | | 10.58 | |
| 2014 | | | 9.80 | | | | 0.15 | | | | (1.56 | ) | | | (1.41 | ) | | | (0.07 | ) | | | — | | | | (0.07 | ) | | | 8.32 | | | | (14.49 | ) | | | 27,053 | | | | 0.65 | | | | 1.59 | | | | 15.77 | |
| 2013 | | | 12.93 | | | | 0.17 | | | | (2.87 | ) | | | (2.70 | ) | | | (0.43 | ) | | | — | | | | (0.43 | ) | | | 9.80 | | | | (21.69 | ) | | | 32,828 | | | | 0.65 | | | | 1.63 | | | | 37.06 | |
| 2012 | | | 14.92 | | | | 0.24 | | | | (1.32 | ) | | | (1.08 | ) | | | (0.57 | ) | | | (0.34 | ) | | | (0.91 | ) | | | 12.93 | | | | (7.08 | ) | | | 31,041 | | | | 0.65 | | | | 1.84 | | | | 28.90 | |
| 2011 | | | 16.63 | | | | 0.35 | | | | (1.97 | ) | | | (1.62 | ) | | | (0.09 | ) | | | — | | | | (0.09 | ) | | | 14.92 | | | | (9.85 | ) | | | 45,517 | | | | 0.65 | | | | 1.91 | | | | 15.78 | |
| 2010(1) | | | 14.40 | | | | — | | | | 2.23 | | | | 2.23 | | | | — | | | | — | | | | — | | | | 16.63 | | | | 15.49 | | | | 29,929 | | | | 0.65 | | | | 0.06 | † | | | 1.36 | |
| Global X Uranium ETF | | | | | | | | | | | | | | | | | | | | | | | | | | | | | | | | | | | | | | | | | | |
| 2015(Unaudited) | | | 11.63 | | | | 0.04 | | | | 0.51 | | | | 0.55 | | | | (0.49 | ) | | | — | | | | (0.49 | ) | | | 11.69 | | | | (19.18 | ) | | | 233,927 | | | | 0.69 | † | | | 0.73 | † | | | 0.48 | |
| 2014 | | | 14.47 | | | | 0.04 | | | | (2.80 | ) | | | (2.76 | ) | | | (0.08 | ) | | | — | | | | (0.08 | ) | | | 11.63 | | | | (19.18 | ) | | | 212,357 | | | | 0.69 | | | | 0.30 | | | | 20.90 | |
| 2013(4) | | | 21.03 | | | | 0.09 | | | | (6.28 | ) | | | (6.19 | ) | | | (0.37 | ) | | | — | | | | (0.37 | ) | | | 14.47 | | | | (29.88 | ) | | | 118,871 | | | | 0.69 | | | | 0.51 | | | | 73.16 | |
| 2012(4) | | | 30.27 | | | | 0.08 | | | | (9.32 | ) | | | (9.24 | ) | | | — | | | | — | | | | — | | | | 21.03 | | | | (30.53 | ) | | | 135,668 | | | | 0.69 | | | | 0.30 | | | | 55.90 | |
| 2011(4)(5) | | | 50.34 | | | | 0.44 | | | | (19.34 | ) | | | (18.90 | ) | | | (1.17 | ) | | | — | | | | (1.17 | ) | | | 30.27 | | | | (38.70 | ) | | | 199,349 | | | | 0.69 | † | | | 1.10 | † | | | 24.17 | |
| (1) | The Fund commenced operations on April 19, 2010. |
| (2) | Per share amounts have been adjusted for a 1 for 4 reverse share split on May 16, 2013. For more information see Note 9 in the Notes to Financial Statements |
| (3) | The Fund commenced operations on November 3, 2010. |
| (4) | Per share amounts have been adjusted for a 1 for 3 reverse share split on May 16, 2013. For more information see Note 9 in the Notes to Financial Statements |
| (5) | The Fund commenced operations on November 4, 2010. |
| * | Per share data calculated using average shares method. |
| ** | Total return is based on the change in net asset value of a share during the year or period and assumes reinvestment of dividends and distributions at net asset value. Total return is for the period indicated and periods of less than one year have not been annualized. The return shown does not reflect the deduction of taxes that a shareholder would pay on Fund distributions or the redemption of Fund shares. |
| † | Annualized. |
| †† | Portfolio turnover rate is for the period indicated and periods of less than one year have not been annualized. Excludes effect of in-kind transfers. |
Amounts designated as “—” are either $0 or have been rounded to $0.
The accompanying notes are an integral part of the financial statements.
Financial Highlights
Selected Per Share Data & Ratios
For a Share Outstanding Throughout the Period
| | | Net Asset
Value,
Beginning
of Period
($) | | | Net
Investment
Income
(Loss) ($)* | | | Net
Realized
and
Unrealized
Gain (Loss)
on
Investments
($) | | | Total from
Operations
($) | | | Distribution
from Net
Investment
Income ($) | | | Distribution
from
Capital
Gains ($) | | | Total from
Distributions
($) | | | Net Asset
Value,
End of
Period
($) | | | Total
Return
(%)** | | | Net
Assets
End of
Period
($)(000) | | | Ratio of
Expenses
to
Average
Net
Assets
(%) | | | Ratio of
Net
Investment
Income
(Loss) to
Average
Net Assets
(%) | | | Portfolio
Turnover
(%)†† | |
| Global X Lithium ETF | | | | | | | | | | | | | | | | | | | | | | | | | | | | | | | | | | | | | | | | | | |
| 2015(Unaudited) | | | 12.00 | | | | 0.04 | | | | 0.66 | | | | 0.70 | | | | (0.12 | ) | | | — | | | | (0.12 | ) | | | 12.58 | | | | 5.94 | | | | 47,820 | | | | 0.75 | † | | | 0.68 | † | | | 17.13 | |
| 2014 | | | 12.94 | | | | 0.10 | | | | (1.00 | ) | | | (0.90 | ) | | | (0.04 | ) | | | — | | | | (0.04 | ) | | | 12.00 | | | | (6.97 | ) | | | 50,389 | | | | 0.75 | | | | 0.75 | | | | 43.37 | |
| 2013 | | | 14.41 | | | | 0.03 | | | | (1.15 | ) | | | (1.12 | ) | | | (0.35 | ) | | | — | | | | (0.35 | ) | | | 12.94 | | | | (8.00 | ) | | | 51,105 | | | | 0.75 | | | | 0.21 | | | | 38.46 | |
| 2012 | | | 15.90 | | | | 0.21 | | | | (1.68 | ) | | | (1.47 | ) | | | (0.02 | ) | | | — | | | | (0.02 | ) | | | 14.41 | | | | (9.25 | ) | | | 69,871 | | | | 0.75 | | | | 1.40 | | | | 28.78 | |
| 2011 | | | 19.83 | | | | (0.04 | ) | | | (3.62 | ) | | | (3.66 | ) | | | (0.25 | ) | | | (0.02 | ) | | | (0.27 | ) | | | 15.90 | | | | (18.86 | ) | | | 107,301 | | | | 0.75 | | | | (0.22 | ) | | | 24.87 | |
| 2010(2) | | | 15.51 | | | | (0.03 | ) | | | 4.35 | | | | 4.32 | | | | — | | | | — | | | | — | | | | 19.83 | | | | 27.85 | | | | 78,317 | | | | 0.75 | † | | | (0.62 | )† | | | 5.55 | |
| Global X Fertilizers/Potash ETF | | | | | | | | | | | | | | | | | | | | | | | | | | | | | | | | | | | | | | | | | | |
| 2015(Unaudited) | | | 10.87 | | | | 0.20 | | | | 0.88 | | | | 1.08 | | | | (0.25 | ) | | | — | | | | (0.25 | ) | | | 11.70 | | | | 10.18 | | | | 14,628 | | | | 0.69 | † | | | 3.59 | † | | | 9.65 | |
| 2014 | | | 11.73 | | | | 0.23 | | | | (0.90 | ) | | | (0.67 | ) | | | (0.19 | ) | | | — | | | | (0.19 | ) | | | 10.87 | | | | (5.79 | ) | | | 15,761 | | | | 0.69 | | | | 1.98 | | | | 18.79 | |
| 2013 | | | 13.85 | | | | 0.25 | | | | (2.21 | ) | | | 1.96 | | | | (0.16 | ) | | | — | | | | (0.16 | ) | | | 11.73 | | | | (14.33 | ) | | | 22,383 | | | | 0.69 | | | | 1.93 | | | | 14.12 | |
| 2012 | | | 14.06 | | | | 0.19 | | | | (0.29 | ) | | | (0.10 | ) | | | (0.09 | ) | | | (0.02 | ) | | | (0.11 | ) | | | 13.85 | | | | (0.61 | ) | | | 28,383 | | | | 0.69 | | | | 1.42 | | | | 24.05 | |
| 2011(3) | | | 15.05 | | | | 0.06 | | | | (1.05 | ) | | | (0.99 | ) | | | — | | | | — | | | | — | | | | 14.06 | | | | (6.58 | ) | | | 35,160 | | | | 0.69 | † | | | 0.90 | † | | | 7.55 | |
| Global X Junior Miners ETF | | | | | | | | | | | | | | | | | | | | | | | | | | | | | | | | | | | | | | | | | | |
| 2015(Unaudited) | | | 11.74 | | | | 0.02 | | | | 0.32 | | | | 0.34 | | | | (0.09 | ) | | | — | | | | (0.09 | ) | | | 11.99 | | | | 2.90 | | | | 3,994 | | | | 0.69 | † | | | 0.39 | † | | | 14.63 | |
| 2014 | | | 16.62 | | | | 0.07 | | | | (4.95 | ) | | | (4.88 | ) | | | — | | | | — | | | | — | | | | 11.74 | | | | (29.36 | ) | | | 4,499 | | | | 0.69 | | | | 0.44 | | | | 27.75 | |
| 2013(1) | | | 32.52 | | | | 0.12 | | | | (12.64 | ) | | | (12.52 | ) | | | (3.38 | ) | | | — | | | | (3.38 | ) | | | 16.62 | | | | (42.49 | ) | | | 5,537 | | | | 0.69 | | | | 0.60 | | | | 37.23 | |
| 2012(1) | | | 34.59 | | | | (0.18 | ) | | | (1.03 | ) | | | (1.21 | ) | | | (0.86 | ) | | | — | | | | (0.86 | ) | | | 32.52 | | | | (3.16 | ) | | | 2,710 | | | | 0.75 | | | | (0.57 | ) | | | 167.10 | |
| 2011(1)(4) | | | 45.12 | | | | (0.20 | ) | | | (10.33 | ) | | | (10.53 | ) | | | — | | | | — | | | | — | | | | 34.59 | | | | (23.34 | ) | | | 2,882 | | | | 0.75 | † | | | (0.77 | )† | | | 28.23 | |
| (1) | Per share amounts have been adjusted for a 1 for 3 reverse share split on May 16, 2013. For more information see Note 9 in the Notes to Financial Statements. |
| (2) | The Fund commenced operations on July 22, 2010. |
| (3) | The Fund commenced operations on May 25, 2011. |
| (4) | The Fund commenced operations on March 16, 2011. |
| * | Per share data calculated using average shares method. |
| ** | Total return is based on the change in net asset value of a share during the year or period and assumes reinvestment of dividends and distributions at net asset value. Total return is for the period indicated and periods of less than one year have not been annualized. The return shown does not reflect the deduction of taxes that a shareholder would pay on Fund distributions or the redemption of Fund shares. |
| † | Annualized. |
| †† | Portfolio turnover rate is for the period indicated and periods of less than one year have not been annualized. Excludes effect of in-kind transfers. |
Amounts designated as “—” are either $0 or have been rounded to $0.
The accompanying notes are an integral part of the financial statements.
Notes to Financial Statements
April 30, 2015 (Unaudited)
1. ORGANIZATION
The Global X Funds (the “Trust”) is a Delaware statutory trust formed on March 6, 2008. The Trust is registered under the Investment Company Act of 1940, as amended, as an open-end management investment company. As of April 30, 2015, the Trust had ninety-four portfolios, forty-five of which were operational. The financial statements herein and the related notes pertain to the Global X Silver Miners ETF, Global X Gold Explorers ETF, Global X Copper Miners ETF, Global X Uranium ETF, Global X Lithium ETF, Global X Fertilizers/Potash ETF and Global X Junior Miners ETF (each a “Fund” and collectively, the “Funds”). Each Fund is non-diversified.
2. SIGNIFICANT ACCOUNTING POLICIES
The following is a summary of the significant accounting policies followed by the Funds.
USE OF ESTIMATES – The Funds are an investment companies that apply the accounting and reporting guidance issued in Topic 946 by the U.S. Financial Accounting Standards Board. The preparation of financial statements in conformity with U.S. generally accepted accounting principles ("U.S. GAAP") requires management to make estimates and assumptions that affect the reported amounts of assets and liabilities and disclosure of contingent assets and liabilities at the date of the financial statements and the reported amounts of increases and decreases in net assets from operations during the reporting period. Actual results could materially differ from those estimates.
SECURITY VALUATION — Securities listed on a securities exchange, market or automated quotation system for which quotations are readily available (except for securities traded on NASDAQ), including securities traded over the counter, are valued at the last quoted sale price on the primary exchange or market (foreign or domestic) on which they are traded (or at approximately 4:00 pm if a security’s primary exchange is normally open at that time), or, if there is no such reported sale, at the most recent mean between the quoted bid and asked prices (absent both bid and asked prices on such exchange, the bid price may be used).
For securities traded on NASDAQ, the NASDAQ Official Closing Price will be used. If available, debt securities are priced based upon valuations provided by independent, third-party pricing agents. Such values generally reflect the last reported sales price if the security is actively traded. The third-party pricing agents may also value debt securities at an evaluated bid price by employing methodologies that utilize actual market transactions, broker-supplied valuations, or other methodologies designed to identify the market value for such securities. Debt obligations with remaining maturities of sixty days or less may be valued at their amortized cost, which approximates market value. The prices for foreign securities are reported in local currency and converted to U.S. dollars using currency exchange rates. The exchange rates used by the Trust for valuation are captured as of the New York or London close each day. Prices for most securities held in the Funds are provided daily by recognized independent pricing agents. If a security price cannot be obtained from an independent, third-party pricing agent, the Funds seek to obtain a bid price from at least one independent broker.
Securities for which market prices are not “readily available” are valued in accordance with Fair Value Procedures established by the Board of Directors (the “Board”). The Funds’ Fair Value Procedures are implemented through a Fair Value Committee (the “Committee”) designated by the Board. Some of the more common reasons that may necessitate that a security be valued using Fair Value Procedures include: the security's trading has been halted or suspended; the security has been
Notes to Financial Statements (continued)
April 30, 2015 (Unaudited)
2. SIGNIFICANT ACCOUNTING POLICIES (continued)
SECURITY VALUATION (continued)
de-listed from its primary trading exchange; the security's primary trading market is temporarily closed at a time when under normal conditions it would be open; the security has not been traded for an extended period of time; the security's primary pricing source is not able or willing to provide a price; or trading of the security is subject to local government-imposed restrictions. In addition, the Funds may fair value their securities if an event that may materially affect the value of the Funds’ securities that traded outside of the United States (a “Significant Event”) has occurred between the time of the security's last close and the time that the Funds calculate their net asset value. A Significant Event may relate to a single issuer or to an entire market sector. Events that may be Significant Events include: government actions, natural disasters, armed conflict, acts of terrorism and significant market fluctuations. If Global X Management Company LLC (the “Adviser”) becomes aware of a Significant Event that has occurred with respect to a security or group of securities after the closing of the exchange or market on which the security or securities principally trade, but before the time at which the Funds calculate net asset value, it may request that a Committee meeting be called. When a security is valued in accordance with the Fair Value Procedures, the Committee will determine the value after taking into consideration all relevant information reasonably available to the Committee. As of April 30, 2015, there was $425,515 of fair valued securities in the Global X Copper Miners ETF and $92 of fair valued securities in the Global X Junior Miners ETF. There were no other securities priced using the Fair Value Procedures.
In accordance with the authoritative guidance on fair value measurements and disclosure under U.S. GAAP, the Funds disclose the fair value of their investments in a hierarchy that prioritizes the inputs to valuation techniques used to measure the fair value. The objective of a fair value measurement is to determine the price that would be received to sell an asset or paid to transfer a liability in an orderly transaction between market participants at the measurement date (an exit price). Accordingly, the fair value hierarchy gives the highest priority to quoted prices (unadjusted) in active markets for identical assets or liabilities (Level 1) and the lowest priority to unobservable inputs (Level 3). The three levels of the fair value hierarchy are described below:
The three levels of the fair value hierarchy are described below:
Level 1 – Unadjusted quoted prices in active markets for identical, unrestricted assets or liabilities that the Funds have the ability to access at the measurement date
Level 2 – Other significant observable inputs (including quoted prices in non-active markets, quoted prices for similar investments, fair value of investments for which the Funds have the ability to fully redeem tranches at net asset value as of the measurement date or within the near term, and short-term investments valued at amortized cost)
Level 3 – Significant unobservable inputs (including the Funds’ own assumptions in determining the fair value of investments and fair value of investments for which the Funds do not have the ability to fully redeem tranches at net asset value as of the measurement date or within the near term)
Investments are classified within the level of the lowest significant input considered in determining fair value. Investments classified within Level 3 whose fair value measurement considers several inputs may include Level 1 or Level 2 inputs as components of the overall fair value measurement.
Notes to Financial Statements (continued)
April 30, 2015 (Unaudited)
SIGNIFICANT ACCOUNTING POLICIES (continued)
SECURITY VALUATION (concluded)
For the period ended April 30, 2015, there have been no significant changes to the Funds’ fair valuation methodologies.
The following table summarizes the quantitative inputs and assumptions used for items categorized as material Level 3 investments as of April 30, 2015. The disclosures below also include qualitative information on the sensitivity of the fair value measurements to changes in the significant unobservable inputs.
Global X Copper Miners ETF
| Assets | | Fair Value at 4/30/15 | | | Valuation Technique(s) | | Unobservable Input | | Discount Percentage | |
| Common Stock | | $ | 425,515 | | | Discount from the Last Traded Price | | Last Traded Price Comparability Adjustment % | | | 25 | % |
The unobservable inputs used to determine fair value of Level 3 assets may have similar or diverging impacts on valuation. Significant increases and decreases in these inputs in isolation and interrelationships between those inputs could result in significantly higher or lower fair value measurement.
REPURCHASE AGREEMENTS — Securities pledged as collateral for repurchase agreements are held by Citibank N.A. and are designated as being held on each Fund’s behalf by its custodian under a book-entry system. Each Fund monitors the adequacy of the collateral on a daily basis and can require the seller to provide additional collateral in the event the market value of the securities pledged falls below the carrying value of the repurchase agreement, including accrued interest. It is the Funds’ policy to only enter into repurchase agreements with banks and other financial institutions which are deemed by the Adviser to be creditworthy. The Funds bear the risk of loss in the event that the other party to a repurchase agreement defaults on its obligations and the Funds are prevented from exercising their rights to dispose of the underlying securities received as collateral and the risk of a possible decline in the value of the underlying securities during the period. For financial statement purposes, the Funds record the securities lending collateral (included in Repurchase Agreements, at value or restricted cash) as an asset and the obligation to return securities lending collateral as a liability on the Statements of Assets and Liabilities.
Repurchase agreements are entered into by the Funds under Master Repurchase Agreements (“MRA”) which permit the Funds, under certain circumstances, including an event of default (such as bankruptcy or insolvency), to offset payables and/or receivables under the MRA with collateral held and/or posted to the counterparty and create one single net payment due to or from the Funds.
Notes to Financial Statements (continued)
April 30, 2015 (Unaudited)
2. SIGNIFICANT ACCOUNTING POLICIES (continued)
Repurchase Agreements – (continued)
At April 30, 2015, the open repurchase agreements by counterparty which are subject to a MRA on a net payment basis are as follows:
| | | | | | Fair Value of Non-cash | | | Cash Collateral | | | | |
| | | Repurchase Agreements | | | Collateral Received | | | Received | | | Net Amount(1) | |
| Global X Silver Miners ETF | | | | | | | | | | | | | | | | |
| Barclays | | $ | 5,000,000 | | | $ | 5,000,000 | | | $ | - | | | $ | - | |
| Deutsche Bank | | | 2,406,470 | | | | 2,406,470 | | | | - | | | | - | |
| Global X Gold Explorers ETF | | | | | | | | | | | | | | | | |
| Deutsche Bank | | | 1,131,938 | | | | 1,131,938 | | | | - | | | | - | |
| Global X Copper Miners ETF | | | | | | | | | | | | | | | | |
| Deutsche Bank | | | 1,998,492 | | | | 1,998,492 | | | | - | | | | - | |
| Global X Uranium ETF | | | | | | | | | | | | | | | | |
| Barclays | | | 15,000,000 | | | | 15,000,000 | | | | - | | | | - | |
| Deutsche Bank | | | 4,929,835 | | | | 4,929,835 | | | | | | | | - | |
| Global X Lithium ETF | | | | | | | | | | | | | | | | |
| Deutsche Bank | | | 299,890 | | | | 299,890 | | | | - | | | | - | |
| (1) Net Amount represents the net amount receivable due from the counterparty in the event of default. |
FEDERAL INCOME TAXES — It is each Fund’s intention to qualify or continue to qualify as a regulated investment company for Federal income tax purposes by complying with the appropriate provisions of Subchapter M of the Internal Revenue Code of 1986, as amended. Accordingly, no provisions for Federal income taxes have been made in the financial statements.
The Funds evaluate tax positions taken or expected to be taken in the course of preparing the Funds’ tax returns to determine whether it is “more-likely-than-not” (i.e., greater than 50 percent) that each tax position will be sustained upon examination by a taxing authority based on the technical merits of the position. Tax positions not deemed to meet the more-likely-than-not threshold are recorded as a tax benefit or expense in the current year. The Funds did not record any tax provision in the current period. Management’s conclusions regarding tax positions may be subject to review and adjustment at a later date based on factors including, but not limited to, examination by tax authorities (i.e., the last three tax year ends, as applicable), on-going analysis of and changes to tax laws, regulations and interpretations thereof.
As of and during the six months ended April 30, 2015, the Funds did not have a liability for any unrecognized tax benefits. The Funds recognize interest and penalties, if any, related to unrecognized tax benefits as income tax expense in the Statement of Operations. During the period, the Funds did not incur any interest or penalties.
SECURITY TRANSACTIONS AND INVESTMENT INCOME — Security transactions are accounted for on the trade date for financial reporting purposes. Costs used in determining realized gains and losses on the sale of investment securities are based on specific identification. Dividend income is recorded on the ex-dividend date. Interest income is recognized on the accrual basis from the settlement date.
Notes to Financial Statements (continued)
April 30, 2015 (Unaudited)
2. SIGNIFICANT ACCOUNTING POLICIES (concluded)
FOREIGN CURRENCY TRANSACTIONS AND TRANSLATION — The books and records of the Funds are maintained in U.S. dollars. Investment securities and other assets and liabilities denominated in a foreign currency are translated into U.S. dollars on the date of valuation. Purchases and sales of investment securities, income and expenses are translated into U.S. dollars at the relevant rates of exchange prevailing on the respective dates of such transactions. The Funds do not isolate that portion of realized or unrealized gains and losses resulting from changes in the foreign exchange rate from fluctuations arising from changes in the market prices of the securities. These gains and losses are included in net realized and unrealized gains and losses on investments on the Statement of Operations. Net realized and unrealized gains and losses on foreign currency transactions and translations represent net foreign exchange gains or losses from foreign currency spot contracts, disposition of foreign currencies, currency gains or losses realized between trade and settlement dates on securities transactions and the difference between the amount of the investment income and foreign withholding taxes recorded on the Funds’ books and the U.S. dollar equivalent amounts actually received or paid.
DIVIDENDS AND DISTRIBUTIONS TO SHAREHOLDERS — The Funds distribute their net investment income on a pro rata basis. Any net realized capital gains are distributed annually. All distributions are recorded on ex-dividend date.
CREATION UNITS — The Funds issue and redeem shares (“Shares”) at Net Asset Value (“NAV”) and only in large blocks of Shares (each block of Shares for a Fund is called a “Creation Unit” or multiples thereof). Purchasers of Creation Units (“Authorized Participants“) at NAV must pay a standard creation transaction fee per transaction. The fee is a single charge and will be the same regardless of the number of Creation Units purchased by an investor on the same day.
An Authorized Participant who holds Creation Units and wishes to redeem at NAV would also pay a standard redemption fee per transaction to Brown Brothers Harriman & Co. (“BBH”), the Funds’ Custodian, on the date of such redemption, regardless of the number of Creation Units redeemed that day.
If a Creation Unit is purchased or redeemed for cash, a higher transaction fee will be charged. The following table discloses Creation Unit breakdown:
| | | Creation Unit | | | | | | Value at April 30, | | | | |
| | | Shares | | | Creation Fee | | | 2015 | | | Redemption Fee | |
| Global X Silver Miners ETF | | | 50,000 | | | $ | 1,000 | | | $ | 444,000 | | | $ | 1,000 | |
| Global X Gold Explorers ETF | | | 50,000 | | | | 1,000 | | | | 556,000 | | | | 1,000 | |
| Global X Copper Miners ETF | | | 50,000 | | | | 1,000 | | | | 399,500 | | | | 1,000 | |
| Global X Uranium ETF | | | 50,000 | | | | 1,000 | | | | 584,500 | | | | 1,000 | |
| Global X Lithium ETF | | | 50,000 | | | | 1,000 | | | | 629,000 | | | | 1,000 | |
| Global X Fertilizers/Potash ETF | | | 50,000 | | | | 1,000 | | | | 585,000 | | | | 1,000 | |
| Global X Junior Miners ETF | | | 50,000 | | | | 1,000 | | | | 599,500 | | | | 1,000 | |
Notes to Financial Statements (continued)
April 30, 2015 (Unaudited)
3. RELATED PARTY TRANSACTIONS
The Adviser serves as the investment adviser and the administrator for the Funds. Subject to the supervision of the Board of Trustees, the Adviser is responsible for managing the investment activities of the Funds and the Funds’ business affairs and other administrative matters and provides or causes to be furnished all supervisory, administrative and other services reasonably necessary for the operation of the Funds, including certain distribution services (provided pursuant to a separate Distribution Agreement), certain shareholder and distribution-related services (provided pursuant to a separate Rule 12b-1 Plan and related agreements) and investment advisory services (provided pursuant to a separate Investment Advisory Agreement), under what is essentially an "all-in" fee structure. For its service to the Funds, under the Supervision and Administration Agreement, each Fund pays a monthly fee to the Adviser at the annual rate (stated as a percentage of the average daily net assets of the Fund). In addition, the Funds bear other expenses, directly and indirectly, that are not covered by the Supervision and Administration Agreement, which may vary and affect the total expense ratios of the Funds, such as taxes, brokerage fees, commissions, acquired fund fees and other transaction expenses, interest expenses, and extraordinary expenses (such as litigation and indemnification expenses).
| | | Supervision and | |
| | | Administration Fee | |
| Global X Silver Miners ETF | | | 0.65 | % |
| Global X Gold Explorers ETF | | | 0.65 | % |
| Global X Copper Miners ETF | | | 0.65 | % |
| Global X Uranium ETF | | | 0.69 | % |
| Global X Lithium ETF | | | 0.75 | % |
| Global X Fertilizers/Potash ETF | | | 0.69 | % |
| Global X Junior Miners ETF | | | 0.69 | % |
The Adviser and MCCA Lithium ETF, LLC (“MCCA”), a single purpose limited liability firm, have an agreement, pursuant to which MCCA has agreed to assist the Adviser, in its capacity as sponsor of the Global X Lithium ETF, by providing initial capital and additional financial resources to the Adviser in connection with the listing, launch and the continuing operation of the Global X Lithium Fund. In return, the Adviser has agreed to compensate MCCA for its financial assistance to the Adviser with respect to the Global X Lithium ETF by sharing with MCCA fifty percent (50%) of the Adviser’s Net Profits with respect to the Global X Lithium ETF. For this purpose, the term Net Profits means, for any calendar quarter, the total management fees received by the Adviser with respect to the Global X Lithium ETF less direct expenses, marketing expenses and overhead expenses for the Global X Lithium ETF during such quarter. In the event that there are no Net Profits with respect to the Global X Lithium ETF in any calendar quarter, MCCA shall pay fifty percent of the negative shortfall in Net Profits to the Adviser. The agreement between the parties does not contemplate that MCCA or any of its affiliates will be involved directly or indirectly in the distribution of shares of the Global X Lithium ETF.
SEI Investments Global Funds Services (“SEIGFS”) serves as Sub-Administrator to the Funds. As Sub-Administrator, SEIGFS provides the Funds with the required general administrative services, including, without limitation: office space, equipment, and personnel; clerical and general back office services; bookkeeping, internal accounting and secretarial services; the calculation of NAV; and assistance with the preparation and filing of reports, registration statements, proxy statements
Notes to Financial Statements (continued)
April 30, 2015 (Unaudited)
3. RELATED PARTY TRANSACTIONS (continued)
and other materials required to be filed or furnished by the Funds under federal and state securities laws. As compensation for these services, the Sub-Administrator receives certain out-of-pocket costs, transaction fees and asset-based fees which are accrued daily and paid monthly by the Adviser.
SEI Investments Distribution Co. (“SIDCO”) serves as each Funds’ underwriter and distributor of Shares pursuant to a Distribution Agreement. Under the Distribution Agreement, SIDCO, as agent, receives orders to create and redeem Shares in Creation Unit Aggregations and transmits such orders to the Trust’s custodian and transfer agent. The Distributor has no obligation to sell any specific quantity of Fund Shares. SIDCO bears the following costs and expenses relating to the distribution of Shares: (i) the costs of processing and maintaining records of creations of Creation Units; (ii) all costs of maintaining the records required of a registered broker/dealer; (iii) the expenses of maintaining its registration or qualification as a dealer or broker under Federal or state laws; (iv) filing fees; and (v) all other expenses incurred in connection with the distribution services as contemplated in the Distribution Agreement. SIDCO receives no fee for its distribution services under the Distribution Agreement.
BBH, located at 40 Water Street, Boston, MA 02109, serves as Custodian and Transfer Agent of the Funds’ assets. As Custodian, BBH has agreed to (1) make receipts and disbursements of money on behalf of the Funds, (2) collect and receive all income and other payments and distributions on account of the Funds’ portfolio investments, (3) respond to correspondence from shareholders, security brokers and others relating to its duties; and (4) make periodic reports to the Funds concerning the Funds’ operations. BBH does not exercise any supervisory function over the purchase and sale of securities. As compensation for these services, the Custodian receives certain out-of-pocket costs, transaction fees and asset-based fees which are accrued daily and paid monthly by the Adviser from its fees. As Transfer Agent, BBH has agreed to (1) issue and redeem shares of each Fund, (2) make dividend and other distributions to shareholders of each Fund, (3) respond to correspondence by shareholders and others relating to its duties; (4) maintain shareholder accounts, and (5) make periodic reports to the Funds. As compensation for these services, the Transfer Agent receives certain out-of-pocket costs, transaction fees and asset-based fees which are accrued daily and paid monthly by the Adviser from its fees.
At April 30, 2015, Global X Gold Explorers ETF and Global X Uranium ETF own greater than 5% of the outstanding shares of the following common stocks. These investments are noted as “Affiliated Investment” in the Schedules of Investments.
Notes to Financial Statements (continued)
April 30, 2015 (Unaudited)
3. RELATED PARTY TRANSACTIONS (concluded)
The following is a summary of the transactions with affiliates for the period ended April 30, 2015:
| | | | | | | | | Changes in | | | | | | | | | | |
| | | | | | | | | Unrealized | | | | | | | | | | |
| Value At | | Purchases | | | Proceeds | | | Appreciation | | | Realized | | | Value at | | | Dividend | |
| 10/31/2014 | | at Cost | | | from Sales | | | (Depreciation) | | | Loss | | | 04/30/2015 | | | Income | |
| Global X Gold Explorers ETF | | | | | | | | | | | | | | | | | | | | | | | | |
| Gold Canyon Resources | | | | | | | | | | | | | | | | | | | | | | | | |
| $1,052,934 | | $ | 1,245,600 | | | $ | 0 | | | $ | 2,052,369 | | | $ | 0 | | | $ | 4,350,903 | | | $ | — | |
| Gryphon Minerals LTD | | | | | | | | | | | | | | | | | | | | | | | | |
| $1,000,894 | | $ | 877,073 | | | $ | 0 | | | $ | (393,860 | ) | | $ | 0 | | | $ | 1,484,107 | | | $ | — | |
| Global X Uranium ETF | | | | | | | | | | | | | | | | | | | | | | | | |
| Bannerman Resources | | | | | | | | | | | | | | | | | | | | | | | | |
| $1,137,352 | | $ | 64,786 | | | $ | 0 | | | $ | 250,135 | | | $ | (251,324 | ) | | $ | 1,200,949 | | | $ | — | |
| Berkeley Resources | | | | | | | | | | | | | | | | | | | | | | | | |
| $2,564,476 | | $ | 304,660 | | | $ | (190,762 | ) | | $ | (283,503 | ) | | $ | (99,003 | ) | | $ | 2,295,868 | | | $ | — | |
| Denison Mines | | | | | | | | | | | | | | | | | | | | | | | | |
| $25,100,020 | | $ | 3,049,920 | | | $ | (1,732,323 | ) | | $ | (707,916 | ) | | $ | (895,607 | ) | | $ | 24,814,094 | | | $ | — | |
| Energy Fuels | | | | | | | | | | | | | | | | | | | | | | | | |
| $9,988,789 | | $ | 1,203,663 | | | $ | (656,511 | ) | | $ | (1,542,164 | ) | | $ | (427,351 | ) | | $ | 8,566,426 | | | $ | — | |
| Fission 3.0 | | | | | | | | | | | | | | | | | | | | | | | | |
| $1,010,852 | | $ | 149,106 | | | $ | (27,855 | ) | | $ | 215,931 | | | $ | 1,422 | | | $ | 1,349,456 | | | $ | — | |
| Greenland Minerals & Energy | | | | | | | | | | | | | | | | | | | | | | | | |
| $3,428,498 | | $ | 412,517 | | | $ | (224,272 | ) | | $ | 311,799 | | | $ | (365,094 | ) | | $ | 3,563,448 | | | $ | — | |
| Laramide Resources | | | | | | | | | | | | | | | | | | | | | | | | |
| $2,248,253 | | $ | 261,958 | | | $ | (158,955 | ) | | $ | (82,323 | ) | | $ | (358,662 | ) | | $ | 1,910,271 | | | $ | — | |
| Mega Uranium | | | | | | | | | | | | | | | | | | | | | | | | |
| $2,739,735 | | $ | 348,524 | | | $ | (206,537 | ) | | $ | (165,474 | ) | | $ | (276,023 | ) | | $ | 2,440,225 | | | $ | — | |
| Silex Systems | | | | | | | | | | | | | | | | | | | | | | | | |
| $5,937,210 | | $ | 615,970 | | | $ | (369,213 | ) | | $ | (293,751 | ) | | $ | (834,710 | ) | | $ | 5,055,506 | | | $ | — | |
| UEX | | | | | | | | | | | | | | | | | | | | | | | | |
| $4,611,399 | | $ | 547,074 | | | $ | (327,755 | ) | | $ | 196,697 | | | $ | (298,472 | ) | | $ | 4,728,943 | | | $ | — | |
| Uranerz Energy | | | | | | | | | | | | | | | | | | | | | | | | |
| $7,774,349 | | $ | 1,206,970 | | | $ | (636,306 | ) | | $ | 2,476,723 | | | $ | (463,223 | ) | | $ | 10,358,513 | | | $ | — | |
| Uranium Energy | | | | | | | | | | | | | | | | | | | | | | | | |
| $9,171,155 | | $ | 1,826,366 | | | $ | (851,396 | ) | | $ | 12,394,774 | | | $ | (736,813 | ) | | $ | 21,804,086 | | | $ | — | |
| Uranium Participation | | | | | | | | | | | | | | | | | | | | | | | | |
| $32,107,095 | | $ | 3,921,283 | | | $ | (2,101,055 | ) | | $ | 1,188,362 | | | $ | (288,529 | ) | | $ | 34,827,156 | | | $ | — | |
| Uranium Resources | | | | | | | | | | | | | | | | | | | | | | | | |
| $4,030,695 | | $ | 524,573 | | | $ | (339,052 | ) | | $ | (379,830 | ) | | $ | (306,900 | ) | | $ | 3,529,486 | | | $ | — | |
| Ur-Energy | | | | | | | | | | | | | | | | | | | | | | | | |
| $8,366,330 | | $ | 1,181,792 | | | $ | (606,944 | ) | | $ | 1,994,933 | | | $ | (370,239 | ) | | $ | 10,565,872 | | | $ | — | |
| Totals: | | | | | | | | | | | | | | | | | | | | | | | | |
| $120,216,208 | | $ | 15,619,162 | | | $ | (8,428,936 | ) | | $ | 15,574,393 | | | $ | (5,970,528 | ) | | $ | 38,413,545 | | | $ | — | |
Notes to Financial Statements (continued)
April 30, 2015 (Unaudited)
4. INVESTMENT TRANSACTIONS
For the period ended April 30, 2015, the purchases and sales of investments in securities, excluding in-kind transactions, long-term U.S. Government and short-term securities were:
| | | | | | Sales and | |
| | | Purchases | | | Maturities | |
| Global X Silver Miners ETF | | $ | 25,607,654 | | | $ | 24,458,168 | |
| Global X Gold Explorers ETF | | | 11,307,253 | | | | 10,920,073 | |
| Global X Copper Miners ETF | | | 2,548,462 | | | | 3,012,267 | |
| Global X Uranium ETF | | | 1,018,815 | | | | 9,624,127 | |
| Global X Lithium ETF | | | 7,962,724 | | | | 9,280,649 | |
| Global X Fertilizers/Potash ETF | | | 1,474,447 | | | | 1,717,576 | |
| Global X Junior Miners ETF | | | 593,484 | | | | 616,975 | |
For the period ended April 30, 2015, in-kind transactions associated with creations and redemptions were:
| | | | | | Sales and | | | Realized | |
| | | Purchases | | | Maturities | | | Gain/(Loss) | |
| Global X Silver Miners ETF | | $ | 13,986,906 | | | $ | 9,777,803 | | | $ | 641,239 | |
| Global X Gold Explorers ETF | | | 511,642 | | | | - | | | | - | |
| Global X Copper Miners ETF | | | 2,972,697 | | | | 2,146,471 | | | | (394,621 | ) |
| Global X Uranium ETF | | | 26,451,969 | | | | 5,552,412 | | | | (173,657 | ) |
| Global X Lithium ETF | | | - | | | | 3,694,243 | | | | 611,762 | |
| Global X Fertilizers/Potash ETF | | | - | | | | 2,105,313 | | | | 108,729 | |
| Global X Junior Miners ETF | | | - | | | | 550,853 | | | | (163,227 | ) |
During the period ended April 30, 2015, there were no purchases or sales of long-term U.S. Government securities for the Funds.
5. TAX INFORMATION
The amount and character of income and capital gain distributions to be paid, if any, are determined in accordance with Federal income tax regulations, which may differ from U.S. GAAP. As a result, net investment income (loss) and net realized gain (loss) on investment transactions for a reporting period may differ significantly from distributions during such period. These book/tax differences may be temporary or permanent. To the extent these differences are permanent in nature, they are charged or credited to undistributed net investment income (loss), accumulated net realized gain (loss) or paid-in capital, as appropriate, in the period that the differences arise.
Notes to Financial Statements (continued)
April 30, 2015 (Unaudited)
5. TAX INFORMATION (continued)
The tax character of dividends and distributions declared during the years ended October 31, 2014 and October 31, 2013 were as follows:
| Global X Funds | | Ordinary Income | | | Long-Term
Capital Gain | | | Return of Capital | | | Totals | |
| | | | |
| Global X Silver Miners ETF |
| 2014 | | $ | 1,275,569 | | | $ | – | | | $ | – | | | $ | 1,275,569 | |
| 2013 | | | 3,117,053 | | | | – | | | | – | | | | 3,117,053 | |
| Global X Gold Explorers ETF |
| 2014 | | $ | – | | | $ | – | | | $ | – | | | $ | – | |
| 2013 | | | 1,890,494 | | | | – | | | | – | | | | 1,890,494 | |
| Global X Copper Miners ETF |
| Global X Funds | | Ordinary Income | | | Long-Term
Capital Gain | | | Return of Capital | | | Totals | |
| 2014 | | $ | 225,417 | | | $ | – | | | $ | – | | | $ | 225,417 | |
| 2013 | | | 1,026,703 | | | | – | | | | – | | | | 1,026,703 | |
| Global X Uranium ETF | | | | | | | | | | | | | | | | |
| 2014 | | $ | 734,117 | | | $ | – | | | $ | – | | | $ | 734,117 | |
| 2013 | | | 2,536,311 | | | | – | | | | – | | | | 2,536,311 | |
| Global X Lithium ETF | | | | | | | | | | | | | | | | |
| 2014 | | $ | 160,079 | | | $ | – | | | $ | – | | | $ | 160,079 | |
| 2013 | | | 1,597,778 | | | | – | | | | – | | | | 1,597,778 | |
| Global X Fertilizers/Potash ETF | | | | | | | | | | | | | | | | |
| 2014 | | $ | 366,898 | | | $ | – | | | $ | – | | | $ | 366,898 | |
| 2013 | | | 330,509 | | | | – | | | | – | | | | 330,509 | |
| Global X Junior Miners ETF | | | | | | | | | | | | | | | | |
| 2014 | | $ | – | | | $ | – | | | $ | – | | | $ | – | |
| 2013 | | | 337,710 | | | | – | | | | – | | | | 337,710 | |
As of October 31, 2014, the components of tax basis distributable earnings (accumulated losses) were as follows:
| | | Global X Funds | |
| | | Global X Silver
Miners ETF | | | Global X Gold
Explorers ETF | | | Global X Copper
Miners ETF | | | Global X Uranium
ETF | |
| Undistributed Ordinary Income | | $ | – | | | $ | – | | | $ | 472,475 | | | $ | 8,992,689 | |
| Capital Loss Carryforwards | | | (123,324,501 | ) | | | (16,217,215 | ) | | | (8,437,959 | ) | | | (173,560,460 | ) |
| Unrealized Depreciation on Investments and Foreign Currency | | | (170,233,869 | ) | | | (45,675,521 | ) | | | (13,400,254 | ) | | | (156,983,392 | ) |
| Late Year Loss Deferral * | | | (40,279 | ) | | | – | | | | – | | | | – | |
| Other Temporary Differences | | | – | | | | 1 | | | | (9 | ) | | | (9 | ) |
| Total Accumulated Losses | | $ | (293,598,649 | ) | | $ | (61,892,735 | ) | | $ | (21,365,747 | ) | | $ | (321,551,172 | ) |
| | | Global X Funds | |
| | | Global X Lithium
ETF | | | Global X
Fertilizers/Potash
ETF | | | Global X Junior
Miners ETF | |
| Undistributed Ordinary Income | | $ | 301,758 | | | $ | 305,028 | | | $ | 28,543 | |
| Capital Loss Carryforwards | | | (51,683,786 | ) | | | (2,414,103 | ) | | | (2,897,051 | ) |
| Unrealized Depreciation on Investments and Foreign Currency | | | (1,046,181 | ) | | | (6,020,657 | ) | | | (2,851,710 | ) |
| Other Temporary Differences | | | (5 | ) | | | (7 | ) | | | 1 | |
| Total Accumulated Losses | | $ | (52,428,214 | ) | | $ | (8,129,739 | ) | | $ | (5,720,217 | ) |
Notes to Financial Statements (continued)
April 30, 2015 (Unaudited)
5. TAX INFORMATION (concluded)
Deferred late-year losses represent ordinary losses realized on investment transactions from January 1, 2014 through October 31, 2014.
For Federal income tax purposes, capital losses incurred in taxable years beginning before December 22, 2010 may be carried forward for a maximum period of eight years and applied against future gains. As of October 31, 2014, the Funds that had capital loss carryforwards are listed below:
| | | Global X Silver | | | Global X Gold | | | Global X | | | Global X | | | Global X Junior | |
| Expiration Date | | Miners ETF | | | Explorers ETF | | | Uranium ETF | | | Lithium ETF | | | Miners ETF | |
| Oct. 2019 | | $ | 8,433,465 | | | $ | 130,976 | | | $ | 12,705,798 | | | $ | 7,329,308 | | | $ | 506,011 | |
Under the Regulated Investment Company Modernization Act of 2010, the Funds will be permitted to carry forward capital losses incurred in taxable years beginning after December 22, 2010 for an unlimited period. However, any losses incurred during those future taxable years are required to be used prior to the losses incurred in pre-enactment taxable years. As a result of this ordering rule, preenactment capital loss carryforwards may be more likely to expire unused. Additionally, post-enactment capital losses that are carried forward will retain their character as either short-term or long-term capital losses rather than being considered all short-term as under previous law.
Losses carried forward under these new provisions are as follows:
| Global X Funds | | Short-Term Loss | | | Long-Term Loss | | | Total | |
| Global X Silver Miners ETF | | $ | 18,061,290 | | | $ | 96,829,746 | | | $ | 114,891,036 | |
| Global X Gold Explorers ETF | | | 5,158,634 | | | | 10,927,605 | | | | 16,086,239 | |
| Global X Copper Miners ETF | | | 2,044,539 | | | | 6,393,420 | | | | 8,437,959 | |
| Global X Uranium ETF | | | 40,611,362 | | | | 120,243,300 | | | | 160,854,662 | |
| Global X Lithium ETF | | | 9,532,302 | | | | 34,822,176 | | | | 44,354,478 | |
| Global X Fertilizers/Potash ETF | | | 900,313 | | | | 1,513,790 | | | | 2,414,103 | |
| Global X Junior Miners ETF | | | 1,601,784 | | | | 789,256 | | | | 2,391,040 | |
During the fiscal year ended October 31, 2014, no Funds utilized capital loss carryforwards to offset capital gains.
The Federal tax cost and aggregate gross unrealized appreciation and depreciation on investments held by the Funds at April 30, 2015 were as follows:
| | | | | | | | | Aggregated Gross | | | | |
| | | | | | Aggregated Gross | | | Unrealized | | | Net Unrealized | |
| Global X Funds | | Federal Tax Cost | | | Unrealized Appreciation | | | Depreciation | | | Depreciation | |
| Global X Silver Miners ETF | | $ | 296,274,009 | | | $ | - | | | $ | (110,320,306 | ) | | $ | (110,320,306 | ) |
| Global X Gold Explorers ETF | | | 54,740,745 | | | | 449,033 | | | | (21,498,941 | ) | | | (21,049,908 | ) |
| Global X Copper Miners ETF | | | 37,577,086 | | | | 581,960 | | | | (9,040,577 | ) | | | (8,458,617 | ) |
| Global X Uranium ETF | | | 367,554,416 | | | | 5,308,041 | | | | (94,321,222 | ) | | | (89,013,182 | ) |
| Global X Lithium ETF | | | 54,608,821 | | | | 6,126,203 | | | | (6,717,541 | ) | | | (591,338 | ) |
| Global X Fertilizers/Potash ETF | | | 19,041,063 | | | | 1,112,408 | | | | (5,575,592 | ) | | | (4,463,184 | ) |
| Global X Junior Miners ETF | | | 5,413,653 | | | | 256,986 | | | | (1,680,815 | ) | | | (1,423,829 | ) |
Notes to Financial Statements (continued)
April 30, 2015 (Unaudited)
6. CONCENTRATION OF RISKS
The Funds invest in securities of foreign issuers in various countries. These investments may involve certain considerations and risks not typically associated with investments in the United States as a result of, among other factors, the possibility of future political and economic developments and the level of governmental supervision and regulation of securities markets in the respective countries.
The securities markets of emerging countries are less liquid and subject to greater price volatility, and have a smaller market capitalization, than the U.S. securities markets. In certain countries, there may be fewer publicly traded securities and the market may be dominated by a few issues or sectors. Issuers and securities markets in such countries are not subject to as extensive and frequent accounting, financial and other reporting requirements or as comprehensive government regulations as are issuers and securities markets in the U.S. In particular, the assets and profits appearing on the financial statements of emerging country issuers may not reflect their financial position or results of operations in the same manner as financial statements for U.S. issuers. Substantially less information may be publicly available about emerging country issuers than is available about issuers in the United States.
The Funds may be subject to taxes imposed by countries in which they invest. Such taxes are generally based on either income or gains earned or repatriated. The Funds accrue and apply such taxes to net investment income, net realized gains and net unrealized gains as income and/or capital gains are earned.
The Funds use a replication strategy. A replication strategy is an indexing strategy that involves investing in the securities of the underlying index in approximately the same proportions as in the underlying index. The Funds may utilize a representative sampling strategy with respect to their underlying indices when a replication strategy might be detrimental to their shareholders, such as when there are practical difficulties or substantial costs involved in compiling a portfolio of equity securities to follow its underlying index, or, in certain instances, when securities in the underlying index become temporarily illiquid, unavailable or less liquid, or due to legal restrictions (such as diversification requirements that apply to the Funds but not the underlying indexes). Commodity related securities are susceptible to fluctuations in certain commodity markets. Any negative changes in commodity markets could have a great impact on these Funds.
7. LOANS OF PORTFOLIO SECURITIES
The Funds may lend portfolio securities having a market value up to one-third of the Funds’ total assets. Security loans made pursuant to a securities lending agreement are required at all times to be secured by collateral equal to at least 102% for U.S.-based securities and 105% for foreign-based securities. Such collateral will be cash securities issued or guaranteed by the U.S. Government or any agencies. Cash collateral received in connection with these loans can be invested in repurchase agreements or U.S. Treasury obligations and is recognized in the Schedule of Investments and Statement of Assets and Liabilities. The obligation to return securities lending collateral is also recognized as a liability in the Statement of Assets and Liabilities. It is the Funds’ policy to obtain additional collateral from or return excess collateral to the borrower by the end of the next business day, following the valuation date of the securities loaned. Therefore, the value of the collateral held may be temporarily less than the value of the securities on loan. Lending securities entails a risk of loss to the Funds if and to the extent that the market value of the securities loans were to increase and the borrower did not increase the collateral accordingly, and the borrower fails to return the securities. The Funds could also experience delays and costs in gaining access to the collateral. The Funds bear the risk of any deficiency in the amount of the collateral
Notes to Financial Statements (continued)
April 30, 2015 (Unaudited)
7. LOANS OF PORTFOLIO SECURITIES (concluded)
available for return to the borrower due to any loss on the collateral invested.
As of April 30, 2015, the value of securities on loan was $6,292,704, $1,016,203, $1,822,630, $16,373,711 and $230,578 for the Global X Silver Miners ETF, Global X Gold Explorers ETF, Global X Copper Miners ETF, Global X Uranium ETF and Global X Lithium ETF, respectively and the value of securities purchased with the cash collateral held from securities on loan was $7,406,470, $1,131,938, $1,998,492, $19,929,835 and $299,890 for the Global X Silver Miners ETF, Global X Gold Explorers ETF, Global X Copper Miners ETF, Global X Uranium ETF and Global X Lithium ETF, respectively.
At April 30, 2015, the following Funds had securities on loan, by counterparty:
| | | Market Value | | | Cash Collateral | |
| Global X Silver Miners ETF | | | | | | | | |
| BNP Prime Brokerage | | $ | 120 | | | $ | 150 | |
| Credit Suisse | | | 498,475 | | | | 594,310 | |
| Deutsche Bank Securities | | | 1,941,774 | | | | 2,445,360 | |
| Goldman Sachs & Co. | | | 2,568,912 | | | | 2,943,000 | |
| JPMorgan | | | 662,350 | | | | 810,500 | |
| Merrill Lynch Pierce Fenner & Smith | | | 940,215 | | | | 1,053,768 | |
| National Financial Services | | | 2,919,081 | | | | 3,201,804 | |
| Nomura Securities | | | 23,577 | | | | 27,264 | |
| UBS Securities | | | 419,040 | | | | 481,627 | |
| Global X Gold Explorers ETF | | | | | | | | |
| Barclays Capital | | | 916,876 | | | | 1,167,835 | |
| Credit Suisse | | | 782,941 | | | | 932,890 | |
| Deutsche Bank Securities | | | 19,028 | | | | 28,400 | |
| JPMorgan | | | 734,277 | | | | 952,363 | |
| Morgan Stanley | | | 537,708 | | | | 802,549 | |
| Nomura Securities | | | 2,241 | | | | 3,260 | |
| Global X Copper Miners ETF | | | | | | | | |
| Credit Suisse | | | 1,231,108 | | | | 1,288,371 | |
| Merrill Lynch Pierce Fenner & Smith | | | 64,523 | | | | 68,370 | |
| UBS Securities | | | 9,739 | | | | 10,320 | |
| Global X Uranium ETF | | | | | | | | |
| Barclays Capital | | | 687,060 | | | | 943,737 | |
| BNP Prime Brokerage | | | 248,348 | | | | 300,000 | |
| Citigroup | | | 3,925,069 | | | | 4,204,195 | |
| Credit Suisse | | | 178,436 | | | | 192,500 | |
| Deutsche Bank Securities | | | 1,748,571 | | | | 1,902,550 | |
| Goldman Sachs & Co. | | | 876,501 | | | | 972,800 | |
| JPMorgan | | | 7,465,984 | | | | 8,273,789 | |
| Macquarie Capital | | | 173,338 | | | | 187,000 | |
| Merrill Lynch Pierce Fenner & Smith | | | 1,659,483 | | | | 1,792,866 | |
| Morgan Stanley | | | 4,645,210 | | | | 5,992,818 | |
| UBS Securities | | | 1,198,229 | | | | 1,273,656 | |
| Global X Lithium ETF | | | | | | | | |
| Citigroup | | | 126 | | | | 1,417 | |
| Credit Suisse | | | 36,119 | | | | 156,633 | |
| Goldman Sachs & Co. | | | 66,270 | | | | 74,716 | |
| JPMorgan | | | 2,838 | | | | 25,600 | |
| Morgan Stanley | | | 45 | | | | 400 | |
| Nomura Securities | | | 106 | | | | 1,197 | |
Notes to Financial Statements (concluded)
April 30, 2015 (Unaudited)
8. CONTRACTUAL OBLIGATIONS
The Funds enter into contracts in the normal course of business that contain a variety of indemnifications. The Funds’ maximum exposure under these arrangements is unknown. However, the Funds have not had prior gains or losses pursuant to these contracts. Management has reviewed the Funds’ existing contracts and expects the risk of loss to be remote.
Pursuant to the Trust’s organizational documents, the Trustees of the Trust and the Trust’s officers are indemnified against certain liabilities that may arise out of the performance of their duties.
9. REVERSE SHARE SPLIT
Effective May 16, 2013, the Global X Gold Explorers ETF, Global X Uranium ETF and the Global X Junior Miners ETF executed a reverse share split for shareholders of record after the close of markets on May 15, 2013. The effect of this transaction was to divide the number of outstanding shares of the Funds by the ratio below, resulting in a corresponding increase in the net asset value per share. The capital share activity presented in the statement of changes in net assets for each of the years in the period then ended, and per share data in the financial highlights for each of the years in the period then ended, have been given retroactive effect to reflect these reverse share splits. There were no changes in net assets, results of operations or total return as a result of these transactions. The details of the reverse split are as follows:
| Fund Name | | | Ratio | |
| Global X Gold Explorers ETF | | | 1:4 | |
| Global X Uranium ETF | | | 1:3 | |
| Global X Junior Miners ETF | | | 1:3 | |
10. SUBSEQUENT EVENTS
The Funds have been evaluated regarding the need for additional disclosures and/or adjustments resulting from subsequent events. Based on this evaluation, no additional disclosure or adjustments were required to the financial statements as of the date the financial statements were issued, except as follows:
Subsequent to the April 30th period end, the following investment portfolios were added to the Trust.
Fund Name
Global X High Quality Dividend Yield Index ETF
Global X S&P 500® Catholic Values Custom Index ETF
Subsequent to the April 30th period end, the following investment portfolios of the Trust commenced operations.
| Fund Name | | Commenced Operations |
| Global X Scientific Beta US ETF | | May 12, 2015 |
| Global X Scientific Beta Europe ETF | | May 12, 2015 |
| Global X Scientific Beta Asia ex-Japan ETF | | May 12, 2015 |
| Global X Scientific Beta Japan ETF | | May 12, 2015 |
| Global X YieldCo Index ETF | | May 27, 2015 |
Disclosure of Fund Expenses (unaudited)
All Exchange Traded Funds (“ETF”) have operating expenses. As a shareholder of an ETF, your investment is affected by these ongoing costs, which include (among others) costs for ETF management, administrative services, commissions, and shareholder reports like this one. It is important for you to understand the impact of these costs on your investment returns. In addition, a shareholder is responsible for brokerage fees as a result of their investment in a Fund.
Operating expenses such as these are deducted from an ETF’s gross income and directly reduce its final investment return. These expenses are expressed as a percentage of the ETF’s average net assets; this percentage is known as the ETF’s expense ratio.
The following examples use the expense ratio and are intended to help you understand the ongoing costs (in dollars) of investing in your Fund and to compare these costs with those of other funds. The examples are based on an investment of $1,000 made at the beginning of the period shown and held for the entire period (November 1, 2014 to April 30, 2015).
The table on the next page illustrates your Fund’s costs in two ways:
Actual Fund Return. This section helps you to estimate the actual expenses that your Fund incurred over the period. The “Expenses Paid During Period” column shows the actual dollar expense cost incurred by a $1,000 investment in the Fund, and the “Ending Account Value” number is derived from deducting that expense cost from the Fund’s gross investment return.
You can use this information, together with the actual amount you invested in the Funds, to estimate the expenses you paid over that period. Simply divide your actual account value by $1,000 to arrive at a ratio (for example, an $8,600 account value divided by $1,000 = 8.6), then multiply that ratio by the number shown for your Fund under “Expenses Paid During Period.”
Hypothetical 5% Return. This section helps you compare your Fund’s costs with those of other funds. It assumes that the Funds had an annual 5% return before expenses during the year, but that the expense ratio (Column 3) for the period is unchanged. This example is useful in making comparisons because the Securities and Exchange Commission requires all funds to make this 5% calculation. You can assess your Fund’s comparative cost by comparing the hypothetical result for your Fund in the “Expenses Paid During Period” column with those that appear in the same charts in the shareholder reports for other funds.
NOTE: Because the return is set at 5% for comparison purposes — NOT your Fund’s actual return — the account values shown may not apply to your specific investment.
Disclosure of Fund Expenses (unaudited) (concluded)
| | | Beginning
Account
Value
11/1/2014 | | | Ending
Account
Value
4/30/2015 | | | Annualized
Expense
Ratios | | | Expenses
Paid
During
Period(1) | |
| Global X Silver Miners ETF | | | | | | | | | | | | | | | | |
| Actual Fund Return | | $ | 1,000.00 | | | $ | 1,019.10 | | | | 0.65 | % | | $ | 3.25 | |
| Hypothetical 5% Return | | | 1,000.00 | | | | 1,021.98 | | | | 0.65 | | | | 3.26 | |
| Global X Gold Explorers ETF | | | | | | | | | | | | | | | | |
| Actual Fund Return | | $ | 1,000.00 | | | $ | 1,155.20 | | | | 0.65 | % | | $ | 3.48 | |
| Hypothetical 5% Return | | | 1,000.00 | | | | 1,021.98 | | | | 0.65 | | | | 3.26 | |
| Global X Copper Miners ETF | | | | | | | | | | | | | | | | |
| Actual Fund Return | | $ | 1,000.00 | | | $ | 982.50 | | | | 0.65 | % | | $ | 3.25 | |
| Hypothetical 5% Return | | | 1,000.00 | | | | 1,021.93 | | | | 0.65 | | | | 3.46 | |
| Global X Uranium ETF | | | | | | | | | | | | | | | | |
| Actual Fund Return | | $ | 1,000.00 | | | $ | 1,048.40 | | | | 0.69 | % | | $ | 3.50 | |
| Hypothetical 5% Return | | | 1,000.00 | | | | 1,021.68 | | | | 0.69 | | | | 3.46 | |
| Global X Lithium ETF | | | | | | | | | | | | | | | | |
| Actual Fund Return | | $ | 1,000.00 | | | $ | 1,059.40 | | | | 0.75 | % | | $ | 3.83 | |
| Hypothetical 5% Return | | | 1,000.00 | | | | 1,021.49 | | | | 0.75 | | | | 3.76 | |
| Global X Fertilizers/Potash ETF | | | | | | | | | | | | | | | | |
| Actual Fund Return | | $ | 1,000.00 | | | $ | 1,101.80 | | | | 0.69 | % | | $ | 3.60 | |
| Hypothetical 5% Return | | | 1,000.00 | | | | 1,021.78 | | | | 0.69 | | | | 3.46 | |
| Global X Junior Miners ETF | | | | | | | | | | | | | | | | |
| Actual Fund Return | | $ | 1,000.00 | | | $ | 1,029.00 | | | | 0.69 | % | | $ | 3.47 | |
| Hypothetical 5% Return | | | 1,000.00 | | | | 1,021.78 | | | | 0.69 | | | | 3.46 | |
| (1) | Expenses are equal to the Fund’s annualized expense ratio multiplied by the average account value over the period, multiplied by 181/365 (to reflect the one-half year period.) |
Approval of Investment Advisory Agreement (Unaudited)
Section 15(c) of the Investment Company Act of 1940, as amended ("1940 Act"), requires that the board of trustees (the “Board”) of Global X Funds (the “Trust”), including a majority of those trustees who are not "interested persons," as defined in the 1940 Act ("Independent Trustees"), consider on an initial basis and periodically thereafter, at an in-person meeting called for such purpose, the terms of each fund’s investment advisory agreement and whether to approve entering into, or renewing, each such agreement.
At a quarterly Board meeting held on November 14, 2014, the Board (including the Trust’s Independent Trustees voting separately) considered and unanimously approved the continuation of (i) the Investment Advisory Agreement ("Renewal Investment Advisory Agreement") for each fund covered by this Semi-Annual Report (each, a "Renewal Fund") and (ii) the Supervision and Administration Agreement ("Renewal Supervision and Administration Agreement"), on behalf of each Renewal Fund, between the Trust and Global X Management Company ("Global X Management"). The Renewal Investment Advisory Agreement and the Renewal Supervision and Administration Agreement are collectively referred to herein as the "Renewal Agreements."
In advance of the Board meeting, the Board (including the Trust’s Independent Trustees) and the Independent Trustees’ independent legal counsel requested (in writing) detailed information from Global X Management in connection with the Board’s consideration of the Renewal Agreements, and the Board received and reviewed written responses from Global X Management and supporting materials relating to those requests for information. In the course of their consideration of the Renewal Agreements, the Trust’s Independent Trustees were advised by their counsel and, in addition to meeting with management of Global X Management, they met separately in executive session with their counsel.
In determining to approve the continuation of the Renewal Agreements for each Renewal Fund, the Board considered a variety of factors, including but not limited to the factors discussed in greater detail below. After full consideration of the facts below, as well as other factors that were instructive in their consideration, the Board, including all of the Trust’s Independent Trustees voting separately, concluded that the Renewal Agreements were fair and reasonable and in the best interests of each Renewal Fund and its shareholders.
In reaching this decision, the Board did not assign relative weights to the factors discussed below nor did the Board deem any one factor or group of factors to be determinative. Each member of the Board may have afforded different weight to the various factors.
Approval of Investment Advisory Agreement (Unaudited)
RENEWAL AGREEMENTS
Nature, Extent and Quality of Services
With respect to this factor, the Board considered:
| • | the terms of the Renewal Agreements and the range of services that would continue to be provided to each Renewal Fund in accordance with the Renewal Agreements; |
| • | Global X Management’s key personnel and the portfolio managers who would continue to provide investment advisory, supervision and administrative services to each Renewal Fund; |
| • | Global X Management’s responsibilities under the Renewal Agreements, including, among other things, to: (i) manage the investment operations of each Renewal Fund and the composition of each Renewal Fund’s assets, including the purchase, retention and disposition of its holdings, (ii) provide quarterly reports to the Trust’s officers and the Board and other reports as the Board deems necessary or appropriate, (iii) vote proxies, exercise consents, and exercise all other rights relating to securities and assets held by each Renewal Fund, (iv) select broker-dealers to execute portfolio transactions for each Renewal Fund when necessary, (v) assist in the preparation and filing of reports and proxy statements (if any) for the shareholders of each Renewal Fund, the periodic updating of the registration statement, prospectuses, statements of additional information, and other reports and documents for each Renewal Fund that are required to be filed by the Trust with the Securities and Exchange Commission (“SEC”) and other regulatory and governmental bodies, and (vi) monitor anticipated purchases and redemptions of the shares (including creation units) of each Renewal Fund by shareholders and new investors; |
| • | the nature, extent and quality of the services (including advisory, administrative and compliance services) that have been provided by Global X Management or made available to each Renewal Fund and the adequacy of Global X Management’s personnel resources that would continue to be made available to each Renewal Fund; and |
| • | the quality of Global X Management’s resources and personnel that would be made available to each Renewal Fund, including Global X Management’s experience and the professional qualifications of Global X Management’s key personnel. |
Based on these considerations, the Board concluded that, in the exercise of its business judgment, the nature, extent and quality of the services provided to each Renewal Fund by Global X Management were fair and reasonable.
Approval of Investment Advisory Agreement (Unaudited)
Performance
With respect to this factor, the Board considered each Renewal Fund’s total return and investment performance relative to (i) the performance of unaffiliated comparable specialized and/or focused exchange-traded funds and/or other registered funds in the same industry classification as each of the Renewal Funds, which performance information is publicly available from such registered funds as well as other third party sources; and (ii) the performance of other comparable funds and pertinent indexes.
Based on these considerations and comparisons, the Board concluded that, in the exercise of its business judgment, the investment performance of each Renewal Fund supported the Board’s approval of the continuation of the Renewal Agreements.
Cost of Services and Profitability
The Board considered Global X Management’s costs in providing investment management and related services to each Renewal Fund. In this regard, the Board considered the management fee (“Management Fee”) that has been borne or expected to be borne by each Renewal Fund under the Renewal Agreements for the various investment advisory, supervisory and administrative services that each Renewal Fund requires under a unitary fee structure (including the types of fees and expenses that are not included within the unitary fee and would be borne by each Renewal Fund).
In addition, the Board considered the current and expected profitability to Global X Management from all services provided or expected to be provided to the Renewal Funds, as well as all aspects of Global X Management’s relationship with each of the Renewal Funds. In connection with these considerations, Global X Management provided the Board with financial information regarding its operations and services to the Renewal Funds and discussed with the Board its current and expected profitability with respect to the Renewal Funds.
Based on these considerations, the Board concluded that, in the exercise of its business judgment, the Management Fee paid by each Renewal Fund to Global X Management, as well as the profits anticipated to be realized by Global X Management from its relationship with each of the Renewal Funds, was reasonable and in the best interests of each Renewal Fund and its shareholders.
Approval of Investment Advisory Agreement (Unaudited)(Concluded)
Comparison of Fees and Services
With respect to this factor, the Board considered:
| • | comparative information with respect to the Management Fee paid to Global X Management by each of the Renewal Funds. In connection with this consideration, Global X Management provided the Board with comparative expense data for each of the Renewal Funds, including fees and expenses paid by unaffiliated comparable specialized and/or focused exchange-traded funds and/or other comparable registered funds, as well as fees and expenses paid by other funds that are series of the Trust under the same unitary Management Fee structure; |
| • | the structure of the unitary Management Fee (which includes, as one component, the investment advisory fee for each Renewal Fund) and the current total expense ratios for each of the Renewal Funds. In this regard, the Board took into consideration that the purpose of adopting a unitary Management Fee structure for the Renewal Funds was to create a simple, all-inclusive fee that would provide a level of predictability with respect to the overall expense ratio (i.e., the total fees) of each of the Renewal Funds and that the Management Fee for each Renewal Fund was set at a competitive rate to make each Renewal Fund viable in the marketplace; and |
| • | that Global X Management is responsible for most ordinary expenses of the Renewal Funds, including the costs of various third-party services required by the Renewal Funds, including investment advisory, administrative, audit, certain custody, portfolio accounting, legal, transfer agency and printing costs, but that each Renewal Fund bears other expenses not covered under the unitary Management Fee, such as taxes, brokerage fees, commissions, and other transaction expenses, interest expenses, and extraordinary expenses. |
Based on these considerations and comparisons regarding fees and services, the Board concluded that, in the exercise of its business judgment, it would be in the best interests of each Renewal Fund and its shareholders to approve the Renewal Agreements.
Economies of Scale
With respect to this factor, the Board considered:
| • | the extent to which economies of scale would be realized as the Renewal Funds grow and whether the unitary Management Fee for each Renewal Fund reflected these economies of scale; |
| • | the significant investment of time, personnel and other resources that Global X Management has made and intends to make in the Renewal Funds in order to seek to assure that the Renewal Funds are attractive to investors; and |
| • | that the unitary Management Fee provides a high level of certainty as to the total level of expenses for the Renewal Funds and their shareholders. |
Approval of Investment Advisory Agreement (Unaudited)(Concluded)
Based on these considerations regarding economies of scale, the Board concluded that, in the exercise of its business judgment, it would be in the best interests of each Renewal Fund and its shareholders to approve the continuation of the Renewal Agreements.
Other Benefits
The Board also considered any other benefits realized by Global X Management as a result of its relationships with each Renewal Fund. As a result, the Board concluded that, in the exercise of its business judgment, all information it considered supported approval of the continuation of the Renewal Agreements.
Supplemental Information (Unaudited)
Net asset value, or “NAV”, is the price per Share at which the Funds issue and redeem Shares. It is calculated in accordance with the standard formula for valuing mutual fund shares. The “Market Price” of the Funds generally is determined using the midpoint between the highest bid and the lowest offer on the stock exchange on which the Shares of the Funds are listed for trading, as of the time that the Funds’ NAV is calculated. The Funds’ Market Price may be at, above or below their NAV. The NAV of the Funds will fluctuate with changes in the market value of the Funds’ holdings. The Market Price of the Funds will fluctuate in accordance with changes in their NAV, as well as market supply and demand.
Premiums or discounts are the differences (expressed as a percentage) between the NAV and Market Price of the Funds on a given day, generally at the time NAV is calculated. A premium is the amount that the Funds are trading above the reported NAV, expressed as a percentage of the NAV. A discount is the amount that the Funds are trading below the reported NAV, expressed as a percentage of the NAV.
Further information regarding premiums and discounts is available on the Funds’ website at www.GlobalXFunds.com.
NOTES
NOTES
623 Fifth Avenue, 15th floor
New York, NY 10022
1-888-GXFund-1
(1-888-493-8631)
www.globalxfunds.com
Investment Adviser and Administrator:
Global X Management Company LLC
623 Fifth Avenue, 15th floor
New York, NY 10022
Distributor:
SEI Investments Distribution Co.
One Freedom Valley Drive
Oaks, PA 19456
Sub-Administrator:
SEI Investments Global Funds Services
One Freedom Valley Drive
Oaks, PA 19456
Counsel for Global X Funds and the Independent Trustees:
K&L Gates LLP
1601 K Street N.W.
Washington, DC 20006
Custodian and Transfer Agent:
Brown Brothers Harriman & Co.
40 Water Street
Boston, MA 02109
Independent Registered Public Accounting Firm:
Ernst & Young LLP
2005 Market Street
Suite 700
Philadelphia, PA 19103
This information must be preceded or accompanied by a current prospectus for the Funds described.
GLX-SA-001-0700
Global X China Consumer ETF (ticker: CHIQ)
Global X China Energy ETF (ticker: CHIE)
Global X China Financials ETF (ticker: CHIX)
Global X China Industrials ETF (ticker: CHII)
Global X China Materials ETF (ticker: CHIM)
Global X NASDAQ China Technology ETF (ticker: QQQC)
Global X Southeast Asia ETF (ticker: ASEA)
Global X FTSE Andean 40 ETF (ticker: AND)
Global X MSCI Colombia ETF (ticker: GXG)
Global X Brazil Mid Cap ETF (ticker: BRAZ)
Global X Brazil Consumer ETF (ticker: BRAQ)
Global X Brazil Financials ETF (ticker: BRAF)
Global X MSCI Argentina ETF (ticker: ARGT)
Global X FTSE Greece 20 ETF (ticker: GREK)
Global X MSCI Norway ETF (ticker: NORW)
Global X FTSE Nordic Region ETF (ticker: GXF)
Global X Central Asia & Mongolia Index ETF (ticker: AZIA)
Global X MSCI Nigeria ETF (ticker: NGE)
Global X Next Emerging & Frontier ETF (ticker: EMFM)
Global X FTSE Portugal 20 ETF (ticker: PGAL)
Global X MSCI Pakistan ETF (ticker: PAK)
Semi-Annual Report
April 30, 2015
Table of Contents
The Funds file their complete schedules of Fund holdings with the Securities and Exchange Commission (the “Commission”) for the first and third quarters of each fiscal year on Form N-Q within sixty days after the end of the period. The Funds’ Forms N-Q are available on the Commission’s website at http://www.sec.gov, and may be reviewed and copied at the Commission's Public Reference Room in Washington, DC. Information on the operation of the Public Reference Room may be obtained by calling 1-800-SEC-0330.
A description of the policies and procedures that Global X Funds uses to determine how to vote proxies relating to Fund securities, as well as information relating to how the Funds voted proxies relating to Fund securities during the most recent 12-month period ended June 30, will be available (i) without charge, upon request, by calling 1-888-GXFund-1; and (ii) on the Commission’s website at http://www.sec.gov.
| Schedule of Investments | April 30, 2015 (Unaudited) |
Global X China Consumer ETF
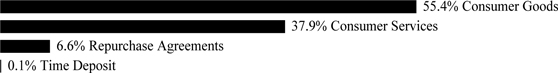
† Sector weightings percentages are based on the total market value of investments. Repurchase agreements purchased from cash collateral received for securities lending activity are included in total investments. Please see Note 8 in Notes to Financial Statements for more detailed information.
| | | Shares | | | Value | |
| COMMON STOCK — 99.8% | | | | | | | | |
| | | | | | | | | |
| CHINA— 75.8% | | | | | | | | |
| Consumer Goods — 40.2% | | | | | | | | |
| ANTA Sports Products | | | 1,090,296 | | | $ | 2,402,515 | |
| BYD, Cl H | | | 898,500 | | | | 5,465,547 | |
| China Yurun Food Group * (A) | | | 1,749,888 | | | | 607,290 | |
| Dongfeng Motor Group, Cl H | | | 3,175,146 | | | | 5,300,683 | |
| Great Wall Motor, Cl H | | | 726,399 | | | | 5,543,242 | |
| Guangzhou Automobile Group, Cl H | | | 2,886,417 | | | | 3,146,659 | |
| Hengan International Group | | | 435,449 | | | | 5,381,913 | |
| Li Ning * | | | 1,781,269 | | | | 988,171 | |
| Shenzhou International Group Holdings | | | 626,262 | | | | 2,953,094 | |
| Tingyi Cayman Islands Holding | | | 2,450,925 | | | | 5,179,380 | |
| Tsingtao Brewery, Cl H | | | 427,617 | | | | 2,722,551 | |
| Uni-President China Holdings | | | 1,656,743 | | | | 1,340,160 | |
| Want Want China Holdings | | | 4,902,009 | | | | 5,381,924 | |
| | | | | | | | 46,413,129 | |
| Consumer Services — 35.6% | | | | | | | | |
| Air China, Cl H | | | 2,223,528 | | | | 2,685,049 | |
| Ajisen China Holdings | | | 708,093 | | | | 440,323 | |
| Alibaba Group Holding ADR * | | | 64,300 | | | | 5,226,947 | |
| China Southern Airlines, Cl H | | | 2,115,495 | | | | 2,071,513 | |
| Chow Tai Fook Jewellery Group (A) | | | 1,385,879 | | | | 1,680,688 | |
| Ctrip.com International ADR * | | | 61,528 | | | | 3,918,103 | |
| E-Commerce China Dangdang ADR, Cl A * (A) | | | 54,750 | | | | 517,935 | |
| Golden Eagle Retail Group | | | 692,547 | | | | 1,038,220 | |
| GOME Electrical Appliances Holding (A) | | | 14,950,005 | | | | 3,838,206 | |
| Homeinns Hotel Group ADR * | | | 23,642 | | | | 661,266 | |
| Intime Retail Group | | | 1,498,684 | | | | 1,682,144 | |
| JD.com ADR * | | | 159,300 | | | | 5,346,108 | |
| New Oriental Education & Technology Group ADR * | | | 61,381 | | | | 1,570,740 | |
| Parkson Retail Group | | | 1,430,112 | | | | 363,471 | |
| Sun Art Retail Group | | | 2,698,125 | | | | 2,781,267 | |
| Vipshop Holdings ADR * | | | 185,430 | | | | 5,245,815 | |
| Wumart Stores, Cl H | | | 713,411 | | | | 624,947 | |
The accompanying notes are an integral part of the financial statements.
| Schedule of Investments | April 30, 2015 (Unaudited) |
Global X China Consumer ETF
| | | Shares/Face
Amount | | | Value | |
| COMMON STOCK — continued | | | | | | | | |
| Consumer Services — continued | | | | | | | | |
| Youku.com ADR * (A) | | | 78,837 | | | $ | 1,474,252 | |
| | | | | | | | 41,166,994 | |
| TOTAL CHINA | | | | | | | 87,580,123 | |
| | | | | | | | | |
| HONG KONG— 24.0% | | | | | | | | |
| Consumer Goods — 19.1% | | | | | | | | |
| Belle International Holdings, Cl A | | | 3,894,996 | | | | 5,009,980 | |
| Biostime International Holdings (A) | | | 203,800 | | | | 936,026 | |
| Bosideng International Holdings (A) | | | 3,608,262 | | | | 633,098 | |
| China Agri-Industries Holdings | | | 2,869,956 | | | | 1,640,261 | |
| China Foods | | | 938,213 | | | | 703,253 | |
| China Mengniu Dairy | | | 1,022,226 | | | | 5,176,312 | |
| China Resources Enterprise | | | 1,925,888 | | | | 5,913,462 | |
| Skyworth Digital Holdings | | | 2,356,487 | | | | 2,106,843 | |
| | | | | | | | 22,119,235 | |
| Consumer Services — 4.9% | | | | | | | | |
| China Dongxiang Group | | | 3,556,288 | | | | 871,735 | |
| Melco Crown Entertainment ADR (A) | | | 229,977 | | | | 4,696,130 | |
| | | | | | | | 5,567,865 | |
| TOTAL HONG KONG | | | | | | | 27,687,100 | |
| TOTAL COMMON STOCK | | | | | | | | |
| (Cost $118,160,976) | | | | | | | 115,267,223 | |
| | | | | | | | | |
| REPURCHASE AGREEMENTS — 7.1% | | | | | | | | |
| Barclays | | | | | | | | |
| 0.100%, dated 04/30/15, to be repurchased on 05/01/15 repurchase price $6,000,017 (collateralized by U.S. Treasury Obligations, ranging in par value $0-$4,015,829, 0.000%-3.000%, 05/31/15-05/15/37 with a total market value of $6,120,002)(B) | | $ | 6,000,000 | | | | 6,000,000 | |
| Deutsche Bank | | | | | | | | |
| 0.080%, dated 04/30/15, to be repurchased on 05/01/15 repurchase price $2,209,510 (collateralized by U.S. Treasury Notes, par value $2,225,355, 1.500%, 11/30/19 with a total market value of $2,245,360)(B) | | | 2,209,505 | | | | 2,209,505 | |
| TOTAL REPURCHASE AGREEMENTS | | | | | | | | |
| (Cost $8,209,505) | | | | | | | 8,209,505 | |
| | | | | | | | | |
| TIME DEPOSIT — 0.2% | | | | | | | | |
| Brown Brothers Harriman, 0.030%, 05/01/15 | | | | | | | | |
| (Cost $179,794) | | | 179,794 | | | | 179,794 | |
| | | | | | | | | |
| TOTAL INVESTMENTS — 107.1% | | | | | | | | |
| (Cost $126,550,275) | | | | | | $ | 123,656,522 | |
Percentages are based on Net Assets of $115,410,933.
| * | Non-income producing security. |
The accompanying notes are an integral part of the financial statements.
| Schedule of Investments | April 30, 2015 (Unaudited) |
Global X China Consumer ETF
| (A) | This security or a partial position of this security is on loan at April 30, 2015. The total value of securities on loan at April 30, 2015 was $7,515,812. |
| (B) | These securities were purchased with cash collateral held from securities on loan. The total value of such securities as of April 30, 2015 was $8,209,505. |
ADR — American Depositary Receipt
Cl — Class
The following is a summary of the inputs used as of April 30, 2015, in valuing the Fund's investments carried at value:
| Investments in Securities | | Level 1 | | | Level 2 | | | Level 3 | | | Total | |
| Common Stock | | $ | 115,267,223 | | | $ | — | | | $ | — | | | $ | 115,267,223 | |
| Repurchase Agreements | | | — | | | | 8,209,505 | | | | — | | | | 8,209,505 | |
| Time Deposit | | | — | | | | 179,794 | | | | — | | | | 179,794 | |
| Total Investments in Securities | | $ | 115,267,223 | | | $ | 8,389,299 | | | $ | — | | | $ | 123,656,522 | |
For the period ended April 30, 2015, there have been no transfers between Level 1, Level 2 or Level 3 investments.
As of April 30, 2015, there were no Level 3 investments.
The accompanying notes are an integral part of the financial statements.
| Schedule of Investments | April 30, 2015 (Unaudited) |
Global X China Energy ETF
Sector Weightings †:
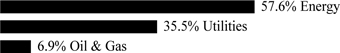
† Sector weightings percentages are based on the total market value of investments
| | | Shares | | | Value | |
| COMMON STOCK — 100.1% | | | | | | | | |
| | | | | | | | | |
| CHINA— 56.3% | | | | | | | | |
| Energy — 37.7% | | | | | | | | |
| Anton Oilfield Services Group | | | 32,028 | | | $ | 7,768 | |
| China Coal Energy, Cl H | | | 64,991 | | | | 42,846 | |
| China Longyuan Power Group, Cl H | | | 82,276 | | | | 102,538 | |
| China Oilfield Services, Cl H | | | 48,056 | | | | 99,198 | |
| China Petroleum & Chemical, Cl H | | | 345,897 | | | | 323,979 | |
| China Shenhua Energy, Cl H | | | 54,540 | | | | 141,783 | |
| Daqo New Energy ADR * | | | 185 | | | | 5,078 | |
| Hanwha SolarOne ADR * | | | 22,010 | | | | 53,044 | |
| JA Solar Holdings ADR * | | | 912 | | | | 9,138 | |
| JinkoSolar Holding ADR * | | | 573 | | | | 16,056 | |
| PetroChina, Cl H | | | 229,913 | | | | 295,431 | |
| Tianneng Power International | | | 16,915 | | | | 8,314 | |
| Trina Solar ADR * | | | 1,029 | | | | 12,564 | |
| Yanzhou Coal Mining, Cl H | | | 47,075 | | | | 47,068 | |
| Yingli Green Energy Holding ADR * | | | 3,070 | | | | 5,680 | |
| | | | | | | | 1,170,485 | |
| Oil & Gas — 4.6% | | | | | | | | |
| ENN Energy Holdings | | | 19,961 | | | | 144,213 | |
| Utilities — 14.0% | | | | | | | | |
| CGN Power, Cl H * (A) | | | 254,700 | | | | 143,268 | |
| Datang International Power Generation, Cl H | | | 71,612 | | | | 42,129 | |
| Huadian Fuxin Energy, Cl H | | | 59,600 | | | | 32,218 | |
| Huadian Power International, Cl H | | | 43,261 | | | | 47,943 | |
| Huaneng Power International, Cl H | | | 91,521 | | | | 131,062 | |
| Huaneng Renewables, Cl H | | | 90,300 | | | | 39,610 | |
| | | | | | | | 436,230 | |
| TOTAL CHINA | | | | | | | 1,750,928 | |
| | | | | | | | | |
| HONG KONG— 43.8% | | | | | | | | |
| Energy — 20.0% | | | | | | | | |
| Beijing Enterprises Holdings | | | 13,573 | | | | 124,328 | |
| China Gas Holdings | | | 42,537 | | | | 75,403 | |
| CNOOC | | | 180,985 | | | | 306,812 | |
| Kunlun Energy | | | 81,205 | | | | 96,698 | |
The accompanying notes are an integral part of the financial statements.
| Schedule of Investments | April 30, 2015 (Unaudited) |
Global X China Energy ETF
| | | Shares | | | Value | |
| COMMON STOCK — continued | | | | | | | | |
| | | | | | | | | |
| Energy — continued | | | | | | | | |
| Shougang Fushan Resources Group | | | 73,615 | | | $ | 18,899 | |
| | | | | | | | 622,140 | |
| Oil & Gas — 2.3% | | | | | | | | |
| China Oil & Gas Group | | | 109,200 | | | | 15,356 | |
| Shunfeng International Clean Energy * | | | 39,200 | | | | 27,714 | |
| Xinjiang Goldwind Science & Technology, Cl H | | | 11,800 | | | | 27,494 | |
| | | | | | | | 70,564 | |
| Utilities — 21.5% | | | | | | | | |
| Beijing Jingneng Clean Energy, Cl H | | | 52,500 | | | | 26,077 | |
| China Power International Development | | | 79,784 | | | | 51,569 | |
| China Resources Gas Group | | | 21,200 | | | | 73,847 | |
| China Resources Power Holdings | | | 46,901 | | | | 141,892 | |
| GCL-Poly Energy Holdings | | | 277,211 | | | | 84,045 | |
| Hong Kong & China Gas | | | 60,767 | | | | 145,035 | |
| Power Assets Holdings | | | 14,500 | | | | 146,756 | |
| | | | | | | | 669,221 | |
| TOTAL HONG KONG | | | | | | | 1,361,925 | |
| | | | | | | | | |
| TOTAL INVESTMENTS — 100.1% | | | | | | | | |
| (Cost $3,153,227) | | | | | | $ | 3,112,853 | |
Percentages are based on Net Assets of $3,111,283.
| * | Non-income producing security. |
| (A) | Securities sold within terms of a private placement memorandum, exempt from registration under Section 144A of the Securities Act of 1933, as amended, and may be sold only to dealers in that program or other "accredited investors." These securities have been determined to be liquid under guidelines established by the board of Trustees. |
ADR — American Depositary Receipt
Cl — Class
As of April 30, 2015, all of the Fund’s investments were considered Level 1, in accordance with the authoritative guidance on fair value measurements and disclosure under U.S. GAAP.
For the period ended April 30, 2015, there have been no transfers between Level 1, Level 2 or Level 3 investments.
As of April 30, 2015, there were no Level 3 investments.
The accompanying notes are an integral part of the financial statements.
| Schedule of Investments | April 30, 2015 (Unaudited) |
Global X China Financials ETF
Sector Weightings †:
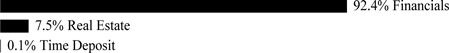
† Sector weightings percentages are based on the total market value of investments.
| | | Shares | | | Value | |
| COMMON STOCK — 99.8% | | | | | | | | |
| | | | | | | | | |
| CHINA— 75.8% | | | | | | | | |
| Financials — 70.0% | | | | | | | | |
| Agricultural Bank of China, Cl H | | | 9,658,088 | | | $ | 5,457,568 | |
| Bank of China, Cl H | | | 16,435,234 | | | | 11,301,523 | |
| Bank of Communications, Cl H | | | 3,258,271 | | | | 3,350,267 | |
| China Citic Bank, Cl H | | | 3,371,122 | | | | 3,066,178 | |
| China Construction Bank, Cl H | | | 11,631,026 | | | | 11,329,189 | |
| China Everbright Bank, Cl H | | | 1,942,300 | | | | 1,320,568 | |
| China Galaxy Securities, Cl H | | | 535,400 | | | | 879,998 | |
| China Life Insurance, Cl H | | | 1,091,840 | | | | 5,317,529 | |
| China Merchants Bank, Cl H | | | 1,772,634 | | | | 5,362,852 | |
| China Minsheng Banking, Cl H | | | 2,462,955 | | | | 3,616,035 | |
| China Pacific Insurance Group, Cl H | | | 930,512 | | | | 5,078,041 | |
| Chongqing Rural Commercial Bank, Cl H | | | 1,035,967 | | | | 927,554 | |
| CITIC Securities, Cl H | | | 436,596 | | | | 1,943,268 | |
| Industrial & Commercial Bank of China, Cl H | | | 13,072,337 | | | | 11,367,029 | |
| PICC Property & Casualty, Cl H | | | 1,904,642 | | | | 4,236,278 | |
| Ping An Insurance Group of China, Cl H | | | 392,707 | | | | 5,644,009 | |
| Sino-Ocean Land Holdings | | | 1,807,652 | | | | 1,511,206 | |
| SOHO China | | | 766,859 | | | | 582,726 | |
| | | | | | | | 82,291,818 | |
| Real Estate — 5.8% | | | | | | | | |
| Agile Property Holdings | | | 581,512 | | | | 487,647 | |
| Country Garden Holdings | | | 2,324,997 | | | | 1,259,812 | |
| Evergrande Real Estate Group | | | 1,887,361 | | | | 1,789,683 | |
| Greentown China Holdings | | | 249,093 | | | | 309,794 | |
| Guangzhou R&F Properties | | | 388,793 | | | | 497,581 | |
| Longfor Properties | | | 492,738 | | | | 858,191 | |
| Shimao Property Holdings | | | 499,904 | | | | 1,184,113 | |
| Shui On Land | | | 1,391,601 | | | | 450,632 | |
| | | | | | | | 6,837,453 | |
| TOTAL CHINA | | | | | | | 89,129,271 | |
| | | | | | | | | |
| HONG KONG— 24.0% | | | | | | | | |
| Financials — 22.3% | | | | | | | | |
| China Everbright | | | 351,641 | | | | 1,168,182 | |
| China Overseas Land & Investment | | | 1,477,766 | | | | 6,186,631 | |
| China Resources Land | | | 941,708 | | | | 3,432,168 | |
The accompanying notes are an integral part of the financial statements.
| Schedule of Investments | April 30, 2015 (Unaudited) |
Global X China Financials ETF
| | | Shares/Face
Amount | | | Value | |
| COMMON STOCK — continued | | | | | | | | |
| | | | | | | | | |
| Financials — continued | | | | | | | | |
| CK Hutchison Holdings | | | 260,950 | | | $ | 5,672,716 | |
| Franshion Properties China | | | 1,180,058 | | | | 478,043 | |
| Haitong Securities, Cl H | | | 555,300 | | | | 1,823,263 | |
| KWG Property Holding | | | 479,585 | | | | 486,939 | |
| New China Life Insurance, Cl H | | | 392,111 | | | | 2,435,786 | |
| People's Insurance Group of China, Cl H | | | 3,355,600 | | | | 2,333,419 | |
| Shenzhen Investment | | | 907,418 | | | | 499,884 | |
| Sunac China Holdings | | | 738,300 | | | | 973,459 | |
| Yuexiu Property | | | 3,197,545 | | | | 783,798 | |
| | | | | | | | 26,274,288 | |
| Real Estate — 1.7% | | | | | | | | |
| China Taiping Insurance Holdings * | | | 398,330 | | | | 1,487,735 | |
| Poly Property Group | | | 832,307 | | | | 535,819 | |
| | | | | | | | 2,023,554 | |
| TOTAL HONG KONG | | | | | | | 28,297,842 | |
| TOTAL COMMON STOCK | | | | | | | | |
| (Cost $91,131,330) | | | | | | | 117,427,113 | |
| | | | | | | | | |
| TIME DEPOSIT — 0.1% | | | | | | | | |
| Brown Brothers Harriman, 0.030%, 05/01/15 | | | | | | | | |
| (Cost $74,905) | | $ | 74,905 | | | | 74,905 | |
| | | | | | | | | |
| TOTAL INVESTMENTS — 99.9% | | | | | | | | |
| (Cost $91,206,235) | | | | | | $ | 117,502,018 | |
Percentages are based on Net Assets of $117,600,671.
* Non-income producing security.
Cl — Class
The following is a summary of the inputs used as of April 30, 2015, in valuing the Fund's investments carried at value:
| Investments in Securities | | Level 1 | | | Level 2 | | | Level 3 | | | Total | |
| Common Stock | | $ | 117,427,113 | | | $ | — | | | $ | — | | | $ | 117,427,113 | |
| Time Deposit | | | — | | | | 74,905 | | | | — | | | | 74,905 | |
| Total Investments in Securities | | $ | 117,427,113 | | | $ | 74,905 | | | $ | — | | | $ | 117,502,018 | |
For the period ended April 30, 2015, there have been no transfers between Level 1, Level 2 or Level 3 investments.
As of April 30, 2015, there were no Level 3 investments.
The accompanying notes are an integral part of the financial statements.
| Schedule of Investments | April 30, 2015 (Unaudited) |
Global X China Industrials ETF
| Sector Weightings †: | |
 | |
| | |
| † Sector weightings percentages are based on the total market value of investments | |
| | | Shares | | | Value | |
| COMMON STOCK — 99.9% | | | | | | | | |
| | | | | | | | | |
| CHINA—72.3% | | | | | | | | |
| Industrials — 72.3% | | | | | | | | |
| Anhui Conch Cement, Cl H | | | 138,737 | | | $ | 563,815 | |
| BYD, Cl H | | | 93,344 | | | | 567,809 | |
| China Communications Construction, Cl H | | | 275,283 | | | | 503,604 | |
| China COSCO Holdings, Cl H * | | | 403,462 | | | | 372,691 | |
| China Lesso Group Holdings | | | 153,345 | | | | 113,162 | |
| China National Building Material, Cl H | | | 450,217 | | | | 548,312 | |
| China National Materials | | | 162,446 | | | | 59,939 | |
| China Railway Construction, Cl H | | | 267,511 | | | | 535,633 | |
| China Railway Group, Cl H | | | 384,768 | | | | 542,070 | |
| China Shanshui Cement Group (A) (B) | | | 292,452 | | | | 225,457 | |
| China Shipping Container Lines, Cl H * | | | 586,252 | | | | 332,034 | |
| China Shipping Development, Cl H | | | 178,044 | | | | 149,535 | |
| China South Locomotive and Rolling Stock | | | 234,413 | | | | 453,635 | |
| China Zhongwang Holdings | | | 224,908 | | | | 136,956 | |
| Dongfang Electric, Cl H | | | 50,343 | | | | 114,570 | |
| First Tractor, Cl H | | | 60,941 | | | | 55,114 | |
| Guangshen Railway, Cl H | | | 223,388 | | | | 148,423 | |
| Haitian International Holdings | | | 99,496 | | | | 247,997 | |
| Harbin Power Equipment, Cl H | | | 100,071 | | | | 82,369 | |
| Hollysys Automation Technologies | | | 6,117 | | | | 134,390 | |
| Jiangsu Expressway, Cl H | | | 190,979 | | | | 263,142 | |
| Metallurgical Corp of China, Cl H | | | 448,541 | | | | 265,613 | |
| Sany Heavy Equipment International Holdings | | | 137,194 | | | | 38,763 | |
| Shanghai Electric Group, Cl H | | | 441,851 | | | | 451,476 | |
| Weichai Power, Cl H | | | 75,959 | | | | 302,321 | |
| Yangzijiang Shipbuilding Holdings | | | 302,543 | | | | 334,623 | |
| Zhejiang Expressway, Cl H | | | 224,100 | | | | 356,772 | |
| Zhuzhou CSR Times Electric, Cl H | | | 66,993 | | | | 573,029 | |
| TOTAL CHINA | | | | | | | 8,473,254 | |
| | | | | | | | | |
| HONG KONG— 27.6% | | | | | | | | |
| Industrials — 27.6% | | | | | | | | |
| AviChina Industry & Technology, Cl H | | | 325,100 | | | | 369,930 | |
| Beijing Capital International Airport, Cl H | | | 216,971 | | | | 231,495 | |
| China CNR, Cl H * (C) | | | 219,100 | | | | 449,442 | |
| China High Speed Transmission Equipment Group | | | 148,250 | | | | 134,266 | |
| China Huarong Energy * | | | 729,218 | | | | 97,842 | |
| China International Marine Containers Group, Cl H | | | 68,600 | | | | 185,414 | |
The accompanying notes are an integral part of the financial statements.
| Schedule of Investments | April 30, 2015 (Unaudited) |
Global X China Industrials ETF
| | | Shares | | | Value | |
| COMMON STOCK — continued | | | | | | | | |
| | | | | | | | | |
| Industrials — continued | | | | | | | | |
| China Merchants Holdings International | | | 134,011 | | | $ | 609,443 | |
| China Resources Cement Holdings | | | 271,441 | | | | 173,346 | |
| Shanghai Industrial Holdings | | | 72,399 | | | | 289,553 | |
| Shenzhen International Holdings | | | 165,596 | | | | 312,343 | |
| Sunny Optical Technology Group | | | 104,664 | | | | 234,412 | |
| Zoomlion Heavy Industry Science and Technology | | | 201,500 | | | | 140,639 | |
| TOTAL HONG KONG | | | | | | | 3,228,125 | |
| TOTAL INVESTMENTS — 99.9% | | | | | | | | |
| (Cost $9,706,515) | | | | | | $ | 11,701,379 | |
Percentages are based on Net Assets of $11,718,671.
| * | Non-income producing security. |
| (A) | Securities considered illiquid. The total value of such securities as of April 30, 2015 was $225,457 and represented 1.9% of Net Assets. |
| (B) | Security is fair valued using methods determined in good faith by the Fair Value Committee of the Fund. The total value of such securities as of April 30, 2015, was $225,457 and represents 1.9% of net assets. |
| (C) | Securities sold within terms of a private placement memorandum, exempt from registration under Section 144A of the Securities Act of 1933, as amended, and may be sold only to dealers in that program or other "accredited investors." These securities have been determined to be liquid under guidelines established by the board of Trustees. |
Cl — Class
The following is a summary of the inputs used as of April 30, 2015, in valuing the Fund's investments carried at value:
| Investments in Securities | | Level 1 | | | Level 2 | | | Level 3(1) | | | Total | |
| Common Stock | | $ | 11,475,922 | | | $ | — | | | $ | 225,457 | | | $ | 11,701,379 | |
| Total Investments in Securities | | $ | 11,475,922 | | | $ | — | | | $ | 225,457 | | | $ | 11,701,379 | |
(1) Please see Note 2 for details on the unobservable inputs and the interrelationships and sensitivity between these inputs for those Level 3 securities that are not valued by third party pricing vendors or broker quotes.
The following is a reconciliation of investments in which significant unobservable inputs (Level 3) were used in determining fair value:
| | | Investments in | |
| | | Common Stock | |
| Beginning Balance as of October 31, 2014 | | $ | 507,987 | |
| Transfers out of Level 3 | | | (507,987 | ) |
| Transfers into Level 3 | | | 225,457 | |
| Ending Balance as of April 30, 2015 | | $ | 225,457 | |
For the period ended April 30, 2015, the transfers in and out of Level 3 were due to the lifting of trading halts in the shares of the affected companies. Transfers between levels are recognized at period end.
Net change in unrealized appreciation (depreciation) from investments (Level 3) still held at April 30, 2015 is $0.
The accompanying notes are an integral part of the financial statements.
| Schedule of Investments | April 30, 2015 (Unaudited) |
Global X China Materials ETF
| Sector Weightings †: | |
 | |
| | |
| † Sector weightings percentages are based on the total market value of investments | |
| | | Shares | | | Value | |
| COMMON STOCK — 99.9% | | | | | | | | |
| | | | | | | | | |
| CHINA—65.5% | | | | | | | | |
| Basic Materials — 65.5% | | | | | | | | |
| Aluminum Corp of China, Cl H * | | | 517,699 | | | $ | 333,950 | |
| Angang Steel, Cl H | | | 396,784 | | | | 331,201 | |
| BBMG, Cl H | | | 297,200 | | | | 368,857 | |
| China BlueChemical | | | 615,029 | | | | 274,540 | |
| China Hongqiao Group | | | 414,882 | | | | 388,058 | |
| China Molybdenum, Cl H | | | 334,388 | | | | 335,201 | |
| Dongyue Group | | | 393,457 | | | | 167,512 | |
| Fosun International | | | 134,100 | | | | 335,633 | |
| Jiangxi Copper, Cl H | | | 158,841 | | | | 329,521 | |
| Maanshan Iron & Steel, Cl H | | | 632,925 | | | | 246,600 | |
| Real Gold Mining * (A) (B) | | | 97,864 | | | | 6,481 | |
| Sinofert Holdings | | | 643,130 | | | | 177,560 | |
| Sinopec Shanghai Petrochemical, Cl H | | | 642,510 | | | | 388,764 | |
| Sinopec Yizheng Chemical Fibre, Cl H | | | 577,814 | | | | 336,201 | |
| Zhaojin Mining Industry | | | 297,344 | | | | 212,521 | |
| Zijin Mining Group, Cl H | | | 1,042,849 | | | | 402,278 | |
| TOTAL CHINA | | | | | | | 4,634,878 | |
| | | | | | | | | |
| HONG KONG— 33.0% | | | | | | | | |
| Basic Materials — 33.0% | | | | | | | | |
| China Lumena New Materials * (A)(B) | | | 1,082,950 | | | | 1,746 | |
| China Precious Metal Resources Holdings * | | | 1,373,200 | | | | 116,926 | |
| Citic Pacific | | | 172,100 | | | | 345,037 | |
| Fufeng Group | | | 379,244 | | | | 296,990 | |
| Kingboard Chemical Holdings | | | 172,500 | | | | 315,127 | |
| Kingboard Laminates Holdings | | | 274,128 | | | | 141,111 | |
| Nine Dragons Paper Holdings | | | 450,900 | | | | 369,392 | |
| North Mining Shares, Cl C * | | | 2,589,756 | | | | 126,963 | |
| Shougang Concord International Enterprises * | | | 2,248,024 | | | | 159,513 | |
| West China Cement | | | 838,100 | | | | 143,808 | |
| Yingde Gases | | | 364,549 | | | | 319,345 | |
| TOTAL HONG KONG | | | | | | | 2,335,958 | |
| | | | | | | | | |
| SINGAPORE—1.4% | | | | | | | | |
| Basic Materials — 1.4% | | | | | | | | |
| Midas Holdings | | | 350,666 | | | | 103,250 | |
| TOTAL INVESTMENTS — 99.9% | | | | | | | | |
| (Cost $6,849,582) | | | | | | $ | 7,074,086 | |
Percentages are based on Net Assets of $7,077,874.
The accompanying notes are an integral part of the financial statements.
| Schedule of Investments | April 30, 2015 (Unaudited) |
Global X China Materials ETF
| * | Non-income producing security. |
Cl — Class
| (A) | Securities considered illiquid. The total value of such securities as of April 30, 2015 was $8,227 and represented 0.1% of Net Assets. |
| (B) | Security is fair valued using methods determined in good faith by the Fair Value Committee of the Fund. The total value of such securities as of April 30, 2015, was $8,227 and represents 0.1% of net assets. |
The following is a summary of the inputs used as of April 30, 2015, in valuing the Fund's investments carried at value:
| Investments in Securities | | Level 1 | | | Level 2 | | | Level 3 | | | Total | |
| Common Stock | | $ | 6,663,581 | | | $ | 402,278 | | | $ | 8,227 | | | $ | 7,074,086 | |
| Total Investments in Securities | | $ | 6,663,581 | | | $ | 402,278 | | | $ | 8,227 | | | $ | 7,074,086 | |
The following is a reconciliation of investments in which significant unobservable inputs (Level 3) were used in determining fair value:
| | | Investments in | |
| | | Common Stock | |
| Beginning Balance as of October 31, 2014 | | $ | 121,942 | |
| Transfers out of Level 3 | | | (87,457 | ) |
| Change in unrealized appreciation/(depreciation) | | | (26,258 | ) |
| Ending Balance as of April 30, 2015 | | $ | 8,227 | |
For the period ended April 30, 2015, the transfers in and out of Level 3 were due to the lifting of trading halts in the shares of the affected companies. Transfers between levels are recognized at period end.
Net change in unrealized appreciation (depreciation) from investments (Level 3) still held at April 30, 2015 is $(26,258).
The accompanying notes are an integral part of the financial statements.
| Schedule of Investments | April 30, 2015 (Unaudited) |
Global X NASDAQ China Technology ETF
| Sector Weightings †: | |
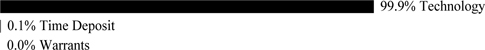 | |
| | |
| † Sector weightings percentages are based on the total market value of investments. | |
| | | Shares | | | Value | |
| COMMON STOCK — 99.9% | | | | | | | | |
| | | | | | | | | |
| CHINA—68.2% | | | | | | | | |
| Technology — 68.2% | | | | | | | | |
| 21Vianet Group ADR * | | | 20,256 | | | $ | 416,666 | |
| Autohome ADR * | | | 12,062 | | | | 615,644 | |
| Baidu ADR * | | | 6,565 | | | | 1,314,838 | |
| BYD Electronic International | | | 336,881 | | | | 508,506 | |
| China Communications Services, Cl H | | | 374,603 | | | | 211,680 | |
| China Finance Online ADR * | | | 8,439 | | | | 44,558 | |
| ChinaCache International Holdings ADR * | | | 4,272 | | | | 60,192 | |
| Coolpad Group | | | 1,094,115 | | | | 409,350 | |
| FIH Mobile * | | | 998,619 | | | | 533,377 | |
| Kingdee International Software Group * | | | 769,949 | | | | 458,921 | |
| Lenovo Group | | | 867,363 | | | | 1,499,476 | |
| NetEase ADR | | | 13,372 | | | | 1,714,157 | |
| Qihoo 360 Technology ADR * | | | 29,256 | | | | 1,764,137 | |
| Semiconductor Manufacturing International * | | | 7,621,474 | | | | 845,612 | |
| Shanghai Baosight Software, Cl B | | | 49,500 | | | | 221,364 | |
| Sohu.com * | | | 12,286 | | | | 816,405 | |
| Tencent Holdings | | | 87,035 | | | | 1,806,691 | |
| Travelsky Technology, Cl H | | | 138,455 | | | | 269,367 | |
| Vimicro International ADR * | | | 8,300 | | | | 108,647 | |
| YY ADR * | | | 12,683 | | | | 806,131 | |
| ZTE, Cl H | | | 268,011 | | | | 904,187 | |
| TOTAL CHINA | | | | | | | 15,329,906 | |
| | | | | | | | | |
| HONG KONG— 27.3% | | | | | | | | |
| Technology — 27.3% | | | | | | | | |
| Alibaba Health Information Technology * | | | 940,029 | | | | 1,455,313 | |
| ASM Pacific Technology | | | 66,143 | | | | 740,691 | |
| China Public Procurement * | | | 3,582,500 | | | | 117,858 | |
| Chinasoft International * (A) | | | 469,276 | | | | 262,840 | |
| Comba Telecom Systems Holdings | | | 383,597 | | | | 136,095 | |
| Digital China Holdings | | | 348,838 | | | | 540,956 | |
| Hi Sun Technology China * | | | 769,300 | | | | 309,660 | |
| Ju Teng International Holdings | | | 336,444 | | | | 211,386 | |
| PAX Global Technology * | | | 272,400 | | | | 397,118 | |
| Suncorp Technologies * | | | 5,153,400 | | | | 917,501 | |
| TCL Communication Technology Holdings | | | 223,132 | | | | 238,356 | |
The accompanying notes are an integral part of the financial statements.
| Schedule of Investments | April 30, 2015 (Unaudited) |
Global X NASDAQ China Technology ETF
| | | Shares/Number
of
Warrants/Face
Amount | | | Value | |
| COMMON STOCK — continued | | | | | | | | |
| | | | | | | | | |
| Technology — continued | | | | | | | | |
| V1 Group | | | 1,421,678 | | | $ | 150,400 | |
| VTech Holdings | | | 47,032 | | | | 654,710 | |
| TOTAL HONG KONG | | | | | | | 6,132,884 | |
| | | | | | | | | |
| UNITED STATES— 4.4% | | | | | | | | |
| Technology — 4.4% | | | | | | | | |
| NQ Mobile ADR * | | | 33,489 | | | | 128,598 | |
| SINA * | | | 17,997 | | | | 791,778 | |
| Weibo ADR * | | | 3,900 | | | | 65,052 | |
| TOTAL UNITED STATES | | | | | | | 985,428 | |
| TOTAL COMMON STOCK | | | | | | | | |
| (Cost $16,610,577) | | | | | | | 22,448,218 | |
| | | | | | | | | |
| WARRANTS — 0.0% | | | | | | | | |
| Hong Kong — 0.0% | | | | | | | | |
| Ju Teng International Holdings Strike Price $4.60, Expires 10/30/16* (A) (B) | | | | | | | | |
| (Cost $–) | | | 42,930 | | | | 1,496 | |
| | | | | | | | | |
| TIME DEPOSIT — 0.1% | | | | | | | | |
| Brown Brothers Harriman, 0.030%, 05/01/15 | | | | | | | | |
| (Cost $17,794) | | $ | 17,794 | | | | 17,794 | |
| TOTAL INVESTMENTS — 100.0% | | | | | | | | |
| (Cost $16,628,371) | | | | | | $ | 22,467,508 | |
Percentages are based on Net Assets of $22,462,584.
| * | Non-income producing security. |
| (A) | Security is fair valued using methods determined in good faith by the Fair Value Committee of the Fund. The total value of such securities as of April 30, 2015, was $264,336 and represents 1.2% of net assets. |
| (B) | Securities considered illiquid. The total value of such securities as of April 30, 2015 was $1,496 and represented 0.0% of Net Assets. |
| ADR — American Depositary Receipt | |
| Cl — Class | |
| | |
Amounts designated as “—“ are $0 or have been rounded to $0.
The following is a summary of the inputs used as of April 30, 2015, in valuing the Fund's investments carried at value:
| Investments in Securities | | Level 1 | | | Level 2 | | | Level 3(1) | | | Total | |
| Common Stock | | $ | 21,964,014 | | | $ | 484,204 | | | $ | — | | | $ | 22,448,218 | |
| Warrants | | | — | | | | — | | | | 1,496 | | | | 1,496 | |
| Time Deposit | | | — | | | | 17,794 | | | | — | | | | 17,794 | |
| Total Investments in Securities | | $ | 21,964,014 | | | $ | 501,998 | | | $ | 1,496 | | | $ | 22,467,508 | |
(1) A reconciliation of Level 3 investments and disclosures of significant unobservable inputs are presented when the Fund has a significant amount (over 1%) of Level 3 investments at the beginning and/or end of the period in relation to net assets. Management has concluded that Level 3 investments are not material in relation to net assets.
For the period ended April 30, 2015 the transfers in and out of Level 3 were due to changes in the availability of observable inputs to determine fair value. Transfers between levels are recognized at period end.
The accompanying notes are an integral part of the financial statements.
| Schedule of Investments | April 30, 2015 (Unaudited) |
Global X Southeast Asia ETF
| Sector Weightings †: | |
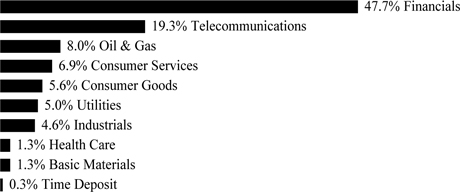 | |
| | |
| † Sector weightings percentages are based on the total market value of investments. | |
| | | Shares | | | Value | |
| COMMON STOCK — 98.9% | | | | | | | | |
| | | | | | | | | |
| INDONESIA—16.3% | | | | | | | | |
| Consumer Goods — 4.1% | | | | | | | | |
| Astra International | | | 1,256,731 | | | $ | 664,116 | |
| Unilever Indonesia | | | 72,596 | | | | 238,580 | |
| | | | | | | | 902,696 | |
| | | | | | | | | |
| Financials — 8.4% | | | | | | | | |
| Bank Central Asia | | | 766,756 | | | | 797,071 | |
| Bank Mandiri | | | 583,260 | | | | 483,707 | |
| Bank Rakyat Indonesia Persero | | | 672,260 | | | | 602,895 | |
| | | | | | | | 1,883,673 | |
| | | | | | | | | |
| Telecommunications — 2.9% | | | | | | | | |
| Telekomunikasi Indonesia ADR | | | 15,734 | | | | 651,073 | |
| Utilities — 0.9% | | | | | | | | |
| Perusahaan Gas Negara | | | 678,439 | | | | 214,588 | |
| TOTAL INDONESIA | | | | | | | 3,652,030 | |
| | | | | | | | | |
| MALAYSIA—26.2% | | | | | | | | |
| Basic Materials — 1.3% | | | | | | | | |
| Petronas Chemicals Group | | | 183,024 | | | | 301,657 | |
| Financials — 10.6% | | | | | | | | |
| CIMB Group Holdings | | | 329,105 | | | | 545,197 | |
| Malayan Banking | | | 297,181 | | | | 768,507 | |
| Public Bank | | | 194,429 | | | | 1,063,450 | |
| | | | | | | | 2,377,154 | |
| | | | | | | | | |
| Health Care — 1.3% | | | | | | | | |
| IHH Healthcare | | | 170,800 | | | | 283,907 | |
| Industrials — 2.2% | | | | | | | | |
| Sime Darby | | | 194,846 | | | | 495,663 | |
The accompanying notes are an integral part of the financial statements.
| Schedule of Investments | April 30, 2015 (Unaudited) |
Global X Southeast Asia ETF
| | | Shares | | | Value | |
| COMMON STOCK — continued | | | | | | | | |
| Oil & Gas — 1.4% | | | | | | | | |
| Petronas Gas | | | 49,339 | | | $ | 314,750 | |
| Telecommunications — 5.4% | | | | | | | | |
| Axiata Group | | | 269,128 | | | | 509,314 | |
| DiGi.Com | | | 233,100 | | | | 393,354 | |
| Maxis | | | 163,706 | | | | 319,001 | |
| | | | | | | | 1,221,669 | |
| Utilities — 4.0% | | | | | | | | |
| Tenaga Nasional | | | 220,555 | | | | 889,280 | |
| TOTAL MALAYSIA | | | | | | | 5,884,080 | |
| | | | | | | | | |
| PHILIPPINES—4.3% | | | | | | | | |
| Consumer Services — 1.8% | | | | | | | | |
| SM Investments | | | 19,887 | | | | 402,161 | |
| Financials — 0.9% | | | | | | | | |
| SM Prime Holdings | | | 485,400 | | | | 203,404 | |
| Telecommunications — 1.6% | | | | | | | | |
| Philippine Long Distance Telephone ADR | | | 5,427 | | | | 349,716 | |
| TOTAL PHILIPPINES | | | | | | | 955,281 | |
| | | | | | | | | |
| SINGAPORE—36.9% | | | | | | | | |
| Consumer Goods — 1.4% | | | | | | | | |
| Wilmar International | | | 131,221 | | | | 322,963 | |
| Consumer Services — 3.5% | | | | | | | | |
| Genting Singapore | | | 378,945 | | | | 293,246 | |
| Jardine Cycle & Carriage | | | 6,327 | | | | 193,027 | |
| Singapore Airlines | | | 31,473 | | | | 289,888 | |
| | | | | | | | 776,161 | |
| Financials — 22.6% | | | | | | | | |
| CapitaLand | | | 158,388 | | | | 441,245 | |
| DBS Group Holdings | | | 108,673 | | | | 1,730,334 | |
| Oversea-Chinese Banking | | | 190,736 | | | | 1,537,926 | |
| United Overseas Bank | | | 74,087 | | | | 1,369,817 | |
| | | | | | | | 5,079,322 | |
| Oil & Gas — 2.6% | | | | | | | | |
| Keppel | | | 89,107 | | | | 586,624 | |
| Telecommunications — 6.8% | | | | | | | | |
| Singapore Telecommunications | | | 457,834 | | | | 1,531,240 | |
| TOTAL SINGAPORE | | | | | | | 8,296,310 | |
| | | | | | | | | |
| THAILAND—15.2% | | | | | | | | |
| Consumer Services — 1.6% | | | | | | | | |
| CP ALL | | | 274,763 | | | | 350,070 | |
The accompanying notes are an integral part of the financial statements.
| Schedule of Investments | April 30, 2015 (Unaudited) |
Global X Southeast Asia ETF
| | | Shares/Face
Amount | | | Value | |
| COMMON STOCK — continued | | | | | | | | |
| Financials — 4.9% | | | | | | | | |
| Bangkok Bank | | | 30,201 | | | $ | 169,488 | |
| Kasikornbank | | | 72,918 | | | | 464,517 | |
| Siam Commercial Bank | | | 97,071 | | | | 468,202 | |
| | | | | | | | 1,102,207 | |
| Industrials — 2.4% | | | | | | | | |
| Airports of Thailand | | | 26,700 | | | | 234,885 | |
| Siam Cement | | | 18,986 | | | | 307,554 | |
| | | | | | | | 542,439 | |
| Oil & Gas — 3.9% | | | | | | | | |
| PTT | | | 53,314 | | | | 575,756 | |
| PTT Exploration & Production | | | 86,680 | | | | 307,646 | |
| | | | | | | | 883,402 | |
| Telecommunications — 2.4% | | | | | | | | |
| Advanced Info Service | | | 74,171 | | | | 539,998 | |
| TOTAL THAILAND | | | | | | | 3,418,116 | |
| TOTAL COMMON STOCK | | | | | | | | |
| (Cost $23,991,746) | | | | | | | 22,205,817 | |
| | | | | | | | | |
| TIME DEPOSIT — 0.3% | | | | | | | | |
| Brown Brothers Harriman, 0.030%, 05/01/15 | | | | | | | | |
| (Cost $62,278) | | $ | 62,278 | | | | 62,278 | |
| | | | | | | | | |
| TOTAL INVESTMENTS — 99.2% | | | | | | | | |
| (Cost $24,054,024) | | | | | | $ | 22,268,095 | |
Percentages are based on Net Assets of $22,453,339.
ADR — American Depositary Receipt
The following is a summary of the inputs used as of April 30, 2015, in valuing the Fund's investments carried at value:
| Investments in Securities | | Level 1 | | | Level 2 | | | Level 3 | | | Total | |
| Common Stock | | $ | 22,205,817 | | | $ | — | | | $ | — | | | $ | 22,205,817 | |
| Time Deposit | | | — | | | | 62,278 | | | | — | | | | 62,278 | |
| Total Investments in Securities | | $ | 22,205,817 | | | $ | 62,278 | | | $ | — | | | $ | 22,268,095 | |
For the period ended April 30, 2015, there have been no transfers between Level 1, Level 2 or Level 3 investments.
As of April 30, 2015, there were no Level 3 investments.
The accompanying notes are an integral part of the financial statements.
| Schedule of Investments | April 30, 2015 (Unaudited) |
Global X FTSE Andean 40 ETF
| Sector Weightings †: | |
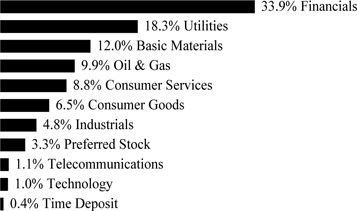 | |
| | |
| † Sector weightings percentages are based on the total market value of investments. | |
| | | Shares | | | Value | |
| COMMON STOCK — 96.3% | | | | | | | | |
| | | | | | | | | |
| CHILE—48.0% | | | | | | | | |
| Basic Materials — 4.8% | | | | | | | | |
| CAP | | | 5,261 | | | $ | 18,776 | |
| Empresas CMPC | | | 73,529 | | | | 206,296 | |
| Sociedad Quimica y Minera de Chile ADR | | | 6,029 | | | | 131,673 | |
| | | | | | | | 356,745 | |
| Consumer Goods — 1.4% | | | | | | | | |
| Cia Cervecerias Unidas ADR | | | 4,859 | | | | 106,266 | |
| Consumer Services — 8.8% | | | | | | | | |
| Cencosud | | | 73,860 | | | | 191,370 | |
| Latam Airlines Group ADR * | | | 22,198 | | | | 212,435 | |
| SACI Falabella | | | 31,565 | | | | 246,220 | |
| | | | | | | | 650,025 | |
| Financials — 11.2% | | | | | | | | |
| Banco de Chile ADR | | | 2,613 | | | | 183,433 | |
| Banco de Credito e Inversiones | | | 2,845 | | | | 141,836 | |
| Banco Santander Chile ADR | | | 10,251 | | | | 223,574 | |
| Corpbanca ADR | | | 7,005 | | | | 118,735 | |
| Parque Arauco | | | 33,874 | | | | 69,115 | |
| Sociedad Matriz Banco de Chile, Cl B | | | 304,020 | | | | 92,817 | |
| | | | | | | | 829,510 | |
| Oil & Gas — 3.9% | | | | | | | | |
| Empresas COPEC | | | 24,869 | | | | 285,465 | |
| Technology — 1.0% | | | | | | | | |
| Sonda | | | 30,924 | | | | 73,046 | |
| Telecommunications — 1.1% | | | | | | | | |
| ENTEL Chile | | | 7,155 | | | | 80,920 | |
The accompanying notes are an integral part of the financial statements.
|
| Schedule of Investments | April 30, 2015 (Unaudited) |
| |
| Global X FTSE Andean 40 ETF |
| | Shares | | | Value | |
| COMMON STOCK — continued | | | | | | | | |
| Utilities — 15.8% | | | | | | | | |
| AES Gener | | | 165,931 | | | $ | 95,594 | |
| Aguas Andinas, Cl A | | | 191,342 | | | | 113,177 | |
| Colbun | | | 463,596 | | | | 140,255 | |
| E.CL * | | | 34,572 | | | | 56,242 | |
| Empresa Nacional de Electricidad ADR | | | 6,538 | | | | 301,532 | |
| Enersis ADR | | | 26,112 | | | | 464,010 | |
| | | | | | | | 1,170,810 | |
| TOTAL CHILE | | | | | | | 3,552,787 | |
| | | | | | | | | |
| COLOMBIA— 31.4% | | | | | | | | |
| Consumer Goods — 5.1% | | | | | | | | |
| Almacenes Exito | | | 18,684 | | | | 199,014 | |
| Grupo Nutresa | | | 17,285 | | | | 178,350 | |
| | | | | | | | 377,364 | |
| Financials — 13.0% | | | | | | | | |
| BanColombia ADR | | | 8,131 | | | | 368,090 | |
| Celsia ESP | | | 25,200 | | | | 53,033 | |
| Financiera Colombiana | | | 8,822 | | | | 140,801 | |
| Grupo Aval Acciones y Valores ADR | | | 8,529 | | | | 86,314 | |
| Grupo de Inversiones Suramericana | | | 19,587 | | | | 319,478 | |
| | | | | | | | 967,716 | |
| Industrials — 4.8% | | | | | | | | |
| Cementos Argos | | | 34,462 | | | | 145,336 | |
| Grupo Argos | | | 26,946 | | | | 212,006 | |
| | | | | | | | 357,342 | |
| Oil & Gas — 6.0% | | | | | | | | |
| Ecopetrol ADR | | | 20,782 | | | | 355,788 | |
| Pacific Rubiales Energy^ | | | 25,825 | | | | 86,989 | |
| | | | | | | | 442,777 | |
| Utilities — 2.5% | | | | | | | | |
| Interconexion Electrica | | | 27,680 | | | | 92,280 | |
| Isagen | | | 68,130 | | | | 90,427 | |
| | | | | | | | 182,707 | |
| TOTAL COLOMBIA | | | | | | | 2,327,906 | |
| | | | | | | | | |
| PERU— 16.9% | | | | | | | | |
| Basic Materials — 7.2% | | | | | | | | |
| Cia de Minas Buenaventura ADR | | | 17,219 | | | | 192,508 | |
| Southern Copper | | | 10,509 | | | | 342,383 | |
| | | | | | | | 534,891 | |
| Financials — 9.7% | | | | | | | | |
| BBVA Banco Continental | | | 22,500 | | | | 30,456 | |
| Credicorp | | | 1,056 | | | | 158,875 | |
| | | | | | | | | |
The accompanying notes are an integral part of the financial statements.
|
| |
| Schedule of Investments | April 30, 2015 (Unaudited) |
| |
| Global X FTSE Andean 40 ETF |
| | | Shares/Face
Amount | | | Value | |
| | | | | | | | | |
| COMMON STOCK — continued | | | | | | | | |
| Financials — continued | | | | | | | | |
| Credicorp Ltd. | | | 3,441 | | | $ | 524,925 | |
| | | | | | | | 714,256 | |
| TOTAL PERU | | | | | | | 1,249,147 | |
| TOTAL COMMON STOCK | | | | | | | | |
| (Cost $9,535,650) | | | | | | | 7,129,840 | |
| | | | | | | | | |
| PREFERRED STOCK — 3.4% | | | | | | | | |
| COLOMBIA— 3.4% | | | | | | | | |
| Financials — 2.3% | | | | | | | | |
| Banco Davivienda | | | 8,380 | | | | 96,733 | |
| Grupo Aval Acciones y Valores | | | 134,171 | | | | 67,655 | |
| | | | | | | | 164,388 | |
| Industrials — 1.1% | | | | | | | | |
| Grupo Argos | | | 10,420 | | | | 82,417 | |
| TOTAL PREFERRED STOCK | | | | | | | | |
| (Cost $277,294) | | | | | | | 246,805 | |
| | | | | | | | | |
| TIME DEPOSIT — 0.4% | | | | | | | | |
| Brown Brothers Harriman, 0.030%, 05/01/15 | | | | | | | | |
| (Cost $30,783) | | $ | 30,783 | | | | 30,783 | |
| TOTAL INVESTMENTS — 100.1% | | | | | | | | |
| (Cost $9,843,727) | | | | | | $ | 7,407,428 | |
Percentages are based on Net Assets of $7,403,149.
| * | Non-income producing security. |
| ^ | Security traded on the Toronto Stock Exchange. |
| ADR | — American Depositary Receipt |
The accompanying notes are an integral part of the financial statements.
|
| |
| Schedule of Investments | April 30, 2015 (Unaudited) |
| |
| Global X FTSE Andean 40 ETF |
The following is a summary of the inputs used as of April 30, 2015, in valuing the Fund's investments carried at value:
| Investments in Securities | | Level 1 | | | Level 2 | | | Level 3 | | | Total | |
| Common Stock | | $ | 7,129,840 | | | $ | — | | | $ | — | | | $ | 7,129,840 | |
| Preferred Stock | | | 246,805 | | | | — | | | | — | | | | 246,805 | |
| Time Deposit | | | — | | | | 30,783 | | | | — | | | | 30,783 | |
| Total Investments in Securities | | $ | 7,376,645 | | | $ | 30,783 | | | $ | — | | | $ | 7,407,428 | |
For the period ended April 30, 2015, there have been no transfers between Level 1, Level 2 or Level 3 investments.
As of April 30, 2015, there were no Level 3 investments.
The accompanying notes are an integral part of the financial statements.
|
| |
| Schedule of Investments | April 30, 2015 (Unaudited) |
| |
| Global X MSCI Colombia 40 ETF |
| Sector Weightings †: | |
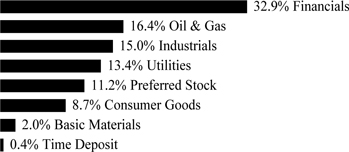 | |
† Sector weightings percentages are based on the total market value of investments. | |
| | | Shares | | | Value | |
| COMMON STOCK — 88.2% | | | | | | | | |
| | | | | | | | | |
| COLOMBIA— 88.2% | | | | | | | | |
| Basic Materials — 2.1% | | | | | | | | |
| Mineros | | | 2,985,963 | | | $ | 2,146,474 | |
| Consumer Goods — 8.7% | | | | | | | | |
| Almacenes Exito | | | 446,761 | | | | 4,758,699 | |
| Grupo Nutresa | | | 429,727 | | | | 4,433,997 | |
| | | | | | | | 9,192,696 | |
| Financials — 32.6% | | | | | | | | |
| Banco de Bogota | | | 36,697 | | | | 961,602 | |
| BanColombia ADR | | | 331,961 | | | | 15,027,874 | |
| Bolsa de Valores de Colombia | | | 297,680,626 | | | | 2,605,085 | |
| Celsia ESP | | | 1,902,821 | | | | 4,004,437 | |
| Financiera Colombiana | | | 96,803 | | | | 1,545,037 | |
| Grupo Aval Acciones y Valores | | | 365,311 | | | | 183,443 | |
| Grupo Aval Acciones y Valores ADR | | | 181,711 | | | | 1,838,915 | |
| Grupo de Inversiones Suramericana | | | 493,369 | | | | 8,047,200 | |
| Interbolsa * (A) (B) | | | 1,320,603 | | | | 550 | |
| | | | | | | | 34,214,143 | |
| Industrials — 15.0% | | | | | | | | |
| Cementos Argos | | | 625,587 | | | | 2,638,277 | |
| Cemex Latam Holdings * | | | 743,312 | | | | 4,119,788 | |
| Construcciones El Condor | | | 3,657,776 | | | | 2,499,845 | |
| Constructora Conconcreto | | | 4,711,469 | | | | 2,297,176 | |
| Grupo Argos | | | 526,264 | | | | 4,140,547 | |
| | | | | | | | 15,695,633 | |
| Oil & Gas — 16.4% | | | | | | | | |
| Canacol Energy * | | | 1,090,274 | | | | 3,537,483 | |
| Ecopetrol ADR | | | 550,612 | | | | 9,426,478 | |
| Pacific Rubiales Energy^ | | | 1,249,319 | | | | 4,208,232 | |
| | | | | | | | 17,172,193 | |
| Utilities — 13.4% | | | | | | | | |
| Empresa de Energia de Bogota | | | 6,236,977 | | | | 4,418,503 | |
The accompanying notes are an integral part of the financial statements.
|
| |
| Schedule of Investments | April 30, 2015 (Unaudited) |
| |
| Global X MSCI Colombia ETF |
| | | Shares/Face
Amount | | | Value | |
| COMMON STOCK — continued | | | | | | | | |
| | | | | | | | | |
| Utilities — continued | | | | | | | | |
| Interconexion Electrica | | | 1,389,162 | | | $ | 4,631,215 | |
| Isagen | | | 3,783,882 | | | | 5,022,259 | |
| | | | | | | | 14,071,977 | |
| TOTAL COMMON STOCK | | | | | | | | |
| (Cost $111,504,617) | | | | | | | 92,493,116 | |
| | | | | | | | | |
| PREFERRED STOCK — 11.2% | | | | | | | | |
| | | | | | | | | |
| COLOMBIA— 11.2% | | | | | | | | |
| Consumer Services — 3.4% | | | | | | | | |
| Avianca Holdings* | | | 2,271,776 | | | | 3,550,168 | |
| Financials — 7.1% | | | | | | | | |
| Banco Davivienda | | | 430,881 | | | | 4,973,811 | |
| Grupo Aval Acciones y Valores | | | 1,431,941 | | | | 722,042 | |
| Grupo de Inversiones Suramericana | | | 121,603 | | | | 1,798,973 | |
| | | | | | | | 7,494,826 | |
| Industrials — 0.7% | | | | | | | | |
| Grupo Argos | | | 84,538 | | | | 668,652 | |
| TOTAL PREFERRED STOCK | | | | | | | | |
| (Cost $12,046,626) | | | | | | | 11,713,646 | |
| | | | | | | | | |
| TIME DEPOSIT — 0.4% | | | | | | | | |
| Brown Brothers Harriman, 0.030%, 05/01/15 | | | | | | | | |
| (Cost $402,749) | | $ | 402,749 | | | | 402,749 | |
| TOTAL INVESTMENTS — 99.8% | | | | | | | | |
| (Cost $123,953,992) | | | | | | $ | 104,609,511 | |
Percentages are based on Net Assets of $104,777,965.
| * | Non-income producing security. |
| ^ | Security traded on the Toronto Stock Exchange. |
| ADR | — American Depositary Receipt |
| (A) | Securities considered illiquid. The total value of such securities as of April 30, 2015 was $550 and represented 0.0% of Net Assets. |
| (B) | Security is fair valued using methods determined in good faith by the Fair Value Committee of the Fund. The total value of such securities as of April 30, 2015, was $550 and represents 0.0% of net assets. |
The accompanying notes are an integral part of the financial statements.
|
| |
| Schedule of Investments | April 30, 2015 (Unaudited) |
| |
| Global X MSCI Colombia ETF |
The following is a summary of the inputs used as of April 30, 2015, in valuing the Fund's investments carried at value:
| Investments in Securities | | Level 1 | | | Level 2 | | | Level 3 | | | Total | |
| Common Stock | | $ | 92,492,566 | | | $ | — | | | $ | 550 | | | $ | 92,493,116 | |
| Preferred Stock | | | 11,713,646 | | | | — | | | | — | | | | 11,713,646 | |
| Time Deposit | | | — | | | | 402,749 | | | | — | | | | 402,749 | |
| Total Investments in Securities | | $ | 104,206,212 | | | $ | 402,749 | | | $ | 550 | | | $ | 104,609,511 | |
The following is a reconciliation of investments in which significant unobservable inputs (Level 3) were used in determining fair value:
| | | Investments in | |
| | | Common Stock | |
| Beginning Balance as of October 31, 2014 | | $ | 3,471,731 | |
| Transfers out of Level 3 | | | (3,471,090 | ) |
| Change in unrealized appreciation/(depreciation) | | | (91 | ) |
| Ending Balance as of April 30, 2015 | | $ | 550 | |
For the period ended April 30, 2015, the transfers in and out of Level 3 were due to the lifting of trading halts in the shares of the affected companies. Transfers between levels are recognized at period end.
Net change in unrealized appreciation (depreciation) from investments (Level 3) still held at April 30, 2015 is $(91).
The accompanying notes are an integral part of the financial statements.
|
| |
| Schedule of Investments | April 30, 2015 (Unaudited) |
| |
| Global X Brazil Mid Cap ETF |
| Sector Weightings †: | |
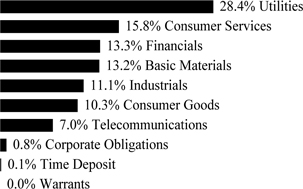 | |
| |
| † Sector weightings percentages are based on the total market value of investments. | |
| | | Shares | | | Value | |
| COMMON STOCK — 93.7% | | | | | | | | |
| | | | | | | | | |
| BRAZIL— 93.7% | | | | | | | | |
| Basic Materials — 12.0% | | | | | | | | |
| Cia Siderurgica Nacional ADR | | | 59,729 | | | $ | 160,671 | |
| Fibria Celulose ADR | | | 20,645 | | | | 289,236 | |
| Gerdau ADR | | | 41,386 | | | | 139,057 | |
| | | | | | | | 588,964 | |
| Consumer Goods — 10.2% | | | | | | | | |
| Cosan, Cl A | | | 6,496 | | | | 47,161 | |
| Cosan Industria e Comercio | | | 4,683 | | | | 45,346 | |
| Hypermarcas * | | | 14,787 | | | | 98,118 | |
| JBS | | | 38,645 | | | | 197,925 | |
| M Dias Branco | | | 1,656 | | | | 47,377 | |
| Natura Cosmeticos | | | 7,069 | | | | 66,729 | |
| | | | | | | | 502,656 | |
| Consumer Services — 13.6% | | | | | | | | |
| Cia Brasileira de Distribuicao Grupo Pao de Acucar ADR | | | 5,430 | | | | 182,122 | |
| Kroton Educacional | | | 65,180 | | | | 240,373 | |
| Localiza Rent a Car | | | 5,902 | | | | 69,508 | |
| Lojas Renner | | | 5,081 | | | | 178,264 | |
| | | | | | | | 670,267 | |
| Financials — 12.5% | | | | | | | | |
| BM&F Bovespa | | | 70,706 | | | | 291,165 | |
| BR Malls Participacoes | | | 16,891 | | | | 92,479 | |
| CETIP - Mercados Organizados | | | 8,752 | | | | 100,155 | |
| Cyrela Brazil Realty Empreendimentos e Participacoes | | | 9,239 | | | | 36,043 | |
| Multiplan Empreendimentos Imobiliarios | | | 3,099 | | | | 54,250 | |
| Porto Seguro | | | 3,706 | | | | 45,957 | |
| | | | | | | | 620,049 | |
| Industrials — 11.1% | | | | | | | | |
| Duratex | | | 11,163 | | | | 31,676 | |
The accompanying notes are an integral part of the financial statements.
|
| |
| Schedule of Investments | April 30, 2015 (Unaudited) |
| |
| Global X Brazil Mid Cap ETF |
| | | Shares/Face
Amount | | | Value | |
| COMMON STOCK — continued | | | | | | |
| | | | | | | |
| Industrials — continued | | | | | | | | |
| EcoRodovias Infraestrutura e Logistica | | | 7,927 | | | $ | 23,445 | |
| Embraer ADR | | | 4,304 | | | | 134,199 | |
| Klabin | | | 38,344 | | | | 236,530 | |
| WEG | | | 23,170 | | | | 124,540 | |
| | | | | | | | 550,390 | |
| Telecommunications — 7.0% | | | | | | | | |
| Oi ADR | | | 21,943 | | | | 42,350 | |
| Tim Participacoes ADR | | | 19,075 | | | | 299,859 | |
| | | | | | | | 342,209 | |
| Utilities — 27.3% | | | | | | | | |
| Centrais Eletricas Brasileiras ADR | | | 41,555 | | | | 101,810 | |
| Cia de Saneamento Basico do Estado de Sao Paulo ADR | | | 25,777 | | | | 151,826 | |
| Cia Energetica de Minas Gerais ADR | | | 28,851 | | | | 141,947 | |
| Cia Paranaense de Energia ADR | | | 3,783 | | | | 41,386 | |
| CPFL Energia ADR | | | 19,743 | | | | 257,056 | |
| EDP - Energias do Brasil | | | 9,381 | | | | 35,158 | |
| Tractebel Energia | | | 8,167 | | | | 96,265 | |
| Ultrapar Participacoes ADR | | | 22,755 | | | | 519,724 | |
| | | | | | | | 1,345,172 | |
| TOTAL COMMON STOCK | | | | | | | | |
| (Cost $5,835,750) | | | | | | | 4,619,707 | |
| | | | | | | | | |
PREFERRED STOCK — 4.9%
| | | | | | | | |
| | | | | | | | | |
| BRAZIL— 4.9% | | | | | | | | |
| Basic Materials — 1.2% | | | | | | | | |
| Braskem | | | 5,694 | | | | 23,638 | |
| Metalurgica Gerdau | | | 10,355 | | | | 33,802 | |
| | | | | | | | 57,440 | |
| Consumer Services — 2.1% | | | | | | | | |
| Lojas Americanas | | | 18,749 | | | | 106,653 | |
| Financials — 0.7% | | | | | | | | |
| Bradespar | | | 8,696 | | | | 34,940 | |
| Utilities — 0.9% | | | | | | | | |
| Cia Energetica de Sao Paulo | | | 6,966 | | | | 43,389 | |
| TOTAL PREFERRED STOCK | | | | | | | | |
| (Cost $522,400) | | | | | | | 242,422 | |
| | | | | | | | | |
| CORPORATE OBLIGATIONS — 0.8% | | | | | | | | |
| Hypermarcas | | | | | | | | |
| 11.300%, 10/15/18(A) (B) | | $ | 59,000 | | | | 19,999 | |
| 3.000%, 10/15/18(A) (B) | | | 59,000 | | | | 19,998 | |
| | | | | | | | | |
| TOTAL CORPORATE OBLIGATIONS | | | | | | | | |
| (Cost $70,852) | | | | | | | 39,997 | |
The accompanying notes are an integral part of the financial statements.
|
| |
| Schedule of Investments | April 30, 2015 (Unaudited) |
| |
| Global X Brazil Mid Cap ETF |
| | | Number of
Warrants/Face
Amount | | | Value | |
| WARRANTS — 0.0% | | | | | | |
| Brazil — 0.0% | | | | | | |
| Hypermarcas - Strike Price 29.48, Expires 10/15/15*(A) (B) | | | | | | |
| (Cost $–) | | | 59 | | | $ | — | |
| | | | | | | | | |
| TIME DEPOSIT — 0.1% | | | | | | | | |
| Brown Brothers Harriman, 0.030%, 05/01/15 | | | | | | | | |
| (Cost $5,999) | | $ | 5,999 | | | | 5,999 | |
| TOTAL INVESTMENTS — 99.5% | | | | | | | | |
| (Cost $6,435,001) | | | | | | $ | 4,908,125 | |
Percentages are based on Net Assets of $4,931,150.
| * | Non-income producing security. |
| ADR | — American Depositary Receipt |
| (A) | Securities considered illiquid. The total value of such securities as of April 30, 2015 was $39,997 and represented 0.8% of Net Assets. |
| (B) | Security is fair valued using methods determined in good faith by the Fair Value Committee of the Fund. The total value of such securities as of April 30, 2015, was $39,997 and represents 0.8% of net assets. |
Amounts designated as “—“ are $0 or have been rounded to $0.
The following is a summary of the inputs used as of April 30, 2015, in valuing the Fund's investments carried at value:
| Investments in Securities | | Level 1 | | | Level 2 | | | Level 3(1) | | | Total | |
| Common Stock | | $ | 4,619,707 | | | $ | — | | | $ | — | | | $ | 4,619,707 | |
| Preferred Stock | | | 242,422 | | | | — | | | | — | | | | 242,422 | |
| Corporate Obligations | | | — | | | | — | | | | 39,997 | | | | 39,997 | |
| Warrants | | | — | | | | — | | | | — | | | | — | |
| Time Deposit | | | — | | | | 5,999 | | | | — | | | | 5,999 | |
| Total Investments in Securities | | $ | 4,862,129 | | | $ | 5,999 | | | $ | 39,997 | | | $ | 4,908,125 | |
(1) A reconciliation of Level 3 investments and disclosures of significant unobservable inputs are presented when the Fund has a significant amount (over 1%) of Level 3 investments at the beginning and/or end of the period in relation to net assets. Management has concluded that Level 3 investments are not material in relation to net assets.
For the period ended April 30, 2015, there have been no transfers between Level 1, Level 2 or Level 3 investments.
The accompanying notes are an integral part of the financial statements.
|
| |
| Schedule of Investments | April 30, 2015 (Unaudited) |
| |
| Global X Brazil Consumer ETF |
| Sector Weightings †: | |
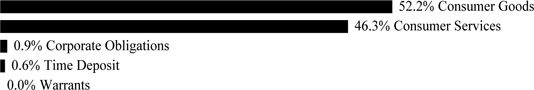 | |
| |
| † Sector weightings percentages are based on the total market value of investments. | |
| | | Shares | | | Value | |
| COMMON STOCK — 92.8% | | | | | | | | |
| | | | | | | | | |
| BRAZIL— 92.8% | | | | | | | | |
| Consumer Goods — 51.2% | | | | | | | | |
| AMBEV ADR | | | 56,545 | | | $ | 357,930 | |
| Arezzo Industria e Comercio | | | 7,612 | | | | 62,184 | |
| BRF ADR | | | 13,775 | | | | 295,749 | |
| Cia Hering | | | 25,503 | | | | 151,366 | |
| Cosan, Cl A | | | 30,125 | | | | 218,707 | |
| Cosan Industria e Comercio | | | 21,907 | | | | 212,127 | |
| Gafisa ADR * | | | 36,185 | | | | 63,686 | |
| Grendene | | | 12,152 | | | | 72,084 | |
| Hypermarcas * | | | 55,180 | | | | 366,143 | |
| JBS | | | 80,316 | | | | 411,348 | |
| M Dias Branco | | | 7,668 | | | | 219,374 | |
| Marfrig Alimentos * | | | 43,486 | | | | 59,450 | |
| Minerva * | | | 17,785 | | | | 50,881 | |
| Natura Cosmeticos | | | 27,346 | | | | 258,137 | |
| Sao Martinho | | | 8,642 | | | | 109,385 | |
| SLC Agricola | | | 7,526 | | | | 43,790 | |
| Souza Cruz | | | 46,592 | | | | 413,247 | |
| | | | | | | | 3,365,588 | |
| Consumer Services — 41.6% | | | | | | | | |
| B2W Cia Digital * | | | 16,924 | | | | 153,211 | |
| Cia Brasileira de Distribuicao Grupo Pao de Acucar ADR | | | 8,575 | | | | 287,606 | |
| Cosan Logistica * | | | 26,287 | | | | 20,511 | |
| Estacio Participacoes | | | 33,700 | | | | 200,803 | |
| GAEC Educacao | | | 6,400 | | | | 41,528 | |
| Gol Linhas Aereas Inteligentes ADR | | | 17,423 | | | | 44,254 | |
| International Meal Alimentacao * | | | 7,267 | | | | 18,101 | |
| Kroton Educacional | | | 52,228 | | | | 192,608 | |
| Localiza Rent a Car | | | 27,101 | | | | 319,170 | |
| Lojas Renner | | | 12,621 | | | | 442,801 | |
| Marisa Lojas | | | 8,496 | | | | 40,482 | |
| Multiplus | | | 7,827 | | | | 86,646 | |
| Raia Drogasil | | | 35,242 | | | | 399,888 | |
| Restoque Comercio e Confeccoes de Roupas | | | 17,379 | | | | 51,574 | |
The accompanying notes are an integral part of the financial statements.
| Schedule of Investments | April 30, 2015 (Unaudited) |
Global X Brazil Consumer ETF
| | | Shares/Face
Amount/
Number of
Warrants | | | Value | |
| COMMON STOCK — continued |
| |
| Consumer Services — continued | | | | | | | | |
| Smiles | | | 10,381 | | | $ | 178,956 | |
| Via Varejo | | | 39,854 | | | | 248,768 | |
| | | | | | | | 2,726,907 | |
| TOTAL COMMON STOCK | | | | | | | | |
| (Cost $7,473,969) | | | | | | | 6,092,495 | |
| | | | | | | | | |
| PREFERRED STOCK — 5.8% |
| |
| BRAZIL— 5.8% | | | | | | | | |
| Consumer Goods — 1.0% | | | | | | | | |
| Alpargatas | | | 19,258 | | | | 64,342 | |
| Consumer Services — 4.8% | | | | | | | | |
| Lojas Americanas | | | 56,112 | | | | 319,191 | |
| TOTAL PREFERRED STOCK | | | | | | | | |
| (Cost $349,681) | | | | | | | 383,533 | |
| | | | | | | | | |
| CORPORATE OBLIGATIONS — 0.8% |
| Hypermarcas | | | | | | | | |
| 11.300%, 10/15/18(A) (B) | | $ | 84,000 | | | | 28,473 | |
| 3.000%, 10/15/18(A) (B) | | | 84,000 | | | | 28,472 | |
| TOTAL CORPORATE OBLIGATIONS | | | | | | | | |
| (Cost $100,874) | | | | | | | 56,945 | |
|
| WARRANTS — 0.0% |
| Brazil — 0.0% |
| Hypermarcas - Strike Price 29.48 Expires 10/15/15*(A) (B) | | | | | | | | |
| (Cost $–) | | | 84 | | | | — | |
| | | | | | | | | |
| TIME DEPOSIT — 0.6% |
| Brown Brothers Harriman, 0.030%, 05/01/15 | | | | | | | | |
| (Cost $36,272) | | | 36,272 | | | | 36,272 | |
| TOTAL INVESTMENTS — 100.0% | | | | | | | | |
| (Cost $7,960,796) | | | | | | $ | 6,569,245 | |
Percentages are based on Net Assets of $6,567,292.
| * | Non-income producing security. |
ADR — American Depositary Receipt
Cl — Class
| * | Non-income producing security. |
| (A) | Securities considered illiquid. The total value of such securities as of April 30, 2015 was $56,945 and represented 0.9% of Net Assets. |
| (B) | Security is fair valued using methods determined in good faith by the Fair Value Committee of the Fund. The total value of such securities as of April 30, 2015, was $56,945 and represents 0.9% of net assets. |
Amounts designated as “—“ are $0 or have been rounded to $0.
The accompanying notes are an integral part of the financial statements.
| Schedule of Investments | April 30, 2015 (Unaudited) |
Global X Brazil Consumer ETF
The following is a summary of the inputs used as of April 30, 2015, in valuing the Fund's investments carried at value:
| Investments in Securities | | Level 1 | | | Level 2 | | | Level 3(1) | | | Total | |
| Common Stock | | $ | 6,092,495 | | | $ | — | | | $ | — | | | $ | 6,092,495 | |
| Preferred Stock | | | 383,533 | | | | — | | | | — | | | | 383,533 | |
| Corporate Obligations | | | — | | | | — | | | | 56,945 | | | | 56,945 | |
| Warrants | | | — | | | | — | | | | — | | | | — | |
| Time Deposit | | | — | | | | 36,272 | | | | — | | | | 36,272 | |
| Total Investments in Securities | | $ | 6,476,028 | | | $ | 36,272 | | | $ | 56,945 | | | $ | 6,569,245 | |
(1) A reconciliation of Level 3 investments and disclosures of significant unobservable inputs are presented when the Fund has a significant amount (over 1%) of Level 3 investments at the beginning and/or end of the period in relation to net assets. Management has concluded that Level 3 investments are not material in relation to net assets.
For the period ended April 30, 2015, there have been no transfers between Level 1, Level 2 or Level 3 investments.
The accompanying notes are an integral part of the financial statements.
| Schedule of Investments | April 30, 2015 (Unaudited) |
Global X Brazil Financials ETF
Sector Weightings †:
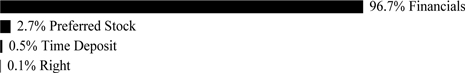
† Sector weightings percentages are based on the total market value of investments.
| | | Shares | | | Value | |
| COMMON STOCK — 96.5% |
| |
| BRAZIL— 96.5% | | | | | | | | |
| Financials — 96.5% | | | | | | | | |
| Aliansce Shopping Centers | | | 2,682 | | | $ | 15,140 | |
| Banco Bradesco ADR | | | 11,854 | | | | 126,719 | |
| Banco do Brasil | | | 6,543 | | | | 57,139 | |
| Banco Santander Brasil ADR | | | 25,121 | | | | 136,407 | |
| BB Seguridade Participacoes | | | 5,357 | | | | 62,054 | |
| BM&F Bovespa | | | 16,981 | | | | 69,927 | |
| BR Malls Participacoes | | | 9,851 | | | | 53,935 | |
| BR Properties | | | 6,594 | | | | 24,186 | |
| Brasil Brokers Participacoes | | | 7,064 | | | | 6,477 | |
| Brasil Insurance Participacoes e Administracao | | | 3,444 | | | | 2,148 | |
| CETIP - Mercados Organizados | | | 5,218 | | | | 59,713 | |
| Cielo | | | 4,805 | | | | 66,407 | |
| Cyrela Brazil Realty Empreendimentos e Participacoes | | | 8,984 | | | | 35,049 | |
| Even Construtora e Incorporadora | | | 8,254 | | | | 13,376 | |
| Ez Tec Empreendimentos e Participacoes | | | 1,914 | | | | 12,100 | |
| Grupo BTG Pactual, Cl Miscellaneous | | | 5,799 | | | | 57,525 | |
| Helbor Empreendimentos | | | 4,030 | | | | 4,313 | |
| Iguatemi Empresa de Shopping Centers | | | 2,506 | | | | 22,486 | |
| Itau Unibanco Holding ADR | | | 9,995 | | | | 128,136 | |
| LPS Brasil Consultoria de Imoveis | | | 2,217 | | | | 4,199 | |
| MRV Engenharia e Participacoes | | | 10,991 | | | | 29,868 | |
| Multiplan Empreendimentos Imobiliarios | | | 2,951 | | | | 51,659 | |
| PDG Realty Empreendimentos e Participacoes * | | | 49,966 | | | | 8,664 | |
| Porto Seguro | | | 3,633 | | | | 45,051 | |
| Qualicorp * | | | 6,620 | | | | 53,661 | |
| Sul America | | | 12,263 | | | | 57,777 | |
| TOTAL COMMON STOCK | | | | | | | | |
| (Cost $1,465,210) | | | | | | | 1,204,116 | |
|
| PREFERRED STOCK — 2.7% |
| |
| BRAZIL— 2.7% | | | | | | | | |
| Financials — 2.7% | | | | | | | | |
| Banco ABC Brasil | | | 1,997 | | | | 8,823 | |
The accompanying notes are an integral part of the financial statements.
| Schedule of Investments | April 30, 2015 (Unaudited) |
Global X Brazil Financials ETF
| | | Shares/Number
of Rights/Face
Amount | | | Value | |
| PREFERRED STOCK— continued |
| |
| Financials — continued | | | | | | | | |
| Banco do Estado do Rio Grande do Sul | | | 6,668 | | | $ | 25,235 | |
| TOTAL PREFERRED STOCK | | | | | | | | |
| (Cost $43,404) | | | | | | | 34,058 | |
|
| RIGHT — 0.1% |
| Brazil — 0.1% | | | | | | | | |
| PDG Realty Empreendimentos e Participacoes* | | | | | | | | |
| (Cost $–) | | | 42,911 | | | | 1,431 | |
|
| TIME DEPOSIT — 0.5% |
| Brown Brothers Harriman, 0.030%, 05/01/15 | | | | | | | | |
| (Cost $6,190) | | $ | 6,190 | | | | 6,190 | |
| TOTAL INVESTMENTS — 99.8% | | | | | | | | |
| (Cost $1,514,804) | | | | | | $ | 1,245,795 | |
Percentages are based on Net Assets of $1,248,333.
| * | Non-income producing security. |
ADR — American Depositary Receipt
Cl — Class
Amounts designated as “—“ are $0 or have been rounded to $0.
The following is a summary of the inputs used as of April 30, 2015, in valuing the Fund's investments carried at value:
| Investments in Securities | | Level 1 | | | Level 2 | | | Level 3 | | | Total | |
| Common Stock | | $ | 1,204,116 | | | $ | — | | | $ | — | | | $ | 1,204,116 | |
| Preferred Stock | | | 34,058 | | | | — | | | | — | | | | 34,058 | |
| Right | | | 1,431 | | | | — | | | | — | | | | 1,431 | |
| Time Deposit | | | — | | | | 6,190 | | | | — | | | | 6,190 | |
| Total Investments in Securities | | $ | 1,239,605 | | | $ | 6,190 | | | $ | — | | | $ | 1,245,795 | |
For the period ended April 30, 2015, there have been no transfers between Level 1, Level 2 or Level 3 investments.
As of April 30, 2015, there were no Level 3 investments.
The accompanying notes are an integral part of the financial statements.
| Schedule of Investments | April 30, 2015 (Unaudited) |
Global X MSCI Argentina ETF
Sector Weightings †:
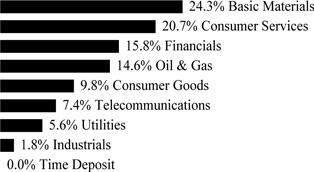
† Sector weightings percentages are based on the total market value of investments.
| | | Shares | | | Value | |
| COMMON STOCK — 99.9% |
| |
| ARGENTINA— 84.6% | | | | | | | | |
| Basic Materials — 21.0% | | | | | | | | |
| Tenaris ADR | | | 138,145 | | | $ | 4,247,959 | |
| Consumer Goods — 2.5% | | | | | | | | |
| Cresud SACIF y A ADR * | | | 38,539 | | | | 506,792 | |
| Consumer Services — 19.1% | | | | | | | | |
| Arcos Dorados Holdings, Cl A | | | 123,356 | | | | 740,136 | |
| MercadoLibre | | | 22,017 | | | | 3,133,680 | |
| | | | | | | | 3,873,816 | |
| Financials — 15.8% | | | | | | | | |
| Banco Macro ADR | | | 16,097 | | | | 889,359 | |
| BBVA Banco Frances ADR | | | 47,734 | | | | 920,312 | |
| Grupo Financiero Galicia ADR | | | 42,356 | | | | 933,526 | |
| IRSA Inversiones y Representaciones ADR | | | 24,914 | | | | 451,442 | |
| | | | | | | | 3,194,639 | |
| Oil & Gas — 13.2% | | | | | | | | |
| Petrobras Argentina ADR | | | 87,263 | | | | 616,950 | |
| Transportadora de Gas del Sur ADR | | | 130,336 | | | | 642,556 | |
| YPF ADR | | | 46,432 | | | | 1,418,033 | |
| | | | | | | | 2,677,539 | |
| Telecommunications — 7.4% | | | | | | | | |
| Grupo Clarin GDR, Cl B | | | 48,631 | | | | 680,834 | |
| Telecom Argentina ADR | | | 38,670 | | | | 806,656 | |
| | | | | | | | 1,487,490 | |
| Utilities — 5.6% | | | | | | | | |
| Empresa Distribuidora Y Comercializadora Norte ADR * | | | 29,763 | | | | 423,825 | |
| Pampa Energia ADR * | | | 43,137 | | | | 702,270 | |
| | | | | | | | 1,126,095 | |
| TOTAL ARGENTINA | | | | | | | 17,114,330 | |
The accompanying notes are an integral part of the financial statements.
| Schedule of Investments | April 30, 2015 (Unaudited) |
Global X MSCI Argentina ETF
| | | Shares/Face
Amount | | | Value | |
| COMMON STOCK — continued |
| |
| CANADA— 5.5% | | | | | | | | |
| Basic Materials — 3.3% | | | | | | | | |
| Pan American Silver | | | 28,761 | | | $ | 273,804 | |
| Silver Standard Resources * | | | 73,094 | | | | 397,997 | |
| | | | | | | | 671,801 | |
| Industrials — 1.8% | | | | | | | | |
| Finning International | | | 17,667 | | | | 360,560 | |
| Oil & Gas — 0.4% | | | | | | | | |
| Pan American Silver | | | 8,878 | | | | 84,657 | |
| TOTAL CANADA | | | | | | | 1,117,018 | |
| | | | | | | | | |
| CHILE— 5.4% | | | | | | | | |
| Consumer Goods — 3.8% | | | | | | | | |
| Cia Cervecerias Unidas ADR | | | 17,943 | | | | 392,413 | |
| Embotelladora Andina ADR, Cl B | | | 19,615 | | | | 370,920 | |
| | | | | | | | 763,333 | |
| Consumer Services — 1.6% | | | | | | | | |
| Cencosud | | | 129,538 | | | | 335,631 | |
| TOTAL CHILE | | | | | | | 1,098,964 | |
| | | | | | | | | |
| HONG KONG— 0.9% | | | | | | | | |
| Oil & Gas — 0.9% | | | | | | | | |
| EPI Holdings * | | | 13,912,600 | | | | 179,491 | |
| | | | | | | | | |
| MEXICO— 1.7% | | | | | | | | |
| Consumer Goods — 1.7% | | | | | | | | |
| Arca Continental | | | 54,900 | | | | 336,350 | |
| | | | | | | | | |
| SPAIN— 1.8% | | | | | | | | |
| Consumer Goods — 1.8% | | | | | | | | |
| Prosegur Cia de Seguridad | | | 62,600 | | | | 361,253 | |
| TOTAL COMMON STOCK | | | | | | | | |
| (Cost $20,789,456) | | | | | | | 20,207,406 | |
|
| TIME DEPOSIT — 0.0% |
| Brown Brothers Harriman, 0.030%, 05/01/15 | | | | | | | | |
| (Cost $7,222) | | $ | 7,222 | | | | 7,222 | |
| TOTAL INVESTMENTS — 99.9% | | | | | | | | |
| (Cost $20,796,678) | | | | | | $ | 20,214,628 | |
Percentages are based on Net Assets of $20,230,723.
| * | Non-income producing security. |
ADR — American Depositary Receipt
Cl — Class
The accompanying notes are an integral part of the financial statements.
| Schedule of Investments | April 30, 2015 (Unaudited) |
Global X MSCI Argentina ETF
The following is a summary of the inputs used as of April 30, 2015, in valuing the Fund's investments carried at value:
| Investments in Securities | | Level 1 | | | Level 2 | | | Level 3 | | | Total | |
| Common Stock | | $ | 20,207,406 | | | $ | — | | | $ | — | | | $ | 20,207,406 | |
| Time Deposit | | | — | | | | 7,222 | | | | — | | | | 7,222 | |
| Total Investments in Securities | | $ | 20,207,406 | | | $ | 7,222 | | | $ | — | | | $ | 20,214,628 | |
For the period ended April 30, 2015, there have been no transfers between Level 1, Level 2 or Level 3 investments.
As of April 30, 2015, there were no Level 3 investments.
The accompanying notes are an integral part of the financial statements.
| Schedule of Investments | April 30, 2015 (Unaudited) |
Global X FTSE Greece 20 ETF
Sector Weightings †:
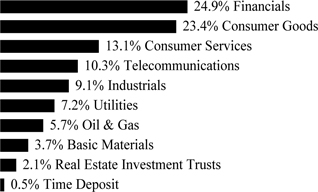
† Sector weightings percentages are based on the total market value of investments.
| | | Shares | | | Value | |
| COMMON STOCK — 99.2% |
| |
| GREECE— 99.2% | | | | | | | | |
| Basic Materials — 3.7% | | | | | | | | |
| Mytilineos Holdings * | | | 1,553,929 | | | $ | 10,708,706 | |
| Consumer Goods — 23.3% | | | | | | | | |
| Coca-Cola HBC | | | 2,596,387 | | | | 55,022,401 | |
| JUMBO | | | 1,211,153 | | | | 12,472,262 | |
| | | | | | | | 67,494,663 | |
| Consumer Services — 13.1% | | | | | | | | |
| FF Group | | | 417,878 | | | | 12,595,995 | |
| OPAP | | | 2,828,786 | | | | 25,199,848 | |
| | | | | | | | 37,795,843 | |
| Financials — 24.9% | | | | | | | | |
| Alpha Bank AE * | | | 37,766,603 | | | | 13,161,307 | |
| Eurobank Ergasias * | | | 98,694,228 | | | | 14,929,877 | |
| National Bank of Greece ADR * | | | 20,246,290 | | | | 29,559,583 | |
| Piraeus Bank * | | | 31,956,151 | | | | 14,180,135 | |
| | | | | | | | 71,830,902 | |
| Industrials — 9.1% | | | | | | | | |
| Ellaktor | | | 2,689,019 | | | | 6,026,353 | |
| Metka | | | 507,281 | | | | 4,717,994 | |
| Titan Cement | | | 524,798 | | | | 13,231,388 | |
| Viohalco * | | | 767,391 | | | | 2,261,534 | |
| | | | | | | | 26,237,269 | |
| Oil & Gas — 5.6% | | | | | | | | |
| Hellenic Petroleum | | | 1,372,942 | | | | 6,830,710 | |
| Motor Oil Hellas Corinth Refineries | | | 1,082,785 | | | | 9,463,843 | |
| | | | | | | | 16,294,553 | |
| Real Estate Investment Trusts — 2.1% | | | | | | | | |
| Grivalia Properties | | | 757,112 | | | | 6,023,504 | |
The accompanying notes are an integral part of the financial statements.
| Schedule of Investments | April 30, 2015 (Unaudited) |
Global X FTSE Greece 20 ETF
| | | Shares/Face
Amount | | | Value | |
| COMMON STOCK — continued |
| |
| Telecommunications — 10.2% | | | | | | | | |
| Hellenic Telecommunications Organization | | | 3,261,214 | | | $ | 29,600,226 | |
| Utilities — 7.2% | | | | | | | | |
| Athens Water Supply & Sewage | | | 822,740 | | | | 4,609,601 | |
| Public Power | | | 2,112,585 | | | | 14,179,853 | |
| Terna Energy | | | 677,193 | | | | 2,033,658 | |
| | | | | | | | 20,823,112 | |
| TOTAL COMMON STOCK | | | | | | | | |
| (Cost $325,289,132) | | | | | | | 286,808,778 | |
| | | | | | | | | |
| TIME DEPOSIT — 0.5% |
| Brown Brothers Harriman, 0.030%, 05/01/15 | | | | | | | | |
| (Cost $1,309,371) | | $ | 1,309,371 | | | | 1,309,371 | |
| TOTAL INVESTMENTS — 99.7% | | | | | | | | |
| (Cost $326,598,503) | | | | | | $ | 288,118,149 | |
Percentages are based on Net Assets of $288,948,309.
| * | Non-income producing security. |
ADR — American Depositary Receipt
The following is a summary of the inputs used as of April 30, 2015, in valuing the Fund's investments carried at value:
| Investments in Securities | | Level 1 | | | Level 2 | | | Level 3 | | | Total | |
| Common Stock | | $ | 286,808,778 | | | $ | — | | | $ | — | | | $ | 286,808,778 | |
| Time Deposit | | | — | | | | 1,309,371 | | | | — | | | | 1,309,371 | |
| Total Investments in Securities | | $ | 286,808,778 | | | $ | 1,309,371 | | | $ | — | | | $ | 288,118,149 | |
For the period ended April 30, 2015, the transfers out of Level 3 were due to the lifting of trading halts in the shares of the affected companies. Transfers between levels are recognized at period end.
As of April 30, 2015, there were no Level 3 investments.
The accompanying notes are an integral part of the financial statements.
| Schedule of Investments | April 30, 2015 (Unaudited) |
Global X MSCI Norway ETF
Sector Weightings †:
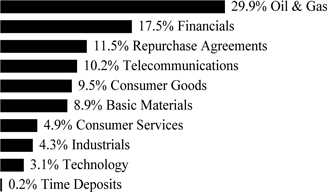
† Sector weightings percentages are based on the total market value of investments. Repurchase agreements purchased from cash collateral received for securities lending activity are included in total investments. Please see Note 8 in Notes to Financial Statements for more detailed information.
| | | Shares | | | Value | |
| COMMON STOCK ��� 98.9% |
| |
| BERMUDA— 0.4% | | | | | | | | |
| Industrials — 0.4% | | | | | | | | |
| Avance Gas Holding (A) | | | 21,700 | | | $ | 342,685 | |
| | | | | | | | | |
| CYPRUS— 0.2% | | | | | | | | |
| Oil & Gas — 0.2% | | | | | | | | |
| Songa Offshore * | | | 810,500 | | | | 181,772 | |
| | | | | | | | | |
| NORWAY— 95.7% | | | | | | | | |
| Basic Materials — 10.0% | | | | | | | | |
| Borregaard | | | 88,400 | | | | 683,339 | |
| Norsk Hydro | | | 685,457 | | | | 3,237,398 | |
| Yara International (B) | | | 104,667 | | | | 5,367,040 | |
| | | | | | | | 9,287,777 | |
| Consumer Goods — 10.7% | | | | | | | | |
| Austevoll Seafood | | | 113,800 | | | | 661,461 | |
| Bakkafrost P | | | 31,855 | | | | 748,236 | |
| Kongsberg Automotive Holding * | | | 414,393 | | | | 344,801 | |
| Leroy Seafood Group | | | 24,000 | | | | 796,231 | |
| Marine Harvest | | | 233,381 | | | | 2,850,869 | |
| Orkla | | | 498,358 | | | | 3,908,561 | |
| Salmar | | | 44,040 | | | | 715,931 | |
| | | | | | | | 10,026,090 | |
| Consumer Services — 5.4% | | | | | | | | |
| Norwegian Air Shuttle * | | | 23,831 | | | | 999,349 | |
| Schibsted (B) | | | 65,170 | | | | 4,058,693 | |
| | | | | | | | 5,058,042 | |
| Financials — 19.5% | | | | | | | | |
| Aker, Cl A | | | 26,560 | | | | 597,428 | |
| DnB (B) | | | 623,098 | | | | 11,080,238 | |
The accompanying notes are an integral part of the financial statements.
| Schedule of Investments | April 30, 2015 (Unaudited) |
Global X MSCI Norway ETF
| | | Shares | | | Value | |
| COMMON STOCK — continued |
| |
| Financials — continued | | | | | | | | |
| Gjensidige Forsikring (B) | | | 173,143 | | | $ | 3,012,282 | |
| Norwegian Property | | | 271,668 | | | | 365,925 | |
| Selvaag Bolig | | | 55,987 | | | | 211,006 | |
| SpareBank 1 Nord Norge | | | 86,022 | | | | 504,568 | |
| SpareBank 1 SMN | | | 112,600 | | | | 1,004,890 | |
| Storebrand * | | | 420,988 | | | | 1,489,422 | |
| | | | | | | | 18,265,759 | |
| Industrials — 4.5% | | | | | | | | |
| American Shipping | | | 55,365 | | | | 233,642 | |
| BW LPG (A) | | | 68,260 | | | | 603,746 | |
| Deep Sea Supply | | | 437,800 | | | | 235,298 | |
| Golden Ocean Group * | | | 110,843 | | | | 544,985 | |
| Hexagon Composites (B) | | | 82,800 | | | | 267,008 | |
| Hoegh LNG Holdings | | | 45,150 | | | | 608,151 | |
| Ocean Yield | | | 46,009 | | | | 344,968 | |
| Stolt-Nielsen | | | 33,450 | | | | 623,678 | |
| Thin Film Electronics * | | | 361,749 | | | | 295,237 | |
| Wilh Wilhelmsen, Cl B | | | 65,327 | | | | 424,792 | |
| | | | | | | | 4,181,505 | |
| Oil & Gas — 30.7% | | | | | | | | |
| Aker Solutions | | | 141,586 | | | | 862,048 | |
| Aker Solutions (B) | | | 153,086 | | | | 298,635 | |
| Archer * | | | 478,800 | | | | 177,275 | |
| Awilco Drilling | | | 20,633 | | | | 169,078 | |
| BW Offshore | | | 460,000 | | | | 341,849 | |
| Det Norske Oljeselskap * (B) | | | 102,305 | | | | 746,024 | |
| DNO International * (B) | | | 589,184 | | | | 1,106,357 | |
| Fred Olsen Energy (B) | | | 35,660 | | | | 319,428 | |
| Kvaerner | | | 222,200 | | | | 173,974 | |
| Odfjell Drilling * | | | 131,203 | | | | 116,656 | |
| Petroleum Geo-Services (B) | | | 182,090 | | | | 1,205,315 | |
| ProSafe | | | 216,270 | | | | 769,164 | |
| REC Solar * | | | 32,720 | | | | 442,896 | |
| Renewable Energy * (B) | | | 1,774,500 | | | | 496,874 | |
| Seadrill | | | 297,090 | | | | 3,763,153 | |
| Statoil | | | 734,817 | | | | 15,504,731 | |
| TGS Nopec Geophysical | | | 87,400 | | | | 2,219,940 | |
| | | | | | | | 28,713,397 | |
| Technology — 3.5% | | | | | | | | |
| Atea (B) | | | 73,392 | | | | 818,118 | |
| Nordic Semiconductor | | | 154,744 | | | | 1,180,781 | |
| Opera Software (B) | | | 128,900 | | | | 1,255,558 | |
| | | | | | | | 3,254,457 | |
The accompanying notes are an integral part of the financial statements.
| Schedule of Investments | April 30, 2015 (Unaudited) |
Global X MSCI Norway ETF
| | | Shares/Face
Amount(1) | | | Value | |
| COMMON STOCK — continued |
| |
| Telecommunications — 11.4% | | | | | | | | |
| Telenor | | | 473,996 | | | $ | 10,712,165 | |
| TOTAL NORWAY | | | | | | | 89,499,192 | |
| | | | | | | | | |
| UNITED KINGDOM— 2.6% | | | | | | | | |
| Oil & Gas — 2.6% | | | | | | | | |
| Subsea 7 | | | 216,524 | | | | 2,403,588 | |
| TOTAL COMMON STOCK | | | | | | | | |
| (Cost $114,737,174) | | | | | | | 92,427,237 | |
| | | | | | | | | |
|
| REPURCHASE AGREEMENTS — 12.9% |
| Barclays | | | | | | | | |
| 0.100%, dated 04/30/15, to be repurchased on 05/01/15 repurchase price $10,000,028 (collateralized by U.S. Treasury Obligations, ranging in par value $0-$8,945,383, 0.000-3.000%, 05/31/15-05/15/37 with a total market value of $10,200,004)(C) | | | 10,000,000 | | | | 10,000,000 | |
| Deutsche Bank | | | | | | | | |
| 0.080%, dated 04/30/15, to be repurchased on 05/01/15 repurchase price $2,012,284 (collateralized by U.S. Treasury Notes, par value $2,026,715, 1.500%, 11/30/19 with a total market value of $2,044,935)(C) | | | 2,012,280 | | | | 2,012,280 | |
| TOTAL REPURCHASE AGREEMENTS | | | | | | | | |
| (Cost $12,012,280) | | | | | | | 12,012,280 | |
|
| TIME DEPOSITS — 0.2% |
| Brown Brothers Harriman | | | | | | | | |
| 0.030%, 05/01/15 | | | 199,578 | | | | 199,578 | |
| 0.365%, 05/01/15, NOK | | | 76,184 | | | | 10,110 | |
| TOTAL TIME DEPOSITS | | | | | | | | |
| (Cost $209,688) | | | | | | | 209,688 | |
| | | | | | | | | |
| TOTAL INVESTMENTS — 112.0% | | | | | | | | |
| (Cost $126,959,142) | | | | | | $ | 104,649,205 | |
Percentages are based on Net Assets of $93,459,164.
| * | Non-income producing security. |
| Cl | — Class |
| NOK | — Norwegian Krone |
| (1) | In U.S. Dollars unless otherwise indicated. |
| (A) | Securities sold within terms of a private placement memorandum, exempt from registration under Section 144A of the Securities Act of 1933, as amended, and may be sold only to dealers in that program or other "accredited investors." These securities have been determined to be liquid under guidelines established by the board of Trustees. |
| (B) | This security or a partial position of this security is on loan at April 30, 2015. The total value of securities on loan at April 30, 2015 was $14,782,848. |
| (C) | These securities were purchased with cash collateral held from securities on loan. The total value of such securities as of April 30, 2015 was $12,012,280. |
The accompanying notes are an integral part of the financial statements.
| Schedule of Investments | April 30, 2015 (Unaudited) |
Global X MSCI Norway ETF
The following is a summary of the inputs used as of April 30, 2015, in valuing the Fund's investments carried at value:
| Investments in Securities | | Level 1 | | | Level 2 | | | Level 3 | | | Total | |
| Common Stock | | $ | 92,427,237 | | | $ | — | | | $ | — | | | $ | 92,427,237 | |
| Repurchase Agreements | | | — | | | | 12,012,280 | | | | — | | | | 12,012,280 | |
| Time Deposits | | | — | | | | 209,688 | | | | — | | | | 209,688 | |
| Total Investments in Securities | | $ | 92,427,237 | | | $ | 12,221,968 | | | $ | — | | | $ | 104,649,205 | |
For the period ended April 30, 2015, there have been no transfers between Level 1, Level 2 or Level 3 investments.
As of April 30, 2015, there were no Level 3 investments.
The accompanying notes are an integral part of the financial statements.
| Schedule of Investments | April 30, 2015 (Unaudited) |
Global X FTSE Nordic Region ETF
Sector Weightings †:

† Sector weightings percentages are based on the total market value of investments.
| | | Shares | | | Value | |
| COMMON STOCK — 98.3% |
| |
| DENMARK— 26.4% | | | | | | | | |
| Consumer Goods — 1.5% | | | | | | | | |
| Carlsberg, Cl B | | | 9,491 | | | $ | 865,021 | |
| Financials — 3.3% | | | | | | | | |
| Danske Bank | | | 66,073 | | | | 1,875,045 | |
| Health Care — 19.4% | | | | | | | | |
| Coloplast, Cl B | | | 8,983 | | | | 733,747 | |
| Novo Nordisk ADR | | | 164,601 | | | | 9,262,098 | |
| Novozymes, Cl B | | | 20,740 | | | | 958,524 | |
| | | | | | | | 10,954,369 | |
| Industrials — 2.2% | | | | | | | | |
| A P Moller - Maersk, Cl B | | | 607 | | | | 1,203,974 | |
| TOTAL DENMARK | | | | | | | 14,898,409 | |
| | | | | | | | | |
| FINLAND— 11.7% | | | | | | | | |
| Financials — 3.7% | | | | | | | | |
| Sampo, Cl A | | | 43,071 | | | | 2,092,690 | |
| Industrials — 2.6% | | | | | | | | |
| Kone, Cl B | | | 34,674 | | | | 1,494,710 | |
| Technology — 4.0% | | | | | | | | |
| Nokia ADR | | | 343,102 | | | | 2,257,611 | |
| Utilities — 1.4% | | | | | | | | |
| Fortum | | | 40,009 | | | | 793,527 | |
| TOTAL FINLAND | | | | | | | 6,638,538 | |
| | | | | | | | | |
| NORWAY— 11.1% | | | | | | | | |
| Basic Materials — 2.5% | | | | | | | | |
| Norsk Hydro | | | 119,720 | | | | 565,435 | |
The accompanying notes are an integral part of the financial statements.
| Schedule of Investments | April 30, 2015 (Unaudited) |
Global X FTSE Nordic Region ETF
| | | Shares | | | Value | |
| COMMON STOCK — continued |
| |
| Basic Materials — continued | | | | | | | | |
| Yara International | | | 15,797 | | | $ | 810,027 | |
| | | | | | | | 1,375,462 | |
| Financials — 3.1% | | | | | | | | |
| DnB | | | 97,766 | | | | 1,738,524 | |
| Oil & Gas — 3.0% | | | | | | | | |
| Statoil ADR | | | 80,219 | | | | 1,703,050 | |
| Telecommunications — 2.5% | | | | | | | | |
| Telenor | | | 63,276 | | | | 1,430,018 | |
| TOTAL NORWAY | | | | | | | 6,247,054 | |
| | | | | | | | | |
| SWEDEN— 49.1% | | | | | | | | |
| Consumer Goods — 2.4% | | | | | | | | |
| Svenska Cellulosa, Cl B | | | 52,853 | | | | 1,338,043 | |
| Consumer Services — 5.6% | | | | | | | | |
| Hennes & Mauritz, Cl B | | | 80,015 | | | | 3,184,176 | |
| Financials — 19.3% | | | | | | | | |
| Investor, Cl B | | | 41,321 | | | | 1,683,451 | |
| Nordea Bank | | | 267,705 | | | | 3,404,680 | |
| Skandinaviska Enskilda Banken, Cl A | | | 132,725 | | | | 1,681,643 | |
| Svenska Handelsbanken, Cl A | | | 40,327 | | | | 1,861,242 | |
| Swedbank, Cl A | | | 95,605 | | | | 2,225,729 | |
| | | | | | | | 10,856,745 | |
| Industrials — 14.3% | | | | | | | | |
| Assa Abloy, Cl B | | | 28,599 | | | | 1,660,727 | |
| Atlas Copco, Cl A | | | 56,623 | | | | 1,766,428 | |
| Hexagon, Cl B | | | 23,000 | | | | 853,306 | |
| Sandvik | | | 89,151 | | | | 1,121,013 | |
| SKF, Cl B | | | 37,389 | | | | 913,417 | |
| Volvo, Cl B | | | 127,893 | | | | 1,758,264 | |
| | | | | | | | 8,073,155 | |
| Technology — 4.9% | | | | | | | | |
| Ericsson ADR | | | 251,174 | | | | 2,742,820 | |
| Telecommunications — 2.6% | | | | | | | | |
| TeliaSonera | | | 237,101 | | | | 1,476,495 | |
| TOTAL SWEDEN | | | | | | | 27,671,434 | |
| TOTAL COMMON STOCK | | | | | | | | |
| (Cost $49,368,765) | | | | | | | 55,455,435 | |
The accompanying notes are an integral part of the financial statements.
| Schedule of Investments | April 30, 2015 (Unaudited) |
Global X FTSE Nordic Region ETF
| | | Face Amount | | | Value | |
| TIME DEPOSIT — 0.6% |
| Brown Brothers Harriman, 0.030%, 05/01/15 | | | | | | | | |
| (Cost $317,389) | | $ | 317,389 | | | $ | 317,389 | |
| | | | | | | | | |
| TOTAL INVESTMENTS — 98.9% | | | | | | | | |
| (Cost $49,686,154) | | | | | | $ | 55,772,824 | |
Percentages are based on Net Assets of $56,383,413.
ADR — American Depositary Receipt
Cl — Class
The following is a summary of the inputs used as of April 30, 2015, in valuing the Fund's investments carried at value:
| Investments in Securities | | Level 1 | | | Level 2 | | | Level 3 | | | Total | |
| Common Stock | | $ | 55,455,435 | | | $ | — | | | $ | — | | | $ | 55,455,435 | |
| Time Deposit | | | — | | | | 317,389 | | | | — | | | | 317,389 | |
| Total Investments in Securities | | $ | 55,455,435 | | | $ | 317,389 | | | $ | — | | | $ | 55,772,824 | |
For the period ended April 30, 2015, there have been no transfers between Level 1, Level 2 or Level 3 investments.
As of April 30, 2015, there were no Level 3 investments.
The accompanying notes are an integral part of the financial statements.
| Schedule of Investments | April 30, 2015 (Unaudited) |
Global X Central Asia & Mongolia Index ETF
Sector Weightings †:
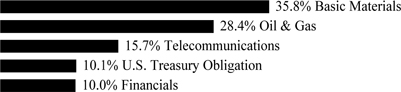
† Sector weightings percentages are based on the total market value of investments.
| | | Shares | | | Value | |
| COMMON STOCK — 99.3% |
| |
| CANADA— 14.0% | | | | | | | | |
| Basic Materials — 14.0% | | | | | | | | |
| Centerra Gold | | | 15,552 | | | $ | 80,119 | |
| Dundee Precious Metals * | | | 41,613 | | | | 99,974 | |
| SouthGobi Resources * | | | 42,850 | | | | 30,018 | |
| Turquoise Hill Resources * | | | 39,958 | | | | 166,226 | |
| TOTAL CANADA | | | | | | | 376,337 | |
| | | | | | | | | |
| CHINA— 9.4% | | | | | | | | |
| Oil & Gas — 9.4% | | | | | | | | |
| MIE Holdings | | | 974,500 | | | | 119,437 | |
| SPT Energy Group | | | 591,100 | | | | 133,454 | |
| TOTAL CHINA | | | | | | | 252,891 | |
| | | | | | | | | |
| HONG KONG— 2.5% | | | | | | | | |
| Basic Materials — 2.5% | | | | | | | | |
| Mongolia Energy * | | | 975,500 | | | | 66,702 | |
| | | | | | | | | |
| KAZAKHSTAN— 28.5% | | | | | | | | |
| Financials — 7.4% | | | | | | | | |
| Halyk Savings Bank of Kazakhstan JSC GDR * | | | 25,857 | | | | 200,392 | |
| Oil & Gas — 14.1% | | | | | | | | |
| KazMunaiGas Exploration Production JSC GDR | | | 20,058 | | | | 227,658 | |
| Nostrum Oil & Gas * | | | 16,024 | | | | 151,444 | |
| | | | | | | | 379,102 | |
| Telecommunications — 7.0% | | | | | | | | |
| KCell JSC GDR | | | 22,133 | | | | 187,024 | |
| TOTAL KAZAKHSTAN | | | | | | | 766,518 | |
| | | | | | | | | |
| MONGOLIA— 5.5% | | | | | | | | |
| Basic Materials — 5.5% | | | | | | | | |
| Mongolian Mining * | | | 2,679,550 | | | | 148,650 | |
| | | | | | | | | |
| NETHERLANDS— 6.3% | | | | | | | | |
| Telecommunications — 6.3% | | | | | | | | |
| VimpelCom ADR | | | 29,696 | | | | 168,376 | |
The accompanying notes are an integral part of the financial statements.
| Schedule of Investments | April 30, 2015 (Unaudited) |
Global X Central Asia & Mongolia Index ETF
| | | Shares/Face
Amount | | | Value | |
| COMMON STOCK — continued | | | | | | | | |
| | | | | | | | | |
| SWEDEN— 4.0% | | | | | | | | |
| Telecommunications — 4.0% | | | | | | | | |
| TeliaSonera | | | 17,386 | | | $ | 108,268 | |
| | | | | | | | | |
| UNITED ARAB EMIRATES— 7.9% | | | | | | | | |
| Oil & Gas — 7.9% | | | | | | | | |
| Dragon Oil | | | 22,248 | | | | 212,148 | |
| | | | | | | | | |
| UNITED KINGDOM— 21.2% | | | | | | | | |
| Basic Materials — 17.6% | | | | | | | | |
| Central Asia Metals | | | 49,929 | | | | 144,634 | |
| China Nonferrous Gold * | | | 252,613 | | | | 85,891 | |
| KAZ Minerals | | | 35,192 | | | | 141,207 | |
| Polymetal International | | | 12,420 | | | | 101,063 | |
| | | | | | | | 472,795 | |
| Financials — 3.6% | | | | | | | | |
| Bank of Georgia Holdings | | | 3,473 | | | | 95,855 | |
| TOTAL UNITED KINGDOM | | | | | | | 568,650 | |
| TOTAL COMMON STOCK | | | | | | | | |
| (Cost $2,952,554) | | | | | | | 2,668,540 | |
| | | | | | | | | |
| U.S. TREASURY OBLIGATION — 11.2% | | | | | | | | |
| United States Treasury Bills | | | | | | | | |
| 0.001%, 05/14/15(A) | | | | | | | | |
| (Cost $300,002) | | $ | 300,000 | | | | 299,999 | |
| | | | | | | | | |
| TOTAL INVESTMENTS — 110.5% | | | | | | | | |
| (Cost $3,252,556) | | | | | | $ | 2,968,539 | |
Percentages are based on Net Assets of $2,685,783.
| * | Non-income producing security. |
ADR — American Depositary Receipt
GDR — Global Depositary Receipt
| (A) | The rate reported on the Schedule of Investments is the effective yield at time of purchase. |
The following is a summary of the inputs used as of April 30, 2015, in valuing the Fund's investments carried at value:
| Investments in Securities | | Level 1 | | | Level 2 | | | Level 3 | | | Total | |
| Common Stock | | $ | 2,668,540 | | | $ | — | | | $ | — | | | $ | 2,668,540 | |
| U.S. Treasury Obligation | | | — | | | | 299,999 | | | | — | | | | 299,999 | |
| Total Investments in Securities | | $ | 2,668,540 | | | $ | 299,999 | | | $ | — | | | $ | 2,968,539 | |
For the period ended April 30, 2015, there have been no transfers between Level 1, Level 2 or Level 3 investments.
As of April 30, 2015, there were no Level 3 investments.
The accompanying notes are an integral part of the financial statements.
| Schedule of Investments | April 30, 2015 (Unaudited) |
Global X MSCI Nigeria ETF
Sector Weightings †:
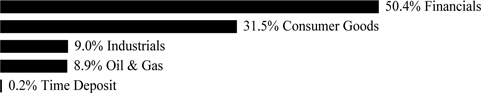
† Sector weightings percentages are based on the total market value of investments.
| | | Shares | | | Value | |
| COMMON STOCK — 99.4% |
| |
| NIGERIA— 99.4% | | | | | | | | |
| Consumer Goods — 31.4% | | | | | | | | |
| Flour Mills of Nigeria | | | 3,529,489 | | | $ | 633,889 | |
| Guinness Nigeria | | | 1,751,451 | | | | 1,496,214 | |
| Nestle Nigeria | | | 529,815 | | | | 2,529,268 | |
| Nigerian Breweries | | | 6,977,839 | | | | 5,505,480 | |
| | | | | | | | 10,164,851 | |
| Financials — 50.2% | | | | | | | | |
| Access Bank | | | 28,161,000 | | | | 847,660 | |
| Diamond Bank | | | 31,131,800 | | | | 719,629 | |
| Ecobank Transnational | | | 14,303,234 | | | | 1,487,824 | |
| FBN Holdings | | | 33,043,192 | | | | 1,627,253 | |
| First City Monument Bank | | | 33,515,516 | | | | 562,522 | |
| Guaranty Trust Bank | | | 25,114,500 | | | | 3,628,351 | |
| Stanbic IBTC Holdings | | | 9,219,850 | | | | 1,364,445 | |
| Transnational Corp of Nigeria | | | 68,885,500 | | | | 1,107,707 | |
| UAC of Nigeria | | | 4,652,680 | | | | 981,973 | |
| United Bank for Africa | | | 42,123,362 | | | | 1,119,762 | |
| Zenith Bank | | | 26,582,000 | | | | 2,825,172 | |
| | | | | | | | 16,272,298 | |
| Industrials — 9.0% | | | | | | | | |
| Dangote Cement | | | 1,504,200 | | | | 1,394,597 | |
| Lafarge Africa | | | 3,206,959 | | | | 1,514,845 | |
| | | | | | | | 2,909,442 | |
| Oil & Gas — 8.8% | | | | | | | | |
| Forte Oil | | | 1,222,994 | | | | 1,091,783 | |
| Oando | | | 9,945,050 | | | | 899,552 | |
| SEPLAT Petroleum Development | | | 455,167 | | | | 862,301 | |
| | | | | | | | 2,853,636 | |
| TOTAL COMMON STOCK | | | | | | | | |
| (Cost $35,496,687) | | | | | | | 32,200,227 | |
The accompanying notes are an integral part of the financial statements.
| Schedule of Investments | April 30, 2015 (Unaudited) |
Global X MSCI Nigeria ETF
| | | Face Amount | | | Value | |
| TIME DEPOSIT — 0.2% |
| Brown Brothers Harriman, 0.030%, 05/01/15 | | | | | | | | |
| (Cost $64,645) | | $ | 64,645 | | | $ | 64,645 | |
| | | | | | | | | |
| TOTAL INVESTMENTS — 99.6% | | | | | | | | |
| (Cost $35,561,332) | | | | | | $ | 32,264,872 | |
Percentages are based on Net Assets of $32,393,986.
The following is a summary of the inputs used as of April 30, 2015, in valuing the Fund's investments carried at value:
| Investments in Securities | | Level 1 | | | Level 2 | | | Level 3 | | | Total | |
| Common Stock | | $ | 32,200,227 | | | $ | — | | | $ | — | | | $ | 32,200,227 | |
| Time Deposit | | | — | | | | 64,645 | | | | — | | | | 64,645 | |
| Total Investments in Securities | | $ | 32,200,227 | | | $ | 64,645 | | | $ | — | | | $ | 32,264,872 | |
For the period ended April 30, 2015, the transfer into Level 1 from Level 2 was due to changes in the availability of observable inputs to determine fair value. Transfers between Levels are recognized at period end.
As of April 30, 2015, there were no Level 3 investments.
The accompanying notes are an integral part of the financial statements.
| Schedule of Investments | April 30, 2015 (Unaudited) |
Global X Next Emerging & Frontier ETF
Sector Weightings †:
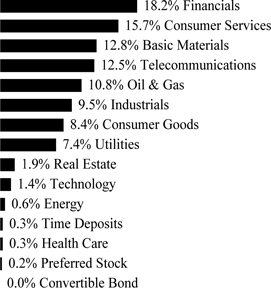
† Sector weightings percentages are based on the total market value of investments.
| | | Shares | | | Value | |
| COMMON STOCK — 99.5% | | | | | | | | |
| | | | | | | | | |
| ARGENTINA— 3.7% | | | | | | | | |
| Consumer Services — 2.0% | | | | | | | | |
| Arcos Dorados Holdings, Cl A | | | 91,050 | | | $ | 546,300 | |
| MercadoLibre | | | 15,219 | | | | 2,166,120 | |
| | | | | | | | 2,712,420 | |
| Oil & Gas — 1.7% | | | | | | | | |
| YPF ADR | | | 72,199 | | | | 2,204,958 | |
| TOTAL ARGENTINA | | | | | | | 4,917,378 | |
| | | | | | | | | |
| AUSTRALIA— 0.7% | | | | | | | | |
| Basic Materials — 0.6% | | | | | | | | |
| Paladin Energy * | | | 2,280,600 | | | | 629,587 | |
| Resolute Mining * | | | 878,900 | | | | 232,233 | |
| | | | | | | | 861,820 | |
| Consumer Services — 0.1% | | | | | | | | |
| Donaco International * | | | 261,700 | | | | 127,978 | |
| iSentric * | | | 34,028 | | | | 3,892 | |
| | | | | | | | 131,870 | |
| TOTAL AUSTRALIA | | | | | | | 993,690 | |
| | | | | | | | | |
| BAHRAIN— 0.1% | | | | | | | | |
| Financials — 0.1% | | | | | | | | |
| Al-Salam Bank | | | 245,400 | | | | 91,118 | |
The accompanying notes are an integral part of the financial statements.
| Schedule of Investments | April 30, 2015 (Unaudited) |
Global X Next Emerging & Frontier ETF
| | | Shares | | | Value | |
| COMMON STOCK — continued | | | | | | | | |
| | | | | | | | | |
| BANGLADESH— 1.0% | | | | | | | | |
| Consumer Services — 0.3% | | | | | | | | |
| Square Pharmaceuticals | | | 110,066 | | | $ | 347,979 | |
| Telecommunications — 0.7% | | | | | | | | |
| GrameenPhone | | | 224,000 | | | | 931,870 | |
| TOTAL BANGLADESH | | | | | | | 1,279,849 | |
| | | | | | | | | |
| CANADA— 3.2% | | | | | | | | |
| Basic Materials — 2.7% | | | | | | | | |
| Acacia Mining | | | 187,830 | | | | 833,908 | |
| Asanko Gold * | | | 64,024 | | | | 94,087 | |
| Endeavour Mining * | | | 315,145 | | | | 163,914 | |
| First Quantum Minerals | | | 88,116 | | | | 1,344,383 | |
| Turquoise Hill Resources * | | | 271,872 | | | | 1,135,746 | |
| | | | | | | | 3,572,038 | |
| Oil & Gas — 0.5% | | | | | | | | |
| Pan American Silver | | | 66,496 | | | | 634,080 | |
| TOTAL CANADA | | | | | | | 4,206,118 | |
| | | | | | | | | |
| CAYMAN ISLANDS— 0.3% | | | | | | | | |
| Consumer Services — 0.3% | | | | | | | | |
| NagaCorp | | | 630,983 | | | | 455,054 | |
| | | | | | | | | |
| CHILE— 4.4% | | | | | | | | |
| Basic Materials — 0.3% | | | | | | | | |
| Empresas CMPC | | | 91,200 | | | | 255,875 | |
| Sociedad Quimica y Minera de Chile, Cl B | | | 7,300 | | | | 160,081 | |
| | | | | | | | 415,956 | |
| Consumer Services — 1.5% | | | | | | | | |
| Cencosud | | | 68,400 | | | | 177,223 | |
| Latam Airlines Group * | | | 81,860 | | | | 783,375 | |
| SACI Falabella | | | 139,280 | | | | 1,086,441 | |
| | | | | | | | 2,047,039 | |
| Financials — 0.3% | | | | | | | | |
| Banco de Chile | | | 1,978,527 | | | | 227,398 | |
| Banco Santander Chile | | | 4,466,600 | | | | 240,469 | |
| | | | | | | | 467,867 | |
| Oil & Gas — 0.2% | | | | | | | | |
| Empresas COPEC | | | 19,380 | | | | 222,459 | |
| Utilities — 2.1% | | | | | | | | |
| Empresa Nacional de Electricidad | | | 891,449 | | | | 1,373,332 | |
| Enersis | | | 4,028,453 | | | | 1,407,186 | |
| | | | | | | | 2,780,518 | |
| TOTAL CHILE | | | | | | | 5,933,839 | |
The accompanying notes are an integral part of the financial statements.
| Schedule of Investments | April 30, 2015 (Unaudited) |
Global X Next Emerging & Frontier ETF
| | | Shares | | | Value | |
| COMMON STOCK — continued | | | | | | | | |
| | | | | | | | | |
| COLOMBIA— 1.1% | | | | | | | | |
| Consumer Goods — 0.1% | | | | | | | | |
| Almacenes Exito | | | 12,540 | | | $ | 133,570 | |
| Financials — 0.1% | | | | | | | | |
| Grupo de Inversiones Suramericana | | | 10,671 | | | | 174,052 | |
| Industrials — 0.1% | | | | | | | | |
| Cementos Argos | | | 41,046 | | | | 173,103 | |
| Oil & Gas — 0.8% | | | | | | | | |
| Ecopetrol | | | 601,248 | | | | 508,630 | |
| Pacific Rubiales Energy^ | | | 145,679 | | | | 490,708 | |
| | | | | | | | 999,338 | |
| TOTAL COLOMBIA | | | | | | | 1,480,063 | |
| | | | | | | | | |
| CZECH REPUBLIC— 1.4% | | | | | | | | |
| Financials — 0.2% | | | | | | | | |
| Komercni Banka | | | 1,254 | | | | 279,251 | |
| Telecommunications — 0.1% | | | | | | | | |
| O2 Czech Republic | | | 17,100 | | | | 140,206 | |
| Utilities — 1.1% | | | | | | | | |
| CEZ | | | 53,351 | | | | 1,385,095 | |
| TOTAL CZECH REPUBLIC | | | | | | | 1,804,552 | |
| | | | | | | | | |
| EGYPT— 0.6% | | | | | | | | |
| Financials — 0.5% | | | | | | | | |
| Commercial International Bank Egypt SAE | | | 56,100 | | | | 406,741 | |
| Talaat Moustafa Group | | | 174,850 | | | | 230,534 | |
| | | | | | | | 637,275 | |
| Telecommunications — 0.1% | | | | | | | | |
| Global Telecom Holding SAE * | | | 290,003 | | | | 123,146 | |
| TOTAL EGYPT | | | | | | | 760,421 | |
| | | | | | | | | |
| FRANCE— 0.2% | | | | | | | | |
| Oil & Gas — 0.2% | | | | | | | | |
| Etablissements Maurel et Prom | | | 30,841 | | | | 288,566 | |
| | | | | | | | | |
| GREECE— 0.0% | | | | | | | | |
| Industrials — 0.0% | | | | | | | | |
| Metka | | | 7,682 | | | | 71,447 | |
| | | | | | | | | |
| HUNGARY— 0.9% | | | | | | | | |
| Consumer Services — 0.2% | | | | | | | | |
| Richter Gedeon Nyrt | | | 15,996 | | | | 269,629 | |
| Financials — 0.6% | | | | | | | | |
| OTP Bank | | | 36,870 | | | | 818,241 | |
The accompanying notes are an integral part of the financial statements.
| Schedule of Investments | April 30, 2015 (Unaudited) |
Global X Next Emerging & Frontier ETF
| | | Shares | | | Value | |
| COMMON STOCK — continued | | | | | | | | |
| | | | | | | | | |
| Oil & Gas — 0.1% | | | | | | | | |
| MOL Hungarian Oil & Gas | | | 3,078 | | | $ | 171,198 | |
| TOTAL HUNGARY | | | | | | | 1,259,068 | |
| | | | | | | | | |
| INDONESIA— 8.4% | | | | | | | | |
| Basic Materials — 1.0% | | | | | | | | |
| Indocement Tunggal Prakarsa | | | 161,600 | | | | 261,801 | |
| Semen Indonesia Persero | | | 1,173,385 | | | | 1,131,519 | |
| | | | | | | | 1,393,320 | |
| Consumer Goods — 2.0% | | | | | | | | |
| Astra International | | | 2,352,897 | | | | 1,243,383 | |
| Charoen Pokphand Indonesia | | | 616,500 | | | | 134,833 | |
| Gudang Garam | | | 87,514 | | | | 337,566 | |
| Indofood CBP Sukses Makmur TBK | | | 228,300 | | | | 232,483 | |
| Indofood Sukses Makmur | | | 456,700 | | | | 237,819 | |
| Unilever Indonesia | | | 106,669 | | | | 350,557 | |
| | | | | | | | 2,536,641 | |
| Consumer Services — 0.3% | | | | | | | | |
| Kalbe Farma | | | 2,452,800 | | | | 339,655 | |
| Financials — 3.1% | | | | | | | | |
| Bank Central Asia | | | 1,501,668 | | | | 1,561,040 | |
| Bank Mandiri | | | 1,989,118 | | | | 1,649,606 | |
| Bank Rakyat Indonesia Persero | | | 1,079,100 | | | | 967,756 | |
| | | | | | | | 4,178,402 | |
| Industrials — 0.2% | | | | | | | | |
| United Tractors | | | 136,800 | | | | 225,845 | |
| Telecommunications — 1.1% | | | | | | | | |
| Telekomunikasi Indonesia Persero | | | 7,401,105 | | | | 1,493,068 | |
| Utilities — 0.7% | | | | | | | | |
| Perusahaan Gas Negara | | | 3,125,339 | | | | 988,535 | |
| TOTAL INDONESIA | | | | | | | 11,155,466 | |
| | | | | | | | | |
| KAZAKHSTAN— 0.1% | | | | | | | | |
| Oil & Gas — 0.1% | | | | | | | | |
| KazMunaiGas Exploration Production JSC GDR | | | 17,975 | | | | 204,016 | |
| | | | | | | | | |
| KENYA— 0.3% | | | | | | | | |
| Telecommunications — 0.3% | | | | | | | | |
| Safaricom | | | 2,064,500 | | | | 379,448 | |
| | | | | | | | | |
| KUWAIT— 1.1% | | | | | | | | |
| Financials — 1.1% | | | | | | | | |
| Kuwait Finance House | | | 407,895 | | | | 919,352 | |
| National Bank of Kuwait SAK | | | 180,319 | | | | 514,002 | |
| TOTAL KUWAIT | | | | | | | 1,433,354 | |
The accompanying notes are an integral part of the financial statements.
| Schedule of Investments | April 30, 2015 (Unaudited) |
Global X Next Emerging & Frontier ETF
| | | Shares | | | Value | |
| COMMON STOCK — continued | | | | | | | | |
| | | | | | | | | |
| LUXEMBOURG— 0.2% | | | | | | | | |
| Consumer Goods — 0.2% | | | | | | | | |
| Adecoagro * | | | 23,432 | | | $ | 227,525 | |
| | | | | | | | | |
| MALAYSIA— 10.7% | | | | | | | | |
| Basic Materials — 0.2% | | | | | | | | |
| Petronas Chemicals Group | | | 130,590 | | | | 215,236 | |
| Consumer Goods — 0.4% | | | | | | | | |
| British American Tobacco Malaysia | | | 10,255 | | | | 192,862 | |
| IOI | | | 170,500 | | | | 207,769 | |
| Kuala Lumpur Kepong | | | 29,100 | | | | 180,900 | |
| | | | | | | | 581,531 | |
| Consumer Services — 0.4% | | | | | | | | |
| Genting | | | 91,200 | | | | 224,063 | |
| Genting Malaysia | | | 216,600 | | | | 261,513 | |
| | | | | | | | 485,576 | |
| Energy — 0.6% | | | | | | | | |
| Sapurakencana Petroleum | | | 1,104,867 | | | | 825,199 | |
| Financials — 2.4% | | | | | | | | |
| CIMB Group Holdings | | | 325,770 | | | | 539,672 | |
| Malayan Banking | | | 473,526 | | | | 1,224,533 | |
| Public Bank | | | 252,100 | | | | 1,378,888 | |
| | | | | | | | 3,143,093 | |
| Health Care — 0.3% | | | | | | | | |
| IHH Healthcare | | | 220,952 | | | | 367,271 | |
| Industrials — 1.2% | | | | | | | | |
| MISC | | | 136,800 | | | | 351,459 | |
| Sime Darby | | | 492,599 | | | | 1,253,109 | |
| | | | | | | | 1,604,568 | |
| Oil & Gas — 0.2% | | | | | | | | |
| Petronas Dagangan | | | 22,800 | | | | 136,998 | |
| Petronas Gas | | | 30,149 | | | | 192,331 | |
| | | | | | | | 329,329 | |
| Telecommunications — 3.4% | | | | | | | | |
| Axiata Group | | | 665,767 | | | | 1,259,938 | |
| DiGi.Com | | | 947,702 | | | | 1,599,239 | |
| Maxis | | | 662,596 | | | | 1,291,146 | |
| Telekom Malaysia | | | 187,185 | | | | 389,454 | |
| | | | | | | | 4,539,777 | |
| Utilities — 1.6% | | | | | | | | |
| Tenaga Nasional | | | 497,373 | | | | 2,005,412 | |
The accompanying notes are an integral part of the financial statements.
| Schedule of Investments | April 30, 2015 (Unaudited) |
Global X Next Emerging & Frontier ETF
| | | Shares | | | Value | |
| COMMON STOCK — continued | | | | | | | | |
| | | | | | | | | |
| Utilities — continued | | | | | | | | |
| YTL | | | 432,600 | | | $ | 202,848 | |
| | | | | | | | 2,208,260 | |
| TOTAL MALAYSIA | | | | | | | 14,299,840 | |
| | | | | | | | | |
| MEXICO— 10.2% | | | | | | | | |
| Basic Materials — 2.6% | | | | | | | | |
| Fresnillo | | | 84,461 | | | | 933,884 | |
| Grupo Mexico, Cl B | | | 442,368 | | | | 1,365,328 | |
| Industrias Penoles | | | 10,224 | | | | 173,052 | |
| Mexichem | | | 324,017 | | | | 925,799 | |
| | | | | | | | 3,398,063 | |
| Consumer Goods — 2.7% | | | | | | | | |
| Arca Continental | | | 47,138 | | | | 288,795 | |
| Coca-Cola Femsa | | | 22,800 | | | | 182,107 | |
| Fomento Economico Mexicano | | | 77,209 | | | | 697,756 | |
| Grupo Bimbo, Ser A * | | | 91,200 | | | | 244,195 | |
| Grupo Lala, Cl B | | | 286,681 | | | | 576,688 | |
| Kimberly-Clark de Mexico, Cl A | | | 95,183 | | | | 209,316 | |
| Wal-Mart de Mexico | | | 563,580 | | | | 1,324,482 | |
| | | | | | | | 3,523,339 | |
| Consumer Services — 0.2% | | | | | | | | |
| Grupo Elektra | | | 8,778 | | | | 226,180 | |
| Financials — 1.0% | | | | | | | | |
| Grupo Financiero Banorte, Cl O | | | 117,984 | | | | 668,460 | |
| Grupo Financiero Inbursa, Cl O | | | 296,400 | | | | 707,189 | |
| | | | | | | | 1,375,649 | |
| Industrials — 1.8% | | | | | | | | |
| Alfa, Cl A | | | 527,070 | | | | 1,068,833 | |
| Cemex, Cl Preference * | | | 590,126 | | | | 568,962 | |
| OHL Mexico * | | | 97,590 | | | | 196,948 | |
| Promotora y Operadora de Infraestructura * | | | 54,013 | | | | 618,863 | |
| | | | | | | | 2,453,606 | |
| Telecommunications — 1.6% | | | | | | | | |
| America Movil | | | 1,324,767 | | | | 1,386,784 | |
| Grupo Televisa | | | 106,121 | | | | 771,681 | |
| | | | | | | | 2,158,465 | |
| Utilities — 0.3% | | | | | | | | |
| Infraestructura Energetica Nova | | | 75,340 | | | | 439,163 | |
| TOTAL MEXICO | | | | | | | 13,574,465 | |
| | | | | | | | | |
| NIGERIA— 0.3% | | | | | | | | |
| Consumer Goods — 0.1% | | | | | | | | |
| Nigerian Breweries | | | 203,800 | | | | 160,797 | |
The accompanying notes are an integral part of the financial statements.
| Schedule of Investments | April 30, 2015 (Unaudited) |
Global X Next Emerging & Frontier ETF
| | | Shares | | | Value | |
| COMMON STOCK — continued | | | | | | | | |
| | | | | | | | | |
| Financials — 0.2% | | | | | | | | |
| Guaranty Trust Bank | | | 1,440,500 | | | $ | 208,113 | |
| TOTAL NIGERIA | | | | | | | 368,910 | |
| | | | | | | | | |
| OMAN— 0.6% | | | | | | | | |
| Financials — 0.2% | | | | | | | | |
| BankMuscat SAOG | | | 155,610 | | | | 214,189 | |
| Telecommunications — 0.4% | | | | | | | | |
| Oman Telecommunications SAOG | | | 130,710 | | | | 551,626 | |
| TOTAL OMAN | | | | | | | 765,815 | |
| | | | | | | | | |
| PAKISTAN— 0.6% | | | | | | | | |
| Oil & Gas — 0.5% | | | | | | | | |
| Oil & Gas Development | | | 97,000 | | | | 174,416 | |
| Pakistan Petroleum | | | 273,600 | | | | 484,615 | |
| | | | | | | | 659,031 | |
| Telecommunications — 0.1% | | | | | | | | |
| Pakistan Telecommunication | | | 732,193 | | | | 149,700 | |
| TOTAL PAKISTAN | | | | | | | 808,731 | |
| | | | | | | | | |
| PANAMA— 1.3% | | | | | | | | |
| Consumer Services — 1.3% | | | | | | | | |
| Copa Holdings, Cl A | | | 15,832 | | | | 1,755,610 | |
| | | | | | | | | |
| PAPUA NEW GUINEA— 1.2% | | | | | | | | |
| Oil & Gas — 1.2% | | | | | | | | |
| Oil Search | | | 243,127 | | | | 1,551,389 | |
| | | | | | | | | |
| PERU— 0.6% | | | | | | | | |
| Financials — 0.6% | | | | | | | | |
| Credicorp Ltd. | | | 5,280 | | | | 805,464 | |
| | | | | | | | | |
| PHILIPPINES— 4.3% | | | | | | | | |
| Consumer Goods — 0.5% | | | | | | | | |
| JG Summit Holdings | | | 194,549 | | | | 312,379 | |
| Universal Robina | | | 97,517 | | | | 476,964 | |
| | | | | | | | 789,343 | |
| Consumer Services — 1.0% | | | | | | | | |
| SM Investments | | | 68,384 | | | | 1,382,883 | |
| Financials — 0.5% | | | | | | | | |
| Ayala | | | 20,520 | | | | 359,434 | |
| SM Prime Holdings | | | 803,297 | | | | 336,616 | |
| | | | | | | | 696,050 | |
| Industrials — 0.6% | | | | | | | | |
| Alliance Global Group | | | 467,400 | | | | 266,606 | |
| DMCI Holdings | | | 644,930 | | | | 217,246 | |
The accompanying notes are an integral part of the financial statements.
| Schedule of Investments | April 30, 2015 (Unaudited) |
Global X Next Emerging & Frontier ETF
| | | Shares | | | Value | |
| COMMON STOCK — continued | | | | | | | | |
| | | | | | | | | |
| Industrials — continued | | | | | | | | |
| International Container Terminal Services | | | 91,200 | | | $ | 225,286 | |
| | | | | | | | 709,138 | |
| Real Estate — 0.3% | | | | | | | | |
| Ayala Land | | | 410,700 | | | | 356,469 | |
| Technology — 1.0% | | | | | | | | |
| Philippine Long Distance Telephone | | | 21,734 | | | | 1,351,969 | |
| Utilities — 0.4% | | | | | | | | |
| Aboitiz Power | | | 268,758 | | | | 259,222 | |
| Manila Electric | | | 41,040 | | | | 239,992 | |
| | | | | | | | 499,214 | |
| TOTAL PHILIPPINES | | | | | | | 5,785,066 | |
| | | | | | | | | |
| POLAND— 5.2% | | | | | | | | |
| Basic Materials — 0.9% | | | | | | | | |
| KGHM Polska Miedz | | | 34,906 | | | | 1,222,982 | |
| Consumer Goods — 0.1% | | | | | | | | |
| LPP * | | | 80 | | | | 169,571 | |
| Financials — 1.6% | | | | | | | | |
| Bank Pekao | | | 12,124 | | | | 629,866 | |
| Bank Zachodni | | | 2,418 | | | | 249,096 | |
| Powszechna Kasa Oszczednosci Bank Polski | | | 58,391 | | | | 584,056 | |
| Powszechny Zaklad Ubezpieczen | | | 5,455 | | | | 710,309 | |
| | | | | | | | 2,173,327 | |
| Oil & Gas — 1.6% | | | | | | | | |
| Polski Koncern Naftowy Orlen S.A. | | | 93,186 | | | | 1,768,136 | |
| Polskie Gornictwo Naftowe i Gazownictwo | | | 155,800 | | | | 280,596 | |
| | | | | | | | 2,048,732 | |
| Utilities — 1.0% | | | | | | | | |
| PGE | | | 226,950 | | | | 1,304,816 | |
| TOTAL POLAND | | | | | | | 6,919,428 | |
| | | | | | | | | |
| QATAR— 1.8% | | | | | | | | |
| Financials — 0.8% | | | | | | | | |
| Qatar National Bank | | | 17,970 | | | | 977,476 | |
| Industrials — 1.0% | | | | | | | | |
| Industries Qatar QSC | | | 34,406 | | | | 1,371,495 | |
| TOTAL QATAR | | | | | | | 2,348,971 | |
| | | | | | | | | |
| RUSSIA— 0.7% | | | | | | | | |
| Basic Materials — 0.7% | | | | | | | | |
| Polyus Gold International | | | 334,421 | | | | 964,893 | |
The accompanying notes are an integral part of the financial statements.
| Schedule of Investments | April 30, 2015 (Unaudited) |
Global X Next Emerging & Frontier ETF
| | | Shares | | | Value | |
| COMMON STOCK — continued | | | | | | | | |
| | | | | | | | | |
| SOUTH AFRICA— 10.5% | | | | | | | | |
| Basic Materials — 1.4% | | | | | | | | |
| Anglo American Platinum * | | | 16,530 | | | $ | 452,302 | |
| AngloGold Ashanti | | | 46,330 | | | | 522,504 | |
| Aquarius Platinum * | | | 358,903 | | | | 48,922 | |
| Impala Platinum Holdings | | | 58,120 | | | | 320,832 | |
| Kumba Iron Ore | | | 18,816 | | | | 252,052 | |
| Mondi | | | 16,671 | | | | 334,308 | |
| | | | | | | | 1,930,920 | |
| Consumer Goods — 0.5% | | | | | | | | |
| Tiger Brands | | | 24,143 | | | | 625,982 | |
| Consumer Services — 4.8% | | | | | | | | |
| Aspen Pharmacare Holdings | | | 27,161 | | | | 822,362 | |
| Mediclinic International | | | 91,856 | | | | 969,101 | |
| Naspers, Cl N | | | 14,064 | | | | 2,200,889 | |
| Shoprite Holdings | | | 41,254 | | | | 587,265 | |
| Steinhoff International Holdings | | | 190,611 | | | | 1,204,935 | |
| Woolworths Holdings | | | 100,418 | | | | 751,866 | |
| | | | | | | | 6,536,418 | |
| Financials — 1.5% | | | | | | | | |
| FirstRand | | | 210,980 | | | | 1,002,831 | |
| Standard Bank Group | | | 59,765 | | | | 872,770 | |
| | | | | | | | 1,875,601 | |
| Industrials — 0.6% | | | | | | | | |
| Bidvest Group | | | 27,860 | | | | 751,903 | |
| Oil & Gas — 0.1% | | | | | | | | |
| Exxaro Resources | | | 18,240 | | | | 148,347 | |
| Technology — 0.4% | | | | | | | | |
| Sasol | | | 14,733 | | | | 592,258 | |
| Telecommunications — 1.2% | | | | | | | | |
| MTN Group | | | 36,163 | | | | 722,888 | |
| Vodacom Group | | | 66,110 | | | | 819,950 | |
| | | | | | | | 1,542,838 | |
| TOTAL SOUTH AFRICA | | | | | | | 14,004,267 | |
| | | | | | | | | |
| SOUTH KOREA— 0.2% | | | | | | | | |
| Consumer Services — 0.2% | | | | | | | | |
| Kolao Holdings | | | 17,679 | | | | 331,481 | |
| | | | | | | | | |
| THAILAND— 9.3% | | | | | | | | |
| Basic Materials — 0.4% | | | | | | | | |
| PTT Global Chemical | | | 309,031 | | | | 602,313 | |
The accompanying notes are an integral part of the financial statements.
| Schedule of Investments | April 30, 2015 (Unaudited) |
Global X Next Emerging & Frontier ETF
| | | Shares | | | Value | |
| COMMON STOCK — continued | | | | | | | | |
| | | | | | | | | |
| Consumer Goods — 1.2% | | | | | | | | |
| Charoen Pokphand Foods | | | 949,957 | | | $ | 642,622 | |
| Thai Beverage | | | 1,701,307 | | | | 918,376 | |
| | | | | | | | 1,560,998 | |
| Consumer Services — 1.4% | | | | | | | | |
| Bangkok Dusit Medical Services, Cl F | | | 1,639,200 | | | | 1,004,454 | |
| CP ALL | | | 604,922 | | | | 770,718 | |
| | | | | | | | 1,775,172 | |
| Financials — 0.5% | | | | | | | | |
| Siam Commercial Bank | | | 149,760 | | | | 722,337 | |
| Industrials — 2.1% | | | | | | | | |
| Airports of Thailand | | | 112,494 | | | | 989,633 | |
| Siam Cement | | | 22,360 | | | | 364,923 | |
| Siam Cement NVDR | | | 81,940 | | | | 1,337,288 | |
| | | | | | | | 2,691,844 | |
| Oil & Gas — 1.8% | | | | | | | | |
| PTT | | | 2,000 | | | | 21,599 | |
| PTT Ltd. | | | 139,391 | | | | 1,505,330 | |
| PTT Exploration & Production | | | 261,860 | | | | 929,398 | |
| | | | | | | | 2,456,327 | |
| Telecommunications — 1.9% | | | | | | | | |
| Advanced Info Service | | | 177,954 | | | | 1,295,585 | |
| Intouch Holdings | | | 9,000 | | | | 21,022 | |
| Intouch Holdings, Cl F | | | 17,400 | | | | 40,643 | |
| Intouch Holdings NVDR | | | 265,830 | | | | 620,929 | |
| Total Access Communication | | | 195,721 | | | | 515,055 | |
| Total Access Communication NVDR | | | 12,300 | | | | 32,369 | |
| | | | | | | | 2,525,603 | |
| TOTAL THAILAND | | | | | | | 12,334,594 | |
| | | | | | | | | |
| TURKEY— 8.1% | | | | | | | | |
| Basic Materials — 1.4% | | | | | | | | |
| Eregli Demir ve Celik Fabrikalari | | | 1,122,773 | | | | 1,888,671 | |
| Consumer Goods — 0.3% | | | | | | | | |
| Anadolu Efes Biracilik Ve Malt Sanayii | | | 17,100 | | | | 143,823 | |
| Coca-Cola Icecek | | | 10,260 | | | | 173,931 | |
| Ford Otomotiv Sanayi | | | 14,820 | | | | 183,093 | |
| | | | | | | | 500,847 | |
| Consumer Services — 1.7% | | | | | | | | |
| BIM Birlesik Magazalar | | | 65,479 | | | | 1,211,600 | |
| Turk Hava Yollari * | | | 325,875 | | | | 1,081,723 | |
| | | | | | | | 2,293,323 | |
| Financials — 1.3% | | | | | | | | |
| Akbank | | | 174,800 | | | | 509,015 | |
The accompanying notes are an integral part of the financial statements.
| Schedule of Investments | April 30, 2015 (Unaudited) |
Global X Next Emerging & Frontier ETF
| | | Shares | | | Value | |
| COMMON STOCK — continued | | | | | | | | |
| | | | | | | | | |
| Financials — continued | | | | | | | | |
| Turkiye Garanti Bankasi | | | 175,725 | | | $ | 559,004 | |
| Turkiye Is Bankasi, Cl C | | | 262,444 | | | | 590,589 | |
| | | | | | | | 1,658,608 | |
| Industrials — 1.2% | | | | | | | | |
| Enka Insaat ve Sanayi | | | 111,254 | | | | 239,131 | |
| KOC Holding | | | 283,636 | | | | 1,341,231 | |
| | | | | | | | 1,580,362 | |
| Oil & Gas — 1.2% | | | | | | | | |
| Tupras Turkiye Petrol Rafinerileri | | | 63,723 | | | | 1,545,940 | |
| Telecommunications — 1.0% | | | | | | | | |
| Turk Telekomunikasyon | | | 86,336 | | | | 238,500 | |
| Turkcell Iletisim Hizmetleri | | | 241,140 | | | | 1,072,675 | |
| | | | | | | | 1,311,175 | |
| TOTAL TURKEY | | | | | | | 10,778,926 | |
| | | | | | | | | |
| UKRAINE— 0.3% | | | | | | | | |
| Consumer Goods — 0.3% | | | | | | | | |
| Kernel Holding | | | 47,731 | | | | 460,898 | |
| | | | | | | | | |
| UNITED ARAB EMIRATES— 3.6% | | | | | | | | |
| Financials — 1.3% | | | | | | | | |
| First Gulf Bank PJSC | | | 268,161 | | | | 1,113,398 | |
| National Bank of Abu Dhabi PJSC | | | 175,054 | | | | 529,030 | |
| | | | | | | | 1,642,428 | |
| Industrials — 0.7% | | | | | | | | |
| DP World | | | 41,977 | | | | 968,829 | |
| Real Estate — 1.6% | | | | | | | | |
| Emaar Properties PJSC | | | 962,671 | | | | 2,159,683 | |
| TOTAL UNITED ARAB EMIRATES | | | | | | | 4,770,940 | |
| | | | | | | | | |
| UNITED KINGDOM— 1.9% | | | | | | | | |
| Basic Materials — 0.6% | | | | | | | | |
| KAZ Minerals | | | 202,035 | | | | 810,661 | |
| Financials — 0.3% | | | | | | | | |
| Bank of Georgia Holdings | | | 16,074 | | | | 443,646 | |
| Oil & Gas — 0.4% | | | | | | | | |
| Afren * | | | 433,500 | | | | 21,984 | |
| Premier Oil | | | 178,973 | | | | 482,417 | |
| | | | | | | | 504,401 | |
| Telecommunications — 0.6% | | | | | | | | |
| Cable & Wireless Communications | | | 742,262 | | | | 768,817 | |
| TOTAL UNITED KINGDOM | | | | | | | 2,527,525 | |
The accompanying notes are an integral part of the financial statements.
| Schedule of Investments | April 30, 2015 (Unaudited) |
Global X Next Emerging & Frontier ETF
| | | Shares/Face
Amount(1) | | | Value | |
| COMMON STOCK — continued | | | | | | | | |
| | | | | | | | | |
| UNITED STATES— 0.2% | | | | | | | | |
| Oil & Gas — 0.2% | | | | | | | | |
| Vaalco Energy * | | | 86,184 | | | $ | 212,874 | |
| | | | | | | | | |
| VIETNAM— 0.2% | | | | | | | | |
| Utilities — 0.2% | | | | | | | | |
| PetroVietnam Gas JSC | | | 72,070 | | | | 220,316 | |
| TOTAL COMMON STOCK | | | | | | | | |
| (Cost $146,240,270) | | | | | | | 132,531,375 | |
| | | | | | | | | |
| PREFERRED STOCK — 0.2% | | | | | | | | |
| | | | | | | | | |
| COLOMBIA— 0.2% | | | | | | | | |
| Consumer Services — 0.1% | | | | | | | | |
| Avianca Holdings * | | | 110,101 | | | | 172,058 | |
| Financials — 0.1% | | | | | | | | |
| Banco Davivienda * | | | 14,100 | | | | 162,761 | |
| TOTAL PREFERRED STOCK | | | | | | | | |
| (Cost $454,492) | | | | | | | 334,819 | |
| | | | | | | | | |
| CONVERTIBLE BOND — 0.0% | | | | | | | | |
| BankMuscat SAOG 4.500%, 03/20/17 | | | | | | | | |
| (Cost $–) | | | 2,702 | | | | 737 | |
| | | | | | | | | |
| TIME DEPOSITS — 0.3% | | | | | | | | |
| Brown Brothers Harriman | | | | | | | | |
| 0.030%, 05/01/15 | | | 380,936 | | | | 380,936 | |
| 0.150%, 05/01/15, CAD | | | 25 | | | | 20 | |
| 5.010%, 05/01/15, ZAR | | | 206 | | | | 17 | |
| TOTAL TIME DEPOSITS | | | | | | | | |
| (Cost $380,973) | | | | | | | 380,973 | |
| TOTAL INVESTMENTS — 100.0% | | | | | | | | |
| (Cost $147,075,735) | | | | | | $ | 133,247,904 | |
Percentages are based on Net Assets of $133,249,078.
| * | Non-income producing security. |
| (1) | In U.S. Dollars unless otherwise indicated. |
| ^ | Security traded on the Toronto Stock Exchange. |
ADR – American Depositary Receipt
CAD – Canadian Dollar
Cl – Class
GDR – Global Depositary Receipt
Ltd. –Limited
NVDR – Non-voting Depository Receipt
Ser – Series
ZAR – South African Rand
The accompanying notes are an integral part of the financial statements.
| Schedule of Investments | April 30, 2015 (Unaudited) |
Global X Next Emerging & Frontier ETF
Amounts designated as “—“ are $0 or have been rounded to $0.
The following is a summary of the inputs used as of April 30, 2015, in valuing the Fund's investments carried at value:
| Investments in Securities | | Level 1 | | | Level 2 | | | Level 3 | | | Total | |
| Common Stock | | $ | 132,403,397 | | | $ | 127,978 | | | $ | — | | | $ | 132,531,375 | |
| Preferred Stock | | | 334,819 | | | | — | | | | — | | | | 334,819 | |
| Convertible Bond | | | — | | | | 737 | | | | — | | | | 737 | |
| Time Deposits | | | — | | | | 380,973 | | | | — | | | | 380,973 | |
| Total Investments in Securities | | $ | 132,738,216 | | | $ | 509,688 | | | $ | — | | | $ | 133,247,904 | |
For the period ended April 30, 2015 the transfers out of Level 3 were due to changes in the availability of observable inputs to determine fair value. Transfers between levels are recognized at period end.
As of April 30, 2015, there were no Level 3 investments.
The accompanying notes are an integral part of the financial statements.
| Schedule of Investments | April 30, 2015 (Unaudited) |
Global X FTSE Portugal 20 ETF
Sector Weightings †:
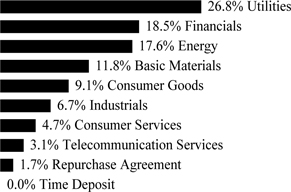
† Sector weightings percentages are based on the total market value of investments. Repurchase agreements purchased from cash collateral received for securities lending activity are included in total investments. Please see Note 8 in Notes to Financial Statements for more detailed information.
| | | Shares | | | Value | |
| COMMON STOCK — 99.9% |
| |
| PORTUGAL— 99.9% | | | | | | | | |
| Basic Materials — 12.0% | | | | | | | | |
| Altri | | | 237,828 | | | $ | 1,018,288 | |
| Cimpor Cimentos de Portugal * | | | 130,799 | | | | 197,865 | |
| Portucel | | | 439,503 | | | | 2,152,650 | |
| Semapa-Sociedade de Investimento e Gestao | | | 141,203 | | | | 2,023,696 | |
| Sonae Industria * | | | 11,261,021 | | | | 99,686 | |
| | | | | | | | 5,492,185 | |
| Consumer Goods — 9.3% | | | | | | | | |
| Jeronimo Martins | | | 164,637 | | | | 2,402,901 | |
| Sonae | | | 1,324,513 | | | | 1,843,353 | |
| | | | | | | | 4,246,254 | |
| Consumer Services — 4.8% | | | | | | | | |
| NOS SGPS | | | 301,905 | | | | 2,198,945 | |
| Energy — 17.9% | | | | | | | | |
| Galp Energia | | | 599,681 | | | | 8,191,335 | |
| Financials — 18.8% | | | | | | | | |
| Banco BPI, Cl G * (A) | | | 1,160,348 | | | | 1,898,331 | |
| Banco Comercial Portugues, Cl R * | | | 59,304,008 | | | | 5,920,964 | |
| Banco Espirito Santo * (C)(D) | | | 2,085,614 | | | | — | |
| BANIF - Banco Internacional do Funchal * | | | 104,226,516 | | | | 782,499 | |
| | | | | | | | 8,601,794 | |
| Industrials — 6.8% | | | | | | | | |
| CTT-Correios de Portugal | | | 193,100 | | | | 2,180,008 | |
| Mota-Engil | | | 223,532 | | | | 773,478 | |
| Sonae Capital * | | | 298,669 | | | | 130,522 | |
| | | | | | | | 3,084,008 | |
The accompanying notes are an integral part of the financial statements.
| Schedule of Investments | April 30, 2015 (Unaudited) |
Global X FTSE Portugal 20 ETF
| | | Shares/Face
Amount | | | Value | |
| COMMON STOCK — continued |
| |
| Telecommunication Services — 3.1% | | | | | | | | |
| Portugal Telecom (A) | | | 1,800,135 | | | $ | 1,155,820 | |
| Sonaecom * | | | 110,045 | | | | 270,051 | |
| | | | | | | | 1,425,871 | |
| Utilities — 27.2% | | | | | | | | |
| EDP Renovaveis | | | 289,545 | | | | 2,028,781 | |
| Energias de Portugal | | | 2,248,018 | | | | 8,997,916 | |
| REN - Redes Energeticas Nacionais | | | 461,641 | | | | 1,443,242 | |
| | | | | | | | 12,469,939 | |
| TOTAL COMMON STOCK | | | | | | | | |
| (Cost $51,005,811) | | | | | | | 45,710,331 | |
| |
| REPURCHASE AGREEMENT — 1.7% |
| Deutsche Bank | | | | | | | | |
| 0.080%, dated 04/30/15, to be repurchased on 05/01/15 repurchase price $783,901 (collateralized by U.S. Treasury Notes, par value $789,522, 1.500%, 11/30/19 with a total market value of $796,620)(B) | | | | | | | | |
| (Cost $783,899) | | $ | 783,899 | | | | 783,899 | |
| | | | | | | | | |
| TIME DEPOSIT — 0.0% |
| Brown Brothers Harriman, 0.030%, 05/01/15 | | | | | | | | |
| (Cost $2,780) | | | 2,780 | | | | 2,780 | |
| | | | | | | | | |
| TOTAL INVESTMENTS — 101.6% | | | | | | | | |
| (Cost $51,792,490) | | | | | | $ | 46,497,010 | |
Percentages are based on Net Assets of $45,760,309.
| * | Non-income producing security. |
| (A) | This security or a partial position of this security is on loan at April 30, 2015. The total value of securities on loan at April 30, 2015 was $735,633. |
| (B) | These securities were purchased with cash collateral held from securities on loan. The total value of such securities as of April 30, 2015 was $783,899. |
| (C) | Security considered illiquid. The total value of such securities as of April 30, 2015 was $0 and represented 0.0% of Net Assets. |
| (D) | Security is fair valued using methods determined in good faith by the Fair Value Committee of the Fund. The total value of such securities as of April 30, 2015, was $0 and represents 0.0% of net assets. |
Amounts designated as “—“ are $0 or have been rounded to $0.
The following is a summary of the inputs used as of April 30, 2015, in valuing the Fund's investments carried at value:
| Investments in Securities | | Level 1 | | | Level 2 | | | Level 3(1) | | | Total | |
| Common Stock | | $ | 45,710,331 | | | $ | — | | | $ | — | | | $ | 45,710,331 | |
| Repurchase Agreement | | | — | | | | 783,899 | | | | — | | | | 783,899 | |
| Time Deposit | | | — | | | | 2,780 | | | | — | | | | 2,780 | |
| Total Investments in Securities | | $ | 45,710,331 | | | $ | 786,679 | | | $ | — | | | $ | 46,497,010 | |
(1) A reconciliation of Level 3 investments and disclosures of significant unobservable inputs are presented when the Fund has a significant amount (over 1%) of Level 3 investments at the beginning and/or end of the period in relation to net assets. Management has concluded that Level 3 investments are not material in relation to net assets.
For the period ended April 30, 2015, there have been no transfers between Level 1, Level 2 or Level 3 investments.
The accompanying notes are an integral part of the financial statements.
| Schedule of Investments | April 30, 2015 (Unaudited) |
Global X MSCI Pakistan ETF
Sector Weightings †:
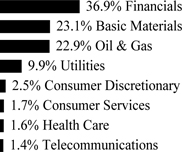
† Sector weightings percentages are based on the total market value of investments.
| | | Shares | | | Value | |
| COMMON STOCK — 100.2% |
| |
| PAKISTAN— 100.2% | | | | | | | | |
| Basic Materials — 23.2% | | | | |
| DG Khan Cement | | | 36,600 | | | $ | 49,441 | |
| Engro * | | | 33,000 | | | | 102,727 | |
| Fatima Fertilizer | | | 88,500 | | | | 33,012 | |
| Fauji Cement | | | 180,600 | | | | 59,836 | |
| Fauji Fertilizer | | | 85,500 | | | | 119,777 | |
| Fauji Fertilizer Bin Qasim | | | 16,800 | | | | 8,013 | |
| Lucky Cement * | | | 24,200 | | | | 115,953 | |
| Millat Tractors | | | 7,200 | | | | 43,192 | |
| | | | | | | | 531,951 | |
| Consumer Discretionary — 2.5% | | | | |
| Indus Motor | | | 4,800 | | | | 57,337 | |
| Consumer Services — 1.7% | | | | |
| Nishat Mills | | | 34,800 | | | | 38,416 | |
| Financials — 37.0% | | | | |
| Askari Bank | | | 160,800 | | | | 34,031 | |
| Bank Al Habib | | | 203,400 | | | | 93,514 | |
| Bank Alfalah | | | 186,600 | | | | 54,630 | |
| Habib Bank | | | 96,700 | | | | 190,766 | |
| IGI Insurance | | | 15,300 | | | | 34,155 | |
| MCB Bank | | | 86,900 | | | | 236,108 | |
| National Bank of Pakistan | | | 140,700 | | | | 78,912 | |
| United Bank | | | 73,700 | | | | 128,780 | |
| | | | | | | | 850,896 | |
| Health Care — 1.6% | | | | |
| Abbott Laboratories Pakistan | | | 6,600 | | | | 36,024 | |
| Oil & Gas — 22.9% | | | | |
| Attock Petroleum | | | 6,300 | | | | 34,448 | |
The accompanying notes are an integral part of the financial statements.
| Schedule of Investments | April 30, 2015 (Unaudited) |
Global X MSCI Pakistan ETF
| | | Shares | | | Value | |
| COMMON STOCK — continued |
| |
| Oil & Gas — continued | | | | | | | | |
| National Refinery * | | | 11,100 | | | $ | 23,675 | |
| Oil & Gas Development | | | 109,800 | | | | 197,431 | |
| Pakistan Oilfields | | | 19,800 | | | | 71,838 | |
| Pakistan Petroleum | | | 39,000 | | | | 69,079 | |
| Pakistan State Oil | | | 28,500 | | | | 106,744 | |
| Shell Pakistan | | | 9,900 | | | | 23,890 | |
| | | | | | | | 527,105 | |
| Telecommunications — 1.4% | | | | | | | | |
| Pakistan Telecommunication | | | 160,800 | | | | 32,876 | |
| Utilities — 9.9% | | | | | | | | |
| Hub Power | | | 106,742 | | | | 102,213 | |
| K-Electric | | | 543,600 | | | | 40,094 | |
| Kot Addu Power | | | 67,200 | | | | 58,757 | |
| SUI Southern Gas * | | | 76,500 | | | | 27,633 | |
| | | | | | | | 228,697 | |
| TOTAL INVESTMENTS — 100.2% | | | | | | | | |
| (Cost $2,306,923) | | | | | | $ | 2,303,302 | |
Percentages are based on Net Assets of $2,297,960.
| * | Non-income producing security. |
As of April 30, 2015, all of the Fund’s investments were considered Level 1, in accordance with the authoritative guidance on fair value measurements and disclosure under U.S. GAAP.
For the period ended April 30, 2015, there have been no transfers between Level 1, Level 2 or Level 3 investments.
As of April 30, 2015, there were no Level 3 investments.
The accompanying notes are an integral part of the financial statements.
Statements of Assets and Liabilities
April 30, 2015 (Unaudited)
| | | Global X China
Consumer ETF | | | Global X China
Energy ETF | | | Global X China
Financials ETF | | | Global X China
Industrials ETF | |
| Assets: | | | | | | | | | | | | | | | | |
| Cost of Investments | | $ | 118,340,770 | | | $ | 3,153,227 | | | $ | 91,206,235 | | | $ | 9,706,515 | |
| Cost of Repurchase Agreement | | | 8,209,505 | | | | — | | | | — | | | | — | |
| Cost of Foreign Currency | | | 2 | | | | 1 | | | | 2 | | | | — | |
| Investments, at Value | | $ | 115,447,017 | * | | $ | 3,112,853 | | | $ | 117,502,018 | | | $ | 11,701,379 | |
| Repurchase Agreement, at Value | | | 8,209,505 | | | | — | | | | — | | | | — | |
| Foreign Currency, at Value | | | 2 | | | | 1 | | | | 2 | | | | — | |
| Cash | | | — | | | | — | | | | — | | | | — | |
| Receivable for Investment Securities Sold | | | 16,046,409 | | | | 274,165 | | | | 6,831,971 | | | | 953,181 | |
| Dividend and Interest Receivable | | | 10,329 | | | | — | | | | 4,863 | | | | — | |
| Receivable for Capital Shares Sold | | | — | | | | — | | | | 1,936,655 | | | | 987,205 | |
| Total Assets | | | 139,713,262 | | | | 3,387,019 | | | | 126,275,509 | | | | 13,641,765 | |
| Liabilities: | | | | | | | | | | | | | | | | |
| Payable for Investment Securities Purchased | | | 16,030,249 | | | | 271,631 | | | | 8,617,998 | | | | 1,908,992 | |
| Obligation to Return Securities Lending Collateral | | | 8,209,505 | | | | — | | | | — | | | | — | |
| Payable due to Investment Adviser | | | 60,675 | | | | 1,860 | | | | 56,840 | | | | 4,658 | |
| Cash Overdraft | | | 1,900 | | | | 2,245 | | | | — | | | | 9,444 | |
| Total Liabilities | | | 24,302,329 | | | | 275,736 | | | | 8,674,838 | | | | 1,923,094 | |
| Net Assets | | $ | 115,410,933 | | | $ | 3,111,283 | | | $ | 117,600,671 | | | $ | 11,718,671 | |
| Net Assets Consist of: | | | | | | | | | | | | | | | | |
| Paid-in Capital | | $ | 146,472,367 | | | $ | 3,610,114 | | | $ | 91,366,617 | | | $ | 11,081,448 | |
| Distributions in Excess of Net Investment Income | | | (346,601 | ) | | | (11,340 | ) | | | (181,686 | ) | | | (21,734 | ) |
| Accumulated Net Realized Gain (Loss) on Investments and Foreign Currency Transactions | | | (27,821,079 | ) | | | (447,117 | ) | | | 119,958 | | | | (1,335,907 | ) |
| Net Unrealized Appreciation (Depreciation) on Investments | | | (2,893,753 | ) | | | (40,374 | ) | | | 26,295,783 | | | | 1,994,864 | |
| Net Unrealized Depreciation on Foreign Currency Translations | | | (1 | ) | | | — | | �� | | (1 | ) | | | — | |
| Net Assets | | $ | 115,410,933 | | | $ | 3,111,283 | | | $ | 117,600,671 | | | $ | 11,718,671 | |
| Outstanding Shares of Beneficial Interest | | | | | | | | | | | | | | | | |
| (unlimited authorization — no par value) | | | 7,450,000 | | | | 200,000 | | | | 6,100,000 | | | | 600,000 | |
| Net Asset Value, Offering and Redemption Price Per Share | | $ | 15.49 | | | $ | 15.56 | | | $ | 19.28 | | | $ | 19.53 | |
| *Includes Market Value of Securities on Loan | | $ | 7,515,812 | | | $ | — | | | $ | — | | | $ | — | |
The accompanying notes are an integral part of the financial statements.
Statements of Assets and Liabilities
April 30, 2015 (Unaudited)
| | | Global X China
Materials ETF | | | Global X NASDAQ
China Technology
ETF | | | Global X Southeast
Asia ETF | | | Global X FTSE
Andean 40 ETF | |
| Assets: | | | | | | | | | | | | | | | | |
| Cost of Investments | | $ | 6,849,582 | | | $ | 16,628,371 | | | $ | 24,054,024 | | | $ | 9,843,727 | |
| Cost of Foreign Currency | | | — | | | | — | | | | 18,040 | | | | 3,850 | |
| Investments, at Value | | $ | 7,074,086 | | | $ | 22,467,508 | | | $ | 22,268,095 | | | $ | 7,407,428 | |
| Foreign Currency, at Value | | | — | | | | — | | | | 18,040 | | | | 3,866 | |
| Cash | | | — | | | | — | | | | 103 | | | | 48 | |
| Receivable for Investment Securities Sold | | | 582,549 | | | | — | | | | — | | | | — | |
| Unrealized Appreciation on Spot Contracts | | | — | | | | — | | | | — | | | | 35 | |
| Dividend and Interest Receivable | | | — | | | | 7,485 | | | | 174,043 | | | | 19,308 | |
| Reclaim Receivable | | | — | | | | — | | | | 5,126 | | | | — | |
| Total Assets | | | 7,656,635 | | | | 22,474,993 | | | | 22,465,407 | | | | 7,430,685 | |
| Liabilities: | | | | | | | | | | | | | | | | |
| Payable for Investment Securities Purchased | | | 570,606 | | | | — | | | | — | | | | 23,304 | |
| Cash Overdraft | | | 5,878 | | | | 1,340 | | | | — | | | | — | |
| Payable due to Investment Adviser | | | 2,277 | | | | 11,069 | | | | 12,068 | | | | 4,189 | |
| Unrealized Depreciation on Spot Contracts | | | — | | | | — | | | | — | | | | 43 | |
| Total Liabilities | | | 578,761 | | | | 12,409 | | | | 12,068 | | | | 27,536 | |
| Net Assets | | $ | 7,077,874 | | | $ | 22,462,584 | | | $ | 22,453,339 | | | $ | 7,403,149 | |
| Net Assets Consist of: | | | | | | | | | | | | | | | | |
| Paid-in Capital | | $ | 7,804,573 | | | $ | 17,421,664 | | | $ | 26,480,798 | | | $ | 11,897,860 | |
| Undistributed (Distributions in Excess of) Net Investment Income | | | (7,529 | ) | | | (33,726 | ) | | | 240,681 | | | | 36,110 | |
| Accumulated Net Realized Loss on Investments and Foreign Currency Transactions | | | (943,673 | ) | | | (764,491 | ) | | | (2,483,485 | ) | | | (2,094,551 | ) |
| Net Unrealized Appreciation (Depreciation) on Investments | | | 224,504 | | | | 5,839,137 | | | | (1,785,929 | ) | | | (2,436,299 | ) |
| Net Unrealized Appreciation (Depreciation) on Foreign Currency Translations | | | (1 | ) | | | — | | | | 1,274 | | | | 29 | |
| Net Assets | | $ | 7,077,874 | | | $ | 22,462,584 | | | $ | 22,453,339 | | | $ | 7,403,149 | |
| Outstanding Shares of Beneficial Interest | | | | | | | | | | | | | | | | |
| (unlimited authorization — no par value) | | | 349,971 | | | | 800,000 | | | | 1,400,000 | | | | 800,000 | |
| Net Asset Value, Offering and Redemption Price Per Share | | $ | 20.22 | | | $ | 28.08 | | | $ | 16.04 | | | $ | 9.25 | |
The accompanying notes are an integral part of the financial statements.
Statements of Assets and Liabilities
April 30, 2015 (Unaudited)
| | | Global X MSCI
Colombia ETF | | | Global X Brazil
Mid Cap ETF | | | Global X Brazil
Consumer ETF | | | Global X Brazil
Financials ETF | |
| Assets: | | | | | | | | | | | | | | | | |
| Cost of Investments | | $ | 123,953,992 | | | $ | 6,435,001 | | | $ | 7,960,796 | | | $ | 1,514,804 | |
| Cost of Foreign Currency | | | 97,796 | | | | 1,322 | | | | 1,308 | | | | (242 | ) |
| Investments, at Value | | $ | 104,609,511 | | | $ | 4,908,125 | | | $ | 6,569,245 | | | $ | 1,245,795 | |
| Foreign Currency, at Value | | | 97,732 | | | | 1,322 | | | | 1,307 | | | | — | |
| Receivable for Capital Shares Sold | | | 11,768,771 | | | | — | | | | — | | | | — | |
| Dividend and Interest Receivable | | | 15,833 | | | | 27,234 | | | | 27,143 | | | | 3,434 | |
| Unrealized Appreciation on Spot Contracts | | | 581 | | | | — | | | | — | | | | — | |
| Total Assets | | | 116,492,428 | | | | 4,936,681 | | | | 6,597,695 | | | | 1,249,229 | |
| Liabilities: | | | | | | | | | | | | | | | | |
| Payable for Investment Securities Purchased | | | 11,593,364 | | | | — | | | | — | | | | — | |
| Unrealized Depreciation on Spot Contracts | | | 69,115 | | | | — | | | | — | | | | — | |
| Payable due to Investment Adviser | | | 40,337 | | | | 2,726 | | | | 4,212 | | | | 654 | |
| Cash Overdraft | | | 11,647 | | | | 2,805 | | | | 26,191 | | | | 242 | |
| Total Liabilities | | | 11,714,463 | | | | 5,531 | | | | 30,403 | | | | 896 | |
| Net Assets | | $ | 104,777,965 | | | $ | 4,931,150 | | | $ | 6,567,292 | | | $ | 1,248,333 | |
| Net Assets Consist of: | | | | | | | | | | | | | | | | |
| Paid-in Capital | | $ | 171,261,591 | | | $ | 12,573,309 | | | $ | 11,476,698 | | | $ | 3,595,229 | |
| Undistributed (Distributions in Excess of) Net Investment Income | | | (335,600 | ) | | | 44,909 | | | | 50,300 | | | | 8,647 | |
| Accumulated Net Realized Loss on Investments and Foreign Currency Transactions | | | (46,768,961 | ) | | | (6,159,892 | ) | | | (3,567,514 | ) | | | (2,086,452 | ) |
| Net Unrealized Depreciation on Investments | | | (19,344,481 | ) | | | (1,526,876 | ) | | | (1,391,551 | ) | | | (269,009 | ) |
| Net Unrealized Depreciation on Foreign Currency Translations | | | (34,584 | ) | | | (300 | ) | | | (641 | ) | | | (82 | ) |
| Net Assets | | $ | 104,777,965 | | | $ | 4,931,150 | | | $ | 6,567,292 | | | $ | 1,248,333 | |
| Outstanding Shares of Beneficial Interest | | | | | | | | | | | | | | | | |
| (unlimited authorization — no par value) | | | 8,480,000 | | | | 500,000 | | | | 500,000 | | | | 150,000 | |
| Net Asset Value, Offering and Redemption Price Per Share | | $ | 12.36 | | | $ | 9.86 | | | $ | 13.13 | | | $ | 8.32 | |
The accompanying notes are an integral part of the financial statements.
Statements of Assets and Liabilities
April 30, 2015 (Unaudited)
| | | Global X MSCI
Argentina ETF | | | Global X FTSE
Greece 20 ETF | | | Global X MSCI
Norway ETF | | | Global X FTSE
Nordic Region
ETF | |
| Assets: | | | | | | | | | | | | | | | | |
| Cost of Investments | | $ | 20,796,678 | | | $ | 326,598,503 | | | $ | 114,946,862 | | | $ | 49,686,154 | |
| Cost of Repurchase Agreement | | | — | | | | — | | | | 12,012,280 | | | | — | |
| Cost of Foreign Currency | | | 343 | | | | 2,156 | | | | 65,647 | | | | (1 | ) |
| Investments, at Value | | $ | 20,214,628 | | | $ | 288,118,149 | | | $ | 92,636,925 | * | | $ | 55,772,824 | |
| Foreign Currency, at Value | | | 343 | | | | 2,223 | | | | 66,933 | | | | — | |
| Repurchase Agreement, at Value | | | — | | | | — | | | | 12,012,280 | | | | — | |
| Cash | | | — | | | | — | | | | 3,412 | | | | — | |
| Cash held for securities on loan | | | — | | | | — | | | | 3,401,322 | | | | — | |
| Dividend and Interest Receivable | | | 28,926 | | | | — | | | | 508,822 | | | | 133,680 | |
| Reclaim Receivable | | | 201 | | | | — | | | | 289,253 | | | | 500,050 | |
| Unrealized Appreciation on Spot Contracts | | | — | | | | — | | | | 9 | | | | — | |
| Receivable for Capital Shares Sold | | | — | | | | 7,642,726 | | | | — | | | | — | |
| Receivable for Investment Securities Sold | | | — | | | | 3,693,451 | | | | 1,289,276 | | | | — | |
| Total Assets | | | 20,244,098 | | | | 299,456,549 | | | | 110,208,232 | | | | 56,406,554 | |
| Liabilities: | | | | | | | | | | | | | | | | |
| Payable due to Investment Adviser | | | 11,575 | | | | 107,451 | | | | 35,461 | | | | 23,140 | |
| Payable due to Custodian | | | 131 | | | | 19,634 | | | | — | | | | — | |
| Cash Overdraft | | | 1,669 | | | | 651,537 | | | | — | | | | 1 | |
| Payable for Investment Securities Purchased | | | — | | | | 9,716,824 | | | | — | | | | — | |
| Obligation to Return Securities Lending Collateral | | | — | | | | — | | | | 15,413,602 | | | | — | |
| Payable for Capital Shares Redeemed | | | — | | | | — | | | | 1,300,005 | | | | — | |
| Unrealized Depreciation on Spot Contracts | | | — | | | | 12,794 | | | | — | | | | — | |
| Total Liabilities | | | 13,375 | | | | 10,508,240 | | | | 16,749,068 | | | | 23,141 | |
| Net Assets | | $ | 20,230,723 | | | $ | 288,948,309 | | | $ | 93,459,164 | | | $ | 56,383,413 | |
| Net Assets Consist of: | | | | | | | | | | | | | | | | |
| Paid-in Capital | | $ | 24,066,111 | | | $ | 402,729,249 | | | $ | 143,430,471 | | | $ | 50,766,314 | |
| Undistributed (Distributions in Excess of) Net Investment Income | | | (28,842 | ) | | | 983,987 | | | | 884,737 | | | | 926,646 | |
| Accumulated Net Realized Loss on Investments and Foreign Currency Transactions | | | (3,224,482 | ) | | | (76,279,530 | ) | | | (28,528,593 | ) | | | (1,326,907 | ) |
| Net Unrealized Appreciation (Depreciation) on Investments | | | (582,050 | ) | | | (38,480,354 | ) | | | (22,309,937 | ) | | | 6,086,670 | |
| Net Unrealized Depreciation on Foreign Currency Translations | | | (14 | ) | | | (5,043 | ) | | | (17,514 | ) | | | (69,310 | ) |
| Net Assets | | $ | 20,230,723 | | | $ | 288,948,309 | | | $ | 93,459,164 | | | $ | 56,383,413 | |
| Outstanding Shares of Beneficial Interest | | | | | | | | | | | | | | | | |
| (unlimited authorization — no par value) | | | 924,975 | | | | 23,850,000 | | | | 7,100,000 | | | | 2,310,000 | |
| Net Asset Value, Offering and Redemption Price Per Share | | $ | 21.87 | | | $ | 12.12 | | | $ | 13.16 | | | $ | 24.41 | |
| *Includes Market Value of Securities on Loan | | $ | — | | | $ | — | | | $ | 14,782,848 | | | $ | — | |
The accompanying notes are an integral part of the financial statements.
Statements of Assets and Liabilities
April 30, 2015 (Unaudited)
| | | Global X Central
Asia & Mongolia
Index ETF | | | Global X MSCI
Nigeria ETF | | | Global X Next
Emerging &
Frontier ETF | | | Global X FTSE
Portugal 20 ETF | | | Global X MSCI
Pakistan ETF | |
| Assets: | | | | | | | | | | | | | | | | | | | | |
| Cost of Investments | | $ | 3,252,556 | | | $ | 35,561,332 | | | $ | 147,075,735 | | | $ | 51,008,591 | | | $ | 2,306,923 | |
| Cost of Repurchase Agreement | | | — | | | | — | | | | — | | | | 783,899 | | | | — | |
| Cost of Foreign Currency | | | 3,687 | | | | 44,326 | | | | 160,415 | | | | — | | | | — | |
| Investments, at Value | | $ | 2,968,539 | | | $ | 32,264,872 | | | $ | 133,247,904 | | | $ | 45,713,111 | * | | $ | 2,303,302 | |
| Foreign Currency, at Value | | | 3,687 | | | | 44,326 | | | | 159,837 | | | | — | | | | — | |
| Repurchase Agreement, at Value | | | — | | | | — | | | | — | | | | 783,899 | | | | — | |
| Cash | | | — | | | | 395 | | | | — | | | | — | | | | 288,129 | |
| Dividend and Interest Receivable | | | 31,897 | | | | 261,337 | | | | 324,792 | | | | 3,675 | | | | 1,436 | |
| Reclaim Receivable | | | 3,579 | | | | 4,264 | | | | 22,028 | | | | 67,602 | | | | — | |
| Unrealized Appreciation on Spot Contracts | | | — | | | | — | | | | 155 | | | | — | | | | — | |
| Receivable for Capital Shares Sold | | | — | | | | 506,220 | | | | — | | | | — | | | | — | |
| Receivable for Investment Securities Sold | | | — | | | | — | | | | — | | | | — | | | | 134,951 | |
| Total Assets | | | 3,007,702 | | | | 33,081,414 | | | | 133,754,716 | | | | 46,568,287 | | | | 2,727,818 | |
| Liabilities: | | | | | | | | | | | | | | | | | | | | |
| Cash Overdraft | | | 320,457 | | | | — | | | | 6,048 | | | | 1,340 | | | | — | |
| Payable due to Investment Adviser | | | 1,433 | | | | 17,267 | | | | 53,278 | | | | 19,167 | | | | 214 | |
| Payable due to Custodian | | | 29 | | | | — | | | | 20,012 | | | | 3,572 | | | | 63 | |
| Payable for Investment Securities Purchased | | | — | | | | 667,287 | | | | 425,116 | | | | — | | | | 426,143 | |
| Obligation to Return Securities Lending Collateral | | | — | | | | — | | | | — | | | | 783,899 | | | | — | |
| Unrealized Depreciation on Spot Contracts | | | — | | | | 2,874 | | | | 1,184 | | | | — | | | | — | |
| Payable for Foreign Capital Gains Tax | | | — | | | | — | | | | — | | | | — | | | | 3,438 | |
| Total Liabilities | | | 321,919 | | | | 687,428 | | | | 505,638 | | | | 807,978 | | | | 429,858 | |
| Net Assets | | $ | 2,685,783 | | | $ | 32,393,986 | | | $ | 133,249,078 | | | $ | 45,760,309 | | | $ | 2,297,960 | |
| Net Assets Consist of: | | | | | | | | | | | | | | | | | | | | |
| Paid-in Capital | | $ | 3,349,975 | | | $ | 37,666,195 | | | $ | 146,757,806 | | | $ | 54,775,185 | | | $ | 2,292,116 | |
| Undistributed (Distributions in Excess of) Net Investment Income | | | 28,697 | | | | 535,797 | | | | 1,114,023 | | | | (59,985 | ) | | | 1,161 | |
| Accumulated Net Realized Gain (Loss) on Investments and Foreign Currency Transactions | | | (409,420 | ) | | | (2,508,229 | ) | | | (808,139 | ) | | | (3,645,260 | ) | | | 11,857 | |
| Net Unrealized Depreciation on Investments | | | (284,017 | ) | | | (3,296,460 | ) | | | (13,827,831 | ) | | | (5,295,480 | ) | | | (3,621 | ) |
| Net Unrealized Appreciation (Depreciation) on Foreign Currency Translations | | | 548 | | | | (3,317 | ) | | | 13,219 | | | | (14,151 | ) | | | (3,553 | ) |
| Net Assets | | $ | 2,685,783 | | | $ | 32,393,986 | | | $ | 133,249,078 | | | $ | 45,760,309 | | | $ | 2,297,960 | |
| Outstanding Shares of Beneficial Interest | | | | | | | | | | | | | | | | | | | | |
| (unlimited authorization — no par value) | | | 250,000 | | | | 3,200,000 | | | | 5,700,000 | | | | 3,700,000 | | | | 150,000 | |
| Net Asset Value, Offering and Redemption Price Per Share | | $ | 10.74 | | | $ | 10.12 | | | $ | 23.38 | | | $ | 12.37 | | | $ | 15.32 | |
| *Includes Market Value of Securities on Loan | | $ | — | | | $ | — | | | $ | — | | | $ | 735,633 | | | $ | — | |
The accompanying notes are an integral part of the financial statements.
Statements of Operations
For the period ended April 30, 2015 (Unaudited)
| | | Global X China
Consumer ETF | | | Global X China
Energy ETF | | | Global X China
Financials ETF | | | Global X China
Industrials ETF | |
| Investment Income: | | | | | | | | | | | | | | | | |
| Dividend Income | | $ | 560,399 | | | $ | 208 | | | $ | 113,875 | | | $ | 3,208 | |
| Interest Income | | | 33 | | | | 1 | | | | 9 | | | | 10 | |
| Security Lending Income | | | 76,729 | | | | — | | | | — | | | | — | |
| Less: Foreign Taxes Withheld | | | 4,015 | | | | (313 | ) | | | (3,216 | ) | | | — | |
| Total Investment Income (Loss) | | | 641,176 | | | | (104 | ) | | | 110,668 | | | | 3,218 | |
| Supervision and Administration Fees(1) | | | 364,725 | | | | 11,236 | | | | 255,682 | | | | 20,042 | |
| Total Expenses | | | 364,725 | | | | 11,236 | | | | 255,682 | | | | 20,042 | |
| Net Investment Income (Loss) | | | 276,451 | | | | (11,340 | ) | | | (145,014 | ) | | | (16,824 | ) |
| Net Realized Gain (Loss) on: | | | | | | | | | | | | | | | | |
| Investments (2) | | | (7,156,666 | ) | | | 175,350 | | | | 1,555,239 | | | | 201,693 | |
| Foreign Currency Transactions | | | 1,157 | | | | 8 | | | | (21 | ) | | | (111 | ) |
| Net Realized Gain (Loss) on Investments and Foreign Currency | | | (7,155,509 | ) | | | 175,358 | | | | 1,555,218 | | | | 201,582 | |
| Net Change in Unrealized Appreciation (Depreciation) on: | | | | | | | | | | | | | | | | |
| Investments | | | 19,395,701 | | | | 6,176 | | | | 27,778,495 | | | | 2,357,166 | |
| Foreign Currency Translation | | | (65 | ) | | | — | | | | (3 | ) | | | — | |
| Net Change in Unrealized Appreciation on Investments and Foreign Currency Translation | | | 19,395,636 | | | | 6,176 | | | | 27,778,492 | | | | 2,357,166 | |
| Net Realized and Unrealized Gain on Investments and Foreign Currency Transactions and Translation | | | 12,240,127 | | | | 181,534 | | | | 29,333,710 | | | | 2,558,748 | |
| Net Increase in Net Assets Resulting from Operations | | $ | 12,516,578 | | | $ | 170,194 | | | $ | 29,188,696 | | | $ | 2,541,924 | |
| (1) | The Supervision and Administration fees reflect the supervisory and administrative fee, which includes fees paid by the Funds for the investment advisory services provided by the Adviser. (See Note 3 in Notes to Financial Statements.) |
| (2) | Includes realized gains (losses) as a result of in-kind redemptions. (See Note 4 in Notes to Financial Statements.) |
The accompanying notes are an integral part of the financial statements.
Statements of Operations
For the period ended April 30, 2015 (Unaudited)
| | | Global X China
Materials ETF | | | Global X
NASDAQ China
Technology ETF | | | Global X Southeast
Asia ETF | | | Global X FTSE
Andean 40 ETF | |
| Investment Income: | | | | | | | | | | | | | | | | |
| Dividend Income | | $ | 1,393 | | | $ | 41,743 | | | $ | 390,361 | | | $ | 105,553 | |
| Interest Income | | | 1 | | | | 7 | | | | 7 | | | | — | |
| Less: Foreign Taxes Withheld | | | — | | | | (2,074 | ) | | | (19,138 | ) | | | (15,638 | ) |
| Total Investment Income | | | 1,394 | | | | 39,676 | | | | 371,230 | | | | 89,915 | |
| Supervision and Administration Fees(1) | | | 8,923 | | | | 62,881 | | | | 82,059 | | | | 26,017 | |
| Total Expenses | | | 8,923 | | | | 62,881 | | | | 82,059 | | | | 26,017 | |
| Net Investment Income (Loss) | | | (7,529 | ) | | | (23,205 | ) | | | 289,171 | | | | 63,898 | |
| Net Realized Gain (Loss) on: | | | | | | | | | | | | | | | | |
| Investments (2) | | | (1,980 | ) | | | 418,991 | | | | (664,067 | ) | | | (695,214 | ) |
| Foreign Currency Transactions | | | (12 | ) | | | (379 | ) | | | 1,657 | | | | (554 | ) |
| Net Realized Gain (Loss) on Investments and Foreign Currency Transactions | | | (1,992 | ) | | | 418,612 | | | | (662,410 | ) | | | (695,768 | ) |
| Net Change in Unrealized Appreciation (Depreciation) on: | | | | | | | | | | | | | | | | |
| Investments | | | 1,010,740 | | | | 3,072,406 | | | | (316,541 | ) | | | (319,789 | ) |
| Foreign Currency Translation | | | 3 | | | | — | | | | 515 | | | | 31 | |
| Net Change in Unrealized Appreciation (Depreciation) on Investments and Foreign Currency Translation | | | 1,010,743 | | | | 3,072,406 | | | | (316,026 | ) | | | (319,758 | ) |
| Net Realized and Unrealized Gain (Loss) on Investments and Foreign Currency Transactions and Translation | | | 1,008,751 | | | | 3,491,018 | | | | (978,436 | ) | | | (1,015,526 | ) |
| Net Increase (Decrease) in Net Assets Resulting from Operations | | $ | 1,001,222 | | | $ | 3,467,813 | | | $ | (689,265 | ) | | $ | (951,628 | ) |
| (1) | The Supervision and Administration fees reflect the supervisory and administrative fee, which includes fees paid by the Funds for the investment advisory services provided by the Adviser. (See Note 3 in Notes to Financial Statements.) |
| (2) | Includes realized gains (losses) as a result of in-kind redemptions. (See Note 4 in Notes to Financial Statements.) |
The accompanying notes are an integral part of the financial statements.
Statements of Operations
For the period ended April 30, 2015 (Unaudited)
| | | Global X MSCI
Colombia ETF | | | Global X Brazil
Mid Cap ETF | | | Global X Brazil
Consumer ETF | | | Global X Brazil
Financials ETF | |
| Investment Income: | | | | | | | | | | | | | | | | |
| Dividend Income | | $ | 1,040,560 | | | $ | 95,430 | | | $ | 77,888 | | | $ | 18,675 | |
| Interest Income | | | 49 | | | | 2,731 | | | | 3,885 | | | | 1 | |
| Security Lending Income | | | 21,194 | | | | — | | | | — | | | | — | |
| Less: Foreign Taxes Withheld | | | (20,844 | ) | | | — | | | | — | | | | — | |
| Total Investment Income | | | 1,040,959 | | | | 98,161 | | | | 81,773 | | | | 18,676 | |
| Supervision and Administration Fees(1) | | | 249,106 | | | | 20,467 | | | | 29,619 | | | | 4,561 | |
| Custodian Fees | | | 42,087 | | | | – | | | | – | | | | – | |
| Total Expenses | | | 291,193 | | | | 20,467 | | | | 29,619 | | | | 4,561 | |
| Waiver of Supervision and Administration Fees | | | (25,643 | ) | | | – | | | | – | | | | – | |
| Waiver of Custodian Fees | | | (42,087 | ) | | | – | | | | – | | | | – | |
| Net Expenses | | | 223,463 | | | | 20,467 | | | | 29,619 | | | | 4,561 | |
| Net Investment Income | | | 817,496 | | | | 77,694 | | | | 52,154 | | | | 14,115 | |
| Net Realized Gain (Loss) on: | | | | | | | | | | | | | | | | |
| Investments (2) | | | (20,489,956 | ) | | | (994,885 | ) | | | (530,863 | ) | | | (714,935 | ) |
| Foreign Currency Transactions | | | (368,355 | ) | | | 1,081 | | | | (1,734 | ) | | | (1,987 | ) |
| Net Realized Loss on Investments and Foreign Currency Transactions | | | (20,858,311 | ) | | | (993,804 | ) | | | (532,597 | ) | | | (716,922 | ) |
| Net Change in Unrealized Appreciation (Depreciation) on: | | | | | | | | | | | | | | | | |
| Investments | | | (4,196,272 | ) | | | (495,611 | ) | | | (1,372,846 | ) | | | 364,092 | |
| Foreign Currency Translation | | | (43,944 | ) | | | 426 | | | | (201 | ) | | | 146 | |
| Net Change in Unrealized Appreciation (Depreciation) on Investments and Foreign Currency Translation | | | (4,240,216 | ) | | | (495,185 | ) | | | (1,373,047 | ) | | | 364,238 | |
| Net Realized and Unrealized Loss on Investments and Foreign Currency Transactions and Translation | | | (25,098,527 | ) | | | (1,488,989 | ) | | | (1,905,644 | ) | | | (352,684 | ) |
| Net Decrease in Net Assets Resulting from Operations | | $ | (24,281,031 | ) | | $ | (1,411,295 | ) | | $ | (1,853,490 | ) | | $ | (338,569 | ) |
| (1) | The Supervision and Administration fees reflect the supervisory and administrative fee, which includes fees paid by the Funds for the investment advisory services provided by the Adviser. (See Note 3 in Notes to Financial Statements.) |
| (2) | Includes realized gains (losses) as a result of in-kind redemptions. (See Note 4 in Notes to Financial Statements.) |
The accompanying notes are an integral part of the financial statements.
Statements of Operations
For the period ended April 30, 2015 (Unaudited)
| | | Global X MSCI
Argentina ETF | | | Global X FTSE
Greece 20 ETF | | | Global X MSCI
Norway ETF | | | Global X FTSE
Nordic Region
ETF | |
| Investment Income: | | | | | | | | | | | | | | | | |
| Dividend Income | | $ | 114,122 | | | $ | 1,872,878 | | | $ | 1,594,742 | | | $ | 1,520,899 | |
| Interest Income | | | 4 | | | | 42 | | | | 107 | | | | 11 | |
| Security Lending Income | | | — | | | | 7,244 | | | | 197,623 | | | | 2,037 | |
| Less: Foreign Taxes Withheld | | | (15,101 | ) | | | (153,241 | ) | | | (185,647 | ) | | | (107,251 | ) |
| Total Investment Income | | | 99,025 | | | | 1,726,923 | | | | 1,606,825 | | | | 1,415,696 | |
| Supervision and Administration Fees(1) | | | 68,433 | | | | 450,611 | | | | 243,454 | | | | 139,080 | |
| Custodian Fees | | | 362 | | | | 43,097 | | | | — | | | | — | |
| Total Expenses | | | 68,795 | | | | 493,708 | | | | 243,454 | | | | 139,080 | |
| Net Investment Income | | | 30,230 | | | | 1,233,215 | | | | 1,363,371 | | | | 1,276,616 | |
| Net Realized Gain (Loss) on: | | | | | | | | | | | | | | | | |
| Investments (2) | | | (346,010 | ) | | | (58,804,906 | ) | | | (21,411,148 | ) | | | (316,770 | ) |
| Foreign Currency Transactions | | | 1,810 | | | | 2,570 | | | | (121,915 | ) | | | (1,531 | ) |
| Net Realized Loss on Investments and Foreign Currency Transactions | | | (344,200 | ) | | | (58,802,336 | ) | | | (21,533,063 | ) | | | (318,301 | ) |
| Net Change in Unrealized Appreciation (Depreciation) on: | | | | | | | | | | | | | | | | |
| Investments | | | 620,536 | | | | 29,290,171 | | | | 7,028,780 | | | | 1,197,426 | |
| Foreign Currency Translation | | | (11 | ) | | | (5,482 | ) | | | (5,011 | ) | | | (30,110 | ) |
| Net Change in Unrealized Appreciation on Investments and Foreign Currency Translation | | | 620,525 | | | | 29,284,689 | | | | 7,023,769 | | | | 1,167,316 | |
| Net Realized and Unrealized Gain (Loss) on Investments and Foreign Currency Transactions and Translation | | | 276,325 | | | | (29,517,647 | ) | | | (14,509,294 | ) | | | 849,015 | |
| Net Increase (Decrease) in Net Assets Resulting from Operations | | $ | 306,555 | | | $ | (28,284,432 | ) | | $ | (13,145,923 | ) | | $ | 2,125,631 | |
| (1) | The Supervision and Administration fees reflect the supervisory and administrative fee, which includes fees paid by the Funds for the investment advisory services provided by the Adviser. (See Note 3 in Notes to Financial Statements.) |
| (2) | Includes realized gains (losses) as a result of in-kind redemptions. (See Note 4 in Notes to Financial Statements.) |
The accompanying notes are an integral part of the financial statements.
Statements of Operations
For the period ended April 30, 2015 (Unaudited)
| | | Global X Central
Asia & Mongolia
Index ETF | | | Global X MSCI
Nigeria ETF | | | Global X Next
Emerging &
Frontier ETF | | | Global X FTSE
Portugal 20 ETF | | | Global X MSCI
Pakistan ETF(3) | |
| Investment Income: | | | | | | | | | | | | | | | | | | | | |
| Dividend Income | | $ | 45,033 | | | $ | 798,199 | | | $ | 2,211,253 | | | $ | 24,407 | | | $ | 1,597 | |
| Interest Income | | | 2 | | | | 25 | | | | — | | | | 4 | | | | — | |
| Security Lending Income | | | — | | | | — | | | | — | | | | 21,894 | | | | — | |
| Less: Foreign Taxes Withheld | | | (703 | ) | | | (74,435 | ) | | | (165,743 | ) | | | (6,094 | ) | | | (159 | ) |
| Total Investment Income | | | 44,332 | | | | 723,789 | | | | 2,045,510 | | | | 40,211 | | | | 1,438 | |
| Supervision and Administration Fees(1) | | | 7,420 | | | | 66,698 | | | | 329,614 | | | | 90,157 | | | | 214 | |
| Custodian Fees | | | 85 | | | | 23,540 | | | | 60,786 | | | | 10,040 | | | | 63 | |
| Total Expenses | | | 7,505 | | | | 90,238 | | | | 390,400 | | | | 100,197 | | | | 277 | |
| Waiver of Custodian Fees | | | — | | | | (23,540 | ) | | | — | | | | — | | | | — | |
| Net Expenses | | | 7,505 | | | | 66,698 | | | | 390,400 | | | | 100,197 | | | | 277 | |
| Net Investment Income (Loss) | | | 36,827 | | | | 657,091 | | | | 1,655,110 | | | | (59,986 | ) | | | 1,161 | |
| Net Realized Gain (Loss) on: | | | | | | | | | | | | | | | | | | | | |
| Investments | | | (244,005 | ) | | | (1,956,617 | ) | | | (381,493 | )(2) | | | (1,947,987 | )(2) | | | (1,131 | ) |
| Foreign Currency Transactions | | | (332 | ) | | | 535,437 | | | | (22,393 | ) | | | (9,741 | ) | | | 12,988 | |
| Net Realized Gain (Loss) on Investments and Foreign Currency Transactions | | | (244,337 | ) | | | (1,421,180 | ) | | | (403,886 | ) | | | (1,957,728 | ) | | | 11,857 | |
| Net Change in Unrealized Appreciation (Depreciation) on: | | | | | | | | | | | | | | | | | | | | |
| Investments | | | 15,433 | | | | (1,321,362 | ) | | | (11,736,671 | ) | | | 2,827,084 | | | | (3,621 | ) |
| Foreign Currency Translation | | | (195 | ) | | | (2,715 | ) | | | 4,646 | | | | (7,984 | ) | | | (3,553 | ) |
| Net Change in Unrealized Appreciation (Depreciation) on Investments and Foreign Currency Translation | | | 15,238 | | | | (1,324,077 | ) | | | (11,732,025 | ) | | | 2,819,100 | | | | (7,174 | ) |
| Net Realized and Unrealized Gain (Loss) on Investments and Foreign Currency Transactions and Translation | | | (229,099 | ) | | | (2,745,257 | ) | | | (12,135,911 | ) | | | 861,372 | | | | 4,683 | |
| Net Increase (Decrease) in Net Assets Resulting from Operations | | $ | (192,272 | ) | | $ | (2,088,166 | ) | | $ | (10,480,801 | ) | | $ | 801,386 | | | $ | 5,844 | |
| (1) | The Supervision and Administration fees reflect the supervisory and administrative fee, which includes fees paid by the Funds for the investment advisory services provided by the Adviser. (See Note 3 in Notes to Financial Statements.) |
| (2) | Includes realized gains (losses) as a result of in-kind redemptions. (See Note 4 in Notes to Financial Statements.) |
| (3) | Commenced operations on April 22, 2015. |
The accompanying notes are an integral part of the financial statements.
Statements of Changes in Net Assets
| | | Global X China Consumer ETF | | | Global X China Energy ETF | |
| | | Period Ended
April 30, 2015
(Unaudited) | | | Year Ended
October 31, 2014
(Audited) | | | Period Ended
April 30, 2015
(Unaudited) | | | Year Ended
October 31, 2014
(Audited) | |
| Operations: | | | | | | | | | | | | | | | | |
| Net Investment Income (Loss) | | $ | 276,451 | | | $ | 1,913,938 | | | $ | (11,340 | ) | | $ | 81,755 | |
| Net Realized Gain (Loss) on Investments and Foreign Currency Transactions(1) | | | (7,155,509 | ) | | | (2,704,977 | ) | | | 175,358 | | | | 134,132 | |
| Net Change in Unrealized Appreciation (Depreciation) on Investments and Foreign Currency Translation | | | 19,395,636 | | | | (22,387,593 | ) | | | 6,176 | | | | (382,964 | ) |
| Net Increase (Decrease) in Net Assets Resulting from Operations | | | 12,516,578 | | | | (23,178,632 | ) | | | 170,194 | | | | (167,077 | ) |
| Dividends and Distributions from: | | | | | | | | | | | | | | | | |
| Net Investment Income | | | (2,353,760 | ) | | | (1,981,753 | ) | | | (81,629 | ) | | | (85,026 | ) |
| Total Dividends and Distributions | | | (2,353,760 | ) | | | (1,981,753 | ) | | | (81,629 | ) | | | (85,026 | ) |
| Capital Share Transactions: | | | | | | | | | | | | | | | | |
| Issued | | | — | | | | 48,155,014 | | | | — | | | | 1,700,115 | |
| Redeemed | | | (28,765,921 | ) | | | (59,534,481 | ) | | | (1,486,119 | ) | | | (1,473,525 | ) |
| Increase (Decrease) in Net Assets from Capital Share Transactions | | | (28,765,921 | ) | | | (11,379,467 | ) | | | (1,486,119 | ) | | | 226,590 | |
| Total Decrease in Net Assets | | | (18,603,103 | ) | | | (36,539,852 | ) | | | (1,397,554 | ) | | | (25,513 | ) |
| Net Assets: | | | | | | | | | | | | | | | | |
| Beginning of Period | | | 134,014,036 | | | | 170,553,888 | | | | 4,508,837 | | | | 4,534,350 | |
| End of Period | | $ | 115,410,933 | | | $ | 134,014,036 | | | $ | 3,111,283 | | | $ | 4,508,837 | |
| Undistributed (Distributions in Excess of) Net Investment Income | | $ | (346,601 | ) | | $ | 1,730,708 | | | $ | (11,340 | ) | | $ | 81,629 | |
| Share Transactions: | | | | | | | | | | | | | | | | |
| Issued | | | — | | | | 3,050,000 | | | | — | | | | 100,000 | |
| Redeemed | | | (2,250,000 | ) | | | (4,100,000 | ) | | | (100,000 | ) | | | (100,000 | ) |
| Net Decrease in Shares Outstanding from Share Transactions | | | (2,250,000 | ) | | | (1,050,000 | ) | | | (100,000 | ) | | | — | |
| (1) | Includes realized gains (losses) as a result of in-kind transactions. (See Note 4 in Notes to Financial Statements). |
The accompanying notes are an integral part of the financial statements.
Statements of Changes in Net Assets
| | | Global X China Financials ETF | | | Global X China Industrials ETF | |
| | | Period Ended
April 30, 2015
(Unaudited) | | | Year Ended
October 31, 2014
(Audited) | | | Period Ended
April 30, 2015
(Unaudited) | | | Year Ended
October 31, 2014
(Audited) | |
| Operations: | | | | | | | | | | | | | | | | |
| Net Investment Income (Loss) | | $ | (145,014 | ) | | $ | 581,521 | | | $ | (16,824 | ) | | $ | 45,160 | |
| Net Realized Gain (Loss) on Investments and Foreign Currency Transactions(1) | | | 1,555,218 | | | | (2,274,890 | ) | | | 201,582 | | | | (488,702 | ) |
| Net Change in Unrealized Appreciation (Depreciation) on Investments and Foreign Currency Translation | | | 27,778,492 | | | | (2,627,366 | ) | | | 2,357,166 | | | | 713,362 | |
| Net Increase (Decrease) in Net Assets Resulting from Operations | | | 29,188,696 | | | | (4,320,735 | ) | | | 2,541,924 | | | | 269,820 | |
| Dividends and Distributions from: | | | | | | | | | | | | | | | | |
| Net Investment Income | | | (617,666 | ) | | | (243,282 | ) | | | (44,362 | ) | | | (65,300 | ) |
| Total Dividends and Distributions | | | (617,666 | ) | | | (243,282 | ) | | | (44,362 | ) | | | (65,300 | ) |
| Capital Share Transactions: | | | | | | | | | | | | | | | | |
| Issued | | | 45,839,534 | | | | 43,844,234 | | | | 4,716,298 | | | | 2,505,369 | |
| Redeemed | | | (5,395,227 | ) | | | (33,212,829 | ) | | | (1,315,823 | ) | | | (1,137,500 | ) |
| Increase in Net Assets from Capital Share Transactions | | | 40,444,307 | | | | 10,631,405 | | | | 3,400,475 | | | | 1,367,869 | |
| Total Increase in Net Assets | | | 69,015,337 | | | | 6,067,388 | | | | 5,898,037 | | | | 1,572,389 | |
| Net Assets: | | | | | | | | | | | | | | | | |
| Beginning of Period | | | 48,585,334 | | | | 42,517,946 | | | | 5,820,634 | | | | 4,248,245 | |
| End of Period | | $ | 117,600,671 | | | $ | 48,585,334 | | | $ | 11,718,671 | | | $ | 5,820,634 | |
| Undistributed (Distributions in Excess of) Net Investment Income | | $ | (181,686 | ) | | $ | 580,994 | | | $ | (21,734 | ) | | $ | 39,452 | |
| Share Transactions: | | | | | | | | | | | | | | | | |
| Issued | | | 2,850,000 | | | | 3,200,000 | | | | 250,000 | | | | 200,000 | |
| Redeemed | | | (350,000 | ) | | | (2,800,000 | ) | | | (100,000 | ) | | | (100,000 | ) |
| Net Increase in Shares Outstanding from Share Transactions | | | 2,500,000 | | | | 400,000 | | | | 150,000 | | | | 100,000 | |
| (1) | Includes realized gains (losses) as a result of in-kind transactions. (See Note 4 in Notes to Financial Statements). |
The accompanying notes are an integral part of the financial statements.
Statements of Changes in Net Assets
| | | Global X China Materials ETF | | | Global X NASDAQ China
Technology ETF | |
| | | Period Ended
April 30, 2015
(Unaudited) | | | Year Ended
October 31, 2014
(Audited) | | | Period Ended
April 30, 2015
(Unaudited) | | | Year Ended
October 31, 2014
(Audited) | |
| Operations: | | | | | | | | | | | | | | | | |
| Net Investment Income (Loss) | | $ | (7,529 | ) | | $ | 30,707 | | | $ | (23,205 | ) | | $ | 54,398 | |
| Net Realized Gain (Loss) on Investments and Foreign Currency Transactions(1) | | | (1,992 | ) | | | 116,946 | | | | 418,612 | | | | 222,294 | |
| Net Change in Unrealized Appreciation (Depreciation) on Investments and Foreign Currency Translation | | | 1,010,743 | | | | (240,082 | ) | | | 3,072,406 | | | | 1,408,514 | |
| Net Increase (Decrease) in Net Assets Resulting from Operations | | | 1,001,222 | | | | (92,429 | ) | | | 3,467,813 | | | | 1,685,206 | |
| Dividends and Distributions from: | | | | | | | | | | | | | | | | |
| Net Investment Income | | | (30,768 | ) | | | (36,867 | ) | | | (64,823 | ) | | | (3,666 | ) |
| Total Dividends and Distributions | | | (30,768 | ) | | | (36,867 | ) | | | (64,823 | ) | | | (3,666 | ) |
| Capital Share Transactions: | | | | | | | | | | | | | | | | |
| Issued | | | 3,895,748 | | | | 3,210,002 | | | | 1,073,252 | | | | 11,389,496 | |
| Redeemed | | | (747,647 | ) | | | (2,390,367 | ) | | | (4,320,529 | ) | | | (1,081,619 | ) |
| Increase (Decrease) in Net Assets from Capital Share Transactions | | | 3,148,101 | | | | 819,635 | | | | (3,247,277 | ) | | | 10,307,877 | |
| Total Increase in Net Assets | | | 4,118,555 | | | | 690,339 | | | | 155,713 | | | | 11,989,417 | |
| Net Assets: | | | | | | | | | | | | | | | | |
| Beginning of Period | | | 2,959,319 | | | | 2,268,980 | | | | 22,306,871 | | | | 10,317,454 | |
| End of Period | | $ | 7,077,874 | | | $ | 2,959,319 | | | $ | 22,462,584 | | | $ | 22,306,871 | |
| Undistributed (Distributions in Excess of) Net Investment Income | | $ | (7,529 | ) | | $ | 30,768 | | | $ | (33,726 | ) | | $ | 54,302 | |
| Share Transactions: | | | | | | | | | | | | | | | | |
| Issued | | | 200,000 | | | | 200,000 | | | | 50,000 | | | | 500,000 | |
| Redeemed | | | (50,000 | ) | | | (150,000 | ) | | | (200,000 | ) | | | (50,000 | ) |
| Net Increase (Decrease) in Shares Outstanding from Share Transactions | | | 150,000 | | | | 50,000 | | | | (150,000 | ) | | | 450,000 | |
| (1) | Includes realized gains (losses) as a result of in-kind transactions. (See Note 4 in Notes to Financial Statements). |
The accompanying notes are an integral part of the financial statements.
Statements of Changes in Net Assets
| | | Global X Southeast Asia ETF | | | Global X FTSE Andean 40 ETF | |
| | | Period Ended
April 30, 2015
(Unaudited) | | | Year Ended
October 31, 2014
(Audited) | | | Period Ended
April 30, 2015
(Unaudited) | | | Year Ended
October 31, 2014
(Audited) | |
| Operations: | | | | | | | | | | | | | | | | |
| Net Investment Income | | $ | 289,171 | | | $ | 782,192 | | | $ | 63,898 | | | $ | 162,703 | |
| Net Realized Loss on Investments and Foreign Currency Transactions(1) | | | (662,410 | ) | | | (1,187,065 | ) | | | (695,768 | ) | | | (783,510 | ) |
| Net Change in Unrealized Depreciation on Investments and Foreign Currency Translation | | | (316,026 | ) | | | (370,487 | ) | | | (319,758 | ) | | | (785,045 | ) |
| Net Decrease in Net Assets Resulting from Operations | | | (689,265 | ) | | | (775,360 | ) | | | (951,628 | ) | | | (1,405,852 | ) |
| Dividends and Distributions from: | | | | | | | | | | | | | | | | |
| Net Investment Income | | | (689,799 | ) | | | (1,423,135 | ) | | | (168,007 | ) | | | (153,480 | ) |
| Total Dividends and Distributions | | | (689,799 | ) | | | (1,423,135 | ) | | | (168,007 | ) | | | (153,480 | ) |
| Capital Share Transactions: | | | | | | | | | | | | | | | | |
| Issued | | | 1,664,730 | | | | 871,105 | | | | 432,012 | | | | 1,612,500 | |
| Redeemed | | | (7,168,290 | ) | | | (18,970,966 | ) | | | (919,686 | ) | | | (1,425,000 | ) |
| Increase (Decrease) in Net Assets from Capital Share Transactions | | | (5,503,560 | ) | | | (18,099,861 | ) | | | (487,674 | ) | | | 187,500 | |
| Total Decrease in Net Assets | | | (6,882,624 | ) | | | (20,298,356 | ) | | | (1,607,309 | ) | | | (1,371,832 | ) |
| Net Assets: | | | | | | | | | | | | | | | | |
| Beginning of Period | | | 29,335,963 | | | | 49,634,319 | | | | 9,010,458 | | | | 10,382,290 | |
| End of Period | | $ | 22,453,339 | | | $ | 29,335,963 | | | $ | 7,403,149 | | | $ | 9,010,458 | |
| Undistributed Net Investment Income | | $ | 240,681 | | | $ | 641,309 | | | $ | 36,110 | | | $ | 140,219 | |
| Share Transactions: | | | | | | | | | | | | | | | | |
| Issued | | | 100,000 | | | | 50,000 | | | | 50,000 | | | | 150,000 | |
| Redeemed | | | (450,000 | ) | | | (1,200,000 | ) | | | (100,000 | ) | | | (150,000 | ) |
| Net Decrease in Shares Outstanding from Share Transactions | | | (350,000 | ) | | | (1,150,000 | ) | | | (50,000 | ) | | | — | |
| (1) | Includes realized gains (losses) as a result of in-kind transactions. (See Note 4 in Notes to Financial Statements). |
The accompanying notes are an integral part of the financial statements.
Statements of Changes in Net Assets
| | | Global X MSCI Colombia ETF | | | Global X Brazil Mid Cap ETF | |
| | | Period Ended
April 30, 2015
(Unaudited) | | | Year Ended
October 31, 2014
(Audited) | | | Period Ended
April 30, 2015
(Unaudited) | | | Year Ended
October 31, 2014
(Audited) | |
| Operations: | | | | | | | | | | | | | | | | |
| Net Investment Income | | $ | 817,496 | | | $ | 2,347,157 | | | $ | 77,694 | | | $ | 272,879 | |
| Net Realized Loss on Investments and Foreign Currency Transactions(1) | | | (20,858,311 | ) | | | (1,311,327 | ) | | | (993,804 | ) | | | (484,122 | ) |
| Net Change in Unrealized Depreciation on Investments and Foreign Currency Translation | | | (4,240,216 | ) | | | (19,271,052 | ) | | | (495,185 | ) | | | (902,819 | ) |
| Net Decrease in Net Assets Resulting from Operations | | | (24,281,031 | ) | | | (18,235,222 | ) | | | (1,411,295 | ) | | | (1,114,062 | ) |
| Dividends and Distributions from: | | | | | | | | | | | | | | | | |
| Net Investment Income | | | (2,318,237 | ) | | | (4,567,150 | ) | | | (242,176 | ) | | | (531,843 | ) |
| Total Dividends and Distributions | | | (2,318,237 | ) | | | (4,567,150 | ) | | | (242,176 | ) | | | (531,843 | ) |
| Capital Share Transactions: | | | | | | | | | | | | | | | | |
| Issued | | | 36,171,850 | | | | 29,655,286 | | | | — | | | | — | |
| Redeemed | | | (5,482,128 | ) | | | (55,789,957 | ) | | | (1,357,642 | ) | | | (2,802,000 | ) |
| Increase (Decrease) in Net Assets from Capital Share Transactions | | | 30,689,722 | | | | (26,134,671 | ) | | | (1,357,642 | ) | | | (2,802,000 | ) |
| Total Increase (Decrease) in Net Assets | | | 4,090,454 | | | | (48,937,043 | ) | | | (3,011,113 | ) | | | (4,447,905 | ) |
| Net Assets: | | | | | | | | | | | | | | | | |
| Beginning of Period | | | 100,687,511 | | | | 149,624,554 | | | | 7,942,263 | | | | 12,390,168 | |
| End of Period | | $ | 104,777,965 | | | $ | 100,687,511 | | | $ | 4,931,150 | | | $ | 7,942,263 | |
| Undistributed (Distributions in Excess of) Net Investment Income | | $ | (335,600 | ) | | $ | 1,165,141 | | | $ | 44,909 | | | $ | 209,391 | |
| Share Transactions: | | | | | | | | | | | | | | | | |
| Issued | | | 3,150,000 | | | | 1,550,000 | | | | — | | | | — | |
| Redeemed | | | (450,000 | ) | | | (3,050,000 | ) | | | (150,000 | ) | | | (200,000 | ) |
| Net Increase (Decrease) in Shares Outstanding from Share Transactions | | | 2,700,000 | | | | (1,500,000 | ) | | | (150,000 | ) | | | (200,000 | ) |
| (1) | Includes realized gains (losses) as a result of in-kind transactions. (See Note 4 in Notes to Financial Statements). |
The accompanying notes are an integral part of the financial statements.
Statements of Changes in Net Assets
| | | Global X Brazil Consumer ETF | | | Global X Brazil Financials ETF | |
| | | Period Ended
April 30, 2015
(Unaudited) | | | Year Ended
October 31, 2014
(Audited) | | | Period Ended
April 30, 2015
(Unaudited) | | | Year Ended
October 31, 2014
(Audited) | |
| Operations: | | | | | | | | | | | | | | | | |
| Net Investment Income | | $ | 52,154 | | | $ | 269,976 | | | $ | 14,115 | | | $ | 117,679 | |
| Net Realized Gain (Loss) on Investments and Foreign Currency Transactions | | | (532,597 | )(1) | | | 146,889 | (1) | | | (716,922 | )(1) | | | (147,279 | ) |
| Net Change in Unrealized Appreciation (Depreciation) on Investments and Foreign Currency Translation | | | (1,373,047 | ) | | | (1,193,505 | ) | | | 364,238 | | | | (209,239 | ) |
| Net Decrease in Net Assets Resulting from Operations | | | (1,853,490 | ) | | | (776,640 | ) | | | (338,569 | ) | | | (238,839 | ) |
| Dividends and Distributions from: | | | | | | | | | | | | | | | | |
| Net Investment Income | | | (240,597 | ) | | | (185,072 | ) | | | (118,836 | ) | | | (22,454 | ) |
| Total Dividends and Distributions | | | (240,597 | ) | | | (185,072 | ) | | | (118,836 | ) | | | (22,454 | ) |
| Capital Share Transactions: | | | | | | | | | | | | | | | | |
| Issued | | | — | | | | — | | | | 397,849 | | | | 555,500 | |
| Redeemed | | | (1,281,271 | ) | | | (7,882,187 | ) | | | (1,411,074 | ) | | | — | |
| Increase (Decrease) in Net Assets from Capital Share Transactions | | | (1,281,271 | ) | | | (7,882,187 | ) | | | (1,013,225 | ) | | | 555,500 | |
| Total Increase (Decrease) in Net Assets | | | (3,375,358 | ) | | | (8,843,899 | ) | | | (1,470,630 | ) | | | 294,207 | |
| Net Assets: | | | | | | | | | | | | | | | | |
| Beginning of Period | | | 9,942,650 | | | | 18,786,549 | | | | 2,718,963 | | | | 2,424,756 | |
| End of Period | | $ | 6,567,292 | | | $ | 9,942,650 | | | $ | 1,248,333 | | | $ | 2,718,963 | |
| Undistributed Net Investment Income | | $ | 50,300 | | | $ | 238,743 | | | $ | 8,647 | | | $ | 113,368 | |
| Share Transactions: | | | | | | | | | | | | | | | | |
| Issued | | | — | | | | — | | | | 50,000 | | | | 50,000 | |
| Redeemed | | | (100,000 | ) | | | (450,000 | ) | | | (150,000 | ) | | | — | |
| Net Increase (Decrease) in Shares Outstanding from Share Transactions | | | (100,000 | ) | | | (450,000 | ) | | | (100,000 | ) | | | 50,000 | |
| (1) | Includes realized gains (losses) as a result of in-kind transactions. (See Note 4 in Notes to Financial Statements). |
The accompanying notes are an integral part of the financial statements.
Statements of Changes in Net Assets
| | | Global X MSCI Argentina ETF | | | Global X FTSE Greece 20 ETF | |
| | | Period Ended
April 30, 2015
(Unaudited) | | | Year Ended
October 31, 2014
(Audited) | | | Period Ended
April 30, 2015
(Unaudited) | | | Year Ended
October 31, 2014
(Audited) | |
| Operations: | | | | | | | | | | | | | | | | |
| Net Investment Income | | $ | 30,230 | | | $ | 69,027 | | | $ | 1,233,215 | | | $ | 747,129 | |
| Net Realized Gain (Loss) on Investments and Foreign Currency Transactions(1) | | | (344,200 | ) | | | 216,289 | | | | (58,802,336 | ) | | | 3,451,956 | |
| Net Change in Unrealized Appreciation (Depreciation) on Investments and Foreign Currency Translation | | | 620,525 | | | | (1,390,959 | ) | | | 29,284,689 | | | | (88,239,623 | ) |
| Net Increase (Decrease) in Net Assets Resulting from Operations | | | 306,555 | | | | (1,105,643 | ) | | | (28,284,432 | ) | | | (84,040,538 | ) |
| Dividends and Distributions from: | | | | | | | | | | | | | | | | |
| Net Investment Income | | | (90,100 | ) | | | (45,738 | ) | | | (956,353 | ) | | | (53,067 | ) |
| Net Realized Gains | | | — | | | | — | | | | — | | | | (99,419 | ) |
| Total Dividends and Distributions | | | (90,100 | ) | | | (45,738 | ) | | | (956,353 | ) | | | (152,486 | ) |
| Capital Share Transactions: | | | | | | | | | | | | | | | | |
| Issued | | | 4,191,156 | | | | 33,130,182 | | | | 224,402,029 | | | | 365,866,512 | |
| Redeemed | | | (4,829,135 | ) | | | (17,921,744 | ) | | | (46,414,196 | ) | | | (236,410,164 | ) |
| Increase (Decrease) in Net Assets from Capital Share Transactions | | | (637,979 | ) | | | 15,208,438 | | | | 177,987,833 | | | | 129,456,348 | |
| Total Increase (Decrease) in Net Assets | | | (421,524 | ) | | | 14,057,057 | | | | 148,747,048 | | | | 45,263,324 | |
| Net Assets: | | | | | | | | | | | | | | | | |
| Beginning of Period | | | 20,652,247 | | | | 6,595,190 | | | | 140,201,261 | | | | 94,937,937 | |
| End of Period | | $ | 20,230,723 | | | $ | 20,652,247 | | | $ | 288,948,309 | | | $ | 140,201,261 | |
| Undistributed (Distributions in Excess of) Net Investment Income | | $ | (28,842 | ) | | $ | 31,028 | | | $ | 983,987 | | | $ | 707,125 | |
| Share Transactions: | | | | | | | | | | | | | | | | |
| Issued | | | 200,000 | | | | 1,500,000 | | | | 18,150,000 | | | | 16,150,000 | |
| Redeemed | | | (250,000 | ) | | | (850,000 | ) | | | (3,150,000 | ) | | | (11,500,000 | ) |
| Net Increase (Decrease) in Shares Outstanding from Share Transactions | | | (50,000 | ) | | | 650,000 | | | | 15,000,000 | | | | 4,650,000 | |
| (1) | Includes realized gains (losses) as a result of in-kind transactions. (See Note 4 in Notes to Financial Statements). |
The accompanying notes are an integral part of the financial statements.
Statements of Changes in Net Assets
| | | Global X MSCI Norway ETF | | | Global X FTSE Nordic Region ETF | |
| | | Period Ended
April 30, 2015
(Unaudited) | | | Year Ended
October 31, 2014
(Audited) | | | Period Ended
April 30, 2015
(Unaudited) | | | Year Ended
October 31, 2014
(Audited) | |
| Operations: | | | | | | | | | | | | | | | | |
| Net Investment Income | | $ | 1,363,371 | | | $ | 4,715,125 | | | $ | 1,276,616 | | | $ | 1,941,897 | |
| Net Realized Gain (Loss) on Investments and Foreign Currency Transactions(1) | | | (21,533,063 | ) | | | 1,465,465 | | | | (318,301 | ) | | | 3,135,947 | |
| Net Change in Unrealized Appreciation (Depreciation) on Investments and Foreign Currency Translation | | | 7,023,769 | | | | (35,374,857 | ) | | | 1,167,316 | | | | (2,958,708 | ) |
| Net Increase (Decrease) in Net Assets Resulting from Operations | | | (13,145,923 | ) | | | (29,194,267 | ) | | | 2,125,631 | | | | 2,119,136 | |
| Dividends and Distributions from: | | | | | | | | | | | | | | | | |
| Net Investment Income | | | (4,921,308 | ) | | | (2,012,342 | ) | | | (2,045,741 | ) | | | (1,480,041 | ) |
| Total Dividends and Distributions | | | (4,921,308 | ) | | | (2,012,342 | ) | | | (2,045,741 | ) | | | (1,480,041 | ) |
| Capital Share Transactions: | | | | | | | | | | | | | | | | |
| Issued | | | 28,942,603 | | | | 157,097,512 | | | | — | | | | 13,753,500 | |
| Redeemed | | | (100,453,822 | ) | | | (23,318,063 | ) | | | (3,623,030 | ) | | | (10,480,721 | ) |
| Increase (Decrease) in Net Assets from Capital Share Transactions | | | (71,511,219 | ) | | | 133,779,449 | | | | (3,623,030 | ) | | | 3,272,779 | |
| Total Increase (Decrease) in Net Assets | | | (89,578,450 | ) | | | 102,572,840 | | | | (3,543,140 | ) | | | 3,911,874 | |
| Net Assets: | | | | | | | | | | | | | | | | |
| Beginning of Period | | | 183,037,614 | | | | 80,464,774 | | | | 59,926,553 | | | | 56,014,679 | |
| End of Period | | $ | 93,459,164 | | | $ | 183,037,614 | | | $ | 56,383,413 | | | $ | 59,926,553 | |
| Undistributed Net Investment Income | | $ | 884,737 | | | $ | 4,442,674 | | | $ | 926,646 | | | $ | 1,695,771 | |
| Share Transactions: | | | | | | | | | | | | | | | | |
| Issued | | | 2,200,000 | | | | 9,000,000 | | | | — | | | | 550,000 | |
| Redeemed | | | (7,450,000 | ) | | | (1,450,000 | ) | | | (150,000 | ) | | | (450,000 | ) |
| Net Increase (Decrease) in Shares Outstanding from Share Transactions | | | (5,250,000 | ) | | | 7,550,000 | | | | (150,000 | ) | | | 100,000 | |
| (1) | Includes realized gains (losses) as a result of in-kind transactions. (See Note 4 in Notes to Financial Statements). |
The accompanying notes are an integral part of the financial statements.
Statements of Changes in Net Assets
| | | Global X Central Asia & Mongolia
Index ETF | | | Global X MSCI Nigeria ETF | |
| | | Period Ended
April 30, 2015
(Unaudited) | | | Year Ended
October 31, 2014
(Audited) | | | Period Ended
April 30, 2015
(Unaudited) | | | Year Ended
October 31, 2014
(Audited) | |
| Operations: | | | | | | | | | | | | | | | | |
| Net Investment Income | | $ | 36,827 | | | $ | 61,207 | | | $ | 657,091 | | | $ | 443,264 | |
| Net Realized Loss on Investments and Foreign Currency Transactions | | | (244,337 | ) | | | (150,731 | ) | | | (1,421,180 | ) | | | (1,146,397 | ) |
| Net Change in Unrealized Appreciation (Depreciation) on Investments and Foreign Currency Translation | | | 15,238 | | | | (168,755 | ) | | | (1,324,077 | ) | | | (1,689,895 | ) |
| Net Decrease in Net Assets Resulting from Operations | | | (192,272 | ) | | | (258,279 | ) | | | (2,088,166 | ) | | | (2,393,028 | ) |
| Dividends and Distributions from: | | | | | | | | | | | | | | | | |
| Net Investment Income | | | (63,072 | ) | | | (52,316 | ) | | | (505,211 | ) | | | (76,054 | ) |
| Net Realized Gains | | | — | | | | — | | | | — | | | | (16,784 | ) |
| Total Dividends and Distributions | | | (63,072 | ) | | | (52,316 | ) | | | (505,211 | ) | | | (92,838 | ) |
| Capital Share Transactions: | | | | | | | | | | | | | | | | |
| Issued | | | 484,094 | | | | 1,394,002 | | | | 18,063,382 | | | | 14,117,633 | |
| Redeemed | | | — | | | | — | | | | — | | | | (677,320 | ) |
| Increase in Net Assets from Capital Share Transactions | | | 484,094 | | | | 1,394,002 | | | | 18,063,382 | | | | 13,440,313 | |
| Total Increase in Net Assets | | | 228,750 | | | | 1,083,407 | | | | 15,470,005 | | | | 10,954,447 | |
| Net Assets: | | | | | | | | | | | | | | | | |
| Beginning of Period | | | 2,457,033 | | | | 1,373,626 | | | | 16,923,981 | | | | 5,969,534 | |
| End of Period | | $ | 2,685,783 | | | $ | 2,457,033 | | | $ | 32,393,986 | | | $ | 16,923,981 | |
| Undistributed Net Investment Income | | $ | 28,697 | | | $ | 54,942 | | | $ | 535,797 | | | $ | 383,917 | |
| Share Transactions: | | | | | | | | | | | | | | | | |
| Issued | | | 50,000 | | | | 100,000 | | | | 1,900,000 | | | | 950,000 | |
| Redeemed | | | — | | | | — | | | | — | | | | (50,000 | ) |
| Net Increase in Shares Outstanding from Share Transactions | | | 50,000 | | | | 100,000 | | | | 1,900,000 | | | | 900,000 | |
The accompanying notes are an integral part of the financial statements.
Statements of Changes in Net Assets
| | | Global X Next Emerging
& Frontier ETF | | | Global X FTSE Portugal 20 ETF | | | Global X MSCI
Pakistan ETF | |
| | | Period Ended
April 30, 2015
(Unaudited) | | | Period Ended
October 31, 2014(1)
(Audited) | | | Period Ended
April 30, 2015
(Unaudited) | | | Period Ended
October 31, 2014(2)
(Audited) | | | Period Ended
April 30, 2015(3)
(Unaudited) | |
| Operations: | | | | | | | | | | | | | | | | | | | | |
| Net Investment Income (Loss) | | $ | 1,655,110 | | | $ | 1,853,596 | | | $ | (59,986 | ) | | $ | 574,014 | | | $ | 1,161 | |
| Net Realized Gain (Loss) on Investments and Foreign Currency Transactions | | | (403,886 | )(4) | | | (238,800 | )(4) | | | (1,957,728 | )(4) | | | (1,289,384 | )(4) | | | 11,857 | |
| Net Change in Unrealized Appreciation (Depreciation) on Investments and Foreign Currency Translation | | | (11,732,025 | ) | | | (2,082,587 | ) | | | 2,819,100 | | | | (8,128,731 | ) | | | (7,174 | ) |
| Net Increase (Decrease) in Net Assets Resulting from Operations | | | (10,480,801 | ) | | | (467,791 | ) | | | 801,386 | | | | (8,844,101 | ) | | | 5,844 | |
| Dividends and Distributions from: | | | | | | | | | | | | | | | | | | | | |
| Net Investment Income | | | (2,316,518 | ) | | | (28,312 | ) | | | (575,663 | ) | | | — | | | | — | |
| Total Dividends and Distributions | | | (2,316,518 | ) | | | (28,312 | ) | | | (575,663 | ) | | | — | | | | — | |
| Capital Share Transactions: | | | | | | | | | | | | | | | | | | | | |
| Issued | | | — | | | | 156,318,000 | | | | 19,215,261 | | | | 53,026,360 | | | | 2,292,116 | |
| Redeemed | | | (5,980,712 | ) | | | (3,794,788 | ) | | | (10,372,196 | ) | | | (7,490,738 | ) | | | — | |
| Increase (Decrease) in Net Assets from Capital Share Transactions | | | (5,980,712 | ) | | | 152,523,212 | | | | 8,843,065 | | | | 45,535,622 | | | | 2,292,116 | |
| Total Increase (Decrease) in Net Assets | | | (18,778,031 | ) | | | 152,027,109 | | | | 9,068,788 | | | | 36,691,521 | | | | 2,297,960 | |
| Net Assets: | | | | | | | | | | | | | | | | | | | | |
| Beginning of Period | | | 152,027,109 | | | | — | | | | 36,691,521 | | | | — | | | | — | |
| End of Period | | $ | 133,249,078 | | | $ | 152,027,109 | | | $ | 45,760,309 | | | $ | 36,691,521 | | | $ | 2,297,960 | |
| Undistributed (Distributions in Excess of) Net Investment Income | | $ | 1,114,023 | | | $ | 1,775,431 | | | $ | (59,985 | ) | | $ | 575,664 | | | $ | 1,161 | |
| Share Transactions: | | | | | | | | | | | | | | | | | | | | |
| Issued | | | — | | | | 6,100,000 | | | | 1,700,000 | | | | 3,450,000 | | | | 150,000 | |
| Redeemed | | | (250,000 | ) | | | (150,000 | ) | | | (900,000 | ) | | | (550,000 | ) | | | — | |
| Net Increase (Decrease) in Shares Outstanding from Share Transactions | | | (250,000 | ) | | | 5,950,000 | | | | 800,000 | | | | 2,900,000 | | | | 150,000 | |
| (1) | Commenced operations on November 6, 2013. |
| (2) | Commenced operations on November 12, 2013. |
| (3) | Commenced operations on April 22, 2015. |
| (4) | Includes realized gains(losses) as a result of in-kind transactions. (See Note 4 in Notes to Financial Statements.) |
The accompanying notes are an integral part of the financial statements.
Financial Highlights
Selected Per Share Data & Ratios
For a Share Outstanding Throughout the Period
| | | Net Asset
Value,
Beginning
of Period
($) | | | Net
Investment
Income
(Loss) ($)* | | | Net Realized
and
Unrealized
Gain (Loss)
on
Investments
($) | | | Total from
Operations
($) | | | Distribution
from Net
Investment
Income ($) | | | Distribution
from
Capital
Gains ($) | | | Total from
Distributions
($) | | | Net
Asset
Value,
End of
Period
($) | | | Total
Return
(%)** | | | Net
Assets
End of
Period
($)(000) | | | Ratio of
Expenses
to
Average
Net
Assets
(%) | | | Ratio of Net
Investment
Income
(Loss) to
Average
Net Assets
(%) | | | Portfolio
Turnover
(%) | |
| Global X China Consumer ETF | | | | | | | | | | | | | | | | | | | | | | | | | | | | | | | | | | | | | |
| 2015(Unaudited) | | | 13.82 | | | | 0.03 | | | | 1.90 | | | | 1.93 | | | | (0.26 | ) | | | — | | | | (0.26 | ) | | | 15.49 | | | | 14.41 | | | | 115,411 | | | | 0.65 | † | | | 0.49 | † | | | 27.76 | †† |
| 2014 | | | 15.87 | | | | 0.17 | | | | (2.07 | ) | | | (1.90 | ) | | | (0.15 | ) | | | — | | | | (0.15 | ) | | | 13.82 | | | | (12.09 | ) | | | 134,014 | | | | 0.65 | | | | 1.18 | | | | 18.89 | |
| 2013 | | | 14.00 | | | | 0.16 | | | | 1.88 | | | | 2.04 | | | | (0.17 | ) | | | — | | | | (0.17 | ) | | | 15.87 | | | | 14. 66 | | | | 170,554 | | | | 0.65 | | | | 1.11 | | | | 27.76 | |
| 2012 | | | 15.29 | | | | 0.24 | | | | (1.47 | ) | | | (1.23 | ) | | | (0.06 | ) | | | — | | | | (0.06 | ) | | | 14.00 | | | | (8.06 | ) | | | 126,715 | | | | 0.65 | | | | 1.73 | | | | 17.32 | |
| 2011 | | | 20.33 | | | | 0.17 | | | | (5.02 | ) | | | (4.85 | ) | | | (0.19 | ) | | | — | | | | (0.19 | ) | | | 15.29 | | | | (23.99 | ) | | | 136,858 | | | | 0.65 | | | | 0.98 | | | | 12.37 | |
| 2010(1) | | | 15.65 | | | | 0.17 | | | | 4.51 | | | | 4.68 | | | | — | | | | — | | | | — | | | | 20.33 | | | | 29.90 | | | | 174,875 | | | | 0.65 | † | | | 1.03 | † | | | 3.91 | †† |
| Global X China Energy ETF | | | | | | | | | | | | | | | | | | | | | | | | | | | | | | | | | | | | | | | | |
| 2015(Unaudited) | | | 15.03 | | | | (0.04 | ) | | | 0.90 | | | | 0.86 | | | | (0.33 | ) | | | — | | | | (0.33 | ) | | | 15.56 | | | | 6.03 | | | | 3,111 | | | | 0.65 | † | | | (0.66 | )† | | | 24.41 | †† |
| 2014 | | | 15.11 | | | | 0.29 | | | | (0.09 | ) | | | 0.20 | | | | (0.28 | ) | | | — | | | | (0.28 | ) | | | 15.03 | | | | 1.34 | | | | 4,509 | | | | 0.65 | | | | 1.90 | | | | 12.65 | |
| 2013 | | | 13.76 | | | | 0.26 | | | | 1.34 | | | | 1.60 | | | | (0.25 | ) | | | — | | | | (0.25 | ) | | | 15.11 | | | | 11.72 | | | | 4,534 | | | | 0.65 | | | | 1.82 | | | | 24.41 | |
| 2012 | | | 13.78 | | | | 0.25 | | | | (0.01 | ) | | | 0.24 | | | | (0.26 | ) | | | — | | | | (0.26 | ) | | | 13.76 | | | | 1.87 | | | | 4,816 | | | | 0.65 | | | | 1.85 | | | | 17.22 | |
| 2011 | | | 15.72 | | | | 0.27 | | | | (2.07 | ) | | | (1.80 | ) | | | (0.14 | ) | | | — | | | | (0.14 | ) | | | 13.78 | | | | (11.57 | ) | | | 4,822 | | | | 0.65 | | | | 1.70 | | | | 11.39 | |
| 2010(2) | | | 15.02 | | | | 0.23 | | | | 0.47 | | | | 0.70 | | | | — | | | | — | | | | — | | | | 15.72 | | | | 4.66 | | | | 4,717 | | | | 0.65 | † | | | 1.80 | † | | | 20.55 | †† |
| Global X China Financials ETF | | | | | | | | | | | | | | | | | | | | | | | | | | | | | | | | | | | | | | | | | | | | |
| 2015(Unaudited) | | | 13.50 | | | | (0.03 | ) | | | 5.97 | | | | 5.94 | | | | (0.16 | ) | | | — | | | | (0.16 | ) | | | 19.28 | | | | 44.27 | | | | 117,601 | | | | 0.65 | † | | | (0.37 | )† | | | 33.49 | †† |
| 2014 | | | 13.29 | | | | 0.23 | | | | 0.05 | ^ | | | 0.28 | | | | (0.07 | ) | | | — | | | | (0.07 | ) | | | 13.50 | | | | 2.08 | | | | 48,585 | | | | 0.65 | | | | 1.76 | | | | 6.90 | |
| 2013 | | | 12.03 | | | | 0.27 | | | | 1.36 | | | | 1.63 | | | | (0.37 | ) | | | — | | | | (0.37 | ) | | | 13.29 | | | | 13.61 | | | | 42,518 | | | | 0.65 | | | | 2.09 | | | | 33.49 | |
| 2012 | | | 10.92 | | | | 0.20 | | | | 0.92 | | | | 1.12 | | | | (0.01 | ) | | | — | | | | (0.01 | ) | | | 12.03 | | | | 10.28 | | | | 6,013 | | | | 0.65 | | | | 1.76 | | | | 14.02 | |
| 2011 | | | 14.77 | | | | 0.03 | | | | (3.56 | ) | | | (3.53 | ) | | | (0.32 | ) | | | — | | | | (0.32 | ) | | | 10.92 | | | | (24.29 | ) | | | 10,924 | | | | 0.65 | | | | 0.25 | | | | 41.54 | |
| 2010(3) | | | 14.90 | | | | 0.27 | | | | (0.40 | ) | | | (0.13 | ) | | | — | | | | — | | | | — | | | | 14.77 | | | | (0.87 | ) | | | 70,158 | | | | 0.65 | † | | | 2.26 | † | | | 14.42 | †† |
| Global X China Industrials ETF | | | | | | | | | | | | | | | | | | | | | | | | | | | | | | | | | | | | | | | | | | | | |
| 2015(Unaudited) | | | 12.93 | | | | (0.04 | ) | | | 6.74 | | | | 6.70 | | | | (0.10 | ) | | | — | | | | (0.10 | ) | | | 19.53 | | | | 52.14 | | | | 11,719 | | | | 0.65 | † | | | (0.55 | )† | | | 19.01 | †† |
| 2014 | | | 12.14 | | | | 0.15 | | | | 0.83 | | | | 0.98 | | | | (0.19 | ) | | | — | | | | (0.19 | ) | | | 12.93 | | | | 8.13 | | | | 5,821 | | | | 0.65 | | | | 1.24 | | | | 10.61 | |
| 2013 | | | 11.40 | | | | 0.15 | | | | 0.75 | | | | 0.90 | | | | (0.16 | ) | | | — | | | | (0.16 | ) | | | 12.14 | | | | 7.89 | | | | 4,248 | | | | 0.65 | | | | 1.28 | | | | 19.01 | |
| 2012 | | | 11.39 | | | | 0.16 | | | | (0.13 | ) | | | 0.03 | | | | (0.02 | ) | | | — | | | | (0.02 | ) | | | 11.40 | | | | 0.30 | | | | 4,561 | | | | 0.65 | | | | 1.48 | | | | 23.00 | |
| 2011 | | | 17.13 | | | | 0.13 | | | | (5.64 | ) | | | (5.51 | ) | | | (0.23 | ) | | | — | | | | (0.23 | ) | | | 11.39 | | | | (32.56 | ) | | | 4,558 | | | | 0.65 | | | | 0.88 | | | | 20.13 | |
| 2010(1) | | | 15.50 | | | | 0.08 | | | | 1.55 | | | | 1.63 | | | | — | | | | — | | | | — | | | | 17.13 | | | | 10.52 | | | | 12,850 | | | | 0.65 | † | | | 0.61 | † | | | 12.74 | †† |
| Global X China Materials ETF | | | | | | | | | | | | | | | | | | | | | | | | | | | | | | | | | | | | | | | | | | | | |
| 2015(Unaudited) | | | 14.80 | | | | (0.04 | ) | | | 5.67 | | | | 5.63 | | | | (0.21 | ) | | | — | | | | (0.21 | ) | | | 20.22 | | | | 38.53 | | | | 7,078 | | | | 0.65 | † | | | (0.55 | )† | | | 31.07 | †† |
| 2014 | | | 15.13 | | | | 0.19 | | | | (0.27 | ) | | | (0.08 | ) | | | (0.25 | ) | | | — | | | | (0.25 | ) | | | 14.80 | | | | (0.57 | ) | | | 2,959 | | | | 0.65 | | | | 1.26 | | | | 13.51 | |
| 2013(4) | | | 16.28 | | | | 0.17 | | | | (1.05 | ) | | | (0.88 | ) | | | (0.27 | ) | | | — | | | | (0.27 | ) | | | 15.13 | | | | (5.63 | ) | | | 2,269 | | | | 0.65 | | | | 1.65 | | | | 31.07 | |
| 2012(4) | | | 19.16 | | | | 0.25 | | | | (3.13 | ) | | | (2.88 | ) | | | — | | | | — | | | | — | | | | 16.28 | | | | (15.03 | ) | | | 2,441 | | | | 0.65 | | | | 1.50 | | | | 50.30 | |
| 2011(4) | | | 29.18 | | | | 0.01 | | | | (9.74 | ) | | | (9.73 | ) | | | (0.29 | ) | | | — | | | | (0.29 | ) | | | 19.16 | | | | (33.69 | ) | | | 2,875 | | | | 0.65 | | | | 0.05 | | | | 36.82 | |
| 2010(4)(5) | | | 29.90 | | | | 0.05 | | | | (0.77 | ) | | | (0.72 | ) | | | — | | | | — | | | | — | | | | 29.18 | | | | (2.41 | ) | | | 57,642 | | | | 0.65 | † | | | 0.23 | † | | | 6.13 | †† |
| Global X NASDAQ China Technology ETF | | | | | | | | | | | | | | | | | | | | | | | | | | | | | | | | | | | | | | | | |
| 2015(Unaudited) | | | 23.48 | | | | (0.03 | ) | | | 4.70 | | | | 4.67 | | | | (0.07 | ) | | | — | | | | (0.07 | ) | | | 28.08 | | | | 19.99 | | | | 22,463 | | | | 0.65 | † | | | (0.24 | )† | | | 57.24 | †† |
| 2014 | | | 20.63 | | | | 0.06 | | | | 2.80 | | | | 2.86 | | | | (0.01 | ) | | | — | | | | (0.01 | ) | | | 23.48 | | | | 13.85 | | | | 22,307 | | | | 0.65 | | | | 0.29 | | | | 64.79 | |
| 2013 | | | 13.77 | | | | 0.02 | | | | 6.92 | | | | 6.94 | | | | (0.08 | ) | | | — | | | | (0.08 | ) | | | 20.63 | | | | 50.68 | | | | 10,317 | | | | 0.65 | | | | 0.14 | | | | 57.24 | |
| 2012 | | | 15.38 | | | | 0.05 | | | | (1.47 | ) | | | (1.42 | ) | | | (0.19 | ) | | | — | | | | (0.19 | ) | | | 13.77 | | | | (9.17 | ) | | | 2,754 | | | | 0.65 | | | | 0.35 | | | | 53.45 | |
| 2011 | | | 17.21 | | | | 0.38 | | | | (2.05 | ) | | | (1.67 | ) | | | (0.03 | ) | | | (0.13 | ) | | | (0.16 | ) | | | 15.38 | | | | (9.81 | ) | | | 4,614 | | | | 0.65 | | | | 2.26 | | | | 16.79 | |
| 2010(6) | | | 14.90 | | | | 0.03 | | | | 2.28 | | | | 2.31 | | | | — | | | | — | | | | — | | | | 17.21 | | | | 15.50 | | | | 4,301 | | | | 0.65 | † | | | 0.24 | † | | | 5.15 | †† |
| Global X Southeast Asia ETF | | | | | | | | | | | | | | | | | | | | | | | | | | | | | | | | | | | | | | | | | | | | |
| 2015(Unaudited) | | | 16.76 | | | | 0.18 | | | | (0.48 | ) | | | (0.30 | ) | | | (0.42 | ) | | | — | | | | (0.42 | ) | | | 16.04 | | | | (1.78 | ) | | | 22,453 | | | | 0.65 | † | | | 2.29 | † | | | 24.07 | †† |
| 2014 | | | 17.12 | | | | 0.39 | | | | (0.16 | ) | | | 0.23 | | | | (0.59 | ) | | | — | | | | (0.59 | ) | | | 16.76 | | | | 1.68 | | | | 29,336 | | | | 0.65 | | | | 2.36 | | | | 8.36 | |
| 2013 | | | 16.75 | | | | 0.47 | | | | 0.28 | ^ | | | 0.75 | | | | (0.38 | ) | | | — | | | | (0.38 | ) | | | 17.12 | | | | 4.50 | | | | 49,634 | | | | 0.65 | | | | 2.73 | | | | 24.07 | |
| 2012 | | | 15.51 | | | | 0.51 | | | | 1.10 | | | | 1.61 | | | | (0.37 | ) | | | — | | | | (0.37 | ) | | | 16.75 | | | | 10.77 | | | | 32,656 | | | | 0.65 | | | | 3.23 | | | | 9.69 | |
| 2011(7) | | | 15.08 | | | | 0.38 | | | | 0.05 | | | | 0.43 | | | | — | | | | — | | | | — | | | | 15.51 | | | | 2.85 | | | | 23,262 | | | | 0.62 | † | | | 3.46 | † | | | 2.68 | †† |
| (1) | The Fund commenced operations on November 30, 2009. |
| (2) | The Fund commenced operations on December 15, 2009. |
| (3) | The Fund commenced operations on December 10, 2009. |
| (4) | Per share amounts have been restated for a 1 for 2 reverse share split. See Note 7 in the Notes to Financial Statements. |
| (5) | The Fund commenced operations on January 12, 2010. |
| (6) | The Fund commenced operations on December 8, 2009. |
| (7) | The Fund commenced operations on February 16, 2011. |
| ^ | The amount shown for a share outstanding throughout the period does not accord with the aggregate net gains on investments for the period because of the sales and repurchases of fund shares in relation to fluctuating market value of the investments of the Fund. |
| * | Per share data calculated using average shares method. |
| ** | Total Return is for the period indicated and has not been annualized. The return shown does not reflect the deduction of taxes that a shareholder would pay on Fund distributions or the redemption of Fund shares. |
| † | Annualized. |
| †† | Portfolio turnover rate is for the period indicated and has not been annualized. Excludes effect of in-kind transfers. |
Amounts designated as “—” are either $0 or have been rounded to $0.
The accompanying notes are an integral part of the financial statements.
Financial Highlights
Selected Per Share Data & Ratios
For a Share Outstanding Throughout the Period
| | | Net Asset
Value,
Beginning
of Period
($) | | | Net
Investment
Income
($)* | | | Net
Realized
and
Unrealized
Gain (Loss)
on
Investments
($) | | | Total from Operations ($) | | | Distribution from Net Investment Income ($) | | | Distribution from Capital Gains ($) | | | Total from Distributions ($) | | | Net Asset
Value,
End of
Period
($) | | | Total
Return
(%)** | | | Net
Assets
End of
Period
($)(000) | | | Ratio of
Expenses
to
Average
Net
Assets
(%) | | | Ratio of
Net
Investment
Income to
Average
Net Assets
(%) | | | Portfolio
Turnover
(%) | |
| Global X FTSE Andean 40 ETF | | | | | | | | | | | | | | | | | | | | | | | | | | | | | | | | | | | | | | | | | | | | |
| 2015(Unaudited) | | | 10.60 | | | | 0.08 | | | | (1.23 | ) | | | (1.15 | ) | | | (0.20 | ) | | | — | | | | (0.20 | ) | | | 9.25 | | | | (10.86 | ) | | | 7,403 | | | | 0.72 | † | | | 1.77 | † | | | 22.05 | †† |
| 2014 | | | 12.21 | | | | 0.19 | | | | (1.63 | ) | | | (1.44 | ) | | | (0.17 | ) | | | — | | | | (0.17 | ) | | | 10.60 | | | | (11.84 | ) | | | 9,010 | | | | 0.72 | | | | 1.71 | | | | 19.94 | |
| 2013 | | | 14.37 | | | | 0.23 | | | | (2.13 | ) | | | (1.90 | ) | | | (0.26 | ) | | | — | | | | (0.26 | ) | | | 12.21 | | | | (13.52 | ) | | | 10,382 | | | | 0.72 | | | | 1.71 | | | | 22.05 | |
| 2012 | | | 13.61 | | | | 0.23 | | | | 0.77 | | | | 1.00 | | | | (0.24 | ) | | | — | | | | (0.24 | ) | | | 14.37 | | | | 7.63 | | | | 8,620 | | | | 0.72 | | | | 1.65 | | | | 25.80 | |
| 2011(1) | | | 14.88 | | | | 0.19 | | | | (1.46 | ) | | | (1.27 | ) | | | — | | | | — | | | | — | | | | 13.61 | | | | (8.53 | ) | | | 6,806 | | | | 0.72 | † | | | 1.81 | † | | | 15.83 | †† |
| Global X MSCI Colombia ETF | | | | | | | | | | | | | | | | | | | | | | | | | | | | | | | | | | | | | | | | | | | | |
| 2015(Unaudited) | | | 17.42 | | | | 0.14 | | | | (4.79 | ) | | | (4.65 | ) | | | (0.41 | ) | | | — | | | | (0.41 | ) | | | 12.36 | | | | (26.78 | ) | | | 104,778 | | | | 0.61 | †@ | | | 2.23 | † | | | 52.06 | †† |
| 2014 | | | 20.55 | | | | 0.40 | | | | (2.78 | ) | | | (2.38 | ) | | | (0.75 | ) | | | — | | | | (0.75 | ) | | | 17.42 | | | | (11.73 | ) | | | 100,688 | | | | 0.66 | @ | | | 2.12 | | | | 47.57 | |
| 2013 | | | 21.89 | | | | 0.42 | | | | (1.31 | ) | | | (0.89 | ) | | | (0.45 | ) | | | — | | | | (0.45 | ) | | | 20.55 | | | | (4.21 | ) | | | 149,625 | | | | 0.75 | @ | | | 2.05 | | | | 52.06 | |
| 2012 | | | 19.19 | | | | 0.39 | | | | 2.52 | | | | 2.91 | | | | (0.21 | ) | | | — | | | | (0.21 | ) | | | 21.89 | | | | 15.41 | | | | 182,379 | | | | 0.78 | @ | | | 1.92 | | | | 61.70 | |
| 2011 | | | 22.99 | | | | 0.29 | | | | (3.88 | ) | | | (3.59 | ) | | | (0.13 | ) | | | (0.08 | ) | | | (0.21 | ) | | | 19.19 | | | | (15.69 | ) | | | 141,613 | | | | 0.81 | @ | | | 1.39 | | | | 63.11 | |
| 2010 | | | 13.92 | | | | 0.16 | | | | 9.44 | | | | 9.60 | | | | (0.53 | ) | | | — | | | | (0.53 | ) | | | 22.99 | | | | 71.28 | | | | 196,355 | | | | 0.86 | @ | | | 0.77 | | | | 40.95 | |
| Global X Brazil Mid Cap ETF |
| 2015(Unaudited) | | | 12.22 | | | | 0.13 | | | | (2.12 | ) | | | (1.99 | ) | | | (0.37 | ) | | | — | | | | (0.37 | ) | | | 9.86 | | | | (16.40 | ) | | | 4,931 | | | | 0.69 | † | | | 2.62 | † | | | 16.38 | †† |
| 2014 | | | 14.58 | | | | 0.39 | | | | (2.04 | ) | | | (1.65 | ) | | | (0.71 | ) | | | — | | | | (0.71 | ) | | | 12.22 | | | | (11.59 | ) | | | 7,942 | | | | 0.69 | | | | 2.99 | | | | 17.72 | |
| 2013 | | | 15.55 | | | | 0.50 | | | | (1.02 | ) | | | (0.52 | ) | | | (0.45 | ) | | | — | | | | (0.45 | ) | | | 14.58 | | | | (3.52 | ) | | | 12,390 | | | | 0.69 | | | | 3.32 | | | | 16.38 | |
| 2012 | | | 15.55 | | | | 0.47 | | | | (0.13 | ) | | | 0.34 | | | | (0.34 | ) | | | — | | | | (0.34 | ) | | | 15.55 | | | | 2.42 | | | | 20,994 | | | | 0.69 | | | | 2.98 | | | | 34.81 | |
| 2011 | | | 18.28 | | | | 0.46 | | | | (2.94 | ) | | | (2.48 | ) | | | (0.23 | ) | | | (0.02 | ) | | | (0.25 | ) | | | 15.55 | | | | (13.73 | ) | | | 23,329 | | | | 0.69 | | | | 2.68 | | | | 16.90 | |
| 2010(2) | | | 15.16 | | | | 0.08 | | | | 3.04 | | | | 3.12 | | | | — | | | | — | | | | — | | | | 18.28 | | | | 20.58 | | | | 29,242 | | | | 0.69 | † | | | 1.24 | † | | | 2.69 | †† |
| Global X Brazil Consumer ETF | | | | | | | | | | | | | | | | | | | | | | | | | | | | | | | | | | | | | | | | | | | | |
| 2015(Unaudited) | | | 16.57 | | | | 0.09 | | | | (3.13 | ) | | | (3.04 | ) | | | (0.40 | ) | | | — | | | | (0.40 | ) | | | 13.13 | | | | (18.49 | ) | | | 6,567 | | | | 0.77 | † | | | 1.36 | † | | | 15.01 | †† |
| 2014 | | | 17.89 | | | | 0.33 | | | | (1.44 | ) | | | (1.11 | ) | | | (0.21 | ) | | | — | | | | (0.21 | ) | | | 16.57 | | | | (6.20 | ) | | | 9,943 | | | | 0.78 | ‡ | | | 1.98 | | | | 18.59 | |
| 2013 | | | 19.43 | | | | 0.15 | | | | (1.45 | ) | | | (1.30 | ) | | | (0.24 | ) | | | — | | | | (0.24 | ) | | | 17.89 | | | | (6.80 | ) | | | 18,787 | | | | 0.77 | | | | 0.80 | | | | 15.01 | |
| 2012 | | | 16.78 | | | | 0.14 | | | | 2.73 | | | | 2.87 | | | | (0.22 | ) | | | — | | | | (0.22 | ) | | | 19.43 | | | | 17.49 | | | | 25,257 | | | | 0.77 | | | | 0.83 | | | | 49.88 | |
| 2011 | | | 19.95 | | | | 0.28 | | | | (3.42 | ) | | | (3.14 | ) | | | (0.02 | ) | | | (0.01 | ) | | | (0.03 | ) | | | 16.78 | | | | (15.74 | ) | | | 29,361 | | | | 0.77 | | | | 1.53 | | | | 37.28 | |
| 2010(3) | | | 15.48 | | | | — | | | | 4.47 | | | | 4.47 | | | | — | | | | — | | | | — | | | | 19.95 | | | | 28.88 | | | | 24,934 | | | | 0.77 | † | | | 0.07 | † | | | 4.72 | †† |
| Global X Brazil Financials ETF | | | | | | | | | | | | | | | | | | | | | | | | | | | | | | | | | | | | | | | | | | | | |
| 2015(Unaudited) | | | 10.88 | | | | 0.10 | | | | (1.87 | ) | | | (1.77 | ) | | | (0.79 | ) | | | — | | | | (0.79 | ) | | | 8.32 | | | | (16.48 | ) | | | 1,248 | | | | 0.77 | † | | | 2.38 | † | | | 14.87 | †† |
| 2014 | | | 12.12 | | | | 0.52 | | | | (1.65 | ) | | | (1.13 | ) | | | (0.11 | ) | | | — | | | | (0.11 | ) | | | 10.88 | | | | (9.25 | ) | | | 2,719 | | | | 0.77 | ‡ | | | 4.56 | | | | 17.31 | |
| 2013 | | | 12.82 | | | | 0.30 | | | | (0.50 | ) | | | (0.20 | ) | | | (0.50 | ) | | | — | | | | (0.50 | ) | | | 12.12 | | | | (1.87 | ) | | | 2,425 | | | | 0.77 | | | | 2.36 | | | | 14.87 | |
| 2012 | | | 14.92 | | | | 0.34 | | | | (1.80 | ) | | | (1.46 | ) | | | (0.64 | ) | | | — | | | | (0.64 | ) | | | 12.82 | | | | (9.79 | ) | | | 3,845 | | | | 0.77 | | | | 2.47 | | | | 24.79 | |
| 2011 | | | 17.40 | | | | 0.46 | | | | (2.85 | ) | | | (2.39 | ) | | | (0.09 | ) | | | — | | | | (0.09 | ) | | | 14.92 | | | | (13.80 | ) | | | 7,461 | | | | 0.77 | | | | 2.85 | | | | 37.24 | |
| 2010(4) | | | 15.08 | | | | 0.05 | | | | 2.27 | | | | 2.32 | | | | — | | | | — | | | | — | | | | 17.40 | | | | 15.38 | | | | 7,829 | | | | 0.77 | † | | | 1.15 | † | | | — | †† |
| Global X MSCI Argentina ETF | | | | | | | | | | | | | | | | | | | | | | | | | | | | | | | | | | | | | | | | | | | | |
| 2015(Unaudited) | | | 21.18 | | | | 0.03 | | | | 0.75 | | | | 0.78 | | | | (0.09 | ) | | | — | | | | (0.09 | ) | | | 21.87 | | | | 3.74 | | | | 20,231 | | | | 0.74 | † | | | 0.33 | † | | | 26.52 | †† |
| 2014 | | | 20.29 | | | | 0.10 | | | | 0.91 | ^ | | | 1.01 | | | | (0.12 | ) | | | — | | | | (0.12 | ) | | | 21.18 | | | | 5.03 | | | | 20,652 | | | | 0.74 | | | | 0.49 | | | | 95.29 | |
| 2013(5) | | | 16.84 | | | | 0.10 | | | | 3.53 | | | | 3.63 | | | | (0.18 | ) | | | — | | | | (0.18 | ) | | | 20.29 | | | | 21.73 | | | | 6,595 | | | | 0.74 | | | | 0.57 | | | | 26.52 | |
| 2012(5) | | | 22.04 | | | | 0.24 | | | | (4.85 | ) | | | (4.61 | ) | | | (0.59 | ) | | | — | | | | (0.59 | ) | | | 16.84 | | | | (21.44 | ) | | | 2,946 | | | | 0.74 | | | | 1.25 | | | | 29.51 | |
| 2011(5)(6) | | | 29.86 | | | | 0.45 | | | | (8.27 | ) | | | (7.82 | ) | | | — | | | | — | | | | — | | | | 22.04 | | | | (26.19 | ) | | | 3,857 | | | | 0.75 | † | | | 2.53 | † | | | 40.86 | †† |
| (1) | The Fund commenced operations on February 2, 2011. |
| (2) | The Fund commenced operations on June 21, 2010. |
| (3) | The Fund commenced operations on July 7, 2010. |
| (4) | The Fund commenced operations on July 28, 2010. |
| (5) | Per share amounts have been restated for a 1 for 2 reverse share split. See Note 7 in the Notes to Financial Statements. |
| (6) | The Fund commenced operations on March 2, 2011. |
| ^ | The amount shown for a share outstanding throughout the period does not accord with the aggregate net gains on investments for the period because of the sales and repurchases of fund shares in relation to fluctuating market value of the investments of the Fund. |
| * | Per share data calculated using average shares method. |
| ** | Total Return is for the period indicated and has not been annualized. The return shown does not reflect the deduction of taxes that a shareholder would pay on Fund distributions or the redemption of Fund shares. |
| † | Annualized. |
| †† | Portfolio turnover rate is for the period indicated and has not been annualized. Excludes effect of in-kind transfers. |
| @ | The ratio of Expenses to Average Net Assets includes the effect of a waiver. If these offsets were excluded, the ratio would have been 0.68%, 0.78%, 0.80%, 0.83%, 0.83% and 0.86% for the period ended April 30, 2015 and the years ended October 31, 2014, 2013, 2012, 2011 and 2010, respectively. |
| ‡ | The ratio of Expenses to Average Net Assets includes the effect of income taxes. If these expenses were excluded, the ratio would have been 0.77%, and 0.77% for the Global X Brazil Consumer ETF and Global X Brazil Financials ETF, respectively. |
Amounts designated as “—” are either $0 or have been rounded to $0.
The accompanying notes are an integral part of the financial statements.
Financial Highlights
Selected Per Share Data & Ratios
For a Share Outstanding Throughout the Period
| | | Net Asset
Value,
Beginning
of Period
($) | | | Net
Investment
Income
(Loss) ($)* | | | Net
Realized and
Unrealized
Gain (Loss)
on
Investments
($) | | | Total from
Operations
($) | | | Distribution
from Net
Investment
Income ($) | | | Distribution
from
Capital
Gains ($) | | | Total from
Distributions
($) | | | Net Asset
Value,
End of
Period
($) | | | Total
Return
(%)** | | | Net
Assets
End of
Period
($)(000) | | | Ratio of
Expenses
to
Average
Net
Assets
(%) | | | Ratio of
Net
Investment
Income
(Loss) to
Average
Net Assets
(%) | | | Portfolio
Turnover
(%) | |
| Global X FTSE Greece 20 ETF |
| 2015(Unaudited) | | | 15.84 | | | | 0.09 | | | | (3.68 | ) | | | (3.59 | ) | | | (0.13 | ) | | | — | | | | (0.13 | ) | | | 12.12 | | | | (22.76 | ) | | | 288,948 | | | | 0.60 | † | | | 1.51 | † | | | 77.29 | †† |
| 2014 | | | 22.60 | | | | 0.08 | | | | (6.83 | ) | | | (6.75 | ) | | | (0.01 | ) | | | — | | | | (0.01 | ) | | | 15.84 | | | | (29.83 | ) | | | 140,201 | | | | 0.62 | | | | 0.38 | | | | 64.19 | |
| 2013 | | | 16.16 | | | | 0.15 | | | | 6.32 | | | | 6.47 | | | | (0.02 | ) | | | (0.01 | ) | | | (0.03 | ) | | | 22.60 | | | | 40.14 | | | | 94,938 | | | | 0.61 | | | | 0.84 | | | | 77.29 | |
| 2012(1) | | | 15.18 | | | | 0.25 | | | | 0.76 | | | | 1.01 | | | | (0.03 | ) | | | — | | | | (0.03 | ) | | | 16.16 | | | | 6.70 | | | | 25,863 | | | | 0.62 | † | | | 1.93 | † | | | 23.99 | †† |
| Global X MSCI Norway ETF |
| 2015(Unaudited) | | | 14.82 | | | | 0.18 | | | | (1.01 | ) | | | (0.83 | ) | | | (0.83 | ) | | | — | | | | (0.83 | ) | | | 13.16 | | | | (5.12 | ) | | | 93,459 | | | | 0.50 | † | | | 2.80 | † | | | 11.01 | †† |
| 2014 | | | 16.76 | | | | 0.63 | | | | (2.18 | ) | | | (1.55 | ) | | | (0.39 | ) | | | — | | | | (0.39 | ) | | | 14.82 | | | | (9.46 | ) | | | 183,038 | | | | 0.50 | | | | 3.76 | | | | 26.50 | |
| 2013 | | | 15.09 | | | | 0.50 | | | | 1.60 | | | | 2.10 | | | | (0.43 | ) | | | — | | | | (0.43 | ) | | | 16.76 | | | | 14.21 | | | | 80,465 | | | | 0.50 | | | | 3.23 | | | | 11.01 | |
| 2012 | | | 13.96 | | | | 0.49 | | | | 1.00 | | | | 1.49 | | | | (0.36 | ) | | | — | | | | (0.36 | ) | | | 15.09 | | | | 11.24 | | | | 61,129 | | | | 0.50 | | | | 3.52 | | | | 23.39 | |
| 2011(2) | | | 14.80 | | | | 0.44 | | | | (1.27 | ) | | | (0.83 | ) | | | (0.01 | ) | | | — | | | | (0.01 | ) | | | 13.96 | | | | (5.62 | ) | | | 74,707 | | | | 0.50 | † | | | 3.03 | † | | | 24.26 | †† |
| Global X FTSE Nordic Region ETF |
| 2015(Unaudited) | | | 24.36 | | | | 0.53 | | | | 0.37 | | | | 0.90 | | | | (0.85 | ) | | | — | | | | (0.85 | ) | | | 24.41 | | | | 3.99 | | | | 56,383 | | | | 0.50 | † | | | 4.59 | † | | | 8.95 | †† |
| 2014 | | | 23.74 | | | | 0.79 | | | | 0.46 | | | | 1.25 | | | | (0.63 | ) | | | — | | | | (0.63 | ) | | | 24.36 | | | | 5.30 | | | | 59,927 | | | | 0.50 | | | | 3.16 | | | | 6.05 | |
| 2013 | | | 18.65 | | | | 0.62 | | | | 4.97 | | | | 5.59 | | | | (0.50 | ) | | | — | | | | (0.50 | ) | | | 23.74 | | | | 30.54 | | | | 56,015 | | | | 0.50 | | | | 2.92 | | | | 8.95 | |
| 2012 | | | 17.47 | | | | 0.50 | | | | 1.27 | | | | 1.77 | | | | (0.53 | ) | | | (0.06 | ) | | | (0.59 | ) | | | 18.65 | | | | 10.84 | | | | 26,293 | | | | 0.50 | | | | 2.88 | | | | 10.15 | |
| 2011 | | | 19.22 | | | | 0.53 | | | | (2.11 | ) | | | (1.58 | ) | | | (0.17 | ) | | | — | | | | (0.17 | ) | | | 17.47 | | | | (8.34 | ) | | | 29,005 | | | | 0.50 | | | | 2.74 | | | | 3.59 | |
| 2010 | | | 16.07 | | | | 0.32 | | | | 2.84 | | | | 3.16 | | | | (0.01 | ) | | | — | | | | (0.01 | ) | | | 19.22 | | | | 19.68 | | | | 12,683 | | | | 0.50 | | | | 1.91 | | | | 4.07 | |
| Global X Central Asia & Mongolia Index ETF |
| 2015(Unaudited) | | | 12.29 | | | | 0.17 | | | | (1.40 | ) | | | (1.23 | ) | | | (0.32 | ) | | | — | | | | (0.32 | ) | | | 10.74 | | | | (9.86 | ) | | | 2,686 | | | | 0.69 | † | | | 3.38 | † | | | 11.01 | †† |
| 2014 | | | 13.74 | | | | 0.38 | | | | (1.48 | ) | | | (1.10 | ) | | | (0.35 | ) | | | — | | | | (0.35 | ) | | | 12.29 | | | | (8.23 | ) | | | 2,457 | | | | 0.69 | | | | 2.84 | | | | 55.76 | |
| 2013(3) | | | 14.84 | | | | 0.41 | | | | (1.51 | ) | | | (1.10 | ) | | | — | | | | — | | | | — | | | | 13.74 | | | | (7.41 | ) | | | 1,374 | | | | 0.69 | † | | | 5.01 | † | | | 11.01 | †† |
| Global X MSCI Nigeria ETF |
| 2015(Unaudited) | | | 13.02 | | | | 0.32 | | | | (2.91 | ) | | | (2.59 | ) | | | (0.31 | ) | | | — | | | | (0.31 | ) | | | 10.12 | | | | (20.03 | ) | | | 32,394 | | | | 0.68 | †@ | | | 6.70 | † | | | 5.44 | †† |
| 2014 | | | 14.92 | | | | 0.47 | | | | (2.16 | ) | | | (1.69 | ) | | | (0.17 | ) | | | (0.04 | ) | | | (0.21 | ) | | | 13.02 | | | | (11.55 | ) | | | 16,924 | | | | 0.68 | @ | | | 3.14 | | | | 54.75 | |
| 2013(3) | | | 15.31 | | | | 0.30 | | | | (0.69 | ) | | | (0.39 | ) | | | — | | | | — | | | | — | | | | 14.92 | | | | (2.55 | ) | | | 5,970 | | | | 0.68 | †@ | | | 3.54 | † | | | 5.44 | †† |
| Global X Next Emerging & Frontier ETF |
| 2015(Unaudited) | | | 25.55 | | | | 0.29 | | | | (2.06 | ) | | | (1.77 | ) | | | (0.40 | ) | | | — | | | | (0.40 | ) | | | 23.38 | | | | (6.93 | ) | | | 133,249 | | | | 0.58 | † | | | 2.46 | † | | | 0.77 | †† |
| 2014(4) | | | 25.08 | | | | 0.51 | | | | 0.01 | ^ | | | 0.52 | | | | (0.05 | ) | | | — | | | | (0.05 | ) | | | 25.55 | | | | 2.07 | | | | 152,027 | | | | 0.58 | †‡ | | | 2.00 | † | | | 24.14 | †† |
| Global X FTSE Portugal 20 ETF |
| 2015(Unaudited) | | | 12.65 | | | | (0.02 | ) | | | (0.03 | ) | | | (0.05 | ) | | | (0.23 | ) | | | — | | | | (0.23 | ) | | | 12.37 | | | | (0.12 | ) | | | 45,760 | | | | 0.61 | † | | | (0.37 | )† | | | 50.52 | †† |
| 2014(5) | | | 15.04 | | | | 0.38 | | | | (2.77 | ) | | | (2.39 | ) | | | — | | | | — | | | | — | | | | 12.65 | | | | (15.89 | ) | | | 36,692 | | | | 0.61 | † | | | 2.58 | † | | | 53.58 | †† |
| Global X MSCI Pakistan ETF |
| 2015(6)(Unaudited) | | | 15.28 | | | | 0.01 | | | | 0.03 | | | | 0.04 | | | | — | | | | — | | | | — | | | | 15.32 | | | | 0.26 | | | | 2,298 | | | | 0.88 | † | | | 3.69 | † | | | 5.86 | †† |
| (1) | The Fund commenced operations on December 7, 2011. |
| (2) | The Fund commenced operations on November 9, 2010. |
| (3) | The Fund commenced operations on April 2, 2013. |
| (4) | The Fund commenced operations on November 6, 2013. |
| (5) | The Fund commenced operations on November 12, 2013. |
| (6) | The Fund commenced operations on April 22, 2015. |
| ^ | The amount shown for a share outstanding throughout the period does not accord with the aggregate net gains on investments for the period because of the sales and repurchases of fund shares in relation to fluctuating market value of the investments of the Fund. |
| * | Per share data calculated using average shares method. |
| ** | Total Return is for the period indicated and has not been annualized. The return shown does not reflect the deduction of taxes that a shareholder would pay on Fund distributions or the redemption of Fund shares. |
| † | Annualized. |
| †† | Portfolio turnover rate is for the period indicated and has not been annualized. Excludes effect of in-kind transfers. |
| @ | The ratio of Expenses to Average Net Assets includes the effect of a waiver. If these offsets were excluded, the ratio would have been 0.92%, 0.92% and 0.92% for the year and or period ended April 30, 2015, October 31, 2014, and 2013, respectively. |
| ‡ | The ratio of Expenses to Average Net Assets includes the effect of income taxes. If these expenses were excluded, the ratio would have been 0.58% for the Global X Next Emerging & Frontier ETF. |
Amounts designated as “—” are either $0 or have been rounded to $0.
The accompanying notes are an integral part of the financial statements.
Notes to Financial Statements
April 30, 2015 (Unaudited)
1. ORGANIZATION
The Global X Funds (the "Trust") is a Delaware Statutory Trust formed on March 6, 2008. The Trust is registered under the Investment Company Act of 1940, as amended, as an open-end management investment company. As of April 30, 2015, the Trust had ninety four portfolios, forty five of which were operational. The financial statements herein and the related notes pertain to the Global X China Consumer ETF, Global X China Energy ETF, Global X China Financials ETF, Global X China Industrials ETF, Global X China Materials ETF, Global X NASDAQ China Technology ETF, Global X Southeast Asia ETF, Global X FTSE Andean 40 ETF, Global X MSCI Colombia ETF, Global X Brazil Mid Cap ETF, Global X Brazil Consumer ETF, Global X Brazil Financials ETF, Global X MSCI Argentina ETF, Global X FTSE Greece 20 ETF, Global X MSCI Norway ETF, Global X FTSE Nordic Region ETF, Global X Central Asia & Mongolia Index ETF, Global X MSCI Nigeria ETF, Global X Next Emerging & Frontier ETF, Global X FTSE Portugal 20 ETF, and Global X MSCI Pakistan ETF (each a “Fund”, collectively, the “Funds”). Each Fund is non-diversified.
2. SIGNIFICANT ACCOUNTING POLICIES
The following is a summary of the Significant Accounting Policies followed by the Funds.
USE OF ESTIMATES – The Funds are investment companies that apply the accounting and reporting guidance issued in Topic 946 by the U.S. Financial Accounting Standards Board. The preparation of financial statements in conformity with U.S. generally accepted accounting principles ("U.S. GAAP") requires management to make estimates and assumptions that affect the reported amounts of assets and liabilities and disclosure of contingent assets and liabilities at the date of the financial statements and the reported amounts of increases and decreases in net assets from operations during the reporting period. Actual results could differ from those estimates.
SECURITY VALUATION — Securities listed on a securities exchange, market or automated quotation system for which quotations are readily available (except for securities traded on NASDAQ and the Nigerian Stock Exchange), including securities traded over the counter, are valued at the last quoted sale price on the primary exchange or market (foreign or domestic) on which they are traded (or at approximately 4:00 pm if a security’s primary exchange is normally open at that time), or, if there is no such reported sale, at the most recent mean between the quoted bid and asked prices (absent both bid and asked prices on such exchange, the bid price may be used).
For securities traded on NASDAQ and the Nigerian Stock Exchange, the Official Closing Price will be used. If available, debt securities are priced based upon valuations provided by independent, third-party pricing agents. Such values generally reflect the last reported sales price if the security is actively traded. The third-party pricing agents may also value debt securities at an evaluated bid price by employing methodologies that utilize actual market transactions, broker-supplied valuations, or other methodologies designed to identify the market value for such securities. Debt obligations with remaining maturities of sixty days or less may be valued at their amortized cost, which approximates market value. The prices for foreign securities are reported in local currency and converted to U.S. dollars using currency exchange rates. Prices for most securities held in the Funds are provided daily by recognized independent pricing agents. If a security price cannot be obtained from an independent, third-party pricing agent, the Funds seek to obtain a bid price from at least one independent broker.
Notes to Financial Statements (continued)
April 30, 2015 (Unaudited)
2. SIGNIFICANT ACCOUNTING POLICIES (continued)
Securities for which market prices are not "readily available" are valued in accordance with Fair Value Procedures established by the Board of Trustees (the “Board”). The Funds’ Fair Value Procedures are implemented through a Fair Value Committee (the "Committee") designated by the Board. Some of the more common reasons that may necessitate that a security be valued using Fair Value Procedures include: the security's trading has been halted or suspended; the security has been de-listed from its primary trading exchange; the security's primary trading market is temporarily closed at a time when under normal conditions it would be open; the security has not been traded for an extended period of time; the security's primary pricing source is not able or willing to provide a price; or trading of the security is subject to local government-imposed restrictions. In addition, the Funds may fair value their securities if an event that may materially affect the value of the Funds’ securities that traded outside of the United States (a “Significant Event”) has occurred between the time of the security's last close and the time that the Funds calculate net asset value. A Significant Event may relate to a single issuer or to an entire market sector. Events that may be Significant Events include: government actions, natural disaster, armed conflict, acts of terrorism and significant market fluctuations. If Global X Management Company LLC (the “Adviser”) becomes aware of a Significant Event that has occurred with respect to a security or group of securities after the closing of the exchange or market on which the security or securities principally trade, but before the time at which the Funds calculate net asset value, it may request that a Committee meeting be called. When a security is valued in accordance with the Fair Value Procedures, the Committee will determine the value after taking into consideration relevant information reasonably available to the Committee. As of April 30, 2015, there were securities valued using Fair Value Procedures of $225,457, $410,505, $264,336, $550, $39,997, and $56,945 in Global X China Industrials ETF, Global X China Materials ETF, Global X NASDAQ China Technology ETF, Global X MSCI Colombia ETF, Global X Brazil Mid Cap ETF, and Global X Brazil Consumer ETF, respectively. There were no other securities priced using the Fair Value Procedures.
In accordance with the authoritative guidance on fair value measurements and disclosure under U.S. GAAP, the Funds disclose the fair value of their investments in a hierarchy that prioritizes the inputs to valuation techniques used to measure the fair value. The objective of a fair value measurement is to determine the price that would be received to sell an asset or paid to transfer a liability in an orderly transaction between market participants at the measurement date (an exit price). Accordingly, the fair value hierarchy gives the highest priority to quoted prices (unadjusted) in active markets for identical assets or liabilities (Level 1) and the lowest priority to unobservable inputs (Level 3). The three levels of the fair value hierarchy are described below:
Level 1 – Unadjusted quoted prices in active markets for identical, unrestricted assets or liabilities that the Funds have the ability to access at the measurement date
Level 2 – Other significant observable inputs (including quoted prices in non-active markets, quoted prices for similar investments, fair value of investments for which the Funds have the ability to fully redeem tranches at net asset value as of the measurement date or within the near term, and short-term investments valued at amortized cost)
Level 3 – Significant unobservable inputs (including the Funds’ own assumptions in determining the fair value of investments, fair value of investments for which the Funds do not have the ability to fully redeem tranches at net asset value as of the measurement date or within the near term)
Notes to Financial Statements (continued)
April 30, 2015 (Unaudited)
2. SIGNIFICANT ACCOUNTING POLICIES (continued)
Investments are classified within the level of the lowest significant input considered in determining fair value. Investments classified within Level 3 whose fair value measurement considers several inputs may include Level 1 or Level 2 inputs as components of the overall fair value measurement.
For the six months ended April 30, 2015, there have been no significant changes to the Funds’ fair valuation methodologies.
The following table summarizes the quantitative inputs and assumptions used for items categorized as material Level 3 investments as of April 30, 2015. The disclosures below also include qualitative information on the sensitivity of the fair value measurements to changes in the significant unobservable inputs.
Global X China Industrials ETF
Quantitative information about Level 3 fair value measurements
| Assets | | Fair Value at 4/30/15 | | | Valuation Technique(s) | | Unobservable Input | | Discount Percentage | |
| Common Stock | | $ | 225,457 | | | Discount from the Last Traded Price | | Last Traded Price Comparability Adjustment % | | | 5 | % |
The unobservable inputs used to determine fair value of Level 3 assets may have similar or diverging impacts on valuation. Significant increases and decreases in these inputs in isolation and interrelationships between those inputs could result in significantly higher or lower fair value measurement.
REPURCHASE AGREEMENTS — Securities pledged as collateral for repurchase agreements are held by Citibank, N.A. and are designated as being held on each Fund’s behalf by its custodian under a book-entry system. Each Fund monitors the adequacy of the collateral on a daily basis and can require the seller to provide additional collateral in the event the market value of the securities pledged falls below the carrying value of the repurchase agreement, including accrued interest. It is the Funds’ policy to only enter into repurchase agreements with banks and other financial institutions which are deemed by the Adviser to be creditworthy. The Fund bears the risk of loss in the event that the other party to a repurchase agreement defaults on its obligations and the Fund is prevented from exercising its rights to dispose of the underlying securities received as collateral and the risk of a possible decline in the value of the underlying securities during the period. For financial statement purposes, the Funds record the securities lending collateral (included in Repurchase Agreements, at value or restricted cash) as an asset and the obligation to return securities lending collateral as a liability on the Statements of Assets and Liabilities.
Repurchase agreements are entered into by the Funds under Master Repurchase Agreements (“MRA”) which permit the Funds, under certain circumstances including an event of default (such as bankruptcy or insolvency), to offset payables and/or receivables under the MRA with collateral held and/or posted to the counterparty and create one single net payment due to or from the Funds.
Notes to Financial Statements (continued)
April 30, 2015 (Unaudited)
2. SIGNIFICANT ACCOUNTING POLICIES (continued)
At April 30, 2015, the open repurchase agreements by counterparty which are subject to a MRA on a net payment basis are as follows:
| | | Repurchase Agreements | | | Fair Value of Non-cash
Collateral Received | | | Cash Collateral
Received | | | Net Amount(1) | |
| Global X China Consumer ETF | | | | | | | | | | | | | | | | |
| Barclays | | $ | 6,000,000 | | | $ | 6,000,000 | | | $ | - | | | $ | - | |
| Deutsche Bank | | | 2,209,505 | | | | 2,209,505 | | | | - | | | | - | |
| Global X MSCI Norway ETF | | | | | | | | | | | | | | | | |
| Barclays | | | 10,000,000 | | | | 10,000,000 | | | | - | | | | - | |
| Deutsche Bank | | | 2,012,280 | | | | 2,012,280 | | | | - | | | | - | |
| Global X FTSE Portugal 20 ETF | | | | | | | | | | | | | | | | |
| Deutsche Bank | | | 783,899 | | | | 783,899 | | | | - | | | | - | |
(1)Net Amount represents the net amount receivable due from the counterparty in the event of default.
FEDERAL INCOME TAXES — It is each Fund’s intention to qualify or continue to qualify as a regulated investment company for Federal income tax purposes by complying with the appropriate provisions of Subchapter M of the Internal Revenue Code of 1986, as amended. Accordingly, no provisions for Federal income taxes have been made in the financial statements.
During the year ended October 31, 2014, The Global X Brazil Consumer ETF, Global X Brazil Financials ETF, and Global X Next Emerging & Frontier ETF incurred federal excise tax in the amount of $808, $5, and $17, respectively. No other provisions for Federal income taxes have been made in the financial statements.
The Funds evaluate tax positions taken or expected to be taken in the course of preparing the Funds’ tax returns to determine whether it is "more-likely-than-not" (i.e., greater than 50 percent) that each tax position will be sustained upon examination by a taxing authority based on the technical merits of the position. Tax positions not deemed to meet the more-likely-than-not threshold are recorded as a tax benefit or expense in the current year. The Funds did not record any tax provision in the current period. However, management’s conclusions regarding tax positions may be subject to review and adjustment at a later date based on factors including, but not limited to, examination by tax authorities (i.e., the last three tax year ends, as applicable), on-going analysis of and changes to tax laws, regulations and interpretations thereof.
As of and during the six months ended April 30, 2015, the Funds did not have a liability for any unrecognized tax benefits. The Funds recognize interest and penalties, if any, related to unrecognized tax benefits as income tax expense in the Statement of Operations. During the period, the Funds did not incur any interest or penalties.
SECURITY TRANSACTIONS AND INVESTMENT INCOME — Security transactions are accounted for on the trade date for financial reporting purposes. Costs used in determining realized gains and losses on the sale of investment securities are based on specific identification. Dividend income is recorded on the ex-dividend date. Interest income is recognized on the accrual basis from the settlement date.
FOREIGN CURRENCY TRANSACTIONS AND TRANSLATION — The books and records of the Funds are maintained in U.S. dollars. Investment securities and other assets and liabilities denominated in a foreign currency are translated into U.S. dollars on the date of valuation. Purchases and sales of investment securities, income and expenses are translated into U.S. dollars at the
Notes to Financial Statements (continued)
April 30, 2015 (Unaudited)
2. SIGNIFICANT ACCOUNTING POLICIES (continued)
relevant rates of exchange prevailing on the respective dates of such transactions. The Funds do not isolate that portion of realized or unrealized gains and losses resulting from changes in the foreign exchange rate from fluctuations arising from changes in the market prices of the securities. These gains and losses are included in net realized and unrealized gains and losses on investments on the Statement of Operations. Net realized and unrealized gains and losses on foreign currency transactions and translations represent net foreign exchange gains or losses from foreign currency spot contracts, disposition of foreign currencies, currency gains or losses realized between trade and settlement dates on securities transactions and the difference between the amount of the investment income and foreign withholding taxes recorded on the Funds’ books and the U.S. dollar equivalent amounts actually received or paid.
DIVIDENDS AND DISTRIBUTIONS TO SHAREHOLDERS — The Funds distribute their net investment income on a pro rata basis. Any net realized capital gains are distributed annually. All distributions are recorded on ex-dividend date.
CREATION UNITS — The Funds issue and redeem shares ("Shares") at Net Asset Value (“NAV”) and only in large blocks of Shares, (each block of Shares for a Fund is called a "Creation Unit" or multiples thereof). Purchasers of Creation Units ("Authorized Participants") at NAV must pay a standard creation transaction fee per transaction. The fee is a single charge and will be the same regardless of the number of Creation Units purchased by an investor on the same day. An Authorized Participant who holds Creation Units and wishes to redeem at NAV would also pay a standard redemption fee per transaction payable to Brown Brothers Harriman & Co. (“BBH”), the Fund’s Custodian, on the date of such redemption, regardless of the number of Creation Units redeemed that day.
If a Creation Unit is purchased or redeemed for cash, a higher Transaction Fee will be charged. The following table discloses Creation Unit breakdown:
| | | Creation Unit | | | Creation | | | Value at | | | Redemption | |
| | | Shares | | | Fee | | | April 30, 2015 | | | Fee | |
| Global X China Consumer ETF | | | 50,000 | | | $ | 1,900 | | | $ | 774,500 | | | $ | 1,900 | |
| Global X China Energy ETF | | | 50,000 | | | | 1,900 | | | | 778,000 | | | | 1,900 | |
| Global X China Financials ETF | | | 50,000 | | | | 1,900 | | | | 964,000 | | | | 1,900 | |
| Global X China Industrials ETF | | | 50,000 | | | | 1,900 | | | | 976,500 | | | | 1,900 | |
| Global X China Materials ETF | | | 50,000 | | | | 1,900 | | | | 1,011,000 | | | | 1,900 | |
| Global X NASDAQ China Technology ETF | | | 50,000 | | | | 1,900 | | | | 1,404,000 | | | | 1,900 | |
| Global X Southeast Asia ETF | | | 50,000 | | | | 2,300 | | | | 802,000 | | | | 2,300 | |
| Global X FTSE Andean 40 ETF | | | 50,000 | | | | 2,300 | | | | 462,500 | | | | 2,300 | |
| Global X MSCI Colombia ETF | | | 50,000 | | | | 2,500 | | | | 618,000 | | | | 2,500 | |
| Global X Brazil Mid Cap ETF | | | 50,000 | | | | 1,900 | | | | 493,000 | | | | 1,900 | |
| Global X Brazil Consumer ETF | | | 50,000 | | | | 1,500 | | | | 656,500 | | | | 1,500 | |
| Global X Brazil Financials ETF | | | 50,000 | | | | 1,500 | | | | 416,000 | | | | 1,500 | |
| Global X MSCI Argentina ETF | | | 50,000 | | | | 1,000 | | | | 1,093,500 | | | | 1,000 | |
| Global X FTSE Greece 20 ETF | | | 50,000 | | | | 1,000 | | | | 606,000 | | | | 1,000 | |
| Global X MSCI Norway ETF | | | 50,000 | | | | 1,400 | | | | 658,000 | | | | 1,400 | |
| Global X FTSE Nordic Region ETF | | | 50,000 | | | | 1,400 | | | | 1,220,500 | | | | 1,400 | |
| Global X Central Asia & Mongolia Index ETF | | | 50,000 | | | | 2,700 | | | | 537,000 | | | | 2,700 | |
| Global X MSCI Nigeria ETF | | | 50,000 | | | | 2,300 | | | | 506,000 | | | | 2,300 | |
| Global X Next Emerging & Frontier ETF | | | 50,000 | | | | 9,500 | | | | 1,169,000 | | | | 9,500 | |
| Global X FTSE Portugal 20 ETF | | | 50,000 | | | | 1,000 | | | | 618,500 | | | | 1,000 | |
| Global X MSCI Pakistan ETF | | | 50,000 | | | | 3,800 | | | | 766,000 | | | | 3,800 | |
Notes to Financial Statements (continued)
April 30, 2015 (Unaudited)
3. RELATED PARTY TRANSACTIONS
The Adviser serves as the investment adviser and the administrator for the Funds. Subject to the supervision of the Board of Trustees, the Adviser is responsible for managing the investment activities of the Funds and the Funds’ business affairs and other administrative matters and provides or causes to be furnished all supervisory, administrative and other services reasonably necessary for the operation of the Funds, including certain distribution services (provided pursuant to a separate Distribution Agreement), certain shareholder and distribution-related services (provided pursuant to a separate Rule 12b-1 Plan and related agreements) and investment advisory services (provided pursuant to a separate Investment Advisory Agreement), under what is essentially an "all-in" fee structure. For its service to the Funds, under the Supervision and Administration Agreement, each Fund pays a monthly fee to the Adviser at the annual rate (stated as a percentage of the average daily net assets of the Fund). In addition, the Funds bear other expenses, directly and indirectly that are not covered by the Supervision and Administration Agreement, which may vary and affect the total expense ratios of the Funds, such as taxes, brokerage fees, commissions and other transaction expenses, interest expenses, acquired fund fees and extraordinary expenses (such as litigation and indemnification expenses). In addition, the Global X MSCI Colombia ETF, Global X MSCI Argentina ETF, Global X FTSE Greece 20 ETF, Global X Central Asia & Mongolia Index ETF, Global X MSCI Nigeria ETF, Global X Next Emerging & Frontier ETF and Global X FTSE Portugal 20 ETF pay custodial fees that are not covered by the Supervision and Administration Agreement. Pursuant to an agreement with the Custodian, the Global X MSCI Colombia ETF, Global X MSCI Argentina ETF, Global X FTSE Greece 20 ETF, Global X Central Asia & Mongolia Index ETF, Global X MSCI Nigeria ETF, Global X Next Emerging & Frontier ETF, Global X FTSE Portugal 20 ETF and Global X MSCI Pakistan ETF may pay up to 0.11%, 0.01%, 0.06%, 0.01%, 0.24%, 0.09%, 0.06% and 0.20%, respectively, in Custody Fees (in addition to the Supervision and Administration Fee).
Notes to Financial Statements (continued)
April 30, 2015 (Unaudited)
3. RELATED PARTY TRANSACTIONS (continued)
| | | Supervision | |
| | | and | |
| | | Administration | |
| | | Fee | |
| Global X China Consumer ETF | | | 0.65 | % |
| Global X China Energy ETF | | | 0.65 | % |
| Global X China Financials ETF | | | 0.65 | % |
| Global X China Industrials ETF | | | 0.65 | % |
| Global X China Materials ETF | | | 0.65 | % |
| Global X NASDAQ China Technology ETF | | | 0.65 | % |
| Global X Southeast Asia ETF | | | 0.65 | % |
| Global X FTSE Andean 40 ETF | | | 0.72 | % |
| Global X MSCI Colombia ETF* | | | 0.68 | % |
| Global X Brazil Mid Cap ETF | | | 0.69 | % |
| Global X Brazil Consumer ETF | | | 0.77 | % |
| Global X Brazil Financials ETF | | | 0.77 | % |
| Global X MSCI Argentina ETF | | | 0.74 | % |
| Global X FTSE Greece 20 ETF | | | 0.55 | % |
| Global X MSCI Norway ETF | | | 0.50 | % |
| Global X FTSE Nordic Region ETF | | | 0.50 | % |
| Global X Central Asia & Mongolia Index ETF | | | 0.68 | % |
| Global X MSCI Nigeria ETF** | | | 0.68 | % |
| Global X Next Emerging & Frontier ETF | | | 0.49 | % |
| Global X FTSE Portugal 20 ETF | | | 0.55 | % |
| Global X MSCI Pakistan ETF | | | 0.68 | % |
*Effective July 15, 2014, pursuant to an expense limitation agreement, the Adviser has agreed to waive or reimburse fees and/or limit fund expenses to the extent necessary to assure that the operating expenses of the Global X MSCI Colombia Fund (the “Fund”) (exclusive of taxes, brokerage fees, commissions, and other transaction expenses, interest and extraordinary expenses (such as litigation and indemnification expenses)) will not exceed 0.61% of the Fund’s average daily net assets per year until at least March 1, 2016. Prior to July 15, 2014, pursuant to an expense limitation agreement, the Adviser had agreed to waive or reimburse fees and/or limit fund expenses to the extent necessary to assure that the operating expenses of the Fund (exclusive of taxes, brokerage fees, commissions, and other transaction expenses, interest and extraordinary expenses (such as litigation and indemnification expenses)) did not exceed 0.68% of the Fund’s average daily net assets per year until at least March 1, 2015. The Fund (at a later date) may reimburse the Adviser for the fees and expenses it waived or reimbursed and/or limited pursuant to the expense limitation agreement during any of the prior three fiscal years, provided that, among other things, any reimbursement made to the Adviser does not cause Total Annual Fund Operating Expenses to exceed the maximum permitted rate during the period in which it is paid and the Board of Trustees has approved such reimbursement to the Adviser. At April 30, 2015, the amounts of waivers/reimbursements subject to recoupment for Global X MSCI Colombia ETF were $67,730 expiring in 2018, $132,223 expiring in 2017, $84,928 expiring in 2016 and $77,243 expiring in 2015. As of April 30, 2015, there had been no recoupment of previously waived and reimbursed fees.
**Pursuant to an expense limitation agreement, the Adviser has agreed to waive or reimburse fees and/or limit fund expenses to the extent necessary to assure that the operating expenses of the Global X MSCI Nigeria Fund (the “Fund”) (exclusive of taxes, brokerage fees, commissions, and other transaction expenses, interest and extraordinary expenses (such as litigation and indemnification expenses)) will not exceed 0.68% of the Fund’s average daily net assets per year until at least March 1, 2016. The Fund (at a later date) may reimburse the Adviser for the fees and expenses it waived or reimbursed and/or limited pursuant to the expense limitation agreement during any of the prior three fiscal years, provided that, among other things, any reimbursement made to the Adviser does not cause Total Annual Fund Operating Expenses of the Fund to exceed the maximum permitted rate during the period in which it is paid and the Board of Trustees has approved such reimbursement to the Adviser. At April 30, 2015, the amounts of waivers/reimbursements subject to recoupment for Global X MSCI Nigeria ETF were $23,540 expiring in 2018, $33,893 expiring in 2017 and $5,469 expiring in 2016. As of April 30, 2015, there had been no recoupment of previously waived and reimbursed fees.
Notes to Financial Statements (continued)
April 30, 2015 (Unaudited)
3. RELATED PARTY TRANSACTIONS (continued)
SEI Investments Global Fund Services (“SEIGFS”) serves as Sub-Administrator to the Funds. As Sub-Administrator, SEIGFS provides the Funds with the required general administrative services, including, without limitation: office space, equipment, and personnel; clerical and general back office services; bookkeeping, internal accounting and secretarial services; the calculation of NAV; and assistance with the preparation and filing of reports, registration statements, proxy statements and other materials required to be filed or furnished by the Funds under federal and state securities laws. As compensation for these services, the Sub-Administrator receives certain out-of-pocket costs, transaction fees and asset-based fees which are accrued daily and paid monthly by the Adviser.
SEI Investments Distribution Co. (“SIDCO”) serves as each Fund’s underwriter and distributor of Shares pursuant to a Distribution Agreement. Under the Distribution Agreement, SIDCO, as agent, receives orders to create and redeem Shares in Creation Unit Aggregations and transmits such orders to the Trust’s custodian and transfer agent. The Distributor has no obligation to sell any specific quantity of Fund Shares. SIDCO bears the following costs and expenses relating to the distribution of Shares: (i) the costs of processing and maintaining records of creations of Creation Units; (ii) all costs of maintaining the records required of a registered broker/dealer; (iii) the expenses of maintaining its registration or qualification as a dealer or broker under Federal or state laws; (iv) filing fees; and (v) all other expenses incurred in connection with the distribution services as contemplated in the Distribution Agreement. SIDCO receives no fee for its distribution services under the Distribution Agreement.
BBH, located at 40 Water Street, Boston, MA 02109, serves as Custodian and Transfer Agent of the Funds’ assets. As Custodian, BBH has agreed to (1) make receipts and disbursements of money on behalf of the Fund, (2) collect and receive all income and other payments and distributions on account of the Funds’ portfolio investments, (3) respond to correspondence from shareholders, security brokers and others relating to its duties; and (4) make periodic reports to the Funds concerning the Funds’ operations. BBH does not exercise any supervisory function over the purchase and sale of securities. As compensation for these services, the Custodian receives certain out-of-pocket costs, transaction fees and asset-based fees which are accrued daily and paid monthly by the Adviser from its fees.
As Transfer Agent, BBH has agreed to (1) issue and redeem shares of each Fund, (2) make dividend and other distributions to shareholders of each Fund, (3) respond to correspondence by shareholders and others relating to its duties; (4) maintain shareholder accounts, and (5) make periodic reports to the Funds. As compensation for these services, the Transfer Agent receives certain out of-pocket costs, transaction fees and asset-based fees which are accrued daily and paid monthly by the Adviser from its fees.
Notes to Financial Statements (continued)
April 30, 2015 (Unaudited)
4. INVESTMENT TRANSACTIONS
For the period ended April 30, 2015, the purchases and sales of investments in securities, excluding in-kind transactions, long-term U.S. Government and short-term securities were:
| | | | | | Sales and | |
| | | Purchases | | | Maturities | |
| Global X China Consumer ETF | | $ | 16,325,657 | | | $ | 18,862,974 | |
| Global X China Energy ETF | | | 306,392 | | | | 392,170 | |
| Global X China Financials ETF | | | 6,871,540 | | | | 7,684,008 | |
| Global X China Industrials ETF | | | 1,365,842 | | | | 1,265,788 | |
| Global X China Materials ETF | | | 680,536 | | | | 722,078 | |
| Global X NASDAQ China Technology ETF | | | 5,083,490 | | | | 4,372,323 | |
| Global X Southeast Asia ETF | | | 1,847,654 | | | | 3,870,096 | |
| Global X FTSE Andean 40 ETF | | | 972,714 | | | | 1,330,636 | |
| Global X MSCI Colombia ETF | | | 48,310,267 | | | | 29,774,459 | |
| Global X Brazil Mid Cap ETF | | | 491,217 | | | | 1,307,185 | |
| Global X Brazil Consumer ETF | | | 947,305 | | | | 2,155,327 | |
| Global X Brazil Financials ETF | | | 393,655 | | | | 1,187,782 | |
| Global X MSCI Argentina ETF | | | 2,991,905 | | | | 3,182,860 | |
| Global X FTSE Greece 20 ETF | | | 45,613,762 | | | | 45,006,648 | |
| Global X MSCI Norway ETF | | | 9,383,375 | | | | 12,525,680 | |
| Global X FTSE Nordic Region ETF | | | 1,611,974 | | | | 2,973,369 | |
| Global X Central Asia & Mongolia ETF | | | 385,209 | | | | 424,374 | |
| Global X MSCI Nigeria ETF | | | 21,596,007 | | | | 3,083,179 | |
| Global X Next Emerging & Frontier ETF | | | 1,058,540 | | | | 3,505,265 | |
| Global X FTSE Portugal 20 ETF | | | 6,259,678 | | | | 6,919,424 | |
| Global X MSCI Pakistan ETF | | | 2,443,005 | | | | 134,951 | |
During the period ended April 30, 2015, there were no purchases or sales of long-term U.S. Government securities for the Funds.
Notes to Financial Statements (continued)
April 30, 2015 (Unaudited)
4. INVESTMENT TRANSACTIONS (continued)
For the year or period ended April 30, 2015 and October 31, 2014, in-kind transactions associated with creations and redemptions were, respectively:
| | | | | | Sales and | | | Realized | |
| | | Purchases | | | Maturities | | | Gain (Loss) | |
| Global X China Consumer ETF | | $ | - | | | $ | 28,764,289 | | | $ | (2,315,500 | ) |
| Global X China Energy ETF | | | - | | | | 1,488,018 | | | | 261,904 | |
| Global X China Financials ETF | | | 45,882,818 | | | | 5,402,831 | | | | 915,864 | |
| Global X China Industrials ETF | | | 4,723,276 | | | | 1,317,463 | | | | 257,956 | |
| Global X China Materials ETF | | | 3,901,261 | | | | 747,829 | | | | (8,308 | ) |
| Global X NASDAQ China Technology ETF | | | - | | | | 4,032,209 | | | | 1,071,008 | |
| Global X Southeast Asia ETF | | | 1,207,349 | | | | 5,291,756 | | | | (121,698 | ) |
| Global X FTSE Andean 40 ETF | | | 234,771 | | | | 494,995 | | | | 23,482 | |
| Global X MSCI Colombia ETF | | | 12,077,675 | | | | 2,319,422 | | | | (956,697 | ) |
| Global X Brazil Mid Cap ETF | | | - | | | | 695,156 | | | | (195,885 | ) |
| Global X Brazil Consumer ETF | | | - | | | | 259,958 | | | | (135,853 | ) |
| Global X Brazil Financials ETF | | | 118,644 | | | | 437,350 | | | | (79,806 | ) |
| Global X MSCI Argentina ETF | | | 4,124,088 | | | | 4,602,995 | | | | 201,401 | |
| Global X FTSE Greece 20 ETF | | | 222,280,514 | | | | 46,390,183 | | | | (13,197,049 | ) |
| Global X MSCI Norway ETF | | | 28,913,661 | | | | 100,507,684 | | | | (16,825,148 | ) |
| Global X FTSE Nordic Region ETF | | | - | | | | 3,620,648 | | | | 969,241 | |
| Global X Central Asia & Mongolia ETF | | | 487,572 | | | | - | | | | - | |
| Global X MSCI Nigeria ETF | | | - | | | | - | | | | - | |
| Global X Next Emerging & Frontier ETF | | | - | | | | 4,403,327 | | | | (12,341 | ) |
| Global X FTSE Portugal 20 ETF | | | 19,241,548 | | | | 10,382,786 | | | | (493,371 | ) |
| Global X MSCI Pakistan ETF | | | - | | | | - | | | | - | |
| | | | | | Sales and | | | Realized | |
| | | Purchases | | | Maturities | | | Gain (Loss) | |
| Global X China Consumer ETF | | $ | 47,940,122 | | | $ | 59,438,708 | | | $ | 8,591,703 | |
| Global X China Energy ETF | | | 1,699,167 | | | | 1,473,707 | | | | 285,984 | |
| Global X China Financials ETF | | | 43,833,368 | | | | 33,262,860 | | | | (1,909,351 | ) |
| Global X China Industrials ETF | | | 2,505,310 | | | | 1,137,325 | | | | (192,086 | ) |
| Global X China Materials ETF | | | 3,140,144 | | | | 2,325,727 | | | | 242,887 | |
| Global X NASDAQ China Technology ETF | | | 11,399,519 | | | | 1,083,174 | | | | 427,255 | |
| Global X Southeast Asia ETF | | | 618,059 | | | | 13,850,456 | | | | (775,180 | ) |
| Global X FTSE Andean 40 ETF | | | 861,619 | | | | 778,248 | | | | (48,376 | ) |
| Global X MSCI Colombia ETF | | | 10,416,753 | | | | 19,375,791 | | | | (1,830,863 | ) |
| Global X Brazil Mid Cap ETF | | | - | | | | 1,446,513 | | | | 210,770 | |
| Global X Brazil Consumer ETF | | | - | | | | 1,757,766 | | | | (6,808 | ) |
| Global X Brazil Financials ETF | | | 171,813 | | | | - | | | | - | |
| Global X MSCI Argentina ETF | | | 31,901,934 | | | | 17,604,834 | | | | 1,741,787 | |
| Global X FTSE Greece 20 ETF | | | 362,238,361 | | | | 236,278,267 | | | | 16,402,582 | |
| Global X MSCI Norway ETF | | | 156,687,697 | | | | 23,285,532 | | | | 3,808,749 | |
| Global X FTSE Nordic Region ETF | | | 13,746,411 | | | | 10,481,543 | | | | 3,016,773 | |
| Global X Central Asia & Mongolia ETF | | | 1,397,287 | | | | - | | | | - | |
| Global X MSCI Nigeria ETF | | | 3,562,309 | | | | - | | | | - | |
| Global X Next Emerging & Frontier ETF | | | 107,644,116 | | | | 2,778,201 | | | | 215,323 | |
| Global X FTSE Portugal 20 ETF | | | 53,044,408 | | | | 7,499,502 | | | | 396,498 | |
5. TAX INFORMATION
The amount and character of income and capital gain distributions to be paid, if any, are determined in accordance with Federal income tax regulations, which may differ from U.S. GAAP. As a result, net investment income (loss) and net realized gain (loss) on investment transactions for a reporting period may differ significantly from distributions during such period. These book/tax differences
Notes to Financial Statements (continued)
April 30, 2015 (Unaudited)
5. TAX INFORMATION (continued)
may be temporary or permanent. To the extent these differences are permanent in nature, they are charged or credited to undistributed net investment income (loss), accumulated net realized gain (loss) or paid-in capital, as appropriate, in the period that the differences arise.
The tax character of dividends and distributions declared during the years or periods ended October 31, 2014 and October 31, 2013 were as follows:
| Global X Funds | | Ordinary Income | | | Long-Term Capital
Gain | | | Totals | |
| | | | |
| Global X China Consumer ETF |
| 2014 | | $ | 1,981,753 | | | $ | – | | | $ | 1,981,753 | |
| 2013 | | | 2,128,638 | | | | – | | | | 2,128,638 | |
| Global X China Energy ETF |
| 2014 | | $ | 85,026 | | | $ | – | | | $ | 85,026 | |
| 2013 | | | 88,625 | | | | – | | | | 88,625 | |
| Global X China Financials ETF |
| 2014 | | $ | 243,282 | | | $ | – | | | $ | 243,282 | |
| 2013 | | | 186,317 | | | | – | | | | 186,317 | |
| Global X China Industrials ETF |
| 2014 | | $ | 65,300 | | | $ | – | | | $ | 65,300 | |
| 2013 | | | 64,616 | | | | – | | | | 64,616 | |
| Global X China Materials ETF |
| 2014 | | $ | 36,867 | | | $ | – | | | $ | 36,867 | |
| 2013 | | | 40,384 | | | | – | | | | 40,384 | |
| Global X NASDAQ China Technology ETF |
| 2014 | | $ | 3,666 | | | $ | – | | | $ | 3,666 | |
| 2013 | | | 16,025 | | | | – | | | | 16,025 | |
| Global X Southeast Asia ETF |
| 2014 | | $ | 1,423,135 | | | $ | – | | | $ | 1,423,135 | |
| 2013 | | | 806,416 | | | | – | | | | 806,416 | |
| Global X FTSE Andean 40 ETF |
| 2014 | | $ | 153,480 | | | $ | – | | | $ | 153,480 | |
| 2013 | | | 155,634 | | | | – | | | | 155,634 | |
| Global X MSCI Colombia ETF |
| 2014 | | $ | 4,567,150 | | | $ | – | | | $ | 4,567,150 | |
| 2013 | | | 3,654,817 | | | | – | | | | 3,654,817 | |
| Global X Brazil Mid Cap ETF |
| 2014 | | $ | 531,843 | | | $ | – | | | $ | 531,843 | |
| 2013 | | | 544,000 | | | | – | | | | 544,000 | |
| Global X Brazil Consumer ETF |
| 2014 | | $ | 185,072 | | | $ | – | | | $ | 185,072 | |
| 2013 | | | 293,164 | | | | – | | | | 293,164 | |
| Global X Brazil Financials ETF |
| 2014 | | $ | 22,454 | | | $ | – | | | $ | 22,454 | |
| 2013 | | | 149,310 | | | | – | | | | 149,310 | |
| Global X MSCI Argentina ETF |
| 2014 | | $ | 45,738 | | | $ | – | | | $ | 45,738 | |
| 2013 | | | 31,297 | | | | – | | | | 31,297 | |
| Global X FTSE Greece 20 ETF |
| 2014 | | $ | 118,994 | | | $ | 33,492 | | | $ | 152,486 | |
| 2013 | | | 47,749 | | | | – | | | | 47,749 | |
| Global X MSCI Norway ETF |
| 2014 | | $ | 2,012,342 | | | $ | – | | | $ | 2,012,342 | |
| 2013 | | | 1,583,434 | | | | – | | | | 1,583,434 | |
| Global X FTSE Nordic Region ETF |
| 2014 | | $ | 1,480,041 | | | $ | – | | | $ | 1,480,041 | |
| 2013 | | | 698,310 | | | | – | | | | 698,310 | |
| Global X Central Asia & Mongolia Index ETF |
| 2014 | | $ | 52,316 | | | $ | – | | | $ | 52,316 | |
| 2013 | | | – | | | | – | | | | – | |
| Global X MSCI Nigeria ETF |
| 2014 | | $ | 92,838 | | | $ | – | | | $ | 92,838 | |
| 2013 | | | – | | | | – | | | | – | |
| Global X Next Emerging & Frontier ETF(1) |
| 2014 | | $ | 28,312 | | | $ | – | | | $ | 28,312 | |
| Global X FTSE Portugal 20 ETF(2) |
| 2014 | | $ | – | | | $ | – | | | $ | – | |
(1)Commenced operations November 6, 2013.
(2)Commenced operations November 12, 2013.
Notes to Financial Statements (continued)
April 30, 2015 (Unaudited)
5. TAX INFORMATION (continued)
As of October 31, 2014, the components of tax basis distributable earnings (accumulated losses)
were as follows:
| | | Global X China
Consumer ETF | | | Global X China
Energy ETF | | | Global X China
Financials ETF | |
| Undistributed Ordinary Income | | $ | 1,969,844 | | | $ | 81,629 | | | $ | 617,665 | |
| Capital Loss Carryforwards | | | (17,328,473 | ) | | | (612,885 | ) | | | (1,306,781 | ) |
| Unrealized Depreciation on Investments and Foreign Currency | | | (25,865,619 | ) | | | (56,137 | ) | | | (1,647,856 | ) |
| Other Temporary Differences | | | (4 | ) | | | (3 | ) | | | (4 | ) |
| Total Accumulated Losses | | $ | (41,224,252 | ) | | $ | (587,396 | ) | | $ | (2,336,976 | ) |
| | | Global X China
Industrials ETF | | | Global X China
Materials ETF | | | Global X
NASDAQ China
Technology ETF | |
| Undistributed Ordinary Income | | $ | 40,506 | | | $ | 30,768 | | | $ | 58,833 | |
| Capital Loss Carryforwards | | | (1,441,161 | ) | | | (938,459 | ) | | | (898,727 | ) |
| Unrealized Depreciation on Investments and Foreign Currency | | | (459,681 | ) | | | (789,463 | ) | | | 2,477,825 | |
| Other Temporary Differences | | | (3 | ) | | | 1 | | | | (1 | ) |
| Total Distributable Earnings (Accumulated Losses) | | $ | (1,860,339 | ) | | $ | (1,697,153 | ) | | $ | 1,637,930 | |
| | | Global X
Southeast Asia
ETF | | | Global X FTSE
Andean 40 ETF | | | Global X MSCI
Colombia ETF | |
| Undistributed Ordinary Income | | $ | 641,310 | | | $ | 154,556 | | | $ | 2,089,415 | |
| Capital Loss Carryforwards | | | (1,652,420 | ) | | | (1,002,786 | ) | | | (19,187,538 | ) |
| Unrealized Depreciation on Investments and Foreign Currency | | | (1,637,279 | ) | | | (2,526,847 | ) | | | (22,786,232 | ) |
| Other Temporary Differences | | | (6 | ) | | | 1 | | | | (3 | ) |
| Total Accumulated Losses | | $ | (2,648,395 | ) | | $ | (3,375,0 76 | ) | | $ | (39,884,358 | ) |
| | | Global X Brazil
Mid Cap ETF | | | Global X Brazil
Consumer ETF | | | Global X Brazil
Financials ETF | |
| Undistributed Ordinary Income | | $ | 209,389 | | | $ | 238,744 | | | $ | 113,926 | |
| Capital Loss Carryforwards | | | (5,095,803 | ) | | | (2,578,461 | ) | | | (1,143,797 | ) |
| Unrealized Depreciation on Investments and Foreign Currency | | | (1,102,273 | ) | | | (475,602 | ) | | | (859,617 | ) |
| Other Temporary Differences | | | (1 | ) | | | — | | | | (3 | ) |
| Total Accumulated Losses | | $ | (5,988,688 | ) | | $ | (2,815,319 | ) | | $ | (1,889,491 | ) |
| | | Global X MSCI
Argentina ETF | | | Global X FTSE
Greece 20 ETF | | | Global X MSCI
Norway ETF | |
| Undistributed Ordinary Income | | $ | 31,029 | | | $ | 707,126 | | | $ | 4,495,136 | |
| Capital Loss Carryforwards | | | (1,806,944 | ) | | | (4,430,311 | ) | | | (3,797,528 | ) |
| Unrealized Depreciation on Investments and Foreign Currency | | | (2,275,925 | ) | | | (80,816,966 | ) | | | (32,601,688 | ) |
| Other Temporary Differences | | | (3 | ) | | | (4 | ) | | | 4 | |
| Total Accumulated Losses | | $ | (4,051,843 | ) | | $ | (84,540,155 | ) | | $ | (31,904,076 | ) |
Notes to Financial Statements (continued)
April 30, 2015 (Unaudited)
5. TAX INFORMATION (continued)
| | | Global X FTSE
Nordic Region
ETF | | | Global X Central
Asia & Mongolia
Index ETF | | | Global X MSCI
Nigeria ETF | |
| Undistributed Ordinary Income | | $ | 2,045,741 | | | $ | 62,356 | | | $ | 383,917 | |
| Capital Loss Carryforwards | | | (412,755 | ) | | | (76,411 | ) | | | (606,112 | ) |
| Unrealized Appreciation (Depreciation) on Investments and Foreign Currency | | | 3,904,227 | | | | (394,791 | ) | | | (2,456,638 | ) |
| Other Temporary Differences | | | (4 | ) | | | (2 | ) | | | 1 | |
| Total Distributable Earnings (Accumulated Losses) | | $ | 5,537,209 | | | $ | (408,848 | ) | | $ | (2,678,832 | ) |
| | | Global X Next
Emerging &
Frontier ETF | | | Global X FTSE
Portugal 20 ETF | |
| Undistributed Ordinary Income | | $ | 1,793,239 | | | $ | 575,663 | |
| Capital Loss Carryforwards | | | (399,316 | ) | | | (257,210 | ) |
| Unrealized Depreciation on Investments and Foreign Currency | | | (2,105,327 | ) | | | (9,559,053 | ) |
| Other Temporary Differences | | | (5 | ) | | | 1 | |
| Total Accumulated Losses | | $ | (711,409 | ) | | $ | (9,240,599 | ) |
For Federal income tax purposes, capital loss carryforwards represent realized losses of the Funds that may be carried forward for a maximum period of eight years and applied against future gains. As of October 31, 2014, the Funds that had capital loss carryforwards are listed below:
| | | | | | | | | Global X | | | Global X | | | Global X | |
| | | | | | Global X | | | China | | | China | | | China | |
| | | Global X China | | | China | | | Financials | | | Industrials | | | Materials | |
| Expiration date | | Consumer ETF | | | Energy ETF | | | ETF | | | ETF | | | ETF | |
| October 2019 | | $ | 1,341,121 | | | $ | 33,912 | | | $ | - | | | $ | - | | | $ | - | |
| October 2018 | | | 173,208 | | | | - | | | | 551,954 | | | | 94,810 | | | | - | |
| | | $ | 1,514,329 | | | $ | 33,912 | | | $ | 551,954 | | | $ | 94,810 | | | $ | - | |
| | | Global X | | | | | | Global X | | | Global X | | | | |
| | | NASDAQ | | | Global X | | | FTSE | | | MSCI | | | Global X | |
| | | China | | | Southeast | | | Andean 40 | | | Colombia | | | Brazil Mid | |
| Expiration date | | Technology | | | Asia ETF | | | ETF | | | ETF | | | Cap ETF | |
| October 2019 | | $ | 236,466 | | | $ | - | | | $ | 120,886 | | | $ | 8,249,654 | | | $ | 918,379 | |
| October 2018 | | | - | | | | - | | | | - | | | | - | | | | - | |
| | | $ | 236,466 | | | $ | - | | | $ | 120,886 | | | $ | 8,249,654 | | | $ | 918,379 | |
| | | | | | Global X | | | Global X | | | | | | | |
| | | | | | Brazil | | | MSCI | | | Global X | | | Global X | |
| | | Global X Brazil | | | Financials | | | Argentina | | | FTSE Greece | | | MSCI | |
| Expiration date | | Consumer ETF | | | ETF | | | ETF | | | 20 ETF | | | Norway ETF | |
| October 2019 | | $ | 563,593 | | | $ | - | | | $ | 414,683 | | | $ | - | | | $ | 1,802,290 | |
| October 2018 | | | - | | | | - | | | | - | | | | - | | | | - | |
| | | $ | 563,593 | | | $ | - | | | $ | 414,683 | | | $ | - | | | $ | 1,802,290 | |
| | | | | | Global X | | | | | | Global X | | | Global X | |
| | | Global X FTSE | | | Central Asia | | | Global X | | | Next | | | FTSE | |
| | | Nordic Region | | | & Mongolia | | | MSCI | | | Emerging & | | | Portugal 20 | |
| Expiration date | | ETF | | | Index ETF | | | Nigeria ETF | | | Frontier ETF | | | ETF | |
| October 2019 | | $ | - | | | $ | - | | | $ | - | | | $ | - | | | $ | - | |
| October 2018 | | | - | | | | - | | | | - | | | | - | | | | - | |
| | | $ | - | | | $ | - | | | $ | - | | | $ | - | | | $ | - | |
Notes to Financial Statements (continued)
April 30, 2015 (Unaudited)
5. TAX INFORMATION (continued)
Under the Regulated Investment Company Modernization Act of 2010, the Funds are permitted to carry forward capital losses incurred in taxable years beginning after December 22, 2010 for an unlimited period. However, any losses incurred during those future taxable years are required to be used prior to the losses incurred in pre-enactment taxable years. As a result of this ordering rule, preenactment capital loss carryforwards may be more likely to expire unused. Additionally, post-enactment capital losses that are carried forward will retain their character as either short-term or long-term capital losses rather than being considered all short-term as under previous law. Losses carried forward under these new provisions are as follows:
Global X Funds | | Short-Term Loss | | | Long-Term Loss | | | Total | |
| Global X China Consumer ETF | | $ | 2,846,972 | | | $ | 12,967,172 | | | $ | 15,814,144 | |
| Global X China Energy ETF | | | 47,040 | | | | 531,933 | | | | 578,973 | |
| Global X China Financials ETF | | | 248,269 | | | | 506,558 | | | | 754,827 | |
| Global X China Industrials ETF | | | 560 | | | | 1,345,791 | | | | 1,346,351 | |
| Global X China Materials ETF | | | 30,358 | | | | 908,101 | | | | 938,459 | |
| Global X NASDAQ China Technology ETF | | | 152,056 | | | | 510,205 | | | | 662,261 | |
| Global X Southeast Asia ETF | | | 1,414,797 | | | | 237,623 | | | | 1,652,420 | |
| Global X FTSE Andean 40 ETF | | | 387,284 | | | | 494,616 | | | | 881,900 | |
| Global X MSCI Colombia ETF | | | 6,755,460 | | | | 4,182,424 | | | | 10,937,884 | |
| Global X Brazil Mid Cap ETF | | | 744,516 | | | | 3,432,908 | | | | 4,177,424 | |
| Global X Brazil Consumer ETF | | | 695,905 | | | | 1,318,963 | | | | 2,014,868 | |
| Global X Brazil Financials ETF | | | 129,982 | | | | 1,013,815 | | | | 1,143,797 | |
| Global X MSCI Argentina ETF | | | 288,330 | | | | 1,103,931 | | | | 1,392,261 | |
| Global X FTSE Greece 20 ETF | | | 4,430,311 | | | | — | | | | 4,430,311 | |
| Global X MSCI Norway ETF | | | 794,087 | | | | 1,201,151 | | | | 1,995,238 | |
| Global X FTSE Nordic Region ETF | | | 355,991 | | | | 56,764 | | | | 412,755 | |
| Global X Central Asia & Mongolia Index ETF | | | 76,411 | | | | — | | | | 76,411 | |
| Global X MSCI Nigeria ETF | | | 228,044 | | | | 378,068 | | | | 606,112 | |
| Global X Next Emerging & Frontier ETF(1) | | | 399,316 | | | | — | | | | 399,316 | |
| Global X FTSE Portugal 20 ETF(2) | | | 257,210 | | | | — | | | | 257,210 | |
(1)Commenced operations November 6, 2013.
(2)Commenced operations November 12, 2013.
During the year ended October 31, 2014 the following funds utilized capital loss carryforwards to offset capital gains amounting to:
| Global X Funds | | | |
| Global X NASDAQ China Technology ETF | | $ | 18,272 | |
| Global X MSCI Norway ETF | | | 431,879 | |
| Global X FTSE Nordic Region ETF | | | 209,783 | |
Notes to Financial Statements (continued)
April 30, 2015 (Unaudited)
5. TAX INFORMATION (continued)
The Federal tax cost and aggregate gross unrealized appreciation and depreciation on investments
held by the Funds at April 30, 2015 were as follows:
Global X Funds | | Federal Tax
Cost | | | Aggregated
Gross
Unrealized
Appreciation | | | Aggregated Gross
Unrealized
(Depreciation) | | | Net
Unrealized
Appreciation (Depreciation) | |
| Global X China Consumer ETF | | $ | 126,550,275 | | | $ | 14,025,109 | | | $ | (16,918,862 | ) | | $ | (2,893,753 | ) |
| Global X China Energy ETF | | | 3,153,227 | | | | 321,859 | | | | (362,233 | ) | | | (40,374 | ) |
| Global X China Financials ETF | | | 91,206,235 | | | | 26,343,796 | | | | (48,013 | ) | | | 26,295,783 | |
| Global X China Industrials ETF | | | 9,706,515 | | | | 2,347,623 | | | | (352,759 | ) | | | 1,994,864 | |
| Global X China Materials ETF | | | 6,849,582 | | | | 659,205 | | | | (434,701 | ) | | | 224,504 | |
| Global X NASDAQ China Technology ETF | | | 16,628,371 | | | | 6,439,955 | | | | (600,818 | ) | | | 5,839,137 | |
| Global X Southeast Asia ETF | | | 24,054,024 | | | | 1,029,354 | | | | (2,815,283 | ) | | | (1,785,929 | ) |
| Global X FTSE Andean 40 ETF | | | 9,843,727 | | | | 175,512 | | | | (2,611,811 | ) | | | (2,436,299 | ) |
| Global X MSCI Colombia ETF | | | 123,953,992 | | | | 2,931,259 | | | | (22,275,741 | ) | | | (19,344,481 | ) |
| Global X Brazil Mid Cap ETF | | | 6,435,001 | | | | 421,796 | | | | (1,948,673 | ) | | | (1,526,876 | ) |
| Global X Brazil Consumer ETF | | | 7,960,796 | | | | 858,362 | | | | (2,249,914 | ) | | | (1,391,551 | ) |
| Global X Brazil Financials ETF | | | 1,514,804 | | | | 40,159 | | | | (309,168 | ) | | | (269,009 | ) |
| Global X MSCI Argentina ETF | | | 20,796,678 | | | | 2,142,334 | | | | (2,724,383 | ) | | | (582,050 | ) |
| Global X FTSE Greece 20 ETF | | | 326,598,503 | | | | 8,902,939 | | | | (47,383,293 | ) | | | (38,480,354 | ) |
| Global X MSCI Norway ETF | | | 126,959,142 | | | | 1,314,858 | | | | (23,624,794 | ) | | | (22,309,937 | ) |
| Global X FTSE Nordic Region ETF | | | 49,686,154 | | | | 8,041,254 | | | | (1,954,585 | ) | | | 6,086,670 | |
| Global X Central Asia & Mongolia Index ETF | | | 3,252,556 | | | | 157,856 | | | | (441,872 | ) | | | (284,017 | ) |
| Global X MSCI Nigeria ETF | | | 35,561,332 | | | | 259,565 | | | | (3,556,025 | ) | | | (3,296,460 | ) |
| Global X Next Emerging & Frontier ETF | | | 147,075,735 | | | | 8,117,999 | | | | (21,945,829 | ) | | | (13,827,831 | ) |
| Global X FTSE Portugal 20 ETF | | | 51,792,490 | | | | 1,465,116 | | | | (6,760,596 | ) | | | (5,295,480 | ) |
| Global X MSCI Pakistan ETF(1) | | | 2,306,923 | | | | 22,824 | | | | (26,445 | ) | | | (3,621 | ) |
(1) The Fund commenced operations on April 22, 2015.
Notes to Financial Statements (continued)
April 30, 2015 (Unaudited)
6. CONCENTRATION OF RISKS
The Funds invest in securities of foreign issuers in several countries. These investments may involve certain considerations and risks not typically associated with investments in the United States as a result of, among other factors, the possibility of future political and economic developments and the level of governmental supervision and regulation of securities markets in the respective countries.
The securities markets of emerging countries are less liquid and subject to greater price volatility, and have a smaller market capitalization, than the U.S. securities markets. In certain countries, there may be fewer publicly traded securities and the market may be dominated by a few issues or sectors.
Issuers and securities markets in such countries are not subject to as extensive and frequent accounting, financial and other reporting requirements or as comprehensive government regulations are issuers and securities markets in the U.S. In particular, the assets and profits appearing on the financial statements of emerging country issuers may not reflect their financial position or results of operations in the same manner as financial statements for U.S. issuers. Substantially less information may be publicly available about emerging country issuers than is available about issuers in the United States.
The Funds may be subject to taxes imposed by countries in which it invests. Such taxes are generally based on either income or gains earned or repatriated. The Funds accrue and apply such taxes to net investment income, net realized gains and net unrealized gains as income and/or capital gains are earned.
The Funds use a replication strategy. A replication strategy is an indexing strategy that involves investing in the securities of the underlying index in approximately the same proportions as in the underlying index. The Funds may utilize a representative sampling strategy with respect to their underlying index when a replication strategy might be detrimental to its shareholders, such as when there are practical difficulties or substantial costs involved in compiling a portfolio of equity securities to follow its underlying index, or, in certain instances, when securities in the underlying index become temporarily illiquid, unavailable or less liquid, or due to legal restrictions (such as diversification requirements that apply to the Funds but not the underlying indexes).
Certain Funds may invest in commodity related securities, which are susceptible to fluctuations in certain commodity markets. Any negative changes in commodity markets could have a great impact on those securities.
7. REVERSE SHARE SPLIT
Effective May 16, 2013, the Global X China Materials ETF and the Global X MSCI Argentina ETF executed a 1-for-2 reverse share split for shareholders of record after the close of markets on May 15, 2013. The effect of this transaction was to divide the number of outstanding shares of the Funds by two, resulting in a corresponding increase in the net asset value per share. The capital share activity presented in the statement of changes in net assets for each of the years in the period then ended, and per share data in the financial highlights for each of the years in the period then ended, have been given retroactive effect to reflect these reverse share splits. There were no changes in net assets, results of operations or total return as a result of these transactions.
Notes to Financial Statements (continued)
April 30, 2015 (Unaudited)
8. LOANS OF PORTFOLIO SECURITIES
The Funds may lend portfolio securities having a market value up to one-third of the Funds’ total assets. Security loans made pursuant to a securities lending agreement are required at all times to be secured by collateral equal to at least 102% for U.S. based securities and 105% for foreign based securities. Such collateral received in connection with these loans will be cash and can be invested in repurchase agreements or U.S. Treasury obligations and is recognized in the Schedule of Investments and Statement of Assets and Liabilities. The obligation to return securities lending collateral is also recognized as a liability in the Statement of Assets and Liabilities. It is the Funds’ policy to obtain additional collateral from or return excess collateral to the borrower by the end of the next business day, following the valuation date of the securities loaned. Therefore, the value of the collateral held may be temporarily less than the value of the securities on loan. Lending securities entails a risk of loss to the Funds if and to the extent that the market value of the securities loans were to increase and the borrower did not increase the collateral accordingly, and the borrower fails to return the securities. The Funds could also experience delays and costs in gaining access to the collateral. The Funds bear the risk of any deficiency in the amount of the collateral available for return to the borrower due to any loss on the collateral invested.
As of April 30, 2015, the value of the securities on loan was $7,515,812, $14,782,848 and $735,633 for the Global X China Consumer ETF, Global X MSCI Norway ETF and Global X FTSE Portugal 20 ETF, respectively. The value of securities purchased with the cash collateral held from securities on loan was $8,209,505, $12,012,280 and $783,899 for the Global X China Consumer ETF, Global X MSCI Norway ETF, and Global X FTSE Portugal 20 ETF, respectively. The value of the cash collateral held from securities on loan was $3,401,322 for the Global X MSCI Norway ETF.
As of April 30, 2015, the following Funds had securities on loan, by counterparty:
| | | Market Value | | | Cash Collateral | |
| Global X China Consumer ETF | | | | | | | | |
| Citigroup | | $ | 1,035,980 | | | $ | 1,024,900 | |
| Deutsche Bank | | | 113,697 | | | | 162,001 | |
| Goldman Sachs | | | 684,328 | | | | 722,640 | |
| Macquarie Capital | | | 2,898,557 | | | | 3,387,007 | |
| Morgan Stanley | | | 2,100,046 | | | | 2,204,257 | |
| National Financial Services | | | 620,768 | | | | 646,000 | |
| UBS Securities | | | 62,436 | | | | 62,700 | |
| Global X MSCI Norway ETF | | | | | | | | |
| Barclays Capital | | | 232,181 | | | | 237,600 | |
| Citigroup | | | 597,066 | | | | 587,850 | |
| Credit Suisse | | | 10,023,853 | | | | 10,555,918 | |
| JPMorgan | | | 252,438 | | | | 254,925 | |
| Morgan Stanley | | | 1,310,725 | | | | 1,327,829 | |
| UBS Securities | | | 2,366,585 | | | | 2,449,480 | |
| Global X FTSE Portugal 20 ETF | | | | | | | | |
| Citigroup | | | 60,355 | | | | 65,800 | |
| Credit Suisse | | | 532,295 | | | | 562,929 | |
| Merrill Lynch Pierce Fenner & Smith | | | 22,864 | | | | 24,214 | |
| Nomura Securities | | | 120,119 | | | | 130,956 | |
Notes to Financial Statements (concluded)
April 30, 2015 (Unaudited)
9. CONTRACTUAL OBLIGATIONS
The Funds enter into contracts in the normal course of business that contain a variety of indemnifications. The Funds’ maximum exposure under these arrangements is unknown. However the Funds have not had prior gains or losses pursuant to these contracts. Management has reviewed the Funds’ existing contracts and expects the risk of loss to be remote.
Pursuant to the Trust’s organizational documents, the Trustees of the Trust and the Trust’s officers are indemnified against certain liabilities that may arise out of the performance of their duties.
10. SUBSEQUENT EVENTS
The Funds have evaluated the need for additional disclosures and/or adjustments resulting from subsequent events. Based on this evaluation, no additional disclosure or adjustments were required to the financial statements as of the date the financial statements were issued, except as follows:
Subsequent to the April 30th period end, the following investment portfolios were added to the Trust.
Fund Name:
Global X High Quality Dividend Yield Index ETF
Global X S&P 500® Catholic Values Custom Index ETF
Subsequent to the April 30th period end, the following investment portfolios of the Trust commenced operations:
| Fund Name: | | Commenced Operations: |
| Global X Scientific Beta US ETF | | May 12, 2015 |
| Global X Scientific Beta Europe ETF | | May 12, 2015 |
| Global X Scientific Beta Asia ex-Japan ETF | | May 12, 2015 |
| Global X Scientific Beta Japan ETF | | May 12, 2015 |
| Global X YieldCo Index ETF | | May 27, 2015 |
Disclosure of Fund Expenses (Unaudited)
All Exchange Traded Funds (“ETF”) have operating expenses. As a shareholder of an ETF, your investment is affected by these ongoing costs, which include (among others) costs for ETF management, administrative services, brokerage fees, and shareholder reports like this one. It is important for you to understand the impact of these costs on your investment returns. In addition, a shareholder is responsible for brokerage fees as a result of their investment in a Fund.
Operating expenses such as these are deducted from an ETF’s gross income and directly reduce your final investment return. These expenses are expressed as a percentage of the ETF’s average net assets; this percentage is known as the ETF’s expense ratio.
The following examples use the expense ratio and are intended to help you understand the ongoing costs (in dollars) of investing in your Fund and to compare these costs with those of other funds. The examples are based on an investment of $1,000 made at the beginning of the period shown and held for the entire period from November 1, 2014 through April 30, 2015.
The table on the next page illustrates your Fund’s costs in two ways:
Actual Fund Return. This section helps you to estimate the actual expenses that your Fund incurred over the period. The “Expenses Paid During Period” column shows the actual dollar expense cost incurred by a $1,000 investment in the Fund, and the “Ending Account Value” number is derived from deducting that expense cost from the Fund’s gross investment return.
You can use this information, together with the actual amount you invested in the Funds, to estimate the expenses you paid over that period. Simply divide your actual account value by $1,000 to arrive at a ratio (for example, an $8,600 account value divided by $1,000 = 8.6), then multiply that ratio by the number shown for your Fund under “Expenses Paid During Period.”
Hypothetical 5% Return. This section helps you compare your Fund’s costs with those of other funds. It assumes that the Funds had an annual 5% return before expenses during the year, but that the expense ratio (Column 3) for the period is unchanged. This example is useful in making comparisons because the Securities and Exchange Commission requires all funds to make this 5% calculation. You can assess your Fund’s comparative cost by comparing the hypothetical result for your Fund in the “Expenses Paid During Period” column with those that appear in the same charts in the shareholder reports for other funds.
NOTE: Because the return is set at 5% for comparison purposes — NOT your Fund’s actual return — the account values shown may not apply to your specific investment.
Disclosure of Fund Expenses (Unaudited) (continued)
| | | Beginning
Account
Value
11/1/2014 | | | Ending
Account
Value
4/30/2015 | | | Annualized
Expense
Ratios | | | Expenses
Paid During
Period(1) | |
| Global X China Consumer ETF |
| Actual Fund Return | | $ | 1,000.00 | | | $ | 1,144.10 | | | | 0.65 | % | | $ | 3.46 | |
| Hypothetical 5% Return | | | 1,000.00 | | | | 1,021.57 | | | | 0.65 | | | | 3.26 | |
| Global X China Energy ETF |
| Actual Fund Return | | $ | 1,000.00 | | | $ | 1,060.30 | | | | 0.65 | % | | $ | 3.32 | |
| Hypothetical 5% Return | | | 1,000.00 | | | | 1,021.57 | | | | 0.65 | | | | 3.26 | |
| Global X China Financials ETF |
| Actual Fund Return | | $ | 1,000.00 | | | $ | 1,442.70 | | | | 0.65 | % | | $ | 3.94 | |
| Hypothetical 5% Return | | | 1,000.00 | | | | 1,021.57 | | | | 0.65 | | | | 3.26 | |
| Global X China Industrials ETF |
| Actual Fund Return | | $ | 1,000.00 | | | $ | 1,521.40 | | | | 0.65 | % | | $ | 4.06 | |
| Hypothetical 5% Return | | | 1,000.00 | | | | 1,021.57 | | | | 0.65 | | | | 3.26 | |
| Global X China Materials ETF |
| Actual Fund Return | | $ | 1,000.00 | | | $ | 1,385.30 | | | | 0.65 | % | | $ | 3.84 | |
| Hypothetical 5% Return | | | 1,000.00 | | | | 1,021.57 | | | | 0.65 | | | | 3.26 | |
| Global X NASDAQ China Technology ETF |
| Actual Fund Return | | $ | 1,000.00 | | | $ | 1,199.90 | | | | 0.65 | % | | $ | 3.55 | |
| Hypothetical 5% Return | | | 1,000.00 | | | | 1,021.57 | | | | 0.65 | | | | 3.26 | |
| Global X Southeast Asia ETF |
| Actual Fund Return | | $ | 1,000.00 | | | $ | 982.20 | | | | 0.65 | % | | $ | 3.19 | |
| Hypothetical 5% Return | | | 1,000.00 | | | | 1,021.57 | | | | 0.65 | | | | 3.26 | |
| Global X FTSE Andean 40 ETF |
| Actual Fund Return | | $ | 1,000.00 | | | $ | 891.90 | | | | 0.72 | % | | $ | 3.38 | |
| Hypothetical 5% Return | | | 1,000.00 | | | | 1,021.22 | | | | 0.72 | | | | 3.61 | |
| Global X MSCI Colombia ETF |
| Actual Fund Return | | $ | 1,000.00 | | | $ | 732.20 | | | | 0.61 | % | | $ | 2.62 | |
| Hypothetical 5% Return | | | 1,000.00 | | | | 1,021.77 | | | | 0.61 | | | | 3.06 | |
| Global X Brazil Mid Cap ETF |
| Actual Fund Return | | $ | 1,000.00 | | | $ | 836.00 | | | | 0.69 | % | | $ | 3.14 | |
| Hypothetical 5% Return | | | 1,000.00 | | | | 1,021.37 | | | | 0.69 | | | | 3.46 | |
| Global X Brazil Consumer ETF |
| Actual Fund Return | | $ | 1,000.00 | | | $ | 815.10 | | | | 0.77 | % | | $ | 3.47 | |
| Hypothetical 5% Return | | | 1,000.00 | | | | 1,020.98 | | | | 0.77 | | | | 3.86 | |
| Global X Brazil Financials ETF |
| Actual Fund Return | | $ | 1,000.00 | | | $ | 835.20 | | | | 0.77 | % | | $ | 3.50 | |
| Hypothetical 5% Return | | | 1,000.00 | | | | 1,020.98 | | | | 0.77 | | | | 3.86 | |
| Global X MSCI Argentina ETF |
| Actual Fund Return | | $ | 1,000.00 | | | $ | 1,037.40 | | | | 0.74 | % | | $ | 3.74 | |
| Hypothetical 5% Return | | | 1,000.00 | | | | 1,021.12 | | | | 0.74 | | | | 3.71 | |
| Global X FTSE Greece 20 ETF |
| Actual Fund Return | | $ | 1,000.00 | | | $ | 772.40 | | | | 0.60 | % | | $ | 2.65 | |
| Hypothetical 5% Return | | | 1,000.00 | | | | 1,021.81 | | | | 0.60 | | | | 3.02 | |
| Global X MSCI Norway ETF |
| Actual Fund Return | | $ | 1,000.00 | | | $ | 948.80 | | | | 0.50 | % | | $ | 2.42 | |
| Hypothetical 5% Return | | | 1,000.00 | | | | 1,022.32 | | | | 0.50 | | | | 2.51 | |
| Global X FTSE Nordic Region ETF |
| Actual Fund Return | | $ | 1,000.00 | | | $ | 1,039.90 | | | | 0.50 | % | | $ | 2.53 | |
| Hypothetical 5% Return | | | 1,000.00 | | | | 1,022.32 | | | | 0.50 | | | | 2.51 | |
| Global X Central Asia & Mongolia Index ETF |
| Actual Fund Return | | $ | 1,000.00 | | | $ | 901.40 | | | | 0.69 | % | | $ | 3.24 | |
| Hypothetical 5% Return | | | 1,000.00 | | | | 1,021.38 | | | | 0.69 | | | | 3.45 | |
| Global X MSCI Nigeria ETF |
| Actual Fund Return | | $ | 1,000.00 | | | $ | 799.70 | | | | 0.68 | % | | $ | 3.03 | |
| Hypothetical 5% Return | | | 1,000.00 | | | | 1,021.42 | | | | 0.68 | | | | 3.41 | |
| Global X Next Emerging & Frontier ETF | | | | | | | | | | | | | | | | |
| Actual Fund Return | | $ | 1,000.00 | | | $ | 930.70 | | | | 0.58 | % | | $ | 2.78 | |
| Hypothetical 5% Return | | | 1,000.00 | | | | 1,021.92 | | | | 0.58 | | | | 2.91 | |
Disclosure of Fund Expenses (Unaudited) (concluded)
| | | Beginning
Account
Value
11/1/2014 | | | Ending
Account
Value
4/30/2015 | | | Annualized
Expense
Ratios | | | Expenses
Paid During
Period(1) | |
Global X FTSE Portugal ETF | | | | | | | | | | | | | | | | |
| Actual Fund Return | | $ | 1,000.00 | | | $ | 998.80 | | | | 0.61 | % | | $ | 3.03 | |
| Hypothetical 5% Return | | | 1,000.00 | | | | 1,021.76 | | | | 0.61 | | | | 3.06 | |
| Global X MSCI Pakistan ETF | | | | | | | | | | | | | | | | |
| Actual Fund Return | | $ | 1,000.00 | | | $ | 1,002.60 | | | | 0.88 | % | | $ | 0.22 | (2) |
| Hypothetical 5% Return | | | 1,000.00 | | | | 1,020.43 | | | | 0.88 | | | | 4.41 | |
| (1) | Expenses are equal to the Fund’s annualized expense ratio multiplied by the average account value over the period, multiplied by 181/365 (to reflect the one-half year period.). |
| (2) | Expenses are equal to the Fund’s annualized expense ratio multiplied by the average account value over the period, multiplied by 8/365 (to reflect the period from inception to date.). |
Approval of Investment Advisory Agreement (Unaudited)
Section 15(c) of the Investment Company Act of 1940, as amended ("1940 Act"), requires the board of trustees (the “Board”) of Global X Funds (the “Trust”), including a majority of those trustees who are not "interested persons," as defined in the 1940 Act ("Independent Trustees"), consider on an initial basis and periodically thereafter, at an in-person meeting called for such purpose, the terms of each fund’s investment advisory agreement and whether to approve entering into, or renewing, each such agreement.
At a quarterly Board meeting held on November 14, 2014, the Board (including the Trust’s Independent Trustees voting separately) considered and unanimously approved the continuation of (i) the Investment Advisory Agreement ("Renewal Investment Advisory Agreement") for each fund covered by this Semi-Annual Report (each, a "Renewal Fund") and (ii) the Supervision and Administration Agreement ("Renewal Supervision and Administration Agreement"), on behalf of each Renewal Fund, between the Trust and Global X Management Company ("Global X Management"). The Renewal Investment Advisory Agreement and the Renewal Supervision and Administration Agreement are collectively referred to herein as the "Renewal Agreements."
In advance of the Board meeting, the Board (including the Trust’s Independent Trustees) and the Independent Trustees’ independent legal counsel requested (in writing) detailed information from Global X Management in connection with the Board’s consideration of the Renewal Agreements, and the Board received and reviewed written responses from Global X Management and supporting materials relating to those requests for information. In the course of their consideration of the Renewal Agreements, the Trust’s Independent Trustees were advised by their counsel and, in addition to meeting with management of Global X Management, they met separately in executive session with their counsel.
In determining to approve the continuation of the Renewal Agreements for each Renewal Fund, the Board considered a variety of actors, including but not limited to the factors discussed in greater detail below. After full consideration of the facts below, as well as other factors that were instructive in their consideration, the Board, including all of the Trust’s Independent Trustees voting separately, concluded that the Renewal Agreements were fair and reasonable and in the best interests of each Renewal Fund and its shareholders.
In reaching this decision, the Board did not assign relative weights to the factors discussed below nor did the Board deem any one factor or group of factors to be determinative. Each member of the Board may have afforded different weight to the various factors.
RENEWAL AGREEMENTS
Nature, Extent and Quality of Services
With respect to this factor, the Board considered:
| • | the terms of the Renewal Agreements and the range of services to be provided to each Renewal Fund in accordance with the Renewal Agreements; |
Approval of Investment Advisory Agreement (Unaudited) (continued)
| • | Global X Management’s key personnel and the portfolio managers who would provide investment advisory, supervision and administrative services to each Renewal Fund; |
| • | Global X Management’s responsibilities under the Renewal Agreements, including, among other things, to: (i) manage the investment operations of each Renewal Fund and the composition of each Renewal Fund’s assets, including the purchase, retention and disposition of its holdings, (ii) provide quarterly reports to the Trust’s officers and the Board and other reports as the Board deems necessary or appropriate, (iii) vote proxies, exercise consents, and exercise all other rights relating to securities and assets held by each Renewal Fund, (iv) select broker-dealers to execute portfolio transactions for each Renewal Fund when necessary, (v) assist in the preparation and filing of reports and proxy statements (if any) for the shareholders of each Renewal Fund, the periodic updating of the registration statement, prospectuses, statements of additional information, and other reports and documents for each Renewal Fund that are required to be filed by the Trust with the Securities and Exchange Commission (“SEC”) and other regulatory and governmental bodies, and (vi) monitor anticipated purchases and redemptions of the shares (including creation units) of each Renewal Fund by shareholders and new investors; |
| • | the nature, extent and quality of the services (including advisory, administrative and compliance services) that have been provided by Global X Management or made available to each Renewal Fund and the adequacy of Global X Management’s personnel resources that would continue to be made available to each Renewal Fund; and |
| • | the quality of Global X Management’s resources and personnel that would be made available to each Renewal Fund, including Global X Management’s experience and the professional qualifications of Global X Management’s key personnel. |
Based on these considerations, the Board concluded that, in the exercise of its business judgment, the nature, extent and quality of the services provided to each Renewal Fund by Global X Management were fair and reasonable.
Performance
With respect to this factor, the Board considered the total return and investment performance of each Renewal Fund (other than the Global X MSCI Pakistan ETF) relative to (i) the performance of unaffiliated comparable specialized and/or focused exchange-traded funds and/or other registered funds in the same industry classification as each of the Renewal Funds, which performance information is publicly available from such registered funds as well as other third party sources; and (ii) the performance of other comparable funds and pertinent indexes.
Based on these considerations and comparisons, the Board concluded that, in the exercise of its business judgment, the investment performance of each Renewal Fund (other than the Global X MSCI Pakistan ETF) supported the Board’s approval of the continuation of the Renewal Agreements.
Approval of Investment Advisory Agreement (Unaudited) (continued)
The Board determined that, because the Global X MSCI Pakistan ETF had not commenced operations, meaningful data relating to its investment performance was not available and, therefore, could not be a factor in approving the Renewal Agreement for the Global X MSCI Pakistan ETF.
Cost of Services and Profitability
The Board considered Global X Management’s costs in providing investment management and related services to each Renewal Fund. In this regard, the Board considered the management fee (“Management Fee”) that has been borne or expected to be borne by each Renewal Fund under the Renewal Agreements for the various investment advisory, supervisory and administrative services that each Renewal Fund requires under a unitary fee structure (including the types of fees and expenses that are not included within the unitary fee and would be borne by each Renewal Fund).
In addition, the Board considered the current and expected profitability to Global X Management from all services provided or expected to be provided to the Renewal Funds, as well as all aspects of Global X Management’s relationship with each of the Renewal Funds. In connection with these considerations, Global X Management provided the Board with financial information regarding its operations and services to the Renewal Funds and discussed with the Board its current and expected profitability with respect to the Renewal Funds.
Based on these considerations, the Board concluded that, in the exercise of its business judgment, the Management Fee paid by each Renewal Fund to Global X Management, as well as the profits anticipated to be realized by Global X Management from its relationship with each of the Renewal Funds, was reasonable and in the best interests of each Renewal Fund and its shareholders.
Comparison of Fees and Services
With respect to this factor, the Board considered:
| • | comparative information with respect to the Management Fee paid to Global X Management by each of the Renewal Funds. In connection with this consideration, Global X Management provided the Board with comparative expense data for each of the Renewal Funds, including fees and expenses paid by unaffiliated comparable specialized and/or focused exchange-traded funds and/or other comparable registered funds, as well as fees and expenses paid by other funds that are series of the Trust under the same unitary Management Fee structure; |
| • | the structure of the unitary Management Fee (which includes, as one component, the investment advisory fee for each Renewal Fund) and the current total expense ratios for each of the Renewal Funds. In this regard, the Board took into consideration that the purpose of adopting a unitary Management Fee structure for the Renewal Funds was to create a simple, all-inclusive fee that would provide a level of predictability with respect to the overall expense ratio (i.e., the total fees) of each of the Renewal Funds and that the |
Approval of Investment Advisory Agreement (Unaudited) (Concluded)
Management Fee for each Renewal Fund was set at a competitive fee to make each Renewal Fund viable in the marketplace; and
| • | that Global X Management is responsible for most ordinary expenses of the Renewal Funds, including the costs of various third-party services required by the Renewal Funds, including investment advisory, administrative, audit, certain custody, portfolio accounting, legal, transfer agency and printing costs, but that each Renewal Fund bears other expenses not covered under the unitary Management Fee, such as asset-based custody fees for certain of the Renewal Funds, taxes, brokerage fees, commissions, and other transaction expenses, interest expenses, and extraordinary expenses. |
Based on these considerations and comparisons regarding fees and expenses, the Board concluded that, in the exercise of its business judgment, it would be in the best interests of each Renewal Fund and its shareholders to approve the Renewal Agreements.
Economies of Scale
With respect to this factor, the Board considered:
| • | the extent to which economies of scale would be realized as the Renewal Funds grow and whether the unitary Management Fee for each Renewal Fund reflected these economies of scale; |
| • | the significant investment of time, personnel and other resources that Global X Management has made and intends to make in the Renewal Funds in order to seek to assure that the Renewal Funds are attractive to investors; and |
| • | that the unitary Management Fee provides a high level of certainty as to the total level of expenses for the Renewal Funds and their shareholders. |
Based on these considerations regarding economies of scale, the Board concluded that, in the exercise of its business judgment, it would be in the best interests of each Renewal Fund and its shareholders to approve the continuation of the Renewal Agreements.
Other Benefits
The Board also considered any other benefits realized by Global X Management as a result of its relationships with each Renewal Fund. As a result, the Board concluded that, in the exercise of its business judgment, all information it considered supported approval of the continuation of the Renewal Agreements.
Supplemental Information (Unaudited)
Net asset value, or “NAV”, is the price per Share at which the Funds issue and redeem Shares. It is calculated in accordance with the standard formula for valuing mutual fund shares. The “Market Price” of the Funds generally is determined using the midpoint between the highest bid and the lowest offer on the stock exchange on which the Shares of the Funds are listed for trading, as of the time that the Funds’ NAV is calculated. The Funds’ Market Price may be at, above or below their NAV. The NAV of the Funds will fluctuate with changes in the market value of the Funds’ holdings. The Market Price of the Funds will fluctuate in accordance with changes in their NAV, as well as market supply and demand.
Premiums or discounts are the differences (expressed as a percentage) between the NAV and Market Price of the Funds on a given day, generally at the time NAV is calculated. A premium is the amount that the Funds are trading above the reported NAV, expressed as a percentage of the NAV. A discount is the amount that the Funds are trading below the reported NAV, expressed as a percentage of the NAV.
Further information regarding premiums and discounts is available on the Funds’ website at www.GlobalXFunds.com.
Notes
Notes
Notes

623 Fifth Avenue, 15th floor
New York, NY 10022
1-888-GXFund-1
(1-888-493-8631)
www.globalxfunds.com
Investment Adviser and Administrator:
Global X Management Company LLC
623 Fifth Avenue, 15th floor
New York, NY 10022
Distributor:
SEI Investments Distribution Co.
One Freedom Valley Drive
Oaks, PA 19456
Sub-Administrator:
SEI Investments Global Funds Services
One Freedom Valley Drive
Oaks, PA 19456
Counsel for Global X Funds and the Independent Trustees:
K&L Gates LLP
1601 K Street N.W.
Washington, DC 20006
Custodian and Transfer Agent:
Brown Brothers Harriman & Co.
40 Water Street
Boston, MA 02109
Independent Registered Public Accounting Firm:
Ernst & Young LLP
2005 Market Street
Suite 700
Philadelphia, PA 19103
This information must be preceded or accompanied by a prospectus for the Funds described.
GLX-SA-002-0400
| Global X SuperDividend® ETF (ticker: SDIV) |
| Global X SuperDividend® U.S. ETF (ticker: DIV) |
| Global X SuperDividend® Emerging Markets ETF (ticker: SRET) |
| Global X SuperDividend® REIT ETF (ticker: SRET) |
| Global X SuperIncome™ Preferred ETF (ticker: SPFF) |
| Global X Social Media Index ETF (ticker: SOCL) |
| Global X | JPMorgan Efficiente Index ETF (ticker: EFFE) |
| Global X | JPMorgan US Sector Rotator Index ETF (ticker: SCTO) |
| Global X Permanent ETF (ticker: PERM) |
| Global X Guru™ Index ETF (ticker: GURU) |
| Global X Guru™ Activist Index ETF (ticker: ACTX) |
| Global X Guru™ International Index ETF (ticker: GURI) |
| Global X Guru™ Small Cap Index ETF (ticker: GURX) |
| Global X GF China Bond ETF (ticker: CHNB) |
Semi-Annual Report
April 30, 2015
The Funds file their complete schedules of Fund holdings with the Securities and Exchange Commission (the “Commission”) for the first and third quarters of each fiscal year on Form N-Q within sixty days after the end of the period. The Funds’ Forms N-Q are available on the Commission’s website at http://www.sec.gov, and may be reviewed and copied at the Commission's Public Reference Room in Washington, DC. Information on the operation of the Public Reference Room may be obtained by calling 1-800-SEC-0330.
A description of the policies and procedures that Global X Funds use to determine how to vote proxies relating to Fund securities, as well as information relating to how the Funds voted proxies relating to Fund securities during the most recent 12-month period ended June 30, is available (i) without charge, upon request, by calling 1-888-GXFund-1; and (ii) on the Commission’s website at http://www.sec.gov.
|
| | |
| Schedule of Investments | April 30, 2015 (Unaudited) |
| | |
| Global X SuperDividend® ETF |
Sector Weightings †:
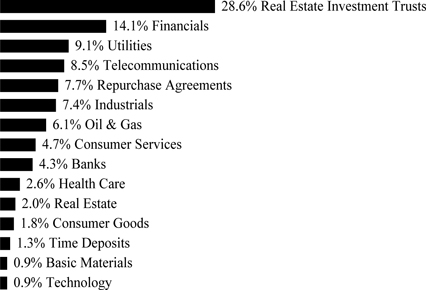
† Sector weightings percentages are based on the total market value of investments. Repurchase agreements purchased from cash collateral received for securities lending activity are included in total investments. Please see Note 7 in Notes to Financial Statements for more detailed information.
| | | Shares | | | Value | |
| COMMON STOCK — 98.2% | | | | | | | | |
| | | | | | | | | |
| AUSTRALIA— 17.3% | | | | | | | | |
| Banks — 4.7% | | | | | | | | |
| Bank of Queensland | | | 964,217 | | | $ | 9,902,042 | |
| Bendigo and Adelaide Bank | | | 1,009,389 | | | | 9,625,512 | |
| Commonwealth Bank of Australia | | | 149,220 | | | | 10,459,747 | |
| National Australia Bank | | | 359,239 | | | | 10,418,761 | |
| Westpac Banking | | | 357,774 | | | | 10,288,793 | |
| | | | | | | | 50,694,855 | |
| Consumer Services — 2.0% | | | | | | | | |
| Myer Holdings (A) | | | 7,432,288 | | | | 8,089,852 | |
| Southern Cross Media Group | | | 14,951,346 | | | | 12,618,364 | |
| | | | | | | | 20,708,216 | |
| Financials — 2.0% | | | | | | �� | | |
| ASX | | | 320,732 | | | | 10,662,986 | |
| IOOF Holdings (A) | | | 1,301,966 | | | | 10,351,402 | |
| | | | | | | | 21,014,388 | |
| Industrials — 1.0% | | | | | | | | |
| Sydney Airport | | | 2,628,793 | | | | 11,175,942 | |
| Oil & Gas — 1.1% | | | | | | | | |
| APA Group | | | 1,543,591 | | | | 11,688,060 | |
| Real Estate Investment Trusts — 3.8% | | | | | | | | |
| Abacus Property Group | | | 4,413,598 | | | | 10,269,606 | |
| Charter Hall Retail | | | 3,152,788 | | | | 10,717,932 | |
The accompanying notes are an integral part of the financial statements.
|
| | |
| Schedule of Investments | April 30, 2015 (Unaudited) |
| | |
| Global X SuperDividend® ETF |
| | | Shares | | | Value | |
| COMMON STOCK — continued | | | | | | | | |
| | | | | | | | | |
| Real Estate Investment Trusts — continued | | | | | | | | |
| Cromwell Property Group | | | 11,758,354 | | | $ | 10,248,205 | |
| Stockland | | | 2,882,636 | | | | 10,095,126 | |
| | | | | | | | 41,330,869 | |
| Telecommunications — 0.9% | | | | | | | | |
| Telstra | | | 2,037,152 | | | | 10,010,378 | |
| Utilities — 1.8% | | | | | | | | |
| DUET Group | | | 5,060,083 | | | | 10,097,576 | |
| Spark Infrastructure Group | | | 6,204,285 | | | | 9,542,569 | |
| | | | | | | | 19,640,145 | |
| TOTAL AUSTRALIA | | | | | | | 186,262,853 | |
| | | | | | | | | |
| BERMUDA— 1.0% | | | | | | | | |
| Industrials — 1.0% | | | | | | | | |
| Ship Finance International (A) | | | 702,883 | | | | 11,077,436 | |
| | | | | | | | | |
| BRAZIL— 3.2% | | | | | | | | |
| Financials — 1.0% | | | | | | | | |
| Banco do Brasil | | | 1,263,900 | | | | 11,037,342 | |
| Telecommunications — 1.2% | | | | | | | | |
| Telefonica Brasil ADR | | | 802,144 | | | | 13,171,204 | |
| Utilities — 1.0% | | | | | | | | |
| Transmissora Alianca de Energia Eletrica | | | 1,512,600 | | | | 9,991,366 | |
| TOTAL BRAZIL | | | | | | | 34,199,912 | |
| | | | | | | | | |
| CANADA— 5.9% | | | | | | | | |
| Consumer Services — 1.2% | | | | | | | | |
| Parkland Fuel (A) | | | 574,250 | | | | 12,487,715 | |
| Oil & Gas — 3.6% | | | | | | | | |
| Crescent Point Energy (A) | | | 425,465 | | | | 11,068,237 | |
| Surge Energy (A) | | | 4,200,535 | | | | 15,224,230 | |
| Veresen (A) | | | 843,280 | | | | 12,629,184 | |
| | | | | | | | 38,921,651 | |
| Real Estate Investment Trusts — 1.1% | | | | | | | | |
| Dream Global Real Estate Investment Trust | | | 1,446,233 | | | | 12,071,344 | |
| TOTAL CANADA | | | | | | | 63,480,710 | |
| | | | | | | | | |
| CHINA— 3.2% | | | | | | | | |
| Consumer Goods — 1.0% | | | | | | | | |
| Pacific Textiles Holdings | | | 7,477,200 | | | | 10,379,708 | |
| Real Estate — 2.2% | | | | | | | | |
| Evergrande Real Estate Group | | | 25,169,900 | | | | 23,867,267 | |
| TOTAL CHINA | | | | | | | 34,246,975 | |
| | | | | | | | | |
| FINLAND— 4.0% | | | | | | | | |
| Basic Materials — 0.9% | | | | | | | | |
| UPM-Kymmene | | | 551,710 | | | | 10,021,312 | |
The accompanying notes are an integral part of the financial statements.
|
| | |
| Schedule of Investments | April 30, 2015 (Unaudited) |
| | |
| Global X SuperDividend® ETF |
| | | Shares | | | Value | |
| COMMON STOCK — continued | | | | | | | | |
| | | | | | | | | |
| Health Care — 1.0% | | | | | | | | |
| Orion, Cl B | | | 334,148 | | | $ | 10,952,051 | |
| Telecommunications — 1.2% | | | | | | | | |
| Elisa | | | 401,809 | | | | 12,287,227 | |
| Utilities — 0.9% | | | | | | | | |
| Fortum | | | 496,124 | | | | 9,839,980 | |
| TOTAL FINLAND | | | | | | | 43,100,570 | |
| | | | | | | | | |
| FRANCE— 7.1% | | | | | | | | |
| Financials — 1.1% | | | | | | | | |
| Euler Hermes | | | 103,441 | | | | 11,301,290 | |
| Industrials — 2.1% | | | | | | | | |
| Bouygues (A) | | | 268,909 | | | | 11,127,955 | |
| Veolia Environnement (A) | | | 558,649 | | | | 11,843,794 | |
| | | | | | | | 22,971,749 | |
| Oil & Gas — 1.0% | | | | | | | | |
| Total | | | 201,380 | | | | 10,940,935 | |
| Real Estate Investment Trusts — 0.9% | | | | | | | | |
| Fonciere Des Regions (A) | | | 104,382 | | | | 9,875,364 | |
| Utilities — 2.0% | | | | | | | | |
| Electricite de France | | | 390,897 | | | | 9,956,174 | |
| Suez Environnement | | | 569,750 | | | | 11,619,473 | |
| | | | | | | | 21,575,647 | |
| TOTAL FRANCE | | | | | | | 76,664,985 | |
| | | | | | | | | |
| GERMANY— 1.0% | | | | | | | | |
| Telecommunications — 1.0% | | | | | | | | |
| Freenet | | | 344,489 | | | | 11,219,575 | |
| | | | | | | | | |
| HONG KONG— 1.0% | | | | | | | | |
| Technology — 1.0% | | | | | | | | |
| VTech Holdings | | | 736,524 | | | | 10,252,793 | |
| | | | | | | | | |
| ISRAEL— 2.2% | | | | | | | | |
| Consumer Services — 1.1% | | | | | | | | |
| Delek Automotive Systems | | | 1,017,673 | | | | 12,352,830 | |
| Telecommunications — 1.1% | | | | | | | | |
| Bezeq The Israeli Telecommunication | | | 6,089,639 | | | | 11,540,022 | |
| TOTAL ISRAEL | | | | | | | 23,892,852 | |
| | | | | | | | | |
| ITALY— 1.0% | | | | | | | | |
| Utilities — 1.0% | | | | | | | | |
| Hera | | | 4,237,819 | | | | 11,187,895 | |
| | | | | | | | | |
| KAZAKHSTAN— 0.9% | | | | | | | | |
| Oil & Gas — 0.9% | | | | | | | | |
| KazMunaiGas Exploration Production JSC GDR | | | 889,578 | | | | 10,096,710 | |
The accompanying notes are an integral part of the financial statements.
|
| | |
| Schedule of Investments | April 30, 2015 (Unaudited) |
| | |
| Global X SuperDividend® ETF |
| | | Shares | | | Value | |
| COMMON STOCK — continued | | | | | | | | |
| | | | | | | | | |
| NIGERIA— 1.3% | | | | | | | | |
| Financials — 1.3% | | | | | | | | |
| FBN Holdings | | | 281,393,800 | | | $ | 13,857,584 | |
| | | | | | | | | |
| PORTUGAL— 1.0% | | | | | | | | |
| Utilities — 1.0% | | | | | | | | |
| Energias de Portugal | | | 2,789,051 | | | | 11,163,455 | |
| | | | | | | | | |
| RUSSIA— 0.9% | | | | | | | | |
| Consumer Services — 0.9% | | | | | | | | |
| CTC Media | | | 2,680,402 | | | | 9,354,603 | |
| | | | | | | | | |
| SINGAPORE— 6.9% | | | | | | | | |
| Industrials — 1.9% | | | | | | | | |
| Hutchison Port Holdings Trust, Cl U | | | 15,168,095 | | | | 10,238,464 | |
| Venture | | | 1,729,861 | | | | 11,035,692 | |
| | | | | | | | 21,274,156 | |
| Real Estate Investment Trusts — 4.0% | | | | | | | | |
| Ascendas | | | 5,824,349 | | | | 10,861,154 | |
| Mapletree Industrial Trust | | | 9,096,800 | | | | 11,057,226 | |
| Mapletree Logistics Trust | | | 11,743,863 | | | | 10,905,554 | |
| Suntec Real Estate Investment Trust | | | 7,422,685 | | | | 9,918,955 | |
| | | | | | | | 42,742,889 | |
| Telecommunications — 1.0% | | | | | | | | |
| StarHub | | | 3,309,306 | | | | 10,568,393 | |
| TOTAL SINGAPORE | | | | | | | 74,585,438 | |
| | | | | | | | | |
| SOUTH AFRICA— 1.0% | | | | | | | | |
| Real Estate Investment Trusts — 1.0% | | | | | | | | |
| Redefine Properties | | | 10,786,050 | | | | 10,879,737 | |
| | | | | | | | | |
| SPAIN— 1.0% | | | | | | | | |
| Financials — 1.0% | | | | | | | | |
| Banco Santander | | | 1,446,966 | | | | 10,954,150 | |
| | | | | | | | | |
| SWEDEN— 1.0% | | | | | | | | |
| Telecommunications — 1.0% | | | | | | | | |
| TeliaSonera | | | 1,744,817 | | | | 10,865,471 | |
| | | | | | | | | |
| UNITED KINGDOM— 7.1% | | | | | | | | |
| Financials — 6.1% | | | | | | | | |
| Admiral Group | | | 468,817 | | | | 11,224,749 | |
| Amlin | | | 1,398,978 | | | | 9,863,707 | |
| Intermediate Capital Group | | | 1,369,926 | | | | 11,105,175 | |
| Phoenix Group Holdings | | | 830,727 | | | | 10,768,352 | |
| Provident Financial | | | 254,110 | | | | 11,773,753 | |
| Standard Life | | | 1,589,993 | | | | 11,432,840 | |
| | | | | | | | 66,168,576 | |
The accompanying notes are an integral part of the financial statements.
|
| | |
| Schedule of Investments | April 30, 2015 (Unaudited) |
| | |
| Global X SuperDividend® ETF |
| | | Shares | | | Value | |
| COMMON STOCK — continued | | | | | | | | |
| | | | | | | | | |
| Utilities — 1.0% | | | | | | | | |
| SSE | | | 449,193 | | | $ | 10,678,964 | |
| TOTAL UNITED KINGDOM | | | | | | | 76,847,540 | |
| | | | | | | | | |
| UNITED STATES— 30.2% | | | | | | | | |
| Consumer Goods — 0.9% | | | | | | | | |
| Vector Group | | | 454,408 | | | | 10,065,137 | |
| Financials — 2.9% | | | | | | | | |
| Arlington Asset Investment, Cl A | | | 424,624 | | | | 9,205,848 | |
| BGC Partners, Cl A | | | 1,116,624 | | | | 11,205,322 | |
| New York Community Bancorp | | | 638,129 | | | | 10,969,437 | |
| | | | | | | | 31,380,607 | |
| Health Care — 1.9% | | | | | | | | |
| AstraZeneca | | | 155,315 | | | | 10,732,326 | |
| PDL BioPharma (A) | | | 1,448,049 | | | | 9,658,487 | |
| | | | | | | | 20,390,813 | |
| Industrials — 2.1% | | | | | | | | |
| Costamare | | | 553,132 | | | | 11,189,860 | |
| RR Donnelley & Sons | | | 583,459 | | | | 10,864,007 | |
| | | | | | | | 22,053,867 | |
| Real Estate Investment Trusts — 20.5% | | | | | | | | |
| American Capital Mortgage Investment | | | 577,050 | | | | 10,121,457 | |
| Annaly Capital Management | | | 983,442 | | | | 9,903,261 | |
| Apollo Commercial Real Estate Finance | | | 630,192 | | | | 10,769,981 | |
| ARMOUR Residential | | | 3,390,023 | | | | 10,170,069 | |
| Capstead Mortgage | | | 882,238 | | | | 10,278,073 | |
| Chimera Investment | | | 656,871 | | | | 9,977,871 | |
| CYS Investments | | | 1,184,636 | | | | 10,566,953 | |
| Franklin Street Properties | | | 831,401 | | | | 9,818,846 | |
| Hatteras Financial | | | 567,020 | | | | 10,240,381 | |
| Hospitality Properties Trust | | | 332,238 | | | | 9,993,719 | |
| Invesco Mortgage Capital | | | 684,624 | | | | 10,543,210 | |
| Investors Real Estate Trust | | | 1,381,711 | | | | 9,906,868 | |
| Medical Properties Trust | | | 698,156 | | | | 9,760,221 | |
| New York Mortgage Trust (A) | | | 1,353,414 | | | | 10,570,163 | |
| NorthStar Realty Finance | | | 561,098 | | | | 10,526,198 | |
| Omega Healthcare Investors | | | 261,333 | | | | 9,431,508 | |
| PennyMac Mortgage Investment Trust | | | 491,038 | | | | 10,287,246 | |
| RAIT Financial Trust | | | 1,431,835 | | | | 9,278,291 | |
| Resource Capital | | | 2,160,425 | | | | 9,527,474 | |
| Sabra Health Care | | | 324,168 | | | | 9,686,140 | |
| Senior Housing Properties Trust | | | 466,670 | | | | 9,552,735 | |
| Starwood Property Trust | | | 431,897 | | | | 10,369,847 | |
| | | | | | | | 221,280,512 | |
The accompanying notes are an integral part of the financial statements.
|
| | |
| Schedule of Investments | April 30, 2015 (Unaudited) |
| | |
| Global X SuperDividend® ETF |
| | | Shares/Face
Amount(1) | | | Value | |
| COMMON STOCK — continued | | | | | | | | |
| | | | | | | | | |
| Telecommunications — 1.9% | | | | | | | | |
| Consolidated Communications Holdings | | | 440,306 | | | $ | 9,277,247 | |
| Frontier Communications | | | 1,270,090 | | | | 8,712,817 | |
| Windstream Holdings (A) | | | 202,976 | | | | 2,370,760 | |
| | | | | | | | 20,360,824 | |
| TOTAL UNITED STATES | | | | | | | 325,531,766 | |
| TOTAL COMMON STOCK | | | | | | | | |
| (Cost $1,015,170,981) | | | | | | | 1,059,723,004 | |
| | | | | | | | | |
| PREFERRED STOCK — 0.9% | | | | | | | | |
| | | | | | | | | |
| BRAZIL— 0.9% | | | | | | | | |
| Utilities — 0.9% | | | | | | | | |
| AES Tiete | | | | | | | | |
| (Cost $14,589,945) | | | 1,745,656 | | | | 9,947,571 | |
| | | | | | | | | |
| REPURCHASE AGREEMENTS — 8.4% | | | | | | | | |
| Barclays | | | | | | | | |
| 0.100%, dated 04/30/15, to be repurchased on 05/01/15 repurchase price $84,000,233 (collateralized by U.S. Treasury Obligations, ranging in par value $0- $81,406,618, 0.000%-3.000%, 05/31/15-05/15/37 with a total market value of $85,680,033)(B) | | | 84,000,000 | | | | 84,000,000 | |
| Deutsche Bank | | | | | | | | |
| 0.100%, dated 04/30/15, to be repurchased on 05/01/15 repurchase price $6,695,755 (collateralized by U.S. Treasury Notes, par value $6,743,767, 1.500%, 11/30/19 with a total market value of $6,804,393)(B) | | | 6,695,736 | | | | 6,695,736 | |
| TOTAL REPURCHASE AGREEMENTS | | | | | | | | |
| (Cost $90,695,736) | | | | | | | 90,695,736 | |
| | | | | | | | | |
| TIME DEPOSITS — 1.4% | | | | | | | | |
| Brown Brothers Harriman | | | | | | | | |
| 0.030%, 05/01/15 | | | 15,235,459 | | | | 15,235,459 | |
| 1.460%, 05/01/15, AUD | | | 576 | | | | 454 | |
| 0.150%, 05/01/15, CAD | | | 59 | | | | 49 | |
| (0.195%), 05/01/15, EUR | | | 30,347 | | | | 34,005 | |
| 0.080%, 05/01/15, GBP | | | 22 | | | | 34 | |
| TOTAL TIME DEPOSITS | | | | | | | | |
| (Cost $15,270,001) | | | | | | | 15,270,001 | |
| | | | | | | | | |
| TOTAL INVESTMENTS — 108.9% | | | | | | | | |
| (Cost $1,135,726,663) | | | | | | $ | 1,175,636,312 | |
Percentages are based on Net Assets of $1,079,524,186.
| * | Non-income producing security. |
| (1) | In U.S. Dollars unless otherwise indicated. |
| (A) | This security or a partial position of this security is on loan at April 30, 2015. The total value of securities on loan at April 30, 2015 was $88,484,305. |
| (B) | These securities were purchased with cash collateral held from securities on loan. The total value of such securities as of April 30, 2015 was $90,695,736. |
The accompanying notes are an integral part of the financial statements.
|
| | |
| Schedule of Investments | April 30, 2015 (Unaudited) |
| | |
| Global X SuperDividend® ETF |
| ADR — American Depositary Receipt |
| AUD — Australian Dollar |
| CAD — Canadian Dollar |
| Cl — Class |
| EUR — Euro |
| GBP — British Pound Sterling |
| GDR — Global Depositary Receipt |
The following is a summary of the inputs used as of April 30, 2015, in valuing the Fund's investments carried at value:
| Investments in Securities | | Level 1 | | | Level 2 | | | Level 3 | | | Total | |
| Common Stock | | $ | 1,059,723,004 | | | $ | — | | | $ | — | | | $ | 1,059,723,004 | |
| Preferred Stock | | | 9,947,571 | | | | — | | | | — | | | | 9,947,571 | |
| Repurchase Agreements | | | — | | | | 90,695,736 | | | | — | | | | 90,695,736 | |
| Time Deposits | | | — | | | | 15,270,001 | | | | — | | | | 15,270,001 | |
| Total Investments in Securities | | $ | 1,069,670,575 | | | $ | 105,965,737 | | | $ | — | | | $ | 1,175,636,312 | |
For the period ended April 30, 2015, there have been no transfers between Level 1, Level 2 or Level 3 investments.
As of April 30, 2015, there were no Level 3 investments.
The accompanying notes are an integral part of the financial statements.
|
| | |
| Schedule of Investments | April 30, 2015 (Unaudited) |
| | |
| Global X SuperDividend® U.S. ETF |
Sector Weightings †:
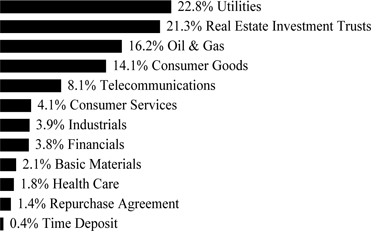
† Sector weightings percentages are based on the total market value of investments. Repurchase agreements purchased from cash collateral received for securities lending activity are included in total investments. Please see Note 7 in Notes to Financial Statements for more detailed information.
| | | Shares | | | Value | |
| COMMON STOCK — 79.0% | | | | | | | | |
| | | | | | | | | |
| UNITED STATES— 79.0% | | | | | | | | |
| Basic Materials — 2.2% | | | | | | | | |
| Kronos Worldwide | | | 471,092 | | | $ | 6,336,187 | |
| Consumer Goods — 14.3% | | | | | | | | |
| Altria Group | | | 105,000 | | | | 5,255,250 | |
| B&G Foods | | | 206,745 | | | | 6,285,048 | |
| Lorillard | | | 84,995 | | | | 5,937,751 | |
| Mattel | | | 226,652 | | | | 6,382,520 | |
| Philip Morris International | | | 70,305 | | | | 5,868,358 | |
| Reynolds American | | | 79,808 | | | | 5,849,927 | |
| Universal | | | 124,641 | | | | 5,861,866 | |
| | | | | | | | 41,440,720 | |
| Consumer Services — 2.0% | | | | | | | | |
| Six Flags Entertainment | | | 123,898 | | | | 5,825,684 | |
| Financials — 3.8% | | | | | | | | |
| Arlington Asset Investment, Cl A | | | 235,250 | | | | 5,100,220 | |
| New York Community Bancorp | | | 353,568 | | | | 6,077,834 | |
| | | | | | | | 11,178,054 | |
| Health Care — 1.8% | | | | | | | | |
| PDL BioPharma (A) | | | 802,338 | | | | 5,351,595 | |
| Industrials — 4.0% | | | | | | | | |
| Covanta Holding | | | 274,075 | | | | 5,560,982 | |
| Macquarie Infrastructure | | | 72,923 | | | | 6,035,107 | |
| | | | | | | | 11,596,089 | |
| Real Estate Investment Trusts — 21.5% | | | | | | | | |
| AG Mortgage Investment Trust | | | 313,455 | | | | 6,024,605 | |
| Apollo Commercial Real Estate Finance | | | 349,165 | | | | 5,967,230 | |
The accompanying notes are an integral part of the financial statements.
|
| | |
| Schedule of Investments | April 30, 2015 (Unaudited) |
| | |
| Global X SuperDividend® U.S. ETF |
| | | Shares | | | Value | |
| COMMON STOCK — continued | | | | | | | | |
| | | | | | | | | |
| Real Estate Investment Trusts — continued | | | | | | | | |
| Apollo Residential Mortgage | | | 370,698 | | | $ | 5,879,270 | |
| Capstead Mortgage | | | 488,844 | | | | 5,695,033 | |
| Chimera Investment | | | 363,964 | | | | 5,528,613 | |
| Colony Capital | | | 232,588 | | | | 6,026,355 | |
| Communications Sales & Leasing * | | | 135,359 | | | | 4,071,587 | |
| CYS Investments | | | 656,431 | | | | 5,855,364 | |
| New York Mortgage Trust (A) | | | 749,939 | | | | 5,857,024 | |
| Starwood Property Trust | | | 239,351 | | | | 5,746,817 | |
| Western Asset Mortgage Capital (A) | | | 409,931 | | | | 5,989,092 | |
| | | | | | | | 62,640,990 | |
| Telecommunications — 8.2% | | | | | | | | |
| AT&T | | | 171,422 | | | | 5,938,058 | |
| CenturyLink | | | 157,815 | | | | 5,675,027 | |
| Frontier Communications | | | 703,756 | | | | 4,827,766 | |
| Verizon Communications | | | 119,304 | | | | 6,017,694 | |
| Windstream Holdings (A) | | | 112,798 | | | | 1,317,485 | |
| | | | | | | | 23,776,030 | |
| Utilities — 21.2% | | | | | | | | |
| Ameren | | | 135,956 | | | | 5,566,039 | |
| Avista | | | 170,691 | | | | 5,567,940 | |
| Consolidated Edison | | | 91,652 | | | | 5,641,181 | |
| Duke Energy | | | 74,161 | | | | 5,752,669 | |
| Empire District Electric | | | 229,216 | | | | 5,402,621 | |
| Entergy | | | 73,673 | | | | 5,686,082 | |
| Northwest Natural Gas (A) | | | 121,817 | | | | 5,688,854 | |
| Pepco Holdings | | | 214,394 | | | | 5,569,956 | |
| PPL | | | 167,001 | | | | 5,683,044 | |
| Southern | | | 126,640 | | | | 5,610,152 | |
| TECO Energy | | | 292,202 | | | | 5,537,228 | |
| | | | | | | | 61,705,766 | |
| TOTAL COMMON STOCK | | | | | | | | |
| (Cost $226,999,342) | | | | | | | 229,851,115 | |
| | | | | | | | | |
| MASTER LIMITED PARTNERSHIPS — 20.5% | | | | | | | | |
| | | | | | | | | |
| UNITED STATES— 20.5% | | | | | | | | |
| Consumer Services — 2.1% | | | | | | | | |
| Stonemor Partners | | | 202,397 | | | | 6,193,348 | |
| Oil & Gas — 18.4% | | | | | | | | |
| Crestwood Midstream Partners (A) | | | 418,462 | | | | 6,640,992 | |
| CSI Compressco | | | 350,646 | | | | 7,433,695 | |
| Enbridge Energy Partners | | | 147,431 | | | | 5,475,587 | |
| Energy Transfer Partners | | | 97,011 | | | | 5,605,295 | |
| Ferrellgas Partners | | | 231,832 | | | | 5,677,566 | |
| Martin Midstream Partners (A) | | | 192,496 | | | | 7,141,602 | |
The accompanying notes are an integral part of the financial statements.
|
| | |
| Schedule of Investments | April 30, 2015 (Unaudited) |
| | |
| Global X SuperDividend® U.S. ETF |
| | | Shares/Face
Amount | | | Value | |
| MASTER LIMITED PARTNERSHIPS — continued | | | | | | | | |
| | | | | | | | | |
| Oil & Gas — continued | | | | | | | | |
| Memorial Production Partners | | | 335,526 | | | $ | 6,012,626 | |
| Natural Resource Partners (A) | | | 735,356 | | | | 3,750,316 | |
| TC PipeLines | | | 82,000 | | | | 5,582,560 | |
| | | | | | | | 53,320,239 | |
| TOTAL MASTER LIMITED PARTNERSHIP | | | | | | | | |
| (Cost $56,840,369) | | | | | | | 59,513,587 | |
| | | | | | | | | |
| REPURCHASE AGREEMENT — 1.4% | | | | | | | | |
| Deutsche Bank | | | | | | | | |
| 0.100%, dated 04/30/15, to be repurchased on 05/01/15 repurchase price $4,108,692 (collateralized by U.S. Treasury Notes, par value $4,138,154, 1.500%, 11/30/19 with a total market value of $4,175,356)(B) | | | | | | | | |
| (Cost $4,108,681) | | $ | 4,108,681 | | | | 4,108,681 | |
| | | | | | | | | |
| TIME DEPOSIT — 0.4% | | | | | | | | |
| Brown Brothers Harriman, 0.030%, 05/01/15 | | | | | | | | |
| (Cost $1,193,613) | | | 1,193,613 | | | | 1,193,613 | |
| | | | | | | | | |
| TOTAL INVESTMENTS — 101.3% | | | | | | | | |
| (Cost $289,142,005) | | | | | | $ | 294,666,996 | |
Percentages are based on Net Assets of $290,897,771.
| * | Non-income producing security. |
| (A) | This security or a partial position of this security is on loan at April 30, 2015. The total value of securities on loan at April 30, 2015 was $11,105,280. |
| (B) | These securities were purchased with cash collateral held from securities on loan. The total value of such securities as of April 30, 2015 was $4,108,681. |
Cl — Class
The following is a summary of the inputs used as of April 30, 2015, in valuing the Fund's investments carried at value:
| Investments in Securities | | Level 1 | | | Level 2 | | | Level 3 | | | Total | |
| Common Stock | | $ | 229,851,115 | | | $ | — | | | $ | — | | | $ | 229,851,115 | |
| Master Limited Partnerships | | | 59,513,587 | | | | — | | | | — | | | | 59,513,587 | |
| Repurchase Agreement | | | — | | | | 4,108,681 | | | | — | | | | 4,108,681 | |
| Time Deposit | | | — | | | | 1,193,613 | | | | — | | | | 1,193,613 | |
| Total Investments in Securities | | $ | 289,364,702 | | | $ | 5,302,294 | | | $ | — | | | $ | 294,666,996 | |
For the period ended April 30, 2015, there have been no transfers between Level 1, Level 2 or Level 3 investments.
As of April 30, 2015, there were no Level 3 investments.
The accompanying notes are an integral part of the financial statements.
|
| | |
| Schedule of Investments | April 30, 2015 (Unaudited) |
| | |
| Global X SuperDividend® Emerging Markets ETF |
Sector Weightings †:
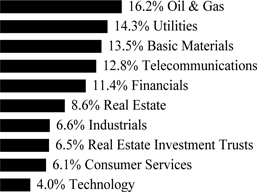
† Sector weightings percentages are based on the total market value of investments.
| | | Shares | | | Value | |
| COMMON STOCK — 92.5% | | | | | | | | |
| | | | | | | | | |
| BRAZIL— 12.8% | | | | | | | | |
| Consumer Services — 1.4% | | | | | | | | |
| Multiplus | | | 4,800 | | | $ | 53,137 | |
| Industrials — 3.0% | | | | | | | | |
| CCR | | | 11,200 | | | | 61,806 | |
| EcoRodovias Infraestrutura e Logistica | | | 16,400 | | | | 48,505 | |
| | | | | | | | 110,311 | |
| Oil & Gas — 2.7% | | | | | | | | |
| Petroleo Brasileiro ADR | | | 10,400 | | | | 98,800 | |
| Utilities — 5.7% | | | | | | | | |
| CPFL Energia | | | 10,319 | | | | 67,339 | |
| EDP - Energias do Brasil | | | 19,600 | | | | 73,457 | |
| Light | | | 12,000 | | | | 68,742 | |
| | | | | | | | 209,538 | |
| TOTAL BRAZIL | | | | | | | 471,786 | |
| | | | | | | | | |
| CHINA— 18.6% | | | | | | | | |
| Basic Materials — 2.5% | | | | | | | | |
| China Hongqiao Group | | | 99,200 | | | | 92,786 | |
| Consumer Services — 3.1% | | | | | | | | |
| Intime Retail Group | | | 102,000 | | | | 114,486 | |
| Financials — 1.9% | | | | | | | | |
| SOHO China | | | 90,400 | | | | 68,694 | |
| Oil & Gas — 2.6% | | | | | | | | |
| Sinopec Engineering Group, Cl H | | | 87,600 | | | | 94,820 | |
| Real Estate — 8.5% | | | | | | | | |
| Agile Property Holdings | | | 102,800 | | | | 86,206 | |
| Country Garden Holdings | | | 157,200 | | | | 85,180 | |
| Evergrande Real Estate Group | | | 150,800 | | | | 142,995 | |
| | | | | | | | 314,381 | |
| TOTAL CHINA | | | | | | | 685,167 | |
The accompanying notes are an integral part of the financial statements.
|
| | |
| Schedule of Investments | April 30, 2015 (Unaudited) |
| | |
| Global X SuperDividend® Emerging Markets ETF |
| | | Shares | | | Value | |
| COMMON STOCK — continued | | | | | | | | |
| | | | | | | | | |
| CZECH REPUBLIC— 2.0% | | | | | | | | |
| Utilities — 2.0% | | | | | | | | |
| CEZ | | | 2,800 | | | $ | 72,693 | |
| | | | | | | | | |
| HONG KONG— 2.7% | | | | | | | | |
| Financials — 2.7% | | | | | | | | |
| KWG Property Holding | | | 98,000 | | | | 99,503 | |
| | | | | | | | | |
| INDIA— 5.4% | | | | | | | | |
| Basic Materials — 1.6% | | | | | | | | |
| NMDC | | | 28,400 | | | | 57,346 | |
| Financials — 1.7% | | | | | | | | |
| Indiabulls Housing Finance | | | 6,600 | | | | 61,688 | |
| Technology — 2.1% | | | | | | | | |
| Hexaware Technologies | | | 17,600 | | | | 78,017 | |
| TOTAL INDIA | | | | | | | 197,051 | |
| | | | | | | | | |
| MALAYSIA— 7.0% | | | | | | | | |
| Basic Materials — 1.8% | | | | | | | | |
| HAP Seng Consolidated | | | 51,600 | | | | 66,936 | |
| Financials — 1.8% | | | | | | | | |
| Malayan Banking | | | 26,000 | | | | 67,236 | |
| Telecommunications — 1.7% | | | | | | | | |
| Maxis | | | 32,400 | | | | 63,135 | |
| Utilities — 1.7% | | | | | | | | |
| YTL | | | 129,600 | | | | 60,770 | |
| TOTAL MALAYSIA | | | | | | | 258,077 | |
| | | | | | | | | |
| MEXICO— 3.2% | | | | | | | | |
| Real Estate Investment Trusts — 3.2% | | | | | | | | |
| Mexico Real Estate Management | | | 38,800 | | | | 58,651 | |
| PLA Administradora Industrial S de RL | | | 29,600 | | | | 58,291 | |
| TOTAL MEXICO | | | | | | | 116,942 | |
| | | | | | | | | |
| POLAND— 3.9% | | | | | | | | |
| Telecommunications — 2.0% | | | | | | | | |
| Orange Polska | | | 26,000 | | | | 73,481 | |
| Utilities — 1.9% | | | | | | | | |
| PGE | | | 12,000 | | | | 68,992 | |
| TOTAL POLAND | | | | | | | 142,473 | |
| | | | | | | | | |
| RUSSIA— 12.6% | | | | | | | | |
| Basic Materials — 1.9% | | | | | | | | |
| MMC Norilsk Nickel ADR | | | 3,800 | | | | 71,364 | |
The accompanying notes are an integral part of the financial statements.
|
| | |
| Schedule of Investments | April 30, 2015 (Unaudited) |
| | |
| Global X SuperDividend® Emerging Markets ETF |
| | | Shares | | | Value | |
| COMMON STOCK — continued | | | | | | | | |
| | | | | | | | | |
| Oil & Gas — 5.1% | | | | | | | | |
| Gazprom OAO ADR | | | 15,600 | | | $ | 92,414 | |
| Rosneft OAO GDR | | | 19,200 | | | | 94,848 | |
| | | | | | | | 187,262 | |
| Telecommunications — 5.6% | | | | | | | | |
| Mobile TeleSystems ADR | | | 8,000 | | | | 96,640 | |
| Sistema GDR | | | 14,000 | | | | 105,700 | |
| | | | | | | | 202,340 | |
| TOTAL RUSSIA | | | | | | | 460,966 | |
| | | | | | | | | |
| SOUTH AFRICA— 12.8% | | | | | | | | |
| Basic Materials — 2.5% | | | | | | | | |
| Assore | | | 4,600 | | | | 44,380 | |
| Kumba Iron Ore | | | 3,400 | | | | 45,545 | |
| | | | | | | | 89,925 | |
| Financials — 1.6% | | | | | | | | |
| Capital Property Fund | | | 50,800 | | | | 58,124 | |
| Oil & Gas — 1.6% | | | | | | | | |
| Exxaro Resources | | | 7,000 | | | | 56,931 | |
| Real Estate Investment Trusts — 3.2% | | | | | | | | |
| Growthpoint Properties | | | 24,800 | | | | 57,892 | |
| Redefine Properties | | | 64,000 | | | | 64,557 | |
| | | | | | | | 122,449 | |
| Technology — 1.9% | | | | | | | | |
| Sasol | | | 1,700 | | | | 68,339 | |
| Telecommunications — 2.0% | | | | | | | | |
| MTN Group | | | 3,600 | | | | 71,963 | |
| TOTAL SOUTH AFRICA | | | | | | | 467,731 | |
| | | | | | | | | |
| THAILAND— 3.5% | | | | | | | | |
| Oil & Gas — 1.9% | | | | | | | | |
| PTT Exploration & Production | | | 19,200 | | | | 68,145 | |
| Telecommunications — 1.6% | | | | | | | | |
| Intouch Holdings | | | 25,600 | | | | 59,797 | |
| TOTAL THAILAND | | | | | | | 127,942 | |
| | | | | | | | | |
| TURKEY— 3.0% | | | | | | | | |
| Consumer Services — 1.4% | | | | | | | | |
| Dogus Otomotiv Servis ve Ticaret | | | 10,800 | | | | 52,483 | |
| Industrials — 1.6% | | | | | | | | |
| Turk Traktor ve Ziraat Makineleri | | | 1,900 | | | | 56,748 | |
| TOTAL TURKEY | | | | | | | 109,231 | |
| | | | | | | | | |
| UNITED KINGDOM— 3.0% | | | | | | | | |
| Basic Materials — 3.0% | | | | | | | | |
| Vedanta Resources | | | 11,200 | | | | 108,176 | |
The accompanying notes are an integral part of the financial statements.
|
| | |
| Schedule of Investments | April 30, 2015 (Unaudited) |
| | |
| Global X SuperDividend® Emerging Markets ETF |
| | | Shares | | | Value | |
| COMMON STOCK — continued | | | | | | | | |
| | | | | | | | | |
| UNITED STATES— 2.0% | | | | | | | | |
| Industrials — 2.0% | | | | | | | | |
| Costamare | | | 3,600 | | | $ | 72,828 | |
| TOTAL COMMON STOCK | | | | | | | | |
| (Cost $2,862,762) | | | | | | | 3,390,566 | |
| | | | | | | | | |
| PREFERRED STOCK — 6.6% | | | | | | | | |
| | | | | | | | | |
| BRAZIL— 4.4% | | | | | | | | |
| Financials — 1.6% | | | | | | | | |
| Bradespar | | | 14,400 | | | | 57,858 | |
| Utilities — 2.8% | | | | | | | | |
| Cia Energetica de Sao Paulo | | | 7,200 | | | | 44,846 | |
| Cia Paranaense de Energia | | | 5,400 | | | | 59,582 | |
| | | | | | | | 104,428 | |
| TOTAL BRAZIL | | | | | | | 162,286 | |
| | | | | | | | | |
| RUSSIA— 2.2% | | | | | | | | |
| Oil & Gas — 2.2% | | | | | | | | |
| Surgutneftegas OAO | | | 106,400 | | | | 80,125 | |
| TOTAL PREFERRED STOCK | | | | | | | | |
| (Cost $233,195) | | | | | | | 242,411 | |
| TOTAL INVESTMENTS — 99.1% | | | | | | | | |
| (Cost $3,095,957) | | | | | | $ | 3,632,977 | |
Percentages are based on Net Assets of $3,664,623.
| ADR — American Depositary Receipt |
| Cl — Class |
| GDR — Global Depositary Receipt |
The following is a summary of the inputs used as of April 30, 2015, in valuing the Fund's investments carried at value:
| Investments in Securities | | Level 1 | | | Level 2 | | | Level 3 | | | Total | |
| Common Stock | | $ | 3,323,630 | | | $ | 66,936 | | | $ | — | | | $ | 3,390,566 | |
| Preferred Stock | | | 162,286 | | | | 80,125 | | | | — | | | | 242,411 | |
| Total Investments in Securities | | $ | 3,485,916 | | | $ | 147,061 | | | $ | — | | | $ | 3,632,977 | |
For the period ended April 30, 2015, there have been no transfers between Level 1, Level 2 or Level 3 investments.
As of April 30, 2015, there were no Level 3 investments.
The accompanying notes are an integral part of the financial statements.
|
| | |
| Schedule of Investments | April 30, 2015 (Unaudited) |
| | |
| Global X SuperDividend® REIT ETF |
Sector Weightings †:

† Sector weightings percentages are based on the total market value of investments.
| | | Shares | | | Value | |
| COMMON STOCK — 99.4% | | | | | | | | |
| | | | | | | | | |
| AUSTRALIA— 10.5% | | | | | | | | |
| Real Estate Investment Trusts — 10.5% | | | | | | | | |
| GPT Group | | | 21,900 | | | $ | 77,213 | |
| Novion Property Group | | | 42,900 | | | | 83,578 | |
| Stockland | | | 22,800 | | | | 79,847 | |
| TOTAL AUSTRALIA | | | | | | | 240,638 | |
| | | | | | | | | |
| CANADA— 10.5% | | | | | | | | |
| Real Estate Investment Trusts — 10.5% | | | | | | | | |
| Cominar Real Estate Investment Trust | | | 5,100 | | | | 80,505 | |
| H&R Real Estate Investment Trust | | | 4,050 | | | | 77,406 | |
| RioCan Real Estate Investment Trust | | | 3,350 | | | | 82,585 | |
| TOTAL CANADA | | | | | | | 240,496 | |
| | | | | | | | | |
| SOUTH AFRICA— 3.5% | | | | | | | | |
| Real Estate Investment Trusts — 3.5% | | | | | | | | |
| Redefine Properties | | | 78,900 | | | | 79,585 | |
| | | | | | | | | |
| UNITED STATES— 74.9% | | | | | | | | |
| Real Estate Investment Trusts — 74.9% | | | | | | | | |
| American Capital Agency | | | 3,600 | | | | 74,286 | |
| American Capital Mortgage Investment | | | 4,221 | | | | 74,036 | |
| Annaly Capital Management | | | 7,453 | | | | 75,052 | |
| Anworth Mortgage Asset | | | 15,176 | | | | 77,094 | |
| ARMOUR Residential | | | 23,700 | | | | 71,100 | |
| Blackstone Mortgage Trust, Cl A | | | 2,678 | | | | 82,295 | |
| Capstead Mortgage | | | 6,537 | | | | 76,156 | |
| Chambers Street Properties | | | 9,150 | | | | 68,625 | |
| Chimera Investment | | | 5,020 | | | | 76,254 | |
| Columbia Property Trust | | | 3,180 | | | | 83,411 | |
| Corrections Corp of America | | | 1,981 | | | | 72,881 | |
| CYS Investments | | | 8,935 | | | | 79,700 | |
| EPR Properties | | | 1,200 | | | | 69,204 | |
| Government Properties Income Trust | | | 3,390 | | | | 70,648 | |
| Hatteras Financial | | | 4,327 | | | | 78,146 | |
| Liberty Property Trust | | | 1,920 | | | | 66,893 | |
| MFA Financial | | | 10,016 | | | | 77,824 | |
| PennyMac Mortgage Investment Trust | | | 3,420 | | | | 71,649 | |
| Select Income | | | 3,090 | | | | 71,657 | |
| Spirit Realty Capital | | | 6,000 | | | | 67,740 | |
| Starwood Property Trust | | | 3,270 | | | | 78,513 | |
The accompanying notes are an integral part of the financial statements.
|
| | |
| Schedule of Investments | April 30, 2015 (Unaudited) |
| | |
| Global X SuperDividend® REIT ETF |
| | | Shares | | | Value | |
| COMMON STOCK — continued | | | | | | | | |
| | | | | | | | | |
| Real Estate Investment Trusts — continued | | | | | | | | |
| Two Harbors Investment | | | 7,607 | | | $ | 79,874 | |
| WP Carey | | | 1,080 | | | | 68,558 | |
| TOTAL UNITED STATES | | | | | | | 1,711,596 | |
| TOTAL COMMON STOCK | | | | | | | | |
| (Cost $2,305,390) | | | | | | | 2,272,315 | |
| | | | | | | | | |
| TOTAL INVESTMENTS — 99.4% | | | | | | | | |
| (Cost $2,305,390) | | | | | | $ | 2,272,315 | |
Percentages are based on Net Assets of $2,285,835.
Cl — Class
As of April 30, 2015, all of the Fund's investments were considered Level 1, in accordance with the authoritative guidance on fair value measurements and disclosure under U.S. GAAP.
For the period ended April 30, 2015, there have been no transfers between Level 1, Level 2 or Level 3 investments.
As of April 30, 2015, there were no Level 3 investments.
The accompanying notes are an integral part of the financial statements.
|
| | |
| Schedule of Investments | April 30, 2015 (Unaudited) |
| | |
| Global X SuperIncome™ Preferred ETF |
Sector Weightings †:
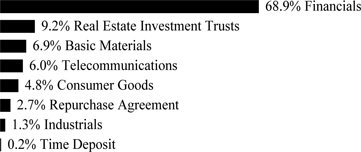
† Sector weightings percentages are based on the total market value of investments. Repurchase agreements purchased from cash collateral received for securities lending activity are included in total investments. Please see Note 7 in Notes to Financial Statements for more detailed information.
| | | Shares | | | Value | |
| PREFERRED STOCK — 99.6% | | | | | | | | |
| | | | | | | | | |
| UNITED STATES— 99.6% | | | | | | | | |
| Basic Materials — 7.1% | | | | | | | | |
| ArcelorMittal, 6.000%* | | | 947,689 | | | $ | 16,044,375 | |
| NuStar Logistics, 7.625%(A) | | | 170,223 | | | | 4,446,225 | |
| | | | | | | | 20,490,600 | |
| Consumer Goods — 4.9% | | | | | | | | |
| CHS, Ser 2, 7.100%(A) | | | 157,150 | | | | 4,194,334 | |
| CHS, Ser 3, 6.750%(A) | | | 183,078 | | | | 4,781,997 | |
| CHS, Ser 4, 7.500%(B) | | | 189,372 | | | | 5,277,798 | |
| | | | | | | | 14,254,129 | |
| Financials — 70.7% | | | | | | | | |
| Aegon, 8.000% | | | 220,132 | | | | 6,168,099 | |
| Ally Financial, Ser A, 8.500%(A) | | | 150,293 | | | | 3,982,765 | |
| Annaly Capital Management, Ser C, 7.625% | | | 124,404 | | | | 3,161,106 | |
| Aviva, 8.250% | | | 167,438 | | | | 4,627,986 | |
| Barclays Bank, Ser 3, 7.100% | | | 144,873 | | | | 3,749,313 | |
| Barclays Bank, Ser 4, 7.750% | | | 121,302 | | | | 3,162,343 | |
| Barclays Bank, Ser 5, 8.125% | | | 282,077 | | | | 7,373,493 | |
| Citigroup, Ser J, 7.125%(A) | | | 137,560 | | | | 3,815,914 | |
| Citigroup, Ser L, 6.875% | | | 68,955 | | | | 1,839,030 | |
| Citigroup Capital XIII, 7.875%(A) | | | 328,074 | | | | 8,493,836 | |
| Deutsche Bank Contingent Capital Trust III, 7.600% | | | 296,233 | | | | 8,324,147 | |
| Deutsche Bank Contingent Capital Trust V, 8.050% | | | 207,309 | | | | 5,945,622 | |
| First Niagara Financial Group, Ser B, 8.625%(A) (B) | | | 145,201 | | | | 4,014,808 | |
| GMAC Capital Trust I, Ser 2, 8.125%(A) | | | 394,304 | | | | 10,362,309 | |
| Hartford Financial Services Group, 7.875%(A) | | | 254,299 | | | | 7,954,473 | |
| HSBC Holdings, 8.125% | | | 200,869 | | | | 5,292,898 | |
| HSBC Holdings, Ser 2, 8.000% | | | 346,130 | | | | 9,089,374 | |
| ING Groep, 7.375% | | | 324,136 | | | | 8,291,399 | |
| ING Groep, 7.200% | | | 233,475 | | | | 5,983,964 | |
| JPMorgan Chase, Ser T, 6.700% | | | 383,107 | | | | 10,286,423 | |
The accompanying notes are an integral part of the financial statements.
|
| | |
| Schedule of Investments | April 30, 2015 (Unaudited) |
| | |
| Global X SuperIncome™ Preferred ETF |
| | | Shares/Face
Amount | | | Value | |
| PREFERRED STOCK — continued | | | | | | | | |
| | | | | | | | | |
| Financials — continued | | | | | | | | |
| KKR Financial Holdings, Ser A, 7.375% | | | 155,185 | | | $ | 4,031,706 | |
| Ladenburg Thalmann Financial Services, Ser A, 8.000% | | | 148,748 | | | | 3,685,976 | |
| Lloyds Banking Group, 7.750% | | | 361,411 | | | | 9,190,682 | |
| Merrill Lynch Capital Trust III, 7.375% (B) | | | 176,241 | | | | 4,585,791 | |
| Merrill Lynch Preferred Capital Trust III, 7.000% | | | 176,171 | | | | 4,539,927 | |
| Merrill Lynch Preferred Capital Trust V, Ser F, 7.280% | | | 200,339 | | | | 5,186,777 | |
| Morgan Stanley, Ser E, 7.125%(A) (B) | | | 202,341 | | | | 5,736,367 | |
| Morgan Stanley, Ser F, 6.875%(A) | | | 199,820 | | | | 5,475,068 | |
| Morgan Stanley, Ser G, 6.625% | | | 117,333 | | | | 3,062,391 | |
| PartnerRe, Ser E, 7.250% | | | 155,335 | | | | 4,116,377 | |
| Raymond James Financial, 6.900% | | | 145,758 | | | | 3,932,551 | |
| Royal Bank of Scotland Group, Ser Q, 6.750% | | | 118,581 | | | | 2,991,798 | |
| Royal Bank of Scotland Group, Ser S, 6.600%(B) | | | 152,079 | | | | 3,806,537 | |
| Royal Bank of Scotland Group, Ser T, 7.250% | | | 295,577 | | | | 7,513,567 | |
| Wells Fargo, Ser J, 8.000% | | | 491,105 | | | | 14,227,312 | |
| | | | | | | | 204,002,129 | |
| Industrials — 1.3% | | | | | | | | |
| Seaspan, Ser C, 9.500% | | | 146,364 | | | | 3,856,691 | |
| Real Estate Investment Trusts — 9.4% | | | | | | | | |
| American Realty Capital Properties, Ser F, 6.700%(B) | | | 440,999 | | | | 10,588,386 | |
| Annaly Capital Management, Ser D, 7.500% | | | 191,167 | | | | 4,807,850 | |
| CBL & Associates Properties, Ser D, 7.375% | | | 188,960 | | | | 4,877,058 | |
| Digital Realty Trust, Ser H, 7.375% | | | 150,895 | | | | 4,101,326 | |
| NorthStar Realty Finance, Ser E, 8.750% | | | 103,525 | | | | 2,746,518 | |
| | | | | | | | 27,121,138 | |
| Telecommunications — 6.2% | | | | | | | | |
| Qwest, 7.500%(B) | | | 177,471 | | | | 4,720,728 | |
| Qwest, Ser 51, 7.375% | | | 203,408 | | | | 5,333,358 | |
| Qwest, Ser 52, 7.000%(B) | | | 160,512 | | | | 4,211,835 | |
| United States Cellular, 6.950% | | | 141,520 | | | | 3,637,064 | |
| | | | | | | | 17,902,985 | |
| TOTAL PREFERRED STOCK | | | | | | | | |
| (Cost $287,205,586) | | | | | | | 287,627,672 | |
| | | | | | | | | |
| REPURCHASE AGREEMENT — 2.7% | | | | | | | | |
| Deutsche Bank | | | | | | | | |
0.100%, dated 04/30/15, to be repurchased on 05/01/15, repurchase price $7,872,222 (collateralized by U.S. Treasury Notes, par value $7,928,670,
1.500%, 11/30/19 with a total market value of $7,999,949)(C) | | | | | | | | |
| (Cost $7,872,200) | | $ | 7,872,200 | | | | 7,872,200 | |
The accompanying notes are an integral part of the financial statements.
|
| | |
| Schedule of Investments | April 30, 2015 (Unaudited) |
| | |
| Global X SuperIncome™ Preferred ETF |
| | | Face Amount | | | Value | |
| TIME DEPOSIT — 0.2% | | | | | | | | |
| Brown Brothers Harriman, 0.030%, 05/01/15 | | | | | | | | |
| (Cost $619,103) | | $ | 619,103 | | | $ | 619,103 | |
| | | | | | | | | |
| TOTAL INVESTMENTS — 102.5% | | | | | | | | |
| (Cost $295,696,889) | | | | | | $ | 296,118,975 | |
Percentages are based on Net Assets of $288,758,891
| * | Non-income producing security. |
| (A) | Floating rate security - Rate disclosed is the rate in effect on April 30, 2015. |
| (B) | This security or a partial position of this security is on loan at April 30, 2015. The total value of securities on loan at April 30, 2015 was $7,585,490. |
| (C) | These securities were purchased with cash collateral held from securities on loan. The total value of such securities as of April 30, 2015 was $7,872,200. |
The following is a summary of the inputs used as of April 30, 2015, in valuing the Fund's investments carried at value:
| Investments in Securities | | Level 1 | | | Level 2 | | | Level 3 | | | Total | |
| Preferred Stock | | $ | 287,627,672 | | | $ | — | | | $ | — | | | $ | 287,627,672 | |
| Repurchase Agreement | | | — | | | | 7,872,200 | | | | — | | | | 7,872,200 | |
| Time Deposit | | | — | | | | 619,103 | | | | — | | | | 619,103 | |
| Total Investments in Securities | | $ | 287,627,672 | | | $ | 8,491,303 | | | $ | — | | | $ | 296,118,975 | |
For the period ended April 30, 2015, there have been no transfers between Level 1, Level 2 or Level 3 investments.
As of April 30, 2015, there were no Level 3 investments.
The accompanying notes are an integral part of the financial statements.
|
| | |
| Schedule of Investments | April 30, 2015 (Unaudited) |
| | |
| Global X Social Media Index ETF |
Sector Weightings †:
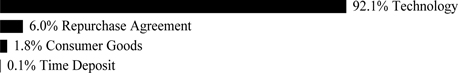
† Sector weightings percentages are based on the total market value of investments. Repurchase agreements purchased from cash collateral received for securities lending activity are included in total investments. Please see Note 7 in Notes to Financial Statements for more detailed information.
| | | Shares | | | Value | |
| COMMON STOCK — 99.4% | | | | | | | | |
| | | | | | | | | |
| CHINA— 19.5% | | | | | | | | |
| Technology — 19.5% | | | | | | | | |
| Changyou.com ADR * | | | 10,044 | | | $ | 339,086 | |
| NetEase ADR | | | 45,823 | | | | 5,874,050 | |
| Renren ADR * | | | 115,044 | | | | 341,681 | |
| Tencent Holdings | | | 543,715 | | | | 11,286,550 | |
| Youku.com ADR * | | | 99,086 | | | | 1,852,908 | |
| YY ADR * (A) | | | 26,603 | | | | 1,690,887 | |
| TOTAL CHINA | | | | | | | 21,385,162 | |
| | | | | | | | | |
| GERMANY— 0.6% | | | | | | | | |
| Technology — 0.6% | | | | | | | | |
| XING | | | 4,468 | | | | 740,728 | |
| | | | | | | | | |
| JAPAN— 10.7% | | | | | | | | |
| Technology — 10.7% | | | | | | | | |
| Dena | | | 172,421 | | | | 3,449,284 | |
| Gree (A) | | | 168,635 | | | | 1,087,877 | |
| Mixi (A) | | | 60,900 | | | | 2,404,550 | |
| Nexon | | | 378,672 | | | | 4,819,232 | |
| TOTAL JAPAN | | | | | | | 11,760,943 | |
| | | | | | | | | |
| RUSSIA— 8.4% | | | | | | | | |
| Technology — 8.4% | | | | | | | | |
| Mail.ru Group GDR * | | | 179,110 | | | | 4,298,640 | |
| Yandex, Cl A * | | | 254,876 | | | | 4,903,814 | |
| TOTAL RUSSIA | | | | | | | 9,202,454 | |
| | | | | | | | | |
| TAIWAN— 1.6% | | | | | | | | |
| Technology — 1.6% | | | | | | | | |
| PChome Online | | | 104,491 | | | | 1,777,569 | |
| | | | | | | | | |
| UNITED STATES— 58.6% | | | | | | | | |
| Consumer Goods — 1.9% | | | | | | | | |
| King Digital Entertainment (A) | | | 132,825 | | | | 2,106,605 | |
| Technology — 56.7% | | | | | | | | |
| Angie's List * | | | 70,874 | | | | 416,030 | |
| Demand Media * | | | 14,281 | | | | 91,541 | |
The accompanying notes are an integral part of the financial statements.
|
| | |
| Schedule of Investments | April 30, 2015 (Unaudited) |
| | |
| Global X Social Media Index ETF |
| | | Shares/Face
Amount | | | Value | |
| COMMON STOCK — continued | | | | | | | | |
| | | | | | | | | |
| Technology — continued | | | | | | | | |
| Facebook, Cl A * | | | 136,353 | | | $ | 10,740,526 | |
| Google, Cl A * | | | 9,801 | | | | 5,378,495 | |
| Groupon, Cl A * | | | 724,837 | | | | 5,015,872 | |
| Jive Software * | | | 66,411 | | | | 357,291 | |
| LinkedIn, Cl A * | | | 43,611 | | | | 10,995,641 | |
| Nutrisystem | | | 46,350 | | | | 882,968 | |
| Pandora Media * | | | 297,284 | | | | 5,303,547 | |
| SINA * | | | 107,346 | | | | 4,722,687 | |
| Twitter * | | | 102,346 | | | | 3,987,400 | |
| United Online * | | | 22,638 | | | | 358,359 | |
| Weibo ADR * (A) | | | 112,248 | | | | 1,872,297 | |
| Yahoo! * | | | 116,400 | | | | 4,954,566 | |
| Yelp, Cl A * | | | 105,651 | | | | 4,161,593 | |
| Zynga, Cl A * | | | 1,223,889 | | | | 2,998,528 | |
| | | | | | | | 62,237,341 | |
| TOTAL UNITED STATES | | | | | | | 64,343,946 | |
| TOTAL COMMON STOCK | | | | | | | | |
| (Cost $117,750,854) | | | | | | | 109,210,802 | |
| | | | | | | | | |
| REPURCHASE AGREEMENT — 6.3% | | | | | | | | |
| Deutsche Bank | | | | | | | | |
| 0.100%, dated 04/30/15, to be repurchased on 05/01/15 repurchase price $6,914,550 (collateralized by U.S. Treasury Notes, par value $6,964,131, 1.500%, 11/30/19 with a total market value of $7,026,739)(B) | | | | | | | | |
| (Cost $6,914,531) | | $ | 6,914,531 | | | | 6,914,531 | |
| | | | | | | | | |
| TIME DEPOSIT — 0.1% | | | | | | | | |
| Brown Brothers Harriman, 0.030%, 05/01/15 | | | | | | | | |
| (Cost $80,798) | | | 80,798 | | | | 80,798 | |
| | | | | | | | | |
| TOTAL INVESTMENTS — 105.8% | | | | | | | | |
| (Cost $124,746,183) | | | | | | $ | 116,206,131 | |
Percentages are based on Net Assets of $109,789,321.
| * | Non-income producing security. |
| (A) | This security or a partial position of this security is on loan at April 30, 2015. The total value of securities on loan at April 30, 2015 was $6,583,622. |
| (B) | These securities were purchased with cash collateral held from securities on loan. The total value of such securities as of April 30, 2015 was $6,914,531. |
| ADR — American Depositary Receipt |
| Cl — Class |
| GDR — Global Depositary Receipt |
The accompanying notes are an integral part of the financial statements.
|
| | |
| Schedule of Investments | April 30, 2015 (Unaudited) |
| | |
| Global X Social Media Index ETF |
The following is a summary of the inputs used as of April 30, 2015, in valuing the Fund's investments carried at value:
| Investments in Securities | | Level 1 | | | Level 2 | | | Level 3 | | | Total | |
| Common Stock | | $ | 109,210,802 | | | $ | — | | | $ | — | | | $ | 109,210,802 | |
| Repurchase Agreement | | | — | | | | 6,914,531 | | | | — | | | | 6,914,531 | |
| Time Deposit | | | — | | | | 80,798 | | | | — | | | | 80,798 | |
| Total Investments in Securities | | $ | 109,210,802 | | | $ | 6,995,329 | | | $ | — | | | $ | 116,206,131 | |
For the period ended April 30, 2015, there have been no transfers between Level 1, Level 2 or Level 3 investments.
As of April 30, 2015, there were no Level 3 investments
The accompanying notes are an integral part of the financial statements.
|
| | |
| Schedule of Investments | April 30, 2015 (Unaudited) |
| | |
| Global X | JPMorgan Efficiente Index ETF |
Sector Weightings †:

† Sector weightings percentages are based on the total market value of investments.
| | | Shares/Face
Amount | | | Value | |
| EXCHANGE TRADED FUNDS — 100.0% | | | | | | | | |
| iShares 20+ Year Treasury Bond ETF | | | 40,243 | | | $ | 5,068,606 | |
| iShares Core S&P Small-Capital ETF | | | 45,108 | | | | 5,201,403 | |
| iShares iBoxx $ Investment Grade Corporate Bond ETF | | | 21,831 | | | | 2,618,410 | |
| Vanguard FTSE Developed Markets ETF | | | 66,232 | | | | 2,740,018 | |
| Vanguard REIT ETF | | | 63,156 | | | | 5,013,323 | |
| Vanguard S&P 500 ETF | | | 28,188 | | | | 5,386,727 | |
| TOTAL EXCHANGE TRADED FUNDS | | | | | | | | |
| (Cost $26,266,696) | | | | | | | 26,028,487 | |
| | | | | | | | | |
| TIME DEPOSIT — 0.1% | | | | | | | | |
| Brown Brothers Harriman, 0.030%, 05/01/15 | | | | | | | | |
| (Cost $14,542) | | $ | 14,542 | | | | 14,542 | |
| | | | | | | | | |
| TOTAL INVESTMENTS — 100.1% | | | | | | | | |
| (Cost $26,281,238) | | | | | | $ | 26,043,029 | |
Percentages are based on Net Assets of $26,025,258.
| ETF — Exchange Traded Fund |
| FTSE — Financial Times and Stock Exchange |
| REIT — Real Estate Investment Trust |
| S&P — Standard & Poor's |
The following is a summary of the inputs used as of April 30, 2015, in valuing the Fund's investments carried at value:
| Investments in Securities | | Level 1 | | | Level 2 | | | Level 3 | | | Total | |
| Exchange Traded Funds | | $ | 26,028,487 | | | $ | — | | | $ | — | | | $ | 26,028,487 | |
| Time Deposit | | | — | | | | 14,542 | | | | — | | | | 14,542 | |
| Total Investments in Securities | | $ | 26,028,487 | | | $ | 14,542 | | | $ | — | | | $ | 26,043,029 | |
For the period ended April 30, 2015, there have been no transfers between Level 1, Level 2 or Level 3 investments.
As of April 30, 2015, there were no Level 3 investments.
The accompanying notes are an integral part of the financial statements.
|
| | |
| Schedule of Investments | April 30, 2015 (Unaudited) |
| | |
| Global X | JPMorgan US Sector Rotator Index ETF |
Sector Weightings †:

† Sector weightings percentages are based on the total market value of investments.
| | | Shares/Face
Amount | | | Value | |
| EXCHANGE TRADED FUNDS — 99.9% | | | | | | | | |
| Consumer Discretionary Select Sector SPDR Fund | | | 71,727 | | | $ | 5,401,760 | |
| Energy Select Sector SPDR Fund | | | 43,391 | | | | 3,587,568 | |
| Financial Select Sector SPDR Fund | | | 282,507 | | | | 6,816,895 | |
| Materials Select Sector SPDR Fund | | | 121,394 | | | | 6,120,685 | |
| Technology Select Sector SPDR Fund | | | 121,530 | | | | 5,174,747 | |
| TOTAL EXCHANGE TRADED FUNDS | | | | | | | | |
| (Cost $27,164,653) | | | | | | | 27,101,655 | |
| | | | | | | | | |
| TIME DEPOSIT — 0.1% | | | | | | | | |
| Brown Brothers Harriman, 0.030%, 05/01/15 | | | | | | | | |
| (Cost $19,444) | | $ | 19,444 | | | | 19,444 | |
| | | | | | | | | |
| TOTAL INVESTMENTS — 100.0% | | | | | | | | |
| (Cost $27,184,097) | | | | | | $ | 27,121,099 | |
Percentages are based on Net Assets of $27,129,645.
| SPDR — Standard & Poor’s Depositary Receipts |
The following is a summary of the inputs used as of April 30, 2015, in valuing the Fund's investments carried at value:
| Investments in Securities | | Level 1 | | | Level 2 | | | Level 3 | | | Total | |
| Exchange Traded Funds | | $ | 27,101,655 | | | $ | — | | | $ | — | | | $ | 27,101,655 | |
| Time Deposit | | | — | | | | 19,444 | | | | — | | | | 19,444 | |
| Total Investments in Securities | | $ | 27,101,655 | | | $ | 19,444 | | | $ | — | | | $ | 27,121,099 | |
For the period ended April 30, 2015, there have been no transfers between Level 1, Level 2 or Level 3 investments.
As of April 30, 2015, there were no Level 3 investments.
The accompanying notes are an integral part of the financial statements.
|
| | |
| Schedule of Investments | April 30, 2015 (Unaudited) |
| | |
| Global X Permanent ETF |
Sector Weightings †:
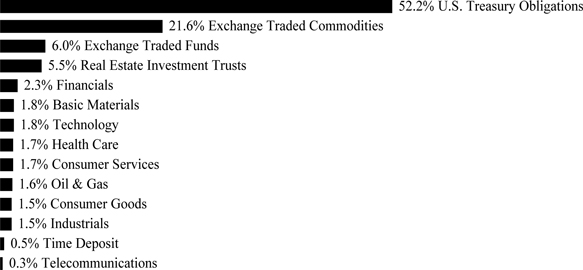
† Sector weightings percentages are based on the total market value of investments.
| | | Face
Amount/Shares | | | Value | |
| U.S. TREASURY OBLIGATIONS — 52.0% | | | | | | | | |
| U.S. Treasury Bonds | | | | | | | | |
| 4.625%, 02/15/40 | | $ | 491,200 | | | $ | 663,619 | |
| 4.375%, 11/15/39 | | | 514,800 | | | | 671,171 | |
| 4.375%, 05/15/40 | | | 513,700 | | | | 670,780 | |
| 3.875%, 08/15/40 | | | 550,318 | | | | 668,894 | |
| U.S. Treasury Notes | | | | | | | | |
| 2.000%, 04/30/16 | | | 592,100 | | | | 602,138 | |
| 1.875%, 06/30/15 | | | 594,500 | | | | 596,265 | |
| 1.750%, 07/31/15 | | | 596,000 | | | | 598,468 | |
| 1.750%, 05/31/16 | | | 595,600 | | | | 604,813 | |
| TOTAL U.S. TREASURY OBLIGATIONS | | | | | | | | |
| (Cost $4,933,195) | | | | | | | 5,076,148 | |
| | | | | | | | | |
| EXCHANGE TRADED COMMODITIES — 21.5% | | | | | | | | |
| ETFS Physical Gold | | | 7,562 | | | | 864,147 | |
| ETFS Physical Silver | | | 20,317 | | | | 311,658 | |
| ETFS Physical Silver (GBP shares) | | | 3,802 | | | | 58,332 | |
| Gold Bullion Securities | | | 7,659 | | | | 863,591 | |
| TOTAL EXCHANGE TRADED COMMODITIES | | | | | | | | |
| (Cost $3,132,711) | | | | | | | 2,097,728 | |
| | | | | | | | | |
| COMMON STOCK — 19.6% | | | | | | | | |
| | | | | | | | | |
| AUSTRALIA— 0.2% | | | | | | | | |
| Basic Materials — 0.2% | | | | | | | | |
| BHP Billiton ADR | | | 495 | | | | 25,388 | |
| | | | | | | | | |
| BRAZIL— 0.2% | | | | | | | | |
| Basic Materials — 0.2% | | | | | | | | |
| Vale ADR, Cl B | | | 2,306 | | | | 17,710 | |
The accompanying notes are an integral part of the financial statements.
|
| | |
| Schedule of Investments | April 30, 2015 (Unaudited) |
| | |
| Global X Permanent ETF |
| | | Shares | | | Value | |
| COMMON STOCK — continued | | | | | | | | |
| | | | | | | | | |
| CANADA— 0.3% | | | | | | | | |
| Basic Materials — 0.3% | | | | | | | | |
| Potash Corp of Saskatchewan | | | 820 | | | $ | 26,765 | |
| | | | | | | | | |
| CHINA— 0.3% | | | | | | | | |
| Oil & Gas — 0.3% | | | | | | | | |
| PetroChina ADR | | | 252 | | | | 32,488 | |
| | | | | | | | | |
| FRANCE— 0.2% | | | | | | | | |
| Oil & Gas — 0.2% | | | | | | | | |
| Total | | | 422 | | | | 22,927 | |
| | | | | | | | | |
| NETHERLANDS— 0.3% | | | | | | | | |
| Oil & Gas — 0.3% | | | | | | | | |
| Royal Dutch Shell ADR, Cl A | | | 379 | | | | 24,040 | |
| | | | | | | | | |
| SWITZERLAND— 0.5% | | | | | | | | |
| Basic Materials — 0.5% | | | | | | | | |
| Glencore Xstrata * | | | 5,630 | | | | 26,843 | |
| Syngenta ADR | | | 391 | | | | 26,212 | |
| TOTAL SWITZERLAND | | | | | | | 53,055 | |
| | | | | | | | | |
| UNITED KINGDOM— 0.5% | | | | | | | | |
| Basic Materials — 0.5% | | | | | | | | |
| Anglo American | | | 1,276 | | | | 21,668 | |
| Rio Tinto ADR | | | 587 | | | | 26,292 | |
| TOTAL UNITED KINGDOM | | | | | | | 47,960 | |
| | | | | | | | | |
| UNITED STATES— 17.1% | | | | | | | | |
| Consumer Goods — 1.5% | | | | | | | | |
| Altria Group | | | 383 | | | | 19,169 | |
| Archer-Daniels-Midland | | | 697 | | | | 34,069 | |
| Coca-Cola | | | 412 | | | | 16,711 | |
| Monsanto | | | 258 | | | | 29,402 | |
| PepsiCo | | | 205 | | | | 19,499 | |
| Philip Morris International | | | 169 | | | | 14,107 | |
| Procter & Gamble | | | 194 | | | | 15,425 | |
| | | | | | | | 148,382 | |
| Consumer Services — 1.7% | | | | | | | | |
| Amazon.com * | | | 62 | | | | 26,150 | |
| Comcast, Cl A | | | 315 | | | | 18,194 | |
| CVS Health | | | 215 | | | | 21,347 | |
| Home Depot | | | 220 | | | | 23,536 | |
| McDonald's | | | 195 | | | | 18,827 | |
| Twenty-First Century Fox ADR, Cl A | | | 482 | | | | 16,427 | |
| Wal-Mart Stores | | | 217 | | | | 16,937 | |
| Walt Disney | | | 203 | | | | 22,070 | |
| | | | | | | | 163,488 | |
The accompanying notes are an integral part of the financial statements.
|
| | |
| Schedule of Investments | April 30, 2015 (Unaudited) |
| | |
| Global X Permanent ETF |
| | | Shares | | | Value | |
| COMMON STOCK — continued | | | | | | | | |
| | | | | | | | | |
| Financials — 2.3% | | | | | | | | |
| American Express | | | 183 | | | $ | 14,173 | |
| American International Group | | | 388 | | | | 21,841 | |
| Bank of America | | | 1,320 | | | | 21,027 | |
| Berkshire Hathaway, Cl B * | | | 150 | | | | 21,181 | |
| Citigroup | | | 343 | | | | 18,289 | |
| Goldman Sachs Group | | | 106 | | | | 20,821 | |
| JPMorgan Chase | | | 315 | | | | 19,927 | |
| Mastercard, Cl A | | | 280 | | | | 25,259 | |
| US Bancorp | | | 470 | | | | 20,149 | |
| Visa, Cl A | | | 344 | | | | 22,721 | |
| Wells Fargo | | | 332 | | | | 18,293 | |
| | | | | | | | 223,681 | |
| Health Care — 1.7% | | | | | | | | |
| AbbVie | | | 290 | | | | 18,751 | |
| Amgen | | | 163 | | | | 25,739 | |
| Bristol-Myers Squibb | | | 356 | | | | 22,688 | |
| Gilead Sciences | | | 205 | | | | 20,605 | |
| Johnson & Johnson | | | 194 | | | | 19,245 | |
| Merck | | | 361 | | | | 21,501 | |
| Pfizer | | | 535 | | | | 18,153 | |
| UnitedHealth Group | | | 213 | | | | 23,728 | |
| | | | | | | | 170,410 | |
| Industrials — 1.5% | | | | | | | | |
| 3M | | | 114 | | | | 17,829 | |
| Boeing | | | 168 | | | | 24,081 | |
| Deere | | | 344 | | | | 31,139 | |
| General Electric | | | 716 | | | | 19,389 | |
| Union Pacific | | | 175 | | | | 18,590 | |
| United Parcel Service, Cl B | | | 160 | | | | 16,085 | |
| United Technologies | | | 184 | | | | 20,930 | |
| | | | | | | | 148,043 | |
| Oil & Gas — 0.8% | | | | | | | | |
| Chevron | | | 260 | | | | 28,875 | |
| Exxon Mobil | | | 345 | | | | 30,143 | |
| Schlumberger | | | 153 | | | | 14,476 | |
| | | | | | | | 73,494 | |
| Real Estate Investment Trusts — 5.5% | | | | | | | | |
| American Tower, Cl A | | | 537 | | | | 50,763 | |
| Crown Castle International | | | 645 | | | | 53,877 | |
| Equity Residential | | | 773 | | | | 57,094 | |
| General Growth Properties | | | 2,005 | | | | 54,937 | |
| HCP | | | 1,159 | | | | 46,696 | |
| Health Care | | | 786 | | | | 56,608 | |
| ProLogis | | | 1,232 | | | | 49,526 | |
The accompanying notes are an integral part of the financial statements.
|
| | |
| Schedule of Investments | April 30, 2015 (Unaudited) |
| | |
| Global X Permanent ETF |
| | | Shares/Face
Amount | | | Value | |
| COMMON STOCK — continued | | | | | | | | |
| | | | | | | | | |
| Real Estate Investment Trusts — continued | | | | | | | | |
| Public Storage | | | 307 | | | $ | 57,688 | |
| Simon Property Group | | | 305 | | | | 55,354 | |
| Ventas | | | 741 | | | | 51,055 | |
| | | | | | | | 533,598 | |
| Technology — 1.8% | | | | | | | | |
| Apple | | | 181 | | | | 22,652 | |
| Cisco Systems | | | 670 | | | | 19,316 | |
| Facebook, Cl A * | | | 254 | | | | 20,008 | |
| Google, Cl A * | | | 29 | | | | 15,914 | |
| Intel | | | 671 | | | | 21,841 | |
| International Business Machines | | | 97 | | | | 16,615 | |
| Microsoft | | | 488 | | | | 23,736 | |
| Oracle | | | 399 | | | | 17,405 | |
| QUALCOMM | | | 207 | | | | 14,076 | |
| | | | | | | | 171,563 | |
| Telecommunications — 0.3% | | | | | | | | |
| AT&T | | | 513 | | | | 17,770 | |
| Verizon Communications | | | 319 | | | | 16,091 | |
| | | | | | | | 33,861 | |
| TOTAL UNITED STATES | | | | | | | 1,666,520 | |
| TOTAL COMMON STOCK | | | | | | | | |
| (Cost $1,784,601) | | | | | | | 1,916,853 | |
| | | | | | | | | |
| EXCHANGE TRADED FUNDS — 6.0% | | | | | | | | |
| Vanguard FTSE All-World ex-US ETF, Cl U | | | 5,624 | | | | 287,049 | |
| Vanguard Small-Cap ETF | | | 2,514 | | | | 301,831 | |
| TOTAL EXCHANGE TRADED FUNDS | | | | | | | | |
| (Cost $500,885) | | | | | | | 588,880 | |
| | | | | | | | | |
| TIME DEPOSIT — 0.5% | | | | | | | | |
| Brown Brothers Harriman, 0.030%, 05/01/15 | | | | | | | | |
| (Cost $50,497) | | $ | 50,497 | | | | 50,497 | |
| | | | | | | | | |
| TOTAL INVESTMENTS — 99.6% | | | | | | | | |
| (Cost $10,401,889) | | | | | | $ | 9,730,106 | |
Percentages are based on Net Assets of $9,769,230.
| * | Non-income producing security. |
The accompanying notes are an integral part of the financial statements.
|
| | |
| Schedule of Investments | April 30, 2015 (Unaudited) |
| | |
| Global X Permanent ETF |
ADR — American Depositary Receipt
Cl — Class
ETF — Exchange Traded Fund
FTSE — Financial Times and Stock Exchange
GBP — British Pound Sterling
The following is a summary of the inputs used as of April 30, 2015, in valuing the Fund's investments carried at value:
| Investments in Securities | | Level 1 | | | Level 2 | | | Level 3 | | | Total | |
| U.S. Treasury Obligations | | $ | — | | | $ | 5,076,148 | | | $ | — | | | $ | 5,076,148 | |
| Exchange Traded Commodities | | | 2,097,728 | | | | — | | | | — | | | | 2,097,728 | |
| Common Stock | | | 1,916,853 | | | | — | | | | — | | | | 1,916,853 | |
| Exchange Traded Funds | | | 588,880 | | | | — | | | | — | | | | 588,880 | |
| Time Deposit | | | — | | | | 50,497 | | | | — | | | | 50,497 | |
| Total Investments in Securities | | $ | 4,603,461 | | | $ | 5,126,645 | | | $ | — | | | $ | 9,730,106 | |
For the period ended April 30, 2015, there have been no transfers between Level 1, Level 2 or Level 3 investments.
As of April 30, 2015, there were no Level 3 investments.
The accompanying notes are an integral part of the financial statements.
|
| | |
| Schedule of Investments | April 30, 2015 (Unaudited) |
| | |
| Global X Guru™ Index ETF |
Sector Weightings †:
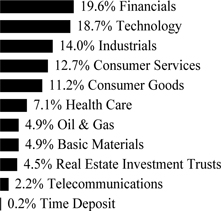
† Sector weightings percentages are based on the total market value of investments.
| | | Shares | | | Value | |
| COMMON STOCK — 97.4% | | | | | | | | |
| | | | | | | | | |
| CANADA— 2.3% | | | | | | | | |
| Industrials — 2.3% | | | | | | | | |
| Canadian Pacific Railway | | | 36,968 | | | $ | 7,045,362 | |
| | | | | | | | | |
| CHINA— 2.3% | | | | | | | | |
| Technology — 2.3% | | | | | | | | |
| Baidu ADR * | | | 34,379 | | | | 6,885,426 | |
| | | | | | | | | |
| IRELAND— 4.8% | | | | | | | | |
| Health Care — 4.8% | | | | | | | | |
| Actavis * | | | 25,082 | | | | 7,094,695 | |
| Shire ADR | | | 29,967 | | | | 7,297,264 | |
| TOTAL IRELAND | | | | | | | 14,391,959 | |
| | | | | | | | | |
| ISRAEL— 2.7% | | | | | | | | |
| Technology — 2.7% | | | | | | | | |
| RADWARE * | | | 347,007 | | | | 8,213,656 | |
| | | | | | | | | |
| MEXICO— 2.2% | | | | | | | | |
| Telecommunications — 2.2% | | | | | | | | |
| America Movil ADR, Ser L | | | 324,165 | | | | 6,771,807 | |
| | | | | | | | | |
| UNITED KINGDOM— 2.4% | | | | | | | | |
| Consumer Services — 2.4% | | | | | | | | |
| Liberty Global * | | | 140,138 | | | | 7,069,962 | |
| | | | | | | | | |
| UNITED STATES— 80.7% | | | | | | | | |
| Basic Materials — 4.9% | | | | | | | | |
| Celanese, Cl A | | | 122,815 | | | | 8,150,003 | |
| FMC | | | 111,216 | | | | 6,596,221 | |
| | | | | | | | 14,746,224 | |
The accompanying notes are an integral part of the financial statements.
| Schedule of Investments | April 30, 2015 (Unaudited) |
| | |
Global X Guru™ Index ETF |
| | | Shares | | | Value | |
| | | | | | | | | |
| COMMON STOCK — continued | | | | | | | | |
| | | | | | | | | |
| Consumer Goods — 11.2% | | | | | | | | |
| Darling Ingredients * | | | 405,725 | | | $ | 5,542,203 | |
| DR Horton | | | 261,734 | | | | 6,648,044 | |
| General Motors | | | 192,653 | | | | 6,754,414 | |
| Mondelez International, Cl A | | | 192,824 | | | | 7,398,657 | |
| NIKE, Cl B | | | 76,082 | | | | 7,519,945 | |
| | | | | | | | 33,863,263 | |
| Consumer Services — 10.3% | | | | | | | | |
| Dunkin' Brands Group | | | 152,422 | | | | 7,942,711 | |
| Houghton Mifflin Harcourt * | | | 359,769 | | | | 8,224,319 | |
| Michaels * | | | 258,812 | | | | 6,692,878 | |
| Pandora Media * | | | 480,073 | | | | 8,564,502 | |
| | | | | | | | 31,424,410 | |
| Financials — 19.6% | | | | | | | | |
| Ally Financial * | | | 330,839 | | | | 7,242,066 | |
| American International Group | | | 130,415 | | | | 7,341,060 | |
| Bank of New York Mellon | | | 182,746 | | | | 7,737,466 | |
| Citigroup | | | 138,576 | | | | 7,388,872 | |
| JPMorgan Chase | | | 119,943 | | | | 7,587,594 | |
| Mastercard, Cl A | | | 81,198 | | | | 7,324,871 | |
| Moody's | | | 72,492 | | | | 7,794,340 | |
| Voya Financial | | | 163,602 | | | | 6,926,909 | |
| | | | | | | | 59,343,178 | |
| Health Care — 2.3% | | | | | | | | |
| Thermo Fisher Scientific | | | 55,671 | | | | 6,996,731 | |
| Industrials — 11.7% | | | | | | | | |
| FleetCor Technologies * | | | 46,512 | | | | 7,483,316 | |
| LinkedIn, Cl A * | | | 26,678 | | | | 6,726,324 | |
| Owens-Illinois * | | | 268,504 | | | | 6,419,931 | |
| RR Donnelley & Sons | | | 398,849 | | | | 7,426,568 | |
| Spirit Aerosystems Holdings, Cl A * | | | 142,516 | | | | 7,252,639 | |
| | | | | | | | 35,308,778 | |
| Oil & Gas — 2.5% | | | | | | | | |
| Williams | | | 147,601 | | | | 7,555,695 | |
| Real Estate Investment Trusts — 4.5% | | | | | | | | |
| American Tower, Cl A | | | 74,028 | | | | 6,997,867 | |
| Crown Castle International | | | 80,743 | | | | 6,744,463 | |
| | | | | | | | 13,742,330 | |
| Technology — 13.7% | | | | | | | | |
| Akamai Technologies * | | | 101,326 | | | | 7,475,832 | |
| Apple | | | 55,351 | | | | 6,927,178 | |
| CDW | | | 187,731 | | | | 7,193,852 | |
| Facebook, Cl A * | | | 92,899 | | | | 7,317,654 | |
| Micron Technology * | | | 221,324 | | | | 6,225,844 | |
The accompanying notes are an integral part of the financial statements.
| Schedule of Investments | April 30, 2015 (Unaudited) |
| | |
| Global X Guru™ Index ETF |
| | | Shares/Face
Amount | | | Value | |
| COMMON STOCK — continued | | | | | | | | |
| | | | | | | | | |
| Technology — continued | | | | | | | | |
| Motorola Solutions | | | 103,476 | | | $ | 6,182,691 | |
| | | | | | | | 41,323,051 | |
| TOTAL UNITED STATES | | | | | | | 244,303,660 | |
| TOTAL COMMON STOCK | | | | | | | | |
| (Cost $283,641,917) | | | | | | | 294,681,832 | |
| | | | | | | | | |
| MASTER LIMITED PARTNERSHIP — 2.4% | | | | | | | | |
| | | | | | | | | |
| UNITED STATES— 2.4% | | | | | | | | |
| Oil & Gas — 2.4% | | | | | | | | |
| Enterprise Products Partners | | | | | | | | |
| (Cost $6,760,816) | | | 209,209 | | | | 7,165,408 | |
| | | | | | | | | |
| TIME DEPOSIT — 0.2% | | | | | | | | |
| Brown Brothers Harriman, 0.030%, 05/01/15 | | | | | | | | |
| (Cost $562,739) | | $ | 562,739 | | | | 562,739 | |
| | | | | | | | | |
| TOTAL INVESTMENTS — 100.0% | | | | | | | | |
| (Cost $290,965,472) | | | | | | $ | 302,409,979 | |
Percentages are based on Net Assets of $302,380,274.
| * | Non-income producing security. |
ADR — American Depositary Receipt
Cl — Class
Ser — Series
The following is a summary of the inputs used as of April 30, 2015, in valuing the Fund's investments carried at value:
| Investments in Securities | | Level 1 | | | Level 2 | | | Level 3 | | | Total | |
| Common Stock | | $ | 294,681,832 | | | $ | — | | | $ | — | | | $ | 294,681,832 | |
| Master Limited Partnership | | | 7,165,408 | | | | — | | | | — | | | | 7,165,408 | |
| Time Deposit | | | — | | | | 562,739 | | | | — | | | | 562,739 | |
| Total Investments in Securities | | $ | 301,847,240 | | | $ | 562,739 | | | $ | — | | | $ | 302,409,979 | |
For the period ended April 30, 2015, there have been no transfers between Level 1, Level 2 or Level 3 investments.
As of April 30, 2015, there were no Level 3 investments.
The accompanying notes are an integral part of the financial statements.
| Schedule of Investments | April 30, 2015 (Unaudited) |
| | |
| Global X Guru™ Activist Index ETF |
Sector Weightings †:
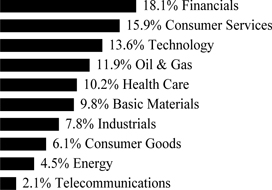
† Sector weightings percentages are based on the total market value of investments.
| | | Shares | | | Value | |
| COMMON STOCK — 100.0% | | | | | | | | |
| | | | | | | | | |
| CANADA— 6.2% | | | | | | | | |
| Basic Materials — 1.9% | | | | | | | | |
| Agrium | | | 280 | | | $ | 29,016 | |
| Health Care — 2.2% | | | | | | | | |
| Valeant Pharmaceuticals International * | | | 150 | | | | 32,539 | |
| Industrials — 2.1% | | | | | | | | |
| Canadian Pacific Railway | | | 160 | | | | 30,492 | |
| TOTAL CANADA | | | | | | | 92,047 | |
| | | | | | | | | |
| IRELAND— 1.9% | | | | | | | | |
| Health Care — 1.9% | | | | | | | | |
| Actavis * | | | 100 | | | | 28,286 | |
| | | | | | | | | |
| NETHERLANDS— 1.9% | | | | | | | | |
| Industrials — 1.9% | | | | | | | | |
| Koninklijke Philips | | | 1,000 | | | | 28,610 | |
| | | | | | | | | |
| UNITED STATES— 90.0% | | | | | | | | |
| Basic Materials — 7.9% | | | | | | | | |
| Air Products & Chemicals | | | 190 | | | | 27,252 | |
| Dow Chemical | | | 600 | | | | 30,600 | |
| EI du Pont de Nemours | | | 380 | | | | 27,816 | |
| Platform Specialty Products * | | | 1,200 | | | | 32,328 | |
| | | | | | | | 117,996 | |
| Consumer Goods — 6.1% | | | | | | | | |
| Mondelez International, Cl A | | | 820 | | | | 31,463 | |
| PepsiCo | | | 300 | | | | 28,536 | |
| Walgreens Boots Alliance | | | 380 | | | | 31,514 | |
| | | | | | | | 91,513 | |
| Consumer Services — 15.9% | | | | | | | | |
| DIRECTV * | | | 340 | | | | 30,840 | |
The accompanying notes are an integral part of the financial statements.
| Schedule of Investments | April 30, 2015 (Unaudited) |
| | |
| Global X Guru™ Activist Index ETF |
| | | Shares | | | Value | |
| COMMON STOCK — continued | | | | | | | | |
| | | | | | | | | |
| Consumer Services — continued | | | | | | | | |
| eBay * | | | 520 | | | $ | 30,295 | |
| Family Dollar Stores | | | 380 | | | | 29,693 | |
| Hertz Global Holdings * | | | 1,300 | | | | 27,092 | |
| McDonald's | | | 320 | | | | 30,896 | |
| Scripps Networks Interactive, Cl A | | | 400 | | | | 27,944 | |
| Time Warner Cable | | | 200 | | | | 31,104 | |
| Twenty-First Century Fox, Cl B | | | 880 | | | | 29,348 | |
| | | | | | | | 237,212 | |
| Energy — 4.5% | | | | | | | | |
| Baker Hughes | | | 480 | | | | 32,861 | |
| Halliburton | | | 700 | | | | 34,265 | |
| | | | | | | | 67,126 | |
| Financials — 18.1% | | | | | | | | |
| Bank of New York Mellon | | | 760 | | | | 32,178 | |
| CBRE Group, Cl A * | | | 860 | | | | 32,972 | |
| FNF Group | | | 800 | | | | 28,792 | |
| Franklin Resources | | | 560 | | | | 28,874 | |
| Intercontinental Exchange | | | 130 | | | | 29,189 | |
| Legg Mason | | | 520 | | | | 27,378 | |
| Loews | | | 720 | | | | 29,981 | |
| McGraw Hill Financial | | | 280 | | | | 29,204 | |
| Moody's | | | 300 | | | | 32,257 | |
| | | | | | | | 270,825 | |
| Health Care — 6.1% | | | | | | | | |
| Amgen | | | 190 | | | | 30,003 | |
| Hologic * | | | 940 | | | | 31,716 | |
| Zoetis, Cl A | | | 660 | | | | 29,317 | |
| | | | | | | | 91,036 | |
| Industrials — 3.8% | | | | | | | | |
| FedEx | | | 170 | | | | 28,827 | |
| Ingersoll-Rand | | | 440 | | | | 28,970 | |
| | | | | | | | 57,797 | |
| Oil & Gas — 11.9% | | | | | | | | |
| Anadarko Petroleum | | | 350 | | | | 32,935 | |
| Chesapeake Energy | | | 1,520 | | | | 23,970 | |
| CONSOL Energy | | | 900 | | | | 29,232 | |
| CVR Energy | | | 720 | | | | 28,829 | |
| Hess | | | 400 | | | | 30,760 | |
| Williams | | | 620 | | | | 31,738 | |
| | | | | | | | 177,464 | |
| Technology — 13.6% | | | | | | | | |
| Adobe Systems * | | | 380 | | | | 28,903 | |
| Apple | | | 220 | | | | 27,533 | |
The accompanying notes are an integral part of the financial statements.
| Schedule of Investments | April 30, 2015 (Unaudited) |
| | |
| Global X Guru™ Activist Index ETF |
| | | Shares | | | Value | |
| COMMON STOCK — continued | | | | | | | | |
| | | | | | | | | |
| Technology — continued | | | | | | | | |
| EMC | | | 1,040 | | | $ | 27,986 | |
| Juniper Networks | | | 1,240 | | | | 32,773 | |
| Micron Technology * | | | 960 | | | | 27,005 | |
| Microsoft | | | 680 | | | | 33,075 | |
| Motorola Solutions | | | 440 | | | | 26,290 | |
| | | | | | | | 203,565 | |
| Telecommunications — 2.1% | | | | | | | | |
| Level 3 Communications * | | | 560 | | | | 31,326 | |
| TOTAL UNITED STATES | | | | | | | 1,345,860 | |
| TOTAL COMMON STOCK | | | | | | | | |
| (Cost $1,504,670) | | | | | | | 1,494,803 | |
| TOTAL INVESTMENTS — 100.0% | | | | | | | | |
| (Cost $1,504,670) | | | | | | $ | 1,494,803 | |
Percentages are based on Net Assets of $1,495,231.
| * | Non-income producing security. |
Cl — Class
As of April 30, 2015, all of the Fund's investments were considered Level 1, in accordance with the authoritative guidance on fair value measurements and disclosure under U.S. GAAP.
For the period ended April 30, 2015, there have been no transfers between Level 1, Level 2 or Level 3 investments.
As of April 30, 2015, there were no Level 3 investments.
The accompanying notes are an integral part of the financial statements.
| Schedule of Investments | April 30, 2015 (Unaudited) |
| | |
| Global X Guru™ International Index ETF |
Sector Weightings †:
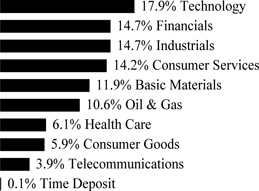
† Sector weightings percentages are based on the total market value of investments.
| | | Shares | | | Value | |
| COMMON STOCK — 99.8% | | | | | | | | |
| | | | | | | | | |
| ARGENTINA— 2.3% | | | | | | | | |
| Oil & Gas — 2.3% | | | | | | | | |
| YPF ADR | | | 1,718 | | | $ | 52,468 | |
| | | | | | | | | |
| BELGIUM— 1.9% | | | | | | | | |
| Consumer Goods — 1.9% | | | | | | | | |
| Anheuser-Busch InBev ADR | | | 366 | | | | 43,934 | |
| | | | | | | | | |
| BRAZIL— 5.8% | | | | | | | | |
| Financials — 4.2% | | | | | | | | |
| Banco Bradesco ADR | | | 4,209 | | | | 44,994 | |
| Banco Santander Brasil ADR | | | 9,183 | | | | 49,864 | |
| | | | | | | | 94,858 | |
| Industrials — 1.6% | | | | | | | | |
| Embraer ADR | | | 1,205 | | | | 37,572 | |
| TOTAL BRAZIL | | | | | | | 132,430 | |
| | | | | | | | | |
| CANADA— 30.0% | | | | | | | | |
| Basic Materials — 11.9% | | | | | | | | |
| Agrium | | | 417 | | | | 43,214 | |
| Barrick Gold | | | 3,505 | | | | 45,635 | |
| Dominion Diamond | | | 2,678 | | | | 52,783 | |
| Potash Corp of Saskatchewan | | | 1,222 | | | | 39,886 | |
| Pretium Resources * | | | 7,710 | | | | 44,410 | |
| Teck Resources, Cl B | | | 2,906 | | | | 44,113 | |
| | | | | | | | 270,041 | |
| Consumer Goods — 2.1% | | | | | | | | |
| Gildan Activewear, Cl A | | | 1,520 | | | | 48,199 | |
| Consumer Services — 4.0% | | | | | | | | |
| IMAX * | | | 1,271 | | | | 47,485 | |
| Restaurant Brands International | | | 1,086 | | | | 44,287 | |
| | | | | | | | 91,772 | |
The accompanying notes are an integral part of the financial statements.
| Schedule of Investments | April 30, 2015 (Unaudited) |
| | |
| Global X Guru™ International Index ETF |
| | | Shares | | | Value | |
| COMMON STOCK — continued | | | | | | | | |
| | | | | | | | | |
| Financials — 2.0% | | | | | | | | |
| Brookfield Asset Management, Cl A | | | 832 | | | $ | 44,803 | |
| Industrials — 5.9% | | | | | | | | |
| Canadian National Railway | | | 646 | | | | 41,680 | |
| Canadian Pacific Railway | | | 238 | | | | 45,358 | |
| Progressive Waste Solutions | | | 1,619 | | | | 46,805 | |
| | | | | | | | 133,843 | |
| Oil & Gas — 2.1% | | | | | | | | |
| TransCanada | | | 1,018 | | | | 47,256 | |
| Technology — 2.0% | | | | | | | | |
| BlackBerry * | | | 4,475 | | | | 45,466 | |
| TOTAL CANADA | | | | | | | 681,380 | |
| | | | | | | | | |
| CHINA— 8.7% | | | | | | | | |
| Consumer Services — 4.6% | | | | | | | | |
| Alibaba Group Holding ADR * | | | 521 | | | | 42,352 | |
| Ctrip.com International ADR * | | | 962 | | | | 61,260 | |
| | | | | | | | 103,612 | |
| Technology — 4.1% | | | | | | | | |
| 21Vianet Group ADR * | | | 2,465 | | | | 50,705 | |
| Baidu ADR * | | | 216 | | | | 43,261 | |
| | | | | | | | 93,966 | |
| TOTAL CHINA | | | | | | | 197,578 | |
| | | | | | | | | |
| COLOMBIA— 2.1% | | | | | | | | |
| Financials — 2.1% | | | | | | | | |
| BanColombia ADR | | | 1,046 | | | | 47,352 | |
| | | | | | | | | |
| FINLAND— 1.6% | | | | | | | | |
| Technology — 1.6% | | | | | | | | |
| Nokia ADR | | | 5,598 | | | | 36,835 | |
| | | | | | | | | |
| FRANCE— 1.9% | | | | | | | | |
| Health Care — 1.9% | | | | | | | | |
| Flamel Technologies ADR * | | | 3,090 | | | | 42,889 | |
| | | | | | | | | |
| GREECE— 1.5% | | | | | | | | |
| Industrials — 1.5% | | | | | | | | |
| DryShips * | | | 46,104 | | | | 32,734 | |
| | | | | | | | | |
| HONG KONG— 1.5% | | | | | | | | |
| Consumer Services — 1.5% | | | | | | | | |
| Melco Crown Entertainment ADR | | | 1,645 | | | | 33,591 | |
| | | | | | | | | |
| INDIA— 3.3% | | | | | | | | |
| Industrials — 1.6% | | | | | | | | |
| Tata Motors ADR | | | 912 | | | | 37,565 | |
| Technology — 1.7% | | | | | | | | |
| Infosys ADR | | | 1,224 | | | | 37,920 | |
The accompanying notes are an integral part of the financial statements.
| Schedule of Investments | April 30, 2015 (Unaudited) |
| | |
| Global X Guru™ International Index ETF |
| | | Shares | | | Value | |
| COMMON STOCK — continued | | | | | | | | |
| | | | | | | | | |
| TOTAL INDIA | | | | | | $ | 75,485 | |
| | | | | | | | | |
| IRELAND— 2.0% | | | | | | | | |
| Health Care — 2.0% | | | | | | | | |
| Shire ADR | | | 190 | | | | 46,267 | |
| | | | | | | | | |
| ISRAEL— 6.5% | | | | | | | | |
| Health Care — 2.1% | | | | | | | | |
| Teva Pharmaceutical Industries ADR | | | 796 | | | | 48,094 | |
| Technology — 4.4% | | | | | | | | |
| RADWARE * | | | 2,140 | | | | 50,654 | |
| Tower Semiconductor * | | | 3,301 | | | | 48,162 | |
| | | | | | | | 98,816 | |
| TOTAL ISRAEL | | | | | | | 146,910 | |
| | | | | | | | | |
| LUXEMBOURG— 2.1% | | | | | | | | |
| Financials — 2.1% | | | | | | | | |
| Altisource Portfolio Solutions * | | | 1,947 | | | | 47,215 | |
| | | | | | | | | |
| MEXICO— 1.9% | | | | | | | | |
| Telecommunications — 1.9% | | | | | | | | |
| America Movil ADR, Ser L | | | 2,077 | | | | 43,388 | |
| | | | | | | | | |
| NETHERLANDS— 6.0% | | | | | | | | |
| Industrials — 4.1% | | | | | | | | |
| AerCap Holdings * | | | 1,019 | | | | 47,567 | |
| Koninklijke Philips | | | 1,528 | | | | 43,716 | |
| | | | | | | | 91,283 | |
| Oil & Gas — 1.9% | | | | | | | | |
| Royal Dutch Shell ADR, Cl A | | | 687 | | | | 43,576 | |
| TOTAL NETHERLANDS | | | | | | | 134,859 | |
| | | | | | | | | |
| NORWAY— 2.2% | | | | | | | | |
| Oil & Gas — 2.2% | | | | | | | | |
| Statoil ADR | | | 2,390 | | | | 50,740 | |
| | | | | | | | | |
| PERU— 2.0% | | | | | | | | |
| Financials — 2.0% | | | | | | | | |
| Credicorp Ltd. | | | 303 | | | | 46,223 | |
| | | | | | | | | |
| SINGAPORE— 2.1% | | | | | | | | |
| Technology — 2.1% | | | | | | | | |
| Avago Technologies, Cl A | | | 403 | | | | 47,103 | |
| | | | | | | | | |
| SOUTH KOREA— 2.0% | | | | | | | | |
| Telecommunications — 2.0% | | | | | | | | |
| SK Telecom ADR | | | 1,538 | | | | 45,602 | |
The accompanying notes are an integral part of the financial statements.
| Schedule of Investments | April 30, 2015 (Unaudited) |
| | |
| Global X Guru™ International Index ETF |
| | | Shares/Face
Amount | | | Value | |
| COMMON STOCK — continued | | | | | | | | |
| | | | | | | | | |
| SWITZERLAND— 2.3% | | | | | | | | |
| Financials — 2.3% | | | | | | | | |
| UBS Group | | | 2,561 | | | $ | 51,399 | |
| | | | | | | | | |
| TAIWAN— 2.0% | | | | | | | | |
| Technology — 2.0% | | | | | | | | |
| Taiwan Semiconductor Manufacturing ADR | | | 1,849 | | | | 45,189 | |
| | | | | | | | | |
| UNITED KINGDOM— 4.0% | | | | | | | | |
| Consumer Goods — 1.9% | | | | | | | | |
| Fiat Chrysler Automobiles * | | | 2,915 | | | | 42,996 | |
| Oil & Gas — 2.1% | | | | | | | | |
| BP ADR | | | 1,097 | | | | 47,347 | |
| TOTAL UNITED KINGDOM | | | | | | | 90,343 | |
| | | | | | | | | |
| UNITED STATES— 4.1% | | | | | | | | |
| Consumer Services — 4.1% | | | | | | | | |
| MakeMyTrip * | | | 1,806 | | | | 38,251 | |
| TAL Education Group ADR * | | | 1,502 | | | | 55,198 | |
| TOTAL UNITED STATES | | | | | | | 93,449 | |
| TOTAL COMMON STOCK | | | | | | | | |
| (Cost $2,311,873) | | | | | | | 2,265,363 | |
| | | | | | | | | |
| TIME DEPOSIT — 0.1% | | | | | | | | |
| Brown Brothers Harriman, 0.030%, 05/01/15 | | | | | | | | |
| (Cost $3,182) | | $ | 3,182 | | | | 3,182 | |
| TOTAL INVESTMENTS — 99.9% | | | | | | | | |
| (Cost $2,315,055) | | | | | | $ | 2,268,545 | |
Percentages are based on Net Assets of $2,270,470.
| * | Non-income producing security. |
ADR — American Depositary Receipt
Cl — Class
Ltd. — Limited
Ser — Series
The following is a summary of the inputs used as of April 30, 2015, in valuing the Fund's investments carried at value:
| Investments in Securities | | Level 1 | | | Level 2 | | | Level 3 | | | Total | |
| Common Stock | | $ | 2,265,363 | | | $ | — | | | $ | — | | | $ | 2,265,363 | |
| Time Deposit | | | — | | | | 3,182 | | | | — | | | | 3,182 | |
| Total Investments in Securities | | $ | 2,265,363 | | | $ | 3,182 | | | $ | — | | | $ | 2,268,545 | |
For the period ended April 30, 2015, there have been no transfers between Level 1, Level 2 or Level 3 investments.
As of April 30, 2015, there were no Level 3 investments.
The accompanying notes are an integral part of the financial statements.
| Schedule of Investments | April 30, 2015 (Unaudited) |
| | |
| Global X Guru™ Small Cap Index ETF |
Sector Weightings †:
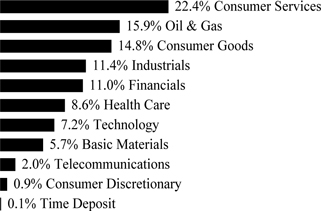
† Sector weightings percentages are based on the total market value of investments.
| | | Shares | | | Value | |
| COMMON STOCK — 95.9% | | | | | | | | |
| | | | | | | | | |
| AUSTRALIA— 0.9% | | | | | | | | |
| Basic Materials — 0.9% | | | | | | | | |
| Tronox, Cl A | | | 908 | | | $ | 19,022 | |
| | | | | | | | | |
| CANADA— 2.1% | | | | | | | | |
| Basic Materials — 1.0% | | | | | | | | |
| Pretium Resources * | | | 3,572 | | | | 20,575 | |
| Consumer Services — 1.1% | | | | | | | | |
| IMAX * | | | 589 | | | | 22,005 | |
| TOTAL CANADA | | | | | | | 42,580 | |
| | | | | | | | | |
| FRANCE— 1.0% | | | | | | | | |
| Health Care — 1.0% | | | | | | | | |
| Flamel Technologies ADR * | | | 1,431 | | | | 19,862 | |
| | | | | | | | | |
| GREECE— 0.7% | | | | | | | | |
| Industrials — 0.7% | | | | | | | | |
| DryShips * | | | 21,360 | | | | 15,166 | |
| | | | | | | | | |
| IRELAND— 1.5% | | | | | | | | |
| Health Care — 1.5% | | | | | | | | |
| Horizon Pharma * | | | 1,130 | | | | 31,776 | |
| | | | | | | | | |
| ISRAEL— 1.1% | | | | | | | | |
| Technology — 1.1% | | | | | | | | |
| RADWARE * | | | 1,008 | | | | 23,859 | |
| | | | | | | | | |
| JERSEY— 1.1% | | | | | | | | |
| Oil & Gas — 1.1% | | | | | | | | |
| DHT Holdings | | | 2,883 | | | | 23,064 | |
The accompanying notes are an integral part of the financial statements.
| Schedule of Investments | April 30, 2015 (Unaudited) |
| | |
| Global X Guru™ Small Cap Index ETF |
| | | Shares | | | Value | |
| COMMON STOCK — continued | | | | | | | | |
| | | | | | | | | |
| LUXEMBOURG— 1.1% | | | | | | | | |
| Financials — 1.1% | | | | | | | | |
| Altisource Portfolio Solutions * | | | 902 | | | $ | 21,873 | |
| | | | | | | | | |
| PERU— 1.1% | | | | | | | | |
| Basic Materials — 1.1% | | | | | | | | |
| Cia de Minas Buenaventura ADR | | | 2,013 | | | | 22,505 | |
| | | | | | | | | |
| UNITED STATES— 85.3% | | | | | | | | |
| Basic Materials — 2.7% | | | | | | | | |
| Flotek Industries * | | | 1,216 | | | | 17,377 | |
| Mercer International * | | | 1,451 | | | | 20,749 | |
| Resolute Forest Products * | | | 1,109 | | | | 17,101 | |
| | | | | | | | 55,227 | |
| Consumer Discretionary — 0.9% | | | | | | | | |
| Liberty TripAdvisor Holdings, Cl A * | | | 635 | | | | 18,866 | |
| Consumer Goods — 14.9% | | | | | | | | |
| American Eagle Outfitters | | | 1,418 | | | | 22,560 | |
| Barnes & Noble * | | | 849 | | | | 18,593 | |
| Chico's FAS | | | 1,163 | | | | 19,608 | |
| Cooper-Standard Holding * | | | 368 | | | | 22,455 | |
| Darling Ingredients * | | | 1,187 | | | | 16,214 | |
| Dean Foods | | | 1,266 | | | | 20,573 | |
| Federal-Mogul Holdings * | | | 1,405 | | | | 18,125 | |
| FTD * | | | 593 | | | | 16,924 | |
| Lands' End * | | | 593 | | | | 17,423 | |
| Libbey | | | 569 | | | | 22,390 | |
| Lumber Liquidators Holdings * | | | 308 | | | | 8,467 | |
| Navistar International * | | | 714 | | | | 21,391 | |
| Outerwall | | | 311 | | | | 20,660 | |
| Ryland Group | | | 466 | | | | 19,209 | |
| SpartanNash | | | 799 | | | | 24,106 | |
| Take-Two Interactive Software * | | | 785 | | | | 18,604 | |
| | | | | | | | 307,302 | |
| Consumer Services — 21.3% | | | | | | | | |
| Apollo Education Group, Cl A * | | | 782 | | | | 13,126 | |
| Ascena Retail Group * | | | 1,590 | | | | 23,834 | |
| Children's Place Retail Stores | | | 367 | | | | 22,262 | |
| DreamWorks Animation SKG, Cl A * | | | 1,029 | | | | 26,816 | |
| First Cash Financial Services * | | | 428 | | | | 20,690 | |
| Heartland Payment Systems | | | 433 | | | | 22,040 | |
| Houghton Mifflin Harcourt * | | | 1,056 | | | | 24,140 | |
| ITT Educational Services * | | | 2,533 | | | | 13,374 | |
| KB Home | | | 1,488 | | | | 21,561 | |
| Life Time Fitness * | | | 357 | | | | 25,525 | |
| MakeMyTrip * | | | 837 | | | | 17,728 | |
The accompanying notes are an integral part of the financial statements.
| Schedule of Investments | April 30, 2015 (Unaudited) |
| | |
| Global X Guru™ Small Cap Index ETF |
| | | Shares | | | Value | |
| COMMON STOCK — continued | | | | | | | | |
| | | | | | | | | |
| Consumer Services — continued | | | | | | | | |
| Meritage Homes * | | | 493 | | | $ | 21,086 | |
| Monro Muffler Brake | | | 331 | | | | 19,824 | |
| Noodles, Cl A * | | | 1,107 | | | | 22,162 | |
| Pinnacle Entertainment * | | | 804 | | | | 29,555 | |
| Rent-A-Center, Cl A | | | 717 | | | | 21,223 | |
| Republic Airways Holdings * | | | 1,442 | | | | 17,650 | |
| Scientific Games, Cl A * | | | 1,522 | | | | 19,284 | |
| Sears Hometown and Outlet Stores * | | | 1,610 | | | | 11,157 | |
| Sinclair Broadcast Group, Cl A | | | 771 | | | | 23,623 | |
| TAL Education Group ADR * | | | 696 | | | | 25,578 | |
| | | | | | | | 442,238 | |
| Financials — 9.9% | | | | | | | | |
| Ambac Financial Group * | | | 835 | | | | 19,213 | |
| American National Insurance | | | 198 | | | | 19,812 | |
| Enstar Group * | | | 153 | | | | 21,732 | |
| HRG Group * | | | 1,710 | | | | 21,426 | |
| MBIA * | | | 2,437 | | | | 21,324 | |
| Nationstar Mortgage Holdings * | | | 750 | | | | 18,825 | |
| NMI Holdings, Cl A * | | | 2,776 | | | | 22,153 | |
| Primerica | | | 391 | | | | 18,072 | |
| St. Joe * | | | 1,202 | | | | 20,975 | |
| State National | | | 2,285 | | | | 21,799 | |
| | | | | | | | 205,331 | |
| Health Care — 6.1% | | | | | | | | |
| Depomed * | | | 1,046 | | | | 24,330 | |
| Hill-Rom Holdings | | | 438 | | | | 21,874 | |
| Kindred Healthcare | | | 1,104 | | | | 25,337 | |
| Medicines * | | | 735 | | | | 18,823 | |
| Theravance | | | 1,149 | | | | 18,671 | |
| Vanda Pharmaceuticals * | | | 1,831 | | | | 16,754 | |
| | | | | | | | 125,789 | |
| Industrials — 10.7% | | | | | | | | |
| American Railcar Industries | | | 373 | | | | 19,784 | |
| Dycom Industries * | | | 551 | | | | 25,335 | |
| EnPro Industries | | | 318 | | | | 20,355 | |
| GATX | | | 330 | | | | 17,952 | |
| Louisiana-Pacific * | | | 1,203 | | | | 18,334 | |
| MasTec * | | | 1,014 | | | | 18,191 | |
| Nortek * | | | 266 | | | | 22,509 | |
| Quad | | | 926 | | | | 19,946 | |
| Quanex Building Products | | | 1,071 | | | | 20,670 | |
| Terex | | | 766 | | | | 21,035 | |
| YRC Worldwide * | | | 1,049 | | | | 16,364 | |
| | | | | | | | 220,475 | |
The accompanying notes are an integral part of the financial statements.
| Schedule of Investments | April 30, 2015 (Unaudited) |
| | |
| Global X Guru™ Small Cap Index ETF |
| | | Shares/Face Amount | | | Value | |
| COMMON STOCK — continued | | | | | | | | |
| | | | | | | | | |
| Oil & Gas — 10.7% | | | | | | | | |
| Atwood Oceanics | | | 609 | | | $ | 20,329 | |
| California Resources | | | 2,965 | | | | 27,574 | |
| Enbridge Energy Management | | | 567 | | | | 20,934 | |
| Exterran Holdings | | | 662 | | | | 24,540 | |
| MRC Global * | | | 1,660 | | | | 24,236 | |
| PBF Energy, Cl A | | | 677 | | | | 19,213 | |
| SandRidge Energy * | | | 9,019 | | | | 17,046 | |
| Scorpio Tankers | | | 2,493 | | | | 23,285 | |
| Stone Energy * | | | 1,172 | | | | 20,006 | |
| Viper Energy Partners | | | 1,146 | | | | 23,619 | |
| | | | | | | | 220,782 | |
| Technology — 6.1% | | | | | | | | |
| Allscripts Healthcare Solutions * | | | 1,631 | | | | 21,692 | |
| Carbonite * | | | 1,414 | | | | 14,479 | |
| InterDigital | | | 405 | | | | 22,162 | |
| Mentor Graphics | | | 827 | | | | 19,790 | |
| NetScout Systems * | | | 535 | | | | 21,989 | |
| Universal Display * | | | 582 | | | | 25,649 | |
| | | | | | | | 125,761 | |
| Telecommunications — 2.0% | | | | | | | | |
| Intelsat * | | | 1,587 | | | | 19,980 | |
| Leap Wireless *(A) (B) | | | 856 | | | | 1,819 | |
| VASCO Data Security International * | | | 759 | | | | 19,294 | |
| | | | | | | | 41,093 | |
| TOTAL UNITED STATES | | | | | | | 1,762,864 | |
| TOTAL COMMON STOCK | | | | | | | | |
| (Cost $2,065,448) | | | | | | | 1,982,571 | |
| | | | | | | | | |
| MASTER LIMITED PARTNERSHIPS — 4.1% | | | | | | | | |
| | | | | | | | | |
| UNITED STATES— 4.1% | | | | | | | | |
| Oil & Gas — 4.1% | | | | | | | | |
| Crestwood Midstream Partners | | | 1,499 | | | | 23,789 | |
| Golar LNG Partners | | | 754 | | | | 22,024 | |
| NGL Energy Partners | | | 668 | | | | 19,546 | |
| Summit Midstream Partners | | | 535 | | | | 18,966 | |
| TOTAL MASTER LIMITED PARTNERSHIP | | | | | | | | |
| (Cost $92,479) | | | | | | | 84,325 | |
| | | | | | | | | |
| TIME DEPOSIT — 0.1% | | | | | | | | |
| Brown Brothers Harriman, 0.030%, 05/01/15 | | | | | | | | |
| (Cost $2,148) | | $ | 2,148 | | | | 2,148 | |
| TOTAL INVESTMENTS — 100.1% | | | | | | | | |
| (Cost $2,160,075) | | | | | | $ | 2,069,044 | |
The accompanying notes are an integral part of the financial statements.
| Schedule of Investments | April 30, 2015 (Unaudited) |
| | |
| Global X Guru™ Small Cap Index ETF |
Percentages are based on Net Assets of $2,067,783.
| * | Non-income producing security. |
| (A) | Security is fair valued using methods determined in good faith by the Fair Value Committee of the Fund. The total value of such security as of April 30, 2015, was $1,819 and represents 0.09% of Net Assets. |
| (B) | Securities considered illiquid. The total value of such securities as of April 30, 2015 was 1,819 and represented 0.1% of Net Assets. |
ADR — American Depositary Receipt
Cl — Class
The following is a summary of the inputs used as of April 30, 2015, in valuing the Fund's investments carried at value:
| Investments in Securities | | Level 1 | | | Level 2 | | | Level 3(a) | | | Total | |
| Common Stock | | $ | 1,980,752 | | | $ | — | | | $ | 1,819 | | | $ | 1,982,571 | |
| Master Limited Partnerships | | | 84,325 | | | | — | | | | — | | | | 84,325 | |
| Time Deposit | | | — | | | | 2,148 | | | | — | | | | 2,148 | |
| Total Investments in Securities | | $ | 2,065,077 | | | $ | 2,148 | | | $ | 1,819 | | | $ | 2,069,044 | |
| (a) | A reconciliation of Level 3 investments and disclosures of significant unobservable inputs are presented when the Fund has a significant amount of Level 3 investments at the beginning and/or end of the period in relation to net assets. Management has concluded that Level 3 investments are not material in relation to net assets. |
For the period ended April 30, 2015, there have been no transfers between Level 1, Level 2 or Level 3 investments.
The accompanying notes are an integral part of the financial statements.
| Schedule of Investments | April 30, 2015 (Unaudited) |
| | |
| Global X GF China Bond ETF |
Sector Weightings †:
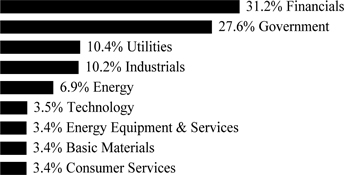
† Sector weightings percentages are based on the total market value of investments.
| | | Face Amount(1) | | | Value | |
| CORPORATE OBLIGATIONS — 97.2% | | | | | | | | |
| | | | | | | | | |
| CHINA — 97.2% | | | | | | | | |
| Basic Materials — 3.3% | | | | | | | | |
| Wuhan Iron & Steel Group MTN | | | | | | | | |
| 4.990%, 08/08/16 | | | 10,000,000 | | | $ | 1,621,174 | |
| Consumer Services — 3.3% | | | | | | | | |
| Overseas Chinese Town Enterprises MTN | | | | | | | | |
| 5.400%, 08/08/17 | | | 10,000,000 | | | | 1,639,829 | |
| Energy — 6.7% | | | | | | | | |
| China Three Gorges MTN | | | | | | | | |
| 4.440%, 04/17/18 | | | 10,000,000 | | | | 1,620,165 | |
| Shenhua Group MTN | | | | | | | | |
| 5.150%, 06/13/19 | | | 10,000,000 | | | | 1,657,701 | |
| | | | | | | | 3,277,866 | |
| Energy Equipment & Services — 3.3% | | | | | | | | |
| China Energy Conservation & Environmental Protection Group MTN | | | | | | | | |
| 5.210%, 11/28/16 | | | 10,000,000 | | | | 1,635,729 | |
| Financials — 30.3% | | | | | | | | |
| Agricultural Development Bank of China | | | | | | | | |
| 4.950%, 07/16/19 | | | 10,000,000 | | | | 1,672,335 | |
| China Development Bank | | | | | | | | |
| 4.830%, 09/19/19 | | | 30,000,000 | | | | 4,976,402 | |
| 4.690%, 08/07/17 | | | 10,000,000 | | | | 1,640,233 | |
| 3.750%, 07/09/17 | | | 30,000,000 | | | | 4,845,618 | |
| China Merchants Group MTN | | | | | | | | |
| 5.400%, 08/18/21 | | | 10,000,000 | | | | 1,674,065 | |
| | | | | | | | 14,808,653 | |
| Government — 26.9% | | | | | | | | |
| China Government Bond | | | | | | | | |
| 4.000%, 09/11/17 | | | 40,000,000 | | | | 6,585,516 | |
| 3.530%, 10/30/19 | | | 30,000,000 | | | | 4,889,036 | |
The accompanying notes are an integral part of the financial statements.
| Schedule of Investments | April 30, 2015 (Unaudited) |
| | |
| Global X GF China Bond ETF |
| | | Face Amount(1) | | | Value | |
| CORPORATE OBLIGATIONS — continued | | | | | | | | |
| | | | | | | | | |
| Government — continued | | | | | | | | |
| Export-Import Bank of China | | | | | | | | |
| 4.691%, 08/05/17 | | | 10,000,000 | | | $ | 1,640,912 | |
| | | | | | | | 13,115,464 | |
| Industrials — 9.9% | | | | | | | | |
| China North Industries Group | | | | | | | | |
| 4.480%, 05/24/17 | | | 10,000,000 | | | | 1,617,324 | |
| China Shipbuilding Industry MTN | | | | | | | | |
| 5.350%, 05/12/17 | | | 10,000,000 | | | | 1,638,267 | |
| China State Shipbuilding MTN | | | | | | | | |
| 4.800%, 07/18/19 | | | 10,000,000 | | | | 1,618,866 | |
| | | | | | | | 4,874,457 | |
| Technology — 3.4% | | | | | | | | |
| China Electronics MTN | | | | | | | | |
| 5.400%, 06/13/19 | | | 10,000,000 | | | | 1,651,403 | |
| Utilities — 10.1% | | | | | | | | |
| China Huaneng Group MTN | | | | | | | | |
| 5.750%, 03/14/19 | | | 10,000,000 | | | | 1,685,160 | |
| China Power Investment MTN | | | | | | | | |
| 5.260%, 05/07/17 | | | 10,000,000 | | | | 1,640,703 | |
| State Grid Corp of China MTN | | | | | | | | |
| 4.840%, 06/11/17 | | | 10,000,000 | | | | 1,630,638 | |
| | | | | | | | 4,956,501 | |
| TOTAL CORPORATE OBLIGATIONS | | | | | | | | |
| (Cost $48,083,805) | | | | | | | 47,581,076 | |
| TOTAL INVESTMENTS — 97.2% | | | | | | | | |
| (Cost $48,083,805) | | | | | | $ | 47,581,076 | |
Percentages are based on Net Assets of $48,941,064.
MTN — Medium Term Note
The following is a summary of the inputs used as of April 30, 2015, in valuing the Fund's investments carried at value:
| Investments in Securities | | Level 1 | | | Level 2 | | | Level 3 | | | Total | |
| Corporate Obligations | | $ | — | | | $ | 47,581,076 | | | $ | — | | | $ | 47,581,076 | |
| Total Investments in Securities | | $ | — | | | $ | 47,581,076 | | | $ | — | | | $ | 47,581,076 | |
For the period ended April 30, 2015, there have been no transfers between Level 1, Level 2 or Level 3 investments.
As of April 30, 2015, there were no Level 3 investments.
The accompanying notes are an integral part of the financial statements.
Statements of Assets And Liabilities |
| APRIL 30, 2015(Unaudited) |
| | | Global X
SuperDividend®
ETF | | | Global X
SuperDividend®
U.S. ETF | | | Global X
SuperDividend®
Emerging Markets
ETF | | | Global X
SuperDividend®
REIT ETF | | | Global X
SuperIncome™
Preferred ETF | |
| Assets: | | | | | | | | | | | | | | | | | | | | |
| Cost of Investments | | $ | 1,045,030,927 | | | $ | 285,033,324 | | | $ | 3,095,957 | | | $ | 2,305,390 | | | $ | 287,824,689 | |
| Cost of Repurchase Agreement | | | 90,695,736 | | | | 4,108,681 | | | | — | | | | — | | | | 7,872,200 | |
| Cost of Foreign Currency | | | — | | | | — | | | | 1,365 | | | | 728 | | | | — | |
| Investments, at Value | | $ | 1,084,940,576 | * | | $ | 290,558,315 | * | | $ | 3,632,977 | | | $ | 2,272,315 | | | $ | 288,246,775 | * |
| Repurchase Agreement, at Value | | | 90,695,736 | | | | 4,108,681 | | | | — | | | | — | | | | 7,872,200 | |
| Foreign Currency, at Value | | | 279,808 | | | | — | | | | 1,350 | | | | 738 | | | | — | |
| Cash | | | — | | | | 7,260,904 (1) | | | | 11,422 | | | | 9,112 | | | | 28,860 | |
| Receivable for Investment Securities Sold | | | 8,591,521 | | | | 2,862,441 | | | | — | | | | — | | | | — | |
| Dividend and Interest Receivable | | | 4,477,716 | | | | 448,019 | | | | 20,695 | | | | 4,780 | | | | 617,532 | |
| Reclaim Receivable | | | 378,864 | | | | 4,526 | | | | — | | | | — | | | | — | |
| Unrealized Appreciation on Spot Contracts | | | 5,581 | | | | — | | | | 2 | | | | 2 | | | | — | |
| Receivable for Capital Shares Sold | | | — | | | | 1,444,129 | | | | — | | | | — | | | | — | |
| Total Assets | | | 1,189,369,802 | | | | 306,687,015 | | | | 3,666,446 | | | | 2,286,947 | | | | 296,765,367 | |
| Liabilities: | | | | | | | | | | | | | | | | | | | | |
| Obligation to Return Securities Lending Collateral | | | 90,695,736 | | | | 11,369,585 | | | | — | | | | — | | | | 7,872,200 | |
| Payable for Investment Securities Purchased | | | 18,634,909 | | | | 1,441,613 | | | | — | | | | — | | | | — | |
| Payable due to Investment Adviser | | | 505,317 | | | | 107,612 | | | | 1,822 | | | | 1,112 | | | | 134,276 | |
| Cash Overdraft | | | 8,345 | | | | 948 | | | | — | | | | — | | | | — | |
| Unrealized Depreciation on Spot Contracts | | | 1,309 | | | | — | | | | 1 | | | | — | | | | — | |
| Payable for Capital Shares Redeemed | | | — | | | | 2,869,486 | | | | — | | | | — | | | | — | |
| Total Liabilities | | | 109,845,616 | | | | 15,789,244 | | | | 1,823 | | | | 1,112 | | | | 8,006,476 | |
| Net Assets | | $ | 1,079,524,186 | | | $ | 290,897,771 | | | $ | 3,664,623 | | | $ | 2,285,835 | | | $ | 288,758,891 | |
| Net Assets Consist of: | | | | | | | | | | | | | | | | | | | | |
| Paid-in Capital | | $ | 1,062,630,296 | | | $ | 290,962,219 | | | $ | 3,097,256 | | | $ | 2,287,916 | | | $ | 292,375,386 | |
| Undistributed (Distributions in Excess of) Net Investment Income | | | (7,882,528 | ) | | | (268,132 | ) | | | 27,703 | | | | 27,594 | | | | 778,168 | |
| Accumulated Net Realized Gain (Loss) on Investments and Foreign Currency Transactions | | | (15,169,058 | ) | | | (5,321,307 | ) | | | 2,579 | | | | 3,393 | | | | (4,816,749 | ) |
| Net Unrealized Appreciation (Depreciation) on Investments | | | 39,909,649 | | | | 5,524,991 | | | | 537,020 | | | | (33,075 | ) | | | 422,086 | |
| Net Unrealized Appreciation on Foreign Currency Translations | | | 35,827 | | | | — | | | | 65 | | | | 7 | | | | — | |
| Net Assets | | $ | 1,079,524,186 | | | $ | 290,897,771 | | | $ | 3,664,623 | | | $ | 2,285,835 | | | $ | 288,758,891 | |
| Outstanding Shares of Beneficial Interest | | | | | | | | | | | | | | | | | | | | |
| (unlimited authorization — no par value) | | | 45,100,000 | | | | 10,200,000 | | | | 200,000 | | | | 150,000 | | | | 19,750,000 | |
| Net Asset Value, Offering and Redemption Price Per Share | | $ | 23.94 | | | $ | 28.52 | | | $ | 18.32 | | | $ | 15.24 | | | $ | 14.62 | |
| * Includes Market Value of Securities on Loan | | $ | 88,484,305 | | | $ | 11,105,280 | | | $ | — | | | $ | — | | | $ | 7,585,490 | |
| (1) | Cash is restricted, received from securities on loan (See Note 7 in Notes to Financial Statements). |
The accompanying notes are an integral part of the financial statements.
Statements of Assets And Liabilities |
| APRIL 30, 2015(Unaudited) |
| | | Global X Social
Media Index ETF | | | Global X |
JPMorgan
Efficiente Index
ETF | | | Global X |
JPMorgan US
Sector Rotator
Index ETF | | | Global X
Permanent ETF | | | Global X Guru™
Index ETF | |
| Assets: | | | | | | | | | | | | | | | | | | | | |
| Cost of Investments | | $ | 117,831,652 | | | $ | 26,281,238 | | | $ | 27,184,097 | | | $ | 10,401,889 | | | $ | 290,965,472 | |
| Cost of Repurchase Agreement | | | 6,914,531 | | | | — | | | | — | | | | — | | | | — | |
| Cost of Foreign Currency | | | — | | | | — | | | | — | | | | 2 | | | | — | |
| Investments, at Value | | $ | 109,291,600 | * | | $ | 26,043,029 | | | $ | 27,121,099 | | | $ | 9,730,106 | | | $ | 302,409,979 | |
| Repurchase Agreement, at Value | | | 6,914,531 | | | | — | | | | — | | | | — | | | | — | |
| Foreign Currency, at Value | | | — | | | | — | | | | — | | | | 2 | | | | — | |
| Receivable for Investment Securities Sold | | | 17,045,295 | | | | — | | | | 21,227,380 | | | | — | | | | — | |
| Dividend and Interest Receivable | | | 108,145 | | | | — | | | | — | | | | 43,658 | | | | 159,701 | |
| Reclaim Receivable | | | — | | | | — | | | | — | | | | 220 | | | | — | |
| Total Assets | | | 133,359,571 | | | | 26,043,029 | | | | 48,348,479 | | | | 9,773,986 | | | | 302,569,680 | |
| Liabilities: | | | | | | | | | | | | | | | | | | | | |
| Payable for Investment Securities Purchased | | | 16,591,776 | | | | — | | | | 21,202,692 | | | | — | | | | — | |
| Obligation to Return Securities Lending Collateral | | | 6,914,531 | | | | — | | | | — | | | | — | | | | — | |
| Payable due to Investment Adviser | | | 59,843 | | | | 13,068 | | | | 16,142 | | | | 3,906 | | | | 189,406 | |
| Cash Overdraft | | | 4,100 | | | | 4,703 | | | | — | | | | 850 | | | | — | |
| Total Liabilities | | | 23,570,250 | | | | 17,771 | | | | 21,218,834 | | | | 4,756 | | | | 189,406 | |
| Net Assets | | $ | 109,789,321 | | | $ | 26,025,258 | | | $ | 27,129,645 | | | $ | 9,769,230 | | | $ | 302,380,274 | |
| Net Assets Consist of: | | | | | | | | | | | | | | | | | | | | |
| Paid-in Capital | | $ | 122,996,135 | | | $ | 26,228,265 | | | $ | 28,381,480 | | | $ | 10,713,715 | | | $ | 284,980,396 | |
| Undistributed Net Investment Income | | | 51,381 | | | | 58,027 | | | | 66,704 | | | | 32,607 | | | | 469,712 | |
| Accumulated Net Realized Gain (Loss) on Investments and Foreign Currency Transactions | | | (4,717,828 | ) | | | (22,825 | ) | | | (1,255,541 | ) | | | (305,318 | ) | | | 5,485,659 | |
| Net Unrealized Appreciation (Depreciation) on Investments | | | (8,540,052 | ) | | | (238,209 | ) | | | (62,998 | ) | | | (671,783 | ) | | | 11,444,507 | |
| Net Unrealized Appreciation (Depreciation) on Foreign Currency Translations | | | (315 | ) | | | — | | | | — | | | | 9 | | | | — | |
| Net Assets | | $ | 109,789,321 | | | $ | 26,025,258 | | | $ | 27,129,645 | | | $ | 9,769,230 | | | $ | 302,380,274 | |
| Outstanding Shares of Beneficial Interest | | | | | | | | | | | | | | | | | | | | |
| (unlimited authorization — no par value) | | | 5,400,000 | | | | 1,000,000 | | | | 1,100,000 | | | | 400,000 | | | | 11,350,000 | |
| Net Asset Value, Offering and Redemption Price Per Share | | $ | 20.33 | | | $ | 26.03 | | | $ | 24.66 | | | $ | 24.42 | | | $ | 26.64 | |
| *Includes Market Value of Securities on Loan | | $ | 6,583,622 | | | $ | — | | | $ | — | | | $ | — | | | $ | — | |
The accompanying notes are an integral part of the financial statements.
Statements of Assets And Liabilities |
| APRIL 30, 2015(Unaudited) |
| | | Global X Guru™
Activist Index ETF | | | Global X Guru™
International Index
ETF | | | Global X Guru™
Small Cap Index
ETF | | | Global X GF China
Bond ETF | |
| Assets: | | | | | | | | | | | | | | | | |
| Cost of Investments | | $ | 1,504,670 | | | $ | 2,315,055 | | | $ | 2,160,075 | | | $ | 48,083,805 | |
| Cost of Foreign Currency | | | — | | | | — | | | | — | | | | 15,806 | |
| Investments, at Value | | $ | 1,494,803 | | | $ | 2,268,545 | | | $ | 2,069,044 | | | $ | 47,581,076 | |
| Foreign Currency, at Value | | | — | | | | — | | | | — | | | | 15,803 | |
| Cash | | | — | | | | 34 | | | | — | | | | — | |
| Receivable for Capital Shares Sold | | | 1,505,000 | | | | — | | | | — | | | | — | |
| Dividend and Interest Receivable | | | 129 | | | | 2,884 | | | | — | | | | 1,462,596 | |
| Reclaim Receivable | | | — | | | | 408 | | | | 36 | | | | — | |
| Total Assets | | | 2,999,932 | | | | 2,271,871 | | | | 2,069,080 | | | | 49,059,475 | |
| Liabilities: | | | | | | | | | | | | | | | | |
| Payable for Investment Securities Purchased | | | 1,504,670 | | | | — | | | | — | | | | — | |
| Payable due to Investment Adviser | | | 31 | | | | 1,401 | | | | 1,297 | | | | 24,076 | |
| Cash Overdraft | | | — | | | | — | | | | — | | | | 94,335 | |
| Total Liabilities | | | 1,504,701 | | | | 1,401 | | | | 1,297 | | | | 118,411 | |
| Net Assets | | $ | 1,495,231 | | | $ | 2,270,470 | | | $ | 2,067,783 | | | $ | 48,941,064 | |
| Net Assets Consist of: | | | | | | | | | | | | | | | | |
| Paid-in Capital | | $ | 1,505,000 | | | $ | 2,334,438 | | | $ | 2,251,332 | | | $ | 49,389,420 | |
| Undistributed Net Investment Income | | | 98 | | | | 1,018 | | | | 1,095 | | | | 132,635 | |
| Accumulated Net Realized Loss on Investments and Foreign Currency Transactions | | | — | | | | (18,476 | ) | | | (93,613 | ) | | | (71,208 | ) |
| Net Unrealized Depreciation on Investments | | | (9,867 | ) | | | (46,510 | ) | | | (91,031 | ) | | | (502,729 | ) |
| Net Unrealized Depreciation on Foreign Currency Translations | | | — | | | | — | | | | — | | | | (7,054 | ) |
| Net Assets | | $ | 1,495,231 | | | $ | 2,270,470 | | | $ | 2,067,783 | | | $ | 48,941,064 | |
| Outstanding Shares of Beneficial Interest | | | | | | | | | | | | | | | | |
| (unlimited authorization — no par value) | | | 100,000 | | | | 150,000 | | | | 150,000 | | | | 1,300,000 | |
| Net Asset Value, Offering and Redemption Price Per Share | | $ | 14.95 | | | $ | 15.14 | | | $ | 13.79 | | | $ | 37.65 | |
The accompanying notes are an integral part of the financial statements.
Statements of Operations |
| For the period ended April 30, 2015 (Unaudited) |
| | | Global X
SuperDividend®
ETF | | | Global X
SuperDividend® U.S.
ETF | | | Global X
SuperDividend®
Emerging Markets
ETF(1) | | | Global X
SuperDividend®
REIT ETF(1) | | | Global X
SuperIncome™
Preferred ETF | |
| Investment Income: | | | | | | | | | | | | | | | | | | | | |
| Dividend Income | | $ | 30,332,626 | | | $ | 9,005,096 | | | $ | 31,517 | | | $ | 29,497 | | | $ | 8,353,590 | |
| Interest Income | | | 490 | | | | 162 | | | | — | | | | — | | | | 125 | |
| Security Lending Income | | | 244,978 | | | | 173,234 | | | | — | | | | — | | | | 32,079 | |
| Less: Foreign Taxes Withheld | | | (1,420,311 | ) | | | (25,716 | ) | | | (1,543 | ) | | | (385 | ) | | | — | |
| Total Investment Income | | | 29,157,783 | | | | 9,152,776 | | | | 29,974 | | | | 29,112 | | | | 8,385,794 | |
| Supervision and Administration Fees(2) | | | 2,958,322 | | | | 663,043 | | | | 2,271 | | | | 1,518 | | | | 655,070 | |
| Income Tax(4) | | | – | | | | – | | | | – | | | | – | | | | 3,118 | |
| Total Expenses | | | 2,958,322 | | | | 663,043 | | | | 2,271 | | | | 1,518 | | | | 658,188 | |
| Net Investment Income | | | 26,199,461 | | | | 8,489,733 | | | | 27,703 | | | | 27,594 | | | | 7,727,606 | |
| Net Realized Gain (Loss) on: | | | | | | | | | | | | | | | | | | | | |
| Investments | | | (12,586,061 | )(3) | | | (5,394,980 | )(3) | | | – | | | | 3,373 | | | | (2,449,835 | )(3) |
| Foreign Currency Transactions | | | (802,037 | ) | | | — | | | | 2,579 | | | | 20 | | | | — | |
| Net Realized Gain (Loss) on Investments and Foreign Currency Transactions | | | (13,388,098 | ) | | | (5,394,980 | ) | | | 2,579 | | | | 3,393 | | | | (2,449,835 | ) |
| Net Change in Unrealized Appreciation (Depreciation) on: | | | | | | | | | | | | | | | | | | | | |
| Investments | | | 7,668,380 | | | | (5,556,127 | ) | | | 537,020 | | | | (33,075 | ) | | | 816,255 | |
| Foreign Currency Translations | | | 62,217 | | | | — | | | | 65 | | | | 7 | | | | — | |
| Net Change in Unrealized Appreciation (Depreciation) on Investments and Foreign Currency Translations | | | 7,730,597 | | | | (5,556,127 | ) | | | 537,085 | | | | (33,068 | ) | | | 816,255 | |
| Net Realized and Unrealized Gain (Loss) on Investments and Foreign Currency Transactions and Translations | | | (5,657,501 | ) | | | (10,951,107 | ) | | | 539,664 | | | | (29,675 | ) | | | (1,633,580 | ) |
| Net Increase (Decrease) in Net Assets Resulting from Operations | | $ | 20,541,960 | | | $ | (2,461,374 | ) | | $ | 567,367 | | | $ | (2,081 | ) | | $ | 6,094,026 | |
| (1) | The Fund commenced operations on March 16, 2015. |
| (2) | The Supervision and Administration fees reflect the supervisory and administrative fee, which includes fees paid by the Funds for the investment advisory services provided by the Adviser. (See Note 3 in Notes to Financial Statements.) |
| (3) | Includes realized gains (losses) as a result of in-kind redemptions. (See Note 4 in Notes to Financial Statements.) |
| (4) | See Note 2 in Notes to Financial Statements. |
The accompanying notes are an integral part of the financial statements.
Statements of Operations |
| For the period ended April 30, 2015 (Unaudited) |
| | | Global X Social
Media Index ETF | | | Global X |
JPMorgan
Efficiente Index
ETF | | | Global X | JPMorgan
US Sector Rotator
Index ETF | | | Global X
Permanent ETF | | | Global X Guru™
Index ETF | |
| Investment Income: | | | | | | | | | | | | | | | | | | | | |
| Dividend Income | | $ | 228,201 | | | $ | 110,897 | | | $ | 157,267 | | | $ | 30,099 | | | $ | 2,221,541 | |
| Interest Income | | | 20 | | | | 2 | | | | 6 | | | | 41,202 | | | | 122 | |
| Security Lending Income | | | 267,623 | | | | — | | | | — | | | | — | | | | 39,518 | |
| Less: Foreign Taxes Withheld | | | (25,964 | ) | | | — | | | | — | | | | (376 | ) | | | (3,343 | ) |
| Total Investment Income | | | 469,880 | | | | 110,899 | | | | 157,273 | | | | 70,925 | | | | 2,257,838 | |
| Supervision and Administration Fees(1) | | | 357,341 | | | | 36,536 | | | | 58,064 | | | | 23,254 | | | | 1,387,949 | |
| Total Expenses | | | 357,341 | | | | 36,536 | | | | 58,064 | | | | 23,254 | | | | 1,387,949 | |
| Net Investment Income | | | 112,539 | | | | 74,363 | | | | 99,209 | | | | 47,671 | | | | 869,889 | |
| Net Realized Gain (Loss) on: | | | | | | | | | | | | | | | | | | | | |
| Investments | | | 2,628,516 | (2) | | | (22,825 | ) | | | (1,255,541 | )(2) | | | 109,032 | (2) | | | 13,077,733 | (2) |
| Foreign Currency Transactions | | | 186,506 | | | | — | | | | — | | | | — | | | | — | |
| Net Realized Gain (Loss) on Investments and Foreign Currency Transactions | | | 2,815,022 | | | | (22,825 | ) | | | (1,255,541 | ) | | | 109,032 | | | | 13,077,733 | |
| Net Change in Unrealized Appreciation (Depreciation) on: | | | | | | | | | | | | | | | | | | | | |
| Investments | | | 2,266,306 | | | | (292,672 | ) | | | (98,250 | ) | | | 87,630 | | | | (6,988,803 | ) |
| Foreign Currency Translations | | | 566 | | | | — | | | | — | | | | 9 | | | | — | |
| Net Change in Unrealized Appreciation (Depreciation) on Investments and Foreign Currency Translations | | | 2,266,872 | | | | (292,672 | ) | | | (98,250 | ) | | | 87,639 | | | | (6,988,803 | ) |
| Net Realized and Unrealized Gain (Loss) on Investments and Foreign Currency Transactions and Translations | | | 5,081,894 | | | | (315,497 | ) | | | (1,353,791 | ) | | | 196,671 | | | | 6,088,930 | |
| Net Increase (Decrease) in Net Assets Resulting from Operations | | $ | 5,194,433 | | | $ | (241,134 | ) | | $ | (1,254,582 | ) | | $ | 244,342 | | | $ | 6,958,819 | |
| (1) | The Supervision and Administration fees reflect the supervisory and administrative fee, which includes fees paid by the Funds for the investment advisory services provided by the Adviser. (See Note 3 in Notes to Financial Statements.) |
| (2) | Includes realized gains (losses) as a result of in-kind redemptions. (See Note 4 in Notes to Financial Statements.) |
The accompanying notes are an integral part of the financial statements.
Statements of Operations
For the period ended April 30, 2015 (Unaudited)
| | | Global X Guru™
Activist Index ETF(1) | | | Global X Guru™
International Index
ETF | | | Global X Guru™
Small Cap Index
ETF | | | Global X GF China
Bond ETF(2) | |
| Investment Income: | | | | | | | | | | | | | | | | |
| Dividend Income | | $ | 129 | | | $ | 17,441 | | | $ | 8,754 | | | $ | — | |
| Interest Income | | | — | | | | — | | | | — | | | | 849,222 | |
| Less: Foreign Taxes Withheld | | | — | | | | (2,251 | ) | | | — | | | | — | |
| Total Investment Income | | | 129 | | | | 15,190 | | | | 8,754 | | | | 849,222 | |
| Supervision and Administration Fees(3) | | | 31 | | | | 8,278 | | | | 7,659 | | | | 103,387 | |
| Custodian Fees | | | — | | | | — | | | | — | | | | 21,539 | |
| Total Expenses | | | 31 | | | | 8,278 | | | | 7,659 | | | | 124,926 | |
| Waiver of Supervision and Administration Fees | | | – | | | | — | | | | — | | | | (17,231 | ) |
| Net Expenses | | | 31 | | | | 8,278 | | | | 7,659 | | | | 107,695 | |
| Net Investment Income | | | 98 | | | | 6,912 | | | | 1,095 | | | | 741,527 | |
| Net Realized Gain (Loss) on: | | | | | | | | | | | | | | | | |
| Investments | | | — | | | | 11,681 | | | | (78,946 | ) | | | (53,491 | ) |
| Foreign Currency Transactions | | | — | | | | — | | | | — | | | | (17,717 | ) |
| Net Realized Gain (Loss) on Investments and Foreign Currency Transactions | | | — | | | | 11,681 | | | | (78,946 | ) | | | (71,208 | ) |
| Net Change in Unrealized Depreciation on: | | | | | | | | | | | | | | | | |
| Investments | | | (9,867 | ) | | | (75,177 | ) | | | (8,965 | ) | | | (502,729 | ) |
| Foreign Currency Translations | | | — | | | | — | | | | — | | | | (7,054 | ) |
| Net Change in Unrealized Depreciation on Investments and Foreign Currency Translations | | | (9,867 | ) | | | (75,177 | ) | | | (8,965 | ) | | | (509,783 | ) |
| Net Realized and Unrealized Loss on Investments and Foreign Currency Transactions and Translations | | | (9,867 | ) | | | (63,496 | ) | | | (87,911 | ) | | | (580,991 | ) |
| Net Increase (Decrease) in Net Assets Resulting from Operations | | $ | (9,769 | ) | | $ | (56,584 | ) | | $ | (86,816 | ) | | $ | 160,536 | |
| (1) | The Fund commenced operations on April 28, 2015. |
| (2) | The Fund commenced operations on November 18, 2014. |
| (3) | The Supervision and Administration fees reflect the supervisory and administrative fee, which includes fees paid by the Funds for the investment advisory services provided by the Adviser. (See Note 3 in Notes to Financial Statements.) |
The accompanying notes are an integral part of the financial statements.
Statements of Changes in Net Assets
| | | Global X SuperDividend® ETF | | | Global X SuperDividend® U.S. ETF | |
| | | Period Ended April
30, 2015
(Unaudited) | | | Year Ended October
31, 2014 (Audited) | | | Period Ended April
30, 2015
(Unaudited) | | | Year Ended October
31, 2014 (Audited) | |
| Operations: | | | | | | | | | | | | | | | | |
| Net Investment Income | | $ | 26,199,461 | | | $ | 53,950,753 | | | $ | 8,489,733 | | | $ | 6,886,974 | |
| Net Realized Gain (Loss) on Investments and Foreign Currency Transactions(1) | | | (13,388,098 | ) | | | 28,755,720 | | | | (5,394,980 | ) | | | 2,818,231 | |
| Net Change in Unrealized Appreciation (Depreciation) on Investments and Foreign Currency Translations | | | 7,730,597 | | | | (20,389,996 | ) | | | (5,556,127 | ) | | | 9,558,716 | |
| Net Increase (Decrease) in Net Assets Resulting from Operations | | | 20,541,960 | | | | 62,316,477 | | | | (2,461,374 | ) | | | 19,263,921 | |
| Dividends and Distributions from: | | | | | | | | | | | | | | | | |
| Net Investment Income | | | (31,456,197 | ) | | | (55,528,000 | ) | | | (8,757,865 | ) | | | (5,177,061 | ) |
| Net Realized Gains | | | (1,980,385 | ) | | | — | | | | — | | | | (617,714 | ) |
| Total Dividends and Distributions | | | (33,436,582 | ) | | | (55,528,000 | ) | | | (8,757,865 | ) | | | (5,794,775 | ) |
| Capital Share Transactions: | | | | | | | | | | | | | | | | |
| Issued | | | 66,306,190 | | | | 304,468,290 | | | | 64,337,982 | | | | 227,401,148 | |
| Redeemed | | | (11,463,429 | ) | | | (48,918,715 | ) | | | (38,935,606 | ) | | | (16,035,000 | ) |
| Increase in Net Assets from Capital Share Transactions | | | 54,842,761 | | | | 255,549,575 | | | | 25,402,376 | | | | 211,366,148 | |
| Total Increase in Net Assets | | | 41,948,139 | | | | 262,338,052 | | | | 14,183,137 | | | | 224,835,294 | |
| Net Assets: | | | | | | | | | | | | | | | | |
| Beginning of Period | | | 1,037,576,047 | | | | 775,237,995 | | | | 276,714,634 | | | | 51,879,340 | |
| End of Period | | $ | 1,079,524,186 | | | $ | 1,037,576,047 | | | $ | 290,897,771 | | | $ | 276,714,634 | |
| Distributions in Excess of Net Investment Income | | $ | (7,882,528 | ) | | $ | (2,625,792 | ) | | $ | (268,132 | ) | | $ | — | |
| Share Transactions: | | | | | | | | | | | | | | | | |
| Issued | | | 2,800,000 | | | | 12,250,000 | | | | 2,200,000 | | | | 7,950,000 | |
| Redeemed | | | (500,000 | ) | | | (2,100,000 | ) | | | (1,350,000 | ) | | | (600,000 | ) |
| Net Increase in Shares Outstanding from Share Transactions | | | 2,300,000 | | | | 10,150,000 | | | | 850,000 | | | | 7,350,000 | |
| (1) | Includes realized gains (losses) as a result of in-kind redemptions. (See Note 4 in Notes to Financial Statements.) |
The accompanying notes are an integral part of the financial statements.
Statements of Changes in Net Assets
| | | Global X
SuperDividend®
Emerging
Markets ETF | | | Global X
SuperDividend®
REIT ETF | | | Global X SuperIncome™ Preferred
ETF | |
| | | Period Ended April
30, 2015(1)
(Unaudited) | | | Period Ended April
30, 2015(1)
(Unaudited) | | | Period Ended
April 30, 2015
(Unaudited) | | | Year Ended
October 31, 2014
(Audited) | |
| Operations: | | | | | | | | | | | | | | | | |
| Net Investment Income | | $ | 27,703 | | | $ | 27,594 | | | $ | 7,727,606 | | | $ | 6,891,089 | |
| Net Realized Gain (Loss) on Investments and Foreign Currency Transactions | | | 2,579 | | | | 3,393 | | | | (2,449,835 | )(2) | | | (483,511 | )(2) |
| Net Change in Unrealized Appreciation (Depreciation) on Investments and Foreign Currency Translations | | | 537,085 | | | | (33,068 | ) | | | 816,255 | | | | (826,411 | ) |
| Net Increase (Decrease) in Net Assets Resulting from Operations | | | 567,367 | | | | (2,081 | ) | | | 6,094,026 | | | | 5,581,167 | |
| Dividends and Distributions from: | | | | | | | | | | | | | | | | |
| Net Investment Income | | | — | | | | — | | | | (7,263,864 | ) | | | (6,808,392 | ) |
| Total Dividends and Distributions | | | — | | | | — | | | | (7,263,864 | ) | | | (6,808,392 | ) |
| Capital Share Transactions: | | | | | | | | | | | | | | | | |
| Issued | | | 3,097,256 | | | | 2,287,916 | | | | 134,324,796 | | | | 117,538,007 | |
| Redeemed | | | — | | | | — | | | | (7,270,772 | ) | | | (13,401,000 | ) |
| Increase in Net Assets from Capital Share Transactions | | | 3,097,256 | | | | 2,287,916 | | | | 127,054,024 | | | | 104,137,007 | |
| Total Increase in Net Assets | | | 3,664,623 | | | | 2,285,835 | | | | 125,884,186 | | | | 102,909,782 | |
| Net Assets: | | | | | | | | | | | | | | | | |
| Beginning of Period | | | — | | | | — | | | | 162,874,705 | | | | 59,964,923 | |
| End of Period | | $ | 3,664,623 | | | $ | 2,285,835 | | | $ | 288,758,891 | | | $ | 162,874,705 | |
| Undistributed Net Investment Income | | $ | 27,703 | | | $ | 27,594 | | | $ | 778,168 | | | $ | 314,426 | |
| Share Transactions: | | | | | | | | | | | | | | | | |
| Issued | | | 200,000 | | | | 150,000 | | | | 9,200,000 | | | | 7,900,000 | |
| Redeemed | | | — | | | | — | | | | (500,000 | ) | | | (900,000 | ) |
| Net Increase in Shares Outstanding from Share Transactions | | | 200,000 | | | | 150,000 | | | | 8,700,000 | | | | 7,000,000 | |
| (1) | The Fund commenced operations on March 16, 2015. |
| (2) | Includes realized gains (losses) as a result of in-kind redemptions. (See Note 4 in Notes to Financial Statements.) |
The accompanying notes are an integral part of the financial statements.
Statements of Changes in Net Assets
| | | Global X Social Media Index ETF | | | Global X | JPMorgan Efficiente Index
ETF | |
| | | Period Ended April
30, 2015
(Unaudited) | | | Year Ended
October 31, 2014
(Audited) | | | Period Ended
April 30, 2015
(Unaudited) | | | Period Ended
October 31, 2014(1)
(Audited) | |
| Operations: | | | | | | | | | | | | | | | | |
| Net Investment Income (Loss) | | $ | 112,539 | | | $ | (12,711 | ) | | $ | 74,363 | | | $ | (380 | ) |
| Net Realized Gain (Loss) on Investments and Foreign Currency Transactions | | | 2,815,022 | (2) | | | 8,231,848 | (2) | | | (22,825 | ) | | | — | |
| Net Change in Unrealized Appreciation (Depreciation) on Investments and Foreign Currency Translations | | | 2,266,872 | | | | (13,398,596 | ) | | | (292,672 | ) | | | 54,463 | |
| Net Increase (Decrease) in Net Assets Resulting from Operations | | | 5,194,433 | | | | (5,179,459 | ) | | | (241,134 | ) | | | 54,083 | |
| Dividends and Distributions from: | | | | | | | | | | | | | | | | |
| Net Investment Income | | | (57,330 | ) | | | (1,764 | ) | | | (15,956 | ) | | | — | |
| Total Dividends and Distributions | | | (57,330 | ) | | | (1,764 | ) | | | (15,956 | ) | | | — | |
| Capital Share Transactions: | | | | | | | | | | | | | | | | |
| Issued | | | 44,416,815 | | | | 104,020,692 | | | | 23,733,265 | | | | 2,495,000 | |
| Redeemed | | | (66,182,412 | ) | | | (68,369,208 | ) | | | — | | | | — | |
| Increase (Decrease) in Net Assets from Capital Share Transactions | | | (21,765,597 | ) | | | 35,651,484 | | | | 23,733,265 | | | | 2,495,000 | |
| Total Increase (Decrease) in Net Assets | | | (16,628,494 | ) | | | 30,470,261 | | | | 23,476,175 | | | | 2,549,083 | |
| Net Assets: | | | | | | | | | | | | | | | | |
| Beginning of Period | | | 126,417,815 | | | | 95,947,554 | | | | 2,549,083 | | | | — | |
| End of Period | | $ | 109,789,321 | | | $ | 126,417,815 | | | $ | 26,025,258 | | | $ | 2,549,083 | |
| Undistributed (Distributions in Excess of) Net Investment Income/Accumulated Net Investment Loss | | $ | 51,381 | | | $ | (3,828 | ) | | $ | 58,027 | | | $ | (380 | ) |
| Share Transactions: | | | | | | | | | | | | | | | | |
| Issued | | | 2,350,000 | | | | 5,100,000 | | | | 900,000 | | | | 100,000 | |
| Redeemed | | | (3,500,000 | ) | | | (3,500,000 | ) | | | — | | | | — | |
| Net Increase (Decrease) in Shares Outstanding from Share Transactions | | | (1,150,000 | ) | | | 1,600,000 | | | | 900,000 | | | | 100,000 | |
| (1) | The Fund commenced operations on October 22, 2014. |
| (2) | Includes realized gains (losses) as a result of in-kind redemptions. (See Note 4 in Notes to Financial Statements.) |
The accompanying notes are an integral part of the financial statements.
Statements of Changes in Net Assets
| | | Global X | JPMorgan US Sector
Rotator Index ETF | | | Global X Permanent ETF | |
| | | Period Ended
April 30, 2015
(Unaudited) | | | Period Ended
October 31, 2014(1)
(Audited) | | | Period Ended April
30, 2015
(Unaudited) | | | Year Ended
October 31, 2014
(Audited) | |
| Operations: | | | | | | | | | | | | | | | | |
| Net Investment Income (Loss) | | $ | 99,209 | | | $ | (381 | ) | | $ | 47,671 | | | $ | 121,011 | |
| Net Realized Gain (Loss) on Investments and Foreign Currency Transactions | | | (1,255,541 | )(2) | | | 3,446 | | | | 109,032 | (2) | | | (70,010 | )(2) |
| Net Change in Unrealized Appreciation (Depreciation) on Investments and Foreign Currency Translations | | | (98,250 | ) | | | 35,252 | | | | 87,639 | | | | 196,407 | |
| Net Increase (Decrease) in Net Assets Resulting from Operations | | | (1,254,582 | ) | | | 38,317 | | | | 244,342 | | | | 247,408 | |
| Dividends and Distributions from: | | | | | | | | | | | | | | | | |
| Net Investment Income | | | (32,505 | ) | | | — | | | | (105,609 | ) | | | (217,743 | ) |
| Net Realized Gains | | | (3,065 | ) | | | — | | | | — | | | | (47,656 | ) |
| Total Dividends and Distributions | | | (35,570 | ) | | | — | | | | (105,609 | ) | | | (265,399 | ) |
| Capital Share Transactions: | | | | | | | | | | | | | | | | |
| Issued | | | 27,130,870 | | | | 2,503,000 | | | | 2,449,828 | | | | 1,157,000 | |
| Redeemed | | | (1,252,390 | ) | | | — | | | | (1,258,291 | ) | | | (7,176,640 | ) |
| Increase (Decrease) in Net Assets from Capital Share Transactions | | | 25,878,480 | | | | 2,503,000 | | | | 1,191,537 | | | | (6,019,640 | ) |
| Total Increase (Decrease) in Net Assets | | | 24,588,328 | | | | 2,541,317 | | | | 1,330,270 | | | | (6,037,631 | ) |
| Net Assets: | | | | | | | | | | | | | | | | |
| Beginning of Period | | | 2,541,317 | | | | — | | | | 8,438,960 | | | | 14,476,591 | |
| End of Period | | $ | 27,129,645 | | | $ | 2,541,317 | | | $ | 9,769,230 | | | $ | 8,438,960 | |
| Undistributed Net Investment Income/Accumulated Net Investment Loss | | $ | 66,704 | | | $ | (381 | ) | | $ | 32,607 | | | $ | 90,545 | |
| Share Transactions: | | | | | | | | | | | | | | | | |
| Issued | | | 1,050,000 | | | | 100,000 | | | | 100,000 | | | | 50,000 | |
| Redeemed | | | (50,000 | ) | | | — | | | | (50,000 | ) | | | (300,000 | ) |
| Net Increase (Decrease) in Shares Outstanding from Share Transactions | | | 1,000,000 | | | | 100,000 | | | | 50,000 | | | | (250,000 | ) |
| (1) | The Fund commenced operations on October 22, 2014. |
| (2) | Includes realized gains (losses) as a result of in-kind redemptions. (See Note 4 in Notes to Financial Statements.) |
The accompanying notes are an integral part of the financial statements.
Statements of Changes in Net Assets
| | | Global X Guru™ Index ETF | | | Global X Guru™
Activist Index ETF | |
| | | Period Ended April
30, 2015
(Unaudited) | | | Period Ended October
31, 2014
(Audited) | | | Period Ended April
30, 2015(1)
(Unaudited) | |
| Operations: | | | | | | | | | | | | |
| Net Investment Income | | $ | 869,889 | | | $ | 4,142,275 | | | $ | 98 | |
| Net Realized Gain on Investments and Foreign Currency Transactions | | | 13,077,733 | (2) | | | 30,193,967 | (2) | | | — | |
| Net Change in Unrealized Depreciation on Investments and Foreign Currency Translations | | | (6,988,803 | ) | | | (2,560,775 | ) | | | (9,867 | ) |
| Net Increase (Decrease) in Net Assets Resulting from Operations | | | 6,958,819 | | | | 31,775,467 | | | | (9,769 | ) |
| Dividends and Distributions from: | | | | | | | | | | | | |
| Net Investment Income | | | (4,215,674 | ) | | | (424,262 | ) | | | — | |
| Net Realized Gains | | | — | | | | (50,655 | ) | | | — | |
| Total Dividends and Distributions | | | (4,215,674 | ) | | | (474,917 | ) | | | — | |
| Capital Share Transactions: | | | | | | | | | | | | |
| Issued | | | 11,909,462 | | | | 568,526,986 | | | | 1,505,000 | |
| Redeemed | | | (148,858,369 | ) | | | (404,301,007 | ) | | | — | |
| Increase (Decrease) in Net Assets from Capital Share Transactions | | | (136,948,907 | ) | | | 164,225,979 | | | | 1,505,000 | |
| Total Increase (Decrease) in Net Assets | | | (134,205,762 | ) | | | 195,526,529 | | | | 1,495,231 | |
| Net Assets: | | | | | | | | | | | | |
| Beginning of Period | | | 436,586,036 | | | | 241,059,507 | | | | — | |
| End of Period | | $ | 302,380,274 | | | $ | 436,586,036 | | | $ | 1,495,231 | |
| Undistributed Net Investment Income | | $ | 469,712 | | | $ | 3,815,497 | | | $ | 98 | |
| Share Transactions: | | | | | | | | | | | | |
| Issued | | | 450,000 | | | | 22,750,000 | | | | 100,000 | |
| Redeemed | | | (5,700,000 | ) | | | (16,200,000 | ) | | | — | |
| Net Increase (Decrease) in Shares Outstanding from Share Transactions | | | (5,250,000 | ) | | | 6,550,000 | | | | 100,000 | |
| (1) | The Fund commenced operations on April 28, 2015. |
| (2) | Includes realized gains (losses) as a result of in-kind redemptions. (See Note 4 in Notes to Financial Statements.) |
The accompanying notes are an integral part of the financial statements.
Statements of Changes in Net Assets
| | | Global X Guru™ International Index
ETF | | | Global X Guru™ Small Cap Index
ETF | | | Global X GF
China Bond
ETF | |
| | | Period Ended
April 30, 2015
(Unaudited) | | | Period Ended
October 31, 2014(1)
(Audited) | | | Period Ended
April 30, 2015
(Unaudited) | | | Period Ended
October 31, 2014(1)
(Audited) | | | Period Ended
April 30, 2015(2)
(Unaudited) | |
| Operations: | | | | | | | | | | | | | | | | | | | | |
| Net Investment Income | | $ | 6,912 | | | $ | 10,465 | | | $ | 1,095 | | | $ | 760 | | | $ | 741,527 | |
| Net Realized Gain (Loss) on Investments and Foreign Currency Transactions | | | 11,681 | | | | 36,258 | | | | (78,946 | ) | | | (17,095 | ) | | | (71,208 | ) |
| Net Change in Unrealized Appreciation (Depreciation) on Investments and Foreign Currency Translations | | | (75,177 | ) | | | 28,667 | | | | (8,965 | ) | | | (82,066 | ) | | | (509,783 | ) |
| Net Increase (Decrease) in Net Assets Resulting from Operations | | | (56,584 | ) | | | 75,390 | | | | (86,816 | ) | | | (98,401 | ) | | | 160,536 | |
| Dividends and Distributions from: | | | | | | | | | | | | | | | | | | | | |
| Net Investment Income | | | (16,359 | ) | | | — | | | | — | | | | — | | | | (608,892 | ) |
| Total Dividends and Distributions | | | (16,359 | ) | | | — | | | | — | | | | — | | | | (608,892 | ) |
| Capital Share Transactions: | | | | | | | | | | | | | | | | | | | | |
| Issued | | | — | | | | 3,080,523 | | | | — | | | | 2,253,000 | | | | 49,389,420 | |
| Redeemed | | | — | | | | (812,500 | ) | | | — | | | | — | | | | — | |
| Increase in Net Assets from Capital Share Transactions | | | — | | | | 2,268,023 | | | | — | | | | 2,253,000 | | | | 49,389,420 | |
| Total Increase (Decrease) in Net Assets | | | (72,943 | ) | | | 2,343,413 | | | | (86,816 | ) | | | 2,154,599 | | | | 48,941,064 | |
| Net Assets: | | | | | | | | | | | | | | | | | | | | |
| Beginning of Period | | | 2,343,413 | | | | — | | | | 2,154,599 | | | | — | | | | — | |
| End of Period | | $ | 2,270,470 | | | $ | 2,343,413 | | | $ | 2,067,783 | | | $ | 2,154,599 | | | $ | 48,941,064 | |
| Undistributed Net Investment Income | | $ | 1,018 | | | $ | 10,465 | | | $ | 1,095 | | | $ | — | | | $ | 132,635 | |
| Share Transactions: | | | | | | | | | | | | | | | | | | | | |
| Issued | | | — | | | | 200,000 | | | | — | | | | 150,000 | | | | 1,300,000 | |
| Redeemed | | | — | | | | (50,000 | ) | | | — | | | | — | | | | — | |
| Net Increase in Shares Outstanding from Share Transactions | | | — | | | | 150,000 | | | | — | | | | 150,000 | | | | 1,300,000 | |
| (1) | The Fund commenced operations on March 10, 2014. |
| (2) | The Fund commenced operations on November 18, 2014. |
The accompanying notes are an integral part of the financial statements.
Financial Highlights
Selected Per Share Data & Ratios
| | | Net Asset
Value,
Beginning of
Period ($) | | | Net
Investment
Income
(Loss) ($)* | | | Net Realized
and
Unrealized
Gain (Loss)
on
Investments
($) | | | Total from
Operations
($) | | | Distribution
from Net
Investment
Income ($) | | | Distribution
from
Capital
Gains ($) | | | Return of
Capital ($) | | | Total from
Distributions
($) | | | Net Asset
Value,
End of
Period ($) | | | Total
Return
(%)** | | | Net Assets
End of
Period
($)(000) | | | Ratio of
Expenses
to
Average
Net Assets
(%) | | | Ratio of
Net
Investment
Income
(Loss) to
Average
Net Assets
(%) | | | Portfolio
Turnover
(%)†† | |
| Global X SuperDividend® ETF | | | | | | | | | | | | | | | | | | | | | | | | | | | | | | | | | | | | | | | | | | | | |
| 2015(Unaudited) | | | 24.24 | | | | 0.60 | | | | (0.13 | ) | | | 0.47 | | | | (0.72 | ) | | | (0.05 | ) | | | — | | | | (0.77 | ) | | | 23.94 | | | | 2.03 | | | | 1,079,524 | | | | 0.58 | † | | | 5.14 | † | | | 18.83 | |
| 2014 | | | 23.74 | | | | 1.40 | | | | 0.56 | | | | 1.96 | | | | (1.46 | ) | | | — | | | | — | | | | (1.46 | ) | | | 24.24 | | | | 8.41 | | | | 1,037,576 | | | | 0.58 | | | | 5.71 | | | | 33.63 | |
| 2013 | | | 21.86 | | | | 1.34 | | | | 2.27 | | | | 3.61 | | | | (1.73 | ) | | | — | | | | — | | | | (1.73 | ) | | | 23.74 | | | | 17.34 | | | | 775,238 | | | | 0.58 | | | | 5.93 | | | | 43.64 | |
| 2012 | | | 21.76 | | | | 1.62 | | | | 0.09 | | | | 1.71 | | | | (1.61 | ) | | | — | | | | — | | | | (1.61 | ) | | | 21.86 | | | | 8.34 | | | | 162,828 | | | | 0.58 | | | | 7.53 | | | | 34.03 | |
| 2011(1) | | | 24.70 | | | | 0.64 | | | | (3.02 | ) | | | (2.38 | ) | | | (0.56 | ) | | | — | | | | — | | | | (0.56 | ) | | | 21.76 | | | | (9.56 | ) | | | 29,372 | | | | 0.58 | † | | | 7.22 | † | | | 4.58 | |
| Global X SuperDividend® U.S. ETF | | | | | | | | | | | | | | | | | | | | | | | | | | | | | | | | | | | | | | | | |
| 2015(Unaudited) | | | 29.60 | | | | 0.83 | | | | (1.04 | ) | | | (0.21 | ) | | | (0.87 | ) | | | — | | | | — | | | | (0.87 | ) | | | 28.52 | | | | (0.73 | ) | | | 290,898 | | | | 0.45 | † | | | 5.77 | † | | | 34.21 | |
| 2014 | | | 25.94 | | | | 1.78 | | | | 3.45 | | | | 5.23 | | | | (1.41 | ) | | | — | | | | (0.16 | ) | | | (1.57 | ) | | | 29.60 | | | | 20.80 | | | | 276,715 | | | | 0.45 | | | | 6.32 | | | | 40.04 | |
| 2013(2) | | | 25.15 | | | | 0.98 | | | | 0.82 | | | | 1.80 | | | | (0.91 | ) | | | — | | | | (0.10 | ) | | | (1.01 | ) | | | 25.94 | | | | 7.32 | | | | 51,879 | | | | 0.45 | † | | | 6.02 | † | | | 20.36 | |
| Global X SuperDividend® Emerging Markets ETF | | | | | | | | | | | | | | | | | | | | | | | | |
| 2015(3)(Unaudited) | | | 14.90 | | | | 0.17 | | | | 3.25 | | | | 3.42 | | | | — | | | | — | | | | — | | | | — | | | | 18.32 | | | | 22.95 | | | | 3,665 | | | | 0.65 | † | | | 7.95 | † | | | — | |
| Global X SuperDividend® REIT ETF | | | | | | | | | | | | | | | | | | | | | | | | | | | | | | | | | | | | | | | | |
| 2015(3)(Unaudited) | | | 15.12 | | | | 0.20 | | | | (0.08 | ) | | | 0.12 | | | | — | | | | — | | | | — | | | | — | | | | 15.24 | | | | 0.79 | | | | 2,286 | | | | 0.58 | † | | | 10.57 | † | | | 0.09 | |
| Global X SuperIncome™ Preferred ETF | | | | | | | | | | | | | | | | | | | | | | | | | | | | | | | | | | | | | | | | |
| 2015(Unaudited) | | | 14.74 | | | | 0.50 | | | | (0.13 | ) | | | 0.37 | | | | (0.49 | ) | | | — | | | | — | | | | (0.49 | ) | | | 14.62 | | | | 2.57 | | | | 288,759 | | | | 0.58 | † | | | 6.84 | † | | | 17.75 | |
| 2014 | | | 14.81 | | | | 1.01 | | | | (0.02 | ) | | | 0.99 | | | | (1.06 | ) | | | — | | | | — | | | | (1.06 | ) | | | 14.74 | | | | 6.89 | | | | 162,875 | | | | 0.58 | | | | 6.78 | | | | 85.07 | |
| 2013^ | | | 14.65 | | | | 0.31 | | | | 0.18 | | | | 0.49 | | | | (0.33 | ) | | | — | | | | — | | | | (0.33 | ) | | | 14.81 | | | | 3.38 | | | | 59,965 | | | | 0.58 | † | | | 6.34 | † | | | 61.86 | |
| 2013(4) | | | 15.02 | | | | 1.13 | | | | (0.47 | ) | | | 0.66 | | | | (1.02 | ) | | | (0.01 | ) | | | — | | | | (1.03 | ) | | | 14.65 | | | | 4.46 | | | | 35,169 | | | | 0.58 | † | | | 7.84 | † | | | 91.98 | |
| Global X Social Media Index ETF | | | | | | | | | | | | | | | | | | | | | | | | | | | | | | | | | | | | | | | | |
| 2015(Unaudited) | | | 19.30 | | | | 0.02 | | | | 1.02 | | | | 1.04 | | | | (0.01 | ) | | | — | | | | — | | | | (0.01 | ) | | | 20.33 | | | | 5.39 | | | | 109,789 | | | | 0.65 | † | | | 0.20 | † | | | 16.16 | |
| 2014 | | | 19.38 | | | | — | | | | (0.08 | ) | | | (0.08 | ) | | | — | | | | — | | | | — | | | | — | | | | 19.30 | | | | (0.41 | ) | | | 126,418 | | | | 0.65 | | | | (0.01 | ) | | | 26.52 | |
| 2013 | | | 12.83 | | | | — | | | | 6.66 | | | | 6.66 | | | | (0.11 | ) | | | — | | | | — | | | | (0.11 | ) | | | 19.38 | | | | 52.34 | | | | 95,948 | | | | 0.65 | | | | (0.01 | ) | | | 55.96 | |
| 2012(5) | | | 14.93 | | | | 0.12 | | | | (2.22 | ) | | | (2.10 | ) | | | — | | | | — | | | | — | | | | — | | | | 12.83 | | | | (14.07 | ) | | | 13,471 | | | | 0.65 | † | | | 0.88 | † | | | 91.78 | |
| Global X | JPMorgan Efficiente Index ETF | | | | | | | | | | | | | | | | | | | | | | | | | | | | | | | | | | | | | | | | |
| 2015(Unaudited) | | | 25.49 | | | | 0.18 | | | | 0.52 | ^^ | | | 0.70 | | | | (0.16 | ) | | | — | | | | — | | | | (0.16 | ) | | | 26.03 | | | | 2.75 | | | | 26,025 | | | | 0.69 | † | | | 1.40 | † | | | 33.97 | |
| 2014(6) | | | 24.95 | | | | — | | | | 0.54 | | | | 0.54 | | | | — | | | | — | | | | — | | | | — | | | | 25.49 | | | | 2.16 | | | | 2,549 | | | | 0.69 | † | | | (0.69 | )† | | | — | |
| (1) | The Fund commenced operations on June 8, 2011. |
| (2) | The Fund commenced operations on March 11, 2013. |
| (3) | The Fund commenced operations on March 16, 2015. |
| (4) | The Fund commenced operations on July 16, 2012. |
| (5) | The Fund commenced operations on November 14, 2011. |
| (6) | The Fund commenced operations on October 22, 2014. |
| ^ | For the period July 1, 2013 to October 31, 2013. Effective July 1, 2013 the Global X Permanent ETF, Global X Guru™ Index ETF (formerly Global X Top Guru Holdings Index ETF) and Global X SuperIncome™ Preferred ETF each changed their fiscal year end to October 31 (See Note 1 in Notes to Financial Statements). |
| ^^ | The amount shown for a share outstanding throughout the period does not accord with the aggregate net gains on investments for the period because of the sales and repurchases of fund shares in relation to fluctuating market value of the investments of the Fund. |
| * | Per share data calculated using average shares method. |
| ** | Total return is based on the change in net asset value of a share during the year or period and assumes reinvestment of dividends and distributions at net asset value. Total return is for the period indicated and periods of less than one year have not been annualized. The return shown does not reflect the deduction of taxes that a shareholder would pay on Fund distributions or the redemption of Fund shares. |
| †† | Portfolio turnover rate is for the period indicated and periods of less than one year have not been annualized. Excludes effect of in-kind transfers. |
Amounts designated as “—” are $0 or have been rounded to $0.
The accompanying notes are an integral part of the financial statements.
Financial Highlights
Selected Per Share Data & Ratios
| | | Net Asset Value, Beginning of Period ($) | | | Net Investment Income (Loss) ($)* | | | Net Realized and Unrealized Gain (Loss) on Investments ($) | | | Total from Operations ($) | | | Distribution from Net Investment Income ($) | | | Distribution from Capital Gains ($) | | | Return of Capital ($) | | | Total from Distributions ($) | | | Net Asset Value, End of Period ($) | | | Total Return (%)** | | | Net Assets End of Period ($)(000) | | | Ratio of Expenses to Average Net Assets (%) | | | Ratio of Expenses to Average Net Assets (excluding waiver) (%) | | | Ratio of Net Investment Income to Average Net Assets (%) | | | Portfolio Turnover (%)†† | |
| Global X | JPMorgan US Sector Rotator Index ETF | | | | | | | | | | | | | | | | | | | | | | | | | | | | | | | | | | | | | | | | | | | | |
| 2015(Unaudited) | | | 25.41 | | | | 0.15 | | | | (0.78 | ) | | | (0.63 | ) | | | (0.11 | ) | | | (0.01 | ) | | | — | | | | (0.12 | ) | | | 24.66 | | | | (2.51 | ) | | | 27,130 | | | | 0.69 | † | | | 0.69 | † | | | 1.18 | † | | | 538.42 | |
| 2014(1) | | | 25.03 | | | | — | | | | 0.38 | | | | 0.38 | | | | — | | | | — | | | | — | | | | — | | | | 25.41 | | | | 1.52 | | | | 2,541 | | | | 0.69 | † | | | 0.69 | † | | | (0.69 | )† | | | 63.35 | |
| Global X Permanent ETF | | | | | | | | | | | | | | | | | | | | | | | | | | | | | | | | | | | | | | | | | | | | |
| 2015(Unaudited) | | | 24.11 | | | | 0.12 | | | | 0.42 | | | | 0.54 | | | | (0.23 | ) | | | — | | | | — | | | | (0.23 | ) | | | 24.42 | | | | 2.26 | | | | 9,769 | | | | 0.48 | † | | | 0.48 | † | | | 0.98 | † | | | 6.90 | |
| 2014 | | | 24.13 | | | | 0.24 | | | | 0.18 | | | | 0.42 | | | | (0.36 | ) | | | (0.08 | ) | | | — | | | | (0.44 | ) | | | 24.11 | | | | 1.84 | | | | 8,439 | | | | 0.48 | | | | 0.48 | | | | 1.02 | | | | 24.63 | |
| 2013^ | | | 23.15 | | | | 0.07 | | | | 0.91 | | | | 0.98 | | | | — | | | | — | | | | — | | | | — | | | | 24.13 | | | | 4.23 | | | | 14,477 | | | | 0.48 | † | | | 0.48 | † | | | 0.90 | † | | | 3.08 | |
| 2013 | | | 24.77 | | | | 0.25 | | | | (1.66 | ) | | | (1.41 | ) | | | (0.21 | ) | | | — | | | | — | | | | (0.21 | ) | | | 23.15 | | | | (5.77 | ) | | | 15,048 | | | | 0.48 | | | | 0.48 | | | | 0.98 | | | | 44.44 | |
| 2012(2) | | | 25.04 | | | | 0.09 | | | | (0.36 | ) | | | (0.27 | ) | | | — | | | | — | | | | — | | | | — | | | | 24.77 | | | | (1.08 | ) | | | 14,859 | | | | 0.48 | † | | | 0.48 | † | | | 0.92 | † | | | 14.89 | |
| Global X Guru™ Index ETF | | | | | | | | | | | | | | | | | | | | | | | | | | | | | | | | | | | | | | | | | | | | |
| 2015(Unaudited) | | | 26.30 | | | | 0.06 | | | | 0.56 | | | | 0.62 | | | | (0.28 | ) | | | — | | | | — | | | | (0.28 | ) | | | 26.64 | | | | 2.35 | | | | 302,380 | | | | 0.75 | † | | | 0.75 | † | | | 0.47 | † | | | 80.46 | |
| 2014 | | | 23.99 | | | | 0.22 | | | | 2.12 | | | | 2.34 | | | | (0.03 | ) | | | — | | | | — | | | | (0.03 | ) | | | 26.30 | | | | 9.76 | | | | 436,586 | | | | 0.75 | | | | 0.75 | | | | 0.88 | | | | 87.53 | |
| 2013^ | | | 20.68 | | | | 0.01 | | | | 3.30 | | | | 3.31 | | | | — | | | | — | | | | — | | | | — | | | | 23.99 | | | | 16.01 | | | | 241,060 | | | | 0.75 | † | | | 0.75 | † | | | 0.10 | † | | | 24.89 | |
| 2013 | | | 15.83 | | | | 0.17 | | | | 5.66 | | | | 5.83 | | | | (0.20 | ) | | | (0.78 | ) | | | — | | | | (0.98 | ) | | | 20.68 | | | | 38.08 | | | | 52,740 | | | | 0.75 | | | | 0.75 | | | | 0.85 | | | | 77.25 | |
| 2012(3) | | | 14.96 | | | | 0.02 | | | | 0.85 | | | | 0.87 | | | | — | | | | — | | | | — | | | | — | | | | 15.83 | | | | 5.82 | | | | 5,539 | | | | 0.75 | † | | | 0.75 | † | | | 1.90 | † | | | 1.90 | |
| Global X Guru™ Activist Index ETF | | | | | | | | | | | | | | | | | | | | | | | | | | | | | | | | | | | | | | | | | | | | |
| 2015(4)(Unaudited) | | | 15.05 | | | | 0.01 | | | | (0.11 | ) | | | (0.10 | ) | | | — | | | | — | | | | — | | | | — | | | | 14.95 | | | | (0.66 | ) | | | 1,495 | | | | 0.75 | † | | | 0.75 | † | | | 2.39 | † | | | — | |
| Global X Guru™ International Index ETF | | | | | | | | | | | | | | | | | | | | | | | | | | | | | | | | | | | | | | | | | | | | |
| 2015(Unaudited) | | | 15.62 | | | | 0.05 | | | | (0.42 | ) | | | (0.37 | ) | | | (0.11 | ) | | | — | | | | — | | | | (0.11 | ) | | | 15.14 | | | | (2.34 | ) | | | 2,270 | | | | 0.75 | † | | | 0.75 | † | | | 0.63 | † | | | 66.83 | |
| 2014(5) | | | 14.83 | | | | 0.09 | | | | 0.70 | | | | 0.79 | | | | — | | | | — | | | | — | | | | — | | | | 15.62 | | | | 5.33 | | | | 2,343 | | | | 0.75 | † | | | 0.75 | † | | | 0.89 | † | | | 62.71 | |
| Global X Guru™ Small Cap Index ETF | | | | | | | | | | | | | | | | | | | | | | | | | | | | | | | | | | | | | | | | | | | | |
| 2015(Unaudited) | | | 14.36 | | | | 0.01 | | | | (0.58 | ) | | | (0.57 | ) | | | — | | | | — | | | | — | | | | — | | | | 13.79 | | | | (3.97 | ) | | | 2,068 | | | | 0.75 | † | | | 0.75 | † | | | 0.11 | † | | | 78.91 | |
| 2014(5) | | | 15.01 | | | | 0.01 | | | | (0.66 | ) | | | (0.65 | ) | | | — | | | | — | | | | — | | | | — | | | | 14.36 | | | | (4.33 | ) | | | 2,155 | | | | 0.75 | † | | | 0.75 | † | | | 0.06 | † | | | 78.42 | |
| Global X GF China Bond ETF | | | | | | | | | | | | | | | | | | | | | | | | | | | | | | | | | | | | | | | | | | | | |
| 2015(6)(Unaudited) | | | 76.00 | | | | 0.88 | | | | (38.40 | ) | | | (37.52 | ) | | | (0.83 | ) | | | — | | | | — | | | | (0.83 | ) | | | 37.65 | | | | 0.33 | | | | 48,941 | | | | 0.50 | † | | | 0.58 | † | | | 3.42 | † | | | 6.96 | |
| (1) | The Fund commenced operations on October 22, 2014. |
| (2) | The Fund commenced operations on February 7, 2012. |
| (3) | The Fund commenced operations on June 4, 2012. |
| (4) | The Fund commenced operations on April 28, 2015. |
| (5) | The Fund commenced operations on March 10, 2014. |
| (6) | The Fund commenced operations on November 18, 2014. |
| ^ | For the period July 1, 2013 to October 31, 2013. Effective July 1, 2013 the Global X Permanent ETF, Global X Guru™ Index ETF (formerly Global X Top Guru Holdings Index ETF) and Global X SuperIncome™ Preferred ETF each changed their fiscal year end to October 31 (See Note 1 in Notes to Financial Statements). |
| * | Per share data calculated using average shares method. |
| ** | Total return is based on the change in net asset value of a share during the year or period and assumes reinvestment of dividends and distributions at net asset value. Total return is for the period indicated and periods of less than one year have not been annualized. The return shown does not reflect the deduction of taxes that a shareholder would pay on Fund distributions or the redemption of Fund shares. |
| †† | Portfolio turnover rate is for the period indicated and periods of less than one year have not been annualized. Excludes effect of in-kind transfers. |
Amounts designated as “—” are $0 or have been rounded to $0.
The accompanying notes are an integral part of the financial statements.
Notes to Financial Statements
April 30, 2015 (Unaudited)
1. ORGANIZATION
The Global X Funds (the "Trust") is a Delaware statutory trust formed on March 6, 2008. The Trust is registered under the Investment Company Act of 1940, as amended, as an open-end management investment company. As of April 30, 2015, the Trust had ninety-four portfolios, forty-five of which were operational. The financial statements herein and the related notes pertain to the Global X SuperDividend® ETF, Global X SuperDividend® U.S. ETF, Global X SuperDividend® Emerging Markets ETF, Global X SuperDividend® REIT ETF, Global X SuperIncome™ Preferred ETF, Global X Social Media Index ETF, Global X | JPMorgan Efficiente Index ETF, Global X | JPMorgan US Sector Rotator Index ETF, Global X Permanent ETF, Global X Guru™ Index ETF, Global X Guru™ Activist Index ETF, Global X Guru™ International Index ETF, Global X Guru™ Small Cap Index ETF and Global X GF China Bond ETF (each a “Fund”, collectively, the “Funds”). Each Fund is non-diversified.
The Global X SuperDividend® Emerging Markets ETF and Global X SuperDividend® REIT ETF commenced operations on March 16, 2015. The Global X Guru™ Activist Index ETF commenced operations on April 28, 2015. The Global X GF China Bond ETF commenced operations on November 18, 2014.
2. SIGNIFICANT ACCOUNTING POLICIES
The following is a summary of the significant accounting policies followed by the Funds.
USE OF ESTIMATES – The Funds are investment companies that apply the accounting and reporting guidance issued in Topic 946 by the U.S. Financial Accounting Standards Board. The preparation of financial statements in conformity with U.S. generally accepted accounting principles ("U.S. GAAP") requires management to make estimates and assumptions that affect the reported amounts of assets and liabilities and disclosure of contingent assets and liabilities at the date of the financial statements and the reported amounts of increases and decreases in net assets from operations during the reporting period. Actual results could materially differ from those estimates.
MASTER LIMITED PARTNERSHIPS (“MLPs”) – Certain funds may invest in MLPs. MLPs are publicly traded partnerships engaged in the transportation, storage and processing of minerals and natural resources. By confining their operations to these specific activities, their interests, or units, are able to trade on public securities exchanges exactly like the shares of a corporation, without entity level taxation. To qualify as a MLP and to not be taxed as a corporation, a partnership must receive at least 90% of its income from qualifying sources as set forth in Section 7704(d) of the Internal Revenue Code of 1986, as amended (the “Code”). These qualifying sources include natural resource-based activities such as the processing, transportation and storage of mineral or natural resources. MLPs generally have two classes of owners: the general partner and limited partners. The general partner of an MLP is typically owned by a major energy company, an investment fund, the direct management of the MLP, or is an entity owned by one or more of such parties. The general partner may be structured as a private or publicly traded corporation or other entity. The general partner typically controls the operations and management of the MLP through an up to 2% equity interest in the MLP plus, in many cases, ownership of common units and subordinated units.
Limited partners typically own the remainder of the partnership, through ownership of common units, and have a limited role in the partnership’s operations and management. MLPs are typically structured such that common units and general partner interests have first priority to receive
Notes to Financial Statements (CONTINUED)
April 30, 2015 (Unaudited)
2. SIGNIFICANT ACCOUNTING POLICIES (continued)
MASTER LIMITED PARTNERSHIPS (“MLPs”) (concluded)
quarterly cash distributions up to an established minimum amount (“minimum quarterly distributions” or “MQD”). Common and general partner interests also accrue arrearages in distributions to the extent the MQD is not paid. Once common and general partner interests have been paid, subordinated units receive distributions of up to the MQD; however, subordinated units do not accrue arrearages. Distributable cash in excess of the MQD is paid to both common and subordinated units and is distributed to both common and subordinated units generally on a pro rata basis. The general partner is also eligible to receive incentive distributions if the general partner operates the business in a manner which results in distributions paid per common unit surpassing specified target levels. As the general partner increases cash distributions to the limited partners, the general partner receives an increasingly higher percentage of the incremental cash distributions.
SECURITY VALUATION -- Securities listed on a securities exchange, market or automated quotation system for which quotations are readily available (except for securities traded on NASDAQ), including securities traded over the counter, are valued at the last quoted sale price on the primary exchange or market (foreign or domestic) on which they are traded (or at approximately 4:00 pm if a security’s primary exchange is normally open at that time), or, if there is no such reported sale, at the most recent mean between the quoted bid and asked prices (absent both bid and asked prices on such exchange, the bid price may be used).
For securities traded on NASDAQ, the NASDAQ Official Closing Price will be used. If available, debt securities are priced based upon valuations provided by independent, third-party pricing agents. Such values generally reflect the last reported sales price if the security is actively traded. The third-party pricing agents may also value debt securities at an evaluated bid price by employing methodologies that utilize actual market transactions, broker-supplied valuations, or other methodologies designed to identify the market value for such securities. Debt obligations with remaining maturities of sixty days or less may be valued at their amortized cost, which approximates market value. The prices for foreign securities are reported in local currency and converted to U.S. dollars using currency exchange rates. The exchange rates used by the Trust for valuation are captured as of the New York or London close each day. Prices for most securities held in the Funds are provided daily by recognized independent pricing agents. If a security price cannot be obtained from an independent, third-party pricing agent, the Funds seek to obtain a bid price from at least one independent broker.
Securities for which market prices are not "readily available" are valued in accordance with Fair Value Procedures established by the Board of Trustees (the “Board”). The Funds’ Fair Value Procedures are implemented through a fair value committee (the “Committee”) designated by the Board. Some of the more common reasons that may necessitate that a security be valued using Fair Value Procedures include: the security's trading has been halted or suspended; the security has been de-listed from its primary trading exchange; the security's primary trading market is temporarily closed at a time when under normal conditions it would be open; the security has not been traded for an extended period of time; the security's primary pricing source is not able or willing to provide a price; or, trading of the security is subject to local government-imposed restrictions. In addition, the Funds may fair value their securities if an event that may materially affect the value of the Funds’ securities that traded outside of the United States (a “Significant Event”) has occurred between the time of the security's last close and the time that the Funds calculate their net asset value. A Significant Event may relate to a single issuer or to an entire market sector. Events that may be
Notes to Financial Statements (CONTINUED)
April 30, 2015 (Unaudited)
2. SIGNIFICANT ACCOUNTING POLICIES (continued)
SECURITY VALUATION (concluded)
Significant Events include: government actions, natural disasters, armed conflict, acts of terrorism and significant market fluctuations. If Global X Management Company LLC (the “Adviser”) becomes aware of a Significant Event that has occurred with respect to a security or group of securities after the closing of the exchange or market on which the security or securities principally trade, but before the time at which the Funds calculate net asset value, it may request that a Committee meeting be called. When a security is valued in accordance with the Fair Value Procedures, the Committee will determine the value after taking into consideration all relevant information reasonably available to the Committee. As of April 30, 2015, there was $1,819 of fair valued securities in the Global X Guru™ Small Cap Index ETF. There were no other securities priced using the Fair Value Procedures.
In accordance with the authoritative guidance on fair value measurements and disclosure under U.S. GAAP, the Funds disclose the fair value of their investments in a hierarchy that prioritizes the inputs to valuation techniques used to measure the fair value. The objective of a fair value measurement is to determine the price that would be received to sell an asset or paid to transfer a liability in an orderly transaction between market participants at the measurement date (an exit price). Accordingly, the fair value hierarchy gives the highest priority to quoted prices (unadjusted) in active markets for identical assets or liabilities (Level 1) and the lowest priority to unobservable inputs (Level 3). The three levels of the fair value hierarchy are described below:
Level 1 – Unadjusted quoted prices in active markets for identical, unrestricted assets or liabilities that the Funds have the ability to access at the measurement date
Level 2 – Other significant observable inputs (including quoted prices in non-active markets, quoted prices for similar investments, fair value of investments for which the Funds have the ability to fully redeem tranches at net asset value as of the measurement date or within the near term, and short-term investments valued at amortized cost)
Level 3 – Significant unobservable inputs (including the Funds’ own assumptions in determining the fair value of investments, and fair value of investments for which the Funds do not have the ability to fully redeem tranches at net asset value as of the measurement date or within the near term)
Investments are classified within the level of the lowest significant input considered in determining fair value. Investments classified within Level 3 whose fair value measurement considers several inputs may include Level 1 or Level 2 inputs as components of the overall fair value measurement.
For the period ended April 30, 2015, there have been no significant changes to the Funds’ fair valuation methodologies.
The unobservable inputs used to determine fair value of Level 3 assets may have similar or diverging impacts on valuation. Significant increases and decreases in these inputs in isolation and interrelationships between those inputs could result in significantly higher or lower fair value measurement.
REPURCHASE AGREEMENTS — Securities pledged as collateral for repurchase agreements are held by Citibank, N.A. and are designated as being held on each Fund’s behalf by its custodian under a book-entry system. Each Fund monitors the adequacy of the collateral on a daily basis and can
Notes to Financial Statements (continued)
April 30, 2015 (Unaudited)
2. SIGNIFICANT ACCOUNTING POLICIES (continued)
REPURCHASE AGREEMENTS (concluded)
require the seller to provide additional collateral in the event the market value of the securities pledged falls below the carrying value of the repurchase agreement, including accrued interest.
It is the Funds’ policy to only enter into repurchase agreements with banks and other financial institutions which are deemed by the Adviser to be creditworthy. The Funds bear the risk of loss in the event that the other party to a repurchase agreement defaults on its obligations and the Funds are prevented from exercising their rights to dispose of the underlying securities received as collateral and the risk of a possible decline in the value of the underlying securities during the period. For financial statement purposes, the Funds record the securities lending collateral (included in Repurchase Agreements, at value or restricted cash) as an asset and the obligation to return securities lending collateral as a liability on the Statements of Assets and Liabilities.
Repurchase agreements are entered into by the Funds under Master Repurchase Agreements (“MRA”) which permit the Funds, under certain circumstances, including an event of default (such as bankruptcy or insolvency), to offset payables and/or receivables under the MRA with collateral held and/or posted to the counterparty and create one single net payment due to or from the Funds.
At April 30, 2015, the open repurchase agreements by counterparty which are subject to a MRA on a net payment basis are as follows:
| | | | | | Fair Value of Non-cash | | | Cash Collateral | | | | |
| | | Repurchase Agreements | | | Collateral Received | | | Received | | | Net Amount(1) | |
| Global X SuperDividend® ETF | | | | | | | | | | | | | | | | |
| Barclays | | $ | 84,000,000 | | | $ | 84,000,000 | | | $ | - | | | $ | - | |
| Deutsche Bank | | | 6,695,736 | | | | 6,695,736 | | | | - | | | | - | |
| Global X SuperDividend® U.S. ETF | | | | | | | | | | | | | | | | |
| Deutsche Bank | | | 4,108,681 | | | | 4,108,681 | | | | - | | | | - | |
| Global X SuperIncome™ Preferred ETF | | | | | | | | | | | | | | | | |
| Deutsche Bank | | | 7,872,200 | | | | 7,872,200 | | | | - | | | | - | |
| Global X Social Media Index ETF | | | | | | | | | | | | | | | | |
| Deutsche Bank | | | 6,914,531 | | | | 6,914,531 | | | | - | | | | - | |
(1)Net Amount represents the net amount receivable due from the counterparty in the event of default.
FEDERAL INCOME TAXES – It is each Fund’s intention to qualify, or continue to qualify, as a regulated investment company for Federal income tax purposes by complying with the appropriate provisions of Subchapter M of the Internal Revenue Code of 1986, as amended. Accordingly, no provisions for Federal income taxes have been made in the financial statements.
During the period ended April 30, 2015, the Global X SuperIncomeTM Preferred ETF incurred federal excise tax in the amount of $3,118. No other provisions for Federal income taxes have been made in the financial statements.
The Funds evaluate tax positions taken or expected to be taken in the course of preparing the Funds’ tax returns to determine whether it is "more-likely-than-not" (i.e., greater than 50 percent) that each tax position will be sustained upon examination by a taxing authority based on the technical merits of the position. Tax positions not deemed to meet the more-likely-than-not threshold are recorded as a tax benefit or expense in the current year. The Funds did not record any tax provisions in the
Notes to Financial Statements (continued)
April 30, 2015 (Unaudited)
2. SIGNIFICANT ACCOUNTING POLICIES (continued)
FEDERAL INCOME TAXES (concluded)
current period; however, management’s conclusions regarding tax positions may be subject to review and adjustment at a later date based on factors including, but not limited to, examination by tax authorities (i.e., the last three tax year ends, as applicable), on-going analysis of and changes to tax laws, regulations and interpretations thereof.
As of and during the six months ended April 30, 2015, the Funds did not have a liability for any unrecognized tax benefits. The Funds recognize interest and penalties, if any, related to unrecognized tax benefits as income tax expense in the Statement of Operations. During the period, the Funds did not incur any interest or penalties.
SECURITY TRANSACTIONS AND INVESTMENT INCOME — Security transactions are accounted for on the trade date for financial reporting purposes. Costs used in determining realized gains and losses on the sale of investment securities are based on specific identification. Dividend income is recorded on the ex-dividend date. Interest income is recognized on the accrual basis from the settlement date.
FOREIGN CURRENCY TRANSACTIONS AND TRANSLATION — The books and records of the Funds are maintained in U.S. dollars. Investment securities and other assets and liabilities denominated in a foreign currency are translated into U.S. dollars on the date of valuation. Purchases and sales of investment securities, income and expenses are translated into U.S. dollars at the relevant rates of exchange prevailing on the respective dates of such transactions. The Funds do not isolate that portion of realized or unrealized gains and losses resulting from changes in the foreign exchange rate from fluctuations arising from changes in the market prices of the securities. These gains and losses are included in net realized and unrealized gains and losses on investments on the Statement of Operations. Net realized and unrealized gains and losses on foreign currency transactions and translations represent net foreign exchange gains or losses from foreign currency spot contracts, disposition of foreign currencies, currency gains or losses realized between trade and settlement dates on securities transactions and the difference between the amount of the investment income and foreign withholding taxes recorded on the Funds’ books and the U.S. dollar equivalent amounts actually received or paid.
DIVIDENDS AND DISTRIBUTIONS TO SHAREHOLDERS — The Funds distribute their net investment income on a pro rata basis. Any net realized capital gains are distributed annually. All distributions are recorded on the ex-dividend date.
INVESTMENTS IN REITs — With respect to the Funds, dividend income is recorded based on the income included in distributions received from real estate investment trust (“REIT”) investments using published REIT reclassifications, including some management estimates when actual amounts are not available. Distributions received in excess of these estimated amounts are recorded as a reduction of the cost of investments or reclassified to capital gains. The actual amounts of income, return of capital, and capital gains are only determined by each REIT after its fiscal year end, and may differ from the estimated amounts.
Notes to Financial Statements (continued)
April 30, 2015 (Unaudited)
2. SIGNIFICANT ACCOUNTING POLICIES (concluded)
CREATION UNITS — The Funds issue and redeem shares (“Shares”) at Net Asset Value (“NAV”) and only in large blocks of Shares, (each block of Shares for a Fund is called a “Creation Unit” or multiples thereof). Purchasers of Creation Units (“Authorized Participants”) at NAV must pay a standard creation transaction fee per transaction. The fee is a single charge and will be the same regardless of the number of Creation Units purchased by an investor on the same day. An Authorized Participant who holds Creation Units and wishes to redeem at NAV would also pay a standard Redemption Fee per transaction to Brown Brothers Harriman & Co. (“BBH”), the Funds’ custodian, on the date of such redemption, regardless of the number of Creation Units redeemed that day.
If a Creation Unit is purchased or redeemed for cash, a higher transaction fee will be charged. The following table discloses Creation Unit breakdown:
| | | | | | Creation | | | Value at April 30, | | | | |
| | | Creation Unit Shares | | | Fee | | | 2015 | | | Redemption Fee | |
| Global X SuperDividend® ETF | | | 50,000 | | | $ | 3,800 | | | $ | 1,197,000 | | | $ | 3,800 | |
| Global X SuperDividend® U.S. ETF | | | 50,000 | | | | 750 | | | | 1,426,000 | | | | 750 | |
| Global X SuperDividend® Emerging Markets ETF | | | 50,000 | | | | 3,000 | | | | 916,000 | | | | 3,000 | |
| Global X SuperDividend® REIT ETF | | | 50,000 | | | | 750 | | | | 762,000 | | | | 750 | |
| Global X SuperIncomeTM Preferred ETF | | | 50,000 | | | | 500 | | | | 731,000 | | | | 500 | |
| Global X Social Media Index ETF | | | 50,000 | | | | 1,000 | | | | 1,016,500 | | | | 1,000 | |
| Global X | JPMorgan Efficiente Index ETF | | | 50,000 | | | | 500 | | | | 1,301,500 | | | | 500 | |
| Global X | JPMorgan US Sector Rotator Index ETF | | | 50,000 | | | | 500 | | | | 1,233,000 | | | | 500 | |
| Global X Permanent ETF | | | 50,000 | | | | 1,000 | | | | 1,221,000 | | | | 1,000 | |
| Global X GuruTM Index ETF | | | 50,000 | | | | 750 | | | | 1,332,000 | | | | 750 | |
| Global X GuruTM Activist Index ETF | | | 50,000 | | | | 750 | | | | 747,500 | | | | 750 | |
| Global X GuruTM International Index ETF | | | 50,000 | | | | 750 | | | | 757,000 | | | | 750 | |
| Global X GuruTM Small Cap Index ETF | | | 50,000 | | | | 750 | | | | 689,500 | | | | 750 | |
| Global X GF China Bond ETF | | | 50,000 | | | | 1,000 | | | | 1,882,500 | | | | 1,000 | |
3. RELATED PARTY TRANSACTIONS
The Adviser serves as the investment adviser and the administrator for the Funds. Subject to the supervision of the Board of Trustees, the Adviser is responsible for managing the investment activities of the Funds and the Funds’ business affairs and other administrative matters and provides or causes to be furnished all supervisory, administrative and other services reasonably necessary for the operation of the Funds, including certain distribution services (provided pursuant to a separate Distribution Agreement), certain shareholder and distribution-related services (provided pursuant to a separate Rule 12b-1 Plan and related agreements) and investment advisory services (provided pursuant to a separate Investment Advisory Agreement), under what is essentially an "all-in" fee structure. For its service to the Funds, under the Supervision and Administration Agreement, each Fund pays a monthly fee to the Adviser at the annual rate (stated as a percentage of the average daily net assets of the Fund). In addition, the Funds bear other expenses, directly and indirectly, that are not covered by the Supervision and Administration Agreement, which may vary and affect the total expense ratios of the Funds, such as taxes, brokerage fees, commissions, acquired fund fees, and other transaction expenses, interest expenses and extraordinary expenses (such as litigation and indemnification expenses). In addition, the Global X GF China Bond ETF pays custodial fees that
Notes to Financial Statements (continued)
April 30, 2015 (Unaudited)
3. RELATED PARTY TRANSACTIONS (continued)
are not covered by the Supervision and Administration Agreement. Pursuant to an agreement with the Custodian, the Global X GF China Bond ETF may pay up to 0.10% in Custody Fees (in addition to the Supervision and Administration Fee).
| | | Supervision and | |
| | | Administration Fee | |
| Global X SuperDividend® ETF | | | 0.58 | % |
| Global X SuperDividend® U.S. ETF | | | 0.45 | % |
| Global X SuperDividend® Emerging Markets ETF | | | 0.65 | % |
| Global X SuperDividend® REIT ETF | | | 0.58 | % |
| Global X SuperIncomeTM Preferred ETF | | | 0.58 | % |
| Global X Social Media Index ETF | | | 0.65 | % |
| Global X | JPMorgan Efficiente Index ETF | | | 0.69 | % |
| Global X | JPMorgan US Sector Rotator Index ETF | | | 0.69 | % |
| Global X Permanent ETF | | | 0.48 | % |
| Global X GuruTM Index ETF | | | 0.75 | % |
| Global X GuruTM Activist Index ETF | | | 0.75 | % |
| Global X GuruTM International Index ETF | | | 0.75 | % |
| Global X GuruTM Small Cap Index ETF | | | 0.75 | % |
| Global X GF China Bond ETF * | | | 0.48 | % |
*Pursuant to an Expense Limitation Agreement, the Adviser has agreed to waive or reimburse fees and/or limit Fund expenses to the extent necessary to assure that the operating expenses of the Fund (exclusive of taxes, brokerage fees, commissions, and other transaction expenses, interest and extraordinary expenses (such as litigation and indemnification expenses)) will not exceed 0.50% of the Global X GF China Bond Fund’s average daily net assets per year until at least March 1, 2016.
GF International Investment Management Limited (“Sub-Adviser”), located at Suites 3503-3505, 35/F, Two International Finance Centre, 8 Finance Street, Central, Hong Kong serves as sub-adviser to the Global X GF China Bond ETF. The Sub-Adviser is responsible for the day-to-day investment management of the Global X GF China Bond ETF, subject to the oversight of the Adviser. For the services it provides to the Global X GF China Bond ET, the Adviser pays the Sub-Adviser a fee equal to 50% of the net profit the Adviser derives from its relationship with the Global X GF China Bond ETF. In addition, the investment sub-advisory agreement requires the Sub-Adviser to pay the Adviser a payment equal to 50% of any amount by which certain administrative and other operating expenses of the Sub-Adviser.
SEI Investments Global Funds Services (“SEIGFS”) serves as Sub-Administrator to the Funds. As Sub-Administrator, SEIGFS provides the Funds with the required general administrative services, including, without limitation: office space, equipment, and personnel; clerical and general back office services; bookkeeping, internal accounting and secretarial services; the calculation of NAV; and assistance with the preparation and filing of reports, registration statements, proxy statements and other materials required to be filed or furnished by the Funds under federal and state securities laws. As compensation for these services, the Sub-Administrator receives certain out-of-pocket costs, transaction fees and asset-based fees which are accrued daily and paid monthly by the Adviser.
Notes to Financial Statements (continued)
April 30, 2015 (Unaudited)
3. RELATED PARTY TRANSACTIONS (concluded)
SEI Investments Distribution Co. (“SIDCO”) serves as each Fund’s underwriter and distributor of Shares pursuant to a Distribution Agreement. Under the Distribution Agreement, SIDCO, as agent, receives orders to create and redeem Shares in Creation Unit Aggregations and transmits such orders to the Trust’s custodian and transfer agent. The Distributor has no obligation to sell any specific quantity of Fund Shares. SIDCO bears the following costs and expenses relating to the distribution of Shares: (i) the costs of processing and maintaining records of creations of Creation Units; (ii) all costs of maintaining the records required of a registered broker/dealer; (iii) the expenses of maintaining its registration or qualification as a dealer or broker under Federal or state laws; (iv) filing fees; and (v) all other expenses incurred in connection with the distribution services as contemplated in the Distribution Agreement. SIDCO receives no fee for its distribution services under the Distribution Agreement.
BBH, located at 40 Water Street, Boston, MA 02109, serves as Custodian and Transfer Agent of the Funds’ assets. As Custodian, BBH has agreed to (1) make receipts and disbursements of money on behalf of the Funds, (2) collect and receive all income and other payments and distributions on account of the Funds’ portfolio investments, (3) respond to correspondence from shareholders, security brokers and others relating to its duties; and (4) make periodic reports to the Funds concerning the Funds’ operations. BBH does not exercise any supervisory function over the purchase and sale of securities. As Transfer Agent, BBH has agreed to (1) issue and redeem shares of each Fund, (2) make dividend and other distributions to shareholders of each Fund, (3) respond to correspondence by shareholders and others relating to its duties; (4) maintain shareholder accounts, and (5) make periodic reports to the Funds. As compensation for these services, the Transfer Agent receives certain out-of-pocket costs, transaction fees and asset-based fees which are accrued daily and paid monthly by the Adviser from its fees. As compensation for these services, the Custodian receives certain out-of-pocket costs, transaction fees and asset-based fees which are accrued daily and paid monthly by the Adviser from its fees.
4. INVESTMENT TRANSACTIONS
For the period ended April 30, 2015, the purchases and sales of investments in securities excluding in-kind transactions, long-term U.S. Government and short-term securities were:
| | | | | | Sales and | |
| | | Purchases | | | Maturities | |
| Global X SuperDividend® ETF | | $ | 193,932,709 | | | $ | 198,545,761 | |
| Global X SuperDividend® U.S. ETF | | | 99,750,131 | | | | 108,941,659 | |
| Global X SuperDividend® Emerging Markets ETF | | | 927,125 | | | | - | |
| Global X SuperDividend® REIT ETF | | | 22,368 | | | | 1,959 | |
| Global X SuperIncomeTM Preferred ETF | | | 40,032,967 | | | | 40,189,505 | |
| Global X Social Media Index ETF | | | 18,573,079 | | | | 18,233,259 | |
| Global X | JPMorgan Efficiente Index ETF | | | 3,729,691 | | | | 3,687,623 | |
| Global X | JPMorgan US Sector Rotator Index ETF | | | 92,410,939 | | | | 92,326,290 | |
| Global X Permanent ETF | | | 964,741 | | | | 506,317 | |
| Global X GuruTM Index ETF | | | 296,795,972 | | | | 299,950,479 | |
| Global X GuruTM Activist Index ETF | | | - | | | | - | |
| Global X GuruTM International Index ETF | | | 1,492,319 | | | | 1,507,931 | |
| Global X GuruTM Small Cap Index ETF | | | 1,629,885 | | | | 1,627,122 | |
| Global X GF China Bond ETF | | | 51,542,101 | | | | 3,303,312 | |
Notes to Financial Statements (continued)
April 30, 2015 (Unaudited)
4. INVESTMENT TRANSACTIONS (concluded)
For the period ended April 30, 2015 the purchases and sales of long-term U.S. Government securities were:
| | | | | | Sales and | |
| | | Purchases | | | Maturities | |
| Global X Permanent ETF | | $ | - | | | $ | 119,965 | |
For the period ended April 30, 2015 in-kind transactions associated with creations and redemptions were:
| | | | | | Sales and | | | | |
| | | Purchases | | | Maturities | | | Realized Gain | |
| Global X SuperDividend® ETF | | $ | 63,595,216 | | | $ | 11,012,622 | | | $ | 1,729,867 | |
| Global X SuperDividend® U.S. ETF | | | 64,230,242 | | | | 29,000,926 | | | | 4,060,229 | |
| Global X SuperDividend® Emerging Markets ETF | | | 2,168,832 | | | | - | | | | - | |
| Global X SuperDividend® REIT ETF | | | 2,284,982 | | | | - | | | | - | |
| Global X SuperIncomeTM Preferred ETF | | | 134,142,324 | | | | 7,270,021 | | | | 301,428 | |
| Global X Social Media Index ETF | | | 42,729,405 | | | | 65,001,033 | | | | 6,716,645 | |
| Global X | JPMorgan Efficiente Index ETF | | | 23,753,014 | | | | - | | | | - | |
| Global X | JPMorgan US Sector Rotator Index ETF | | | 27,082,883 | | | | 1,252,675 | | | | 3,637 | |
| Global X Permanent ETF | | | 1,154,577 | | | | 597,499 | | | | 80,850 | |
| Global X GuruTM Index ETF | | | 11,925,032 | | | | 148,941,533 | | | | 11,362,328 | |
| Global X GuruTM Activist Index ETF | | | 1,504,670 | | | | - | | | | - | |
| Global X GuruTM International Index ETF | | | - | | | | - | | | | - | |
| Global X GuruTM Small Cap Index ETF | | | - | | | | - | | | | - | |
| Global X GF China Bond ETF | | | - | | | | - | | | | - | |
For the year or periods ended October 31, 2014 in-kind transactions associated with creations and redemptions were:
| | | | | | Sales and | | | | |
| | | Purchases | | | Maturities | | | Realized Gain | |
| Global X SuperDividend® ETF | | $ | 291,318,883 | | | $ | 46,485,624 | | | $ | 6,877,254 | |
| Global X SuperDividend® U.S. ETF | | | 226,952,335 | | | | 15,011,076 | | | | 3,725,106 | |
| Global X SuperIncomeTM Preferred ETF | | | 117,436,325 | | | | 13,616,202 | | | | 873,051 | |
| Global X Social Media Index ETF | | | 102,815,373 | | | | 67,464,717 | | | | 13,728,822 | |
| Global X | JPMorgan Efficiente Index ETF | | | 2,494,440 | | | | - | | | | - | |
| Global X | JPMorgan US Sector Rotator Index ETF | | | 2,502,135 | | | | - | | | | - | |
| Global X Permanent ETF | | | 602,819 | | | | 4,899,378 | | | | 47,979 | |
| Global X GuruTM Index ETF | | | 568,383,721 | | | | 403,551,463 | | | | 37,571,401 | |
| Global X GuruTM International Index ETF | | | 3,080,436 | | | | 734,683 | | | | 66,415 | |
| Global X GuruTM Small Cap Index ETF | | | 2,253,119 | | | | - | | | | - | |
5. TAX INFORMATION
The amount and character of income and capital gain distributions to be paid, if any, are determined in accordance with Federal income tax regulations, which may differ from U.S. GAAP. As a result, net investment income (loss) and net realized gain (loss) on investment transactions for a reporting period may differ significantly from distributions during such period. These book/tax differences may be temporary or permanent. To the extent these differences are permanent in nature, they are charged or credited to undistributed net investment income (loss), accumulated net realized gain (loss) or paid-in capital, as appropriate, in the period that the differences arise.
Notes to Financial Statements (continued)
April 30, 2015 (Unaudited)
5. TAX INFORMATION (continued)
The tax character of dividends and distributions declared during the years or periods ended October 31, 2014 and October 31, 2013 were as follows:
| Global X Funds | | Ordinary Income | | | Long-Term
Capital Gain | | | Return of Capital | | | Totals | |
| | | | |
| Global X SuperDividend® ETF |
| 2014 | | $ | 55,528,000 | | | $ | – | | | $ | – | | | $ | 55,528,000 | |
| 2013 | | | 35,106,732 | | | | – | | | | – | | | | 35,106,732 | |
| Global X SuperDividend® U.S. ETF |
| 2014 | | $ | 5,177,061 | | | $ | – | | | $ | 617,714 | | | $ | 5,794,775 | |
| 2013 | | | 1,333,281 | | | | – | | | | 145,569 | | | | 1,478,850 | |
| Global X SuperIncome™ Preferred Index ETF |
| 2014 | | $ | 6,808,392 | | | $ | – | | | $ | – | | | $ | 6,808,392 | |
| 2013* | | | 978,675 | | | | – | | | | – | | | | 978,675 | |
| 2013** | | | 802,997 | | | | – | | | | – | | | | 802,997 | |
| Global X Social Media Index ETF |
| 2014 | | $ | 1,764 | | | $ | – | | | $ | – | | | $ | 1,764 | |
| 2013 | | | 98,361 | | | | – | | | | – | | | | 98,361 | |
| Global X Permanent ETF |
| 2014 | | $ | 217,578 | | | $ | 47,821 | | | $ | – | | | $ | 265,399 | |
| 2013* | | | – | | | | – | | | | – | | | | – | |
| 2013** | | | 114,515 | | | | – | | | | – | | | | 114,515 | |
| Global X Guru™ Index ETF |
| 2014 | | $ | 424,270 | | | $ | 50,647 | | | $ | – | | | $ | 474,917 | |
| 2013* | | | – | | | | – | | | | – | | | | – | |
| 2013** | | | 98,030 | | | | – | | | | – | | | | 98,030 | |
*For the period from July 1, 2013 to October 31, 2013
**For the year or period ended June 30, 2013
As of October 31, 2014, the components of tax basis distributable earnings (accumulated losses) were as follows:
| | | Global X Funds | |
| | | Global X
SuperDividend®
ETF | | | Global X
SuperDividend®
U.S. ETF | | | Global X
SuperIncome™
Preferred ETF | | | Global X Social
Media Index
ETF | | | Global X |
JPMorgan
Efficiente Index
ETF | |
| Undistributed Ordinary Income | | $ | 5,093,945 | | | $ | – | | | $ | 539,784 | | | $ | 19,487 | | | $ | – | |
| Undistributed Long-Term Capital Gain | | | 1,980,361 | | | | – | | | | – | | | | – | | | | – | |
| Capital Loss Carryforwards | | | – | | | | (1,452,981 | ) | | | (1,398,794 | ) | | | (4,661,406 | ) | | | – | |
| Unrealized Appreciation (Depreciation) on Investments and Foreign Currency | | | 22,714,204 | | | | 12,607,769 | | | | (1,362,284 | ) | | | (13,702,001 | ) | | | 54,463 | |
| Late Year Loss Deferral * | | | – | | | | – | | | | – | | | | – | | | | (380 | ) |
| Other Temporary Differences | | | 2 | | | | 3 | | | | (225,363 | ) | | | 3 | | | | – | |
| | | | | | | | | | | | | | | | | | | | | |
| Total Distributable Earnings | | $ | 29,788,512 | | | $ | 11,154,791 | | | $ | (2,446,657 | ) | | $ | (18,343,917 | ) | | $ | 54,083 | |
Notes to Financial Statements (continued)
April 30, 2015 (Unaudited)
5. TAX INFORMATION (continued)
| | | Global X Funds | |
| | | Global X |
JPMorgan US
Sector Rotator
Index ETF | | | Global X
Permanent ETF | | | Global X
Guru™ Index
ETF | | | Global X
Guru™
International
Index ETF | | | Global X Guru™
Small Cap Index
ETF | |
| Undistributed Ordinary Income | | $ | 3,065 | | | $ | 90,544 | | | $ | 3,815,497 | | | $ | 10,466 | | | $ | – | |
| Undistributed Long-Term Capital Gain | | | – | | | | – | | | | – | | | | – | | | | – | |
| Capital Loss Carryforwards | | | – | | | | (404,180 | ) | | | (6,256,459 | ) | | | (16,419 | ) | | | (16,000 | ) |
| Unrealized Appreciation (Depreciation) on Investments and Foreign Currency | | | 35,252 | | | | (769,582 | ) | | | 17,097,695 | | | | 14,929 | | | | (80,734 | ) |
| Other Temporary Differences | | | – | | | | – | | | | – | | | | (1 | ) | | | 1 | |
| | | | | | | | | | | | | | | | | | | | | |
| Total Distributable Earnings | | $ | 38,317 | | | $ | (1,083,218 | ) | | $ | 14,656,733 | | | $ | 8,975 | | | $ | (96,733 | ) |
*Deferred late-year losses represent ordinary losses realized on investment transactions from January 1, 2014 through
October 31, 2014.
Under the Regulated Investment Company Modernization Act of 2010, the Funds are permitted to carry forward capital losses incurred in taxable years beginning after December 22, 2010 for an unlimited period. However, any losses incurred during those future taxable years are required to be used prior to the losses incurred in pre-enactment taxable years. As a result of this ordering rule, preenactment capital loss carryforwards may be more likely to expire unused. Additionally, post-enactment capital losses that are carried forward will retain their character as either short-term or long-term capital losses rather than being considered all short-term as under previous law. Losses carried forward under these new provisions are as follows:
| | | Short-Term | | | Long-Term | | | | |
| Global X Funds | | Loss | | | Loss | | | Total | |
| Global X SuperDividend® U.S. ETF | | $ | 1,452,981 | | | $ | - | | | $ | 1,452,981 | |
| Global X SuperIncomeTM Preferred ETF | | | 1,060,170 | | | | 338,624 | | | | 1,398,794 | |
| Global X Social Media Index ETF | | | 4,444,314 | | | | 217,092 | | | | 4,661,406 | |
| Global X Permanent ETF | | | 390,625 | | | | 13,555 | | | | 404,180 | |
| Global X GuruTM Index ETF | | | 6,256,459 | | | | - | | | | 6,256,459 | |
| Global X GuruTM International Index ETF | | | 16,419 | | | | - | | | | 16,419 | |
| Global X GuruTM Small Cap Index ETF | | | 16,000 | | | | - | | | | 16,000 | |
During the year ended October 31, 2014 the following funds utilized capital loss carryforwards to offset capital gains amounting to:
| Global X Funds | | | |
| Global X SuperDividend® ETF | | $ | 18,271,023 | |
Notes to Financial Statements (continued)
April 30, 2015 (Unaudited)
5. TAX INFORMATION (concluded)
The Federal tax cost and aggregate gross unrealized appreciation and depreciation on investments held by the Funds at April 30, 2015 were as follows:
| Global X Funds | | Federal Tax Cost | | | Aggregated Gross
Unrealized
Appreciation | | | Aggregated Gross
Unrealized
Depreciation | | | Net Unrealized
Appreciation
(Depreciation) | |
| Global X SuperDividend® ETF | | $ | 1,135,726,663 | | | $ | 105,562,772 | | | $ | (65,653,123 | ) | | $ | 39,909,649 | |
| Global X SuperDividend® U.S. ETF | | | 289,142,005 | | | | 14,393,863 | | | | (8,868,872 | ) | | | 5,524,991 | |
| Global X SuperDividend® Emerging Markets ETF | | | 3,095,957 | | | | 559,129 | | | | (22,109 | ) | | | 537,020 | |
| Global X SuperDividend® REIT ETF | | | 2,305,390 | | | | 27,237 | | | | (60,312 | ) | | | (33,075 | ) |
| Global X SuperIncome™ Preferred ETF | | | 295,696,889 | | | | 2,894,651 | | | | (2,472,565 | ) | | | 422,086 | |
| Global X Social Media Index ETF | | | 124,746,183 | | | | 9,437,530 | | | | (17,977,582 | ) | | | (8,540,052 | ) |
| Global X | JPMorgan Efficiente Index ETF | | | 26,281,238 | | | | 192,741 | | | | (430,950 | ) | | | (238,209 | ) |
| Global X | JPMorgan US Sector Rotator Index ETF | | | 27,184,097 | | | | – | | | | (62,998 | ) | | | (62,998 | ) |
| Global X Permanent ETF | | | 10,401,889 | | | | 480,305 | | | | (1,152,088 | ) | | | (671,783 | ) |
| Global X Guru™ Index ETF | | | 290,965,472 | | | | 21,205,160 | | | | (9,760,653 | ) | | | 11,444,507 | |
| Global X Guru™ Activist Index ETF | | | 1,504,670 | | | | 10,571 | | | | (20,438 | ) | | | (9,867 | ) |
| Global X Guru™ International Index ETF | | | 2,315,055 | | | | 165,889 | | | | (212,399 | ) | | | (46,510 | ) |
| Global X Guru™ Small Cap Index ETF | | | 2,160,075 | �� | | | 186,149 | | | | (277,180 | ) | | | (91,031 | ) |
| Global X GF China Bond ETF | | | 48,083,805 | | | | 10,596 | | | | (513,325 | ) | | | (502,729 | ) |
6. CONCENTRATION OF RISKS
The Funds invest in securities of foreign issuers in various countries. These investments may involve certain considerations and risks not typically associated with investments in the United States as a result of, among other factors, the possibility of future political and economic developments and the level of governmental supervision and regulation of securities markets in the respective countries.
The securities markets of emerging countries are less liquid and subject to greater price volatility, and have a smaller market capitalization, than those of U.S. securities markets. In certain countries, there may be fewer publicly traded securities and the market may be dominated by a few issuers or sectors. Issuers and securities markets in such countries are not subject to as extensive and frequent accounting, financial and other reporting requirements or as comprehensive government regulations as are issuers and securities markets in the U.S. In particular, the assets and profits appearing on the financial statements of emerging country issuers may not reflect their financial position or results of operations in the same manner as financial statements for U.S. issuers. Substantially less information maybe publicly available about emerging country issuers than is available about issuers in the United States.
The Funds may be subject to taxes imposed by countries in which they invest. Such taxes are generally based on either income or gains earned or repatriated. The Funds accrue and apply such taxes to net investment income, net realized gains and net unrealized gains as income and/or capital gains are earned.
The Funds (other than the Global X GF China Bond ETF) use a replication strategy. A replication strategy is an indexing strategy that involves investing in the securities of an underlying index in approximately the same proportions as in the underlying index. The Funds (other than the Global X
Notes to Financial Statements (continued)
April 30, 2015 (Unaudited)
6. CONCENTRATION OF RISKS (concluded)
GF China Bond ETF) may utilize a representative sampling strategy with respect to their underlying indices when a replication strategy might be detrimental to their shareholders, such as when there are practical difficulties or substantial costs involved in compiling a portfolio of equity securities to follow their underlying indices, or, in certain instances, when securities in the underlying indices become temporarily illiquid, unavailable or less liquid, or due to legal restrictions (such as diversification requirements that apply to the Funds but not the underlying indices).
Because of the practical difficulties and expense of purchasing all of the securities in the underlying index, the Global X GF China Bond ETF does not expect to purchase all of the securities in the underlying index. Instead, the Adviser will utilize a “sampling” methodology in seeking to achieve the Fund’s objective. As such, the Fund may purchase a subset of the bonds in the underlying index in an effort to hold a portfolio of bonds with generally the same risk and return characteristics of the underlying index.
7. LOANS OF PORTFOLIO SECURITIES
The Funds may lend portfolio securities having a market value up to one-third of the Funds’ total assets. Security loans made pursuant to a securities lending agreement are required at all times to be secured by collateral equal to at least 102% for U.S.-based securities and 105% for foreign-based securities. Such collateral received in connection with these loans will be cash and can be invested in repurchase agreements or U.S. Treasury obligations and is recognized in the Schedule of Investments and Statement of Assets and Liabilities. The obligation to return securities lending collateral is also recognized as a liability in the Statement of Assets and Liabilities. It is the Funds’ policy to obtain additional collateral from or return excess collateral to the borrower by the end of the next business day, following the valuation date of the securities loaned. Therefore, the value of the collateral held may be temporarily less than the value of the securities on loan. Lending securities entails a risk of loss to the Funds if and to the extent that the market value of the securities loans were to increase and the borrower did not increase the collateral accordingly, and the borrower fails to return the securities. The Funds could also experience delays and costs in gaining access to the collateral. The Funds bear the risk of any deficiency in the amount of the collateral available for return to the borrower due to any loss on the collateral invested.
As of April 30, 2015 the value of securities on loan was $88,484,305, $11,105,280, $7,585,490 and 6,583,622 for the Global X SuperDividend® ETF, Global X SuperDividend® U.S. ETF, Global SuperIncome™ Preferred ETF and Global X Social Media Index ETF, respectively and the value of securities purchased with the cash collateral held from securities on loan was $90,695,736, $4,108,681, $7,872,200 and $6,914,531 for the Global X SuperDividend® ETF, Global X SuperDividend® U.S. ETF, Global X SuperIncome™ Preferred ETF and Global X Social Media Index ETF, respectively.
Notes to Financial Statements (continued)
April 30, 2015 (Unaudited)
7. LOANS OF PORTFOLIO SECURITIES (concluded)
At April 30, 2015, the following Funds had securities on loan, by counterparty:
| | | Market Value | | | Cash Collateral | |
| Global X SuperDividend® ETF | | | | | | | | |
| Barclays | | $ | 1,562,000 | | | $ | 1,650,000 | |
| BNP Prime Brokerage | | | 40,433,436 | | | | 42,824,347 | |
| Citigroup | | | 865,224 | | | | 892,125 | |
| Credit Suisse | | | 3,649,950 | | | | 3,915,825 | |
| Deutsche Bank | | | 1,857,807 | | | | 2,048,160 | |
| Goldman Sachs & Co. | | | 1,068,265 | | | | 1,147,900 | |
| JPMorgan | | | 10,751,312 | | | | 8,171,238 | |
| Merrill Lynch Pierce Fenner & Smith | | | 3,335,000 | | | | 3,500,000 | |
| Morgan Stanley | | | 3,117,174 | | | | 3,302,190 | |
| Nomura Securities | | | 8,262,783 | | | | 8,902,408 | |
| UBS Securities | | | 13,581,353 | | | | 14,341,543 | |
| Global X SuperDividend® U.S. ETF | | | | | | | | |
| Barclays | | | 3,402,498 | | | | 3,609,375 | |
| Deutsche Bank | | | 28,566 | | | | 29,700 | |
| JPMorgan | | | 3,037,310 | | | | 2,839,160 | |
| Merrill Lynch Pierce Fenner & Smith | | | 3,166,824 | | | | 3,325,950 | |
| Morgan Stanley | | | 1,470,082 | | | | 1,565,400 | |
| Global X SuperIncome™ Preferred ETF | | | | | | | | |
| Citigroup | | | 25,030 | | | | 25,750 | |
| JPMorgan | | | 166,884 | | | | 172,650 | |
| Merrill Lynch Pierce Fenner & Smith | | | 240,975 | | | | 246,500 | |
| Morgan Stanley | | | 3,209,266 | | | | 3,312,200 | |
| Wells Fargo Securities | | | 3,943,335 | | | | 4,115,100 | |
| Global X Social Media Index ETF | | | | | | | | |
| Barclays | | | 1,556,244 | | | | 1,649,400 | |
| Citigroup | | | 667,212 | | | | 675,325 | |
| Deutsche Bank | | | 200,160 | | | | 207,000 | |
| JPMorgan | | | 1,165,072 | | | | 1,216,200 | |
| Merrill Lynch Pierce Fenner & Smith | | | 1,958,465 | | | | 2,073,364 | |
| Morgan Stanley | | | 236,872 | | | | 244,199 | |
| Nomura Securities | | | 799,598 | | | | 849,044 | |
Notes to Financial Statements (continued)
April 30, 2015 (Unaudited)
8. CONTRACTUAL OBLIGATIONS
The Funds enter into contracts in the normal course of business that contain a variety of indemnifications. The Funds’ maximum exposure under these arrangements is unknown. However the Funds have not had prior gains or losses pursuant to these contracts. Management has reviewed the Funds’ existing contracts and expects the risk of loss to be remote.
Pursuant to the Trust’s organizational documents, the Trustees of the Trust and the Trust’s officers are indemnified against certain liabilities that may arise out of the performance of their duties.
9. SUBSEQUENT EVENTS
The Funds have been evaluated regarding the need for additional disclosures and/or adjustments resulting from subsequent events. Based on this evaluation, no additional disclosure or adjustments were required to the financial statements as the date the financial statements were issued, except as follows:
Subsequent to the April 30th period end, the following investment portfolios were added to the Trust.
Fund Name
Global X High Quality Dividend Yield Index ETF
Global X S&P 500® Catholic Values Custom Index ETF
Subsequent to the April 30th period end, the following investment portfolios of the Trust commenced operations.
| Fund Name | | Commenced Operations | |
| Global X Scientific Beta US ETF | | May 12, 2015 | |
| Global X Scientific Beta Europe ETF | | May 12, 2015 | |
| Global X Scientific Beta Asia ex-Japan ETF | | May 12, 2015 | |
| Global X Scientific Beta Japan ETF | | May 12, 2015 | |
| Global X YieldCo Index ETF | | May 27, 2015 | |
Disclosure of Fund Expenses (Unaudited)
All Exchange Traded Funds (“ETF”) have operating expenses. As a shareholder of an ETF, your investment is affected by these ongoing costs, which include (among others) costs for ETF management, administrative services, commissions, and shareholder reports like this one. It is important for you to understand the impact of these costs on your investment returns. In addition, a shareholder is responsible for brokerage fees as a result of their investment in a Fund.
Operating expenses such as these are deducted from an ETF’s gross income and directly reduce its final investment return. These expenses are expressed as a percentage of the ETF’s average net assets; this percentage is known as the ETF’s expense ratio.
The following examples use the expense ratio and are intended to help you understand the ongoing costs (in dollars) of investing in your Fund and to compare these costs with those of other funds. The examples are based on an investment of $1,000 made at the beginning of the period shown and held for the entire period from November 1, 2014 through April 30, 2015.
The table on the next page illustrates your Fund’s costs in two ways:
Actual Fund Return. This section helps you to estimate the actual expenses that your Fund incurred over the period. The “Expenses Paid During Period” column shows the actual dollar expense cost incurred by a $1,000 investment in the Fund, and the “Ending Account Value” number is derived from deducting that expense cost from the Fund’s gross investment return.
You can use this information, together with the actual amount you invested in the Funds, to estimate the expenses you paid over that period. Simply divide your actual account value by $1,000 to arrive at a ratio (for example, an $8,600 account value divided by $1,000 = 8.6), then multiply that ratio by the number shown for your Fund under “Expenses Paid During Period.”
Hypothetical 5% Return. This section helps you compare your Fund’s costs with those of other funds. It assumes that the Funds had an annual 5% return before expenses during the year, but that the expense ratio (Column 3) for the period is unchanged. This example is useful in making comparisons because the Securities and Exchange Commission requires all funds to make this 5% calculation. You can assess your Fund’s comparative cost by comparing the hypothetical result for your Fund in the “Expenses Paid During Period” column with those that appear in the same charts in the shareholder reports for other funds.
NOTE: Because the return is set at 5% for comparison purposes — NOT your Fund’s actual return — the account values shown may not apply to your specific investment.
Disclosure of Fund Expenses (Unaudited) (concluded)
| | | Beginning
Account
Value
11/1/2014 | | | Ending
Account
Value
4/30/2015 | | | Annualized
Expense
Ratios | | | Expenses
Paid
During
Period(1) | |
| Global X SuperDividend® ETF |
| Actual Fund Return | | $ | 1,000.00 | | | $ | 1,020.30 | | | | 0.58 | % | | $ | 2 .91 | |
| Hypothetical 5% Return | | | 1,000.00 | | | | 1,021.92 | | | | 0.58 | | | | 2 .91 | |
| Global X SuperDividend® U.S. ETF |
| Actual Fund Return | | $ | 1,000.00 | | | $ | 992.70 | | | | 0.45 | % | | $ | 2 .22 | |
| Hypothetical 5% Return | | | 1,000.00 | | | | 1,022.56 | | | | 0.45 | | | | 2 .26 | |
| Global X SuperDividend® Emerging Markets ETF |
| Actual Fund Return(2) | | $ | 1,000.00 | | | $ | 1,229.50 | | | | 0.65 | % | | $ | 0 .89 | |
| Hypothetical 5% Return | | | 1,000.00 | | | | 1,021.57 | | | | 0.65 | | | | 3 .26 | |
| Global X SuperDividend® REIT ETF |
| Actual Fund Return(2) | | $ | 1,000.00 | | | $ | 1,007.90 | | | | 0.58 | % | | $ | 0 .72 | |
| Hypothetical 5% Return | | | 1,000.00 | | | | 1,021.92 | | | | 0.58 | | | | 2 .91 | |
| Global X SuperIncome™ Preferred ETF |
| Actual Fund Return | | $ | 1,000.00 | | | $ | 1,025.70 | | | | 0.58 | % | | $ | 2 .91 | |
| Hypothetical 5% Return | | | 1,000.00 | | | | 1,021.92 | | | | 0.58 | | | | 2 .91 | |
| Global X Social Media Index ETF |
| Actual Fund Return | | $ | 1,000.00 | | | $ | 1,053.90 | | | | 0.65 | % | | $ | 3 .31 | |
| Hypothetical 5% Return | | | 1,000.00 | | | | 1,021.57 | | | | 0.65 | | | | 3 .26 | |
| Global X | JPMorgan Efficiente Index ETF |
| Actual Fund Return | | $ | 1,000.00 | | | $ | 1,027.50 | | | | 0.69 | % | | $ | 3 .47 | |
| Hypothetical 5% Return | | | 1,000.00 | | | | 1,021.37 | | | | 0.69 | | | | 3 .46 | |
| Global X | JPMorgan US Sector Rotator Index ETF |
| Actual Fund Return | | $ | 1,000.00 | | | $ | 974.90 | | | | 0.69 | % | | $ | 3 .38 | |
| Hypothetical 5% Return | | | 1,000.00 | | | | 1,021.37 | | | | 0.69 | | | | 3 .46 | |
| Global X Permanent ETF |
| Actual Fund Return | | $ | 1,000.00 | | | $ | 1,022.60 | | | | 0.48 | % | | $ | 2 .41 | |
| Hypothetical 5% Return | | | 1,000.00 | | | | 1,022.41 | | | | 0.48 | | | | 2 .41 | |
| Global X Guru™ Index ETF |
| Actual Fund Return | | $ | 1,000.00 | | | $ | 1,023.50 | | | | 0.75 | % | | $ | 3 .76 | |
| Hypothetical 5% Return | | | 1,000.00 | | | | 1,021.08 | | | | 0.75 | | | | 3 .76 | |
| Global X Guru™ Activist Index ETF |
| Actual Fund Return(3) | | $ | 1,000.00 | | | $ | 991.40 | | | | 0.75 | % | | $ | 0 .06 | |
| Hypothetical 5% Return | | | 1,000.00 | | | | 1,021.08 | | | | 0.75 | | | | 3 .76 | |
| Global X Guru™ International Index ETF |
| Actual Fund Return | | $ | 1,000.00 | | | $ | 976.60 | | | | 0.75 | % | | $ | 3 .68 | |
| Hypothetical 5% Return | | | 1,000.00 | | | | 1,021.08 | | | | 0.75 | | | | 3 .76 | |
| Global X Guru™ Small Cap Index ETF |
| Actual Fund Return | | $ | 1,000.00 | | | $ | 960.30 | | | | 0.75 | % | | $ | 3 .65 | |
| Hypothetical 5% Return | | | 1,000.00 | | | | 1,021.08 | | | | 0.75 | | | | 3 .76 | |
| Global X GF China Bond ETF |
| Actual Fund Return(4) | | $ | 1,000.00 | | | $ | 1,003.30 | | | | 0.50 | % | | $ | 2 .25 | |
| Hypothetical 5% Return | | | 1,000.00 | | | | 1,022.32 | | | | 0.50 | | | | 2 .51 | |
| (1) | Expenses are equal to the Fund’s annualized expense ratio multiplied by the average account value over the period, multiplied by 181/365 (to reflect the one-half year period.) |
| (2) | Expenses are equal to the Fund’s annualized expense ratio multiplied by the average account value over the period, multiplied by 45/365 (to reflect the period from inception to date.) |
| (3) | Expenses are equal to the Fund’s annualized expense ratio multiplied by the average account value over the period, multiplied by 3/365 (to reflect the period from inception to date.) |
| (4) | Expenses are equal to the Fund’s annualized expense ratio multiplied by the average account value over the period, multiplied by 164/365 (to reflect the period from inception to date.) |
APPROVAL OF INVESTMENT ADVISORY AGREEMENT(Unaudited)
Section 15(c) of the Investment Company Act of 1940, as amended ("1940 Act"), requires that the board of trustees (the “Board”) of Global X Funds (the “Trust”), including a majority of those trustees who are not "interested persons," as defined in the 1940 Act ("Independent Trustees"), consider on an initial basis and periodically thereafter, at an in-person meeting called for such purpose, the terms of each fund’s investment advisory agreement and whether to approve entering into, or renewing, each such agreement.
At a quarterly Board meeting held on November 14, 2014, the Board (including the Trust’s Independent Trustees voting separately) considered and unanimously approved the continuation of (i) the Investment Advisory Agreement ("Renewal Investment Advisory Agreement") for each Fund covered by this Semi-Annual Report (other than the Global X SuperDividend Emerging Markets ETF) (each a "Renewal Fund") and (ii) the Supervision and Administration Agreement ("Renewal Supervision and Administration Agreement"), on behalf of each Renewal Fund, between the Trust and Global X Management Company ("Global X Management"). The Board (including the Trust’s Independent Trustee voting separately) also considered and unanimously approved the continuation of the Investment Sub-Advisory Agreement (“Renewal Subadvisory Agreement”) between Global X Management and GF International Investment Management Limited (“GFI”). The Renewal Investment Advisory Agreement, the Renewal Supervision and Administration Agreement and Renewal Subadvisory Agreement are collectively referred to herein as the "Renewal Agreements."
At the same meeting, the Board (including the Trust’s Independent Trustees voting separately) also initially considered and unanimously approved (i) the initial Investment Advisory Agreement (“Initial Investment Advisory Agreement”) for the Global X SuperDividend Emerging Markets ETF (the “New Fund”) and (ii) the Supervision and Administration Agreement (“Initial Supervision and Administration Agreement”), on behalf of the New Fund, between the Trust and Global X Management. The Initial Investment Advisory Agreement and the Initial Supervision and Administration Agreement are collectively referred to herein as the “New Fund Agreements.”
In advance of the Board meeting, the Board (including the Trust’s Independent Trustees) and the Independent Trustees’ independent legal counsel requested (in writing) information from Global X Management and GFI in connection with the Board’s consideration of the Renewal Agreements and the New Fund Agreements, and the Board received and reviewed written responses from Global X Management and GFI and supporting materials relating to those requests for information. In the course of their consideration of the Renewal Agreements and the New Fund Agreements, the Trust’s Independent Trustees were advised by their counsel and, in addition to meeting with management of Global X Management, they met separately in executive session with their counsel.
In determining to approve the New Fund Agreements for the New Fund and the continuation of the Renewal Agreements for each Renewal Fund, the Board considered a variety of factors, including but not limited to the factors discussed in greater detail below. After full consideration of the factors below, as well as other factors that were instructive in their consideration, the Board,
APPROVAL OF INVESTMENT ADVISORY AGREEMENT(unaudited)(continued)
including all of the Trust’s Independent Trustees voting separately, concluded that the New Fund Agreements and the Renewal Agreements were fair and reasonable and in the best interests of the New Fund and each Renewal Fund, respectively, and their respective shareholders.
In reaching this decision, the Board did not assign relative weights to the factors discussed below nor did the Board deem any one factor or group of factors to be determinative. Each member of the Board may have afforded different weight to the various factors.
NEW FUND AGREEMENTS
Nature, Extent and Quality of Services
With respect to this factor, the Board considered:
| • | the terms of the New Fund Agreements and the range of services to be provided to the New Fund in accordance with the New Fund Agreements; |
| • | Global X Management’s key personnel and the portfolio managers who would provide investment advisory services to the New Fund; |
| • | Global X Management’s responsibilities under the New Fund Agreements, including, among other things, to (i) manage the investment operations of the New Fund and the composition of the New Fund’s assets, including the purchase, retention and disposition of its holdings, (ii) provide quarterly reports to the Trust’s officers and the Board and other reports as the Board deems necessary or appropriate, (iii) vote proxies, exercise consents, and exercise all other rights relating to securities and assets held by the New Fund, (iv) select broker-dealers to execute portfolio transactions for the New Fund when necessary, (v) assist in the preparation and filing of reports and proxy statements (if any) for the shareholders of the New Fund, the periodic updating of the registration statement, prospectuses, statements of additional information, and other reports and documents for the New Fund that are required to be filed by the Trust with the Securities and Exchange Commission ("SEC") and other regulatory or governmental bodies, and (vi) monitor anticipated purchases and redemptions of the shares (including creation units) of the New Fund by shareholders and new investors; |
| • | the nature, extent and quality of the services (including advisory, administrative and compliance services) that have been provided by or made available to each Renewal Fund and that would be made available to the New Fund; and |
| • | the quality of Global X Management’s resources and personnel that would be made available to the New Fund, including Global X Management’s experience and the professional qualifications of Global X Management’s key personnel. |
APPROVAL OF INVESTMENT ADVISORY AGREEMENT(unaudited)(continued)
Based on these considerations, the Board concluded that, in the exercise of its business judgment, the nature, extent and quality of the services to be provided to the New Fund by Global X Management were fair and reasonable.
Performance
The Board determined that, because the New Fund had not commenced operations, meaningful data relating to the investment performance of the New Fund was not available and, therefore, could not be a factor in approving the New Fund Agreements.
Cost of Services and Profitability
With respect to this factor, the Board considered:
| • | Global X Management’s expected costs in providing investment management, supervisory, administrative and related services to the New Fund; |
| • | The unitary fee (including the proposed investment advisory fee) ("Management Fee") proposed to be borne by the New Fund under the New Fund Agreements for the various investment advisory, supervisory and administrative services that the New Fund requires under a unitary fee structure (including the types of fees and expenses that are not included within the unitary fee and would be borne by the New Fund); and |
| • | the expected profitability to Global X Management, if any, from all services to be provided to the New Fund, as well as all aspects of the relationship between Global X Management and the New Fund. |
Based on these considerations, the Board concluded that, in the exercise of its business judgment, the Management Fee proposed to be paid by the New Fund to Global X Management, as well as the profits expected to be realized by Global X Management from its relationship with the New Fund, was reasonable and in the best interests of the New Fund and its shareholders.
Comparison of Fees and Services
With respect to this factor, the Board considered:
| • | comparative information with respect to the proposed Management Fee to be paid to Global X Management by the New Fund. In connection with this consideration, Global X Management provided the Board with comparative expense data for the New Fund, including fees and expenses paid by unaffiliated comparable specialized and/or focused exchange-traded funds and/or other registered funds, as well as fees and expenses paid by other funds that are series of the Trust under the same unitary Management Fee structure; |
| • | the structure of the proposed unitary Management Fee (which includes as one component the proposed investment advisory fee for the New Fund) and the expected total expense |
APPROVAL OF INVESTMENT ADVISORY AGREEMENT(unaudited)(continued)
ratio for the New Fund. In this regard, the Board took into consideration that the purpose of adopting a unitary Management Fee structure for the New Fund was to create a simple, all-inclusive fee that would provide a level of predictability with respect to the overall expense ratio (i.e., the total fees) of the New Fund and that the proposed Management Fee for the New Fund was set at a competitive rate to make the New Fund viable in the marketplace; and
| • | that Global X Management would be responsible for most ordinary expenses of the New Fund, including the costs of various third-party services required by the New Fund, including investment advisory, administrative, audit, certain custody, portfolio accounting, legal, transfer agency and printing costs, but that the New Fund would bear other expenses not covered under the proposed unitary Management Fee, such as taxes, brokerage fees, commissions, and other transaction expenses, interest expenses, and extraordinary expenses. |
Based on these considerations and comparisons regarding fees and services, the Board concluded that, in the exercise of its business judgment, it would be in the best interests of the New Fund and its shareholders to approve the New Fund Agreements.
Economies of Scale
With respect to this factor, the Board considered:
| • | the extent to which economies of scale would be realized as the New Fund grows and whether the proposed unitary Management Fee for the New Fund reflects these economies of scale; |
| • | the significant investment of time, personnel and other resources that Global X Management intends to made in the New Fund in order to seek to assure that the New Fund is attractive to investors; and |
| • | that the proposed unitary Management Fee would provide a high level of certainty as to the total level of expenses for the New Fund and its shareholders. |
Based on these considerations regarding economies of scale, the Board concluded that, in the exercise of its business judgment, it would be in the best interests of the New Fund and its shareholders to approve the New Fund Agreements.
Other Benefits
The Board also considered any other benefits that may be realized by Global X Management as a result of its relationships with the New Fund. As a result, the Board concluded that, in the exercise of its business judgment, all information it considered supported approval of the New Fund Agreements.
APPROVAL OF INVESTMENT ADVISORY AGREEMENT(unaudited)(continued)
RENEWAL AGREEMENTS
Nature, Extent and Quality of Services
With respect to this factor, the Board considered:
| • | the terms of the Renewal Agreements and the range of services that would continue to be provided to each Renewal Fund in accordance with the Renewal Agreements; |
| • | Global X Management’s and GFI’s key personnel and the portfolio managers who would continue to provide investment advisory, supervision and administrative services to each Renewal Fund, as applicable; |
| • | Global X Management’s responsibilities under the Renewal Agreements, including, among other things, to: (i) manage the investment operations of each Renewal Fund and the composition of each Renewal Fund’s assets, including the purchase, retention and disposition of its holdings, (ii) provide quarterly reports to the Trust’s officers and the Board and other reports as the Board deems necessary or appropriate, (iii) vote proxies, exercise consents, and exercise all other rights relating to securities and assets held by each Renewal Fund, (iv) select broker-dealers to execute portfolio transactions for each Renewal Fund when necessary, (v) assist in the preparation and filing of reports and proxy statements (if any) for the shareholders of each Renewal Fund, the periodic updating of the registration statement, prospectuses, statements of additional information, and other reports and documents for each Renewal Fund that are required to be filed by the Trust with the SEC and other regulatory and governmental bodies, and (vi) monitor anticipated purchases and redemptions of the shares (including creation units) of each Renewal Fund by shareholders and new investors; |
| • | GFI’s responsibilities under the Renewal Subadvisory Agreements. |
| • | the nature, extent and quality of the services (including advisory, administrative and compliance services) that have been provided by Global X Management and GFI or made available to each Renewal Fund and the adequacy of Global X Management’s and GFI’s personnel resources that would continue to be made available to each Renewal Fund, as applicable; and |
| • | the quality of Global X Management’s and GFI’s resources and personnel that would be made available to each Renewal Fund, including Global X Management’s and GFI’s experience and the professional qualifications of Global X Management’s and GFI’s key personnel. |
APPROVAL OF INVESTMENT ADVISORY AGREEMENT(unaudited)(continued)
Based on these considerations, the Board concluded that, in the exercise of its business judgment, the nature, extent and quality of the services provided to each Renewal Fund by Global X Management and GFI were fair and reasonable.
Performance
With respect to this factor, the Board considered the total return and investment performance of each Renewal Fund (other than the Global X SuperDividend REIT ETF, Global X | JPMorgan Efficiente Index ETF, Global X | JP Morgan US Sector Rotator Index ETF, Global X Guru Activist Index ETF and Global X GF China Bond ETF) relative to (i) the performance of unaffiliated comparable specialized and/or focused exchange-traded funds and/or other registered funds in the same industry classification as each of the Renewal Funds, which performance information is publicly available from such registered funds as well as other third party sources; and (ii) the performance of other comparable funds and pertinent indexes.
Based on these considerations and comparisons, the Board concluded that, in the exercise of its business judgment, the investment performance of each Renewal Fund (other than the Global X SuperDividend REIT ETF, Global X | JPMorgan Efficiente Index ETF, Global X | JP Morgan US Sector Rotator Index ETF, Global X Guru Activist Index ETF and Global X GF China Bond ETF) supported the Board’s approval of the continuation of the Renewal Agreements.
The Board determined that, because the Global X | JPMorgan Efficiente Index ETF and Global X | JP Morgan US Sector Rotator Index ETF commenced operations less than a month prior to the November 14, 2014 Board meeting, and because the Global X SuperDividend REIT ETF, Global X Guru Activist Index ETF and Global X GF China Bond ETF had not commenced operations, meaningful data related to their investment performance was not available and, therefore, could not be a factor in approving the Renewal Agreements for the Global X SuperDividend REIT ETF, Global X | JPMorgan Efficiente Index ETF, Global X | JP Morgan US Sector Rotator Index ETF, Global X Guru Activist Index ETF and Global X GF China Bond ETF.
Cost of Services and Profitability
The Board considered Global X Management’s costs in providing investment management and related services to each Renewal Fund. In this regard, the Board considered the management fee (“Management Fee”) that has been borne or expected to be borne by each Renewal Fund under the Renewal Agreements for the various investment advisory, supervisory and administrative services that each Renewal Fund requires under a unitary fee structure (including the types of fees and expenses that are not included within the unitary fee and would be borne by each Renewal Fund). The Board took notice of the fact that Global X Management paid GFI directly from its assets, and that the Global X GF China Bond ETF did not pay compensation directly to GFI.
In addition, the Board considered the current and expected profitability to Global X Management from all services provided or expected to be provided to the Renewal Funds, as well as all aspects
APPROVAL OF INVESTMENT ADVISORY AGREEMENT(unaudited)(continued)
of Global X Management’s relationship with each of the Renewal Funds. In connection with these considerations, Global X Management provided the Board with financial information regarding its operations and services to the Renewal Funds and discussed with the Board its current and expected profitability with respect to the Renewal Funds.
Based on these considerations, the Board concluded that, in the exercise of its business judgment, the Management Fee paid by each Renewal Fund to Global X Management, as well as the profits anticipated to be realized by Global X Management from its relationship with each of the Renewal Funds, was reasonable and in the best interests of each Renewal Fund and its shareholders.
Comparison of Fees and Services
With respect to this factor, the Board considered:
| • | comparative information with respect to the Management Fee paid to Global X Management by each of the Renewal Funds. In connection with this consideration, Global X Management provided the Board with comparative expense data for each of the Renewal Funds, including fees and expenses paid by unaffiliated comparable specialized and/or focused exchange-traded funds and/or other comparable registered funds, as well as fees and expenses paid by other funds that are series of the Trust under the same unified Management Fee structure; |
| • | the structure of the unitary Management Fee (which includes, as one component, the investment advisory fee for each Renewal Fund) and the current total expense ratios for each of the Renewal Funds. In this regard, the Board took into consideration that the purpose of adopting a unitary Management Fee structure for the Renewal Funds was to create a simple, all-inclusive fee that would provide a level of predictability with respect to the overall expense ratio (i.e., the total fees) of each of the Renewal Funds and that the Management Fee for each Renewal Fund was set at a competitive rate to make each Renewal Fund viable in the marketplace; and |
| • | that Global X Management is responsible for most ordinary expenses of the Renewal Funds, including the costs of various third-party services required by the Renewal Funds, including investment advisory, administrative, audit, certain custody, portfolio accounting, legal, transfer agency and printing costs, but that each Renewal Fund bears other expenses not covered under the unitary Management Fee, such as asset-based custody fees for certain of the Renewal Funds, taxes, brokerage fees, commissions, and other transaction expenses, interest expenses, and extraordinary expenses. |
Based on these considerations and comparisons regarding fees and services, the Board concluded that, in the exercise of its business judgment, it would be in the best interests of each Renewal Fund and its shareholders to approve the Renewal Agreements.
APPROVAL OF INVESTMENT ADVISORY AGREEMENT(unaudited)(concluded)
Economies of Scale
With respect to this factor, the Board considered:
| • | the extent to which economies of scale would be realized as the Renewal Funds grow and whether the unitary Management Fee for each Renewal Fund reflected these economies of scale; |
| • | the significant investment of time, personnel and other resources that Global X Management and GFI have made and intends to make in the Renewal Funds in order to seek to assure that the Renewal Funds are attractive to investors; and |
| • | that the unitary Management Fee provides a high level of certainty as to the total level of expenses for the Renewal Funds and their shareholders. |
Based on these considerations regarding economies of scale, the Board concluded that, in the exercise of its business judgment, it would be in the best interests of each Renewal Fund and its shareholders to approve the continuation of the Renewal Agreements.
Other Benefits
The Board also considered any other benefits realized by Global X Management and GFI as a result of its relationships with each Renewal Fund. As a result, the Board concluded that, in the exercise of its business judgment, all information it considered supported approval of the continuation of the Renewal Agreements.
Supplemental Information (Unaudited)
Net asset value, or “NAV”, is the price per Share at which the Funds issue and redeem Shares. It is calculated in accordance with the standard formula for valuing mutual fund shares. The “Market Price” of the Funds generally is determined using the midpoint between the highest bid and the lowest offer on the stock exchange on which the Shares of the Funds are listed for trading, as of the time that the Funds’ NAV is calculated. The Funds’ Market Price may be at, above or below their NAV. The NAV of the Funds will fluctuate with changes in the market value of the Funds’ holdings. The Market Price of the Funds will fluctuate in accordance with changes in their NAV, as well as market supply and demand.
Premiums or discounts are the differences (expressed as a percentage) between the NAV and Market Price of the Funds on a given day, generally at the time NAV is calculated. A premium is the amount that the Funds are trading above the reported NAV, expressed as a percentage of the NAV. A discount is the amount that the Funds are trading below the reported NAV, expressed as a percentage of the NAV.
Further information regarding premiums and discounts is available on the Funds’ website at www.GlobalXFunds.com
NOTES
NOTES
623 Fifth Avenue, 15th floor
New York, NY 10022
1-888-GXFund-1
(1-888-493-8631)
www.globalxfunds.com
Investment Adviser and Administrator:
Global X Management Company LLC
623 Fifth Avenue, 15th floor
New York, NY 10022
Distributor:
SEI Investments Distribution Co.
One Freedom Valley Drive
Oaks, PA 19456
Sub-Administrator:
SEI Investments Global Funds Services
One Freedom Valley Drive
Oaks, PA 19456
Counsel for Global X Funds and the Independent Trustees:
K&L Gates LLP
1601 K Street N.W.
Washington, DC 20007
Custodian and Transfer Agent:
Brown Brothers Harriman & Co.
40 Water Street
Boston, MA 02109
Independent Registered Public Accounting Firm:
Ernst & Young LLP
2005 Market Street
Suite 700
Philadelphia, PA 19103
This information must be preceded or accompanied by a current prospectus for the Funds described.
GLX-SA-003-0400
Item 2. Code of Ethics.
Not applicable for semi-annual report.
Item 3. Audit Committee Financial Expert.
Not applicable for semi-annual report.
Item 4. Principal Accountant Fees and Services.
Not applicable for semi-annual report.
Item 5. Audit Committee of Listed Registrants.
Not applicable to open-end management investment companies.
Item 6. Schedule of Investments.
Not applicable.
Item 7. Disclosure of Proxy Voting Policies and Procedures for Closed-End Management Investment Companies.
Not applicable to open-end management investment companies.
Item 8. Portfolio Managers of Closed-End Management Investment Companies.
Not applicable to open-end management investment companies.
Item 9. Purchases of Equity Securities by Closed-End Management Company and Affiliated Purchasers.
Not applicable to open-end management investment companies.
Item 10. Submission of Matters to a Vote of Security Holders.
There have been no material changes.
Item 11. Controls and Procedures.
(a) The certifying officers, whose certifications are included herewith, have evaluated the registrant’s disclosure controls and procedures within 90 days of the filing date of this report. In their opinion, based on their evaluation, the registrant’s disclosure controls and procedures are adequately designed, and are operating effectively to ensure, that information required to be disclosed by the registrant in the reports it files or submits under the Securities Exchange Act of 1934 is recorded, processed, summarized and reported within the time periods specified in the Securities and Exchange Commission’s rules and forms.
(b) There were no significant changes in the registrant’s internal control over financial reporting that occurred during the second fiscal quarter of the period covered by this report that has materially affected, or is reasonably likely to materially affect, the registrant’s internal control over financial reporting.
Items 12. Exhibits.
(a)(1) Not applicable for semi-annual report.
(a)(2) A separate certification for the principal executive officer and the principal financial officer of the registrant as required by Rule 30a-2(a) under the Investment Company Act of 1940, as amended (17 CFR 270.30a-2(a)), are filed herewith.
(b) Officer certifications as required by Rule 30a-2(b) under the Investment Company Act of 1940, as amended (17 CFR 270.30a-2(b)) also accompany this filing as an Exhibit.
SIGNATURES
Pursuant to the requirements of the Securities Exchange Act of 1934 and the Investment Company Act of 1940, the registrant has duly caused this report to be signed on its behalf by the undersigned, thereunto duly authorized.
| (Registrant) | Global X Funds |
| |
| By (Signature and Title)* | /s/ Bruno del Ama | |
| | Bruno del Ama |
| | President |
| | |
| Date: July 08, 2015 | |
Pursuant to the requirements of the Securities Exchange Act of 1934 and the Investment Company Act of 1940, this report has been signed below by the following persons on behalf of the registrant and in the capacities and on the dates indicated.
| By (Signature and Title)* | /s/ Bruno del Ama |
| Bruno del Ama |
| | President |
| | |
| Date: July 08, 2015 | |
| | |
| By (Signature and Title)* | /s/ Bruno del Ama | |
| | Bruno del Ama |
| | Chief Financial Officer |
Date: July 08, 2015
* Print the name and title of each signing officer under his or her signature.