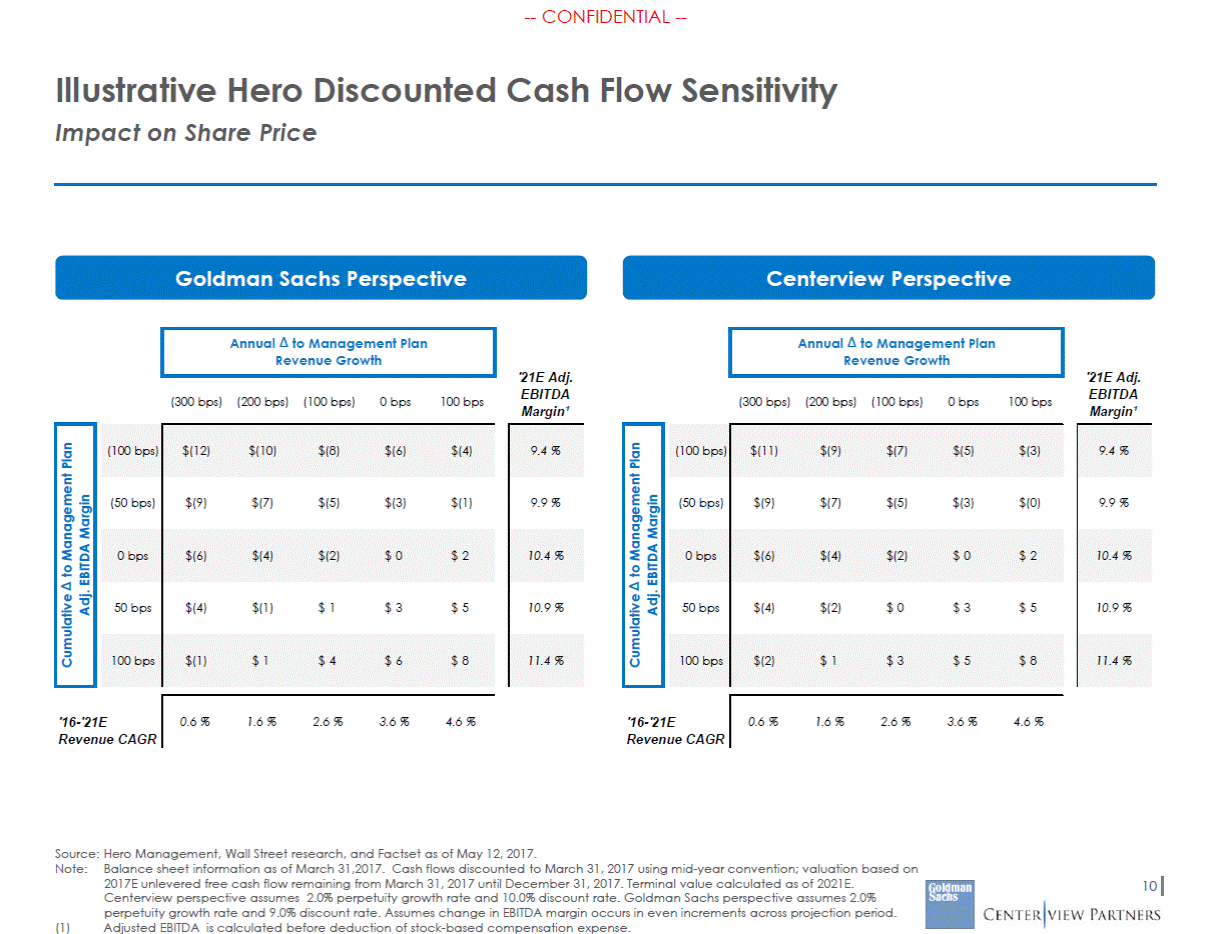
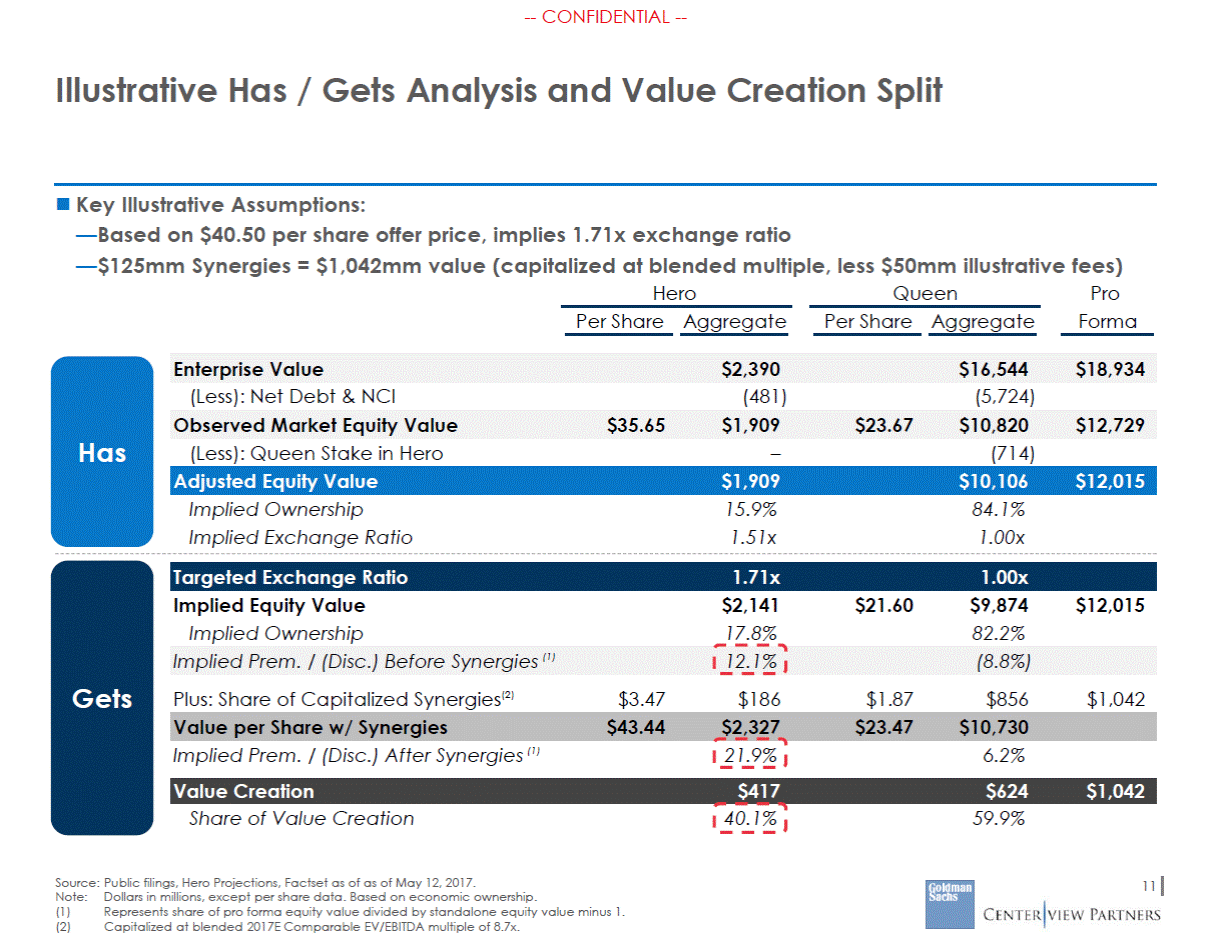
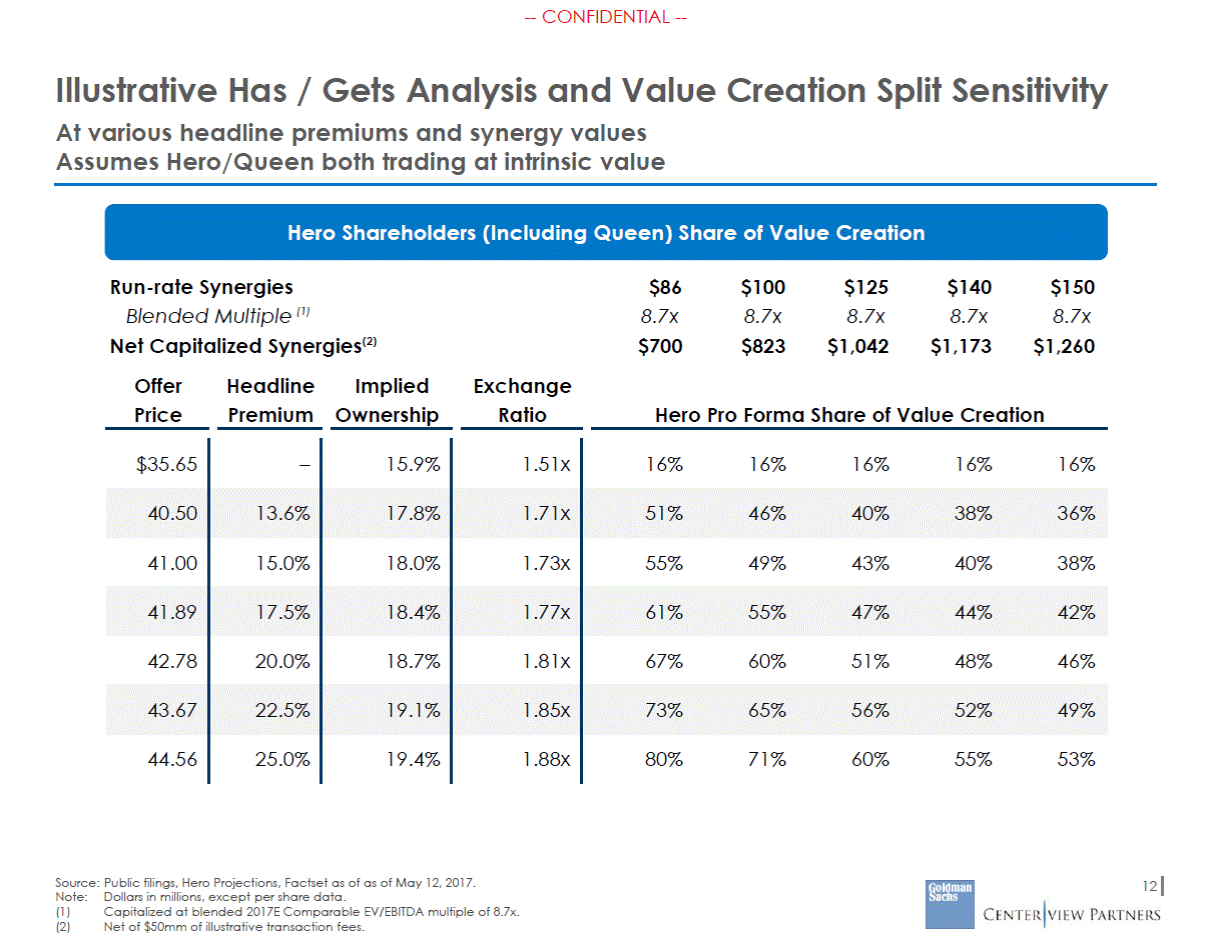
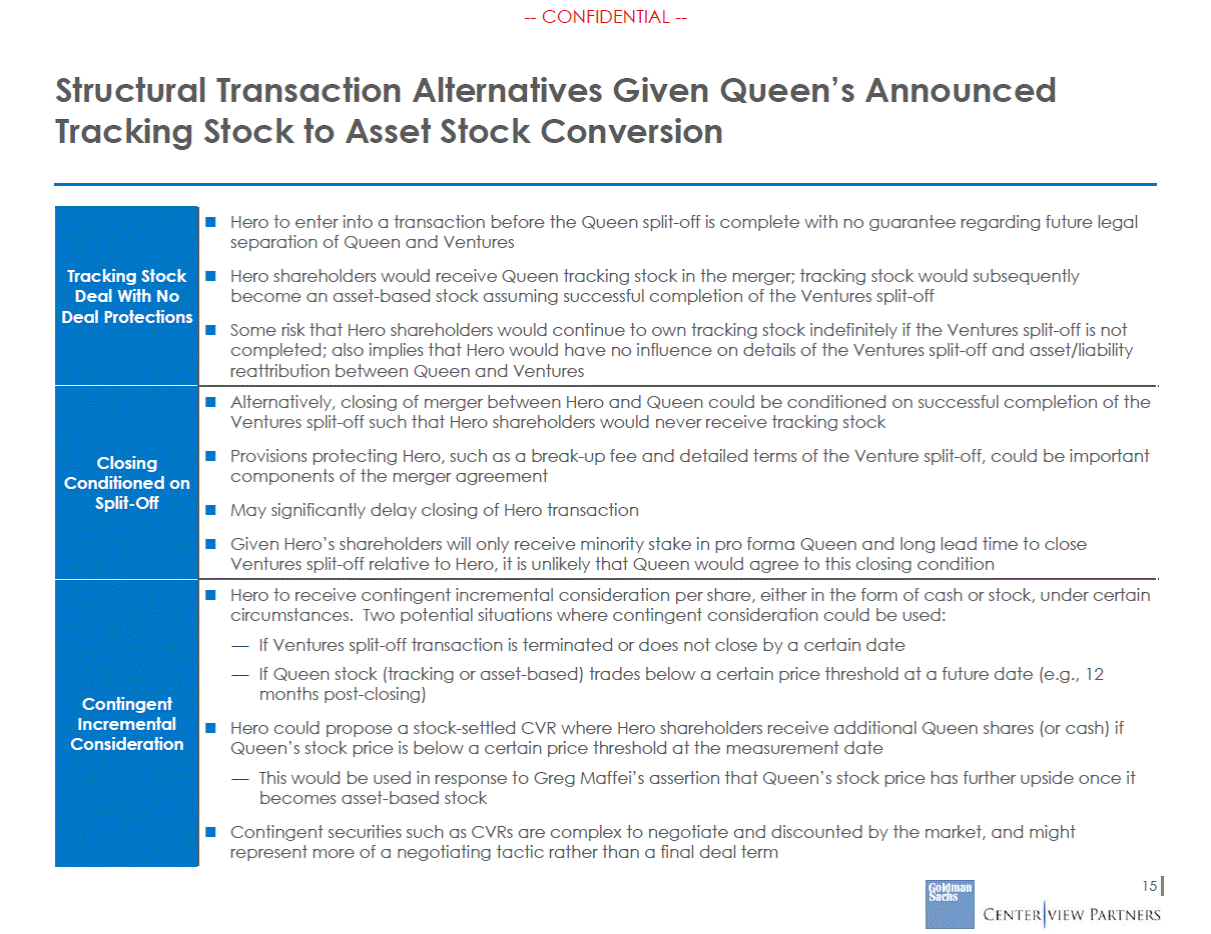
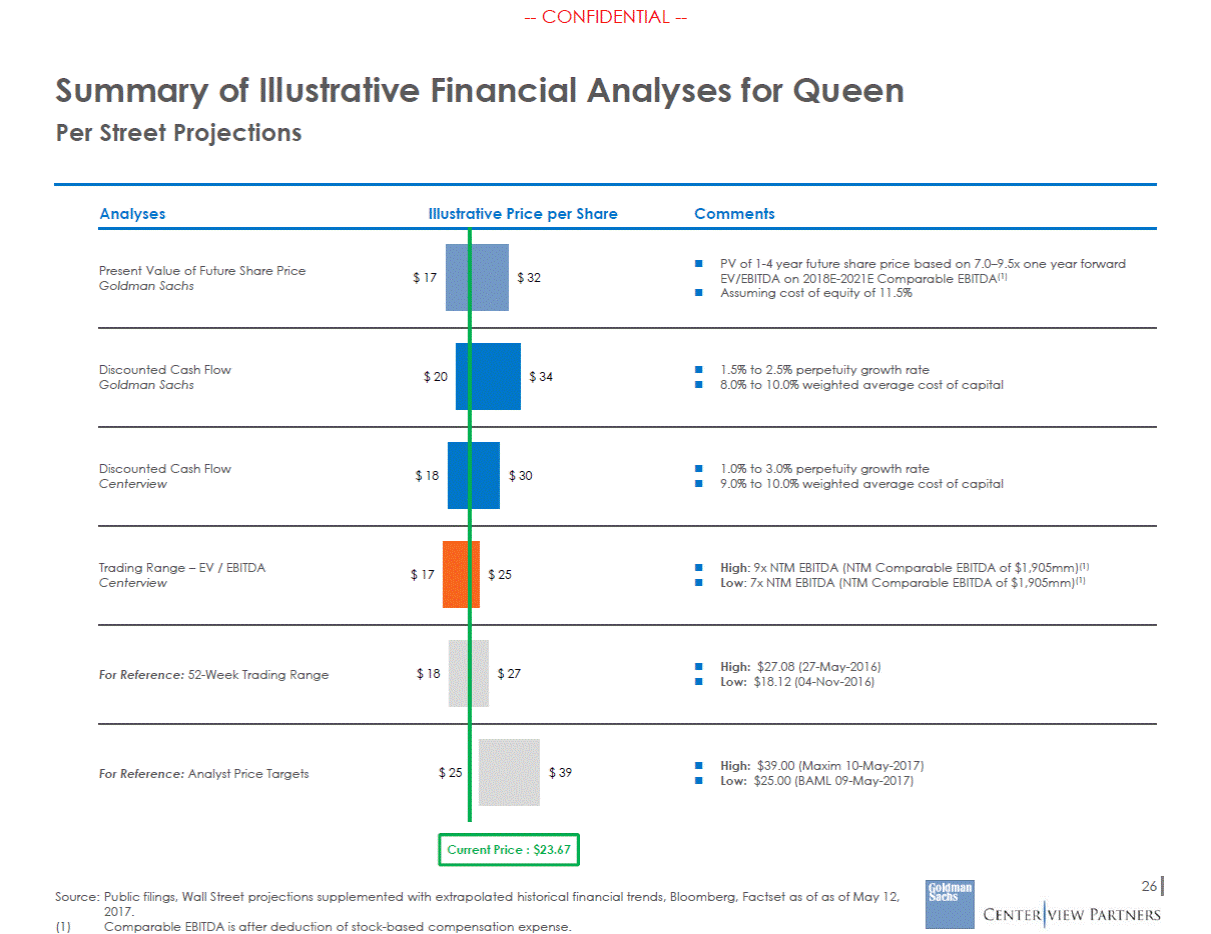
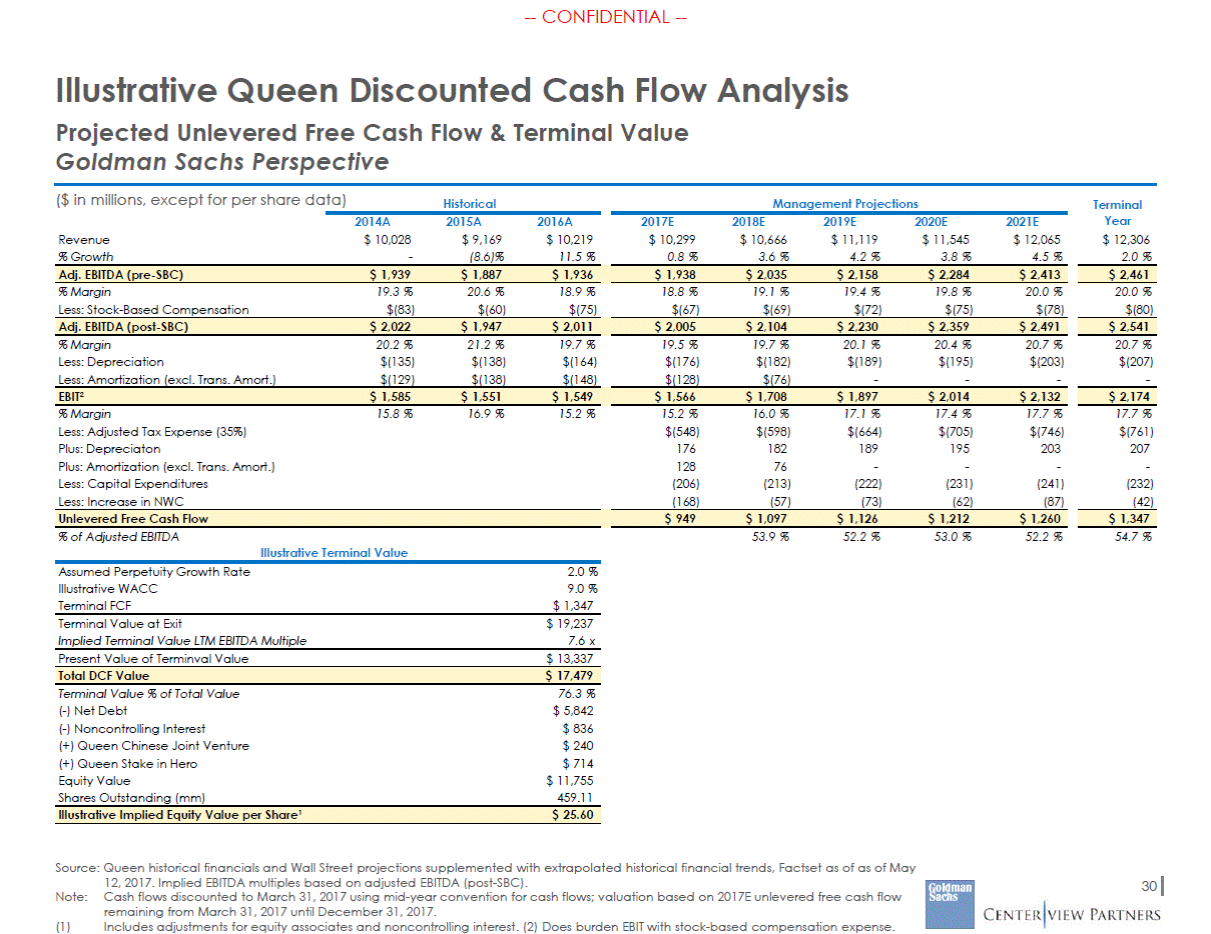
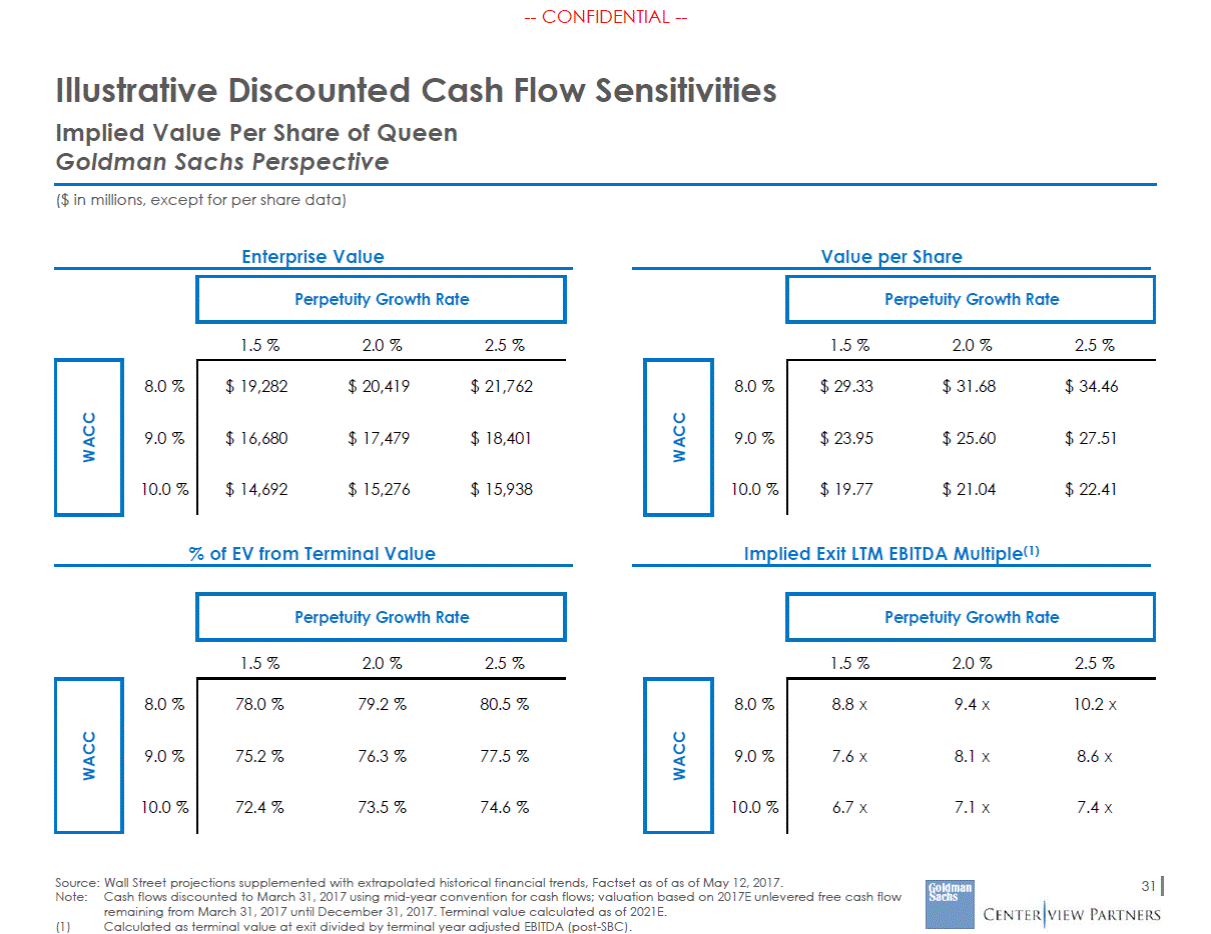
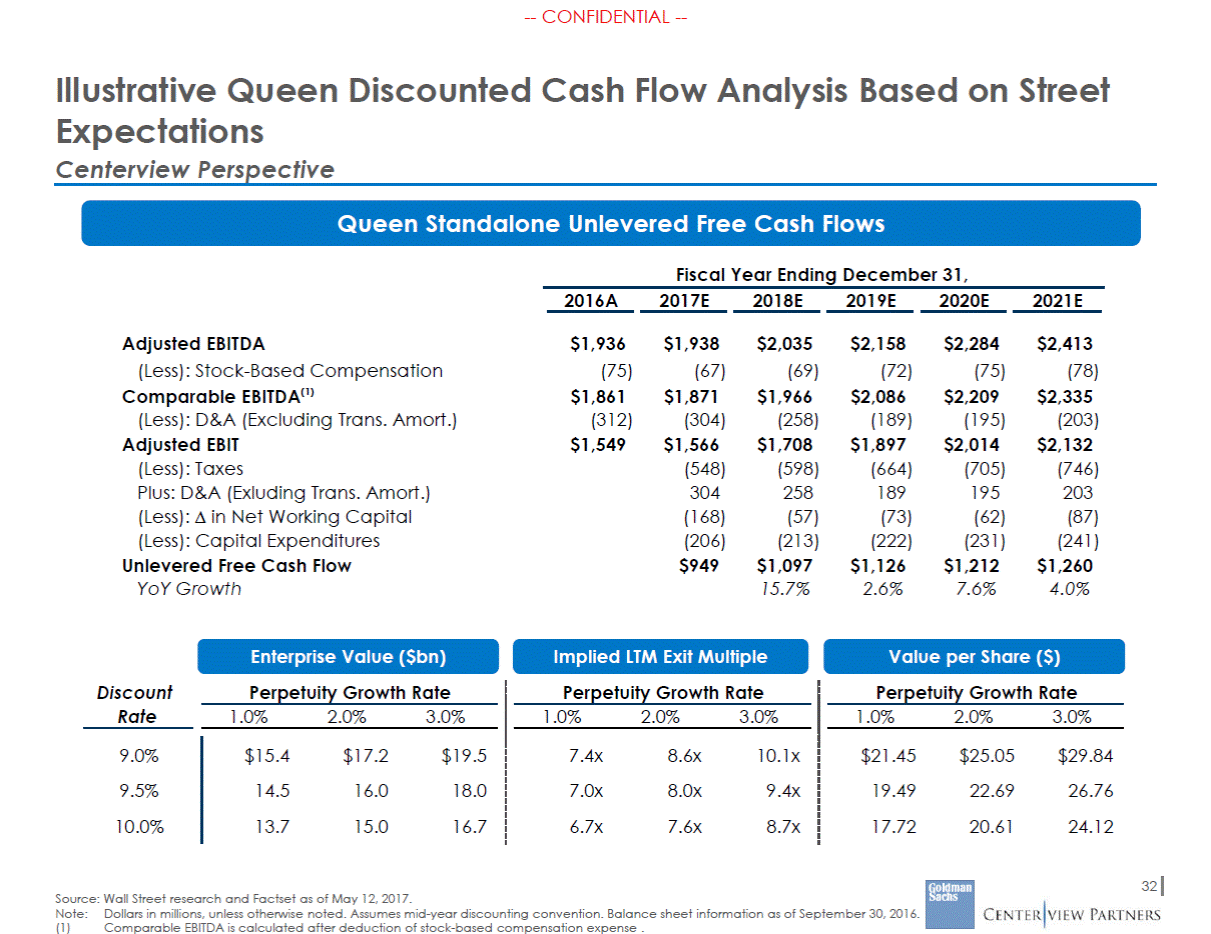
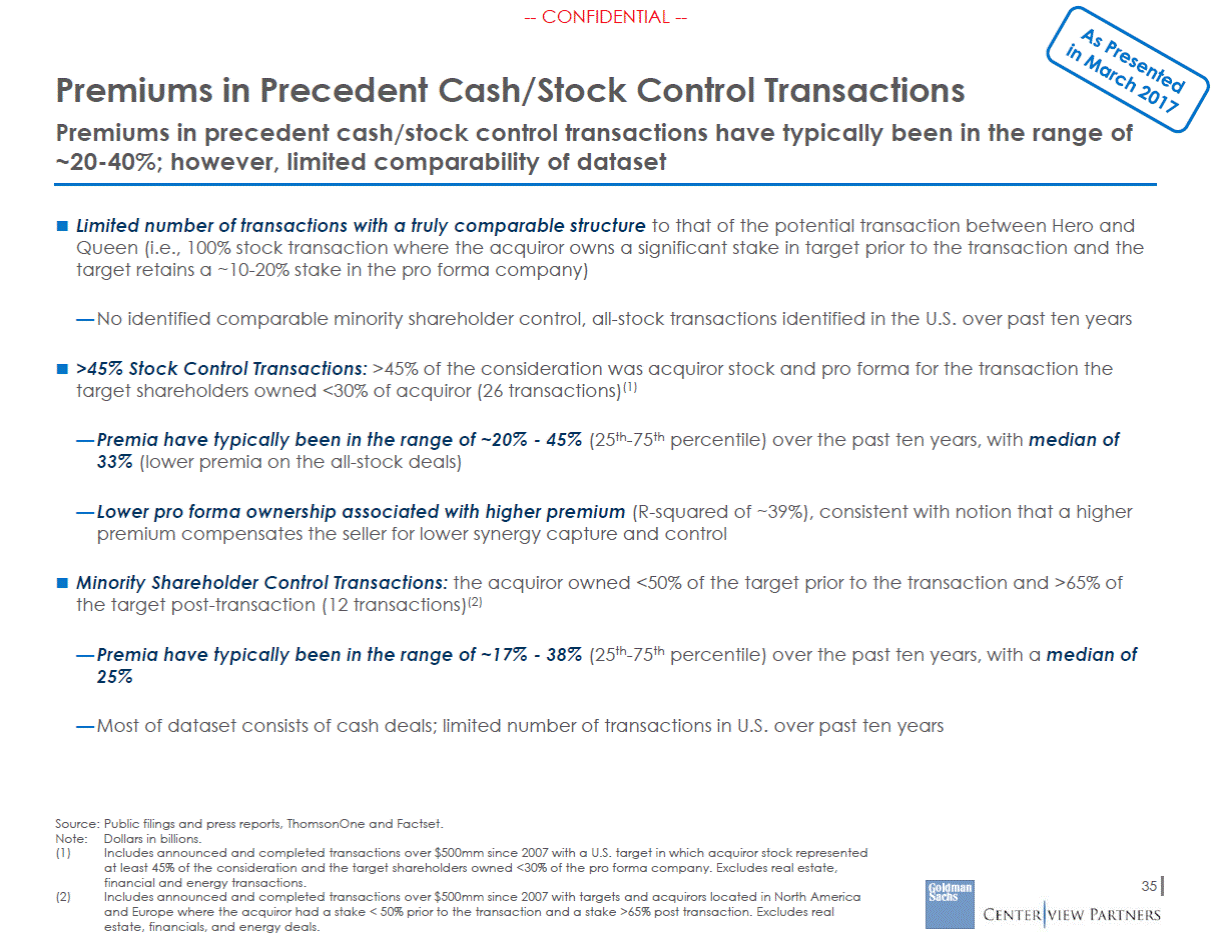
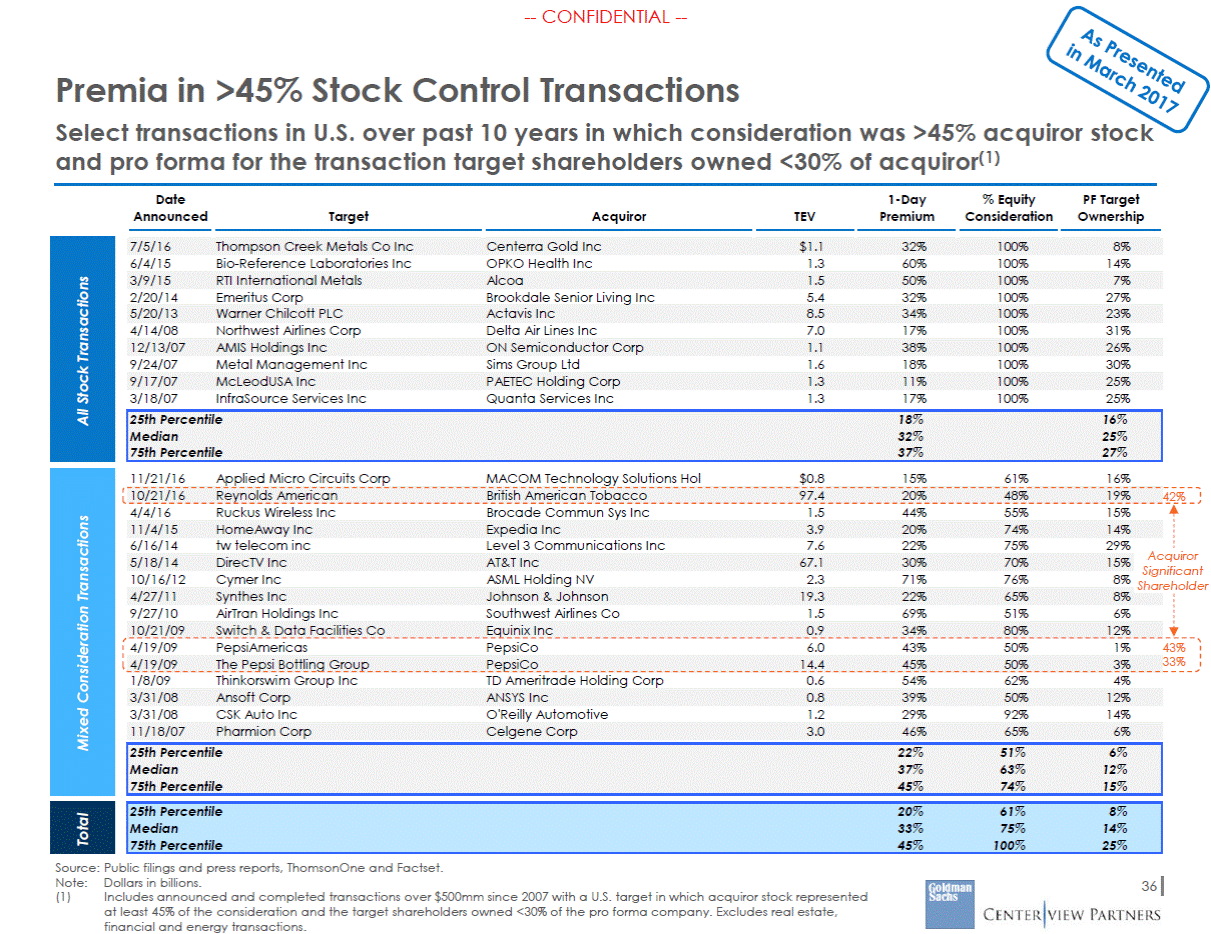
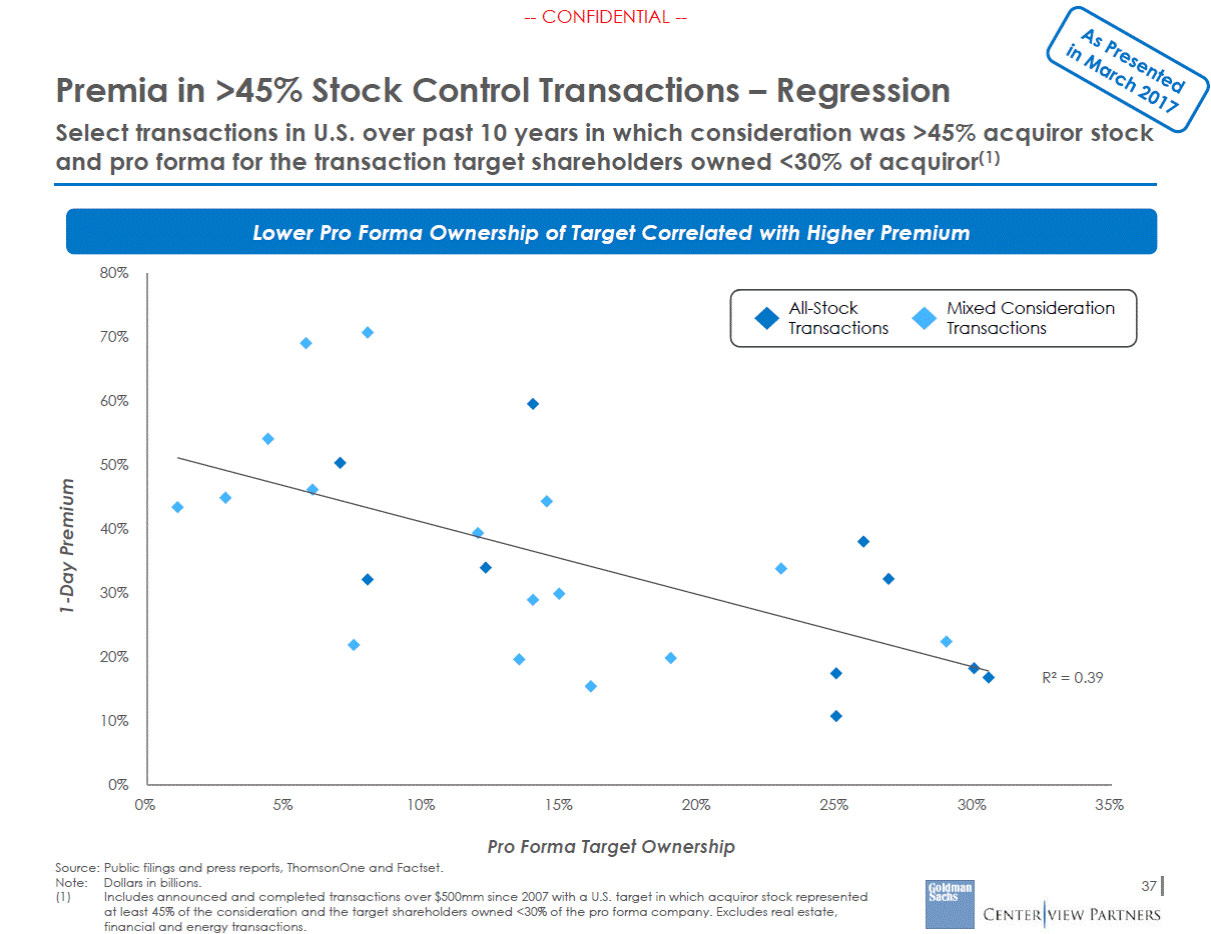
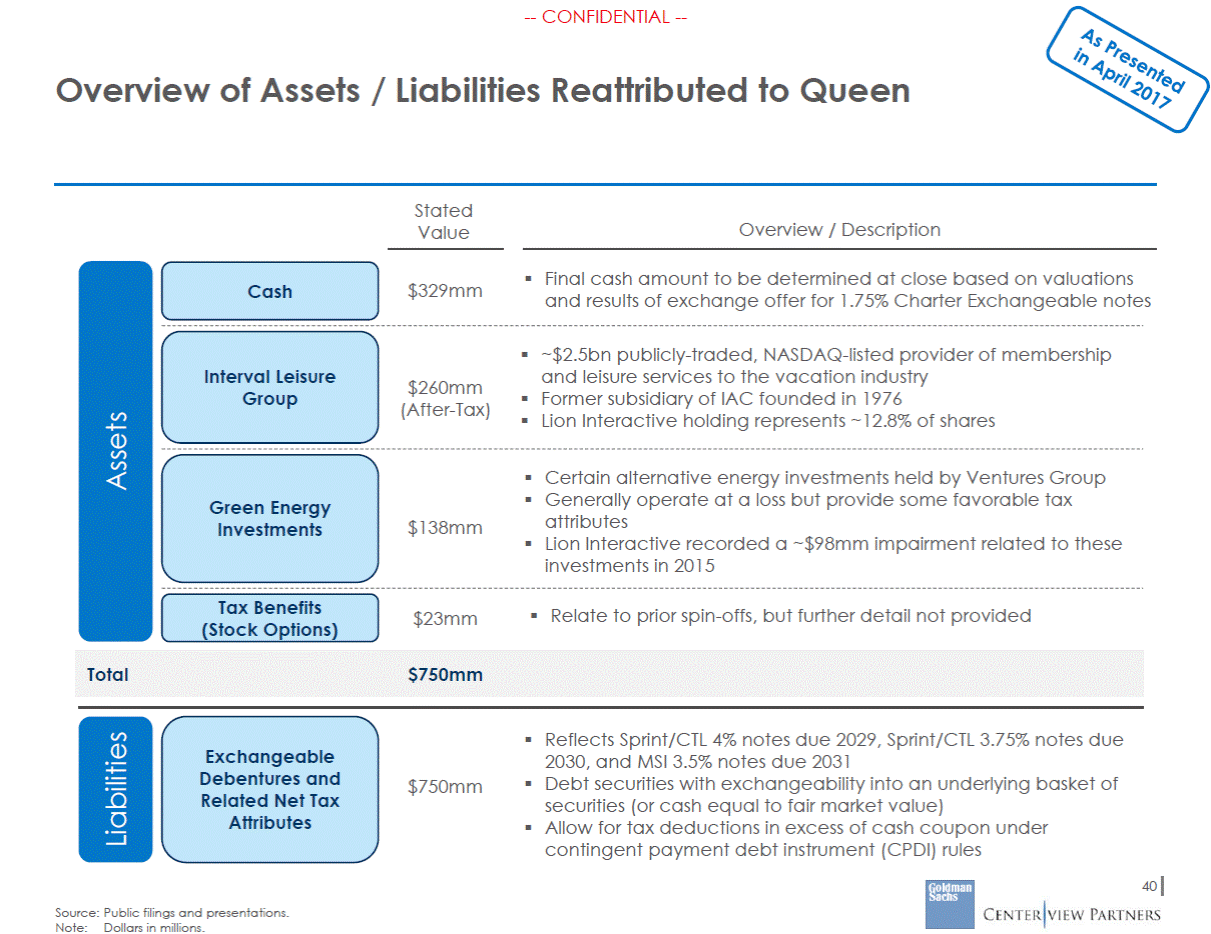
--CONFIDENTIAL --Queen Standalone Street Financials Historical Street Projections CAGR 2014A 2015A 2016A 2017E 2018E 2019E 2020E 2021E '14-16A '16-21E Gross Profit $3,650 $3,322 $3,577 $3,459 $3,591 $3,665 $3,817 $3,981 (1.0%) 2.2% (Less): Operating Expenses ($1,711) ($1,435) ($1,641) ($1,521) ($1,555) ($1,507) ($1,532) ($1,568) (Less): Stock-Based Comp. (Less): D&A (Less): Other Reported EBIT Plus: Equity Earnings / Other (Less): Net Interest Expense Pre-Tax Income (Less): Taxes Net Income (Less): NCI & Other Net Income to Queen Plus: Adjustments Adjusted Net Income to Queen (83) (587) (7) $1,262 (14) (312) $936 (306) $630 (54) $576 219 $795 (60) (657) – $1,170 91 (283) $978 (304) $674 (34) $640 238 $878 (75) (850) – $1,011 86 (289) $808 (297) $511 (38) $473 339 $812 (67) (694) – $1,176 49 (284) $941 (329) $612 (35) $577 254 $830 (69) (434) – $1,532 57 (291) $1,298 (454) $844 (48) $796 114 $910 (72) (311) – $1,775 64 (290) $1,549 (542) $1,007 (57) $949 79 $1,029 (75) (258) – $1,951 70 (284) $1,737 (608) $1,129 (64) $1,065 41 $1,105 (78) (222) – $2,113 77 (273) $1,916 (671) $1,245 (71) $1,174 12 $1,187 (10.5%) 15.9% 1.1% 7.9% Memo: Comparable EBITDA(2) $1,856 $1,827 $1,861 $1,871 $1,966 $2,086 $2,209 $2,335 0.1% 4.6% 28 Source: Wall Street research. (1) (2) Adjusted EBITDA is before deduction of stock based compensation expense. Comparable EBITDA is after deduction of stock-based compensation expense. Adjusted Diluted EPS $1.62 $1.83 $1.69 $1.87 $2.19 $2.64 $3.00 $3.39 2.2% 15.0% YoY Growth 13.0% (7.5%) 11.0% 16.9% 20.4% 13.7% 13.0% Adjusted EBITDA(1) $1,939 $1,887 $1,936 $1,938 $2,035 $2,158 $2,284 $2,413 (0.1%) 4.5% % Margin 19.3% 20.6% 18.9% 18.8% 19.1% 19.4% 19.8% 20.0% % of Sales 17.1% 15.7% 16.1% 14.8% 14.6% 13.6% 13.3% 13.0% % Margin 36.4% 36.2% 35.0% 33.6% 33.7% 33.0% 33.1% 33.0% Revenue $10,028 $9,169 $10,219 $10,299 $10,666 $11,119 $11,545 $12,065 0.9% 3.4% YoY Growth (8.6%) 11.5% 0.8% 3.6% 4.2% 3.8% 4.5%

