UNITED STATES
SECURITIES AND EXCHANGE COMMISSION
Washington D.C. 20549
FORM 10-Q
| | x | QUARTERLY REPORT PURSUANT TO SECTION 13 OR 15(d) OF THE SECURITIES EXCHANGE ACT OF 1934 |
For the quarterly period ended: March 31, 2016
or
| | ¨ | TRANSITION REPORT PURSUANT TO SECTION 13 OR 15(d) OF THE SECURITIES EXCHANGE ACT OF 1934 |
For the transition period from ______to______.
| | XG SCIENCES, INC. | |
| | (Exact name of registrant as
specified in its
charter) | |
| Michigan | | 333-209131 | | 20-4998896 |
(State or other jurisdiction of
incorporation or organization) | | (Commission File No.) | | (I.R.S. Employer Identification
No.) |
3101 Grand Oak Drive
Lansing, MI 48911
(Address of principal executive offices) (zip code)
(517) 703-1110
(Issuer Telephone number)
Indicate by check mark whether the registrant (1) has filed all reports required to be filed by Section 13 or 15(d) of the Securities Exchange Act of 1934 during the preceding 12 months (or for such shorter period that the registrant was required to file such reports), and (2) has been subject to such filing requirements for the past 90 days. Yesx No¨
Indicate by check mark whether the registrant has submitted electronically and posted on its corporate Web site, if any, every Interactive Data File required to be submitted and posted pursuant to Rule 405 of Regulation S-T (§232.405 of this chapter) during the preceding 12 months (or for such shorter period that the registrant was required to submit and post such files). Yes¨ Nox
Indicate by check mark whether the registrant is a large accelerated filer, an accelerated filer, a non-accelerated filer or a smaller reporting company filer. See definition of “accelerated filer” and “large accelerated filer” in Rule 12b-2 of the Exchange Act (Check one):
| Large Accelerated Filer¨ | Accelerated Filer¨ | Non-Accelerated Filer¨ | Smaller Reporting Companyx |
Indicate by check mark whether the registrant is a shell company as defined in Rule 12b-2 of the Exchange Act. Yes¨ Nox
As of May 10, 2016, there were 878,044 shares outstanding of the registrant’s common stock. As of March 31, 2016 there were 836,544 shares of common stock outstanding.
XG SCIENCES, INC.
FORM 10-Q
MARCH 31, 2016
INDEX
FORWARD-LOOKING STATEMENTS
The information in this Quarterly Report on Form 10-Q contains “forward-looking statements” and information within the meaning of Section 27A of the Securities Act of 1933, as amended (the “Securities Act”), and Section 21E of the Securities Exchange Act of 1934, as amended (the “Exchange Act”) relating to XG Sciences, Inc., a Michigan corporation and its subsidiary, XG Sciences IP, LLC, a Michigan corporation (collectively referred to as “we”, “us”, “our”, “XG Sciences”, “XGS”, or the “Company”), which are subject to the “safe harbor” created by those sections. These forward-looking statements include, but are not limited to, statements concerning our strategy, future operations, future financial position, future revenues, projected costs, prospects and plans and objectives of management. The words “anticipates,” “believes,” “estimates,” “expects,” “intends,” “may,” “plans,” “projects,” “will,” “would” and similar expressions are intended to identify forward-looking statements, although not all forward-looking statements contain these identifying words. We may not actually achieve the plans, intentions or expectations disclosed in our forward-looking statements and you should not place undue reliance on our forward-looking statements. These forward-looking statements involve known and unknown risks and uncertainties that could cause our actual results, performance or achievements to differ materially from those expressed or implied by the forward-looking statements, including, without limitation, the risks set forth under the section entitled “Risk Factors” in Amendment No. 4 to our Registration Statement on Form S-1 (File No. 333-209131) as filed with the Securities and Exchange Commission (the “SEC”) on April 12, 2016, and declared effective on April 13, 2016.
XG SCIENCES, INC.
CONDENSED CONSOLIDATED BALANCE SHEETS
| | | March 31,
2016 | | | December 31, 2015 | |
| | | (unaudited) | | | | |
| ASSETS | | | | | | | | |
| | | | | | | | | |
| CURRENT ASSETS | | | | | | | | |
| Cash | | $ | 532,491 | | | $ | 1,060,224 | |
| Accounts receivable, less allowance for doubtful accounts of $10,000 at March 31, 2016 and December 31, 2015 | | | 22,067 | | | | 54,413 | |
| Inventories | | | 215,673 | | | | 229,034 | |
| Other current assets | | | 223,834 | | | | 194,096 | |
| | | | 994,065 | | | | 1,537,767 | |
| Total current assets | | | | | | | | |
| | | | | | | | | |
| PROPERTY, PLANT AND EQUIPMENT, NET | | | 3,553,382 | | | | 3,753,248 | |
| | | | | | | | | |
| RESTRICTED CASH FOR LETTER OF CREDIT | | | 195,279 | | | | 195,206 | |
| | | | | | | | | |
| INTANGIBLE ASSETS, NET | | | 429,590 | | | | 411,789 | |
| | | | | | | | | |
| TOTAL ASSETS | | $ | 5,172,316 | | | $ | 5,898,010 | |
| | | | | | | | | |
| LIABILITIES AND STOCKHOLDERS’ DEFICIT | | | | | | | | |
| | | | | | | | | |
| CURRENT LIABILITIES | | | | | | | | |
| Accounts payable and other liabilities | | $ | 893,983 | | | $ | 704,177 | |
| Short-term promissory notes | | | 1,041,542 | | | | 497,324 | |
| Current portion of capital lease obligations | | | 193,286 | | | | 178,487 | |
| Total current liabilities | | | 2,128,811 | | | | 1,379,988 | |
| | | | | | | | | |
| LONG TERM LIABILITIES | | | | | | | | |
| Long term portion of capital lease obligations | | | 300,331 | | | | 354,483 | |
| Derivative liability - warrants | | | 8,167,213 | | | | 8,235,163 | |
| Total long term liabilities | | | 8,467,544 | | | | 8,589,646 | |
| | | | | | | | | |
| TOTAL LIABILITIES | | | 10,596,355 | | | | 9,969,634 | |
| | | | | | | | | |
| STOCKHOLDERS’ DEFICIT | | | | | | | | |
| Series A convertible preferred stock, 3,000,000 shares authorized, 1,807,836 and 1,800,696 shares issued and outstanding, liquidation value of $21,694,056 and $21,608,376 at March 31, 2016 and December 31, 2015, respectively | | | 21,377,583 | | | | 21,291,912 | |
| Series B Preferred Stock, 1,500,000 shares authorized, 269,987 shares issued and outstanding, liquidation value of $4,319,792 | | | 3,651,533 | | | | 3,651,533 | |
| Common stock, no par value, 25,000,000 shares authorized, 836,544 shares issued and outstanding | | | 8,565,225 | | | | 8,565,225 | |
| Additional paid in capital | | | 5,905,137 | | | | 5,791,074 | |
| Accumulated deficit | | | (44,923,517 | ) | | | (43,371,368 | ) |
| Total stockholders’ deficit | | | (5,424,039 | ) | | | (4,071,624 | ) |
| | | | | | | | | |
| TOTAL LIABILITIES AND STOCKHOLDERS’ DEFICIT | | $ | 5,172,316 | | | $ | 5,898,010 | |
See notes to unaudited condensed consolidated financial statements.
XG SCIENCES, INC.
CONDENSED CONSOLIDATED STATEMENTS OF OPERATIONS
FOR THE THREE MONTHS ENDED MARCH 31, 2016 AND 2015 (unaudited)
| | | 2016 | | | 2015 | |
| | | | | | | |
| REVENUES | | | | | | | | |
| Product sales | | $ | 59,742 | | | $ | 37,304 | |
| Grants | | | 21,310 | | | | 97,505 | |
| Licensing revenue | | | 25,000 | | | | 25,000 | |
| Total revenue | | | 106,052 | | | | 159,809 | |
| | | | | | | | | |
| COST OF GOODS SOLD | | | | | | | | |
| Direct costs | | | 32,032 | | | | 22,003 | |
| Unallocated manufacturing expenses | | | 343,716 | | | | 398,105 | |
| Total cost of goods sold | | | 375,748 | | | | 420,108 | |
| | | | | | | | | |
| GROSS (LOSS) | | | (269,696 | ) | | | (260,299 | ) |
| | | | | | | | | |
| OPERATING EXPENSES | | | | | | | | |
| Research and development | | | 216,350 | | | | 382,649 | |
| Sales, general and administrative | | | 1,096,220 | | | | 1,046,864 | |
| Total operating expenses | | | 1,312,570 | | | | 1,429,513 | |
| | | | | | | | | |
| OPERATING LOSS | | | (1,582,266 | ) | | | (1,689,812 | ) |
| | | | | | | | | |
| OTHER INCOME (EXPENSE) | | | | | | | | |
| Incentive refund and interest income | | | 24,153 | | | | 24,455 | |
| Interest expense | | | (83,801 | ) | | | (510,827 | ) |
| Gain from change in fair value of derivative liability – warrants | | | 89,765 | | | | 96,299 | |
| Total other income (expense) | | | 30,117 | | | | (390,073 | ) |
| | | | | | | | | |
| NET LOSS | | $ | (1,552,149 | ) | | $ | (2,079,885 | ) |
| | | | | | | | | |
WEIGHTED AVERAGE NUMBER OF SHARES OUTSTANDING – Basic and diluted | | | 836,544 | | | | 835,253 | |
| | | | | | | | | |
| NET LOSS PER SHARE – Basic and diluted | | $ | (1.86 | ) | | $ | (2.49 | ) |
See notes to unaudited condensed consolidated financial statements.
XG SCIENCES, INC.
CONDENSED CONSOLIDATED STATEMENT OF CHANGES IN STOCKHOLDERS’ (DEFICIT) (unaudited)
For The Three Months Ended March 31, 2016
| | | Preferred stock (A) | | | Preferred stock (B) | | | Common stock | | | Additional | | | | | | | |
| | | Shares | | | Amount | | | Shares | | | Amount | | | Shares | | | Amount | | | paid-in
capital | | | Accumulated
deficit | | | Total | |
Balances, December
31, 2015 | | | 1,800,696 | | | $ | 21,291,912 | | | | 269,987 | | | $ | 3,651,533 | | | | 836,544 | | | $ | 8,565,225 | | | $ | 5,791,074 | | | $ | (43,371,368 | ) | | $ | (4,071,624 | ) |
| Preferred stock issued to pay capital lease obligations | | | 7,140 | | | | 85,671 | | | | - | | | | - | | | | - | | | | - | | | | - | | | | - | | | | 85,671 | |
| Employee stock option expense | | | | | | | | | | | | | | | | | | | | | | | | | | | 114,063 | | | | | | | | 114,063 | |
| Net loss | | | - | | | | - | | | | - | | | | - | | | | - | | | | - | | | | - | | | | (1,552,149 | ) | | | (1,552,149 | ) |
| Balances, March 31, 2016 | | | 1,807,836 | | | $ | 21,377,583 | | | | 269,987 | | | $ | 3,651,533 | | | | 836,544 | | | $ | 8,565,225 | | | $ | 5,905,137 | | | $ | (44,923,517 | ) | | $ | (5,424,039 | ) |
See notes to unaudited condensed consolidated financial statements.
XG SCIENCES, INC.
CONDENSED CONSOLIDATED STATEMENTS OF CASH FLOWS
FOR THE THREE MONTHS ENDED MARCH 31, 2016 AND 2015 (unaudited)
| | | 2016 | | | 2015 | |
| CASH FLOWS FROM OPERATING ACTIVITIES | | | | | | | | |
| Net loss | | $ | (1,552,149 | ) | | $ | (2,079,885 | ) |
| Adjustments to reconcile net loss to net cash used in operating activities | | | | | | | | |
| Depreciation and amortization | | | 213,739 | | | | 213,768 | |
| Amortization of intangible assets | | | 7,035 | | | | 7,035 | |
| Stock based compensation expense | | | 114,063 | | | | 122,079 | |
| Non-cash interest expense | | | 83,762 | | | | 484,280 | |
| Gain from change in fair value of derivative liability - warrants | | | (89,765 | ) | | | (96,299 | ) |
| (Increase) Decrease in: | | | | | | | | |
| Accounts receivable | | | 32,346 | | | | (12,033 | ) |
| Inventory | | | 13,361 | | | | (87,478 | ) |
| Other current and non-current assets | | | (29,811 | ) | | | (35,343 | ) |
| Increase (Decrease) in: | | | | | | | | |
| Accounts payable and other liabilities | | | 189,804 | | | | 13,687 | |
| NET CASH USED IN OPERATING ACTIVITIES | | | (1,017,615 | ) | | | (1,470,189 | ) |
| | | | | | | | | |
| CASH FLOWS FROM INVESTING ACTIVITIES | | | | | | | | |
| Purchases of property and equipment | | | (13,873 | ) | | | (29,152 | ) |
| Purchases of intangible assets | | | (24,836 | ) | | | (9,475 | ) |
| NET CASH USED IN INVESTING ACTIVITIES | | | (38,709 | ) | | | (38,627 | ) |
| | | | | | | | | |
| CASH FLOWS FROM FINANCING ACTIVITIES | | | | | | | | |
| Advances on short-term notes | | | 530,000 | | | | - | |
| Repayments of capital lease obligations | | | (1,409 | ) | | | (15,102 | ) |
| Proceeds from issuance of common stock | | | - | | | | 14,000 | |
| NET CASH PROVIDED BY (USED IN) FINANCING ACTIVITIES | | | 528,591 | | | | (1,102 | ) |
| | | | | | | | | |
| NET DECREASE IN CASH | | | (527,733 | ) | | | (1,509,918 | ) |
| CASH AT BEGINNING OF PERIOD | | | 1,060,224 | | | | 2,088,866 | |
| | | | | | | | | |
| CASH AT END OF PERIOD | | $ | 532,491 | | | $ | 578,948 | |
| | | | | | | | | |
| SUPPLEMENTAL DISCLOSURE OF CASH FLOW INFORMATION: | | | | | | | | |
| Cash paid for interest | | $ | 40 | | | $ | 26,546 | |
| | | | | | | | | |
| SUPPLEMENTAL DISCLOSURE OF NON-CASH INVESTING AND FINANCING: | | | | | | | | |
| Value of preferred stock issued for AAOF capital lease obligations | | $ | 85,671 | | | $ | 85,671 | |
See notes to unaudited condensed consolidated financial statements.
XG SCIENCES, INC.
NOTES TO UNAUDITED CONDENSED CONSOLIDATED FINANCIAL STATEMENTS
March 31, 2016
NOTE 1 - NATURE OF BUSINESS AND BASIS OF PRESENTATION
XG Sciences, Inc., a Michigan company located in Lansing, Michigan and its subsidiary, XGS IP, LLC (collectively referred to as “we”, “us”, “our”, or the “Company”) manufactures graphene nanoplatelets made from graphite, using a proprietary manufacturing process to split natural flakes of crystalline graphite into very small and thin particles, which we sell as xGnP® graphene nanoplatelets. These particles are then used in products like battery electrodes, thin sheets, films, inks and coatings that we sell to other companies. We also sell our nanoparticles in the form of bulk powders or dispersions to other companies for use as additives to make composite and other materials with specially engineered characteristics. Additionally, we license our technology to other companies in exchange for royalties and other fees.
Basis of Presentation
The accompanying interim condensed consolidated financial statements are unaudited and have been prepared in accordance with accounting principles generally accepted in the United States of America (“GAAP”) for interim financial information and the instructions to Form 10-Q and do not include all of the information and footnotes required by GAAP for complete financial statements. All intercompany transactions have been eliminated in consolidation.
Certain information and footnote disclosures normally included in the Company’s annual audited consolidated financial statements and accompanying notes have been condensed or omitted in these interim condensed consolidated financial statements. Accordingly, the unaudited condensed consolidated financial statements included herein should be read in conjunction with the audited consolidated financial statements for the year ended December 31, 2015, as filed with the Securities and Exchange Commission (“SEC”) on Form S-1 (Registration No. 333-209131) with an effective date of April 13, 2016.
The results of operations presented in this quarterly report are not necessarily indicative of the results of operations that may be expected for any future periods. In the opinion of management, these unaudited condensed consolidated financial statements include all adjustments and accruals, consisting only of normal recurring adjustments that are necessary for a fair statement of the results of all interim periods reported herein.
NOTE 2 - SUMMARY OF SIGNIFICANT ACCOUNTING POLICIES
Going Concern
We have historically incurred recurring losses from operations and we may continue to generate negative cash flows as we implement our business plan. Our unaudited condensed consolidated financial statements are prepared using GAAP as applicable to a going concern, which contemplates the realization of assets and liquidation of liabilities in the normal course of business.
We currently do not have sufficient cash or commitments for financing to sustain our operations for the next twelve months. Our plan is to develop customer relationships and increase our revenues derived from our products and IP licensing. Although we have historically incurred operating losses, we have been able to fund such losses primarily by selling common and preferred stock and convertible notes. We expect that our cash on hand at March 31, 2016, of $532,491 and proceeds from our initial public offering of common stock (“IPO”) will sustain our operations for the next twelve months. However, we cannot make any assurances that additional financing will be available to us and, if available, completed on a timely basis, on acceptable terms, or at all.
There has been no public market for our securities and a public market may never develop, or, if any market does develop, it may not be sustained. Our common stock is not currently quoted on or traded on any exchange or on any over-the-counter market. In the event we are unable to fund our operations from existing cash on hand, operating cash flows, additional borrowings or raising equity capital, we may be forced to reduce our expenses, slow down our growth rate, or discontinue operations. Our condensed consolidated financial statements do not include any adjustments relating to the recoverability and classification of recorded asset amounts or the amounts and classification of liabilities that might be necessary should we be unable to continue as a going concern.
XG SCIENCES, INC.
NOTES TO UNAUDITED CONDENSED CONSOLIDATED FINANCIAL STATEMENTS
March 31, 2016
Use of Estimates
The preparation of our condensed consolidated financial statements in conformity with GAAP requires us to make estimates, judgments and assumptions that affect the reported amounts of assets, liabilities, revenues and expenses, together with amounts disclosed in the related notes to the financial statements. Actual results and outcomes may differ from our estimates, judgments and assumptions. Significant estimates, judgments and assumptions used in these condensed consolidated financial statements include, but are not limited to, those related to revenues, accounts receivable and related allowances, contingencies, useful lives and recovery of long-term assets, income taxes, the fair value of stock-based compensation and derivative financial instrument liabilities. These estimates, judgments, and assumptions are reviewed periodically and the effects of material revisions in estimates are reflected in the financial statements prospectively from the date of the change in estimate.
Inventory
Inventory consists of raw materials, work-in-process and finished goods, all of which are valued at standard cost, which approximates average cost.
Derivative Financial Instruments
We do not use derivative instruments to hedge exposures to cash flow, market or foreign currency risk. The terms of convertible preferred stock and convertible notes that we issue are reviewed to determine whether or not they contain embedded derivative instruments that are required by ASC 815: “Derivatives and Hedging” to be accounted for separately from the host contract, and recorded at fair value. In addition, freestanding warrants are also reviewed to determine if they achieve equity classification. Certain warrants that we have issued did not meet the conditions for equity classification and are classified as derivative instrument liabilities measured at fair value. The fair values of these derivative liabilities are revalued at each reporting date, with the change in fair value recognized in earnings.
Fair Value Measurements
The following is a reconciliation of the beginning and ending balances for liabilities measured at fair value on a recurring basis using significant unobservable inputs (Level 3) during the three months ended March 31, 2016 and 2015:
| | | 2016 | | | 2015 | |
| | | | | | | |
| Balance at January 1 | | $ | 8,235,163 | | | $ | 5,000,752 | |
| Warrants issued with additional financing | | | 21,815 | | | | — | |
| Gain recognized in earnings | | | (89,765 | ) | | | (96,299 | ) |
| Balance at March 31 | | $ | 8,167,213 | | | $ | 4,904,453 | |
NOTE 3 – PRIVATE PLACEMENT AND PREEMPTIVE RIGHTS
Private Placement
In April 2015, we commenced a private placement offering of up to $18,000,000 in Series B Units consisting of up to 1,125,000 shares of Series B convertible preferred stock (“Series B Preferred Stock”) and warrants to purchase common stock at an offering price of $16.00 per Unit (the “Warrants”). The offering terminated on August 31, 2015 and as of such date, we had sold 266,887 shares of Series B Preferred Stock and warrants to purchase 222,262 shares of Common Stock, for aggregate gross proceeds of $4,270,192.
The Series B Preferred Stock has a stated value of $16.00 per share and is convertible, at the option of the holder, at a conversion price of $16.00 per share, subject to adjustments for stock dividends, splits, combinations and similar events. The Warrants have an exercise price of $16.00 per share and expire 7 years from issuance. During the period from closing of the offering and ending on the earlier of i) December 31, 2017 and ii) the date the Company consummates the sale of new securities resulting in gross proceeds of at least $18,000,000, the holder has the right to exchange their Series B Preferred Stock and Warrants on a price per share basis into the new security on the relative price per share terms as the new securities are sold to the third party .
XG SCIENCES, INC.
NOTES TO UNAUDITED CONDENSED CONSOLIDATED FINANCIAL STATEMENTS
March 31, 2016
The cash proceeds from the private placement were allocated first to the derivative liabilities resulting from warrants, at their fair values, with the residual being allocated to the Series B Preferred Stock.
Preemptive Rights
On January 15, 2014, as part of our financing agreements with Samsung Ventures (“Samsung”), Aspen Advanced Opportunity Fund LP (“AAOF”) and XGS II, LLC (“XGS II”), we agreed to allow all shareholders to purchase one share of Series A convertible preferred stock (“Series A Preferred Stock”) at a price of $12.00 per share for every two (2) shares of Series A Convertible Preferred Stock or Common Stock owned by the shareholder. In addition, for every two preemptive shares purchased, the Company issued the shareholder a warrant to purchase one additional share of Series A Preferred Stock with the same terms as the warrants issued to AAOF and XGS II. The Company also agreed to issue warrants with the same terms to those shareholders who exercised preemptive rights in October 2013.
Under the January 15, 2014 preemptive rights offering, 101,000 shares of Series A Preferred Stock were sold to existing stockholders at a price of $12.00 per share. In addition, warrants indexed to 56,054 shares of Series A Preferred Stock were issued in conjunction with these stock purchases, including 5,554 warrants related to the preemptive rights exercised in October 2013.
As part of our Series B Unit private placement in April 2015, shareholders and holders of our convertible notes were provided the right to purchase their pro rata share of any class of stock that the Company sells or issues. The sale of Series B Preferred Stock in the April 2015 offering triggered the preemptive rights. As of March 31, 2016, 3,100 shares of Series B Convertible Stock have been sold to existing shareholders at a price of $16.00 per share. In addition, Warrants indexed to 2,635 shares of common stock were issued in conjunction with these Series B Preferred Stock purchases.
As of March 31, 2016, the total number of warrants issued due to the preemptive rights offerings was 58,689.
NOTE 4 – BRIDGE FINANCINGS
From December 31, 2015 through March 31, 2016, the Company entered into private placement bridge financings with 14 investors, seven (7) of whom are board members or affiliates of board members, totaling $1,080,000 (the “Bridge Financings”). The investors in the Bridge Financings received common stock warrant coverage of 30% for investments made prior to December 31, 2015 and 20% coverage thereafter.
The following tables provide additional details regarding the Bridge Financings:
| | | December 2015
Bridge Financing | | | March 2016
Bridge Financing | |
| Face value of notes at issuance | | $ | 550,000 | | | $ | 530,000 | |
| Interest rate | | | 8.0 | % | | | 8.0 | % |
| Maturity Date | | | June 30, 2016 | | | | December 31, 2016 | |
| Common Stock Warrant Shares | | | 20,625 | | | | 10,600 | |
| Warrant Exercise Price | | $ | 8.00 | | | $ | 10.00 | |
| Warrant Term | | | 5 years | | | | 5 years | |
During the period from closing of such private placement and ending on the earlier of i) December 31, 2017 and ii) the date the Company consummates the sale of new securities resulting in gross proceeds of at least $18.000,000, such warrant holders have the right to exchange their warrants on a price per share basis into the new security on the relative price per share terms as the new securities are sold to the third party. Due to the exchange rights, the warrants do not meet the conditions for equity classification and require classification as liabilities at fair value. The proceeds of the Bridge Financings were allocated first to the derivative liabilities resulting from the warrants, at their fair value, with the residual allocated to the debt instrument as follows:
XG SCIENCES, INC.
NOTES TO UNAUDITED CONDENSED CONSOLIDATED FINANCIAL STATEMENTS
March 31, 2016
| | | December 2015
Bridge
Financing | | | March 2016
Bridge
Financing | |
| Derivative liabilities – warrants | | $ | 52,676 | | | $ | 21,815 | |
| Bridge Financing Notes | | | 497,324 | | | | 508,185 | |
| Total allocated proceeds | | $ | 550,000 | | | $ | 530,000 | |
NOTE 5 – DERIVATIVE LIABILITY WARRANTS
As of March 31, 2016, all 1,228,842 warrants issued to AAOF, XGS II, holders of Series A and Series B Preferred Stock, and the Bridge Financings promissory notes have vested.
Shares indexed to derivative liabilities as of March 31, 2016 and December 31, 2015 were as follows:
| | | Type of
shares
indexed | | Exercise
Price | | | March
31, 2016 | | | December
31, 2015 | |
| | | | | | | | | | | | |
| Warrants issued with Secured Convertible Notes | | Series A PS | | $ | 6.40 | | | | 833,333 | | | | 833,333 | |
| Warrants issued with equipment financing leases | | Series A PS | | $ | 6.40 | | | | 83,333 | | | | 83,333 | |
| Warrants issued with preemptive rights | | Series A PS | | $ | 6.40 | | | | 56,054 | | | | 56,054 | |
| Warrants issued with preemptive rights | | Common | | $ | 16.00 | | | | 2,635 | | | | 2,635 | |
| Warrants issued with 2015 private placement | | Common | | $ | 16.00 | | | | 222,262 | | | | 222,262 | |
| Warrants issued with 2015 Bridge Financings | | Common | | $ | 8.00 | | | | 20,625 | | | | 20,625 | |
| Warrants issued with 2016 Bridge Financings | | Common | | $ | 10.00 | | | | 10,600 | | | | — | |
| Total shares indexed to derivative liabilities | | | | | | | | | 1,228,842 | | | | 1,218,242 | |
The following table summarizes the fair value of the derivative liabilities as of March 31, 2016 and December 31, 2015:
| | | March 31, 2016 | | | December 31,2015 | |
| | | | | | | |
| Warrants issued with Secured Convertible Notes | | $ | 6,668,410 | | | $ | 6,743,997 | |
| Warrants issued with equipment financing leases | | | 666,843 | | | | 674,397 | |
| Warrants issued with preemptive rights | | | 452,181 | | | | 457,265 | |
| Warrants issued with 2015 private placement | | | 306,546 | | | | 306,828 | |
| Warrants issued with Bridge Financings | | | 73,233 | | | | 52,676 | |
| | | | | | | | | |
| Total derivative liabilities | | $ | 8,167,213 | | | $ | 8,235,163 | |
XG SCIENCES, INC.
NOTES TO UNAUDITED CONDENSED CONSOLIDATED FINANCIAL STATEMENTS
March 31, 2016
The Company estimated the fair value of their warrant derivative liabilities as of March 31, 2016 and December 31, 2015, using a lattice model and the following assumptions:
| | | March 31, 2016 | | | December 31, 2015 |
| Fair value of underlying stock | | $7.63 - $12.64 | | | $7.63 - $12.64 |
| Equivalent risk free interest rate | | 0.73%- 0.98% | | | 1.06%- 1.39% |
| Expected term (in years) | | 4.76- 7.80 | | | 5.01- 8.05 |
| Equivalent stock price volatility | | 39.18%- 39.75% | | | 38.00%- 38.61% |
| Expected dividend yield | | — | | | — |
The fair value of the warrants is estimated using a binomial lattice model. Equivalent amounts reflect the net results of multiple modeling simulations that the lattice model applies to underlying assumptions. Because the Company is not publically traded, the expected volatility of the Company’s stock was developed using historical volatility for a peer group for a period equal to the expected term of the warrants. The fair value of the warrants will be significantly influenced by the fair value of our common stock, stock price volatility and the risk free interest components of the lattice technique. Changes in the fair value of Derivative Liabilities, carried at fair value, are reported as “Change in fair value of derivative liability - warrants” in the Statement of Operations, and were as follows:
| | | Three months ended March 31, | |
| | | 2016 | | | 2015 | |
| Warrants issued with Secured Convertible Notes | | $ | 75,587 | | | $ | 82,500 | |
| Warrants issued with equipment financing leases | | | 7,554 | | | | 8,250 | |
| Warrants issued with preemptive rights | | | 5,084 | | | | 5,549 | |
| Warrants issued with 2015 private placement | | | 282 | | | | — | |
| Warrants issued with Bridge Financings | | | 1,258 | | | | — | |
| | | | | | | | | |
| Total Derivative Gain | | $ | 89,765 | | | $ | 96,299 | |
NOTE 6 – OTHER COMMON STOCK WARRANTS
In addition to the warrants described in Note 5, which are accounted for as derivative liabilities, we had 42,694 warrants to purchase common stock that were issued in 2012 and prior years which are accounted for as equity instruments. As of March 31, 2016, the remaining warrants, all of which are exercisable, have exercise prices ranging from $8.00 to $12.00 and expire at various dates through 2027, as follows:
| Date Issued | | Expiration Date | | Exercise Price | | | Number of
Warrants | |
| | | | | | | | | |
| 7/1/2009 | | 7/1/2019 | | $ | 8.00 | | | | 6,000 | |
| 10/8/2012 | | 10/8/2027 | | $ | 12.00 | | | | 5,000 | |
| | | | | | | | | | 11,000 | |
NOTE 7 - INCENTIVE STOCK OPTION PLAN
We have established an incentive stock option plan (the “Plan”) under which the Company may grant key employees and directors options to purchase common stock of the Company at not less than fair market value as of the grant date. Options for up to 600,000 shares may be awarded under the Plan. Each option is exercisable into one share of common stock of the Company. The Plan expires in December 2017. The fair value of the options granted was estimated on the dates of grant using the Black Scholes option-pricing model. As of March 31, 2016, 419,750 option shares have been granted and are outstanding, of which 221,824 are exercisable at an exercise price of $12.00. Vesting of the options ranges from immediately to 20% per year, with most options vesting on a straight-line basis over a three or four year period from the date issued. Rights to exercise the options vest immediately upon a change in control of the Company or termination of the employee’s continuous service due to death or disability. The options expire at various dates through October 2023.
XG SCIENCES, INC.
NOTES TO UNAUDITED CONDENSED CONSOLIDATED FINANCIAL STATEMENTS
March 31, 2016
NOTE 8 – CAPITAL LEASES
As of March 31, 2016 and December 31, 2015, we have capital lease obligations as follows:
| | | March 31, 2016 | | | December 31, 2015 | |
| | | | | | | |
| Capital lease obligations | | $ | 620,163 | | | $ | 682,564 | |
| Unamortized warrant discount | | | (126,546 | ) | | | (149,594 | ) |
| Net obligations | | | 493,617 | | | | 532,970 | |
| Short-term portion of obligations | | | (193,286 | ) | | | (178,487 | ) |
| | | | | | | | | |
| Long-term portion of obligations | | $ | 300,331 | | | $ | 354,483 | |
The 83,333 common stock warrants issued as consideration for the equipment financing leases are recorded as derivative liabilities at fair value. The initial value of these warrants was recorded as a reduction of the capital lease obligation and is being amortized as part of the effective interest cost on the capital lease obligations.
NOTE 9 - RELATED PARTY TRANSACTIONS
We have a licensing agreement for exclusive use of patents and pending patents with Michigan State University (“MSU”), a shareholder of the Company via the MSU Foundation. During the three months ended March 31, 2016 and 2015, we incurred expenses of $12,500. We have also entered into product licensing agreements with certain other shareholders. No royalty expenses have been recognized related to these agreements during the three months ended March 31, 2016 and 2015.
Beginning in 2014, POSCO Corporation (“POSCO”), one of our shareholders, has a contractual obligation to pay us a minimum of $100,000 per year to license certain technologies we license from MSU. This obligation is due annually on February 28 of the following year. We record this license revenue at a rate of $25,000 per quarter. POSCO is disputing that they are obligated to pay the royalties. A petition for arbitration has been filed for this matter by the Company on March 9, 2016. An allowance in the amount of $112,500 and $100,000 has been recorded at March 31, 2016 and December 31, 2015, respectively, to reflect an estimate of the portion of the 2016, 2015 and 2014 royalties that we believe may not be collectible. The accrued royalty and allowance are netted together and reflected in other current assets on the condensed consolidated balance sheet.
The financing arrangements as previously disclosed were provided by AAOF and XGS II, two (2) private funds that were formed for the sole purpose of investing in the Company by two investors affiliated with ASC-XGS, LLC, a shareholder of the Company. Pursuant to the Company’s Shareholders’ Agreement dated March 18, 2013 (as amended on February 26, 2016), a principal of each private fund serves as a director of the Company.
The Bridge Financings discussed in Note 4 above include loans from entities controlled by existing shareholders. Three of these shareholders are also directors of the Company. In conjunction with these short-term borrowings, the Company issued warrants (see also discussed in Note 5).
NOTE 10 – SUBSEQUENT EVENTS
During the period from April 1 through the date May 16, 2016, we issued promissory notes in an aggregate amount of $44,750 and issued warrants to purchase 895 shares of common stock.
XG SCIENCES, INC.
NOTES TO UNAUDITED CONDENSED CONSOLIDATED FINANCIAL STATEMENTS
March 31, 2016
Effective April 13, 2016 the company filed a Form S-1 Registration Statement under the Securities Act of 1933 with the United States Securities and Exchange Commission (SEC), registration no. 333-209131. This is the initial public offering of common stock of XG Sciences, Inc., and no public market currently exists for the securities being offered. We are registering for sale a total of 3,000,000 shares of common stock at a fixed price of $8.00 per share to the general public in a self-underwritten, best efforts offering. We intend to engage the services of non-exclusive sales agents to assist us with selling the shares. Proceeds from the sale of common stock between April 13, 2016 and May 16, 2016 totaled $332,000 for 41,500 common shares.
Item 2. Management’s Discussion and Analysis of Financial Condition and Results of Operations
Forward-Looking Statements
In this Quarterly Report on Form 10-Q, unless otherwise indicated, the words “we”, “us”, “our”, “XG”, “XGS”, “XG Sciences” or the “Company” refer to XG Sciences, Inc. and its wholly owned subsidiary,XG Sciences IP, LLC, a Michigan limited liability company.
Introduction
The following discussion and analysis should be read in conjunction with the unaudited condensed consolidated financial statements, and the notes thereto included herein. The information contained below includes statements of the Company’s or management’s beliefs, expectations, hopes, goals and plans that, if not historical, are forward-looking statements subject to certain risks and uncertainties that could cause actual results to differ materially from those anticipated in the forward-looking statements. For a discussion on forward-looking statements, see the information set forth in the introductory note to this quarterly report on Form 10-Q under the caption “Forward-Looking Statements”, which information is incorporated herein by reference.
Overview of our Business
XG Sciences was formed in May 2006 for the purpose of commercializing certain technology to produce graphene nanoplatelets. First isolated and characterized in 2004, graphene is a single layer of carbon atoms configured in an atomic-scale honeycomb lattice. Among many noted properties, graphene is harder than diamonds, lighter than steel but significantly stronger, and conducts electricity better than copper. Graphene nanoplatelets are particles consisting of multiple layers of graphene. Graphene nanoplatelets have unique capabilities for energy storage, thermal conductivity, electrical conductivity, barrier properties, lubricity and the ability to impart strength when incorporated into plastics or other matrices.
We believe the unique properties of graphene and graphene nanoplatelets will enable numerous new product applications and the market for such products will quickly grow to be a significant market opportunity. Our business model is to design, manufacture and sell advanced materials we call xGnP® graphene nanoplatelets and value-added products based on these nanoplatelets. We currently have hundreds of customers trialing our products for numerous applications, including, but not limited to lithium ion batteries, supercapacitors, thermal shielding and heat transfer, inks and coatings, printed electronics, construction materials, composites, and military uses.
We target our xGnP®nanoplatelets for use in a range of large and growing end-use markets. Our proprietary manufacturing processes allow us to produce nanoplatelets with varying performance characteristics that can be tuned to specific end-use applications based on customer requirements. We currently offer three commercial “grades” of bulk materials, each of which is available in various particle sizes, which allows for surface areas ranging from 50 to 800 square meters of surface area per gram of material depending on the product. Other grades may be made available, depending on the needs for specific applications. In addition to selling bulk graphene nanoplatelets, we also offer the following value added products that contain our graphene nanoplatelets in various forms.
| 1. | Energy storage materials. These consist of specialty advanced materials that have been formulated for specific applications in the energy storage segment. Chief among these is our proprietary, specially formulated silicon-graphene composite material (also referred to as “SiG” or “XG SiG®”) for use in lithium-ion battery anodes. XG SiG® targets the never-ending need for higher battery capacity and longer life. In several customer trials, our SiG material has demonstrated the potential to increase battery energy storage capacity by 3-5x what is currently available with conventional lithium ion batteries today. Additionally, we offer various bulk materials for use as conductive additives for cathodes and anodes in li-ion batteries, as an additive to anode slurries for lead-carbon batteries and are investigating the use of our materials as part of other battery components. |
| 2. | XG Leaf®. XG Leaf is a family of sheet products for a variety of thermal spreading and other applications. XG Leaf® is ideally suited for use in thermal management in portable electronics, which may include cell phones, tablets and notebook PC’s. As these devices continue to adopt faster electronics, higher data management capabilities, brighter displays with ever increasing definition, they generate more and more heat. Managing that heat is a key requirement for the portable electronics market and our XG Leaf®product line is well suited to address the need. These sheets are made using special formulations of xGnP® graphene nanoplatelets as precursors, along with other materials for specific applications. There are several different types of XG Leaf® available in various thicknesses, depending on the end-use requirements for thermal conductivity, electrical conductivity, or resistive heating. |
| 3. | Inks and Coatings. These consist of specially-formulated dispersions of xGnP® together with solvents, binders, and other additives to make electrically or thermally conductive products designed for printing or coating and which are showing promise in diverse customer applications such as advanced packaging, electrostatic dissipation and thermal management. |
We sell products to customers around the world and have sold materials to over 1,000 customers (entities that have purchased our materials) in 47 countries since 2008. Some of these customers are research organizations and some are commercial organizations. Because graphene is a new material, our customers are developing new uses for our products and purchase them in quantities consistent with development purposes. A few of our customers have indicated to us that they have introduced commercial products that use our materials, but our customers are under no obligation to report to us on the usage of our materials. Our customers have included well-known automotive and OEM suppliers around the world, world-scale lithium ion battery manufacturers in the US, South Korea and China, diverse specialty material companies, as well as many others. We have also licensed some of our base manufacturing technology to other companies and we consider technology licensing a component of our business model. Our licensees include POSCO and Cabot Corporation, who further extend our technology through their customer network. Ultimately, we expect to benefit in terms of royalties on sales of xGnP® produced and sold by our licensees.
The process of “designing-in” new materials is a relatively complex process that involves the use of relatively small amounts of the new material in laboratory and engineering development for an extended period of time. Following successful development, we expect customers that incorporate our materials into their products will then order much larger quantities of material to support commercial production. Thus, while many of our customers are currently purchasing our materials in kilogram (one or two pound) quantities, we expect many of our customers will require tons or even hundreds of tons of material when they commercialize products that incorporate our materials. The majority of our customers are still in the development stage and our product sales thus consist of many orders for relatively small quantities of materials being used in a variety of research or development activities and early phase adoption in limited commercial applications.
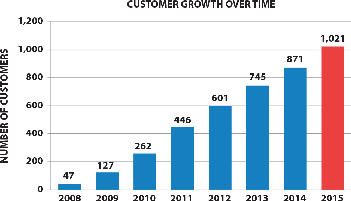 | 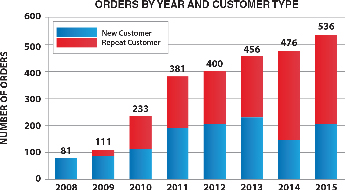 |
The above graphs show total orders and customers based on actual purchases of our materials and do not include free samples or materials used in joint development programs. The average order size in 2014 was $2,175 and in 2015 was $600, which indicates these orders were for materials that were not yet incorporated into large-volume commercial products. However, six customers have informed us of their intent to begin commercializing products using our products during 2016. As a result, we expect to begin shipping significantly greater quantities of our products in 2016. Based on the status of current discussions with such customers, we believe that we will begin to scale up revenue as 2016 progresses, and we will be able to book approximately $5-10 million of revenue in 2016.
The following are examples of commercial and development uses of our products:
| • | Construction company demonstrating less than one weight percent of our product in construction material composites improves flexural strength by more than 30%, and |
| • | Large oil and lubricant supplier showing gear and friction improvements when incorporated into industrial and automotive greases, and |
| • | Engineering design firm for automotive manufacturers found 20% reduction in operating temperature and in thermal uniformity when XG Leaf®replaces standard cooling fins in lithium ion battery packs’, and |
| • | Auto manufacturer showing increased tensile and flexural strength and reduced weight in automotive composites, and |
| • | Battery manufacturers demonstrating improved cycle life and energy storage when used as additives in lead acid batteries. |
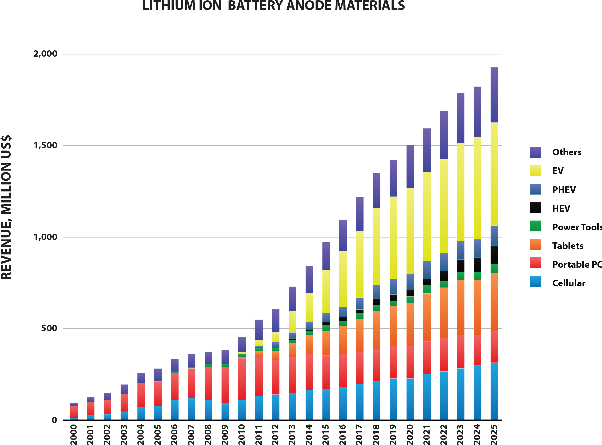
The markets that we serve are large and rapidly growing. For example, as shown in the figure below (Avicenne Energy, “The Rechargeable Battery Market, 2014–2025”, July 2015),the market for materials used in lithium ion battery anodes is currently approximately $1 billion, but is expected to approximately double over the next ten years. We believe our ability to address next generation anode materials represents a significant opportunity for us.
According to Prismark Partners, LLC, a leading electronics industry consulting firm specializing in advanced materials, the 2014 market for finished graphitic heat spreaders as sold to the OEM and EMS companies with adhesive, PET, and/or copper backing for selected portable applications was $600 million, and is expected to reach $900 million in 2018. The market is currently in a significant expansion period driven by the demand for portable devices. In a press release dated March 3, 2015, Gartner, Inc., a leading research organization, estimated the 2014 global cell phone market at 1.88 billion units. Every cell phone has some form of thermal management system, and we believe many of the new smart phones being developed can benefit from the thermal management properties of our XG Leaf® product line. In August 2015, International Data Corporation (IDC) in their Worldwide Quarterly Tablet Tracker, estimated the global shipment of tablets in 2015 at 212 million units. Thus, we believe our XG Leaf®product line is well positioned to address a very large and rapidly growing market.
Some of our proprietary manufacturing processes were developed at Michigan State University (MSU) and licensed to us in 2006. We licensed three U.S. patents and patent applications from MSU. However, over time, our scientists and engineers have made many further discoveries and inventions that are embodied in the form of twenty three additional US patents and patent applications, two China patents, and numerous additional international filings and trade secrets. Our general IP strategy is to keep as trade secrets those manufacturing processes that are difficult to enforce should they be disclosed and to seek patent coverage for other manufacturing processes, materials derived from those processes, unique combinations of materials and end uses of materials containing graphene nanoplatelets. We believe that the combination of our rights under the MSU license, patents and patent applications, and our trade secrets create a strong intellectual property position.
We have developed and scaled-up capacity for two manufacturing processes — one based on chemical intercalation of graphite and subsequent exfoliation and classification; and the second based on a high-shear mechanical process. In March 2012, we took possession of a production facility under terms of a long-term lease and moved our headquarters to this new location. Initial production commenced in this facility in September 2012. Currently, this facility is capable of producing approximately 30 – 50 tons per year of intercalated materials (depending on product mix) if operated on a continuous basis. We also operate a separate production facility in leased manufacturing space which is used for the production of certain specialty materials. This facility is capable of producing approximately 30 – 60 tons per year of materials (depending on product mix) if operated on a continuous basis. We believe these manufacturing facilities will be sufficient to meet demands for the majority of our bulk materials for a number of years, with suitable additions of capital equipment as warranted. However, additional manufacturing capabilities for certain value-added products and certain bulk materials remain to be developed and will likely require the acquisition of additional facilities. In particular, the production processes for XG Leaf®, XG SiG® and our conductive inks will require additional capital and additional facilities to meet expected future customer demand.
Operating Segment
We have one reportable operating segment that manufactures xGnP® graphene nanoplatelets and value-added products produced therefrom, conducts research on graphene nanoplatelets and related products, and licenses our technology as appropriate. As of March 31, 2016 we shipped products on a worldwide basis, but all of our assets were located within the United States.
Our Critical Accounting Policies
US generally accepted accounting principles (“GAAP”) requires management to make estimates, judgments and assumptions that affect the reported amounts of assets, liabilities, revenues and expenses, together with amounts disclosed in the related notes to the consolidated financial statements. Actual results and outcomes may differ from management’s estimates, judgments and assumptions. Significant estimates, judgments and assumptions used in these consolidated financial statements include, but are not limited to, those related to revenues, accounts receivable and related allowances, contingencies, useful lives and recovery of long-term assets, income taxes, and the fair values of stock-based compensation and derivative financial instrument liabilities. These estimates, judgments, and assumptions are reviewed periodically and the effects of material revisions in estimates are reflected in the financial statements prospectively from the date of the change in estimate.
Revenue Recognition
We recognize revenues when (a) the price is fixed or determinable, (b) persuasive evidence of a sales arrangement exists, (c) the service is performed or delivery has occurred and (d) collectability of the resulting receivable is reasonably assured.
We recognize product revenues when products are shipped to customers. At that time, product ownership and risk have transferred to the customer and we have no further obligations. We record product sales at net selling prices that are reflective of discounts and allowances. Shipping and handling costs are recorded as a component of direct costs, as are shipping and handling costs billed to customers.
Revenue related to licensing agreements is recorded upon substantial performance of the terms of the licensing contract. In the case of licensing arrangements that involve up-front payments, revenue is recorded when management determines that the appropriate terms of the contract have been fulfilled. For example, this may occur when technology has been transferred via written documents or, if training is involved, whenever all contracted training has occurred. In the case of licenses where product delivery is also embedded in the deliverable, a portion of revenue would be recognized when products are delivered.
In the case of licensing arrangements that involve ongoing royalties based on sales of products produced with our technology, royalty income is recorded when received or, in the case of minimum royalties due, in the period when due.
Grant contract revenue is recognized over the life of the contracts as the services are performed.
Amounts received in excess of revenues earned are recorded as deferred revenue.
Stock-Based Compensation
We recognize compensation expense in our statement of operations for all share-based option and stock awards, based on estimated grant-date fair values.
We estimate the grant-date fair value of stock-based compensation awards using the Black-Scholes option valuation model. This model is affected by the estimated value of our common stock on the date of the grant as well as assumptions regarding a number of highly complex and subjective variables. These variables include the expected term of the option, the exercise price, expected risk-free rates of return, the expected volatility of our common stock, and expected dividend yield, each of which is more fully described below. The assumptions for the estimated value of our common stock, expected term and expected volatility are the assumptions that most significantly affect the grant date fair value.
Estimated Value of our common stock: The estimated fair value of the Company’s common stock was based on a number of objective and subjective factors, including external market conditions affecting the Company’s industry sector, the prices at which the Company sold shares of convertible preferred stock, and the superior rights and preferences of securities senior to the Company’s common stock at the time. The Company used the option pricing method, utilizing the back-solve method, which is a form of the market approach defined in the American Institute of Certified Public Accountants, or AICPA, Audit and Accounting Practice Aid Series: Valuation of Privately Held Company Equity Securities Issued as Compensation, used to estimate the fair value of common stock. The valuation methodology included estimates and assumptions that require the Company’s judgment.
Expected Term: Because we have limited experience related to the exercise of employee stock options, we use the simplified method permitted by SEC Staff Accounting Bulletin Topic 14 to estimate the expected term of the options. The expected term of an option is estimated to be equal to the mid-point between the vesting and expiration dates of the option
Risk-free Interest Rate: We base the risk-free interest rate used on the implied yield at the grant date of U.S. Treasury zero-coupon issues with a term approximately equal to the expected term of the stock-based award being valued.
Expected Stock Price Volatility: Because we are a private company with very limited stock sales history, we use a blended average weekly volatility of certain publicly traded peer companies. We believe that the use of this blended average peer volatility is reflective of market conditions and a reasonable indicator of our expected future volatility.
Dividend Yield: Because we have never paid a dividend and do not expect to begin doing so in the foreseeable future, we have assumed a 0% dividend yield in valuing our stock-based awards.
The grant-date fair value of the award is recognized as expense over the requisite service period using the straight-line method.
Fair Value Measurements
FASB ASC 820: “Fair Value Measurements and Disclosures” defines fair value as the exchange price that would be received for an asset or paid to transfer a liability (an exit price) in the principal or most advantageous market for the asset or liability in an orderly transaction between market participants on the measurement date. ASC 820 also establishes a fair value hierarchy which requires an entity to maximize the use of observable inputs and minimize the use of unobservable inputs when measuring fair value. The standard describes three levels of inputs that may be used to measure fair value:
Level 1: Quoted prices in active markets for identical assets or liabilities.
Level 2: Inputs other than quoted prices included within Level 1 which are either directly or indirectly observable.
Level 3: Inputs to the valuation methodology are unobservable and significant to the fair value measurement.
A financial instrument’s level within the fair value hierarchy is based on the lowest level of any input that is significant to the fair value measurement. Our derivative liabilities are classified as Level 3 within the fair value hierarchy because they were valued using other unobservable inputs. The valuation technique used to measure fair value of the derivative liabilities is based on a lattice model with significant assumptions and inputs determined by the Company. A lattice model was used to estimate the fair value of the derivative liabilities because management believes it reflects all the assumptions that market participants would likely consider including early exercise of the warrants. The fair value of the derivative liabilities will be significantly influenced by the fair value of our common stock, stock price volatility and the risk free interest components of the lattice technique.
The following is a reconciliation of the beginning and ending balances for liabilities measured at fair value on a recurring basis using significant unobservable inputs (Level 3) during the three months ended March 31, 2016 and 2015:
| | | 2016 | | | 2015 | |
| | | | | | | |
| Balance at January 1 | | $ | 8,235,163 | | | $ | 5,000,752 | |
| Warrants issued with additional financing | | | 21,815 | | | | — | |
| Loss (gain) recognized in earnings | | | (89,765 | ) | | | (96,299 | ) |
| Balance at March 31 | | $ | 8,167,213 | | | $ | 4,904,453 | |
Derivative Financial Instruments
We do not use derivative instruments to hedge exposures to cash flow, market or foreign currency risk. The terms of convertible preferred stock and convertible notes that we have issued in the past were reviewed to determine whether or not they contain embedded derivative instruments that are required by ASC 815: “Derivatives and Hedging” to be accounted for separately from the host contract, and recorded at fair value. In addition, freestanding warrants are also reviewed to determine if they achieve equity classification. Certain warrants that we have issued did not meet the conditions for equity classification and are classified as derivative instrument liabilities measured at fair value. The fair values of these derivative liabilities are revalued at each reporting date, with the change in fair value recognized in earnings. See Note 5 of the condensed consolidated financial statements for additional information.
Going Concern
We have historically incurred recurring losses from operations and we may continue to generate negative cash flows as we implement our business plan. Our unaudited condensed consolidated financial statements are prepared using GAAP as applicable to a going concern, which contemplates the realization of assets and liquidation of liabilities in the normal course of business.
We currently do not have sufficient cash or commitments for financing to sustain our operations for the next twelve months. Although we have historically incurred operating losses, we have been able to fund such losses primarily by selling common and preferred stock and convertible notes. Our plan is to develop customer relationships and increase our revenues derived from our products and IP licensing and to raise additional equity capital through our ongoing initial public offering. We expect that our cash on hand at March 31, 2016 of $532,491 and proceeds from our initial public offering of common stock (“IPO”) will sustain our operations for the next twelve months. However, we cannot make any assurances that additional financing will be available to us and, if available, completed on a timely basis, on acceptable terms, or at all.
There has been no public market for our securities and a public market may never develop, or, if any market does develop, it may not be sustained. Our common stock is not currently quoted on or traded on any exchange or on any over-the-counter market. In the event we are unable to fund our operations from existing cash on hand, operating cash flows, additional borrowings or raising equity capital, we may be forced to reduce our expenses, slow down our growth rate, or discontinue operations. Our condensed consolidated financial statements do not include any adjustments relating to the recoverability and classification of recorded asset amounts or the amounts and classification of liabilities that might be necessary should we be unable to continue as a going concern.
Recent Accounting Pronouncements
In May 2014, the Financial Accounting Standards Board, or FASB, issued Accounting Standards Update No. 2014-09, Revenue From Contracts With Customers, or ASU 2014-09. Pursuant to this update, an entity should recognize revenue to depict the transfer of promised goods or services to customers in an amount that reflects the consideration to which the entity expects to be entitled in exchange for those goods or services. The amendments in this update are currently effective for annual reporting periods beginning after December 15, 2016, including interim periods within that reporting period, and are to be applied retrospectively, or on a modified retrospective basis. Early application is not permitted. In July 2015, the FASB approved a one year deferral of the effective date for annual reporting periods beginning after December 15, 2017 with early adoption permitted for annual periods beginning after December 15, 2016. We are currently evaluating the impact of adopting ASU 2014-09 on our financial statements.
In August 2014, FASB issued ASU 2014-15, Disclosure of Uncertainties about an Entity’s Ability to Continue as a Going Concern, or ASU 2014-15. ASU 2014-15 explicitly requires a company’s management to assess an entity’s ability to continue as a going concern, and to provide related footnote disclosures in certain circumstances. The new standard will be effective in the first annual period ending after December 15, 2016, although early application is permitted. We are currently evaluating the potential impact of the adoption of this standard, but believe its adoption will have no impact on our financial position, results of operations or cash flows.
In November 2014, the FASB issued ASU No. 2014-16, Determining Whether the Host Contract in a Hybrid Financial Instrument Issued in the Form of a Share is more akin to Debt or to Equity, or ASU 2014-16. ASU 2014-16 clarifies how current GAAP should be interpreted in evaluating the economic characteristics and risks of a host contract in a hybrid financial instrument that is issued in the form of a share. Specifically, ASU 2014-16 provides that an entity should consider all relevant terms and features, including the embedded derivative feature being evaluated for bifurcation, in evaluating the nature of the host contract. ASU 2014-16 is effective for public companies for fiscal years and interim periods within those fiscal years beginning after December 15, 2015 with early adoption permitted. We adopted this guidance for the year ended December 31, 2014 and have properly applied it to hybrid financial instruments.
In April 2015, the FASB issued ASU No. 2015-03, Simplifying the Presentation of Debt Issuance Costs, or ASU 2015-03. ASU 2015-03 requires debt issuance costs to be presented in the balance sheet as a direct deduction from the carrying value of the associated debt liability, consistent with the presentation of a debt discount. The standard also aligns the GAAP presentation with International Financial Reporting Standards and will remedy the long-standing conflict with the guidance in FASB Concepts Statement No. 6, Elements of Financial Statements, which indicates that debt issuance costs do not meet the definition of an asset, because they provide no future economic benefit. ASU No. 2015-03 is effective for financial statements issued for fiscal years beginning after December 15, 2015, and interim periods within those fiscal years. Early adoption is permitted for financial statements that have not been previously issued. The new guidance will be applied on a retrospective basis. The adoption of this guidance during the year ended December 31, 2015 did not have a material impact on our balance sheets.
We do not believe that any other issued or proposed accounting pronouncements will have a material effect on our financial statements.
Results of Operations for the Three Months Ended March 31, 2016 Compared with the Three Months Ended March 31, 2015
The following table summarizes the results of our operations for the three months ended March 31, 2016 and 2015.
| Summary Income Statement | | Three Months ended March 31 | | | Change 2015 - 2016 | |
| | | 2016 | | | 2015 | | | $ | | | % | |
| | | | | | | | | | | | | |
| Total Revenues | | $ | 106,052 | | | $ | 159,809 | | | $ | (53,757 | ) | | | (33.6 | ) |
| Cost of Goods Sold | | | 375,748 | | | | 420,108 | | | | (44,360 | ) | | | (10.6 | ) |
| Gross Profit | | | (269,696 | ) | | | (260,299 | ) | | | (9,397 | ) | | | (3.6 | ) |
| | | | | | | | | | | | | | | | | |
| Research & Development Expense | | | 216,350 | | | | 382,649 | | | | (166,299 | ) | | | (43.5 | ) |
| Sales, General & Administrative Expense | | | 1,096,220 | | | | 1,046,864 | | | | 49,356 | | | | 4.7 | |
| Total Operating Expense | | | 1,312,570 | | | | 1,429,513 | | | | (116,943 | ) | | | (8.2 | ) |
| | | | | | | | | | | | | | | | | |
| Operating Loss | | | (1,582,266 | ) | | | (1,689,812 | ) | | | 107,546 | | | | 6.4 | |
| | | | | | | | | | | | | | | | | |
| Other Income (Expense) | | | 30,117 | | | | (390,073 | ) | | | 420,190 | | | | 107.7 | |
| | | | | | | | | | | | | | | | | |
| Net Loss | | $ | (1,552,149 | ) | | $ | (2,079,885 | ) | | $ | 527,736 | | | | 25.4 | |
Revenues
Revenues for the three months ended March 31, 2016 and 2015, by category, are shown below.
Revenue Summary
| | | Three Months ended March 31 | | | Change 2015 - 2016 | |
| | | 2016 | | | 2015 | | | $ | | | % | |
| | | | | | | | | | | | | |
| Product Sales | | $ | 59,742 | | | $ | 37,305 | | | $ | 22,437 | | | | 60.1 | |
| Grants | | | 21,310 | | | | 97,504 | | | | (76,194 | ) | | | (78.1 | ) |
| Licensing Revenues | | | 25,000 | | | | 25,000 | | | | - | | | | 0.0 | |
| | | | | | | | | | | | | | | | | |
| Total | | $ | 106,052 | | | $ | 159,809 | | | $ | (53,757 | ) | | | (33.6 | ) |
Product sales consist of two broad categories: (1) material sold to customers for research or development purposes; and (2) production orders for customers. Typically, the order sizes for the first category are relatively small, however we expect orders in the second category to be much larger in the future. In the three months ended March 31, 2016, product sales increased by $22,437, or 60%. The main reason for the increase was customers moving through development programs towards commercialization, requiring larger quantities of our materials for advanced testing and pilot production activities.
We ship our products from our Lansing manufacturing facilities to customers around the world. During the three months ended March 31, 2016, we shipped materials to customers in 19 different countries, versus 15 countries during the three months ended March 31, 2015. Shipments to only one country other than the United States accounted for more than 10% of product revenues during the three months ended March 31, 2016 and 2015. That country (South Korea) accounted for approximately 39% and 21% of total product revenues during each of the respective periods.
The table below shows a comparison of orders received, both domestic and international, and the average order size in dollars. These numbers indicate that our customer base remains active with development or research projects that use our materials and indicate the breadth of our geographic coverage. However, the small average order size indicates that almost all orders are for quantities that are far smaller than anticipated orders once our products are commercialized in an industrial or consumer product. Orders increased by approximately 15% during the three months ended March 31, 2016 as compared to the three months ended March 31, 2015. The average order size increased 69% compared to previous year period due to one of our customers entering into a pilot production stage with our product requiring larger quantities than what is typically required during the sampling stage. We do not consider these fluctuations to be especially significant, given the relatively small order size in comparison to our expectations for future commercial orders.
Order Summary
| | | Three Months Ended March 31 | | | Change 2015-2016 | |
| | | 2016 | | | 2015 | | | | | | % | |
| Number of orders - domestic | | | 81 | | | | 72 | | | | 9 | | | | 12.5 | |
| Number of orders - international | | | 69 | | | | 58 | | | | 11 | | | | 19.0 | |
| Number of orders - total | | | 150 | | | | 130 | | | | 20 | | | | 15.4 | |
| Average order size - $ | | | 830 | | | | 491 | | | | 339 | | | | 69.0 | |
Grant revenues of $21,310 and $97,504 during the three months ended March 31, 2016 and 2015 consisted entirely of revenue from the Phase II SBIR grant from the US Department of Energy. This Phase II SBIR was a grant awarded from the DOE as a follow-on for continued development of the materials investigated under the Phase I program entitled “Low-cost, High-Energy Si/Graphene Anodes for Li-Ion Batteries.” This award was for a total of $999,899 to fund a research project over a planned two-year period commencing in January 2014 and originally expiring December 2015. A no cost contract extension has been approved with a new expiration date of June 22, 2016. A total of $862,842 has been billed against the grant as of March 31, 2016. All grant revenues are recorded as time and expenses are incurred according to the grant contracts.
Cost of Goods Sold
We use a standard cost system to estimate the direct costs of products sold. Direct costs include estimates of raw material costs, packaging, freight charges net of those billed to customers, and an allocation for direct labor and manufacturing overhead. Because of the nature of our production processes, there is a substantial fixed manufacturing expense requirement that represents the ongoing cost of maintaining production facilities that are not directly related to products sold, so we use a “full capacity” allocation of overhead based on an estimate of what product costs would be if the manufacturing facilities were operating on a full-time basis and producing products at the designed capacity. This estimate involves estimating both the level of expenses as well as production amounts as if the manufacturing facility were operating on a continuous, three-shift, production basis.
The following table shows the relationship of direct costs to product sales for the three months ended March 31, 2016 and 2015:
Gross Profit Summary
| | | Three Months Ended March 31 | | | Change 2015 - 2016 | |
| | | 2016 | | | 2015 | | | $ | | | % | |
| | | | | | | | | | | | | |
| Product Sales | | $ | 59,742 | | | $ | 37,305 | | | $ | 22,437 | | | | 60.1 | |
| Direct Costs | | | 32,032 | | | | 22,004 | | | | 10,028 | | | | 45.6 | |
| Direct Cost Margin | | $ | 27,710 | | | $ | 15,301 | | | $ | 12,409 | | | | 81.1 | |
| % of Sales | | | 46.4 | % | | | 41.0 | % | | | | | | | | |
| Unallocated Manufacturing Expense | | | 343,716 | | | | 398,105 | | | | (54,389 | ) | | | (13.7 | ) |
| Gross Profit (Loss) on Product Sales | | $ | (316,006 | ) | | $ | (382,804 | ) | | $ | 66,798 | | | | 17.4 | |
We believe that the fluctuations in direct cost from period to period are not indicative of overall performance or of future margins because of the relatively small size of our sales in comparison to our future expectations. Direct costs vary depending on the size of an order, the specific products being ordered, and other factors like shipping destination.
Costs associated with grant revenues tend to be a mixture of facilities use, management time, labor from scientists, technicians and manufacturing personnel, and some supplies. Because of the difficulty of developing and maintaining an administrative system to gather direct costs for grants, together with the relatively small size of grant revenues, we do not track direct costs for grant revenues as a separate cost category. Therefore, we do not calculate direct cost margins associated with grant revenues but, rather, we view these revenues as being supported by indirect corporate expenses.
Costs associated with licensing revenue tend to be a mixture of IP costs as well as management and administrative expenses that are indirect in nature. As such, we do not assign direct costs to licensing revenues. Where revenues from a license agreement can be assigned to specific product revenues, we classify these revenues as product sales and, using our standard cost system, assign direct costs to those sales.
The remaining “non-direct” costs of operating our manufacturing facilities are recorded as unallocated manufacturing expenses. These expenses include personnel costs, rent, utilities, indirect supplies, depreciation, and related indirect expenses. Unallocated manufacturing expenses are expensed as incurred. We allocate these costs as direct product costs on the basis of the proportion of these expenses that would be representative product costs if we were operating our factory at full capacity.
For the three months ended March 31, 2016, unallocated manufacturing expenses decreased by $54,389 or 14% from the comparable period in 2015. The largest part of this decrease was due to decreased payroll, tax and benefit costs as compared with the prior year.
Research and Development Expenses
For the three months ended March 31, 2016, research and development expenses decreased by $166,000 or 44% from the comparable period in 2015. The largest part of this decrease was due to reduced payroll, tax and benefit costs as compared with the prior year.
Selling, General and Administrative Expenses
During the first three months of 2016 we incurred selling, general and administrative expenses (SGA) of $1.1 million. This represents an increase from the same period in the prior year of $49,000 or 4.7%. As we continue to grow and gain traction in the marketplace these expenses will fluctuate but should stabilize and become more fixed in nature as we achieve economies of scale. The increased SGA expenses in the current year include a 62% increase in professional fees associated with the preparation of the Company’s initial public offering of common stock (“IPO”).
Other Income (Expense)
The following table shows a comparison of other income and expense by major component for the three months ended March 31, 2016 and 2015:
| | | Three Months ended March 31 | | | Change 2015 -2016 | |
| | | 2016 | | | 2015 | | | $ | | | % | |
| | | | | | | | | | | | | |
| Incentive Refund & Interest Income | | $ | 24,153 | | | $ | 24,455 | | | $ | (302 | ) | | | (1.2 | ) |
| Interest Expense | | | (83,801 | ) | | | (510,827 | ) | | | 427,026 | | | | (83.6 | ) |
| Gain (loss) from change in fair value of derivative liability - warrants | | | 89,765 | | | | 96,299 | | | | (6,534 | ) | | | (6.8 | ) |
| | | | | | | | | | | | | | | | | |
| Total | | $ | 30,117 | | | $ | (390,073 | ) | | $ | 420,190 | | | | 107.7 | |
Interest expense for the three months ended March 31, 2016 decreased by 83.6% from the same period in 2015, because the prior year reflected interest expense on convertible notes. These convertible notes were converted into Series A Preferred Stock on December 31, 2015 in accordance with the terms of the agreements.
Cash Flow Summary
Net cash used by operating activities decreased by 30.8% during the three months ended March 31, 2016 as compared to the same period in 2015, because of reduced operating expenses, as discussed above. The following condensed cash flow statement compares cash flow from operating, investing and financing activities for the three months ended March 31, 2016 and 2015.
| | | Three Months Ended March 31 | | | Change 2015 - 2016 | |
| | | 2016 | | | 2015 | | | $ | | | % | |
| Cash, beginning of period | | $ | 1,060,224 | | | $ | 2,088,866 | | | $ | (1,028,642 | ) | | | (49.2 | ) |
| Net Cash provided (used) by: | | | | | | | | | | | | | | | | |
| Operating activities | | | (1,017,615 | ) | | | (1,470,189 | ) | | | 452,574 | | | | (30.8 | ) |
| Investing Activities | | | (38,709 | ) | | | (38,627 | ) | | | (82 | ) | | | 0.2 | |
| Financing Activities | | | 528,591 | | | | (1,102 | ) | | | 529,693 | | | | (48066.5 | ) |
| Net increase (decrease) in cash | | | (527,733 | ) | | | (1,509,918 | ) | | | 982,185 | | | | (65.0 | ) |
| Cash, end of period | | $ | 532,491 | | | $ | 578,948 | | | $ | (46,457 | ) | | | (8.0 | ) |
Investment activities for the three months ended March 31, 2016 included net capital expenditures for the purchase of property and equipment of $13,873 and $24,836 for intellectual property as compared with $29,152 for property and equipment and $9,475 for intellectual property during the corresponding period in 2015. These levels of capital expenditures are significantly lower than expected in the future as we begin to ramp up our production capacity to meet customer orders. Therefore, these expenditures should not be interpreted as indicative of future expenditures in this area.
Liquidity and Capital Expenditures
Ongoing cash flow from operations has been negative throughout our history. In addition, we have invested significant amounts in research and manufacturing capabilities. We anticipate that we will need to invest further to support ongoing operations for a minimum of another one to two years. We believe that cash on hand of $532,491 as of March 31, 2016 is sufficient to finance our business through the end of May 2016. Our registration statement on Form S-1 for our IPO was declared effective on April 13, 2016, and we are now in the process of conducting our IPO. Our plan is also to further develop customer relationships and increase our revenues derived from our products and IP licensing.
The Company’s financial projections show that the Company may need to raise an additional $15,000,000 or more before it is capable of achieving sustainable cash flow from operations. We intend that the primary means for raising such funds will be through our currently ongoing IPO. However, we cannot make any assurance that we will be able to raise these funds or that the terms and conditions of future financing will be workable or acceptable for the Company and its shareholders.
We also currently forecast a need for additional capital expenditures to execute on our business plan. The amount and timing of such expenditures will be dependent on the timing and magnitude of sales orders received from customers, but we currently anticipate a need to invest approximately $1,000,000 to $6,000,000 during the next twelve months. We plan to fund these investments through a mixture of capital lease financing, debt financing, and from the proceeds of our IPO. If we are unable to obtain such financing, we may be forced to curtail our investment activities and this may limit our ability to grow our revenues as fast as we would like.
Additionally, we anticipate that as our sales increase we will need to invest funds in working capital to support additional inventory and accounts receivable. Taken together, these multiple cash requirements will likely exceed our cash flow from operations for at least one to two more years.
Although there can be no guarantee of successful funding in the future, we intend to pursue the sale of additional equity securities, as well as additional debt or lease financing in the future, until such time as ongoing revenues allow us to generate a positive monthly cash flow from the business sufficient to cover our cash requirements.
In the event we are unable to fund our operations from existing cash on hand, operating cash flows, additional debt or equity capital, we may be forced to reduce our expenses, slow down our growth rate, or discontinue operations. Our consolidated financial statements do not include any adjustments relating to the recoverability and classification of recorded asset amounts or the amounts and classification of liabilities that might be necessary should we be unable to continue as a going concern.
Item 3. Quantitative and Qualitative Disclosures about Market Risk
Smaller reporting companies are not required to provide this information.
Item 4. Controls and Procedures
(a)Evaluation of disclosure controls and procedures. At the conclusion of the period ended March 31, 2016, we carried out an evaluation, under the supervision and with the participation of our management, including our Principal Executive Officer/Principal Financial Officer, of the effectiveness of the design and operation of our disclosure controls and procedures (as such term is defined in Rules 13a-15(e) and 15d-15(e) under the Securities Exchange Act of 1934 (the “Exchange Act”)). Based upon that evaluation, our Principal Executive Officer/Principal Financial Officer concluded that as of March 31, 2016, our disclosure controls and procedures were effective and adequately designed to ensure that the information required to be disclosed by us in the reports we submit under the Exchange Act is recorded, processed, summarized and reported within the time periods specified in the applicable rules and forms and that such information was accumulated and communicated to our Principal Executive Officer/Principal Financial Officer, in a manner that allowed for timely decisions regarding required disclosure.
We do not expect that our disclosure controls and procedures will prevent all errors and all instances of fraud. Disclosure controls and procedures, no matter how well conceived and operated, can provide only reasonable, not absolute, assurance that the objectives of the disclosure controls and procedures are met. Further, the design of disclosure controls and procedures must reflect the fact that there are resource constraints, and the benefits must be considered relative to their costs. Because of the inherent limitations in all disclosure controls and procedures, no evaluation of disclosure controls and procedures can provide absolute assurance that we have detected all our control deficiencies and instances of fraud, if any. The design of disclosure controls and procedures also is based partly on certain assumptions about the likelihood of future events, and there can be no assurance that any design will succeed in achieving its stated goals under all potential future conditions.
(b)Changes in internal controls. There were no changes in our internal control over financial reporting that occurred during our last fiscal quarter that have materially affected, or are reasonably likely to materially affect, our internal control over financial reporting.
PART II - OTHER INFORMATION
Item 1. Legal Proceedings.
Beginning in 2014, POSCO, one of our licensees and a shareholder, has had a contractual obligation to pay us a minimum fee of $100,000 per year to license certain technologies. This obligation is due annually on February 28 of the following year. We record this license revenue at a rate of $25,000 per quarter. POSCO is disputing that they are obligated to pay the royalties. A petition for arbitration has been filed for this matter by the Company on March 9, 2016.
Item 1A. Risk Factors.
Smaller reporting companies are not required to provide this information.
Item 2. Unregistered Sales of Equity Securities and Use of Proceeds.
On March 9, 2016 we commenced a private placement of promissory notes and warrants to purchase common stock to existing shareholders. The notes are non-convertible and mature on December 31, 2016. The warrants have a five year maturity date with a strike price of $10.00 per share.
During the period from March 9 through March 31, 2016, we issued promissory notes in an aggregate amount of $530,000 and issued warrants to purchase 10,600 shares of common stock.
No underwriters were utilized and no commissions or fees were paid with respect to any of the above transactions. These persons were the only offerees in connection with these transactions. We relied on Regulation S, Section 4(a)(2) and/or Rule 506 of Regulation D of the Securities Act for the transactions set forth above since none of the transactions involved any public offering.
Item 3. Defaults Upon Senior Securities.
None.
Item 4. Mine Safety Disclosures.
None.
Item 5. Other Information.
Michael Knox retired from the Company and resigned as Chief Financial Officer, Senior Vice President, Secretary and as a Director effective February 24, 2016. David Pendell was appointed to serve as a member of the Board of Directors effective February 24, 2016 to fill the vacancy created with Mr. Knox’s retirement.
On February 26, 2016, our Shareholders Agreement was amended to provide that holders of Excluded Stock (as defined in the Shareholders Agreement) are not subject to the terms of the Shareholders Agreement. Excluded Stock means, among other things, shares of common stock that are subject to a registration statement that has been filed with the SEC and has been declared effective.
The Amendment to Shareholders Agreement takes effect when (i) a majority of the Board of Directors and shareholders holding at least 60% of the voting power of all shares of Shareholder Stock have consented to the amendment to the Shareholders Agreement, and (ii) a registration statement registering shares of common stock has been filed with the SEC and declared effective. Both conditions have been satisfied as a result of the Company’s Registration Statement (File No. 333-209131) on Form S-1 becoming effective on April 13, 2016.
The amendment to Shareholders Agreement amends the termination date of the Shareholders Agreement. Specifically, the Shareholders Agreement has been amended to provide that it continues in effect until (i) the date of the closing of a public offering of common stock pursuant to a registration statement filed with the SEC that is declared effective in which the Company receives gross proceeds of at least $10,000,000, on which date it shall terminate in its entirety, unless the Shareholders Agreement is earlier terminated in accordance with its terms, or (ii) the date on which the Company’s common stock is listed on the NASDAQ Stock Market of the New York Stock Exchange. As a result, in the event that the Company is unable to raise at least $10,000,000 in its IPO, the Shareholders Agreement will continue to remain in effect. In addition, the amendment to the Shareholders Agreement clarifies that certain preemptive rights shall not apply to Excluded Stock.
Item 6. Exhibits.
EXHIBIT
NUMBER | | DESCRIPTION | | LOCATION |
| | | | | |
| 3.1 | | Articles of Incorporation of XG Sciences, Inc. (formerly known as XG Nano, Inc.) dated May 23, 2006 | | Incorporated by reference to the Company’s Form S-1 filed with the SEC on January 26, 2016 |
| | | | | |
| 3.2 | | Certificate of Amendment to Articles of Incorporation of XG Sciences, Inc. dated August 31, 2006 (name change) | | Incorporated by reference to the Company’s Form S-1 filed with the SEC on January 26, 2016 |
| | | | | |
| 3.3 | | Certificate of Amendment to Articles of Incorporation of XG Sciences, Inc. dated March 23, 2009 (increase of authorized common stock) | | Incorporated by reference to the Company’s Form S-1 filed with the SEC on January 26, 2016 |
| | | | | |
| 3.4 | | Certificate of Designations of Series A Convertible Preferred Stock, dated March 18, 2013 | | Incorporated by reference to the Company’s Form S-1 filed with the SEC on January 26, 2016 |
| | | | | |
| 3.5 | | Certificate of Amendment to Articles of Incorporation of XG Sciences, Inc. dated June 26, 2013 (increase of authorized common stock and authorization of preferred stock) | | Incorporated by reference to the Company’s Form S-1 filed with the SEC on January 26, 2016 |
| | | | | |
| 3.6 | | Amended and Restated Certificate of Designations of Series A Convertible Preferred Stock, dated June 26, 2013 | | Incorporated by reference to the Company’s Form S-1 filed with the SEC on January 26, 2016 |
| | | | | |
| 3.7 | | First Amendment to the Amended and Restated Certificate of Designations of Series A Convertible Preferred Stock, dated November 20, 2013 | | Incorporated by reference to the Company’s Form S-1 filed with the SEC on January 26, 2016 |
| | | | | |
| 3.8 | | Restated Bylaws dated January 15, 2014 | | Incorporated by reference to the Company’s Form S-1 filed with the SEC on January 26, 2016 |
| | | | | |
| 3.9 | | Certificate of Designations of Series B Convertible Preferred Stock, effective September 9, 2015 | | Incorporated by reference to the Company’s Form S-1 filed with the SEC on January 26, 2016 |
| | | | | |
| 4.1 | | Warrant to Purchase 5,000 Shares of Common Stock, dated October 8, 2012, issued by XG Sciences, Inc. to Michael R. Knox, together with Notice and Certificate of Adjustment to Warrant, dated August 21, 2013 | | Incorporated by reference to the Company’s Form S-1 filed with the SEC on January 26, 2016 |
| | | | | |
| 4.2 | | Warrant to Purchase 833,333 Shares of Series A Convertible Preferred Stock, dated January 15, 2014, issued by XG Sciences, Inc. to Aspen Advanced Opportunity Fund, LP | | Incorporated by reference to the Company’s Form S-1 filed with the SEC on January 26, 2016 |
| | | | | |
| 4.3 | | Warrant to Purchase 83,333 Shares of Series A Convertible Preferred Stock, dated January 15, 2014, issued by XG Sciences, Inc. to XGS II, LLC | | Incorporated by reference to the Company’s Form S-1 filed with the SEC on January 26, 2016 |
| | | | | |
| 4.4 | | Warrant to Purchase 100,000 Shares of Series A Convertible Preferred Stock, dated January 15, 2014, issued by XG Sciences, Inc. to SVIC No. 15 New Technology Business Investment L.L.P. | | Incorporated by reference to the Company’s Form S-1 filed with the SEC on January 26, 2016 |
| 10.1 | | Technology Licensing Agreement between XGS and Michigan State University dated July 27, 2007 and amended on May 24, 2010 and May 27, 2011 | | Incorporated by reference to the Company’s Form S-1 filed with the SEC on January 26, 2016 |
| | | | | |
| 10.2 | | Lease between XG Sciences, Inc. and Quality Dairy Company, dated January 3, 2008 | | Incorporated by reference to the Company’s Form S-1 filed with the SEC on January 26, 2016 |
| | | | | |
| 10.3 | | Amendment to Technology Licensing Agreement between XGS and Michigan State University dated May 24, 2010 | | Incorporated by reference to the Company’s Form S-1 filed with the SEC on January 26, 2016 |
| | | | | |
| 10.4 | | Amendment to Technology Licensing Agreement between XGS and Michigan State University dated May 27, 2011 | | Incorporated by reference to the Company’s Form S-1 filed with the SEC on January 26, 2016 |
| | | | | |
| 10.5 | | Lease between XG Sciences, Inc. and Dart Container of Michigan LLC, dated September 1, 2011 | | Incorporated by reference to the Company’s Form S-1, as amended, filed with the SEC on March 1, 2016 |
| | | | | |
| 10.6 | | Amendment to Lease between XG Sciences, Inc. and Dart Container of Michigan LLC, dated August 15, 2011 | | Incorporated by reference to the Company’s Form S-1 filed with the SEC on January 26, 2016 |
| | | | | |
| 10.7 | | Amendment to Lease between XG Sciences, Inc. and Dart Container of Michigan LLC, dated November 16, 2012 | | Incorporated by reference to the Company’s Form S-1 filed with the SEC on March 22, 2016 |
| | | | | |
| 10.8 | | $300,000 Line of Credit Note, dated March 18, 2013, issued by XG Sciences, Inc. to Michael R. Knox | | Incorporated by reference to the Company’s Form S-1 filed with the SEC on January 26, 2016 |
| | | | | |
| 10.9 | | Letter Agreement, dated March 18, 2013, by and between XG Sciences, Inc. and Michael R. Knox | | Incorporated by reference to the Company’s Form S-1 filed with the SEC on January 26, 2016 |
| | | | | |
| 10.10 | | Shareholder Agreement, dated March 18, 2013, by and among XG Sciences, Inc. and the stockholder signatories thereto. | | Incorporated by reference to the Company’s Form S-1 filed with the SEC on January 26, 2016 |
| | | | | |
| 10.11 | | Master Lease Agreement, dated March 18, 2013, by and between XG Sciences, Inc. and Aspen Advanced Opportunity Fund, LP | | Incorporated by reference to the Company’s Form S-1 filed with the SEC on January 26, 2016 |
| | | | | |
| 10.12 | | Employment Agreement dated December 16, 2013, by and between Philip L. Rose and XG Sciences | | Incorporated by reference to the Company’s Form S-1, as amended, filed with the SEC on March 22, 2016 |
| 10.13 | | Employment Agreement dated January 13, 2014 by and between Michael R. Knox and XG Sciences | | Incorporated by reference to the Company’s Form S-1 filed with the SEC on January 26, 2016 |
| | | | | |
| 10.14 | | $772,998.15 Secured Convertible Promissory Note, dated January 15, 2014, issued by XG Sciences, Inc. to Michael R. Knox | | Incorporated by reference to the Company’s Form S-1 filed with the SEC on January 26, 2016 |
| | | | | |
| 10.15 | | Second Amended & Restated Purchase Agreement, dated January 15, 2014, by and between XG Sciences, Inc. and Aspen Advanced Opportunity Fund, LP | | Incorporated by reference to the Company’s Form S-1, as amended, filed with the SEC on March 1, 2016 |
| | | | | |
| 10.16 | | $4,178,330.92 Secured Convertible Promissory Note, dated January 15, 2014, issued by XG Sciences, Inc. and XG Sciences IP, LLC to Aspen Advanced Opportunity Fund, LP | | Incorporated by reference to the Company’s Form S-1 filed with the SEC on January 26, 2016 |
| | | | | |
| 10.17 | | $1,300,000 Secured Convertible Promissory Note, dated March 18, 2014, issued by XG Sciences, Inc. and XG Sciences IP, LLC to Aspen Advanced Opportunity Fund, LP | | Incorporated by reference to the Company’s Form S-1 filed with the SEC on January 26, 2016 |
| | | | | |
| 10.18 | | $900,000 Secured Convertible Promissory Note, dated March 31, 2014, issued by XG Sciences, Inc. and XG Sciences IP, LLC to Aspen Advanced Opportunity Fund, LP | | Incorporated by reference to the Company’s Form S-1 filed with the SEC on January 26, 2016 |
| | | | | |
| 10.19 | | Amended & Restated Purchase Agreement, dated January 15, 2014, by and between XG Sciences, Inc. and XGS II, LLC | | Incorporated by reference to the Company’s Form S-1, as amended, filed with the SEC on March 1, 2016 |
| | | | | |
| 10.20 | | $739,349.83 Secured Convertible Promissory Note, dated January 15, 2014, issued by XG Sciences, Inc. and XG Sciences IP, LLC to XGS II, LLC | | Incorporated by reference to the Company’s Form S-1 filed with the SEC on January 26, 2016 |
| | | | | |
| 10.21 | | Purchase Agreement, dated January 15, 2014, by and between XG Sciences, Inc. and SVIC No. 15 New Technology Business Investment L.L.P. | | Incorporated by reference to the Company’s Form S-1, as amended, filed with the SEC on March 1, 2016 |
| | | | | |
| | | | | |
| 10.22 | | $3,000,000 Secured Convertible Promissory Note, dated January 15, 2014, issued by XG Sciences, Inc. and XG Sciences IP, LLC to SVIC No. 15 New Technology Business Investment L.L.P. | | Incorporated by reference to the Company’s Form S-1 filed with the SEC on January 26, 2016 |
| | | | | |
| 10.23 | | License Agreement, dated January 15, 2014, by and between XG Sciences, Inc. and XG Sciences IP, LLC | | Incorporated by reference to the Company’s Form S-1 filed with the SEC on January 26, 2016 |
| 10.24 | | Second Amended and Restated Security Agreement, dated January 15, 2014, by and among XG Sciences, Inc., Aspen Advanced Opportunity Fund, LP, XGS II, LLC, SVIC No. 15 New Technology Business Investment L.L.P.
and Michael R. Knox | | Incorporated by reference to the Company’s Form S-1 filed with the SEC on January 26, 2016 |
| | | | | |
| 10.25 | | Second Amended and Restated Intellectual Property Security Agreement, dated January 15, 2014, by and among XG Sciences, Inc., Aspen Capital Advisors LLC, Aspen Advanced Opportunity Fund, LP, XGS II, LLC, SVIC No. 15 New Technology Business Investment L.L.P. and Michael R. Knox | | Incorporated by reference to the Company’s Form S-1 filed with the SEC on January 26, 2016 |
| | | | | |
| 10.26 | | Second Amended and Restated Inter-creditor Agreement, dated January 15, 2014 by and among XG Sciences, Inc., Aspen Advanced Opportunity Fund, LP, XGS II, LLC, SVIC No. 15 New Technology Business Investment L.L.P. and Michael R. Knox | | Incorporated by reference to the Company’s Form S-1 filed with the SEC on January 26, 2016 |
| | | | | |
| 10.27 | | Second Amended and Restated Registration Rights Agreement, dated January 15, 2014, by and among XG Sciences, Inc., Aspen Advanced Opportunity Fund, LP, XGS II, LLC and SVIC No. 15 New Technology Business Investment L.L.P. | | Incorporated by reference to the Company’s Form S-1 filed with the SEC on January 26, 2016 |
| | | | | |
| 10.28 | | Voting Agreement, dated January 15, 2014, by and among XG Sciences, Inc., SVIC No. 15 New Technology Business Investment L.L.P and the stockholder signatories thereto. | | Incorporated by reference to the Company’s Form S-1 filed with the SEC on January 26, 2016 |
| | | | | |
| 10.29 | | Assignment of Intellectual Property, dated January 15, 2014, by and between XG Sciences, Inc. and XG Sciences IP, LLC | | Incorporated by reference to the Company’s Form S-1 filed with the SEC on January 26, 2016 |
| | | | | |
| 10.30 | | Letter Agreement dated January 15, 2014, by and among XG Sciences, Inc., Aspen Advanced Opportunity Fund, LP, XGS II, LLC and SVIC No. 15 New Technology Business Investment L.L.P. and Michael Knox | | Incorporated by reference to the Company’s Form S-1 filed with the SEC on January 26, 2016 |
| | | | | |
| 10.31 | | Form of Distribution Agreement | | Incorporated by reference to the Company’s Form S-1 filed with the SEC on January 26, 2016 |
| | | | | |
| 10.32 | | Form of Subscription Agreement for Series B Unit Offering | | Incorporated by reference to the Company’s Form S-1 filed with the SEC on January 26, 2016 |
| 10.33 | | Form of Warrant for Series B Unit Offering | | Incorporated by reference to the Company’s Form S-1 filed with the SEC on January 26, 2016 |
| | | | | |
| 10.34 | | Form of December Note for December Placement | | Incorporated by reference to the Company’s Form S-1 filed with the SEC on January 26, 2016 |
| | | | | |
| 10.35 | | Form of December Warrant for December Placement | | Incorporated by reference to the Company’s Form S-1 filed with the SEC on January 26, 2016 |
| | | | | |
| 10.36 | | Form of Subscription Agreement for December Placement | | Incorporated by reference to the Company’s Form S-1 filed with the SEC on January 26, 2016 |
| | | | | |
| 10.37 | | Form of Subscription Agreement for Primary Offering | | Incorporated by reference to the Company’s Form S-1, as amended, filed with the SEC on April 5, 2016 |
| | | | | |
| 10.38 | | First Amendment to Shareholder Agreement, dated February 26, 2016 | | Incorporated by reference to the Company’s Form S-1, as amended, filed with the SEC on March 1, 2016 |
| | | | | |
31.1 | | Certifications of the Chief Executive Officer and Principal Financial Officer pursuant to Section 302 of the Sarbanes-Oxley Act of 2002 | | Filed herewith |
| | | | | |
| 32.1 | | Certification Pursuant To 18 U.S.C. Section 1350, As Adopted Pursuant To Section 906 of the Sarbanes-Oxley Act Of 2002* | | Furnished herewith |
| | | | | |
| 101. INS | | XBRL Instance Document | | Filed herewith |
| | | | | |
| 101. CAL | | XBRL Taxonomy Extension Calculation Link base Document | | Filed herewith |
| | | | | |
| 101. DEF | | XBRL Taxonomy Extension Definition Link base Document | | Filed herewith |
| | | | | |
| 101. LAB | | XBRL Taxonomy Label Link base Document | | Filed herewith |
| | | | | |
| 101. PRE | | XBRL Extension Presentation Link base Document | | Filed herewith |
| | | | | |
| 101. SCH | | XBRL Taxonomy Extension Scheme Document | | Filed herewith |
SIGNATURES
Pursuant to the requirements of the Securities Exchange Act of 1934, as amended, the registrant has duly caused this Quarterly Report on Form 10-Q to be signed on its behalf by the undersigned, thereunto duly authorized.
XG SCIENCES, INC.
| Dated: May 16, 2016 | By: | | /s/ Philip L. Rose |
| | Name: | | Philip L. Rose |
| | Title: | | Chief Executive Officer, President,
Treasurer, Principal Executive Officer and
Principal Financial Officer |
| | | | |
| Dated: May 16, 2016 | By: | | /s/ Corinne Lyon |
| | Name: | | Corinne Lyon |
| | Title: | | Controller and Principal Accounting Officer |