                                  UNITED STATES
                       SECURITIES AND EXCHANGE COMMISSION
                             WASHINGTON, D.C. 20549

                                   FORM N-CSR


              CERTIFIED SHAREHOLDER REPORT OF REGISTERED MANAGEMENT
                              INVESTMENT COMPANIES

Investment Company Act file number 811-234

                        Seligman Common Stock Fund, Inc.
               (Exact name of Registrant as specified in charter)

                                 100 Park Avenue
                            New York, New York 10017
               (Address of principal executive offices) (Zip code)

                                Lawrence P. Vogel
                                 100 Park Avenue
                            New York, New York 10017
                     (Name and address of agent for service)

Registrant's telephone number, including area code:               (212) 850-1864


Date of fiscal year end:                    12/31

Date of reporting period:                   6/30/05


ITEM 1.  REPORTS TO STOCKHOLDERS.
|
Seligman |
Common Stock Fund, Inc. |
|
|
| | |
| Mid-Year Report | |
| June 30, 2005 | |
| | |
| Seeking Total Return | |
| Through a Combination | |
| of Capital Appreciation | |
| and Current Income | |
| | |
| 
| |
| | |
| J. & W. SELIGMAN & CO. | |
| INCORPORATED | |
| ESTABLISHED 1864 | |
| 100 Park Avenue, New York, NY 10017 | |
|
Seligman |
141 Years of Investment Experience |
|
J. & W. Seligman & Co. Incorporated is a firm with a long tradition of investment expertise, offering a broad array of investment choices to help today’s investors seek their long-term financial goals.
Established in 1864, Seligman has a history of providing financial services marked not by fanfare, but rather by a quiet and firm adherence to financial prudence. While the world has changed dramatically in the 141 years since Seligman first opened its doors, the firm has continued to offer its clients high-quality investment solutions through changing times.
In the late 19th century, as the country grew, Seligman helped finance the westward expansion of the railroads, the construction of the Panama Canal, and the launching of urban transit systems. In the early 20th century, the firm helped fund the growing capital needs of new industries, including the nascent automobile and steel industries.
With the formation of Tri-Continental Corporation in 1929 — today, one of the nation’s largest diversified publicly-traded closed-end equity investment companies — Seligman began shifting its emphasis to investment management. In 1930, Seligman established what would be the first in an impressive lineup of mutual funds.
Seligman is proud of its distinctive past and of the traditional values that continue to shape the firm’s business decisions and investment judgment. While much has changed over the years, the firm’s commitment to providing prudent investment management that seeks to build wealth for clients over time is an enduring value that will continue to guide Seligman.
Table of Contents
Your mid-year shareholder report for Seligman Common Stock Fund, Inc. follows this letter. This report contains the Fund’s investment results and financial statements, including a portfolio of investments.
For the six months ended June 30, 2005, the Fund posted a total return of –2.25% based on the net asset value of Class A shares. During the same period, the Lipper Large-Cap Core Funds Average and the S&P 500 Index returned –1.20% and –0.81%, respectively.
We appreciate your continued support of Seligman Common Stock Fund, Inc. and look forward to serving your investment needs for many years to come.
By Order of the Board of Directors,

William C. Morris
Chairman

Brian T. Zino
President
August 12, 2005
| | | |
Manager | Shareholder Service Agent | Important Telephone Numbers |
J. & W. Seligman & Co. | Seligman Data Corp. | (800) 221-2450 | Shareholder Services |
Incorporated | 100 Park Avenue | (800) 445-1777 | Retirement Plan |
100 Park Avenue | New York, NY 10017 | | Services |
New York, NY 10017 | | (212) 682-7600 | Outside the |
| General Counsel | | United States |
General Distributor | Sullivan & Cromwell LLP | (800) 622-4597 | 24-Hour Automated |
Seligman Advisors, Inc. | | | Telephone Access |
100 Park Avenue | | | Service |
New York, NY 10017 | | | |
1
Performance and Portfolio Overview
This section of the report is intended to help you understand the performance of Seligman Common Stock Fund and to provide a summary of the Fund’s portfolio characteristics.
Performance data quoted in this report represents past performance and does not guarantee future investment results. The rates of return will vary and the principal value of an investment will fluctuate. Shares, if redeemed, may be worth more or less than their original cost. Current performance may be lower or higher than the performance data quoted. Total returns of the Fund as of the most recent month end will be available at www.seligman.com1 by the seventh business day following that month end. Calculations assume reinvestment of distributions. Performance data quoted does not reflect the deduction of taxes that an investor may pay on distributions or the redemption of shares.
Returns for Class A shares are calculated with and without the effect of the initial 4.75% maximum sales charge. Returns for Class B shares are calculated with and without the effect of the maximum 5% contingent deferred sales charge (“CDSC”), charged on redemptions made within one year of purchase, declining to 1% in the sixth year and 0% thereafter. The return from inception for Class B shares reflects automatic conversion to Class A shares approximately eight years after inception date. Returns for Class C shares are calculated with and without the effect of the initial 1% maximum sales charge and the 1% CDSC that is charged on redemptions made within 18 months of purchase. Returns for Class D and Class R shares are calculated with and without the effect of the 1% CDSC, charged on redemptions made within one year of purchase. Class I shares do not have sales charges.
| |
|
1 | The reference to Seligman’s website is an inactive textual reference and information contained in or otherwise accessible through Seligman’s website does not form a part of this report or the Fund’s prospectus. |
2
Performance and Portfolio Overview
| | | | | | | | | | | | | | | | | | | | | | | | | | | | | | | | | |
Investment Results
Total Returns
For Periods Ended June 30, 2005 | |
|
| | | | | Average Annual |
| | | | |
|
Class A | | Six
Months* | One
Year | Five
Years | Ten
Years | Class B
Since
Inception
4/22/96 | | Class C
Since
Inception
5/27/99 | Class I
Since
Inception
11/30/01 | Class R
Since
Inception
4/30/03 |
|
With Sales Charge | | | (6.91 | )% | | 0.18 | % | | (5.42 | )% | | 3.68 | % | | | n/a | | | | | n/a | | | | | n/a | | | | | n/a | | |
|
Without Sales Charge | | | (2.25 | ) | | 5.18 | | | (4.49 | ) | | 4.18 | | | | n/a | | | | | n/a | | | | | n/a | | | | | n/a | | |
|
Class B | | | | | | | | | | | | | | | | | | | | | | | | | | | | | | | | | |
|
With CDSC† | | | (7.51 | ) | | (0.66 | ) | | (5.60 | ) | | n/a | | | | n/a | | | | | n/a | | | | | n/a | | | | | n/a | | |
|
Without CDSC | | | (2.64 | ) | | 4.34 | | | (5.22 | ) | | n/a | | | | 2.22 | %‡ | | | | n/a | | | | | n/a | | | | | n/a | | |
|
Class C | | | | | | | | | | | | | | | | | | | | | | | | | | | | | | | | | |
|
With Sales Charge and CDSC†† | | | (4.53 | ) | | 2.27 | | | (5.42 | ) | | n/a | | | | n/a | | | | | (4.58 | )% | | | | n/a | | | | | n/a | | |
|
Without Sales Charge and CDSC | | | (2.64 | ) | | 4.33 | | | (5.22 | ) | | n/a | | | | n/a | | | | | (4.42 | ) | | | | n/a | | | | | n/a | | |
|
Class D | | | | | | | | | | | | | | | | | | | | | | | | | | | | | | | | | |
|
With 1% CDSC | | | (3.52 | ) | | 3.43 | | | n/a | | | n/a | | | | n/a | | | | | n/a | | | | | n/a | | | | | n/a | | |
|
Without CDSC | | | (2.55 | ) | | 4.43 | | | (5.22 | ) | | 3.38 | | | | n/a | | | | | n/a | | | | | n/a | | | | | n/a | | |
|
Class I | | | (2.07 | ) | | 5.56 | | | n/a | | | n/a | | | | n/a | | | | | n/a | | | | | 0.29 | % | | | | n/a | | |
|
Class R | | | | | | | | | | | | | | | | | | | | | | | | | | | | | | | | | |
|
With 1% CDSC | | | (3.31 | ) | | 4.04 | | | n/a | | | n/a | | | | n/a | | | | | n/a | | | | | n/a | | | | | n/a | | |
|
Without CDSC | | | (2.33 | ) | | 5.04 | | | n/a | | | n/a | | | | n/a | | | | | n/a | | | | | n/a | | | | | 13.37 | % | |
|
Lipper Large-Cap | | | | | | | | | | | | | | | | | | | | | | | | | | | | | | | | | |
Core Funds Average** | | | (1.20 | ) | | 4.41 | | | (3.62 | ) | | 8.15 | | | | 6.51 | Ø | | | | (0.48 | ) | | | | 1.10 | | | | | 12.37 | | |
|
S&P 500** | | | (0.81 | ) | | 6.32 | | | (2.37 | ) | | 9.94 | | | | 8.56 | | | | | 0.32 | | | | | 3.01 | | | | | 14.85 | | |
|
Net Asset Value Per Share
| | | | | | | | | | | | | | | | | | | |
| | Class A | | Class B | | Class C | | Class D | | Class I | | Class R | |
|
6/30/05 | | $ | 11.32 | | $ | 11.07 | | $ | 11.08 | | $ | 11.08 | | $ | 11.37 | | $ | 11.31 | |
|
12/31/04 | | | 11.58 | | | 11.37 | | | 11.38 | | | 11.37 | | | 11.61 | | | 11.58 | |
|
6/30/04 | | | 10.83 | | | 10.61 | | | 10.62 | | | 10.61 | | | 10.87 | | | 10.81 | |
|
| | |
* | | Returns for periods of less than one year are not annualized. |
** | | The Lipper Large-Cap Core Funds Average (“Lipper Average”) and the Standard & Poor’s 500 Composite Index (“S&P 500”) are unmanaged benchmarks that assume reinvestment of all distributions and exclude the effect of taxes and sales charges. The S&P 500 also excludes the effect of fees. The Lipper Average measures the performance of funds, that, by portfolio practise, invest at least 75% of their equity assets in companies with market capitalization (on a three-year weighted basis) greater than 300% of the dollar weighted median market capitalization of the middle 1,000 securities of the S&P SuperComposite 1500 Index ($13.5 billion at June 30, 2005). Large-cap core funds have more latitude in the companies in which they invest. These funds typically have an average price-to-earnings ratio, price to book ratio, and three-year sales-per-share growth value, compared to the S&P 500. The S&P 500 measures the performance of 500 of the largest US companies based on market capitalizations. Investors cannot invest directly in an average or index. |
† | | The CDSC is 5% for periods of one year or less and 2% for the five-year period. |
†† | | The CDSC is 1% for periods of 18 months or less. |
ø | | From April 25, 1996. |
‡ | | Return from inception for Class B shares reflects automatic conversion to Class A shares approximately eight years after the inception date. |
3
Performance and Portfolio Overview
| | | | | | | | | | | | | | | | | | | | |
Diversification of Net Assets
June 30, 2005 | | | | | | | | | | | | |
|
| | | | | | | | | | | Percent of Net Assets | |
| | | | | | | | | | |
|
Common Stocks and Warrants: | | | Issues | | | Cost | | | Value | | June 30,
2005 | | December 31,
2004* | |
|
Aerospace and Defense | | | 2 | | $ | 4,332,520 | | $ | 4,836,711 | | | | 1.8 | | | | | 0.6 | | |
|
Air Freight and Logistics | | | 1 | | | 1,301,250 | | | 1,117,938 | | | | 0.4 | | | | | — | | |
|
Auto Components | | | — | | | — | | | — | | | | — | | | | | 1.1 | | |
|
Beverages | | | 2 | | | 7,129,156 | | | 6,734,957 | | | | 2.5 | | | | | 2.7 | | |
|
Biotechnology | | | 2 | | | 5,768,929 | | | 4,610,585 | | | | 1.7 | | | | | 1.1 | | |
|
Building Products | | | 1 | | | 1,141,250 | | | 1,302,160 | | | | 0.5 | | | | | 0.5 | | |
|
Capital Markets | | | 4 | | | 8,993,788 | | | 8,854,879 | | | | 3.2 | | | | | 2.9 | | |
|
Chemicals | | | 3 | | | 5,394,030 | | | 5,891,507 | | | | 2.1 | | | | | 1.9 | | |
|
Commercial Banks | | | 3 | | | 6,282,000 | | | 6,550,793 | | | | 2.4 | | | | | 3.3 | | |
|
Commercial Services and Supplies | | | 3 | | | 6,291,810 | | | 6,554,308 | | | | 2.4 | | | | | 1.7 | | |
|
Communications Equipment | | | 6 | | | 13,767,465 | | | 13,546,347 | | | | 4.9 | | | | | 3.8 | | |
|
Computers and Peripherals | | | 3 | | | 7,641,612 | | | 7,513,914 | | | | 2.7 | | | | | 5.0 | | |
|
Consumer Finance | | | 2 | | | 4,955,319 | | | 6,039,807 | | | | 2.2 | | | | | 1.8 | | |
|
Containers and Packaging | | | 1 | | | 3,511,202 | | | 2,511,453 | | | | 0.9 | | | | | — | | |
|
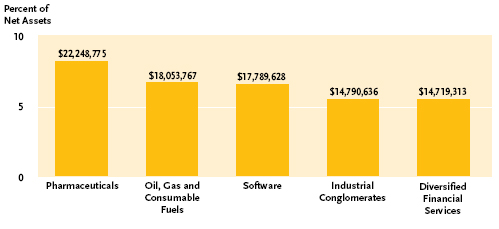
Diversified Financial Services | | | 3 | | | 13,245,380 | | | 14,719,313 | | | | 5.4 | | | | | 4.5 | | |
|
Diversified Telecommunication Services | | | 4 | | | 8,047,607 | | | 7,895,934 | | | | 2.9 | | | | | 2.1 | | |
|
Electric Utilities | | | 2 | | | 3,588,851 | | | 4,140,852 | | | | 1.5 | | | | | 0.5 | | |
|
Electronic Equipment and Instruments | | | 1 | | | 1,395,732 | | | 1,194,270 | | | | 0.4 | | | | | 0.6 | | |
|
Energy Equipment and Services | | | 5 | | | 3,627,806 | | | 4,243,277 | | | | 1.5 | | | | | 0.9 | | |
|
Energy Traders | | | 1 | | | 985,314 | | | 1,596,501 | | | | 0.6 | | | | | 0.9 | | |
|
Food and Staples Retailing | | | 2 | | | 8,545,545 | | | 8,041,568 | | | | 2.9 | | | | | 3.6 | | |
|
Food Products | | | — | | | — | | | — | | | | — | | | | | 1.3 | | |
|
Health Care Equipment and Supplies | | | 2 | | | 3,468,314 | | | 3,263,357 | | | | 1.2 | | | | | 0.4 | | |
|
Health Care Providers and Services | | | 1 | | | 1,049,480 | | | 1,629,576 | | | | 0.6 | | | | | 1.8 | | |
|
Hotels, Restaurants and Leisure | | | 2 | | | 2,747,658 | | | 3,265,884 | | | | 1.2 | | | | | 2.1 | | |
|
Household Products | | | 2 | | | 3,668,378 | | | 4,244,282 | | | | 1.5 | | | | | 2.1 | | |
|
Index Derivatives | | | — | | | — | | | — | | | | — | | | | | 0.8 | | |
|
Industrial Conglomerates | | | 2 | | | 11,673,592 | | | 14,790,636 | | | | 5.4 | | | | | 5.6 | | |
|
Insurance | | | 2 | | | 7,063,623 | | | 7,841,078 | | | | 2.9 | | | | | 4.9 | | |
|
Internet and Catalog Retail | | | 1 | | | 943,775 | | | 1,094,119 | | | | 0.4 | | | | | 0.8 | | |
|
Internet Software and Services | | | 1 | | | 1,056,078 | | | 1,157,143 | | | | 0.4 | | | | | 1.0 | | |
|
Machinery | | | 2 | | | 3,819,151 | | | 4,687,445 | | | | 1.7 | | | | | 2.0 | | |
|
Media | | | 6 | | | 15,250,569 | | | 14,697,182 | | | | 5.4 | | | | | 4.1 | | |
|
Metals and Mining | | | 2 | | | 4,236,224 | | | 3,716,349 | | | | 1.4 | | | | | 1.6 | | |
|
Multiline Retail | | | 2 | | | 2,866,090 | | | 3,012,136 | | | | 1.1 | | | | | 0.5 | | |
|
(Continued on page 5.)
4
Performance and Portfolio Overview
| | | | | | | | | | | | | | | | | | | | | | |
Diversification of Net Assets (continued)
June 30, 2005 |
|
| | | | | | | | | Percent of Net Assets |
| | | | | | | | |
|
Common Stocks and Warrants: | | | Issues | | Cost | | Value | | June 30,
2005 | | December 31,
2004* | |
|
Oil, Gas and Consumable Fuels | | | | 9 | | | $ | 13,194,487 | | $ | 18,053,767 | | | | 6.6 | | | | | 3.8 | | |
|
Paper and Forest Products | | | | — | | | | — | | | — | | | | — | | | | | 0.6 | | |
|
Personal Products | | | | 1 | | | | 1,216,207 | | | 1,225,246 | | | | 0.4 | | | | | — | | |
|
Pharmaceuticals | | | | 7 | | | | 21,338,556 | | | 22,248,775 | | | | 8.1 | | | | | 10.1 | | |
|
Semiconductors and Semiconductor Equipment | | | | 3 | | | | 5,600,807 | | | 5,976,740 | | | | 2.2 | | | | | 3.1 | | |
|
Software | | | | 5 | | | | 17,220,291 | | | 17,789,628 | | | | 6.5 | | | | | 5.8 | | |
|
Specialty Retail | | | | 3 | | | | 3,806,537 | | | 4,381,701 | | | | 1.6 | | | | | 1.0 | | |
|
Thrifts and Mortgage Finance | | | | 2 | | | | 5,339,881 | | | 5,270,743 | | | | 1.9 | | | | | 1.6 | | |
|
Tobacco | | | | 1 | | | | 4,440,919 | | | 6,537,126 | | | | 2.4 | | | | | 2.6 | | |
|
Wireless Telecommunication Services | | | | 2 | | | | 3,399,192 | | | 5,166,968 | | | | 1.9 | | | | | 1.8 | | |
|
Total Common Stocks and Warrants | | | | 109 | | | | 249,346,375 | | | 267,946,955 | | | | 97.7 | | | | | 98.9 | | |
|
Put Options Purchased | | | | 2 | | | | 40,682 | | | 43,955 | | | | — | | | | | — | | |
|
Short-Term Holding and Other Assets Less Liabilities | | | | 1 | | | | 6,145,904 | | | 6,145,904 | | | | 2.3 | | | | | 1.1 | | |
|
Net Assets | | | | 112 | | | $ | 255,532,961 | | $ | 274,136,814 | | | | 100.0 | | | | | 100.0 | | |
|
| |
* | Restated to conform to the current period’s classifications. |
Largest Industries |
June 30, 2005 |
|
5
Performance and Portfolio Overview
| | |
Largest Portfolio Changes | | |
During Past Six Months | | |
| |
|
Largest Purchases | | Largest Sales |
| |
|
Pharmion* | | Carnival** |
| |
|
Smurfit-Stone Container* | | Wachovia |
| |
|
Honeywell International* | | Lear** |
| |
|
Comcast (Class A)* | | Dell |
| |
|
Morgan Stanley | | Merck** |
| |
|
Cendant* | | Andrx |
| |
|
Citizens Communications* | | Novartis (ADR) |
| |
|
JPMorgan Chase | | Texas Instruments** |
| |
|
Novell* | | Verizon Communications |
| |
|
News Corp. (Class A)* | | Dean Foods** |
| |
|
Largest portfolio changes from the previous period to the current period are based on cost of purchases and proceeds from sales of securities, listed in descending order.
| |
|
* | Position added during the period. |
** | Position eliminated during the period. |
| | | | | | | | | |
Largest Portfolio Holdings
June 30, 2005 | | | | | |
|
Security | | Value | | Percent of Net Assets | |
|
General Electric | | $ | 9,944,896 | | | | 3.6 | | |
|
Exxon Mobil | | | 8,834,863 | | | | 3.2 | | |
|
Microsoft | | | 8,656,477 | | | | 3.2 | | |
|
Citigroup | | | 8,530,637 | | | | 3.1 | | |
|
Pfizer | | | 7,842,042 | | | | 2.9 | | |
|
Altria Group | | | 6,537,126 | | | | 2.4 | | |
|
Wal-Mart Stores | | | 5,647,594 | | | | 2.1 | | |
|
American International Group | | | 5,490,450 | | | | 2.0 | | |
|
Tyco International | | | 4,845,740 | | | | 1.8 | | |
|
International Business Machines | | | 4,768,834 | | | | 1.7 | | |
|
6
Understanding and Comparing
Your Fund’s Expenses
As a shareholder of the Fund, you incur ongoing expenses, such as management fees, distribution and/or service (12b-1) fees, and other fund expenses. The information below is intended to help you understand your ongoing expenses (in dollars) of investing in the Fund and to compare them with the ongoing expenses of investing in other mutual funds. Please note that the expenses shown in the table are meant to highlight your ongoing expenses only and do not reflect any transactional costs, such as sales charges (also known as loads) on certain purchases or redemptions. Therefore, the table is useful in comparing ongoing expenses only, and will not help you to determine the relative total expenses of owning different funds. In addition, if transactional costs were included, your total expenses would have been higher.
The table is based on an investment of $1,000 invested at the beginning of January 1, 2005 and held for the entire six-month period ended June 30, 2005.
Actual Expenses
The table below provides information about actual expenses and actual account values. You may use the information, together with the amount you invested, to estimate the expenses that you paid over the period. Simply divide your account value at the beginning of the period by $1,000 (for example, an $8,600 account value divided by $1,000 = 8.6), then multiply the result by the number under the heading entitled “Expenses Paid During Period” for the Fund’s share class that you own to estimate the expenses that you paid on your account during the period.
Hypothetical Example for Comparison Purposes
The table below also provides information about hypothetical expenses and hypothetical account values based on the actual expense ratio of each class and an assumed rate of return of 5% per year before expenses, which is not the actual return of any class of the Fund. The hypothetical expenses and account values may not be used to estimate the ending account value or the actual expenses you paid for the period. You may use this information to compare the ongoing expenses of investing in the Fund and other mutual funds. To do so, compare this 5% hypothetical example with the 5% hypothetical examples that appear in the shareholder reports of the other mutual funds.
| | | | | | | | | | | | | | | | | | | | | | | | | | | |
| | | | | | Actual | | Hypothetical | |
| | | | | |
| |
| |
| | Beginning
Account
Value
1/1/05 | | Annualized
Expense
Ratio* | | Ending
Account
Value
6/30/05 | | Expenses Paid
During Period**
1/1/05 to 6/30/05 | | Ending
Account
Value
6/30/05 | | Expenses Paid
During Period**
1/1/05 to 6/30/05 | |
|
Class A | | $ | 1,000.00 | | | | 1.29 | % | | | $ | 977.50 | | | | $ | 6.33 | | | $ | 1,018.40 | | | $ | 6.46 | | |
|
|
|
|
|
|
|
|
|
|
|
|
|
|
|
|
|
|
|
|
|
|
|
|
|
|
|
|
Class B | | | 1,000.00 | | | | 2.05 | | | | | 973.60 | | | | | 10.03 | | | | 1,014.63 | | | | 10.24 | | |
|
|
|
|
|
|
|
|
|
|
|
|
|
|
|
|
|
|
|
|
|
|
|
|
|
|
|
|
Class C | | | 1,000.00 | | | | 2.05 | | | | | 973.60 | | | | | 10.03 | | | | 1,014.63 | | | | 10.24 | | |
|
|
|
|
|
|
|
|
|
|
|
|
|
|
|
|
|
|
|
|
|
|
|
|
|
|
|
|
Class D | | | 1,000.00 | | | | 2.05 | | | | | 974.50 | | | | | 10.04 | | | | 1,014.63 | | | | 10.24 | | |
|
|
|
|
|
|
|
|
|
|
|
|
|
|
|
|
|
|
|
|
|
|
|
|
|
|
|
|
Class I | | | 1,000.00 | | | | 0.90 | | | | | 979.30 | | | | | 4.42 | | | | 1,020.33 | | | | 4.51 | | |
|
|
|
|
|
|
|
|
|
|
|
|
|
|
|
|
|
|
|
|
|
|
|
|
|
|
|
|
Class R | | | 1,000.00 | | | | 1.55 | | | | | 976.70 | | | | | 7.60 | | | | 1,017.11 | | | | 7.75 | | |
|
|
|
|
|
|
|
|
|
|
|
|
|
|
|
|
|
|
|
|
|
|
|
|
|
|
|
|
| | |
|
* | | Expenses of Class B, Class C, Class D, Class I and Class R shares differ from the expenses of Class A shares due to the differences in 12b-1 fees and other class-specific expenses paid by each share class. See the Fund’s prospectus for description of each share class and its expenses and sales charges. |
** | | Expenses are equal to the annualized expense ratio based on actual expenses for the period January 1, 2005 to June 30, 2005, multiplied by the average account value over the period, multiplied by 181/365 (number of days in the period). |
7
Portfolio of Investments (unaudited)
June 30, 2005
| | | | | | | |
| | Shares | | Value | |
Common Stocks and Warrants 97.7% | | | | | | | |
|
|
|
|
|
|
|
|
Aerospace and Defense 1.8% | | | | | | | |
|
|
|
|
|
|
|
|
General Dynamics | | | 16,500 | | $ | 1,807,410 | |
|
|
|
|
|
|
|
|
Honeywell International | | | 82,700 | | | 3,029,301 | |
|
|
|
|
|
|
|
|
| | | | | | 4,836,711 | |
|
|
|
|
|
|
|
|
| | | | | | | |
Air Freight and Logistics 0.4% | | | | | | | |
|
|
|
|
|
|
|
|
FedEx | | | 13,800 | | | 1,117,938 | |
|
|
|
|
|
|
|
|
| | | | | | | |
Beverages 2.5% | | | | | | | |
|
|
|
|
|
|
|
|
Coca-Cola | | | 90,400 | | | 3,774,200 | |
|
|
|
|
|
|
|
|
PepsiCo | | | 54,900 | | | 2,960,757 | |
|
|
|
|
|
|
|
|
| | | | | | 6,734,957 | |
|
|
|
|
|
|
|
|
| | | | | | | |
Biotechnology 1.7% | | | | | | | |
|
|
|
|
|
|
|
|
Amgen* | | | 32,200 | | | 1,946,651 | |
|
|
|
|
|
|
|
|
Pharmion* | | | 114,800 | | | 2,663,934 | |
|
|
|
|
|
|
|
|
| | | | | | 4,610,585 | |
|
|
|
|
|
|
|
|
| | | | | | | |
Building Products 0.5% | | | | | | | |
|
|
|
|
|
|
|
|
Masco | | | 41,000 | | | 1,302,160 | |
|
|
|
|
|
|
|
|
| | | | | | | |
Capital Markets 3.2% | | | | | | | |
|
|
|
|
|
|
|
|
Bank of New York | | | 44,200 | | | 1,272,076 | |
|
|
|
|
|
|
|
|
Goldman Sachs Group | | | 19,720 | | | 2,011,834 | |
|
|
|
|
|
|
|
|
Merrill Lynch | | | 38,100 | | | 2,095,881 | |
|
|
|
|
|
|
|
|
Morgan Stanley | | | 66,230 | | | 3,475,088 | |
|
|
|
|
|
|
|
|
| | | | | | 8,854,879 | |
|
|
|
|
|
|
|
|
| | | | | | | |
Chemicals 2.1% | | | | | | | |
|
|
|
|
|
|
|
|
Dow Chemical | | | 49,500 | | | 2,204,235 | |
|
|
|
|
|
|
|
|
E. I. du Pont de Nemours | | | 41,200 | | | 1,772,012 | |
|
|
|
|
|
|
|
|
Praxair | | | 41,100 | | | 1,915,260 | |
|
|
|
|
|
|
|
|
| | | | | | 5,891,507 | |
|
|
|
|
|
|
|
|
| | | | | | | |
Commercial Banks 2.4% | | | | | | | |
|
|
|
|
|
|
|
|
Bank of America | | | 92,760 | | | 4,230,784 | |
|
|
|
|
|
|
|
|
Fifth Third Bancorp | | | 31,000 | | | 1,276,425 | |
|
|
|
|
|
|
|
|
Wachovia | | | 21,040 | | | 1,043,584 | |
|
|
|
|
|
|
|
|
| | | | | | 6,550,793 | |
|
|
|
|
|
|
|
|
| | | | | | | |
Commercial Services and Supplies 2.4% | | | | | | | |
|
|
|
|
|
|
|
|
Cendant | | | 119,800 | | | 2,679,926 | |
|
|
|
|
|
|
|
|
ServiceMaster | | | 104,500 | | | 1,400,300 | |
|
|
|
|
|
|
|
|
Waste Management | | | 87,300 | | | 2,474,082 | |
|
|
|
|
|
|
|
|
| | | | | | 6,554,308 | |
|
|
|
See footnotes on page 13. |
8
Portfolio of Investments (unaudited)
June 30, 2005
| | | | | | | | | |
| | Shares
or Warrants | | Value | |
Communications Equipment 4.9% | | | | | | | |
|
Cisco Systems* | | | | 228,360 | shs. | | $ | 4,360,534 | |
|
|
|
|
|
|
|
|
|
|
Lucent Technologies* | | | | 615,500 | | | | 1,791,105 | |
|
|
|
|
|
|
|
|
|
|
Lucent Technologies* (exercise price of $2.75, expiring 12/10/07) | | | | 18,325 | wts. | | | 14,019 | |
|
|
|
|
|
|
|
|
|
|
Nokia (ADR) | | | | 216,500 | shs. | | | 3,602,560 | |
|
|
|
|
|
|
|
|
|
|
Nortel Networks* | | | | 659,500 | | | | 1,721,295 | |
|
|
|
|
|
|
|
|
|
|
QUALCOMM | | | | 62,300 | | | | 2,056,834 | |
|
|
|
|
|
|
|
|
|
|
| | | | | | | | 13,546,347 | |
|
|
|
|
|
|
|
|
|
|
| | | | | | | | | |
Computers and Peripherals 2.7% | | | | | | | | | |
|
|
|
|
|
|
|
|
|
|
Dell* | | | | 28,440 | | | | 1,121,816 | |
|
|
|
|
|
|
|
|
|
|
EMC* | | | | 118,400 | | | | 1,623,264 | |
|
|
|
|
|
|
|
|
|
|
International Business Machines | | | | 64,270 | | | | 4,768,834 | |
|
|
|
|
|
|
|
|
|
|
| | | | | | | | 7,513,914 | |
|
|
|
|
|
|
|
|
|
|
| | | | | | | | | |
Consumer Finance 2.2% | | | | | | | | | |
|
|
|
|
|
|
|
|
|
|
American Express | | | | 55,180 | | | | 2,937,231 | |
|
|
|
|
|
|
|
|
|
|
MBNA | | | | 118,600 | | | | 3,102,576 | |
|
|
|
|
|
|
|
|
|
|
| | | | | | | | 6,039,807 | |
|
|
|
|
|
|
|
|
|
|
| | | | | | | | | |
Containers and Packaging 0.9% | | | | | | | | | |
|
|
|
|
|
|
|
|
|
|
Smurfit-Stone Container* | | | | 247,800 | | | | 2,511,453 | |
|
|
|
|
|
|
|
|
|
|
| | | | | | | | | |
Diversified Financial Services 5.4% | | | | | | | | | |
|
|
|
|
|
|
|
|
|
|
CIT Group | | | | 35,400 | | | | 1,521,138 | |
|
|
|
|
|
|
|
|
|
|
Citigroup | | | | 184,526 | | | | 8,530,637 | |
|
|
|
|
|
|
|
|
|
|
JPMorgan Chase | | | | 132,150 | | | | 4,667,538 | |
|
|
|
|
|
|
|
|
|
|
| | | | | | | | 14,719,313 | |
|
|
|
|
|
|
|
|
|
|
| | | | | | | | | |
Diversified Telecommunication Services 2.9% | | | | | | | | | |
|
|
|
|
|
|
|
|
|
|
Citizens Communications | | | | 182,200 | | | | 2,448,768 | |
|
|
|
|
|
|
|
|
|
|
SBC Communications | | | | 46,800 | | | | 1,111,500 | |
|
|
|
|
|
|
|
|
|
|
Sprint | | | | 93,900 | | | | 2,355,951 | |
|
|
|
|
|
|
|
|
|
|
Verizon Communications | | | | 57,300 | | | | 1,979,715 | |
|
|
|
|
|
|
|
|
|
|
| | | | | | | | 7,895,934 | |
|
|
|
|
|
|
|
|
|
|
| | | | | | | | | |
Electric Utilities 1.5% | | | | | | | | | |
|
|
|
|
|
|
|
|
|
|
Ameren | | | | 41,700 | | | | 2,306,010 | |
|
|
|
|
|
|
|
|
|
|
PPL | | | | 30,900 | | | | 1,834,842 | |
|
|
|
|
|
|
|
|
|
|
| | | | | | | | 4,140,852 | |
|
|
|
|
|
|
|
|
|
|
| | | | | | | | | |
Electronic Equipment and Instruments 0.4% | | | | | | | | | |
|
|
|
|
|
|
|
|
|
|
Symbol Technologies | | | | 121,000 | | | | 1,194,270 | |
|
|
|
See footnotes on page 13. |
9
Portfolio of Investments (unaudited)
June 30, 2005
| | | | | | | |
| | Shares | | Value | |
Energy Equipment and Services 1.5% | | | | | | | |
|
|
|
|
|
|
|
|
Diamond Offshore Drilling | | | 14,300 | (1) | $ | 764,049 | |
|
|
|
|
|
|
|
|
National Oilwell Varco* | | | 16,100 | | | 765,394 | |
|
|
|
|
|
|
|
|
Noble | | | 12,800 | (1) | | 787,328 | |
|
|
|
|
|
|
|
|
Tidewater | | | 31,000 | | | 1,181,720 | |
|
|
|
|
|
|
|
|
Transocean* | | | 13,800 | (1) | | 744,786 | |
|
|
|
|
|
|
|
|
| | | | | | 4,243,277 | |
|
|
|
|
|
|
|
|
| | | | | | | |
Energy Traders 0.6% | | | | | | | |
|
|
|
|
|
|
|
|
Duke Energy | | | 53,700 | | | 1,596,501 | |
|
|
|
|
|
|
|
|
| | | | | | | |
Food and Staples Retailing 2.9% | | | | | | | |
|
|
|
|
|
|
|
|
Kroger* | | | 125,800 | | | 2,393,974 | |
|
|
|
|
|
|
|
|
Wal-Mart Stores | | | 117,170 | | | 5,647,594 | |
|
|
|
|
|
|
|
|
| | | | | | 8,041,568 | |
|
|
|
|
|
|
|
|
| | | | | | | |
Health Care Equipment and Supplies 1.2% | | | | | | | |
|
|
|
|
|
|
|
|
Boston Scientific* | | | 47,400 | | | 1,279,800 | |
|
|
|
|
|
|
|
|
Medtronic | | | 38,300 | | | 1,983,557 | |
|
|
|
|
|
|
|
|
| | | | | | 3,263,357 | |
|
|
|
|
|
|
|
|
| | | | | | | |
Health Care Providers and Services 0.6% | | | | | | | |
|
|
|
|
|
|
|
|
WellPoint* | | | 23,400 | | | 1,629,576 | |
|
|
|
|
|
|
|
|
| | | | | | | |
Hotels, Restaurants and Leisure 1.2% | | | | | | | |
|
|
|
|
|
|
|
|
Applebee’s International | | | 58,500 | | | 1,546,740 | |
|
|
|
|
|
|
|
|
Marriott International (Class A) | | | 25,200 | | | 1,719,144 | |
|
|
|
|
|
|
|
|
| | | | | | 3,265,884 | |
|
|
|
|
|
|
|
|
| | | | | | | |
Household Products 1.5% | | | | | | | |
|
|
|
|
|
|
|
|
Colgate-Palmolive | | | 44,200 | | | 2,206,022 | |
|
|
|
|
|
|
|
|
Procter & Gamble | | | 38,640 | | | 2,038,260 | |
|
|
|
|
|
|
|
|
| | | | | | 4,244,282 | |
|
|
|
|
|
|
|
|
| | | | | | | |
Industrial Conglomerates 5.4% | | | | | | | |
|
|
|
|
|
|
|
|
General Electric | | | 287,010 | | | 9,944,896 | |
|
|
|
|
|
|
|
|
Tyco International | | | 165,950 | | | 4,845,740 | |
|
|
|
|
|
|
|
|
| | | | | | 14,790,636 | |
|
|
|
|
|
|
|
|
| | | | | | | |
Insurance 2.9% | | | | | | | |
|
|
|
|
|
|
|
|
American International Group | | | 94,500 | | | 5,490,450 | |
|
|
|
|
|
|
|
|
Prudential Financial | | | 35,800 | | | 2,350,628 | |
|
|
|
|
|
|
|
|
| | | | | | 7,841,078 | |
|
|
|
|
|
|
|
|
| | | | | | | |
Internet and Catalog Retail 0.4% | | | | | | | |
|
|
|
|
|
|
|
|
eBay* | | | 33,120 | (1) | | 1,094,119 | |
|
|
|
See footnotes on page 13. |
10
Portfolio of Investments (unaudited)
June 30, 2005
| | | | | | | |
| | Shares | | Value | |
Internet Software and Services 0.4% | | | | | | | |
|
Yahoo!* | | | 33,400 | (1) | $ | 1,157,143 | |
|
|
|
|
|
|
|
|
| | | | | | | |
Machinery 1.7% | | | | | | | |
|
|
|
|
|
|
|
|
Deere | | | 23,200 | | | 1,519,368 | |
|
|
|
|
|
|
|
|
Illinois Tool Works | | | 39,760 | | | 3,168,077 | |
|
|
|
|
|
|
|
|
| | | | | | 4,687,445 | |
|
|
|
|
|
|
|
|
| | | | | | | |
Media 5.4% | | | | | | | |
|
|
|
|
|
|
|
|
Clear Channel Communications | | | 61,400 | | | 1,899,102 | |
|
|
|
|
|
|
|
|
Comcast (Class A)* | | | 85,200 | | | 2,613,510 | |
|
|
|
|
|
|
|
|
News Corp. (Class A) | | | 133,000 | | | 2,151,940 | |
|
|
|
|
|
|
|
|
Time Warner | | | 238,000 | | | 3,976,980 | |
|
|
|
|
|
|
|
|
Univision Communications (Class A)* | | | 79,800 | | | 2,198,490 | |
|
|
|
|
|
|
|
|
Viacom (Class B) | | | 58,000 | | | 1,857,160 | |
|
|
|
|
|
|
|
|
| | | | | | 14,697,182 | |
|
|
|
|
|
|
|
|
| | | | | | | |
Metals and Mining 1.4% | | | | | | | |
|
|
|
|
|
|
|
|
Alcoa | | | 71,300 | | | 1,863,069 | |
|
|
|
|
|
|
|
|
Freeport-McMoRan Copper & Gold (Class B) | | | 49,500 | | | 1,853,280 | |
|
|
|
|
|
|
|
|
| | | | | | 3,716,349 | |
|
|
|
|
|
|
|
|
| | | | | | | |
Multiline Retail 1.1% | | | | | | | |
|
|
|
|
|
|
|
|
Dollar General | | | 73,800 | | | 1,502,568 | |
|
|
|
|
|
|
|
|
Federated Department Stores | | | 20,600 | | | 1,509,568 | |
|
|
|
|
|
|
|
|
| | | | | | 3,012,136 | |
|
|
|
|
|
|
|
|
| | | | | | | |
Oil, Gas and Consumable Fuels 6.6% | | | | | | | |
|
|
|
|
|
|
|
|
Apache | | | 12,100 | (1) | | 781,660 | |
|
|
|
|
|
|
|
|
BP (ADR) | | | 28,500 | | | 1,777,830 | |
|
|
|
|
|
|
|
|
Chevron | | | 25,800 | (1) | | 1,442,736 | |
|
|
|
|
|
|
|
|
ConocoPhillips | | | 21,200 | (1) | | 1,218,788 | |
|
|
|
|
|
|
|
|
El Paso | | | 66,800 | | | 769,536 | |
|
|
|
|
|
|
|
|
Exxon Mobil | | | 153,730 | (1) | | 8,834,863 | |
|
|
|
|
|
|
|
|
Murphy Oil | | | 31,200 | (1) | | 1,629,576 | |
|
|
|
|
|
|
|
|
Pogo Producing | | | 15,400 | | | 799,568 | |
|
|
|
|
|
|
|
|
Western Gas Resources | | | 22,900 | (1) | | 799,210 | |
|
|
|
|
|
|
|
|
| | | | | | 18,053,767 | |
|
|
|
|
|
|
|
|
| | | | | | | |
Personal Products 0.4% | | | | | | | |
|
|
|
|
|
|
|
|
Gillette | | | 24,200 | | | 1,225,246 | |
|
|
|
|
|
|
|
|
| | | | | | | |
Pharmaceuticals 8.1% | | | | | | | |
|
|
|
|
|
|
|
|
Andrx* | | | 60,800 | | | 1,233,936 | |
|
|
|
|
|
|
|
|
Eli Lilly | | | 28,400 | (1) | | 1,582,164 | |
|
|
|
|
|
|
|
|
Forest Laboratories* | | | 57,300 | | | 2,226,105 | |
|
|
|
|
|
|
|
|
Johnson & Johnson | | | 54,150 | | | 3,519,750 | |
|
|
|
See footnotes on page 13. |
11
Portfolio of Investments (unaudited)
June 30, 2005
| | | | | | | |
| | Shares | | Value | |
Pharmaceuticals (continued) | | | | | | | |
|
Novartis (ADR) | | | 61,200 | | $ | 2,903,328 | |
|
|
|
|
|
|
|
|
Pfizer | | | 284,338 | | | 7,842,042 | |
|
|
|
|
|
|
|
|
Wyeth | | | 66,100 | | | 2,941,450 | |
|
|
|
|
|
|
|
|
| | | | | | 22,248,775 | |
|
|
|
|
|
|
|
|
| | | | | | | |
Semiconductors and Semiconductor Equipment 2.2% | | | | | | | |
|
|
|
|
|
|
|
|
Applied Materials* | | | 59,500 | | | 962,413 | |
|
|
|
|
|
|
|
|
Broadcom (Class A)* | | | 48,500 | | | 1,723,205 | |
|
|
|
|
|
|
|
|
Intel | | | 126,460 | (1) | | 3,291,122 | |
|
|
|
|
|
|
|
|
| | | | | | 5,976,740 | |
|
|
|
|
|
|
|
|
| | | | | | | |
Software 6.5% | | | | | | | |
|
|
|
|
|
|
|
|
Computer Associates International | | | 97,900 | | | 2,690,292 | |
|
|
|
|
|
|
|
|
Microsoft | | | 348,700 | | | 8,656,477 | |
|
|
|
|
|
|
|
|
Novell* | | | 362,900 | | | 2,251,795 | |
|
|
|
|
|
|
|
|
Symantec* | | | 119,000 | | | 2,587,655 | |
|
|
|
|
|
|
|
|
VERITAS Software* | | | 65,700 | | | 1,603,409 | |
|
|
|
|
|
|
|
|
| | | | | | 17,789,628 | |
|
|
|
|
|
|
|
|
| | | | | | | |
Specialty Retail 1.6% | | | | | | | |
|
|
|
|
|
|
|
|
Gap | | | 77,800 | | | 1,536,550 | |
|
|
|
|
|
|
|
|
Home Depot | | | 38,300 | | | 1,489,870 | |
|
|
|
|
|
|
|
|
Michaels Stores | | | 32,760 | (1) | | 1,355,281 | |
|
|
|
|
|
|
|
|
| | | | | | 4,381,701 | |
|
|
|
|
|
|
|
|
| | | | | | | |
Thrifts and Mortgage Finance 1.9% | | | | | | | |
|
|
|
|
|
|
|
|
Fannie Mae | | | 61,100 | | | 3,568,240 | |
|
|
|
|
|
|
|
|
Freddie Mac | | | 26,100 | | | 1,702,503 | |
|
|
|
|
|
|
|
|
| | | | | | 5,270,743 | |
|
|
|
|
|
|
|
|
| | | | | | | |
Tobacco 2.4% | | | | | | | |
|
|
|
|
|
|
|
|
Altria Group | | | 101,100 | | | 6,537,126 | |
|
|
|
|
|
|
|
|
| | | | | | | |
Wireless Telecommunication Services 1.9% | | | | | | | |
|
|
|
|
|
|
|
|
American Tower (Class A)* | | | 83,600 | | | 1,757,272 | |
|
|
|
|
|
|
|
|
Crown Castle International* | | | 167,800 | | | 3,409,696 | |
|
|
|
|
|
|
|
|
| | | | | | 5,166,968 | |
|
|
|
|
|
|
|
|
| | | | | | | |
Total Common Stocks and Warrants (Cost $249,346,375) | | | | | | 267,946,955 | |
|
|
|
See footnotes on page 13. |
12
Portfolio of Investments (unaudited)
June 30, 2005
| | | | | | | | | |
| | Shares Subject
to Put/Call or
Principal Amount | | Value | |
Put Options Purchased* 0.0% | | | | | | | |
|
|
|
|
|
|
|
|
Internet Software and Services 0.0% | | | | | | | |
|
|
|
|
|
|
|
|
Yahoo!, expiring July 2005 at $35 | | | | 33,400 | shs. | | $ | 31,730 | |
|
|
|
|
|
|
|
|
|
|
Specialty Retail 0.0% | | | | | | | | | |
|
|
|
|
|
|
|
|
|
|
Michaels Stores, expiring July 2005 at $40 | | | | 32,600 | | | | 12,225 | |
|
|
|
|
|
|
|
|
|
|
Total Put Options Purchased* (Cost $40,682) | | | | | | | | 43,955 | |
|
|
|
|
|
|
|
|
|
|
|
Fixed Time Deposit 2.5% | | | | | | | | | |
|
|
|
|
|
|
|
|
|
|
BNP Paribas, Grand Cayman 3.35%,
7/1/05 (Cost $6,818,000) | | | $ | 6,818,000 | | | | 6,818,000 | |
|
|
|
|
|
|
|
|
|
|
|
Total Investments (Cost $256,205,057) 100.2% | | | | | | | | 274,808,910 | |
|
|
|
|
|
|
|
|
|
|
|
Other Assets Less Other Liabilities (0.2)% | | | | | | | | (672,096 | ) |
|
|
|
|
|
|
|
|
|
|
|
Net Assets 100.0% | | | | | | | $ | 274,136,814 | |
|
|
|
|
|
|
|
|
|
|
|
Call Options Written | | | | | | | | | |
|
|
|
|
|
|
|
|
|
|
Apache, expiring July 2005 at $65 | | | | 12,100 | shs. | | $ | (15,125 | ) |
|
|
|
|
|
|
|
|
|
|
Chevron, expiring July 2005 at $60 | | | | 25,800 | | | | (2,580 | ) |
|
|
|
|
|
|
|
|
|
|
ConocoPhillips, expiring July 2005 at $57.50 | | | | 21,200 | | | | (24,380 | ) |
|
|
|
|
|
|
|
|
|
|
Diamond Offshore Drilling, expiring July 2005 at $55 | | | | 14,300 | | | | (12,870 | ) |
|
|
|
|
|
|
|
|
|
|
eBay, expiring July 2005 at $37.50 | | | | 33,000 | | | | (3,300 | ) |
|
|
|
|
|
|
|
|
|
|
Eli Lilly, expiring October 2005 at $60 | | | | 28,200 | | | | (28,200 | ) |
|
|
|
|
|
|
|
|
|
|
Exxon Mobil, expiring July 2005 at $65 | | | | 38,400 | | | | (1,920 | ) |
|
|
|
|
|
|
|
|
|
|
Exxon Mobil, expiring July 2005 at $70 | | | | 38,400 | | | | (1,920 | ) |
|
|
|
|
|
|
|
|
|
|
Intel, expiring July 2005 at $27.50 | | | | 51,400 | | | | (5,140 | ) |
|
|
|
|
|
|
|
|
|
|
Michaels Stores, expiring July 2005 at $45 | | | | 32,600 | | | | (4,890 | ) |
|
|
|
|
|
|
|
|
|
|
Murphy Oil, expiring July 2005 at $55 | | | | 4,200 | | | | (1,680 | ) |
|
|
|
|
|
|
|
|
|
|
Noble, expiring July 2005 at $60 | | | | 12,800 | | | | (38,400 | ) |
|
|
|
|
|
|
|
|
|
|
Transocean, expiring July 2005 at $55 | | | | 13,800 | | | | (15,180 | ) |
|
|
|
|
|
|
|
|
|
|
Western Gas Resources, expiring July 2005 at $35 | | | | 8,200 | | | | (7,790 | ) |
|
|
|
|
|
|
|
|
|
|
Yahoo!, expiring July 2005 at $37.50 | | | | 33,400 | | | | (3,340 | ) |
|
|
|
|
|
|
|
|
|
|
|
Total Call Options Written (Premiums received $400,052) | | | | | | | $ | (166,715 | ) |
|
|
|
|
|
|
|
|
|
|
* Non-income producing security.
ADR – American Depositary Receipts.
(1) All or part of the security is held as collateral for options written.
See Notes to Financial Statements.
13
Statement of Assets and Liabilities (unaudited)
June 30, 2005
| | | | |
Assets: | | | | |
|
|
|
|
|
Investments, at value: | | | | |
|
|
|
|
|
Common stocks and warrants (cost $249,346,375) | | $ | 267,946,955 | |
|
|
|
|
|
Put options purchased (cost $40,682) | | | 43,955 | |
|
|
|
|
|
Fixed time deposit (cost $6,818,000) | | | 6,818,000 | |
|
|
|
|
|
Total investments (cost $256,205,057) | | | 274,808,910 | |
|
|
|
|
|
Receivable for securities sold | | | 383,157 | |
|
|
|
|
|
Receivable for dividends and interest | | | 305,712 | |
|
|
|
|
|
Investment in, and expenses prepaid to, shareholder service agent | | | 78,575 | |
|
|
|
|
|
Receivable for Capital Stock sold | | | 38,896 | |
|
|
|
|
|
Other | | | 35,245 | |
|
|
|
|
|
Total Assets | | | 275,650,495 | |
|
|
|
|
|
Liabilities: | | | | |
|
|
|
|
|
Bank overdraft | | | 56,041 | |
|
|
|
|
|
Payable for Capital Stock repurchased | | | 587,526 | |
|
|
|
|
|
Payable for securities purchased | | | 363,638 | |
|
|
|
|
|
Options written, at value (premiums received $400,052) | | | 166,715 | |
|
|
|
|
|
Management fee payable | | | 148,769 | |
|
|
|
|
|
Distribution and service fees payable | | | 74,764 | |
|
|
|
|
|
Accrued expenses and other | | | 116,228 | |
|
|
|
|
|
Total Liabilities | | | 1,513,681 | |
|
|
|
|
|
Net Assets | | $ | 274,136,814 | |
|
|
|
|
|
Composition of Net Assets: | | | | |
|
|
|
|
|
Capital Stock, at par ($0.50 par value; 500,000,000 shares authorized; | | | | |
24,274,985 shares outstanding): | | | | |
|
|
|
|
|
Class A | | $ | 10,595,290 | |
|
|
|
|
|
Class B | | | 490,693 | |
|
|
|
|
|
Class C | | | 219,377 | |
|
|
|
|
|
Class D | | | 648,430 | |
|
|
|
|
|
Class I | | | 164,637 | |
|
|
|
|
|
Class R | | | 19,066 | |
|
|
|
|
|
Additional paid-in capital | | | 273,273,720 | |
|
|
|
|
|
Undistributed net investment income | | | 596,996 | |
|
|
|
|
|
Accumulated net realized loss | | | (30,708,585 | ) |
|
|
|
|
|
Net unrealized appreciation of investments and options written | | | 18,837,190 | |
|
|
|
|
|
Net Assets | | $ | 274,136,814 | |
|
|
|
|
|
Net Asset Value Per Share: | | | | |
|
|
|
|
|
Class A ($239,862,020 ÷ 21,190,580 shares) | | $ | 11.32 | |
|
|
|
|
|
Class B ($10,868,734 ÷ 981,387 shares) | | $ | 11.07 | |
|
|
|
|
|
Class C ($4,863,107 ÷ 438,753 shares) | | $ | 11.08 | |
|
|
|
|
|
Class D ($14,366,481 ÷ 1,296,859 shares) | | $ | 11.08 | |
|
|
|
|
|
Class I ($3,745,377 ÷ 329,275 shares) | | $ | 11.37 | |
|
|
|
|
|
Class R ($431,095 ÷ 38,131 shares) | | $ | 11.31 | |
|
|
|
|
|
See Notes to Financial Statements.
14
Statement of Operations (unaudited)
For the Six Months Ended June 30, 2005
| | | | |
Investment Income: | | | | |
|
|
|
|
|
Dividends (net of foreign taxes withheld of $25,171) | | $ | 2,515,229 | |
|
|
|
|
|
Interest | | | 41,809 | |
|
|
|
|
|
Total Investment Income | | | 2,557,038 | |
|
|
|
|
|
| | | | |
Expenses: | | | | |
|
|
|
|
|
Management fee | | | 915,480 | |
|
|
|
|
|
Distribution and service fees | | | 457,420 | |
|
|
|
|
|
Shareholder account services | | | 377,254 | |
|
|
|
|
|
Registration | | | 48,486 | |
|
|
|
|
|
Auditing and legal fees | | | 45,684 | |
|
|
|
|
|
Custody and related services | | | 38,701 | |
|
|
|
|
|
Shareholder reports and communications | | | 23,728 | |
|
|
|
|
|
Directors’ fees and expenses | | | 6,439 | |
|
|
|
|
|
Miscellaneous | | | 12,954 | |
|
|
|
|
|
Total Expenses | | | 1,926,146 | |
|
|
|
|
|
Net Investment Income | | | 630,892 | |
|
|
|
|
|
| | | | |
Net Realized and Unrealized Gain (Loss) on Investments and Options Written: | | | | |
|
|
|
|
|
Net realized gain on investments and options written | | | 13,915,800 | |
|
|
|
|
|
Net change in unrealized appreciation of investments and options written | | | (21,586,384 | ) |
|
|
|
|
|
Net Loss on Investments and Options Written | | | (7,670,584 | ) |
|
|
|
|
|
Decrease in Net Assets from Operations | | $ | (7,039,692 | ) |
|
|
|
|
|
See Notes to Financial Statements.
15
Statements of Changes in Net Assets
(unaudited)
| | | | | | | | | |
| | Six Months Ended
June 30, 2005 | | Year Ended
December 31, 2004 | |
|
|
|
|
|
|
Operations: | | | | | | | |
|
|
|
|
|
|
|
|
Net investment income | | | $ | 630,892 | | | $ | 1,717,820 | |
|
|
|
|
|
|
|
|
|
|
Net realized gain on investments and options written | | | | 13,915,800 | | | | 30,561,232 | |
|
|
|
|
|
|
|
|
|
|
Payments received from the Manager (Note 9) | | | | — | | | | 107,746 | |
|
|
|
|
|
|
|
|
|
|
Net change in unrealized appreciation of investments and options written | | | | (21,586,384 | ) | | | 757,770 | |
|
|
|
|
|
|
|
|
|
|
Increase (Decrease) in Net Assets from Operations | | | | (7,039,692 | ) | | | 33,144,568 | |
|
|
|
|
|
|
|
|
|
|
| | | | | | | | | |
Distributions to Shareholders: | | | | | | | | | |
|
|
|
|
|
|
|
|
|
|
Net investment income: | | | | | | | | | |
|
|
|
|
|
|
|
|
|
|
Class A | | | | — | | | | (1,621,308 | ) |
|
|
|
|
|
|
|
|
|
|
Class I | | | | — | | | | (35,829 | ) |
|
|
|
|
|
|
|
|
|
|
Class R | | | | — | | | | (1,240 | ) |
|
|
|
|
|
|
|
|
|
|
Decrease in Net Assets from Distributions | | | | — | | | | (1,658,377 | ) |
|
|
|
|
|
|
|
|
|
|
| | | | | | | | | |
Capital Share Transactions: | | | | | | | | | |
|
|
|
|
|
|
|
|
|
|
Net proceeds from sales of shares | | | | 3,234,382 | | | | 5,741,679 | |
|
|
|
|
|
|
|
|
|
|
Investment of dividends | | | | — | | | | 1,032,446 | |
|
|
|
|
|
|
|
|
|
|
Exchanged from associated funds | | | | 1,622,288 | | | | 3,893,043 | |
|
|
|
|
|
|
|
|
|
|
Total | | | | 4,856,670 | | | | 10,667,168 | |
|
|
|
|
|
|
|
|
|
|
Cost of shares repurchased | | | | (25,635,125 | ) | | | (50,738,536 | ) |
|
|
|
|
|
|
|
|
|
|
Exchanged into associated funds | | | | (1,691,263 | ) | | | (3,509,829 | ) |
|
|
|
|
|
|
|
|
|
|
Total | | | | (27,326,388 | ) | | | (54,248,365 | ) |
|
|
|
|
|
|
|
|
|
|
Decrease in Net Assets from Capital Share Transactions | | | | (22,469,718 | ) | | | (43,581,197 | ) |
|
|
|
|
|
|
|
|
|
|
Decrease in Net Assets | | | | (29,509,410 | ) | | | (12,095,006 | ) |
|
|
|
|
|
|
|
|
|
|
| | | | | | | | | |
Net Assets: | | | | | | | | | |
|
|
|
|
|
|
|
|
|
|
Beginning of period | | | | 303,646,224 | | | | 315,741,230 | |
|
|
|
|
|
|
|
|
|
|
End of Period (including undistributed (net of dividends in excess of)net investment income of $596,996, and $(33,896), respectively) | | | $ | 274,136,814 | | | $ | 303,646,224 | |
|
|
|
|
|
|
|
|
|
|
See Notes to Financial Statements.
16
Notes to Financial Statements (unaudited)
| |
1. | Multiple Classes of Shares — Seligman Common Stock Fund, Inc. (the “Fund”) offers the following six classes of shares: |
| |
| Class A shares are sold with an initial sales charge of up to 4.75% and a continuing service fee of up to 0.25% on an annual basis. Class A shares purchased in an amount of $1,000,000 or more are sold without an initial sales charge but are subject to a contingent deferred sales charge (“CDSC”) of 1% on redemptions within 18 months of purchase. |
| |
| Class B shares are sold without an initial sales charge but are subject to a distribution fee of 0.75% and a service fee of up to 0.25% on an annual basis, and a CDSC, if applicable, of 5% on redemptions in the first year of purchase, declining to 1% in the sixth year and 0% thereafter. Class B shares will automatically convert to Class A shares approximately eight years after their date of purchase. If Class B shares of the Fund are exchanged for Class B shares of another Seligman mutual fund, the holding period of the shares exchanged will be added to the holding period of the shares acquired, both for determining the applicable CDSC and the conversion of Class B shares to Class A shares. |
| |
| Class C shares are sold primarily with an initial sales charge of up to 1%, and a CDSC, if applicable, of 1% imposed on redemptions made within 18 months of purchase. Class C shares purchased through certain financial intermediaries may be bought without an initial sales charge and with a 1% CDSC on redemptions made within 12 months of purchase. All Class C shares are subject to a distribution fee of up to 0.75% and a service fee of up to 0.25% on an annual basis. |
| |
| Class D shares are sold without an initial sales charge but are subject to a distribution fee of up to 0.75% and a service fee of up to 0.25% on an annual basis, and a CDSC, if applicable, of 1% imposed on redemptions made within one year of purchase. |
| |
| Class I shares are offered to certain institutional clients. Class I shares are sold without any sales charges and are not subject to distribution and service fees. |
| |
| Class R shares are offered to certain employee benefit plans and are not available to all investors. They are sold without an initial sales charge, but are subject to a distribution fee of up to 0.25% and a service fee of up to 0.25% on an annual basis, and a CDSC, if applicable, of 1% on redemptions made within one year of a plan’s initial purchase of Class R shares. |
| |
| All classes of shares represent interests in the same portfolio of investments, have the same rights and are generally identical in all respects except that each class bears its own class-specific expenses, and has exclusive voting rights with respect to any matter on which a separate vote of any class is required. |
| |
2. | Significant Accounting Policies — The financial statements have been prepared in conformity with accounting principles generally accepted in the United States of America which require management to make certain estimates and assumptions at the date of the financial statements. Actual results may differ from these estimates. These unaudited interim financial statements reflect all adjustments which are, in the opinion of management, necessary to a fair statement of the results for the interim period presented. All such adjustments are of a normal recurring nature. The following summarizes the significant accounting policies of the Fund: |
| | |
| a. | Security Valuation — Securities traded on an exchange are valued at the last sales price on the primary exchange or market on which they are traded. Securities not listed on an exchange or security market, or securities for which there is no last sales price, are valued at the mean of the most recent bid and asked prices or are valued by J. & W. Seligman & Co. Incorporated (the “Manager”) based on quotations provided by primary market makers in such securities. Securities for which market quotations are not readily available (or are otherwise no longer valid or reliable) are valued at fair value determined |
17
Notes to Financial Statements (unaudited)
| | |
| | in accordance with procedures approved by the Board of Directors. This can occur in the event of, among other things, natural disasters, acts of terrorism, market disruptions, intra-day trading halts, and extreme market volatility. Short-term holdings that mature in more than 60 days are valued at current market quotations. Short-term holdings maturing in 60 days or less are valued at amortized cost. |
| | |
| b. | Federal Taxes — There is no provision for federal income tax. The Fund has elected to be taxed as a regulated investment company and intends to distribute substantially all taxable net income and net gain realized. |
| | |
| c. | Security Transactions and Related Investment Income — Investment transactions are recorded on trade dates. Identified cost of investments sold is used for both financial reporting and federal income tax purposes. Dividends receivable are recorded on ex-dividend dates, except that certain dividends from foreign securities where the ex-dividend dates may have passed are recorded as soon as the Fund is informed of the dividend. Interest income is recorded on an accrual basis. |
| | |
| d. | Repurchase Agreements — The Fund may enter into repurchase agreements with commercial banks and with broker/dealers deemed to be creditworthy by the Manager. Securities received as collateral subject to repurchase agreements are deposited with the Fund’s custodian and, pursuant to the terms of the repurchase agreement, must have an aggregate market value greater than or equal to the repurchase price plus accrued interest at all times. Procedures have been established to monitor, on a daily basis, the market value of repurchase agreements’ underlying securities to ensure the existence of the proper level of collateral. |
| | |
| e. | Multiple Class Allocations — All income, expenses (other than class-specific expenses), and realized and unrealized gains or losses are allocated daily to each class of shares based upon the relative value of shares of each class. Class-specific expenses, which include distribution and service fees and any other items that are specifically attributable to a particular class, are charged directly to such class. For the six months ended June 30, 2005, distribution and service fees, shareholder account services and registration expenses were class-specific expenses. |
| | |
| f. | Distributions to Shareholders — Dividends and distributions to shareholders are recorded on ex-dividend date. |
| | |
| g. | Options — The Fund is authorized to write and purchase put and call options. When the Fund writes an option, an amount equal to the premium received by the Fund is reflected as an asset and an equivalent liability. The amount of the liability is subsequently marked to market to reflect the current market value of the option written. When a security is purchased or sold through an exercise of an option, the related premium paid (or received) is added to (or deducted from) the basis of the security acquired or deducted from (or added to) the proceeds of the security sold. When an option expires (or the Fund enters into a closing transaction), the Fund realizes a gain or loss on the option to the extent of the premiums received or paid (or gain or loss to the extent the cost of the closing transaction exceeds the premium paid or received). The Fund, as writer of an option, bears the market risk of an unfavorable change in the price of the security underlying the written option. Written and purchased options are non-income producing investments. |
| |
3. | Management Fee, Distribution Services, and Other Transactions — The Manager manages the affairs of the Fund and provides the necessary personnel and facilities. Compensation of all officers of the Fund, all directors of the Fund who are employees of the Manager, and all personnel of the Fund and the Manager is paid by the Manager. The Manager receives a fee, calculated daily and payable monthly, equal to 0.65% per annum of the first $1 billion of the Fund’s average daily net assets, 0.60% per annum of the |
18
Notes to Financial Statements (unaudited)
| |
| next $1 billion of the Fund’s average daily net assets, and 0.55% per annum of the Fund’s average daily net assets in excess of $2 billion. The management fee reflected in the Statement of Operations represents 0.65% per annum of the Fund’s average daily net assets. |
| |
| Seligman Advisors, Inc. (the “Distributor”), agent for the distribution of the Fund’s shares and an affiliate of the Manager, received concessions of $2,374 from sales of Class A shares. Commissions of $18,408 and $1,979 were paid to dealers from sales of Class A and Class C shares, respectively. |
| |
| The Fund has an Administration, Shareholder Services and Distribution Plan (the “Plan”) with respect to distribution of its shares. Under the Plan, with respect to Class A shares, service organizations can enter into agreements with the Distributor and receive a continuing fee of up to 0.25% on an annual basis, payable monthly, of the average daily net assets of the Class A shares attributable to the particular service organizations for providing personal services and/or the maintenance of shareholder accounts. The Distributor charges such fees to the Fund pursuant to the Plan. For the six months ended June 30, 2005, fees incurred under the Plan aggregated $297,827 or 0.24% per annum of the average daily net assets of Class A shares. |
| |
| Under the Plan, with respect to Class B shares, Class C shares, Class D shares, and Class R shares, service organizations can enter into agreements with the Distributor and receive a continuing fee for providing personal services and/or the maintenance of shareholder accounts of up to 0.25% on an annual basis of the average daily net assets of the Class B, Class C, Class D, and Class R shares for which the organizations are responsible; and, for Class C, Class D and Class R shares, fees for providing other distribution assistance of up to 0.75% (0.25%, in the case of Class R shares) on an annual basis of such average daily net assets. Such fees are paid monthly by the Fund to the Distributor pursuant to the Plan. |
| |
| With respect to Class B shares, a distribution fee of 0.75% on an annual basis of average daily net assets is payable monthly by the Fund to the Distributor; however, the Distributor has sold its rights to this fee with respect to a substantial portion of Class B shares to third parties (the “Purchasers”), which provide funding to the Distributor to enable it to pay commissions to dealers at the time of the sale of the related Class B shares. Distribution fees retained by the Distributor, for the six months ended June 30, 2005, amounted to $54. |
| |
| For the six months ended June 30, 2005, fees incurred under the Plan, equivalent to 1% per annum of the average daily net assets of Class B, Class C, and Class D shares, and 0.50% per annum of the average daily net assets of Class R shares, amounted to $59,544, $24,588, $74,501, and $960, respectively. |
| |
| The Distributor is entitled to retain any CDSC imposed on certain redemptions of Class A, Class C, Class D and Class R shares. For the six months ended June 30, 2005, such charges amounted to $1,954. The Distributor has sold its rights to collect any CDSC imposed on redemptions of Class B shares to the Purchasers. |
| |
| Seligman Services, Inc., an affiliate of the Manager, is eligible to receive commissions from certain sales of shares of the Fund, as well as distribution and service fees pursuant to the Plan. For the six months ended June 30, 2005, Seligman Services, Inc. received commissions of $1,922 from the sales of shares of the Fund. Seligman Services, Inc. also received distribution and service fees of $66,622, pursuant to the Plan. |
| |
| Seligman Data Corp., which is owned by the Fund and certain associated investment companies, charged the Fund at cost $377,254 for shareholder account services in accordance with a methodology approved by the Fund’s directors. Class I shares receive more limited shareholder services than the Fund’s other classes of shares (the “Retail Classes”). Seligman Data Corp. does not allocate to Class I the costs of any of its departments that do not provide services to the Class I shareholders. |
19
Notes to Financial Statements (unaudited)
| |
| Costs of Seligman Data Corp. directly attributable to the Retail Classes of the Fund were charged to those classes in proportion to their respective net asset values. Costs directly attributable to Class I shares were charged to Class I. The remaining charges were allocated to the Retail Classes and Class I by Seligman Data Corp. pursuant to a formula based on their net assets, shareholder transaction volumes and number of shareholder accounts. |
| |
| The Fund and certain other associated investment companies (together, the “Guarantors”) have severally but not jointly guaranteed the performance and observance of all the terms and conditions of two leases entered into by Seligman Data Corp., including the payment of rent by Seligman Data Corp. (the “Guaranties”). The leases and the Guaranties expire in September 2008 and January 2009. The obligation of the Fund to pay any amount due under either Guaranty is limited to a specified percentage of the full amount, which generally is based on the Fund’s percentage of the expenses billed by Seligman Data Corp. to all Guarantors in the preceding calendar quarter. As of June 30, 2005, the Fund’s potential obligation under the Guaranties is $143,000. As of June 30, 2005, no event has occurred which would result in the Fund becoming liable to make any payment under a Guaranty. A portion of rent paid by Seligman Data Corp. is charged to the Fund as part of Seligman Data Corp.’s shareholder account services cost. |
| |
| The Fund’s investment in Seligman Data Corp. is recorded at a cost of $22,506. |
| |
| Certain officers and directors of the Fund are officers or directors of the Manager, the Distributor, Seligman Services, Inc., and/or Seligman Data Corp. |
| |
| The Fund has a compensation arrangement under which directors who receive fees may elect to defer receiving such fees. Directors may elect to have the deferred fees accrue interest or earn a return based on the performance of the Fund or other funds in the Seligman Group of Investment Companies. The cost of such fees and earnings/loss accrued thereon is included in directors’ fees and expenses and the accumulated balance thereof at June 30, 2005, of $28,137 is included in accrued expenses and other liabilities. Deferred fees and related accrued earnings are not deductible by the Fund for federal income tax purposes until such amounts are paid. |
| |
4. | Committed Line of Credit — The Fund is a participant in a joint $400 million committed line of credit that is shared by substantially all open-end funds in the Seligman Group of Investment Companies. The directors have currently limited the Fund’s borrowings to 10% of its net assets. Borrowings pursuant to the credit facility are subject to interest at a rate equal to the overnight federal funds rate plus 0.50%. The Fund incurs a commitment fee of 0.10% per annum on its share of the unused portion of the credit facility. The credit facility may be drawn upon only for temporary purposes and is subject to certain other customary restrictions. The credit facility commitment expires in June 2006, but is renewable annually with the consent of the participating banks. For the six months ended June 30, 2005, the Fund did not borrow from the credit facility. |
| |
5. | Purchases and Sales of Securities — Purchases and sales of portfolio securities, excluding options and short-term investments, for the six months ended June 30, 2005 amounted to $93,373,071 and $117,402,853, respectively. |
| |
6. | Federal Tax Information — Certain components of income, expense and realized capital gain and loss are recognized at different times or have a different character for federal income tax purposes and for financial reporting purposes. Where such differences are permanent in nature, they are reclassified in the components of net assets based on their characterization for federal income tax purposes. Any such reclassifications will have no effect on net assets, results of operations or net asset value per share of the Fund. As a result of the differences described above, the treatment for financial reporting purposes of |
20
Notes to Financial Statement (unaudited)
| |
| distributions made during the year from net investment income or net realized gains may differ from their treatment for federal income tax purposes. Further, the cost of investments also can differ for federal income tax purposes. |
| |
| The tax basis information presented below is based on operating results for the six months ended June 30, 2005 and will vary from the final tax information as of the Fund’s year-end. |
| |
| At June 30, 2005, the cost of investments for federal income tax purposes was $256,641,770. The tax basis cost was greater than the cost for financial reporting purposes due to the tax deferral of losses on wash sales of $436,713. |
| |
| At June 30, 2005, the tax basis components of accumulated losses were as follows: |
| | | | | |
| Gross unrealized appreciation of portfolio securities and options written | | $ | 30,524,972 | |
|
|
|
|
|
|
| Gross unrealized depreciation of portfolio securities and options written | | | (12,124,495 | ) |
|
|
|
|
|
|
| Net unrealized appreciation of portfolio securities and options written | | | 18,400,477 | |
|
|
|
|
|
|
| Capital loss carryforward | | | (44,587,760 | ) |
|
|
|
|
|
|
| Current period net realized gain | | | 14,315,888 | |
|
|
|
|
|
|
| Undistributed income | | | 625,133 | |
|
|
|
|
|
|
| Total accumulated losses | | $ | (11,246,262 | ) |
|
|
|
|
|
|
| |
| At December 31, 2004, the Fund had a capital loss carryforward for federal income tax purposes of $44,587,760, which is available for offset against future taxable net capital gains, with $5,909,220 expiring in 2009, $33,227,305 expiring in 2010 and $5,451,235 expiring in 2011. The amount was determined after adjustments for certain differences between financial reporting and tax purposes, such as wash sale losses. Accordingly, no capital gain distributions are expected to be paid to shareholders until net capital gains have been realized in excess of the available capital loss carryforward. |
| |
7. | Options Written — Transactions in options written during the six months ended June 30, 2005, were as follows: |
| | | | | | | | |
| | | Shares Subject
To Call | | Premiums | |
|
|
|
|
|
|
|
| Options outstanding, December 31, 2004 | | | | — | | | $ | — | |
|
|
|
|
|
|
|
|
|
|
|
| Options written | | | | 699,100 | | | | 779,551 | |
|
|
|
|
|
|
|
|
|
|
|
| Options expired | | | | (209,200 | ) | | | (170,644 | ) |
|
|
|
|
|
|
|
|
|
|
|
| Options terminated in closing purchase transactions | | | | (122,100 | ) | | | (208,855 | ) |
|
|
|
|
|
|
|
|
|
|
|
| Options outstanding, June 30, 2005 | | | | 367,800 | | | $ | 400,052 | |
|
|
|
|
|
|
|
|
|
|
|
21
Notes to Financial Statement (unaudited)
| | |
8. | | Capital Share Transactions — The Fund has authorized 500,000,000 shares of $0.50 par value Capital Stock. Transactions in shares of Capital Stock were as follows: |
| | | | | | | | | | | | | | |
| | | Six Months Ended
June 30, 2005 | | Year Ended
December 31, 2004 | |
|
|
|
|
|
|
|
|
|
|
|
|
|
|
|
| | | | | | | | | | | | | | |
| Class A | | | Shares | Amount | | | Shares | Amount | |
|
|
|
|
|
|
|
|
|
|
|
| Net proceeds from sales of shares | | | 114,710 | | $ | 1,290,844 | | | 203,589 | | $ | 2,188,610 | |
|
|
|
|
|
|
|
|
|
|
|
|
|
|
|
| Investment of dividends | | | — | | | — | | | 87,237 | | | 995,377 | |
|
|
|
|
|
|
|
|
|
|
|
|
|
|
|
| Exchanged from associated funds | | | 74,026 | | | 837,672 | | | 195,431 | | | 2,136,627 | |
|
|
|
|
|
|
|
|
|
|
|
|
|
|
|
| Converted from Class B* | | | 77,657 | | | 874,611 | | | 165,544 | | | 1,773,507 | |
|
|
|
|
|
|
|
|
|
|
|
|
|
|
|
| Total | | | 266,393 | | | 3,003,127 | | | 651,801 | | | 7,094,121 | |
|
|
|
|
|
|
|
|
|
|
|
|
|
|
|
| Cost of shares repurchased | | | (1,789,441 | ) | | (20,152,930 | ) | | (3,695,156 | ) | | (39,759,459 | ) |
|
|
|
|
|
|
|
|
|
|
|
|
|
|
|
| Exchanged into associated funds | | | (98,829 | ) | | (1,102,784 | ) | | (213,896 | ) | | (2,284,289 | ) |
|
|
|
|
|
|
|
|
|
|
|
|
|
|
|
| Total | | | (1,888,270 | ) | | (21,255,714 | ) | | (3,909,052 | ) | | (42,043,748 | ) |
|
|
|
|
|
|
|
|
|
|
|
|
|
|
|
| Decrease | | | (1,621,877 | ) | $ | (18,252,587 | ) | | (3,257,251 | ) | $ | (34,949,627 | ) |
|
|
|
|
|
|
|
|
|
|
|
|
|
|
|
| | | | | | | | | | | | | | |
| | | | | | | | | | | | | | |
| Class B | | | Shares | | Amount | | | Shares | | Amount | |
|
|
|
|
|
|
|
|
|
|
|
|
|
|
|
| Net proceeds from sales of shares | | | 26,190 | | $ | 289,682 | | | 50,752 | | $ | 534,997 | |
|
|
|
|
|
|
|
|
|
|
|
|
|
|
|
| Exchanged from associated funds | | | 23,484 | | | 261,083 | | | 103,787 | | | 1,104,503 | |
|
|
|
|
|
|
|
|
|
|
|
|
|
|
|
| Total | | | 49,674 | | | 550,765 | | | 154,539 | | | 1,639,500 | |
|
|
|
|
|
|
|
|
|
|
|
|
|
|
|
| Cost of shares repurchased | | | (161,360 | ) | | (1,781,860 | ) | | (333,919 | ) | | (3,520,171 | ) |
|
|
|
|
|
|
|
|
|
|
|
|
|
|
|
| Exchanged into associated funds | | | (21,969 | ) | | (241,458 | ) | | (48,719 | ) | | (508,542 | ) |
|
|
|
|
|
|
|
|
|
|
|
|
|
|
|
| Converted to Class A* | | | (79,231 | ) | | (874,611 | ) | | (169,081 | ) | | (1,773,507 | ) |
|
|
|
|
|
|
|
|
|
|
|
|
|
|
|
| Total | | | (262,560 | ) | | (2,897,929 | ) | | (551,719 | ) | | (5,802,220 | ) |
|
|
|
|
|
|
|
|
|
|
|
|
|
|
|
| Decrease | | | (212,886 | ) | $ | (2,347,164 | ) | | (397,180 | ) | $ | (4,162,720 | ) |
|
|
|
|
|
|
|
|
|
|
|
|
|
|
|
| | | | | | | | | | | | | | |
| | | | | | | | | | | | | | |
| Class C | | | Shares | | Amount | | | Shares | | Amount | |
|
|
|
|
|
|
|
|
|
|
|
|
|
|
|
| Net proceeds from sales of shares | | | 45,387 | | $ | 500,946 | | | 31,388 | | $ | 333,238 | |
|
|
|
|
|
|
|
|
|
|
|
|
|
|
|
| Exchanged from associated funds | | | 12,592 | | | 139,052 | | | 11,938 | | | 125,712 | |
|
|
|
|
|
|
|
|
|
|
|
|
|
|
|
| Total | | | 57,979 | | | 639,998 | | | 43,326 | | | 458,950 | |
|
|
|
|
|
|
|
|
|
|
|
|
|
|
|
| Cost of shares repurchased | | | (65,429 | ) | | (721,855 | ) | | (216,601 | ) | | (2,269,735 | ) |
|
|
|
|
|
|
|
|
|
|
|
|
|
|
|
| Exchanged into associated funds | | | (13,118 | ) | | (143,584 | ) | | (17,819 | ) | | (188,979 | ) |
|
|
|
|
|
|
|
|
|
|
|
|
|
|
|
| Total | | | (78,547 | ) | | (865,439 | ) | | (234,420 | ) | | (2,458,714 | ) |
|
|
|
|
|
|
|
|
|
|
|
|
|
|
|
| Decrease | | | (20,568 | ) | $ | (225,441 | ) | | (191,094 | ) | $ | (1,999,764 | ) |
|
|
|
|
|
|
|
|
|
|
|
|
|
|
|
| | | | | | | | | | | | | | |
| | | | | | | | | | | | | | |
| Class D | | | Shares | | Amount | | | Shares | | Amount | |
|
|
|
|
|
|
|
|
|
|
|
|
|
|
|
| Net proceeds from sales of shares | | | 64,684 | | $ | 716,895 | | | 163,748 | | $ | 1,720,079 | |
|
|
|
|
|
|
|
|
|
|
|
|
|
|
|
| Exchanged from associated funds | | | 34,710 | | | 384,481 | | | 49,619 | | | 521,854 | |
|
|
|
|
|
|
|
|
|
|
|
|
|
|
|
| Total | | | 99,394 | | | 1,101,376 | | | 213,367 | | | 2,241,933 | |
|
|
|
|
|
|
|
|
|
|
|
|
|
|
|
| Cost of shares repurchased | | | (223,384 | ) | | (2,473,711 | ) | | (460,278 | ) | | (4,822,245 | ) |
|
|
|
|
|
|
|
|
|
|
|
|
|
|
|
| Exchanged into associated funds | | | (18,363 | ) | | (203,437 | ) | | (50,380 | ) | | (528,019 | ) |
|
|
|
|
|
|
|
|
|
|
|
|
|
|
|
| Total | | | (241,747 | ) | | (2,677,148 | ) | | (510,658 | ) | | (5,350,264 | ) |
|
|
|
|
|
|
|
|
|
|
|
|
|
|
|
| Decrease | | | (142,353 | ) | $ | (1,575,772 | ) | | (297,291 | ) | $ | (3,108,331 | ) |
|
|
|
|
|
|
|
|
|
|
|
|
|
|
|
22
Notes to Financial Statement (unaudited)
| | | | | | | | | | | | | | |
| | | Six Months Ended
June 30, 2005 | | Year Ended
December 31, 2004 | |
|
|
|
|
|
|
|
| Class I | | | Shares | | Amount | | | Shares | | Amount | |
|
|
|
|
|
|
|
|
|
|
|
|
|
|
|
| Net proceeds from sales of shares | | | 27,558 | | $ | 310,182 | | | 57,827 | | $ | 619,170 | |
|
|
|
|
|
|
|
|
|
|
|
|
|
|
|
| Investment of dividends | | | — | | | — | | | 3,132 | | | 35,829 | |
|
|
|
|
|
|
|
|
|
|
|
|
|
|
|
| Total | | | 27,558 | | | 310,182 | | | 60,959 | | | 654,999 | |
|
|
|
|
|
|
|
|
|
|
|
|
|
|
|
| Cost of shares repurchased | | | (43,147 | ) | | (496,173 | ) | | (28,672 | ) | | (313,309 | ) |
|
|
|
|
|
|
|
|
|
|
|
|
|
|
|
| Increase (decrease) | | | (15,589 | ) | $ | (185,991 | ) | | 32,287 | | $ | 341,690 | |
|
|
|
|
|
|
|
|
|
|
|
|
|
|
|
| | | | | | | | | | | | | | |
| Class R | | | Shares | | Amount | | | Shares | | Amount | |
|
|
|
|
|
|
|
|
|
|
|
|
|
|
|
| Net proceeds from sales of shares | | | 11,204 | | $ | 125,833 | | | 32,047 | | $ | 345,585 | |
|
|
|
|
|
|
|
|
|
|
|
|
|
|
|
| Investment of dividends | | | — | | | — | | | 109 | | | 1,240 | |
|
|
|
|
|
|
|
|
|
|
|
|
|
|
|
| Exchanged from associated funds | | | — | | | — | | | 382 | | | 4,347 | |
|
|
|
|
|
|
|
|
|
|
|
|
|
|
|
| Total | | | 11,204 | | | 125,833 | | | 32,538 | | | 351,172 | |
|
|
|
|
|
|
|
|
|
|
|
|
|
|
|
| Cost of shares repurchased | | | (761 | ) | | (8,596 | ) | | (5,023 | ) | | (53,617 | ) |
|
|
|
|
|
|
|
|
|
|
|
|
|
|
|
| Increase | | | 10,443 | | $ | 117,237 | | | 27,515 | | $ | 297,555 | |
|
|
|
|
|
|
|
|
|
|
|
|
|
|
|
| |
|
|
| * Automatic conversion of Class B shares to Class A shares approximately eight years after the initial purchase date. |
| |
9. | Other Matters — The Manager conducted an extensive internal review in response to developments regarding disruptive or illegal trading practices within the mutual fund industry. As of September 2003, the Manager had one arrangement that permitted frequent trading in the Seligman registered investment companies (“Seligman Funds”). This arrangement was in the process of being closed down by the Manager before the first proceedings relating to trading practices within the mutual fund industry were publicly announced. Based on a review of the Manager’s records for 2001 through 2003, the Manager identified three other arrangements that had permitted frequent trading in the Seligman Funds. All three had already been terminated prior to the end of September 2002. The Securities and Exchange Commission (the “SEC”) and the Attorney General of the State of New York also are reviewing these matters. |
| |
| The Manager also reviewed its practice of placing some of the Seligman Funds’ orders to buy and sell portfolio securities with brokerage firms in recognition of their sales of Seligman Funds. At the time the orders were placed, this practice was permissible when done properly; however, the Manager believes that it may have violated applicable requirements for certain of such orders as a result of compensation arrangements the Manager had with certain brokerage firms. The Manager discontinued this practice entirely in October 2003. The Manager is confident that the execution of all such orders was consistent with its best execution obligations and that the Seligman Funds did not pay higher brokerage commissions than they would otherwise have paid for comparable transactions. The Manager also responded fully to information requests from the SEC and the NASD relating to the Manager’s use of revenue sharing and fund portfolio brokerage commissions and will continue to provide additional information if, and as, requested. |
| |
| The results of the Manager’s internal reviews were presented to the Independent Directors of the Seligman Funds. In order to resolve matters with the Independent Directors relating to the four arrangements that permitted frequent trading, which did not affect Seligman Common Stock Fund, in May 2004, the Manager made payments to three funds and agreed to waive a portion of its management fee with respect to another fund. In order to resolve matters with the Independent Directors with regard to portfolio brokerage commissions, in May 2004, the Manager made payments to each of twenty-four funds in an amount equal to the commissions paid by each such fund during the period from 1998 through 2003 to certain brokerage firms in recognition of sales of fund shares, including $107,746 paid to Seligman Common Stock Fund, which has been reported as Payments received from the Manager in the Statement of Changes in Net Assets for the year ended December 31, 2004. |
23
Financial Highlights (unaudited)
The tables below are intended to help you understand each Class’s financial performance for the periods presented. Certain information reflects financial results for a single share of a Class that was held throughout the periods shown. Per share amounts are calculated using average shares outstanding. “Total Return” shows the rate that you would have earned (or lost) on an investment in each Class, assuming you reinvested all your dividends and capital gain distributions. Total returns do not reflect any taxes or sales charges and are not annualized for periods of less than one year.
| | | | | | | | | | | | | | | | | | | | | |
CLASS A | | | | | | | | | | | | | | | | | | | |
|
|
|
|
|
|
|
|
|
|
|
|
|
|
|
|
|
|
|
|
| | Six Months
Ended
6/30/05 | | Year Ended December 31, | |
| | |
| |
| | | 2004 | | 2003 | | 2002 | | 2001 | | 2000 | |
|
|
|
|
|
|
|
|
|
|
|
|
|
|
Per Share Data: | | | | | | | | | | | | | | | | | | | | | |
|
|
|
|
|
|
|
|
|
|
|
|
|
|
|
|
|
|
|
|
|
|
Net Asset Value, Beginning of Period | | | $ | 11.58 | | | $ | 10.42 | | $ | 8.49 | | $ | 11.55 | | $ | 13.41 | | $ | 14.93 | |
|
|
|
|
|
|
|
|
|
|
|
|
|
|
|
|
|
|
|
|
|
|
Income (Loss) from Investment Operations: | | | | | | | | | | | | | | | | | | | | | |
|
|
|
|
|
|
|
|
|
|
|
|
|
|
|
|
|
|
|
|
|
|
Net investment income | | | | 0.03 | | | | 0.07 | | | 0.03 | | | 0.05 | | | 0.06 | | | 0.08 | |
|
|
|
|
|
|
|
|
|
|
|
|
|
|
|
|
|
|
|
|
|
|
Net realized and unrealized gain (loss) on investments | | | | (0.29 | ) | | | 1.16 | | | 1.93 | | | (3.06 | ) | | (1.86 | ) | | (1.36 | ) |
|
|
|
|
|
|
|
|
|
|
|
|
|
|
|
|
|
|
|
|
|
|
Total from Investment Operations | | | | (0.26 | ) | | | 1.23 | | | 1.96 | | | (3.01 | ) | | (1.80 | ) | | (1.28 | ) |
|
|
|
|
|
|
|
|
|
|
|
|
|
|
|
|
|
|
|
|
|
|
Less Distributions: | | | | | | | | | | | | | | | | | | | | | |
|
|
|
|
|
|
|
|
|
|
|
|
|
|
|
|
|
|
|
|
|
|
Dividends from net investment income | | | | — | | | | (0.07 | ) | | (0.03 | ) | | (0.05 | ) | | (0.06 | ) | | (0.07 | ) |
|
|
|
|
|
|
|
|
|
|
|
|
|
|
|
|
|
|
|
|
|
|
Distributions from net realized capital gains | | | | — | | | | — | | | — | | | — | | | — | | | (0.17 | ) |
|
|
|
|
|
|
|
|
|
|
|
|
|
|
|
|
|
|
|
|
|
|
Total Distributions | | | | — | | | | (0.07 | ) | | (0.03 | ) | | (0.05 | ) | | (0.06 | ) | | (0.24 | ) |
|
|
|
|
|
|
|
|
|
|
|
|
|
|
|
|
|
|
|
|
|
|
Net Asset Value, End of Period | | | $ | 11.32 | | | $ | 11.58 | | $ | 10.42 | | $ | 8.49 | | $ | 11.55 | | $ | 13.41 | |
|
|
|
|
|
|
|
|
|
|
|
|
|
|
|
|
|
|
|
|
|
|
| | | | | | | | | | | | | | | | | | | | | |
Total Return | | | | (2.25 | )% | | | 11.82 | %# | | 23.11 | % | | (26.10 | )% | | (13.40 | )% | | (8.67 | )% |
|
|
|
|
|
|
|
|
|
|
|
|
|
|
|
|
|
|
|
|
|
|
| | | | | | | | | | | | | | | | | | | | | |
Ratios/Supplemental Data: | | | | | | | | | | | | | | | | | | | | | |
|
|
|
|
|
|
|
|
|
|
|
|
|
|
|
|
|
|
|
|
|
|
Net assets, end of period (000s omitted) | | | $ | 239,862 | | | $ | 264,142 | | $ | 271,692 | | $ | 255,027 | | $ | 409,769 | | $ | 550,547 | |
|
|
|
|
|
|
|
|
|
|
|
|
|
|
|
|
|
|
|
|
|
|
Ratio of expenses to average net assets | | | | 1.29 | %† | | | 1.28 | % | | 1.31 | % | | 1.31 | % | | 1.18 | % | | 1.12 | % |
|
|
|
|
|
|
|
|
|
|
|
|
|
|
|
|
|
|
|
|
|
|
Ratio of net investment income to average net assets | | | | 0.53 | %† | | | 0.66 | % | | 0.38 | % | | 0.48 | % | | 0.54 | % | | 0.52 | % |
|
|
|
|
|
|
|
|
|
|
|
|
|
|
|
|
|
|
|
|
|
|
Portfolio turnover rate | | | | 33.20 | % | | | 43.50 | % | | 140.33 | % | | 174.50 | % | | 105.62 | % | | 61.27 | % |
|
|
|
|
|
|
|
|
|
|
|
|
|
|
|
|
|
|
|
|
|
|
See footnotes on page 28.
24
Financial Highlights (unaudited)
| | | | | | | | | | | | | | | | | | | | | |
CLASS B | | | | | | | | | | | | | | | | | | | |
|
|
|
|
|
|
|
|
|
|
|
|
|
|
|
|
|
|
|
|
| | Six Months
Ended
6/30/05 | | Year Ended December 31, | |
| | |
|
|
| | | 2004 | | 2003 | | 2002 | | 2001 | | 2000 | |
|
|
|
|
|
|
|
|
|
|
|
|
|
|
Per Share Data: | | | | | | | | | | | | | | | | | | | |
|
|
|
|
|
|
|
|
|
|
|
|
|
|
Net Asset Value, Beginning of Period | | | $ | 11.37 | | | $ | 10.25 | | $ | 8.39 | | $ | 11.44 | | $ | 13.30 | | $ | 14.85 | |
|
|
|
|
|
|
|
|
|
|
|
|
|
|
|
|
|
|
|
|
|
|
Income (Loss) from Investment Operations: | | | | | | | | | | | | | | | | | | | | | |
|
|
|
|
|
|
|
|
|
|
|
|
|
|
|
|
|
|
|
|
|
|
Net investment loss | | | | (0.01 | ) | | | (0.01 | ) | | (0.03 | ) | | (0.03 | ) | | (0.03 | ) | | (0.04 | ) |
|
|
|
|
|
|
|
|
|
|
|
|
|
|
|
|
|
|
|
|
|
|
Net realized and unrealized gain (loss) on investments | | | | (0.29 | ) | | | 1.13 | | | 1.89 | | | (3.02 | ) | | (1.83 | ) | | (1.34 | ) |
|
|
|
|
|
|
|
|
|
|
|
|
|
|
|
|
|
|
|
|
|
|
Total from Investment Operations | | | | (0.30 | ) | | | 1.12 | | | 1.86 | | | (3.05 | ) | | (1.86 | ) | | (1.38 | ) |
|
|
|
|
|
|
|
|
|
|
|
|
|
|
|
|
|
|
|
|
|
|
Less Distributions: | | | | | | | | | | | | | | | | | | | | | |
|
|
|
|
|
|
|
|
|
|
|
|
|
|
|
|
|
|
|
|
|
|
Distributions from net realized capital gains | | | | — | | | | — | | | — | | | — | | | — | | | (0.17 | ) |
|
|
|
|
|
|
|
|
|
|
|
|
|
|
|
|
|
|
|
|
|
|
Total Distributions | | | | — | | | | — | | | — | | | — | | | — | | | (0.17 | ) |
|
|
|
|
|
|
|
|
|
|
|
|
|
|
|
|
|
|
|
|
|
|
Net Asset Value, End of Period | | | $ | 11.07 | | | $ | 11.37 | | $ | 10.25 | | $ | 8.39 | | $ | 11.44 | | $ | 13.30 | |
|
|
|
|
|
|
|
|
|
|
|
|
|
|
|
|
|
|
|
|
|
|
| | | | | | | | | | | | | | | | | | | | | |
Total Return | | | | (2.64 | )% | | | 10.93 | %# | | 22.17 | % | | (26.66 | )% | | (13.98 | )% | | (9.37 | )% |
|
|
|
|
|
|
|
|
|
|
|
|
|
|
|
|
|
|
|
|
|
|
| | | | | | | | | | | | | | | | | | | | | |
Ratios/Supplemental Data: | | | | | | | | | | | | | | | | | | | | | |
|
|
|
|
|
|
|
|
|
|
|
|
|
|
|
|
|
|
|
|
|
|
Net assets, end of period (000s omitted) | | | $ | 10,869 | | | $ | 13,581 | | $ | 16,312 | | $ | 15,456 | | $ | 25,513 | | $ | 31,196 | |
|
|
|
|
|
|
|
|
|
|
|
|
|
|
|
|
|
|
|
|
|
|
Ratio of expenses to average net assets | | | | 2.05 | %† | | | 2.04 | % | | 2.07 | % | | 2.06 | % | | 1.93 | % | | 1.87 | % |
|
|
|
|
|
|
|
|
|
|
|
|
|
|
|
|
|
|
|
|
|
|
Ratio of net investment loss to average net assets | | | | (0.23 | )%† | | | (0.10 | )% | | (0.38 | )% | | (0.27 | )% | | (0.21 | )% | | (0.23 | )% |
|
|
|
|
|
|
|
|
|
|
|
|
|
|
|
|
|
|
|
|
|
|
Portfolio turnover rate | | | | 33.20 | % | | | 43.50 | % | | 140.33 | % | | 174.50 | % | | 105.62 | % | | 61.27 | % |
|
|
|
|
|
|
|
|
|
|
|
|
|
|
|
|
|
|
|
|
|
|
See footnotes on page 28.
25
Financial Highlights (unaudited)
| | | | | | | | | | | | | | | | | | | | | |
CLASS C | | | | | | | | | | | | | | | | | | | |
|
|
|
|
|
|
|
|
|
|
|
|
|
|
|
|
|
|
|
|
| | Six Months
Ended
6/30/05 | | Year Ended December 31, | |
| | |
|
|
| | | 2004 | | 2003 | | 2002 | | 2001 | | 2000 | |
|
|
|
|
|
|
|
|
|
|
|
|
|
|
Per Share Data: | | | | | | | | | | | | | | | | | | | | | |
|
|
|
|
|
|
|
|
|
|
|
|
|
|
|
|
|
|
|
|
|
|
Net Asset Value, Beginning of Period | | | $ | 11.38 | | | $ | 10.26 | | $ | 8.39 | | $ | 11.45 | | $ | 13.32 | | $ | 14.87 | |
|
|
|
|
|
|
|
|
|
|
|
|
|
|
|
|
|
|
|
|
|
|
Income (Loss) from Investment Operations: | | | | | | | | | | | | | | | | | | | | | |
|
|
|
|
|
|
|
|
|
|
|
|
|
|
|
|
|
|
|
|
|
|
Net investment loss | | | | (0.01 | ) | | | (0.01 | ) | | (0.03 | ) | | (0.03 | ) | | (0.03 | ) | | (0.04 | ) |
|
|
|
|
|
|
|
|
|
|
|
|
|
|
|
|
|
|
|
|
|
|
Net realized and unrealized gain (loss) on investments | | | | (0.29 | ) | | | 1.13 | | | 1.90 | | | (3.03 | ) | | (1.84 | ) | | (1.34 | ) |
|
|
|
|
|
|
|
|
|
|
|
|
|
|
|
|
|
|
|
|
|
|
Total from Investment Operations | | | | (0.30 | ) | | | 1.12 | | | 1.87 | | | (3.06 | ) | | (1.87 | ) | | (1.38 | ) |
|
|
|
|
|
|
|
|
|
|
|
|
|
|
|
|
|
|
|
|
|
|
Less Distributions: | | | | | | | | | | | | | | | | | | | | | |
|
|
|
|
|
|
|
|
|
|
|
|
|
|
|
|
|
|
|
|
|
|
Distributions from net realized capital gains | | | | — | | | | — | | | — | | | — | | | — | | | (0.17 | ) |
|
|
|
|
|
|
|
|
|
|
|
|
|
|
|
|
|
|
|
|
|
|
Total Distributions | | | | — | | | | — | | | — | | | — | | | — | | | (0.17 | ) |
|
|
|
|
|
|
|
|
|
|
|
|
|
|
|
|
|
|
|
|
|
|
Net Asset Value, End of Period | | | $ | 11.08 | | | $ | 11.38 | | $ | 10.26 | | $ | 8.39 | | $ | 11.45 | | $ | 13.32 | |
|
|
|
|
|
|
|
|
|
|
|
|
|
|
|
|
|
|
|
|
|
|
| | | | | | | | | | | | | | | | | | | | | |
Total Return | | | | (2.64 | )% | | | 10.92 | %# | | 22.29 | % | | (26.73 | )% | | (14.04 | )% | | (9.36 | )% |
|
|
|
|
|
|
|
|
|
|
|
|
|
|
|
|
|
|
|
|
|
|
| | | | | | | | | | | | | | | | | | | | | |
Ratios/Supplemental Data: | | | | | | | | | | | | | | | | | | | | | |
|
|
|
|
|
|
|
|
|
|
|
|
|
|
|
|
|
|
|
|
|
|
Net assets, end of period (000s omitted) | | | $ | 4,863 | | | $ | 5,227 | | $ | 6,671 | | $ | 6,179 | | $ | 10,592 | | $ | 10,388 | |
|
|
|
|
|
|
|
|
|
|
|
|
|
|
|
|
|
|
|
|
|
|
Ratio of expenses to average net assets | | | | 2.05 | %† | | | 2.04 | % | | 2.07 | % | | 2.06 | % | | 1.93 | % | | 1.87 | % |
|
|
|
|
|
|
|
|
|
|
|
|
|
|
|
|
|
|
|
|
|
|
Ratio of net investment loss to average net assets | | | | (0.23 | )%† | | | (0.10 | )% | | (0.38 | )% | | (0.27 | )% | | (0.21 | )% | | (0.23 | )% |
|
|
|
|
|
|
|
|
|
|
|
|
|
|
|
|
|
|
|
|
|
|
Portfolio turnover rate | | | | 33.20 | % | | | 43.50 | % | | 140.33 | % | | 174.50 | % | | 105.62 | % | | 61.27 | % |
|
|
|
|
|
|
|
|
|
|
|
|
|
|
|
|
|
|
|
|
|
|
See footnotes on page 28.
26
Financial Highlights (unaudited)
| | | | | | | | | | | | | | | | | | | | | |
CLASS D | | | | | | | | | | | | | | | | | | | |
|
|
|
|
|
|
|
|
|
|
|
|
|
|
|
|
|
|
|
|
| | Six Months
Ended
6/30/05 | | Year Ended December 31, | |
| | |
|
|
| | | 2004 | | 2003 | | 2002 | | 2001 | | 2000 | |
|
|
|
|
|
|
|
|
|
|
|
|
|
|
Per Share Data: | | | | | | | | | | | | | | | | | | | |
|
|
|
|
|
|
|
|
|
|
|
|
|
|
|
|
|
|
|
|
Net Asset Value, Beginning of Period | | | $ | 11.37 | | | $ | 10.25 | | $ | 8.39 | | $ | 11.45 | | $ | 13.32 | | $ | 14.87 | |
|
|
|
|
|
|
|
|
|
|
|
|
|
|
|
|
|
|
|
|
|
|
Income (Loss) from Investment Operations: | | | | | | | | | | | | | | | | | | | | | |
|
|
|
|
|
|
|
|
|
|
|
|
|
|
|
|
|
|
|
|
|
|
Net investment loss | | | | (0.01 | ) | | | (0.01 | ) | | (0.03 | ) | | (0.03 | ) | | (0.03 | ) | | (0.04 | ) |
|
|
|
|
|
|
|
|
|
|
|
|
|
|
|
|
|
|
|
|
|
|
Net realized and unrealized gain (loss) on investments | | | | (0.28 | ) | | | 1.13 | | | 1.89 | | | (3.03 | ) | | (1.84 | ) | | (1.34 | ) |
|
|
|
|
|
|
|
|
|
|
|
|
|
|
|
|
|
|
|
|
|
|
Total from Investment Operations | | | | (0.29 | ) | | | 1.12 | | | 1.86 | | | (3.06 | ) | | (1.87 | ) | | (1.38 | ) |
|
|
|
|
|
|
|
|
|
|
|
|
|
|
|
|
|
|
|
|
|
|
Less Distributions: | | | | | | | | | | | | | | | | | | | | | |
|
|
|
|
|
|
|
|
|
|
|
|
|
|
|
|
|
|
|
|
|
|
Distributions from net realized capital gains | | | | — | | | | — | | | — | | | — | | | — | | | (0.17 | ) |
|
|
|
|
|
|
|
|
|
|
|
|
|
|
|
|
|
|
|
|
|
|
Total Distributions | | | | — | | | | — | | | — | | | — | | | — | | | (0.17 | ) |
|
|
|
|
|
|
|
|
|
|
|
|
|
|
|
|
|
|
|
|
|
|
Net Asset Value, End of Period | | | $ | 11.08 | | | $ | 11.37 | | $ | 10.25 | | $ | 8.39 | | $ | 11.45 | | $ | 13.32 | |
|
|
|
|
|
|
|
|
|
|
|
|
|
|
|
|
|
|
|
|
|
|
|
Total Return | | | | (2.55 | )% | | | 10.93 | %# | | 22.17 | % | | (26.73 | )% | | (14.04 | )% | | (9.36 | )% |
|
|
|
|
|
|
|
|
|
|
|
|
|
|
|
|
|
|
|
|
|
|
|
Ratios/Supplemental Data: | | | | | | | | | | | | | | | | | | | | | |
|
|
|
|
|
|
|
|
|
|
|
|
|
|
|
|
|
|
|
|
|
|
Net assets, end of period (000s omitted) | | | $ | 14,366 | | | $ | 16,370 | | $ | 17,800 | | $ | 18,302 | | $ | 32,230 | | $ | 44,469 | |
|
|
|
|
|
|
|
|
|
|
|
|
|
|
|
|
|
|
|
|
|
|
Ratio of expenses to average net assets | | | | 2.05 | %† | | | 2.04 | % | | 2.07 | % | | 2.06 | % | | 1.93 | % | | 1.87 | % |
|
|
|
|
|
|
|
|
|
|
|
|
|
|
|
|
|
|
|
|
|
|
Ratio of net investment loss to average net assets | | | | (0.23 | )%† | | | (0.10 | )% | | (0.38 | )% | | (0.27 | )% | | (0.21 | )% | | (0.23 | )% |
|
|
|
|
|
|
|
|
|
|
|
|
|
|
|
|
|
|
|
|
|
|
Portfolio turnover rate | | | | 33.20 | % | | | 43.50 | % | | 140.33 | % | | 174.50 | % | | 105.62 | % | | 61.27 | % |
|
|
|
|
|
|
|
|
|
|
|
|
|
|
|
|
|
|
|
|
|
|
See footnotes on page 28.
27
Financial Highlights (unaudited)
| | | | | | | | | | | | | | | | | | | | | | | | | | | | | |
CLASS I | | CLASS R | |
| |
|
|
| | Six Months
Ended
6/30/05 | | Year Ended December 31, | | 11/30/01*
to
12/31/01 | | Six Months
Ended
6/30/05 | | Year
Ended
12/31/04 | | 4/30/03*
to
12/31/03 | |
| | |
| | | | | |
| | | 2004 | | 2003 | | 2002 | | | | | |
|
|
|
|
|
|
|
|
|
|
| |
|
|
|
|
|
|
Per Share Data: | | | | | | | | | | | | | | | | | | | | | | | | | |
|
|
|
|
|
|
|
|
|
|
|
|
|
|
|
| |
|
|
|
|
|
|
|
|
|
Net Asset Value, | | | | | | | | | | | | | | | | | | | | | | | | | |
Beginning of Period | | | $ | 11.61 | | | $ | 10.44 | | $ | 8.49 | | $ | 11.55 | | $ | 11.55 | | | $ | 11.58 | | | $ | 10.42 | | $ | 8.66 | |
|
|
|
|
|
|
|
|
|
|
|
|
|
|
|
|
|
| |
|
|
|
|
|
|
|
|
|
|
|
Income (Loss) from | | | | | | | | | | | | | | | | | | | | | | | | | | | | | |
Investment Operations: | | | | | | | | | | | | | | | | | | | | | | | | | | | | | |
|
|
|
|
|
|
|
|
|
|
|
|
|
|
|
|
|
| |
|
|
|
|
|
|
|
|
|
|
|
Net investment income | | | | 0.05 | | | | 0.11 | | | 0.07 | | | 0.10 | | | — | ‡ | | | 0.01 | | | | 0.04 | | | 0.01 | |
|
|
|
|
|
|
|
|
|
|
|
|
|
|
|
|
|
| |
|
|
|
|
|
|
|
|
|
|
|
Net realized and unrealized | | | | | | | | | | | | | | | | | | | | | | | | | | | | | |
gain (loss) on investments | | | | (0.29 | ) | | | 1.17 | | | 1.94 | | | (3.07 | ) | | 0.02 | | | | (0.28 | ) | | | 1.17 | | | 1.77 | |
|
|
|
|
|
|
|
|
|
|
|
|
|
|
|
|
|
| |
|
|
|
|
|
|
|
|
|
|
|
Total from Investment | | | | | | | | | | | | | | | | | | | | | | | | | | | | | |
Operations | | | | (0.24 | ) | | | 1.28 | | | 2.01 | | | (2.97 | ) | | 0.02 | | | | (0.27 | ) | | | 1.21 | | | 1.78 | |
|
|
|
|
|
|
|
|
|
|
|
|
|
|
|
|
|
| |
|
|
|
|
|
|
|
|
|
|
|
Less Distributions: | | | | | | | | | | | | | | | | | | | | | | | | | | | | | |
|
|
|
|
|
|
|
|
|
|
|
|
|
|
|
|
|
| |
|
|
|
|
|
|
|
|
|
|
|
Dividends from net | | | | | | | | | | | | | | | | | | | | | | | | | | | | | |
investment income | | | | — | | | | (0.11 | ) | | (0.06 | ) | | (0.09 | ) | | (0.02 | ) | | | — | | | | (0.05 | ) | | (0.02 | ) |
|
|
|
|
|
|
|
|
|
|
|
|
|
|
|
|
|
| |
|
|
|
|
|
|
|
|
|
|
|
Total Distributions | | | | — | | | | (0.11 | ) | | (0.06 | ) | | (0.09 | ) | | (0.02 | ) | | | — | | | | (0.05 | ) | | (0.02 | ) |
|
|
|
|
|
|
|
|
|
|
|
|
|
|
|
|
|
| |
|
|
|
|
|
|
|
|
|
|
|
Net Asset Value, | | | | | | | | | | | | | | | | | | | | | | | | | | | | | |
End of Period | | | $ | 11.37 | | | $ | 11.61 | | $ | 10.44 | | $ | 8.49 | | $ | 11.55 | | | $ | 11.31 | | | $ | 11.58 | | $ | 10.42 | |
|
|
|
|
|
|
|
|
|
|
|
|
|
|
|
|
|
| |
|
|
|
|
|
|
|
|
|
|
|
Total Return | | | | (2.07 | )% | | | 12.23 | %# | | 23.72 | % | | (25.82 | )% | | 0.17 | % | | | (2.33 | )% | | | 11.57 | %# | | 20.50 | % |
|
|
|
|
|
|
|
|
|
|
|
|
|
|
|
|
|
| |
|
|
|
|
|
|
|
|
|
|
|
Ratios/Supplemental Data: | | | | | | | | | | | | | | | | | | | | | | | | | | | | | |
|
|
|
|
|
|
|
|
|
|
|
|
|
|
|
|
|
| |
|
|
|
|
|
|
|
|
|
|
|
Net assets, end of period | | | | | | | | | | | | | | | | | | | | | | | | | | | | | |
(000s omitted) | | | $ | 3,745 | | | $ | 4,005 | | $ | 3,265 | | $ | 2,539 | | $ | 21 | | | $ | 431 | | | $ | 321 | | $ | 2 | |
|
|
|
|
|
|
|
|
|
|
|
|
|
|
|
|
|
| |
|
|
|
|
|
|
|
|
|
|
|
Ratio of expenses to | | | | | | | | | | | | | | | | | | | | | | | | | | | | | |
average net assets | | | | 0.90 | %† | | | 0.90 | % | | 0.98 | % | | 0.92 | % | | 0.78 | %† | | | 1.55 | %† | | | 1.54 | % | | 1.58 | %† |
|
|
|
|
|
|
|
|
|
|
|
|
|
|
|
|
|
| |
|
|
|
|
|
|
|
|
|
|
|
Ratio of net investment income | | | | | | | | | | | | | | | | | | | | | | | | | | | | | |
to average net assets | | | | 0.92 | %† | | | 1.04 | % | | 0.71 | % | | 0.87 | % | | 0.83 | %† | | | 0.27 | %† | | | 0.40 | % | | 0.09 | %† |
|
|
|
|
|
|
|
|
|
|
|
|
|
|
|
|
|
| |
|
|
|
|
|
|
|
|
|
|
|
Portfolio turnover rate | | | | 33.20 | % | | | 43.50 | % | | 140.33 | % | | 174.50 | % | | 105.62 | %†† | | | 33.20 | % | | | 43.50 | % | | 140.33 | %ø |
|
|
|
|
|
|
|
|
|
|
|
|
|
|
|
|
|
| |
|
|
|
|
|
|
|
|
|
|
|
Without expense | | | | | | | | | | | | | | | | | | | | | | | | | | | | | |
reimbursement:øø | | | | | | | | | | | | | | | | | | | | | | | | | | | | | |
|
|
|
|
|
|
|
|
|
|
|
|
|
|
|
|
|
| | | | | | | | | | | | |
Ratio of expenses to | | | | | | | | | | | | | | | | | | | | | | | | | | | | | |
average net assets | | | | | | | | | | | | | | 0.96 | % | | 1.37 | %† | | | | | | | | | | | |
|
|
|
|
|
|
|
|
|
|
|
|
|
|
|
|
|
| | | | | | | | | | | | |
Ratio of net investment income | | | | | | | | | | | | | | | | | | | | | | | | | | | | | |
to average net assets | | | | | | | | | | | | | | 0.83 | % | | 0.24 | %† | | | | | | | | | | | |
|
|
|
|
|
|
|
|
|
|
|
|
|
|
|
|
|
| | | | | | | | | | | | |
| | |
* | | Commencement of offering of shares. |
† | | Annualized. |
†† | | For the year ended December 31, 2001. |
ø | | For the year ended December 31, 2003. |
øø | | The Manager, at its discretion, reimbursed certain expenses of Class I shares. |
‡ | | Less than + or – $0.01. |
# | | Excluding the effect of the payments received from the Manager (Note 9), total return would have been as follows: Class A 11.79%; Class B 10.90%; Class C 10.89%; Class D 10.90%; Class I 12.20%; and Class R 11.54%. |
See Notes to Financial Statements. |
28
Board of Directors
| | | | |
Robert B. Catell 2, 3 | | Leroy C. Richie 1, 3 |
| |
|
• | Chairman, Chief Executive Officer and Director, | | • | Chairman and Chief Executive Officer, |
| KeySpan Corporation | | | Q Standards Worldwide, Inc. |
| | • | Director, Kerr-McGee Corporation |
John R. Galvin 1, 3 | | |
| | Robert L. Shafer 2, 3 |
• | Dean Emeritus, | |
|
| Fletcher School of Law and Diplomacy at Tufts | | • | Ambassador and Permanent Observer of the |
| University | | | Sovereign Military Order of Malta to the |
| | | | United Nations |
Alice S. Ilchman 2, 3 | | |
| | James N. Whitson 1, 3 |
• | President Emerita, Sarah Lawrence College | |
|
• | Director, Jeannette K. Watson Summer | | • | Retired Executive Vice President and Chief |
| Fellowship | | | Operating Officer, Sammons Enterprises, Inc. |
• | Trustee, Committee for Economic Development | | • | Director, CommScope, Inc. |
| | | | |
Frank A. McPherson 2, 3 | | Brian T. Zino |
| |
|
• | Retired Chairman of the Board and Chief | | • | Director and President, |
| Executive Officer, Kerr-McGee Corporation | | | J. & W. Seligman & Co. Incorporated |
• | Director, ConocoPhillips | | • | Chairman, Seligman Data Corp. |
• | Director, Integris Health | | • | Director, ICI Mutual Insurance Company |
| | | • | Member of the Board of Governors, |
Betsy S. Michel 1, 3 | | | Investment Company Institute |
| | | |
• | Trustee, The Geraldine R. Dodge Foundation | |
|
| | | Member: | 1 Audit Committee |
William C. Morris | | | 2 Director Nominating Committee |
| | | 3 Board Operations Committee |
• | Chairman, J. & W. Seligman & Co. Incorporated | | | |
• | Chairman, Carbo Ceramics Inc. | | | |
Executive Officers
| | |
William C. Morris | | Michael F. McGarry |
| |
|
Chairman | | Vice President |
| | |
Brian T. Zino | | Thomas G. Rose |
| |
|
President and Chief Executive Officer | | Vice President |
| | |
John B. Cunningham | | Lawrence P. Vogel |
| |
|
Vice President | | Vice President and Treasurer |
| | |
Eleanor T.M. Hoagland | | Frank J. Nasta |
| |
|
Vice President and Chief Compliance Officer | | Secretary |
29
Additional Fund Information
Quarterly Schedule of Investments
A complete schedule of portfolio holdings owned by the Fund will be filed with the SEC for the first and third quarters of each fiscal year on Form N-Q, and will be available to shareholders (i) without charge, upon request, by calling toll-free (800) 221-2450 in the US or collect (212) 682-7600 outside the US or (ii) on the SEC’s website at www.sec.gov. In addition, the Form N-Q may be reviewed and copied at the SEC’s Public Reference Room in Washington, D.C. Information on the operation of the Public Reference Room may be obtained by calling (800) SEC-0330. Certain of the information contained in the Fund’s Form N-Q is also made available to shareholders on Seligman’s website at www.seligman.com.1
Proxy Voting
A description of the policies and procedures used by the Fund to determine how to vote proxies relating to portfolio securities as well as information regarding how the Fund voted proxies relating to portfolio securities during the 12-month period ended June 30 of each year will be available (i) without charge, upon request, by calling toll-free (800) 221-2450 in the US or collect (212) 682-7600 outside the US and (ii) on the SEC’s website at www.sec.gov.2
This report is intended only for the information of shareholders or those who have received the offering prospectus covering shares of Capital Stock of Seligman Common Stock Fund, Inc., which contains information about the investment objectives, risks, charges, and expenses of the Fund, each of which should be considered carefully before investing. The prospectus, which contains information about these factors, should be read carefully before investing or sending money.
| |
1 | The reference to Seligman’s website is an inactive textual reference and information contained in or otherwise accessible through Seligman’s website does not form a part of this report or the Fund’s prospectus. |
2 | Information for each new 12-month period ending June 30 will be available no later than August 31 of that year. |
EQCS3 6/05
ITEM 2.    CODE OF ETHICS.
                Not applicable.

ITEM 3.    AUDIT COMMITTEE FINANCIAL EXPERT.
                Not applicable.

ITEM 4.    PRINCIPAL ACCOUNTANT FEES AND SERVICES.
                Not applicable.

ITEM 5.    AUDIT COMMITTEE OF LISTED REGISTRANTS.
                Not applicable.

ITEM 6.    SCHEDULE OF INVESTMENTS.
                Included in Item 1 above.

ITEM 7.    DISCLOSURE OF PROXY VOTING POLICIES AND PROCEDURES FOR CLOSED-END
           MANAGEMENT INVESTMENT COMPANIES.
                Not applicable.

ITEM 8.    PORTFOLIO MANAGERS OF CLOSED-END MANAGEMENT INVESTMENT COMPANIES.
                Not applicable.

ITEM 9.    PURCHASES OF EQUITY SECURITIES BY CLOSED-END MANAGEMENT INVESTMENT
           COMPANY AND AFFILIATED PURCHASERS.
                Not applicable.

ITEM 10.   SUBMISSION OF MATTERS TO A VOTE OF SECURITY HOLDERS.

                  The Board of Directors of the Registrant has a adopted a
            Nominating Committee Charter which provides that the Nominating
            Committee (the "Committee") may consider and evaluate nominee
            candidates properly submitted by shareholders if a vacancy among the
            Independent Directors of the Registrant occurs and if, based on the
            Board's then current size, composition and structure, the Committee
            determines that the vacancy should be filled. The Committee will
            consider candidates submitted by shareholders on the same basis as
            it considers and evaluates candidates recommended by other sources.
            A copy of the qualifications and procedures that must be met or
            followed by shareholders to properly submit a nominee candidate to
            the Committee may be obtained by submitting a request in writing to
            the Secretary of the Registrant.

ITEM 11. CONTROLS AND PROCEDURES.

(a)      The registrant's principal executive officer and principal financial
         officer have concluded, based upon their evaluation of the registrant's
         disclosure controls and procedures as conducted within 90 days of the
         filing date of this report, that these disclosure controls and
         procedures provide reasonable assurance that material information
         required to be disclosed by the registrant in the report it files or
         submits on Form N-CSR is recorded,


         processed, summarized and reported, within the time periods specified
         in the Commission's rules and forms and that such material information
         accumulated and communicated to the registrant's management, including
         is its principal executive officer and principal financial officer, as
         appropriate, in order to allow timely decisions regarding required
         disclosure.

(b)      The registrant's principal executive officer and principal financial
         officer are aware of no changes in the registrant's internal control
         over financial reporting that occurred during the second fiscal quarter
         of the period covered by this report that has materially affected, or
         is reasonably likely to materially affect, the registrant's internal
         control over financial reporting.


ITEM 12.  EXHIBITS.
(a)(1)   Not applicable.

(a)(2)   Certifications of principal executive officer and principal financial
         officer as required by Rule 30a-2(a) under the Investment Company Act
         of 1940.

(a)(3)   Not applicable.

(b)      Certifications of chief executive officer and chief financial officer
         as required by Rule 30a-2(b) under the Investment Company Act of 1940.


                                   SIGNATURES

Pursuant to the requirements of the Securities Exchange Act of 1934 and the
Investment Company Act of 1940, the registrant has duly caused this report to be
signed on its behalf by the undersigned, thereunto duly authorized.

SELIGMAN COMMON STOCK FUND, INC.


By:      /s/ BRIAN T. ZINO
         Brian T. Zino
         President and Chief Executive Officer


Date:    September 7, 2005

Pursuant to the requirements of the Securities Exchange Act of 1934 and the
Investment Company Act of 1940, this report has been signed below by the
following persons on behalf of the registrant and in the capacities and on the
dates indicated.


By:      /s/ BRIAN T. ZINO
         Brian T. Zino
         President and Chief Executive Officer

Date:    September 7, 2005


By:      /s/ LAWRENCE P. VOGEL
         Lawrence P. Vogel
         Vice President, Treasurer and Chief Financial Officer

Date:    September 7, 2005


SELIGMAN COMMON STOCK FUND, INC.


EXHIBIT INDEX

          (a)(2)  Certifications of principal executive officer and principal
                  financial officer as required by Rule 30a-2(a) under the
                  Investment Company Act of 1940.

           (b)    Certification of chief executive officer and chief financial
                  officer as required by Rule 30a-2(b) of the Investment Company
                  Act of 1940.