See accompanying notes which are an integral part of these financial statements.
TEAM Asset Strategy Fund
Notes to the Financial Statements
October 31, 2010
NOTE 1. ORGANIZATION
The TEAM Asset Strategy Fund (the “Fund”) is an open-end, non-diversified series of the Valued Advisers Trust (the “Trust”). The Trust is a management investment company established under the laws of Delaware by an Agreement and Declaration of Trust dated June 13, 2008 (the “Trust Agreement”). The Trust Agreement permits the Trustees to issue an unlimited number of shares of beneficial interest of separate series without par value. The Fund is one of a series of funds authorized by the Board of Trustees (the “Board”). The Fund’s investment adviser is TEAM Financial Asset Management, LLC (the “Adviser”). The investment objective of the Fund is to provide high total investment return, which will generally be achieved t hrough a combination of appreciation in capital and income.
NOTE 2. SIGNIFICANT ACCOUNTING POLICIES
The following is a summary of significant accounting policies followed by the Fund in the preparation of its financial statements in accordance with accounting principles generally accepted in the United States of America (“GAAP”).
Securities Valuation – All investments in securities are recorded at their estimated fair value as described in Note 3.
Federal Income Taxes – The Fund makes no provision for federal income or excise tax. The Fund intends to qualify each year as a regulated investment company (“RIC”) under subchapter M of the Internal Revenue Code of 1986, as amended, by complying with the requirements applicable to RICs and by distributing substantially all of its taxable income. The Fund also intends to distribute sufficient net investment income and net capital gains, if any, so that it will not be subject to excise tax on undistributed income and gains. If the required amount of net investment income or gains is not distributed, the Fund could incur a tax expense.
As of and during the period ended October 31, 2010, the Fund did not have a liability for any unrecognized tax benefits. The Fund recognizes interest and penalties, if any, related to unrecognized tax benefits as income tax expense in the statement of operations. During the period, the Fund did not incur any interest or penalties. The Fund is subject to examination by U.S. federal tax authorities for the tax period ending October 31, 2010.
Expenses – Expenses incurred by the Trust that do not relate to a specific fund of the Trust are allocated to the individual funds based on each fund’s relative net assets or another appropriate basis (as determined by the Trustees).
Security Transactions and Related Income - The Fund follows industry practice and records security transactions on the trade date. The specific identification method is used for determining gains or losses for financial statement and income tax purposes. Dividend income is recorded on the ex-dividend date and interest income is recorded on an accrual basis. Discounts and premiums on securities purchased are amortized or accreted using the effective interest method. Withholding taxes on foreign dividends have been provided for in accordance with the Fund’s understanding of the applicable country’s tax rules and rates. The ability of issuers of debt securities held by the Fund to meet their obligations may be affected by economic and pol itical developments in a specific country or region.
Dividends and Distributions - The Fund intends to distribute substantially all of its net investment income, net realized long-term capital gains and its net realized short-term capital gains, if any, to its shareholders on at least an annual basis. Dividends to shareholders, which are determined in accordance with income tax regulations, are recorded on the ex-dividend date. The treatment for financial reporting purposes of distributions made to shareholders during the year from net investment income or net realized capital gains may differ from their ultimate treatment for federal income tax purposes. These differences are caused primarily by differences in the timing of the recognition of certain components of income, expense or realized capital gain for federal inc ome tax purposes. Where such differences are permanent in nature, they are reclassified in the components of net assets based on their ultimate characterization for federal income tax purposes. Any such reclassifications will have no effect on net assets, results of operations or net asset values per share of the Fund.
TEAM Asset Strategy Fund
Notes to the Financial Statements - continued
October 31, 2010
NOTE 2. SIGNIFICANT ACCOUNTING POLICIES – continued
Forward Currency Contracts - The Fund may engage in foreign currency exchange transactions. The value of the Fund’s portfolio securities that are invested in non-U.S. dollar denominated instruments as measured in U.S. dollars may be affected favorably or unfavorably by changes in foreign currency exchange rates, and the Fund may incur costs in connection with conversions between various currencies. The Fund will conduct its foreign currency exchange transactions either on a spot (i.e., cash) basis at the spot rate prevailing in the foreign currency exchange market, or through forward contracts to purchase or sell foreign currencies. A forward foreign currency exchange contract involves an obligation to purchase or sell a specific currency at a future date, which may be any fixed number of days from the date of the contract agreed upon by the parties, at a price set at the time of the contract. These contracts are traded directly between currency traders (usually large commercial banks) and their customers. The Fund will not, however, hold foreign currency except in connection with the purchase and sale of foreign portfolio securities. The Fund has engaged in foreign currency exchange transactions for the purpose of capitalizing on the movements of foreign currency value versus the U.S. dollar.
Purchasing Put Options - The Fund may purchase put options. As the holder of a put option, the Fund has the right to sell the underlying security at the exercise price at any time during the option period. The Fund may enter into closing sale transactions with respect to such options, exercise them or permit them to expire. The Fund may purchase a put option on an underlying security (a “protective put”) owned as a defensive technique in order to protect against an anticipated decline in the value of the security. Such hedge protection is provided only during the life of the put option when the Fund, as the holder of the put option, is able to sell the underlying security at the put exercise price rega rdless of any decline in the underlying security’s market price. For example, a put option may be purchased in order to protect unrealized appreciation of a security where the Adviser deems it desirable to continue to hold the security because of tax considerations. The premium paid for the put option and any transaction costs would reduce any capital gain otherwise available for distribution when the security is eventually sold.
Purchasing Call Options - The Fund may purchase call options. As the holder of a call option, the Fund has the right to purchase the underlying security at the exercise price at any time during the option period. The Fund may enter into closing sale transactions with respect to such options, exercise them or permit them to expire. The Fund may also purchase call options on relevant stock indexes. Call options may also be purchased by the Fund for the purpose of acquiring the underlying securities for its portfolio. Utilized in this fashion, the purchase of call options enables the Fund to acquire the securities at the exercise price of the call option plus the premium paid. At times the net cost of acquiring securities in this manner may be less than the cost of acquiring the sec urities directly. This technique may also be useful to the Fund in purchasing a large block of securities that would be more difficult to acquire by direct market purchases. So long as it holds such a call option rather than the underlying security itself, the Fund is partially protected from any unexpected decline in the market price of the underlying security and in such event could allow the call option to expire, incurring a loss only to the extent of the premium paid for the option.
NOTE 3. SECURITIES VALUATION AND FAIR VALUE MEASUREMENTS
Fair value is defined as the price that a Fund would receive upon selling an investment in a timely transaction to an independent buyer in the principal or most advantageous market of the investment. GAAP establishes a three-tier hierarchy to maximize the use of observable market data and minimize the use of unobservable inputs and to establish classification of fair value measurements for disclosure purposes.
Inputs refer broadly to the assumptions that market participants would use in pricing the asset or liability, including assumptions about risk (the risk inherent in a particular valuation technique used to measure fair value such as pricing model and/or the risk inherent in the inputs to the valuation technique). Inputs may be observable or unobservable. Observable inputs are inputs that reflect the assumptions market participants would use in pricing the asset or liability developed based on market data obtained from sources independent of the reporting entity. Unobservable inputs are inputs that reflect the reporting entity’s own assumptions about the assumptions market participants would use in pricing the asset or liability developed based on the best information available in the circumstances.
TEAM Asset Strategy Fund
Notes to the Financial Statements - continued
October 31, 2010
NOTE 3. SECURITIES VALUATION AND FAIR VALUE MEASUREMENTS – continued
Various inputs are used in determining the value of the Fund’s investments. These inputs are summarized in the three broad levels listed below.
| · | Level 1 – quoted prices in active markets for identical securities |
| · | Level 2 – other significant observable inputs (including, but not limited to, quoted prices for an identical security in an inactive market, quoted prices for similar securities, interest rates, prepayment speeds, credit risk, etc.) |
| · | Level 3 – significant unobservable inputs (including the Fund’s own assumptions in determining fair value of investments based on the best information available) |
The inputs used to measure fair value may fall into different levels of the fair value hierarchy. In such cases, for disclosure purposes, the level in the fair value hierarchy within which the fair value measurement falls in its entirety, is determined based on the lowest level input that is significant to the fair value measurement in its entirety.
Equity securities, including common stocks, exchange-traded funds and exchange-traded notes, are generally valued by using market quotations, furnished by a pricing service. Securities that are traded on any stock exchange are generally valued at the last quoted sale price. Lacking a last sale price, an exchange traded security is generally valued at its last bid price. Securities traded in the NASDAQ over-the-counter market are generally valued at the NASDAQ Official Closing Price. When using the market quotations or close prices provided by the pricing service and when the market is considered active, the security is classified as a Level 1 security. Sometimes, an equity security owned by the Fund will be valued by the pricing service with factors other than market quotations or when the market is con sidered inactive. When this happens, the security is classified as a Level 2 security. When market quotations are not readily available, when the Fund determines that the market quotation or the price provided by the pricing service does not accurately reflect the current fair value, or when restricted or illiquid securities are being valued, such securities are valued as determined in good faith by the Fund, in conformity with guidelines adopted by and subject to review by the Board. These securities are categorized as Level 3 securities.
Investments in mutual funds, including money market mutual funds, are generally priced at the ending net asset value (NAV) provided by the service agent of the funds. These securities are categorized as Level 1 securities.
Fixed income securities that are valued using market quotations in an active market are categorized as Level 1 securities. However, they may be valued on the basis of prices furnished by a pricing service when the Fund believes such prices more accurately reflect the fair value of such securities. A pricing service utilizes electronic data processing techniques based on yield spreads relating to securities with similar characteristics to determine prices for normal institutional-size trading units of debt securities without regard to sale or bid prices. These securities are generally categorized as Level 2 securities. If the Fund decides that a price provided by the pricing service does not accurately reflect the fair value of the securities, when prices are not readily available from a pricing service, or when restricted or illiquid s ecurities are being valued, securities are valued at fair value as determined in good faith by the Fund, in conformity with guidelines adopted by and subject to review of the Board. These securities are categorized as Level 3 securities.
Short-term investments in fixed income securities, (those with maturities of less than 60 days when acquired, or which subsequently are within 60 days of maturity), are valued using the amortized cost method of valuation, which the Board has determined represents fair value. These securities will be classified as Level 2 securities.
If the Fund decides that a price provided by the pricing service does not accurately reflect the fair value of the securities, when prices are not readily available from a pricing service, or when restricted or illiquid securities are being valued, securities are valued at fair value as determined in good faith by the Fund, in conformity with guidelines adopted by and subject to review of the Board. These securities will be categorized as Level 3 securities.
TEAM Asset Strategy Fund
Notes to the Financial Statements - continued
October 31, 2010
NOTE 3. SECURITIES VALUATION AND FAIR VALUE MEASUREMENTS - continued
Derivative instruments the Fund invests in, such as forward currency contracts, are valued at the interpolated rates based on the prevailing banking rates and are generally categorized as Level 2 securities.
In accordance with the Trust’s good faith pricing guidelines, the Fund is required to consider all appropriate factors relevant to the value of securities for which it has determined other pricing sources are not available or reliable as described above. No single standard exists for determining fair value, because fair value depends upon the circumstances of each individual case. As a general principle, the current fair value of an issue of securities being valued by the Fund would appear to be the amount which the owner might reasonably expect to receive for them upon their current sale. Methods which are in accordance with this principle may, for example, be based on (i) a multiple of earnings; (ii) a discount from market of a similar freely traded security (including a derivative security or a basket of securities traded on o ther markets, exchanges or among dealers); or (iii) yield to maturity with respect to debt issues, or a combination of these and other methods. Good faith pricing is permitted if, in the Fund’s opinion, the validity of market quotations appears to be questionable based on factors such as evidence of a thin market in the security based on a small number of quotations, a significant event occurs after the close of a market but before a Fund’s NAV calculation that may affect a security’s value, or the Fund is aware of any other data that calls into question the reliability of market quotations. Good faith pricing may also be used in instances when the bonds the Fund invests in may default or otherwise cease to have market quotations readily available. Any fair value pricing done outside the Fund’s approved pricing methods must be approved by the Pricing Committee of the Board.
The following is a summary of the inputs used to value the Fund’s investments as of October 31, 2010:
| | | Valuation Inputs | |
| Assets | | Level 1 - Quoted Prices in Active Markets | | | Level 2 - Other Significant Observable Inputs | | | Level 3 - Significant Unobservable Inputs | | | Total | |
| | | | | | | | | | | | | |
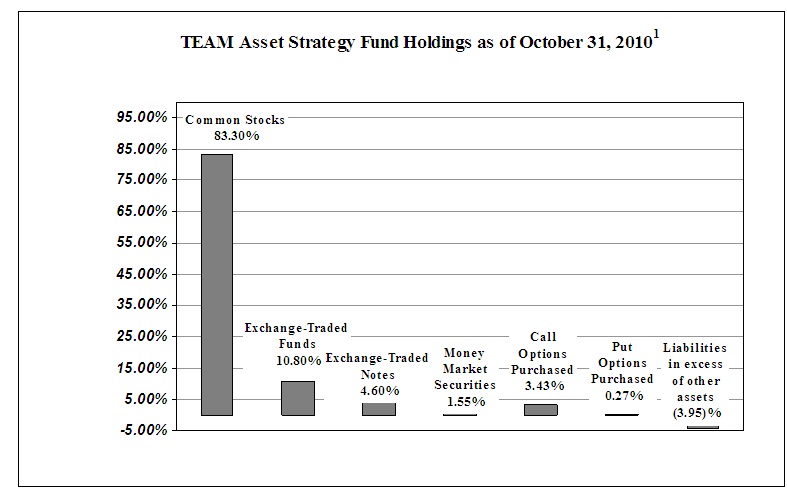
| Common Stocks* | | $ | 36,090,813 | | | $ | - | | | $ | - | | | $ | 36,090,813 | |
| Exchange-Traded Funds | | | 4,676,520 | | | | - | | | | - | | | | 4,676,520 | |
| Exchange-Traded Notes | | | 1,994,650 | | | | - | | | | - | | | | 1,994,650 | |
| Money Market Securities | | | 671,529 | | | | - | | | | - | | | | 671,529 | |
| Call Options Purchased | | | 1,485,800 | | | | - | | | | - | | | | 1,485,800 | |
| Put Options Purchased | | | 117,000 | | | | - | | | | - | | | | 117,000 | |
| Total | | $ | 45,036,312 | | | $ | - | | | $ | - | | | $ | 45,036,312 | |
*Refer to the Schedule of Investments for industry classifications.
| | | Valuation Inputs | |
| Liabilities | | Level 1 - Quoted Prices in Active Markets | | | Level 2 - Other Significant Observable Inputs | | | Level 3 - Significant Unobservable Inputs | | | Total | |
| | | | | | | | | | | | | |
| Long Currency Forward Contract | | $ | - | | | $ | 90,452 | | | $ | - | | | $ | 90,452 | |
| Short Currency Forward Contract | | | - | | | | (1,874,910 | ) | | | - | | | | (1,874,910 | ) |
| Total | | $ | - | | | $ | (1,784,458 | ) | | $ | - | | | $ | (1,784,458 | ) |
TEAM Asset Strategy Fund
Notes to the Financial Statements - continued
October 31, 2010
NOTE 3. SECURITIES VALUATION AND FAIR VALUE MEASUREMENTS - continued
The Fund did not hold any assets at any time during the reporting period in which significant unobservable inputs were used in determining fair value; therefore, no reconciliation of Level 3 securities is included for this reporting period.
NOTE 4. DERIVATIVE TRANSACTIONS
Call and put options purchased and long and short forward currency contracts are represented on the Statement of Assets and Liabilities under investments in securities at value and payable for forward currency contracts, respectively and on the Statement of Operations under net realized gain (loss) on investment securities and change in unrealized appreciation (depreciation) on investment securities and foreign currency, respectively.
Please see the chart below for information regarding call and put options purchased and long and short forward currency contracts for the Fund.
| | | | | | |
| At October 31, 2010: | | | | | |
| Derivatives | Location of Derivatives on Statements of Assets & Liabilities | | | | |
| | | | | | |
| Call Options Purchased | Investment in Securities, at fair value | | $ | 1,485,800 | |
| | | | | | |
| | | | | | |
| Put Options Purchased | Investment in Securities, at fair value | | $ | 117,000 | |
| | | | | | |
| | | | | | |
| Long Forward Currency | Receivable for forward currency contracts | | $ | 124,092 | |
| | | | | | |
| | | | | | |
| Long Forward Currency | Payable for forward currency contracts | | $ | (33,640) | |
| | | | | | |
| | | | | | |
| Short Forward Currency | Payable for forward currency contracts | | $ | (1,874,910) | |
| | | | | | |
| | | | | | |
| | | | | | |
| For the period ended October 31, 2010 : | | | | |
| Derivatives | Location of Gain (Loss) on Derivatives on Statements of Operations | | Contracts Opened | | | Contracts Closed | | | Realized Gain (Loss) on Derivatives | | | Change in Unrealized Appreciation (Depreciation) on Derivatives | |
| Equity Risk: | | | | | | | | | | | | | |
| Call Options Purchased | Net realized and unrealized gain (loss) on investments | | | 32,856 | | | | 27,856 | | | $ | 1,148,130 | | | $ | 324,188 | |
| Equity Risk: | | | | | | | | | | | | | | | | | |
| Put Options Purchased | Net realized and unrealized gain (loss) on investments | | | 5,080 | | | | 3,280 | | | $ | (654,240 | ) | | $ | (93,210 | ) |
| Foreign Exchange Risk: | Change in Unrealized appreciation (depreciation) on: | | | | | | | | | | | | | | | | |
| Long Forward Currency | Foreign Currency Translations | | | (1 | ) | | | (1 | ) | | | N/A | | | $ | 90,452 | |
| Foreign Exchange Risk: | Change in Unrealized appreciation (depreciation) on: | | | | | | | | | | | | | | | | |
| Short Forward Currency | Foreign Currency Translations | | | (1 | ) | | | (1 | ) | | | N/A | | | $ | (1,874,910 | ) |
(1) The Fund's open contracts at the end of the period were the only contracts entered into during the period.
NOTE 5. FEES AND OTHER TRANSACTIONS WITH AFFILIATES
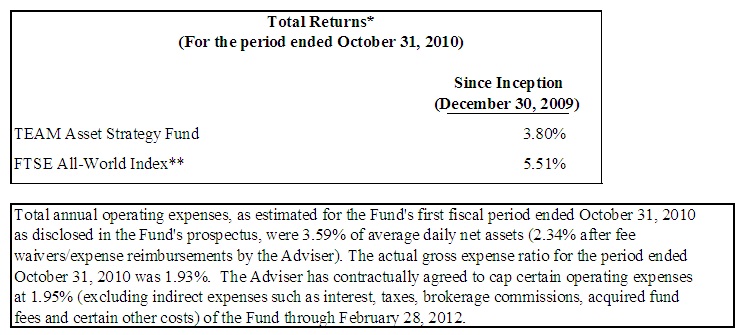
Under the terms of the management agreement (the “Agreement”), the Adviser manages the Fund’s investments subject to the approval of the Board. As compensation for its management services, the Fund is obligated to pay the Adviser a fee computed and accrued daily and paid monthly at an annual rate of 1.25% of the average daily net assets of the Fund. For the period December 30, 2009 (commencement of Fund operations) to October 31, 2010, the Adviser earned a fee of $364,154 from the Fund. At October 31, 2010, the Fund owed the Adviser $45,458 for advisory fees.
TEAM Asset Strategy Fund
Notes to the Financial Statements - continued
October 31, 2010
NOTE 5. FEES AND OTHER TRANSACTIONS WITH AFFILIATES - continued
The Advisor has contractually agreed to waive all or a portion of its management fee and/or reimburse certain Fund operating expenses, but only to the extent necessary to maintain each Fund’s total annual expenses, excluding brokerage fees and commissions, borrowing costs (such as interest and dividend expenses on securities sold short), taxes, extraordinary litigation expenses and any indirect expenses (such as expenses incurred by other investment companies acquired by the Fund), at 1.95% of the Fund’s average daily net assets through February 28, 2012.
The Adviser may be entitled to the reimbursement of any fees waived or expenses reimbursed pursuant to the agreement, provided overall expenses fall below the limitations set forth above. The Adviser may recoup the sum of all fees previously waived or expenses reimbursed during any of the previous three (3) years, less any reimbursement previously paid, provided total expenses do not exceed the limitation set forth above.
The Trust retains Huntington Asset Services, Inc. (“HASI”) formerly known as Unified Fund Services, Inc. to manage the Fund’s business affairs and provide the Fund with administrative services, including all regulatory reporting and necessary office equipment and personnel. For the period December 30, 2009 (commencement of Fund operations) to October 31, 2010, HASI earned fees of $31,041 for administrative services provided to the Fund. At October 31, 2010, HASI was owed $2,623 from the Fund for administrative services. Certain officers of the Trust are members of management and/or employees of HASI. HASI operates as a wholly-owned subsidiary of Huntington Bancshares, Inc., the parent company of Unified Financial Securities, Inc. (the “Distributor”) and Huntington National Bank, the custodian of the Fund’s investments (the “Custodian”). For the period from December 30, 2009 (commencement of Fund operations) to October 31, 2010, the Custodian earned fees of $15,665 for custody services provided to the Fund. At October 31, 2010, the Custodian was owed $1,529 from the Fund for custody services.
The Trust also retains HASI to act as the Fund’s transfer agent and to provide fund accounting services. For the period December 30, 2009 (commencement of Fund operations) to October 31, 2010, HASI earned fees of $20,677 for transfer agent services and $23,694 in reimbursement of out-of-pocket expenses incurred in providing transfer agent services to the Fund. At October 31, 2010, the Fund owed HASI $1,668 for transfer agent services and $2,521 for out-of-pocket expenses. For the period December 30, 2009 (commencement of Fund operations) to October 31, 2010, HASI earned fees of $22,939 from the Fund for fund accounting services. At October 31, 2010, HASI was owed $2,084 from the Fund for fund accounting services.
The Fund has adopted a Distribution Plan (the “Plan”) pursuant to Rule 12b-1 under the 1940 Act. The Plan provides that the Fund will pay the Distributor and/or any registered securities dealer, financial institution or any other person (the “Recipient”) a shareholder servicing fee of 0.25% of the average daily net assets of the Fund in connection with the promotion and distribution of the Fund’s shares or the provision of personal services to shareholders, including, but not necessarily limited to, advertising, compensation to underwriters, dealers and selling personnel, the printing and mailing
of prospectuses to other than current Fund shareholders, the printing and mailing of sales literature and servicing shareholder accounts. The Fund or Distributor may pay all or a portion of these fees to any Recipient who renders assistance in distributing or promoting the sale of shares, or who provides certain shareholder services, pursuant to a written agreement. The Plan will not be activated through February 28, 2011.
The Distributor acts as the principal underwriter of the Fund’s shares. There were no payments made by the Fund to the Distributor during the period December 30, 2009 (commencement of Fund operations) to October 31, 2010. An officer of the Trust is an officer of the Distributor and such person may be deemed to be an affiliate of the Distributor.
The Fund placed a portion of its portfolio transactions with a brokerage firm affiliated with HASI. The commissions paid to this affiliated firm were $37,464 for the period.
TEAM Asset Strategy Fund
Notes to the Financial Statements - continued
October 31, 2010
NOTE 6. PURCHASES AND SALES OF INVESTMENTS
For the period ended October 31, 2010, purchases and sales of investment securities, other than short-term investments and short-term U.S. government obligations, were as follows:
| Purchases | | | |
| U.S. Government Obligations | | $ | - | |
| Other | | | 136,583,097 | |
| Sales | | | | |
| U.S. Government Obligations | | $ | - | |
| Other | | | 96,604,916 | |
At October 31, 2010, the net unrealized appreciation (depreciation) of investments for tax purposes excluding forward currency contracts was as follows:
| | | | |
| Gross Appreciation | | $ | 3,975,690 | |
| Gross (Depreciation) | | | (546,393 | ) |
| Net Appreciation (Depreciation) on Investments | | $ | 3,429,297 | |
At October 31, 2010, the aggregate cost of securities for federal income tax purposes was $41,607,015.
NOTE 7. ESTIMATES
The preparation of financial statements in conformity with GAAP requires management to make estimates and assumptions that affect the reported amounts of assets and liabilities and disclosure of contingent assets and liabilities at the date of the financial statements and the reported amounts of increases and decreases in net assets from operations during the reporting period. Actual results could differ from those estimates.
NOTE 8. BENEFICIAL OWNERSHIP
The beneficial ownership, either directly or indirectly, of 25% or more of the voting securities of a fund creates a presumption of control of a fund, under Section 2(a) (9) of the Investment Company Act of 1940. At October 31, 2010, Charles Schwab, for the benefit of its customers, held 63.78% of the voting securities. As a result, Charles Schwab may be deemed to control the Fund.
NOTE 9. DISTRIBUTIONS TO SHAREHOLDERS
There were no distributions made by the Fund during the period December 30, 2009 (commencement of Fund operations) to October 31, 2010.
NOTE 10. COMMITMENTS AND CONTINGENCIES
The Fund indemnifies its officers and trustees for certain liabilities that may arise from their performance of their duties to the Fund. Additionally, in the normal course of business, the Fund enters into contracts that contain a variety of representatives and warranties which provide general indemnifications. The Fund’s maximum exposure under these arrangements is unknown, as this would involve future claims that may be made against the Fund that have not yet occurred.
TEAM Asset Strategy Fund
Notes to the Financial Statements - continued
October 31, 2010
NOTE 11. RECENT ACCOUNTING PRONOUNCEMENTS
In January 2010, the Financial Accounting Standards Board issued Accounting Standards Update (“ASU”) No. 2010-06 “Improving Disclosures about Fair Value Measurements.” ASU No. 2010-06 clarifies existing disclosure and requires additional disclosures regarding fair value measurements. Effective for fiscal years beginning after December 15, 2010, and for interim periods within those fiscal years, entities will need to disclose information about purchases, sales, issuances and settlements of Level 3 securities on a gross basis, rather than as a net number as currently required. Management is currently evaluating the impact ASU No. 2010-06 will have on its financial statement disclosures.
NOTE 12. TAX COMPONENTS OF CAPITAL
At October 31, 2010, the components of distributable earnings (accumulated losses) on a tax basis were as follows:
| Capital loss carryforward | | $ | (177,073 | ) |
| Unrealized appreciation (depreciation) | | | 3,429,297 | |
| | | $ | 3,252,224 | |
The differences between the federal income tax cost of investments and the financial statements is due to certain differences in the recognition of capital gains or losses under income tax reporting regulations and GAAP. These “book/tax” differences are temporary in nature and are primarily due to tax deferral of losses on wash sales and passive foreign investment company gains.
As of October 31, 2010, the Fund recorded reclassifications due to foreign exchange gains/losses and non-deductible offering costs. The Fund increased accumulated realized gains by $1,784,458 and reduced undistributed net investment loss and paid in capital by $17,228 and $1,801,686, respectively.
NOTE 13. CAPITAL LOSS CARRYFORWARD
At October 31, 2010, the Fund had available for federal tax purposes unused capital loss carryforwards of $177,073, which are available to offset future realized capital gains. To the extent that these carryforwards are used to offset future gains, it is probable that the amount offset will not be distributed to shareholders. The carryforward expires as follows:
| | | | | |
| | | | | |
| Amount | | | Expires October 31, | |
| | | | | |
| $ | 177,073 | | | | 2018 | |
NOTE 14. SUBSEQUENT EVENT
In accordance with GAAP, Management has evaluated subsequent events through the date the financial statements were issued and determined there were no material subsequent events.