UNITED STATES
SECURITIES AND EXCHANGE COMMISSION
WASHINGTON, D.C. 20549
FORM N-CSR
CERTIFIED SHAREHOLDER REPORT OF REGISTERED
MANAGEMENT INVESTMENT COMPANIES
Investment Company Act file number 811-22208
Valued Advisers Trust
(Exact name of registrant as specified in charter)
Huntington Asset Services, Inc. 2960 N. Meridian Street, Suite 300 Indianapolis, IN 46208
(Address of principal executive offices) (Zip code)
Capitol Services, Inc.
615 S. Dupont Hwy.
Dover,DE 19901
(Name and address of agent for service)
With a copy to:
John H. Lively, Esq.
The Law Offices of John H. Lively & Associates, Inc.
A member firm of The 1940 Act Law Group
2041 W. 141st Terrace
Suite 119
Leawood, KS 66224
Registrant’s telephone number, including area code: 317-917-7000
Date of fiscal year end: 1/31
Date of reporting period: 01/31/11
Item 1. Reports to Stockholders.
Golub Group Equity Fund
Annual Report
January 31, 2011
Fund Adviser:
Golub Group, LLC
1850 Gateway Drive, Suite 600
San Mateo, CA 94404
Toll Free (866) 954-6682
TO OUR FELLOW SHAREHOLDERS:
Despite the greater than 15% return for the S&P 500, 2010 proved to be a challenging year in the markets, characterized by two distinct investment environments. The first half of the year saw the market fall 8.3% as concerns over the fiscal situation in Europe led investors to shun investments that were perceived as risky (namely equities) and move into the perceived security of fixed income securities (in particular U.S. Treasury bonds). As governments around the world moved to support an economic recovery, investors re-embraced risk and drove the market up over 23% from the July 2nd low, resulting in the solid gains for the year.
We remain mindful of the risks associated with a nascent economic recovery and have positioned the Fund accordingly. Our attention to these risks led us to be more conservative and as a result, the Fund underperformed the benchmark this year. While it may not feel like we are in the midst of a recovery, the data is indisputable as the level of 2010 GDP surpassed its previous high level set in 2008, and U.S. corporate profits, the ultimate driver of long-term stock price appreciation, are within a fraction of the peak reached in 2006. We are further encouraged by the fact that the stock market has recovered nearly all of its losses incurred since September, 2008, and has appreciated over 90% since the market reached its low in March, 2009.
We are occasionally asked whether we are concerned about short-term periods when the Fund is not performing as well as the market. We explain that we never manage our clients’ money with the aim of always outperforming every short-term period, because when one tries to do so, it induces one to take unnecessary risk. Taking unnecessary risk runs counter to our mission for our clients—to produce a multi-year outcome which will provide our clients with happy and secure futures. This is the business we are in. We know that the rules for successfully creating wealth involve a constant focus on the long-term versus the short-term, keeping our clients’ capital invested in the world’s strongest businesses, and purchasing those businesses when they are cheap and selling them when they are overvalued. This is the way we have always managed our client’s money, through good times and bad. This is the way we will always manage our clients’ money.
In closing, we appreciate your confidence in us. The true intent of the Golub Group Equity Fund is to provide a means by which our investors can build their wealth over the long term. We look forward to achieving this with you.
Sincerely,
Golub Group, LLC
1
MANAGEMENT’S DISCUSSION OF FUND PERFORMANCE FOR THE FISCAL YEAR ENDING JANUARY 31, 2011
The Golub Group Equity Fund returned 17.20% for the fiscal year ending January 31, 2011. In comparison, our benchmark, the S&P 500 Index*, gained 22.20% during the same period. Since inception on April 1, 2009, since inception, the fund has a cumulative return of 51.62% as compared to the 64.65% return of the benchmark.
Performance for the period was led by our most economically sensitive positions, namely those in the Energy and Industrial sectors that benefited from the perception and reality of a rebound in global economic activity and higher demand and prices for oil. In terms of positive contribution, ConocoPhillips, Caterpillar and Chevron were the largest contributors and returned 54.9%, 57.4% and 36.5% respectively. Performance also benefitted from our decision to add exposure to the Financial sector, a sector that we had been significantly underweight following the recent collapse of the credit and housing bubble. We added positions in Franklin Resources, Wells Fargo and U.S. Bancorp, all of which had a positive contribution to performance.
The portfolio’s exposure to the Healthcare, Technology and Consumer Staple sector were the largest detractors to performance. Our Healthcare holdings suffered due to the uncertainty related to the pending healthcare regulations and how that may impact corporate profits in the sector as well as some company specific issues which we believe are short-term in nature. Three of our weakest performing holdings were healthcare companies, with Medtronic, Teva and Amgen down 8.5%, 6.4% and 5.8% respectively. Cisco Systems ended the year as our largest holding as we added to the position throughout the year and was down 5.8% for the period. Lastly, we began to reduce our exposure to the Consumer Staple sector, where on a relative basis our holdings underperformed the sector.
In addition to the stock and security selection, the advisor’s decision to waive fees and reimburse expenses to the fund due to the expense limitation cap impacted performance. Had the advisor not waived and reimbursed these expenses, the performance of the fund would have been worse.
We remain focused on our long term discipline of investing in high-quality, large-cap, dividend-paying businesses that trade at attractive valuations and are confident that our style of investing is particularly well suited for the period ahead.
Sincerely,
Golub Group, LLC
2
Investment Results – (Unaudited)
Total Returns*
(For the period ended January 31, 2011)
| | | | | | | | |
| | | One Year | | | Average Annual
Since Inception
(April 1, 2009) | |
Golub Group Equity Fund | | | 17.20 | % | | | 25.45 | % |
| | |
S&P 500(R) Index** | | | 22.20 | % | | | 31.21 | % |
Total annual operating expenses, as disclosed in the Fund's prospectus, were 3.46% of average daily net assets (1.26% after fee waivers/expense reimbursements by the Adviser.) The Adviser has contractually agreed to cap certain operating expenses (excluding indirect expenses such as (i) interest, (ii) taxes, (iii) brokerage commissions, (iv) other expenditures which are capitalized in accordance with generally accepted accounting principles, (v) other extraordinary expenses not incurred in the ordinary course of the Fund's business, (vi) dividend expense on short sales, and (vii) expenses that the Fund has incurred but did not actually pay because of an expense offset arrangement, if applicable, incurred by the Fund in any fiscal year through May 31, 2011. The operating expense limitation also excludes any Fees and Expense of Acquired Funds.
The performance quoted represents past performance, which does not guarantee future results. The investment return and principal value of an investment will fluctuate so that an investor’s shares, when redeemed, may be worth more or less than their original cost. The returns shown do not reflect deduction of taxes that a shareholder would pay on Fund distributions or the redemption of Fund shares. Current performance of the Fund may be lower or higher than the performance quoted. The Fund’s investment objectives, risks, charges and expenses must be considered carefully before investing. Performance data current to the most recent month end may be obtained by calling 1-866-954-6682.
| * | Return figures reflect any change in price per share and assume the reinvestment of all distributions. |
| ** | The S&P 500® Index is a widely recognized unmanaged index of equity securities and is representative of a broader market and range of securities than is found in the Fund’s portfolio. Individuals cannot invest directly in the Index; however, an individual can invest in exchange traded funds or other investment vehicles that attempt to track the performance of a benchmark index. |
The Fund’s investment objectives, risks, charges and expenses must be considered carefully before investing. The prospectus contains this and other important information about the Fund and may be obtained by calling the same number as above. Please read it carefully before investing. The Fund is distributed by Unified Financial Securities, Inc., member FINRA.
3
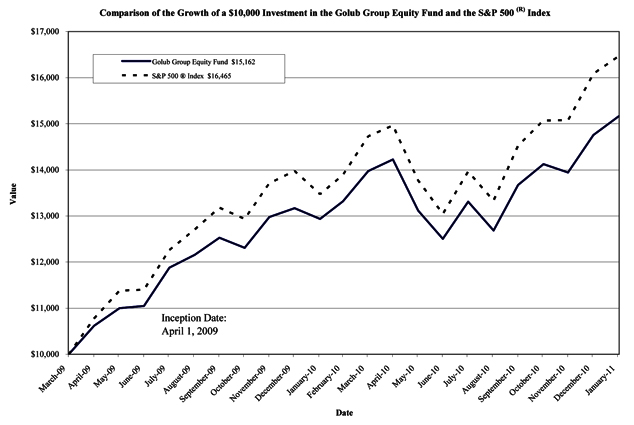
The chart above assumes an initial investment of $10,000 made on April 1, 2009 (commencement of Fund operations) and held through January 31, 2011. The S&P 500® Index is a widely recognized unmanaged index of equity securities and is representative of a broader market and range of securities than is found in the Fund’s portfolio. Individuals cannot invest directly in the Index; however, an individual can invest in exchange traded funds or other investment vehicles that attempt to track the performance of a benchmark index. THE FUND’S RETURN REPRESENTS PAST PERFORMANCE AND DOES NOT GUARANTEE FUTURE RESULTS. The returns shown do not reflect deduction of taxes that a shareholder would pay on Fund distributions or the redemption of Fund shares. Investment returns and principal values will fluctuate so that your shares, when redeemed, may be worth more or less than their original purchase price.
Current performance may be lower or higher than the performance data quoted. For more information on the Fund, and to obtain performance data current to the most recent month end or to request a prospectus, please call 1-866-954-6682. You should carefully consider the investment objectives, potential risks, management fees, and charges and expenses of the Fund before investing. The Fund’s prospectus contains this and other information about the Fund, and should be read carefully before investing.
The Fund is distributed by Unified Financial Securities, Inc., member FINRA.
4
Fund Holdings – (Unaudited)
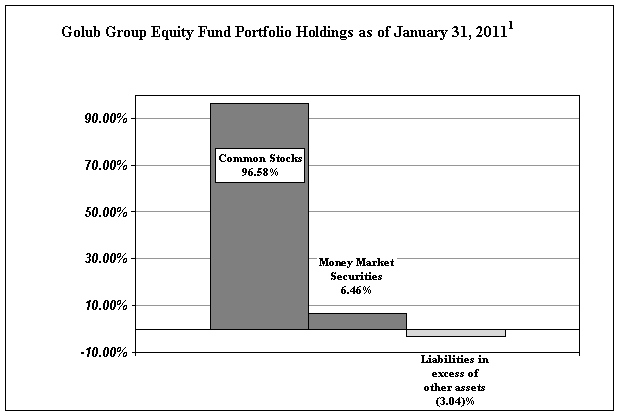
| 1 | As a percentage of net assets. |
The investment objective of the Golub Group Equity Fund is to provide long-term capital appreciation. A secondary objective is provide current income.
Availability of Portfolio Schedule – (Unaudited)
The Fund files its complete schedule of portfolio holdings with the Securities and Exchange Commission (“SEC”) for the first and third quarters of each fiscal year on Form N-Q. The Fund’s Forms N-Q are available at the SEC’s website at www.sec.gov. The Fund’s Forms N-Q may be reviewed and copied at the SEC’s Public Reference Room in Washington DC. Information on the operation of the Public Reference Room may be obtained by calling 1-800-SEC-0330.
Summary of Fund’s Expenses – (Unaudited)
As a shareholder of the Fund, you incur ongoing costs, including management fees and other Fund expenses. This Example is intended to help you understand your ongoing costs (in dollars) of investing in the Fund and to compare these costs with the ongoing costs of investing in other mutual funds.
The Example is based on an investment of $1,000 invested at the beginning and held for the entire period from August 1, 2010 to January 31, 2011.
5
Actual Expenses
The first line of the table below provides information about actual account values and actual expenses. You may use the information in this line, together with the amount you invested, to estimate the expenses that you paid over the period. Simply divide your account value by $1,000 (for example, an $8,600 account value divided by $1,000 = $8.60), then multiply the result by the number in the first line under the heading entitled “Expenses Paid During the Period” to estimate the expenses you paid on your account during this period.
Hypothetical Example for Comparison Purposes
The second line of the table below provides information about hypothetical account values and hypothetical expenses based on the Fund’s actual expense ratio and an assumed rate of return of 5% per year before expenses, which is not the Fund’s actual return. The hypothetical account values and expenses may not be used to estimate the actual ending account balance or expenses you paid for the period. You may use this information to compare the ongoing costs of investing in the Fund and other funds. To do so, compare this 5% hypothetical example with the 5% hypothetical examples that appear in the shareholder reports of the other funds.
Please note that the expenses shown in the table are meant to highlight your ongoing costs only. Therefore, the second line of the table below is useful in comparing ongoing costs only and will not help you determine the relative costs of owning different funds.
| | | | | | | | | | | | |
Golub Group Equity Fund | | Beginning Account
Value
August 1, 2010 | | | Ending Account
Value
January 31, 2011 | | | Expenses Paid
During the Period Ended
January 31, 2011 | |
Actual* | | $ | 1,000.00 | | | $ | 1,139.19 | | | $ | 6.74 | |
Hypothetical** | | $ | 1,000.00 | | | $ | 1,018.91 | | | $ | 6.36 | |
| * | Expenses are equal to the Fund’s annualized expense ratio of 1.25%, multiplied by the average account value over the period, multiplied by 184/365. |
| ** | Assumes a 5% return before expenses. |
6
Golub Group Equity Fund
Schedule of Investments
January 31, 2011
| | | | | | | | |
| | | Shares | | | Value | |
Common Stocks - 96.58% | | | | | | | | |
| | |
Aircraft Engines & Engine Parts - 2.99% | | | | | | | | |
United Technologies Corp. | | | 7,200 | | | $ | 585,360 | |
| | | | | | | | |
Beverages - 4.32% | | | | | | | | |
Diageo plc (b) | | | 3,725 | | | | 286,080 | |
PepsiCo, Inc. | | | 8,700 | | | | 559,497 | |
| | | | | | | | |
| | | | | | | 845,577 | |
| | | | | | | | |
Biological Products (No Diagnostic Substances) - 1.49% | | | | | | | | |
Amgen, Inc. (a) | | | 5,300 | | | | 291,924 | |
| | | | | | | | |
Brewery - 2.02% | | | | | | | | |
Anheuser-Busch InBev NV (b) | | | 7,150 | | | | 395,466 | |
| | | | | | | | |
Cable & Other Pay Television Services - 2.45% | | | | | | | | |
Comcast Corp. - Class A | | | 21,100 | | | | 480,025 | |
| | | | | | | | |
Computer & Office Equipment - 3.95% | | | | | | | | |
Hewlett-Packard Co. | | | 16,925 | | | | 773,303 | |
| | | | | | | | |
Computer Communications Equipment - 3.93% | | | | | | | | |
Cisco Systems, Inc. (a) | | | 36,400 | | | | 769,860 | |
| | | | | | | | |
Construction Machinery & Equipment - 1.51% | | | | | | | | |
Caterpillar, Inc. | | | 3,050 | | | | 295,881 | |
| | | | | | | | |
Electromedical & Electrotherapeutic Apparatus - 3.61% | | | | | | | | |
Medtronic, Inc. | | | 18,425 | | | | 706,046 | |
| | | | | | | | |
Electronic & Other Electrical Equipment (No Computer Equipment) - 4.26% | | | | | | | | |
General Electric Co. | | | 41,400 | | | | 833,796 | |
| | | | | | | | |
Fire, Marine & Casualty Insurance - 3.53% | | | | | | | | |
Berkshire Hathaway, Inc. - Class B (a) | | | 8,450 | | | | 690,787 | |
| | | | | | | | |
Food & Kindred Products - 3.03% | | | | | | | | |
Kraft Foods, Inc. - Class A | | | 19,400 | | | | 593,058 | |
| | | | | | | | |
Investment Advice - 2.80% | | | | | | | | |
Franklin Resources, Inc. | | | 4,550 | | | | 548,957 | |
| | | | | | | | |
Medical - Generic Drugs - 3.54% | | | | | | | | |
Teva Pharmaceutical Industries, Ltd. (b) | | | 12,675 | | | | 692,689 | |
| | | | | | | | |
See accompanying notes which are an integral part of these financial statements.
7
Golub Group Equity Fund
Schedule of Investments - continued
January 31, 2011
| | | | | | | | |
| | | Shares | | | Value | |
Common Stocks - 96.58% - continued | | | | | | | | |
| | |
Petroleum Refining - 9.93% | | | | | | | | |
Chevron Corp. | | | 6,400 | | | $ | 607,552 | |
ConocoPhillips | | | 8,675 | | | | 619,915 | |
Exxon Mobil Corp. | | | 8,875 | | | | 716,035 | |
| | | | | | | | |
| | | | | | | 1,943,502 | |
| | | | | | | | |
Pharmaceutical Preparations - 3.53% | | | | | | | | |
Johnson & Johnson | | | 11,575 | | | | 691,838 | |
| | | | | | | | |
Retail - Discount - 2.81% | | | | | | | | |
Wal-Mart Stores, Inc. | | | 9,800 | | | | 549,486 | |
| | | | | | | | |
Retail - Drug Stores & Proprietary Stores - 3.07% | | | | | | | | |
Walgreen Co. | | | 14,850 | | | | 600,534 | |
| | | | | | | | |
Retail - Lumber & Other Building Materials Dealers - 6.32% | | | | | | | | |
Home Depot, Inc./The | | | 15,500 | | | | 569,935 | |
Lowe’s Companies, Inc. | | | 26,925 | | | | 667,740 | |
| | | | | | | | |
| | | | | | | 1,237,675 | |
| | | | | | | | |
Semiconductors & Related Devices - 2.96% | | | | | | | | |
Intel Corp. | | | 27,000 | | | | 579,420 | |
| | | | | | | | |
Services - Computer Processing & Data Preparation - 3.59% | | | | | | | | |
Fiserv, Inc. (a) | | | 11,375 | | | | 702,634 | |
| | | | | | | | |
Services - Engineering, Accounting, Research, Management - 3.03% | | | | | | | | |
Paychex, Inc. | | | 18,525 | | | | 592,800 | |
| | | | | | | | |
Services - Prepackaged Software - 3.84% | | | | | | | | |
Microsoft Corp. | | | 27,075 | | | | 750,654 | |
| | | | | | | | |
Soap, Detergent, Cleaning Preparations, Perfumes, Cosmetics - 1.92% | | | | | | | | |
Procter & Gamble Co./The | | | 5,950 | | | | 375,624 | |
| | | | | | | | |
Super-Regional Banks-US - 6.65% | | | | | | | | |
U.S. Bancorp | | | 22,800 | | | | 615,600 | |
Wells Fargo & Co. | | | 21,125 | | | | 684,873 | |
| | | | | | | | |
| | | | | | | 1,300,473 | |
| | | | | | | | |
Telephone Communications (No Radio Telephone) - 3.06% | | | | | | | | |
China Mobile Ltd. (b) | | | 12,200 | | | | 599,508 | |
| | | | | | | | |
Trucking & Courier Services (No Air) - 2.44% | | | | | | | | |
United Parcel Service, Inc. - Class B | | | 6,675 | | | | 478,064 | |
| | | | | | | | |
TOTAL COMMON STOCKS (Cost $16,254,742) | | | | | | | 18,904,941 | |
| | | | | | | | |
See accompanying notes which are an integral part of these financial statements.
8
Golub Group Equity Fund
Schedule of Investments - continued
January 31, 2011
| | | | | | | | |
| | | Shares | | | Value | |
Money Market Securities - 6.46% | | | | | | | | |
| | |
Fidelity Institutional Money Market Portfolio - Institutional Class, 0.25% (c) | | | 1,265,375 | | | $ | 1,265,375 | |
| | | | | | | | |
TOTAL MONEY MARKET SECURITIES (Cost $1,265,375) | | | | | | | 1,265,375 | |
| | | | | | | | |
TOTAL INVESTMENTS (Cost $17,520,117) - 103.04% | | | | | | $ | 20,170,316 | |
| | | | | | | | |
Liabilities in excess of other assets - (3.04)% | | | | | | | (595,920 | ) |
| | | | | | | | |
TOTAL NET ASSETS - 100.00% | | | | | | $ | 19,574,396 | |
| | | | | | | | |
| (b) | American Depositary Receipt. |
| (c) | Variable rate security; the rate shown represents the yield at January 31, 2011. |
See accompanying notes which are an integral part of these financial statements.
9
Golub Group Equity Fund
Statement of Assets and Liabilities
January 31, 2011
| | | | |
Assets | | | | |
Investments in securities, at value (cost $17,520,117) | | $ | 20,170,316 | |
Dividends receivable | | | 12,913 | |
Interest receivable | | | 255 | |
Receivable for tax reclaim | | | 203 | |
Prepaid expenses | | | 4,738 | |
| | | | |
Total assets | | | 20,188,425 | |
| | | | |
Liabilities | | | | |
Payable for investments purchased | | | 353,593 | |
Payable for capital stock | | | 225,813 | |
Payable to administrator, fund accountant, and transfer agent | | | 8,545 | |
Payable to Adviser | | | 6,925 | |
Payable to trustees | | | 596 | |
Payable to custodian | | | 540 | |
Other accrued expenses | | | 18,017 | |
| | | | |
Total liabilities | | | 614,029 | |
| | | | |
Net Assets | | $ | 19,574,396 | |
| | | | |
Net Assets consist of: | | | | |
Paid in capital | | $ | 16,572,867 | |
Accumulated net realized gain on investments | | | 351,330 | |
Net unrealized appreciation on investments | | | 2,650,199 | |
| | | | |
Net Assets | | $ | 19,574,396 | |
| | | | |
Shares outstanding (unlimited number of shares authorized; no par value) | | | 1,342,433 | |
| | | | |
Net Asset Value, offering and redemption price per share | | $ | 14.58 | |
| | | | |
See accompanying notes which are an integral part of these financial statements.
10
Golub Group Equity Fund
Statement of Operations
For the year ended January 31, 2011
| | | | |
Investment Income | | | | |
Dividend income (net of withholding tax of $1,509) | | $ | 277,724 | |
Interest income | | | 2,293 | |
| | | | |
Total Investment Income | | | 280,017 | |
| | | | |
Expenses | | | | |
Investment Adviser fee | | | 135,459 | |
Transfer agent | | | 40,797 | |
Administration | | | 37,083 | |
Fund accounting | | | 25,000 | |
Audit | | | 17,000 | |
Legal | | | 12,214 | |
Insurance | | | 7,871 | |
Custodian | | | 5,870 | |
Registration | | | 5,324 | |
Trustee | | | 4,439 | |
Miscellaneous | | | 3,090 | |
Pricing | | | 3,046 | |
Printing | | | 886 | |
24f-2 fees | | | 904 | |
| | | | |
Total Expenses | | | 298,983 | |
Less: Fees waived and reimbursed by Adviser | | | (129,687 | ) |
| | | | |
Net operating expenses | | | 169,296 | |
| | | | |
Net Investment Income | | | 110,721 | |
| | | | |
Realized & Unrealized Gain on Investments | | | | |
Net realized gain on investment securities | | | 689,107 | |
Change in unrealized appreciation on investment securities | | | 1,565,154 | |
| | | | |
Net realized and unrealized gain on investment securities | | | 2,254,261 | |
| | | | |
Net increase in net assets resulting from operations | | $ | 2,364,982 | |
| | | | |
See accompanying notes which are an integral part of these financial statements.
11
Golub Group Equity Fund
Statements of Changes In Net Assets
| | | | | | | | |
| |
| For the
Year Ended
January 31, 2011 |
| |
| For the
Period Ended
January 31, 2010 |
(a) |
Increase (Decrease) in Net Assets due to: | | | | | | | | |
Operations | | | | | | | | |
Net investment income | | $ | 110,721 | | | $ | 57,677 | |
Net realized gain on investment securities | | | 689,107 | | | | 130,260 | |
Change in unrealized appreciation on investment securities | | | 1,565,154 | | | | 1,085,045 | |
| | | | | | | | |
Net increase in net assets resulting from operations | | | 2,364,982 | | | | 1,272,982 | |
| | | | | | | | |
Distributions | | | | | | | | |
From net investment income | | | (110,853 | ) | | | (57,545 | ) |
From net realized gains | | | (465,123 | ) | | | (2,914 | ) |
| | | | | | | | |
Total distributions | | | (575,976 | ) | | | (60,459 | ) |
| | | | | | | | |
Capital Share Transactions | | | | | | | | |
Proceeds from shares sold | | | 10,118,861 | | | | 8,484,737 | |
Reinvestment of distributions | | | 575,976 | | | | 60,459 | |
Amount paid for shares redeemed | | | (2,299,251 | ) | | | (367,915 | ) |
| | | | | | | | |
Net increase in net assets resulting from capital share transactions | | | 8,395,586 | | | | 8,177,281 | |
| | | | | | | | |
Total Increase in Net Assets | | | 10,184,592 | | | | 9,389,804 | |
| | | | | | | | |
Net Assets | | | | | | | | |
Beginning of period | | | 9,389,804 | | | | — | |
| | | | | | | | |
End of period | | $ | 19,574,396 | | | $ | 9,389,804 | |
| | | | | | | | |
Undistributed net investment income included in net assets at end of period | | $ | — | | | $ | 132 | |
| | | | | | | | |
Capital Share Transactions | | | | | | | | |
Shares sold | | | 737,390 | | | | 755,705 | |
Shares issued in reinvestment of distributions | | | 40,505 | | | | 4,580 | |
Shares redeemed | | | (166,043 | ) | | | (29,704 | ) |
| | | | | | | | |
Net increase from capital share transactions | | | 611,852 | | | | 730,581 | |
| | | | | | | | |
| (a) | For the period April 1, 2009 (Commencement of Operations) to January 31, 2010. |
See accompanying notes which are an integral part of these financial statements.
12
Golub Group Equity Fund
Financial Highlights
(For a share outstanding during each period)
| | | | | | | | |
| |
| For the
Year Ended
January 31, 2011 |
| |
| For the
Period Ended
January 31, 2010 |
(a) |
Selected Per Share Data: | | | | | | | | |
Net asset value, beginning of period | | $ | 12.85 | | | $ | 10.00 | |
| | | | | | | | |
Income from investment operations: | | | | | | | | |
Net investment income (b) | | | 0.11 | | | | 0.11 | |
Net realized and unrealized gain on investments | | | 2.09 | | | | 2.83 | |
| | | | | | | | |
Total from investment operations | | | 2.20 | | | | 2.94 | |
| | | | | | | | |
Less distributions to shareholders: | | | | | | | | |
From net investment income | | | (0.09 | ) | | | (0.09 | ) |
From net realized gains | | | (0.38 | ) | | | — | (c) |
| | | | | | | | |
Total distributions | | | (0.47 | ) | | | (0.09 | ) |
| | | | | | | | |
Net asset value, end of period | | $ | 14.58 | | | $ | 12.85 | |
| | | | | | | | |
Total Return (d) | | | 17.20 | % | | | 29.37 | % (e) |
| | |
Ratios and Supplemental Data: | | | | | | | | |
Net assets, end of period (000) | | $ | 19,574 | | | $ | 9,390 | |
Ratio of net expenses to average net assets | | | 1.25 | % | | | 1.25 | % (f) |
Ratio of expenses to average net assets before waiver and reimbursement | | | 2.21 | % | | | 3.45 | % (f) |
Ratio of net investment income to average net assets | | | 0.82 | % | | | 1.07 | % (f) |
Ratio of net investment income to average net assets before waiver and reimbursement | | | (0.14 | )% | | | (1.13 | )% (f) |
Portfolio turnover rate | | | 23.15 | % | | | 8.58 | % (e) |
| (a) | For the period April 1, 2009 (Commencement of Operations) to January 31, 2010. |
| (b) | Net investment income per share is calculated by dividing net investment income by the average shares outstanding throughout the period. |
| (c) | Distributions to shareholders resulted in less than $0.005 per share. |
| (d) | Total return in the above table represents the rate that the investor would have earned or lost on an investment in the Fund, assuming reinvestment of distributions. |
See accompanying notes which are an integral part of these financial statements.
13
Golub Group Equity Fund
Notes to the Financial Statements
January 31, 2011
NOTE 1. ORGANIZATION
The Golub Group Equity Fund (the “Fund”) is an open-end diversified series of the Valued Advisers Trust (the “Trust”). The Trust is a management investment company established under the laws of Delaware by an Agreement and Declaration of Trust dated June 13, 2008 (the “Trust Agreement”). The Trust Agreement permits the Trustees to issue an unlimited number of shares of beneficial interest of separate series without par value. The Fund is one of a series of funds authorized by the Trustees. The Fund’s investment adviser is Golub Group, LLC (the “Adviser”). The investment objective of the Fund is to provide long-term capital appreciation. A secondary objective is to provide current income.
NOTE 2. SIGNIFICANT ACCOUNTING POLICIES
The following is a summary of significant accounting policies followed by the Fund in the preparation of its financial statements.
Securities Valuation – All investments in securities are recorded at their estimated fair value as described in Note 3.
Federal Income Taxes – The Fund makes no provision for federal income or excise tax. The Fund intends to qualify each year as a regulated investment company (“RIC”) under subchapter M of the Internal Revenue Code of 1986, as amended, by complying with the requirements applicable to RICs and by distributing substantially all of its taxable income. The Fund also intends to distribute sufficient net investment income and net capital gains, if any, so that it will not be subject to excise tax on undistributed income and gains. If the required amount of net investment income or gains is not distributed, the Fund could incur a tax expense.
As of and during the fiscal year ended January 31, 2011, the Fund did not have a liability for any unrecognized tax benefits. The Fund recognizes interest and penalties, if any, related to unrecognized tax benefits as income tax expense in the statement of operations. During the period, the Fund did not incur any interest or penalties. The Fund’s federal tax returns filed in the 2-year period ended January 31, 2011, remains subject to examination by the Internal Revenue Service.
Expenses – Expenses incurred by the Trust that do not relate to a specific fund of the Trust are allocated to the individual funds based on each fund’s relative net assets or another appropriate basis (as determined by the Trustees).
Security Transactions and Related Income - The Fund follows industry practice and records security transactions on the trade date. The specific identification method is used for determining gains or losses for financial statement and income tax purposes. Dividend income is recorded on the ex-dividend date and interest income is recorded on an accrual basis. Discounts and premiums on securities purchased are accreted or amortized using the effective interest method. The ability of issuers of debt securities held by the Fund to meet their obligations may be affected by economic and political developments in a specific country or region. Withholding taxes on foreign dividends have been provided for in accordance with the Fund’s understanding of the applicable country’s tax rules and rates.
Dividends and Distributions - The Fund intends to distribute substantially all of its net investment income, if any, as dividends to its shareholders on at least an annual basis. The Fund intends to distribute its net realized long term capital gains and its net realized short term capital gains, if any, at least once a year. Dividends to shareholders, which are determined in accordance with income tax regulations, are recorded on the ex-dividend date. The treatment for financial reporting purposes of distributions made to shareholders during the period from net investment income or net realized capital gains may differ from their ultimate treatment for federal income tax purposes. These differences are caused primarily by differences in the timing of the recognition of certain components of income, expense or realized capital gain for federal income tax purposes. Where such differences are permanent in nature, they are reclassified in the components of the net assets based on their ultimate characterization for federal income tax purposes. Any such reclassifications will have no effect on net assets, results of operations or net asset values per share of the Fund.
14
Golub Group Equity Fund
Notes to the Financial Statements - continued
January 31, 2011
NOTE 3. SECURITIES VALUATION AND FAIR VALUE MEASUREMENTS
Fair value is defined as the price that a Fund would receive upon selling an investment in a timely transaction to an independent buyer in the principal or most advantageous market of the investment. Accounting principles generally accepted in the United States of America (“GAAP”) establishes a three-tier hierarchy to maximize the use of observable market data and minimize the use of unobservable inputs and to establish classification of fair value measurements for disclosure purposes.
Inputs refer broadly to the assumptions that market participants would use in pricing the asset or liability, including assumptions about risk, for example, the risk inherent in a particular valuation technique used to measure fair value including such as a pricing model and/or the risk inherent in the inputs to the valuation technique. Inputs may be observable or unobservable. Observable inputs are inputs that reflect the assumptions market participants would use in pricing the asset or liability developed based on market data obtained from sources independent of the reporting entity. Unobservable inputs are inputs that reflect the reporting entity’s own assumptions about the assumptions market participants would use in pricing the asset or liability developed based on the best information available in the circumstances.
Various inputs are used in determining the value of the Fund’s investments. These inputs are summarized in the three broad levels listed below.
| | • | | Level 1 – quoted prices in active markets for identical securities |
| | • | | Level 2 – other significant observable inputs (including, but not limited to, quoted prices for an identical security in an inactive market, quoted prices for similar securities, interest rates, prepayment speeds, credit risk, etc.) |
| | • | | Level 3 – significant unobservable inputs (including the Fund’s own assumptions in determining fair value of investments based on the best information available) |
The inputs used to measure fair value may fall into different levels of the fair value hierarchy. In such cases, for disclosure purposes, the level in the fair value hierarchy within which the fair value measurement falls in its entirety, is determined based on the lowest level input that is significant to the fair value measurement in its entirety.
Equity securities, including common stocks and American Depositary Receipts, are generally valued by using market quotations, but may be valued on the basis of prices furnished by a pricing service when the Fund believes such prices more accurately reflect the fair value of such securities. Securities that are traded on any stock exchange are generally valued by the pricing service at the last quoted sale price. Lacking a last sale price, an exchange traded security is generally valued by the pricing service at its last bid price. Securities traded in the NASDAQ over-the-counter market are generally valued by the pricing service at the NASDAQ Official Closing Price. When using the market quotations or close prices provided by the pricing service and when the market is considered active, the security will be classified as a Level 1 security. Sometimes, an equity security owned by the Fund will be valued by the pricing service with factors other than market quotations or when the market is considered inactive. When this happens, the security will be classified as a Level 2 security. When market quotations are not readily available, when the Fund determines that the market quotation or the price provided by the pricing service does not accurately reflect the current fair value, or when restricted or illiquid securities are being valued, such securities are valued as determined in good faith by the Fund, in conformity with guidelines adopted by and subject to review by the Board. These securities will be categorized as Level 3 securities.
Investments in mutual funds, including money market mutual funds, are generally priced at the ending net asset value (NAV) provided by the service agent of the funds. These securities will be categorized as Level 1 securities.
Fixed income securities that are valued using market quotations in an active market will be categorized as Level 1 securities. However, they may be valued on the basis of prices furnished by a pricing service when the Fund believes
15
Golub Group Equity Fund
Notes to the Financial Statements - continued
January 31, 2011
NOTE 3. SECURITIES VALUATION AND FAIR VALUE MEASUREMENTS – continued
such prices more accurately reflect the fair value of such securities. A pricing service utilizes electronic data processing techniques based on yield spreads relating to securities with similar characteristics to determine prices for normal institutional-size trading units of debt securities without regard to sale or bid prices. These securities will generally be categorized as Level 2 securities. If the Fund decides that a price provided by the pricing service does not accurately reflect the fair value of the securities, when prices are not readily available from a pricing service, or when restricted or illiquid securities are being valued, securities are valued at fair value as determined in good faith by the Fund, in conformity with guidelines adopted by and subject to review of the Board. These securities will be categorized as Level 3 securities.
Short-term investments in fixed income securities (those with maturities of less than 60 days when acquired or which subsequently are within 60 days of maturity), are valued at amortized cost, which the Board has determined will represent fair value. These securities will be classified as Level 2 securities.
In accordance with the Trust’s good faith pricing guidelines, the Fund is required to consider all appropriate factors relevant to the value of securities for which it has determined other pricing sources are not available or reliable as described above. No single standard exists for determining fair value, because fair value depends upon the circumstances of each individual case. As a general principle, the current fair value of an issue of securities being valued by the Fund would appear to be the amount which the owner might reasonably expect to receive for them upon their current sale. Methods which are in accordance with this principle may, for example, be based on (i) a multiple of earnings; (ii) a discount from market of a similar freely traded security (including a derivative security or a basket of securities traded on other markets, exchanges or among dealers); or (iii) yield to maturity with respect to debt issues, or a combination of these and other methods. Good faith pricing is permitted if, in the Fund’s opinion, the validity of market quotations appears to be questionable based on factors such as evidence of a thin market in the security based on a small number of quotations, a significant event occurs after the close of a market but before a Fund’s NAV calculation that may affect a security’s value, or the Fund is aware of any other data that calls into question the reliability of market quotations. Good faith pricing may also be used in instances when the bonds the Fund invest in may default or otherwise cease to have market quotations readily available. Any fair valuation pricing done outside the Fund’s approved pricing methods must be approved by the Pricing Committee of the Board.
The following is a summary of the inputs used to value the Fund’s investments as of January 31, 2011:
| | | | | | | | | | | | | | | | |
| | | Valuation Inputs | |
Assets | | Level 1 -Quoted
Prices in Active
Markets | | | Level 2 - Other
Significant
Observable Inputs | | | Level 3 -
Significant
Unobservable
Inputs | | | Total | |
Common Stocks* | | $ | 18,904,941 | | | $ | — | | | $ | — | | | $ | 18,904,941 | |
Money Market Securities | | | 1,265,375 | | | | — | | | | — | | | | 1,265,375 | |
Total | | $ | 20,170,316 | | | $ | — | | | $ | — | | | $ | 20,170,316 | |
| * | Refer to the Schedule of Investments for industry classifications. |
The Fund had no transfers between Level 1 and Level 2 at anytime during the reporting period.
The Fund did not hold any investments at any time during the reporting period in which significant unobservable inputs were used in determining fair value; therefore, no reconciliation of Level 3 securities is included for this reporting period. The Fund did not hold any derivative instruments during the reporting period.
16
Golub Group Equity Funds
Notes to the Financial Statements - continued
January 31, 2011
NOTE 4. FEES AND OTHER TRANSACTIONS WITH AFFILIATES
Under the terms of the management agreement, on behalf of the Fund (the “Agreement”), the Adviser manages the Fund’s investments subject to approval of the Trustees. As compensation for its management services, the Golub Group Equity Fund is obligated to pay the Adviser a fee computed and accrued daily and paid monthly at an annual rate of 1.00% of the average daily net assets of the Fund. For the fiscal year ended January 31 2011, the Adviser earned a fee of $135,459 from the Fund before the reimbursement described below. At January 31, 2011, the Fund owed the Adviser $6,925.
The Adviser has contractually agreed to waive its management fee and/or reimburse expenses so that total annual fund operating expenses, excluding interest, taxes, brokerage commissions, other expenditures which are capitalized in accordance with GAAP, other extraordinary expenses not incurred in the ordinary course of the Fund’s business, dividend expense on short sales, and expenses that the Fund has incurred but did not actually pay because of an expense offset arrangement, if applicable, incurred by the Fund in any fiscal year, do not exceed 1.25% of the Fund’s average daily net assets through May 31, 2011. The operating expense limitation also excludes any fees and expenses of acquired funds. For the fiscal year ended January 31, 2011, the Adviser waived fees of $129,687.
The amounts subject to repayment by the Fund, pursuant to the aforementioned conditions, at January 31, 2011 are as follows:
| | |
Amount | | Recoverable through January 31, |
| $118,845 | | 2013 |
| $129,687 | | 2014 |
The Trust retains Huntington Asset Services, Inc. (“HASI”) formerly known as Unified Fund Services, Inc, to manage the Fund’s business affairs and provide the Fund with administrative services, including all regulatory reporting and necessary office equipment and personnel. For the fiscal year ended January 31, 2011, HASI earned fees of $37,083 for administrative services provided to the Fund. At January 31, 2011, HASI was owed $3,000 from the Fund for administrative services. Certain officers of the Trust are members of management and/or employees of HASI. HASI is a wholly-owned subsidiary of Huntington Bancshares, Inc., the parent company of Unified Financial Securities, Inc. (the “Distributor”) and Huntington National Bank, the custodian of the Fund’s investments (the “Custodian”). For the fiscal year ended January 31, 2011, the Custodian earned fees of $5,870 for custody services provided to the Fund. At January 31, 2011, the Custodian was owed $540 from the Fund for custody services.
The Trust also retains HASI to act as the Fund’s transfer agent and to provide fund accounting services. For the fiscal year ended January 31, 2011, HASI earned fees of $40,797 for transfer agent services to the Fund. At January 31, 2011, the Fund owed HASI $3,462 for transfer agent services.
For the fiscal year ended January 31, 2011, HASI earned fees of $25,000 from the Fund for fund accounting services. At January 31, 2011, HASI was owed $2,083 from the Fund for fund accounting services.
The Fund has adopted a Distribution Plan pursuant to Rule 12b-1 under the 1940 Act (the “Plan”). The Plan provides that the Fund will pay the Distributor and/or any registered securities dealer, financial institution or any other person (the “Recipient”) a shareholder servicing fee of 0.25% of the average daily net assets of the Fund in connection with the promotion and distribution of the Fund’s shares or the provision of personal services to shareholders, including, but not necessarily limited to, advertising, compensation to underwriters, dealers and selling personnel, the printing and mailing of prospectuses to other than current Fund shareholders, the printing and mailing of sales literature and servicing shareholder accounts (“12b-1 Expenses”). The Fund or Distributor may pay all or a portion of these fees to any
17
Golub Group Equity Fund
Notes to the Financial Statements - continued
January 31, 2011
NOTE 4. FEES AND OTHER TRANSACTIONS WITH AFFILIATES – continued
Recipient who renders assistance in distributing or promoting the sale of shares, or who provides certain shareholder services, pursuant to a written agreement. The Plan is a compensation plan, which means that the Plan will benefit shareholders because an effective sales program typically is necessary in order for the Fund to reach and maintain a sufficient size to achieve efficiently its investment objectives and to realize economies of scale. The Plan is not active and will not be activated prior to May 31, 2011.
Unified Financial Securities, Inc. acts as the principal distributor of the Fund’s shares. There were no payments made by the Fund to the Distributor during the fiscal year ended January 31, 2011. An officer of the Trust is an officer of the Distributor and such person may be deemed to be an affiliate of the Distributor.
NOTE 5. INVESTMENTS
For the fiscal year ended January 31, 2011, purchases and sales of investment securities, other than short-term investments and short-term U.S. government obligations, were as follows:
| | | | |
Purchases | | | | |
U.S. Government Obligations | | $ | — | |
Other | | | 10,706,267 | |
Sales | | | | |
U.S. Government Obligations | | $ | — | |
Other | | | 2,940,835 | |
At January 31, 2011, the net unrealized appreciation (depreciation) of investments for tax purposes was as follows:
| | | | |
Gross Appreciation | | $ | 2,754,607 | |
Gross (Depreciation) | | | (104,408 | ) |
| | | | |
Net Appreciation (Depreciation)on Investments | | $ | 2,650,199 | |
| | | | |
At January 31, 2011, the aggregate cost of securities, excluding U.S. government obligations, for federal income tax purposes was $17,520,117 for the Fund.
NOTE 6. ESTIMATES
The preparation of financial statements in conformity with GAAP requires management to make estimates and assumptions that affect the reported amounts of assets and liabilities and disclosure of contingent assets and liabilities at the date of the financial statements and the reported amounts of increases and decreases in net assets from operations during the reporting period. Actual results could differ from those estimates.
NOTE 7. DISTRIBUTIONS TO SHAREHOLDERS
On December 28, 2010, the Fund paid an income distribution of $0.0901 per share, a short-term capital gain distribution of $0.2018 per share, and a long-term capital gain distribution of $0.1763 per share, to shareholders of record on December 27, 2010.
18
Golub Group Equity Fund
Notes to the Financial Statements - continued
January 31, 2011
NOTE 7. DISTRIBUTIONS TO SHAREHOLDERS – continued
The tax characterization of distributions for the fiscal periods ended January 31, were as follows:
| | | | | | | | |
| | | 2011 | | | 2010 | |
Distributions paid from: | | | | | | | | |
Ordinary Income* | | $ | 359,056 | | | $ | 60,459 | |
Long-term Capital Gain | | | 216,920 | | | | — | |
| | | | | | | | |
| | $ | 575,976 | | | $ | 60,459 | |
| | | | | | | | |
| * | Short term capital gain distributions are treated as ordinary income for tax purposes. |
At January 31, 2011, the components of distributable earnings (accumulated losses) on a tax basis were as follows:
| | | | |
Undistributed long-term capital gain | | | 351,330 | |
Unrealized appreciation (depreciation) | | | 2,650,199 | |
| | | | |
| | $ | 3,001,529 | |
| | | | |
At January 31, 2011, there were no differences between book basis and tax basis appreciation.
NOTE 8. COMMITMENTS AND CONTINGENCIES
The Fund indemnifies its officers and trustees for certain liabilities that may arise from their performance of their duties to the Fund. Additionally, in the normal course of business, the Fund enters into contracts that contain a variety of representatives and warranties which provide general indemnifications. The Fund’s maximum exposure under these arrangements is unknown, as this would involve future claims that may be made against the Fund that have not yet occurred.
NOTE 9. SPECIAL SHAREHOLDERS MEETING (Unaudited)
On June 16, 2010, a Special Meeting of shareholders of the Valued Advisers Trust was held to elect two (2) trustees to hold office for an indefinite period of time. The results of the election were
| | | | | | | | | | | | |
| | | For | | | Against | | | Abstained | |
Ira Cohen | | | 4,137,387 | | | | 3,252 | | | | 7,012 | |
R. Jeffrey Young | | | 4,137,229 | | | | — | | | | 10,423 | |
Based on the results above, Ira Cohen and R. Jeffrey Young were elected as Trustees for the Value Advisors Trust.
19
Golub Group Equity Fund
Notes to the Financial Statements - continued
January 31, 2011
NOTE 10. RECENT ACCOUNTING PRONOUNCEMENTS
In January 2010, the Financial Accounting Standards Board issued Accounting Standards Update (“ASU”) No. 2010-06 “Improving Disclosures about Fair Value Measurements.” ASU No. 2010-06 clarifies existing disclosure and requires additional disclosures regarding fair value measurements. Effective for fiscal years beginning after December 15, 2010, and for interim periods within those fiscal years, entities will need to disclose information about purchases, sales, issuances and settlements of Level 3 securities on a gross basis, rather than as a net number as currently required. Management is currently evaluating the impact ASU No. 2010-06 will have on its financial statement disclosures.
NOTE 11. SUBSEQUENT EVENT
In connection with the preparation of the financial statements of the Fund as of and for the year ended January 31, 2011, events and transactions subsequent to January 31, 2011, have been evaluated by the Fund’s management for possible adjustment and/or disclosure. Management has not identified any subsequent events requiring financial statement disclosure as of the date these financial statements were issued.
20

REPORT OF INDEPENDENT REGISTERED PUBLIC ACCOUNTING FIRM
To the Board of Trustees of Valued Advisers Trust
and the Shareholders of Golub Group Equity Fund
We have audited the accompanying statement of assets and liabilities of the Golub Group Equity Fund, a series of shares of beneficial interest in Valued Advisers Trust (the “Fund”), including the schedule of investments, as of January 31, 2011, and the related statement of operations for the year then ended, and the statements of changes in net assets and the financial highlights for each of the year then ended and the period April 1, 2009 (commencement of operations) through January 31, 2010. These financial statements and financial highlights are the responsibility of the Fund’s management. Our responsibility is to express an opinion on these financial statements and financial highlights based on our audit.
We conducted our audits in accordance with the standards of the Public Company Accounting Oversight Board (United States). Those standards require that we plan and perform the audits to obtain reasonable assurance about whether the financial statements and financial highlights are free of material misstatement. An audit includes examining, on a test basis, evidence supporting the amounts and disclosures in the financial statements. Our procedures included confirmation of securities owned as of January 31, 2011 by correspondence with the custodian and brokers. An audit also includes assessing the accounting principles used and significant estimates made by management, as well as evaluating the overall financial statement presentation. We believe that our audits provide a reasonable basis for our opinion.
In our opinion, the financial statements and financial highlights referred to above present fairly, in all material respects, the financial position of the Golub Group Equity Fund as of January 31, 2011, and the results of its operations for the year then ended, and the changes in its net assets and its financial highlights for the year then ended and the period April 1, 2009 (commencement of operations) through January 31, 2010, in conformity with accounting principles generally accepted in the United States of America.

BBD, LLP
Philadelphia, Pennsylvania
March 22, 2011
TRUSTEES AND OFFICERS – (Unaudited)
The Board of Trustees supervises the business activities of the Trust. Each Trustee serves as a trustee until termination of the Trust unless the Trustee dies, resigns, retires or is removed.
The following tables provide information regarding the Trustees and Officers.
Independent Trustee
| | |
Name, Address*, (Age), Position with Trust**, Term of Position with Trust | | Principal Occupation During Past 5 Years and Other Directorships |
| Dr. Merwyn R. Vanderlind, 74, Independent Trustee, August 2008 to present. | | Retired; Consultant to Battelle Memorial Institute on business investments from 2001 to 2003; Formerly employed with Battelle Memorial Institute from 1966 to 2003 in various positions, including the Executive Vice President of Battelle Institute from 1991 to 2001, General Manager from 1985 to 1991, Director of the Battelle Industrial Technology Center (Geneva, Switzerland) from 1983 to 1985, and Practicing Researcher from 1966 to 1983. No other directorships held. |
| |
| Ira Cohen, 52, Independent Trustee, June 2010 to present. | | Independent financial services consultant (February 2005 – present); Senior Vice-President, Dealer Services/Institutional Services, AIM Investment Services, Inc., 1992 to 2005. |
|
Interested Trustee and Officers |
Name, Address*, (Age), Position with Trust**, Term of Position with Trust | | Principal Occupation During Past 5 Years and Other Directorships |
| R. Jeffrey Young, 46, Chairman, Interested Trustee, Principal Executive Officer and President, January 2010 to present. | | Senior Vice President of Huntington Asset Services, Inc. since January 2010. Chief Executive Officer, Huntington Funds since February 2010; President, Dreman Contrarian Funds since March 2011. Managing Director and Chief Operating Officer of Professional WealthStone from 2007 to January 2010; Co-Founder of Kinwood Group, LLC July 2007 to March 2008; President and Chief Executive Officer of The Coventry Group from 2000 to 2007; President and Chief Executive Officer of the STI Classic Funds from 2004 to 2007; Trustee of the Coventry Group from 1999 to 2005; and Senior Vice President of BISYS Fund Services/The Winsbury Company October 1993 to June 2007. No other directorships held. |
| |
| John C. Swhear, 49, Chief Compliance Officer, AML Officer and Vice President, August 2008 to present. | | Vice President of Legal Administration and Compliance for Huntington Asset Services, Inc., the Trust’s administrator, since April 2007; Chief Compliance Officer of Unified Financial Securities, Inc., the Trust’s distributor, since May 2007; Senior Vice President of the Unified Series Trust since May 2007; Secretary, Huntington Funds since April 2010, President and Chief Executive Officer, Dreman Contrarian Funds from March 2010 to March 2011, and Vice President and Acting Chief Executive Officer from May 2007 to March 2010. Employed in various positions with American United Life Insurance Company from 1983 to April 2007, including: Associate General Counsel, April 2007; Investment Adviser Chief Compliance Officer, June 2004 to April 2007; Assistant Secretary to the Board of Directors, December 2002 to April 2007; Chief Compliance Officer of OneAmerica Funds, Inc., June 2004 to April 2007; Chief Counsel and Secretary, OneAmerica Securities, Inc., December 2002 to April 2007. |
| | |
Name, Address*, (Age), Position with Trust**, Term of Position with Trust | | Principal Occupation During Past 5 Years and Other Directorships |
| Carol J. Highsmith, 46, Vice President, August 2008 to present. | | Employed in various positions with Huntington Asset Services, Inc., the Trust’s administrator, since November of 1994; currently Vice President of Legal Administration. |
| |
| William J. Murphy, 47, Principal Financial Officer and Treasurer, December 2009 to present | | Manager of Financial Reporting for Huntington Asset Services, Inc., since October 2007; Treasurer and Chief Financial Officer, Dreman Contrarian Funds from February 2008 to March 2011; Employed in various positions with American United Life Insurance Company from March 1987 to October 2007. |
| |
| Deborah Wells, 40, Secretary, December 2010 to present | | Paralegal for Huntington Asset Services, Inc. since May 2010; Paralegal for Baker & Daniels LLP from February 2007 to September 2009; Governance Administrator for WellPoint, Inc. from May 1996 to February 2007. |
| * | The address for each trustee and officer is 2960 N. Meridian St., Suite 300, Indianapolis, IN 46208. |
| ** | The trust currently consists of 5 series. |
OTHER INFORMATION
The Fund’s Statement of Additional Information (“SAI”) includes additional information about the trustees and is available without charge, upon request. You may call toll-free at (866) 954-6682 to request a copy of the SAI or to make shareholder inquiries.
Management Agreement Renewal - (Unaudited)
At a meeting held on December 9, 2010, the Board of Trustees (the “Board”) considered the renewal of the Investment Advisory Agreement between the Trust and Golub Group, LLC (the “Adviser”). Legal Counsel noted that the 1940 Act requires the approval of the investment advisory agreements between the Trust and its service providers by a majority of the Independent Trustees. The Board discussed the arrangements between the Adviser and the Trust with respect to the Golub Group Equity Fund. The Board reviewed a memorandum from Legal Counsel addressed to the Trustees that summarized, among other things, the fiduciary duties and responsibilities of the Board in reviewing and approving the renewal of the Agreement. A copy of this memorandum was circulated to the Trustees in advance of the meeting. Legal Counsel discussed with the Trustees the types of information and factors that should be considered by the Board in order to make an informed decision regarding the approval of the renewal of the Agreement, including the following material factors: (i) the nature, extent, and quality of the services provided by the Adviser; (ii) the investment performance of the Fund; (iii) the costs of the services to be provided and profits to be realized by the Adviser from the relationship with the Fund; (iv) the extent to which economies of scale would be realized if the Fund grows and whether advisory fee levels reflect those economies of scale for the benefit of the Fund’s investors; (v) the Adviser’s practices regarding brokerage and portfolio transactions; and (vi) the Adviser’s practices regarding possible conflicts of interest.
In assessing these factors and reaching its decisions, the Board took into consideration information furnished for the Board’s review and consideration throughout the year at regular Board meetings, as well as information specifically prepared and/or presented in connection with the annual renewal process, including information presented at the Meeting. The Board requested and was provided with information and reports relevant to the annual renewal of the Agreement, including: (i) reports regarding the services and support provided to the Fund and its shareholders by the Adviser; (ii) quarterly assessments of the investment performance of the Fund by personnel of the Adviser; (iii) commentary on the reasons for the performance; (iv) presentations by Fund management addressing the Adviser’s investment philosophy, investment strategy, personnel and operations; (v) compliance and audit reports concerning the Fund and the Adviser; (vi) disclosure information contained in the registration statement of the Trust and the Form ADV of the Adviser; (vii) information on relevant developments in the mutual fund industry and how the Fund and/or the Adviser are responding to them; and (viii) a memorandum from Counsel, that summarized the fiduciary duties and responsibilities of the Board in reviewing and approving the Agreement, including the material factors set forth above and the types of information included in each factor that should be considered by the Board in order to make an informed decision. The Board also requested and received various informational materials including, without limitation: (i) documents containing information about the Adviser, including financial information, a description of personnel and the services provided to the Fund, information on investment advice, performance, summaries of Fund expenses, compliance program, current legal matters, and other general information; (ii) comparative expense and performance information for other mutual funds with strategies similar to the Fund; (iii) the anticipated effect of size on the Fund’s performance and expenses; and (iv) benefits to be realized by the Adviser from its relationship with the Fund. The Board did not identify any particular information that was most relevant to its consideration to approve the Agreement and each Trustee may have afforded different weight to the various factors.
In deciding whether to approve the agreement, the Trustees considered numerous factors, including:
| 1. | The nature, extent, and quality of the services to be provided by the Adviser. In this regard, the Board reviewed the Adviser’s responsibilities under the Advisory Agreement. The Trustees reviewed the services being provided by the Adviser to the Fund including, without limitation: the quality of its investment advisory services (including research and recommendations with respect to portfolio securities), its process for formulating investment recommendations and assuring compliance with the Fund’s investment objectives and limitations, its coordination of services for the Fund among the Fund’s service providers, and its efforts to promote the Fund and grow its assets. The Trustees noted the Adviser’s continuity of, and commitment to retain, qualified personnel and the Adviser’s commitment to maintain and enhance its resources and systems, the commitment of the Adviser’s personnel to finding alternatives and options that allow the Fund to maintain its goals, and the Adviser’s continued cooperation with the Independent Trustees and Counsel for the Fund. The Trustees evaluated the Adviser’s personnel, including the education and experience of the Adviser’s personnel. After reviewing the foregoing information and further information in the meeting materials provided by the Adviser (including the Adviser’s Form ADV), the Board concluded that, in light of all the facts and circumstances, the nature, extent, and quality of the services provided by the Adviser were satisfactory and adequate for the Fund. |
Management Agreement Renewal - (Unaudited) - continued
| 2. | Investment Performance of the Fund and the Adviser. In considering the investment performance of the Fund and the Adviser, the Trustees compared the short and long-term performance of the Fund with the performance of funds with similar objectives managed by other investment advisers, as well as with aggregated peer group data. The Trustees also considered the consistency of the Adviser’s management of the Fund with its investment objective, strategies, and limitations. The Trustees noted that the Fund’s performance was comparable to the performance of the Adviser’s composites for accounts managed similarly to the Fund. The Trustees also compared the short and long-term performance of the Fund with the performance of its benchmark index, comparable funds with similar objectives and size managed by other investment advisers, and comparable peer group indices (e.g. Morningstar and Lipper category averages). The Trustees noted that the Fund’s performance was better than most of its peers in the short term and since the Fund’s inception. After reviewing and discussing the investment performance of the Fund further, the Adviser’s experience managing the Fund, the Adviser’s historical performance, and other relevant factors, the Board concluded, in light of all the facts and circumstances, that the investment performance of the Fund and the Adviser was satisfactory. |
| 3. | The costs of the services to be provided and profits to be realized by the Adviser from the relationship with the Fund. In considering the costs of services to be provided and the profits to be realized by the Adviser from the relationship with the Fund, the Trustees considered: (1) the Adviser’s financial condition; (2) asset level of the Fund; (3) the overall expenses of the fund; and (4) the nature and frequency of advisory fee payments. The Trustees reviewed information provided by the Adviser regarding its profits associated with managing the Fund. The Trustees also considered potential benefits for the Adviser in managing the Fund. The Trustees then compared the fees and expenses of the Fund (including the management fee) to other comparable mutual funds. The Trustees noted that the Fund’s management fee and expense ratios were lower than some of the specifically identified comparable funds and higher than others. Based on the foregoing, the Board concluded that the fees to be paid to the Adviser by the Fund and the profits to be realized by the Adviser, in light of all the facts and circumstances, were fair and reasonable in relation to the nature and quality of the services provided by the Adviser. |
| 4. | The extent to which economies of scale would be realized as the Fund grows and whether advisory fee levels reflect these economies of scale for the benefit of the Fund’s investors. In this regard, the Board considered the Fund’s fee arrangements with the Adviser. The Board considered that while the management fee remained the same at all asset levels, the Fund’s shareholders had experienced benefits from the Fund’s expense limitation arrangement. The Trustees noted that the Fund’s shareholders would continue to experience benefits from the expense limitation arrangement until the Fund’s expenses feel below the cap set by the arrangement. Thereafter, the Trustees noted that the Fund’s shareholders would continue to benefit from the economies of scale under the Fund’s agreements with service providers other than the Adviser. In light of its ongoing consideration of the Fund’s asset levels, expectations for growth in the Fund, and fee levels, the Board determined that the Fund’s fee arrangements, in light of all the facts and circumstances, were fair and reasonable in relation to the nature and quality of the services provided by the Adviser. |
| 5. | Brokerage and portfolio transactions. In considering the Adviser’s practices regarding brokerage and portfolio transactions, the Trustees reviewed the Adviser’s practice for seeking best execution for the Fund’s portfolio transactions. The Trustees also considered the portfolio turnover rate for the Fund and they considered the Adviser’s practices with respect to allocating portfolio business to broker/dealers who provide research, statistical, or other services – this latter assessment included consideration of whether commission rates paid to broker/dealers are reasonable in relation to the value of the services provided. The Trustees considered the process by which evaluations are made of the overall reasonableness of commission paid and the method and basis for selecting and evaluating the broker/dealers used by the Adviser. The Trustees noted that in selecting broker/dealers to execute portfolio transactions, the Adviser considers a variety of factors including, among others, the price of the security, the rate of the commission, the size and difficulty of the order, the firms’ ability to provide professional services (e.g., the firms’ reliability, integrity, quality of execution and operational capabilities) and research provided by the firm. The Trustees also considered the extent to which the foregoing services benefit the other accounts advised by the Adviser and the extent to which such services enable the |
Management Agreement Renewal - (Unaudited) - continued
| | Adviser to avoid expenses that it otherwise would be required to bear under the Agreement. After further review and discussion, the Board determined that the Adviser’s practices regarding brokerage and portfolio transactions were satisfactory. |
| 6. | Possible conflicts of interest. In considering the Adviser’s practices regarding conflicts of interest, the Trustees evaluated the potential for conflicts of interest and considered such matters as the experience and ability of the advisory personnel assigned to the Fund; the basis of decisions to buy or sell securities for the Fund and/or the Adviser’s other accounts; and the substance and administration of the Adviser’s code of ethics. The Trustees also considered disclosure in the registration statement of the Trust relating to the Adviser’s potential conflicts of interest. Based on the foregoing, the Board determined that the Adviser’s standards and practices of the Advisers relating to the identification and mitigation of potential conflicts of interest were satisfactory. |
After additional consideration of the factors delineated in the memorandum provided by Legal Counsel and further discussion among the Board, the Board determined to renew the Investment Advisory Agreement between the Trust and the Adviser for an additional one year period.
PROXY VOTING
A description of the policies and procedures that the Fund uses to determine how to vote proxies relating to portfolio securities and information regarding how the Funds voted those proxies during the most recent twelve month period ended June 30, is available without charge upon request by (1) calling the Fund at (866) 954-6682 and (2) from Fund documents filed with the Securities and Exchange Commission (“SEC”) on the SEC’s website at www.sec.gov.
TRUSTEES
R. Jeffrey Young, Chairman
Dr. Merwyn R. Vanderlind
Ira Cohen
OFFICERS
R. Jeffrey Young, Principal Executive Officer and President
John C. Swhear, Chief Compliance Officer, AML Officer and Vice-President
Carol J. Highsmith, Vice President
William J. Murphy, Principal Financial Officer and Treasurer
Deborah Wells, Secretary
INVESTMENT ADVISER
Golub Group, LLC
1850 Gateway Drive, Suite 600
San Mateo, CA 94404
DISTRIBUTOR
Unified Financial Securities, Inc.
2960 North Meridian Street, Suite 300
Indianapolis, IN 46208
INDEPENDENT REGISTERED PUBLIC ACCOUNTING FIRM
BBD, LLP
1835 Market Street, 26th Floor
Philadelphia, PA 19103
LEGAL COUNSEL
The Law Offices of John H. Lively & Associates, Inc.,
A member firm of The 1940 Act Law Group
2041 West 141st Terrace, Suite 119
Leawood, KS 66224
CUSTODIAN
Huntington National Bank
41 South Street
Columbus, OH 43125
ADMINISTRATOR, TRANSFER AGENT AND FUND ACCOUNTANT
Huntington Asset Services, Inc.
2960 North Meridian Street, Suite 300
Indianapolis, IN 46208
This report is intended only for the information of shareholders or those who have received the Fund’s prospectus which contains information about the Fund’s management fee and expenses. Please read the prospectus carefully before investing.
Distributed by Unified Financial Securities, Inc.
Member FINRA/SIPC
Item 2. Code of Ethics.
As of the end of the period covered by this report, the registrant has adopted a code of ethics that applies to the registrant’s principal executive officer, principal financial officer, principal accounting officer or controller, or persons performing similar functions, regardless of whether these individuals are employed by the registrant or a third party. Pursuant to Item 12(a)(1), a copy of registrant’s code of ethics is filed as an exhibit to this Form N-CSR. During the period covered by this report, the code of ethics has not been amended, and the registrant has not granted any waivers, including implicit waivers, from the provisions of the code of ethics.
Item 3. Audit Committee Financial Expert.
(a) The registrant’s board of trustees has determined that the registrant does not have an audit committee financial expert. The committee members and the full Board considered a possibility of adding a member that would qualify as an expert. The audit committee determined that, although none of its members meet the technical definition of an audit committee expert, the committee has sufficient financial expertise to adequately perform its duties under the Audit Committee Charter without the addition of a qualified expert.
Item 4. Principal Accountant Fees and Services.
| | | | |
Golub Funds: | | FY 2011 | | $13,000 |
| | FY 2010 | | $13,000 |
| | | | |
| | Registrant | | |
Golub Funds: | | FY 2011 | | $0 |
| | FY 2010 | | $0 |
| | | | |
| | Registrant | | |
Golub Funds: | | FY 2011 | | $2,000 |
| | FY 2010 | | $2,000 |
Nature of the fees: Preparation of the 1120 RIC and Excise review
| | | | |
| | Registrant | | |
Golub Funds: | | FY 2011 | | $0 |
| | FY 2010 | | $0 |
(e)(1) Audit Committee’s Pre-Approval Policies
The Audit Committee Charter requires the Audit Committee to be responsible for the selection, retention or termination of auditors and, in connection therewith, to (i) evaluate the proposed fees and other compensation, if any, to be paid to the auditors, (ii) evaluate the independence of the auditors, (iii) pre-approve all audit services and, when appropriate, any non-audit services provided by the independent auditors to the Trust, (iv) pre-approve, when appropriate, any non-audit services provided by the independent auditors to the Trust’s investment adviser, or any entity controlling, controlled by, or under common control with the investment adviser and that provides ongoing services to the Trust if the engagement relates directly to the operations and financial reporting of the Trust, and (v) receive the auditors’ specific representations as to their independence;
| | (2) | Percentages of Services Approved by the Audit Committee |
| | | | |
| | | Registrant | |
Audit-Related Fees: | | | 0% | |
Tax Fees: | | | 0% | |
All Other Fees: | | | 0% | |
| (f) | During audit of registrant’s financial statements for the most recent fiscal year, less than 50 percent of the hours expended on the principal accountant’s engagement were attributed to work performed by persons other than the principal accountant’s full-time, permanent employees. |
| (g) | The aggregate non-audit fees billed by the registrant’s accountant for services rendered to the registrant, and rendered to the registrant’s investment adviser (not including any sub-adviser whose role is primarily portfolio management and is subcontracted with or overseen by another investment adviser), and any entity controlling, controlled by, or under common control with the adviser that provides ongoing services to the registrant: |
| | | | |
| | Registrant | | Adviser |
FY 2011 | | $0 | | $0 |
FY 2010 | | $0 | | $0 |
| (h) | Not applicable. The auditor performed no services for the registrant’s investment adviser or any entity controlling, controlled by, or under common control with the investment adviser that provides ongoing services to the registrant. |
Item 5. Audit Committee of Listed Companies. NOT APPLICABLE – applies to listed companies only
Item 6. Schedule of Investments. Schedule filed with Item 1.
Item 7. Disclosure of Proxy Voting Policies and Procedures for Closed-End Management Investment Companies. NOT APPLICABLE – applies to closed-end funds only
Item 8. Portfolio Managers of Closed-End Investment Companies. NOT APPLICABLE – applies to closed-end funds only
Item 9. Purchases of Equity Securities by Closed-End Management Investment Company and Affiliated Purchasers. NOT APPLICABLE – applies to closed-end funds only
Item 10. Submission of Matters to a Vote of Security Holders.
The guidelines applicable to shareholders desiring to submit recommendations for nominees to the Registrant’s board of trustees are contained in the statement of additional information of the Trust with respect to the Fund(s) for which this Form N-CSR is being filed.
Item 11. Controls and Procedures.
(a) Based on their evaluation of the registrant’s disclosure controls and procedures (as defined in Rule 30a-3(c) under the Investment Company Act of 1940, as amended (the “Act”)) as of a date within 90 days of the filing date of this report, the registrant’s principal executive officer and principal financial officer have concluded that such disclosure controls and procedures are reasonably designed and are operating effectively to ensure that material information relating to the registrant is made known to them by others within those entities, particularly during the period in which this report is being prepared, and that the information required in filings on Form N-CSR is recorded, processed, summarized, and reported on a timely basis.
(b) There were no changes in the registrant’s internal control over financial reporting (as defined in Rule 30a-3(d) under the Investment Company Act of 1940) that occurred during the second fiscal quarter of the period covered by this report that have materially affected, or are reasonably likely to materially affect, the registrant’s internal control over financial reporting.
Item 12. Exhibits.
| | |
| (a) (1) | | Code is filed herewith |
| |
| (2) | | Certifications by the registrant’s principal executive officer and principal financial officer, pursuant to Section 302 of the Sarbanes- Oxley Act of 2002 and required by Rule 30a-2under the Investment Company Act of 1940 are filed herewith. |
| |
| (3) | | Not Applicable |
| |
| (b) | | Certification pursuant to 18 U.S.C. Section 1350, as adopted pursuant to Section 906 of the Sarbanes-Oxley Act of 2002 is filed herewith. |
-2-
SIGNATURES
Pursuant to the requirements of the Securities Exchange Act of 1934 and the Investment Company Act of 1940, the registrant has duly caused this report to be signed on its behalf by the undersigned, thereunto duly authorized.
| | |
| (Registrant) Valued Advisers Trust | | |
| |
| By /s/ R. Jeffrey Young | | |
| | |
| R. Jeffrey Young, President and Principal Executive Officer | | |
| |
| Date 3/24/11 | | |
Pursuant to the requirements of the Securities Exchange Act of 1934 and the Investment Company Act of 1940, this report has been signed below by the following persons on behalf of the registrant and in the capacities and on the dates indicated.
| | | | |
| By /s/ R. Jeffrey Young | | | | |
| | | | |
| R. Jeffrey Young, President and Principal Executive Officer | | | | |
| | |
| Date 3/24/11 | | | | |
| | |
| By /s/ William J. Murphy | | | | |
| | | | |
| William J. Murphy, Treasurer and Principal Financial Officer | | | | |
| | |
| Date 3/28/11 | | | | |