UNITED STATES
SECURITIES AND EXCHANGE COMMISSION
WASHINGTON, D.C. 20549
FORM N-CSR
CERTIFIED SHAREHOLDER REPORT OF REGISTERED
MANAGEMENT INVESTMENT COMPANIES
Investment Company Act file number 811-22208
Valued Advisers Trust
(Exact name of registrant as specified in charter)
| | |
| Huntington Asset Services, Inc. 2960 N. Meridian Street, Suite 300 Indianapolis, IN 46208 |
| (Address of principal executive offices) (Zip code) |
Capitol Services, Inc.
615 S. Dupont Hwy.
Dover,DE 19901
(Name and address of agent for service)
With a copy to:
John H. Lively, Esq.
The Law Offices of John H. Lively & Associates, Inc.
A member firm of The 1940 Act Law Group
2041 W. 141st Terrace
Suite 119
Leawood, KS 66224
Registrant’s telephone number, including area code: 317-917-7000
Date of fiscal year end: 1/31
Date of reporting period: 1/31/12
Item 1. Reports to Stockholders.
Golub Group Equity Fund
Annual Report
January 31, 2012
Fund Adviser:
Golub Group, LLC
1850 Gateway Drive, Suite 600
San Mateo, CA 94404
Toll Free (866) 954-6682
TO OUR FELLOW SHAREHOLDERS:
What a year it was! 2011 witnessed riots and regime change in the Arab world, a nuclear catastrophe in Japan, political deadlock and the downgrade of the United States’ credit rating, and a persistent debt crisis that threatens the continuity of the European Union. Despite these events, the S&P 500* was virtually unchanged, ending the year at nearly the exact same price level that it began the year. In many ways, it was analogous to a theme park roller coaster that picks up and drops off riders at the same level platform, but which offers many thrills and chills in-between.
Much of the resiliency in the U.S. market is due to the fact that our domestic economy continues to show signs of stability and gradual improvement while alternative economies in Europe and emerging countries are beginning to deteriorate. Accordingly, U.S. equity markets dramatically outshone all developed and emerging foreign markets, including Germany (DAX: -17.4%), France (CAC 40: -19.6%), Japan (Nikkei: -12.8%), Hong Kong (Hang Seng: -19.9%), Brazil (Bovespa: -27.0%), China (Shanghai: -18.1%), and India (NSE Nifty: -36.5%). During a period when so many investment professionals have strongly endorsed global market diversification through index ETFs, we ask, “why?” We get plenty of global economic diversification through multinationals, and our hand-selected shares of foreign companies performed well.
In investing, the consensus is typically wrong. Crowd behavior among investors is precisely the thing that creates opportunities for those who can use independent judgment and exploit the mispricings that result. We firmly believe that when market pundits line up on a particular point of view, we are sent a clear signal to expect the opposite to occur.
This year, the consensus is decidedly downbeat. Taking cues from the recent past, the average market pundit believes that we are in for more of the same as we experienced in 2011. We are not with the consensus, and are in fact optimistic for the market, even at a time when we expect modest GDP growth and continued high unemployment. GDP growth rates have never been well correlated with stock market returns. Other factors are more important. Specifically, we expect further earnings growth from corporations, albeit at a more moderate rate than the recent past, continued benign inflation, a containment of Europe’s problems largely within Europe, and—finally—a willingness amongst the investing public to put money to work in selected equities.
Since the beginning of 2008, retail investors have withdrawn a total of $390 billion from domestic and foreign equity mutual funds, while increasing their commitments to fixed income mutual funds by $708 billion (Investment Company Institute data). 2011 saw investors again accepting virtually no return from bond funds in exchange for their presumed safety. In fact, equity funds saw outflows of $125 billion for the year through December 21st; bond funds saw inflows of $133 billion over the same period. If something cannot continue forever, it will stop. We believe that 2012 will be the year that funds flows finally decidedly favor stocks, driven by the widest-ever disparity between the relative value of stocks versus bonds. Investors will simply no longer accept negative real returns in bonds, will recognize that stocks as a class are attractively priced at 12x earnings and 2.1% current dividend yield (with the shares of many wonderful companies even cheaper than this), and will acknowledge their capital is really quite secure in stocks, provided they focus their investments in high quality companies that are attractively valued.
In closing, we appreciate your confidence in us. The true intent of the Golub Group Equity Fund is to provide a means by which our investors can build their wealth over the long term. We look forward to achieving this with you.
Sincerely,
Golub Group, LLC
1
MANAGEMENT’S DISCUSSION OF FUND PERFORMANCE FOR THE FISCAL YEAR ENDING JANUARY 31, 2012
The Golub Group Equity Fund returned 2.65% for the fiscal year ending January 31, 2012. In comparison, our benchmark, the S&P 500 Index*, gained 4.19% during the same period. Since inception on April 1, 2009, the Fund has returned 55.63% cumulatively as compared to the 66.76% return of the benchmark.
Performance for the year was led by strong returns from our building supply stocks in anticipation of a bottoming of the U.S. housing market, outperformance of our Energy holdings, and select Technology names that continue to perform better than overly pessimistic market expectations. In terms of positive contribution, Intel, Home Depot and Lowe’s were the largest contributors and returned 27.4%, 24.5% and 8.7% respectively. Microsoft ended the year as our largest holding and was up 9.2% for the period.
Despite the aforementioned positive contributions from Intel and Microsoft, the portfolio’s exposure to the Technology sector was the largest detractor to performance due to our position in Hewlett Packard which fell 42.5%. We were also negatively impacted by our relative underperformance in the Healthcare sector, which was the market’s best performing sector during the period. Teva Pharmaceutical fell 16.2% and was our second worst performer during the period.
During the year, we added the following eight new positions to the Fund: Apple, Abbott Labs, Avon Products, Bank of New York Mellon, Becton Dickinson, Federal Express, General Motors and Google. During the period we sold the following eight positions in their entirety: Amgen, Caterpillar, Comcast, Hewlett Packard, Kraft Foods, Range Resources, Walmart and Walgreen.
In addition to the stock and security selection, the adviser’s decision to waive fees and reimburse expenses to the Fund due to the expense limitation cap impacted performance. Had the adviser not waived and reimbursed these expenses, the performance of the Fund would have been lower.
We remain focused on our long term discipline of investing in high-quality, large-cap, dividend-paying businesses that trade at attractive valuations and are confident that our style of investing is particularly well suited for the period ahead.
Sincerely,
Golub Group, LLC
| * | The S&P 500® Index is a widely recognized unmanaged index of equity prices and is representative of a broader market and range of securities than is found in the Fund’s portfolio. Individuals cannot invest directly in the Index; however, an individual can invest in exchange traded funds or other investment vehicles that attempt to track the performance of a benchmark index. |
The views in the foregoing discussion were those of the Fund’s investment adviser as of the date set forth above and may not reflect its views on the date this Annual Report is first published or anytime thereafter. These views are intended to assist shareholders in understanding their investment in the Fund and do not constitute investment advice.
The performance information quoted above represents past performance and past performance does not guarantee future results. Investment return and principal value of an investment will fluctuate so that an investor’s shares, when redeemed, may be worth more or less than their original cost. Current performance may be lower or higher than the performance data quoted. Performance data, current to the most recent month end, may be obtained by calling the Fund at 1-866-954-6682. Fee waivers and expense reimbursements have positively impacted Fund performance. An investor should consider the Fund’s investment objectives, risks, and charges and expenses carefully before investing. The Fund’s Prospectus contains this and other important information. For information on the Fund’s expense ratio, please see the Financial Highlights Table found within the accompanying Annual Report.
2
Investment Results – (Unaudited)
| | | | | | | | |
Total Returns* (For the period ended January 31, 2012) | |
| | | One Year | | | Average Annual
Since Inception
(April 1, 2009) | |
| Golub Group Equity Fund | | | 2.65 | % | | | 16.90 | % |
| S&P 500(R) Index** | | | 4.19 | % | | | 19.76 | % |
Total annual operating expenses, as disclosed in the most recent supplement to the Fund's prospectus, were 1.97% of average daily net assets (1.26% after fee waivers/expense reimbursements by the Adviser.) The Adviser has contractually agreed to waive or limit its fees and assume other expenses of the Fund until May 31, 2012, so that Total Annual Fund Operating Expenses do not exceed 1.25%. This contractual arrangement may only be terminated by mutual consent of the Adviser and the Fund, and it will automatically terminate upon the termination of the investment advisory agreement between the Fund and the Adviser. This operating expense limitation does not apply to: (i) interest, (ii) taxes, (iii) brokerage commissions, (iv) other expenditures which are capitalized in accordance with generally accepted accounting principles, (v) other extraordinary expenses not incurred in the ordinary course of the Fund's business, (vi) dividend expense on short sales, (vii) expenses incurred under a plan of distribution under Rule 12b-1, and (viii) expenses that the Fund has incurred but did not actually pay because of an expense offset arrangement, if applicable, incurred by the Fund in any fiscal year.
The performance quoted represents past performance, which does not guarantee future results. The investment return and principal value of an investment will fluctuate so that an investor’s shares, when redeemed, may be worth more or less than their original cost. The returns shown do not reflect deduction of taxes that a shareholder would pay on Fund distributions or the redemption of Fund shares. Current performance of the Fund may be lower or higher than the performance quoted. The Fund’s investment objectives, risks, charges and expenses must be considered carefully before investing. Performance data current to the most recent month end may be obtained by calling 1-866-954-6682.
| * | Return figures reflect any change in price per share and assume the reinvestment of all distributions. |
| ** | The S&P 500® Index is a widely recognized unmanaged index of equity securities and is representative of a broader domestic equity market and range of securities than is found in the Fund’s portfolio. Individuals cannot invest directly in the Index; however, an individual can invest in exchange traded funds or other investment vehicles that attempt to track the performance of a benchmark index. |
The Fund’s investment objectives, strategies, risks, charges and expenses must be considered carefully before investing. The prospectus contains this and other important information about the Fund and may be obtained by calling the same number as above. Please read it carefully before investing. The Fund is distributed by Unified Financial Securities, Inc., member FINRA.
3
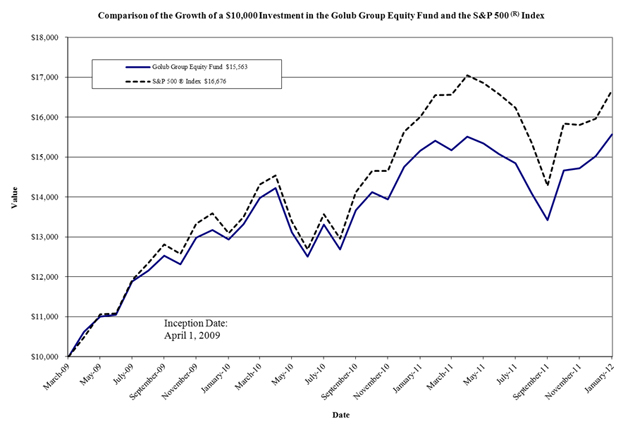
The chart above assumes an initial investment of $10,000 made on April 1, 2009 (commencement of Fund operations) and held through January 31, 2012. The S&P 500® Index is a widely recognized unmanaged index of equity securities and is representative of a broader domestic equity market and range of securities than is found in the Fund’s portfolio. Individuals cannot invest directly in the Index; however, an individual can invest in exchange traded funds or other investment vehicles that attempt to track the performance of a benchmark index. THE FUND’S RETURN REPRESENTS PAST PERFORMANCE AND DOES NOT GUARANTEE FUTURE RESULTS. The returns shown do not reflect deduction of taxes that a shareholder would pay on Fund distributions or the redemption of Fund shares. Investment returns and principal values will fluctuate so that your shares, when redeemed, may be worth more or less than their original purchase price.
Current performance may be lower or higher than the performance data quoted. For more information on the Fund, and to obtain performance data current to the most recent month end or to request a prospectus, please call 1-866-954-6682. You should carefully consider the investment objectives, potential risks, management fees, and charges and expenses of the Fund before investing. The Fund’s prospectus contains this and other information about the Fund, and should be read carefully before investing.
The Fund is distributed by Unified Financial Securities, Inc., member FINRA.
4
Fund Holdings – (Unaudited)
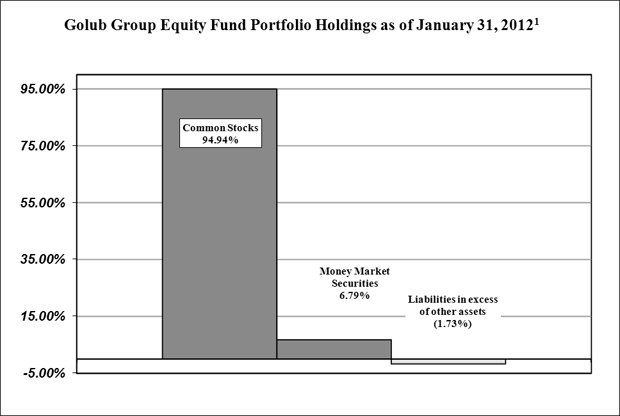
| 1 | As a percentage of net assets. |
The investment objective of the Golub Group Equity Fund is to provide long-term capital appreciation. A secondary objective is provide current income.
Availability of Portfolio Schedule – (Unaudited)
The Fund files its complete schedule of portfolio holdings with the Securities and Exchange Commission (“SEC”) for the first and third quarters of each fiscal year on Form N-Q. The Fund’s Forms N-Q are available at the SEC’s website at www.sec.gov. The Fund’s Forms N-Q may be reviewed and copied at the SEC’s Public Reference Room in Washington DC. Information on the operation of the Public Reference Room may be obtained by calling 1-800-SEC-0330.
5
Summary of Fund’s Expenses – (Unaudited)
As a shareholder of the Fund, you incur ongoing costs, including management fees and other Fund expenses. This Example is intended to help you understand your ongoing costs (in dollars) of investing in the Fund and to compare these costs with the ongoing costs of investing in other mutual funds.
The Example is based on an investment of $1,000 invested at the beginning and held for the entire period from August 1, 2011 to January 31, 2012.
Actual Expenses
The first line of the table below provides information about actual account values and actual expenses. You may use the information in this line, together with the amount you invested, to estimate the expenses that you paid over the period. Simply divide your account value by $1,000 (for example, an $8,600 account value divided by $1,000 = $8.60), then multiply the result by the number in the first line under the heading entitled “Expenses Paid During the Period” to estimate the expenses you paid on your account during this period.
Hypothetical Example for Comparison Purposes
The second line of the table below provides information about hypothetical account values and hypothetical expenses based on the Fund’s actual expense ratio and an assumed rate of return of 5% per year before expenses, which is not the Fund’s actual return. The hypothetical account values and expenses may not be used to estimate the actual ending account balance or expenses you paid for the period. You may use this information to compare the ongoing costs of investing in the Fund and other funds. To do so, compare this 5% hypothetical example with the 5% hypothetical examples that appear in the shareholder reports of the other funds.
Please note that the expenses shown in the table are meant to highlight your ongoing costs only. Therefore, the second line of the table below is useful in comparing ongoing costs only and will not help you determine the relative costs of owning different funds.
| | | | | | | | | | | | |
Golub Group Equity Fund | | Beginning Account
Value
August 1, 2011 | | | Ending Account
Value
January 31, 2012 | | | Expenses Paid
During the Period Ended
January 31, 2012 | |
Actual* | | $ | 1,000.00 | | | $ | 1,048.75 | | | $ | 6.46 | |
Hypothetical** | | $ | 1,000.00 | | | $ | 1,018.90 | | | $ | 6.36 | |
| * | Expenses are equal to the Fund’s annualized net expense ratio of 1.25%, multiplied by the average account value over the period, multiplied by 184/365. |
| ** | Assumes a 5% return before expenses. |
6
Golub Group Equity Fund
Schedule of Investments
January 31, 2012
| | | | | | | | |
| | | Shares | | | Fair Value | |
Common Stocks - 94.94% | | | | | | | | |
Air Courier Services - 1.99% | | | | | | | | |
FedEx Corp. | | | 5,200 | | | $ | 475,748 | |
| | | | | | | | |
Aircraft Engines & Engine Parts - 1.45% | | | | | | | | |
United Technologies Corp. | | | 4,425 | | | | 346,699 | |
| | | | | | | | |
Beverages - 4.29% | | | | | | | | |
Diageo plc (b)(d) | | | 4,025 | | | | 356,575 | |
PepsiCo, Inc. | | | 10,200 | | | | 669,834 | |
| | | | | | | | |
| | | | | | | 1,026,409 | |
| | | | | | | | |
Brewery - 2.89% | | | | | | | | |
Anheuser-Busch InBev NV (b) | | | 11,375 | | | | 691,600 | |
| | | | | | | | |
Computer Communications Equipment - 4.09% | | | | | | | | |
Cisco Systems, Inc. | | | 49,875 | | | | 979,046 | |
| | | | | | | | |
Electromedical & Electrotherapeutic Apparatus - 3.16% | | | | | | | | |
Medtronic, Inc. | | | 19,625 | | | | 756,936 | |
| | | | | | | | |
Electronic & Other Electrical Equipment (No Computer Equipment) - 4.26% | | | | | | | | |
General Electric Co. | | | 54,525 | | | | 1,020,163 | |
| | | | | | | | |
Electronic Computers - 1.51% | | | | | | | | |
Apple, Inc. (a) | | | 790 | | | | 360,619 | |
| | | | | | | | |
Fire, Marine & Casualty Insurance - 3.82% | | | | | | | | |
Berkshire Hathaway, Inc. - Class B (a) | | | 11,675 | | | | 914,970 | |
| | | | | | | | |
Investment Advice - 2.89% | | | | | | | | |
Franklin Resources, Inc. | | | 6,525 | | | | 692,302 | |
| | | | | | | | |
Medical - Generic Drugs - 3.80% | | | | | | | | |
Teva Pharmaceutical Industries, Ltd. (b) | | | 20,150 | | | | 909,369 | |
| | | | | | | | |
Motor Vehicles & Passenger Car Bodies - 3.02% | | | | | | | | |
General Motors Co. (a) | | | 30,125 | | | | 723,602 | |
| | | | | | | | |
Perfumes, Cosmetics, & Other Toilet Preparations - 1.39% | | | | | | | | |
Avon Products, Inc. | | | 18,750 | | | | 333,188 | |
| | | | | | | | |
Petroleum Refining - 8.70% | | | | | | | | |
Chevron Corp. | | | 6,400 | | | | 659,712 | |
ConocoPhillips | | | 9,275 | | | | 632,648 | |
Exxon Mobil Corp. | | | 9,450 | | | | 791,343 | |
| | | | | | | | |
| | | | | | | 2,083,703 | |
| | | | | | | | |
Pharmaceutical Preparations - 5.69% | | | | | | | | |
Abbott Laboratories | | | 12,375 | | | | 670,106 | |
Johnson & Johnson | | | 10,500 | | | | 692,055 | |
| | | | | | | | |
| | | | | | | 1,362,161 | |
| | | | | | | | |
Retail - Lumber & Other Building Materials Dealers - 7.68% | | | | | | | | |
Home Depot, Inc./The | | | 18,800 | | | | 834,532 | |
Lowe’s Companies, Inc. | | | 37,450 | | | | 1,004,784 | |
| | | | | | | | |
| | | | | | | 1,839,316 | |
| | | | | | | | |
See accompanying notes which are an integral part of these financial statements.
7
Golub Group Equity Fund
Schedule of Investments - continued
January 31, 2012
| | | | | | | | |
| | | Shares | | | Fair Value | |
Common Stocks - 94.94% - continued | | | | | | | | |
Semiconductors & Related Devices - 1.99% | | | | | | | | |
Intel Corp. | | | 18,050 | | | $ | 476,881 | |
| | | | | | | | |
Services - Computer Processing & Data Preparation - 2.78% | | | | | | | | |
Fiserv, Inc. (a) | | | 10,575 | | | | 665,062 | |
| | | | | | | | |
Services - Computer Programming, Data Processing, Etc. - 3.14% | | | | | | | | |
Google Inc. - Class A(a) | | | 1,295 | | | | 751,242 | |
| | | | | | | | |
Services - Engineering, Accounting, Research, Management - 2.56% | | | | | | | | |
Paychex, Inc. | | | 19,500 | | | | 614,250 | |
| | | | | | | | |
Services - Prepackaged Software - 4.34% | | | | | | | | |
Microsoft Corp. | | | 35,200 | | | | 1,039,456 | |
| | | | | | | | |
Soap, Detergent, Cleaning Preparations, Perfumes, Cosmetics - 1.77% | | | | | | | | |
Procter & Gamble Co./The | | | 6,725 | | | | 423,944 | |
| | | | | | | | |
State Commercial Banks - 2.80% | | | | | | | | |
Bank of New York Mellon Corp./The | | | 33,350 | | | | 671,336 | |
| | | | | | | | |
Super-Regional Banks-US - 7.36% | | | | | | | | |
U.S. Bancorp | | | 30,900 | | | | 871,998 | |
Wells Fargo & Co. | | | 30,500 | | | | 890,905 | |
| | | | | | | | |
| | | | | | | 1,762,903 | |
| | | | | | | | |
Surgical & Medical Instruments & Apparatus - 1.98% | | | | | | | | |
Becton, Dickinson and Co. | | | 6,050 | | | | 474,381 | |
| | | | | | | | |
Telephone Communications (No Radio Telephone) - 2.86% | | | | | | | | |
China Mobile Ltd. (b) | | | 13,425 | | | | 685,749 | |
| | | | | | | | |
Trucking & Courier Services (No Air) - 2.73% | | | | | | | | |
United Parcel Service, Inc. - Class B | | | 8,648 | | | | 654,221 | |
| | | | | | | | |
TOTAL COMMON STOCKS (Cost $20,376,205) | | | | | | | 22,735,256 | |
| | | | | | | | |
Money Market Securities - 6.79% | | | | | | | | |
| | |
Fidelity Institutional Money Market Portfolio - Institutional Class, 0.26% (c) | | | 1,625,116 | | | $ | 1,625,116 | |
| | | | | | | | |
TOTAL MONEY MARKET SECURITIES (Cost $1,625,116) | | | | | | | 1,625,116 | |
| | | | | | | | |
TOTAL INVESTMENTS (Cost $22,001,321) - 101.73% | | | | | | $ | 24,360,372 | |
| | | | | | | | |
Liabilities in excess of other assets - (1.73)% | | | | | | | (413,956 | ) |
| | | | | | | | |
TOTAL NET ASSETS - 100.00% | | | | | | $ | 23,946,416 | |
| | | | | | | | |
| (b) | American Depositary Receipt. |
| (c) | Variable rate security; the rate shown represents the 7-day yield at January 31, 2012. |
| (d) | Public Limited Company. |
See accompanying notes which are an integral part of these financial statements.
8
Golub Group Equity Fund
Statement of Assets and Liabilities
January 31, 2012
| | | | |
Assets | | | | |
Investments in securities, at fair value (cost $22,001,321) | | $ | 24,360,372 | |
Receivable for investments sold | | | 436,109 | |
Dividends receivable | | | 25,289 | |
Interest receivable | | | 281 | |
Receivable for tax reclaim | | | 203 | |
Prepaid expenses | | | 4,275 | |
| | | | |
Total assets | | | 24,826,529 | |
| | | | |
Liabilities | | | | |
Payable for investments purchased | | | 843,955 | |
Payable to Adviser (a) | | | 8,813 | |
Payable to administrator, fund accountant, and transfer agent (a) | | | 8,159 | |
Payable to custodian (a) | | | 1,134 | |
Payable to trustees | | | 116 | |
Other accrued expenses | | | 17,936 | |
| | | | |
Total liabilities | | | 880,113 | |
| | | | |
Net Assets | | $ | 23,946,416 | |
| | | | |
Net Assets consist of: | | | | |
Paid in capital | | $ | 21,791,561 | |
Undistributed net investment income | | | 8,233 | |
Accumulated net realized loss on investments | | | (212,429 | ) |
Net unrealized appreciation on investments | | | 2,359,051 | |
| | | | |
Net Assets | | $ | 23,946,416 | |
| | | | |
Shares outstanding (unlimited number of shares authorized; no par value) | | | 1,711,004 | |
| | | | |
Net Asset Value, offering and redemption price per share | | $ | 14.00 | |
| | | | |
| (a) | See Note 4 in the Notes to the Financial Statements. |
See accompanying notes which are an integral part of these financial statements.
9
Golub Group Equity Fund
Statement of Operations
Year ended January 31, 2012
| | | | |
Investment Income | | | | |
Dividend income (net of foreign withholding tax of $6,758) | | $ | 486,912 | |
Interest income | | | 2,122 | |
| | | | |
Total Investment Income | | | 489,034 | |
| | | | |
Expenses | | | | |
Investment Adviser fee (a) | | | 214,348 | |
Administration expenses (a) | | | 36,854 | |
Transfer agent expenses (a) | | | 36,174 | |
Fund accounting expenses (a) | | | 25,000 | |
Legal expenses | | | 17,268 | |
Audit expenses | | | 15,000 | |
Custodian expenses (a) | | | 7,362 | |
Trustee expenses | | | 6,694 | |
Registration expenses | | | 4,809 | |
Insurance expenses | | | 3,939 | |
Printing expenses | | | 3,771 | |
Pricing expenses | | | 2,106 | |
Miscellaneous expenses | | | 1,800 | |
24f-2 fees | | | 635 | |
| | | | |
Total Expenses | | | 375,760 | |
Fees waived and expenses reimbursed by Adviser (a) | | | (107,613 | ) |
| | | | |
Net operating expenses | | | 268,147 | |
| | | | |
Net Investment Income | | | 220,887 | |
| | | | |
Realized & Unrealized Gain (Loss) on Investments | | | | |
Net realized gain on investment securities | | | 697,262 | |
Change in unrealized appreciation on investment securities | | | (291,148 | ) |
| | | | |
Net realized and unrealized gain on investment securities | | | 406,114 | |
| | | | |
Net increase in net assets resulting from operations | | $ | 627,001 | |
| | | | |
| (a) | See Note 4 in the Notes to the Financial Statements. |
See accompanying notes which are an integral part of these financial statements.
10
Golub Group Equity Fund
Statements of Changes In Net Assets
| | | | | | | | |
| | | Year Ended
January 31, 2012 | | | Year Ended
January 31, 2011 | |
Increase (Decrease) in Net Assets due to: | | | | | | | | |
Operations | | | | | | | | |
Net investment income | | $ | 220,887 | | | $ | 110,721 | |
Net realized gain on investment securities | | | 697,262 | | | | 689,107 | |
Change in unrealized appreciation on investment securities | | | (291,148 | ) | | | 1,565,154 | |
| | | | | | | | |
Net increase in net assets resulting from operations | | | 627,001 | | | | 2,364,982 | |
| | | | | | | | |
Distributions | | | | | | | | |
From net investment income | | | (212,526 | ) | | | (110,853 | ) |
From net realized gains | | | (1,261,149 | ) | | | (465,123 | ) |
| | | | | | | | |
Total distributions | | | (1,473,675 | ) | | | (575,976 | ) |
| | | | | | | | |
Capital Share Transactions | | | | | | | | |
Proceeds from shares sold | | | 7,225,438 | | | | 10,118,861 | |
Reinvestment of distributions | | | 1,473,675 | | | | 575,976 | |
Amount paid for shares redeemed | | | (3,480,419 | ) | | | (2,299,251 | ) |
| | | | | | | | |
Net increase in net assets resulting from capital share transactions | | | 5,218,694 | | | | 8,395,586 | |
| | | | | | | | |
Total Increase in Net Assets | | | 4,372,020 | | | | 10,184,592 | |
| | | | | | | | |
Net Assets | | | | | | | | |
Beginning of year | | | 19,574,396 | | | | 9,389,804 | |
| | | | | | | | |
End of year | | $ | 23,946,416 | | | $ | 19,574,396 | |
| | | | | | | | |
Undistributed net investment income included in net assets at end of period | | $ | 8,233 | | | $ | — | |
| | | | | | | | |
Capital Share Transactions | | | | | | | | |
Shares sold | | | 508,241 | | | | 737,390 | |
Shares issued in reinvestment of distributions | | | 109,812 | | | | 40,505 | |
Shares redeemed | | | (249,482 | ) | | | (166,043 | ) |
| | | | | | | | |
Net increase from capital share transactions | | | 368,571 | | | | 611,852 | |
| | | | | | | | |
| | | | |
| See accompanying notes which are an integral part of these financial statements. |
|
| 11 |
Golub Group Equity Fund
Financial Highlights
(For a share outstanding during the period)
| | | | | | | | | | | | |
| | | For the
Year Ended
January 31, 2012 | | | For the
Year Ended
January 31, 2011 | | | For the
Period Ended
January 31, 2010 (a) | |
Selected Per Share Data: | | | | | | | | | | | | |
Net asset value, beginning of period | | $ | 14.58 | | | $ | 12.85 | | | $ | 10.00 | |
| | | | | | | | | | | | |
Income from investment operations: | | | | | | | | | | | | |
Net investment income (b) | | | 0.15 | | | | 0.11 | | | | 0.11 | |
Net realized and unrealized gain on investments | | | 0.20 | | | | 2.09 | | | | 2.83 | |
| | | | | | | | | | | | |
Total income from investment operations | | | 0.35 | | | | 2.20 | | | | 2.94 | |
| | | | | | | | | | | | |
Less distributions to shareholders: | | | | | | | | | | | | |
From net investment income | | | (0.14 | ) | | | (0.09 | ) | | | (0.09 | ) |
From net realized gains | | | (0.79 | ) | | | (0.38 | ) | | | — | (c) |
| | | | | | | | | | | | |
Total distributions | | | (0.93 | ) | | | (0.47 | ) | | | (0.09 | ) |
| | | | | | | | | | | | |
Net asset value, end of period | | $ | 14.00 | | | $ | 14.58 | | | $ | 12.85 | |
| | | | | | | | | | | | |
Total Return (d) | | | 2.65 | % | | | 17.20 | % | | | 29.37 | % (e) |
Ratios and Supplemental Data: | | | | | | | | | | | | |
Net assets, end of period (000) | | $ | 23,946 | | | $ | 19,574 | | | $ | 9,390 | |
Ratio of expenses to average net assets | | | 1.25 | % | | | 1.25 | % | | | 1.25 | % (f) |
Ratio of expenses to average net assets before waiver and reimbursement by Adviser | | | 1.75 | % | | | 2.21 | % | | | 3.45 | % (f) |
Ratio of net investment income (loss) to average net assets | | | 1.03 | % | | | 0.82 | % | | | 1.07 | % (f) |
Ratio of net investment income (loss) to average net assets before waiver and reimbursement by Adviser | | | 0.53 | % | | | (0.14 | )% | | | (1.13 | )% (f) |
Portfolio turnover rate | | | 27.33 | % | | | 23.15 | % | | | 8.58 | % (e) |
| (a) | For the period April 1, 2009 (Commencement of Operations) to January 31, 2010. |
| (b) | Net investment income per share is calculated by dividing net investment income by the average shares outstanding throughout the period. |
| (c) | Distributions to shareholders resulted in less than $0.005 per share. |
| (d) | Total return in the above table represents the rate that the investor would have earned or lost on an investment in the Fund, assuming reinvestment of distributions. |
| | | | |
| See accompanying notes which are an integral part of these financial statements. |
|
| 12 |
Golub Group Equity Fund
Notes to the Financial Statements
January 31, 2012
The Golub Group Equity Fund (the “Fund”) was organized as an open-end diversified series of the Valued Advisers Trust (the “Trust”) on April 1, 2009. The Trust is a management investment company established under the laws of Delaware by an Agreement and Declaration of Trust dated June 13, 2008 (the “Trust Agreement”). The Trust Agreement permits the Board of Trustees (the “Board”) to issue an unlimited number of shares of beneficial interest of separate series without par value. The Fund is one of a series of funds authorized by the Board. The Fund’s investment adviser is Golub Group, LLC (the “Adviser”). The investment objective of the Fund is to provide long-term capital appreciation. A secondary objective is to provide current income.
| NOTE 2. | SIGNIFICANT ACCOUNTING POLICIES |
The following is a summary of significant accounting policies followed by the Fund in the preparation of its financial statements. These policies are in conformity with the generally accepted accounting principles in the United States of America (“GAAP”).
Securities Valuation – All investments in securities are recorded at their estimated fair value as described in Note 3.
Federal Income Taxes – The Fund makes no provision for federal income or excise tax. The Fund intends to qualify each year as a regulated investment company (“RIC”) under subchapter M of the Internal Revenue Code of 1986, as amended, by complying with the requirements applicable to RICs and by distributing substantially all of its taxable income. The Fund also intends to distribute sufficient net investment income and net capital gains, if any, so that it will not be subject to excise tax on undistributed income and gains. If the required amount of net investment income or gains is not distributed, the Fund could incur a tax expense.
As of and during the fiscal year ended January 31, 2012, the Fund did not have a liability for any unrecognized tax benefits. The Fund recognizes interest and penalties, if any, related to unrecognized tax benefits as income tax expense in the statement of operations. During the period, the Fund did not incur any interest or penalties. The Fund is subject to examination by U.S. federal tax authorities for all tax years since inception.
Expenses – Expenses incurred by the Trust that do not relate to a specific fund of the Trust are allocated to the individual funds based on each fund’s relative net assets or another appropriate basis (as determined by the Board).
Security Transactions and Related Income – The Fund follows industry practice and records security transactions on the trade date. The first in, first out method is used for determining gains or losses for financial statement and income tax purposes. Dividend income is recorded on the ex-dividend date and interest income is recorded on an accrual basis. Discounts and premiums on securities purchased are accreted or amortized using the effective interest method. The ability of issuers of debt securities held by the Fund to meet their obligations may be affected by economic and political developments in a specific country or region. Withholding taxes on foreign dividends have been provided for in accordance with the Fund’s understanding of the applicable country’s tax rules and rates.
Dividends and Distributions – The Fund intends to distribute substantially all of its net investment income, if any, as dividends to its shareholders on at least an annual basis. The Fund intends to distribute its net realized long term capital gains and its net realized short term capital gains, if any, at least once a year. Dividends to shareholders, which are determined in accordance with income tax regulations, are recorded on the ex-dividend date. The treatment for financial reporting purposes of distributions made to shareholders during the period from net investment income or net realized capital gains may differ from their ultimate treatment for federal income tax purposes. These differences are caused primarily by differences in the timing of the recognition of certain components of income, expense or realized capital gain for federal income tax purposes. Where such differences are permanent in nature, they are reclassified in the components of the net assets based on their ultimate characterization for federal income tax purposes. Any such reclassifications will have no effect on net assets, results of operations or net asset values per share of the Fund.
13
Golub Group Equity Fund
Notes to the Financial Statements - continued
January 31, 2012
| NOTE 2. | SIGNIFICANT ACCOUNTING POLICIES – continued |
For the year ended January 31, 2012, the Fund made the following reclassifications to increase/(decrease) the components of net assets:
| | | | | | |
Undistributed Net Investment Income | | | Accumulated Net Realized
Loss On Investments | |
| $ | 58,785 | | | $ | (58,785 | ) |
| NOTE 3. | SECURITIES VALUATION AND FAIR VALUE MEASUREMENTS |
Fair value is defined as the price that a Fund would receive upon selling an investment in a timely transaction to an independent buyer in the principal or most advantageous market of the investment. Accounting principles generally accepted in the United States of America (“GAAP”) establish a three-tier hierarchy to maximize the use of observable market data and minimize the use of unobservable inputs and establish classification of fair value measurements for disclosure purposes.
Inputs refer broadly to the assumptions that market participants would use in pricing the asset or liability, including assumptions about risk, for example, the risk inherent in a particular valuation technique used to measure fair value including a pricing model and/or the risk inherent in the inputs to the valuation technique. Inputs may be observable or unobservable. Observable inputs are inputs that reflect the assumptions market participants would use in pricing the asset or liability developed based on market data obtained from sources independent of the reporting entity. Unobservable inputs are inputs that reflect the reporting entity’s own assumptions about the assumptions market participants would use in pricing the asset or liability developed based on the best information available in the circumstances.
Various inputs are used in determining the value of the Fund’s investments. These inputs are summarized in the three broad levels listed below.
| | • | | Level 1 – quoted prices in active markets for identical securities |
| | • | | Level 2 – other significant observable inputs (including, but not limited to, quoted prices for an identical security in an inactive market, quoted prices for similar securities, interest rates, prepayment speeds, credit risk, etc.) |
| | • | | Level 3 – significant unobservable inputs (including the Fund’s own assumptions in determining fair value of investments based on the best information available) |
The inputs used to measure fair value may fall into different levels of the fair value hierarchy. In such cases, for disclosure purposes, the level in the fair value hierarchy within which the fair value measurement falls in its entirety, is determined based on the lowest level input that is significant to the fair value measurement in its entirety.
Equity securities, including common stocks, are generally valued by using market quotations, but may be valued on the basis of prices furnished by a pricing service when the Fund believes such prices more accurately reflect the fair value of such securities. Securities that are traded on any stock exchange are generally valued by the pricing service at the last quoted sale price. Lacking a last sale price, an exchange traded security is generally valued by the pricing service at its last bid price. Securities traded in the NASDAQ over-the-counter market are generally valued by the pricing service at the NASDAQ Official Closing Price. When using the market quotations or close prices provided by the pricing service and when the market is considered active, the security will be classified as a Level 1 security. Sometimes, an equity security owned by the Fund will be valued by the pricing service with factors other than market quotations or when the market is considered inactive. When this happens, the security will be classified as a Level 2 security. When market
14
Golub Group Equity Fund
Notes to the Financial Statements - continued
January 31, 2012
| NOTE 3. | SECURITIES VALUATION AND FAIR VALUE MEASUREMENTS – continued |
quotations are not readily available, when the Fund determines that the market quotation or the price provided by the pricing service does not accurately reflect the current fair value, or when restricted or illiquid securities are being valued, such securities are valued as determined in good faith by the Fund, in conformity with guidelines adopted by and subject to review by the Board. These securities will be categorized as Level 3 securities.
Investments in mutual funds, including money market mutual funds, are generally priced at the ending net asset value (NAV) provided by the service agent of the funds. These securities will be categorized as Level 1 securities.
Fixed income securities that are valued using market quotations in an active market will be categorized as Level 1 securities. However, they may be valued on the basis of prices furnished by a pricing service when the Fund believes such prices more accurately reflect the fair value of such securities. A pricing service utilizes electronic data processing techniques based on yield spreads relating to securities with similar characteristics to determine prices for normal institutional-size trading units of debt securities without regard to sale or bid prices. These securities will generally be categorized as Level 2 securities. If the Fund decides that a price provided by the pricing service does not accurately reflect the fair value of the securities, when prices are not readily available from a pricing service, or when restricted or illiquid securities are being valued, securities are valued at fair value as determined in good faith by the Fund, in conformity with guidelines adopted by and subject to review of the Board. These securities will be categorized as Level 3 securities.
Short-term investments in fixed income securities (those with maturities of less than 60 days when acquired or which subsequently are within 60 days of maturity), are valued at amortized cost, which the Board has determined will represent fair value. These securities will be classified as Level 2 securities.
In accordance with the Trust’s good faith pricing guidelines, the Fund is required to consider all appropriate factors relevant to the value of securities for which it has determined other pricing sources are not available or reliable as described above. No single standard exists for determining fair value, because fair value depends upon the circumstances of each individual case. As a general principle, the current fair value of an issue of securities being valued by the Fund would appear to be the amount which the owner might reasonably expect to receive for them upon their current sale. Methods which are in accordance with this principle may, for example, be based on (i) a multiple of earnings; (ii) a discount from market of a similar freely traded security (including a derivative security or a basket of securities traded on other markets, exchanges or among dealers); or (iii) yield to maturity with respect to debt issues, or a combination of these and other methods. Good faith pricing is permitted if, in the Fund’s opinion, the validity of market quotations appears to be questionable based on factors such as evidence of a thin market in the security based on a small number of quotations, a significant event occurs after the close of a market but before a Fund’s NAV calculation that may affect a security’s value, or the Fund is aware of any other data that calls into question the reliability of market quotations. Good faith pricing may also be used in instances when the bonds the Fund invests in may default or otherwise cease to have market quotations readily available. Any fair valuation pricing done outside the Fund’s approved pricing methods must be approved by the Pricing Committee of the Board.
15
Golub Group Equity Fund
Notes to the Financial Statements - continued
January 31, 2012
| NOTE 3. | SECURITIES VALUATION AND FAIR VALUE MEASUREMENTS – continued |
The following is a summary of the inputs used to value the Fund’s investments as of January 31, 2012:
| | | | | | | | | | | | | | | | |
| | | Valuation Inputs | |
Assets | | Level 1 - Quoted
Prices in Active
Markets | | | Level 2 - Other
Significant
Observable Inputs | | | Level 3 -
Significant
Unobservable
Inputs | | | Total | |
Common Stocks* | | $ | 22,735,256 | | | $ | — | | | $ | — | | | $ | 22,735,256 | |
Money Market Securities | | | 1,625,116 | | | | — | | | | — | | | | 1,625,116 | |
Total | | $ | 24,360,372 | | | $ | — | | | $ | — | | | $ | 24,360,372 | |
| * | Refer to the Schedule of Investments for industry classifications. |
The Fund did not hold any assets at any time during the reporting period in which significant unobservable inputs were used in determining fair value; therefore, no reconciliation of Level 3 securities is included for this reporting period. During the fiscal year ended January 31, 2012, the Fund had no transfers between Levels. The Trust recognizes significant transfers between fair value hierarchy levels at the end of the reporting period.
| NOTE 4. | FEES AND OTHER TRANSACTIONS WITH AFFILIATES |
Under the terms of the management agreement, on behalf of the Fund (the “Agreement”), the Adviser manages the Fund’s investments subject to oversight of the Board. As compensation for its management services, the Golub Group Equity Fund is obligated to pay the Adviser a fee computed and accrued daily and paid monthly at an annual rate of 1.00% of the average daily net assets of the Fund. For the fiscal year ended January 31, 2012, the Adviser earned a fee of $214,348 from the Fund before the reimbursement described below. At January 31, 2012, the Fund owed the Adviser $8,813.
The Adviser has contractually agreed to waive or limit its fee and reimburse certain Fund operating expenses, until May 31, 2012, so that the ratio of total annual operating expenses do not exceed 1.25%. This operating expense limitation does not apply to interest, taxes, brokerage commissions, other expenditures which are capitalized in accordance with generally accepted accounting principles, other extraordinary expenses not incurred in the ordinary course of the Fund’s business, dividend expense on short sales, expenses incurred under a plan of distribution under Rule 12b-1, and expenses that the Fund has incurred but did not actually pay because of an expense offset arrangement, if applicable, incurred by the Fund in any fiscal year. The operating expense limitation also excludes any “Acquired Fund Fees and Expenses.” Acquired Fund Fees and Expenses represent the pro rata expense indirectly incurred by the Fund as a result of investing in other investment companies, including ETFs, closed-end funds and money market funds that have their own expenses. The Adviser may be entitled to the reimbursement of any fees waived or expenses reimbursed pursuant to the agreement provided overall expenses fall below the limitations set forth above. The Adviser may recoup the sum of all fees previously waived or expenses reimbursed during any of the previous three (3) years, less any reimbursement previously paid, provided total expenses do not exceed the limitation set forth above. For the fiscal year ended January 31, 2012, the Adviser waived fees of $107,613.
The amounts subject to repayment by the Fund, pursuant to the aforementioned conditions, at January 31, 2012 are as follows:
| | | | |
Amount | | January 31, | |
$118,845 | | | 2013 | |
$129,687 | | | 2014 | |
$107,613 | | | 2015 | |
16
Golub Group Equity Fund
Notes to the Financial Statements - continued
January 31, 2012
| NOTE 4. | FEES AND OTHER TRANSACTIONS WITH AFFILIATES – continued |
The Trust retains Huntington Asset Services, Inc. (“HASI”) to manage the Fund’s business affairs and provide the Fund with administrative services, including all regulatory reporting and necessary office equipment and personnel. For the fiscal year ended January 31, 2012, HASI earned fees of $36,854 for administrative services provided to the Fund. At January 31, 2012, HASI was owed $2,919 from the Fund for administrative services. Certain officers of the Trust are members of management and/or employees of HASI. HASI is a wholly-owned subsidiary of Huntington Bancshares, Inc., the parent company of Unified Financial Securities, Inc. (the “Distributor”) and Huntington National Bank, the custodian of the Fund’s investments (the “Custodian”). For the fiscal year ended January 31, 2012, the Custodian earned fees of $7,362 for custody services provided to the Fund. At January 31, 2012, the Custodian was owed $1,134 from the Fund for custody services.
The Trust also retains HASI to act as the Fund’s transfer agent and to provide fund accounting services. For the fiscal year ended January 31, 2012, HASI earned fees of $36,174 for transfer agent services to the Fund. At January 31, 2012, the Fund owed HASI $3,157 for transfer agent services.
For the fiscal year ended January 31, 2012, HASI earned fees of $25,000 from the Fund for fund accounting services. At January 31, 2012, HASI was owed $2,083 from the Fund for fund accounting services.
The Fund has adopted a Distribution Plan pursuant to Rule 12b-1 under the 1940 Act (the “Plan”). The Plan provides that the Fund will pay the Distributor and/or any registered securities dealer, financial institution or any other person (the “Recipient”) a shareholder servicing fee of 0.25% of the average daily net assets of the Fund in connection with the promotion and distribution of the Fund’s shares or the provision of personal services to shareholders, including, but not necessarily limited to, advertising, compensation to underwriters, dealers and selling personnel, the printing and mailing of prospectuses to other than current Fund shareholders, the printing and mailing of sales literature and servicing shareholder accounts (“12b-1 Expenses”). The Fund or Distributor may pay all or a portion of these fees to any recipient who renders assistance in distributing or promoting the sale of shares, or who provides certain shareholder services, pursuant to a written agreement. The Plan is a compensation plan, which means that the Plan will benefit shareholders because an effective sales program typically is necessary in order for the Fund to reach and maintain a sufficient size to achieve efficiently its investment objectives and to realize economies of scale. The Plan is not active and will not be activated prior to May 31, 2012.
Unified Financial Securities, Inc. acts as the principal distributor of the Fund’s shares. There were no payments made by the Fund to the Distributor during the fiscal year ended January 31, 2012. An officer of the Trust is an officer of the Distributor and such person may be deemed to be an affiliate of the Distributor.
The Law Offices of John H. Lively and Associates, Inc., a member firm of The 1940 Act Law Group, serves as legal counsel to the Trust. John H. Lively, Interim Secretary of the Trust, is the owner of The Law Offices of John H. Lively & Associates, Inc., but he receives no direct compensation from the Trust or the Funds for serving as an officer of the Trust.
For the fiscal year ended January 31, 2012, purchases and sales of investment securities, other than short-term investments and short-term U.S. government obligations, were as follows:
| | | | |
| | | Amount | |
Purchases | | | | |
U.S. Government Obligations | | $ | — | |
Other | | | 9,061,189 | |
Sales | | | | |
U.S. Government Obligations | | $ | — | |
Other | | | 5,636,995 | |
17
Golub Group Equity Fund
Notes to the Financial Statements - continued
January 31, 2012
| NOTE 5. | INVESTMENTS – continued |
At January 31, 2012, the net unrealized appreciation (depreciation) of investments for tax purposes was as follows:
| | | | |
Gross Appreciation | | $ | 2,736,475 | |
Gross (Depreciation) | | | (377,424 | ) |
| | | | |
Net Appreciation (Depreciation) on Investments | | $ | 2,359,051 | |
| | | | |
At January 31, 2012, the aggregate cost of securities, excluding U.S. government obligations, for federal income tax purposes was $22,001,321 for the Fund.
The preparation of financial statements in conformity with GAAP requires management to make estimates and assumptions that affect the reported amounts of assets and liabilities and disclosure of contingent assets and liabilities at the date of the financial statements and the reported amounts of increases and decreases in net assets from operations during the reporting period. Actual results could differ from those estimates.
| NOTE 7. | BENEFICIAL OWNERSHIP |
The beneficial ownership, either directly or indirectly, of 25% or more of the voting securities of a fund creates a presumption of control of a fund, under Section 2(a) (9) of the Investment Company Act of 1940. At January 31, 2012, Charles Schwab owned, as record shareholder, 96.28% of the outstanding shares of the Golub Group Equity Fund. The Trust does not know wether Charles Schwab or any of the underlying beneficial owners owned or controlled 25% or more of the voting securities of the Golub Group Equity Fund.
| NOTE 8. | DISTRIBUTIONS TO SHAREHOLDERS |
On December 28, 2011, the Fund paid an income distribution of $0.1335 per share, a short-term capital gain distribution of $0.1622, and a long-term capital gain distribution of $0.6300 per share, to shareholders of record on December 27, 2011.
The tax characterization of distributions for the fiscal periods ended January 31, 2012 and January 31, 2011, were as follows:
| | | | | | | | |
| | | 2012 | | | 2011 | |
Distributions paid from: | | | | | | | | |
Ordinary Income* | | $ | 470,799 | | | $ | 359,056 | |
Long-term Capital Gain | | | 1,002,875 | | | | 216,920 | |
| | | | | | | | |
| | $ | 1,473,674 | | | $ | 575,976 | |
| | | | | | | | |
| * | Short term capital gain distributions are treated as ordinary income for tax purposes. |
At January 31, 2012, the components of distributable earnings (accumulated losses) on a tax basis were as follows:
| | | | |
Undistributed ordinary income | | | 8,233 | |
Accumulated capital and other losses | | | (212,429 | ) |
Unrealized appreciation (depreciation) | | | 2,359,051 | |
| | | | |
| | $ | 2,154,855 | |
| | | | |
18
Golub Group Equity Fund
Notes to the Financial Statements - continued
January 31, 2012
| NOTE 8. | DISTRIBUTIONS TO SHAREHOLDERS – continued |
At January 31, 2012, there were no differences between book basis and tax basis unrealized appreciation (depreciation). However, there was a tax deferral of losses on post-October losses in the amount of $212,429.
| NOTE 9. | COMMITMENTS AND CONTINGENCIES |
The Fund indemnifies its officers and trustees for certain liabilities that may arise from their performance of their duties to the Fund. Additionally, in the normal course of business, the Fund enters into contracts that contain a variety of representations and warranties which provide general indemnifications. The Fund’s maximum exposure under these arrangements is unknown, as this would involve future claims that may be made against the Fund that have not yet occurred.
| NOTE 10. | CHANGE IN INDEPENDENT REGISTERED PUBLIC ACCOUNTING FIRM (UNAUDITED) |
On September 13, 2011, BBD LLP (“BBD”) was dismissed as the independent registered public accounting firm for the Golub Group Equity Fund. The opinion of BBD on the Fund’s financial statements for the fiscal periods ended January 31, 2010 and January 31, 2011 did not contain an adverse opinion or disclaimer of opinion, nor was it qualified or modified as to uncertainty, audit scope or accounting principles. The decision to replace BBD was approved by the Audit Committee of the Fund’s Trustees.
During the most recent fiscal year and through September 13, 2011, there were no disagreements with BBD on any matter of accounting principles or practices, financial statement disclosure, or auditing scope or procedure, which disagreements, if not resolved to the satisfaction of BBD, would have caused BBD to make reference to the subject matter of the disagreements in connection with its opinion on the financial statement for such year. During the most recent fiscal year and through September 13, 2011, there were no reportable events of the kind enumerated in paragraphs (1)(v)(A) through (D) of item 304(a) of Regulation S-K
On September 13, 2011, the Trustees approved the firm Cohen Fund Audit Services, Ltd. to serve as the new independent registered public accounting firm to the Fund.
19
REPORT OF INDEPENDENT REGISTERED PUBLIC ACCOUNTING FIRM
To the Shareholders and Board of Trustees
Golub Group Equity Fund
(Valued Advisers Trust)
We have audited the accompanying statement of assets and liabilities, including the schedule of investments, of Golub Group Equity Fund, (the “Fund”), a series of the Valued Advisers Trust, as of January 31, 2012, and the related statements of operations and changes in net assets and the financial highlights for the year then ended. These financial statements and financial highlights are the responsibility of Fund management. Our responsibility is to express an opinion on these financial statements and financial highlights based on our audit. The statement of changes in net assets and financial highlights for the year ended January 31, 2011, and the financial highlights for the period ended January 31, 2010, were audited by another independent registered public accounting firm, who expressed an unqualified opinion on that statement and financial highlights.
We conducted our audit in accordance with the standards of the Public Company Accounting Oversight Board (United States). Those standards require that we plan and perform the audit to obtain reasonable assurance about whether the financial statements and financial highlights are free of material misstatement. An audit includes examining, on a test basis, evidence supporting the amounts and disclosures in the financial statements. Our procedures included confirmation of securities owned as of January 31, 2012 by correspondence with the custodian and broker. An audit also includes assessing the accounting principles used and significant estimates made by management, as well as evaluating the overall financial statement presentation. We believe that our audit provides a reasonable basis for our opinion.
In our opinion, the financial statements and financial highlights referred to above present fairly, in all material respects, the financial position of the Golub Group Equity Fund as of January 31, 2012, the results of its operations, changes in its net assets, and the financial highlights for the year then ended, in conformity with accounting principles generally accepted in the United States of America.
COHEN FUND AUDIT SERVICES, LTD.
Westlake, Ohio
April 2, 2012
TRUSTEES AND OFFICERS (Unaudited)
The Board of Trustees supervises the business activities of the Trust. Each Trustee serves as a trustee until termination of the Trust unless the Trustee dies, resigns, retires or is removed.
The following tables provide information regarding the Trustees and Officers.
The following table provides information regarding each of the Independent Trustees.
| | |
Name, Address*, (Age), Position with Trust**, Term of
Position with Trust | | Principal Occupation During Past 5 Years and Other Directorships |
Dr. Merwyn R. Vanderlind, 75, Independent Trustee, August 2008 to present. | | Retired; Consultant to Battelle Memorial Institute (International Science and Technology Research Enterprise) on business investments from 2001 to 2003; Formerly employed with Battelle Memorial Institute from 1966 to 2003 in various positions, including the Executive Vice President of Battelle Institute from 1991 to 2001, General Manager from 1985 to 1991, Director of the Battelle Industrial Technology Center (Geneva, Switzerland) from 1983 to 1985, and Practicing Researcher from 1966 to 1983. |
| |
Ira Cohen, 52 Independent Trustee, June 2010 to present. | | Independent financial services consultant (Feb. 2005 - present); Senior Vice President, Dealer Services / Institutional Services, AIM Investment Services, Inc. (1992 – 2005). |
| * | The address for each trustee and officer is 2960 N. Meridian St., Suite 300, Indianapolis, IN 46208. |
| ** | The Trust consists of 10 series. |
The following table provides information regarding the Trustee who is considered an “interested person” of the Trust, as that term is defined under the 1940 Act. Based on the experience of the Trustee, the Trust concluded that the individual described below should serve as a Trustee.
| | |
Name, Address*, (Age), Position with Trust**, Term of
Position with Trust | | Principal Occupation During Past 5 Years and Other Directorships |
| R. Jeffrey Young, 47, Trustee and Chairman, June 2010 to present. | | Principal Executive Officer and President, Valued Advisers Trust since February 2010; Senior Vice President, Huntington Asset Services, Inc. since January 2010; Chief Executive Officer, Huntington Funds since February 2010; President and Chief Executive Officer, Dreman Contrarian Funds since March 2011; Trustee, Valued Advisers Trust, August 2008 to January 2010; Managing Director and Chief Operating Officer of Professional Planning Consultants 2007 to 2010; Co-Founder of Kinwood Group, LLC July 2007 to March 2008; President and Chief Executive Officer of The Coventry Group from 2000 to 2007; President and Chief Executive Officer of the STI Classic Funds from 2004 to 2007; Trustee of the Coventry Group from 1999 to 2005; and Senior Vice President of BISYS Fund Services / The Winsbury Company October 1993 to June 2007. |
| * | The address for each trustee and officer is 2960 N. Meridian St., Suite 300, Indianapolis, IN 46208. |
| ** | The Trust consists of 10 series. |
The following table provides information regarding the Officers of the Trust:
| | |
Name, Address*, (Age), Position with Trust,** Term of
Position with Trust | | Principal Occupation During Past 5 Years and Other Directorships |
| R. Jeffrey Young, 47, Principal Executive Officer and President, February 2010 to present. | | Trustee, Valued Advisers Trust since June 2010; Senior Vice President, Huntington Asset Services, Inc. since January 2010; Chief Executive Officer, Huntington Funds since February 2010; President and Chief Executive Officer, Dreman Contrarian Funds since March 2011; Trustee, Valued Advisers Trust, August 2008 to January 2010; Managing Director and Chief Operating Officer of Professional Planning Consultants 2007 to 2010; Co-Founder of Kinwood Group, LLC July 2007 to March 2008; President and Chief Executive Officer of The Coventry Group from 2000 to 2007; President and Chief Executive Officer of the STI Classic Funds from 2004 to 2007; Trustee of the Coventry Group from 1999 to 2005; and Senior Vice President of BISYS Fund Services/The Winsbury Company October 1993 to June 2007. |
| |
| John C. Swhear, 50, Chief Compliance Officer, AML Officer and Vice President, August 2008 to present. | | Vice President of Legal Administration and Compliance for Huntington Asset Services, Inc., the Trust’s administrator, since April 2007; Chief Compliance Officer of Unified Financial Securities, Inc., the Trust’s distributor, since May 2007; Senior Vice President of the Unified Series Trust since May 2007; Secretary of Huntington Funds since April 2010; President and Chief Executive Officer of Dreman Contrarian Funds from March 2010 to March 2011, and Vice President and Acting Chief Executive Officer, 2007 to March 2010 ; Employed in various positions with American United Life Insurance Company from 1983 to April 2007, including: Associate General Counsel, April 2007; Investment Advisor Chief Compliance Officer, June 2004 to April 2007; Assistant Secretary to the Board of Directors, December 2002 to April 2007; Chief Compliance Officer of OneAmerica Funds, Inc., June 2004 to April 2007; Chief Counsel and Secretary, OneAmerica Securities, Inc., December 2002 to April 2007. |
| |
| Carol J. Highsmith, 47, Vice President, August 2008 to present. | | Employed in various positions with Huntington Asset Services, Inc., the Trust’s administrator, since November of 1994; currently Vice President of Legal Administration. |
| |
| Matthew J. Miller, 35, Vice President, December 2011 to present. | | Employed in various positions with Huntington Asset Services, Inc., the Trust’s administrator, since July of 1998; currently Vice President of Relationship Management; Vice President of Huntington Funds since February 2010. |
| |
William J. Murphy, 48, Treasurer, December 2009 to present | | Manager of Fund Administration for Huntington Asset Services, Inc., the Trust’s administrator, since October 2007; Assistant Treasurer of Unified Series Trust from February 2008 to May 2011; Treasurer and Chief Financial Officer of Dreman Contrarian Funds from February 2008 to March 2011; Employed in various positions with American United Life Insurance Company from March 1987 to October 2007. |
| |
John H. Lively, 43, Interim Secretary, September 2011 to present. | | Attorney, The Law Offices of John H. Lively & Associates, Inc., March, 2010 to present; Secretary of Dividend Growth Trust, September 2010 to present; Partner, Husch Blackwell Sanders LLP (law firm), March, 2007 to February, 2010; Managing Attorney, Raymond James Financial (financial services), September, 2005 to March, 2007. |
| * | The address for each trustee and officer is 2960 N. Meridian St., Suite 300, Indianapolis, IN 46208. |
| ** | The Trust consists of 10 series. |
OTHER INFORMATION
The Fund’s Statement of Additional Information (“SAI”) includes additional information about the trustees and is availablewithout charge, upon request. You may call toll-free at (866) 954-6682 to request a copy of the SAI or to make shareholder inquiries.
Management Agreement Renewal - (Unaudited)
At a meeting held on December 7, 2011, the Board of Trustees (the “Board”) considered the renewal of the Investment Advisory Agreement between the Trust and Golub Group, LLC (the “Adviser”). Legal Counsel noted that the 1940 Act requires the approval of the investment advisory agreement between the Trust and its investment advisor service providers by the Board, including a majority of the Independent Trustees. The Board then specifically discussed the arrangements between the Adviser and the Trust with respect to the Golub Fund. The Board reviewed a memorandum from Legal Counsel, and addressed to the Trustees that summarized, among other things, the fiduciary duties and responsibilities of the Board in reviewing and approving the renewal of the advisory agreement (“Advisory Agreement” solely for purposes of this section of the minutes). A copy of this memorandum was circulated to the Trustees in advance of the meeting. Legal Counsel discussed with the Trustees the types of information and factors that should be considered by the Board in order to make an informed decision regarding the approval of the renewal of the Advisory Agreement, including the following material factors: (i) the nature, extent, and quality of the services provided by the Adviser ; (ii) the investment performance of the Fund; (iii) the costs of the services to be provided and profits to be realized by the Adviser from the relationship with the Fund; (iv) the extent to which economies of scale would be realized if the Fund grows and whether advisory fee levels reflect those economies of scale for the benefit of the Fund’s investors; (v) The Adviser’s practices regarding brokerage and portfolio transactions; and (vi) The Fund’s practices regarding possible conflicts of interest.
In assessing these factors and reaching its decisions, the Board took into consideration information furnished for the Board’s review and consideration throughout the year at regular Board meetings, as well as information specifically requested and prepared and/or presented in connection with the annual renewal process, including information presented at the Meeting. The Board was provided with information and reports relevant to the annual renewal of the Advisory Agreement, including: (i) reports regarding the services and support provided to the Fund and its shareholders by the Adviser; (ii) quarterly assessments of the investment performance of the Fund by personnel of the Adviser; (iii) commentary on the reasons for the performance; (iv) presentations by the Adviser addressing the Adviser’s investment philosophy, investment strategy, personnel and operations; (v) compliance and audit reports concerning the Fund and the Adviser; (vi) disclosure information contained in the registration statement of the Trust with respect to the Fund and the Form ADV of the Adviser; (vii) information on relevant developments in the mutual fund industry and how the Fund and/or the Adviser are responding to them; and (viii) a memorandum from Counsel, that summarized the fiduciary duties and responsibilities of the Board in reviewing and approving the Advisory Agreement, including the material factors set forth above and the types of information included in each factor that should be considered by the Board in order to make an informed decision. The Board also requested and received various informational materials including, without limitation: (i) documents containing information about the Adviser, including financial information, a description of personnel and the services provided to the Fund, information on investment advice, performance, summaries of the Fund expenses, compliance program, current legal matters, and other general information; (ii) comparative expense and performance information for other mutual funds with strategies similar to the Fund; (iii) the anticipated effect of size on the Fund’s performance and expenses; and (iv) benefits to be realized by the Adviser from its relationship with the Fund. The Board did not identify any particular information that was most relevant to its consideration to approve the Agreement and each Trustee may have afforded different weight to the various factors.
In deciding whether to approve the agreement, the Trustees considered numerous factors, including the following:
| 1. | The nature, extent, and quality of the services to be provided by the Adviser. In this regard, the Board considered the Adviser’s responsibilities under the Advisory Agreement. The Trustees considered the services being provided by the Adviser to the Fund including, without limitation: the quality of its investment advisory services (including research and recommendations with respect to portfolio securities), its process for formulating investment recommendations and assuring compliance with the Fund’s investment objectives and limitations, its coordination of services for the Fund among the Fund’s service providers, and its efforts to promote the Fund and grow its assets. The Trustees considered the Adviser’s continuity of, and commitment to retain, qualified personnel and the Adviser’s commitment to maintain and enhance its resources and systems, the commitment of the Adviser’s personnel to finding alternatives and options that allow the Fund to maintain its goals, and the Fund’s continued cooperation with the Independent Trustees and Counsel for the Fund. The Trustees considered the Adviser’s personnel, including the education and experience of the Adviser’s personnel. After considering the foregoing |
Management Agreement Renewal - (Unaudited) - continued
| | information and further information in the Meeting materials provided by the Adviser (including the Adviser’s Form ADV), the Board concluded that, in light of all the facts and circumstances, the nature, extent, and quality of the services provided by the Adviser were satisfactory and adequate for the Fund. |
| 2. | Investment Performance of the Fund and the Adviser. In considering the investment performance of the Fund and the Adviser, the Trustees compared the short-term performance of the Fund with the performance of funds with similar objectives managed by other investment advisers, as well as with aggregated peer group data. The Trustees also considered the consistency of the Adviser’s management of the Fund with its investment objective, strategies, and limitations. The Trustees noted that the Fund’s performance was comparable to the performance of the Adviser’s composites for accounts managed similarly to the Fund based on recent data. The Trustees also compared the short-term performance of the Fund with the performance of its benchmark index, comparable funds with similar objectives managed by other investment advisers. The Trustees noted that the Fund’s performance, in the periods since the Fund’s inception, was better than some of its peers and worse than others, but generally comparable to most of its peers. After reviewing and discussing the investment performance of the Fund further, the Adviser’s experience managing the Fund, the Adviser’s historical performance, and other relevant factors, the Board concluded, in light of all the facts and circumstances, that the investment performance of the Fund and the Adviser was satisfactory. |
| 3. | The costs of the services to be provided and profits to be realized by the Adviser from the relationship with the Fund. In considering the costs of services to be provided and the profits to be realized by the Adviser from the relationship with the Fund, the Trustees considered: (1) the Adviser’s financial condition; (2) asset level of the Fund; (3) the overall expenses of the Fund; and (4) the nature and frequency of advisory fee payments. The Trustees reviewed information provided by the Adviser regarding its profits associated with managing the Fund. The Trustees also considered potential benefits for the Adviser in managing the Fund. The Trustees then compared the fees and expenses of the Fund (including the management fee) to other comparable mutual funds. The Trustees noted that the Fund’s management fee, while it was among the higher in its peer group, the net expense ratios were lower than the peer averages and median expense ratios as a result of the Adviser’s contractual commitment to limit the expenses of the Fund. Based on the foregoing, the Board concluded that the fees to be paid to the Adviser by the Fund and the profits to be realized by the Adviser, in light of all the facts and circumstances, were fair and reasonable in relation to the nature and quality of the services provided by the Adviser. |
| 4. | The extent to which economies of scale would be realized as the Fund grows and whether advisory fee levels reflect these economies of scale for the benefit of the Fund’s investors. In this regard, the Board considered the Fund’s fee arrangements with the Adviser. The Board considered that while the management fee remained the same at all asset levels, the Fund’s shareholders had experienced benefits from the Fund’s expense limitation arrangement. The Trustees noted that once the Fund’s expenses feel below the cap set by the arrangement, the Fund’s shareholders would continue to benefit from the economies of scale under the Fund’s agreements with service providers other than the Adviser. In light of its ongoing consideration of the Fund’s asset levels, expectations for growth in the Fund, and fee levels, the Board determined that the Fund’s fee arrangements, in light of all the facts and circumstances, were fair and reasonable in relation to the nature and quality of the services provided by the Adviser. |
| 5. | Possible conflicts of interest. In considering the Adviser’s practices regarding conflicts of interest, the Trustees evaluated the potential for conflicts of interest and considered such matters as the experience and ability of the advisory personnel assigned to the Fund; the basis of decisions to buy or sell securities for the Fund and/or the Adviser’s other accounts; and the substance and administration of the Adviser’s code of ethics. The Trustees also considered disclosure in the registration statement of the Trust relating to the Adviser’s potential conflicts of interest. Based on the foregoing, the Board determined that the Adviser’s standards and practices of the Adviser relating to the identification and mitigation of potential conflicts of interest were satisfactory. |
After additional consideration of the factors delineated in the memorandum provided by Legal Counsel and further discussion among the Board, the Board determined to renew the Investment Advisory Agreement between the Trust and the Adviser for one additional year.
PROXY VOTING
A description of the policies and procedures that the Fund uses to determine how to vote proxies relating to portfolio securities and information regarding how the Fund voted those proxies during the most recent twelve month period ended June 30, is available without charge upon request by (1) calling the Fund at (866) 954-6682 and (2) from Fund documents filed with the Securities and Exchange Commission (“SEC”) on the SEC’s website at www.sec.gov.
TRUSTEES
R. Jeffrey Young, Chairman
Dr. Merwyn R. Vanderlind
Ira Cohen
OFFICERS
R. Jeffrey Young, Principal Executive Officer and President
John C. Swhear, Chief Compliance Officer, AML Officer and Vice-President
Carol J. Highsmith, Vice President
Matthew J. Miller, Vice President
William J. Murphy, Principal Financial Officer and Treasurer
John H. Lively, Interim Secretary
INVESTMENT ADVISER
Golub Group, LLC
1850 Gateway Drive, Suite 600
San Mateo, CA 94404
DISTRIBUTOR
Unified Financial Securities, Inc.
2960 North Meridian Street, Suite 300
Indianapolis, IN 46208
INDEPENDENT REGISTERED PUBLIC ACCOUNTING FIRM
Cohen Fund Audit Services, Ltd.
800 Westpoint Pkwy., Suite 1100
Westlake, OH 44145
LEGAL COUNSEL
The Law Offices of John H. Lively & Associates, Inc.
A member firm of The 1940 Act Law GroupTM
2041 West 141st Terrace, Suite 119
Leawood, KS 66224
CUSTODIAN
Huntington National Bank
41 South High Street
Columbus, OH 43215
ADMINISTRATOR, TRANSFER AGENT AND FUND ACCOUNTANT
Huntington Asset Services, Inc.
2960 North Meridian Street, Suite 300
Indianapolis, IN 46208
This report is intended only for the information of shareholders or those who have received the Fund’s prospectus which contains information about the Fund’s management fee and expenses. Please read the prospectus carefully before investing.
Distributed by Unified Financial Securities, Inc.
Member FINRA/SIPC
ANNUAL REPORT
January 31, 2012

Angel Oak Multi-Strategy Income Fund
Angel Oak Capital Advisors, LLC
One Buckhead Plaza
3060 Peachtree Road NW, Suite 1080
Atlanta, GA 30305
(404) 953-4902
Dear Fellow Shareholders:
We are pleased to provide you with the Annual Report for the Angel Oak Multi-Strategy Income Fund for the fiscal period ended January 31, 2012. Angel Oak Capital has been managing fixed income portfolios within private funds and separately managed accounts for almost 4 years, and the Angel Oak Multi-Strategy Income Fund marked the launch of a similar investment strategy but within a mutual fund structure. Bringing this fund to market has given many investors the ability to access our investment strategy, specifically within the expertise of asset-backed securities (“ABS”). Contained in this year’s annual report is a discussion of the factors that affected fund performance during the period.
The objective of the fund is current income. The fund utilizes a relative value strategy to help achieve its primary objective. Currently, the investment focus is on the ABS market, specifically non-agency mortgage-backed securities. We believe this asset class possesses the highest risk-adjusted return potential currently in the fixed income space. Aside from a minor allocation to agency securities, the mutual fund is currently a long only, pure-play in non-agency residential mortgage-backed securities (“RMBS”) as of the end of the period.
For the fiscal period ended January 31, 2012, the total return (not including the deduction of applicable sales charges) for the Fund’s Class A Shares was 8.95%. A majority of the return was from price appreciation; even though not specifically an objective of the fund, this increase in prices was not surprising given the undervaluation of the asset class. The focus continues to remain on high income, distributed to investors on a monthly basis. During the initial ramp up period, net income has continued to increase and is now approaching its full potential.
Heading into the new year, we feel confident the fund is positioned for a strong 2012. Thank you for your interest and investment in the Angel Oak Multi-Strategy Income Fund.
Respectfully,
| | |
Brad Friedlander | | Ashish Negandhi |
Portfolio Manager | | Portfolio Manager |
1
Management’s Discussion of Fund Performance
Here at Angel Oak Capital, our investment management desk continuously sifts through the entire fixed income marketplace to find the most attractive investments on a risk-adjusted basis. Within this context, we reflect on past decisions in portfolio positioning, risk management, and the valuation of investment results. Passing along these reflections is a core pillar of ours in our continuously evolving investment process.
What drove fund performance in 2011 and how did the fund perform in relation to other asset classes and the fund’s benchmark?
Even though equity indexes ended the year near the flat-line, many investors would not consider 2011 a rather “boring” year. Prices across various asset classes were very volatile. “Risk-off” was the theme of the second half of 2011. Risk assets struggled as the European Debt Crisis overshadowed improving economic data and pushed risk assets lower. Even though macro-economic issues put pressure on RMBS prices, the growing dividend yield for the Fund helped offset those headwinds. Risk assets, including high-yield bonds and equities, began to appreciate in December which drove prices of non-agency RMBS higher as well. The combination of increasing economic conditions, illustrated in the stronger labor market, and increasing valuations in risk assets both contributed to portfolio prices in the Fund doing well into year-end.
For the fiscal period ended January 31, 2012, the fund outperformed the total return of the fund’s benchmark (Barclays Capital U.S. Aggregate Bond Index) by over 300 basis points.
What are Angel Oak Capital’s views on how interest rates and other factors affected performance over the prior year and how will those factors affect performance in 2012?
As we begin the new year, investors remain somewhat jaded from a volatile market environment after the U.S.’s debt rating has been downgraded by S&P, continued uncertainty in Europe, and interest rates at record lows. One year ago, the discussion across asset management desks appeared to be how to protect clients’ portfolios against rapidly rising interest rates; however, Treasury bond yields looked to go nowhere but south in 2011 with the 10 year and 30 year treasury yields both declining over 140 basis points; heighted market fears and “operation twist” combined to flatten the yield curve significantly during the second half of 2011.
With every new year, individuals like to bring new optimism and new cheer. However, markets do not seem to be pricing in this typically redundant positivity. Rates are still at record lows and equities remain basically flat from the year prior. In our view, the market is not catching up to the improving economic and fundamental data, which is reflected in consumer confidence figures returning to levels not seen since early 2009.
2
The unemployment rate is down to 8.5% from a peak of 10.0%. Private payrolls in December increased over 200 thousand and almost 1 million private jobs were created in the second half of 2011. With corporate balance sheets in pristine shape and banks at the lowest leverage levels since the 1990s, increasing business expansion by capital expenditures is very inexpensive and not constrained by corporate conditions. Improving labor market conditions and corporate health should set up well for a strong 2012 in equities, but what about fixed income?
Better corporate conditions and a freshly sharpened consumer is not just an equity market story, but also a bond market story, specifically in credit markets which have priced in a weaker economy in 2012. High yield sector spreads, as measured by the Barclays US Corp High Yield index, averaged 700 basis points at year-end, implying 5-6% defaults, which is a default rate significantly higher than historical standards. Barclays research predicts less than 3% default rates on high yield U.S. corporate companies in 2012. As the high yield sector looks cheap, the 7-9% yields are not loss-adjusted. On a loss-adjusted basis, high yield spreads are in the 3-5% range. This pales in comparison to the opportunities presented in structured fixed income, specifically non-agency RMBS, which is currently yielding 8-12% on a loss-adjusted basis. The opportunities in non-agency RMBS continue to be the main focus of the mutual fund for 2012 and we are positioned accordingly.
The views in the foregoing discussion were those of the Fund’s investment adviser as of the date set forth above and may not reflect its views on the date of this Annual Report is first published or anytime thereafter. These views are intended to assist shareholders in understanding their investment in the Fund and do not constitute investment advice.
3
Investment Results – (Unaudited)
Total Return*
(for the period ended January 31, 2012)
| | |
| | | Since Inception
(June 28, 2011) |
Angel Oak Multi-Strategy Income Fund, Class A, without load | | 8.95% |
Angel Oak Multi-Strategy Income Fund, Class A,
with load | | 2.69% |
Barclays Capital U.S. Aggregate Bond Index** | | 5.26% |
Total annual operating expenses, as estimated for the Fund’s Class A Shares first fiscal period ended January 31, 2012, as disclosed in the Fund’s prospectus, were 2.45% of average daily net assets (2.39% after fee waivers/expense reimbursements by the Adviser). The Adviser contractually has agreed to waive or limit its fees and assume other expenses of the Fund’s Class A Shares until May 31, 2013, so that total annual fund operating expenses do not exceed 2.00%. This operating expense limitation does not apply to brokerage fees and commissions, borrowing costs (such as interest and dividend expenses on securities sold short), taxes, 12b-1 fees, extraordinary expenses and indirect expenses (such as “acquired fund fees and expenses”).
The performance quoted represents past performance, which does not guarantee future results. The investment return and principal value of an investment will fluctuate so that an investor’s shares, when redeemed, may be worth more or less than their original cost. The returns shown do not reflect deduction of taxes that a shareholder would pay on Fund distributions or the redemption of Fund shares. The Fund’s investment objectives, risks, charges and expenses must be considered carefully before investing. Current performance of a Fund may be lower or higher than the performance quoted. Performance data current to the most recent month end may be obtained by calling 1-877-625-3042.
The performance above reflects any fee reductions during the applicable period. If such fee reductions had not occurred, the quoted performance would be lower.
* Return figures reflect any change in price per share and assume the reinvestment of all distributions. Total returns, with load, include the maximum 5.75% sales charge.
** The Barclays Capital U.S. Aggregate Bond Index is a widely recognized, unmanaged index of bond prices. Performance figures include the change in value of the bonds in the index and the reinvestment of interest. The index return does not reflect expenses, which have been deducted from the Fund’s return. Individuals cannot invest directly in an Index.
The Fund’s investment objective, strategies, risks, charges and expenses must be considered carefully before investing. The prospectus contains this and other important information about the investment company and may be obtained by calling 1-877-625-3042. Please read it carefully before investing. The Fund is distributed by Unified Financial Securities, Inc., Member FINRA.
4
Investment Results – (Unaudited) continued
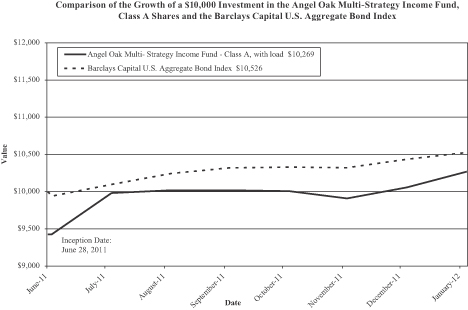
The chart above assumes an initial investment of $10,000 made on June 28, 2011 (commencement of operations) and held through January 31, 2012. THE FUND’S RETURN REPRESENTS PAST PERFORMANCE AND DOES NOT GUARANTEE FUTURE RESULTS. The returns shown do not reflect deduction of taxes that a shareholder would pay on the Fund’s distributions or the redemption of the Fund’s shares. Investment returns and principal values will fluctuate so that your shares, when redeemed, may be worth more or less than their original purchase price.
The Barclays Capital U.S. Aggregate Bond Index is a widely recognized, unmanaged index of bond prices. Performance figures include the change in value of the bonds in the index and the reinvestment of interest. The index return does not reflect expenses, which have been deducted from the Fund’s return. Individuals cannot invest directly in an Index; however, an individual can invest in exchange-traded funds or other investment vehicles that attempt to track the performance of a benchmark index.
Current performance may be lower or higher than the performance data quoted. For more information on the Fund, and to obtain performance data current to the most recent month-end, or to request a prospectus, please call 1-877-625-3042. You should carefully consider the investment objective, strategies, potential risks, management fees, and charges and expenses of the Fund before investing. The Fund’s prospectus contains this and other information about the Fund, and should be read carefully before investing.
The Fund is distributed by Unified Financial Securities, Inc., member FINRA.
5
PORTFOLIO HOLDINGS – (Unaudited)
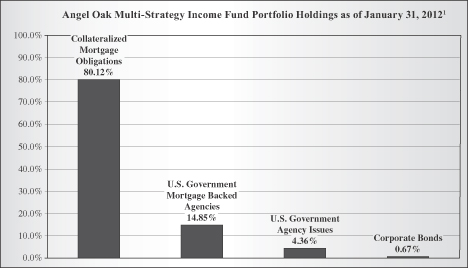
1 As a percentage of total investments.
The investment objective of the Angel Oak Multi-Strategy Income Fund is current income.
AVAILABILITY OF PORTFOLIO SCHEDULE – (Unaudited)
The Fund files its complete schedule of portfolio holdings with the Securities and Exchange Commission (“SEC”) for the first and third quarters of each fiscal year on Form N-Q. The Fund’s Forms N-Q are available at the SEC’s website at www.sec.gov. The Fund’s Forms N-Q may be reviewed and copied at the SEC’s Public Reference Room in Washington DC. Information on the operation of the Public Reference Room may be obtained by calling 1-800-SEC-0330.
SUMMARY OF FUND’S EXPENSES – (Unaudited)
As a shareholder of the Fund, you incur ongoing costs, including management fees and other Fund expenses. This Example is intended to help you understand your ongoing costs (in dollars) of investing in the Fund and to compare these costs with the ongoing costs of investing in other mutual funds. The Example is based on an investment of $1,000 invested at the beginning of the period, and held for the entire period from August 1, 2011 to January 31, 2012.
Actual Expenses
The first line of the table below provides information about actual account values and actual expenses. You may use the information in this line, together with the amount you invested, to estimate the expenses that you paid over the period. Simply divide your account value by $1,000 (for example, an $8,600 account value divided by
6
SUMMARY OF FUND’S EXPENSES – (Unaudited) (Continued)
$1,000 = $8.60), then multiply the result by the number in the first line under the heading entitled “Expenses Paid During the Period” to estimate the expenses you paid on your account during this period.
Hypothetical Example for Comparison Purposes
The second line of the table below provides information about hypothetical account values and hypothetical expenses based on the Fund’s actual expense ratio and an assumed rate of return of 5% per year before expenses, which is not the Fund’s actual return. The hypothetical account values and expenses may not be used to estimate the actual ending account balance or expenses you paid for the period. You may use this information to compare the ongoing costs of investing in the Fund and other funds. To do so, compare this 5% hypothetical example with the 5% hypothetical examples that appear in the shareholder reports of the other funds.
Please note that the expenses shown in the table are meant to highlight your ongoing costs only. Therefore, the second line of the table below is useful in comparing ongoing costs only and will not help you determine the relative costs of owning different funds.
| | | | | | | | | | | | |
Angel Oak Multi-Strategy
Income Fund, Class A | | Beginning
Account Value August 1, 2011 | | | Ending
Account Value January 31, 2012 | | | Expenses Paid During
the Period Ended January 31, 2012* | |
Actual | | $ | 1,000.00 | | | $ | 1,028.80 | | | $ | 11.51 | |
Hypothetical** | | $ | 1,000.00 | | | $ | 1,013.86 | | | $ | 11.42 | |
* Expenses are equal to the Fund’s annualized net expense ratio of 2.25%, excluding interest expense, multiplied by the average account value over the period, multiplied by 184/365.
** Assumes a 5% return before expenses.
7
Angel Oak Multi-Strategy Income Fund
Schedule of Investments
January 31, 2012
| | | | | | | | |
| | | Principal
Amount | | | Fair Value | |
| | | | | | | | |
Collateralized Mortgage Obligations – 92.14% | | | | | | | | |
Adjustable Rate Mortgage Trust., Series 2005-8, Class 4A11, 5.274%, 11/25/2035 (a) | | $ | 715,765 | | | $ | 552,697 | |
Bank of America Mortgage Securities, Inc., Series 2005-I, Class 2A3, 2.732%, 10/25/2035 (a) | | | 18,726 | | | | 18,083 | |
Bear Stearns Adjustable Rate Mortgage Trust, Series 2005-1, Class 4A1, 5.230%, 3/25/2035 (a) | | | 70,340 | | | | 63,754 | |
CountryWide Home Loans, Series 2003-52, Class A1, 2.667%, 2/19/2034 (a) | | | 98,042 | | | | 85,899 | |
CountryWide Alternative Loan Trust, Series 2005-J6, Class 1A1, 0.776%, 7/25/2035 (a) | | | 2,131,707 | | | | 1,472,072 | |
CountryWide Alternative Loan Trust, Series 2005-28CB, Class 3A5, 6.000%, 8/25/2035 | | | 1,666,424 | | | | 1,463,480 | |
CountryWide Home Loans, Series 2005-HYB6, Class 4A1B, 5.207%, 10/20/2035 (a) | | | 133,869 | | | | 94,420 | |
Chase Mortgage Finance Corporation, Series 2005-A1, Class 3A1, 5.139%, 12/25/2035 (a) | | | 181,720 | | | | 159,372 | |
Citigroup Mortgage Loan Trust, Inc., Series 2005-7, Class 2A2A, 5.386%, 9/25/2035 (a)(b) | | | 2,394,974 | | | | 1,817,332 | |
First Horizon Alternative Mortgage Securities Trust, Series 2005-FA5, Class 3A1, 5.500%, 8/25/2035 | | | 302,577 | | | | 247,792 | |
First Horizon Alternative Mortgage Securities Trust, Series 2005-FA8, Class 1A18, 5.500%, 11/25/2035 | | | 14,984 | | | | 12,184 | |
First Horizon Mortgage Pass-Through Trust, Series 2005-5, Class 1A2, 5.500%, 10/25/2035 | | | 436,726 | | | | 297,196 | |
GMAC Mortgage Corporation Loan Trust, Series 2005-AR2, Class 4A, 4.955%, 5/25/2035 (a) | | | 1,466,914 | | | | 1,305,122 | |
GMAC Mortgage Corporation Loan Trust, Series 2005-AR6, Class 4A1, 5.267%, 11/19/2035 (a) | | | 627,786 | | | | 566,369 | |
GSR Mortgage Loan Trust, Series 2005-AR7, Class 5A1, 5.165%, 11/25/2035 (a)(b) | | | 2,502,870 | | | | 2,086,909 | |
GSR Mortgage Loan Trust, Series 2006-AR1, Class 3A1, 5.024%, 1/25/2036 (a) | | | 1,488,770 | | | | 1,259,456 | |
IMPAC CMB Trust, Series 2004-6, Class 1A3, 1.256%, 10/25/2034 (a)(b) | | | 1,823,127 | | | | 1,190,291 | |
INDYMAC Index Mortgage Loan Trust, Series 2004-AR8, Class 2A2A, 1.076%, 11/25/2034 (a) | | | 1,687,647 | | | | 1,074,718 | |
See accompanying notes which are an integral part of these financial statements.
8
Angel Oak Multi-Strategy Income Fund
Schedule of Investments – (continued)
January 31, 2012
| | | | | | | | |
| | | Principal
Amount | | | Fair Value | |
| | | | | | | | |
Collateralized Mortgage Obligations – (continued) | | | | | | | | |
JP Morgan Mortgage Trust, Series 2005-A1, Class 1A1, 5.195%, 2/25/2035 (a) | | $ | 1,575,864 | | | $ | 1,516,648 | |
JP Morgan Mortgage Trust, Series 2006-A3, Class 7A1, 2.817%, 4/25/2035 (a)(b) | | | 1,355,715 | | | | 1,137,279 | |
JP Morgan Mortgage Trust, Series 2005-A8, Class 1A1, 5.397%, 11/25/2035 (a) | | | 1,783,652 | | | | 1,599,664 | |
MASTR Adjustable Rate Mortgages Trust, Series 2004-15, Class 2A2, 2.814%, 12/25/2034 (a) | | | 67,700 | | | | 42,234 | |
Merrill Lynch Mortgage Investors Trust, Series 2005-A7, Class 2A1, 5.254%, 9/25/2035 (a) | | | 1,297,499 | | | | 1,120,084 | |
Residential Accredit Loans, Inc., Series 2005-QS17, Class A10, 6.000%, 12/25/2035 | | | 33,169 | | | | 23,078 | |
Residential Funding Mortgage Securities I, Inc., Series 2005-SA3, Class 3A, 5.248%, 8/25/2035 (a) | | | 814,780 | | | | 635,298 | |
Structured Asset Securities Corporation, Series 2005-1, Class 7A6, 5.500%, 2/25/2035 | | | 1,472,869 | | | | 1,018,241 | |
Structured Asset Securities Corporation, Series 2003-6A, Class 2A1, 5.422%, 3/25/2033 (a) | | | 141,638 | | | | 132,963 | |
Washington Mutual Mortgage Pass-Through Certificates, Series 2005-AR17, Class A1B2, 0.686%, 12/25/2045 (a) | | | 751,323 | | | | 437,470 | |
Wells Fargo Mortgage Backed Securities Trust, Series 2005-AR2, Class 3A1, 3.469%, 3/25/2035 (a) | | | 518,445 | | | | 482,956 | |
Wells Fargo Mortgage Backed Securities Trust, Series 2005-AR14, Class A4, 5.350%, 8/25/2035 (a) | | | 200,000 | | | | 189,636 | |
Wells Fargo Mortgage Backed Securities Trust, Series 2005-AR15, Class 1A2, 5.035%, 9/25/2035 (a) | | | 1,461,785 | | | | 1,254,873 | |
Wells Fargo Mortgage Backed Securities Trust, Series 2005-AR16, Class 7A1, 5.203%, 10/25/2035 (a) | | | 725,000 | | | | 675,611 | |
Wells Fargo Mortgage Backed Securities Trust, Series 2006-AR6, Class 7A1, 5.046%, 3/25/2036 (a) | | | 168,858 | | | | 158,688 | |
| | | | | | | | |
| TOTAL COLLATERALIZED MORTGAGE OBLIGATIONS (Cost $24,033,882) | | | | 24,191,869 | |
| | | | | | | | |
See accompanying notes which are an integral part of these financial statements.
9
Angel Oak Multi-Strategy Income Fund
Schedule of Investments – (continued)
January 31, 2012
| | | | | | | | |
| | | Principal
Amount | | | Fair Value | |
| | | | | | | | |
U.S. Government Mortgage Backed Agencies – 17.08% | |
Federal Home Loan Mortgage Corporation – 3.66% | | | | | | | | |
Pool# G08360, 4.000%, 8/1/2039 | | $ | 422,681 | | | $ | 446,424 | |
Pool# Q04086, 3.500%, 10/1/2041 | | | 495,184 | | | | 514,178 | |
| | | | | | | | |
| | | | | | | 960,602 | |
| | | | | | | | |
| | |
Federal National Mortgage Association – 13.42% | | | | | | | | |
Pool# AH6420, 3.500%, 2/1/2041 | | | 1,438,554 | | | | 1,496,615 | |
Pool# AH6972, 3.500%, 2/1/2026 | | | 449,350 | | | | 473,546 | |
Pool# MA0932, 3.500%, 12/1/2041 (b) | | | 1,492,679 | | | | 1,552,925 | |
| | | | | | | | |
| | | | | | | 3,523,086 | |
| | | | | | | | |
| |
| TOTAL U.S. GOVERNMENT MORTGAGE BACKED AGENCIES (Cost $4,386,648) | | | | 4,483,688 | |
| | | | | | | | |
| | |
U.S. Government Agency Issues – 5.01% | | | | | | | | |
Federal National Mortgage Association 5.01% | | | | | | | | |
1.250%, 9/28/2016 | | | 1,300,000 | | | | 1,316,182 | |
| | | | | | | | |
| | |
TOTAL U.S. GOVERNMENT AGENCY ISSUES
(Cost $1,297,651) | | | | | | | 1,316,182 | |
| | | | | | | | |
| | |
Corporate Bonds – 0.78% | | | | | | | | |
Financials – 0.78% | | | | | | | | |
JP Morgan Chase Capital XXV, 6.800%, 10/1/2037 | | | 200,000 | | | | 203,773 | |
| | | | | | | | |
| | |
TOTAL CORPORATE BONDS (Cost $200,233) | | | | | | | 203,773 | |
| | | | | | | | |
| | |
| TOTAL INVESTMENTS (Cost $29,918,414) – 115.01% | | | | | | $ | 30,195,512 | |
| | | | | | | | |
| | |
Liabilities in excess of other assets – (15.01)% | | | | | | | (3,940,183 | ) |
| | | | | | | | |
| | |
TOTAL NET ASSETS – 100.00% | | | | | | $ | 26,255,329 | |
| | | | | | | | |
| (a) | Variable rate security. Rate disclosed is as of January 31, 2012. |
| (b) | All or a portion of security has been pledged as collateral in connection with open reverse repurchase agreements. |
See accompanying notes which are an integral part of these financial statements.
10
Angel Oak Multi-Strategy Income Fund
Schedule of Investments – (continued)
January 31, 2012
Reverse repurchase agreements outstanding as of January 31, 2012 were as follows:
| | | | | | | | | | | | | | | | | | | | |
Counterparty | | Interest
Rate | | | Trade Date | | | Maturity Date | | | Net Closing
Amount | | | Face Amount | |
| | | | | |
Cantor Fitzgerald & Company | | | 0.450 | % | | | 1/11/2012 | | | | 2/10/2012 | | | $ | 1,335,501 | | | $ | 1,335,000 | |
Guggenheim Partners, LLC | | | 1.800 | % | | | 1/17/2012 | | | | 2/14/2012 | | | | 938,312 | | | | 937,000 | |
Wells Fargo Securities, LLC | | | 1.773 | % | | | 1/27/2012 | | | | 2/27/2012 | | | | 1,323,017 | | | | 1,321,000 | |
UBS AG | | | 2.020 | % | | | 1/23/2012 | | | | 2/22/2012 | | | | 709,296 | | | | 708,104 | |
UBS AG | | | 2.040 | % | | | 1/3/2012 | | | | 2/2/2012 | | | | 1,033,951 | | | | 1,032,196 | |
| | | | | | | | | | | | | | | | | | | | |
Total | | | | | | | | | | | | | | | | | | $ | 5,333,300 | |
| | | | | | | | | | | | | | | | | | | | |
A reverse repurchase agreement, although structured as a sale and repurchase obligation, acts as a financing transaction under which the Fund will effectively pledge certain assets as collateral to secure a short-term loan. Generally the other party to the agreement makes the loan in an amount less than 100% of the fair value of the pledged collateral. At the maturity of the reverse repurchase agreement, the Fund will be required to repay the loan and interest and correspondingly receive back its collateral. While used as collateral, the pledged assets continue to pay principal and interest which are for the benefit of the Fund.
See accompanying notes which are an integral part of these financial statements.
11
Angel Oak Multi-Strategy Income Fund
Statement of Assets and Liabilities
January 31, 2012
| | | | |
Assets | | | | |
Investments in securities, at fair value (cost $29,918,414) | | $ | 30,195,512 | |
Cash | | | 598,067 | |
Receivable for fund shares sold | | | 354,946 | |
Receivable for investments sold | | | 465,714 | |
Interest receivable | | | 125,241 | |
Prepaid expenses | | | 19,338 | |
Deferred offering expense | | | 20,101 | |
| | | | |
Total assets | | | 31,778,919 | |
| | | | |
| |
Liabilities | | | | |
Payable to Adviser | | | 17,564 | |
Payable for reverse repurchase agreements | | | 5,333,300 | |
Payable for fund shares redeemed | | | 29,464 | |
Payable for investments purchased | | | 94,752 | |
Payable to administrator, fund accountant, and transfer agent | | | 16,672 | |
Payable to trustees and officers | | | 1,851 | |
Payable to custodian | | | 2,821 | |
Interest payable for reverse repurchase agreements | | | 3,107 | |
12b-1 fees accrued | | | 5,497 | |
Other accrued expenses | | | 18,562 | |
| | | | |
Total liabilities | | | 5,523,590 | |
| | | | |
Net Assets | | $ | 26,255,329 | |
| | | | |
| |
Net Assets consist of: | | | | |
Paid in capital | | $ | 25,842,676 | |
Accumulated net investment income | | | 118,414 | |
Accumulated net realized gain from investment transactions | | | 17,141 | |
Net unrealized appreciation on investments | | | 277,098 | |
| | | | |
Net Assets | | $ | 26,255,329 | |
| | | | |
| |
Shares Outstanding (unlimited number of shares authorized, no par value) | | | 2,460,411 | |
| | | | |
| |
Net Asset Value Per Share: | | $ | 10.67 | |
| | | | |
| |
Offering Price Per Share (100%/(100%-maximum sales charge)
of net asset value adjusted to the nearest cent): | | $ | 11.32 | |
| | | | |
| |
Maximum Sales Charge: | | | 5.75 | % |
| | | | |
See accompanying notes which are an integral part of these financial statements.
12
Angel Oak Multi-Strategy Income Fund
Statement of Operations
For the period ended January 31, 2012 (a)
| | | | |
Investment Income | | | | |
Interest income | | $ | 841,327 | |
| | | | |
Total Investment Income | | | 841,327 | |
| | | | |
| |
Expenses | | | | |
Investment Adviser fee | | | 161,857 | |
12b-1 fees | | | 26,976 | |
Administration expenses | | | 22,187 | |
Fund accounting expenses | | | 14,791 | |
Transfer agent expenses | | | 40,149 | |
Legal expenses | | | 9,790 | |
Registration expenses | | | 909 | |
Custodian expenses | | | 7,601 | |
Audit expenses | | | 15,000 | |
Trustee expenses | | | 3,059 | |
Insurance expenses | | | 1,319 | |
Pricing expenses | | | 1,750 | |
Report printing expense | | | 5,780 | |
Offering expense | | | 21,433 | |
Organizational expense | | | 8,825 | |
24f-2 expense | | | 2,451 | |
Miscellaneous expenses | | | 1,600 | |
Interest on reverse repurchase agreements | | | 21,696 | |
Other expenses – overdraft fee | | | 193 | |
| | | | |
Total Expenses | | | 367,366 | |
Fees waived and reimbursed by Adviser | | | (100,940 | ) |
| | | | |
Net operating expenses | | | 266,426 | |
| | | | |
Net Investment Income | | | 574,901 | |
| | | | |
| |
Realized & Unrealized Gain on Investments | | | | |
Net realized gain on investment transactions | | | 20,670 | |
Net change in unrealized appreciation of investments | | | 277,098 | |
| | | | |
Net realized and unrealized gain on investments | | | 297,768 | |
| | | | |
Net increase in net assets resulting from operations | | $ | 872,669 | |
| | | | |
| (a) | For the period June 28, 2011 (commencement of operations) to January 31, 2012. |
See accompanying notes which are an integral part of these financial statements.
13
Angel Oak Multi-Strategy Income Fund
Statement of Cash Flows
For the period ended January 31, 2012 (a)
| | | | |
Increase/(Decrease) in Cash | | | | |
Cash flows from operating activities: | | | | |
Net increase in net assets resulting from operations | | $ | 872,669 | |
Adjustments to reconcile net increase in net assets from operations to net cash used in operating activities: | | | | |
Accretion of discount/amortization of premium, net | | | (39,529 | ) |
Purchase of long-term securities | | | (33,465,157 | ) |
Proceeds from sales of long-term securities | | | 3,913,278 | |
Increase in interest receivable | | | (125,241 | ) |
Increase in receivable for investments sold | | | (465,714 | ) |
Increase in prepaid expenses | | | (19,338 | ) |
Increase in deferred offering expense | | | (20,101 | ) |
Increase in payable to Adviser | | | 17,564 | |
Increase in payable for investments purchased | | | 94,752 | |
Increase in interest payable for reverse repurchase agreements | | | 3,107 | |
Increase in accrued expenses and expenses payable | | | 45,403 | |
Net realized gain on investment securities | | | (20,670 | ) |
Net gains on paydowns of mortgage-backed securities | | | (306,336 | ) |
Change in unrealized appreciation on investments | | | (277,098 | ) |
| | | | |
Net cash used in operating activities | | | (29,792,411 | ) |
| | | | |
Cash flows from financing activities: | | | | |
Increase in payable for reverse repurchase agreements | | | 5,333,300 | |
Proceeds from shares sold | | | 36,040,626 | |
Amount paid for shares redeemed | | | (10,957,975 | ) |
Cash distributions paid | | | (25,473 | ) |
| | | | |
Net cash provided from financing activities | | | 30,390,478 | |
| | | | |
Net change in cash | | $ | 598,067 | |
Cash balance beginning of period | | $ | – | |
| | | | |
Cash balance end of period | | $ | 598,067 | |
| | | | |
Non cash financing activities not included herein consist of receivable for fund shares sold of $354,946, payable for fund shares redeemed of $29,464, and reinvestment of distributions of $455,976.
| (a) | For the period June 28, 2011 (commencement of operations) to January 31, 2012. |
| | | | | | |
Supplemental Information |
Interest paid | | $ | 18,589 | | | |
See accompanying notes which are an integral part of these financial statements.
14
Angel Oak Multi-Strategy Income Fund
Statement of Changes In Net Assets
| | | | |
| | | Period Ended
January 31,
2012 (a) | |
Increase to Net Assets due to: | | | | |
Operations | | | | |
Net investment income | | $ | 574,901 | |
Net realized gain on investment transactions | | | 20,670 | |
Net change in unrealized appreciation of investments | | | 277,098 | |
| | | | |
Net increase in net assets resulting from operations | | | 872,669 | |
| | | | |
Distributions | | | | |
From net investment income | | | (481,449 | ) |
| | | | |
Total distributions | | | (481,449 | ) |
| | | | |
Capital Transactions | | | | |
Proceeds from shares sold | | | 36,395,572 | |
Reinvestment of distributions | | | 455,976 | |
Amount paid for shares redeemed | | | (10,987,439 | ) |
| | | | |
Net increase in net assets resulting from capital transactions | | | 25,864,109 | |
| | | | |
Total Increase in Net Assets | | | 26,255,329 | |
| | | | |
Net Assets | | | | |
Beginning of period | | | – | |
| | | | |
End of period | | $ | 26,255,329 | |
| | | | |
Accumulated net investment income included in net assets at end of period | | $ | 118,414 | |
| | | | |
Share Transactions | | | | |
Shares sold | | | 3,460,685 | |
Shares issued in reinvestment of distributions | | | 43,557 | |
Shares redeemed | | | (1,043,831 | ) |
| | | | |
Net increase from share transactions | | | 2,460,411 | |
| | | | |
| (a) | For the period June 28, 2011 (commencement of operations) to January 31, 2012. |
See accompanying notes which are an integral part of these financial statements.
15
Angel Oak Multi-Strategy Income Fund
Financial Highlights
(For a share outstanding during the period)
| | | | |
| Class A: | | For the
Period Ended
January 31, 2012 (a) | |
Selected Per Share Data: | | | | |
Net asset value, beginning of period | | $ | 10.00 | |
| | | | |
Income from investment operations: | | | | |
Net investment income | | | 0.26 | |
Net realized and unrealized gain on investments | | | 0.63 | (b) |
| | | | |
Total from investment operations | | | 0.89 | |
| | | | |
Less distributions to shareholders: | | | | |
From net investment income | | | (0.22 | ) |
From net realized gains | | | – | |
| | | | |
Total distributions | | | (0.22 | ) |
| | | | |
Net asset value, end of period | | $ | 10.67 | |
| | | | |
Total Return (c) | | | 8.95 | % (d) |
| |
Ratios and Supplemental Data: | | | | |
Net assets, end of period (000) | | $ | 26,255 | |
Ratio of expenses to average net assets (e) | | | 2.45 | % (f) |
Ratio of expenses to average net assets before waiver and reimbursement (g) | | | 3.38 | % (f) |
Ratio of net investment income to average net assets | | | 5.29 | % (f) |
Ratio of net investment income to average net assets before waiver and reimbursement | | | 4.36 | % (f) |
Portfolio turnover rate | | | 17.85 | % (d) |
| (a) | For the period June 28, 2011 (commencement of operations) to January 31, 2012. |
| (b) | Realized and unrealized gains and losses per share in this caption are balancing amounts necessary to reconcile the change in net asset value per share for the period, and may not reconcile with the aggregate gains and losses in the Statement of Operations due to share transactions for the period. |
| (c) | Total return in the above table represents the rate that the investor would have earned or lost on an investment in the Fund, assuming reinvestment of dividends. Excludes sales charge. |
| (e) | Ratio includes interest expense. Had there been no interest expense, the ratio would have been 2.25%. |
| (g) | Ratio includes interest expense. Had there been no interest expense, the ratio would have been 3.18%. |
See accompanying notes which are an integral part of these financial statements.
16
Angel Oak Multi-Strategy Income Fund
Notes to the Financial Statements
January 31, 2012
NOTE 1. ORGANIZATION
The Angel Oak Multi-Strategy Income Fund (the “Fund”) is an open-end non-diversified series of the Valued Advisers Trust (the “Trust”). The Trust is a management investment company established under the laws of Delaware by an Agreement and Declaration of Trust dated June 13, 2008 (the “Trust Agreement”). The Trust Agreement permits the Trustees to issue an unlimited number of shares of beneficial interest of separate series without par value. The Fund is one of a series of funds authorized by the Trustees. The Fund’s investment adviser is Angel Oak Capital Advisors, LLC (the “Adviser”). The investment objective of the Fund is current income.
The Fund offers two share classes, Class A and Class C. Class A shares commenced operations on June 28, 2011, Class C shares have not yet commenced operations. Each share represents an equal proportionate interest in the assets and liabilities belonging to the Fund and is entitled to such dividends and distributions out of income belonging to the Fund as are declared by the Board. Class A currently has a maximum sales charge on purchases of 5.75% as a percentage of the original purchase price. Class C does not have an initial sales charge on purchases. The dealer of record receives a payment from the Fund’s distributor of 1.00% of the amount you invest in Class C shares. If you redeem your Class C shares within one year of purchase, you will be subject to a 1.00% contingent deferred sales charge (“CDSC”), based on the lower of the shares’ cost or current net asset value. Any shares acquired by reinvestment of distributions will be redeemed without a CDSC.
NOTE 2. SIGNIFICANT ACCOUNTING POLICIES
The following is a summary of significant accounting policies consistently followed by the Fund in the preparation of its financial statements. These policies are in conformity with the generally accepted accounting principles in the United States of America (“GAAP”).
Securities Valuation – All investments in securities are recorded at their estimated fair value as described in Note 3.
Federal Income Taxes – The Fund selected a tax year end of February 29, 2012; however, the tax information presented in this report is as of January 31, 2012. The Fund makes no provision for federal income or excise tax. The Fund intends to qualify each year as a regulated investment company (“RIC”) under subchapter M of the Internal Revenue Code of 1986, as amended, by complying with the requirements applicable to RICs and by distributing substantially all of its taxable income. The Fund
17
Angel Oak Multi-Strategy Income Fund
Notes to the Financial Statements - (continued)
January 31, 2012
NOTE 2. SIGNIFICANT ACCOUNTING POLICIES - (continued)
also intends to distribute sufficient net investment income and net capital gains, if any, so that it will not be subject to excise tax on undistributed income and gains. If the required amount of net investment income or gains is not distributed, the Fund could incur a tax expense.
As of and during the period ended January 31, 2012, the Fund did not have a liability for any unrecognized tax benefits. The Fund recognizes interest and penalties, if any, related to unrecognized tax benefits as income tax expense in the statement of operations. During the period, the Fund did not incur any interest or penalties. The Fund is subject to examination by U.S. federal tax authorities for all tax years since inception.
Expenses – Expenses incurred by the Trust that do not relate to a specific fund of the Trust are allocated to the individual funds based on each fund’s relative net assets or another appropriate basis (as determined by the Trustees). Expenses attributable to any class are borne by that class. Income, realized gains and losses, unrealized appreciation and depreciation, and expenses are allocated to each class based on the net assets in relation to the relative net assets of the Fund.
Security Transactions and Related Income – The Fund follows industry practice and records security transactions on the trade date. The specific identification method is used for determining gains or losses for financial statement and income tax purposes. Dividend income is recorded on the ex-dividend date and interest income is recorded on an accrual basis. Discounts and premiums on securities purchased are accreted or amortized using the effective interest method. The ability of issuers of debt securities held by the Fund to meet their obligations may be affected by economic and political developments in a specific country or region.
Dividends and Distributions – The Fund intends to distribute substantially all of its net investment income, if any, as dividends to its shareholders on at least an annual basis. The Fund intends to distribute its net realized long term capital gains and its net realized short term capital gains, if any, at least once a year. Dividends to shareholders, which are determined in accordance with income tax regulations, are recorded on the ex-dividend date. The treatment for financial reporting purposes of distributions made to shareholders during the period from net investment income or net realized capital gains may differ from their ultimate treatment for federal income tax purposes. These differences are caused primarily by differences in the timing of the recognition of certain components of income, expense or realized capital gain for federal income tax
18
Angel Oak Multi-Strategy Income Fund
Notes to the Financial Statements - (continued)
January 31, 2012
NOTE 2. SIGNIFICANT ACCOUNTING POLICIES - (continued)
purposes. Where such differences are permanent in nature, they are reclassified in the components of the net assets based on their ultimate characterization for federal income tax purposes. Any such reclassifications will have no effect on net assets, results of operations or net asset values per share of the Fund. There were no such material reclassifications made as of January 31, 2012.
Reverse Repurchase Agreements – A reverse repurchase agreement is the sale by the Fund of a security to a party for a specified price, with the simultaneous agreement by the Fund to repurchase that security from that party on a future date at a higher price. Securities sold under reverse repurchase agreements are reflected as a liability on the Statements of Assets and Liabilities. Interest payments made are recorded as a component of interest expense on the Statements of Operations. Reverse repurchase agreements involve the risk that the counterparty will become subject to bankruptcy or other insolvency proceedings or fail to return the pledged collateral to the Fund. In such situations, the Fund may incur losses while the Fund seeks to enforce its rights, a possible lack of access to income on the underlying security during this period, or expenses of enforcing its rights.
NOTE 3. SECURITIES VALUATION AND FAIR VALUE MEASUREMENTS
Fair value is defined as the price that a Fund would receive upon selling an investment in a timely transaction to an independent buyer in the principal or most advantageous market of the investment. GAAP establishes a three-tier hierarchy to maximize the use of observable market data and minimize the use of unobservable inputs and to establish classification of fair value measurements for disclosure purposes.
Inputs refer broadly to the assumptions that market participants would use in pricing the asset or liability, including assumptions about risk (the risk inherent in a particular valuation technique used to measure fair value, such as pricing models and/or the risk inherent in the inputs to the valuation technique). Inputs may be observable or unobservable. Observable inputs are inputs that reflect the assumptions market participants would use in pricing the asset or liability developed based on market data obtained from sources independent of the reporting entity. Unobservable inputs are inputs that reflect the reporting entity’s own assumptions about the assumptions market participants would use in pricing the asset or liability developed based on the best information available in the circumstances.
19
Angel Oak Multi-Strategy Income Fund
Notes to the Financial Statements - (continued)
January 31, 2012
NOTE 3. SECURITIES VALUATION AND FAIR VALUE MEASUREMENTS - (continued)
Various inputs are used in determining the value of the Fund’s investments. These inputs are summarized in the three broad levels listed below.
| | • | | Level 1 – quoted prices in active markets for identical securities |
| | • | | Level 2 – other significant observable inputs (including, but not limited to, quoted prices for an identical security in an inactive market, quoted prices for similar securities, interest rates, prepayment speeds, credit risk, etc.) |
| | • | | Level 3 – significant unobservable inputs (including the Fund’s own assumptions in determining fair value of investments based on the best information available) |
The inputs used to measure fair value may fall into different levels of the fair value hierarchy. In such cases, for disclosure purposes, the level in the fair value hierarchy within which the fair value measurement falls in its entirety is determined based on the level input that is most significant to the fair value measurement in its entirety.
Equity securities are generally valued by using market quotations, but may be valued on the basis of prices furnished by a pricing service when the Fund believes such prices more accurately reflect the fair value of such securities. Securities that are traded on any stock exchange are generally valued by the pricing service at the last quoted sale price. Lacking a last sale price, an exchange traded security is generally valued by the pricing service at its last bid price. Securities traded in the NASDAQ over-the-counter market are generally valued by the pricing service at the NASDAQ Official Closing Price. When using the market quotations or close prices provided by the pricing service and when the market is considered active, the security will be classified as a Level 1 security. Sometimes, an equity security owned by the Fund will be valued by the pricing service with factors other than market quotations or when the market is considered inactive. When this happens, the security will be classified as a Level 2 security. When market quotations are not readily available, when the Fund determines that the market quotation or the price provided by the pricing service does not accurately reflect the current fair value, or when certain restricted or illiquid securities are being valued, such securities are valued as determined in good faith by the Fund, in conformity with guidelines adopted by and subject to review by the Board of Trustees (the “Board”). These securities will be categorized as Level 3 securities.
Investments in mutual funds, including money market mutual funds, are generally priced at the ending net asset value (“NAV”) provided by the service agent of the funds. These securities will be categorized as Level 1 securities.
20
Angel Oak Multi-Strategy Income Fund
Notes to the Financial Statements - (continued)
January 31, 2012
NOTE 3. SECURITIES VALUATION AND FAIR VALUE MEASUREMENTS - (continued)
Fixed income securities, including collateralized mortgage obligations, U.S government mortgage-backed agencies, U.S. government agency issues and corporate bonds, when valued using market quotations in an active market, will be categorized as Level 1 securities. However, they may be valued on the basis of prices furnished by a pricing service when the Fund believes such prices more accurately reflect the fair value of such securities. A pricing service utilizes electronic data processing techniques based on yield spreads relating to securities with similar characteristics to determine prices for normal institutional-size trading units of debt securities without regard to sale or bid prices. For collateralized mortgage obligations and mortgage-backed securities, the pricing service may also use prepayment speeds, consideration of collateral, unemployment rates, credit risk, foreclosures, and liquidations. These securities will generally be categorized as Level 2 securities. If the Fund decides that a price provided by the pricing service does not accurately reflect the fair value of the securities, when prices are not readily available from a pricing service, or when restricted or illiquid securities are being valued, securities are valued at fair value as determined in good faith by the Fund, in conformity with guidelines adopted by and subject to review of the Board. These securities will be categorized as Level 3 securities.
Short-term investments in fixed income securities, (those with maturities of less than 60 days when acquired, or which subsequently are within 60 days of maturity), are valued by using the amortized cost method of valuation, which the Board has determined will represent fair value. These securities will be classified as Level 2 securities.
In accordance with the Trust’s good faith pricing guidelines, the Fund is required to consider all appropriate factors relevant to the value of securities for which it has determined other pricing sources are not available or reliable as described above. No single standard exists for determining fair value, because fair value depends upon the circumstances of each individual case. As a general principle, the current fair value of an issue of securities being valued by the Fund would appear to be the amount which the owner might reasonably expect to receive for them upon their current sale. Methods which are in accordance with this principle may, for example, be based on (i) a multiple of earnings; (ii) a discount from market of a similar freely traded security (including a derivative security or a basket of securities traded on other markets, exchanges or among dealers); or (iii) yield to maturity with respect to debt issues, or a combination of these and other methods. Good faith pricing is permitted if, in the Fund’s opinion, the validity of market quotations appears to be questionable based on factors such as evidence of a thin market in the security based on a small number of quotations, a significant event occurs after the close of a market but before a Fund’s NAV calculation that may affect a security’s value, or the Fund is aware of any other
21
Angel Oak Multi-Strategy Income Fund
Notes to the Financial Statements - (continued)
January 31, 2012
NOTE 3. SECURITIES VALUATION AND FAIR VALUE MEASUREMENTS - (continued)
data that calls into question the reliability of market quotations. Good faith pricing may also be used in instances when the bonds the Fund invests in may default or otherwise cease to have market quotations readily available. Any fair valuation pricing done outside the Fund’s approved pricing methods must be approved by the Pricing Committee of the Board.
The following is a summary of the inputs used to value the Fund’s investments as of January 31, 2012:
| | | | | | | | | | | | | | | | |
| | | Valuation Inputs | |
| Assets | | Level 1 - Quoted
Prices in Active
Markets | | | Level 2 - Other
Significant
Observable Inputs | | | Level 3 -
Significant
Unobservable
Inputs | | | Total | |
| Collateralized Mortgage Obligations | | $ | – | | | $ | 24,191,869 | | | $ | – | | | $ | 24,191,869 | |
| U.S. Government Mortgage-Backed Agencies | | | – | | | | 4,483,688 | | | | – | | | $ | 4,483,688 | |
| U.S. Government Agency Issues | | | – | | | | 1,316,182 | | | | – | | | $ | 1,316,182 | |
| Corporate Bonds | | | – | | | | 203,773 | | | | – | | | $ | 203,773 | |
| Total | | $ | – | | | $ | 30,195,512 | | | $ | – | | | $ | 30,195,512 | |
Liabilities | | | | | | | | | | | | | | | | |
| Reverse Repurchase Agreements | | $ | – | | | $ | (5,333,300 | ) | | $ | – | | | $ | (5,333,300 | ) |
The Fund did not hold any investments at any time during the reporting period in which significant unobservable inputs were used in determining fair value; therefore, no reconciliation of Level 3 securities is included for this reporting period. The Fund did not hold any derivative instruments during the reporting period. The Trust recognizes significant transfers between fair value hierarchy levels at the reporting period end. There were no significant transfers between any Levels for the period ended January 31, 2012.
NOTE 4. FEES AND OTHER TRANSACTIONS WITH AFFILIATES
Under the terms of the management agreement, on behalf of the Fund (the “Agreement”), the Adviser manages the Fund’s investments subject to oversight of the Trustees. As compensation for its management services, the Fund is obligated to pay the Adviser a fee computed and accrued daily and paid monthly at an annual rate of 1.50%
22
Angel Oak Multi-Strategy Income Fund
Notes to the Financial Statements - (continued)
January 31, 2012
NOTE 4. FEES AND OTHER TRANSACTIONS WITH AFFILIATES - (continued)
of the average daily net assets of the Fund on the first $200 million in assets, 1.25% for the next $300 million in assets and 1.00% for any assets in excess of $500 million. For the period from June 28, 2011 (commencement of operations) to January 31, 2012, the Adviser earned a fee of $161,857 from the Fund before the reimbursement described below. At January 31, 2012, the Fund owed the Adviser $17,564.
The Adviser has contractually agreed to waive or limit its fees and to assume other expenses of the Fund until May 31, 2013, so that Total Annual Fund Operating Expenses does not exceed 2.00%. This operating expense limitation does not apply to brokerage fees and commissions, borrowing costs (such as interest and dividend expenses on securities sold short), taxes, 12b-1 fees; extraordinary expenses and indirect expenses (such as “acquired funds fees and expenses”). For the period from June 28, 2011 (commencement of operations) to January 31, 2012, the Adviser waived fees and reimbursed expenses of $100,940 to the Fund.
The waiver and/or reimbursement by the Adviser with respect to the Fund is subject to repayment by the Fund within the three fiscal years following the fiscal year in which that particular waiver and/or reimbursement occurred, provided that the Fund is able to make the repayment without exceeding the expense limitations described above. Fees waived during the period from June 28, 2011 (commencement of operations) to January 31, 2012, totaling $100,940 may be subject to potential recoupment by the Adviser until January 31, 2015.
The Trust retains Huntington Asset Services, Inc. (“HASI”) to manage the Fund’s business affairs and provide the Fund with administrative services, including all regulatory reporting and necessary office equipment and personnel. For the period from June 28, 2011 (commencement of operations) to January 31, 2012, HASI earned fees of $22,187 for administrative services provided to the Fund. At January 31, 2012, HASI was owed $6,250 from the Fund for administrative services. Certain officers of the Trust are members of management and/or employees of HASI. HASI is a wholly-owned subsidiary of Huntington Bancshares, Inc., the parent company of Unified Financial Securities, Inc. (the “Distributor”) and Huntington National Bank, the custodian of the Fund’s investments (the “Custodian”). For the period from June 28, 2011 (commencement of operations) to January 31, 2012, the Custodian earned fees of $7,601 for custody services provided to the Fund. At January 31, 2012, the Custodian was owed $2,821 from the Fund for custody services.
The Trust also retains HASI to act as the Fund’s transfer agent and to provide fund accounting services. For the period from June 28, 2011 (commencement of operations)
23
Angel Oak Multi-Strategy Income Fund
Notes to the Financial Statements - (continued)
January 31, 2012
NOTE 4. FEES AND OTHER TRANSACTIONS WITH AFFILIATES - (continued)
to January 31, 2012, HASI earned fees of $40,149 for transfer agent services and reimbursement for out-of-pocket expenses incurred in providing transfer agent services to the Fund. At January 31, 2012, the Fund owed HASI $6,256 for transfer agent services and out-of-pocket expenses.
For the period from June 28, 2011 (commencement of operations) to January 31, 2012, HASI earned fees of $14,791 from the Fund for fund accounting services. At January 31, 2012, HASI was owed $4,166 from the Fund for fund accounting services.
The Fund has adopted a Distribution Plan (the “Plan”) pursuant to Rule 12b-1 under the 1940 Act. The Plan provides that the Fund will pay the Distributor and/or any registered securities dealer, financial institution or any other person (the “Recipient”) a shareholder servicing fee of 0.25% (Class A shares) and 1.00% (Class C shares) of each share classes’ respective average daily net assets of the Fund in connection with the promotion and distribution of the Fund’s shares or the provision of personal services to shareholders, including, but not necessarily limited to, advertising, compensation to underwriters, dealers and selling personnel, the printing and mailing of prospectuses to other than current Fund shareholders, the printing and mailing of sales literature and servicing shareholder accounts. The Fund or Adviser may pay all or a portion of these fees to any Recipient who renders assistance in distributing or promoting the sale of shares, or who provides certain shareholder services, pursuant to a written agreement. The Plan is a compensation plan, which means that compensation is provided regardless of 12b-1 expenses actually incurred. It is anticipated that the Plan will benefit shareholders because an effective sales program typically is necessary in order for the Fund to reach and maintain a sufficient size to achieve efficiently its investment objectives and to realize economies of scale. For the period June 28, 2011 (commencement of operations) to January 31, 2012, the Class A shares 12b-1 expense incurred by the Fund was $26,976. The Fund owed $5,497 for Class A shares 12b-1 fees as of January 31, 2012. There were no class C shares 12b-1 fees during the period as this class has not yet commenced operations.
Unified Financial Securities, Inc. (“Unified”) acts as the principal distributor of the Fund’s shares. An officer of the Trust is an officer of the Distributor and such person may be deemed to be an affiliate of the Distributor. For the period ended January 31, 2012, the Distributor received commissions of $7,273 earned on sales of Class A shares. There were no CDSC fees deducted from the redemption of capital shares.
The Law Offices of John H. Lively and Associates, Inc., a member firm of The 1940 Act Law GroupTM, serves as legal counsel to the Trust. John H. Lively, Interim
24
Angel Oak Multi-Strategy Income Fund
Notes to the Financial Statements - (continued)
January 31, 2012
NOTE 4. FEES AND OTHER TRANSACTIONS WITH AFFILIATES - (continued)
Secretary of the Trust, is the owner of The Law Offices of John H. Lively & Associates, Inc., but he receives no direct compensation from the Trust or the Fund for serving as an officer of the Trust.
NOTE 5. PURCHASES AND SALES OF SECURITIES
For the period ended January 31, 2012, purchases and sales of investment securities, other than short-term investments and short-term U.S. government obligations, were as follows:
| | | | | | | | |
| | | Purchases | | | Sales | |
U.S. Government Obligations | | $ | – | | | $ | – | |
Other | | | 33,465,157 | | | | 3,913,278 | |
At January 31, 2012, the net unrealized appreciation (depreciation) of investments for tax purposes was as follows:
| | | | |
Gross Unrealized Appreciation | | $ | 829,570 | |
Gross Unrealized (Depreciation) | | | (552,472 | ) |
| | | | |
Net Unrealized Appreciation on Investments | | $ | 277,098 | |
| | | | |
At January 31, 2012, the aggregate cost of securities, excluding U.S. government obligations, for federal income tax purposes was $29,918,414 for the Fund.
NOTE 6. ESTIMATES
The preparation of financial statements in conformity with GAAP requires management to make estimates and assumptions that affect the reported amounts of assets and liabilities and disclosure of contingent assets and liabilities at the date of the financial statements and the reported amounts of increases and decreases in net assets from operations during the reporting period. Actual results could differ from those estimates.
NOTE 7. BENEFICIAL OWNERSHIP
The beneficial ownership, either directly or indirectly, of 25% or more of the voting securities of a fund (or class) creates a presumption of control of the fund (or class), under Section 2(a) (9) of the Investment Company Act of 1940. At January 31, 2012, TD Ameritrade, Inc., for the benefit of its customers, held 52% of the voting securities of Class A shares. Thus, TD Ameritrade may be deemed to control the Fund.
25
Angel Oak Multi-Strategy Income Fund
Notes to the Financial Statements - (continued)
January 31, 2012
NOTE 8. DISTRIBUTIONS TO SHAREHOLDERS
The Fund paid the following income distributions to Class A shareholders for the period ended January 31, 2012:
| | | | | | |
Record Date | | Ex-Dividend Date | | Per Share
Amount | |
August 31, 2011 | | September 1, 2011 | | $ | 0.0100 | |
September 30, 2011 | | October 3, 2011 | | $ | 0.0470 | |
October 31, 2011 | | November 1, 2011 | | $ | 0.0575 | |
November 30, 2011 | | December 1, 2011 | | $ | 0.0482 | |
December 29, 2011 | | January 3, 2012 | | $ | 0.0566 | |
The Fund paid the following income distributions to Class A shareholders subsequent to January 31, 2012:
| | | | | | |
Record Date | | Ex-Dividend Date | | Per Share
Amount | |
January 31, 2012 | | February 1, 2012 | | $ | 0.0552 | |
February 29, 2012 | | March 1, 2012 | | $ | 0.0640 | |
The tax character of distributions paid for the fiscal period ended January 31, 2012 is as follows:
| | | | |
| | | 2012 | |
Distributions paid from: | | | | |
Ordinary Income | | $ | 481,449 | |
| | | | |
| | $ | 481,449 | |
| | | | |
At January 31, 2012, the components of distributable earnings (accumulated losses) on a tax basis were as follows:
| | | | |
Undistributed ordinary income | | $ | 139,210 | |
Other accumulated differences | | | (3,655 | ) |
Unrealized appreciation | | | 277,098 | |
| | | | |
| | $ | 412,653 | |
| | | | |
At January 31, 2012, other accumulated differences related to the difference in the treatment of organizational costs incurred by the Fund.
26
Angel Oak Multi-Strategy Income Fund
Notes to the Financial Statements - (continued)
January 31, 2012
NOTE 9. COMMITMENTS AND CONTINGENCIES
The Fund indemnifies its officers and trustees for certain liabilities that may arise from performance of their duties to the Fund. Additionally, in the normal course of business, the Fund enters into contracts that contain a variety of representatives and warranties which provide general indemnifications. The Fund’s maximum exposure under these arrangements is unknown, as this would involve future claims that may be made against the Fund that have not yet occurred.
NOTE 10. SUBSEQUENT EVENT
Class C shares commenced operations on March 14, 2012.
27
REPORT OF INDEPENDENT REGISTERED PUBLIC ACCOUNTING FIRM
To the Shareholders and Board of Trustees
Angel Oak Multi-Strategy Income Fund
We have audited the accompanying statement of assets and liabilities, including the schedule of investments, of Angel Oak Multi-Strategy Income Fund (the “Fund”) as of January 31, 2012, and the related statements of operations, changes in net assets, cash flows, and the financial highlights for the period June 28, 2011 (commencement of operations), through January 31, 2012. These financial statements and financial highlights are the responsibility of Fund management. Our responsibility is to express an opinion on these financial statements and financial highlights based on our audit.
We conducted our audit in accordance with the standards of the Public Company Accounting Oversight Board (United States). Those standards require that we plan and perform the audit to obtain reasonable assurance about whether the financial statements and financial highlights are free of material misstatement. An audit includes examining, on a test basis, evidence supporting the amounts and disclosures in the financial statements. Our procedures included confirmation of securities owned as of January 31, 2012 by correspondence with the custodian and brokers or by other appropriate auditing procedures where replies from brokers were not received. An audit also includes assessing the accounting principles used and significant estimates made by management, as well as evaluating the overall financial statement presentation. We believe that our audit provides a reasonable basis for our opinion.
In our opinion, the financial statements and financial highlights referred to above present fairly, in all material respects, the financial position of the Angel Oak Multi-Strategy Income Fund as of January 31, 2012, the results of its operations, changes in its net assets, and its cash flows and the financial highlights for the period June 28, 2011 (commencement of operations), through January 31, 2012, in conformity with accounting principles generally accepted in the United States of America.
COHEN FUND AUDIT SERVICES, LTD.
Westlake, Ohio
April 2, 2012
28
TRUSTEES AND OFFICERS – (Unaudited)
The Board of Trustees supervises the business activities of the Trust. Each Trustee serves as a trustee until termination of the Trust unless the Trustee dies, resigns, retires or is removed.
The following tables provide information regarding the Trustees and Officers.
The following table provides information regarding each of the Independent Trustees.
| | |
Name, Address*, (Age), Position with Trust**,
Term of Position with Trust | | Principal Occupation During Past 5 Years and
Other Directorships |
| Dr. Merwyn R. Vanderlind, 75, Independent Trustee, August 2008 to present. | | Retired; Consultant to Battelle Memorial Institute (International Science and Technology Research Enterprise) on business investments from 2001 to 2003; Formerly employed with Battelle Memorial Institute from 1966 to 2003 in various positions, including the Executive Vice President of Battelle Institute from 1991 to 2001, General Manager from 1985 to 1991, Director of the Battelle Industrial Technology Center (Geneva, Switzerland) from 1983 to 1985, and Practicing Researcher from 1966 to 1983. |
Ira Cohen, 52
Independent Trustee, June 2010 to present. | | Independent financial services consultant (Feb. 2005 - present); Senior Vice President, Dealer Services / Institutional Services, AIM Investment Services, Inc. (1992 – 2005). |
| * | The address for each trustee and officer is 2960 N. Meridian St., Suite 300, Indianapolis, IN 46208. |
| ** | The Trust consists of 10 series. |
29
The following table provides information regarding the Trustee who is considered an “interested person” of the Trust, as that term is defined under the 1940 Act. Based on the experience of the Trustee, the Trust concluded that the individual described below should serve as a Trustee.
| | |
Name, Address*, (Age), Position with Trust**,
Term of Position with Trust | | Principal Occupation During Past 5 Years and
Other Directorships |
| R. Jeffrey Young, 47, Trustee and Chairman, June 2010 to present. | | Principal Executive Officer and President, Valued Advisers Trust since February 2010; Senior Vice President, Huntington Asset Services, Inc. since January 2010; Chief Executive Officer, Huntington Funds since February 2010; President and Chief Executive Officer, Dreman Contrarian Funds since March 2011; Trustee, Valued Advisers Trust, August 2008 to January 2010; Managing Director and Chief Operating Officer of Professional Planning Consultants 2007 to 2010; Co-Founder of Kinwood Group, LLC July 2007 to March 2008; President and Chief Executive Officer of The Coventry Group from 2000 to 2007; President and Chief Executive Officer of the STI Classic Funds from 2004 to 2007; Trustee of the Coventry Group from 1999 to 2005; and Senior Vice President of BISYS Fund Services / The Winsbury Company October 1993 to June 2007. |
| * | The address for each trustee and officer is 2960 N. Meridian St., Suite 300, Indianapolis, IN 46208. |
| ** | The Trust consists of 10 series. |
30
The following table provides information regarding the Officers of the Trust:
| | |
Name, Address*, (Age), Position with Trust,**
Term of Position with Trust | | Principal Occupation During Past 5 Years and
Other Directorships |
| R. Jeffrey Young, 47, Principal Executive Officer and President, February 2010 to present. | | Trustee, Valued Advisers Trust since June 2010; Senior Vice President, Huntington Asset Services, Inc. since January 2010; Chief Executive Officer, Huntington Funds since February 2010; President and Chief Executive Officer, Dreman Contrarian Funds since March 2011; Trustee, Valued Advisers Trust, August 2008 to January 2010; Managing Director and Chief Operating Officer of Professional Planning Consultants 2007 to 2010; Co-Founder of Kinwood Group, LLC July 2007 to March 2008; President and Chief Executive Officer of The Coventry Group from 2000 to 2007; President and Chief Executive Officer of the STI Classic Funds from 2004 to 2007; Trustee of the Coventry Group from 1999 to 2005; and Senior Vice President of BISYS Fund Services/The Winsbury Company October 1993 to June 2007. |
31
| | |
Name, Address*, (Age), Position with Trust,**
Term of Position with Trust | | Principal Occupation During Past 5 Years and
Other Directorships |
| John C. Swhear, 50, Chief Compliance Officer, AML Officer and Vice President, August 2008 to present. | | Vice President of Legal Administration and Compliance for Huntington Asset Services, Inc., the Trust’s administrator, since April 2007; Chief Compliance Officer of Unified Financial Securities, Inc., the Trust’s distributor, since May 2007; Senior Vice President of the Unified Series Trust since May 2007; Secretary of Huntington Funds since April 2010; President and Chief Executive Officer of Dreman Contrarian Funds from March 2010 to March 2011, and Vice President and Acting Chief Executive Officer, 2007 to March 2010 ; Employed in various positions with American United Life Insurance Company from 1983 to April 2007, including: Associate General Counsel, April 2007; Investment Advisor Chief Compliance Officer, June 2004 to April 2007; Assistant Secretary to the Board of Directors, December 2002 to April 2007; Chief Compliance Officer of OneAmerica Funds, Inc., June 2004 to April 2007; Chief Counsel and Secretary, OneAmerica Securities, Inc., December 2002 to April 2007. |
| Carol J. Highsmith, 47, Vice President, August 2008 to present. | | Employed in various positions with Huntington Asset Services, Inc., the Trust’s administrator, since November of 1994; currently Vice President of Legal Administration; Assistant Secretary of AmericaFirst Quantitative Funds since February 2012. |
| Matthew J. Miller, 35, Vice President, December 2011 to present. | | Employed in various positions with Huntington Asset Services, Inc., the Trust’s administrator, since July of 1998; currently Vice President of Relationship Management; Vice President of AmericaFirst Quantitative Funds since February 2012; Vice President of Huntington Funds since February 2010. |
32
| | |
Name, Address*, (Age), Position with Trust,**
Term of Position with Trust | | Principal Occupation During Past 5 Years and
Other Directorships |
| William J. Murphy, 48, Treasurer, December 2009 to present | | Manager of Fund Administration for Huntington Asset Services, Inc., the Trust’s administrator, since October 2007; Assistant Treasurer of Unified Series Trust from February 2008 to May 2011; Treasurer and Chief Financial Officer of Dreman Contrarian Funds from February 2008 to March 2011; Employed in various positions with American United Life Insurance Company from March 1987 to October 2007. |
John H. Lively, 43,
Interim Secretary, September 2011 to present. | | Attorney, The Law Offices of John H. Lively & Associates, Inc., March, 2010 to present; Secretary of Dividend Growth Trust, September 2010 to present; Partner, Husch Blackwell Sanders LLP (law firm), March, 2007 to February, 2010; Managing Attorney, Raymond James Financial (financial services), September, 2005 to March, 2007. |
| * | The address for each trustee and officer is 2960 N. Meridian St., Suite 300, Indianapolis, IN 46208. |
| ** | The Trust consists of 10 series. |
OTHER INFORMATION
The Fund’s Statement of Additional Information (“SAI”) includes additional information about the trustees and is available without charge, upon request. You may call toll-free at (877) 625-3042 to request a copy of the SAI or to make shareholder inquiries.
33
PROXY VOTING
A description of the policies and procedures that the Fund uses to determine how to vote proxies relating to portfolio securities and information regarding how the Funds voted those proxies during the most recent twelve month period ended June 30, is available without charge upon request by (1) calling the Fund at (877) 625-3042 and (2) from Fund documents filed with the Securities and Exchange Commission (“SEC”) on the SEC’s website at www.sec.gov.
TRUSTEES
R. Jeffrey Young, Chairman
Dr. Merwyn R. Vanderlind
Ira Cohen
OFFICERS
R. Jeffrey Young, Principal Executive Officer and President
John C. Swhear, Chief Compliance Officer, AML Officer and Vice-President
Carol J. Highsmith, Vice President
Matthew J. Miller, Vice President
William J. Murphy, Principal Financial Officer and Treasurer
John H. Lively, Interim Secretary
INVESTMENT ADVISER
Angel Oak Capital Advisors, LLC
One Buckhead Plaza
3060 Peachtree Road NW
Suite 1080
Atlanta, GA 30305
DISTRIBUTOR
Unified Financial Securities, Inc.
2960 North Meridian Street, Suite 300
Indianapolis, IN 46208
INDEPENDENT REGISTERED PUBLIC ACCOUNTING FIRM
Cohen Fund Audit Services, Ltd.
800 Westpoint Pkwy., Suite 1100
Westlake, OH 44145
LEGAL COUNSEL
The Law Offices of John H. Lively & Associates, Inc.
A member firm of The 1940 Act Law GroupTM
2041 West 141st Terrace, Suite 119
Leawood, KS 66224
CUSTODIAN
Huntington National Bank
41 South High Street
Columbus, OH 43215
ADMINISTRATOR, TRANSFER AGENT AND FUND ACCOUNTANT
Huntington Asset Services, Inc.
2960 North Meridian Street, Suite 300
Indianapolis, IN 46208
This report is intended only for the information of shareholders or those who have received the Fund’s prospectus which contains information about the Fund’s management fee and expenses. Please read the prospectus carefully before investing.
Distributed by Unified Financial Securities, Inc.
Member FINRA/SIPC
Item 2. Code of Ethics.
As of the end of the period covered by this report, the registrant has adopted a code of ethics that applies to the registrant’s principal executive officer, principal financial officer, principal accounting officer or controller, or persons performing similar functions, regardless of whether these individuals are employed by the registrant or a third party. Pursuant to Item 12(a)(1), a copy of registrant’s code of ethics is filed as an exhibit to this Form N-CSR. During the period covered by this report, the code of ethics has not been amended, and the registrant has not granted any waivers, including implicit waivers, from the provisions of the code of ethics.
Item 3. Audit Committee Financial Expert.
(a) The registrant’s board of trustees has determined that the registrant does not have an audit committee financial expert. The committee members and the full Board considered a possibility of adding a member that would qualify as an expert. The audit committee determined that, although none of its members meet the technical definition of an audit committee expert, the committee has sufficient financial expertise to adequately perform its duties under the Audit Committee Charter without the addition of a qualified expert.
Item 4. Principal Accountant Fees and Services.
| | | | | | |
| Registrant | | | | |
| The Golub Group Equity Fund: | | FY 2012 | | $ | 12,500 | |
| | FY 2011 | | $ | 13,500 | |
| The Angel Oak Multi-Strategy Income Fund: | | FY 2012 | | $ | 12,500 | |
| | FY 2011 | | | NA | |
| | | | | | |
| Registrant | | | | |
| The Golub Group Equity Fund: | | FY 2012 | | $ | 0 | |
| | FY 2011 | | $ | 0 | |
| The Angel Oak Multi-Strategy Income Fund: | | FY 2012 | | $ | 0 | |
| | FY 2011 | | | NA | |
| | | | | | |
| Registrant | | | | |
| The Golub Group Equity Fund: | | FY 2012 | | $ | 2,500 | |
| | FY 2011 | | $ | 2,000 | |
| The Angel Oak Multi-Strategy Income Fund: | | FY 2012 | | $ | 2,500 | |
| | FY 2011 | | | NA | |
Nature of the fees: Preparation of the 1120 RIC and Excise review
| | | | | | |
| Registrant | | | | |
| The Golub Group Equity Fund: | | FY 2012 | | $ | 0 | |
| | FY 2011 | | $ | 0 | |
| The Angel Oak Multi-Strategy Income Fund: | | FY 2012 | | $ | 0 | |
| | FY 2011 | | | NA | |
Nature of the fees:
-2-
| | | | |
| (e) | | (1) | | Audit Committee’s Pre-Approval Policies |
| | |
| | | | The Audit Committee Charter requires the Audit Committee to be responsible for the selection, retention or termination of auditors and, in connection therewith, to (i) evaluate the proposed fees and other compensation, if any, to be paid to the auditors, (ii) evaluate the independence of the auditors, (iii) pre-approve all audit services and, when appropriate, any non-audit services provided by the independent auditors to the Trust, (iv) pre-approve, when appropriate, any non-audit services provided by the independent auditors to the Trust’s investment adviser, or any entity controlling, controlled by, or under common control with the investment adviser and that provides ongoing services to the Trust if the engagement relates directly to the operations and financial reporting of the Trust, and (v) receive the auditors’ specific representations as to their independence; |
| | |
| | (2) | | Percentages of Services Approved by the Audit Committee |
Registrant
| | | | |
Audit-Related Fees: | | | 0 | % |
Tax Fees: | | | 0 | % |
All Other Fees: | | | 0 | % |
(f) During audit of registrant’s financial statements for the most recent fiscal year, less than 50 percent of the hours expended on the principal accountant’s engagement were attributed to work performed by persons other than the principal accountant’s full-time, permanent employees.
(g) The aggregate non-audit fees billed by the registrant’s accountant for services rendered to the registrant, and rendered to the registrant’s investment adviser (not including any sub-adviser whose role is primarily portfolio management and is subcontracted with or overseen by another investment adviser), and any entity controlling, controlled by, or under common control with the adviser that provides ongoing services to the registrant:
| | | | | | | | |
| | | Registrant | | | Adviser | |
FY 2012 | | $ | 0 | | | $ | 0 | |
FY 2011 | | | NA | | | | NA | |
(h) Not applicable. The auditor performed no services for the registrant’s investment adviser or any entity controlling, controlled by, or under common control with the investment adviser that provides ongoing services to the registrant.
Item 5. Audit Committee of Listed Companies. NOT APPLICABLE – applies to listed companies only
Item 6. Schedule of Investments. Schedule filed with Item 1.
Item 7. Disclosure of Proxy Voting Policies and Procedures for Closed-End Management Investment Companies. NOT APPLICABLE – applies to closed-end funds only
-3-
Item 8. Portfolio Managers of Closed-End Investment Companies. NOT APPLICABLE – applies to closed-end funds only
Item 9. Purchases of Equity Securities by Closed-End Management Investment Company and Affiliated Purchasers. NOT APPLICABLE – applies to closed-end funds only
Item 10. Submission of Matters to a Vote of Security Holders.
The guidelines applicable to shareholders desiring to submit recommendations for nominees to the Registrant’s board of trustees are contained in the statement of additional information of the Trust with respect to the Fund(s) for which this Form N-CSR is being filed.
Item 11. Controls and Procedures.
(a) Based on their evaluation of the registrant’s disclosure controls and procedures (as defined in Rule 30a-3(c) under the Investment Company Act of 1940, as amended (the “Act”)) as of a date within 90 days of the filing date of this report, the registrant’s principal executive officer and principal financial officer have concluded that such disclosure controls and procedures are reasonably designed and are operating effectively to ensure that material information relating to the registrant is made known to them by others within those entities, particularly during the period in which this report is being prepared, and that the information required in filings on Form N-CSR is recorded, processed, summarized, and reported on a timely basis.
(b) There were no changes in the registrant’s internal control over financial reporting (as defined in Rule 30a-3(d) under the Investment Company Act of 1940) that occurred during the second fiscal quarter of the period covered by this report that have materially affected, or are reasonably likely to materially affect, the registrant’s internal control over financial reporting.
Item 12. Exhibits.
| | | | |
| (a) | | (1) | | Code is filed herewith. |
| | |
| | (2) | | Certifications by the registrant’s principal executive officer and principal financial officer, pursuant to Section 302 of the Sarbanes- Oxley Act of 2002 and required by Rule 30a-2under the Investment Company Act of 1940 are filed herewith. |
| | |
| | (3) | | Not Applicable |
| | |
| (b) | | | | Certification pursuant to 18 U.S.C. Section 1350, as adopted pursuant to Section 906 of the Sarbanes-Oxley Act of 2002 is filed herewith. |
-4-
SIGNATURES
Pursuant to the requirements of the Securities Exchange Act of 1934 and the Investment Company Act of 1940, the registrant has duly caused this report to be signed on its behalf by the undersigned, thereunto duly authorized.
(Registrant) Valued Advisers Trust
| | |
| |
| By | | /S/ R. JEFFREY YOUNG |
| | R. Jeffrey Young, President and Principal Executive Officer |
Date 3/30/12
Pursuant to the requirements of the Securities Exchange Act of 1934 and the Investment Company Act of 1940, this report has been signed below by the following persons on behalf of the registrant and in the capacities and on the dates indicated.
| | |
| |
| By | | /S/ R. JEFFREY YOUNG |
| | R. Jeffrey Young, President and Principal Executive Officer |
Date 3/30/12
| | |
| |
| By | | /S/ WILLIAM J. MURPHY |
| | William J. Murphy, Treasurer and Principal Financial Officer |
Date 3/30/12