UNITED STATES
SECURITIES AND EXCHANGE COMMISSION
WASHINGTON, D.C. 20549
FORM N-CSR
CERTIFIED SHAREHOLDER REPORT OF REGISTERED
MANAGEMENT INVESTMENT COMPANIES
Investment Company Act file number 811-22208
Valued Advisers Trust
(Exact name of registrant as specified in charter)
|
| Huntington Asset Services, Inc. 2960 N. Meridian Street, Suite 300 Indianapolis, IN 46208 |
| (Address of principal executive offices) (Zip code) |
Capitol Services, Inc.
615 S. Dupont Hwy.
Dover, DE 19901
(Name and address of agent for service)
With a copy to:
John H. Lively, Esq.
The Law Offices of John H. Lively & Associates, Inc.
A member firm of The 1940 Act Law Group
2041 W. 141st Terrace
Suite 119
Leawood, KS 66224
Registrant’s telephone number, including area code: 317-917-7000
Date of fiscal year end: 1/31
Date of reporting period: 1/31/13
Item 1. Reports to Stockholders.

Golub Group Equity Fund
Annual Report
January 31, 2013
Fund Adviser:
Golub Group, LLC
1850 Gateway Drive, Suite 100
San Mateo, CA 94404
Toll Free (866) 954-6682
TO OUR FELLOW SHAREHOLDERS:
“When everybody knows something, nobody knows nothing.” - Andy Grove, founder Intel Corporation
Many investors missed a year of positive stock market returns (the fourth year in a row) as they remained fixated on the daily news flow coming out of Washington and braced themselves for a plunge over the fiscal cliff. As usual, Congress waited till the last moment and avoided a crisis by passing a stop gap measure.
The events of the past year reinforced a fundamental belief we hold with regards to investing which is best understood through a quote attributed to Andy Grove, founder of Intel Corporation, which states, “When everybody knows something, nobody knows nothing.”
Everybody “knew” that stocks should be avoided due to the myriad of issues overhanging the markets. Wall Street predictors were bearish at the beginning of 2012, focusing their concerns on the European debt crisis, the upcoming U.S. Presidential election, and the U.S. fiscal cliff that they felt would lead to a major market sell-off. Despite what most people believed, the market responded with its best first quarter in 14 years and continued to build on those gains and ended up with a 16% annual total return for the S&P 500.
Our experience has shown that as long-term investors, we are best served focusing on the fundamentals and valuations of the individual companies we own, as opposed to the “noise” of the day. This is especially important to keep in mind now, since many of the issues that investors were so worried about are still present. Washington must still address several issues such as the spending cuts (sequestration) delayed until March, the debt ceiling, which was reached in December, and the 2013 fiscal budget, which still needs to be approved. With all of these issues unresolved, we anticipate more of the same this year, with many investors fixated on Washington, as opposed to taking advantage of the opportunity currently presenting itself in high-quality stocks.
“Those that cannot remember the past are condemned to repeat it.” George Santayana, 20th Century Philosopher
History has shown that investors are best served by focusing on the fundamentals of the businesses owned and the economies they operate in. As we stated in December, we are confident that the U.S. economy will continue its steady return to growth anchored by an improving labor market, a broadening housing recovery, increased strength in manufacturing, higher energy exports and improved consumer balance sheets. The latest economic data for December reinforces our confidence. The payroll report shows that 168,000 new jobs were added last month and the Institute of Supply Management (ISM) report, which provides insight into business activity, showed the highest reading since February. And even though the market was up 16% for the year, valuations remain attractive, both well-below historical averages and particularly attractive when compared to the alternative opportunities in cash and fixed income.
1
New Additions
In an effort to bolster our resources to focus on what matters (fundamentals and valuations), we have added two experienced professionals to our research team, both of which are CFA charter holders.
Michael Kon, CFA joins us from Morningstar Inc., in Chicago where he was a Senior Equity Analyst for the past six years. In 2011, Michael was recognized as a “Best on the Street” award winner for his coverage of the Financial Services sector. Prior to Morningstar, Michael was an Equity Analyst covering Telecom, Cable and Wireless companies for CIBC World Markets. Michael received his MBA from McGill University in 2004 and graduated at the top of his class.
Matt Gordon, CFA joins us from Chordant Capital Partners, a healthcare-focused investment firm based in Boston. Matt received his MBA from Columbia Business School in 2010 where he was on the Dean’s List and was the winner of the prestigious Pershing Square Value Investing and Philanthropy Challenge. Prior to Columbia, Matt was an Investment Associate at Putnam Investment Management, which he joined following graduation from Amherst College.
In closing, we appreciate your confidence in us. The true intent of the Golub Group Equity Fund is to provide a means by which our investors can build their wealth over the long term. We look forward to achieving this with you.
Sincerely,
Golub Group, LLC
2
MANAGEMENT’S DISCUSSION OF FUND PERFORMANCE FOR THE FISCAL YEAR ENDING JANUARY 31, 2013
The Golub Group Equity Fund (“Fund”) returned 16.34% for the fiscal year ending January 31, 2013. In comparison, our benchmark, the S&P 500® Index*, gained 16.78% during the same period. Since inception on April 1, 2009, the Fund has returned 81.06% as compared to the 100.37% return of the benchmark.
Performance for the period was led by strong returns from the Financials, Consumer Discretionary and Industrials sectors with all sectors generating positive returns. The portfolio benefited most from its overweight allocation to Financials (21.9% of portfolio weight vs. 14.7% benchmark weight) which was the best performing sector in the S&P 500 and continues to benefit from the improving U.S. economy. Our Consumer Discretionary holdings, primarily the building supply stocks, continued their strong performance on the improved outlook for the U.S. housing market. Industrials, largely driven by General Electric, were a positive contributor despite our sector allocation being underweight relative to benchmark. Lowe’s, Bank of New York Mellon and Berkshire Hathaway were the largest positive contributors and returned 45.3%, 38.6% and 23.2% respectively. Berkshire Hathaway ended the period as our largest holding followed by Lowe’s, Microsoft and General Electric.
The largest detractor to performance was attributable to our underperformance in the Healthcare sector, where we were overweight relative to the benchmark and underperformed in terms of stock selection. Teva Pharmaceuticals had the biggest negative impact with a negative 13.8% return for the period. Despite strong returns in our Consumer Staples holdings, overall performance was hurt by our underweight allocation to the sector (6.4% of portfolio vs. 10.9% benchmark weight). Microsoft and Intel were the only other stocks that had a negative return during the period.
During the period, we added the following three new positions to the fund: Citigroup, Charles Schwab and Devon Energy. During the period we sold the following three positions in their entirety: Abbott Labs, Avon Products and Home Depot.
In addition to the stock and security selection, the advisor’s decision to waive fees and reimburse expenses to the fund due to the expense limitation cap impacted performance. Had the advisor not waived and reimbursed these expenses, the performance of the fund would have been lower.
We remain focused on our long term discipline of investing in high-quality, large-cap, dividend-paying businesses that trade at attractive valuations and are confident that our style of investing is particularly well-suited for the period ahead.
Sincerely,
Golub Group, LLC
3
* The S&P 500® Index is a widely recognized unmanaged index of equity prices and is representative of a broader market and range of securities than is found in the Fund’s portfolio. Individuals cannot invest directly in the Index; however, an individual can invest in exchange traded funds or other investment vehicles that attempt to track the performance of a benchmark index.
The views in the foregoing discussion were those of the Fund’s investment advisor as of the date set forth above and may not reflect its views on the date this Annual Report is first published or anytime thereafter. These views are intended to assist shareholders in understanding their investment in the Fund and do not constitute investment advice.
The performance information quoted above represents past performance and past performance does not guarantee future results. Investment return and principal value of an investment will fluctuate so that an investor’s shares, when redeemed, may be worth more or less than their original cost. Current performance may be lower or higher than the performance data quoted. Performance data, current to the most recent month end, may be obtained by calling the Fund at 1-866-954-6682. Fee waivers and expense reimbursements have positively impacted Fund performance. An investor should consider the Fund’s investment objectives, risks, and charges and expenses carefully before investing. The Fund’s Prospectus contains this and other important information. For information on the Fund’s expense ratio, please see the Financial Highlights Table found within the accompanying Annual Report.
4
Investment Results – (Unaudited)
Total Returns*
(For the periods ended January 31, 2013)
| | | | | | | | | | | | |
| | | | | | Average Annual | |
| | | 1 Year | | | 3 Year | | | Since Inception
(April 1, 2009) | |
Golub Group Equity Fund | | | 16.34 | % | | | 11.86 | % | | | 16.73 | % |
S&P 500(R) Index** | | | 16.78 | % | | | 14.14 | % | | | 20.37 | % |
Total annual operating expenses, as disclosed in the most recent supplement to the Fund’s prospectus, were 1.76% of average daily net assets (1.26% after fee waivers/expense reimbursements by the Adviser.) The Adviser has contractually agreed to waive or limit its fees and assume other expenses of the Fund until May 31, 2013, so that Total Annual Fund Operating Expenses do not exceed 1.25%. This contractual arrangement may only be terminated by mutual consent of the Adviser and the Fund, and it will automatically terminate upon the termination of the investment advisory agreement between the Fund and the Adviser. This operating expense limitation does not apply to: (i) interest, (ii) taxes, (iii) brokerage commissions, (iv) other expenditures which are capitalized in accordance with generally accepted accounting principles, (v) other extraordinary expenses not incurred in the ordinary course of the Fund’s business, (vi) dividend expense on short sales, (vii) expenses incurred under a plan of distribution under Rule 12b-1, and (viii) expenses that the Fund has incurred but did not actually pay because of an expense offset arrangement, if applicable, incurred by the Fund in any fiscal year.
The performance quoted represents past performance, which does not guarantee future results. The investment return and principal value of an investment will fluctuate so that an investor’s shares, when redeemed, may be worth more or less than their original cost. The returns shown do not reflect deduction of taxes that a shareholder would pay on Fund distributions or the redemption of Fund shares. Current performance of the Fund may be lower or higher than the performance quoted. The Fund’s investment objectives, risks, charges and expenses must be considered carefully before investing. Performance data current to the most recent month end may be obtained by calling 1-866-954-6682.
| * | Return figures reflect any change in price per share and assume the reinvestment of all distributions. |
| ** | The S&P 500® Index is a widely recognized unmanaged index of equity securities and is representative of a broader domestic equity market and range of securities than is found in the Fund’s portfolio. Individuals cannot invest directly in the Index; however, an individual can invest in exchange traded funds or other investment vehicles that attempt to track the performance of a benchmark index. |
The Fund’s investment objectives, strategies, risks, charges and expenses must be considered carefully before investing. The prospectus contains this and other important information about the Fund and may be obtained by calling the same number as above. Please read it carefully before investing. The Fund is distributed by Unified Financial Securities, Inc., member FINRA.
5
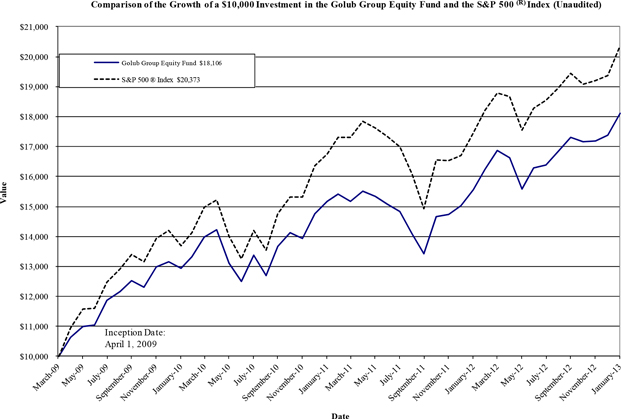
The chart above assumes an initial investment of $10,000 made on April 1, 2009 (commencement of Fund operations) and held through January 31, 2013. The S&P 500® Index is a widely recognized unmanaged index of equity securities and is representative of a broader domestic equity market and range of securities than is found in the Fund’s portfolio. Individuals cannot invest directly in the Index; however, an individual can invest in exchange traded funds or other investment vehicles that attempt to track the performance of a benchmark index. THE FUND’S RETURN REPRESENTS PAST PERFORMANCE AND DOES NOT GUARANTEE FUTURE RESULTS. The returns shown do not reflect deduction of taxes that a shareholder would pay on Fund distributions or the redemption of Fund shares. Investment returns and principal values will fluctuate so that your shares, when redeemed, may be worth more or less than their original purchase price.
Current performance may be lower or higher than the performance data quoted. For more information on the Fund, and to obtain performance data current to the most recent month end or to request a prospectus, please call 1-866-954-6682. You should carefully consider the investment objectives, potential risks, management fees, and charges and expenses of the Fund before investing. The Fund’s prospectus contains this and other information about the Fund, and should be read carefully before investing.
The Fund is distributed by Unified Financial Securities, Inc., member FINRA.
6
Fund Holdings – (Unaudited)
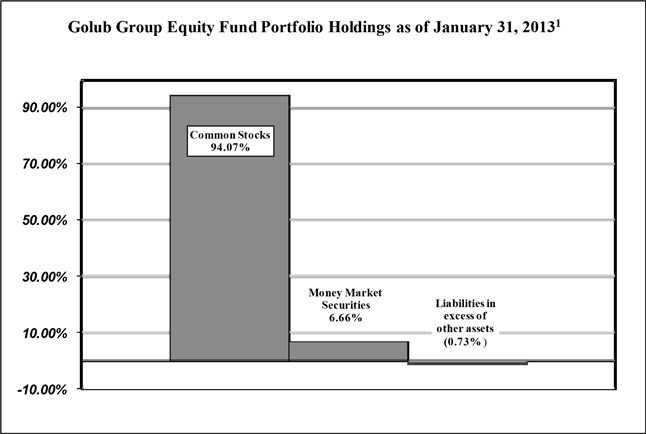
| 1 | As a percentage of net assets. |
The investment objective of the Golub Group Equity Fund is to provide long-term capital appreciation. A secondary objective is to provide current income.
Availability of Portfolio Schedule – (Unaudited)
The Fund files its complete schedule of portfolio holdings with the Securities and Exchange Commission (“SEC”) for the first and third quarters of each fiscal year on Form N-Q. The Fund’s Forms N-Q are available at the SEC’s website at www.sec.gov. The Fund’s Forms N-Q may be reviewed and copied at the SEC’s Public Reference Room in Washington DC. Information on the operation of the Public Reference Room may be obtained by calling 1-800-SEC-0330.
Summary of Fund’s Expenses – (Unaudited)
As a shareholder of the Fund, you incur ongoing costs, including management fees and other Fund expenses. This Example is intended to help you understand your ongoing costs (in dollars) of investing in the Fund and to compare these costs with the ongoing costs of investing in other mutual funds.
The Example is based on an investment of $1,000 invested at the beginning and held for the entire period from August 1, 2012 to January 31, 2013.
Actual Expenses
The first line of the table below provides information about actual account values and actual expenses. You may use the information in this line, together with the amount you invested, to estimate the expenses that you paid over the period. Simply divide your account value by $1,000 (for example, an $8,600 account value divided by $1,000 = $8.60), then multiply the result by the number in the first line under the heading entitled “Expenses Paid During the Period” to estimate the expenses you paid on your account during this period.
7
Hypothetical Example for Comparison Purposes
The second line of the table below provides information about hypothetical account values and hypothetical expenses based on the Fund’s actual expense ratio and an assumed rate of return of 5% per year before expenses, which is not the Fund’s actual return. The hypothetical account values and expenses may not be used to estimate the actual ending account balance or expenses you paid for the period. You may use this information to compare the ongoing costs of investing in the Fund and other funds. To do so, compare this 5% hypothetical example with the 5% hypothetical examples that appear in the shareholder reports of the other funds.
Please note that the expenses shown in the table are meant to highlight your ongoing costs only. Therefore, the second line of the table below is useful in comparing ongoing costs only and will not help you determine the relative costs of owning different funds.
| | | | | | | | | | | | |
Golub Group Equity Fund | | Beginning Account
Value
August 1, 2012 | | | Ending Account
Value
January 31, 2013 | | | Expenses Paid
During the Period Ended
January 31, 2013 | |
Actual* | | $ | 1,000.00 | | | $ | 1,105.00 | | | $ | 6.61 | |
Hypothetical** | | $ | 1,000.00 | | | $ | 1,018.85 | | | $ | 6.34 | |
| * | Expenses are equal to the Fund’s annualized net expense ratio of 1.25%, multiplied by the average account value over the period, multiplied by 184/366. |
| ** | Assumes a 5% return before expenses. |
8
Golub Group Equity Fund
Schedule of Investments
January 31, 2013
| | | | | | | | |
| | | Shares | | | Fair Value | |
Common Stocks - 94.07% | | | | | | | | |
| | |
Air Courier Services - 2.04% | | | | | | | | |
FedEx Corp. | | | 6,550 | | | $ | 664,498 | |
| | | | | | | | |
Aircraft Engines & Engine Parts - 1.54% | | | | | | | | |
United Technologies Corp. | | | 5,725 | | | | 501,338 | |
| | | | | | | | |
Beverages - 4.61% | | | | | | | | |
Diageo plc (b)(c) | | | 4,225 | | | | 504,042 | |
PepsiCo, Inc. | | | 13,650 | | | | 994,402 | |
| | | | | | | | |
| | | | | | | 1,498,444 | |
| | | | | | | | |
Brewery - 2.89% | | | | | | | | |
Anheuser-Busch InBev NV (b) | | | 10,600 | | | | 939,160 | |
| | | | | | | | |
Computer Communications Equipment - 3.90% | | | | | | | | |
Cisco Systems, Inc. | | | 61,700 | | | | 1,269,169 | |
| | | | | | | | |
Crude Petroleum & Natural Gas - 1.82% | | | | | | | | |
Devon Energy Corp. | | | 10,350 | | | | 591,917 | |
| | | | | | | | |
| | |
Electromedical & Electrotherapeutic Apparatus - 2.98% | | | | | | | | |
Medtronic, Inc. | | | 20,775 | | | | 968,115 | |
| | | | | | | | |
Electronic & Other Electrical Equipment (No Computer Equipment) - 4.14% | | | | | | | | |
General Electric Co. | | | 60,400 | | | | 1,345,712 | |
| | | | | | | | |
Electronic Computers - 3.00% | | | | | | | | |
Apple, Inc. | | | 2,140 | | | | 974,363 | |
| | | | | | | | |
Fire, Marine & Casualty Insurance - 4.09% | | | | | | | | |
Berkshire Hathaway, Inc. - Class B (a) | | | 13,725 | | | | 1,330,364 | |
| | | | | | | | |
Investment Advice - 1.95% | | | | | | | | |
Franklin Resources, Inc. | | | 4,625 | | | | 633,070 | |
| | | | | | | | |
Medical - Generic Drugs - 2.94% | | | | | | | | |
Teva Pharmaceutical Industries, Ltd. (b) | | | 25,125 | | | | 954,499 | |
| | | | | | | | |
Motor Vehicles & Passenger Car Bodies - 2.99% | | | | | | | | |
General Motors Co. (a) | | | 34,600 | | | | 971,914 | |
| | | | | | | | |
National Commercial Banks - 3.18% | | | | | | | | |
Citigroup, Inc. | | | 24,550 | | | | 1,035,028 | |
| | | | | | | | |
Petroleum Refining - 8.36% | | | | | | | | |
Chevron Corp. | | | 8,675 | | | | 998,926 | |
ConocoPhillips | | | 10,900 | | | | 632,200 | |
Exxon Mobil Corp. | | | 12,100 | | | | 1,088,637 | |
| | | | | | | | |
| | | | | | | 2,719,763 | |
| | | | | | | | |
Pharmaceutical Preparations - 3.07% | | | | | | | | |
Johnson & Johnson | | | 13,500 | | | | 997,920 | |
| | | | | | | | |
Retail - Lumber & Other Building Materials Dealers - 3.95% | | | | | | | | |
Lowe’s Companies, Inc. | | | 33,600 | | | | 1,283,184 | |
| | | | | | | | |
See accompanying notes which are an integral part of these financial statements.
9
Golub Group Equity Fund
Schedule of Investments - continued
January 31, 2013
| | | | | | | | |
| | | Shares | | | Fair Value | |
Common Stocks - 94.07% - continued | | | | | | | | |
| | |
Security Brokers, Dealers & Flotation Companies - 1.61% | | | | | | | | |
Charles Schwab Corp./The | | | 31,700 | | | $ | 524,001 | |
| | | | | | | | |
| | |
Semiconductors & Related Devices - 2.92% | | | | | | | | |
Intel Corp. | | | 45,175 | | | | 950,482 | |
| | | | | | | | |
Services - Computer Processing & Data Preparation - 2.92% | | | | | | | | |
Fiserv, Inc. (a) | | | 11,825 | | | | 949,666 | |
| | | | | | | | |
Services - Computer Programming, Data Processing, Etc. - 3.08% | | | | | | | | |
Google Inc. - Class A (a) | | | 1,325 | | | | 1,001,289 | |
| | | | | | | | |
Services - Engineering, Accounting, Research, Management - 2.89% | | | | | | | | |
Paychex, Inc. | | | 28,850 | | | | 941,376 | |
| | | | | | | | |
Services - Prepackaged Software - 3.94% | | | | | | | | |
Microsoft Corp. | | | 46,700 | | | | 1,282,849 | |
| | | | | | | | |
Soap, Detergent, Cleaning Preparations, Perfumes, Cosmetics - 2.00% | | | | | | | | |
Procter & Gamble Co./The | | | 8,650 | | | | 650,134 | |
| | | | | | | | |
State Commercial Banks - 4.25% | | | | | | | | |
Bank of New York Mellon Corp./The | | | 50,825 | | | | 1,380,407 | |
| | | | | | | | |
Super-Regional Banks-US - 6.38% | | | | | | | | |
U.S. Bancorp | | | 28,825 | | | | 954,108 | |
Wells Fargo & Co. | | | 32,200 | | | | 1,121,526 | |
| | | | | | | | |
| | | | | | | 2,075,634 | |
| | | | | | | | |
Surgical & Medical Instruments & Apparatus - 2.09% | | | | | | | | |
Becton, Dickinson and Co. | | | 8,075 | | | | 678,623 | |
| | | | | | | | |
Telephone Communications (No Radio Telephone) - 3.00% | | | | | | | | |
China Mobile Ltd. (b) | | | 17,850 | | | | 976,395 | |
| | | | | | | | |
Trucking & Courier Services (No Air) - 1.54% | | | | | | | | |
United Parcel Service, Inc. - Class B | | | 6,298 | | | | 499,368 | |
| | | | | | | | |
TOTAL COMMON STOCKS (Cost $25,380,858) | | | | | | | 30,588,682 | |
| | | | | | | | |
Money Market Securities - 6.66% | | | | | | | | |
Fidelity Institutional Money Market Portfolio - Institutional Class, 0.16% (d) | | | 2,167,773 | | | | 2,167,773 | |
| | | | | | | | |
TOTAL MONEY MARKET SECURITIES (Cost $2,167,773) | | | | | | | 2,167,773 | |
| | | | | | | | |
TOTAL INVESTMENTS (Cost $27,548,631) - 100.73% | | | | | | $ | 32,756,455 | |
| | | | | | | | |
Liabilities in excess of other assets - (0.73%) | | | | | | | (238,996 | ) |
| | | | | | | | |
TOTAL NET ASSETS - 100.00% | | | | | | $ | 32,517,459 | |
| | | | | | | | |
| (b) | American Depositary Receipt. |
| (c) | Public Limited Company. |
| (d) | Variable rate security; the rate shown represents the 7-day yield at January 31, 2013. |
See accompanying notes which are an integral part of these financial statements.
10
Golub Group Equity Fund
Statement of Assets and Liabilities
January 31, 2013
| | | | |
Assets | | | | |
Investments in securities, at fair value (cost $27,548,631) | | $ | 32,756,455 | |
Receivable for fund shares sold | | | 85,000 | |
Dividends receivable | | | 25,892 | |
Interest receivable | | | 210 | |
Receivable for tax reclaim | | | 203 | |
Prepaid expenses | | | 8,575 | |
| | | | |
Total assets | | | 32,876,335 | |
| | | | |
Liabilities | | | | |
Payable to Adviser (a) | | | 19,982 | |
Payable for investments purchased | | | 296,469 | |
Payable for fund shares redeemed | | | 15,331 | |
Payable to administrator, fund accountant, and transfer agent (a) | | | 8,251 | |
Payable to custodian (a) | | | 414 | |
Payable to trustees | | | 613 | |
Other accrued expenses | | | 17,816 | |
| | | | |
Total liabilities | | | 358,876 | |
| | | | |
Net Assets | | $ | 32,517,459 | |
| | | | |
Net Assets consist of: | | | | |
Paid in capital | | $ | 27,082,547 | |
Undistributed net investment income (loss) | | | (7,946 | ) |
Accumulated net realized gain (loss) on investments | | | 235,034 | |
Net unrealized appreciation (depreciation) on investments | | | 5,207,824 | |
| | | | |
Net Assets | | $ | 32,517,459 | |
| | | | |
Shares outstanding (unlimited number of shares authorized; no par value) | | | 2,063,466 | |
| | | | |
Net Asset Value, offering and redemption price per share | | $ | 15.76 | |
| | | | |
| (a) | See Note 4 in the Notes to the Financial Statements. |
See accompanying notes which are an integral part of these financial statements.
11
Golub Group Equity Fund
Statement of Operations
For the year ended January 31, 2013
| | | | |
Investment Income | | | | |
Dividend income (net of foreign withholding tax of $12,739) | | $ | 615,790 | |
Interest income | | | 3,011 | |
| | | | |
Total Investment Income | | | 618,801 | |
| | | | |
Expenses | | | | |
Investment Adviser fee (a) | | | 281,146 | |
Transfer agent expenses (a) | | | 36,176 | |
Administration expenses (a) | | | 34,998 | |
Fund accounting expenses (a) | | | 25,000 | |
Legal expenses | | | 16,203 | |
Audit expenses | | | 14,500 | |
Custodian expenses (a) | | | 8,183 | |
Printing expenses | | | 7,427 | |
Trustee expenses | | | 6,057 | |
Registration expenses | | | 4,200 | |
Insurance expenses | | | 4,177 | |
Miscellaneous expenses | | | 2,457 | |
Pricing expenses | | | 760 | |
CCO expenses | | | 750 | |
24f-2 fees | | | 730 | |
| | | | |
Total Expenses | | | 442,764 | |
Fees waived and expenses reimbursed by Adviser (a) | | | (91,129 | ) |
| | | | |
Net operating expenses | | | 351,635 | |
| | | | |
Net Investment Income | | | 267,166 | |
| | | | |
Realized & Unrealized Gain on Investments | | | | |
Net realized gain on investment securities | | | 1,167,364 | |
Change in unrealized appreciation on investment securities | | | 2,848,773 | |
| | | | |
Net realized and unrealized gain on investment securities | | | 4,016,137 | |
| | | | |
Net increase in net assets resulting from operations | | $ | 4,283,303 | |
| | | | |
| (a) | See Note 4 in the Notes to the Financial Statements. |
See accompanying notes which are an integral part of these financial statements.
12
Golub Group Equity Fund
Statements of Changes In Net Assets
| | | | | | | | |
| | | Year Ended
January 31, 2013 | | | Year Ended
January 31, 2012 | |
Increase (Decrease) in Net Assets due to: | | | | | | | | |
Operations | | | | | | | | |
Net investment income | | $ | 267,166 | | | $ | 220,887 | |
Net realized gain on investment securities | | | 1,167,364 | | | | 697,262 | |
Change in unrealized appreciation (depreciation) on investment securities | | | 2,848,773 | | | | (291,148 | ) |
| | | | | | | | |
Net increase in net assets resulting from operations | | | 4,283,303 | | | | 627,001 | |
| | | | | | | | |
Distributions | | | | | | | | |
From net investment income | | | (288,218 | ) | | | (212,526 | ) |
From net realized gains | | | (715,029 | ) | | | (1,261,149 | ) |
| | | | | | | | |
Total distributions | | | (1,003,247 | ) | | | (1,473,675 | ) |
| | | | | | | | |
Capital Share Transactions | | | | | | | | |
Proceeds from shares sold | | | 9,029,658 | | | | 7,225,438 | |
Reinvestment of distributions | | | 1,003,247 | | | | 1,473,675 | |
Amount paid for shares redeemed | | | (4,741,918 | ) | | | (3,480,419 | ) |
| | | | | | | | |
Net increase in net assets resulting from capital share transactions | | | 5,290,987 | | | | 5,218,694 | |
| | | | | | | | |
Total Increase in Net Assets | | | 8,571,043 | | | | 4,372,020 | |
| | | | | | | | |
Net Assets | | | | | | | | |
Beginning of year | | | 23,946,416 | | | | 19,574,396 | |
| | | | | | | | |
End of year | | $ | 32,517,459 | | | $ | 23,946,416 | |
| | | | | | | | |
Undistributed net investment income (loss) included in net assets at end of year | | $ | (7,946 | ) | | $ | 8,233 | |
| | | | | | | | |
Capital Share Transactions | | | | | | | | |
Shares sold | | | 598,533 | | | | 508,241 | |
Shares issued in reinvestment of distributions | | | 67,151 | | | | 109,812 | |
Shares redeemed | | | (313,222 | ) | | | (249,482 | ) |
| | | | | | | | |
Net increase from capital share transactions | | | 352,462 | | | | 368,571 | |
| | | | | | | | |
See accompanying notes which are an integral part of these financial statements.
13
Golub Group Equity Fund
Financial Highlights
(For a share outstanding during each period)
| | | | | | | | | | | | | | | | |
| |
| For the
Year Ended
January 31, 2013 |
| |
| For the
Year Ended
January 31, 2012 |
| |
| For the
Year Ended
January 31, 2011 |
| |
| For the
Period Ended
January 31, 2010 |
(a) |
| | | | | | | | | | | | | | | | |
Selected Per Share Data: | | | | | | | | | | | | | | | | |
Net asset value, beginning of period | | $ | 14.00 | | | $ | 14.58 | | | $ | 12.85 | | | $ | 10.00 | |
| | | | | | | | | | | | | | | | |
Income from investment operations: | | | | | | | | | | | | | | | | |
Net investment income (b) | | | 0.14 | | | | 0.15 | | | | 0.11 | | | | 0.11 | |
Net realized and unrealized gain on investments | | | 2.12 | | | | 0.20 | | | | 2.09 | | | | 2.83 | |
| | | | | | | | | | | | | | | | |
Total income from investment operations | | | 2.26 | | | | 0.35 | | | | 2.20 | | | | 2.94 | |
| | | | | | | | | | | | | | | | |
Less distributions to shareholders: | | | | | | | | | | | | | | | | |
From net investment income | | | (0.14 | ) | | | (0.14 | ) | | | (0.09 | ) | | | (0.09 | ) |
From net realized gains | | | (0.36 | ) | | | (0.79 | ) | | | (0.38 | ) | | | — | (c) |
| | | | | | | | | | | | | | | | |
Total distributions | | | (0.50 | ) | | | (0.93 | ) | | | (0.47 | ) | | | (0.09 | ) |
| | | | | | | | | | | | | | | | |
Net asset value, end of period | | $ | 15.76 | | | $ | 14.00 | | | $ | 14.58 | | | $ | 12.85 | |
| | | | | | | | | | | | | | | | |
Total Return (d) | | | 16.34 | % | | | 2.65 | % | | | 17.20 | % | | | 29.37 | % (e) |
| | | | |
Ratios and Supplemental Data: | | | | | | | | | | | | | | | | |
Net assets, end of period (000) | | $ | 32,517 | | | $ | 23,946 | | | $ | 19,574 | | | $ | 9,390 | |
Ratio of expenses to average net assets after expense reimbursement | | | 1.25 | % | | | 1.25 | % | | | 1.25 | % | | | 1.25 | % (f) |
Ratio of expenses to average net assets before waiver and reimbursement | | | 1.57 | % | | | 1.75 | % | | | 2.21 | % | | | 3.45 | % (f) |
Ratio of net investment income (loss) to average net assets after expense reimbursement | | | 0.95 | % | | | 1.03 | % | | | 0.82 | % | | | 1.07 | % (f) |
Ratio of net investment income (loss) to average net assets before waiver and reimbursement | | | 0.63 | % | | | 0.53 | % | | | (0.14 | )% | | | (1.13 | )%(f) |
Portfolio turnover rate | | | 16.79 | % | | | 27.33 | % | | | 23.15 | % | | | 8.58 | % (e) |
| (a) | For the period April 1, 2009 (Commencement of Operations) to January 31, 2010. |
| (b) | Net investment income per share is calculated by dividing net investment income by the average shares outstanding throughout the period. |
| (c) | Distributions to shareholders resulted in less than $0.005 per share. |
| (d) | Total return in the above table represents the rate that the investor would have earned or lost on an investment in the Fund, assuming reinvestment of distributions. |
See accompanying notes which are an integral part of these financial statements.
14
Golub Group Equity Fund
Notes to the Financial Statements
January 31, 2013
NOTE 1. ORGANIZATION
The Golub Group Equity Fund (the “Fund”) was organized as an open-end diversified series of the Valued Advisers Trust (the “Trust”) on April 1, 2009. The Trust is a management investment company established under the laws of Delaware by an Agreement and Declaration of Trust dated June 13, 2008 (the “Trust Agreement”). The Trust Agreement permits the Board of Trustees (the “Board”) to issue an unlimited number of shares of beneficial interest of separate series without par value. The Fund is one of a series of funds authorized by the Board. The Fund’s investment adviser is Golub Group, LLC (the “Adviser”). The investment objective of the Fund is to provide long-term capital appreciation. A secondary objective is to provide current income.
NOTE 2. SIGNIFICANT ACCOUNTING POLICIES
The following is a summary of significant accounting policies followed by the Fund in the preparation of its financial statements. These policies are in conformity with the generally accepted accounting principles in the United States of America (“GAAP”).
Securities Valuation – All investments in securities are recorded at their estimated fair value as described in Note 3.
Federal Income Taxes – The Fund makes no provision for federal income or excise tax. The Fund intends to qualify each year as a regulated investment company (“RIC”) under subchapter M of the Internal Revenue Code of 1986, as amended, by complying with the requirements applicable to RICs and by distributing substantially all of its taxable income. The Fund also intends to distribute sufficient net investment income and net capital gains, if any, so that it will not be subject to excise tax on undistributed income and gains. If the required amount of net investment income or gains is not distributed, the Fund could incur a tax expense.
As of and during the fiscal year ended January 31, 2013, the Fund did not have a liability for any unrecognized tax benefits. The Fund recognizes interest and penalties, if any, related to unrecognized tax benefits as income tax expense in the statement of operations. During the year, the Fund did not incur any interest or penalties. The Fund is subject to examination by U.S. federal tax authorities for all tax years since inception.
Expenses – Expenses incurred by the Trust that do not relate to a specific fund of the Trust are allocated to the individual funds based on each fund’s relative net assets or another appropriate basis (as determined by the Board).
Security Transactions and Related Income – The Fund follows industry practice and records security transactions on the trade date. The first in, first out method is used for determining gains or losses for financial statement and income tax purposes. Dividend income is recorded on the ex-dividend date and interest income is recorded on an accrual basis. Discounts and premiums on securities purchased are accreted or amortized using the effective interest method. The ability of issuers of debt securities held by the Fund to meet their obligations may be affected by economic and political developments in a specific country or region. Withholding taxes on foreign dividends have been provided for in accordance with the Fund’s understanding of the applicable country’s tax rules and rates.
Dividends and Distributions – The Fund intends to distribute all or substantially all of its net investment income, if any, as dividends to its shareholders on at least an annual basis. The Fund intends to distribute its net realized long term capital gains and its net realized short term capital gains, if any, at least once a year. Dividends to shareholders, which are determined in accordance with income tax regulations, are recorded on the ex-dividend date. The treatment for financial reporting purposes of distributions made to shareholders during the period from net investment income or net realized capital gains may differ from their ultimate treatment for federal income tax purposes. These differences are caused primarily by differences in the timing of the recognition of certain components of income, expense or realized capital gain for federal income tax purposes. Where such differences are permanent in nature, they are reclassified in the components of the net assets based on their ultimate characterization for federal income tax purposes. Any such reclassifications will have no effect on net assets, results of operations or net asset values per share of the Fund.
15
Golub Group Equity Fund
Notes to the Financial Statements – continued
January 31, 2013
NOTE 2. SIGNIFICANT ACCOUNTING POLICIES – continued
For the year ended January 31, 2013, the Fund made the following reclassifications to increase (decrease) the components of net assets.
| | | | | | | | | | | | |
| | | Paid in Capital | | | Accumulated Undistributed
Net Investment Income | | | Accumulated Net Realized
Loss from Investments | |
Golub Group Equity Fund | | $ | (1 | ) | | $ | 4,873 | | | $ | (4,872 | ) |
NOTE 3. SECURITIES VALUATION AND FAIR VALUE MEASUREMENTS
Fair value is defined as the price that a Fund would receive upon selling an investment in an orderly transaction to an independent buyer in the principal or most advantageous market of the investment. Accounting principles generally accepted in the United States of America (“GAAP”) establishes a three-tier hierarchy to maximize the use of observable market data and minimize the use of unobservable inputs and establish classification of fair value measurements for disclosure purposes.
Inputs refer broadly to the assumptions that market participants would use in pricing the asset or liability, including assumptions about risk, for example, the risk inherent in a particular valuation technique used to measure fair value including a pricing model and/or the risk inherent in the inputs to the valuation technique. Inputs may be observable or unobservable. Observable inputs are inputs that reflect the assumptions market participants would use in pricing the asset or liability developed based on market data obtained from sources independent of the reporting entity. Unobservable inputs are inputs that reflect the reporting entity’s own assumptions about the assumptions market participants would use in pricing the asset or liability developed based on the best information available in the circumstances.
Various inputs are used in determining the value of the Fund’s investments. These inputs are summarized in the three broad levels listed below.
| | • | | Level 1 – quoted prices in active markets for identical securities |
| | • | | Level 2 – other significant observable inputs (including, but not limited to, quoted prices for an identical security in an inactive market, quoted prices for similar securities, interest rates, prepayment speeds, credit risk, etc.) |
| | • | | Level 3 – significant unobservable inputs (including the Fund’s own assumptions in determining fair value of investments based on the best information available) |
The inputs used to measure fair value may fall into different levels of the fair value hierarchy. In such cases, for disclosure purposes, the level in the fair value hierarchy within which the fair value measurement falls in its entirety, is determined based on the lowest level input that is significant to the fair value measurement in its entirety.
Equity securities, including common stocks, are generally valued by using market quotations, but may be valued on the basis of prices furnished by a pricing service when the Fund believes such prices more accurately reflect the fair value of such securities. Securities that are traded on any stock exchange are generally valued by the pricing service at the last quoted sale price. Lacking a last sale price, an exchange traded security is generally valued by the pricing service at its last bid price. Securities traded in the NASDAQ over-the-counter market are generally valued by the pricing service at the NASDAQ Official Closing Price. When using the market quotations or close prices provided by the pricing service and when the market is considered active, the security will be classified as a Level 1 security. Sometimes, an equity security owned by the Fund will be valued by the pricing service with factors other than market quotations or when the market is considered inactive. When this happens, the security will be classified as a Level 2 security. When market quotations are not readily available, when the Fund determines that the market quotation or the price provided by the
16
Golub Group Equity Fund
Notes to the Financial Statements – continued
January 31, 2013
NOTE 3. SECURITIES VALUATION AND FAIR VALUE MEASUREMENTS – continued
pricing service does not accurately reflect the current fair value, or when restricted or illiquid securities are being valued, such securities are valued as determined in good faith by the Fund, in conformity with guidelines adopted by and subject to review by the Board. These securities will be categorized as Level 3 securities.
Investments in mutual funds, including money market mutual funds, are generally priced at the ending net asset value (NAV) provided by the service agent of the funds. These securities will be categorized as Level 1 securities.
Fixed income securities that are valued using market quotations in an active market will be categorized as Level 1 securities. However, they may be valued on the basis of prices furnished by a pricing service when the Fund believes such prices more accurately reflect the fair value of such securities. A pricing service utilizes electronic data processing techniques based on yield spreads relating to securities with similar characteristics to determine prices for normal institutional-size trading units of debt securities without regard to sale or bid prices. These securities will generally be categorized as Level 2 securities. If the Fund decides that a price provided by the pricing service does not accurately reflect the fair value of the securities, when prices are not readily available from a pricing service, or when restricted or illiquid securities are being valued, securities are valued at fair value as determined in good faith by the Fund, in conformity with guidelines adopted by and subject to review of the Board. These securities will be categorized as Level 3 securities.
Short-term investments in fixed income securities (those with maturities of less than 60 days when acquired or which subsequently are within 60 days of maturity), are valued at amortized cost, which the Board has determined will represent fair value. These securities will be classified as Level 2 securities.
In accordance with the Trust’s good faith pricing guidelines, the Fund is required to consider all appropriate factors relevant to the value of securities for which it has determined other pricing sources are not available or reliable as described above. No single standard exists for determining fair value, because fair value depends upon the circumstances of each individual case. As a general principle, the current fair value of an issue of securities being valued by the Fund would appear to be the amount which the owner might reasonably expect to receive for them upon their current sale. Methods which are in accordance with this principle may, for example, be based on (i) a multiple of earnings; (ii) a discount from market of a similar freely traded security (including a derivative security or a basket of securities traded on other markets, exchanges or among dealers); or (iii) yield to maturity with respect to debt issues, or a combination of these and other methods. Good faith pricing is permitted if, in the Fund’s opinion, the validity of market quotations appears to be questionable based on factors such as evidence of a thin market in the security based on a small number of quotations, a significant event occurs after the close of a market but before a Fund’s NAV calculation that may affect a security’s value, or the Fund is aware of any other data that calls into question the reliability of market quotations. Good faith pricing may also be used in instances when the bonds the Fund invests in may default or otherwise cease to have market quotations readily available. Any fair valuation pricing done outside the Fund’s approved pricing methods must be approved by the Pricing Committee of the Board.
The following is a summary of the inputs used to value the Fund’s investments as of January 31, 2013:
| | | | | | | | | | | | | | | | |
| | | Valuation Inputs | |
Assets | | Level 1 - Quoted
Prices in Active
Markets | | | Level 2 - Other
Significant
Observable Inputs | | | Level 3 -
Significant
Unobservable
Inputs | | | Total | |
Common Stocks* | | $ | 30,588,682 | | | $ | — | | | $ | — | | | $ | 30,588,682 | |
Money Market Securities | | | 2,167,773 | | | | — | | | | — | | | | 2,167,773 | |
Total | | $ | 32,756,455 | | | $ | — | | | $ | — | | | $ | 32,756,455 | |
| * | Refer to the Schedule of Investments for industry classifications. |
17
Golub Group Equity Fund
Notes to the Financial Statements – continued
January 31, 2013
NOTE 3. SECURITIES VALUATION AND FAIR VALUE MEASUREMENTS – continued
The Fund did not hold any assets at any time during the reporting period in which significant unobservable inputs were used in determining fair value; therefore, no reconciliation of Level 3 securities is included for this reporting period. During the year ended January 31, 2013, the Fund had no transfers between any Levels. The Fund did not hold any derivative instruments during the reporting period. The Trust recognizes transfers between fair value hierarchy levels at the end of the reporting period.
NOTE 4. FEES AND OTHER TRANSACTIONS WITH AFFILIATES
Under the terms of the investment advisory agreement, on behalf of the Fund (the “Agreement”), the Adviser manages the Fund’s investments subject to oversight of the Board. As compensation for its services, the Golub Group Equity Fund is obligated to pay the Adviser a fee computed and accrued daily and paid monthly at an annual rate of 1.00% of the average daily net assets of the Fund. For the fiscal year ended January 31, 2013, the Adviser earned a fee of $281,146 from the Fund before the reimbursement described below. At January 31, 2013, the Fund owed the Adviser $19,982.
The Adviser has contractually agreed to waive or limit its fee and reimburse certain Fund operating expenses, until May 31, 2013, so that the ratio of total annual operating expenses does not exceed 1.25%. This operating expense limitation does not apply to interest, taxes, brokerage commissions, other expenditures which are capitalized in accordance with generally accepted accounting principles, other extraordinary expenses not incurred in the ordinary course of the Fund’s business, dividend expense on short sales, expenses incurred under a plan of distribution under Rule 12b-1, and expenses that the Fund has incurred but did not actually pay because of an expense offset arrangement, if applicable, incurred by the Fund in any fiscal year. The operating expense limitation also excludes any “Acquired Fund Fees and Expenses.” Acquired Fund Fees and Expenses represent the pro rata expense indirectly incurred by the Fund as a result of investing in other investment companies, including ETFs, closed-end funds and money market funds that have their own expenses. The Adviser may be entitled to the reimbursement of any fees waived or expenses reimbursed pursuant to the agreement provided overall expenses fall below the limitations set forth above. The Adviser may recoup the sum of all fees previously waived or expenses reimbursed during any of the previous three (3) years, less any reimbursement previously paid, provided total expenses do not exceed the limitation set forth above. For the year ended January 31, 2013, the Adviser waived fees of $91,129.
The amounts subject to repayment by the Fund, pursuant to the aforementioned conditions, at January 31, 2013 are as follows:
| | | | |
Amount | | | January 31, |
| | $129,687 | | | 2014 |
| | $107,613 | | | 2015 |
| | $ 91,129 | | | 2016 |
The Trust retains Huntington Asset Services, Inc. (“HASI”) to manage the Fund’s business affairs and provide the Fund with administrative services, including all regulatory reporting and necessary office equipment and personnel. For the fiscal year ended January 31, 2013, HASI earned fees of $34,998 for administrative services provided to the Fund. At January 31, 2012, HASI was owed $2,917 from the Fund for administrative services. Certain officers of the Trust are members of management and/or employees of HASI. HASI is a wholly-owned subsidiary of Huntington Bancshares, Inc., the parent company of Unified Financial Securities, Inc. (the “Distributor”) and Huntington National Bank, the custodian of the Fund’s investments (the “Custodian”). For the fiscal year ended January 31, 2013, the Custodian earned fees of $8,183 for custody services provided to the Fund. At January 31, 2013, the Custodian was owed $414 from the Fund for custody services.
The Trust also retains HASI to act as the Fund’s transfer agent and to provide fund accounting services. For the fiscal year ended January 31, 2013, HASI earned fees of $36,176 for transfer agent services to the Fund. At January 31, 2013, the Fund owed HASI $3,251 for transfer agent services.
18
Golub Group Equity Fund
Notes to the Financial Statements – continued
January 31, 2013
NOTE 4. FEES AND OTHER TRANSACTIONS WITH AFFILIATES – continued
For the fiscal year ended January 31, 2013, HASI earned fees of $25,000 from the Fund for fund accounting services. At January 31, 2013, HASI was owed $2,083 from the Fund for fund accounting services.
The Fund has adopted a Distribution Plan pursuant to Rule 12b-1 under the 1940 Act (the “Plan”). The Plan provides that the Fund will pay the Distributor and/or any registered securities dealer, financial institution or any other person (the “Recipient”) a shareholder servicing fee of 0.25% of the average daily net assets of the Fund in connection with the promotion and distribution of the Fund’s shares or the provision of personal services to shareholders, including, but not necessarily limited to, advertising, compensation to underwriters, dealers and selling personnel, the printing and mailing of prospectuses to other than current Fund shareholders, the printing and mailing of sales literature and servicing shareholder accounts (“12b-1 Expenses”). The Fund or Distributor may pay all or a portion of these fees to any recipient who renders assistance in distributing or promoting the sale of shares, or who provides certain shareholder services, pursuant to a written agreement. The Plan is a compensation plan, which means that the Plan will benefit shareholders because an effective sales program typically is necessary in order for the Fund to reach and maintain a sufficient size to achieve efficiently its investment objectives and to realize economies of scale. The Plan is not active and will not be activated prior to May 31, 2013.
Unified Financial Securities, Inc. acts as the principal distributor of the Fund’s shares. There were no payments made by the Fund to the Distributor during the fiscal year ended January 31, 2013. An officer of the Trust is an officer of the Distributor and such person may be deemed to be an affiliate of the Distributor.
NOTE 5. INVESTMENTS
For the fiscal year ended January 31, 2013, purchases and sales of investment securities, other than short-term investments and short-term U.S. government obligations, were as follows:
| | | | |
| | | Amount | |
Purchases | | | | |
U.S. Government Obligations | | $ | — | |
Other | | | 8,314,744 | |
Sales | | | | |
U.S. Government Obligations | | $ | — | |
Other | | | 4,477,463 | |
At January 31, 2013, the net unrealized appreciation (depreciation) of investments for tax purposes was as follows:
| | | | |
Gross Appreciation | | $ | 5,513,251 | |
Gross (Depreciation) | | | (305,946 | ) |
| | | | |
Net Appreciation (Depreciation) on Investments | | $ | 5,207,305 | |
| | | | |
At January 31, 2013, the aggregate cost of securities, excluding U.S. government obligations, for federal income tax purposes was $27,549,150 for the Fund.
NOTE 6. ESTIMATES
The preparation of financial statements in conformity with GAAP requires management to make estimates and assumptions that affect the reported amounts of assets and liabilities and disclosure of contingent assets and liabilities at the date of the financial statements and the reported amounts of increases and decreases in net assets from operations during the reporting period. Actual results could differ from those estimates.
19
Golub Group Equity Fund
Notes to the Financial Statements – continued
January 31, 2013
NOTE 7. BENEFICIAL OWNERSHIP
The beneficial ownership, either directly or indirectly, of 25% or more of the voting securities of a fund creates a presumption of control of a fund, under Section 2(a) (9) of the Investment Company Act of 1940. At January 31, 2013, Charles Schwab owned, as record shareholder, 95.99% of the outstanding shares of the Fund. The Trust does not know whether Charles Schwab or any of the underlying beneficial owners owned or controlled 25% or more of the voting securities of the Fund.
NOTE 8. DISTRIBUTIONS TO SHAREHOLDERS
On December 28, 2012, the Fund paid an income distribution of $0.1437 per share and a long-term capital gain distribution of $0.3565 per share, to shareholders of record on December 27, 2012.
The tax characterization of distributions for the fiscal periods ended January 31, 2013 and January 31, 2012, were as follows:
| | | | | | | | |
| | | 2013 | | | 2012 | |
Distributions paid from: | | | | | | | | |
Ordinary Income* | | $ | 283,345 | | | $ | 470,799 | |
Long-term Capital Gain | | | 719,902 | | | | 1,002,875 | |
| | | | | | | | |
| | $ | 1,003,247 | | | $ | 1,473,674 | |
| | | | | | | | |
| * | Short term capital gain distributions are treated as ordinary income for tax purposes. |
At January 31, 2013, the components of distributable earnings (accumulated losses) on a tax basis were as follows:
| | | | |
Undistributed long-term capital gains | | | 235,561 | |
Accumulated capital and other losses | | | (7,954 | ) |
Unrealized appreciation (depreciation) | | | 5,207,305 | |
| | | | |
| | $ | 5,434,912 | |
| | | | |
At January 31, 2013, the difference between book basis and tax basis unrealized appreciation (depreciation) is attributable to the tax deferral of losses on wash sales in the amount of $519.
Under current tax law, net investment losses and capital losses realized after October 31 of a Fund’s fiscal year may be deferred and treated as occurring on the first business day of the following fiscal year for tax purposes. The Fund deferred losses as follows:
| | | | |
| | | Late Year
Ordinary Loss | |
Golub Group Equity Fund | | $ | 7,954 | |
NOTE 9. COMMITMENTS AND CONTINGENCIES
The Fund indemnifies its officers and trustees for certain liabilities that may arise from their performance of their duties to the Fund. Additionally, in the normal course of business, the Fund enters into contracts that contain a variety of representations and warranties which provide general indemnifications. The Fund’s maximum exposure under these arrangements is unknown, as this would involve future claims that may be made against the Fund that have not yet occurred.
20

REPORT OF INDEPENDENT REGISTERED PUBLIC ACCOUNTING FIRM
To the Shareholders and Board of Trustees of
Golub Group Equity Fund
(Valued Advisers Trust)
We have audited the accompanying statement of assets and liabilities, including the schedule of investments, of Golub Group Equity Fund (the “Fund”), a series of the Valued Advisers Trust, as of January 31, 2013, and the related statement of operations for the year then ended, and the statements of changes in net assets and the financial highlights for each of the two years in the year then ended. These financial statements and financial highlights are the responsibility of the Fund’s management. Our responsibility is to express an opinion on these financial statements and financial highlights based on our audits. The financial highlights for the periods ended prior to January 31, 2012, were audited by other auditors whose report dated March 22, 2011 expressed an unqualified opinion on those financial highlights.
We conducted our audits in accordance with the standards of the Public Company Accounting Oversight Board (United States). Those standards require that we plan and perform the audit to obtain reasonable assurance about whether the financial statements and financial highlights are free of material misstatement. An audit includes examining, on a test basis, evidence supporting the amounts and disclosures in the financial statements. Our procedures included confirmation of securities owned as of January 31, 2013, by correspondence with the custodian and broker. An audit also includes assessing the accounting principles used and significant estimates made by management, as well as evaluating the overall financial statement presentation. We believe that our audits provide a reasonable basis for our opinion.
In our opinion, the financial statements and financial highlights referred to above present fairly, in all material respects, the financial position of Golub Group Equity Fund as of January 31, 2013, and the results of its operations for the year then ended, and the changes in its net assets and the financial highlights for each of the two years in the year then ended, in conformity with accounting principles generally accepted in the United States of America.

COHEN FUND AUDIT SERVICES, LTD.
Cleveland, Ohio
March 26, 2013

TRUSTEES AND OFFICERS (Unaudited)
The Board of Trustees supervises the business activities of the Trust. Each Trustee serves as a trustee until termination of the Trust unless the Trustee dies, resigns, retires or is removed.
The following tables provide information regarding the Trustees and Officers.
The following table provides information regarding each of the Independent Trustees.
| | |
Name, Address*, (Age), Position with
Trust**, Term of Position with Trust | | Principal Occupation During Past 5 Years and Other Directorships |
| Dr. Merwyn R. Vanderlind, 76, Independent Trustee, August 2008 to present. | | Retired; Consultant to Battelle Memorial Institute (International Science and Technology Research Enterprise) on business investments from 2001 to 2003; Formerly employed with Battelle Memorial Institute from 1966 to 2003 in various positions, including the Executive Vice President of Battelle Institute from 1991 to 2001, General Manager from 1985 to 1991, Director of the Battelle Industrial Technology Center (Geneva, Switzerland) from 1983 to 1985, and Practicing Researcher from 1966 to 1983. |
| |
Ira Cohen, 53 Independent Trustee, June 2010 to present. | | Independent financial services consultant (Feb. 2005 - present); Senior Vice President, Dealer Services / Institutional Services, AIM Investment Services, Inc. (1992 – 2005). |
| * | The address for each trustee and officer is 2960 N. Meridian St., Suite 300, Indianapolis, IN 46208. |
| ** | The Trust consists of 15 series. |
The following table provides information regarding the Trustee who is considered an “interested person” of the Trust, as that term is defined under the 1940 Act. Based on the experience of the Trustee, the Trust concluded that the individual described below should serve as a Trustee.
| | |
Name, Address*, (Age), Position with
Trust**, Term of Position with Trust | | Principal Occupation During Past 5 Years and Other Directorships |
| R. Jeffrey Young, 48, Trustee and Chairman, June 2010 to present. | | Principal Executive Officer and President, Valued Advisers Trust since February 2010; Senior Vice President, Huntington Asset Services, Inc. since January 2010; Chief Executive Officer, Huntington Funds since February 2010; Chief Executive Officer, The Huntington Strategy Shares since November 2010; President and Chief Executive Officer, Dreman Contrarian Funds March 2011 to February 2013; Trustee, Valued Advisers Trust, August 2008 to January 2010; Managing Director and Chief Operating Officer of Professional Planning Consultants 2007 to 2010; Co-Founder of Kinwood Group, LLC July 2007 to March 2008; President and Chief Executive Officer of The Coventry Group from 2000 to 2007; President and Chief Executive Officer of the STI Classic Funds from 2004 to 2007; Trustee of the Coventry Group from 1999 to 2005; and Senior Vice President of BISYS Fund Services / The Winsbury Company October 1993 to June 2007. |
| * | The address for each trustee and officer is 2960 N. Meridian St., Suite 300, Indianapolis, IN 46208. |
| ** | The Trust consists of 15 series. |
The following table provides information regarding the Officers of the Trust:
| | |
Name, Address*, (Age), Position with
Trust,** Term of Position with Trust | | Principal Occupation During Past 5 Years and Other Directorships |
| R. Jeffrey Young, 48, Principal Executive Officer and President, February 2010 to present. | | Trustee, Valued Advisers Trust since June 2010; Senior Vice President, Huntington Asset Services, Inc. since January 2010; Chief Executive Officer, Huntington Funds since February 2010; President and Chief Executive Officer, Dreman Contrarian Funds since March 2011; Trustee, Valued Advisers Trust, August 2008 to January 2010; Managing Director and Chief Operating Officer of Professional Planning Consultants 2007 to 2010; Co-Founder of Kinwood Group, LLC July 2007 to March 2008; President and Chief Executive Officer of The Coventry Group from 2000 to 2007; President and Chief Executive Officer of the STI Classic Funds from 2004 to 2007; Trustee of the Coventry Group from 1999 to 2005; and Senior Vice President of BISYS Fund Services/The Winsbury Company October 1993 to June 2007. |
| |
| John C. Swhear, 51, Chief Compliance Officer, AML Officer and Vice President, August 2008 to present. | | Vice President of Legal Administration and Compliance for Huntington Asset Services, Inc., the Trust’s administrator, since April 2007; Chief Compliance Officer of Unified Financial Securities, Inc., the Trust’s distributor, since May 2007; Senior Vice President of the Unified Series Trust since May 2007; Secretary of Huntington Funds since April 2010; President and Chief Executive Officer of Dreman Contrarian Funds from March 2010 to March 2011, and Vice President and Acting Chief Executive Officer, 2007 to March 2010 ; Employed in various positions with American United Life Insurance Company from 1983 to April 2007, including: Associate General Counsel, April 2007; Investment Advisor Chief Compliance Officer, June 2004 to April 2007; Assistant Secretary to the Board of Directors, December 2002 to April 2007; Chief Compliance Officer of OneAmerica Funds, Inc., June 2004 to April 2007; Chief Counsel and Secretary, OneAmerica Securities, Inc., December 2002 to April 2007. |
| |
| Carol J. Highsmith, 48, Vice President, August 2008 to present. | | Employed in various positions with Huntington Asset Services, Inc., the Trust’s administrator, since November of 1994; currently Vice President of Legal Administration. |
| |
| Matthew J. Miller, 36, Vice President, December 2011 to present. | | Employed in various positions with Huntington Asset Services, Inc., the Trust’s administrator, since July of 1998; currently Vice President of Relationship Management; Vice President of Huntington Funds since February 2010. |
| |
Robert W. Silva, 46, Interim Treasurer, January 2013 to present | | Senior Vice President, Fund Administration for Huntington Asset Services, Inc., the Trust’s administrator, since October 2011, Vice President from September 2010 to October 2011; Treasurer of Huntington Funds since November 2010; Chief Financial Officer and Treasurer of The Huntington Strategy Shares since November 2010; Treasurer and Chief Financial Officer of Dreman Contrarian Funds March 2011 to February 2013; Treasurer and Chief Financial Officer of Unified Series Trust since June 2011; Senior Vice President of Citi Fund Services Ohio, Inc. from September 2007 to September 2010. |
| |
Heather Bonds, 37, Secretary, October 2012 to present. | | Employed in various positions with Huntington Asset Services, Inc., the Trust’s administrator, since January of 2004; currently Certified Paralegal and Section Manager 2. |
| * | The address for each trustee and officer is 2960 N. Meridian St., Suite 300, Indianapolis, IN 46208. |
| ** | The Trust consists of 15 series. |
Other Information
The Fund’s Statement of Additional Information (“SAI”) includes additional information about the trustees and is available without charge, upon request. You may call toll-free at (866) 954-6682 to request a copy of the SAI or to make shareholder inquiries.
Management Agreement Renewal – (Unaudited)
At a meeting held on September 18, 2012, the Board of Trustees (the “Board”) considered the renewal of the Investment Advisory Agreement (“Agreement”) between the Trust and Golub Group, LLC (the “Adviser”). Counsel noted that the 1940 Act requires the approval of the investment advisory agreements between the Trust and its service providers by a majority of the Independent Trustees. The Board discussed the arrangements between the Adviser and the Trust with respect to the Golub Group Equity Fund (the “Golub Fund”). The Board reviewed a memorandum from Counsel, and addressed to the Trustees that summarized, among other things, the fiduciary duties and responsibilities of the Board in reviewing and approving the renewal of the Agreement. A copy of this memorandum was circulated to the Trustees in advance of the meeting. Counsel discussed with the Trustees the types of information and factors that should be considered by the Board in order to make an informed decision regarding the approval of the renewal of the Agreement, including the following material factors: (i) the nature, extent, and quality of the services provided by the Adviser; (ii) the investment performance of the Golub Fund; (iii) the costs of the services to be provided and profits to be realized by the Adviser from the relationship with the Golub Fund; (iv) the extent to which economies of scale would be realized if the Golub Fund grows and whether advisory fee levels reflect those economies of scale for the benefit of the Golub Fund’s investors; and (v) the Adviser’s practices regarding possible conflicts of interest.
In assessing these factors and reaching its decisions, the Board took into consideration information furnished for the Board’s review and consideration throughout the year at regular Board meetings, as well as information specifically prepared and/or presented in connection with the annual renewal process, including information presented at the Meeting. The Board requested and was provided with information and reports relevant to the annual renewal of the Agreement, including: (i) reports regarding the services and support provided to the Golub Fund and its shareholders by the Adviser; (ii) quarterly assessments of the investment performance of the Golub Fund by personnel of the Adviser; (iii) commentary on the reasons for the performance; (iv) presentations by Golub Fund management addressing Golub’s investment philosophy, investment strategy, personnel and operations; (v) compliance and audit reports concerning the Golub Fund and the Adviser; (vi) disclosure information contained in the registration statement of the Trust and the Form ADV of the Adviser; (vii) information on relevant developments in the mutual fund industry and how the Golub Fund and/or Golub are responding to them; and (viii) a memorandum from Counsel, that summarized the fiduciary duties and responsibilities of the Board in reviewing and approving the Agreement, including the material factors set forth above and the types of information included in each factor that should be considered by the Board in order to make an informed decision. The Board also requested and received various informational materials including, without limitation: (i) documents containing information about Golub, including financial information, a description of personnel and the services provided to the Golub Fund, information on investment advice, performance, summaries of Fund expenses, compliance program, current legal matters, and other general information; (ii) comparative expense and performance information for other mutual funds with strategies similar to the Golub Fund; (iii) the anticipated effect of size on the Golub Fund’s performance and expenses; and (iv) benefits to be realized by the Adviser from its relationship with the Golub Fund. The Board did not identify any particular information that was most relevant to its consideration to approve the Agreement and each Trustee may have afforded different weight to the various factors.
1. The nature, extent, and quality of the services to be provided by the Adviser. In this regard, the Board considered the Adviser’s responsibilities under the Agreement. The Trustees considered the services being provided by the Adviser to the Fund including, without limitation: the quality of its investment advisory services (including research and recommendations with respect to portfolio securities), its process for formulating investment recommendations and assuring compliance with the Fund’s investment objectives and limitations, its coordination of services for the Fund among the Fund’s service providers, and its efforts to promote the Fund and grow its assets. The Trustees considered the Adviser’s continuity of, and commitment to retain, qualified personnel and the Adviser’s commitment to maintain and enhance its resources and systems, the commitment of the Adviser’s personnel to finding alternatives and options that allow the Golub Fund to maintain its goals, and the Adviser’s continued cooperation with the Independent Trustees and Counsel for the Fund. The Trustees considered the Adviser’s personnel, including the education and experience of the Adviser’s personnel. After considering the foregoing information and further information in the Meeting materials provided by the Adviser (including the Adviser’s Form ADV), the Board concluded that, in light of all the facts and circumstances, the nature, extent, and quality of the services provided by the Adviser were satisfactory and adequate for the Fund.
Management Agreement Renewal – (Unaudited) – continued
2. Investment Performance of the Fund and the Adviser. In considering the investment performance of the Fund and the Adviser, the Trustees compared the short-term and since inception performance of the Fund with the performance of funds with similar objectives managed by other investment advisers, as well as with aggregated peer group data. The Trustees also considered the consistency of the Adviser’s management of the Fund with its investment objective, strategies, and limitations. The Trustees considered the Fund’s performance relative to the performance of the Adviser’s composite for accounts managed similarly to the Fund based on recent data. The Trustees noted that the Fund’s performance on a year-to-date, three month, one-year, three-year, and since inception basis compared very favorably to many of its peers. After reviewing and discussing the investment performance of the Fund further, the Adviser’s experience managing the Fund, the Adviser’s historical performance, and other relevant factors, the Board concluded, in light of all the facts and circumstances, that the investment performance of the Fund and the Adviser was acceptable.
3. The costs of the services to be provided and profits to be realized by the Adviser from the relationship with the Fund. In considering the costs of services to be provided and the profits to be realized by the Adviser from the relationship with the Fund, the Trustees considered: (1) the Adviser’s financial condition; (2) asset level of the Fund; (3) the overall expenses of the Fund; and (4) the nature and frequency of advisory fee payments. The Trustees reviewed information provided by the Adviser regarding its profits associated with managing the Fund. The Trustees also considered potential benefits for the Adviser in managing the Fund. The Trustees then compared the fees and expenses of the Fund (including the management fee) to other comparable mutual funds. The Trustees noted that the Fund’s management fee tended to be toward the higher end of the comparable mutual funds although the overall expense ratio of the Fund was lower than some of the specifically identified comparable funds and higher than others. Based on the foregoing, the Board concluded that the fees to be paid to the Adviser by the Fund and the profits to be realized by the Adviser, in light of all the facts and circumstances, were fair and reasonable in relation to the nature and quality of the services provided by the Adviser.
4. The extent to which economies of scale would be realized as the Fund grows and whether advisory fee levels reflect these economies of scale for the benefit of the Fund’s investors. In this regard, the Board considered the Fund’s fee arrangements with the Adviser. The Board considered that while the management fee remained the same at all asset levels, the Fund’s shareholders had experienced benefits from the Fund’s expense limitation arrangement. The Trustees noted that since the Fund’s expenses fell below the cap set by the arrangement, the Fund’s shareholders would continue to benefit from the economies of scale under the Fund’s agreements with service providers other than the Adviser. In light of its ongoing consideration of the Fund’s asset levels, expectations for growth in the Fund, and fee levels, the Board determined that the Fund’s fee arrangements, in light of all the facts and circumstances, were fair and reasonable in relation to the nature and quality of the services provided by the Adviser.
5. Possible conflicts of interest. In considering the Adviser’s practices regarding conflicts of interest, the Trustees evaluated the potential for conflicts of interest and considered such matters as the experience and ability of the advisory personnel assigned to the Fund; the basis of decisions to buy or sell securities for the Fund and/or the Adviser’s other accounts; and the substance and administration of the Adviser’s code of ethics. The Trustees also considered disclosure in the registration statement of the Trust relating to the Adviser’s potential conflicts of interest. Based on the foregoing, the Board determined that the Adviser’s standards and practices of the Advisers relating to the identification and mitigation of potential conflicts of interest were satisfactory.
After additional consideration of the factors delineated in the memorandum provided by Counsel and further discussion among the Board, the Board determined to renew the Agreement between the Trust and the Adviser for one additional year.
PROXY VOTING
A description of the policies and procedures that the Fund uses to determine how to vote proxies relating to portfolio securities and information regarding how the Fund voted those proxies is available without charge upon request by (1) calling the Fund at (866) 954-6682 and (2) from Fund documents filed with the Securities and Exchange Commission (“SEC”) on the SEC’s website at www.sec.gov.
TRUSTEES
R. Jeffrey Young, Chairman
Dr. Merwyn R. Vanderlind
Ira Cohen
OFFICERS
R. Jeffrey Young, Principal Executive Officer and President
John C. Swhear, Chief Compliance Officer, AML Officer and Vice-President
Carol J. Highsmith, Vice President
Matthew J. Miller, Vice President
Robert W. Silva, Interim Principal Financial Officer and Treasurer
Heather Bonds, Secretary
INVESTMENT ADVISER
Golub Group, LLC
1850 Gateway Drive, Suite 100
San Mateo, CA 94404
DISTRIBUTOR
Unified Financial Securities, Inc.
2960 North Meridian Street, Suite 300
Indianapolis, IN 46208
INDEPENDENT REGISTERED PUBLIC ACCOUNTING FIRM
Cohen Fund Audit Services, Ltd.
1350 Euclid Avenue, Suite 800
Cleveland, OH 44115
LEGAL COUNSEL
The Law Offices of John H. Lively & Associates, Inc.,
A member firm of The 1940 Act Law GroupTM
11300 Tomahawk Creek Pkwy, Suite 310
Leawood, KS 66211
CUSTODIAN
Huntington National Bank
41 S. High St.
Columbus, OH 43215
ADMINISTRATOR, TRANSFER AGENT AND FUND ACCOUNTANT
Huntington Asset Services, Inc.
2960 North Meridian Street, Suite 300
Indianapolis, IN 46208
This report is intended only for the information of shareholders or those who have received the Fund’s prospectus which contains information about the Fund’s management fee and expenses. Please read the prospectus carefully before investing.
Distributed by Unified Financial Securities, Inc.
Member FINRA/SIPC
PRIVACY POLICY
The following is a description of the Fund’s policies regarding disclosure of nonpublic personal information that you provide to the Fund or that the Fund collects from other sources. In the event that you hold shares of the Fund through a broker-dealer or other financial intermediary, the privacy policy of your financial intermediary would govern how your nonpublic personal information would be shared with nonaffiliated third parties.
Categories of Information the Fund Collects. The Fund collects the following nonpublic personal information about you:
| | • | | Information the Fund receives from you on applications or other forms, correspondence, or conversations (such as your name, address, phone number, social security number, and date of birth); and |
| | • | | Information about your transactions with the Fund, its affiliates, or others (such as your account number and balance, payment history, cost basis information, and other financial information). |
Categories of Information the Fund Discloses. The Fund does not disclose any nonpublic personal information about its current or former shareholders to unaffiliated third parties, except as required or permitted by law. The Fund is permitted by law to disclose all of the information it collects, as described above, to service providers (such as the Fund’s custodian, administrator, transfer agent, accountant and legal counsel) to process your transactions and otherwise provide services to you.
Confidentiality and Security. The Fund restricts access to your nonpublic personal information to those persons who require such information to provide products or services to you. The Fund maintains physical, electronic, and procedural safeguards that comply with federal standards to guard your nonpublic personal information.
Disposal of Information. The Fund, through its transfer agent, has taken steps to reasonably ensure that the privacy of your nonpublic personal information is maintained at all times, including in connection with the disposal of information that is no longer required to be maintained by the Fund. Such steps shall include, whenever possible, shredding paper documents and records prior to disposal, requiring off-site storage vendors to shred documents maintained in such locations prior to disposal, and erasing and/or obliterating any data contained on electronic media in such a manner that the information can no longer be read or reconstructed.
ANNUAL REPORT
January 31, 2013

Angel Oak Multi-Strategy Income Fund
Angel Oak Capital Advisors, LLC
One Buckhead Plaza
3060 Peachtree Road NW Suite 1080
Atlanta, GA 30305
(404) 953-4902
Dear Angel Oak Investor:
On behalf of the team here at Angel Oak Capital Advisors, LLC, we are pleased to provide you with this Annual Report. Last year marked a historic year for Angel Oak, surpassing $2 billion of assets under management. Our portfolio management desk continues to strive for high risk-adjusted returns in this volatile, low interest rate environment. We would like to thank you for your continued support of Angel Oak Capital Advisors, LLC and the Angel Oak Multi-Strategy Income Fund.
Respectfully,
Angel Oak Capital Advisors, LLC, Asset Management
| | |
Brad Friedlander
Head Portfolio Manager
Co-Founder, Managing Partner | | Ashish Negandhi Portfolio Manager Managing Director |
1
Management’s Discussion of Fund Performance
2012 Financial Market Highlights
Many factors drove the investment returns of the mutual fund throughout the last year. The improving economic environment, dovish monetary policy, rising home prices, and the flattening yield curve all benefited U.S. fixed income markets, and more appropriately for this discussion, assets held in the Fund.
Home prices looked to have reached a bottom in January of 2012, up 6.95% since the low as measured by the Case-Shiller Composite-20 Home Price Index (SA). We believe this trend should continue as the leading indicators of the housing market point to a positive outlook: housing affordability remains at an all-time high, Fed monetary policy continues to anchor mortgage rates low, and existing housing supply is rapidly declining each month. This overall improvement in housing fundamentals has benefited the Fund’s allocation to private label mortgage-backed securities by lowering future loss expectations and boosting current prices.
The main focus within the non-agency RMBS asset class was senior pay, maximum subordinated tranches with Prime and Alt-A underlying collateral. While we believe mortgage-related assets would outperform given their current valuations, there were still additional uncertainties associated with servicer activity, refi ability of mortgage holders, etc. Given these headwinds, the Fund utilized the credit enhancement inherent in the structure to protect bondholders from potential credit losses. This focus on the senior classes helped damper price volatility throughout 2012.
In addition to non-agency mortgages, the Fund had a diverse allocation to other fixed income asset classes including, non-amortizing agency debt, agency mortgages (passthroughs), CMBS, and investment grade and high yield corporate bonds. Agency mortgages had two competing forces that drove performance in 2012. As the Fed remained dovish in their monetary policy stance, both long-term interest rates and mortgage rates were driven lower, increasing prepayment speeds on the underlying pools, which decreased total return. However, these were fixed rate assets, thus lower rates pushed prices higher due to their positive duration profile. Both of these factors help drive performance, resulting in marginally positive net returns for the year.
Credit spreads across the corporate space declined in 2012. U.S. corporations overall were able to improve their bottom-line net income last year while reducing their cost of capital by taking advantage of record-low interest rates. Both of these factors were positive for the balance sheets of U.S. companies which were reflected in their declining credit spreads. In 2012, investment grade and high yield corporate spreads declined approximately 971 and 1202 basis points, respectively.
Prices across the non-agency RMBS sectors increased approximately 10%-30% throughout last year. In the face of such steep valuation increases, we believe many
2
Management’s Discussion of Fund Performance — (continued)
bonds still remain undervalued. In this context, we favor non-agencies for their high risk-adjusted return potential, focusing on specific sectors and sub-sectors that we believe provide strong opportunities for high income and price appreciation as risk premiums continue to decline. In the remaining discussion, we discuss key financial landmarks of last year across fixed income, a deeper look into non-agency mortgage bonds, and some additional asset classes we view may provide opportunities to Fund shareholders in 2013.
2013 MARKET OUTLOOK
ASSESSING THE LANDSCAPE IN FIXED INCOME
2012 was a historic year in the U.S. fixed income markets. The benchmark 10 year Treasury bond touched an all-time record low yield of 1.39% in July. The average 30-year mortgage rate hit a “new” low eight times. The Fed extended its Quantitative Easing (QE) program a second and a third time and also committed to keeping its key short-term rate near zero until unemployment goes below 6.5% or inflation rises above 2.5%. Why were there such drastic policy changes and why does every announcement from the Federal Open Market Committee (“FOMC”) seem to have historic consequences? In our view, the 2007 crisis and subsequent collapse of the banking system have clearly had an extraordinary impact on both the global economy and central bank policies that continues to this day.
The U.S economy recently experienced a financial crisis that resulted in painful deleveraging for institutions and individuals alike. The U.S. financial sector has traditionally relied heavily on lending against assets that have either appreciating (or at least stable) values or that generate significant cash flows. Depreciating values and interrupted cash flows on collateral assets have significantly diminished financial performance in the fixed income space since 2007. The Fed has taken a number of steps to inflate the U.S. economy and stimulate growth to counteract the deflationary downdrafts caused by the credit crisis. It now appears likely that the Fed may pull off the previously unthinkable: inflating the economy while keeping rates low. But how much longer can this last?
Outstanding total U.S. Treasury debt was $11.6 trillion (73% of GDP) at year-end 2012, a large number but far from its peak of 113% of GDP at the end of WWII. The Fed’s balance sheet is projected to swell to over $4.0 trillion in 2013 as a result of ongoing QE-related bond purchases. We believe that these measures have contributed to the stabilization of housing prices and will ultimately reflate the economy in coming years. We also feel that the current QE program will continue to keep rates at historic lows across the yield curve in the near term. However, we believe that prudent investors should begin to position their portfolios in expectation of higher rates in the longer term.
Angel Oak anticipates that the dilemma of allocating positions between interest rate risk and credit risk exposures will continue into 2013. This additional risk warrants
3
Management’s Discussion of Fund Performance — (continued)
more attention than in past years. We continue to favor owning credit-sensitive floating rate bonds that will benefit from reflation while avoiding interest-sensitive fixed rate securities. Our 2013 outlook indicates that the best opportunities are in senior-secured, non-agency residential mortgage-backed securities and we will continue to heavily overweight that sector. In addition, we are actively monitoring other sectors across the structured credit spectrum and are making targeted allocations to collateralized loan obligations (CLOs), commercial mortgage-backed securities (CMBS), and esoteric securities. We believe that these sectors will provide even more attractive opportunities for our clients over the next 12-24 months.
NON-AGENCY RESIDENTIAL MORTGAGE-BACKED SECURITIES (NA RMBS)
In a world of low yields and shrinking risk premiums, we believe non-agency RMBS still offer considerable yield pick-up relative to other credit-sensitive assets. Long term technical factors should remain positive and non-agency investors are expected to receive $70-$80 billion in principal pay-downs per annum for the next two years. Since 2008, Angel Oak has stayed the course by focusing on senior secured non-agency RMBS originated in 2005 and earlier which are backed by prime and near-prime collateral. While we were waiting patiently for stability in the housing market, these older vintages provided our investors with greater equity in the underlying collateral and potentially more predictability in borrower behavior and therefore cash flows. We believe almost all recent data related to housing shows continued stabilization in home prices, inventories, unemployment, and delinquencies, factors which should bode well for the future performance of mortgage-related assets.
We continue to favor the 2003-2005 vintages of non-agency RMBS because of the longer payment history and stricter underwriting standards in place during those years. However, we have selectively started looking more closely into the 2006-2007 vintages as they generally provide similar yields at slightly more favorable prices in our view. We expect many more borrowers to get back “above water” as the housing market continues to recover. In support of this view, J.P. Morgan recently published data indicating that the number of underwater borrowers last year fell from 11 million to 7 million, and their projections suggest that the number could decline to 4 million within two years.
With strong fundamental and technical factors in place, non-agency RMBS have the potential to outperform in 2013. We believe the major risks are external and include uncertainty in Europe over sovereign debt levels and the status of the euro as well as political issues related to the U.S. debt ceiling and the “fiscal cliff.” A significant sell-off due to increasing rates is also a concern in some non-agency sectors but in our view remains unlikely. We believe that the combination of favorable expected yields coupled with purchase discounts to par (average prices in the $90 range) make non-agency mortgage-backed securities an attractive investment that will continue to outperform the broader credit markets.
4
Management’s Discussion of Fund Performance — (continued)
COLLATERALIZED LOAN OBLIGATIONS (CLOs)
Stable performance in credit markets should translate into another solid year for CLOs, which are structured securities with collateral generally comprising high yield leveraged bank loans. New issue volumes are expected to be $80-$100 billion in 2013. Unlike high yield corporate bonds, high yield bank loans are typically senior secured, first-lien leveraged loans. Similar in structure to other asset-backed securities, CLOs have a defined priority for cash flows and losses associated with the underlying collateral assets. CLOs are typically floating rate securities with average lives of 4-5 years. Given the low rate environment and tighter spreads in competing products, CLOs are expected to continue providing attractive floating rate returns with minimal duration risk even in a rising rate environment.
It is important to note that no AAA-rated CLO class has ever experienced a principal loss or an interruption of payments, including during the recent credit crisis. In addition, new structures since the crisis have evolved to provide greater protection to the more senior classes. Average recovery rates have been about 62% since the mid-90s, reaching a low of 44% in late 2009. Assuming a worst-case scenario recovery rate of 44%, over 60% of loans would have to default to experience a loss in the AAA-rated senior class. We believe that the likelihood of this scenario occurring is remote in the extreme.
We expect key risk metrics such as underlying default rates, CCC-rated buckets, over-collateralization, and net asset value coverage to remain within acceptable levels that would not threaten principal and interest payments to the more senior classes of these bonds. The main risk for CLOs and other credit-sensitive securities continue to be the macroeconomic factors cited earlier. CLO sector performance would be adversely affected if shocks occurred similar to those experienced early in the summer of 2012. In our view, the probability of these types of tail risk events occurring has been significantly reduced by central bank policies and overall improvements in global economic conditions. We believe that pools of senior secured bank loans offer better relative value than unsecured high yield corporate bonds. Furthermore, we favor the capital structure of CLOs (credit support through subordination) over whole loan assets as protection against downside risks. Most importantly, we favor the protection against increases in interest rates that these floating rate securities provide.
COMMERCIAL MORTGAGE-BACKED SECURITIES (CMBS)
New issue supply of CMBS should be close to $55.0 billion in 2013. While this is still off the highs of 2007, this represents continuing improvement from prior years. In the last half of 2011, the CMBS market experienced a significant risk-off event as spreads moved sharply wider. This was not the case in 2012 as investors dipped down the credit curve and bought lower-rated classes that became more attractive due to overall improvements in commercial real estate markets. This resulted in spreads tightening across all classes to levels not seen since before the crisis of 2008.
5
Management’s Discussion of Fund Performance — (continued)
We expect demand for CMBS securities to be strong as this sector is one of the few where there is significant new issue supply. Current spreads are also attractive relative to similarly rated corporate bonds. We do not view the down-in-credit trade as providing good relative value versus other alternatives. Instead, we favor purchasing AAA-rated super senior tranches of newly originated CMBS and avoiding down-in-credit trades in older vintages.
ESOTERIC ASSET BACKED SECURITIES (Esoteric ABS)
The esoteric sector began to steadily gain respect post-crisis for one major reason: While the world was unraveling and losses were mounting exponentially on conventional structures such as home equity ABS, losses were broadly contained in the esoteric sector.
We believe esoterics remain an attractive alternative as the search for yield continues into 2013 and income-focused investors begin to think more creatively. The underlying collateral in these securities can be composed of structured settlements, insurance premiums, royalties, intellectual property rights, and many other forms of cash flow-generating assets. We view this sector as an opportunistic niche within the ABS universe, with many well-structured deals providing investors in senior classes with more than adequate protection against expected losses. Unlike the non-agency RMBS sector (which has essentially been all but frozen), the esoteric ABS sector is steadily bringing new deals to the market to meet the demand from investors seeking diversification into higher yielding credit-sensitive securities.
One major attraction of these securities is that their cash flows and yield characteristics tend to be uncorrelated with more traditional structured financial instruments. Esoterics should be less directly impacted by economic factors that typically affect individuals and corporations and therefore would provide an opportunity to add diversification to fixed income portfolios.
In our view, market momentum continues to favor esoteric ABS as this sector offers relative value in a yield-starved universe. Many of these deals remain attractive on a risk-adjusted basis versus more conventional ABS. We would advise potential investors to factor in liquidity concessions as the depth of this market is still developing. Nevertheless, Angel Oak will continue to look to the esoteric ABS sector opportunistically as a source of relative value providing uncorrelated cash flows and above market yields.
IN SUMMARY
Angel Oak expects that improvements in housing and real estate markets will continue to be supported by fiscal and monetary initiatives as well as improvements in fundamental economic factors. The Fed’s ongoing commitment to QE is expected to
6
Management’s Discussion of Fund Performance — (continued)
keep mortgage rates low, making housing more affordable and refinancing more viable for greater numbers of borrowers. These developments are all extremely favorable for mortgage-related securities. We expect the Fund to remain over-weight in non-agency mortgage-backed securities as we believe the best opportunity lies in senior-secured, non-agency RMBS. In addition, we will continue to monitor other sectors across the structured credit spectrum and make targeted allocations when attractive opportunities are identified.
We thank you for your continued support of Angel Oak Capital and the Angel Oak Multi-Strategy Income Fund,
Angel Oak Capital Advisors, LLC, Asset Management
| | |
| Brad Friedlander | | Ashish Negandhi |
| Head Portfolio Manager | | Portfolio Manager |
| Co-Founder, Managing Partner | | Managing Director |
| 1 | Investment grade corporate spread contraction is based off a Citi Index of the “US Broad Investment Grade Bond Index” |
| 2 | High yield corporate spread contraction is based off the “Barclays US Corporate High Yield Average OAS” |
7
Investment Results – (Unaudited)
Total Returns*
(for the periods ended January 31, 2013)
| | | | | | | | |
| | | | | | Average Annual Returns | |
| | | One Year | | | Since Inception
(June 28, 2011) | |
Angel Oak Multi-Strategy Income Fund, Class A without load | | | 22.57 | % | | | 19.85 | % |
Angel Oak Multi-Strategy Income Fund, Class A with load | | | 15.53 | % | | | 15.49 | % |
Barclays Capital U.S. Aggregate Bond Index** | | | 2.59 | % | | | 4.92 | % |
Total annual operating expenses, as disclosed in the Fund’s prospectus dated July 11, 2012, were 3.42% of average daily net assets (2.06% after fee waivers/expense reimbursements by the Adviser). The Adviser contractually has agreed to waive or limit its fees and assume other expenses of the Fund until August 31, 2013, so that total annual fund operating expenses do not exceed 1.50%. Effective September 1, 2012, the Adviser contractually has agreed to waive or limit its fees and assume other expenses of the Fund until August 31, 2013, so that total annual fund operating expenses do not exceed 0.99%. This operating expense limitation does not apply to brokerage fees and commissions, borrowing costs (such as interest and dividend expenses on securities sold short), taxes, 12b-1 fees, extraordinary expenses and indirect expenses (such as “acquired fund fees and expenses”).
Total Returns*
(for the period ended January 31, 2013)
| | | | |
| | | Since Inception
(March 14, 2012) | |
Angel Oak Multi-Strategy Income Fund, Class C without load | | | 16.39 | % |
Angel Oak Multi-Strategy Income Fund, Class C
with load | | | 15.39 | % |
Barclays Capital U.S. Aggregate Bond Index** | | | 3.02 | % |
8
Investment Results – (Unaudited) (continued)
Total annual operating expenses, as disclosed in the Fund’s prospectus dated July 11, 2012, were estimated to be 4.17% of average daily net assets (2.74% after fee waivers/expense reimbursements by the Adviser). The Adviser contractually has agreed to waive or limit its fees and assume other expenses of the Fund until August 31, 2013, so that total annual fund operating expenses do not exceed 1.50%. Effective September 1, 2012, the Adviser contractually has agreed to waive or limit its fees and assume other expenses of the Fund until August 31, 2013, so that total annual fund operating expenses do not exceed 0.99%. This operating expense limitation does not apply to brokerage fees and commissions, borrowing costs (such as interest and dividend expenses on securities sold short), taxes, 12b-1 fees, extraordinary expenses and indirect expenses (such as “acquired fund fees and expenses”).
Total Returns*
(for the period ended January 31, 2013)
| | | | |
| | | Since Inception
(August 16, 2012) | |
Angel Oak Multi-Strategy Income Fund, Class I
without load | | | 7.75 | % |
Barclays Capital U.S. Aggregate Bond Index** | | | 0.68 | % |
Total annual operating expenses, as disclosed in the Fund’s prospectus dated July 11, 2012, were estimated to be 3.17% of average daily net assets (1.54% after fee waivers/expense reimbursements by the Adviser). The Adviser contractually has agreed to waive or limit its fees and assume other expenses of the Fund until August 31, 2013, so that total annual fund operating expenses do not exceed 1.50%. Effective September 1, 2012, the Adviser contractually has agreed to waive or limit its fees and assume other expenses of the Fund until August 31, 2013, so that total annual fund operating expenses do not exceed 0.99%. This operating expense limitation does not apply to brokerage fees and commissions, borrowing costs (such as interest and dividend expenses on securities sold short), taxes, 12b-1 fees, extraordinary expenses and indirect expenses (such as “acquired fund fees and expenses”).
The performance quoted represents past performance, which does not guarantee future results. The investment return and principal value of an investment will fluctuate so that an investor’s shares, when redeemed, may be worth more or less than their original cost. The returns shown do not reflect deduction of taxes that a shareholder would pay on Fund distributions or the redemption of Fund shares. The Fund’s investment objectives, risks, charges and expenses must be considered carefully
9
Investment Results – (Unaudited) (continued)
before investing. Current performance of a Fund may be lower or higher than the performance quoted. Performance data current to the most recent month end may be obtained by calling 1-877-625-3042.
The performance above reflects any fee reductions during the applicable period. If such fee reductions had not occurred, the quoted performance would be lower.
* Return figures reflect any change in price per share and assume the reinvestment of all distributions. Total returns for Class A shares, with load, include the maximum 5.75% sales charge. Total returns for Class C shares, with load, assume the deduction of the maximum 1.00% deferred sales charge as if redemption took place on the last business day of the reporting period.
** The Barclays U.S. Aggregate Bond Index measures the performance of the U.S. investment-grade, fixed-rate bond market, including government and credit securities, agency mortgage pass-through securities, asset-backed securities and commercial mortgage-backed securities. Performance figures include the change in value of the bonds in the index and the reinvestment of interest. The index return does not reflect expenses, which have been deducted from the Fund’s return. You cannot invest directly in an Index; however, an individual can invest in exchange-traded funds or other investment vehicles that attempt to track the performance of a benchmark index.
The Fund’s investment objective, strategies, risks, charges and expenses must be considered carefully before investing. The prospectus contains this and other important information about the investment company and may be obtained by calling 1-877-625-3042. Please read it carefully before investing. The Fund is distributed by Unified Financial Securities, Inc., Member FINRA.
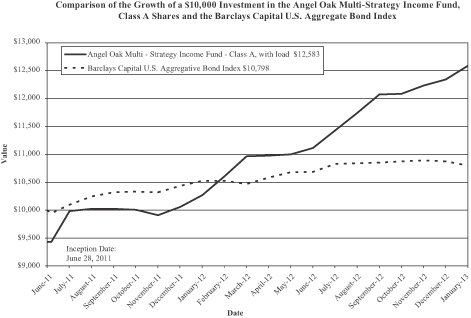
10
Investment Results – (Unaudited) (continued)
The chart above assumes an initial investment of $10,000 made on June 28, 2011 (commencement of operations) and held through January 31, 2013. THE FUND’S RETURN REPRESENTS PAST PERFORMANCE AND DOES NOT GUARANTEE FUTURE RESULTS. The returns shown do not reflect deduction of taxes that a shareholder would pay on the Fund’s distributions or the redemption of the Fund’s shares. Investment returns and principal values will fluctuate so that your shares, when redeemed, may be worth more or less than their original purchase price.
The Barclays U.S. Aggregate Bond Index measures the performance of the U.S. investment-grade, fixed-rate bond market, including government and credit securities, agency mortgage pass-through securities, asset-backed securities and commercial mortgage-backed securities. Performance figures include the change in value of the bonds in the index and the reinvestment of interest. The index return does not reflect expenses, which have been deducted from the Fund’s return. Individuals cannot invest directly in an Index; however, an individual can invest in exchange-traded funds or other investment vehicles that attempt to track the performance of a benchmark index.
Current performance may be lower or higher than the performance data quoted. For more information on the Fund, and to obtain performance data current to the most recent month-end, or to request a prospectus, please call 1-877-625-3042. You should carefully consider the investment objective, strategies, potential risks, management fees, and charges and expenses of the Fund before investing. The Fund’s prospectus contains this and other information about the Fund, and should be read carefully before investing.
The Fund is distributed by Unified Financial Securities, Inc., member FINRA.
11
PORTFOLIO HOLDINGS – (Unaudited)
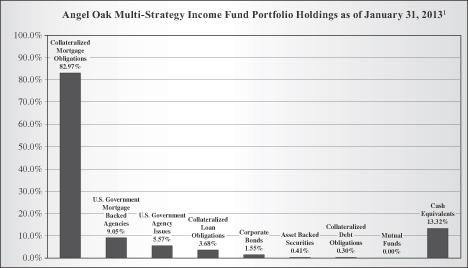
1As a percentage of total investments.
The investment objective of the Angel Oak Multi-Strategy Income Fund is current income.
AVAILABILITY OF PORTFOLIO SCHEDULE – (Unaudited)
The Fund files its complete schedule of portfolio holdings with the Securities and Exchange Commission (“SEC”) for the first and third quarters of each fiscal year on Form N-Q. The Fund’s Forms N-Q are available at the SEC’s website at www.sec.gov. The Fund’s Forms N-Q may be reviewed and copied at the SEC’s Public Reference Room in Washington DC. Information on the operation of the Public Reference Room may be obtained by calling 1-800-SEC-0330.
SUMMARY OF FUND’S EXPENSES – (Unaudited)
As a shareholder of the Fund, you incur ongoing costs, including management fees and other Fund expenses. This Example is intended to help you understand your ongoing costs (in dollars) of investing in the Fund and to compare these costs with the ongoing costs of investing in other mutual funds. The Example is based on an investment of $1,000 invested at the beginning of the period, and held for the entire period from August 1, 2012 to January 31, 2013.
Actual Expenses
The first line of the table below provides information about actual account values and actual expenses. You may use the information in this line, together with the amount you invested, to estimate the expenses that you paid over the period. Simply divide
12
SUMMARY OF FUND’S EXPENSES – (Unaudited) (continued)
your account value by $1,000 (for example, an $8,600 account value divided by $1,000 = $8.60), then multiply the result by the number in the first line under the heading entitled “Expenses Paid During the Period” to estimate the expenses you paid on your account during this period.
Hypothetical Example for Comparison Purposes
The second line of the table below provides information about hypothetical account values and hypothetical expenses based on the Fund’s actual expense ratio and an assumed rate of return of 5% per year before expenses, which is not the Fund’s actual return. The hypothetical account values and expenses may not be used to estimate the actual ending account balance or expenses you paid for the period. You may use this information to compare the ongoing costs of investing in the Fund and other funds. To do so, compare this 5% hypothetical example with the 5% hypothetical examples that appear in the shareholder reports of the other funds.
Please note that the expenses shown in the table are meant to highlight your ongoing costs only. Therefore, the second line of the table below is useful in comparing ongoing costs only and will not help you determine the relative costs of owning different funds.
| | | | | | | | | | | | | | | | | | |
Angel Oak Multi-Strategy
Income Fund | | Beginning
Account Value,
August 31, 2012 | | | Ending
Account Value,
January 31, 2013 | | | Expenses Paid
During Period | | | Annualized
Expense Ratio | |
Class A(1) | | Actual | | $ | 1,000.00 | | | $ | 1,101.10 | | | $ | 8.24 | | | | 1.56 | % |
| | | Hypothetical(2) | | $ | 1,000.00 | | | $ | 1,017.29 | | | $ | 7.91 | | | | 1.56 | % |
Class C(1) | | Actual | | $ | 1,000.00 | | | $ | 1,096.40 | | | $ | 12.17 | | | | 2.31 | % |
| | | Hypothetical(2) | | $ | 1,000.00 | | | $ | 1,013.52 | | | $ | 11.69 | | | | 2.31 | % |
Class I | | Actual* | | $ | 1,000.00 | | | $ | 1,077.50 | | | $ | 6.43 | | | | 1.34 | % |
| | | Hypothetical(2) | | $ | 1,000.00 | | | $ | 1,018.40 | | | $ | 6.80 | | | | 1.34 | % |
* Information shown reflects values using the expense ratio for the period from August 16, 2012 (date of commencement of operations) to January 31, 2013.
(1) Expenses are equal to the Fund’s annualized expense ratios, multiplied by the average account value over the period, multiplied by 184/366 (to reflect the one-half year period). The annualized expense ratios reflect certain waivers of fees and reimbursement of expenses by the Fund’s Adviser for the period beginning August 1, 2012 through January 31, 2013. The “Financial Highlights” tables in the Fund’s financial statements, included in the report, also show the gross expense ratios, without such reimbursements.
| (2) Hypothetical | assumes 5% annual return before expenses. |
13
Angel Oak Multi-Strategy Income Fund
Schedule of Investments
January 31, 2013
| | | | | | | | |
| | | Principal
Amount | | | Fair Value | |
Collateralized Mortgage Obligations – 82.97% | | | | | | | | |
Credit Suisse First Boston Mortgage Securities Corp. Adjustable Rate Mortgage Trust, Series 2004-1, Class 4A1, 5.323%, 1/25/2035 (a) | | $ | 477,815 | | | $ | 480,102 | |
Credit Suisse First Boston Mortgage Securities Corp. Adjustable Rate Mortgage Trust, Series 2005-8, Class 7A4, 0.534%, 11/25/2035 (a) | | | 1,089,470 | | | | 803,461 | |
Credit Suisse First Boston Mortgage Securities Corp. Adjustable Rate Mortgage Trust, Series 2005-8, Class 4A11, 5.189%, 11/25/2035 (a) | | | 670,360 | | | | 629,230 | |
American Home Mortgage Investment Trust, Series 2004-3, Class 3A, 2.361%, 10/25/2034 (a) | | | 3,535,475 | | | | 3,237,549 | |
American Home Mortgage Investment Trust, Series 2005-2, Class 5A4C, 5.408%, 9/25/2035 | | | 3,660,000 | | | | 2,885,418 | |
American Home Mortgage Investment Trust, Series 2005-1, Class 1A3, 0.514%, 6/25/2045 (a) | | | 2,576,550 | | | | 1,433,862 | |
American Home Mortgage Investment Trust, Series 2005-2, Class 1A1, 0.504%, 9/25/2045 (a) | | | 4,214,440 | | | | 3,508,003 | |
American Home Mortgage Investment Trust, Series 2005-2, Class 2A1, 1.774%, 9/25/2045 (a) | | | 1,755,037 | | | | 1,348,130 | |
American Home Mortgage Investment Trust, Series 2005-4, Class 3A1, 0.504%, 11/25/2045 (a) | | | 1,148,887 | | | | 863,540 | |
Banc of America Alternative Loan Trust, Series 2004-3, Class 2A1, 6.000%, 4/25/2034 | | | 997,937 | | | | 990,964 | |
Banc of America Alternative Loan Trust, Series 2005-6, Class 5A2, 5.500%, 7/25/2035 | | | 2,863,976 | | | | 2,837,606 | |
Banc of America Alternative Loan Trust, Series 2005-9, Class 1CB2, 5.500%, 10/25/2035 (d) | | | 11,049,593 | | | | 10,317,983 | |
Banc of America Funding Corp., Series 2004-C, Class 3A1, 3.145%, 12/20/2034 (a) | | | 186,996 | | | | 174,627 | |
Banc of America Funding Corp., Series 2006-G, Class 3A2, 5.750%, 7/20/2036 (a) | | | 5,920,000 | | | | 5,937,609 | |
Banc of America Funding Corp., Series 2006-5, Class 1A4, 6.000%, 9/25/2036 | | | 15,247,000 | | | | 14,907,259 | |
Banc of America Funding Corp., Series 2007-D, Class 3A1, 5.451%, 6/20/2037 (a) | | | 122,856 | | | | 120,742 | |
See accompanying notes which are an integral part of these financial statements.
14
Angel Oak Multi-Strategy Income Fund
Schedule of Investments – (continued)
January 31, 2013
| | | | | | | | |
| | | Principal
Amount | | | Fair Value | |
Collateralized Mortgage Obligations – (continued) | | | | | | | | |
Banc of America Mortgage Securities, Inc., Series 2004-I, Class 2A2, 3.102%, 10/25/2034 (a) | | $ | 561,833 | | | $ | 559,369 | |
Banc of America Mortgage Securities, Inc., Series 2005-E, Class 2A1, 3.111%, 6/25/2035 (a) | | | 2,069,081 | | | | 1,954,853 | |
Banc of America Mortgage Securities, Inc., Series 2005-I, Class 4A1, 5.132%, 10/25/2035 (a) | | | 371,996 | | | | 367,308 | |
Banc of America Mortgage Securities, Inc., Series 2005-I, Class 2A3, 3.074%, 10/25/2035 (a) | | | 310,547 | | | | 293,052 | |
Bank UnitedTrust, Series 2005-1, Class 1A1, 0.504%, 9/25/2045 (a) | | | 192,742 | | | | 139,372 | |
Bayview Commercial Asset Trust, Series 2005-3A, Class A1, 0.524%, 11/25/2035 (a)(b) | | | 7,080,008 | | | | 5,566,716 | |
Bear Stearns Adjustable Rate Mortgage Trust, Series 2005-1, Class 4A1, 5.263%, 3/25/2035 (a) | | | 1,638,676 | | | | 1,625,456 | |
Bear Stearns Adjustable Rate Mortgage Trust, Series 2005-1, Class 2A1, 2.887%, 3/25/2035 (a) | | | 2,525,121 | | | | 2,367,922 | |
Bear Stearns ALT-A Trust, Series 2005-9, Class 25A1, 2.829%, 11/25/2035 (a) | | | 4,543,442 | | | | 3,665,090 | |
Bear Stearns Asset Backed Securities Trust, Series 2005-AC2, Class 1A, 5.250%, 4/25/2035 (d) | | | 6,972,427 | | | | 6,827,213 | |
Bear Stearns Asset Backed Securities Trust, Series 2005-AC4, Class A , 5.500%, 7/25/2035 | | | 3,275,833 | | | | 3,310,893 | |
Chase Mortgage Finance Corp., Series 2005-A1, Class 3A1, 2.926%, 12/25/2035 (a) | | | 1,866,332 | | | | 1,766,410 | |
Chase Mortgage Finance Corp., Series 2005-A1, Class 1A1, 5.179%, 12/25/2035 (a) | | | 85,962 | | | | 84,725 | |
ChaseFlex Trust, Series 2006-1, Class A4, 5.638%, 6/25/2036 (a) | | | 31,247,000 | | | | 28,093,490 | |
Citigroup Mortgage Loan Trust, Inc., Series 2005-2, Class 1A4, 2.731%, 5/25/2035 (a) | | | 816,840 | | | | 791,607 | |
Citigroup Mortgage Loan Trust, Inc., Series 2005-7, Class 2A2A, 3.231%, 9/25/2035 (a) | | | 2,179,389 | | | | 1,977,716 | |
Citigroup Mortgage Loan Trust, Inc., Series 2005-8, Class 1A4A, 5.200%, 10/25/2035 (a) | | | 858,747 | | | | 807,427 | |
Citigroup Mortgage Loan Trust, Inc., Series 2005-11, Class A3, 2.570%, 11/25/2035 (a) | | | 15,211,667 | | | | 14,975,566 | |
See accompanying notes which are an integral part of these financial statements.
15
Angel Oak Multi-Strategy Income Fund
Schedule of Investments – (continued)
January 31, 2013
| | | | | | | | |
| | | Principal
Amount | | | Fair Value | |
Collateralized Mortgage Obligations – (continued) | | | | | | | | |
CountryWide Alternative Loan Trust, Series 2004-J10, Class 1A3, 4.250%, 10/25/2034 | | $ | 2,478,514 | | | $ | 2,328,237 | |
CountryWide Alternative Loan Trust, Series 2005-J1, Class 1A7, 5.500%, 2/25/2035 | | | 9,602,000 | | | | 9,035,794 | |
CountryWide Alternative Loan Trust, Series 2004-30CB, Class 2A4, 5.750%, 2/25/2035 | | | 7,952,112 | | | | 7,556,109 | |
CountryWide Alternative Loan Trust, Series 2004-36CB, Class 2A1, 5.500%, 2/25/2035 | | | 191,698 | | | | 182,109 | |
CountryWide Alternative Loan Trust, Series 2005-1CB, Class 1A4, 5.500%, 3/25/2035 | | | 2,181,557 | | | | 2,071,285 | |
CountryWide Alternative Loan Trust, Series 2005-J5, Class 1A1, 0.504%, 5/25/2035 (a) | | | 401,878 | | | | 386,106 | |
CountryWide Alternative Loan Trust, Series 2005-21CB, Class A17, 6.000%, 6/25/2035 | | | 1,083,596 | | | | 1,091,425 | |
CountryWide Alternative Loan Trust, Series 2005-17, Class 1A1, 0.464%, 7/25/2035 (a) | | | 389,865 | | | | 296,401 | |
CountryWide Alternative Loan Trust, Series 2005-23CB, Class A2, 5.500%, 7/25/2035 | | | 10,000,000 | | | | 9,667,865 | |
CountryWide Alternative Loan Trust, Series 2005-J6, Class 1A1, 0.704%, 7/25/2035 (a) | | | 1,662,753 | | | | 1,416,643 | |
CountryWide Alternative Loan Trust, Series 2005-26CB, Class A1, 0.704%, 7/25/2035 (a) | | | 3,651,976 | | | | 2,742,525 | |
CountryWide Alternative Loan Trust, Series 2005-J6, Class 1A4, 5.500%, 7/25/2035 | | | 2,132,679 | | | | 2,100,695 | |
CountryWide Alternative Loan Trust, Series 2005-J9, Class 1A6, 5.500%, 8/25/2035 | | | 2,713,815 | | | | 2,390,861 | |
CountryWide Alternative Loan Trust, Series 2005-28CB, Class 3A5, 6.000%, 8/25/2035 | | | 1,724,330 | | | | 1,555,693 | |
CountryWide Alternative Loan Trust, Series 2005-28CB, Class 1A6, 5.500%, 8/25/2035 | | | 19,196,493 | | | | 18,546,893 | |
CountryWide Alternative Loan Trust, Series 2005-J10, Class 1A1, 0.704%, 10/25/2035 (a) | | | 1,517,825 | | | | 1,050,143 | |
CountryWide Alternative Loan Trust, Series 2005-46CB, Class A14, 5.500%, 10/25/2035 | | | 260,007 | | | | 243,621 | |
CountryWide Alternative Loan Trust, Series 2005-65CB, Class 2A4, 5.500%, 12/25/2035 (d) | | | 2,888,431 | | | | 2,602,238 | |
See accompanying notes which are an integral part of these financial statements.
16
Angel Oak Multi-Strategy Income Fund
Schedule of Investments – (continued)
January 31, 2013
| | | | | | | | |
| | | Principal
Amount | | | Fair Value | |
Collateralized Mortgage Obligations – (continued) | | | | | | | | |
CountryWide Alternative Loan Trust, Series 2005-J14, Class A8, 5.500%, 12/25/2035 | | $ | 8,729,958 | | | $ | 7,536,031 | |
CountryWide Home Loan Mortgage Pass-Through Trust, Series 2004-HYB3, Class 2A, 2.827%, 6/20/2034 (a) | | | 2,203,361 | | | | 2,042,500 | |
CountryWide Home Loan Mortgage Pass-Through Trust, Series 2005-HYB6, Class 4A1B, 2.884%, 10/20/2035 (a) | | | 118,991 | | | | 108,094 | |
CountryWide Home Loan Mortgage Pass-Through Trust, Series 2005-HYB8, Class 4A1, 4.677%, 12/20/2035 (a)(d) | | | 30,208,699 | | | | 27,062,795 | |
CountryWide Home Loan Mortgage Pass-Through Trust, Series 2006-OA2, Class X1P,
Interest only strip, 0.000%, 5/20/2046 (a)(f) | | | 75,132,071 | | | | 7,208,021 | |
CountryWide Home Loans, Series 2003-52, Class A1, 2.908%, 2/19/2034 (a) | | | 87,320 | | | | 83,511 | |
Credit Suisse First Boston Mortgage Securities Corp., Series 2005-4, Class 2A7, 0.654%, 6/25/2035 (a) | | | 2,870,374 | | | | 2,513,877 | |
Credit Suisse First Boston Mortgage Securities Corp., Series 2005-9, Class 2A1, 5.500%, 10/25/2035 | | | 2,020,331 | | | | 1,940,416 | |
Credit Suisse Mortgage Capital Certificates, Series 2012-9, Class B1, 2.723%, 2/25/2050 (a)(b)(d)(f) | | | 10,363,000 | | | | 9,443,802 | |
Deutsche Alt-A Securities Inc Mortgage Loan Trust Series 2005-2, Class 1A5, 0.704%, 4/25/2035 (a) | | | 1,787,103 | | | | 1,505,192 | |
DSLA Mortgage Loan Trust, Series 2004-AR1, Class A2A, 1.025%, 9/19/2044 (a) | | | 2,486,429 | | | | 2,221,859 | |
First Horizon Alternative Mortgage Securities Trust, Series 2005-FA2, Class 1A1, 0.704%, 4/25/2035 (a) | | | 2,129,230 | | | | 1,665,739 | |
First Horizon Alternative Mortgage Securities Trust, Series 2005-FA8, Class 1A18, 5.500%, 11/25/2035 | | | 5,868 | | | | 5,424 | |
GMACM Mortgage Corp. Loan Trust, Series 2005-AR2, Class 4A, 5.093%, 5/25/2035 (a) | | | 1,797,047 | | | | 1,782,815 | |
GMACM Mortgage Corp. Loan Trust, Series 2005-AF1, Class A11, 5.750%, 7/25/2035 | | | 686,474 | | | | 442,647 | |
GMACM Mortgage Corp. Loan Trust, Series 2005-AR5, Class 5A1, 5.346%, 9/19/2035 (a) | | | 999,373 | | | | 999,798 | |
See accompanying notes which are an integral part of these financial statements.
17
Angel Oak Multi-Strategy Income Fund
Schedule of Investments – (continued)
January 31, 2013
| | | | | | | | |
| | | Principal
Amount | | | Fair Value | |
Collateralized Mortgage Obligations – (continued) | | | | | | | | |
GMACM Mortgage Corp. Loan Trust, Series 2005-AR6, Class 2A1, 3.800%, 11/19/2035 (a) | | $ | 5,968,491 | | | $ | 5,407,178 | |
GMACM Mortgage Corp. Loan Trust, Series 2005-AR6, Class 4A1, 5.487%, 11/19/2035 (a) | | | 653,284 | | | | 652,814 | |
GreenPoint MTA Trust, Series 2005-AR3, Class 1A1, 0.444%, 8/25/2045 (a) | | | 6,553,693 | | | | 5,323,650 | |
GS Mortgage Securities Corp. II, Series 2013-GC10, Class A5, 2.943%, 2/10/2046 (e)(f) | | | 10,000,000 | | | | 10,299,880 | |
GSR Mortgage Loan Trust, Series 2005-AR1, Class 4A1, 5.060%, 1/25/2035 (a) | | | 2,437,795 | | | | 2,434,613 | |
GSR Mortgage Loan Trust, Series 2005-AR2, Class 1A1, 2.911%, 4/25/2035 (a) | | | 3,414,006 | | | | 3,087,367 | |
GSR Mortgage Loan Trust, Series 2005-AR3, Class 4A1, 3.032%, 5/25/2035 (a)(d) | | | 19,953,622 | | | | 17,896,603 | |
GSR Mortgage Loan Trust, Series 2005-AR3, Class 8A1, 5.392%, 5/25/2035 (a)(d) | | | 11,643,392 | | | | 11,761,846 | |
GSR Mortgage Loan Trust, Series 2005-AR3, Class 5A1, 3.045%, 5/25/2035 (a)(d) | | | 18,895,298 | | | | 17,951,771 | |
GSR Mortgage Loan Trust, Series 2005-AR7, Class 5A1, 5.161%, 11/25/2035 (a) | | | 5,544,910 | | | | 5,213,385 | |
GSR Mortgage Loan Trust, Series 2005-AR7, Class 6A1, 5.121%, 11/25/2035 (a) | | | 9,285,197 | | | | 9,195,159 | |
GSR Mortgage Loan Trust, Series 2006-AR1, Class 3A1, 3.226%, 1/25/2036 (a) | | | 1,291,937 | | | | 1,192,814 | |
GSR Mortgage Loan Trust, Series 2006-1F, Class 1A6, 1.154%, 2/25/2036 (a) | | | 1,241,616 | | | | 1,069,282 | |
GSR Mortgage Loan Trust, Series 2006-2F, Class 3A6, 6.000%, 2/25/2036 | | | 9,467,236 | | | | 8,502,752 | |
HarborView Mortgage Loan Trust, Series 2006-10, Class 2A1A, 0.385%, 11/19/2036 (a)(d) | | | 24,012,852 | | | | 19,444,251 | |
IMPAC CMB Trust, Series 2004-6, Class 1A3, 1.184%, 10/25/2034 (a) | | | 1,923,529 | | | | 1,549,522 | |
IMPAC CMB Trust, Series 2004-7, Class 1A2, 1.124%, 11/25/2034 (a) | | | 1,681,907 | | | | 1,414,222 | |
IMPAC CMB Trust, Series 2005-5, Class A4, 0.964%, 8/25/2035 (a) | | | 4,431,760 | | | | 2,503,740 | |
See accompanying notes which are an integral part of these financial statements.
18
Angel Oak Multi-Strategy Income Fund
Schedule of Investments – (continued)
January 31, 2013
| | | | | | | | |
| | | Principal
Amount | | | Fair Value | |
Collateralized Mortgage Obligations – (continued) | | | | | | | | |
INDYMAC Index Mortgage Loan Trust, Series 2004-AR8, Class 2A2A, 1.004%, 11/25/2034 (a) | | $ | 1,532,934 | | | $ | 1,260,356 | |
INDYMAC Index Mortgage Loan Trust,
Series 2005-AR3, Class 4A1, 2.893%, 4/25/2035 (a) | | | 6,299,527 | | | | 5,872,029 | |
INDYMAC Index Mortgage Loan Trust,
Series 2005-AR15, Class A1, 4.779%, 9/25/2035 (a) | | | 27,450,857 | | | | 25,329,756 | |
INDYMAC Index Mortgage Loan Trust,
Series 2005-AR15, Class A2, 4.779%, 9/25/2035 (a)(d) | | | 20,307,610 | | | | 18,892,942 | |
INDYMAC Index Mortgage Loan Trust,
Series 2005-AR25, Class 1A21, 5.109%, 12/25/2035 (a) | | | 1,380,227 | | | | 1,221,729 | |
INDYMAC Index Mortgage Loan Trust,
Series 2006-AR9, Class 3A3, 4.870%, 6/25/2036 (a) | | | 3,174,759 | | | | 3,022,709 | |
INDYMAC Index Mortgage Loan Trust,
Series 2005-AR18, Class 2A1A, 0.514%, 10/25/2036 (a)(f) | | | 22,783,371 | | | | 17,208,553 | |
INDYMAC Index Mortgage Loan Trust,
Series 2006-AR2, Class 1A1B, 0.414%, 4/25/2046 (a) | | | 7,730,222 | | | | 6,057,719 | |
JP Morgan Alternative Loan Trust, Series 2006-S4, Class A5, 6.000%, 12/25/2036 | | | 28,740,000 | | | | 20,630,061 | |
JP Morgan Mortgage Trust, Series 2004-A2, Class 1A2, 3.062%, 5/25/2034 (a)(d) | | | 2,446,403 | | | | 2,494,595 | |
JP Morgan Mortgage Trust, Series 2005-A1, Class 1A1, 5.195%, 2/25/2035 (a) | | | 1,222,672 | | | | 1,247,827 | |
JP Morgan Mortgage Trust, Series 2006-A3, Class 7A1, 2.962%, 4/25/2035 (a) | | | 1,126,726 | | | | 1,103,912 | |
JP Morgan Mortgage Trust, Series 2005-A3, Class A3, 2.960%, 6/25/2035 (a)(d) | | | 6,895,616 | | | | 6,509,017 | |
JP Morgan Mortgage Trust, Series 2005-A7, Class 3A1, 5.221%, 10/25/2035 (a) | | | 664,850 | | | | 666,558 | |
JP Morgan Mortgage Trust, Series 2005-A8, Class 1A1, 5.231%, 11/25/2035 (a) | | | 1,642,235 | | | | 1,616,284 | |
JP Morgan Mortgage Trust, Series 2005-A8, Class 3A1, 3.000%, 11/25/2035 (a) | | | 446,087 | | | | 442,530 | |
JP Morgan Mortgage Trust, Series 2005-S3, Class 1A14, 5.500%, 1/25/2036 | | | 9,016,058 | | | | 8,868,073 | |
JP Morgan Mortgage Trust, Series 2006-A1, Class 3A2, 3.058%, 2/25/2036 (a) | | | 1,458,381 | | | | 1,318,213 | |
See accompanying notes which are an integral part of these financial statements.
19
Angel Oak Multi-Strategy Income Fund
Schedule of Investments – (continued)
January 31, 2013
| | | | | | | | |
| | | Principal
Amount | | | Fair Value | |
Collateralized Mortgage Obligations – (continued) | | | | | | | | |
JP Morgan Mortgage Trust, Series 2006-A1, Class 2A2, 2.855%, 2/25/2036 (a) | | $ | 718,050 | | | $ | 643,111 | |
JP Morgan Mortgage Trust, Series 2007-A2, Class 4A1, 2.150%, 4/25/2037 (a) | | | 1,953,652 | | | | 1,850,984 | |
Lehman XS Trust, Series 2005-1, Class 3A3A,
5.110%, 7/25/2035 | | | 1,260,000 | | | | 1,084,607 | |
Luminent Mortgage Trust, Series 2005-1, Class A1, 0.464%, 11/25/2035 (a) | | | 15,251,889 | | | | 13,225,584 | |
MASTR Adjustable Rate Mortgages Trust,
Series 2004-15, Class 2A2, 3.070%, 12/25/2034 (a) | | | 61,950 | | | | 50,094 | |
MASTR Adjustable Rate Mortgages Trust,
Series 2005-1, Class 9A1, 5.285%, 1/25/2035 (a) | | | 1,545,600 | | | | 1,505,539 | |
MASTR Adjustable Rate Mortgages Trust,
Series 2005-2, Class 5A1, 2.753%, 3/25/2035 (a)(d) | | | 4,513,796 | | | | 4,273,082 | |
MASTR Adjustable Rate Mortgages Trust,
Series 2005-6, Class 7A1, 5.314%, 6/25/2035 (a) | | | 472,085 | | | | 466,665 | |
MASTR Adjustable Rate Mortgages Trust,
Series 2005-6, Class 5A2, 2.582%, 7/25/2035 (a) | | | 956,651 | | | | 835,818 | |
MASTR Alternative Loan Trust, Series 2005-3,
Class 3A1, 6.500%, 4/25/2035 | | | 3,991,251 | | | | 4,027,436 | |
Merrill Lynch Mortgage Investors Trust,
Series 2005-A7, Class 2A1, 5.190%, 9/25/2035 (a)(d) | | | 30,692,599 | | | | 29,778,512 | |
Morgan Stanley Mortgage Loan Trust,
Series 2004-8AR, Class 4A5, 2.774%, 10/25/2034 (a) | | | 560,207 | | | | 434,913 | |
Nomura Asset Acceptance Corp. Alternative Loan Trust, Series 2005-AR4, Class 4A1,
3.254%, 8/25/2035 (a) | | | 2,544,951 | | | | 2,250,838 | |
Nomura Asset Acceptance Corp. Alternative Loan Trust, Series 2005-AR4, Class 3A1,
3.152%, 8/25/2035 (a)(d) | | | 1,881,751 | | | | 1,772,739 | |
Opteum Mortgage Acceptance Corp., Series 2005-5, Class 1A2, 0.534%, 12/25/2035 (a) | | | 2,723,536 | | | | 829,709 | |
Prime Mortgage Trust, Series 2005-4, Class 2A4, 0.704%, 10/25/2035 (a) | | | 258,924 | | | | 219,203 | |
Residential Accredit Loans, Inc., Series 2005-QS2, Class A3, 5.500%, 2/25/2035 (d) | | | 11,632,914 | | | | 11,793,577 | |
See accompanying notes which are an integral part of these financial statements.
20
Angel Oak Multi-Strategy Income Fund
Schedule of Investments – (continued)
January 31, 2013
| | | | | | | | |
| | | Principal
Amount | | | Fair Value | |
Collateralized Mortgage Obligations – (continued) | | | | | | | | |
Residential Accredit Loans, Inc., Series 2005-QA4, Class A31, 3.471%, 4/25/2035 (a) | | $ | 11,763,140 | | | $ | 10,724,778 | |
Residential Accredit Loans, Inc., Series 2005-QS9, Class A6, 5.500%, 6/25/2035 | | | 10,485,364 | | | | 10,010,933 | |
Residential Accredit Loans, Inc., Series 2005-QS11, Class A2, 0.704%, 7/25/2035 (a) | | | 1,256,524 | | | | 1,037,650 | |
Residential Accredit Loans, Inc., Series 2005-QS12, Class A4, 5.500%, 8/25/2035 | | | 25,350,094 | | | | 24,118,663 | |
Residential Accredit Loans, Inc., Series 2005-QS17, Class A10, 6.000%, 12/25/2035 | | | 1,621 | | | | 1,435 | |
Residential Asset Securitization Trust, Series 2004-A9, Class A4, 5.250%, 12/25/2034 | | | 8,187,760 | | | | 8,183,752 | |
Store Master Funding LLC, Series 2012-1A, Class A, 5.770%, 8/20/2042 (b)(f) | | | 994,476 | | | | 1,049,928 | |
Structured Adjustable Rate Mortgage Loan Trust, Series 2004-14, Class 1A, 2.868%, 10/25/2034 (a) | | | 304 | | | | 294 | |
Structured Adjustable Rate Mortgage Loan Trust, Series 2004-16, Class 5A3, 5.343%, 11/25/2034 (a) | | | 180,172 | | | | 180,749 | |
Structured Adjustable Rate Mortgage Loan Trust, Series 2004-16, Class 1A2, 2.801%, 11/25/2034 (a)(d) | | | 7,190,707 | | | | 6,913,440 | |
Structured Adjustable Rate Mortgage Loan Trust, Series 2005-1, Class 5A2, 2.716%, 2/25/2035 (a) | | | 538,118 | | | | 343,916 | |
Structured Adjustable Rate Mortgage Loan Trust, Series 2005-1, Class 4A2, 2.642%, 2/25/2035 (a) | | | 1,004,253 | | | | 538,432 | |
Structured Adjustable Rate Mortgage Loan Trust, Series 2005-4, Class 5A, 4.815%, 3/25/2035 (a) | | | 9,481,175 | | | | 8,954,434 | |
Structured Adjustable Rate Mortgage Loan Trust, Series 2005-12, Class 3A1, 2.631%, 6/25/2035 (a) | | | 2,372,671 | | | | 2,207,189 | |
Structured Adjustable Rate Mortgage Loan Trust, Series 2005-15, Class 1A1, 2.588%, 7/25/2035 (a)(d) | | | 2,436,832 | | | | 2,135,342 | |
Structured Adjustable Rate Mortgage Loan Trust, Series 2005-17, Class 5A1, 4.893%, 8/25/2035 (a) | | | 8,751,563 | | | | 8,532,901 | |
Structured Adjustable Rate Mortgage Loan Trust, Series 2005-18, Class 6A1, 2.786%, 9/25/2035 (a) | | | 3,267,800 | | | | 3,069,588 | |
Structured Adjustable Rate Mortgage Loan Trust, Series 2005-20, Class 4A1, 5.387%, 10/25/2035 (a) | | | 111,753 | | | | 105,328 | |
See accompanying notes which are an integral part of these financial statements.
21
Angel Oak Multi-Strategy Income Fund
Schedule of Investments – (continued)
January 31, 2013
| | | | | | | | |
| | | Principal
Amount | | | Fair Value | |
Collateralized Mortgage Obligations – (continued) | | | | | | | | |
Structured Adjustable Rate Mortgage Loan Trust, Series 2005-21, Class 6A3, 5.400%, 11/25/2035 (a)(d) | | $ | 25,316,000 | | | $ | 20,584,275 | |
Structured Adjustable Rate Mortgage Loan Trust, Series 2005-21, Class 7A1, 5.243%, 11/25/2035 (a) | | | 8,521,461 | | | | 7,788,957 | |
Structured Asset Securities Corp., Series 2003-6A, Class 2A1, 3.624%, 3/25/2033 (a) | | | 96,869 | | | | 96,905 | |
Structured Asset Securities Corp., Series 2004-15, Class 3A8, 5.750%, 9/25/2034 | | | 713,300 | | | | 690,122 | |
Structured Asset Securities Corp., Series 2005-1, Class 7A6, 5.500%, 2/25/2035 | | | 1,376,506 | | | | 1,122,494 | |
Structured Asset Securities Corp., Series 2005-17, Class 5A1, 5.500%, 10/25/2035 | | | 6,363,226 | | | | 6,049,302 | |
Thornburg Mortgage Securities Trust, Series 2004-4, Class 5A, 4.815%, 12/25/2044 (a) | | | 19,721,545 | | | | 19,689,566 | |
UBS-Barclays Commercial Mortgage Trust, Series 2012-C4, Class A5, 2.850%, 12/10/2045 | | | 10,230,000 | | | | 10,375,425 | |
UBS-Barclays Commercial Mortgage Trust, Series 2012-C2, Class A4, 3.525%, 5/10/2063 | | | 3,386,000 | | | | 3,637,839 | |
Washington Mutual Mortgage Pass-Through Certificates, Series 2005-AR18, Class 3A1,
5.036%, 1/25/2036 (a) (d) | | | 12,995,698 | | | | 12,645,354 | |
Washington Mutual Mortgage Pass-Through Certificates, Series 2007-HY5, Class 3A1,
5.130%, 5/25/2037 (a) | | | 3,683,279 | | | | 3,578,486 | |
Washington Mutual Mortgage Pass-Through Certificates WMALT, Series 2005-1, Class 1A1, 5.500%, 3/25/2035 | | | 1,007,266 | | | | 1,024,342 | |
Washington Mutual Mortgage Pass-Through Certificates WMALT, Series 2005-4, Class CB7, 5.500%, 6/25/2035(d) | | | 18,594,904 | | | | 18,223,527 | |
Washington Mutual Mortgage Pass-Through Certificates WMALT, Series 2005-11, Class A2, 5.750%, 1/25/2036 | | | 4,608,173 | | | | 4,007,198 | |
Wells Fargo Mortgage Backed Securities Trust, Series 2005-AR14, Class A4, 5.327%, 8/25/2035 (a) | | | 390,000 | | | | 397,354 | |
See accompanying notes which are an integral part of these financial statements.
22
Angel Oak Multi-Strategy Income Fund
Schedule of Investments – (continued)
January 31, 2013
| | | | | | | | |
| | | Principal
Amount | | | Fair Value | |
Collateralized Mortgage Obligations – (continued) | | | | | | | | |
Wells Fargo Mortgage Backed Securities Trust, Series 2005-AR16, Class 7A1, 5.153%, 10/25/2035 (a) | | $ | 561,353 | | | $ | 559,879 | |
Wells Fargo Mortgage Backed Securities Trust, Series 2005-AR16, Class 7A2, 5.153%, 10/25/2035 (a) | | | 890,991 | | | | 557,239 | |
Wells Fargo Mortgage Backed Securities Trust, Series 2006-AR6, Class 7A1, 5.017%, 3/25/2036 (a) | | | 145,193 | | | | 145,683 | |
Wells Fargo Mortgage Backed Securities Trust, Series 2006-5, Class 1A6, 5.250%, 4/25/2036 | | | 348,498 | | | | 324,585 | |
WFRBS Commercial Mortgage Trust, Series 2012-C10, Class A3, 2.875%, 12/15/2045 | | | 3,000,000 | | | | 3,059,914 | |
WFRBS Commercial Mortgage Trust, Series 2011-C2, Class A4, 4.869%, 2/15/2044 (a)(b) | | | 3,000,000 | | | | 3,528,120 | |
WFRBS Commercial Mortgage Trust, Series 2011-C3, Class A4, 4.375%, 3/15/2044 (b) | | | 4,000,000 | | | | 4,562,852 | |
| | | | | | | | |
TOTAL COLLATERALIZED MORTGAGE OBLIGATIONS (Cost $764,384,131) | | | | 791,941,727 | |
| | | | | | | | |
U.S. Government Agencies – 9.05% | |
Federal Farm Credit Bank – 0.31% | | | | | | | | |
1.900%, 12/17/2021 | | | 3,000,000 | | | | 2,948,451 | |
| | | | | | | | |
Federal Home Loan Mortgage Corporation – 5.07% | | | | | | | | |
1.000%, 3/8/2017 | | | 2,000,000 | | | | 2,017,188 | |
1.000%, 6/29/2017 | | | 3,000,000 | | | | 3,024,027 | |
3.750%, 3/27/2019 | | | 3,000,000 | | | | 3,436,227 | |
1.250%, 10/2/2019 | | | 30,000,000 | | | | 29,619,720 | |
2.375%, 1/13/2022 | | | 10,000,000 | | | | 10,297,560 | |
| | | | | | | | |
| | | | | | | 48,394,722 | |
| | | | | | | | |
Federal National Mortgage Association – 3.67% | | | | | | | | |
1.250%, 9/28/2016 | | | 800,000 | | | | 819,444 | |
0.875%, 12/20/2017 | | | 5,000,000 | | | | 4,985,615 | |
2.000%, 5/21/2021 | | | 5,000,000 | | | | 4,999,120 | |
2.200%, 10/25/2022 | | | 12,000,000 | | | | 11,743,836 | |
2.500%, 2/22/2023 | | | 12,500,000 | | | | 12,467,725 | |
| | | | | | | | |
| | | | | | | 35,015,740 | |
| | | | | | | | |
| |
TOTAL U.S. GOVERNMENT AGENCIES
(Cost $87,244,487) | | | | 86,358,913 | |
| | | | | | | | |
See accompanying notes which are an integral part of these financial statements.
23
Angel Oak Multi-Strategy Income Fund
Schedule of Investments – (continued)
January 31, 2013
| | | | | | | | |
| | | Principal
Amount | | | Fair Value | |
U.S. Government Mortgage Backed Agencies – 5.57% | |
Federal Home Loan Mortgage Corporation – 0.54% | | | | | |
Pool# Q13366, 3.00%, 12/1/2042 | | $ | 4,984,458 | | | $ | 5,130,813 | |
| | | | | | | | |
Federal National Mortgage Association – 5.03% | | | | | | | | |
Pool# AB5472, 3.50%, 6/1/2042 | | | 4,247,713 | | | | 4,489,279 | |
Pool# AB6012, 3.00%, 8/1/2042 | | | 5,659,281 | | | | 5,851,204 | |
Pool# AO8765, 3.00%, 8/1/2042 | | | 4,412,070 | | | | 4,561,696 | |
Pool# AO8776, 3.00%, 8/1/2042 | | | 2,816,847 | | | | 2,912,375 | |
Pool# AQ3381, 3.00%, 11/1/2042 | | | 9,907,076 | | | | 10,243,054 | |
Pool# AQ8653, 2.50%, 12/1/2042 | | | 19,930,723 | | | | 19,948,762 | |
| | | | | | | | |
| | | | | | | 48,006,370 | |
| | | | | | | | |
| |
TOTAL U.S. GOVERNMENT MORTGAGE BACKED AGENCIES
(Cost $53,685,903) | | | | 53,137,183 | |
| | | | | | | | |
Collateralized Loan Obligations – 3.68% | | | | | | | | |
Black Diamond CLO Ltd., Series 2012-1A,
Class C , 4.809%, 2/1/2023 (a)(b)(d)(f) | | | 6,000,000 | | | | 5,496,000 | |
Cavalry CLO Ltd., Class D, 5.058%, 3/15/2022 (a)(b)(f) | | | 7,000,000 | | | | 7,017,500 | |
Longfellow Place CLO Ltd., Series 2013-1A,
Class D, 4.555%, 1/15/2024 (a)(b)(e)(f) | | | 4,000,000 | | | | 3,720,000 | |
Mountain Hawk I CLO Ltd., Series 2013-1A,
Class D, 3.402%, 1/20/2024 (a)(b)(e)(f) | | | 4,000,000 | | | | 3,640,000 | |
Neuberger Berman CLO Ltd., Series 2012-13A,
Class D, 4.865%, 1/23/2024 (a)(b)(f) | | | 3,550,000 | | | | 3,340,195 | |
Symphony CLO XI Ltd., Series 2013-11A,
Class D, 4.262%, 1/17/2025 (a)(b)(e)(f) | | | 4,000,000 | | | | 3,908,128 | |
TICC CLO LLC, Series 2012-1A,
Class D1, 6.468%, 8/25/2023 (a)(b) | | | 8,000,000 | | | | 7,960,000 | |
| | | | | | | | |
| |
TOTAL COLLATERALIZED LOAN OBLIGATIONS
(Cost $35,027,181) | | | | 35,081,823 | |
| | | | | | | | |
Corporate Bonds – 1.55% | | | | | | | | |
Financials – 0.49% | | | | | | | | |
Associates Corp. NA, 6.950%, 11/1/2018 | | | 1,000,000 | | | | 1,220,504 | |
Merrill Lynch, 6.400%, 8/28/2017 | | | 1,000,000 | | | | 1,172,557 | |
See accompanying notes which are an integral part of these financial statements.
24
Angel Oak Multi-Strategy Income Fund
Schedule of Investments – (continued)
January 31, 2013
| | | | | | | | |
| | | Principal
Amount | | | Fair Value | |
Financials – (continued) | | | | | | | | |
Morgan Stanley, 5.450%, 1/9/2017 | | $ | 1,000,000 | | | $ | 1,107,438 | |
Morgan Stanley, 5.750%, 1/25/2021 | | | 1,000,000 | | | | 1,138,185 | |
| | | | | | | | |
| | | | | | | 4,638,684 | |
| | | | | | | | |
| | |
Consumer Staples – 0.44% | | | | | | | | |
First Data Corp., 12.625%, 1/15/2021 | | | 3,000,000 | | | | 3,210,000 | |
First Data Corp., 8.250%, 1/15/2021 (b) | | | 1,000,000 | | | | 1,035,000 | |
| | | | | | | | |
| | | | | | | 4,245,000 | |
| | | | | | | | |
| | |
Consumer Discretionary – 0.62% | | | | | | | | |
Exide Technologies, 8.625%, 2/1/2018 | | | 2,000,000 | | | | 1,735,000 | |
Goodyear Tire & Rubber Co./The, 7.000%, 5/15/2022 | | | 2,000,000 | | | | 2,155,000 | |
Goodyear Tire & Rubber Co./The, 7.000%, 3/15/2028 | | | 2,000,000 | | | | 2,030,000 | |
| | | | | | | | |
| | | | | | | 5,920,000 | |
| | | | | | | | |
| |
| TOTAL CORPORATE BONDS (Cost $14,475,528) | | | | 14,803,684 | |
| | | | | | | | |
| | |
Asset-Backed Securities – 0.41% | | | | | | | | |
Drug Royalty II LP, Series 2012-1, Class A1,
4.304%, 1/15/2025 (a)(b)(f) | | | 2,930,668 | | | | 2,930,668 | |
JGWPT XXVII LLC, Series 3A, Class B, 6.170%, 9/15/2067 (b) | | | 1,000,000 | | | | 1,002,838 | |
| | | | | | | | |
| |
TOTAL ASSET-BACKED SECURITIES (Cost $3,930,653) | | | | 3,933,506 | |
| | | | | | | | |
| | |
Collateralized Debt Obligations – 0.30% | | | | | | | | |
Atrium CDO Corp., 3.802%, 2/28/2024 (a)(b)(e)(f) | | | 3,000,000 | | | | 2,901,000 | |
| | | | | | | | |
| |
TOTAL COLLATERALIZED DEBT OBLIGATIONS (Cost $2,901,000) | | | | 2,901,000 | |
| | | | | | | | |
See accompanying notes which are an integral part of these financial statements.
25
Angel Oak Multi-Strategy Income Fund
Schedule of Investments – (continued)
January 31, 2013
| | | | | | | | |
| | | Shares | | | Fair Value | |
Mutual Funds – 0.00% | | | | | | | | |
MFS High Income Fund – Institutional Shares | | | 5,126 | | | $ | 18,452 | |
Pioneer Global High Yield Fund – Y Shares | | | 770 | | | | 7,877 | |
Prudential High Yield Fund – Z Shares | | | 3,536 | | | | 20,368 | |
| | | | | | | | |
| |
| TOTAL MUTUAL FUNDS (Cost $45,372) | | | | 46,697 | |
| | | | | | | | |
| | |
Cash Equivalents – 13.32% | | | | | | | | |
Fidelity Institutional Money Market
Portfolio, 0.160% (c) | | | 127,099,870 | | | | 127,099,870 | |
| | | | | | | | |
| |
| TOTAL CASH EQUIVALENTS (Cost $127,099,870) | | | | 127,099,870 | |
| | | | | | | | |
| |
TOTAL INVESTMENTS – 116.85%
(Cost $1,088,794,125) | | | $ | 1,115,304,403 | |
| | | | | | | | |
| | |
Liabilities in excess of other assets – (16.85)% | | | | | | | (160,852,137 | ) |
| | | | | | | | |
| | |
NET ASSETS – 100.00% | | | | | | $ | 954,452,266 | |
| | | | | | | | |
| (a) | Variable or Floating Rate Security. Rate disclosed is as of January 31, 2013. |
| (b) | Security exempt from registration under Rule 144A or Section 4(2) of the Securities Act of 1933. The security may be resold in transactions exempt from registration, normally to qualified institutional buyers. |
| (c) | Rate disclosed is the seven day yield as of January 31, 2013. |
| (d) | All or a portion of security has been pledged as collateral in connection with open reverse repurchase agreement. On January 31, 2013, securities valued at $204,747,606 were pledged as collateral for reverse repurchase agreements. |
| (e) | Security was purchased on a delayed delivery basis. |
| (f) | Security is fair valued by the adviser. See Note 3. |
Reverse repurchase agreements outstanding as of January 31, 2013 were as follows:
| | | | | | | | | | | | | | | | | | | | |
Counterparty | | Interest
Rate | | | Trade Date | | | Maturity Date | | | Net Closing
Amount | | | Face Amount | |
| | | | | |
Bank of America | | | 2.110 | % | | | 1/14/2013 | | | | 2/14/2013 | | | $ | 1,286,333 | | | $ | 1,284,000 | |
Bank of America | | | 2.100 | % | | | 1/22/2013 | | | | 2/21/2013 | | | | 10,094,635 | | | | 10,077,000 | |
CRT Capital | | | 1.956 | % | | | 1/14/2013 | | | | 2/14/2013 | | | | 12,152,431 | | | | 12,132,000 | |
CRT Capital | | | 1.956 | % | | | 1/14/2013 | | | | 2/14/2013 | | | | 7,666,890 | | | | 7,654,000 | |
CRT Capital | | | 1.806 | % | | | 1/14/2013 | | | | 2/14/2013 | | | | 5,063,862 | | | | 5,056,000 | |
See accompanying notes which are an integral part of these financial statements.
26
Angel Oak Multi-Strategy Income Fund
Schedule of Investments – (continued)
January 31, 2013
| | | | | | | | | | | | | | | | | | | | |
Counterparty | | Interest
Rate | | | Trade Date | | | Maturity Date | | | Net Closing
Amount | | | Face Amount | |
| | | | | |
Credit Suisse Group AG | | | 1.850 | % | | | 1/9/2013 | | | | 2/8/2013 | | | $ | 4,957,236 | | | $ | 4,949,605 | |
Credit Suisse Group AG | | | 1.850 | % | | | 1/18/2013 | | | | 2/15/2013 | | | | 8,197,089 | | | | 8,185,311 | |
Credit Suisse Group AG | | | 1.850 | % | | | 1/18/2013 | | | | 2/15/2013 | | | | 1,627,668 | | | | 1,625,329 | |
Credit Suisse Group AG | | | 1.700 | % | | | 1/21/2013 | | | | 2/21/2013 | | | | 7,555,308 | | | | 7,544,264 | |
Credit Suisse Group AG | | | 1.850 | % | | | 1/22/2013 | | | | 2/21/2013 | | | | 7,710,782 | | | | 7,698,913 | |
Credit Suisse Group AG | | | 1.850 | % | | | 1/24/2013 | | | | 2/22/2013 | | | | 3,302,514 | | | | 3,297,600 | |
Credit Suisse Group AG | | | 1.850 | % | | | 1/28/2013 | | | | 2/27/2013 | | | | 9,927,979 | | | | 9,912,697 | |
Credit Suisse Group AG | | | 1.850 | % | | | 1/14/2013 | | | | 2/13/2013 | | | | 2,056,499 | | | | 2,053,333 | |
Guggenheim Partners, LLC | | | 2.100 | % | | | 1/29/2013 | | | | 2/26/2013 | | | | 14,455,572 | | | | 14,432,000 | |
Guggenheim Partners, LLC | | | 2.100 | % | | | 1/29/2013 | | | | 2/26/2013 | | | | 1,045,705 | | | | 1,044,000 | |
Jefferies | | | 3.210 | % | | | 1/14/2013 | | | | 2/14/2013 | | | | 4,784,188 | | | | 4,771,000 | |
Jefferies | | | 2.960 | % | | | 1/14/2013 | | | | 2/14/2013 | | | | 12,035,599 | | | | 12,005,000 | |
Jefferies | | | 3.200 | % | | | 1/30/2013 | | | | 2/14/2013 | | | | 1,485,979 | | | | 1,484,000 | |
JP Morgan | | | 1.960 | % | | | 1/31/2013 | | | | 3/18/2013 | | | | 10,957,374 | | | | 10,930,000 | |
Nomura | | | 1.608 | % | | | 1/11/2013 | | | | 2/11/2013 | | | | 2,318,205 | | | | 2,315,000 | |
Nomura | | | 2.305 | % | | | 1/18/2013 | | | | 2/19/2013 | | | | 12,954,485 | | | | 12,928,000 | |
Nomura | | | 2.305 | % | | | 1/18/2013 | | | | 2/19/2013 | | | | 10,063,574 | | | | 10,043,000 | |
Wells Fargo Securities, LLC | | | 1.704 | % | | | 1/28/2013 | | | | 2/28/2013 | | | | 3,658,359 | | | | 3,653,000 | |
| | | | | | | | | | | | | | | | | | | | |
Total | | | | | | | | | | | | | | | | | | $ | 155,075,052 | |
| | | | | | | | | | | | | | | | | | | | |
A reverse repurchase agreement, although structured as a sale and repurchase obligation, acts as a financing transaction under which the Fund will effectively pledge certain assets as collateral to secure a short-term loan. Generally the other party to the agreement makes the loan in an amount equal to at least 100% of the fair value of the pledged collateral. At the maturity of the reverse repurchase agreement, the Fund will be required to repay the loan and interest and correspondingly receive back its collateral. While used as collateral, the pledged assets continue to pay principal and interest which are for the benefit of the Fund.
See accompanying notes which are an integral part of these financial statements.
27
Angel Oak Multi-Strategy Income Fund
Statement of Assets and Liabilities
January 31, 2013
| | | | |
Assets | | | | |
Investments in securities at fair value (cost $1,088,794,125) | | $ | 1,115,304,403 | |
Cash due from broker (a) | | | 2,118,150 | |
Receivable for fund shares sold | | | 41,715,042 | |
Receivable for investments sold | | | 2,249,625 | |
Dividends and interest receivable | | | 3,960,051 | |
Prepaid expenses | | | 99,177 | |
| | | | |
Total Assets | | | 1,165,446,448 | |
| | | | |
| |
Liabilities | | | | |
Payable for reverse repurchase agreements | | | 155,075,052 | |
Payable for fund shares redeemed | | | 855,833 | |
Payable for investments purchased | | | 54,176,322 | |
Interest payable for reverse repurchase agreements | | | 109,664 | |
Payable to Adviser | | | 468,634 | |
Payable to administrator, fund accountant, and transfer agent | | | 55,105 | |
Payable to custodian | | | 9,018 | |
12b-1 fees accrued | | | 104,820 | |
Other accrued expenses | | | 139,734 | |
| | | | |
Total Liabilities | | | 210,994,182 | |
| | | | |
Net Assets | | $ | 954,452,266 | |
| | | | |
| |
Net Assets consist of: | | | | |
Paid-in capital | | $ | 922,895,529 | |
Accumulated net investment income | | | 3,003,048 | |
Accumulated net realized gain from investment transactions | | | 2,043,411 | |
Net unrealized appreciation on investments | | | 26,510,278 | |
| | | | |
Net Assets | | $ | 954,452,266 | |
| | | | |
(a) Margin claim to be received from broker.
See accompanying notes which are an integral part of these financial statements.
28
Angel Oak Multi-Strategy Income Fund
Statement of Assets and Liabilities – (continued)
January 31, 2013
| | | | |
| |
Class A: | | | | |
Net Assets | | $ | 486,444,310 | |
| | | | |
Shares outstanding (unlimited number of shares authorized,
no par value) | | | 39,403,060 | |
| | | | |
Net asset value (“NAV”) per share | | $ | 12.35 | |
| | | | |
Offering price per share (NAV/0.9425) (a) | | $ | 13.10 | |
| | | | |
| |
Class C: | | | | |
Net Assets | | $ | 22,820,705 | |
| | | | |
Shares outstanding (unlimited number of shares authorized,
no par value) | | | 1,853,292 | |
| | | | |
Net asset value (“NAV”) and offering price per share | | $ | 12.31 | |
| | | | |
Minimum redemption price per share (NAV*0.99) (b) | | $ | 12.19 | |
| | | | |
| |
Institutional Class: | | | | |
Net Assets | | $ | 445,187,251 | |
| | | | |
Shares outstanding (unlimited number of shares authorized,
no par value) | | | 36,077,738 | |
| | | | |
Net asset value (“NAV”) and offering price per share | | $ | 12.34 | |
| | | | |
| (a) | Class A shares impose a maximum 5.75% sales charge on purchases. |
| (b) | A contingent deferred sales charge (“CDSC”) of 1.00% may be charged. |
See accompanying notes which are an integral part of these financial statements.
29
Angel Oak Multi-Strategy Income Fund
Statement of Operations
For the year ended January 31, 2013
| | | | |
Investment Income | | | | |
Dividend income | | $ | 56,776 | |
Interest income | | | 16,988,944 | |
| | | | |
Total Investment Income | | | 17,045,720 | |
| | | | |
Expenses | | | | |
Investment Advisory fees | | | 3,469,794 | |
12b-1 fees – Class A | | | 432,012 | |
12b-1 fees – Class C (a) | | | 59,923 | |
Administration expenses | | | 153,324 | |
Fund accounting expenses | | | 61,532 | |
Transfer agent expenses | | | 79,055 | |
Legal expenses | | | 41,051 | |
Registration expenses | | | 74,899 | |
Custodian expenses | | | 56,015 | |
Auditing expenses | | | 25,943 | |
Trustee expenses | | | 5,206 | |
Insurance expenses | | | 4,156 | |
Pricing expenses | | | 26,783 | |
Report printing expenses | | | 58,153 | |
Offering expenses | | | 20,101 | |
24f-2 expenses | | | 102,614 | |
CCO expenses | | | 750 | |
Miscellaneous expenses | | | 4,560 | |
Interest on reverse repurchase agreements | | | 888,972 | |
Line of credit expenses | | | 5,116 | |
Excise tax expenses | | | 88 | |
Other expenses – overdraft fee | | | 67 | |
| | | | |
Total Expenses | | | 5,570,114 | |
| | | | |
Fees contractually waived by Adviser | | | (1,319,337 | ) |
Fees voluntarily waived by Adviser | | | (249,072 | ) |
| | | | |
Net operating expenses | | | 4,001,705 | |
| | | | |
Net Investment Income | | | 13,044,015 | |
| | | | |
| |
Realized and Unrealized Gain on Investments | | | | |
Net realized gain on investment transactions | | | 4,395,366 | |
Net change in unrealized appreciation of investments | | | 26,233,180 | |
| | | | |
Net realized and unrealized gain on investments | | | 30,628,546 | |
| | | | |
Net increase in net assets resulting from operations | | $ | 43,672,561 | |
| | | | |
| (a) | Class C shares commenced operations on March 14, 2012. |
See accompanying notes which are an integral part of these financial statements.
30
Angel Oak Multi-Strategy Income Fund
Statement of Cash Flows
For the year ended January 31, 2013
| | | | |
Increase/(Decrease) in Cash | | | | |
Cash flows from operating activities: | | | | |
Net increase in net assets resulting from operations | | $ | 43,672,561 | |
Adjustments to reconcile net increase in net assets from operations to net cash used in operating activities: | | | | |
Accretion of discount/amortization of premium, net | | | (784,553 | ) |
Purchase of long-term securities | | | (1,085,181,279 | ) |
Proceeds from sales of long-term securities | | | 162,816,607 | |
Purchases of short-term securities, net | | | (126,946,394 | ) |
Increase in dividends and interest receivable | | | (3,834,810 | ) |
Increase in receivable for investments sold | | | (1,783,911 | ) |
Increase in prepaid expenses | | | (79,839 | ) |
Decrease in deferred offering expense | | | 20,101 | |
Increase in payable to Adviser | | | 451,070 | |
Increase in payable for investments purchased | | | 54,081,570 | |
Increase in interest payable for reverse repurchase agreements | | | 106,557 | |
Increase in accrued expenses and expenses payable | | | 263,274 | |
Net realized gain on investment securities | | | (4,395,366 | ) |
Net gains on paydowns of mortgage-backed securities | | | (4,384,726 | ) |
Change in unrealized appreciation on investments | | | (26,233,180 | ) |
| | | | |
Net cash used in operating activities | | | (992,212,318 | ) |
| | | | |
Cash flows from financing activities: | | | | |
Increase in payable for reverse repurchase agreements | | | 149,741,752 | |
Proceeds from shares sold | | | 962,471,558 | |
Amount paid for shares redeemed | | | (116,414,912 | ) |
Cash distributions paid | | | (2,065,997 | ) |
| | | | |
Net cash provided from financing activities | | | 993,732,401 | |
| | | | |
Net change in cash | | $ | 1,520,083 | |
Cash balance beginning of period | | $ | 598,067 | |
| | | | |
Cash balance end of period | | $ | 2,118,150 | |
| | | | |
Non cash financing activities not included herein consist of receivable for fund shares sold of $41,715,042, payable for fund shares redeemed of $855,833, and reinvestment of distributions of $10,482,669.
| | |
Supplemental Information |
Interest paid | | $779,784 |
31
See accompanying notes which are an integral part of these financial statements.
Angel Oak Multi-Strategy Income Fund
Statements of Changes in Net Assets
| | | | | | | | |
| | | For the Year
Ended
January 31, 2013 | | | For the Period
Ended
January 31, 2012 (a) | |
Increase in Net Assets due to: | | | | | | | | |
Operations | | | | | | | | |
Net investment income | | $ | 13,044,015 | | | $ | 574,901 | |
Net realized gain on investment transactions | | | 4,395,366 | | | | 20,670 | |
Net change in unrealized appreciation of investments | | | 26,233,180 | | | | 277,098 | |
| | | | | | | | |
Net increase in net assets resulting from operations | | | 43,672,561 | | | | 872,669 | |
| | | | | | | | |
Distributions | | | | | | | | |
From net investment income, Class A | | | (7,249,037 | ) | | | (481,449 | ) |
From net investment income, Class C | | | (202,571 | ) | | | – | |
From net investment income, Institutional Class | | | (2,891,461 | ) | | | – | |
From net realized gains, Class A | | | (1,321,776 | ) | | | – | |
From net realized gains, Class C | | | (63,207 | ) | | | – | |
From net realized gains, Institutional Class | | | (820,614 | ) | | | – | |
| | | | | | | | |
Total distributions | | | (12,548,666 | ) | | | (481,449 | ) |
| | | | | | | | |
Capital Transactions – Class A | | | | | | | | |
Proceeds from shares sold | | | 540,098,989 | | | | 36,395,572 | |
Reinvestment of distributions | | | 6,762,399 | | | | 455,976 | |
Amount paid for shares redeemed | | | (109,904,633 | ) | | | (10,987,439 | ) |
| | | | | | | | |
Total Class A | | | 436,956,755 | | | | 25,864,109 | |
| | | | | | | | |
Capital Transactions – Class C (b) | | | | | | | | |
Proceeds from shares sold | | | 22,401,838 | | | | – | |
Reinvestment of distributions | | | 206,158 | | | | – | |
Amount paid for shares redeemed | | | (427,809 | ) | | | – | |
| | | | | | | | |
Total Class C | | | 22,180,187 | | | | – | |
| | | | | | | | |
Capital Transactions – Institutional Class (c) | | | | | | | | |
Proceeds from shares sold | | | 441,330,827 | | | | – | |
Reinvestment of distributions | | | 3,514,112 | | | | – | |
Amount paid for shares redeemed | | | (6,908,839 | ) | | | – | |
| | | | | | | | |
Total Institutional Class | | | 437,936,100 | | | | – | |
| | | | | | | | |
Net increase in net assets resulting from capital transactions | | | 897,073,042 | | | | 25,864,109 | |
| | | | | | | | |
Total Increase in Net Assets | | | 928,196,937 | | | | 26,255,329 | |
| | | | | | | | |
Net Assets | | | | | | | | |
Beginning of period | | | 26,255,329 | | | | – | |
| | | | | | | | |
End of period | | $ | 954,452,266 | | | $ | 26,255,329 | |
| | | | | | | | |
Accumulated net investment income (loss) included in net assets at end of period | | $ | 3,003,048 | | | $ | 118,414 | |
| | | | | | | | |
See accompanying notes which are an integral part of these financial statements.
32
Angel Oak Multi-Strategy Income Fund
Statements of Changes in Net Assets – (continued)
| | | | | | | | |
| | | For the Year
Ended
January 31, 2013 | | | For the Period
Ended
January 31, 2012 (a) | |
Share Transactions – Class A | | | | | | | | |
Shares Sold | | | 45,555,230 | | | | 3,460,685 | |
Shares issued in reinvestment of distributions | | | 573,388 | | | | 43,557 | |
Shares redeemed | | | (9,185,969 | ) | | | (1,043,831 | ) |
| | | | | | | | |
Total Class A | | | 36,942,649 | | | | 2,460,411 | |
| | | | | | | | |
Share Transactions – Class C (b) | | | | | | | | |
Shares Sold | | | 1,871,231 | | | | – | |
Shares issued in reinvestment of distributions | | | 17,240 | | | | – | |
Shares redeemed | | | (35,179 | ) | | | – | |
| | | | | | | | |
Total Class C | | | 1,853,292 | | | | – | |
| | | | | | | | |
Share Transactions – Institutional Class (c) | | | | | | | | |
Shares Sold | | | 36,354,579 | | | | – | |
Shares issued in reinvestment of distributions | | | 291,363 | | | | – | |
Shares redeemed | | | (568,204 | ) | | | – | |
| | | | | | | | |
Total Institutional Class | | | 36,077,738 | | | | – | |
| | | | | | | | |
Net increase in share transactions | | | 74,873,679 | | | | 2,460,411 | |
| | | | | | | | |
| (a) | For the period June 28, 2011 (commencement of operations) to January 31, 2012. |
| (b) | Class C shares commenced operations on March 14, 2012. |
| (c) | Institutional Class commenced operations on August 16, 2012. |
See accompanying notes which are an integral part of these financial statements.
33
Angel Oak Multi-Strategy Income Fund
Financial Highlights
(For a share outstanding throughout each period)
| | | | | | | | | | | | | | | | | | | | | | | | | | | | | | | | |
| | | | | | Net asset
value,
beginning
of period | | | Net
investment
income | | | Net
realized
and
unrealized
gain (loss)
on
investments | | | Total from
investment
operations | | | Distributions
from net
investment
income | | | Distributions
from net
realized gain
on
investment
transactions | | | Total
distributions | |
Class A | | | | | | | | | | | | | | | | | | | | | | | | | | | | | | | | |
| | | 2012 | (b) | | $ | 10.00 | | | | 0.26 | | | | 0.63 | (c) | | | 0.89 | | | | (0.22 | ) | | | — | | | | (0.22 | ) |
| | | 2013 | | | $ | 10.67 | | | | 0.60 | | | | 1.74 | | | | 2.34 | | | | (0.61 | ) | | | (0.05 | ) | | | (0.66 | ) |
Class C | | | | | | | | | | | | | | | | | | | | | | | | | | | | | | | | |
| | | 2013 | (j) | | $ | 11.03 | | | | 0.47 | | | | 1.30 | | | | 1.77 | | | | (0.44 | ) | | | (0.05 | ) | | | (0.49 | ) |
Institutional Class | | | | | | | | | | | | | | | | | | | | | | | | | | | | | | | | |
| | | 2013 | (m) | | $ | 11.71 | | | | 0.25 | | | | 0.65 | | | | 0.90 | | | | (0.22 | ) | | | (0.05 | ) | | | (0.27 | ) |
| (a) | Total return in the above table represents the rate that the investor would have earned or lost on an investment in the Fund, assuming reinvestment of dividends. |
| (b) | For the period June 28, 2011 (commencement of operations for Class A) to January 31, 2012. |
| (c) | Realized and unrealized gains and losses per share in this caption are balancing amounts necessary to reconcile the change in net asset value per share for the period, and may not reconcile with the aggregate gains and losses in the Statement of Operations due to share transactions for the period. |
| (f) | Ratio includes interest expense. Had there been no interest expense, the ratio would have been 2.25%. |
| (g) | Ratio includes interest expense. Had there been no interest expense, the ratio would have been 3.18%. |
| (h) | Ratio includes interest expense. Had there been no interest expense, the ratio would have been 1.26%. |
| (i) | Ratio includes interest expense. Had there been no interest expense, the ratio would have been 1.90%. |
| (j) | For the period March 14, 2012 (commencement of operations for Class C) to January 31, 2013. |
| (k) | Ratio includes interest expense. Had there been no interest expense, the ratio would have been 2.00%. |
| (l) | Ratio includes interest expense. Had there been no interest expense, the ratio would have been 2.56%. |
| (m) | For the period August 16, 2012 (commencement of operations for Institutional Class) to January 31, 2013. |
| (n) | Ratio includes interest expense. Had there been no interest expense, the ratio would have been 0.99%. |
| (o) | Ratio includes interest expense. Had there been no interest expense, the ratio would have been 1.54%. |
See accompanying notes which are an integral part of these financial statements.
34
Angel Oak Multi-Strategy Income Fund
Financial Highlights
(For a share outstanding throughout each period)
| | | | | | | | | | | | | | | | | | | | | | | | | | | | | | |
Net asset
value,
end of
period | | | Total
return(a) | | | Net assets,
at end
of period
(000 omitted) | | | Ratio of
expenses
to average
net assets | | | Ratio of
expenses to
average net
assets before
waiver &
reimbursement | | | Ratio of
net
investment
income to
average
net assets | | | Ratio of
net investment
income to
average net
assets before
waiver &
reimbursement | | | Portfolio
turnover rate | |
| | | | | | | | | | | | | | | | | | | | | | | | | | | | | | |
| | $10.67 | | | | 8.95 | %(d) | | $ | 26,255 | | | | 2.45 | %(e)(f) | | | 3.38 | %(e)(g) | | | 5.29 | %(e) | | | 4.36 | %(e) | | | 17.85 | %(d) |
| | $12.35 | | | | 22.57 | % | | $ | 486,444 | | | | 1.60 | %(h) | | | 2.23 | %(i) | | | 5.02 | % | | | 4.39 | % | | | 54.56 | % |
| | | | | | | | | | | | | | | | | | | | | | | | | | | | | | |
| | $12.31 | | | | 16.39 | %(d) | | $ | 22,821 | | | | 2.33 | %(e)(k) | | | 2.91 | %(e)(l) | | | 4.12 | %(e) | | | 3.55 | %(e) | | | 54.56 | % |
| | | | | | | | | | | | | | | | | | | | | | | | | | | | | | |
| | $12.34 | | | | 7.75 | %(d) | | $ | 445,187 | | | | 1.34 | %(e)(n) | | | 1.89 | %(e)(o) | | | 5.07 | %(e) | | | 4.52 | %(e) | | | 54.56 | % |
See accompanying notes which are an integral part of these financial statements.
35
Angel Oak Multi-Strategy Income Fund
Notes to the Financial Statements
January 31, 2013
NOTE 1. ORGANIZATION
The Angel Oak Multi-Strategy Income Fund (the “Fund”) is an open-end non-diversified series of the Valued Advisers Trust (the “Trust”). The Trust is a management investment company established under the laws of Delaware by an Agreement and Declaration of Trust dated June 13, 2008 (the “Trust Agreement”). The Trust Agreement permits the Trustees to issue an unlimited number of shares of beneficial interest of separate series without par value. The Fund is one of a series of funds authorized by the Trustees. The Fund’s investment adviser is Angel Oak Capital Advisors, LLC (the “Adviser”). The investment objective of the Fund is current income.
The Fund currently offers three share classes, Class A, Class C and Institutional Class. The Fund commenced operations by offering Class A shares on June 28, 2011. The Fund began to offer Class C shares on March 14, 2012 and the Institutional Class shares on August 16, 2012. Each share represents an equal proportionate interest in the assets and liabilities belonging to the Fund and is entitled to such dividends and distributions out of income belonging to the Fund as are declared by the Trust’s Board of Trustees. Class A currently has a maximum sales charge on purchases of 5.75% as a percentage of the original purchase price. Class C does not have an initial sales charge on purchases. The dealer of record receives a payment from the Fund’s distributor of 1.00% of the amount you invest in Class C shares. If you redeem your Class C shares within one year of purchase, you will be subject to a 1.00% contingent deferred sales charge (“CDSC”), based on the lower of the shares’ cost or current net asset value. Any shares acquired by reinvestment of distributions will be redeemed without a CDSC. For the year ended January 31, 2013, CDSC fees on Class C Shares paid to the Distributor were $3,877.
NOTE 2. SIGNIFICANT ACCOUNTING POLICIES
The following is a summary of significant accounting policies consistently followed by the Fund in the preparation of its financial statements. These policies are in conformity with the generally accepted accounting principles in the United States of America (“GAAP”).
Securities Valuation – All investments in securities are recorded at their estimated fair value as described in Note 3.
Federal Income Taxes – The Fund makes no provision for federal income or excise tax. The Fund intends to qualify each year as a regulated investment company (“RIC”) under subchapter M of the Internal Revenue Code of 1986, as amended, by complying with the requirements applicable to RICs and by distributing substantially all of its taxable income. The Fund also intends to distribute sufficient net investment income
36
Angel Oak Multi-Strategy Income Fund
Notes to the Financial Statements - (continued)
January 31, 2013
NOTE 2. SIGNIFICANT ACCOUNTING POLICIES - (continued)
and net capital gains, if any, so that it will not be subject to excise tax on undistributed income and gains. If the required amount of net investment income or gains is not distributed, the Fund could incur a tax expense.
As of, and during the year ended January 31, 2013, the Fund did not have a liability for any unrecognized tax benefits. The Fund recognizes interest and penalties, if any, related to unrecognized tax benefits as income tax expense in the statement of operations. During the period, the Fund did not incur any interest or penalties. The Fund is subject to examination by U.S. federal tax authorities for all tax years since inception.
Expenses – Expenses incurred by the Trust that do not relate to a specific fund of the Trust are allocated to the individual funds based on each fund’s relative net assets or another appropriate basis (as determined by the Trustees). Expenses attributable to any class are borne by that class. Income, realized gains and losses, unrealized appreciation and depreciation, and expenses are allocated to each class based on the net assets in relation to the relative net assets of the Fund.
Security Transactions and Related Income – The Fund follows industry practice and records security transactions on the trade date. The specific identification method is used for determining gains or losses for financial statement and income tax purposes. Dividend income is recorded on the ex-dividend date and interest income is recorded on an accrual basis. Discounts and premiums on securities purchased are accreted or amortized using the effective interest method. The ability of issuers of debt securities held by the Fund to meet their obligations may be affected by economic and political developments in a specific country or region.
Dividends and Distributions – The Fund intends to distribute all or substantially all of its net investment income, if any, as dividends to its shareholders on a monthly basis. The Fund intends to distribute its net realized long term capital gains and its net realized short term capital gains, if any, at least once a year. Dividends to shareholders, which are determined in accordance with income tax regulations, are recorded on the ex-dividend date. The treatment for financial reporting purposes of distributions made to shareholders during the period from net investment income or net realized capital gains may differ from their ultimate treatment for federal income tax purposes. These differences are caused primarily by differences in the timing of the recognition of certain components of income, expense or realized capital gain for federal income tax purposes. Where such differences are permanent in nature, they are reclassified in the components of the net assets based on their ultimate characterization for federal
37
Angel Oak Multi-Strategy Income Fund
Notes to the Financial Statements - (continued)
January 31, 2013
NOTE 2. SIGNIFICANT ACCOUNTING POLICIES - (continued)
income tax purposes. Any such reclassifications will have no effect on net assets, results of operations or net asset values per share of the Fund. For the year ended January 31, 2013, the Fund made the following reclassifications to increase/(decrease) the components of net assets:
| | | | | | | | |
Paid in Capital | | Accumulated
Undistributed
Net Investment
Income | | | Accumulated
Net Realized
Gain (Loss) on
Investments | |
| $(20,189) | | $ | 183,688 | | | $ | (163,499 | ) |
Reverse Repurchase Agreements – A reverse repurchase agreement is the sale by the Fund of a security to a party for a specified price, with the simultaneous agreement by the Fund to repurchase that security from that party on a future date at a higher price. Securities sold under reverse repurchase agreements are reflected as a liability on the Statements of Assets and Liabilities. Interest payments made are recorded as a component of interest expense on the Statements of Operations. Reverse repurchase agreements involve the risk that the counterparty will become subject to bankruptcy or other insolvency proceedings or fail to return a security to the Fund. In such situations, the Fund may incur losses as a result of a possible decline in the value of the underlying security during the period while the Fund seeks to enforce its rights, a possible lack of access to income on the underlying security during this period, or expenses of enforcing its rights.
NOTE 3. SECURITIES VALUATION AND FAIR VALUE MEASUREMENTS
Fair value is defined as the price that a Fund would receive upon selling an investment in a timely transaction to an independent buyer in the principal or most advantageous market of the investment. GAAP establishes a three-tier hierarchy to maximize the use of observable market data and minimize the use of unobservable inputs and to establish classification of fair value measurements for disclosure purposes.
Inputs refer broadly to the assumptions that market participants would use in pricing the asset or liability, including assumptions about risk (the risk inherent in a particular valuation technique used to measure fair value, such as pricing models and/or the risk inherent in the inputs to the valuation technique). Inputs may be observable or unobservable. Observable inputs are inputs that reflect the assumptions market participants would use in pricing the asset or liability developed based on market data obtained from sources independent of the reporting entity. Unobservable inputs are inputs that reflect the reporting entity’s own assumptions about the assumptions market
38
Angel Oak Multi-Strategy Income Fund
Notes to the Financial Statements - (continued)
January 31, 2013
NOTE 3. SECURITIES VALUATION AND FAIR VALUE MEASUREMENTS - (continued)
participants would use in pricing the asset or liability developed based on the best information available in the circumstances.
Various inputs are used in determining the value of the Fund’s investments. These inputs are summarized in the three broad levels listed below.
| | • | | Level 1 – quoted prices in active markets for identical securities |
| | • | | Level 2 – other significant observable inputs (including, but not limited to, quoted prices for an identical security in an inactive market, quoted prices for similar securities, interest rates, prepayment speeds, credit risk, etc.) |
| | • | | Level 3 – significant unobservable inputs (including the Fund’s own assumptions in determining fair value of investments based on the best information available) |
The inputs used to measure fair value may fall into different levels of the fair value hierarchy. In such cases, for disclosure purposes, the level in the fair value hierarchy within which the fair value measurement falls in its entirety is determined based on the level input that is most significant to the fair value measurement in its entirety.
Equity securities are generally valued by using market quotations, but may be valued on the basis of prices furnished by a pricing service when the Fund believes such prices more accurately reflect the fair value of such securities. Securities that are traded on any stock exchange are generally valued by the pricing service at the last quoted sale price. Lacking a last sale price, an exchange traded security is generally valued by the pricing service at its last bid price. Securities traded in the NASDAQ over-the-counter market are generally valued by the pricing service at the NASDAQ Official Closing Price. When using the market quotations or close prices provided by the pricing service and when the market is considered active, the security will be classified as a Level 1 security. Sometimes, an equity security owned by the Fund will be valued by the pricing service with factors other than market quotations or when the market is considered inactive. When this happens, the security will be classified as a Level 2 security. When market quotations are not readily available, when the Fund determines that the market quotation or the price provided by the pricing service does not accurately reflect the current fair value, or when certain restricted or illiquid securities are being valued, such securities are valued as determined in good faith by the Fund, in conformity with guidelines adopted by and subject to review by the Board of Trustees (the “Board”). These securities will be categorized as Level 3 securities.
39
Angel Oak Multi-Strategy Income Fund
Notes to the Financial Statements - (continued)
January 31, 2013
NOTE 3. SECURITIES VALUATION AND FAIR VALUE MEASUREMENTS - (continued)
Investments in mutual funds, including money market mutual funds, are generally priced at the ending net asset value (“NAV”) provided by the service agent of the funds. These securities will be categorized as Level 1 securities.
Fixed income securities, including collateralized mortgage obligations, collateralized loan obligations, collateralized debt obligations, asset-backed securities, U.S government mortgage-backed agencies, U.S. government agency issues and corporate bonds, when valued using market quotations in an active market, will be categorized as Level 1 securities. However, they may be valued using a broker quote or on the basis of prices furnished by a pricing service when the Fund believes such prices more accurately reflect the fair value of such securities. A pricing service utilizes electronic data processing techniques based on yield spreads relating to securities with similar characteristics to determine prices for normal institutional-size trading units of debt securities without regard to sale or bid prices. For collateralized mortgage obligations and mortgage-backed securities, the pricing service may also use prepayment speeds, consideration of collateral, unemployment rates, credit risk, foreclosures, and liquidations. These securities will generally be categorized as Level 2 securities. Fixed income securities purchased on a delayed delivery basis will be valued at the purchase price until settlement when prices are not readily available from a pricing service. These will be categorized as Level 3 securities. If the Fund decides that a price provided by the pricing service does not accurately reflect the fair value of the securities, when prices are not readily available from a pricing service, if the purchase price is no longer indicative of fair value, or when restricted or illiquid securities are being valued, securities are valued at fair value as determined in good faith by the Fund, in conformity with guidelines adopted by and subject to review of the Board. These securities will be categorized as Level 3 securities.
Short-term investments in fixed income securities, (those with maturities of less than 60 days when acquired, or which subsequently are within 60 days of maturity), are valued by using the amortized cost method of valuation, which the Board has determined will represent fair value. These securities will be classified as Level 2 securities. Reverse repurchase agreements are valued based on the amount of cash received plus accrued interest, which represents fair value. These securities will be categorized as Level 2 securities.
In accordance with the Trust’s good faith pricing guidelines, the Fund is required to consider all appropriate factors relevant to the value of securities for which it has determined other pricing sources are not available or reliable as described above. No single standard exists for determining fair value, because fair value depends upon the circumstances of each individual case. As a general principle, the current fair value of an issue of securities being valued by the Fund would appear to be the amount which the
40
Angel Oak Multi-Strategy Income Fund
Notes to the Financial Statements - (continued)
January 31, 2013
NOTE 3. SECURITIES VALUATION AND FAIR VALUE MEASUREMENTS - (continued)
owner might reasonably expect to receive for them upon their current sale. Methods which are in accordance with this principle may, for example, be based on (i) a multiple of earnings; (ii) a discount from market of a similar freely traded security (including a derivative security or a basket of securities traded on other markets, exchanges or among dealers); or (iii) yield to maturity with respect to debt issues, or a combination of these and other methods. Good faith pricing is permitted if, in the Fund’s opinion, the validity of market quotations appears to be questionable based on factors such as evidence of a thin market in the security based on a small number of quotations, a significant event occurs after the close of a market but before a Fund’s NAV calculation that may affect a security’s value, or the Fund is aware of any other data that calls into question the reliability of market quotations. Good faith pricing may also be used in instances when the bonds the Fund invests in may default or otherwise cease to have market quotations readily available. Any fair valuation pricing done outside the Fund’s approved pricing methods must be approved by the Pricing Committee of the Board.
The following is a summary of the inputs used to value the Fund’s investments as of January 31, 2013:
| | | | | | | | | | | | | | | | |
| | | Valuation Inputs | |
| Assets | | Level 1 - Quoted
Prices in Active
Markets | | | Level 2 - Other
Observable
Inputs | | | Level 3 -
Unobservable
Inputs | | | Total | |
| Collateralized Mortgage Obligations | | $ | – | | | $ | 746,731,543 | | | $ | 45,210,184 | | | $ | 791,941,727 | |
| U.S. Government Agency Issues | | | – | | | | 86,358,913 | | | | – | | | | 86,358,913 | |
| U.S. Government Mortgage-Backed Agencies | | | – | | | | 53,137,183 | | | | – | | | | 53,137,183 | |
| Collateralized Loan Obligations | | | – | | | | 7,960,000 | | | | 27,121,823 | | | | 35,081,823 | |
| Corporate Bonds | | | – | | | | 14,803,684 | | | | – | | | | 14,803,684 | |
Asset Backed Securities | | | – | | | | 1,002,838 | | | | 2,930,668 | | | | 3,933,506 | |
| Collateralized Debt Obligations | | | – | | | | – | | | | 2,901,000 | | | | 2,901,000 | |
| Mutual Funds | | | 46,697 | | | | – | | | | – | | | | 46,697 | |
| Money Market Securities | | | 127,099,870 | | | | – | | | | – | | | | 127,099,870 | |
| Total | | $ | 127,146,567 | | | $ | 909,994,161 | | | $ | 78,163,675 | | | $ | 1,115,304,403 | |
| Liabilities | | | | | | | | | | | | | | | | |
| Reverse Repurchase Agreements | | $ | – | | | $ | (155,075,052 | ) | | $ | – | | | $ | (155,075,052 | ) |
41
Angel Oak Multi-Strategy Income Fund
Notes to the Financial Statements - (continued)
January 31, 2013
NOTE 3. SECURITIES VALUATION AND FAIR VALUE MEASUREMENTS - (continued)
Following is a reconciliation of investments in which significant unobservable inputs (Level 3) were used in determining fair value for the Fund:
| | | | | | | | | | | | | | | | | | | | |
| | | Collateralized
Mortgage
Obligations | | | Collateralized
Loan
Obligations | | | Asset
Backed
Securities | | | Collateralized
Debt
Obligations | | | Total | |
Balance as of January 31, 2012 | | $ | – | | | $ | – | | | $ | – | | | $ | – | | | $ | – | |
Realized gain (loss) | | | – | | | | – | | | | – | | | | – | | | | – | |
Amortization | | | (3,378 | ) | | | 2,465 | | | | – | | | | – | | | | (913 | ) |
Change in unrealized appreciation (depreciation) | | | (29,719 | ) | | | (2,465 | ) | | | – | | | | – | | | | (32,184 | ) |
Purchases | | | 45,243,281 | | | | 27,121,823 | | | | 2,930,668 | | | | 2,901,000 | | | | 78,196,772 | |
Sales | | | – | | | | – | | | | – | | | | – | | | | – | |
Transfers in to Level 3 | | | – | | | | – | | | | – | | | | – | | | | – | |
Transfers out of Level 3 | | | – | | | | – | | | | – | | | | – | | | | – | |
| | | | | | | | | | | | | | | | | | | | |
Balance as of January 31, 2013 | | $ | 45,210,184 | | | $ | 27,121,823 | | | $ | 2,930,668 | | | $ | 2,901,000 | | | $ | 78,163,675 | |
| | | | | | | | | | | | | | | | | | | | |
The Fund’s Level 3 investments have been valued using unadjusted third party quotations or acquisition cost. As a result, there were no unobservable inputs that have been internally developed by the Fund in determining the fair values of its investments as of January 31, 2013.
The total change in unrealized appreciation (depreciation) attributable to Level 3 investments still held at January 31, 2013 was $(32,184) as shown below.
| | | | |
| | | Total Change in Unrealized
Appreciation (Depreciation) | |
Collateralized Mortgage Obligations | | $ | (29,719 | ) |
Collateralized Loan Obligations | | | (2,465 | ) |
| | | | |
Total | | $ | (32,184 | ) |
| | | | |
The Fund did not hold any derivative instruments during the reporting period. The Fund recognizes transfers between fair value hierarchy levels at the reporting period end. There were no transfers between any Levels for the year ended January 31, 2013.
NOTE 4. FEES AND OTHER TRANSACTIONS WITH AFFILIATES
Under the terms of the investment advisory agreement, on behalf of the Fund (the “Agreement”), the Adviser manages the Fund’s investments subject to oversight of the Trustees. As compensation for its management services, the Fund is obligated to pay the Adviser a fee computed and accrued daily and paid monthly at an annual rate of
42
Angel Oak Multi-Strategy Income Fund
Notes to the Financial Statements - (continued)
January 31, 2013
NOTE 4. FEES AND OTHER TRANSACTIONS WITH AFFILIATES - (continued)
1.50% of the average daily net assets of the Fund on the first $200 million in assets, 1.25% for the next $300 million in assets and 1.00% for any assets in excess of $500 million. For the year ended January 31, 2013, the Adviser earned a fee of $3,469,794 from the Fund before the reimbursement described below. At January 31, 2013, the Fund owed the Adviser $468,634.
Effective September 1, 2012, the Adviser has contractually agreed to waive or limit its fees and to assume other expenses of the Fund until August 31, 2013, so that Total Annual Fund Operating Expenses do not exceed 0.99% with the contractual waiver totaling $1,152,226. From May 1, 2012 through August 31, 2012 the Adviser contractually agreed to limit its fees to 1.50% of the Total Annual Fund Operating expenses with the contractual waiver totaling $139,270. From February 1, 2012 through April 30, 2012 the Adviser contractually agreed to limit its fees to 2.00% of the Total Annual Fund Operating expenses with the contractual waiver totaling $27,841. This operating expense limitation does not apply to brokerage fees and commissions, borrowing costs (such as interest and dividend expenses on securities sold short), taxes, 12b-1 fees, extraordinary expenses and indirect expenses (such as “acquired funds fees and expenses”). For the year ended January 31, 2013, the Adviser waived fees and reimbursed expenses of $1,568,409 to the Fund, of which $249,072 and $1,319,337 were voluntarily and contractually reimbursed respectively.
The waiver and/or reimbursement by the Adviser with respect to the Fund is subject to repayment by the Fund within the three fiscal years following the fiscal year in which that particular waiver and/or reimbursement occurred, provided that the Fund is able to make the repayment without exceeding the expense limitations described above. The amounts subject to repayment by the Fund, pursuant to the aforementioned conditions, at January 31, 2013 are as follows:
| | |
Amount | | Recoverable through
January 31, |
$100,940 | | 2015 |
$1,319,337 | | 2016 |
The Trust retains Huntington Asset Services, Inc. (“HASI”) to manage the Fund’s business affairs and provide the Fund with administrative services, including all regulatory reporting and necessary office equipment and personnel related to that function. For the year ended January 31, 2013, HASI earned fees of $153,324 for administrative services provided to the Fund. At January 31, 2013, HASI was owed $36,075 from the Fund for administrative services. Certain officers and one Trustee of
43
Angel Oak Multi-Strategy Income Fund
Notes to the Financial Statements - (continued)
January 31, 2013
NOTE 4. FEES AND OTHER TRANSACTIONS WITH AFFILIATES - (continued)
the Trust are members of management and/or employees of HASI. HASI is a wholly-owned subsidiary of Huntington Bancshares, Inc., the parent company of Unified Financial Securities, Inc. (the “Distributor”) and Huntington National Bank, the custodian of the Fund’s investments (the “Custodian”). For the year ended January, 31, 2013, the Custodian earned fees of $56,015 for custody services provided to the Fund. At January 31, 2013, the Custodian was owed $9,018 from the Fund for custody services.
The Trust also retains HASI to act as the Fund’s transfer agent and to provide fund accounting services. For the year ended January 31, 2013, HASI earned fees of $79,055 for transfer agent services and reimbursement for out-of-pocket expenses incurred in providing transfer agent services to the Fund. At January 31, 2013, the Fund owed HASI $8,018 for transfer agent services and out-of-pocket expenses.
For the year ended January 31, 2013, HASI earned fees of $61,532 from the Fund for fund accounting services. At January 31, 2013, HASI was owed $11,012 from the Fund for fund accounting services.
The Fund has adopted a Distribution Plan (the “Plan”) pursuant to Rule 12b-1 under the 1940 Act. The Plan provides that the Fund will pay the Distributor and/or any registered securities dealer, financial institution or any other person (the “Recipient”) a shareholder servicing fee of up to 0.25% (Class A shares) and 1.00% (Class C shares) of each share classes’ respective average daily net assets of the Fund in connection with the promotion and distribution of the Fund’s shares or the provision of personal services to shareholders, including, but not necessarily limited to, advertising, compensation to underwriters, dealers and selling personnel, the printing and mailing of prospectuses to other than current Fund shareholders, the printing and mailing of sales literature and servicing shareholder accounts. The Fund or Adviser may pay all or a portion of these fees to any Recipient who renders assistance in distributing or promoting the sale of shares, or who provides certain shareholder services, pursuant to a written agreement. The Plan is a compensation plan, which means that compensation is paid regardless of 12b-1 expenses actually incurred. It is anticipated that the Plan will benefit shareholders because an effective sales program typically is necessary in order for the Fund to reach and maintain a sufficient size to achieve efficiently its investment objectives and to realize economies of scale. For the year ended January 31, 2013, Class A shares 12b-1 expense incurred by the Fund was $432,012 and Class C shares 12b-1 expense incurred $59,923. The Fund owed $87,992 for Class A shares and $16,828 for Class C shares 12b-1 fees as of January 31, 2013.
44
Angel Oak Multi-Strategy Income Fund
Notes to the Financial Statements - (continued)
January 31, 2013
NOTE 4. FEES AND OTHER TRANSACTIONS WITH AFFILIATES - (continued)
Unified Financial Securities, Inc. (the “Distributor”) acts as the principal underwriter of the Fund’s shares. During the year ended January 31, 2013, the Distributor received $198,458 from commissions earned on sales of Class A shares and $201,546 from commissions earned on sales of Class C shares. An officer of the Trust is an officer of the Distributor and such person may be deemed to be an affiliate of the Distributor.
NOTE 5. PURCHASES AND SALES OF SECURITIES
For the year ended January 31, 2013, purchases and sales of investment securities, other than short-term investments and short-term U.S. government obligations, were as follows:
| | | | | | | | |
| | | Purchases | | | Sales | |
U.S. Government Obligations | | $ | – | | | $ | – | |
Other | | | 1,085,181,279 | | | | 162,816,607 | |
At January 31, 2013, the net unrealized appreciation (depreciation) of investments for tax purposes was as follows:
| | | | |
Gross Unrealized Appreciation | | $ | 29,240,656 | |
Gross Unrealized (Depreciation) | | | (2,759,431 | ) |
| | | | |
Net Unrealized Appreciation on Investments | | $ | 26,481,225 | |
| | | | |
At January 31, 2013, the aggregate cost of securities for federal income tax purposes was $1,088,823,178 for the Fund.
NOTE 6. ESTIMATES
The preparation of financial statements in conformity with GAAP requires management to make estimates and assumptions that affect the reported amounts of assets and liabilities and disclosure of contingent assets and liabilities at the date of the financial statements and the reported amounts of increases and decreases in net assets from operations during the reporting period. Actual results could differ from those estimates.
NOTE 7. BENEFICIAL OWNERSHIP
The beneficial ownership, either directly or indirectly, of 25% or more the voting securities of a fund creates a presumption of control of a fund, under Section 2(a)(9) of the Investment Company Act of 1940. At January 31, 2013, Charles Schwab & Co.,
45
Angel Oak Multi-Strategy Income Fund
Notes to the Financial Statements - (continued)
January 31, 2013
NOTE 7. BENEFICIAL OWNERSHIP - (continued)
owned, as record shareholder, 19.49%, of the outstanding shares of Class A and 75.87% of the outstanding shares of Class I. The Trust does not know whether Charles Schwab & Co., or any of the underlying beneficial owners owned or controlled 25% or more of the voting securities of the Fund or any class thereof.
NOTE 8. DISTRIBUTIONS TO SHAREHOLDERS
The Fund paid the following income distributions to shareholders for the period ended January 31, 2013:
| | | | | | | | |
| | | Record Date | | Ex-Dividend Date | | Per Share
Amount | |
Class A | | January 31, 2012 | | February 1, 2012 | | $ | 0.0552 | |
| | February 29, 2012 | | March 1, 2012 | | $ | 0.0640 | |
| | March 30, 2012 | | April 2, 2012 | | $ | 0.0674 | |
| | April 30, 2012 | | May 1, 2012 | | $ | 0.0467 | |
| | June 4, 2012 | | June 5, 2012 | | $ | 0.0550 | |
| | July 3, 2012 | | July 5, 2012 | | $ | 0.0589 | |
| | August 3, 2012 | | August 6, 2012 | | $ | 0.0528 | |
| | September 4, 2012 | | September 5, 2012 | | $ | 0.0390 | |
| | October 4, 2012 | | October 5, 2012 | | $ | 0.0347 | |
| | November 2, 2012 | | November 5, 2012 | | $ | 0.0375 | |
| | December 4, 2012 | | December 5, 2012 | | $ | 0.0480 | |
| | December 28, 2012 | | December 31, 2012 | | $ | 0.0481 | |
Class C | | March 30, 2012 | | April 2, 2012 | | $ | 0.0657 | |
| | April 30, 2012 | | May 1, 2012 | | $ | 0.0402 | |
| | June 4, 2012 | | June 5, 2012 | | $ | 0.0500 | |
| | July 3, 2012 | | July 5, 2012 | | $ | 0.0558 | |
| | August 3, 2012 | | August 6, 2012 | | $ | 0.0479 | |
| | September 4, 2012 | | September 5, 2012 | | $ | 0.0336 | |
| | October 4, 2012 | | October 5, 2012 | | $ | 0.0304 | |
| | November 2, 2012 | | November 5, 2012 | | $ | 0.0311 | |
| | December 4, 2012 | | December 5, 2012 | | $ | 0.0419 | |
| | December 28, 2012 | | December 31, 2012 | | $ | 0.0411 | |
Class I | | September 4, 2012 | | September 5, 2012 | | $ | 0.0410 | |
| | October 4, 2012 | | October 5, 2012 | | $ | 0.0371 | |
| | November 2, 2012 | | November 5, 2012 | | $ | 0.0398 | |
| | December 4, 2012 | | December 5, 2012 | | $ | 0.0502 | |
| | December 28, 2012 | | December 31, 2012 | | $ | 0.0504 | |
46
Angel Oak Multi-Strategy Income Fund
Notes to the Financial Statements - (continued)
January 31, 2013
NOTE 8. DISTRIBUTIONS TO SHAREHOLDERS - (continued)
The Fund paid the following capital gains distributions to shareholders for the period ended January 31, 2013:
| | | | | | | | | | | | | | | | |
| | | | | | Record Date | | | Ex-Dividend Date | | | Per Share
Amount | |
Class A | | | Short Term | | | | December 4, 2012 | | | | December 5, 2012 | | | $ | 0.0473 | |
| | | Long Term | | | | December 4, 2012 | | | | December 5, 2012 | | | $ | 0.0022 | |
| | | | |
Class C | | | Short Term | | | | December 4, 2012 | | | | December 5, 2012 | | | $ | 0.0473 | |
| | | Long Term | | | | December 4, 2012 | | | | December 5, 2012 | | | $ | 0.0022 | |
| | | | |
Class I | | | Short Term | | | | December 4, 2012 | | | | December 5, 2012 | | | $ | 0.0473 | |
| | | Long Term | | | | December 4, 2012 | | | | December 5, 2012 | | | $ | 0.0022 | |
The fund paid the following income distributions to shareholders subsequent to January 31, 2013:
| | | | | | | | |
| | | Record Date | | Ex-Dividend Date | | Per Share
Amount | |
Class A | | February 4, 2013 | | February 5, 2013 | | $ | 0.0378 | |
| | March 4, 2013 | | March 5, 2013 | | $ | 0.0518 | |
| | | |
Class C | | February 4, 2013 | | February 5, 2013 | | $ | 0.0308 | |
| | March 4, 2013 | | March 5, 2013 | | $ | 0.0455 | |
| | | |
Class I | | February 4, 2013 | | February 5, 2013 | | $ | 0.0401 | |
| | March 4, 2013 | | March 5, 2013 | | $ | 0.0540 | |
The tax character of distributions paid for the fiscal period ended January 31, 2013 is as follows:
| | | | | | | | |
| | | 2013 | | | 2012 | |
Distributions paid from: | | | | | | | | |
Ordinary Income | | $ | 12,450,639 | | | $ | 481,449 | |
Net Long-Term Capital Gain | | | 98,027 | | | | – | |
| | | | | | | | |
| | $ | 12,548,666 | | | $ | 481,449 | |
| | | | | | | | |
At January 31, 2013, the components of distributable earnings (accumulated losses) on a tax basis were as follows:
| | | | |
Undistributed ordinary income | | $ | 4,940,619 | |
Undistributed long-term capital gains | | | 138,294 | |
Other accumulated losses | | | (3,401 | ) |
Unrealized appreciation | | | 26,481,225 | |
| | | | |
| | $ | 31,556,737 | |
| | | | |
47
Angel Oak Multi-Strategy Income Fund
Notes to the Financial Statements - (continued)
January 31, 2013
NOTE 8. DISTRIBUTIONS TO SHAREHOLDERS - (continued)
At January 31, 2013 the difference between book and tax basis unrealized appreciation is attributable to wash sales and unamortized organizational costs.
NOTE 9. COMMITMENTS AND CONTINGENCIES
The Fund indemnifies its officers and trustees for certain liabilities that may arise from performance of their duties to the Fund. Additionally, in the normal course of business, the Fund enters into contracts that contain a variety of representations and warranties which provide general indemnifications. The Fund’s maximum exposure under these arrangements is unknown, as this would involve future claims that may be made against the Fund that have not yet occurred.
NOTE 10. RESTRICTED SECURITIES
Restricted securities are securities that may only be resold upon registration under federal securities laws or in transactions exempt from such registration. In some cases, the issuer of restricted securities has agreed to register such securities for resale, at the issuer’s expense, either upon demand or in connection with another registered offering of the securities. Many restricted securities may be resold in the secondary market in transactions exempt from registration. Such restricted securities may be determined by the Fund to be liquid. The Fund does not anticipate incurring any registration costs upon such resale. The Fund’s restricted securities are valued at prices provided by a pricing service or dealers in the secondary market or, if no market prices are available, at the fair value price as determined by the Fund’s Adviser or otherwise pursuant to the Fund’s fair value policies and procedures. The Fund has acquired securities, the sale of which is restricted under Rule 144A of the Securities Act of 1933. It is possible that the fair value price may differ significantly from the amount that may ultimately be realized in the near term, and the difference could be material. At January 31, 2013, the Fund held restricted securities representing 7.03% of net assets, as listed below:
| | | | | | | | | | | | | | |
| Issuer Description | | Acquisition
Date | | Principal
Amount | | | Amortized
Cost | | | Fair
Value | |
| Bayview Commercial Asset Trust, Series 2005-3A, Class A1, 0.524%, 11/25/2035 | | 8/24/2012 | | $ | 7,080,008 | | | $ | 5,558,808 | | | $ | 5,566,716 | |
| Credit Suisse Mortgage Capital Certificates, Series 2012-9, Class B1, 2.723%, 2/25/2050 | | (a) | | | 10,363,000 | | | | 9,413,594 | | | | 9,443,802 | |
| Store Master Funding LLC, Series 2012-1A, Class A, 5.770%, 8/20/2042 | | (b) | | | 994,476 | | | | 993,935 | | | | 1,049,928 | |
48
Angel Oak Multi-Strategy Income Fund
Notes to the Financial Statements - (continued)
January 31, 2013
NOTE 10. RESTRICTED SECURITIES - (continued)
| | | | | | | | | | | | | | |
| Issuer Description | | Acquisition
Date | | Principal
Amount | | | Amortized
Cost | | | Fair
Value | |
| WFRBS Commercial Mortgage Trust, Series 2011-C2, Class A4, 4.869%, 2/15/2044 | | 9/26/2012 | | $ | 3,000,000 | | | $ | 3,566,304 | | | $ | 3,528,120 | |
| WFRBS Commercial Mortgage Trust, Series 2011-C3, Class A4, 4.375%, 3/15/2044 | | 10/26/2012 | | | 4,000,000 | | | | 4,553,011 | | | | 4,562,852 | |
| Black Diamond CLO Ltd., Series 2012-1A, Class C, 4.809%, 2/1/2023 | | 12/19/2012 | | | 6,000,000 | | | | 5,497,046 | | | | 5,496,000 | |
| Cavalry CLO Ltd., Class D, 5.058%, 3/15/2022 | | 1/4/2013 | | | 7,000,000 | | | | 7,017,376 | | | | 7,017,500 | |
| Longfellow Place CLO Ltd., Series 2013-1A, Class D, 4.555%, 1/15/2024 | | 1/15/2013 | | | 4,000,000 | | | | 3,720,000 | | | | 3,720,000 | |
| Mountain Hawk I CLO Ltd., Series 2013-1A, Class D, 3.402%, 1/20/2024 | | 1/23/2013 | | | 4,000,000 | | | | 3,640,000 | | | | 3,640,000 | |
| Neuberger Berman CLO Ltd., Series 2012-13A, Class D, 4.865%, 1/23/2024 | | 11/20/2012 | | | 3,550,000 | | | | 3,341,738 | | | | 3,340,195 | |
| Symphony CLO XI Ltd., Series 2013-11A, Class D, 4.262%, 1/17/2025 | | 1/16/2013 | | | 4,000,000 | | | | 3,908,128 | | | | 3,908,128 | |
| TICC CLO LLC, Series 2012-1A, Class D1, 6.468%, 8/25/2023 | | (c) | | | 8,000,000 | | | | 7,902,893 | | | | 7,960,000 | |
| First Data Corp., 8.250%, 1/15/2021 | | 8/31/2012 | | | 1,000,000 | | | | 1,003,475 | | | | 1,035,000 | |
| Drug Royalty II LP, Series 2012-1, Class A1, 4.304%, 1/15/2025 | | 11/30/2012 | | | 2,930,668 | | | | 2,930,668 | | | | 2,930,668 | |
| JGWPT XXVII LLC, Series 3A, Class B, 6.170%, 9/15/2067 | | 11/9/2012 | | | 1,000,000 | | | | 999,985 | | | | 1,002,838 | |
| Atrium CDO Corp., 3.802%, 2/28/2024 | | 1/24/2013 | | | 3,000,000 | | | | 2,901,000 | | | | 2,901,000 | |
| TOTAL | | | | | | | | | | | | $ | 67,102,747 | |
| (a) | Purchased on various dates beginning 11/21/2012. |
| (b) | Purchased on various dates beginning 08/17/2012. |
| (c) | Purchased on various dates beginning 11/09/2012. |
NOTE 11. LINE OF CREDIT
The Fund participates in a short-term credit agreement (“Line of Credit”) with Huntington National Bank. (“Huntington”). Under the terms of the agreement, the Fund may borrow up to $10 million. The purpose of the agreement is to meet temporary or emergency cash needs, including redemption requests that might
49
Angel Oak Multi-Strategy Income Fund
Notes to the Financial Statements - (continued)
January 31, 2013
NOTE 11. LINE OF CREDIT - (continued)
otherwise require the untimely disposition of securities. Huntington receives an annual facility fee of 0.125% on $10 million for providing the Line of Credit. As of January 31, 2013, the Fund had no outstanding borrowings under this Line of Credit. As of March 25, 2013, the available line of credit was increased to $50 million.
| | | | | | | | | | | | | | | | |
Average Daily Loan
Balance | | Weighted
Average Interest
Rate | | | Number of Days
Outstanding* | | | Interest
Expense
Incurred | | | Maximum Loan
Outstanding | |
$10,000,000 | | | 1.714 | % | | | 1 | | | $ | 476 | | | $ | 10,000,000 | |
| * | Number of Days Outstanding represents the total days during the twelve months ended January 31, 2013 that the Fund utilized the Line of Credit. |
50
REPORT OF INDEPENDENT REGISTERED PUBLIC ACCOUNTING FIRM
To the Shareholders and Board of Trustees of
Angel Oak Multi-Strategy Income Fund
(Valued Advisers Trust)
We have audited the accompanying statement of assets and liabilities, including the schedule of investments of Angel Oak Multi-Strategy Income Fund (the “Fund”), a series of the Valued Advisers Trust, as of January 31, 2013, and the related statements of operations and cash flows for the year then ended, and the statements of changes in net assets and the financial highlights for each of the two periods in the period then ended. These financial statements and financial highlights are the responsibility of the Fund’s management. Our responsibility is to express an opinion on these financial statements and financial highlights based on our audits.
We conducted our audits in accordance with the standards of the Public Company Accounting Oversight Board (United States). Those standards require that we plan and perform the audit to obtain reasonable assurance about whether the financial statements and financial highlights are free of material misstatement. An audit includes examining, on a test basis, evidence supporting the amounts and disclosures in the financial statements. Our procedures included confirmation of securities owned as of January 31, 2013, by correspondence with the custodian and brokers or by other appropriate auditing procedures where replies from brokers were not received. An audit also includes assessing the accounting principles used and significant estimates made by management, as well as evaluating the overall financial statement presentation. We believe that our audits provide a reasonable basis for our opinion.
In our opinion, the financial statements and financial highlights referred to above present fairly, in all material respects, the financial position of Angel Oak Multi-Strategy Income Fund as of January 31, 2013, the results of its operations and its cash flows for the year then ended, and the changes in its net assets and the financial highlights for each of the two periods in the period then ended, in conformity with accounting principles generally accepted in the United States of America.
COHEN FUND AUDIT SERVICES, LTD.
Cleveland, Ohio
April 1, 2013
51
Management Agreement Renewal – (Unaudited)
At a meeting held December 10-12, 2012, the Board of Trustees (the “Board”) considered the renewal of the Investment Advisory Agreement (the “Agreement”) between the Trust and Angel Oak Capital Advisers, LLC (the “Adviser”) with respect to the Angel Oak Multi-Strategy Income Fund (the “Fund”). Counsel noted that the Investment Company Act of 1940, as amended, requires the approval of the investment advisory agreements between the Trust and its service providers by a majority of the Independent Trustees. The Board discussed the arrangements between the Adviser and the Trust with respect to the Fund. The Board reviewed a memorandum from Counsel addressed to the Trustees that summarized, among other things, the fiduciary duties and responsibilities of the Board in reviewing and approving the renewal of the Agreement. A copy of this memorandum was circulated to the Trustees in advance of the meeting. Counsel discussed with the Trustees the types of information and factors that should be considered by the Board in order to make an informed decision regarding the approval of the renewal of the Agreement, including the following material factors: (i) the nature, extent, and quality of the services provided by the Adviser; (ii) the investment performance of the Fund; (iii) the costs of the services to be provided and profits to be realized by the Adviser from the relationship with the Fund; (iv) the extent to which economies of scale would be realized if the Fund grows and whether advisory fee levels reflect those economies of scale for the benefit of the Fund’s investors; and (v) the Adviser’s practices regarding possible conflicts of interest.
In assessing these factors and reaching its decisions, the Board took into consideration information furnished for the Board’s review and consideration throughout the year at regular Board meetings, as well as information specifically prepared and/or presented in connection with the annual renewal process, including information presented at the Meeting. The Board requested and was provided with information and reports relevant to the annual renewal of the Agreement, including: (i) reports regarding the services and support provided to the Fund and effectively to its shareholders by the Adviser; (ii) quarterly assessments of the investment performance of the Fund by personnel of the Adviser; (iii) commentary on the reasons for the performance; (iv) presentations from the Adviser addressing the investment philosophy, investment strategy, personnel and operations used to manage the Fund; (v) compliance and audit reports concerning the Fund and the Adviser; (vi) disclosure information contained in the registration statement of the Trust and the Form ADV of the Adviser; (vii) information on relevant developments in the mutual fund industry and how the Fund and the Adviser are responding to them; and (viii) a memorandum from Counsel, that summarized the fiduciary duties and responsibilities of the Board in reviewing and approving the Agreement, including the material factors set forth above and the types of information included in each factor that should be considered by the Board in order to make an informed decision. The Board also requested and received various informational materials including, without limitation: (i) documents containing information about the Adviser, including financial information, a description of personnel and the services
52
Management Agreement Renewal – (Unaudited) (continued)
provided to the Fund, information on investment advice, performance, summaries of Fund expenses, compliance program, current legal matters, and other general information; (ii) comparative expense and performance information for other mutual funds with strategies similar to the Fund; (iii) the anticipated effect of size on the Fund’s performance and expenses; and (iv) benefits to be realized by the Adviser from its relationship with the Fund. The Board did not identify any particular information that was most relevant to its consideration to approve the Agreement and each Trustee may have afforded different weight to the various factors.
In deciding whether to approve the agreement, the Trustees considered numerous factors, including the following:
1. The nature, extent, and quality of the services to be provided by the Adviser. In this regard, the Board considered the Adviser’s responsibilities under the Agreement. The Trustees considered the services being provided by the Adviser to the Fund including, without limitation: the quality of its investment advisory services (including research and recommendations with respect to portfolio securities), its process for formulating investment recommendations and assuring compliance with the Fund’s investment objectives and limitations, its coordination of services for the Fund among the Fund’s service providers, and its efforts to promote the Fund and grow its assets. The Trustees considered the Adviser’s continuity of, and commitment to retain, qualified personnel and the Adviser’s commitment to maintain and enhance its resources and systems, the commitment of the Adviser’s personnel to finding alternatives and options that allow the Fund to maintain its goals, and the Adviser’s continued cooperation with the Independent Trustees and Counsel for the Fund. The Trustees considered the Adviser’s personnel, including the education and experience of the Adviser’s personnel. After considering the foregoing information and further information in the Meeting materials provided by the Adviser (including the Adviser’s Form ADV), the Board concluded that, in light of all the facts and circumstances, the nature, extent, and quality of the services provided by the Adviser were satisfactory and adequate for the Fund.
2. Investment Performance of the Fund and the Adviser. In considering the investment performance of the Fund and the Adviser, the Trustees compared the performance of the Fund with the performance of funds with similar objectives managed by other investment advisers, as well as with aggregated peer group data. The Trustees also considered the consistency of the Adviser’s management of the Fund with its investment objective, strategies, and limitations. The Trustees considered the Fund’s performance relative to the performance of accounts managed similarly to the Fund based on recent data, although it was noted that the separate accounts were not managed in a manner that was identical to the manner in which the Fund is managed. The Trustees noted that the Fund outperformed most of its peers during all relevant period. After reviewing and discussing the investment performance of the Fund further, the Adviser’s experience managing the Fund, the Adviser’s historical performance, and
53
Management Agreement Renewal – (Unaudited) (continued)
other relevant factors, the Board concluded, in light of all the facts and circumstances, that the investment performance of the Fund and the Adviser was acceptable.
3. The costs of the services to be provided and profits to be realized by the Adviser from the relationship with the Fund. In considering the costs of services to be provided and the profits to be realized by the Adviser from the relationship with the Fund, the Trustees considered: (1) the Adviser’s financial condition; (2) asset level of the Fund; (3) the overall expenses of the Fund; and (4) the nature and frequency of advisory fee payments. The Trustees reviewed information provided by the Adviser regarding its profits associated with managing the Fund. The Trustees also considered potential benefits for the Adviser in managing the Fund. The Trustees then compared the fees and expenses of the Fund (including the management fee) to other comparable mutual funds. The Trustees observed that the Fund’s management fee and overall expense ratio tended to be higher than its peer group average. Based on the foregoing, the Board concluded that the fees to be paid to the Adviser by the Fund and the profits to be realized by the Adviser, in light of all the facts and circumstances, were fair and reasonable in relation to the nature and quality of the services provided by the Adviser.
4. The extent to which economies of scale would be realized as the Fund grows and whether advisory fee levels reflect these economies of scale for the benefit of the Fund’s investors. In this regard, the Board considered the Fund’s fee arrangements with the Adviser. The Board noted that management fee structure contained breakpoints that would come into effect as asset levels increased and thus the Fund’s shareholders would realize the effect of economies of scale as the Fund grows. The Board also observed that as the Fund’s assets had increased, the advisory fees did, in fact, reflect the economies of scale for the benefit of the Fund’s shareholders. Moreover, the Board noted that the Adviser had continued to maintain an expense limitation arrangement that would limit the expenses of the Fund should assets fall below the levels necessary to benefit from the breakpoint structure contained in the management fee structure. In light of the foregoing, the Board determined that the Fund’s fee arrangements, in light of all the facts and circumstances, were fair and reasonable in relation to the nature and quality of the services provided by the Adviser.
5. Possible conflicts of interest. In considering the Adviser’s practices regarding conflicts of interest, the Trustees evaluated the potential for conflicts of interest and considered such matters as the experience and ability of the advisory personnel assigned to the Fund; the basis of decisions to buy or sell securities for the Fund; and the substance and administration of the Adviser’s code of ethics. The Trustees also considered disclosure in the registration statement of the Trust relating to the Adviser’s potential conflicts of interest. Based on the foregoing, the Board determined that the Adviser’s standards and practices of the Advisers relating to the identification and mitigation of potential conflicts of interest were satisfactory.
54
TRUSTEES AND OFFICERS – (Unaudited)
The Board of Trustees supervises the business activities of the Trust and is responsible for protecting the interests of shareholders. Each Trustee serves as a trustee until termination of the Trust unless the Trustee dies, resigns, retires or is removed.
The following table provides information regarding each of the Independent Trustees.
| | |
Name, Address*, (Age), Position with Trust**,
Term of Position with Trust | | Principal Occupation During Past 5 Years and
Other Directorships |
| Dr. Merwyn R. Vanderlind, 76, Independent Trustee, August 2008 to present. | | Retired consultant to Battelle Memorial Institute (International Science and Technology Research Enterprise) on business investments. |
Ira Cohen, 53 Independent Trustee, June 2010 to present. | | Independent financial services consultant (Feb. 2005 – present). |
| * | The address for each trustee and officer is 2960 N. Meridian St., Suite 300, Indianapolis, IN 46208. |
| ** | As of the date of this SAI, the Trust consists of 15 series. |
55
The following table provides information regarding the Trustee who is considered an “interested person” of the Trust, as that term is defined under the 1940 Act. Based on the experience of the Trustee, the Trust concluded that the individual described below should serve as a Trustee.
| | |
Name, Address*, (Age), Position with Trust**,
Term of Position with Trust | | Principal Occupation During Past 5 Years and
Other Directorships |
| R. Jeffrey Young, 48, Trustee and Chairman, June 2010 to present. | | Trustee, Valued Advisers Trust since June 2010; Senior Vice President, Huntington Asset Services, Inc. since January 2010; Chief Executive Officer, Huntington Funds since February 2010; President and Chief Executive Officer of Dreman Contrarian Funds March 2011 to February 2013; Trustee, Valued Advisers Trust, August 2008 to January 2010; Managing Director and Chief Operating Officer of Professional Planning Consultants 2007 to 2010; Co-Founder of Kinwood Group, LLC July 2007 to March 2008. |
| * | The address for each trustee and officer is 2960 N. Meridian St., Suite 300, Indianapolis, IN 46208. |
| ** | As of the date of this SAI, the Trust consists of 15 series. |
56
The following table provides information regarding the Officers of the Trust:
| | |
Name, Address*, (Age), Position with Trust,**
Term of Position with Trust | | Principal Occupation During Past 5 Years and
Other Directorships |
| R. Jeffrey Young, 48, Principal Executive Officer and President, February 2010 to present. | | Trustee, Valued Advisers Trust since June 2010; Senior Vice President, Huntington Asset Services, Inc. since January 2010; Chief Executive Officer, Huntington Funds since February 2010; President and Chief Executive Officer of Dreman Contrarian Funds March 2011 to February 2013; Trustee, Valued Advisers Trust, August 2008 to January 2010; Managing Director and Chief Operating Officer of Professional Planning Consultants 2007 to 2010; Co-Founder of Kinwood Group, LLC July 2007 to March 2008. |
| John C. Swhear, 51, Chief Compliance Officer, AML Officer and Vice President, August 2008 to present. | | Vice President of Legal Administration and Compliance for Huntington Asset Services, Inc., the Trust’s administrator, since April 2007; Chief Compliance Officer of Unified Financial Securities, Inc., the Trust’s distributor, since May 2007; Interim President of the Unified Series Trust since March 2012, and Senior Vice President from May 2007 to March 2012; Secretary of Huntington Funds from April 2010 to February 2012; President and Chief Executive Officer of Dreman Contrarian Funds from March 2010 to March 2011, and Vice President and Acting Chief Executive Officer, 2007 to March 2010. |
| Carol J. Highsmith, 47, Vice President, August 2008 to present. | | Employed in various positions with Huntington Asset Services, Inc., the Trust’s administrator, since November of 1994; currently Vice President of Legal Administration. |
| Matthew J. Miller, 36, Vice President, December 2011 to present. | | Employed in various positions with Huntington Asset Services, Inc., the Trust’s administrator, since July of 1998; currently Vice President of Relationship Management; Vice President of Huntington Funds since February 2010. |
57
| | |
Name, Address*, (Age), Position with Trust,**
Term of Position with Trust | | Principal Occupation During Past 5 Years and
Other Directorships |
| Robert W. Silva, 46, Treasurer and Chief Financial Officer, January 2013 to present | | Senior Vice President, Fund Administration for Huntington Asset Services, Inc., the Trust’s administrator, since September 2010; Treasurer and Chief Financial Officer of Unified Series Trust since June 2011; Treasurer and Chief Financial Officer of Dreman Contrarian Funds March 2011 to February 2013; Treasurer of Huntington Funds since November 2010; Senior Vice President of Citi Fund Services Ohio, Inc. from September 2007 to September 2010. |
Heather Bonds, 37 Secretary, September 2012 to present | | Employed in various positions with Huntington Asset Services, Inc., the Trust’s administrator, since January of 2004; currently Certified Paralegal and Section Manager 2. |
| * | The address for each trustee and officer is 2960 N. Meridian St., Suite 300, Indianapolis, IN 46208. |
| ** | As of the date of this SAI, the Trust consists of 15 series. |
OTHER INFORMATION
The Fund’s Statement of Additional Information (“SAI”) includes additional information about the Trustees and is available without charge, upon request. You may call toll-free at (877) 625-3042 to request a copy of the SAI or to make shareholder inquiries.
58
PROXY VOTING
A description of the policies and procedures that the Fund uses to determine how to vote proxies relating to portfolio securities and information regarding how the Fund voted those proxies during the most recent twelve month period ended June 30, is available without charge upon request by (1) calling the Fund at (877) 625-3042 and (2) from Fund documents filed with the Securities and Exchange Commission (“SEC”) on the SEC’s website at www.sec.gov.
TRUSTEES
R. Jeffrey Young, Chairman
Dr. Merwyn R. Vanderlind
Ira Cohen
OFFICERS
R. Jeffrey Young, Principal Executive Officer and President
John C. Swhear, Chief Compliance Officer, AML Officer and Vice-President
Carol J. Highsmith, Vice President
Matthew J. Miller, Vice President
Robert W. Silva, Interim Principal Financial Officer and Treasurer
Heather Bonds, Secretary
INVESTMENT ADVISER
Angel Oak Capital Advisors, LLC
One Buckhead Plaza
3060 Peachtree Road NW
Suite 1080
Atlanta, GA 30305
DISTRIBUTOR
Unified Financial Securities, Inc.
2960 North Meridian Street, Suite 300
Indianapolis, IN 46208
INDEPENDENT REGISTERED PUBLIC ACCOUNTING FIRM
Cohen Fund Audit Services, Ltd.
1350 Euclid Avenue, Suite 800
Cleveland, OH 44115
LEGAL COUNSEL
The Law Offices of John H. Lively & Associates, Inc.
A member firm of The 1940 Act Law Group TM
11300 Tomahawk Creek Parkway, Suite 310
Leawood, KS 66211
CUSTODIAN
Huntington National Bank
41 South High Street
Columbus, OH 43215
ADMINISTRATOR, TRANSFER AGENT AND FUND ACCOUNTANT
Huntington Asset Services, Inc.
2960 North Meridian Street, Suite 300
Indianapolis, IN 46208
This report is intended only for the information of shareholders or those who have received the Fund’s prospectus which contains information about the Fund’s management fee and expenses. Please read the prospectus carefully before investing.
Distributed by Unified Financial Securities, Inc.
Member FINRA/SIPC
Item 2. Code of Ethics.
As of the end of the period covered by this report, the registrant has adopted a code of ethics that applies to the registrant’s principal executive officer, principal financial officer, principal accounting officer or controller, or persons performing similar functions, regardless of whether these individuals are employed by the registrant or a third party. Pursuant to Item 12(a)(1), a copy of registrant’s code of ethics is filed as an exhibit to this Form N-CSR. During the period covered by this report, the code of ethics has not been amended, and the registrant has not granted any waivers, including implicit waivers, from the provisions of the code of ethics.
Item 3. Audit Committee Financial Expert.
(a) The registrant’s board of trustees has determined that the registrant does not have an audit committee financial expert. The committee members and the full Board considered a possibility of adding a member that would qualify as an expert. The audit committee determined that, although none of its members meet the technical definition of an audit committee expert, the committee has sufficient financial expertise to adequately perform its duties under the Audit Committee Charter without the addition of a qualified expert.
Item 4. Principal Accountant Fees and Services.
(a) Audit Fees
| | | | | | | | |
The Golub Fund: | | FY 2013 | | $ | 12,500 | |
| | | | FY 2012 | | $ | 12,500 | |
The Angel Oak Multi-Strategy Income Fund: | | FY 2013 | | $ | 18,500 | |
| | | | FY 2012 | | $ | 12,500 | |
(b) Audit-Related Fees
| | | | | | | | |
Registrant | |
| | |
The Golub Fund: | | FY 2013 | | $ | 0 | |
| | | | FY 2012 | | $ | 0 | |
The Angel Oak Multi-Strategy Income Fund: | | FY 2013 | | $ | 0 | |
| | | | FY 2012 | | | NA | |
(c) Tax Fees
| | | | | | | | |
Registrant | |
| | |
The Golub Fund: | | FY 2013 | | $ | 2,500 | |
| | | | FY 2012 | | $ | 2,500 | |
The Angel Oak Multi-Strategy Income Fund: | | FY 2013 | | $ | 2,500 | |
| | | | FY 2012 | | $ | 2,500 | |
Nature of the fees: Preparation of the 1120 RIC and Excise review
(d) All Other Fees
| | | | | | | | |
Registrant | |
| | |
The Golub Fund: | | FY 2013 | | $ | 0 | |
| | | | FY 2012 | | $ | 0 | |
The Angel Oak Multi-Strategy Income Fund: | | FY 2013 | | $ | 0 | |
| | | | FY 2012 | | $ | 0 | |
Nature of the fees:
-2-
| (e) (1) | Audit Committee’s Pre-Approval Policies |
| | The Audit Committee Charter requires the Audit Committee to be responsible for the selection, retention or termination of auditors and, in connection therewith, to (i) evaluate the proposed fees and other compensation, if any, to be paid to the auditors, (ii) evaluate the independence of the auditors, (iii) pre-approve all audit services and, when appropriate, any non-audit services provided by the independent auditors to the Trust, (iv) pre-approve, when appropriate, any non-audit services provided by the independent auditors to the Trust’s investment adviser, or any entity controlling, controlled by, or under common control with the investment adviser and that provides ongoing services to the Trust if the engagement relates directly to the operations and financial reporting of the Trust, and (v) receive the auditors’ specific representations as to their independence; |
| (2) | Percentages of Services Approved by the Audit Committee |
Registrant
| | | | | | | | |
Audit-Related Fees: | | | 0 | | | | | % |
Tax Fees: | | | 0 | | | | | % |
All Other Fees: | | | 0 | | | | | % |
(f) During audit of registrant’s financial statements for the most recent fiscal year, less than 50 percent of the hours expended on the principal accountant’s engagement were attributed to work performed by persons other than the principal accountant’s full-time, permanent employees.
(g) The aggregate non-audit fees billed by the registrant’s accountant for services rendered to the registrant, and rendered to the registrant’s investment adviser (not including any sub-adviser whose role is primarily portfolio management and is subcontracted with or overseen by another investment adviser), and any entity controlling, controlled by, or under common control with the adviser that provides ongoing services to the registrant:
| | | | | | | | | | |
| | | Registrant | | | Adviser | |
FY 2013 | | $ | 0 | | | | | $ | 0 | |
FY 2012 | | $ | 0 | | | | | $ | 0 | |
(h) Not applicable. The auditor performed no services for the registrant’s investment adviser or any entity controlling, controlled by, or under common control with the investment adviser that provides ongoing services to the registrant.
Item 5. Audit Committee of Listed Companies. NOT APPLICABLE – applies to listed companies only
Item 6. Schedule of Investments. Schedule filed with Item 1.
Item 7. Disclosure of Proxy Voting Policies and Procedures for Closed-End Management Investment Companies. NOT APPLICABLE – applies to closed-end funds only
-3-
Item 8. Portfolio Managers of Closed-End Investment Companies. NOT APPLICABLE – applies to closed-end funds only
Item 9. Purchases of Equity Securities by Closed-End Management Investment Company and Affiliated Purchasers. NOT APPLICABLE – applies to closed-end funds only
Item 10. Submission of Matters to a Vote of Security Holders.
The guidelines applicable to shareholders desiring to submit recommendations for nominees to the Registrant’s board of trustees are contained in the statement of additional information of the Trust with respect to the Fund(s) for which this Form N-CSR is being filed.
Item 11. Controls and Procedures.
(a) Based on their evaluation of the registrant’s disclosure controls and procedures (as defined in Rule 30a-3(c) under the Investment Company Act of 1940, as amended (the “Act”)) as of a date within 90 days of the filing date of this report, the registrant’s principal executive officer and principal financial officer have concluded that such disclosure controls and procedures are reasonably designed and are operating effectively to ensure that material information relating to the registrant is made known to them by others within those entities, particularly during the period in which this report is being prepared, and that the information required in filings on Form N-CSR is recorded, processed, summarized, and reported on a timely basis.
(b) There were no changes in the registrant’s internal control over financial reporting (as defined in Rule 30a-3(d) under the Investment Company Act of 1940) that occurred during the second fiscal quarter of the period covered by this report that have materially affected, or are reasonably likely to materially affect, the registrant’s internal control over financial reporting.
Item 12. Exhibits.
| (a) (1) | Code is filed herewith. |
| (2) | Certifications by the registrant’s principal executive officer and principal financial officer, pursuant to Section 302 of the Sarbanes-Oxley Act of 2002 and required by Rule 30a-2under the Investment Company Act of 1940 are filed herewith. |
| (b) | Certification pursuant to 18 U.S.C. Section 1350, as adopted pursuant to Section 906 of the Sarbanes-Oxley Act of 2002 is filed herewith. |
-4-
SIGNATURES
Pursuant to the requirements of the Securities Exchange Act of 1934 and the Investment Company Act of 1940, the registrant has duly caused this report to be signed on its behalf by the undersigned, thereunto duly authorized.
| | |
| (Registrant) Valued Advisers Trust |
| |
| By | | /s/ R. Jeffrey Young* |
| | R. Jeffrey Young, President and Principal Executive Officer |
| |
| Date | | 4/9/2013 |
Pursuant to the requirements of the Securities Exchange Act of 1934 and the Investment Company Act of 1940, this report has been signed below by the following persons on behalf of the registrant and in the capacities and on the dates indicated.
| | |
| By | | /s/ R. Jeffrey Young* |
| | R. Jeffrey Young, President and Principal Executive Officer |
| |
| Date | | 4/9/2013 |
| |
| By | | /s/ Robert W. Silva* |
| | Robert W. Silva, Interim Treasurer and Principal Financial Officer |
| |
| Date | | 4/9/2013 |