UNITED STATES
SECURITIES AND EXCHANGE COMMISSION
WASHINGTON, D.C. 20549
FORM N-CSR
CERTIFIED SHAREHOLDER REPORT OF REGISTERED
MANAGEMENT INVESTMENT COMPANIES
Investment Company Act file number 811-22208
Valued Advisers Trust
(Exact name of registrant as specified in charter)
Huntington Asset Services, Inc.
2960 N. Meridian Street, Suite 300
Indianapolis, IN 46208
(Address of principal executive offices)
Capitol Services, Inc.
615 S. Dupont Hwy.
Dover, DE 19901
(Name and address of agent for service)
With a copy to:
John H. Lively, Esq.
The Law Offices of John H. Lively & Associates, Inc.
A member firm of The 1940 Act Law Group
2041 W. 141st Terrace
Suite 119
Leawood, KS 66224
Registrant’s telephone number, including area code: 317-917-7000
Date of fiscal year end: 5/31
Date of reporting period: 5/31/12
Item 1. Reports to Stockholders.

CLOUD CAPITAL FUNDS
Cloud Capital Strategic Large Cap Fund
Cloud Capital Strategic Mid Cap Fund
Annual Report
May 31, 2012
Fund Adviser:
Cloud Capital LLC
5314 South Yale, Suite 606
Tulsa, OK 74135
Toll Free (877) 670-2227
Management’s Discussion of Fund Performance
In this first annual report, we extend a welcome to all of the new shareholders of the Cloud Capital mutual funds.
The Cloud Capital Strategic Large Cap Fund (the “Large Cap Fund”) and the Cloud Capital Strategic Mid Cap Fund (the “Mid Cap Fund”) (each a “Fund” and, collectively the “Funds”) completed their first fiscal year-end on May 31, 2012. However, since the Funds’ starting date was June 29, 2011, the fiscal year-end only represents an eleven month period. Both Funds struggled versus their cap weighted benchmarks with the Large Cap Fund posting a -3.12% return vs. the S&P 500® Index total return of 3.16%, and the Mid Cap Fund posting a -6.13% return vs. the S&P MidCap 400® Index total return of -2.76%.
Since the inception of the Funds, the global economic climate has continued to struggle free of the 2007 economic crisis and its effects. Discussion has revolved around the European debt crisis, U.S. healthcare and tax reform, and the viability of developed and emerging markets. News has been heavy, while resolution has been light, leaving investors in a state of uncertainty.
We at Cloud Capital LLC (“Cloud Capital”) believe that this climate has resulted in a major market divergence in investors’ appetite for growth oriented, larger cap stocks, and the general avoidance of the smaller cap stocks in each peer group. This bias toward larger cap equities is frequently associated with the end of a bull market wherein, historically, institutional investors who have held cash are forced to invest their cash after the market has already appreciated. They usually focus on the largest stocks in their target sectors because those stocks have the most liquidity. This has the effect of heavy out performance by the largest stocks in the respective indices, and relative stagnation of the rest, resulting in outsized performance in cap weighted indices such as those of S&P. Over the last eleven months, the effects of this phenomenon have been stunning.
The Cloud Capital approach distributes assets equally to each industry sector, and to each stock within each sector. We believe this enhanced diversification gives us a performance advantage in most market environments. The two types of market cycles that have historically beaten our approach are:
| | • | | A market that is led by a relative few, mega cap stocks |
| | • | | A market led by the most “over-weighted” industry sectors (technology, financial, etc.) |
Q4-2011 and Q1-2012 were characterized by both of these scenarios as some of the very largest stocks in the respective indices drove much of the gains for the quarter. While the examples below reference the large cap sectors, the same principles were operating within the mid cap space during the period. Apple became the largest stock in the index, growing 48% in the first quarter. According to a Barclays report, analysts
1
attributed 15% of the S&P 500’s gains in the first quarter to Apple alone. Because of the substantially reduced weighting of Apple within the Large Cap Fund, this effect was also reduced, as it would have been with any other mega-cap stock in a large sector.
The performance of Apple stock led the market cap weighted Technology as the top performer and largest sector among all industry groups in Q1. Furthermore, since the Funds’ inception eleven months ago, nine of ten industry sectors have posted returns that favor market cap weighting over equal weighting. Some of the margins were quite extreme (see table below):
| | | | | | | | | | | | |
| Name | | Cap-Weighted
Return | | | Equal
Weighted
Return | | | Cap-Weighted
Advantage | |
S&P 500 Cons Disc | | | 8.6 | | | | 4.9 | | | | 3.7 | |
S&P 500 Cons Staples | | | 10.6 | | | | 6.1 | | | | 4.5 | |
S&P 500 Energy | | | -13.1 | | | | -19.8 | | | | 6.7 | |
S&P 500 Financials | | | -7.4 | | | | -5.9 | | | | -1.5 | |
S&P 500 Health Care | | | 3.8 | | | | -1.7 | | | | 5.5 | |
S&P 500 Industrials | | | -4.8 | | | | -5.8 | | | | 1.0 | |
S&P 500 Info. Technology | | | 10.4 | | | | -8.0 | | | | 18.5 | |
S&P 500 Materials | | | -11.5 | | | | -12.5 | | | | 1.0 | |
S&P 500 Telecom Services | | | 9.6 | | | | -19.3 | | | | 28.8 | |
S&P 500 Utilities | | | 10.8 | | | | 9.8 | | | | 0.9 | |
In Mid Caps, the sectors differed, with Consumer Discretionary and Health Care sectors leading the divergence, but the general result was the same.
It is exceedingly unusual for market cap bias to favor larger stocks in almost every sector in the same 12-month period. The last time that cap weighting won a sweep victory over equal weighting was in 1990. However rare, it has happened in the last 12-months and there was no way for our approach to prevail against such a head wind. However, research over longer time frames indicates that historically, the equally weighted, sector neutral approach wins in as much as 80% of the rolling 12-month periods. It is unfortunate that the Funds’ first fiscal year coincides with a period where the strategy comes up short.
Through the first fiscal year of the Funds’ existence, both had an expense limitation agreement with Cloud Capital LLC. Without the expense limitation, the performance of both portfolios could have been hindered.
As the market appears to be moving slowly toward stabilization, we hope to see the strategy return to its historical winning ways in both large cap and mid cap markets and creating a long-term winning track record in the Funds.
2
Again, we thank our shareholders for their continued confidence in Cloud Capital LLC, and with the first fiscal year behind us, look forward to many more years of serving them.
Sincerely,
Randy Cloud
Cloud Capital LLC, President
3
Cloud Capital Strategic Large Cap Fund
Investment Results – (Unaudited)
Total Returns*
(For the period ended May 31, 2012)
| | | | |
| | | Since Inception
June 29, 2011 | |
Cloud Capital Strategic Large Cap Fund - Institutional Class | | | -3.12 | % |
S&P 500® Index** | | | 3.16 | % |
Total annual operating expenses, as estimated for the Fund’s first fiscal period ending May 31, 2012, as disclosed in the Fund’s prospectus, are 1.63% of average daily net assets (1.41% after fee waiver/expense reimbursements by the Adviser). Cloud Capital, LLC (the “Adviser”) contractually has agreed to cap certain operating expenses of the Fund, excluding brokerage fees and commissions, borrowing costs (such as interest and dividends expenses on securities sold short), taxes, extraordinary expenses and indirect expenses such as Acquired Fund Fees and Expenses of the Fund at 1.40%, through May 31, 2014.
The performance quoted represents past performance, which does not guarantee future results. The investment return and principal value of an investment will fluctuate so that an investor’s shares, when redeemed, may be worth more or less than their original cost. The returns shown do not reflect deduction of taxes that a shareholder would pay on Fund distributions or the redemption of Fund shares. The Fund’s investment objectives, risks, charges and expenses must be considered carefully before investing. Current performance of a Fund may be lower or higher than the performance quoted. Performance data current to the most recent month end may be obtained by calling 1-877-670-2227.
* Return figures reflect any change in price per share and assume the reinvestment of all distributions.
** The S&P 500® Index is a widely recognized unmanaged index of equity prices and is representative of a broader market and range of securities than is found in the Fund’s portfolio. The Index is an unmanaged benchmark that assumes reinvestment of all distributions and excludes the effect of taxes and fees. Individuals cannot invest directly in this Index; however, an individual can invest in exchange traded funds or other investment vehicles that attempt to track the performance of a benchmark index.
The Fund’s investment objectives, risks, charges and expenses must be considered carefully before investing. The prospectus contains this and other important information about the investment company and may be obtained by calling 1-877-670-2227. Please read it carefully before investing.
The Fund is distributed by Unified Financial Securities, Inc., Member FINRA.
4
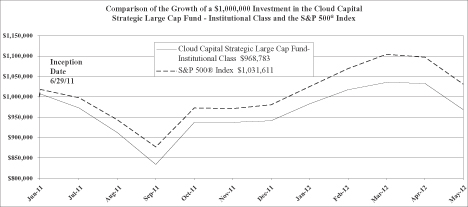
The chart above assumes an initial investment of $1,000,000 made on June 29, 2011 (commencement of Fund operations) and held through May 31, 2012. THE FUND’S RETURNS REPRESENT PAST PERFORMANCE AND DO NOT GUARANTEE FUTURE RESULTS. The returns shown do not reflect deduction of taxes that a shareholder would pay on the Fund’s distributions or the redemption of the Fund’s shares. Investment returns and principal values will fluctuate so that your shares, when redeemed, may be worth more or less than their original purchase price.
Current performance may be lower or higher than the performance data quoted. For more information on the Fund, and to obtain performance data current to the most recent month-end, or to request a prospectus, please call 1-877-670-2227. You should carefully consider the investment objectives, potential risks, management fees, and charges and expenses of the Fund before investing. The Fund’s prospectus contains this and other information about the Fund, and should be read carefully before investing.
The Fund is distributed by Unified Financial Securities, Inc., member FINRA.
5
Cloud Capital Strategic Mid Cap Fund
Investment Results – (Unaudited)
Total Returns*
(For the period ended May 31, 2012)
| | | | |
| | | Since Inception
June 29, 2011 | |
Cloud Capital Strategic Mid Cap Fund – Institutional Class | | | -6.13 | % |
S&P MidCap 400® Index** | | | -2.76 | % |
Total annual operating expenses, as estimated for the Fund’s first fiscal period ending May 31, 2012, as disclosed in the Fund’s prospectus, are 1.63% of average daily net assets (1.41% after fee waiver/expense reimbursements by the Adviser). Cloud Capital, LLC (the “Adviser”) contractually has agreed to cap certain operating expenses of the Fund, excluding brokerage fees and commissions, borrowing costs (such as interest and dividends expenses on securities sold short), taxes, extraordinary expenses and indirect expenses such as Acquired Fund Fees and Expenses of the Fund at 1.40%, through May 31, 2014.
The performance quoted represents past performance, which does not guarantee future results. The investment return and principal value of an investment will fluctuate so that an investor’s shares, when redeemed, may be worth more or less than their original cost. The returns shown do not reflect deduction of taxes that a shareholder would pay on Fund distributions or the redemption of Fund shares. The Fund’s investment objectives, risks, charges and expenses must be considered carefully before investing. Current performance of a Fund may be lower or higher than the performance quoted. Performance data current to the most recent month end may be obtained by calling 1-877-670-2227.
* Return figures reflect any change in price per share and assume the reinvestment of all distributions.
** The S&P MidCap 400® Index is a widely recognized unmanaged index of equity prices and is representative of a broader market and range of securities than is found in the Fund’s portfolio. The Index is an unmanaged benchmark that assumes reinvestment of all distributions and excludes the effect of taxes and fees. Individuals cannot invest directly in this Index; however, an individual can invest in exchange traded funds or other investment vehicles that attempt to track the performance of a benchmark index.
The Fund’s investment objectives, risks, charges and expenses must be considered carefully before investing. The prospectus contains this and other important information about the investment company and may be obtained by calling 1-877-670-2227. Please read it carefully before investing.
The Fund is distributed by Unified Financial Securities, Inc., Member FINRA.
6
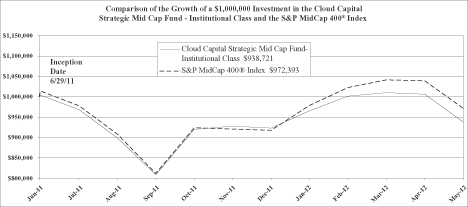
The chart above assumes an initial investment of $1,000,000 made on June 29, 2011 (commencement of Fund operations) and held through May 31, 2012. THE FUND’S RETURNS REPRESENT PAST PERFORMANCE AND DO NOT GUARANTEE FUTURE RESULTS. The returns shown do not reflect deduction of taxes that a shareholder would pay on the Fund’s distributions or the redemption of the Fund’s shares. Investment returns and principal values will fluctuate so that your shares, when redeemed, may be worth more or less than their original purchase price.
Current performance may be lower or higher than the performance data quoted. For more information on the Fund, and to obtain performance data current to the most recent month-end, or to request a prospectus, please call 1-877-670-2227. You should carefully consider the investment objectives, potential risks, management fees, and charges and expenses of the Fund before investing. The Fund’s prospectus contains this and other information about the Fund, and should be read carefully before investing.
The Fund is distributed by Unified Financial Securities, Inc., member FINRA.
7
FUND HOLDINGS – (Unaudited)
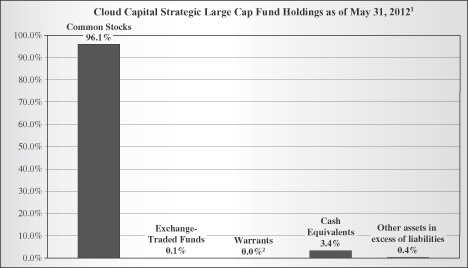
1 As a percent of net assets.
2 Ratio rounds to less than 0.005%.
The investment objective of the Cloud Capital Strategic Large Cap Fund is to consistently deliver excess returns relative to the S&P 500® Index over three- to five-year time horizons.
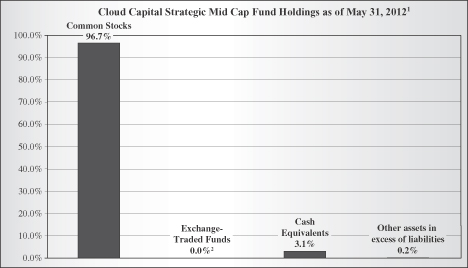
1 As a percent of net assets.
2 Ratio rounds to less than 0.005%.
8
The investment objective of the Cloud Capital Strategic Mid Cap Fund is to consistently deliver excess returns relative to the S&P MidCap 400® Index over three- to five-year time horizons.
AVAILABILITY OF PORTFOLIO SCHEDULE – (Unaudited)
Each Fund files its complete schedule of portfolio holdings with the Securities and Exchange Commission (“SEC”) for the first and third quarters of each fiscal year on Form N-Q. The Funds’ Forms N-Q are available at the SEC’s website at www.sec.gov. The Forms N-Q may be reviewed and copied at the Public Reference Room in Washington DC. Information on the operation of the Public Reference Room may be obtained by calling 1-800-SEC-0330.
ABOUT THE FUND’S EXPENSES – (Unaudited)
As a shareholder of the Fund, you incur two types of costs: (1) transaction costs (such as short-term redemption fees); and (2) ongoing costs, including management fees; and other Fund expenses. This Example is intended to help you understand your ongoing costs (in dollars) of investing in the Fund and to compare these costs with the ongoing costs of investing in other mutual funds. The Example is based on an investment of $1,000 invested at the beginning of the period, and held for the entire period from December 1, 2011 to May 31, 2012.
Actual Expenses
The first line of the table below provides information about actual account values and actual expenses. You may use the information in this line, together with the amount you invested, to estimate the expenses that you paid over the period. Simply divide your account value by $1,000 (for example, an $8,600 account value divided by $1,000 = 8.60), then multiply the result by the number in the first line under the heading entitled “Expenses Paid During Period” to estimate the expenses you paid on your account during this period.
Hypothetical Example for Comparison Purposes
The second line of the table below provides information about hypothetical account values and hypothetical expenses based on the Fund’s actual expense ratios and an assumed rate of return of 5% per year before expenses, which is not the Fund’s actual return. The hypothetical account values and expenses may not be used to estimate the actual ending account balance or expenses you paid for the period. You may use this information to compare the ongoing costs of investing in the Fund and other funds. To do so, compare this 5% hypothetical example with the 5% hypothetical examples that appear in the shareholder reports of the other funds.
Please note that the expenses shown in the table are meant to highlight your ongoing costs only and do not reflect any transactional costs, such as sales charges (loads), redemption fees, or exchange fees. Therefore, the second line of the table is useful in
9
comparing ongoing costs only, and will not help you determine the relative total costs of owning different funds. In addition, if these transactional costs were included, your costs would have been higher.
| | | | | | | | | | | | |
Cloud Capital Strategic Large Cap Fund –
Institutional Class | | Beginning
Account Value December 1, 2011 | | | Ending Account Value May 31, 2012 | | | Expenses Paid During the Period Ended May 31, 2012* | |
Actual | | $ | 1,000.00 | | | $ | 1,032.82 | | | $ | 7.12 | |
Hypothetical ** (5% return before expenses) | | $ | 1,000.00 | | | $ | 1,018.00 | | | $ | 7.06 | |
* Expenses are equal to the Cloud Capital Strategic Large Cap Fund’s annualized expense ratio of 1.40%, multiplied by the average account value over the period, multiplied by 183/366.
** Assumes a 5% return before expenses.
| | | | | | | | | | | | |
Cloud Capital Strategic
Mid Cap Fund –
Institutional Class | | Beginning
Account Value December 1, 2011 | | | Ending Account Value May 31, 2012 | | | Expenses Paid During the Period Ended May 31, 2012* | |
Actual | | $ | 1,000.00 | | | $ | 1,011.55 | | | $ | 7.04 | |
Hypothetical ** (5% return before expenses) | | $ | 1,000.00 | | | $ | 1,018.00 | | | $ | 7.07 | |
* Expenses are equal to the Cloud Capital Strategic Mid Cap Fund’s annualized expense ratio of 1.40%, multiplied by the average account value over the period, multiplied by 183/366.
** Assumes a 5% return before expenses.
10
Cloud Capital Strategic Large Cap Fund
Schedule of Investments
May 31, 2012
| | | | | | | | |
| | | Shares | | | Fair Value | |
| | | | | | | | |
Common Stocks – 96.1% | |
|
Consumer Discretionary – 10.4% | |
| Abercrombie & Fitch Co., Class A | | | 773 | | | $ | 25,917 | |
| Amazon.com, Inc. * | | | 390 | | | | 83,018 | |
| Apollo Group, Inc., Class A * | | | 886 | | | | 28,207 | |
| AutoNation, Inc. * | | | 2,222 | | | | 80,034 | |
| AutoZone, Inc. * | | | 104 | | | | 39,622 | |
| Bed Bath & Beyond, Inc. * | | | 1,180 | | | | 85,232 | |
| Best Buy Co., Inc. | | | 1,445 | | | | 27,058 | |
| Big Lots, Inc. * | | | 855 | | | | 31,411 | |
| Cablevision Systems Corp. | | | 2,653 | | | | 30,349 | |
| CarMax, Inc. * | | | 1,133 | | | | 31,957 | |
| Carnival Corp. | | | 1,214 | | | | 38,961 | |
| CBS Corp., Class B | | | 1,225 | | | | 39,094 | |
| Chipotle Mexican Grill, Inc. * | | | 187 | | | | 77,425 | |
| Coach, Inc. | | | 499 | | | | 33,675 | |
| Comcast Corp., Class A | | | 2,633 | | | | 76,134 | |
| D.R. Horton, Inc. | | | 2,597 | | | | 43,106 | |
| Darden Restaurants, Inc. | | | 758 | | | | 39,237 | |
| DeVry, Inc. | | | 2,230 | | | | 60,952 | |
| DIRECTV, Class A * | | | 815 | | | | 36,243 | |
| Discovery Communications, Inc., Class A * | | | 1,622 | | | | 81,244 | |
| Dollar Tree, Inc. * | | | 827 | | | | 85,315 | |
| Expedia, Inc. | | | 2,259 | | | | 103,648 | |
| Family Dollar Stores, Inc. | | | 677 | | | | 45,897 | |
| Ford Motor Co. | | | 3,164 | | | | 33,413 | |
| GameStop Corp., Class A | | | 1,687 | | | | 32,362 | |
| Gannett Co., Inc. | | | 2,582 | | | | 33,723 | |
| Gap, Inc./The | | | 2,972 | | | | 78,757 | |
| Genuine Parts Co. | | | 648 | | | | 40,803 | |
| Goodyear Tire & Rubber Co./The * | | | 3,314 | | | | 34,636 | |
| H & R Block, Inc. | | | 2,337 | | | | 35,689 | |
| Harley-Davidson, Inc. | | | 785 | | | | 37,816 | |
| Harman International Industries, Inc. | | | 1,660 | | | | 65,090 | |
| Hasbro, Inc. | | | 2,158 | | | | 76,452 | |
| Home Depot, Inc./The | | | 1,582 | | | | 78,059 | |
| International Game Technology | | | 2,331 | | | | 33,330 | |
See accompanying notes which are an integral part of these financial statements.
11
Cloud Capital Strategic Large Cap Fund
Schedule of Investments – (continued)
May 31, 2012
| | | | | | | | |
| | | Shares | | | Fair Value | |
| | | | | | | | |
|
Consumer Discretionary – (continued) | |
| Interpublic Group of Cos., Inc./The | | | 3,451 | | | $ | 35,858 | |
| JC Penney Co., Inc. | | | 1,123 | | | | 29,449 | |
| Johnson Controls, Inc. | | | 1,228 | | | | 37,024 | |
| Kohl’s Corp. | | | 1,636 | | | | 74,953 | |
| Leggett & Platt, Inc. | | | 1,774 | | | | 36,876 | |
| Lennar Corp., Class A | | | 1,541 | | | | 42,064 | |
| Limited Brands, Inc. | | | 3,603 | | | | 159,851 | |
| Lowes Cos., Inc. | | | 1,291 | | | | 34,482 | |
| Macy’s, Inc. | | | 992 | | | | 37,754 | |
| Marriott International, Inc., Class A | | | 2,063 | | | | 79,852 | |
| Mattel, Inc. | | | 1,157 | | | | 36,016 | |
| McDonald’s Corp. | | | 412 | | | | 36,798 | |
| McGraw-Hill Cos.,Inc./The | | | 842 | | | | 36,530 | |
| Meredith Corp. | | | 1,179 | | | | 34,893 | |
| Netflix, Inc. * | | | 655 | | | | 41,547 | |
| Newell Rubbermaid, Inc. | | | 2,190 | | | | 40,305 | |
| News Corp., Class A | | | 2,000 | | | | 38,397 | |
| NIKE, Inc., Class B | | | 369 | | | | 39,897 | |
| Nordstrom, Inc. | | | 721 | | | | 34,148 | |
| Omnicom Group, Inc. | | | 791 | | | | 37,705 | |
| O’Reilly Automotive, Inc. * | | | 870 | | | | 83,321 | |
| Priceline.com, Inc. * | | | 109 | | | | 67,963 | |
| Pulte Group, Inc. * | | | 4,561 | | | | 42,693 | |
| Ralph Lauren Corp. | | | 225 | | | | 33,528 | |
| Ross Stores, Inc. | | | 1,353 | | | | 85,529 | |
| Scripps Networks Interactive, Inc., Class A | | | 1,613 | | | | 88,347 | |
| Sears Holdings Corp. * | | | 560 | | | | 27,687 | |
| Staples, Inc. | | | 4,760 | | | | 62,546 | |
| Starbucks Corp. | | | 718 | | | | 39,430 | |
| Starwood Hotels & Resorts Worldwide, Inc. | | | 679 | | | | 35,872 | |
| Target Corp. | | | 675 | | | | 39,082 | |
| Tiffany & Co. | | | 1,102 | | | | 61,067 | |
| Time Warner Cable, Inc., Class A | | | 974 | | | | 73,475 | |
| Time Warner, Inc. | | | 1,074 | | | | 37,021 | |
| TJX Cos., Inc./The | | | 1,015 | | | | 43,098 | |
| TripAdvisor, Inc. * | | | 1,169 | | | | 50,107 | |
See accompanying notes which are an integral part of these financial statements.
12
Cloud Capital Strategic Large Cap Fund
Schedule of Investments – (continued)
May 31, 2012
| | | | | | | | |
| | | Shares | | | Fair Value | |
| | | | | | | | |
|
Consumer Discretionary – (continued) | |
| Urban Outfitters, Inc. * | | | 1,345 | | | $ | 37,621 | |
| VF Corp. | | | 263 | | | | 37,127 | |
| Viacom, Inc., Class B | | | 857 | | | | 40,906 | |
| Walt Disney Co./The | | | 888 | | | | 40,611 | |
| Washington Post Co./The, Class B | | | 102 | | | | 35,597 | |
| Whirlpool Corp. | | | 1,014 | | | | 62,773 | |
| Wyndham Worldwide Corp. | | | 886 | | | | 44,124 | |
| Wynn Resorts Ltd. | | | 610 | | | | 62,850 | |
| Yum! Brands, Inc. | | | 561 | | | | 39,483 | |
| | | | | | | | |
| | | | | | | 4,020,123 | |
| | | | | | | | |
Consumer Staples – 11.1% | | | | | | | | |
| Altria Group, Inc. | | | 3,259 | | | | 104,909 | |
| Archer-Daniels-Midland Co. | | | 3,057 | | | | 97,454 | |
| Avon Products, Inc. | | | 5,142 | | | | 85,100 | |
| Beam, Inc. | | | 1,706 | | | | 103,335 | |
| Brown-Forman Corp., Class B | | | 1,215 | | | | 105,959 | |
| Campbell Soup Co. | | | 2,951 | | | | 93,549 | |
| Clorox Co./The | | | 1,433 | | | | 98,603 | |
| Coca-Cola Co./The | | | 1,376 | | | | 102,861 | |
| Coca-Cola Enterprises, Inc. | | | 3,437 | | | | 94,033 | |
| Colgate-Palmolive Co. | | | 1,011 | | | | 99,407 | |
| ConAgra Foods, Inc. | | | 3,664 | | | | 92,146 | |
| Constellation Brands, Inc., Class A * | | | 4,297 | | | | 82,885 | |
| Costco Wholesale Corp. | | | 1,068 | | | | 92,298 | |
| CVS Caremark Corp. | | | 2,160 | | | | 97,088 | |
| Dean Foods Co. * | | | 8,072 | | | | 126,242 | |
| Dr. Pepper Snapple Group, Inc. | | | 2,528 | | | | 104,295 | |
| Estee Lauder Cos., Inc./The, Class A | | | 1,549 | | | | 83,904 | |
| General Mills, Inc. | | | 2,507 | | | | 95,976 | |
| H.J. Heinz Co. | | | 1,830 | | | | 97,112 | |
| Hershey Co./The | | | 3,615 | | | | 241,683 | |
| Hormel Foods Corp. | | | 3,371 | | | | 100,836 | |
| JM Smucker Co./The | | | 1,221 | | | | 93,480 | |
| Kellogg Co. | | | 1,832 | | | | 89,363 | |
| Kimberly-Clark Corp. | | | 1,328 | | | | 105,382 | |
See accompanying notes which are an integral part of these financial statements.
13
Cloud Capital Strategic Large Cap Fund
Schedule of Investments – (continued)
May 31, 2012
| | | | | | | | |
| | | Shares | | | Fair Value | |
| | | | | | | | |
Consumer Staples – (continued) | | | | | | | | |
| Kraft Foods, Inc., Class A | | | 2,526 | | | $ | 96,651 | |
| Kroger Co./The | | | 3,998 | | | | 87,996 | |
| Lorillard, Inc. | | | 739 | | | | 91,322 | |
| McCormick & Co., Inc. | | | 1,871 | | | | 105,451 | |
| Mead Johnson Nutrition Co. | | | 1,209 | | | | 97,627 | |
| Molson Coors Brewing Co., Class B | | | 2,233 | | | | 85,842 | |
| PepsiCo, Inc. | | | 1,489 | | | | 101,044 | |
| Philip Morris International, Inc. | | | 1,125 | | | | 95,095 | |
| Procter & Gamble Co. | | | 3,454 | | | | 215,139 | |
| Reynolds American, Inc. | | | 2,368 | | | | 99,094 | |
| Safeway, Inc. | | | 4,523 | | | | 86,030 | |
| Sara Lee Corp. | | | 4,513 | | | | 94,319 | |
| SUPERVALU, Inc. | | | 15,290 | | | | 69,110 | |
| Sysco Corp. | | | 3,277 | | | | 91,470 | |
| Tyson Foods, Inc., Class A | | | 4,928 | | | | 95,459 | |
| Walgreen Co. | | | 2,846 | | | | 86,850 | |
| Wal-Mart Stores, Inc. | | | 1,598 | | | | 105,177 | |
| Whole Foods Market, Inc. | | | 1,142 | | | | 101,207 | |
| | | | | | | | |
| | | | | | | 4,292,783 | |
| | | | | | | | |
Energy – 9.8% | | | | | | | | |
Alpha Natural Resources, Inc. * | | | 6,527 | | | | 68,400 | |
Anadarko Petroleum Corp. | | | 1,306 | | | | 79,637 | |
Apache Corp. | | | 1,016 | | | | 82,680 | |
Baker Hughes, Inc. | | | 2,250 | | | | 93,903 | |
Cabot Oil & Gas Corp. | | | 3,239 | | | | 105,409 | |
Cameron International Corp. * | | | 2,041 | | | | 93,248 | |
Chesapeake Energy Corp. | | | 4,149 | | | | 70,111 | |
Chevron Corp. | | | 980 | | | | 96,320 | |
ConocoPhillips | | | 1,389 | | | | 72,431 | |
Consol Energy, Inc. | | | 3,144 | | | | 88,296 | |
Denbury Resources, Inc. * | | | 5,607 | | | | 84,781 | |
Devon Energy Corp. | | | 1,445 | | | | 85,992 | |
Diamond Offshore Drilling, Inc. | | | 1,520 | | | | 88,427 | |
EOG Resources, Inc. | | | 936 | | | | 92,968 | |
EQT Corp. | | | 2,102 | | | | 97,504 | |
Exxon Mobil Corp. | | | 1,238 | | | | 97,367 | |
See accompanying notes which are an integral part of these financial statements.
14
Cloud Capital Strategic Large Cap Fund
Schedule of Investments – (continued)
May 31, 2012
| | | | | | | | |
| | | Shares | | | Fair Value | |
| | | | | | | | |
Energy – (continued) | | | | | | | | |
FMC Technologies, Inc. * | | | 2,114 | | | $ | 85,056 | |
Halliburton Co. | | | 3,114 | | | | 93,597 | |
Helmerich & Payne, Inc. | | | 1,869 | | | | 84,688 | |
Hess Corp. | | | 1,744 | | | | 76,196 | |
Kinder Morgan, Inc. | | | 1,538 | | | | 52,572 | |
Marathon Oil Corp. | | | 3,190 | | | | 79,457 | |
Marathon Petroleum Corp. | | | 2,455 | | | | 88,545 | |
Murphy Oil Corp. | | | 1,847 | | | | 86,119 | |
Nabors Industries Ltd. * | | | 5,397 | | | | 73,132 | |
National Oilwell Varco, Inc. | | | 1,331 | | | | 88,817 | |
Newfield Exploration Co. * | | | 3,043 | | | | 91,165 | |
Noble Corp. * | | | 2,711 | | | | 84,787 | |
Noble Energy, Inc. | | | 1,099 | | | | 92,797 | |
Occidental Petroleum Corp. | | | 1,101 | | | | 87,314 | |
Peabody Energy Corp. | | | 3,425 | | | | 80,003 | |
Phillips 66 * | | | 695 | | | | 20,861 | |
Pioneer Natural Resources Co. | | | 1,010 | | | | 97,705 | |
QEP Resources, Inc. | | | 3,332 | | | | 87,706 | |
Range Resources Corp. | | | 1,732 | | | | 99,503 | |
Rowan Cos. PLC * | | | 3,042 | | | | 91,259 | |
Schlumberger Ltd. | | | 1,433 | | | | 90,638 | |
Southwestern Energy Co. * | | | 3,171 | | | | 88,894 | |
Spectra Energy Corp. | | | 3,388 | | | | 97,265 | |
Sunoco, Inc. | | | 2,686 | | | | 124,763 | |
Tesoro Corp. * | | | 3,747 | | | | 82,892 | |
Valero Energy Corp. | | | 3,942 | | | | 83,182 | |
Williams Cos., Inc./The | | | 3,417 | | | | 104,329 | |
WPX Energy, Inc. * | | | 5,573 | | | | 81,757 | |
| | | | | | | | |
| | | | | | | 3,792,473 | |
| | | | | | | | |
Financials – 8.2% | | | | | | | | |
ACE Ltd. | | | 756 | | | | 54,674 | |
Aflac, Inc. | | | 1,163 | | | | 46,612 | |
Allstate Corp./The | | | 1,692 | | | | 57,441 | |
American Express Co. | | | 979 | | | | 54,648 | |
American International Group, Inc. * | | | 1,964 | | | | 57,310 | |
Ameriprise Financial, Inc. | | | 964 | | | | 46,194 | |
See accompanying notes which are an integral part of these financial statements.
15
Cloud Capital Strategic Large Cap Fund
Schedule of Investments – (continued)
May 31, 2012
| | | | | | | | |
| | | Shares | | | Fair Value | |
| | | | | | | | |
Financials – (continued) | | | | | | | | |
Aon PLC | | | 1,136 | | | $ | 52,827 | |
Assurant, Inc. | | | 1,361 | | | | 45,426 | |
Bank of America Corp. | | | 5,689 | | | | 41,816 | |
Bank of New York Mellon Corp./The | | | 2,293 | | | | 46,692 | |
BB&T Corp. | | | 1,778 | | | | 53,735 | |
Berkshire Hathaway, Inc., Class B * | | | 679 | | | | 53,863 | |
BlackRock, Inc. | | | 273 | | | | 46,683 | |
Capital One Financial Corp. | | | 1,013 | | | | 52,022 | |
CBRE Group, Inc. * | | | 2,672 | | | | 43,961 | |
Charles Schwab Corp./The | | | 3,639 | | | | 45,340 | |
Chubb Corp./The | | | 802 | | | | 57,764 | |
Cincinnati Financial Corp. | | | 1,587 | | | | 57,272 | |
Citigroup, Inc. | | | 1,464 | | | | 38,814 | |
CME Group, Inc. | | | 191 | | | | 49,149 | |
Comerica, Inc. | | | 1,684 | | | | 51,225 | |
Discover Financial Services | | | 1,740 | | | | 57,610 | |
E*Trade Financial Corp. * | | | 4,948 | | | | 42,010 | |
Federated Investors, Inc., Class B | | | 2,395 | | | | 48,117 | |
Fifth Third Bancorp | | | 3,859 | | | | 51,512 | |
First Horizon National Corp. | | | 5,162 | | | | 43,771 | |
Franklin Resources, Inc. | | | 446 | | | | 47,657 | |
Genworth Financial, Inc., Class A * | | | 6,153 | | | | 32,244 | |
Goldman Sachs Group, Inc./The | | | 435 | | | | 41,666 | |
Hartford Financial Services Group, Inc./The | | | 2,579 | | | | 43,381 | |
Hudson City Bancorp, Inc. | | | 7,461 | | | | 46,256 | |
Intercontinental Exchange, Inc. * | | | 395 | | | | 48,359 | |
Invesco Ltd. | | | 2,119 | | | | 46,080 | |
JPMorgan Chase & Co. | | | 1,233 | | | | 40,874 | |
KeyCorp | | | 6,422 | | | | 48,165 | |
Legg Mason, Inc. | | | 1,917 | | | | 48,793 | |
Leucadia National Corp. | | | 1,946 | | | | 39,552 | |
Lincoln National Corp. | | | 2,069 | | | | 42,768 | |
Loews Corp. | | | 1,383 | | | | 53,781 | |
M&T Bank Corp. | | | 646 | | | | 52,525 | |
Marsh & McLennan Cos., Inc. | | | 1,696 | | | | 54,236 | |
MetLife, Inc. | | | 1,426 | | | | 41,639 | |
Moody’s Corp. | | | 1,320 | | | | 48,314 | |
See accompanying notes which are an integral part of these financial statements.
16
Cloud Capital Strategic Large Cap Fund
Schedule of Investments – (continued)
May 31, 2012
| | | | | | | | |
| | | Shares | | | Fair Value | |
| | | | | | | | |
Financials – (continued) | | | | | | | | |
Morgan Stanley | | | 2,720 | | | $ | 36,334 | |
NASDAQ OMX Group, Inc./The * | | | 2,069 | | | | 45,263 | |
Northern Trust Corp. | | | 1,174 | | | | 50,699 | |
NYSE Euronext | | | 1,863 | | | | 45,287 | |
People’s United Financial, Inc. | | | 4,162 | | | | 48,409 | |
PNC Financial Services Group, Inc. | | | 881 | | | | 54,092 | |
Principal Financial Group, Inc. | | | 1,920 | | | | 47,165 | |
Progressive Corp./The | | | 2,424 | | | | 52,671 | |
Prudential Financial, Inc. | | | 858 | | | | 39,839 | |
Regions Financial Corp. | | | 8,665 | | | | 54,505 | |
SLM Corp. | | | 3,361 | | | | 46,953 | |
State Street Corp. | | | 1,209 | | | | 49,840 | |
SunTrust Banks, Inc. | | | 2,241 | | | | 51,360 | |
T. Rowe Price Group, Inc. | | | 861 | | | | 49,573 | |
Torchmark Corp. | | | 1,099 | | | | 51,272 | |
Travelers Cos., Inc./The | | | 938 | | | | 58,610 | |
U.S. Bancorp | | | 1,761 | | | | 54,798 | |
Unum Group | | | 2,287 | | | | 45,621 | |
Wells Fargo & Co. | | | 1,635 | | | | 52,397 | |
Weyerhaeuser Co. | | | 2,491 | | | | 49,592 | |
XL Group PLC | | | 2,572 | | | | 52,518 | |
Zions Bancorp. | | | 2,517 | | | | 47,895 | |
| | | | | | | | |
| | | | | | | 3,157,471 | |
| | | | | | | | |
Health Care – 10.6% | | | | | | | | |
Abbott Laboratories | | | 1,320 | | | | 81,548 | |
Aetna, Inc. | | | 1,727 | | | | 70,615 | |
Agilent Technologies, Inc. | | | 1,781 | | | | 72,398 | |
Allergan, Inc. | | | 849 | | | | 76,667 | |
AmerisourceBergen Corp. | | | 2,047 | | | | 75,717 | |
Amgen, Inc. | | | 1,166 | | | | 81,027 | |
Baxter International, Inc. | | | 1,337 | | | | 67,676 | |
Becton, Dickinson & Co. | | | 1,033 | | | | 75,580 | |
Biogen Idec, Inc. * | | | 662 | | | | 86,543 | |
Boston Scientific Corp. * | | | 13,106 | | | | 75,226 | |
Bristol-Myers Squibb Co. | | | 2,415 | | | | 80,509 | |
C.R. Bard, Inc. | | | 827 | | | | 80,394 | |
See accompanying notes which are an integral part of these financial statements.
17
Cloud Capital Strategic Large Cap Fund
Schedule of Investments – (continued)
May 31, 2012
| | | | | | | | |
| | | Shares | | | Fair Value | |
| | | | | | | | |
Health Care – (continued) | | | | | | | | |
Cardinal Health, Inc. | | | 1,939 | | | $ | 80,254 | |
CareFusion Corp. * | | | 3,098 | | | | 75,099 | |
Celgene Corp. * | | | 1,050 | | | | 71,683 | |
Cerner Corp. * | | | 1,036 | | | | 80,751 | |
CIGNA Corp. | | | 1,695 | | | | 74,423 | |
Coventry Health Care, Inc. | | | 2,387 | | | | 72,573 | |
Covidien PLC | | | 1,470 | | | | 76,132 | |
DaVita, Inc. * | | | 899 | | | | 73,034 | |
DENTSPLY International, Inc. | | | 2,014 | | | | 74,500 | |
Edwards LifeSciences Corp. * | | | 1,122 | | | | 95,805 | |
Eli Lilly & Co. | | | 1,968 | | | | 80,606 | |
Express Scripts Holding Co. * | | | 2,424 | | | | 126,500 | |
Forest Laboratories, Inc. * | | | 2,356 | | | | 82,443 | |
Gilead Sciences, Inc. * | | | 1,684 | | | | 84,108 | |
Hospira, Inc. * | | | 2,109 | | | | 65,916 | |
Humana, Inc. | | | 924 | | | | 70,551 | |
Intuitive Surgical, Inc. * | | | 149 | | | | 78,165 | |
Johnson & Johnson | | | 1,212 | | | | 75,657 | |
Laboratory Corp. of America Holdings * | | | 878 | | | | 73,128 | |
Life Technologies Corp. * | | | 1,698 | | | | 69,451 | |
McKesson Corp. | | | 906 | | | | 79,117 | |
Medtronic, Inc. | | | 2,006 | | | | 73,911 | |
Merck & Co., Inc. | | | 2,104 | | | | 79,078 | |
Mylan, Inc. * | | | 3,456 | | | | 74,902 | |
Patterson Cos., Inc. | | | 2,465 | | | | 81,949 | |
PerkinElmer, Inc. | | | 2,898 | | | | 77,078 | |
Perrigo Co. | | | 773 | | | | 80,267 | |
Pfizer, Inc. | | | 3,592 | | | | 78,567 | |
Quest Diagnostics, Inc. | | | 1,321 | | | | 75,168 | |
St. Jude Medical, Inc. | | | 1,862 | | | | 71,539 | |
Stryker Corp. | | | 1,441 | | | | 74,149 | |
Tenet Healthcare Corp. * | | | 14,638 | | | | 68,945 | |
Thermo Fisher Scientific, Inc. | | | 1,378 | | | | 69,583 | |
UnitedHealth Group, Inc. | | | 1,429 | | | | 79,717 | |
Varian Medical Systems, Inc. * | | | 1,128 | | | | 66,143 | |
Waters Corp. * | | | 856 | | | | 68,258 | |
See accompanying notes which are an integral part of these financial statements.
18
Cloud Capital Strategic Large Cap Fund
Schedule of Investments – (continued)
May 31, 2012
| | | | | | | | |
| | | Shares | | | Fair Value | |
| | | | | | | | |
Health Care – (continued) | | | | | | | | |
Watson Pharmaceutical, Inc. * | | | 3,345 | | | $ | 238,445 | |
WellPoint, Inc. | | | 1,182 | | | | 79,670 | |
Zimmer Holdings, Inc. | | | 1,237 | | | | 75,037 | |
| | | | | | | | |
| | | | | | | 4,096,202 | |
| | | | | | | | |
Industrials – 10.8% | | | | | | | | |
3M Co. | | | 602 | | | | 50,781 | |
ACCO Brands Corp. * | | | 1,061 | | | | 9,674 | |
Avery Dennison Corp. | | | 1,804 | | | | 52,513 | |
Boeing Co./The | | | 711 | | | | 49,523 | |
BorgWarner, Inc. * | | | 930 | | | | 66,755 | |
Caterpillar, Inc. | | | 981 | | | | 85,965 | |
CH Robinson Worldwide, Inc. | | | 828 | | | | 48,261 | |
Cintas Corp. | | | 1,343 | | | | 49,557 | |
Cooper Industries PLC | | | 848 | | | | 59,752 | |
CSX Corp. | | | 4,926 | | | | 102,908 | |
Cummins, Inc. | | | 858 | | | | 83,136 | |
Danaher Corp. | | | 976 | | | | 50,705 | |
Deere & Co. | | | 1,289 | | | | 95,238 | |
Dover Corp. | | | 843 | | | | 47,661 | |
Dun & Bradstreet Corp. | | | 633 | | | | 42,775 | |
Eaton Corp. | | | 1,075 | | | | 45,844 | |
Emerson Electric Co. | | | 1,041 | | | | 48,700 | |
Equifax, Inc. | | | 1,202 | | | | 54,297 | |
Expeditors International of Washington, Inc. | | | 1,146 | | | | 43,835 | |
Fastenal Co. | | | 1,945 | | | | 86,020 | |
FedEx Corp. | | | 1,148 | | | | 102,358 | |
Flowserve Corp. | | | 466 | | | | 47,926 | |
Fluor Corp. | | | 1,707 | | | | 80,029 | |
General Dynamics Corp. | | | 727 | | | | 46,559 | |
General Electric Co. | | | 5,324 | | | | 101,637 | |
Goodrich Corp. | | | 851 | | | | 107,074 | |
Honeywell International, Inc. | | | 866 | | | | 48,199 | |
Illinois Tool Works, Inc. | | | 934 | | | | 52,451 | |
Ingersoll-Rand PLC | | | 2,548 | | | | 105,261 | |
Iron Mountain, Inc. | | | 3,691 | | | | 104,646 | |
Jacobs Engineering Group, Inc. * | | | 1,152 | | | | 40,936 | |
See accompanying notes which are an integral part of these financial statements.
19
Cloud Capital Strategic Large Cap Fund
Schedule of Investments – (continued)
May 31, 2012
| | | | | | | | |
| | | Shares | | | Fair Value | |
| | | | | | | | |
Industrials – (continued) | | | | | | | | |
Joy Global, Inc. | | | 708 | | | $ | 39,531 | |
L-3 Communications Holdings, Inc. | | | 1,493 | | | | 101,811 | |
Lockheed Martin Corp. | | | 591 | | | | 48,907 | |
Masco Corp. | | | 3,933 | | | | 49,831 | |
Norfolk Southern Corp. | | | 810 | | | | 53,079 | |
Northrop Grumman Corp. | | | 870 | | | | 51,137 | |
PACCAR, Inc. | | | 1,135 | | | | 42,650 | |
Pall Corp. | | | 1,783 | | | | 99,227 | |
Parker Hannifin Corp. | | | 614 | | | | 50,225 | |
Pitney Bowes, Inc. | | | 2,941 | | | | 40,119 | |
Precision Castparts Corp. | | | 603 | | | | 100,219 | |
Quanta Services, Inc. * | | | 2,464 | | | | 55,640 | |
R.R. Donnelley & Sons Co. | | | 4,135 | | | | 44,493 | |
Raytheon Co. | | | 1,022 | | | | 51,408 | |
Republic Services, Inc. | | | 3,503 | | | | 92,332 | |
Robert Half International, Inc. | | | 1,724 | | | | 48,999 | |
Rockwell Collins, Inc. | | | 911 | | | | 45,878 | |
Rockwell International Corp. | | | 656 | | | | 47,566 | |
Roper Industries, Inc. | | | 532 | | | | 53,855 | |
Ryder System, Inc. | | | 994 | | | | 42,953 | |
Snap-on, Inc. | | | 867 | | | | 52,443 | |
Southwest Airlines Co. | | | 12,804 | | | | 115,617 | |
Stanley Black & Decker, Inc. | | | 1,338 | | | | 88,657 | |
Stericycle, Inc. * | | | 621 | | | | 54,190 | |
Textron, Inc. | | | 3,812 | | | | 90,080 | |
Tyco International Ltd. | | | 1,010 | | | | 53,680 | |
Union Pacific Corp. | | | 960 | | | | 106,977 | |
United Parcel Service, Inc., Class B | | | 3,326 | | | | 249,273 | |
United Technologies Corp. | | | 641 | | | | 47,519 | |
W.W. Grainger, Inc. | | | 248 | | | | 48,009 | |
Waste Management, Inc. | | | 1,517 | | | | 49,203 | |
Xylem, Inc. | | | 1,874 | | | | 47,466 | |
| | | | | | | | |
| | | | | | | 4,173,950 | |
| | | | | | | | |
Information Technology – 9.6% | | | | | | | | |
Accenture PLC, Class A | | | 1,315 | | | | 75,106 | |
Adobe Systems, Inc. * | | | 2,486 | | | | 77,186 | |
See accompanying notes which are an integral part of these financial statements.
20
Cloud Capital Strategic Large Cap Fund
Schedule of Investments – (continued)
May 31, 2012
| | | | | | | | |
| | | Shares | | | Fair Value | |
| | | | | | | | |
Information Technology – (continued) | | | | | | | | |
Advanced Micro Devices, Inc. * | | | 3,218 | | | $ | 19,566 | |
Akamai Technologies, Inc. * | | | 2,257 | | | | 66,220 | |
Altera Corp. | | | 2,178 | | | | 72,759 | |
Amphenol Corp., Class A | | | 454 | | | | 24,139 | |
Analog Devices, Inc. | | | 2,122 | | | | 77,166 | |
Apple, Inc. * | | | 468 | | | | 270,661 | |
Applied Materials, Inc. | | | 6,587 | | | | 68,046 | |
Autodesk, Inc. * | | | 2,027 | | | | 64,892 | |
Automatic Data Processing, Inc. | | | 481 | | | | 25,089 | |
BMC Software, Inc. * | | | 654 | | | | 27,685 | |
Broadcom Corp., Class A * | | | 697 | | | | 22,535 | |
CA, Inc. | | | 944 | | | | 23,477 | |
Cisco Systems, Inc. | | | 1,283 | | | | 20,955 | |
Citrix Systems, Inc. * | | | 1,072 | | | | 78,363 | |
Cognizant Technology Solutions Corp., Class A * | | | 1,101 | | | | 64,133 | |
Computer Sciences Corp. | | | 2,787 | | | | 74,238 | |
Corning, Inc. | | | 5,942 | | | | 77,184 | |
Dell, Inc. * | | | 5,130 | | | | 63,257 | |
eBay, Inc. * | | | 2,245 | | | | 87,978 | |
Electronic Arts, Inc. * | | | 1,590 | | | | 21,656 | |
EMC Corp. * | | | 895 | | | | 21,341 | |
F5 Networks, Inc. * | | | 633 | | | | 65,478 | |
Fidelity National Information Services, Inc. | | | 2,577 | | | | 84,478 | |
First Solar, Inc. * | | | 992 | | | | 12,460 | |
Fiserv, Inc. * | | | 1,222 | | | | 82,429 | |
FLIR Systems, Inc. | | | 3,308 | | | | 70,562 | |
Google, Inc., Class A * | | | 343 | | | | 199,187 | |
Harris Corp. | | | 1,897 | | | | 75,446 | |
Hewlett-Packard Co. | | | 1,111 | | | | 25,206 | |
Intel Corp. | | | 929 | | | | 23,999 | |
International Business Machines Corp. | | | 127 | | | | 24,445 | |
Intuit, Inc. | | | 449 | | | | 25,257 | |
Jabil Circuit, Inc. | | | 3,333 | | | | 63,765 | |
JDS Uniphase Corp. * | | | 1,917 | | | | 19,459 | |
Juniper Networks, Inc. * | | | 1,280 | | | | 22,010 | |
KLA-Tencor Corp. | | | 493 | | | | 22,592 | |
Lexmark International, Inc., Class A | | | 769 | | | | 19,237 | |
See accompanying notes which are an integral part of these financial statements.
21
Cloud Capital Strategic Large Cap Fund
Schedule of Investments – (continued)
May 31, 2012
| | | | | | | | |
| | | Shares | | | Fair Value | |
| | | | | | | | |
Information Technology – (continued) | | | | | | | | |
Linear Technology Corp. | | | 780 | | | $ | 22,623 | |
LSI Corp. * | | | 2,873 | | | | 19,106 | |
MasterCard, Inc., Class A | | | 197 | | | | 80,137 | |
Microchip Technology, Inc. | | | 709 | | | | 21,987 | |
Micron Technology, Inc. * | | | 3,270 | | | | 19,100 | |
Microsoft Corp. | | | 810 | | | | 23,651 | |
Molex, Inc. | | | 943 | | | | 21,755 | |
Motorola Solutions, Inc. | | | 528 | | | | 25,400 | |
NetApp, Inc. * | | | 570 | | | | 16,950 | |
Novellus Systems, Inc. * | | | 537 | | | | 22,467 | |
NVIDIA Corp. * | | | 5,797 | | | | 72,060 | |
Oracle Corp. | | | 906 | | | | 23,977 | |
Paychex, Inc. | | | 831 | | | | 24,890 | |
QUALCOMM, Inc. | | | 1,254 | | | | 71,846 | |
Red Hat, Inc. * | | | 491 | | | | 25,224 | |
SAIC, Inc. | | | 1,988 | | | | 22,089 | |
Salesforce.com, Inc. * | | | 550 | | | | 76,276 | |
SanDisk Corp. * | | | 1,701 | | | | 55,617 | |
Symantec Corp. * | | | 4,635 | | | | 68,786 | |
TE Connectivity Ltd. | | | 2,315 | | | | 72,734 | |
Teradata Corp. * | | | 378 | | | | 25,097 | |
Teradyne, Inc. * | | | 4,974 | | | | 71,881 | |
Texas Instruments, Inc. | | | 2,541 | | | | 72,374 | |
Total System Services, Inc. | | | 1,150 | | | | 26,750 | |
VeriSign, Inc. * | | | 2,229 | | | | 85,230 | |
Visa, Inc., Class A | | | 715 | | | | 82,360 | |
Western Digital Corp. * | | | 2,007 | | | | 62,991 | |
Western Union Co./The | | | 1,470 | | | | 24,113 | |
Xerox Corp. | | | 10,334 | | | | 74,608 | |
Xilinx, Inc. | | | 721 | | | | 23,039 | |
Yahoo!, Inc. * | | | 5,540 | | | | 84,429 | |
| | | | | | | | |
| | | | | | | 3,679,189 | |
| | | | | | | | |
Materials – 10.2% | | | | | | | | |
Air Products & Chemicals, Inc. | | | 2,411 | | | | 190,586 | |
Airgas, Inc. | | | 1,152 | | | | 100,040 | |
Alcoa, Inc. | | | 9,845 | | | | 84,172 | |
Allegheny Technologies, Inc. | | | 2,386 | | | | 76,646 | |
See accompanying notes which are an integral part of these financial statements.
22
Cloud Capital Strategic Large Cap Fund
Schedule of Investments – (continued)
May 31, 2012
| | | | | | | | |
| | | Shares | | | Fair Value | |
| | | | | | | | |
Materials – (continued) | | | | | | | | |
Ball Corp. | | | 5,250 | | | $ | 209,840 | |
Bemis Co., Inc. | | | 6,815 | | | | 206,897 | |
CF Industries Holdings, Inc. | | | 1,162 | | | | 198,711 | |
Cliffs Natural Resources, Inc. | | | 3,088 | | | | 147,543 | |
Dow Chemical Co./The | | | 2,831 | | | | 87,932 | |
Du Pont (E.I.) de Nemours & Co. | | | 4,090 | | | | 197,406 | |
Eastman Chemical Co. | | | 4,203 | | | | 195,671 | |
Ecolab, Inc. | | | 1,633 | | | | 103,218 | |
FMC Corp. | | | 4,297 | | | | 218,995 | |
Freeport-McMoRan Copper & Gold, Inc., Class B | | | 5,655 | | | | 181,195 | |
International Flavors & Fragrances, Inc. | | | 1,750 | | | | 98,645 | |
International Paper Co. | | | 2,762 | | | | 80,654 | |
MeadWestvaco Corp. | | | 3,212 | | | | 88,327 | |
Monsanto Co. | | | 2,741 | | | | 211,604 | |
Mosaic Co./The | | | 1,702 | | | | 81,150 | |
Newmont Mining Corp. | | | 1,875 | | | | 88,433 | |
Nucor Corp. | | | 2,313 | | | | 82,720 | |
Owens-Illinois, Inc. * | | | 9,162 | | | | 179,030 | |
PPG Industries, Inc. | | | 1,050 | | | | 108,609 | |
Praxair, Inc. | | | 1,914 | | | | 203,358 | |
Sealed Air Corp. | | | 5,022 | | | | 78,593 | |
Sherwin-Williams Co./The | | | 915 | | | | 118,649 | |
Sigma-Aldrich Corp. | | | 1,342 | | | | 93,087 | |
Titanium Metals Corp. | | | 7,275 | | | | 83,521 | |
United States Steel Corp. | | | 3,394 | | | | 68,904 | |
Vulcan Materials Co. | | | 2,239 | | | | 77,592 | |
| | | | | | | | |
| | | | | | | 3,941,728 | |
| | | | | | | | |
Real Estate Investment Trusts – 2.0% | | | | | | | | |
Apartment Investment & Management Co., Class A | | | 2,122 | | | | 57,433 | |
AvalonBay Communities, Inc. | | | 401 | | | | 56,028 | |
Boston Properties, Inc. | | | 528 | | | | 54,312 | |
Equity Residential | | | 915 | | | | 55,890 | |
HCP, Inc. | | | 1,378 | | | | 56,293 | |
Health Care REIT, Inc. | | | 1,018 | | | | 56,484 | |
Host Hotels & Resorts, Inc. | | | 3,378 | | | | 51,549 | |
Kimco Realty Corp. | | | 2,849 | | | | 51,148 | |
Plum Creek Timber Co., Inc. | | | 1,332 | | | | 48,625 | |
See accompanying notes which are an integral part of these financial statements.
23
Cloud Capital Strategic Large Cap Fund
Schedule of Investments – (continued)
May 31, 2012
| | | | | | | | |
| | | Shares | | | Fair Value | |
| | | | | | | | |
Real Estate Investment Trusts – (continued) | | | | | | | | |
ProLogis, Inc. | | | 1,585 | | | $ | 50,694 | |
Public Storage, Inc. | | | 407 | | | | 54,344 | |
Simon Property Group, Inc. | | | 386 | | | | 56,880 | |
Ventas, Inc. | | | 977 | | | | 57,464 | |
Vornado Realty Trust | | | 656 | | | | 53,778 | |
| | | | | | | | |
| | | | | | | 760,922 | |
| | | | | | | | |
Telecommunication Services – 1.8% | | | | | | | | |
American Tower Corp., Class A | | | 877 | | | | 56,884 | |
AT&T, Inc. | | | 2,717 | | | | 92,832 | |
CenturyLink, Inc. | | | 2,180 | | | | 85,503 | |
Crown Castle International Corp. * | | | 1,608 | | | | 87,819 | |
Frontier Communications Corp. | | | 6,554 | | | | 24,513 | |
MetroPCS Communications, Inc. * | | | 2,632 | | | | 16,847 | |
Sprint Nextel Corp. * | | | 9,292 | | | | 23,879 | |
Verizon Communications, Inc. | | | 5,221 | | | | 217,401 | |
Windstream Corp. | | | 7,322 | | | | 68,535 | |
| | | | | | | | |
| | | | | | | 674,213 | |
| | | | | | | | |
Utilities – 11.6% | | | | | | | | |
AES Corp./The * | | | 9,684 | | | | 117,081 | |
AGL Resources, Inc. | | | 3,269 | | | | 122,525 | |
Ameren Corp. | | | 4,054 | | | | 130,995 | |
American Electric Power Co., Inc. | | | 3,298 | | | | 127,016 | |
CenterPoint Energy, Inc. | | | 6,606 | | | | 133,645 | |
CMS Energy Corp. | | | 5,811 | | | | 135,403 | |
Consolidated Edison, Inc. | | | 4,204 | | | | 253,749 | |
Dominion Resources, Inc., Class A | | | 2,524 | | | | 131,423 | |
DTE Energy Co. | | | 2,340 | | | | 132,965 | |
Duke Energy Corp. | | | 6,052 | | | | 133,030 | |
Edison International | | | 3,004 | | | | 135,047 | |
Entergy Corp. | | | 1,875 | | | | 121,014 | |
Exelon Corp. | | | 3,261 | | | | 120,582 | |
FirstEnergy Corp. | | | 2,865 | | | | 134,035 | |
Integrys Energy Group, Inc. | | | 2,424 | | | | 131,156 | |
NextEra Energy, Inc. | | | 2,097 | | | | 137,000 | |
NiSource, Inc. | | | 5,416 | | | | 135,885 | |
Northeast Utilities | | | 3,508 | | | | 126,341 | |
See accompanying notes which are an integral part of these financial statements.
24
Cloud Capital Strategic Large Cap Fund
Schedule of Investments – (continued)
May 31, 2012
| | | | | | | | |
| | | Shares | | | Fair Value | |
| | | | | | | | |
Utilities – (continued) | | | | | | | | |
NRG Energy, Inc. * | | | 7,770 | | | $ | 119,043 | |
Oneok, Inc. | | | 3,546 | | | | 294,242 | |
Pepco Holdings, Inc. | | | 6,825 | | | | 130,084 | |
PG&E Corp. | | | 2,945 | | | | 128,677 | |
Pinnacle West Capital Corp. | | | 2,700 | | | | 133,321 | |
PPL Corp. | | | 4,595 | | | | 125,770 | |
Progress Energy, Inc. | | | 2,398 | | | | 131,473 | |
Public Service Enterprise Group, Inc. | | | 4,319 | | | | 134,720 | |
SCANA Corp. | | | 2,881 | | | | 135,255 | |
Sempra Energy | | | 2,179 | | | | 141,673 | |
Southern Co. | | | 2,887 | | | | 132,536 | |
TECO Energy, Inc. | | | 7,323 | | | | 127,414 | |
Wisconsin Energy Corp. | | | 3,686 | | | | 139,482 | |
Xcel Energy, Inc. | | | 4,885 | | | | 136,879 | |
| | | | | | | | |
| | | | | | | 4,469,461 | |
| | | | | | | | |
| | |
Total Common Stocks (Cost $37,091,574) | | | | | | | 37,058,515 | |
| | | | | | | | |
| | |
Exchange-Traded Funds – 0.1% | | | | | | | | |
ProShares UltraPro S&P 500 Fund | | | 500 | | | | 34,270 | |
| | | | | | | | |
| | |
Total Exchange-Traded Funds (Cost $38,808) | | | | | | | 34,270 | |
| | | | | | | | |
| | |
Warrants – 0.0% | | | | | | | | |
Kinder Morgan, Inc., Expires 5/25/2017 | | | 2,350 | | | | 5,359 | |
| | | | | | | | |
| | |
Total Warrants (Cost $4,019) | | | | | | | 5,359 | |
| | | | | | | | |
| | |
Cash Equivalents – 3.4% | | | | | | | | |
FOLIOfn Investment Sweep Account, 0.010% (a) | | | 1,307,155 | | | | 1,307,155 | |
| | | | | | | | |
| | |
Total Cash Equivalents (Cost $1,307,155) | | | | | | | 1,307,155 | |
| | | | | | | | |
| | |
Total Investments (Cost $38,441,556) – 99.6% | | | | | | $ | 38,405,299 | |
| | | | | | | | |
| | |
Other Assets in Excess of Liabilities – 0.4% | | | | | | | 145,000 | |
| | | | | | | | |
| | |
Net Assets – 100.0% | | | | | | $ | 38,550,299 | |
| | | | | | | | |
| (a) | Rate disclosed is the annual percentage yield as of May 31, 2012. |
| * | Non-income producing security. |
See accompanying notes which are an integral part of these financial statements.
25
Cloud Capital Strategic Mid Cap Fund
Schedule of Investments
May 31, 2012
| | | | | | | | |
| | | Shares | | | Fair Value | |
| | | | | | | | |
Common Stocks – 96.7% | | | | | | | | |
| | |
Consumer Discretionary – 10.9% | | | | | | | | |
Aaron’s, Inc. | | | 2,172 | | | $ | 57,655 | |
Advance Auto Parts, Inc. | | | 633 | | | | 46,197 | |
Aeropostale, Inc. * | | | 1,249 | | | | 23,101 | |
AMC Networks, Inc., Class A * | | | 605 | | | | 23,339 | |
American Eagle Outfitters, Inc. | | | 3,267 | | | | 63,078 | |
American Greetings Corp., Class A | | | 1,743 | | | | 24,457 | |
ANN, Inc. * | | | 1,963 | | | | 52,772 | |
Ascena Retail Group, Inc. * | | | 2,532 | | | | 47,933 | |
Bally Technologies, Inc. * | | | 577 | | | | 26,857 | |
Barnes & Noble, Inc. * | | | 2,072 | | | | 34,044 | |
Bob Evans Farms, Inc. | | | 1,480 | | | | 60,012 | |
Brinker International, Inc. | | | 985 | | | | 31,821 | |
Carter’s, Inc. * | | | 556 | | | | 29,969 | |
Cheesecake Factory, Inc./The * | | | 1,893 | | | | 61,421 | |
Chico’s FAS, Inc. | | | 3,712 | | | | 54,235 | |
Collective Brands, Inc. * | | | 1,394 | | | | 29,647 | |
Deckers Outdoor Corp. * | | | 434 | | | | 24,140 | |
Dick’s Sporting Goods, Inc. | | | 1,176 | | | | 54,702 | |
Dillard’s, Inc., Class A | | | 3 | | | | 202 | |
Dollar Tree, Inc. * | | | 287 | | | | 29,619 | |
Domino’s Pizza, Inc. * | | | 5 | | | | 154 | |
DreamWorks Animation SKG, Inc. Class A * | | | 1,514 | | | | 26,925 | |
Foot Locker, Inc. | | | 1,824 | | | | 57,897 | |
Fossil, Inc. * | | | 422 | | | | 30,839 | |
Gentex Corp. | | | 1,096 | | | | 24,449 | |
Guess?, Inc. | | | 1,802 | | | | 48,004 | |
Hanesbrands, Inc. * | | | 935 | | | | 26,036 | |
HSN, Inc. | | | 716 | | | | 27,859 | |
International Speedway Corp., Class A | | | 963 | | | | 23,155 | |
ITT Educational Services, Inc. * | | | 829 | | | | 47,198 | |
John Wiley & Sons, Inc., Class A | | | 1,192 | | | | 54,245 | |
KB Home | | | 3,089 | | | | 22,397 | |
Lamar Advertising Co. * | | | 1,726 | | | | 42,476 | |
Life Time Fitness, Inc. * | | | 540 | | | | 23,152 | |
LKQ Corp. * | | | 1,780 | | | | 64,864 | |
Matthews International Corp., Class A | | | 859 | | | | 25,868 | |
MDC Holdings, Inc. | | | 1,079 | | | | 30,982 | |
See accompanying notes which are an integral part of these financial statements.
26
Cloud Capital Strategic Mid Cap Fund
Schedule of Investments – (continued)
May 31, 2012
| | | | | | | | |
| | | Shares | | | Fair Value | |
| | | | | | | | |
| | |
Consumer Discretionary – (continued) | | | | | | | | |
Meredith Corp. | | | 837 | | | $ | 24,774 | |
Mohawk Industries, Inc. * | | | 409 | | | | 27,855 | |
New York Times Co./The, Class A * | | | 4,011 | | | | 26,673 | |
NVR, Inc. * | | | 38 | | | | 30,587 | |
Office Depot, Inc. * | | | 7,824 | | | | 16,822 | |
Panera Bread Co., Class A * | | | 170 | | | | 24,918 | |
PetSmart, Inc. | | | 987 | | | | 63,574 | |
Polaris Industries, Inc. | | | 766 | | | | 58,204 | |
PVH Corp. | | | 299 | | | | 24,258 | |
RadioShack Corp. (a) | | | – | | | | 1 | |
Regis Corp. | | | 1,489 | | | | 27,255 | |
Rent-A-Center, Inc. | | | 729 | | | | 24,561 | |
Saks, Inc. * | | | 2,311 | | | | 22,791 | |
Scholastic Corp. | | | 760 | | | | 20,492 | |
Scientific Games Corp., Class A * | | | 2,299 | | | | 19,630 | |
Service Corp. International | | | 2,479 | | | | 28,387 | |
Signet Jewelers Ltd. | | | 1,191 | | | | 51,984 | |
Sotheby’s | | | 683 | | | | 20,837 | |
Strayer Education, Inc. | | | 600 | | | | 53,915 | |
Thor Industries, Inc. | | | 853 | | | | 26,216 | |
Toll Brothers, Inc. * | | | 1,147 | | | | 31,294 | |
Tractor Supply Co. | | | 298 | | | | 27,229 | |
Tupperware Brands Corp. | | | 887 | | | | 47,937 | |
Under Armour, Inc., Class A * | | | 284 | | | | 28,600 | |
Valassis Communications, Inc. * | | | 2,427 | | | | 48,318 | |
Warnaco Group, Inc./The * | | | 467 | | | | 20,786 | |
Wendy’s Co./The | | | 5,457 | | | | 25,049 | |
Williams-Sonoma, Inc. | | | 729 | | | | 25,461 | |
WMS Industries, Inc. * | | | 1,335 | | | | 27,414 | |
| | | | | | | | |
| | | | | | | 2,227,523 | |
| | | | | | | | |
Consumer Staples – 10.8% | | | | | | | | |
Church & Dwight Co., Inc. | | | 3,972 | | | | 211,482 | |
Energizer Holdings, Inc. * | | | 2,548 | | | | 185,738 | |
Flowers Foods, Inc. | | | 9,648 | | | | 212,457 | |
Green Mountain Coffee Roasters, Inc. * | | | 3,789 | | | | 89,415 | |
See accompanying notes which are an integral part of these financial statements.
27
Cloud Capital Strategic Mid Cap Fund
Schedule of Investments – (continued)
May 31, 2012
| | | | | | | | |
| | | Shares | | | Fair Value | |
| | | | | | | | |
Consumer Staples – (continued) | | | | | | | | |
Harris Teeter Supermarkets, Inc. | | | 4,761 | | | $ | 178,687 | |
Corn Product International, Inc. | | | 3,522 | | | | 179,918 | |
Lancaster Colony Corp. | | | 2,985 | | | | 200,932 | |
Monster Beverage Corp. * | | | 3,208 | | | | 232,913 | |
Ralcorp Holding, Inc. * | | | 2,642 | | | | 167,873 | |
Smithfield Foods, Inc. * | | | 8,637 | | | | 169,890 | |
Tootsie Roll Industries, Inc. | | | 8,751 | | | | 195,578 | |
Universal Corp. | | | 4,212 | | | | 190,247 | |
| | | | | | | | |
| | | | | | | 2,215,130 | |
| | | | | | | | |
Energy – 10.2% | | | | | | | | |
Arch Coal, Inc. | | | 14,393 | | | | 91,249 | |
Atwood Oceanics, Inc. * | | | 3,384 | | | | 129,321 | |
Bill Barrett Corp. * | | | 2,074 | | | | 40,052 | |
CARBO Ceramics, Inc. | | | 1,483 | | | | 120,677 | |
Cimarex Energy Co. | | | 2,023 | | | | 107,781 | |
Comstock Resources, Inc. * | | | 3,308 | | | | 49,451 | |
Dresser-Rand Group, Inc. * | | | 3,225 | | | | 141,500 | |
Dril-Quip, Inc. * | | | 2,279 | | | | 138,063 | |
Energen Corp. | | | 3,091 | | | | 136,468 | |
Energy Transfer Equity LP (b) | | | 1,384 | | | | 50,275 | |
Forest Oil Corp. * | | | 4,372 | | | | 36,502 | |
Helix Energy Solutions Group, Inc. * | | | 3,011 | | | | 51,573 | |
HollyFrontier Corp. | | | 4,772 | | | | 140,672 | |
Northern Oil and Gas, Inc. * | | | 2,596 | | | | 46,545 | |
Oceaneering International, Inc. | | | 996 | | | | 46,044 | |
Oil States International, Inc. * | | | 1,922 | | | | 127,944 | |
Patriot Coal Corp. * | | | 8,546 | | | | 20,254 | |
Patterson-UTI Energy, Inc. | | | 8,845 | | | | 133,737 | |
Plains Exploration & Production Co. * | | | 1,243 | | | | 44,499 | |
Quicksilver Resources, Inc. * | | | 10,932 | | | | 48,864 | |
SM Energy Co. | | | 764 | | | | 41,328 | |
Superior Energy Services, Inc. * | | | 5,675 | | | | 122,809 | |
Tidewater, Inc. | | | 2,832 | | | | 127,665 | |
Unit Corp. * | | | 1,255 | | | | 49,945 | |
World Fuel Services Corp. | | | 1,329 | | | | 49,840 | |
| | | | | | | | |
| | | | | | | 2,093,058 | |
| | | | | | | | |
See accompanying notes which are an integral part of these financial statements.
28
Cloud Capital Strategic Mid Cap Fund
Schedule of Investments – (continued)
May 31, 2012
| | | | | | | | |
| | | Shares | | | Fair Value | |
| | | | | | | | |
Financials – 7.1% | | | | | | | | |
Affiliated Managers Group, Inc. * | | | 271 | | | $ | 27,922 | |
American Financial Group, Inc. | | | 788 | | | | 30,663 | |
Apollo Investment Corp. | | | 4,405 | | | | 32,776 | |
Arthur J Gallagher & Co. | | | 848 | | | | 29,462 | |
Aspen Insurance Holdings, Ltd. | | | 1,076 | | | | 30,395 | |
Associated Banc-Corp. | | | 2,074 | | | | 26,258 | |
Astoria Financial Corp. | | | 3,038 | | | | 27,314 | |
BancorpSouth, Inc. | | | 2,187 | | | | 29,504 | |
| Bank of Hawaii Corp. | | | 626 | | | | 29,018 | |
| Brown & Brown, Inc. | | | 1,250 | | | | 32,006 | |
| Cathay General Bancorp | | | 1,682 | | | | 27,889 | |
| City National Corp. | | | 563 | | | | 27,963 | |
| Commerce Bancshares, Inc. | | | 738 | | | | 28,598 | |
| Cullen/Frost Bankers, Inc. | | | 507 | | | | 28,855 | |
| East West Bancorp, Inc. | | | 1,254 | | | | 28,082 | |
| Eaton Vance Corp. | | | 1,049 | | | | 25,535 | |
| Everest Re Group Ltd. | | | 323 | | | | 32,947 | |
| Fidelity National Financial, Inc., Class A | | | 1,738 | | | | 32,738 | |
| First American Financial Corp. | | | 1,918 | | | | 30,226 | |
| First Niagara Financial Group, Inc. | | | 2,946 | | | | 23,775 | |
| FirstMerit Corp. | | | 1,753 | | | | 27,867 | |
| Fulton Financial Corp. | | | 2,835 | | | | 28,723 | |
| Greenhill & Co., Inc. | | | 665 | | | | 23,182 | |
| Hancock Holding Co. | | | 833 | | | | 25,402 | |
| Hanover Insurance Group, Inc. | | | 738 | | | | 28,795 | |
| HCC Insurance Holdings, Inc. | | | 967 | | | | 30,218 | |
| International Bancshares Corp. | | | 1,458 | | | | 26,932 | |
| Janus Capital Group, Inc. | | | 3,229 | | | | 23,572 | |
| Jefferies Group, Inc. | | | 1,550 | | | | 20,707 | |
| Jones Lang LaSalle, Inc. | | | 352 | | | | 25,484 | |
| Kemper Corp. | | | 996 | | | | 29,167 | |
| Mercury General Corp. | | | 688 | | | | 30,018 | |
| MSCI, Inc., Class A * | | | 799 | | | | 27,014 | |
| New York Community Bancorp, Inc. | | | 2,203 | | | | 27,206 | |
| Old Republic International Corp. | | | 2,809 | | | | 27,725 | |
| Prosperity Bancshares, Inc. | | | 641 | | | | 27,388 | |
| Protective Life Corp. | | | 1,022 | | | | 26,936 | |
See accompanying notes which are an integral part of these financial statements.
29
Cloud Capital Strategic Mid Cap Fund
Schedule of Investments – (continued)
May 31, 2012
| | | | | | | | |
| | | Shares | | | Fair Value | |
| | | | | | | | |
Financials – (continued) | | | | | | | | |
| Raymond James Financial, Inc. | | | 806 | | | $ | 27,536 | |
| Reinsurance Group of America, Inc. | | | 512 | | | | 25,697 | |
| SEI Investments Co. | | | 1,413 | | | | 25,302 | |
| Signature Bank * | | | 464 | | | | 28,511 | |
| StanCorp Financial Group, Inc. | | | 716 | | | | 24,936 | |
| SVB Financial Group * | | | 451 | | | | 26,929 | |
| Synovus Financial Corp. | | | 14,084 | | | | 26,901 | |
| TCF Financial Corp. | | | 2,414 | | | | 28,461 | |
| Trustmark Corp. | | | 1,200 | | | | 29,302 | |
| Valley National Bancorp | | | 2,420 | | | | 27,084 | |
| Waddell & Reed Financial, Inc., Class A | | | 931 | | | | 26,721 | |
| Washington Federal, Inc. | | | 1,760 | | | | 28,881 | |
| Webster Financial Corp. | | | 1,320 | | | | 26,757 | |
| Westamerica Bancorp | | | 622 | | | | 27,806 | |
| WR Berkley Corp. | | | 835 | | | | 31,997 | |
| | | | | | | | |
| | | | | | | 1,451,083 | |
| | | | | | | | |
Health Care – 10.7% | | | | | | | | |
| Allscripts Healthcare Solutions, Inc. * | | | 3,569 | | | | 38,621 | |
| AMERIGROUP Corp. * | | | 999 | | | | 62,368 | |
| Bio-Rad Laboratories, Inc., Class A * | | | 617 | | | | 61,456 | |
| Catalyst Health Solutions, Inc. * | | | 1,014 | | | | 88,101 | |
| Charles River Laboratories International, Inc. * | | | 1,793 | | | | 59,857 | |
| Community Health Systems, Inc. * | | | 2,766 | | | | 60,889 | |
| Cooper Cos., Inc./The | | | 816 | | | | 69,523 | |
| Covance, Inc. * | | | 1,370 | | | | 63,582 | |
| Endo Pharmaceuticals Holdings, Inc. * | | | 1,766 | | | | 57,434 | |
| Gen-Probe, Inc. * | | | 953 | | | | 77,092 | |
| Health Management Associates, Inc. * | | | 9,237 | | | | 59,208 | |
| Health Net, Inc. * | | | 1,677 | | | | 42,963 | |
| Henry Schein, Inc. * | | | 842 | | | | 62,596 | |
| Hill-Rom Holdings, Inc. | | | 1,837 | | | | 54,041 | |
| HMS Holdings Corp. * | | | 2,100 | | | | 56,271 | |
| Hologic, Inc. * | | | 3,010 | | | | 50,450 | |
| IDEXX Laboratories, Inc. * | | | 761 | | | | 64,604 | |
| LifePoint Hospitals, Inc. * | | | 1,673 | | | | 61,594 | |
| Lincare Holdings, Inc. | | | 2,383 | | | | 54,647 | |
See accompanying notes which are an integral part of these financial statements.
30
Cloud Capital Strategic Mid Cap Fund
Schedule of Investments – (continued)
May 31, 2012
| | | | | | | | |
| | | Shares | | | Fair Value | |
| | | | | | | | |
Health Care – (continued) | | | | | | | | |
| Masimo Corp. * | | | 2,966 | | | $ | 55,796 | |
| Medicis Pharmaceutical Corp., Class A | | | 1,736 | | | | 62,671 | |
| Mednax, Inc. * | | | 859 | | | | 52,384 | |
| Mettler-Toledo International, Inc. * | | | 350 | | | | 54,605 | |
| Omnicare, Inc. | | | 1,930 | | | | 60,834 | |
| Orthofix International NV * | | | 10 | | | | 379 | |
| Owens & Minor, Inc. | | | 2,138 | | | | 60,862 | |
| Regeneron Pharmaceuticals, Inc. * | | | 561 | | | | 76,051 | |
| ResMed, Inc. * | | | 2,015 | | | | 62,422 | |
| STERIS Corp. | | | 2,026 | | | | 60,508 | |
| Techne Corp. | | | 936 | | | | 63,540 | |
| Teleflex, Inc. | | | 1,070 | | | | 63,562 | |
| Thoratec Corp. * | | | 1,877 | | | | 56,946 | |
| United Therapeutics Corp. * | | | 1,342 | | | | 59,376 | |
| Universal Health Services, Inc., Class B | | | 1,494 | | | | 57,892 | |
| VCA Antech, Inc. * | | | 2,893 | | | | 62,323 | |
| Vertex Pharmaceuticals, Inc. * | | | 1,569 | | | | 94,181 | |
| WellCare Health Plans, Inc. * | | | 970 | | | | 54,802 | |
| | | | | | | | |
| | | | | | | 2,204,431 | |
| | | | | | | | |
Industrials – 10.6% | | | | | | | | |
| Acuity Brands, Inc. | | | 557 | | | | 30,353 | |
| AECOM Technology Corp. * | | | 1,504 | | | | 24,498 | |
| AGCO Corp. * | | | 697 | | | | 28,035 | |
| Alaska Air Group, Inc. * | | | 993 | | | | 34,048 | |
| Alexander & Baldwin, Inc. | | | 749 | | | | 38,208 | |
| Alliant Techsystems, Inc. | | | 671 | | | | 32,852 | |
| AMETEK, Inc. | | | 728 | | | | 36,928 | |
| BE Aerospace, Inc. * | | | 744 | | | | 32,237 | |
| Brink’s Co./The | | | 1,404 | | | | 31,958 | |
| Carlisle Cos., Inc. | | | 700 | | | | 36,379 | |
| CLARCOR, Inc. | | | 695 | | | | 33,922 | |
| Clean Harbors, Inc. * | | | 513 | | | | 31,834 | |
| Con-way, Inc. | | | 1,038 | | | | 36,678 | |
| Copart, Inc. * | | | 1,332 | | | | 36,106 | |
| Corporate Executive Board Co./The | | | 826 | | | | 29,999 | |
| Corrections Corp. of America * | | | 1,350 | | | | 35,202 | |
See accompanying notes which are an integral part of these financial statements.
31
Cloud Capital Strategic Mid Cap Fund
Schedule of Investments – (continued)
May 31, 2012
| | | | | | | | |
| | | Shares | | | Fair Value | |
| | | | | | | | |
Industrials – (continued) | | | | | | | | |
| Crane Co. | | | 742 | | | $ | 28,101 | |
| Deluxe Corp. | | | 1,469 | | | | 33,974 | |
| Donaldson Co., Inc. | | | 983 | | | | 35,146 | |
| Esterline Technologies Corp. * | | | 527 | | | | 34,012 | |
| Exelis, Inc. | | | 2,950 | | | | 29,500 | |
| Fortune Brands Home & Security, Inc. * | | | 1,657 | | | | 37,478 | |
| FTI Consulting, Inc. * | | | 902 | | | | 28,485 | |
| Gardner Denver, Inc. | | | 504 | | | | 27,237 | |
| GATX Corp. | | | 823 | | | | 31,531 | |
| General Cable Corp. * | | | 1,193 | | | | 33,955 | |
| Graco, Inc. | | | 683 | | | | 32,908 | |
| Granite Construction, Inc. | | | 1,199 | | | | 27,482 | |
| Harsco Corp. | | | 1,494 | | | | 30,029 | |
| Herman Miller, Inc. | | | 1,625 | | | | 30,024 | |
| HNI Corp. | | | 1,286 | | | | 29,724 | |
| Hubbell, Inc., Class B | �� | | 451 | | | | 35,593 | |
| Huntington Ingalls Industries, Inc. * | | | 931 | | | | 34,225 | |
| IDEX Corp. | | | 840 | | | | 33,355 | |
| ITT Corp. | | | 1,542 | | | | 31,648 | |
| JB Hunt Transport Services, Inc. | | | 654 | | | | 37,384 | |
| JetBlue Airways Corp. * | | | 1 | | | | 5 | |
| Kansas City Southern | | | 485 | | | | 32,016 | |
| KBR, Inc. | | | 960 | | | | 24,448 | |
| Kennametal, Inc. | | | 774 | | | | 26,906 | |
| Kirby Corp. * | | | 510 | | | | 26,932 | |
| Korn/Ferry International * | | | 2,168 | | | | 29,483 | |
| Landstar System, Inc. | | | 613 | | | | 32,284 | |
| Lennox International, Inc. | | | 869 | | | | 37,259 | |
| Lincoln Electric Holdings, Inc. | | | 766 | | | | 36,442 | |
| Manpower, Inc. | | | 756 | | | | 27,185 | |
| Mine Safety Appliances Co. | | | 869 | | | | 35,700 | |
| MSC Industrial Direct Co., Inc., Class A | | | 425 | | | | 30,483 | |
| Nordson Corp. | | | 629 | | | | 33,745 | |
| Oshkosh Corp. * | | | 1,531 | | | | 31,346 | |
| Pentair, Inc. | | | 888 | | | | 36,184 | |
| Regal-Beloit Corp. | | | 526 | | | | 31,693 | |
| Rollins, Inc. | | | 1,674 | | | | 35,564 | |
See accompanying notes which are an integral part of these financial statements.
32
Cloud Capital Strategic Mid Cap Fund
Schedule of Investments – (continued)
May 31, 2012
| | | | | | | | |
| | | Shares | | | Fair Value | |
| | | | | | | | |
Industrials – (continued) | | | | | | | | |
| Shaw Group, Inc./The * | | | 1,147 | | | $ | 29,135 | |
| SPX Corp. | | | 463 | | | | 33,223 | |
| Terex Corp. * | | | 1,438 | | | | 23,916 | |
| Timken Co. | | | 664 | | | | 31,658 | |
| Towers Watson & Co., Class A | | | 532 | | | | 32,059 | |
| Trinity Industries, Inc. | | | 1,028 | | | | 25,403 | |
| Triumph Group, Inc. | | | 553 | | | | 33,095 | |
| United Rentals, Inc. * | | | 850 | | | | 29,367 | |
| URS Corp. | | | 819 | | | | 29,622 | |
| UTi Worldwide, Inc. | | | 2,194 | | | | 34,318 | |
| Valmont Industries, Inc. | | | 305 | | | | 34,972 | |
| Wabtec Corp. | | | 457 | | | | 33,185 | |
| Waste Connections, Inc. | | | 1,094 | | | | 33,871 | |
| Watsco, Inc. | | | 485 | | | | 35,685 | |
| Werner Enterprises, Inc. | | | 1,386 | | | | 33,737 | |
| Woodward, Inc. | | | 812 | | | | 30,611 | |
| | | | | | | | |
| | | | | | | 2,182,560 | |
| | | | | | | | |
Information Technology – 10.3% | | | | | | | | |
| ACI Worldwide, Inc. * | | | 907 | | | | 34,638 | |
| Acxiom Corp. * | | | 2,452 | | | | 34,505 | |
| ADTRAN, Inc. | | | 1,162 | | | | 33,972 | |
| Advent Software, Inc. * | | | 1,420 | | | | 37,041 | |
| Alliance Data Systems Corp. * | | | 286 | | | | 36,050 | |
| ANSYS, Inc. * | | | 554 | | | | 34,255 | |
| AOL, Inc. * | | | 2,005 | | | | 54,989 | |
| Arrow Electronics, Inc. * | | | 856 | | | | 29,019 | |
| Atmel Corp. * | | | 3,568 | | | | 24,976 | |
| Avnet, Inc. * | | | 987 | | | | 30,106 | |
| Broadridge Financial Solutions, Inc. | | | 1,484 | | | | 30,021 | |
| Cadence Design Systems, Inc. * | | | 2,953 | | | | 30,116 | |
| Ciena Corp. * | | | 2,272 | | | | 30,782 | |
| Compuware Corp. * | | | 3,878 | | | | 34,900 | |
| Concur Technologies, Inc. * | | | 608 | | | | 37,576 | |
| Convergys Corp. * | | | 2,807 | | | | 39,160 | |
| CoreLogic, Inc. * | | | 2,141 | | | | 36,382 | |
| Cree, Inc. * | | | 1,149 | | | | 28,804 | |
See accompanying notes which are an integral part of these financial statements.
33
Cloud Capital Strategic Mid Cap Fund
Schedule of Investments – (continued)
May 31, 2012
| | | | | | | | |
| | | Shares | | | Fair Value | |
| | | | | | | | |
Information Technology – (continued) | | | | | | | | |
| Cypress Semiconductor Corp. | | | 2,303 | | | $ | 30,372 | |
| Diebold, Inc. | | | 920 | | | | 34,059 | |
| DST Systems, Inc. | | | 658 | | | | 33,636 | |
| Equinix, Inc. * | | | 257 | | | | 41,907 | |
| Factset Research Systems, Inc. | | | 364 | | | | 38,418 | |
| Fair Isaac Corp. | | | 833 | | | | 33,879 | |
| Fairchild Semiconductor International, Inc. * | | | 2,482 | | | | 32,792 | |
| Gartner, Inc. * | | | 850 | | | | 34,592 | |
| Global Payments, Inc. | | | 678 | | | | 28,822 | |
| Informatica Corp. * | | | 701 | | | | 29,053 | |
| Ingram Micro, Inc., Class A * | | | 1,927 | | | | 34,354 | |
| Integrated Device Technology, Inc. * | | | 5,014 | | | | 27,528 | |
| International Rectifier Corp. * | | | 1,578 | | | | 29,722 | |
| Intersil Corp., Class A | | | 3,225 | | | | 34,028 | |
| Itron, Inc. * | | | 818 | | | | 29,291 | |
| Jack Henry & Associates, Inc. | | | 1,057 | | | | 34,886 | |
| Lam Research Corp. * | | | 817 | | | | 30,472 | |
| Lender Processing Services, Inc. | | | 1,443 | | | | 33,310 | |
| Mantech International Corp., Class A | | | 1,055 | | | | 23,008 | |
| MEMC Electronic Materials, Inc. * | | | 9,019 | | | | 15,062 | |
| Mentor Graphics Corp. * | | | 2,360 | | | | 33,271 | |
| MICROS Systems, Inc. * | | | 659 | | | | 34,779 | |
| Monster Worldwide, Inc. * | | | 3,814 | | | | 32,797 | |
| National Instruments Corp. | | | 1,318 | | | | 34,327 | |
| NCR Corp. * | | | 1,673 | | | | 35,837 | |
| NeuStar, Inc., Class A * | | | 1,004 | | | | 32,308 | |
| Parametric Technology Corp. * | | | 1,303 | | | | 26,328 | |
| Plantronics, Inc. | | | 930 | | | | 27,998 | |
| Polycom, Inc. * | | | 1,916 | | | | 21,917 | |
| QLogic Corp. * | | | 2,040 | | | | 27,761 | |
| Quest Software, Inc. * | | | 1,486 | | | | 37,154 | |
| Rackspace Hosting, Inc. * | | | 641 | | | | 31,727 | |
| RF Micro Devices, Inc. * | | | 7,266 | | | | 27,394 | |
| Riverbed Technology, Inc. * | | | 1,318 | | | | 21,621 | |
| Rovi Corp. * | | | 1,080 | | | | 26,388 | |
| Semtech Corp. * | | | 1,255 | | | | 30,237 | |
See accompanying notes which are an integral part of these financial statements.
34
Cloud Capital Strategic Mid Cap Fund
Schedule of Investments – (continued)
May 31, 2012
| | | | | | | | |
| | | Shares | | | Fair Value | |
| | | | | | | | |
Information Technology – (continued) | | | | | | | | |
| Silicon Laboratories, Inc. * | | | 843 | | | $ | 29,123 | |
| Skyworks Solutions, Inc. * | | | 1,276 | | | | 34,284 | |
| Solera Holdings, Inc. | | | 774 | | | | 34,353 | |
| Synopsys, Inc. * | | | 1,182 | | | | 34,937 | |
| Tech Data Corp. * | | | 663 | | | | 31,586 | |
| Tellabs, Inc. | | | 9,198 | | | | 33,666 | |
| TIBCO Software, Inc. * | | | 1,187 | | | | 31,753 | |
| Trimble Navigation Ltd. * | | | 664 | | | | 31,319 | |
| ValueClick, Inc. * | | | 1,768 | | | | 31,006 | |
| VeriFone Systems, Inc. * | | | 721 | | | | 26,034 | |
| Vishay Intertechnology, Inc. * | | | 2,964 | | | | 31,476 | |
| Zebra Technologies Corp., Class A * | | | 878 | | | | 29,390 | |
| | | | | | | | |
| | | | | | | 2,107,254 | |
| | | | | | | | |
Materials – 10.6% | | | | | | | | |
| Albemarle Corp. | | | 1,394 | | | | 84,626 | |
| AptarGroup, Inc. | | | 1,640 | | | | 83,076 | |
| Ashland, Inc. | | | 1,430 | | | | 91,441 | |
| Cabot Corp. | | | 2,090 | | | | 78,997 | |
| Carpenter Technology Corp. | | | 1,719 | | | | 77,464 | |
| Commercial Metals Co. | | | 6,232 | | | | 72,787 | |
| Compass Minerals International, Inc. | | | 1,260 | | | | 89,644 | |
| Cytec Industries, Inc. | | | 1,462 | | | | 88,385 | |
| Domtar Corp. | | | 913 | | | | 72,255 | |
| Greif, Inc., Class A | | | 1,719 | | | | 75,196 | |
| Intrepid Potash, Inc. * | | | 3,514 | | | | 68,988 | |
| Louisiana-Pacific Corp. * | | | 9,161 | | | | 86,295 | |
| Martin Marietta Materials, Inc. | | | 1,013 | | | | 68,359 | |
| Minerals Technologies, Inc. | | | 1,354 | | | | 85,699 | |
| NewMarket Corp. | | | 479 | | | | 99,935 | |
| Olin Corp. | | | 4,126 | | | | 79,087 | |
| Packaging Corp. of America | | | 3,008 | | | | 80,713 | |
| Reliance Steel & Aluminum Co. | | | 1,563 | | | | 73,790 | |
| Rock-Tenn Co., Class A | | | 1,310 | | | | 67,570 | |
| RPM International, Inc. | | | 3,548 | | | | 93,521 | |
| Scotts Miracle-Gro Co., Class A | | | 1,684 | | | | 72,679 | |
| Sensient Technologies Corp. | | | 2,408 | | | | 87,922 | |
See accompanying notes which are an integral part of these financial statements.
35
Cloud Capital Strategic Mid Cap Fund
Schedule of Investments – (continued)
May 31, 2012
| | | | | | | | |
| | | Shares | | | Fair Value | |
| | | | | | | | |
Materials – (continued) | | | | | | | | |
| Silgan Holdings, Inc. | | | 2,014 | | | $ | 84,203 | |
| Sonoco Products Co. | | | 2,618 | | | | 80,542 | |
| Steel Dynamics, Inc. | | | 5,904 | | | | 62,229 | |
| Valspar Corp. | | | 1,835 | | | | 88,476 | |
| Worthington Industries, Inc. | | | 4,905 | | | | 79,713 | |
| | | | | | | | |
| | | | | | | 2,173,592 | |
| | | | | | | | |
Real Estate Investment Trusts – 3.7% | | | | | | | | |
| Alexandria Real Estate Equities, Inc. | | | 413 | | | | 28,294 | |
| American Campus Communities, Inc. | | | 691 | | | | 30,342 | |
| BRE Properties, Inc. | | | 612 | | | | 30,143 | |
| Camden Property Trust | | | 472 | | | | 30,750 | |
| Corporate Office Properties Trust | | | 1,245 | | | | 27,410 | |
| Duke Realty Corp. | | | 2,045 | | | | 28,302 | |
| Equity One, Inc. | | | 1,564 | | | | 31,061 | |
| Essex Property Trust, Inc. | | | 203 | | | | 30,564 | |
| Federal Realty Investment Trust | | | 310 | | | | 30,423 | |
| Highwoods Properties, Inc. | | | 914 | | | | 29,482 | |
| Home Properties, Inc. | | | 508 | | | | 30,443 | |
| Hospitality Properties Trust | | | 1,179 | | | | 27,729 | |
| Liberty Property Trust | | | 880 | | | | 30,494 | |
| Macerich Co./The | | | 533 | | | | 30,425 | |
| Mack-Cali Realty Corp. | | | 1,044 | | | | 28,441 | |
| National Retail Properties, Inc. | | | 1,138 | | | | 30,146 | |
| Omega Healthcare Investors, Inc. | | | 1,441 | | | | 30,424 | |
| Potlatch Corp. | | | 970 | | | | 27,807 | |
| Rayonier, Inc. | | | 684 | | | | 29,405 | |
| Realty Income Corp. | | | 792 | | | | 30,374 | |
| Regency Centers Corp. | | | 671 | | | | 29,413 | |
| Senior Housing Properties Trust | | | 1,377 | | | | 28,440 | |
| SL Green Realty Corp. | | | 382 | | | | 28,656 | |
| Taubman Centers, Inc. | | | 417 | | | | 30,457 | |
| UDR, Inc. | | | 1,162 | | | | 30,087 | |
| Weingarten Realty Investors | | | 1,140 | | | | 29,162 | |
| | | | | | | | |
| | | | | | | 768,674 | |
| | | | | | | | |
Telecommunication Services – 0.3% | | | | | | | | |
| Telephone & Data Systems, Inc. | | | 1,516 | | | | 30,101 | |
| TW Telecom, Inc. * | | | 1,594 | | | | 36,957 | |
| | | | | | | | |
| | | | | | | 67,058 | |
| | | | | | | | |
See accompanying notes which are an integral part of these financial statements.
36
Cloud Capital Strategic Mid Cap Fund
Schedule of Investments – (continued)
May 31, 2012
| | | | | | | | |
| | | Shares | | | Fair Value | |
| | | | | | | | |
Utilities – 11.5% | | | | | | | | |
| Alliant Energy Corp. | | | 2,858 | | | $ | 124,845 | |
| Aqua America, Inc. | | | 5,518 | | | | 127,458 | |
| Atmos Energy Corp. | | | 3,955 | | | | 131,054 | |
| Black Hills Corp. | | | 3,632 | | | | 116,884 | |
| Cleco Corp. | | | 3,125 | | | | 127,644 | |
| Great Plains Energy, Inc. | | | 6,105 | | | | 121,612 | |
| Hawaiian Electric Industries, Inc. | | | 4,771 | | | | 131,727 | |
| IDACORP, Inc. | | | 2,969 | | | | 116,668 | |
| MDU Resources Group, Inc. | | | 5,499 | | | | 123,561 | |
| National Fuel Gas Co. | | | 2,459 | | | | 106,282 | |
| Northeast Utilities | | | 3,358 | | | | 120,926 | |
| NV Energy, Inc. | | | 7,833 | | | | 135,516 | |
| OGE Energy Corp. | | | 2,313 | | | | 123,144 | |
| Oneok, Inc. | | | 5 | | | | 415 | |
| PNM Resources, Inc. | | | 6,735 | | | | 125,616 | |
| Questar Corp. | | | 6,196 | | | | 124,349 | |
| UGI Corp. | | | 4,453 | | | | 127,722 | |
| Vectren Corp. | | | 4,188 | | | | 122,780 | |
| Westar Energy, Inc. | | | 4,451 | | | | 127,374 | |
| WGL Holdings, Inc. | | | 3,022 | | | | 117,709 | |
| | | | | | | | |
| | | | | | | 2,353,286 | |
| | | | | | | | |
Total Common Stocks (Cost $19,466,883) | | | | | | | 19,843,649 | |
| | | | | | | | |
Exchange-Traded Funds – 0.0% | | | | | | | | |
| ProShares Ultra MidCap400 Fund * | | | 5 | | | | 306 | |
| | | | | | | | |
Total Exchange-Traded Funds (Cost $333) | | | | | | | 306 | |
| | | | | | | | |
Cash Equivalents – 3.1% | | | | | | | | |
| FOLIOfn Investment Sweep Account, 0.010% (c) | | | 634,705 | | | | 634,705 | |
| | | | | | | | |
Total Cash Equivalents (Cost $634,705) | | | | | | | 634,705 | |
| | | | | | | | |
Total Investments (Cost $20,101,921) – 99.8% | | | | | | $ | 20,478,660 | |
| | | | | | | | |
Other Assets in Excess of Liabilities – 0.2% | | | | | | | 39,730 | |
| | | | | | | | |
Net Assets – 100.0% | | | | | | $ | 20,518,390 | |
| | | | | | | | |
| (a) | Shares round to less than a half of share. |
| (b) | Master Limited Partnership |
| (c) | Rate disclosed is the annual percentage yield as of May 31, 2012 |
| * | Non-income producing security. |
See accompanying notes which are an integral part of these financial statements.
37
Cloud Capital Funds
Statements of Assets and Liabilities
May 31, 2012
| | | | | | | | |
| | | Cloud Capital
Strategic Large
Cap Fund | | | Cloud Capital
Strategic Mid Cap
Fund | |
Assets: | | | | | | | | |
At cost | | $ | 38,441,556 | | | $ | 20,101,921 | |
| | | | | | | | |
At fair value | | $ | 38,405,299 | | | $ | 20,478,660 | |
Receivable for investments sold | | | 53,801 | | | | – | |
Receivable for fund shares sold | | | 59,677 | | | | 43,663 | |
Dividends receivable | | | 90,595 | | | | 30,502 | |
Tax reclaim receivable | | | 53 | | | | – | |
Prepaid expenses | | | 6,261 | | | | 5,783 | |
Deferred offering expense | | | 3,203 | | | | 3,203 | |
| | | | | | | | |
Total assets | | | 38,618,889 | | | | 20,561,811 | |
| | | | | | | | |
| | |
Liabilities | | | | | | | | |
Payable to Adviser | | | 19,868 | | | | 3,221 | |
Payable for securities purchased | | | 3,594 | | | | 2,365 | |
Payable for fund shares redeemed | | | 3,764 | | | | 2,269 | |
Payable to administrator, fund accountant, and transfer agent | | | 8,065 | | | | 8,144 | |
Payable to custodian | | | 1,135 | | | | 805 | |
Administrative servicing fees – Institutional Class | | | 3,655 | | | | 1,150 | |
Other accrued expenses | | | 28,509 | | | | 25,467 | |
| | | | | | | | |
Total liabilities | | | 68,590 | | | | 43,421 | |
| | | | | | | | |
Net Assets | | $ | 38,550,299 | | | $ | 20,518,390 | |
| | | | | | | | |
| | |
Net Assets consist of: | | | | | | | | |
Paid in capital | | $ | 38,500,652 | | | $ | 21,028,377 | |
Accumulated net investment income | | | 98,989 | | | | 16,846 | |
Accumulated net realized loss from investment transactions | | | (13,085 | ) | | | (903,572 | ) |
Net unrealized appreciation (depreciation) on investments | | | (36,257 | ) | | | 376,739 | |
| | | | | | | | |
Net Assets | | $ | 38,550,299 | | | $ | 20,518,390 | |
| | | | | | | | |
Institutional Class: | | | | | | | | |
Shares Outstanding (unlimited number of shares authorized, no par value) | | | 2,666,521 | | | | 1,471,083 | |
| | | | | | | | |
| | |
Net Asset Value, Offering and Redemption Per Share: | | $ | 14.46 | | | $ | 13.95 | |
| | | | | | | | |
See accompanying notes which are an integral part of these financial statements.
38
Cloud Capital Funds
Statements of Operations
For the period ended May 31, 2012 (a)
| | | | | | | | |
| | | Cloud Capital
Strategic Large Cap
Fund | | | Cloud Capital
Strategic Mid Cap
Fund | |
Investment Income | | | | | | | | |
Dividend income (Net of foreign witholding tax of $156, and $-, respectively) | | $ | 498,627 | | | $ | 255,215 | |
Interest income | | | 506 | | | | 382 | |
| | | | | | | | |
Total Investment Income | | | 499,133 | | | | 255,597 | |
| | | | | | | | |
| | |
Expenses | | | | | | | | |
Investment Adviser fee | | | 258,866 | | | | 182,555 | |
Administration expenses | | | 34,687 | | | | 34,687 | |
Offering expense | | | 30,399 | | | | 30,399 | |
Transfer agent expenses | | | 28,932 | | | | 28,884 | |
Fund accounting expenses | | | 23,125 | | | | 23,125 | |
Administrative servicing fees – Institutional Class | | | 18,886 | | | | 7,035 | |
Audit expenses | | | 18,500 | | | | 18,500 | |
Legal expenses | | | 16,184 | | | | 16,184 | |
Organizational expense | | | 13,000 | | | | 13,000 | |
Pricing expenses | | | 11,637 | | | | 8,945 | |
Custodian expenses | | | 10,401 | | | | 9,051 | |
Miscellaneous expenses | | | 7,997 | | | | 7,857 | |
Report printing expense | | | 6,531 | | | | 6,430 | |
24F-2 expense | | | 4,367 | | | | 2,413 | |
Trustee expenses | | | 3,462 | | | | 3,462 | |
Registration expenses | | | 3,183 | | | | 3,162 | |
Insurance expense | | | 2,522 | | | | 2,522 | |
| | | | | | | | |
Total Expenses | | | 492,679 | | | | 398,211 | |
Fees waived by Adviser | | | (129,192 | ) | | | (142,245 | ) |
| | | | | | | | |
Net operating expenses | | | 363,487 | | | | 255,966 | |
| | | | | | | | |
Net Investment Income (Loss) | | | 135,646 | | | | (369 | ) |
| | | | | | | | |
| | |
Realized & Unrealized Gain (Loss) on Investments | | | | | | | | |
Net realized gain (loss) on investment transactions | | | 34,636 | | | | (728,988 | ) |
Net change in unrealized appreciation (depreciation) of investments | | | (36,257 | ) | | | 376,739 | |
| | | | | | | | |
Net realized and unrealized loss on investments | | | (1,621 | ) | | | (352,249 | ) |
| | | | | | | | |
Net increase (decrease) in net assets resulting from operations | | $ | 134,025 | | | $ | (352,618 | ) |
| | | | | | | | |
| (a) | For the period June 29, 2011 (commencement of operations) to May 31, 2012. |
See accompanying notes which are an integral part of these financial statements.
39
Cloud Capital Funds
Statements of Changes In Net Assets
For the period ended May 31, 2012 (a)
| | | | | | | | |
| | | Cloud Capital
Strategic Large Cap
Fund | | | Cloud Capital
Strategic Mid Cap
Fund | |
Increase to Net Assets due to: | | | | | | | | |
Operations | | | | | | | | |
Net investment income (loss) | | $ | 135,646 | | | $ | (369 | ) |
Net realized gain (loss) on investment transactions | | | 34,636 | | | | (728,988 | ) |
Net change in unrealized appreciation (depreciation) of investments | | | (36,257 | ) | | | 376,739 | |
| | | | | | | | |
Net increase (decrease) in net assets resulting from operations | | | 134,025 | | | | (352,618 | ) |
| | | | | | | | |
Distributions | | | | | | | | |
From net investment income – Institutional Class | | | (67,036 | ) | | | (13,184 | ) |
From net realized gain – Institutional Class | | | (47,743 | ) | | | (174,583 | ) |
| | | | | | | | |
Total distributions | | | (114,779 | ) | | | (187,767 | ) |
| | | | | | | | |
Capital Transactions – Institutional Class | | | | | | | | |
Proceeds from shares sold | | | 50,873,007 | | | | 33,902,757 | |
Reinvestment of distributions | | | 51,011 | | | | 74,072 | |
Amount paid for shares redeemed | | | (12,392,965 | ) | | | (12,918,054 | ) |
| | | | | | | | |
Net increase in net assets resulting from capital transactions | | | 38,531,053 | | | | 21,058,775 | |
| | | | | | | | |
Total Increase in Net Assets | | | 38,550,299 | | | | 20,518,390 | |
| | | | | | | | |
Net Assets | | | | | | | | |
Beginning of period | | | – | | | | – | |
| | | | | | | | |
End of period | | $ | 38,550,299 | | | $ | 20,518,390 | |
| | | | | | | | |
Accumulated net investment income included in net assets at end of period | | $ | 98,989 | | | $ | 16,846 | |
| | | | | | | | |
Capital Share Transactions – Institutional Class | | | | | | | | |
Shares sold | | | 3,555,541 | | | | 2,410,730 | |
Shares issued in reinvestment of distributions | | | 3,605 | | | | 5,360 | |
Shares redeemed | | | (892,625 | ) | | | (945,007 | ) |
| | | | | | | | |
Net increase from capital share transactions | | | 2,666,521 | | | | 1,471,083 | |
| | | | | | | | |
| (a) | For the period June 29, 2011 (commencement of operations) to May 31, 2012. |
See accompanying notes which are an integral part of these financial statements.
40
Cloud Capital Funds
Financial Highlights
For the period ended May 31, 2012 (a)
(For a share outstanding during the period)
| | | | | | | | |
| | | Cloud Capital
Strategic Large Cap
Fund | | | Cloud Capital
Strategic Mid Cap
Fund | |
Institutional Class: | | | | | | | | |
Selected Per Share Data: | | | | | | | | |
Net asset value, beginning of period | | $ | 15.00 | | | $ | 15.00 | |
| | | | | | | | |
Income from investment operations: | | | | | | | | |
Net investment income (loss) | | | 0.07 | | | | – | (b) |
Net realized and unrealized loss on investments | | | (0.54 | ) (c) | | | (0.92 | ) |
| | | | | | | | |
Total from investment operations | | | (0.47 | ) | | | (0.92 | ) |
| | | | | | | | |
Less distributions to shareholders: | | | | | | | | |
From net investment income | | | (0.04 | ) | | | (0.01 | ) |
From net realized gains | | | (0.03 | ) | | | (0.12 | ) |
| | | | | | | | |
Total distributions | | | (0.07 | ) | | | (0.13 | ) |
| | | | | | | | |
Net asset value, end of period | | $ | 14.46 | | | $ | 13.95 | |
| | | | | | | | |
| | |
Total Return (d) | | | (3.12 | )% (e) | | | (6.13 | )% (e) |
| | |
Ratios and Supplemental Data: | | | | | | | | |
Net assets, end of period (000) | | | 38,550 | | | | 20,518 | |
Ratio of expenses to average net assets | | | 1.40 | % (f) | | | 1.40 | % (f) |
Ratio of expenses to average net assets before waiver | | | 1.90 | % (f) | | | 2.18 | % (f) |
Ratio of net investment income (loss) to average net assets | | | 0.53 | % (f) | | | – | % (f) |
Ratio of net investment income (loss) to average net assets before waiver | | | 0.03 | % (f) | | | (0.78 | )% (f) |
Portfolio turnover rate | | | 163.38 | % (e) | | | 178.49 | % (e) |
| (a) | For the period June 29, 2011 (commencement of operations) to May 31, 2012. |
| (b) | Amount is less than $0.005 per share. |
| (c) | Realized and unrealized gains and losses per share in this caption are balancing amounts necessary to reconcile the change in net asset value per share for the period, and may not reconcile with the aggregate gains and losses in the Statements of Operations due to share transactions for the period. |
| (d) | Total return in the above table represents the rate that the investor would have earned or lost on an investment in the Fund, assuming reinvestment of dividends. |
See accompanying notes which are an integral part of these financial statements.
41
Cloud Capital Funds
Notes to the Financial Statements
May 31, 2012
NOTE 1. ORGANIZATION
The Cloud Capital Strategic Large Cap Fund (the “Large Cap Fund”) and the Cloud Capital Strategic Mid Cap Fund (the “Mid Cap Fund”) (each a “Fund” and, collectively the “Funds”) were organized as open-end diversified series of the Valued Advisers Trust (the “Trust”). The Trust is a management investment company established under the laws of Delaware by an Agreement and Declaration of Trust dated June 13, 2008 (the “Trust Agreement”). The Trust Agreement permits the Trustees to issue an unlimited number of shares of beneficial interest of separate series without par value. The Funds are two of a series of funds authorized by the Trustees. The Funds each offer two share classes, Class A Shares and Institutional Class Shares. The Funds’ Class A Shares have not yet commenced operations. The Funds’ Institutional Class Shares commenced operations on June 29, 2011. The Fund’s investment adviser is Cloud Capital LLC (the “Adviser”). The investment objective of the Large Cap Fund is to consistently deliver excess returns relative to the S&P 500® Index over three- to five-year time horizons. The investment objective of the Mid Cap Fund is to consistently deliver excess returns relative to the S&P Mid Cap 400® Index over three- to five-year time horizons.
Each Fund’s prospectus provides a description of the investment objective, policies and strategies, along with information on the classes of shares currently being offered.
NOTE 2. SIGNIFICANT ACCOUNTING POLICIES
The following is a summary of significant accounting policies consistently followed by each Fund in the preparation of its financial statements.
Securities Valuation – All investments in securities are recorded at their estimated fair value as described in Note 3.
Federal Income Taxes – The Funds makes no provision for federal income or excise tax. Each Fund intends to qualify each year as a regulated investment company (“RIC”) under subchapter M of the Internal Revenue Code of 1986, as amended, by complying with the requirements applicable to RICs and by distributing substantially all of its taxable income. Each Fund also intends to distribute sufficient net investment income and net capital gains, if any, so that it will not be subject to excise tax on undistributed income and gains. If the required amount of net investment income or gains is not distributed, the Funds could incur a tax expense.
As of and during the period ended May 31, 2012, the Funds did not have a liability for any unrecognized tax benefits. The Funds recognize interest and penalties, if any,
42
Cloud Capital Funds
Notes to the Financial Statements - (continued)
May 31, 2012
NOTE 2. SIGNIFICANT ACCOUNTING POLICIES - (continued)
related to unrecognized tax benefits as income tax expense in the statement of operations. During the year, the Funds did not incur any interest or penalties. The Funds are subject to examination by U.S. federal tax authorities for all tax years since inception.
Expenses – Expenses incurred by the Trust that do not relate to a specific fund of the Trust are allocated to the individual funds based on each fund’s relative net assets or another appropriate basis (as determined by the Trustees).
Security Transactions and Related Income – The Funds follow industry practice and records security transactions on the trade date. The first in, first out (“FIFO”) method is used for determining gains or losses for financial statements and income tax purposes. Dividend income is recorded on the ex-dividend date and interest income is recorded on an accrual basis. Discounts and premiums on securities purchased are amortized or accreted using the effective interest method. Withholding taxes on foreign dividends have been provided for in accordance with the Funds’ understanding of the applicable country’s tax rules and rates. The ability of issuers of debt securities held by the Funds to meet their obligations may be affected by economic and political developments in a specific country or region.
Dividends and Distributions – Each Fund intends to distribute substantially all of its net investment income, if any, as dividends to its shareholders on at least an annual basis. Each Fund intends to distribute its net realized long term capital gains and its net realized short term capital gains, if any, at least once a year. Dividends to shareholders, which are determined in accordance with income tax regulations, are recorded on the ex-dividend date. The treatment for financial reporting purposes of distributions made to shareholders during the period from net investment income or net realized capital gains may differ from their ultimate treatment for federal income tax purposes. These differences are caused primarily by differences in the timing of the recognition of certain components of income, expense or realized capital gains for federal income tax purposes. Where such differences are permanent in nature, they are reclassified in the components of the net assets based on their ultimate characterization for federal income tax purposes. Any such reclassifications will have no effects on net assets, results of operations or net asset values per share of the Funds.
43
Cloud Capital Funds
Notes to the Financial Statements - (continued)
May 31, 2012
NOTE 2. SIGNIFICANT ACCOUNTING POLICIES - (continued)
For the fiscal period ended May 31, 2012, the Funds made the following reclassifications to increase (decrease) the components of net assets:
| | | | | | | | | | | | |
| Fund | | Paid in Capital | | | Accumulated Net
Investment
Income (Loss) | | | Accumulated
Net Realized
Gain (Loss) | |
Large Cap Fund | | $ | (30,401 | ) | | $ | 30,379 | | | $ | 22 | |
Mid Cap Fund | | | (30,398 | ) | | | 30,399 | | | | (1 | ) |
NOTE 3. SECURITIES VALUATION AND FAIR VALUE MEASUREMENTS
Fair value is defined as the price that a Fund would receive upon selling an investment in an orderly transaction to an independent buyer in the principal or most advantageous market of the investment. Generally Accepted Accounting Principles in the United States of America (“GAAP”) establish a three-tier hierarchy to maximize the use of observable market data and minimize the use of unobservable inputs and to establish classification of fair value measurements for disclosure purposes.
Inputs refer broadly to the assumptions that market participants would use in pricing the asset or liability, including assumptions about risk (the risk inherent in a particular valuation technique used to measure fair value such as pricing model and/or the risk inherent in the inputs to the valuation technique). Inputs may be observable or unobservable. Observable inputs are inputs that reflect the assumptions market participants would use in pricing the asset or liability developed based on market data obtained from sources independent of the reporting entity. Unobservable inputs are inputs that reflect the reporting entity’s own assumptions about the assumptions market participants would use in pricing the asset or liability developed based on the best information available in the circumstances.
Various inputs are used in determining the value of each Fund’s investments. These inputs are summarized in the three broad levels listed below.
| | • | | Level 1 – quoted prices in active markets for identical securities |
| | • | | Level 2 – other significant observable inputs (including, but not limited to, quoted prices for an identical security in an inactive market, quoted prices for similar securities, interest rates, prepayment speeds, credit risk, etc.) |
| | • | | Level 3 – significant unobservable inputs (including the Funds’ own assumptions in determining fair value of investments based on the best information available) |
44
Cloud Capital Funds
Notes to the Financial Statements - (continued)
May 31, 2012
NOTE 3. SECURITIES VALUATION AND FAIR VALUE MEASUREMENTS - (continued)
The inputs used to measure fair value may fall into different levels of the fair value hierarchy. In such cases, for disclosure purposes, the level in the fair value hierarchy within which the fair value measurement falls in its entirety, is determined based on the lowest level input that is significant to the fair value measurement in its entirety.
Equity securities, including common stock, exchanged-traded funds, and warrants are generally valued by using market quotations, but may be valued on the basis of prices furnished by a pricing service when the Fund believes such prices more accurately reflect the fair value of such securities. Securities that are traded on any stock exchange are generally valued by the pricing service at the last quoted sale price. Lacking a last sale price, an exchange traded security is generally valued by the pricing service at its last bid price. Securities traded in the NASDAQ over-the-counter market are generally valued by the pricing service at the NASDAQ Official Closing Price. When using the market quotations or close prices provided by the pricing service and when the market is considered active, the security will be classified as a Level 1 security. Sometimes, an equity security owned by the Fund will be valued by the pricing service with factors other than market quotations or when the market is considered inactive. When this happens, the security will be classified as a Level 2 security. When market quotations are not readily available, when the Fund determines that the market quotation or the price provided by the pricing service does not accurately reflect the current fair value, or when certain restricted or illiquid securities are being valued, such securities are valued as determined in good faith by the Fund, in conformity with guidelines adopted by and subject to review by the Board of Trustees (the “Board”). These securities will be categorized as Level 3 securities.
In accordance with the Trust’s good faith pricing guidelines, each Fund is required to consider all appropriate factors relevant to the value of securities for which it has determined other pricing sources are not available or reliable as described above. No single standard exists for determining fair value, because fair value depends upon the circumstances of each individual case. As a general principle, the current fair value of an issue of securities being valued by the Fund would appear to be the amount which the owner might reasonably expect to receive for them upon their current sale. Methods which are in accordance with this principle may, for example, be based on (i) a multiple of earnings; (ii) a discount from market of a similar freely traded security (including a derivative security or a basket of securities traded on other markets, exchanges or among dealers); or (iii) yield to maturity with respect to debt issues, or a combination of these and other methods. Good faith pricing is permitted if, in the Fund’s opinion, the validity of market quotations appears to be questionable based on factors such as evidence of a thin market in the security based on a small number of
45
Cloud Capital Funds
Notes to the Financial Statements - (continued)
May 31, 2012
NOTE 3. SECURITIES VALUATION AND FAIR VALUE MEASUREMENTS - (continued)
quotations, a significant event occurs after the close of a market but before a Fund’s NAV calculation that may affect a security’s value, or the Fund is aware of any other data that calls into question the reliability of market quotations. Good faith pricing may also be used in instances when the bonds the Fund invests in may default or otherwise cease to have market quotations readily available. Any fair valuation pricing done outside the Fund’s approved pricing methods must be approved by the Pricing Committee of the Board.
The following is a summary of the inputs used to value the Funds’ investments as of May 31, 2012:
| | | | | | | | | | | | | | | | |
| Fund Name | | LEVEL 1 –
Quoted Prices | | | LEVEL 2 – Other
Significant
Observable Inputs | | | LEVEL 3 –
Significant
Unobservable
Inputs | | | Total | |
Large Cap Fund | | | | | | | | | | | | | | | | |
Common Stocks* | | $ | 37,058,515 | | | $ | – | | | $ | – | | | $ | 37,058,515 | |
Exchange-Traded Funds | | | 34,270 | | | | – | | | | – | | | | 34,270 | |
Warrants | | | 5,359 | | | | – | | | | – | | | | 5,359 | |
Cash Equivalents | | | 1,307,155 | | | | – | | | | – | | | | 1,307,155 | |
Total | | | 38,405,299 | | | | – | | | | – | | | | 38,405,299 | |
Mid Cap Fund | | | | | | | | | | | | | | | | |
Common Stocks* | | | 19,843,649 | | | | – | | | | – | | | | 19,843,649 | |
Exchange-Traded Funds | | | 306 | | | | – | | | | – | | | | 306 | |
Cash Equivalents | | | 634,705 | | | | – | | | | – | | | | 634,705 | |
Total | | | 20,478,660 | | | | – | | | | – | | | | 20,478,660 | |
* Refer to the Schedule of Investments for industry classifications.
The Funds did not hold any investments at any time during the reporting period in which significant unobservable inputs were used in determining fair value; therefore, no reconciliation of Level 3 securities is included for this reporting period. The Funds did not hold any derivative instruments during the reporting period.
The Trust recognizes transfers between fair value hierarchy levels at the end of the reporting period. There were no transfers between any levels for the period ended May 31, 2012.
46
Cloud Capital Funds
Notes to the Financial Statements - (continued)
May 31, 2012
NOTE 4. FEES AND OTHER TRANSACTIONS WITH AFFILIATES
Under the terms of the management agreement, on behalf of the Funds (the “Agreement”), the Adviser manages each Fund’s investments subject to oversight of the Trustees. As compensation for its management services, each Fund is obligated to pay the Adviser a fee computed and accrued daily and paid monthly at an annual rate of 1.00% of the average daily net assets of the Fund. For the period from June 29, 2011 (commencement of operations) to May 31, 2012, the Adviser earned fees of $258,866 from the Large Cap Fund and $182,555 from the Mid Cap Fund before the waivers described below. At May 31, 2012, the Funds owed the Adviser $19,868 and $3,221, respectively, for the excess of management fees earned over expenses waived during the period.
The Adviser has contractually agreed to waive or limit its fees and to assume other expenses of each Fund until May 31, 2014, so that total annual fund operating expenses do not exceed 1.40%. This operating expense limitation does not apply to brokerage fees and commissions, borrowing costs (such as interest and dividend expenses on securities sold short), taxes, 12b-1 fees; extraordinary expenses and indirect expenses (such as “acquired funds fees and expenses”). For the period from June 29, 2011 (commencement of operations) to May 31, 2012, the Adviser waived fees of $129,192 from the Large Cap Fund and $142,245 from the Mid Cap Fund. These amounts are subject to potential recoupment by the Adviser through May 31, 2015.
The waiver and/or reimbursement by the Adviser with respect to the Funds are subject to repayment by the Funds within the three fiscal years following the fiscal year in which that particular waiver and/or reimbursement occurred, provided that the Funds are able to make the repayment without exceeding the expense limitations described above.
The Trust retains Huntington Asset Services, Inc. (“HASI”) to manage each Fund’s business affairs and provide each Fund with administrative services, including all regulatory reporting and necessary office equipment and personnel. For the period from June 29, 2011 (commencement of operations) to May 31, 2012, HASI earned fees of $34,687 for the Large Cap Fund and $34,687 for the Mid Cap Fund. At May 31, 2012, HASI was owed $3,125 from the Large Cap Fund and $3,125 from the Mid Cap Fund for administrative services.
The Trust also retains HASI to act as the Fund’s transfer agent and to provide fund accounting services. For the period from June 29, 2011 (commencement of operations) to May 31, 2012, HASI earned fees of $28,932 for the Large Cap Fund and $28,884 for the Mid Cap Fund for transfer agent services and reimbursement for out-of-pocket
47
Cloud Capital Funds
Notes to the Financial Statements - (continued)
May 31, 2012
NOTE 4. FEES AND OTHER TRANSACTIONS WITH AFFILIATES - (continued)
expenses incurred in providing transfer agent services. At May 31, 2012, HASI was owed $2,857 from the Large Cap Fund and $2,936 from the Mid Cap Fund for transfer agent services and out-of-pocket expenses.
For the period from June 29, 2011 (commencement of operations) to May 31, 2012, HASI earned fees of $23,125 from the Large Cap Fund and $23,125 from the Mid Cap Fund for fund accounting services. At May 31, 2012, HASI was owed $2,083 from the Large Cap Fund and $2,083 from the Mid Cap Fund for fund accounting services.
Certain officers of the Trust are members of management and/or employees of HASI. HASI is a wholly-owned subsidiary of Huntington Bancshares, Inc., the parent company of Unified Financial Securities, Inc. (the “Distributor”).
The Funds have adopted a Distribution Plan (the “Plan”) pursuant to Rule 12b-1 under the 1940 Act. The Plan provides that the Funds will pay the Distributor and/or any registered securities dealer, financial institution or any other person (the “Recipient”) a fee of 0.40% of the average daily net assets of the Class A Shares of each Fund in connection with the promotion and distribution of Fund’s shares or the provision of personal services to shareholders, including, but not necessarily limited to, advertising, compensation to underwriters, dealers and selling personnel, the printing and mailing of prospectuses to other than current Fund shareholders, the printing and mailing of sales literature and servicing shareholder accounts. The Funds or Adviser may pay all or a portion of these fees to any Recipient who renders assistance in distributing or promoting the sale of shares, or who provides certain shareholder services, pursuant to a written agreement. The Plan is a compensation plan, which means that compensation is provided regardless of 12b-1 expenses actually incurred. It is anticipated that the Plan will benefit shareholders because an effective sales program typically is necessary in order for the Funds to reach and maintain a sufficient size to achieve efficiently its investment objectives and to realize economies of scale. There were no 12b-1 fees for the period ended May 31, 2012, as the Class A Shares of each Fund have yet to commence operations.
The Funds may pay certain financial intermediaries that provide certain administrative services to shareholders who invest in the Institutional Class shares of the Funds, including record keeping and sub-accounting shareholder accounts. Each Fund is authorized to pay up to 0.25% of the average daily net assets of each Fund’s Institutional Class shares. The payments may also be made to certain financial intermediaries in connection with client account maintenance support, statement preparation and transaction processing. The types of payments under this category
48
Cloud Capital Funds
Notes to the Financial Statements - (continued)
May 31, 2012
NOTE 4. FEES AND OTHER TRANSACTIONS WITH AFFILIATES - (continued)
include, among others, payment of ticket charges per purchase or exchange order placed by a financial intermediary, payment of networking or other recordkeeping fees, or one-time payments for ancillary services such as setting up the Funds on a financial intermediary’s trading systems. For the period from June 29, 2011 (commencement of operations) to May 31, 2012, the Large Cap Fund and Mid Cap Fund incurred administrative servicing fees of $18,886 and $7,035, respectively. At May 31, 2012, the Large Cap Fund and Mid Cap Fund owed $3,655 and $1,150 in administrative servicing fees, respectively.
Unified Financial Securities, Inc. (“Unified”) acts as the principal distributor of the Funds’ shares. An officer of the Trust is an officer of the Distributor and such person may be deemed to be an affiliate of the Distributor. For the period from June 29, 2011 (commencement of operations) to May 31, 2012, there were no sales charges or CDSC fees deducted from the proceeds of sales, and redemption of capital shares, as the Fund’s Class A shares have not yet commenced.
The Law Offices of John H. Lively and Associates, Inc., a member firm of The 1940 Act Law GroupTM, serves as legal counsel to the Trust. John H. Lively, Interim Secretary of the Trust, is the owner of The Law Offices of John H. Lively & Associates, Inc., but he receives no direct compensation from the Trust or the Funds for serving as an officer of the Trust.
NOTE 5. PURCHASES AND SALES OF SECURITIES
For the period from June 29, 2011 (commencement of operations) to May 31, 2012, purchases and sales of investment securities, other than short-term investments and short-term U.S. government obligations, were as follows:
| | | | | | | | |
| Fund | | Purchases | | | Sales | |
Large Cap Fund | | $ | 79,796,378 | | | $ | 42,634,819 | |
Mid Cap Fund | | | 53,393,982 | | | | 33,186,712 | |
At May 31, 2012, the net unrealized appreciation (depreciation) of investments for tax purposes was as follows:
| | | | | | | | | | | | | | | | |
| Fund | | Tax Cost of
Securities | | | Unrealized
Appreciation | | | Unrealized
Depreciation | | | Net
Unrealized
Appreciation
(Depreciation) | |
Large Cap Fund | | $ | 39,715,927 | | | $ | 2,237,968 | | | $ | (3,548,596 | ) | | $ | (1,310,628 | ) |
Mid Cap Fund | | | 21,461,577 | | | | 1,707,279 | | | | (2,690,196 | ) | | | (982,917 | ) |
49
Cloud Capital Funds
Notes to the Financial Statements - (continued)
May 31, 2012
NOTE 5. PURCHASES AND SALES OF SECURITIES - (continued)
The difference between book basis and tax basis unrealized appreciation was attributable primarily to the tax deferral of losses on wash sales of $1,274,371 for the Large Cap Fund and $1,360,471 for the Mid Cap Fund.
NOTE 6. ESTIMATES
The preparation of financial statements in conformity with GAAP requires management to make estimates and assumptions that affect the reported amounts of assets and liabilities and disclosure of contingent assets and liabilities at the date of the financial statements and the reported amounts of increases and decreases in net assets from operations during the reporting period. Actual results could differ from those estimates.
NOTE 7. BENEFICIAL OWNERSHIP
The beneficial ownership, either directly or indirectly, of 25% or more of the voting securities of a fund creates a presumption of control of a fund, under Section 2(a) (9) of the Investment Company Act of 1940. At May 31, 2012, FOLIOfn Investments, Inc. (“FOLIOfn”) owned, as record shareholder, 46.94% of the outstanding shares of the Cloud Capital Strategic Large Cap Fund. At May 31, 2012, FOLIOfn Investments, Inc. (“FOLIOfn”) and TD Ameritrade Trust Company (“TD Ameritrade”) owned, as record shareholder, 59.92% and 32.43%, respectively, of the outstanding shares of the Cloud Capital Strategic Mid Cap Fund. The Trust does not know whether FOLIOfn or TD Ameritrade or any of the underlying beneficial owners owned or controlled 25% or more of the voting securities of the Funds.
NOTE 8. DISTRIBUTIONS TO SHAREHOLDERS
On December 23, 2011, the Large Cap Fund paid an income distribution of $0.0410 per share and a short-term capital gain distribution of $0.0292 per share to shareholders of record on December 22, 2011.
On December 23, 2011, the Mid Cap Fund paid an income distribution of $0.0091 per share and a short-term capital gain distribution of $0.1205 per share to shareholders of record on December 22, 2011.
50
Cloud Capital Funds
Notes to the Financial Statements - (continued)
May 31, 2012
NOTE 8. DISTRIBUTIONS TO SHAREHOLDERS - (continued)
The tax characterization of distributions paid for the fiscal period ended May 31, 2012 was as follows:
| | | | | | | | |
| Fund | | Ordinary
Income* | | | Total
Distributions | |
Large Cap Fund | | $ | 114,779 | | | $ | 114,779 | |
Mid Cap Fund | | | 187,767 | | | | 187,767 | |
* Short term capital gains distributions are treated as ordinary income for tax purposes.
At May 31, 2012, the components of distributable earnings (accumulated losses) on a tax basis were as follows:
| | | | | | | | | | | | | | | | |
| Fund | | Ordinary
Income | | | Undistributed
Long-Term
Capital Gains | | | Unrealized
Appreciation
(Depreciation) | | | Total
Accumulated
Earnings
(Loss) | |
Large Cap Fund | | $ | 1,363,804 | | | $ | 3,940 | | | $ | (1,310,628 | ) | | $ | 57,116 | |
Mid Cap Fund | | | 478,714 | | | | 1,683 | | | | (982,917 | ) | | | (502,520 | ) |
NOTE 9. SUBSEQUENT EVENTS
Management has evaluated events or transactions that may have occurred since May 31, 2012, that would merit recognition or disclosure in the financial statements. There were no items requiring adjustment of the financial statements or additional disclosure.
51
REPORT OF INDEPENDENT REGISTERED PUBLIC ACCOUNTING FIRM
To the Shareholders and Board of Trustees
The Cloud Capital Funds
(Valued Advisers Trust)
We have audited the accompanying statements of assets and liabilities, including the schedules of investments, of The Cloud Capital Funds (the “Funds”), comprising Cloud Capital Strategic Large Cap Fund and Cloud Capital Strategic Mid Cap Fund, each a series of the Valued Advisers Trust, as of May 31, 2012, and the related statements of operations, changes in net assets and the financial highlights for the period June 29, 2011 (commencement of operations) through May 31, 2012. These financial statements and financial highlights are the responsibility of the Funds’ management. Our responsibility is to express an opinion on these financial statements and financial highlights based on our audit.
We conducted our audit in accordance with the standards of the Public Company Accounting Oversight Board (United States). Those standards require that we plan and perform the audit to obtain reasonable assurance about whether the financial statements and financial highlights are free of material misstatement. An audit includes examining, on a test basis, evidence supporting the amounts and disclosures in the financial statements. Our procedures included confirmation of securities owned as of May 31, 2012 by correspondence with the custodian. An audit also includes assessing the accounting principles used and significant estimates made by management, as well as evaluating the overall financial statement presentation. We believe that our audit provides a reasonable basis for our opinion.
In our opinion, the financial statements and financial highlights referred to above present fairly, in all material respects, the financial position of each of the Funds constituting The Cloud Capital Funds as of May 31, 2012, the results of their operations, the changes in their net assets, and their financial highlights for the period then ended, in conformity with accounting principles generally accepted in the United States of America.
COHEN FUND AUDIT SERVICES, LTD.
Westlake, Ohio
July 25, 2012
52
TRUSTEES AND OFFICERS (Unaudited)
The Board of Trustees supervises the business activities of the Trust. Each Trustee serves as a trustee until termination of the Trust unless the Trustee dies, resigns, retires or is removed.
The following tables provide information regarding the Trustees and Officers.
The following table provides information regarding each of the Independent Trustees.
| | |
Name, Address*, (Age), Position with
Trust**, Term of Position with Trust | | Principal Occupation During Past 5 Years and Other
Directorships |
| Dr. Merwyn R. Vanderlind, 75, Independent Trustee, August 2008 to present. | | Retired; Consultant to Battelle Memorial Institute (International Science and Technology Research Enterprise) on business investments from 2001 to 2003; Formerly employed with Battelle Memorial Institute from 1966 to 2003 in various positions, including the Executive Vice President of Battelle Institute from 1991 to 2001, General Manager from 1985 to 1991, Director of the Battelle Industrial Technology Center (Geneva, Switzerland) from 1983 to 1985, and Practicing Researcher from 1966 to 1983. |
Ira Cohen, 53 Independent Trustee, June 2010 to present. | | Independent financial services consultant (Feb. 2005 – present); Senior Vice President, Dealer Services / Institutional Services, AIM Investment Services, Inc. (1992 – 2005). |
* The address for each trustee and officer is 2960 N. Meridian St., Suite 300, Indianapolis, IN 46208.
** The Trust consists of 10 series.
53
The following table provides information regarding the Trustee who is considered an “interested person” of the Trust, as that term is defined under the 1940 Act. Based on the experience of the Trustee, the Trust concluded that the individual described below should serve as a Trustee.
| | |
Name, Address*, (Age), Position with
Trust**, Term of Position with Trust | | Principal Occupation During Past 5 Years and Other
Directorships |
| R. Jeffrey Young, 47, Trustee and Chairman, June 2010 to present. | | Principal Executive Officer and President, Valued Advisers Trust since February 2010; Senior Vice President, Huntington Asset Services, Inc. since January 2010; Chief Executive Officer, Huntington Funds since February 2010; Chief Executive Officer, The Huntington Strategy Shares since November 2010; President and Chief Executive Officer, Dreman Contrarian Funds since March 2011; Trustee, Valued Advisers Trust, August 2008 to January 2010; Managing Director and Chief Operating Officer of Professional Planning Consultants 2007 to 2010; Co-Founder of Kinwood Group, LLC July 2007 to March 2008; President and Chief Executive Officer of The Coventry Group from 2000 to 2007; President and Chief Executive Officer of the STI Classic Funds from 2004 to 2007; Trustee of the Coventry Group from 1999 to 2005; and Senior Vice President of BISYS Fund Services / The Winsbury Company October 1993 to June 2007. |
* The address for each trustee and officer is 2960 N. Meridian St., Suite 300, Indianapolis, IN 46208.
** The Trust consists of 10 series.
54
The following table provides information regarding the Officers of the Trust:
| | |
Name, Address*, (Age), Position with
Trust,** Term of Position with Trust | | Principal Occupation During Past 5 Years and Other
Directorships |
| R. Jeffrey Young, 47, Principal Executive Officer and President, February 2010 to present. | | Trustee, Valued Advisers Trust since June 2010; Senior Vice President, Huntington Asset Services, Inc. since January 2010; Chief Executive Officer, Huntington Funds since February 2010; President and Chief Executive Officer, Dreman Contrarian Funds since March 2011; Trustee, Valued Advisers Trust, August 2008 to January 2010; Managing Director and Chief Operating Officer of Professional Planning Consultants 2007 to 2010; Co-Founder of Kinwood Group, LLC July 2007 to March 2008; President and Chief Executive Officer of The Coventry Group from 2000 to 2007; President and Chief Executive Officer of the STI Classic Funds from 2004 to 2007; Trustee of the Coventry Group from 1999 to 2005; and Senior Vice President of BISYS Fund Services/The Winsbury Company October 1993 to June 2007. |
| John C. Swhear, 51, Chief Compliance Officer, AML Officer and Vice President, August 2008 to present. | | Vice President of Legal Administration and Compliance for Huntington Asset Services, Inc., the Trust’s administrator, since April 2007; Chief Compliance Officer of Unified Financial Securities, Inc., the Trust’s distributor, since May 2007; Senior Vice President of the Unified Series Trust since May 2007; Secretary of Huntington Funds since April 2010; President and Chief Executive Officer of Dreman Contrarian Funds from March 2010 to March 2011, and Vice President and Acting Chief Executive Officer, 2007 to March 2010 ; Employed in various positions with American United Life Insurance Company from 1983 to April 2007, including: Associate General Counsel, April 2007; Investment Advisor Chief Compliance Officer, June 2004 to April 2007; Assistant Secretary to the Board of Directors, December 2002 to April 2007; Chief Compliance Officer of OneAmerica Funds, Inc., June 2004 to April 2007; Chief Counsel and Secretary, OneAmerica Securities, Inc., December 2002 to April 2007. |
55
| | |
Name, Address*, (Age), Position with
Trust,** Term of Position with Trust | | Principal Occupation During Past 5 Years and Other
Directorships |
| Carol J. Highsmith, 47, Vice President, August 2008 to present. | | Employed in various positions with Huntington Asset Services, Inc., the Trust’s administrator, since November of 1994; currently Vice President of Legal Administration. |
| Matthew J. Miller, 36, Vice President, December 2011 to present. | | Employed in various positions with Huntington Asset Services, Inc., the Trust’s administrator, since July of 1998; currently Vice President of Relationship Management; Vice President of Huntington Funds since February 2010. |
William J. Murphy, 49, Treasurer, December 2009 to present | | Manager of Fund Administration for Huntington Asset Services, Inc., the Trust’s administrator, since October 2007; Assistant Treasurer of Unified Series Trust from February 2008 to May 2011; Treasurer and Chief Financial Officer of Dreman Contrarian Funds from February 2008 to March 2011; Employed in various positions with American United Life Insurance Company from March 1987 to October 2007. |
John H. Lively, 43, Interim Secretary, September 2011 to present. | | Attorney, The Law Offices of John H. Lively & Associates, Inc., March, 2010 to present; Secretary of Dividend Growth Trust, September 2010 to present; Partner, Husch Blackwell Sanders LLP (law firm), March, 2007 to February, 2010; Managing Attorney, Raymond James Financial (financial services), September, 2005 to March, 2007. |
* The address for each trustee and officer is 2960 N. Meridian St., Suite 300, Indianapolis, IN 46208.
** The Trust consists of 10 series.
56
OTHER INFORMATION
The Funds’ Statement of Additional Information (“SAI”) includes additional information about the trustees and is available without charge, upon request. You may call toll-free at (877) 670-2227 to request a copy of the SAI or to make shareholder inquiries.
57
VALUED ADVISERS TRUST
PRIVACY POLICY
The following is a description of the policies of the Valued Advisers Trust (the “Trust”) regarding disclosure of nonpublic personal information that shareholders provide to a series of the Trust (each, a “Fund”) or that the Fund collects from other sources. In the event that a shareholder hold shares of a Fund through a broker-dealer or other financial intermediary, the privacy policy of the financial intermediary would govern how shareholder nonpublic personal information would be shared with nonaffiliated third parties.
Categories of Information A Fund May Collect. A Fund may collect the following nonpublic personal information about its shareholders:
| | • | | Information the Fund receives from a shareholder on applications or other forms, correspondence, or conversations (such as the shareholder’s name, address, phone number, social security number, and date of birth); and |
| | • | | Information about the shareholder’s transactions with the Fund, its affiliates, or others (such as the shareholder’s account number and balance, payment history, cost basis information, and other financial information). |
Categories of Information A Fund May Disclose. A Fund may not disclose any nonpublic personal information about its current or former shareholders to unaffiliated third parties, except as required or permitted by law. A Fund is permitted by law to disclose all of the information it collects, as described above, to its service providers (such as the Fund’s custodian, administrator, transfer agent, accountant and legal counsel) to process shareholder transactions and otherwise provide services to the shareholder.
Confidentiality and Security. Each Fund shall restrict access to shareholder nonpublic personal information to those persons who require such information to provide products or services to the shareholder. Each Fund shall maintain physical, electronic, and procedural safeguards that comply with federal standards to guard shareholder nonpublic personal information.
Disposal of Information. The Funds, through their transfer agent, have taken steps to reasonably ensure that the privacy of a shareholder’s nonpublic personal information is maintained at all times, including in connection with the disposal of information that is no longer required to be maintained by the Funds. Such steps shall include, whenever possible, shredding paper documents and records prior to disposal, requiring off-site storage vendors to shred documents maintained in such locations prior to disposal, and erasing and/or obliterating any data contained on electronic media in such a manner that the information can no longer be read or reconstructed.
PROXY VOTING
A description of the policies and procedures that the Funds use to determine how to vote proxies relating to portfolio securities and information regarding how each Fund voted those proxies during the most recent twelve month period ended June 30, is available without charge upon request by (1) calling the Funds at (877) 670-2227 and (2) from Funds documents filed with the Securities and Exchange Commission (“SEC”) on the SEC’s website at www.sec.gov.
TRUSTEES
R. Jeffrey Young, Chairman
Dr. Merwyn R. Vanderlind
Ira Cohen
OFFICERS
R. Jeffrey Young, Principal Executive Officer and President
John C. Swhear, Chief Compliance Officer, AML Officer and Vice-President
Carol J. Highsmith, Vice President
Matthew J. Miller, Vice President
William J. Murphy, Principal Financial Officer and Treasurer
John H. Lively, Interim Secretary
INVESTMENT ADVISER
Cloud Capital LLC
5314 South Yale, Suite 606
Tulsa, OK 74135
DISTRIBUTOR
Unified Financial Securities, Inc.
2960 North Meridian Street, Suite 300
Indianapolis, IN 46208
INDEPENDENT REGISTERED PUBLIC ACCOUNTING FIRM
Cohen Fund Audit Services, Ltd.
800 Westpoint Pkwy., Suite 1100
Westlake, OH 44145
LEGAL COUNSEL
The Law Offices of John H. Lively & Associates, Inc.,
A member firm of The 1940 Act Law GroupTM
11300 Tomahawk Creek Parkway, Ste. 310
Leawood, KS 66224
CUSTODIAN
FOLIOfn Investments, Inc.
8180 Greensboro Drive
8th Floor
McLean, VA 22102
ADMINISTRATOR, TRANSFER AGENT AND FUND ACCOUNTANT
Huntington Asset Services, Inc.
2960 North Meridian Street, Suite 300
Indianapolis, IN 46208
This report is intended only for the information of shareholders or those who have received the Funds’ prospectus which contains information about the Funds’ management fee and expenses. Please read the prospectus carefully before investing.
Distributed by Unified Financial Securities, Inc.
Member FINRA/SIPC
LETTER TO SHAREHOLDERS
Dear Longview Global Allocation Fund Shareholder,
Enclosed for your review is the annual report for the period June 27, 2011 (commencement of operations) to May 31, 2012 (“fiscal period”) for the Longview Global Allocation Fund (“Fund”), which is a series of the Valued Advisers Trust.
MARKET AND FUNDS PERFORMANCE OVERVIEW
During the fiscal period ended May 31, 2012, the equity market averages experienced mixed returns. The S&P 500® Index1 was up 5.48%, the NASDAQ Composite Index1 was up 7.72%, the Russell 2000® Index1 was down -3.22%, the Dow Jones Industrial Average1 was up 6.63%, the MSCI EAFE Index1 was down -15.38%, and the Dow Jones Global Moderate Portfolio Index2 was up 0.05%. During this same period, the Longview Global Allocation Fund was down -10.11% (excluding the impact of sales charges).
During the fiscal period, we participated in the significant up trends and avoided most of the down trends. Sharp market gyrations had investors uncertain as to where to focus their attention. The Fund has the flexibility to invest in any asset class, anywhere, and even amid today’s heightened volatility, found no shortage of opportunities.
Credit concerns continued to be the focus of the financial markets. The market returns over the past fiscal year masked a great deal of volatility throughout the period. Over the past few quarters, the Longview Global Allocation Fund has enjoyed reduced volatility, which brought about our muted returns over the fiscal period.
Our focus remained on large cap defensive sectors such as utilities and consumer staples, while remaining significantly underweighted in the higher “risk on” sectors. Our strategy involves choosing low beta sectors in times of heightened volatility. We successfully avoided areas such as financials and materials, which drove the overall market down during the fiscal period noted. While our sector selection has significantly outperformed the S&P 500® Index over time, our avoidance of higher risk sectors in an extremely choppy, headline driven market underperformed over the period.
Over the fiscal period we spent a significant portion of the time in a defensive posture, holding low beta equity positions, short duration fixed income and cash. These particular vehicles typically experience inverse behavior during periods of “risk on” speculation.
We believe that the markets are currently being driven by headlines, rumors and QE3 hope. Credit concerns continue to mount putting further pressure on the long-term viability of the overall global financial system.
MARKET OUTLOOK
The past months have been complex for investors. Volatility has been extreme, headlines and macro narratives drove the market and governments around the world to continue to avoid dealing with their debt issues. We continue to search for clarity, waiting patiently for the cross currents to resolve themselves. Currently, we believe domestic equities appear to be set up for further strength, however we continue to face headwinds, headline shocks can turn violent in the blink of an eye. Being nimble, disciplined and diversified will be the keys to success in the coming months.
We do not forecast the market; in fact, we strongly believe no one can. We react to the market using our rules-based, trend-following model. In theory, this helps keep the subjectivity and human emotion out of our process.
1
LETTER TO SHAREHOLDERS
LONGVIEW INVESTMENT PHILOSOPHY
Our Fund is managed using an active or tactical management strategy. Our investment process is driven by a single-minded focus: to add value for our clients. This focus requires us to produce investment solutions that aim to consistently generate competitive risk-adjusted returns over full market cycles. It compels us to maintain a long-term perspective and provide innovative investment management solutions that add value for our clients. It also requires us to place an emphasis on risk management, because understanding and managing risk is critical to our clients’ investment success. In this uncertain world we recognize the need to overweight, underweight or simply avoid specific areas of the market based on the environment. We do this to seek to achieve excess returns or to avoid excess volatility.
At Longview, we employ a strict sell discipline with the goal of managing risk and maximizing capital preservation. The Fund invests across markets, classes, sectors and styles with the goal to produce absolute returns with reduced volatility. In addition, the Fund will also attempt to hedge against extreme market outcomes. Finally and most importantly, the Fund can move fully into cash, if need be.
Our overall goal is to win by not losing; we have a flexible investment mandate, focusing on capital appreciation when the markets are performing well, and capital preservation when they are not.
LONGVIEW GLOBAL ALLOCATION FUND
The Fund is a multi-asset, professionally managed fund. The Longview investment process is driven by relative strength, enabling us to identify fundamental trends and changes in the economic environment. Our process allows us to be properly allocated across multiple asset classes, sectors, capitalizations and styles. Our mandate allows us to change our fund’s construction, based on the changing realities of the global markets. Longview Global Allocation Fund seeks to preserve and grow capital by producing absolute returns with reduced volatility.
Thank you for your continued support and allowing us to serve you and the Fund. Please feel free to contact us with any questions or concerns.
Sincerely,
|
 |
| Christian M. Wagner |
| Chief Investment Officer |
| Longview Capital Management, LLC |
2
LETTER TO SHAREHOLDERS
The views in this report were those of the Fund’s investment adviser as of the date of this Report and may not reflect their views on the date this report is first published or anytime thereafter. These views are intended to assist shareholders in understanding their investment in the Fund and do not constitute investment advice.
The performance information quoted above represents past performance and past performance does not guarantee future results. Investment return and principal value of an investment will fluctuate so that an investor’s shares, when redeemed, may be worth more or less than their original cost. Current performance may be lower or higher than the performance data quoted. Performance data, current to the most recent month end, may be obtained by calling 1-877-460-6423. An investor should consider a Fund’s investment objectives, risks, and charges and expenses carefully before investing. The Fund’s prospectus contains this and other important information. For information on the Fund’s expense ratios, please see the Financial Highlights tables found within this Report.
Investment in the Fund is subject to investment risks, including, without limitation, market risk, management style risk, risks related to “fund of funds” structure, sector risk, fixed income risk, tracking risk, risks related to ETF net asset value and market price, foreign securities risk, risks related to portfolio turnover and small capitalization companies risk. Since the Fund is a “fund of funds,” an investor will indirectly bear fees and expenses charged by the underlying ETFs and investment companies in which a Fund invests in addition to the Fund’s direct fees and expenses. More information about these risks and other risks can be found in the Fund’s prospectus.
Beta: A quantitative measure of the volatility of a given stock, mutual fund, or portfolio, relative to the overall market, usually the S&P 500. A beta above 1 is more volatile than the overall market, while a beta below 1 is less volatile.
| 1 | The S&P 500® Index, NASDAQ Composite Index, Russell 2000® Index, Dow Jones Industrial Average, and MSCI EAFE Index (the “Indices”) are widely recognized unmanaged indices of equity prices and are representative of a broader market and range of securities than are found in the Fund’s portfolio. The Indices returns do not reflect the deduction of expenses, which have been deducted from the Fund’s returns. The Indices’ returns assume reinvestment of all distributions and do not reflect the deduction of taxes and fees. Individuals cannot invest directly in the Indices; however, an individual can invest in exchange-traded funds or other investment vehicles that attempt to track the performance of a benchmark index. |
| 2 | The Dow Jones Global Moderate Portfolio Index is a benchmark that takes 60% of the risk of the global securities market. It is a total returns index that is a time-varying weighted average of stocks, bonds, and cash. The Index is the efficient allocation of stocks, bonds, and cash in a portfolio with 60% of the risk of the Dow Jones Aggressive Portfolio Index. The Index is an unmanaged benchmark that assumes reinvestment of all distributions and excludes the effect of taxes and fees. Individuals cannot invest directly in this Index; however, an individual can invest in exchange traded funds or other investment vehicles that attempt to track the performance of a benchmark index. |
3
Investment Results - (Unaudited)
| | | | |
| | | Total Returns*
(For the period ended
May 31, 2012) | |
| | | Since Inception
June 27, 2011 | |
Longview Global Allocation Fund with load | | | –15.28% | |
Longview Global Allocation Fund without load | | | –10.11% | |
Dow Jones Global Moderate Portfolio Index** | | | 0.05% | |
S&P 500® Index*** | | | 5.48% | |
Total annual operating expenses, as estimated for the Fund’s first fiscal period ending May 31, 2012 and disclosed in the Fund’s prospectus, are 2.41% of average daily net assets. Longview Capital Management LLC contractually has agreed to cap certain operating expenses of the Fund, excluding brokerage fees and commissions, borrowing costs (such as interest and dividend expenses on securities sold short), taxes, extraordinary expenses, 12b-1 fees, and indirect expenses such as “Acquired Fund Fees and Expenses” of the of the Fund at 2.20% through September 30, 2013.
The performance quoted represents past performance, which does not guarantee future results. The investment return and principal value of an investment will fluctuate so that an investor’s shares, when redeemed, may be worth more or less than their original cost. The returns shown do not reflect deduction of taxes that a shareholder would pay on Fund distributions or the redemption of Fund shares. The Fund’s investment objectives, risks, charges and expenses must be considered carefully before investing. Current performance of a Fund may be lower or higher than the performance quoted. Performance data current to the most recent month end may be obtained by calling 1-877-460-6423.
| * | Return figures reflect any change in price per share and assume the reinvestment of all distributions. Total returns, with loads, include the maximum 5.75% sales charge. |
| ** | The Dow Jones Global Moderate Portfolio Index is a benchmark that takes 60% of the risk of the global securities market. It is a total returns index that is a time-varying weighted average of stocks, bonds, and cash. The Index is the efficient allocation of stocks, bonds, and cash in a portfolio with 60% of the risk of the Dow Jones Aggressive Portfolio Index. The Index is an unmanaged benchmark that assumes reinvestment of all distributions and excludes the effect of taxes and fees. Individuals cannot invest directly in this Index; however, an individual can invest in exchange traded funds or other investment vehicles that attempt to track the performance of a benchmark index. |
| *** | The S&P 500® Index is a widely recognized unmanaged index of equity prices and is representative of a broader market and range of securities than is found in the Fund’s portfolio. The Index is an unmanaged benchmark that assumes reinvestment of all distributions and excludes the effect of taxes and fees. Individuals cannot invest directly in this Index; however, an individual can invest in exchange traded funds or other investment vehicles that attempt to track the performance of a benchmark index. |
The Fund’s investment objectives, risks, charges and expenses must be considered carefully before investing. The prospectus contains this and other important information about the investment company and may be obtained by calling 1-877-460-6423. Please read it carefully before investing.
The Fund is distributed by Unified Financial Securities, Inc., Member FINRA.
4
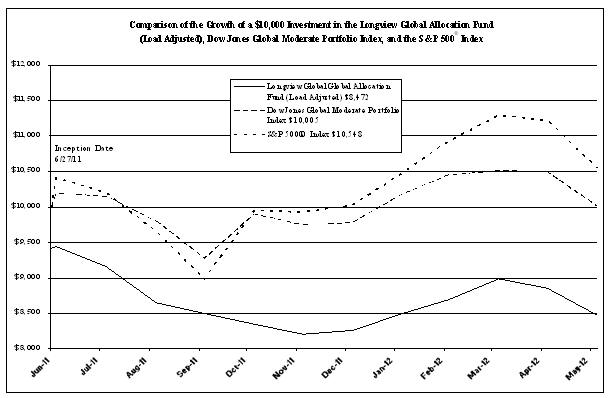
The chart above assumes an initial investment of $10,000 made on June 27, 2011 (commencement of Fund operations) and held through May 31, 2012. THE FUND’S RETURNS REPRESENT PAST PERFORMANCE AND DO NOT GUARANTEE FUTURE RESULTS. The returns shown do not reflect deduction of taxes that a shareholder would pay on the Fund’s distributions or the redemption of the Fund’s shares. Investment returns and principal values will fluctuate so that your shares, when redeemed, may be worth more or less than their original purchase price.
Current performance may be lower or higher than the performance data quoted. For more information on the Fund, and to obtain performance data current to the most recent month-end, or to request a prospectus, please call 1-877-460-6423. You should carefully consider the investment objectives, potential risks, management fees, and charges and expenses of the Fund before investing. The Fund’s prospectus contains this and other information about the Fund, and should be read carefully before investing.
The Fund is distributed by Unified Financial Securities, Inc., member FINRA.
5
FUND HOLDINGS - (Unaudited)
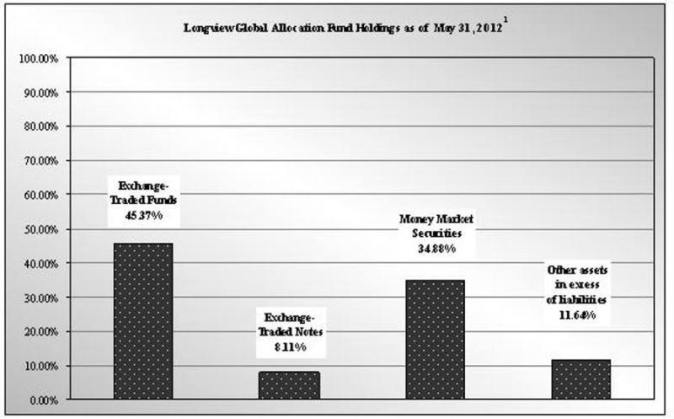
| 1 | As a percent of net assets. |
The investment objective of the Longview Global Allocation Fund is to provide long-term capital appreciation with capital preservation as a secondary objective.
AVAILABILITY OF PORTFOLIO SCHEDULE - (Unaudited)
The Fund files its complete schedule of portfolio holdings with the Securities and Exchange Commission (“SEC”) for the first and third quarters of each fiscal year on Form N-Q. The Fund’s Forms N-Q are available at the SEC’s website at www.sec.gov. The Forms N-Q may be reviewed and copied at the Public Reference Room in Washington DC. Information on the operation of the Public Reference Room may be obtained by calling 1-800-SEC-0330.
ABOUT THE FUND’S EXPENSES - (Unaudited)
As a shareholder of the Fund, you incur two types of costs: (1) transaction costs (such as short-term redemption fees); and (2) ongoing costs, including management fees; and other Fund expenses. This Example is intended to help you understand your ongoing costs (in dollars) of investing in the Fund and to compare these costs with the ongoing costs of investing in other mutual funds. The Example is based on an investment of $1,000 invested at the beginning of the period, and held for the entire period from December 1, 2011 to May 31, 2012.
Actual Expenses
The first line of the table below provides information about actual account values and actual expenses. You may use the information in this line, together with the amount you invested, to estimate the expenses that you paid over the period. Simply divide your account value by $1,000 (for example, an $8,600 account value divided by $1,000 = 8.60), then multiply the result by the number in the first line under the heading entitled “Expenses Paid During Period” to estimate the expenses you paid on your account during this period.
6
ABOUT THE FUND’S EXPENSES - (Unaudited) (Continued)
Hypothetical Example for Comparison Purposes
The second line of the table below provides information about hypothetical account values and hypothetical expenses based on the Fund’s actual expense ratios and an assumed rate of return of 5% per year before expenses, which is not the Fund’s actual return. The hypothetical account values and expenses may not be used to estimate the actual ending account balance or expenses you paid for the period. You may use this information to compare the ongoing costs of investing in the Fund and other funds. To do so, compare this 5% hypothetical example with the 5% hypothetical examples that appear in the shareholder reports of the other funds.
Please note that the expenses shown in the table are meant to highlight your ongoing costs only and do not reflect any transactional costs, such as sales charges (loads), redemption fees, or exchange fees. Therefore, the second line of the table is useful in comparing ongoing costs only, and will not help you determine the relative total costs of owning different funds. In addition, if these transactional costs were included, your costs would have been higher.
| | | | | | |
Longview Global Allocation Fund | | Beginning
Account Value
December 1, 2011 | | Ending
Account Value
May 31, 2012 | | Expenses Paid During
the Period Ended
May 31, 2012* |
Actual | | $1,000.00 | | $1,032.03 | | $10.80 |
Hypothetical ** (5% return before expenses) | | $1,000.00 | | $1,014.37 | | $10.71 |
| * | Expenses are equal to the Fund’s annualized expense ratio of 2.13%, multiplied by the average account value over the period, multiplied by 183/366 (to reflect the partial year period). |
| ** | Assumes a 5% return before expenses. |
7
Longview Global Allocation Fund
Schedule of Investments
May 31, 2012
| | | | | | | | |
| | | Shares | | | Fair Value | |
Exchange-Traded Funds - 45.37% | | | | | | | | |
Consumer Staples Select Sector SPDR Fund | | | 98,003 | | | $ | 3,308,581 | |
Health Care Select Sector SPDR Fund | | | 90,700 | | | | 3,278,805 | |
Utilities Select Sector SPDR Fund | | | 93,845 | | | | 3,365,282 | |
ProShares Ultra VIX Short-Term Futures ETF (a) | | | 48,932 | | | | 979,619 | |
SPDR Dow Jones Industrial Average ETF | | | 15,509 | | | | 1,918,463 | |
SPDR S&P 500 ETF | | | 14,313 | | | | 1,882,017 | |
| | | | | | | | |
TOTAL EXCHANGE-TRADED FUNDS
(Cost $15,063,488) | | | | | | | 14,732,767 | |
| | | | | | | | |
Exchange-Traded Notes - 8.11% | | | | | | | | |
iPath S&P 500 Dynamic VIX ETN (a) | | | 5,610 | | | | 321,060 | |
iPath S&P 500 VIX Short-Term Futures ETN (a) | | | 15,200 | | | | 316,464 | |
VelocityShares Daily Inverse VIX Short-Term ETN (a) | | | 224,564 | | | | 1,996,374 | |
| | | | | | | | |
TOTAL EXCHANGE-TRADED NOTES
(Cost $2,132,412) | | | | | | | 2,633,898 | |
| | | | | | | | |
Money Market Securities - 34.88% | | | | | | | | |
Fidelity Institutional Money Market Portfolio - Institutional Shares, 0.23% (b) | | | 11,326,093 | | | | 11,326,093 | |
| | | | | | | | |
TOTAL MONEY MARKET SECURITIES
(Cost $11,326,093) | | | | | | | 11,326,093 | |
| | | | | | | | |
TOTAL INVESTMENTS
(Cost $28,521,993) - 88.36% | | | | | | $ | 28,692,758 | |
| | | | | | | | |
Other assets in excess of liabilities - 11.64% | | | | | | | 3,779,706 | |
| | | | | | | | |
TOTAL NET ASSETS - 100.00% | | | | | | $ | 32,472,464 | |
| | | | | | | | |
| (b) | Variable rate security; the rate shown represents the yield at May 31, 2012. |
See accompanying notes which are an integral part of these financial statements.
8
Longview Global Allocation Fund
Statement of Assets and Liabilities
May 31, 2012
| | | | |
Assets | | | | |
Investments in securities, at value (cost $28,521,993) | | $ | 28,692,758 | |
Receivable for investments sold | | | 3,804,477 | |
Receivable for fund shares sold | | | 25,051 | |
Dividends receivable | | | 8,136 | |
Prepaid expenses | | | 19,697 | |
Deferred offering expense | | | 2,022 | |
| | | | |
Total assets | | | 32,552,141 | |
| | | | |
Liabilities | | | | |
Payable for fund shares redeemed | | | 8,370 | |
Payable to Adviser | | | 32,207 | |
Payable to administrator, fund accountant, and transfer agent | | | 8,054 | |
Payable to custodian | | | 1,031 | |
12b-1 fees accrued | | | 7,002 | |
Other accrued expenses | | | 23,013 | |
| | | | |
Total liabilities | | | 79,677 | |
| | | | |
Net Assets | | $ | 32,472,464 | |
| | | | |
Net Assets consist of: | | | | |
Paid in capital | | $ | 34,921,672 | |
Accumulated net investment loss | | | (166,979 | ) |
Accumulated net realized loss from investment transactions | | | (2,452,994 | ) |
Net unrealized appreciation on investments | | | 170,765 | |
| | | | |
Net Assets | | $ | 32,472,464 | |
| | | | |
Shares Outstanding (unlimited number of shares authorized, no par value) | | | 3,614,136 | |
| | | | |
Net Asset Value (“NAV”) per share | | $ | 8.98 | |
| | | | |
Public offering price per share (NAV/94.25%) (a) | | $ | 9.53 | |
| | | | |
Redemption price per share (NAV * 98%) (b) | | $ | 8.81 | |
| | | | |
| (a) | The Fund imposes a maximum sales charge of 5.75% on purchases. |
| (b) | A redemption fee of 2.00% is charged on shares held less than 30 days. |
See accompanying notes which are an integral part of these financial statements.
9
Longview Global Allocation Fund
Statement of Operations
For the period ended May 31, 2012 (a)
| | | | |
Investment Income | | | | |
Dividend income | | $ | 417,088 | |
| | | | |
Total Investment Income | | | 417,088 | |
| | | | |
Expenses | | | | |
Investment Adviser fee | | | 300,761 | |
12b-1 fees | | | 65,382 | |
Transfer agent expenses | | | 35,978 | |
Administration expenses | | | 34,791 | |
Fund accounting expenses | | | 23,194 | |
Offering expenses | | | 18,122 | |
Legal expenses | | | 17,537 | |
Audit expenses | | | 15,500 | |
Miscellaneous expenses | | | 11,134 | |
Custodian expenses | | | 10,728 | |
Registration expenses | | | 8,790 | |
Organizational expenses | | | 8,750 | |
Report printing expenses | | | 7,700 | |
Trustee expenses | | | 4,397 | |
24f-2 expense | | | 3,918 | |
Insurance expense | | | 2,521 | |
Pricing expenses | | | 1,185 | |
| | | | |
Total Expenses | | | 570,388 | |
| | | | |
Net Investment Loss | | | (153,300 | ) |
| | | | |
Realized & Unrealized Gain (Loss) on Investments | | | | |
Distributions of long-term realized gains by other investment companies | | | 3,066 | |
Net realized loss on investment transactions | | | (2,457,568 | ) |
Net change in unrealized appreciation of investments | | | 170,765 | |
| | | | |
Net realized and unrealized loss on investments | | | (2,283,737 | ) |
| | | | |
Net decrease in net assets resulting from operations | | $ | (2,437,037 | ) |
| | | | |
| (a) | For the period June 27, 2011 (commencement of operations) to May 31, 2012. |
See accompanying notes which are an integral part of these financial statements.
10
Longview Global Allocation Fund
Statement of Changes In Net Assets
| | | | |
| | | For the period ended
May 31, 2012 (a) | |
Decrease to Net Assets due to: | | | | |
Operations | | | | |
Net investment loss | | $ | (153,300 | ) |
Distributions of long-term realized gains by other investment companies | | | 3,066 | |
Net realized loss on investment transactions | | | (2,457,568 | ) |
Net change in unrealized appreciation of investments | | | 170,765 | |
| | | | |
Net decrease in net assets resulting from operations | | | (2,437,037 | ) |
| | | | |
Distributions | | | | |
From net investment income | | | (30,293 | ) |
| | | | |
Total distributions | | | (30,293 | ) |
| | | | |
Capital Transactions | | | | |
Proceeds from shares sold | | | 38,557,775 | |
Reinvestment of distributions | | | 266 | |
Amount paid for shares redeemed | | | (3,622,093 | ) |
Proceeds from redemption fees (b) | | | 3,846 | |
| | | | |
Net increase in net assets resulting from capital transactions | | | 34,939,794 | |
| | | | |
Total Increase in Net Assets | | | 32,472,464 | |
| | | | |
Net Assets | | | | |
Beginning of period | | | — | |
| | | | |
End of period | | $ | 32,472,464 | |
| | | | |
Accumulated net investment loss included in net assets at the end of period | | $ | (166,979 | ) |
| | | | |
Capital Share Transactions | | | | |
Shares sold | | | 4,010,270 | |
Shares issued in reinvestment of distributions | | | 30 | |
Shares redeemed | | | (396,164 | ) |
| | | | |
Net increase from capital share transactions | | | 3,614,136 | |
| | | | |
| (a) | For the period June 27, 2011 (commencement of operations) to May 31, 2012. |
| (b) | A redemption fee of 2.00% is charged on shares held less than 30 days. |
See accompanying notes which are an integral part of these financial statements.
11
Longview Global Allocation Fund
Financial Highlights
(For a share outstanding during the period)
| | | | |
| | | For the period ended
May 31, 2012 (a) | |
Selected Per Share Data: | | | | |
Net asset value, beginning of period | | $ | 10.00 | |
| | | | |
Loss from investment operations: | | | | |
Net investment loss | | | (0.05 | ) |
Net realized and unrealized loss on investments | | | (0.96 | ) |
| | | | |
Total from investment operations | | | (1.01 | ) |
| | | | |
Less Distributions to shareholders: | | | | |
From net investment income | | | (0.01 | ) |
| | | | |
Total distributions | | | (0.01 | ) |
| | | | |
Paid in capital from redemption fees | | | — | (b) |
| | | | |
Net asset value, end of period | | $ | 8.98 | |
| | | | |
Total Return (c) | | | (10.11 | )%(d) |
Ratios and Supplemental Data: | | | | |
Net assets, end of period (000) | | $ | 32,472 | |
Ratio of expenses to average net assets | | | 2.17 | %(e) |
Ratio of net investment loss to average net assets | | | (0.58 | )%(e) |
Portfolio turnover rate | | | 719.93 | %(d) |
| (a) | For the period June 27, 2011 (commencement of operations) to May 31, 2012. |
| (b) | Redemption fees resulted in less than $0.005 per share. |
| (c) | Total return in the above table represents the rate that the investor would have earned or lost on an investment in the Fund, assuming reinvestment of dividends, and excludes the maximum sales charge. |
See accompanying notes which are an integral part of these financial statements.
12
Longview Global Allocation Fund
Notes to the Financial Statements
May 31, 2012
NOTE 1. ORGANIZATION
The Longview Global Allocation Fund (the “Fund”) is an open-end non-diversified series of the Valued Advisers Trust (the “Trust”). The Trust is a management investment company established under the laws of Delaware by an Agreement and Declaration of Trust dated June 13, 2008 (the “Trust Agreement”). The Trust Agreement permits the Trustees to issue an unlimited number of shares of beneficial interest of separate series without par value. The Fund is one of a series of funds authorized by the Board of Trustees (the “Board”). The Fund’s investment adviser is Longview Capital Management, LLC (the “Adviser”). The investment objective of the Fund is long-term capital appreciation with capital preservation as a secondary objective.
The Fund’s prospectus provides a description of the Fund’s investment objective, policies and strategies, along with information on the class of shares currently being offered. The Fund currently offers one share class that has a maximum sales charge on purchases of 5.75% as a percentage of the original purchase price.
NOTE 2. SIGNIFICANT ACCOUNTING POLICIES
The following is a summary of significant accounting policies consistently followed by the Fund in the preparation of its financial statements.
Securities Valuation - All investments in securities are recorded at their estimated fair value as described in Note 3.
Federal Income Taxes - The Fund makes no provision for federal income or excise tax. The Fund intends to qualify each year as a regulated investment company (“RIC”) under subchapter M of the Internal Revenue Code of 1986, as amended, by complying with the requirements applicable to RICs and by distributing substantially all of its taxable income. The Fund also intends to distribute sufficient net investment income and net capital gains, if any, so that it will not be subject to excise tax on undistributed income and gains. If the required amount of net investment income or gains is not distributed, the Fund could incur a tax expense.
As of and during the period ended May 31, 2012, the Fund did not have a liability for any unrecognized tax benefits. The Fund recognizes interest and penalties, if any, related to unrecognized tax benefits as income tax expense in the statement of operations. During the period, the Fund did not incur any interest or penalties. The Fund is subject to examination by U.S. federal tax authorities for all tax years since inception.
Expenses - Expenses incurred by the Trust that do not relate to a specific fund of the Trust are allocated to the individual funds based on each fund’s relative net assets or another appropriate basis (as determined by the Board).
Security Transactions and Related Income - The Fund follows industry practice and records security transactions on the trade date. The first in, first out (“FIFO”) method is used for determining gains or losses for financial statements and income tax purposes. Dividend income is recorded on the ex-dividend date and interest income is recorded on an accrual basis. Discounts and premiums on securities purchased are amortized or accreted using the effective interest method. Withholding taxes on foreign dividends have been provided for in accordance with the Fund’s understanding of the applicable country’s tax rules and rates. The ability of issuers of debt securities held by the Fund to meet their obligations may be affected by economic and political developments in a specific country or region.
Dividends and Distributions - The Fund intends to distribute substantially all of its net investment income, if any, as dividends to its shareholders on at least an annual basis. The Fund intends to distribute its net realized long term capital gains and its net realized short term capital gains, if any, at least once a year. Dividends to shareholders, which are determined in accordance with income tax regulations, are recorded on the ex-dividend date. The treatment for financial reporting purposes of distributions made to shareholders during the period from net investment income or net realized capital gains may differ from their ultimate treatment for federal income tax purposes. These differences are caused primarily by differences in the timing of the recognition of certain components of income, expense or realized capital gains for federal income tax purposes. Where such differences are permanent in nature, they are reclassified in the components of the net assets based on their ultimate characterization for federal income tax purposes. Any such reclassifications will have no effect on net assets, results of operations or net asset values per share of the Fund.
13
Longview Global Allocation Fund
Notes to the Financial Statements - continued
May 31, 2012
NOTE 2. SIGNIFICANT ACCOUNTING POLICIES - continued
For the fiscal period ended May 31, 2012, the Fund made the following reclassifications to increase (decrease) the components of net assets:
| | | | | | | | | | |
| Paid in Capital | | | Accumulated Net
Investment Loss | | | Accumulated Net
Realized Loss | |
| $ | (18,122 | ) | | $ | 16,614 | | | $ | 1,508 | |
Redemption Fees - The Fund charges a 2.00% redemption fee for shares redeemed within 30 days. These fees are deducted from the redemption proceeds otherwise payable to the shareholder. The Fund will retain the fee charged as an increase in paid-in capital and such fees become part of the Fund’s daily Net Asset Value (“NAV”) calculation.
Contingent Deferred Sales Charge (“CDSC”) - There is no initial sales charge on purchases of shares of $1 million or more, or purchases by qualified retirement plans with at least 200 employees; however, a contingent deferred sales charge (“CDSC”) of 1.00% will be imposed if such shares are redeemed within eighteen (18) months of their purchase, based on the lower of the shares’ cost or current net asset value. Any shares acquired by reinvestment of distributions will be redeemed without a CDSC.
NOTE 3. SECURITIES VALUATION AND FAIR VALUE MEASUREMENTS
Fair value is defined as the price that a Fund would receive upon selling an investment in an orderly transaction to an independent buyer in the principal or most advantageous market of the investment. Generally Accepted Accounting Principles in the United States of America (“GAAP”) establish a three-tier hierarchy to maximize the use of observable market data and minimize the use of unobservable inputs and to establish classification of fair value measurements for disclosure purposes.
Inputs refer broadly to the assumptions that market participants would use in pricing the asset or liability, including assumptions about risk (the risk inherent in a particular valuation technique used to measure fair value such as pricing model and/or the risk inherent in the inputs to the valuation technique). Inputs may be observable or unobservable. Observable inputs are inputs that reflect the assumptions market participants would use in pricing the asset or liability developed based on market data obtained from sources independent of the reporting entity. Unobservable inputs are inputs that reflect the reporting entity’s own assumptions about the assumptions market participants would use in pricing the asset or liability developed based on the best information available in the circumstances.
Various inputs are used in determining the value of the Fund’s investments. These inputs are summarized in the three broad levels listed below.
| | • | | Level 1 - quoted prices in active markets for identical securities |
| | • | | Level 2 - other significant observable inputs (including, but not limited to, quoted prices for an identical security in an inactive market, quoted prices for similar securities, interest rates, prepayment speeds, credit risk, etc.) |
| | • | | Level 3 - significant unobservable inputs (including the Fund’s own assumptions in determining fair value of investments based on the best information available) |
The inputs used to measure fair value may fall into different levels of the fair value hierarchy. In such cases, for disclosure purposes, the level in the fair value hierarchy within which the fair value measurement falls in its entirety, is determined based on the lowest level input that is significant to the fair value measurement in its entirety.
14
Longview Global Allocation Fund
Notes to the Financial Statements - continued
May 31, 2012
NOTE 3. SECURITIES VALUATION AND FAIR VALUE MEASUREMENTS - continued
Equity securities, including exchange-traded funds and exchange-traded notes, are generally valued by using market quotations, but may be valued on the basis of prices furnished by a pricing service when the Fund believes such prices more accurately reflect the fair value of such securities. Securities that are traded on any stock exchange are generally valued by the pricing service at the last quoted sale price. Lacking a last sale price, an exchange traded security is generally valued by the pricing service at its last bid price. Securities traded in the NASDAQ over-the-counter market are generally valued by the pricing service at the NASDAQ Official Closing Price. When using the market quotations or close prices provided by the pricing service and when the market is considered active, the security will be classified as a Level 1 security. Sometimes, an equity security owned by the Fund will be valued by the pricing service with factors other than market quotations or when the market is considered inactive. When this happens, the security will be classified as a Level 2 security. When market quotations are not readily available, when the Fund determines that the market quotation or the price provided by the pricing service does not accurately reflect the current fair value, or when certain restricted or illiquid securities are being valued, such securities are valued as determined in good faith by the Fund, in conformity with guidelines adopted by and subject to review by the Board of Trustees (the “Board”). These securities will be categorized as Level 3 securities.
Investments in mutual funds, including money market mutual funds, are generally priced at the ending NAV provided by the service agent of the Fund. These securities will be categorized as Level 1 securities.
Short-term investments in fixed income securities, (those with maturities of less than 60 days when acquired, or which subsequently are within 60 days of maturity), are valued by using the amortized cost method of valuation, which the Board has determined will represent fair value. These securities will be classified as Level 2 securities.
In accordance with the Trust’s good faith pricing guidelines, the Fund is required to consider all appropriate factors relevant to the value of securities for which it has determined other pricing sources are not available or reliable as described above. No single standard exists for determining fair value, because fair value depends upon the circumstances of each individual case. As a general principle, the current fair value of an issue of securities being valued by the Fund would appear to be the amount which the owner might reasonably expect to receive for them upon their current sale. Methods which are in accordance with this principle may, for example, be based on (i) a multiple of earnings; (ii) a discount from market of a similar freely traded security (including a derivative security or a basket of securities traded on other markets, exchanges or among dealers); or (iii) yield to maturity with respect to debt issues, or a combination of these and other methods. Good faith pricing is permitted if, in the Fund’s opinion, the validity of market quotations appears to be questionable based on factors such as evidence of a thin market in the security based on a small number of quotations, a significant event occurs after the close of a market but before a Fund’s NAV calculation that may affect a security’s value, or the Fund is aware of any other data that calls into question the reliability of market quotations. Good faith pricing may also be used in instances when the bonds the Fund invests in may default or otherwise cease to have market quotations readily available. Any fair valuation pricing done outside the Fund’s approved pricing methods must be approved by the Pricing Committee of the Board.
The following is a summary of the inputs used to value the Fund’s investments as of May 31, 2012:
| | | | | | | | | | | | | | | | |
| | | Valuation Inputs | |
| Assets | | Level 1 - Quoted
Prices in Active
Markets | | | Level 2 - Other
Significant
Observable Inputs | | | Level 3 -
Significant
Unobservable
Inputs | | | Total | |
Exchange-Traded Funds | | $ | 14,732,767 | | | $ | — | | | $ | — | | | $ | 14,732,767 | |
Exchange-Traded Notes | | | 2,633,898 | | | | — | | | | — | | | | 2,633,898 | |
Money Market Securities | | | 11,326,093 | | | | — | | | | — | | | | 11,326,093 | |
Total | | $ | 28,692,758 | | | $ | — | | | $ | — | | | | $28,692,758 | |
15
Longview Global Allocation Fund
Notes to the Financial Statements - continued
May 31, 2012
NOTE 3. SECURITIES VALUATION AND FAIR VALUE MEASUREMENTS - continued
The Fund did not hold any investments at any time during the reporting period in which significant unobservable inputs were used in determining fair value; therefore, no reconciliation of Level 3 securities is included for this reporting period. The Fund did not hold any derivative instruments during the reporting period.
The Trust recognizes significant transfers between fair value hierarchy levels at the end of the reporting period. There were no significant transfers between any levels for the period ended May 31, 2012.
NOTE 4. FEES AND OTHER TRANSACTIONS WITH AFFILIATES
Under the terms of the management agreement (the “Agreement”), on behalf of the Fund, the Adviser manages the Fund’s investments subject to oversight of the Trustees. As compensation for its management services, the Fund is obligated to pay the Adviser a fee computed and accrued daily and paid monthly at an annual rate of 1.15% of the average daily net assets of the Fund. For the period from June 27, 2011 (commencement of operations) to May 31, 2012, the Adviser earned a fee of $300,761 from the Fund. At May 31, 2012, the Fund owed the Adviser $32,207 for advisory fees.
The Adviser has contractually agreed to waive or limit its fees and to assume other expenses of the Fund until September 30, 2013, so that Total Annual Fund Operating Expenses does not exceed 2.20%. This operating expense limitation does not apply to brokerage fees and commissions, borrowing costs (such as interest and dividend expenses on securities sold short), taxes, 12b-1 fees, other capital expenditures in accordance with GAAP, and extraordinary expenses and indirect expenses (such as “acquired funds fees and expenses”). There were no waived or reimbursed advisory fees for the period from June 27, 2011 (commencement of operations) to May 31, 2012.
The waiver and/or reimbursement by the Adviser with respect to the Fund is subject to repayment by the Fund within the three fiscal years following the fiscal year in which that particular waiver and/or reimbursement occurred, provided that the Fund is able to make the repayment without exceeding the expense limitations described above.
The Trust retains Huntington Asset Services, Inc. (“HASI”) to manage the Fund’s business affairs and provide the Fund with administrative services, including all regulatory reporting and necessary office equipment and personnel. For the period from June 27, 2011 (commencement of operations) to May 31, 2012, HASI earned fees of $34,791 for administrative services provided to the Fund. At May 31, 2012, HASI was owed $3,125 from the Fund for administrative services.
Certain officers of the Trust are members of management and/or employees of HASI. HASI is a wholly-owned subsidiary of Huntington Bancshares, Inc., the parent company of Unified Financial Securities, Inc. (the “Distributor”) and Huntington National Bank, the custodian of the Fund’s investments (the “Custodian”). For the period from June 27, 2011 (commencement of operations) to May 31, 2012, the Custodian earned fees of $10,728 for custody services provided to the Fund. At May 31, 2012, the Custodian was owed $1,031 from the Fund for custody services.
The Trust also retains HASI to act as the Fund’s transfer agent and to provide fund accounting services. For the period from June 27, 2011 (commencement of operations) to May 31, 2012, HASI earned fees of $35,978 for transfer agent services and reimbursement for out-of-pocket expenses incurred in providing transfer agent services to the Fund. At May 31, 2012, the Fund owed HASI $2,846 for transfer agent services and out-of-pocket expenses.
For the period from June 27, 2011 (commencement of operations) to May 31, 2012, HASI earned fees of $23,194 from the Fund for fund accounting services. At May 31, 2012, HASI was owed $2,083 from the Fund for fund accounting services.
The Fund has adopted a Distribution Plan (the “Plan”) pursuant to Rule 12b-1 under the 1940 Act. The Plan provides that the Fund will pay the Distributor and/or any registered securities dealer, financial institution or any other person (the “Recipient”) a shareholder servicing fee of 0.25% of the average daily net assets of the Fund in connection with the promotion and distribution of the Fund’s shares or the provision of personal services to shareholders, including, but not necessarily limited to, advertising, compensation to underwriters, dealers and selling personnel, the printing and mailing
16
Longview Global Allocation Fund
Notes to the Financial Statements - continued
May 31, 2012
NOTE 4. FEES AND OTHER TRANSACTIONS WITH AFFILIATES - continued
of prospectuses to other than current Fund shareholders, the printing and mailing of sales literature and servicing shareholder accounts. The Fund or Adviser may pay all or a portion of these fees to any Recipient who renders assistance in distributing or promoting the sale of shares, or who provides certain shareholder services, pursuant to a written agreement. The Plan is a compensation plan, which means that compensation is provided regardless of 12b-1 expenses actually incurred. It is anticipated that the Plan will benefit shareholders because an effective sales program typically is necessary in order for the Fund to reach and maintain a sufficient size to achieve efficiently its investment objectives and to realize economies of scale. For the period June 27, 2011 (commencement of operations) to May 31, 2012, the 12b-1 expense incurred by the Fund was $65,382. The Fund owed $7,002 for 12b-1 fees as of May 31, 2012.
Unified Financial Securities, Inc. (“Unified”) acts as the principal distributor of the Fund’s shares. An officer of the Trust is an officer of the Distributor and such person may be deemed to be an affiliate of the Distributor. For the period ended May 31, 2012, there was $5,851 in sales charges deducted from the proceeds of sales of capital shares. There were no CDSC fees deducted from the redemption of capital shares for the period ended May 31, 2012.
The Law Offices of John H. Lively and Associates, Inc., a member firm of The 1940 Act Law Group TM, serves as legal counsel to the Trust. John H. Lively, Interim Secretary of the Trust, is the owner of The Law Offices of John H. Lively & Associates, Inc., but he receives no direct compensation from the Trust or the Fund for serving as an officer of the Trust.
NOTE 5. PURCHASES AND SALES OF SECURITIES
For the period ended May 31, 2012, purchases and sales of investment securities, other than short-term investments and short-term U.S. government obligations, were as follows:
| | | | | | | | |
| | | Purchases | | | Sales | |
U.S. Government Obligations | | $ | — | | | $ | — | |
Other | | | 181,438,558 | | | | 161,785,060 | |
At May 31, 2012, the net unrealized appreciation (depreciation) of investments for tax purposes was as follows:
| | | | |
Gross Unrealized Appreciation | | $ | 701,615 | |
Gross Unrealized (Depreciation) | | | (1,405,993 | ) |
| | | | |
Net Unrealized Depreciation on Investments | | $ | (704,378 | ) |
| | | | |
At May 31, 2012, the aggregate cost of securities for federal income tax purposes was $29,397,136 for the Fund.
NOTE 6. ESTIMATES
The preparation of financial statements in conformity with GAAP requires management to make estimates and assumptions that affect the reported amounts of assets and liabilities and disclosure of contingent assets and liabilities at the date of the financial statements and the reported amounts of increases and decreases in net assets from operations during the reporting period. Actual results could differ from those estimates.
NOTE 7. BENEFICIAL OWNERSHIP
The beneficial ownership, either directly or indirectly, of 25% or more of the voting securities of a fund creates a presumption of control of a fund, under Section 2(a) (9) of the Investment Company Act of 1940. At May 31, 2012, FOLIOfn Investments, Inc. (“FOLIOfn”) owned, as record shareholder, 89.60% of the outstanding shares of the Longview Global Allocation Fund. The Trust does not know whether FOLIOfn or any of the underlying beneficial owners owned or controlled 25% or more of the voting securities of the Longview Global Allocation Fund.
17
Longview Global Allocation Fund
Notes to the Financial Statements - continued
May 31, 2012
NOTE 8. DISTRIBUTIONS TO SHAREHOLDERS
On December 23, 2011, an income distribution of $0.0088 per share was made to shareholders of record on December 22, 2011.
The tax characterization of distributions paid for the fiscal period ended May 31, 2012 was as follows:
| | | | |
| | | 2012 | |
Distributions paid from: | | | | |
Ordinary Income | | $ | 30,293 | |
| | | | |
| | $ | 30,293 | |
| | | | |
At May 31, 2012, the components of distributable earnings (accumulated losses) on a tax basis were as follows:
| | | | |
Capital loss carryforward | | $ | (1,577,851 | ) |
Unrealized depreciation | | | (704,378 | ) |
Other accumulated losses | | | (163,479 | ) |
| | | | |
Total | | $ | (2,445,708 | ) |
| | | | |
The difference between book basis and tax basis unrealized appreciation (depreciation) was attributable primarily to the tax deferral of losses on wash sales of $875,143. Qualified late year losses are certain capital and ordinary losses incurred after October 31 and December 31. For the taxable year ended May 31, 2012, the Fund plans to defer late year losses in the amount of $(163,479).
NOTE 9. CAPITAL LOSS CARRYFORWARD
At May 31, 2012, the Fund had available for federal tax purposes unused capital loss carryforwards of $1,577,851, which are available to offset future realized gains. To the extent that these carryforwards are used to offset future gains, it is probable that the amount offset will not be distributed to shareholders. Capital losses generated during the fiscal year ended May 31, 2012 will be subject to the provisions of the Regulated Investment Company Modernization Act of 2010. Capital losses generated in the current year are all short-term in character.
NOTE 10. SUBSEQUENT EVENTS
Management has evaluated events or transactions that may have occurred since May 31, 2012, that would merit recognition or disclosure in the financial statements. There were no items requiring adjustment of the financial statements or additional disclosure.
18
REPORT OF INDEPENDENT REGISTERED PUBLIC ACCOUNTING FIRM
To the Shareholders and Board of Trustees
Longview Global Allocation Fund
(Valued Advisers Trust)
We have audited the accompanying statement of assets and liabilities, including the schedule of investments, of Longview Global Allocation Fund (the “Fund”), a series of the Valued Advisers Trust, as of May 31, 2012, and the related related statements of operations, changes in net assets, and the financial highlights for the period June 27, 2011 (commencement of operations), through May 31, 2012. These financial statements and financial highlights are the responsibility of Fund management. Our responsibility is to express an opinion on these financial statements and financial highlights based on our audit.
We conducted our audit in accordance with the standards of the Public Company Accounting Oversight Board (United States). Those standards require that we plan and perform the audit to obtain reasonable assurance about whether the financial statements and financial highlights are free of material misstatement. An audit includes examining, on a test basis, evidence supporting the amounts and disclosures in the financial statements. Our procedures included confirmation of securities owned as of May 31, 2012, by
correspondence with the custodian and broker. An audit also includes assessing the accounting principles used and significant estimates made by management, as well as evaluating the overall financial statement presentation. We believe that our audit provides a reasonable basis for our opinion.
In our opinion, the financial statements and financial highlights referred to above present fairly, in all material respects, the financial position of the Longview Global Allocation Fund as of May 31, 2012, the results of its operations, changes in its net assets, and the financial highlights for the period June 27, 2011 (commencement of operations), through May 31, 2012, in conformity with accounting principles generally accepted in the United States of America.
COHEN FUND AUDIT SERVICES, LTD.
Westlake, Ohio
July 25, 2012
19
TRUSTEES AND OFFICERS (Unaudited)
The Board of Trustees supervises the business activities of the Trust. Each Trustee serves as a trustee until termination of the Trust unless the Trustee dies, resigns, retires or is removed.
The following tables provide information regarding the Trustees and Officers.
The following table provides information regarding each of the Independent Trustees.
| | |
Name, Address*, (Age), Position with
Trust**, Term of Position with Trust | | Principal Occupation During Past 5 Years and Other Directorships |
| Dr. Merwyn R. Vanderlind, 75, Independent Trustee, August 2008 to present. | | Retired; Consultant to Battelle Memorial Institute (International Science and Technology Research Enterprise) on business investments from 2001 to 2003; Formerly employed with Battelle Memorial Institute from 1966 to 2003 in various positions, including the Executive Vice President of Battelle Institute from 1991 to 2001, General Manager from 1985 to 1991, Director of the Battelle Industrial Technology Center (Geneva, Switzerland) from 1983 to 1985, and Practicing Researcher from 1966 to 1983. |
| |
| Ira Cohen, 53 Independent Trustee, June 2010 to present. | | Independent financial services consultant (Feb. 2005 - present); Senior Vice President, Dealer Services / Institutional Services, AIM Investment Services, Inc. (1992 – 2005). |
| * | The address for each trustee and officer is 2960 N. Meridian St., Suite 300, Indianapolis, IN 46208. ** The Trust consists of 10 series. |
The following table provides information regarding the Trustee who is considered an “interested person” of the Trust, as that term is defined under the 1940 Act. Based on the experience of the Trustee, the Trust concluded that the individual described below should serve as a Trustee.
| | |
Name, Address*, (Age), Position with
Trust**, Term of Position with Trust | | Principal Occupation During Past 5 Years and Other Directorships |
| R. Jeffrey Young, 47, Trustee and Chairman, June 2010 to present. | | Principal Executive Officer and President, Valued Advisers Trust since February 2010; Senior Vice President, Huntington Asset Services, Inc. since January 2010; Chief Executive Officer, Huntington Funds since February 2010; Chief Executive Officer, The Huntington Strategy Shares since November 2010; President and Chief Executive Officer, Dreman Contrarian Funds since March 2011; Trustee, Valued Advisers Trust, August 2008 to January 2010; Managing Director and Chief Operating Officer of Professional Planning Consultants 2007 to 2010; Co-Founder of Kinwood Group, LLC July 2007 to March 2008; President and Chief Executive Officer of The Coventry Group from 2000 to 2007; President and Chief Executive Officer of the STI Classic Funds from 2004 to 2007; Trustee of the Coventry Group from 1999 to 2005; and Senior Vice President of BISYS Fund Services / The Winsbury Company October 1993 to June 2007. |
| * | The address for each trustee and officer is 2960 N. Meridian St., Suite 300, Indianapolis, IN 46208. ** The Trust consists of 10 series. |
20
The following table provides information regarding the Officers of the Trust:
| | |
Name, Address*, (Age), Position with
Trust,** Term of Position with Trust | | Principal Occupation During Past 5 Years and Other Directorships |
| R. Jeffrey Young, 47, Principal Executive Officer and President, February 2010 to present. | | Trustee, Valued Advisers Trust since June 2010; Senior Vice President, Huntington Asset Services, Inc. since January 2010; Chief Executive Officer, Huntington Funds since February 2010; President and Chief Executive Officer, Dreman Contrarian Funds since March 2011; Trustee, Valued Advisers Trust, August 2008 to January 2010; Managing Director and Chief Operating Officer of Professional Planning Consultants 2007 to 2010; Co-Founder of Kinwood Group, LLC July 2007 to March 2008; President and Chief Executive Officer of The Coventry Group from 2000 to 2007; President and Chief Executive Officer of the STI Classic Funds from 2004 to 2007; Trustee of the Coventry Group from 1999 to 2005; and Senior Vice President of BISYS Fund Services/The Winsbury Company October 1993 to June 2007. |
| |
| John C. Swhear, 51, Chief Compliance Officer, AML Officer and Vice President, August 2008 to present. | | Vice President of Legal Administration and Compliance for Huntington Asset Services, Inc., the Trust’s administrator, since April 2007; Chief Compliance Officer of Unified Financial Securities, Inc., the Trust’s distributor, since May 2007; Senior Vice President of the Unified Series Trust since May 2007; Secretary of Huntington Funds since April 2010; President and Chief Executive Officer of Dreman Contrarian Funds from March 2010 to March 2011, and Vice President and Acting Chief Executive Officer, 2007 to March 2010 ; Employed in various positions with American United Life Insurance Company from 1983 to April 2007, including: Associate General Counsel, April 2007; Investment Advisor Chief Compliance Officer, June 2004 to April 2007; Assistant Secretary to the Board of Directors, December 2002 to April 2007; Chief Compliance Officer of OneAmerica Funds, Inc., June 2004 to April 2007; Chief Counsel and Secretary, OneAmerica Securities, Inc., December 2002 to April 2007. |
| |
| Carol J. Highsmith, 47, Vice President, August 2008 to present. | | Employed in various positions with Huntington Asset Services, Inc., the Trust’s administrator, since November of 1994; currently Vice President of Legal Administration. |
| |
| Matthew J. Miller, 36, Vice President, December 2011 to present. | | Employed in various positions with Huntington Asset Services, Inc., the Trust’s administrator, since July of 1998; currently Vice President of Relationship Management; Vice President of Huntington Funds since February 2010. |
| |
William J. Murphy, 49, Treasurer, December 2009 to present | | Manager of Fund Administration for Huntington Asset Services, Inc., the Trust’s administrator, since October 2007; Assistant Treasurer of Unified Series Trust from February 2008 to May 2011; Treasurer and Chief Financial Officer of Dreman Contrarian Funds from February 2008 to March 2011; Employed in various positions with American United Life Insurance Company from March 1987 to October 2007. |
| |
John H. Lively, 43, Interim Secretary, September 2011 to present. | | Attorney, The Law Offices of John H. Lively & Associates, Inc., March, 2010 to present; Secretary of Dividend Growth Trust, September 2010 to present; Partner, Husch Blackwell Sanders LLP (law firm), March, 2007 to February, 2010; Managing Attorney, Raymond James Financial (financial services), September, 2005 to March, 2007. |
| * | The address for each trustee and officer is 2960 N. Meridian St., Suite 300, Indianapolis, IN 46208. ** The Trust consists of 10 series. |
22
OTHER INFORMATION
The Fund’s Statement of Additional Information (“SAI”) includes additional information about the trustees and is available without charge, upon request. You may call toll-free at (877) 460-6423 to request a copy of the SAI or to make shareholder inquiries.
23
VALUED ADVISERS TRUST
PRIVACY POLICY
The following is a description of the policies of the Valued Advisers Trust (the “Trust”) regarding disclosure of nonpublic personal information that shareholders provide to a series of the Trust (each, a “Fund”) or that the Fund collects from other sources. In the event that a shareholder hold shares of a Fund through a broker-dealer or other financial intermediary, the privacy policy of the financial intermediary would govern how shareholder nonpublic personal information would be shared with nonaffiliated third parties.
Categories of Information A Fund May Collect. A Fund may collect the following nonpublic personal information about its shareholders:
| | • | | Information the Fund receives from a shareholder on applications or other forms, correspondence, or conversations (such as the shareholder’s name, address, phone number, social security number, and date of birth); and |
| | • | | Information about the shareholder’s transactions with the Fund, its affiliates, or others (such as the shareholder’s account number and balance, payment history, cost basis information, and other financial information). |
Categories of Information A Fund May Disclose. A Fund may not disclose any nonpublic personal information about its current or former shareholders to unaffiliated third parties, except as required or permitted by law. A Fund is permitted by law to disclose all of the information it collects, as described above, to its service providers (such as the Fund’s custodian, administrator, transfer agent, accountant and legal counsel) to process shareholder transactions and otherwise provide services to the shareholder.
Confidentiality and Security. Each Fund shall restrict access to shareholder nonpublic personal information to those persons who require such information to provide products or services to the shareholder. Each Fund shall maintain physical, electronic, and procedural safeguards that comply with federal standards to guard shareholder nonpublic personal information.
Disposal of Information. The Funds, through their transfer agent, have taken steps to reasonably ensure that the privacy of a shareholder’s nonpublic personal information is maintained at all times, including in connection with the disposal of information that is no longer required to be maintained by the Funds. Such steps shall include, whenever possible, shredding paper documents and records prior to disposal, requiring off-site storage vendors to shred documents maintained in such locations prior to disposal, and erasing and/or obliterating any data contained on electronic media in such a manner that the information can no longer be read or reconstructed.
24
PROXY VOTING
A description of the policies and procedures that the Fund uses to determine how to vote proxies relating to portfolio securities and information regarding how the Fund voted those proxies during the most recent twelve month period ended June 30, is available without charge upon request by (1) calling the Fund at (877) 460-6423 and (2) from Fund documents filed with the Securities and Exchange Commission (“SEC”) on the SEC’s website at www.sec.gov.
TRUSTEES
R. Jeffrey Young, Chairman
Dr. Merwyn R. Vanderlind
Ira Cohen
OFFICERS
R. Jeffrey Young, Principal Executive Officer and President
John C. Swhear, Chief Compliance Officer, AML Officer and Vice-President
Carol J. Highsmith, Vice President
Matthew J. Miller, Vice President
William J. Murphy, Principal Financial Officer and Treasurer John
H. Lively, Interim Secretary
INVESTMENT ADVISER
Longview Capital Management LLC
2 Mill Road, Suite 105
Wilmington, DE 19806
DISTRIBUTOR
Unified Financial Securities, Inc.
2960 North Meridian Street, Suite 300
Indianapolis, IN 46208
INDEPENDENT REGISTERED PUBLIC ACCOUNTING FIRM
Cohen Fund Audit Services, Ltd.
800 Westpoint Pkwy., Suite 1100
Westlake, OH 44145
LEGAL COUNSEL
The Law Offices of John H. Lively & Associates, Inc.,
A member firm of The 1940 Act Law Group TM
11300 Tomahawk Creek Parkway, Ste. 310
Leawood, KS 66224
CUSTODIAN
Huntington National Bank
41 S. High St.
Columbus, OH 43215
ADMINISTRATOR, TRANSFER AGENT AND FUND ACCOUNTANT
Huntington Asset Services, Inc.
2960 North Meridian Street, Suite 300
Indianapolis, IN 46208
This report is intended only for the information of shareholders or those who have received the Fund’s prospectus which contains information about the Fund’s management fee and expenses. Please read the prospectus carefully before investing.
Distributed by Unified Financial Securities, Inc.
Member FINRA/SIPC
25
To Shareholders of the LS Opportunity Fund,
Long Short Advisors launched the LS Opportunity Fund (LSOFX) on September 30, 2010 with the goal of delivering strong returns while also protecting capital with reduced volatility by taking both long (i.e., to profit from an increase in price) and short (i.e., to profit from a decline in price) positions in a portfolio of publicly-traded common stocks. Relying on a fundamental, research-driven process, the Fund strives to build a diversified portfolio with approximately 35-50 long positions and 35-50 short positions in at least
10 industries.
The Fund (LSOFX) was established by the advisory firm, Long Short Advisors, LLC. Independence Capital Asset Partners (ICAP), which is responsible for all day-to-day portfolio management, is the sub-advisor to the Fund. The Fund was established to offer access to the investment strategy of the sub-advisor in a mutual fund format.
Since the Fund’s inception, U.S. Equity markets have risen sharply with the S&P 500 Index (“S&P 500”) gaining 18.86%, while the long-short equity universe as defined by Morningstar* experienced more modest returns, having risen 1.22% during the same time period. The Fund, meanwhile, gained 3.12% (See Chart 1) over the same period.
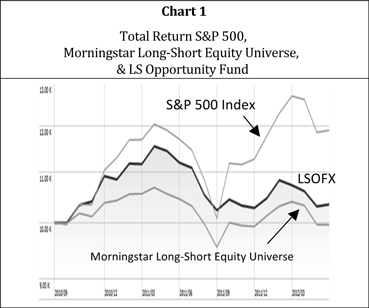
1
About Independence Capital Asset Partners (ICAP)
As the sub-advisor of a long-short equity strategy, ICAP focuses on performance and risk management. ICAP strives to do what a successful investment manager should do: deliver strong returns while protecting capital with reduced volatility. ICAP, founded in 2004, has an experienced investment team that seeks to always have “more good ideas than capital.” ICAP currently has $470 million in assets under management (05/31/2012), ten investment professionals, and fifteen total employees. ICAP manages fundamentally driven long-short equity portfolios across separate accounts, limited partnerships, and the Fund. ICAP’s focus on a strong operational and compliance culture allows the investment team to maintain a sole focus on investing. For more on ICAP, please visit our website at www.longshortadvisors.com.
The Investment Process
On the long side, the Fund invests primarily in companies whose fundamentals (e.g. growth prospects) combined with attractive valuations, indicate significant upside opportunity relative to downside risk. There will be an emphasis on companies able to generate and sustain high returns on capital, to self-finance growth, and to generate excess cash to enhance shareholder value. Attractive investments include: good franchises that are undergoing significant positive change and “emerging growth” companies with good fundamentals that are addressing unmet, “open-ended” business opportunities with innovative
products or services.
On the short side, the Fund takes positions in companies with weak or deteriorating fundamentals, which, combined with unattractive valuations, indicate significant downside risk. In addition, the Fund may use short positions in a “pair-trade” format (i.e. a strategy that matches a long position with a short position in two stocks in the same sector) to exploit valuation anomalies and dampen portfolio volatility.
The Fund generally reduces or eliminates a position if it (i) has reached an intrinsic value that reflects its current market value, (ii) has been revalued as new research uncovers challenges to assumptions underlying the investment case, or (iii) can be replaced in the portfolio by a better idea.
Management Market Review
From 06/01/2011 until 05/31/2012 (“Period”), a continued stream of modestly improving economic data, a slate of generally upbeat corporate earnings, and continued global monetary easing had pushed the U.S. equity market (as measured by the S&P 500 Index) to May 2008 levels. In fact, the first three months of 2012 actually represented the S&P 500’s best first-quarter performance since 1998.
2
As equity markets advance, it is important to stay mindful of the sustainability of the underlying fundamentals. From our perspective, we are attentive to corporate margins that may be at their cyclical peak. Any contraction in profits may pressure the equity market’s strength. We also remain sensitive to the possibility that the market, having been partially driven by liquidity, may be past the phase of maximum impact of the liquidity provided by the European banks and other Central banks around the world.
The Period ended on a cautious note as pessimism surrounding the strength of the U.S. economic recovery, European debt concerns, and China’s ability to orchestrate a soft landing came to the forefront. In the background, interest rates remained exceptionally accommodative, as central bankers appeared committed to inflating asset prices. Currencies were also remarkably stable despite the uncertainty surrounding the sustainability of the euro.
Management Discussion of Fund Performance
The Fund’s top five long positions at the end of the Period were Liberty Media, Davita, Vertex Pharmaceuticals, Qualcomm, and Williams Partners L.P, while top short concepts included positions in the Industrial and Consumer Discretionary sectors.
Detractors
Underweighting toward the Technology and Financial sectors and a relative overweighting toward the Energy sector contributed to the Fund’s underperformance versus the broad market during the first quarter of 2012. So, too, did the Fund’s short book, which was a detractor due to the strong performing stock market. In addition, two of the Fund’s large, long-term holdings - Williams Partners L.P. and Anadarko Petroleum - underperformed across the Period.
Williams Partners L.P. (WPZ), an integrated natural gas company that explores, produces, transports, sells, and processes natural gas and petroleum products, announced two large acquisitions and two stock offerings during the period that weighed heavy on the share price. The equity issuance was near-term dilutive, but the acquisitions will provide WPZ with up to five years of earnings and dividend growth. More importantly, WPZ’s assets are strategically important to the expansion of the North American natural gas market. While the stock’s near-term performance was disappointing, the long-term company story is still intact.
Anadarko (APC) explores, produces, transports, sells, and processes natural gas and petroleum products. While the company’s exploration success and exploration prospects are the envy of the natural gas industry, its share price languished this period as cyclical low prices overwhelmed the company’s positive developments. We still believe, however, that much value is yet to be harvested in the stock. With that in mind, we more aggressively hedged our exposure to U.S. natural gas by layering in a number of short positions in U.S.-based natural gas producers. This move has mitigated some of the more recent losses caused by the share price decline in APC.
3
Contributors
On the positive side, the Fund benefited from its positions in Healthcare, Education, Consumer Services, and Gaming, and Retail. Medivation (MDVN), a biopharmaceutical company focused on developing small molecule drugs for the treatment of disease, gained sharply during this period, as the company announced good results from its Phase III prostate cancer trials. The company’s post-chemotherapy drug, Enzalutamide, revealed additional data in early February demonstrating that it will be the best-in-class agent as a new treatment for advanced-stage prostate cancer. The data opened the potential for earlier stage prostate cancer treatment, which is a significantly greater opportunity. Although the position was reduced once the expected events were reflected in the market, we will remain alert should MDVN’s pre-chemotherapy compound gain traction.
Novo-Nordisk (NVO), a global leader in the treatment of diabetes, was purchased for the portfolio in September 2011. Strong results and excitement surrounding Degludec, Novo’s next-generation insulin, and Victoza, a best-in-class agent with the potential to treat obesity improved sentiment for the company. We reduced the position as NVO’s share price advanced sharply.
Conservative Net Exposure
As the spring arrived, the global economy began providing a weak backdrop for the financial markets. Developing economies felt a rising pressure to find a balance between growth and fiscal austerity. With economic momentum lacking and policy risks at the forefront, May saw a tremendous global equity sell off with the S&P 500 index having its worst monthly decline in two years. Although limiting the upside of the Fund in the early part of the Period, the Fund’s conservative net exposure along with a focus on companies that we believe would prosper in uncertain economic times proved fortuitous as the relative performance of the Fund held up well during the May equity sell off.
Management Outlook
We perceive three critical risks to the current investing environment: 1) the weakness of the U.S. economic recovery, 2) the continued fragility of the European Monetary Union, and 3) the slowdown of the Chinese economy.
Here at home, the recovery is the weakest in post-depression history. By current appearances, job growth is muted and unemployment will persist at abnormally high levels for a long time. After a series of stronger first-quarter economic reports, the weaker data we witnessed in April adds credence to the theory that the U.S. economy is stalling. We are tracking these data points closely in shaping the portfolio.
4
In Europe, long-term refinancing operations implemented during the Period seemingly postponed financial Armageddon by providing liquidity to the financial sector. Unfortunately, nothing was done to improve the spiraling debt, and Europe remains mired in a slow, economically depressed state. While we have seen a rolling turnover of governments across the continent, we believe it will take more than the revolving doors of politics to alter the inevitable slow death of the euro. Pressure will build, as austerity measures crimp growth, deficits continue to grow, and the emergency financial measures deplete. While the timing is uncertain, we expect another bout of turmoil in Europe.
China - the primary engine of world growth since 2004 - is attempting to address the excesses that have built up within the country’s economy, not least of which includes bubbles in housing and infrastructure, as it transforms itself from an export-led economy to a consumer-driven one. This transition has significant investment implications in our opinion and should present a number of interesting investment opportunities going forward.
All in, despite, and in some cases because of the macroeconomic risks, we have identified numerous investment opportunities from both a long and a short perspective. To that end, we plan to further deploy capital into a number of areas as we continually strive to make the Fund a success. We look forward to sharing more insights on these ideas in future communications.
Positioning the LS Opportunity Fund in a Portfolio
In an attempt to reduce equity market exposure, an investor can introduce short positions to a portfolio of long positions. The reduction is calculated by subtracting the percentage of short positions from the percentage of long positions. The difference is the percentage net exposure. The lower the percentage, the lower the investors exposure to the market. An investment in the S&P 500 would be said to have a net exposure of 100% as there are no short positions in the S&P 500. By adding a 30% short position to the S&P 500 investment, the investor would have reduced the market exposure and be said to have a net exposure of 70% (100% - 30% = 70%). As a long-short strategy, the Fund will have a total net exposure of less than 100%. Since inception, the Fund has had an average total net exposure (average of the month end values) of 50.4 %, with a net exposure range of 26.3% to 65.8% (See Chart 2). The May 31, 2012 month end net exposure was 33.4% (See Chart 3).
5
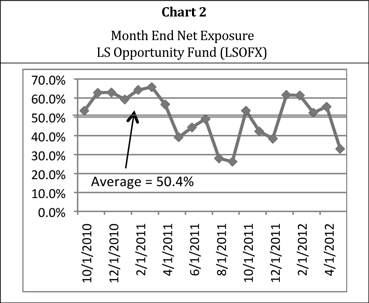
| | | | | | | | | | | | | | | | |
Chart 3 - Sector Exposures
(05/31/2012) | | Long | | | Short | | | Gross | | | Net | |
Consumer Discretionary | | | 27.96 | % | | | -9.96 | % | | | 37.92 | % | | | 18.00 | % |
Consumer Staples | | | 1.75 | % | | | -0.54 | % | | | 2.29 | % | | | 1.21 | % |
Energy | | | 8.78 | % | | | -3.59 | % | | | 12.37 | % | | | 5.19 | % |
Financials | | | 6.92 | % | | | -2.70 | % | | | 9.62 | % | | | 4.22 | % |
Health Care | | | 18.53 | % | | | -3.97 | % | | | 22.50 | % | | | 14.56 | % |
Industrials | | | 4.29 | % | | | -6.38 | % | | | 10.67 | % | | | -2.09 | % |
Information Technology | | | 9.00 | % | | | -4.93 | % | | | 13.93 | % | | | 4.07 | % |
Materials | | | 2.14 | % | | | -2.89 | % | | | 5.03 | % | | | -0.75 | % |
Unclassified | | | 1.92 | % | | | -12.85 | % | | | 14.77 | % | | | -10.93 | % |
Utilities | | | 0.00 | % | | | -0.10 | % | | | 0.10 | % | | | -0.10 | % |
Total | | | 81.29 | % | | | -47.91 | % | | | 129.20 | % | | | 33.38 | % |
6
Adding an investment with reduced net exposure does not necessarily produce diversification benefits. An investor may also want to review the standard deviation (a common measure of volatility), maximum drawdown, and correlation of the investment to the other investments in the portfolio. Over recent years, investor behavior has expanded from portfolio volatility analysis to include the analysis of the volatility of the underlying positions. As can be seen in Chart 4, the Fund offers approximately half the volatility (standard deviation) of the S&P 500 with a reduced maximum drawdown. Furthermore, the Fund has a reduced correlation to the S&P 500 while the Morningstar Long-Short Universe as a whole has a higher correlation to the S&P 500. Consequently, both an equity portfolio with only long positions and an equity portfolio with a long-short equity component may still benefit from the addition of the Fund.
| | | | | | | | | | | | | | | | |
Chart 4 - Risk Statistics
(05/31/2012) | | Standard
Deviation | | | Max
Drawdown | | | Beta
To S&P 500 | | | Correlation
to S&P 500 | |
LS Opportunity Fund (LSOFX) | | | 8.95 | % | | | -11.34 | % | | | 0.48 | | | | 0.82 | |
Morningstar L/S Universe | | | 7.65 | % | | | -9.82 | % | | | 0.50 | | | | 0.99 | |
S&P 500 | | | 15.09 | % | | | -16.26 | % | | | 1.00 | | | | 1.00 | |
Eating our Own Cooking
Long Short Advisors believes one of the greatest risk mitigation tools for any investment strategy is for the management team to be invested alongside their investors.
Employees, their families, and related entities of the Advisor; (Long Short Advisors) and the Sub-Advisor (Independence Capital Asset Partners), as of May 31, 2012, own 280,206 shares of the Fund.
Please refer to the Fund’s prospectus for a full description of the investment strategy and for more information about the Fund. You may obtain a current copy of the Fund’s prospectus by calling 1.877.366.6763.
Thank you for choosing the LS Opportunity Fund as a place to invest your assets. We appreciate your trust in us to protect and grow your capital.
“Don’t Time the Market, Invest in It”
7
The S&P 500 Index is a widely recognized, unmanaged index of common stock prices. The benchmark index may or may not hold substantially similar securities to those held by the Fund, and correlation may b e high or low between the Fund returns and that of the Index. The Index is not available for direct investment; therefore its performance does not reflect the expenses associated with management of an actual portfolio. The return for the Index includes gross dividends reinvested into the index. The Morningstar L/S Universe is a proprietary Morningstar category grouping of like strategies in a given category based on their portfolio statistics and compositions to help investors and investment professionals make meaningful comparisons between funds. The universe comparison is a grouping of investment strategies as categorized by Morningstar that may or may not hold substantially similar securities to those held by the Fund, and thus little correlation may exist between the Fund returns and that of the Index. The Universe is not available for direct investment. Standard Deviation - A measure of the dispersion of a set of data from its mean. Max Drawdown - The peak-to-trough decline during a specific record period of an investment. Beta - A measure of the volatility, or systematic risk, of a security or a portfolio in comparison to the market as a whole. Correlation - A statistical measure of how two securities move in relation to each other. Diversification does not ensure a profit or guarantee against loss.
8
Investment Results
Total Returns*
(For the fiscal year ended May 31, 2012)
| | | | | | | | |
| | | Average | |
| | | | | | Annual Return | |
| | | One Year | | | Since Inception
(September 30, 2010) | |
LS Opportunity Fund | | | -9.92 | % | | | 1.87 | % |
S&P 500® Index** | | | -0.43 | % | | | 10.91 | % |
Total annual operating expenses, as disclosed in the Fund’s prospectus dated September 30, 2011, were 3.76% of average daily net assets (2.50% after fee waivers and expense reimbursements by the Advisor.) Long Short Advisors, LLC (the “Advisor”) contractually has agreed to cap certain operating expenses of the fund until September 30, 2013. This operating expense limitation does not apply to interest, taxes, brokerage commissions, other expenditures which are capitalized in accordance with generally accepted accounting principles, other extraordinary expenses not incurred in the ordinary course of the Fund’s business, dividend expense on short sales, expenses incurred under a Rule 12b-1 plan of distribution, “acquired fund fees and expenses,” and expenses that the Fund has incurred but did not actually pay because of an expense offset arrangement.
The performance quoted represents past performance, which does not guarantee future results. The investment return and principal value of an investment will fluctuate so that an investor’s shares, when redeemed, may be worth more or less than their original cost. The returns shown do not reflect deduction of taxes that a shareholder would pay on Fund distributions or the redemption of Fund shares. The Fund’s investment objectives, risks, charges and expenses must be considered carefully before investing. Current performance of the Fund may be lower or higher than the performance quoted. Performance data current to the most recent month end may be obtained by calling 1-877-336-6763.
| * | Return figures reflect any change in price per share and assume the reinvestment of all distributions, if any. |
| ** | The S&P 500® Index is a widely recognized unmanaged index of equity prices and is representa- tive of a broader market and range of securities than is found in the Fund’s portfolio. The Index is an unmanaged benchmark that assumes reinvestment of all distributions and excludes the effect of taxes and fees. Individuals cannot invest directly in this Index; however, an individual can invest in exchange traded funds or other investment vehicles that attempt to track the performance of a benchmark index. |
The Fund’s investment objectives, risks, charges and expenses must be considered carefully before investing. The prospectus contains this and other important information about the investment company and may be obtained by calling 1-877-336-6763. Please read it carefully before investing.
The Fund is distributed by Unified Financial Securities, Inc., Member FINRA.
9
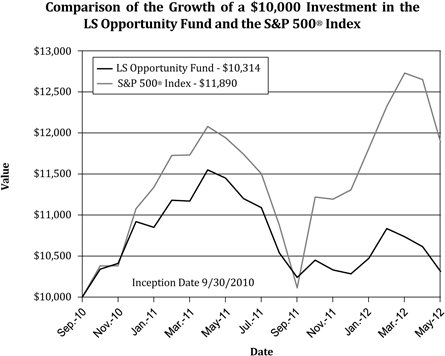
The chart above assumes an initial investment of $10,000 made on September 30, 2010 (commencement of Fund operations) and held through May 31, 2012. THE FUND’S RETURNS REPRESENT PAST PERFORMANCE AND DO NOT GUARANTEE FUTURE RESULTS. The returns shown do not reflect deduction of taxes that a shareholder would pay on the Fund’s distributions or the redemption of the Fund’s shares. Investment returns and principal values will fluctuate so that your shares, when redeemed, may be worth more or less than their original purchase price.
Current performance may be lower or higher than the performance data quoted. For more information on the Fund, and to obtain performance data current to the most recent month-end, or to request a prospectus, please call 1-877-336-6763. You should carefully consider the investment objectives, potential risks, management fees, and charges and expenses of the Fund before investing. The Fund’s prospectus contains this and other information about the Fund, and should be read carefully before investing.
The Fund is distributed by Unified Financial Securities, Inc., member FINRA.
10
FUND HOLDINGS - (Unaudited)
Sector Exposure (5/31/2012)
(Based on Net Assets)
| | | | | | | | | | | | | | | | |
| | | Long | | | Short | | | Gross | | | Net | |
Consumer Discretionary | | | 27.96 | % | | | -9.96 | % | | | 37.92 | % | | | 18.00 | % |
Consumer Staples | | | 1.75 | % | | | -0.54 | % | | | 2.29 | % | | | 1.21 | % |
Energy | | | 8.78 | % | | | -3.59 | % | | | 12.37 | % | | | 5.19 | % |
Financials | | | 6.92 | % | | | -2.70 | % | | | 9.62 | % | | | 4.22 | % |
Health Care | | | 18.53 | % | | | -3.97 | % | | | 22.50 | % | | | 14.56 | % |
Industrials | | | 4.29 | % | | | -6.38 | % | | | 10.67 | % | | | -2.09 | % |
Information Technology | | | 9.00 | % | | | -4.93 | % | | | 13.93 | % | | | 4.07 | % |
Materials | | | 2.14 | % | | | -2.89 | % | | | 5.03 | % | | | -0.75 | % |
Unclassified | | | 1.92 | % | | | -12.85 | % | | | 14.77 | % | | | -10.93 | % |
Utilities | | | 0.00 | % | | | -0.10 | % | | | 0.10 | % | | | -0.10 | % |
Total | | | 81.29 | % | | | -47.91 | % | | | 129.20 | % | | | 33.38 | % |
The LS Opportunity Fund seeks to generate long term capital appreciation by investing in both long and short positions within a portfolio consisting of primarily publicly-traded common stock, with less risk than that of the stock market in general.
AVAILABILITY OF PORTFOLIO SCHEDULE - (Unaudited)
The Fund files its complete schedule of portfolio holdings with the Securities and Exchange Commission (“SEC”) for the first and third quarters of each fiscal year on Form N-Q. The Fund’s Forms N-Q are available at the SEC’s website at www.sec.gov. The Forms N-Q may be reviewed and copied at the Public Reference Room in Washington DC. Information on the operation of the Public Reference Room may be obtained by calling 1-800-SEC-0330.
ABOUT THE FUND’S EXPENSES - (Unaudited)
As a shareholder of the Fund, you incur two types of costs: (1) transaction costs (such as short-term redemption fees); and (2) ongoing costs, including management fees; and other Fund expenses. This Example is intended to help you understand your ongoing costs (in dollars) of investing in the Fund and to compare these costs with the ongoing costs of investing in other mutual funds. The Example is based on an investment of $1,000 invested at the beginning of the period, and held for the entire period from December 1, 2011 to May 31, 2012.
11
Actual Expenses
The first line of the table below provides information about actual account values and actual expenses. You may use the information in this line, together with the amount you invested, to estimate the expenses that you paid over the period. Simply divide your account value by $1,000 (for example, an $8,600 account value divided by $1,000 = 8.60), then multiply the result by the number in the first line under the heading entitled “Expenses Paid During the Period” to estimate the expenses you paid on your account during this period.
Hypothetical Example for Comparison Purposes
The second line of the table below provides information about hypothetical account values and hypothetical expenses based on the Fund’s actual expense ratios and an assumed rate of return of 5% per year before expenses, which is not the Fund’s actual return. The hypothetical account values and expenses may not be used to estimate the actual ending account balance or expenses you paid for the period. You may use this information to compare the ongoing costs of investing in the Fund and other funds. To do so, compare this 5% hypothetical example with the 5% hypothetical examples that appear in the shareholder reports of the other funds.
Please note that the expenses shown in the table are meant to highlight your ongoing costs only and do not reflect any transactional costs, such as sales charges (loads), redemption fees, or exchange fees. Therefore, the second line of the table is useful in comparing ongoing costs only, and will not help you determine the relative total costs of owning different funds. In addition, if these transactional costs were included, your costs would have been higher.
| | | | | | | | | | | | |
LS Opportunity Fund | | Beginning
Account Value
December 1,
2011 | | | Ending
Account Value
May 31, 2012 | | | Expenses Paid
During
the Period
Ended
May 31, 2012* | |
Actual | | $ | 1,000.00 | | | $ | 998.43 | | | $ | 16.07 | |
Hypothetical**
(5% return before expenses) | | $ | 1,000.00 | | | $ | 1,008.91 | | | $ | 16.16 | |
| * | Expenses are equal to the Fund’s annualized expense ratio of 3.22%, multiplied by the average account value over the period, multiplied by 183/366. |
| ** | Assumes a 5% return before expenses. |
12
LS Opportunity Fund
Schedule of Investments
May 31, 2012
| | | | | | | | |
| | | Shares | | | Fair Value | |
Common Stocks - Long - Domestic - 76.52% | | | | | | | | |
Consumer Discretionary - 27.62% | | | | | | | | |
Amazon.com, Inc. (a) (b) | | | 2,748 | | | $ | 585,077 | |
Charter Communications, Inc. - Class A (a) (b) | | | 18,172 | | | | 1,139,384 | |
Deckers Outdoor Corp. (a) | | | 7,837 | | | | 436,286 | |
Family Dollar Stores, Inc. (b) | | | 11,312 | | | | 766,388 | |
Foot Locker, Inc | | | 16,700 | | | | 530,058 | |
Liberty Global, Inc. - Class A (a) (b) | | | 20,920 | | | | 966,504 | |
Liberty Interactive Corp. - Class A (a) (b) | | | 43,714 | | | | 732,647 | |
Liberty Media Corp. - Liberty Capital - Class A (a) (b) | | | 43,584 | | | | 3,694,616 | |
NIKE, Inc. - Class B (b) | | | 7,661 | | | | 828,767 | |
Ryland Group, Inc. / The (b) | | | 37,519 | | | | 838,925 | |
Sally Beauty Holdings, Inc. (a) (b) | | | 28,655 | | | | 757,352 | |
Starbucks Corp | | | 11,765 | | | | 645,781 | |
TripAdvisor, Inc. (a) (b) | | | 19,044 | | | | 816,607 | |
Wyndham Worldwide Corp. (b) | | | 15,250 | | | | 759,450 | |
| | | | | | | | |
| | | | | | | 13,497,842 | |
| | | | | | | | |
Consumer Staples - 1.75% | | | | | | | | |
Monster Beverage Corp. (a) | | | 11,777 | | | | 855,010 | |
| | | | | | | | |
Energy - 6. 27% | | | | | | | | |
Anadarko Petroleum Corp. (b) | | | 16,821 | | | | 1,026,081 | |
Atwood Oceanics, Inc. (a) | | | 5,883 | | | | 224,789 | |
Peabody Energy Corp | | | 15,674 | | | | 366,145 | |
Schlumberger Limited (b) | | | 18,908 | | | | 1,195,931 | |
Valero Energy Corp | | | 11,778 | | | | 248,516 | |
| | | | | | | | |
| | | | | | | 3,061,462 | |
| | | | | | | | |
Financials - 6.92% | | | | | | | | |
American International Group, Inc. (a) (b) | | | 30,149 | | | | 879,748 | |
Capital One Financial Corp. (b) | | | 19,600 | | | | 1,006,852 | |
JPMorgan Chase & Co | | | 7,837 | | | | 259,797 | |
Ocwen Financial Corp. (a) (b) | | | 58,883 | | | | 943,894 | |
Zillow, Inc. (a) | | | 7,380 | | | | 289,148 | |
| | | | | | | | |
| | | | | | | 3,379,439 | |
| | | | | | | | |
See accompanying notes which are an integral part of these financial statements.
13
LS Opportunity Fund
Schedule of Investments
May 31, 2012 - continued
| | | | | | | | |
| | | Shares | | | Fair Value | |
Common Stocks - Long - Domestic - 76.52% - continued | | | | | | | | |
Health Care - 18.53% | | | | | | | | |
ABIOMED, Inc. (a) | | | 1,139 | | | $ | 23,156 | |
Celgene Corp. (a) (b) | | | 10,728 | | | | 732,186 | |
Conceptus, Inc. (a) | | | 15,697 | | | | 264,337 | |
DaVita, Inc. (a) (b) | | | 22,911 | | | | 1,861,519 | |
Edwards Lifesciences Corp. (a) (b) | | | 11,774 | | | | 1,005,146 | |
Express Scripts Holding Company (a) (b) | | | 15,545 | | | | 811,294 | |
MAKO Surgical Corp. (a) | | | 7,850 | | | | 178,273 | |
Medivation, Inc. (a) (b) | | | 12,837 | | | | 1,081,260 | |
NuVasive, Inc. (a) | | | 34,209 | | | | 675,970 | |
Threshold Pharmaceuticals, Inc. (a) | | | 7,546 | | | | 55,312 | |
UnitedHealth Group, Inc. (b) | | | 15,345 | | | | 855,791 | |
Vertex Pharmaceuticals, Inc. (a) (b) | | | 25,128 | | | | 1,508,685 | |
| | | | | | | | |
| | | | | | | 9,052,929 | |
| | | | | | | | |
Industrials - 4.29% | | | | | | | | |
DigitalGlobe, Inc. (a) | | | 18,588 | | | | 300,382 | |
KBR, Inc. | | | 5,889 | | | | 149,993 | |
Owens Corning, Inc. (a) | | | 16,202 | | | | 499,994 | |
Spirit AeroSystems Holdings, Inc. - Class A (a) (b) | | | 23,488 | | | | 541,868 | |
Union Pacific Corp | | | 448 | | | | 49,907 | |
Verisk Analytics, Inc. - Class A (a) | | | 11,573 | | | | 554,347 | |
| | | | | | | | |
| | | | | | | 2,096,491 | |
| | | | | | | | |
Information Technology - 9.00% | | | | | | | | |
Apple, Inc. (a) (b) | | | 2,063 | | | | 1,191,857 | |
Audience, Inc. (a) | | | 11,928 | | | | 211,364 | |
MasterCard, Inc. - Class A (b) | | | 1,792 | | | | 728,466 | |
QUALCOMM, Inc. (b) | | | 21,820 | | | | 1,250,504 | |
Skyworks Solutions, Inc. (a) | | | 24,123 | | | | 647,944 | |
Tangoe, Inc. (a) | | | 19,045 | | | | 367,759 | |
| | | | | | | | |
| | | | | | | 4,397,894 | |
| | | | | | | | |
Materials - 2.14% | | | | | | | | |
Monsanto Company | | | 13,566 | | | | 1,047,295 | |
| | | | | | | | |
TOTAL COMMON STOCKS - LONG - DOMESTIC
(Cost $35,628,619) | | | | | | | 37,388,362 | |
| | | | | | | | |
See accompanying notes which are an integral part of these financial statements.
14
LS Opportunity Fund
Schedule of Investments
May 31, 2012 - continued
| | | | | | | | |
| | | Shares | | | Fair Value | |
Common Stocks - Long International - 0.34% | | | | | | | | |
Consumer Discretionary - 0.34% | | | | | | | | |
Imax Corp. (a) | | | 7,851 | | | $ | 166,755 | |
| | | | | | | | |
TOTAL COMMON STOCKS - LONG - INTERNATIONAL
(Cost $192,439) | | | | | | | 166,755 | |
| | | | | | | | |
TOTAL COMMON STOCKS - LONG - DOMESTIC & INTERNATIONAL
(Cost $35,821,058) | | | | | | | 37,555,117 | |
| | | | | | | | |
Master Limited Partnerships - 2.51% | | | | | | | | |
Williams Partners, L.P. (b) | | | 23,168 | | | | 1,225,587 | |
| | | | | | | | |
TOTAL MASTER LIMITED PARTNERSHIPS
(Cost $1,158,601) | | | | | | | 1,225,587 | |
| | | | | | | | |
Investment Companies - 1.92% | | | | | | | | |
SPDR Gold Trust (a) (b) | | | 6,200 | | | | 940,044 | |
| | | | | | | | |
TOTAL INVESTMENT COMPANIES
(Cost $941,290) | | | | | | | 940,044 | |
| | | | | | | | |
TOTAL INVESTMENTS-LONG
(Cost $37,920,949) - 81.29% | | | | | | | 39,720,748 | |
| | | | | | | | |
TOTAL INVESTMENTS-SHORT
(Proceeds Received $24,046,715) - (47.91%) | | | | | | | (23,409,831 | ) |
| | | | | | | | |
Cash & other assets less liabilities - 66.62% | | | | | | | 32,553,102 | |
| | | | | | | | |
TOTAL NET ASSETS - 100.00% | | | | | | $ | 48,864,019 | |
| | | | | | | | |
| (b) | All or a portion of this security is held for collateral for securities sold short. The total fair value of this collateral on May 31, 2012 is $28,808,663. |
See accompanying notes which are an integral part of these financial statements.
15
LS Opportunity Fund
Schedule of Securities Sold Short
May 31, 2012
| | | | | | | | |
| | | Shares | | | Fair Value | |
Securities Sold Short - Domestic - (32.43%) | | | | | | | | |
Consumer Discretionary - (9.23%) | | | | | | | | |
Apollo Group, Inc. - Class A | | | (6,047 | ) | | $ | (192,416 | ) |
Coach, Inc. | | | (8,173 | ) | | | (551,269 | ) |
Coinstar, Inc. | | | (10,197 | ) | | | (626,402 | ) |
Dish Network Corp. - Class A | | | (6,532 | ) | | | (183,157 | ) |
Dollar General Corp. | | | (5,254 | ) | | | (256,973 | ) |
Gannett Co., Inc. | | | (13,065 | ) | | | (170,629 | ) |
Goodyear Tire & Rubber Company / The | | | (6,538 | ) | | | (68,322 | ) |
Hibbett Sports, Inc. | | | (2,386 | ) | | | (133,688 | ) |
Home Depot, Inc. / The | | | (8,781 | ) | | | (433,255 | ) |
Kohl’s Corp. | | | (5,108 | ) | | | (234,049 | ) |
McDonald’s Corp. | | | (6,537 | ) | | | (584,016 | ) |
PVH Corp. | | | (2,613 | ) | | | (211,653 | ) |
Ralph Lauren Corp. | | | (3,265 | ) | | | (485,832 | ) |
Scholastic Corp. | | | (3,925 | ) | | | (105,779 | ) |
Staples, Inc. | | | (5,050 | ) | | | (66,357 | ) |
Strayer Education, Inc. | | | (1,374 | ) | | | (123,454 | ) |
Wolverine World Wide, Inc. | | | (1,910 | ) | | | (81,194 | ) |
| | | | | | | | |
| | | | | | | (4,508,445 | ) |
| | | | | | | | |
Consumer Staples - (0.54%) | | | | | | | | |
Estee Lauder Companies, Inc. / The - Class A | | | (4,905 | ) | | | (265,606 | ) |
| | | | | | | | |
Energy - (3.59%) | | | | | | | | |
Apache Corp. | | | (6,539 | ) | | | (532,144 | ) |
Dresser-Rand Group, Inc. | | | (1,611 | ) | | | (70,691 | ) |
EOG Resources, Inc. | | | (5,270 | ) | | | (523,311 | ) |
Murphy Oil Corp. | | | (6,532 | ) | | | (304,522 | ) |
Newfield Exploration Company | | | (10,878 | ) | | | (325,905 | ) |
| | | | | | | | |
| | | | | | | (1,756,573 | ) |
| | | | | | | | |
Financials - (2.22%) | | | | | | | | |
Franklin Resources, Inc. | | | (3,270 | ) | | | (349,203 | ) |
Goldman Sachs Group Inc. / The | | | (5,162 | ) | | | (494,003 | ) |
Moody’s Corp. | | | (6,539 | ) | | | (239,262 | ) |
| | | | | | | | |
| | | | | | | (1,082,468 | ) |
| | | | | | | | |
See accompanying notes which are an integral part of these financial statements.
16
LS Opportunity Fund
Schedule of Securities Sold Short
May 31, 2012 - continued
| | | | | | | | |
| | | Shares | | | Fair Value | |
Securities Sold Short - Domestic - (32.43%) - continued | | | | | | | | |
Health Care - (3.97%) | | | | | | | | |
CareFusion Corp. | | | (3,271 | ) | | $ | (79,289 | ) |
Cigna Corp. | | | (6,532 | ) | | | (286,820 | ) |
Eli Lilly & Company | | | (10,695 | ) | | | (437,960 | ) |
Magellan Health Services, Inc. | | | (5,077 | ) | | | (214,097 | ) |
Masimo Corp. | | | (1,635 | ) | | | (30,754 | ) |
PSS World Medical, Inc. | | | (4,907 | ) | | | (99,269 | ) |
Quest Diagnostics, Inc. | | | (11,317 | ) | | | (643,937 | ) |
STERIS Corp. | | | (4,890 | ) | | | (146,015 | ) |
| | | | | | | | |
| | | | | | | (1,938,141 | ) |
| | | | | | | | |
Industrials - (5.93%) | | | | | | | | |
ACCO Brands Corp. | | | (2,671 | ) | | | (24,359 | ) |
Corporate Executive Board Company / The | | | (3,946 | ) | | | (143,398 | ) |
Emerson Electric Co. | | | (11,003 | ) | | | (514,610 | ) |
FTI Consulting, Inc. | | | (9,839 | ) | | | (310,617 | ) |
General Dynamics Corp. | | | (2,615 | ) | | | (167,386 | ) |
Harsco Corp. | | | (3,979 | ) | | | (79,978 | ) |
Rockwell Collins, Inc. | | | (4,905 | ) | | | (247,065 | ) |
Stericycle, Inc. | | | (4,491 | ) | | | (391,885 | ) |
United Stationers, Inc. | | | (3,898 | ) | | | (98,425 | ) |
United Technologies Corp. | | | (9,543 | ) | | | (707,232 | ) |
Waste Management, Inc. | | | (6,538 | ) | | | (212,093 | ) |
| | | | | | | | |
| | | | | | | (2,897,048) | |
| | | | | | | | |
Information Technology - (4.74%) | | | | | | | | |
Avnet, Inc. | | | (3,266 | ) | | | (99,580 | ) |
Cisco Systems, Inc. | | | (16,356 | ) | | | (267,093 | ) |
EMC Corp. | | | (6,444 | ) | | | (153,689 | ) |
Exlservice Holdings, Inc. | | | (6,532 | ) | | | (141,548 | ) |
F5 Networks, Inc. | | | (4,906 | ) | | | (507,673 | ) |
Hewlett-Packard Company | | | (3,121 | ) | | | (70,784 | ) |
International Business Machines Corp. (IBM) | | | (3,192 | ) | | | (615,737 | ) |
Jive Software, Inc. | | | (5,148 | ) | | | (86,229 | ) |
ManTech International Corp. - Class A | | | (5,238 | ) | | | (114,188 | ) |
Rovi Corp. | | | (6,532 | ) | | | (159,577 | ) |
Western Digital Corp. | | | (3,265 | ) | | | (102,488 | ) |
| | | | | | | | |
| | | | | | | (2,318,586 | ) |
| | | | | | | | |
See accompanying notes which are an integral part of these financial statements.
17
LS Opportunity Fund
Schedule of Securities Sold Short
May 31, 2012 - continued
| | | | | | | | |
| | | Shares | | | Fair Value | |
Securities Sold Short - Domestic - (32.43%) - continued | | | | | | | | |
Materials - (2.11%) | | | | | | | | |
Commercial Metals Company | | | (6,532 | ) | | $ | (76,294 | ) |
Ecolab, Inc. | | | (4,933 | ) | | | (311,815 | ) |
Freeport-McMoRan Copper & Gold, Inc. | | | (13,061 | ) | | | (418,474 | ) |
MeadWestvaco Corp. | | | (8,097 | ) | | | (222,668 | ) |
| | | | | | | | |
| | | | | | | (1,029,251 | ) |
| | | | | | | | |
Utilities - (0.10%) | | | | | | | | |
WGL Holdings, Inc. | | | (1,306 | ) | | | (50,869 | ) |
| | | | | | | | |
TOTAL SECURITIES SOLD SHORT-DOMESTIC (Proceeds Received $16,627,658) | | | | | | | (15,846,987 | ) |
| | | | | | | | |
See accompanying notes which are an integral part of these financial statements.
18
LS Opportunity Fund
Schedule of Securities Sold Short
May 31, 2012 - continued
| | | | | | | | |
| | | Shares | | | Fair Value | |
Securities Sold Short - International - (2.63%) | | | | | | | | |
Consumer Discretionary - (0.73%) | | | | | | | | |
Autoliv, Inc. | | | (6,123 | ) | | $ | (353,971 | ) |
| | | | | | | | |
Financials - (0.48%) | | | | | | | | |
Deutsche Bank AG | | | (6,535 | ) | | | (235,129 | ) |
| | | | | | | | |
Industrials - (0.45%) | | | | | | | | |
Canadian Pacific Railway Limited | | | (3,009 | ) | | | (221,131 | ) |
| | | | | | | | |
Information Technology - (0.19%) | | | | | | | | |
Accenture PLC - Class A | | | (1,644 | ) | | | (93,872 | ) |
| | | | | | | | |
Materials - (0.78%) | | | | | | | | |
Syngenta AG(a) | | | (3,222 | ) | | | (207,207 | ) |
Vale SA(a) | | | (9,389 | ) | | | (171,913 | ) |
| | | | | | | | |
| | | | | | | (379,120 | ) |
| | | | | | | | |
TOTAL SECURITIES SOLD SHORT - INTERNATIONAL
(Proceeds Received $1,396,680) | | | | | | | (1,283,223 | ) |
| | | | | | | | |
TOTAL SECURITIES SOLD SHORT - DOMESTIC & INTERNATIONAL
(Proceeds Received $18,024,338) | | | | | | | (17,130,210 | ) |
| | | | | | | | |
Investment Companies - (12.85%) | | | | | | | | |
iShares Barclays 20+ Year Treasury Bond Fund | | | (4,704 | ) | | | (600,230 | ) |
Powershares QQQ Trust, Series 1 | | | (20,372 | ) | | | (1,264,286 | ) |
SPDR Dow Jones Industrial Average ETF Trust | | | (12,111 | ) | | | (1,498,131 | ) |
SPDR S&P 500 ETF Trust | | | (22,184 | ) | | | (2,916,974 | ) |
| | | | | | | | |
TOTAL INVESTMENT COMPANIES
(Proceeds Received - $6,022,377) | | | | | | | (6,279,621 | ) |
| | | | | | | | |
TOTAL SECURITIES SOLD SHORT - DOMESTIC, INTERNATIONAL, & INVESTMENT COMPANIES
(PROCEEDS RECEIVED $24,046,715) - (47.91%) | | | | | | $ | (23,409,831 | ) |
| | | | | | | | |
| (a) | American Depositary Receipt. |
See accompanying notes which are an integral part of these financial statements.
19
LS Opportunity Fund
Statement of Assets and Liabilities
May 31, 2012
| | | | |
Assets | | | | |
Investments in securities, at value (cost $37,920,949) | | $ | 39,720,748 | |
Cash | | | 33,338,084 | |
Receivable for investments sold | | | 916,905 | |
Receivable for Fund shares purchased | | | 150,000 | |
Prepaid expenses | | | 16,345 | |
Dividends receivable | | | 22,134 | |
Tax reclaims receivable (Cost $2,604) | | | 2,576 | |
| | | | |
Total assets | | | 74,166,792 | |
| | | | |
Liabilities | | | | |
Investment securities sold short, at value (proceeds $24,046,715) | | | 23,409,831 | |
Payable to Advisor (a) | | | 89,471 | |
Payable for investments purchased | | | 1,651,755 | |
Payable for Fund shares redeemed | | | 87,483 | |
Dividend expense payable on short positions | | | 33,799 | |
Payable to administrator, fund accountant and transfer agent (a) | | | 12,193 | |
Payable to trustees and officers | | | 1,438 | |
Payable to custodian | | | 4,852 | |
Other accrued expenses | | | 11,951 | |
| | | | |
Total liabilities | | | 25,302,773 | |
| | | | |
Net Assets | | $ | 48,864,019 | |
| | | | |
Net Assets consist of: | | | | |
Paid in capital | | $ | 50,605,293 | |
Undistributed net investment income (loss) | | | (344,407 | ) |
Accumulated net realized gain (loss) | | | (3,833,522 | ) |
Net unrealized appreciation (depreciation) on: | | | | |
Investment securities | | | 2,436,683 | |
Foreign currency | | | (28 | ) |
| | | | |
Net Assets | | $ | 48,864,019 | |
| | | | |
Shares outstanding (unlimited number of shares issued and authorized; no par value) | | | 4,748,281 | |
| | | | |
Net asset value and offering price per share | | $ | 10.29 | |
| | | | |
Minimum redemption price per share (b) (NAV * 98%) | | $ | 10.08 | |
| | | | |
| (a) | See Note 4 in the Notes to the Financial Statements. |
| (b) | The redemption price per share reflects a redemption fee of 2.00% on shares redeemed within 60 calendar days of purchase. |
See accompanying notes which are an integral part of these financial statements.
20
LS Opportunity Fund
Statement of Operations
For the fiscal year ended May 31, 2012
| | | | |
Investment Income | | | | |
Dividend income (net of withholding tax $3,133) | | $ | 403,450 | |
| | | | |
Total Income | | | 403,450 | |
| | | | |
Expenses | | | | |
Investment Advisor fee (a) | | | 729,741 | |
Custodian expenses (a) | | | 48,268 | |
Fund accounting expenses (a) | | | 46,718 | |
Transfer agent expenses (a) | | | 42,209 | |
Administration expenses (a) | | | 40,082 | |
Registration expenses | | | 29,151 | |
Legal expenses | | | 17,450 | |
Audit expenses | | | 15,000 | |
Report printing expense | | | 10,367 | |
Trustee expenses | | | 7,306 | |
Insurance expense | | | 3,934 | |
Pricing expenses | | | 3,914 | |
Offering costs | | | 3,839 | |
24f-2 expense | | | 3,427 | |
Miscellaneous expenses | | | 2,750 | |
Other expense - short sale & interest expense | | | 50,162 | |
Dividend expense on securities sold short | | | 224,072 | |
| | | | |
Total Expenses | | | 1,278,390 | |
Fees recouped by the Advisor (a) | | | 39,805 | |
| | | | |
Net operating expenses | | | 1,318,195 | |
| | | | |
Net Investment Loss | | | (914,745 | ) |
| | | | |
See accompanying notes which are an integral part of these financial statements.
21
LS Opportunity Fund
Statement of Operations
For the fiscal year ended May 31, 2012 - continued
| | | | |
Realized & Unrealized Gain (Loss) | | | | |
Net realized gain (loss) on: | | | | |
Investment securities | | $ | (2,859,579 | ) |
Short securities | | | (752,592 | ) |
Foreign currency | | | 1,754 | |
Change in unrealized appreciation (depreciation) on: | | | | |
Investment securities | | | (37,190 | ) |
Short securities | | | 1,021,485 | |
Foreign currency | | | (33 | ) |
| | | | |
Net realized and unrealized gain (loss) on investments and foreign currency | | | (2,626,155 | ) |
| | | | |
Net increase (decrease) in net assets resulting from operations | | $ | (3,540,900 | ) |
| | | | |
| (a) | See Note 4 in the Notes to the Financial Statements. |
See accompanying notes which are an integral part of these financial statements.
22
LS Opportunity Fund
Statements of Changes In Net Assets
| | | | | | | | |
| | | For the Fiscal
Year Ended
May 31, 2012 | | | For the
Period Ended
May 31, 2011(a) | |
Operations | | | | | | | | |
Net investment loss | | $ | (914,745 | ) | | $ | (204,286 | ) |
Net realized gain (loss) on investment securities, short securities, and foreign currency | | | (3,610,417 | ) | | | 208,652 | |
Change in unrealized appreciation on investments, short securities, and foreign currency | | | 984,262 | | | | 1,452,393 | |
| | | | | | | | |
Net increase (decrease) in net assets resulting from operations | | | (3,540,900 | ) | | | 1,456,759 | |
| | | | | | | | |
Distributions | | | | | | | | |
From net realized gain | | | (104,580 | ) | | | — | |
| | | | | | | | |
Total distributions | | | (104,580 | ) | | | — | |
| | | | | | | | |
Capital Share Transactions | | | | | | | | |
Proceeds from shares sold | | | 41,955,077 | | | | 19,607,202 | |
Reinvestment of distributions | | | 102,860 | | | | — | |
Amount paid for shares redeemed | | | (9,923,887 | ) | | | (692,036 | ) |
Proceeds from redemption fees collected | | | 340 | | | | 3,184 | |
| | | | | | | | |
Net increase in net assets resulting from share transactions | | | 32,134,390 | | | | 18,918,350 | |
| | | | | | | | |
Total Increase in Net Assets | | | 28,488,910 | | | | 20,375,109 | |
| | | | | | | | |
Net Assets | | | | | | | | |
Beginning of period | | | 20,375,109 | | | | — | |
| | | | | | | | |
End of period | | $ | 48,864,019 | | | $ | 20,375,109 | |
| | | | | | | | |
Undistributed net investment income (loss) included in net assets at end of period | | $ | (344,407 | ) | | $ | 8,055 | |
| | | | | | | | |
Capital Share Transactions | | | | | | | | |
Shares sold | | | 3,900,659 | | | | 1,842,851 | |
Shares issued in reinvestment of distributions | | | 10,045 | | | | — | |
Shares redeemed | | | (942,353 | ) | | | (62,921 | ) |
| | | | | | | | |
Net increase from capital share transactions | | | 2,968,351 | | | | 1,779,930 | |
| | | | | | | | |
| (a) | For the period September 30, 2010 (Commencement of Operations) to May 31, 2011. |
See accompanying notes which are an integral part of these financial statements.
23
LS Opportunity Fund
Financial Highlights
(For a share outstanding during each period)
| | | | | | | | |
| | | For the Fiscal
Year Ended
May 31, 2012 | | | For the
Period Ended
May 31, 2011 (a) | |
Selected Per Share Data | | | | | | | | |
Net asset value, beginning of period | | $ | 11.45 | | | $ | 10.00 | |
| | | | | | | | |
Income from investment operations: | | | | | | | | |
Net investment income (loss) (b) | | | (0.23 | ) | | | (0.17 | ) |
Net realized and unrealized gain (loss) | | | (0.91 | ) | | | 1.62 | |
| | | | | | | | |
Total from investment operations | | | (1.14 | ) | | | 1.45 | |
| | | | | | | | |
Less Distributions to Shareholders: | | | | | | | | |
From net realized gain | | | (0.02 | ) | | | — | |
| | | | | | | | |
Redemption Fees (c) | | | — | | | | — | |
| | | | | | | | |
Net asset value, end of period | | $ | 10.29 | | | $ | 11.45 | |
| | | | | | | | |
Total Return (d)(e) | | | (9.92 | )% | | | 14.50 | %(f) |
Ratios and Supplemental Data | | | | | | | | |
Net assets, end of period (000) | | $ | 48,864 | | | $ | 20,375 | |
Ratio of expenses to average net assets | | | 3.16 | %(h) | | | 2.99 | %(g)(h) |
Ratio of expenses to average net assets before waiver & reimbursement/recoupment by Advisor | | | 3.06 | %(h) | | | 4.25 | %(g)(h) |
Ratio of net investment loss to average net assets | | | (2.19 | )% | | | (2.25 | )%(g) |
Portfolio turnover rate | | | 444.62 | % | | | 199.48 | %(f) |
| (a) | For the period September 30, 2010 (Commencement of Operations) through May 31, 2011. |
| (b) | Per share net investment loss has been calculated using the average shares method. |
| (c) | Amount represents less than $0.005 per share. |
| (d) | Total return in the above table represents the rate that the investor would have earned or lost on an investment in the Fund, assuming reinvestment of dividends. |
| (e) | Shareholders redeeming shares held less than sixty days have a lower total return due to the effect of the 2% redemption fee. |
| (h) | Includes dividend and interest expense of 0.66% for 2012 and 0.49% for 2011. |
See accompanying notes which are an integral part of these financial statements.
24
LS Opportunity Fund
Notes to the Financial Statements
May 31, 2012
NOTE 1. ORGANIZATION
The LS Opportunity Fund (the “Fund”) is an open-end, non-diversified series of the Valued Advisers Trust (the “Trust”). The Trust is a management investment company established under the laws of Delaware by an Agreement and Declaration of Trust dated June 13, 2008 (the “Trust Agreement”). The Trust Agreement permits the Trustees to issue an unlimited number of shares of beneficial interest of separate series without par value. The Fund is one of a series of funds authorized by the Board of Trustees (the “Board”). The Fund’s investment Advisor is Long Short Advisors, LLC (the “Advisor”). The Advisor has retained Independence Capital Asset Partners, LLC (the “Sub-Advisor”) to serve as Sub-Advisor to provide portfolio management and related services to the Fund. The Sub-Advisor receives a fee from the Advisor (not the Fund) for these services. The investment objective of the Fund is to generate long term capital appreciation by investing in both long and short positions within a portfolio consisting of primarily publicly-traded common stock, with less risk than that of the stock market in general.
NOTE 2. SIGNIFICANT ACCOUNTING POLICIES
The following is a summary of significant accounting policies followed by the Fund in the preparation of its financial statements.
Securities Valuation - All investments in securities are recorded at their estimated fair value as described in Note 3.
Federal Income Taxes - The Fund makes no provision for federal income or excise tax. The Fund intends to qualify each year as a “regulated investment company” (“RIC”) under subchapter M of the Internal Revenue Code of 1986, as amended, by complying with the requirements applicable to RICs and by distributing substantially all of its taxable income. The Fund also intends to distribute sufficient net investment income and net capital gains, if any, so that it will not be subject to excise tax on undistributed income and gains. If the required amount of net investment income or gains is not distributed, the Fund could incur a tax expense.
As of and during the fiscal year ended May 31, 2012, the Fund did not have a liability for any unrecognized tax benefits. The Fund recognizes interest and penalties, if any, related to unrecognized tax benefits as income tax expense in the Statement of Operations. During the year, the Fund did not incur any interest or penalties. The Fund is subject to examination by U.S. federal tax authorities for all open tax years.
Expenses - Expenses incurred by the Trust that do not relate to a specific fund of the Trust are allocated to the individual funds based on each fund’s relative net assets or other appropriate basis (as determined by the Board).
25
LS Opportunity Fund
Notes to the Financial Statements - continued
May 31, 2012
NOTE 2. SIGNIFICANT ACCOUNTING POLICIES - continued
Security Transactions and Related Income - The Fund follows industry practice and records security transactions on the trade date. The Last In, First Out (“LIFO”) method is used for determining gains or losses for financial statements and income tax purposes. Dividend income is recorded on the ex-dividend date and interest income is recorded on an accrual basis. Distributions from Limited Partnerships are recognized on the ex-date. Income or loss from Limited Partnerships is reclassified in the components of net assets upon receipt of K-1’s. Discounts and premiums on securities purchased are amortized or accreted using the effective interest method. Withholding taxes on foreign dividends have been provided for in accordance with the Fund’s understanding of the applicable country’s tax rules and rates.
Redemption Fees - The Fund charges a 2.00% redemption fee for shares redeemed within 60 days. These fees are deducted from the redemption proceeds otherwise payable to the shareholder. The Fund will retain the fee charged as an increase in paid-in capital and such fees become part of the Fund’s daily NAV calculation.
Foreign Currency Translations - Foreign currency amounts are translated into U.S. dollars as follows: (i) assets and liabilities at the rate of exchange at the end of the respective period; and (ii) purchases and sales of securities and income and expenses at the rate of exchange prevailing on the dates of such transactions. The portion of the results of operations arising from changes in the exchange rates and the portion due to fluctuations arising from changes in the market prices of securities are not isolated. Such fluctuations are included with the net realized and unrealized gain or loss on investments.
The Fund may enter into transactions to purchase or sell foreign currencies to protect the U.S. dollar value of its underlying portfolio securities against the effect of possible adverse movements in foreign exchange rates. Principal risks associated with such transactions include the movement in value of the foreign currency relative to the U.S. dollar and the ability of the counterparty to perform. Fluctuations in the value of such forward currency transactions are recorded daily as unrealized gain or loss; realized gain or loss includes net gain or loss on transactions that have terminated by settlement or by a fund entering into offsetting commitments. Reported net realized foreign exchange gains or losses arise from sales of foreign currencies, currency gains or losses realized between the trade and settlement dates on securities transactions, and the difference between the amounts of dividends, interest, and foreign withholding taxes recorded on the company’s books and the U.S. dollar equivalent of the amounts actually received or paid. These instruments involve market risk, credit risk, or both kinds of risks, in excess of the amount recognized in the Statement of Assets and Liabilities. Risks arise from the possible inability of counterparties to meet the terms of their contracts and from movement in currency and securities values and interest rates.
26
LS Opportunity Fund
Notes to the Financial Statements - continued
May 31, 2012
NOTE 2. SIGNIFICANT ACCOUNTING POLICIES - continued
Dividends and Distributions - The Fund intends to distribute substantially all of its net investment income, net realized long-term capital gains and its net realized short-term capital gains, if any, to its shareholders on at least an annual basis. Dividends to shareholders, which are determined in accordance with income tax regulations, are recorded on the ex-dividend date. The treatment for financial reporting purposes of distributions made to shareholders during the year from net investment income or net realized capital gains may differ from their ultimate treatment for federal income tax purposes. These differences are caused primarily by differences in the timing of the recognition of certain components of income, expense or realized capital gain for federal income tax purposes. Where such differences are permanent in nature, they are reclassified in the components of net assets based on their ultimate characterization for federal income tax purposes. Any such reclassifications will have no effect on net assets, results of operations or net asset value per share of the Fund. For the year ended May 31, 2012, the Fund made the following reclassifications to increase (decrease) the components of net assets:
| | | | | | | | | | | | |
| | | Paid in
Capital | | | Accumulated
Undistributed
Net Investment
Income | | | Accumulated
Net Realized
Loss from
Investments | |
LS Opportunity Fund | | $ | (439,702 | ) | | $ | 562,283 | | | $ | (122,581 | ) |
Short Sales - The Fund may make short sales as part of its overall portfolio management strategies or to offset a potential decline in value of a security. The Fund may engage in short sales with respect to various types of securities, including Exchange Traded Funds (ETFs). A short sale involves the sale of a security that is borrowed from a broker or other institution to complete the sale. The Fund may engage in short sales with respect to securities it owns, as well as securities that it does not own. Short sales expose the Fund to the risk that it will be required to acquire, convert or exchange securities to replace the borrowed securities (also known as “covering” the short position) at a time when the securities sold short have appreciated in value, thus resulting in a loss to the Fund. The Fund’s investment performance may also suffer if the Fund is required to close out a short position earlier than it had intended. The Fund must segregate assets determined to be liquid in accordance with procedures established by the Board of Trustees, or otherwise cover its position in a permissible manner. The Fund will be required to pledge its liquid assets to the broker in order to secure its performance on short sales. As a result, the assets pledged may not be available to meet the Fund’s needs for immediate cash or other liquidity. In addition, the Fund may be subject to expenses related to short sales that are not typically associated with investing in securities directly, such as costs of borrowing and margin account
27
LS Opportunity Fund
Notes to the Financial Statements - continued
May 31, 2012
NOTE 2. SIGNIFICANT ACCOUNTING POLICIES - continued
maintenance costs associated with the Fund’s open short positions. These types of short sales expenses are sometimes referred to as the “negative cost of carry,” and will tend to cause the Fund to lose money on a short sale even in instances where the price of the underlying security sold short does not change over the duration of the short sale. Dividend expenses on securities sold short and borrowing costs are not covered under the Advisor’s expense limitation agreement with the Fund and, therefore, these expenses will be borne by the shareholders of the Fund. The amount of restricted cash for the Fund was $22,536,112 as of May 31, 2012.
NOTE 3. SECURITIES VALUATION AND FAIR VALUE MEASUREMENTS
Fair value is defined as the price that a Fund would receive upon selling an investment in a timely transaction to an independent buyer in the principal or most advantageous market of the investment. GAAP establishes a three-tier hierarchy to maximize the use of observable market data and minimize the use of unobservable inputs and to establish classification of fair value measurements for disclosure purposes.
Inputs refer broadly to the assumptions that market participants would use in pricing the asset or liability, including assumptions about risk (the risk inherent in a particular valuation technique used to measure fair value such as pricing model and/or the risk inherent in the inputs to the valuation technique). Inputs may be observable or unobservable. Observable inputs are inputs that reflect the assumptions market participants would use in pricing the asset or liability developed based on market data obtained from sources independent of the reporting entity. Unobservable inputs are inputs that reflect the reporting entity’s own assumptions about the assumptions market participants would use in pricing the asset or liability developed based on the best information available in the circumstances.
Various inputs are used in determining the value of the Fund’s investments. These inputs are summarized in the three broad levels listed below.
| | • | | Level 1 - quoted prices in active markets for identical securities |
| | • | | Level 2 - other significant observable inputs (including, but not limited to, quoted prices for an identical security in an inactive market, quoted prices for similar securities, interest rates, prepayment speeds, credit risk, etc.) |
| | • | | Level 3 - significant unobservable inputs (including the Fund’s own assumptions in determining fair value of investments based on the best information available) |
28
LS Opportunity Fund
Notes to the Financial Statements - continued
May 31, 2012
NOTE 3. SECURITIES VALUATION AND FAIR VALUE MEASUREMENTS - continued
The inputs used to measure fair value may fall into different levels of the fair value hierarchy. In such cases, for disclosure purposes, the level in the fair value hierarchy within which the fair value measurement falls in its entirety, is determined based on the lowest level input that is significant to the fair value measurement in its entirety.
Equity securities, including common stock, investment companies, American Depositary Receipts, and limited partnerships are generally valued by using market quotations, furnished by a pricing service. Securities that are traded on any stock exchange are generally valued at the last quoted sale price. Lacking a last sale price, an exchange traded security is generally valued at its last bid price. Securities traded in the NASDAQ over-the-counter market are generally valued at the NASDAQ Official Closing Price. When using the market quotations or close prices provided by the pricing service and when the market is considered active, the security is classified as a Level 1 security. Sometimes, an equity security owned by the Fund will be valued by the pricing service with factors other than market quotations or when the market is considered inactive. When this happens, the security is classified as a Level 2 security. When market quotations are not readily available, when the Fund determines that the market quotation or the price provided by the pricing service does not accurately reflect the current fair value, or when restricted or illiquid securities are being valued, such securities are valued as determined in good faith by the Fund, in conformity with guidelines adopted by and subject to review by the Board. These securities are categorized as Level 3 securities.
Investments in mutual funds, including money market mutual funds, are generally priced at the ending net asset value (NAV) provided by the service agent of the funds. These securities are categorized as Level 1 securities.
Call and put options that the Fund invests in are generally traded on an exchange. The options in which the Fund invests are generally valued at the last trade price as provided by a pricing service. If the last sale price is not available, the options will be valued using the last bid price. The options will generally be categorized as Level 1 securities. The Fund did not invest in any options during the current fiscal year.
If the Fund decides that a price provided by the pricing service does not accurately reflect the fair value of the securities, when prices are not readily available from a pricing service, or when restricted or illiquid securities are being valued, securities are valued at fair value as determined in good faith by the Fund, in conformity with guidelines adopted by and subject to review of the Board. These securities will be categorized as Level 3 securities.
29
LS Opportunity Fund
Notes to the Financial Statements - continued
May 31, 2012
NOTE 3. SECURITIES VALUATION AND FAIR VALUE MEASUREMENTS - continued
The following is a summary of the inputs used to value the Fund’s investments as of May 31, 2012:
| | | | | | | | | | | | | | | | |
| | | Valuation Inputs | |
Assets | | Level 1 -
Quoted
Prices in
Active
Markets | | | Level 2 -
Other
Significant
Observable
Inputs | | | Level 3 -
Significant
Unobservable
Inputs | | | Total | |
Common Stocks* | | $ | 37,555,117 | | | $ | — | | | $ | — | | | $ | 37,555,117 | |
Master Limited Partnerships | | | 1,225,587 | | | | — | | | | — | | | | 1,225,587 | |
Investment Companies | | | 940,044 | | | | — | | | | — | | | | 940,044 | |
| | | | | | | | | | | | | | | | |
Total | | $ | 39,720,748 | | | $ | — | | | $ | — | | | $ | 39,720,748 | |
| | | | | | | | | | | | | | | | |
| * | Refer to Schedule of Investments for industry classifications. |
| | | | | | | | | | | | | | | | |
| | | Valuation Inputs | |
Liabilities | | Level 1 -
Quoted
Prices in
Active
Markets | | | Level 2 -
Other
Significant
Observable
Inputs | | | Level 3 -
Significant
Unobservable
Inputs | | | Total | |
Common Stocks* | | $ | (17,130,210 | ) | | $ | — | | | $ | — | | | $ | (17,130,210 | ) |
Investment Companies | | | (6,279,621 | ) | | | — | | | | — | | | | (6,279,621 | ) |
| | | | | | | | | | | | | | | | |
Total | | $ | (23,409,831 | ) | | $ | — | | | $ | — | | | $ | (23,409,831 | ) |
| | | | | | | | | | | | | | | | |
| * | Refer to Schedule of Securities Sold Short for industry classifications. |
The Fund did not hold any investments at any time during the reporting period in which significant unobservable inputs were used in determining fair value; therefore, no reconciliation of Level 3 securities is included for this reporting period. The Fund did not hold any derivative instruments during the reporting period. The Trust recognizes significant transfers between fair value hierarchy levels at the reporting period end. There were no significant transfers between any Levels for the year ended May 31, 2012.
30
LS Opportunity Fund
Notes to the Financial Statements - continued
May 31, 2012
NOTE 4. FEES AND OTHER TRANSACTIONS WITH AFFILIATES
The Advisor, under the terms of the management agreement (the “Agreement”), manages the Fund’s investments. As compensation for its management services, the Fund is obligated to pay the Advisor a fee computed and accrued daily and paid monthly at an annual rate of 1.75% of the Fund’s average net assets. For the fiscal year ended May 31, 2012, the Advisor earned a fee of $729,741 from the Fund before the recoupment described below.
The Advisor has contractually agreed to waive its management fee and/or reimburse certain Fund operating expenses (excluding interest, taxes, brokerage commissions, other expenditures which are capitalized in accordance with generally accepted accounting principles, other extraordinary expenses not incurred in the ordinary course of the Fund’s business, dividend expense on short sales, and expenses that the Fund has incurred but did not actually pay because of an expense offset arrangement) so that total expenses do not exceed 2.50% of net assets. For the fiscal year ended May 31, 2012, the Advisor recouped fees of $39,805. At May 31, 2012, the Advisor was owed $89,471 from the Fund for advisory services. The waiver and/or reimbursement by the Advisor with respect to the Fund is subject to repayment by the Fund within the three fiscal years following the fiscal year in which that particular waiver and/or reimbursement occurred, provided that the Fund is able to make the repayment without exceeding the expense limitations described above. The amount subject to repayment by the Fund pursuant to the aforementioned conditions at May 31, 2012 was:
| | |
| Amount | | Recoverable through
May 31, |
| $75,065 | | 2014 |
The Advisor has retained the Sub-Advisor to provide portfolio management and related services to the Fund. The Sub-Advisor receives a fee from the Advisor (not the Fund) for these services. The Trust retains Huntington Asset Services, Inc. (“HASI”), to manage the Fund’s business affairs and to provide the Fund with administrative services, including all regulatory reporting and necessary office equipment and personnel. For the fiscal year ended May 31, 2012, HASI earned fees of $40,082 for administrative services provided to the Fund. At May 31, 2012, the Fund owed HASI $3,582 for administrative services. Certain officers of the Trust are members of management and/or employees of HASI. A trustee of the Trust is a member of management of HASI. HASI operates as a wholly- owned subsidiary of Huntington Bancshares, Inc., the parent company of Unified Financial Securities, Inc. (the “Distributor”).
31
LS Opportunity Fund
Notes to the Financial Statements - continued
May 31, 2012
NOTE 4. FEES AND OTHER TRANSACTIONS WITH AFFILIATES - continued
The Trust retains HASI to act as the Fund’s transfer agent and to provide fund accounting services. For the fiscal year ended May 31, 2012, HASI earned fees of $42,209 from the Fund for transfer agent services. For the fiscal year ended May 31, 2012, HASI earned fees of $46,718 from the Fund for fund accounting services. At May 31, 2012, the Fund owed HASI $3,468 for transfer agent services and $5,143 for fund accounting services.
The Distributor acts as the principal distributor of the Fund’s shares. There were no payments made to the Distributor by the Fund for the fiscal year ended May 31, 2012. An officer of the Trust is an officer of the Distributor and such person may be deemed to be an affiliate of the Distributor.
The Law Offices of John H. Lively and Associates, Inc., a member firm of The 1940 Act Law Group, serves as legal counsel to the Trust. John H. Lively, Interim Secretary of the Trust, is the owner of The Law Offices of John H. Lively & Associates, Inc., but he receives no direct compensation from the Trust or the Funds for serving as an officer of the Trust.
NOTE 5. INVESTMENT TRANSACTIONS
For the fiscal year ended May 31, 2012, purchases and sales of investment securities, other than short-term investments and short securities were as follows:
| | | | |
Purchases | | | | |
U.S. Government Obligations | | $ | — | |
Other | | | 161,232,651 | |
Sales | | | | |
U.S. Government Obligations | | $ | — | |
Other | | | 135,967,023 | |
At May 31, 2012, the appreciation (depreciation) of investments, net of proceeds for investment securities sold short, for tax purposes was as follows:
| | | | |
| | | Amount | |
Gross Appreciation | | $ | 3,654,160 | |
Gross (Depreciation) | | | (1,696,906 | ) |
| | | | |
Net Appreciation | | $ | 1,957,254 | |
| | | | |
At May 31, 2012, the aggregate cost of securities, net of proceeds for investment securities sold short, for federal income tax purposes, was $14,353,663.
32
LS Opportunity Fund
Notes to the Financial Statements - continued
May 31, 2012
NOTE 6. ESTIMATES
The preparation of financial statements in conformity with GAAP requires management to make estimates and assumptions that affect the reported amounts of assets and liabilities and disclosure of contingent assets and liabilities at the date of the financial statements and the reported amounts of increases and decreases in net assets from operations during the reporting period. Actual results could differ from those estimates.
NOTE 7. BENEFICIAL OWNERSHIP
The beneficial ownership, either directly or indirectly, of 25% or more of the voting securities of a fund creates a presumption of control of a fund, under Section 2(a) (9) of the Investment Company Act of 1940. At May 31, 2012, National Financial Services, Inc. owned, as record shareholder, 39.11% and Charles Schwab owned, as record shareholder, 26.23% of the outstanding shares of the LS Opportunity Fund. The Trust does not know whether National Financial Services, Inc. or Charles Schwab or any of the underlying beneficial owners owned or controlled 25% or more of the voting securities of the LS Opportunity Fund.
NOTE 8. DISTRIBUTIONS TO SHAREHOLDERS
On December 21, 2011, a short-term capital gain of $0.0237 per share was made to shareholders of record on December 20, 2011.
The tax characterization of distributions for the fiscal periods ended May 31, 2012 and 2011 was as follows:
| | | | | | | | |
| | | 2012 | | | 2011 | |
Distributions paid from: | | | | | | | | |
Ordinary Income | | $ | 104,580 | | | $ | — | |
| | | | | | | | |
| | $ | 104,580 | | | $ | — | |
| | | | | | | | |
NOTE 9. COMMITMENTS AND CONTINGENCIES
The Fund indemnifies its officers and trustees for certain liabilities that may arise from their performance of their duties to the Fund. Additionally, in the normal course of business, the Fund enters into contracts that contain a variety of representations and warranties which provide general indemnifications. The Fund’s maximum exposure under these arrangements is unknown, as this would involve future claims that may be made against the Fund that have not yet occurred.
33
LS Opportunity Fund
Notes to the Financial Statements - continued
May 31, 2012
NOTE 10. TAX COMPONENTS OF CAPITAL
At May 31, 2012, the components of distributable earnings on a tax basis were as follows:
| | | | |
Unrealized appreciation (depreciation) | | $ | 1,957,254 | |
Short term capital loss carryforward without expiration | | | (2,119,548 | ) |
Other accumulated losses | | | (1,566,437 | ) |
| | | | |
| | $ | (1,728,731 | ) |
| | | | |
The difference between book basis and tax basis unrealized appreciation is attributable to the tax deferral of wash losses, partnerships, unamortized organization costs, and grantor trusts.
Under current tax law, net investment losses and capital losses realized after October 31 of a Fund’s fiscal year may be deferred and treated as occurring on the first business day of the following fiscal year for tax purposes. The Fund deferred losses as follows:
| | | | | | | | |
| | | Late Year
Ordinary Loss | | | Post-October
Capital Losses | |
LS Opportunity Fund | | $ | 414,838 | | | $ | 1,151,571 | |
34
REPORT OF INDEPENDENT REGISTERED PUBLIC ACCOUNTING FIRM
To the Shareholders and Board of Trustees
LS Opportunity Fund
(Valued Advisers Trust)
We have audited the accompanying statement of assets and liabilities, including the schedules of investments and securities sold short, of LS Opportunity Fund, (the “Fund”), a series of the Valued Advisers Trust, as of May 31, 2012, and the related statements of operations and changes in net assets and the financial highlights for the year then ended. These financial statements and financial highlights are the responsibility of Fund management. Our responsibility is to express an opinion on these financial statements and financial highlights based on our audit. The statement of changes in net assets and financial highlights for the period ended May 31, 2011, were audited by another independent registered public accounting firm, who expressed an unqualified opinion on that statement and financial highlights.
We conducted our audit in accordance with the standards of the Public Company Accounting Oversight Board (United States). Those standards require that we plan and perform the audit to obtain reasonable assurance about whether the financial statements and financial highlights are free of material misstatement. An audit includes examining, on a test basis, evidence supporting the amounts and disclosures in the financial statements. Our procedures included confirmation of securities owned as of May 31, 2012, by correspondence with the custodian and brokers or by other appropriate auditing procedures where replies from brokers were not received. An audit also includes assessing the accounting principles used and significant estimates made by management, as well as evaluating the overall financial statement presentation. We believe that our audit provides a reasonable basis for our opinion.
In our opinion, the financial statements and financial highlights referred to above present fairly, in all material respects, the financial position of the LS Opportunity Fund as of May 31, 2012, the results of its operations, changes in its net assets, and the financial highlights for the year then ended, in conformity with accounting principles generally accepted in the United States of America.
COHEN FUND AUDIT SERVICES, LTD.
Westlake, Ohio
July 25, 2012
35
TRUSTEES AND OFFICERS
The Board of Trustees supervises the business activities of the Trust. Each Trustee serves as a trustee until termination of the Trust unless the Trustee dies, resigns, retires or is removed.
The following tables provide information regarding the Trustees and Officers.
The following table provides information regarding each of the Independent Trustees.
| | |
Name, Address*, (Age), Position with Trust**, Term of Position with Trust | | Principal Occupation During Past 5 Years and Other Directorships |
Dr. Merwyn R. Vanderlind, 75 Independent Trustee, August 2008 to present. | | Retired; Consultant to Battelle Memorial Institute (International Science and Technology Research Enterprise) on business investments from 2001 to 2003; Formerly employed with Battelle Memorial Institute from 1966 to 2003 in various positions, including the Executive Vice President of Battelle Institute from 1991 to 2001, General Manager from 1985 to 1991, Director of the Battelle Industrial Technology Center (Geneva, Switzerland) from 1983 to 1985, and Practicing Researcher from 1966 to 1983. |
| |
Ira Cohen, 53 Independent Trustee, June 2010 to present. | | Independent financial services consultant (Feb. 2005 - present); Senior Vice President, Dealer Services / Institutional Services, AIM Investment Services, Inc. (1992 - 2005). |
| * | The address for each trustee and officer is 2960 N. Meridian St., Suite 300, Indianapolis, IN 46208. |
| ** | The Trust consists of 10 series. |
36
TRUSTEES AND OFFICERS - continued
The following table provides information regarding the Trustee who is considered an “interested person” of the Trust, as that term is defined under the 1940 Act. Based on the experience of the Trustee, the Trust concluded that the individual described below should serve as a Trustee.
| | |
Name, Address*, (Age), Position with Trust**, Term of Position with Trust | | Principal Occupation During Past 5 Years and Other Directorships |
R. Jeffrey Young, 47 Trustee and Chairman, June 2010 to present. | | Principal Executive Officer and President, Valued Advisers Trust since February 2010; Senior Vice President, Huntington Asset Services, Inc. since January 2010; Chief Executive Officer, Huntington Funds since February 2010; President and Chief Executive Officer, Dreman Contrarian Funds since March 2011; Trustee, Valued Advisers Trust, August 2008 to January 2010; Managing Director and Chief Operating Officer of Professional Planning Consultants 2007 to 2010; Co-Founder of Kinwood Group, LLC July 2007 to March 2008; President and Chief Executive Officer of The Coventry Group from 2000 to 2007; President and Chief Executive Officer of the STI Classic Funds from 2004 to 2007; Trustee of the Coventry Group from 1999 to 2005; and Senior Vice President of BISYS Fund Services / The Winsbury Company October 1993 to June 2007. |
| * | The address for each trustee and officer is 2960 N. Meridian St., Suite 300, Indianapolis, IN 46208. |
| ** | The Trust consists of 10 series. |
37
TRUSTEES AND OFFICERS - continued
The following table provides information regarding the Officers of the Trust - continued:
| | |
Name, Address*, (Age), Position with Trust**, Term of Position with Trust | | Principal Occupation During Past 5 Years and Other Directorships |
R. Jeffrey Young, 47 Principal Executive Officer and President, February 2010 to present. | | Trustee, Valued Advisers Trust since June 2010; Senior Vice President, Huntington Asset Services, Inc. since January 2010; Chief Executive Officer, Huntington Funds since February 2010; President and Chief Executive Officer, Dreman Contrarian Funds since March 2011; Trustee, Valued Advisers Trust, August 2008 to January 2010; Managing Director and Chief Operating Officer of Professional Planning Consultants 2007 to 2010; Co-Founder of Kinwood Group, LLC July 2007 to March 2008; President and Chief Executive Officer of The Coventry Group from 2000 to 2007; President and Chief Executive Officer of the STI Classic Funds from 2004 to 2007; Trustee of the Coventry Group from 1999 to 2005; and Senior Vice President of BISYS Fund Services/The Winsbury Company October 1993 to June 2007. |
| |
John C. Swhear, 51 Chief Compliance Officer, AML Officer and Vice President, August 2008 to present. | | Vice President of Legal Administration and Compliance for Huntington Asset Services, Inc., the Trust’s administrator, since April 2007; Chief Compliance Officer of Unified Financial Securities, Inc., the Trust’s distributor, since May 2007; Senior Vice President of the Unified Series Trust since May 2007; Secretary of Huntington Funds since April 2010; President and Chief Executive Officer of Dreman Contrarian Funds from March 2010 to March 2011, and Vice President and Acting Chief Executive Officer, 2007 to March 2010 ; Employed in various positions with American United Life Insurance Company from 1983 to April 2007, including: Associate General Counsel, April 2007; Investment Advisor Chief Compliance Officer, June 2004 to April 2007; Assistant Secretary to the Board of Directors, December 2002 to April 2007; Chief Compliance Officer of OneAmerica Funds, Inc., June 2004 to April 2007; Chief Counsel and Secretary, OneAmerica Securities, Inc., December 2002 to April 2007. |
38
TRUSTEES AND OFFICERS - continued
The following table provides information regarding the Officers of the Trust:
| | |
Name, Address*, (Age), Position with Trust**, Term of Position with Trust | | Principal Occupation During Past 5 Years and Other Directorships |
Carol J. Highsmith, 47 Vice President, August 2008 to present. | | Employed in various positions with Huntington Asset Services, Inc., the Trust’s administrator, since November of 1994; currently Vice President of Legal Administration. |
| |
Matthew J. Miller, 36 Vice President, December 2011 to present. | | Employed in various positions with Huntington Asset Services, Inc., the Trust’s administrator, since July of 1998; currently Vice President of Relationship Management; Vice President of Huntington Funds since February 2010. |
| |
William J. Murphy, 49 Principal Financial Officer and Treasurer, December 2009 to present | | Manager of Fund Administration for Huntington Asset Services, Inc., the Trust’s administrator, since October 2007; Assistant Treasurer of Unified Series Trust from February 2008 to May 2011; Treasurer and Chief Financial Officer of Dreman Contrarian Funds from February 2008 to March 2011; Employed in various positions with American United Life Insurance Company from March 1987 to October 2007. |
| |
John H. Lively, 43 Interim Secretary, September 2011 to present. | | Attorney, The Law Offices of John H. Lively & Associates, Inc., March, 2010 to present; Secretary of Dividend Growth Trust, September 2010 to present; Partner, Husch Blackwell Sanders LLP (law firm), March, 2007 to February, 2010; Managing Attorney, Raymond James Financial (financial services), September, 2005 to March, 2007. |
| * | The address for each trustee and officer is 2960 N. Meridian St., Suite 300, Indianapolis, IN 46208. |
| ** | The Trust consists of 10 series. |
OTHER INFORMATION
The Fund’s Statement of Additional Information (“SAI”) includes additional information about the trustees and is available without charge, upon request. You may call toll-free at (877) 336-6763 to request a copy of the SAI or to make shareholder inquiries.
39
At the quarterly meeting of the Board of Trustees (the “Board”) of the Trust that was held on March 6-7, 2012, the Trustees, including a majority of the trustees who are not parties to the agreements or interested persons of any party to any of the agreements (the “Independent Trustees”), unanimously approved the renewal of the investment advisory agreement between the Trust and Long Short Advisors, LLC (“LSA” or “Adviser”) with respect to the LS Opportunity Fund (the “LS Fund” or “Fund”) and the renewal of the sub-advisory agreement between LSA and Independence Capital Asset Partners, LLC (“ICAP” or “Sub-Adviser”).
The Board specifically discussed the arrangements between LSA and the Trust with respect to the LS Fund. The Board reviewed a memorandum from Counsel, and addressed to the Trustees that summarized, among other things, the fiduciary duties and responsibilities of the Board in reviewing and approving the renewal of the advisory agreement (“Advisory Agreement”). Counsel discussed with the Trustees the types of information and factors that should be considered by the Board in order to make an informed decision regarding the approval of the renewal of the Advisory Agreement, including the following material factors:
(i) the nature, extent, and quality of the services provided by LSA, including its oversight of ICAP; (ii) the investment performance of the LS Fund; (iii) the costs of the services to be provided and anticipated profits to be realized by LSA from the relationship with the LS Fund; (iv) the extent to which economies of scale would be realized if the LS Fund grows and whether advisory fee levels reflect those economies of scale for the benefit of the LS Fund’s investors; and (vi) LSA’s practices regarding possible conflicts of interest.
In assessing these factors and reaching its decisions, the Board took into consideration information furnished for the Board’s review and consideration throughout the year at regular Board meetings, as well as information specifically requested and prepared and/or presented in connection with the annual renewal process, including information presented at the Meeting. The Board was provided with information and reports relevant to the annual renewal of the Advisory Agreement, including: (i) reports regarding the services and support provided to the LS Fund and its shareholders by LSA; (ii) quarterly assessments of the investment performance of the LS Fund by personnel of LSA; (iii) commentary on the reasons for the performance; (iv) presentations by LSA addressing investment philosophy, investment strategy, personnel and operations; (v) compliance and audit reports concerning the LS Fund and LSA; (vi) disclosure information contained in the registration statement of the Trust with respect to the LS Fund and the Form ADV of LSA; (vii) information on relevant developments in the mutual fund industry and how the LS Fund and/or LSA are responding to them; and (viii) a memorandum from Counsel, that summarized the fiduciary duties and responsibilities of the Board in reviewing and approving the Advisory Agreement, including the material factors set forth above and the types of information included in each factor that should be considered by the Board in order to make an informed decision. The Board also requested and received various informational materials including, without limitation: (i) documents containing information about LSA, including financial information, a description of personnel and the services provided to the LS Fund, information on investment advice, performance, summaries of LS Fund expenses, compliance program,
40
current legal matters, and other general information; (ii) comparative expense and performance information for other mutual funds with strategies similar to the LS Fund; (iii) the anticipated effect of size on the LS Fund’s performance and expenses; and (iv) benefits to be realized by LSA from its relationship with the LS Fund. The Board did not identify any particular information that was most relevant to its consideration to approve the Agreement and each Trustee may have afforded different weight to the various factors.
In deciding whether to approve the Advisory Agreement, the Board considered numerous factors, including:
| 1. | The nature, extent, and quality of the services to be provided by the Adviser. In this regard, the Board considered LSA’s responsibilities under the Advisory Agreement. The Trustees considered the services being provided by LSA to the Fund including, without limitation: the quality of its investment advisory services (including research and recommendations with respect to portfolio securities), its process for formulating investment recommendations and assuring compliance with the Fund’s investment objectives and limitations, its coordination of services for the Fund among the Fund’s service providers, and its efforts to promote the Fund and grow its assets. The Trustees considered LSA’s continuity of, and commitment to retain, qualified personnel and LSA’s commitment to maintain and enhance its resources and systems, the commitment of LSA’s personnel to finding alternatives and options that allow the Fund to maintain its goals, and LSA’s continued cooperation with the Independent Trustees and Counsel for the Fund. The Trustees considered LSA’s personnel, including the education and experience of LSA’s personnel. After considering the foregoing information and further information in the Meeting materials provided by LSA (including LSA’s Form ADV), the Board concluded that, in light of all the facts and circumstances, the nature, extent, and quality of the services provided by LSA were satisfactory and adequate for the Fund. |
| 2. | Investment Performance of the Fund and the Adviser. In considering the investment performance of the Fund and LSA, the Trustees compared the short-term performance of the Fund with the performance of funds with similar objectives managed by other investment advisers, as well as with aggregated peer group data. The Trustees also considered the consistency of LSA’s management of the Fund with its investment objective, strategies, and limitations. The Trustees considered the performance of other accounts managed by the Fund’s sub-adviser. The Trustees also compared the short- term performance of the Fund with the performance of its benchmark index, comparable funds with similar objectives managed by other investment advisers. The Trustees noted that the Fund’s performance, in the periods since the Fund’s inception, was better than some of its peers and worse than others, but generally comparable to most of its peers. After reviewing and discussing the investment performance of the Fund further, LSA’s experience managing the Fund, the Fund’s historical performance, and other relevant factors, the Board concluded, in light of all the facts and circumstances, that the investment performance of the Fund and LSA was satisfactory. |
41
| 3. | The costs of the services to be provided and profits to be realized by the Adviser from the relationship with the Fund. In considering the costs of services to be provided and the profits to be realized by LSA from the relationship with the Fund, the Trustees considered: (1) the Fund’s financial condition; (2) asset level of the Fund; (3) the overall expenses of the Fund; and (4) the nature and frequency of advisory fee payments. The Trustees reviewed information provided by LSA regarding its profits associated with managing the Fund. The Trustees also considered potential benefits for LSA in managing the Fund. The Trustees then compared the fees and expenses of the Fund (including the management fee) to other comparable mutual funds. The Trustees noted that the Fund’s management fee, while it was among the higher in its peer group, the net expense ratios were comparable to that of the peer averages and median expense ratios as a result of LSA’s contractual commitment to limit the expenses of the Fund. Based on the foregoing, the Board concluded that the fees to be paid to LSA by the Fund and the profits to be realized by the Fund, in light of all the facts and circumstances, were fair and reasonable in relation to the nature and quality of the services provided by LSA. |
| 4. | The extent to which economies of scale would be realized as the Fund grows and whether advisory fee levels reflect these economies of scale for the benefit of the Fund’s investors. In this regard, the Board considered the Fund’s fee arrangements with LSA. The Board considered that while the management fee remained the same at all asset levels, the Fund’s shareholders had experienced benefits from the Fund’s expense limitation arrangement. The Trustees noted that once the Fund’s expenses feel below the cap set by the arrangement, the Fund’s shareholders would continue to benefit from the economies of scale under the Fund’s agreements with service providers other than LSA. In light of its ongoing consideration of the Fund’s asset levels, expectations for growth in the Fund, and fee levels, the Board determined that the Fund’s fee arrangements, in light of all the facts and circumstances, were fair and reasonable in relation to the nature and quality of the services provided by LSA. |
| 5. | Possible conflicts of interest. In considering LSA’s practices regarding conflicts of interest, the Trustees evaluated the potential for conflicts of interest and considered such matters as the experience and ability of the advisory personnel assigned to the Fund; the basis of decisions to buy or sell securities for the Fund and/or LSA’s other accounts; and the substance and administration of LSA’s code of ethics. The Trustees also considered |
42
| | disclosure in the registration statement of the Trust relating to LSA’s potential conflicts of interest. Based on the foregoing, the Board determined that LSA’s standards and practices of LSA relating to the identification and mitigation of potential conflicts of interest were satisfactory. |
Having considered these factors and additional information provided to the Board in advance of the meeting, the Board of Trustees determined that the Advisory Agreement is fair and in the best interests of the Fund and its shareholders and unanimously approved the appointment of the Adviser to serve as the investment Adviser to the Fund under the terms and conditions set forth in the Advisory Agreement.
The Board then reviewed and discussed the approval of the Sub-advisory Agreement between LSA and ICAP.
The Board discussed the arrangements between LSA and ICAP with respect to the LS Fund. Counsel directed the Board back to his memorandum from Counsel that summarized, among other things, the fiduciary duties and responsibilities of the Board in reviewing and approving the renewal of the sub-advisory agreement (“Sub-Advisory Agreement”). Counsel reminded the Trustees of the types of information and factors that should be considered by the Board in order to make an informed decision regarding the approval of the renewal of the Sub-Advisory Agreement, including the following material factors: (i) the nature, extent, and quality of the services provided by ICAP ; (ii) the investment performance of the LS Fund; (iii) the costs of the services to be provided and profits to be realized by ICAP from the relationship with LSA; (iv) the extent to which economies of scale would be realized if the LS Fund grows and whether sub-advisory fee levels reflect those economies of scale for the benefit of the LS Fund’s investors; (v) ICAP’s practices regarding brokerage and portfolio transactions; and (vi) ICAP’s practices regarding possible conflicts of interest.
In assessing these factors and reaching its decisions, the Board took into consideration information furnished for the Board’s review and consideration throughout the year at regular Board meetings, as well as information specifically requested and prepared and/or presented in connection with the annual renewal process, including information presented at the Meeting. The Board was provided with information and reports relevant to the annual renewal of the Sub-Advisory Agreement, including: (i) reports regarding the services and support provided to the LS Fund and its shareholders by ICAP; (ii) compliance and audit reports concerning the LS Fund and ICAP; (vi) disclosure information contained in the registration statement of the Trust with respect to the LS Fund and the Form ADV of ICAP; (vii) information on relevant developments in the mutual fund industry and how ICAP is responding to them; and (viii) a memorandum from Counsel, that summarized the fiduciary duties and responsibilities of the Board in reviewing and approving the Sub-Advisory Agreement, including the material factors set forth above and the types of information included in each factor that should be considered by the Board in order to make an informed decision. The Board also requested and received various informational materials including, without
43
limitation: (i) documents containing information about ICAP, including financial information, a description of personnel and the services provided to the LS Fund, information on investment advice, performance, summaries of LS Fund expenses, compliance program, current legal matters, and other general information; (ii) comparative expense and performance information for other mutual funds with strategies similar to the LS Fund; (iii) the anticipated effect of size on the LS Fund’s performance and expenses; and (iv) benefits to be realized by ICAP from its relationship with LSA. The Board did not identify any particular information that was most relevant to its consideration to approve the Sub-Agreement and each Trustee may have afforded different weight to the various factors.
In deciding whether to approve the agreement, the Board considered numerous factors, including:
| | 1. | The nature, extent, and quality of the services to be provided by the Sub-Adviser. In this regard, the Board considered ICAP’s responsibilities under the Sub-Advisory Agreement. The Trustees considered the services being provided by ICAP to the LS Fund , (including, without limitation: the quality of its investment sub-advisory services (including research and recommendations with respect to portfolio securities), its process for formulating investment recommendations and assuring compliance with the Fund’s investment objectives and limitations, its coordination of services for the Fund among the Fund’s service providers, and its efforts to promote the Fund and grow its assets. The Trustees considered ICAP’s continuity of, and commitment to retain, qualified personnel and ICAP’s commitment to maintain and enhance its resources and systems, the commitment of ICAP’s personnel to finding alternatives and options that allow the Fund to maintain its goals, and ICAP’s continued cooperation with the Independent Trustees and Counsel for the Fund. The Trustees considered ICAP’s personnel, including the education and experience of ICAP’s personnel. After considering the foregoing information and further information in the Meeting materials provided by ICAP (including ICAP’s Form ADV), the Board concluded that, in light of all the facts and circumstances, the nature, extent, and quality of the services provided by ICAP were satisfactory and adequate for the Fund. |
| | 2. | Investment Performance of the Fund and the Adviser. In considering the investment performance of the Fund and ICAP, the Trustees compared the short-term performance of the Fund with the performance of funds with similar objectives managed by other investment sub-advisers, as well as with aggregated peer group data. The Trustees also considered the consistency of ICAP’s management of the Fund with its investment objective, strategies, and limitations. The Trustees considered the performance of other accounts managed by ICAP. The Trustees also compared the short- term performance of the Fund with the performance of its benchmark index, comparable funds with similar objectives managed by other investment advisers. The Trustees noted that the Fund’s performance, in |
44
| | the periods since the Fund’s inception, was better than some of its peers and worse than others, but generally comparable to most of its peers. After reviewing and discussing the investment performance of the Fund further, ICAP’s experience managing the Fund, the Fund’s historical performance, and other relevant factors, the Board concluded, in light of all the facts and circumstances, that the investment performance of the Fund and ICAP was satisfactory. |
| | 3. | The costs of the services to be provided and profits to be realized by the Adviser from the relationship with the Fund. In considering the costs of services to be provided and the profits to be realized by ICAP from the relationship with the Fund, the Trustees considered: (1) the Fund’s financial condition; (2) asset level of the Fund; (3) the overall expenses of the Fund; and (4) the nature and frequency of advisory fee payments. The Trustees reviewed information provided by ICAP regarding its profits associated with managing the Fund. The Trustees also considered potential benefits for ICAP in managing the Fund. The Trustees then compared the fees and expenses of the Fund (including the management fee) to other comparable mutual funds. The Trustees noted that the Fund’s management fee, while it was among the higher in its peer group, the net expense ratios were lower than the peer averages and median expense ratios as a result of ICAP’s contractual commitment to limit the expenses of the Fund. Based on the foregoing, the Board concluded that the fees to be paid to ICAP by the Fund and the profits to be realized by ICAP, in light of all the facts and circumstances, were fair and reasonable in relation to the nature and quality of the services provided by ICAP. |
| | 4. | The extent to which economies of scale would be realized as the Fund grows and whether advisory fee levels reflect these economies of scale for the benefit of the Fund’s investors. In this regard, the Board considered the Fund’s fee arrangements with ICAP. The Board considered that while the management fee remained the same at all asset levels, the Fund’s shareholders had experienced benefits from the Fund’s expense limitation arrangement. The Trustees noted that once the Fund’s expenses feel below the cap set by the arrangement, the Fund’s shareholders would continue to benefit from the economies of scale under the Fund’s agreements with service providers other than ICAP. In light of its ongoing consideration of the Fund’s asset levels, expectations for growth in the Fund, and fee levels, the Board determined that the Fund’s fee arrangements, in light of all the facts and circumstances, were fair and reasonable in relation to the nature and quality of the services provided by ICAP. |
45
| | 5. | Possible conflicts of interest. In considering ICAP’s practices regarding conflicts of interest, the Trustees evaluated the potential for conflicts of interest and considered such matters as the experience and ability of the advisory personnel assigned to the Fund; the basis of decisions to buy or sell securities for the Fund and/or ICAP’s other accounts; and the substance and administration of ICAP’s code of ethics. The Trustees also considered disclosure in the registration statement of the Trust relating to ICAP’s potential conflicts of interest. Based on the foregoing, the Board determined that ICAP’s standards and practices of ICAP relating to the identification and mitigation of potential conflicts of interest were satisfactory. |
Having considered these factors and additional information provided to the Board in advance of the meeting, the Board of Trustees determined that the Sub-Advisory Agreement is fair and in the best interests of the Fund and its shareholders and unanimously approved the appointment of the Sub-Adviser.
46
PRIVACY POLICY
The following is a description of the Fund’s policies regarding disclosure of nonpublic personal information that you provide to the Fund or that the Fund collects from other sources. In the event that you hold shares of the Fund through a broker-dealer or other financial intermediary, the privacy policy of your financial intermediary would govern how your nonpublic personal information would be shared with nonaffiliated third parties.
Categories of Information the Fund Collects. The Fund collects the following nonpublic personal information about you:
| | • | | Information the Fund receives from you on applications or other forms, correspondence, or conversations (such as your name, address, phone number, social security number, and date of birth); and |
| | • | | Information about your transactions with the Fund, its affiliates, or others (such as your account number and balance, payment history, cost basis information, and other financial information). |
Categories of Information the Fund Discloses. The Fund does not disclose any nonpublic personal information about its current or former shareholders to unaffiliated third parties, except as required or permitted by law. The Fund is permitted by law to disclose all of the information it collects, as described above, to service providers (such as the Fund’s custodian, administrator, transfer agent, accountant and legal counsel) to process your transactions and otherwise provide services to you.
Confidentiality and Security. The Fund restricts access to your nonpublic personal information to those persons who require such information to provide products or services to you. The Fund maintains physical, electronic, and procedural safeguards that comply with federal standards to guard your nonpublic personal information.
Disposal of Information. The Fund, through its transfer agent, has taken steps to reasonably ensure that the privacy of your nonpublic personal information is maintained at all times, including in connection with the disposal of information that is no longer required to be maintained by the Fund. Such steps shall include, whenever possible, shredding paper documents and records prior to disposal, requiring off-site storage vendors to shred documents maintained in such locations prior to disposal, and erasing and/or obliterating any data contained on electronic media in such a manner that the information can no longer be read or reconstructed.
47
PROXY VOTING
A description of the policies and procedures that the Fund uses to determine how to vote proxies relating to portfolio securities and information regarding how the Fund voted those proxies during the most recent twelve month period ended June 30, is available without charge upon request by (1) calling the Fund at (877) 336-6763 and (2) from Fund documents filed with the Securities and Exchange Commission (“SEC”) on the SEC’s website at www.sec.gov.
| | |
| TRUSTEES | | INDEPENDENT REGISTERED |
| R. Jeffrey Young, Chairman | | PUBLIC ACCOUNTING FIRM |
| Dr. Merwyn R. Vanderlind | | Cohen Fund Audit Services, Ltd. |
| Ira Cohen | | 800 Westpoint Pkwy., Suite 1100 |
| | Westlake, OH 44145 |
| OFFICERS | | |
| R. Jeffrey Young, Principal Executive | | LEGAL COUNSEL |
| Officer and President | | The Law Offices of John H. Lively & |
| John C. Swhear, Chief Compliance | | Associates, Inc., |
| Officer, AML Officer and | | A member firm of The 1940 |
| Vice-President | | Act Law GroupTM |
| Carol J. Highsmith, Vice President | | 11300 Tomahawk Creek Parkway, |
| Matthew J. Miller, Vice President | | Ste. 310 |
| William J. Murphy, Principal Financial | | Leawood, KS 66221 |
| Officer and Treasurer | | |
| John H. Lively, Interim Secretary | | CUSTODIAN |
| | Citibank, N A. |
| INVESTMENT ADVISER | | 388 Greenwich Street |
| Long Short Advisors, LLC | | New York, NY 10013 |
| 1818 Market Street, 33rd Floor, | | |
| Suite 3323 | | ADMINISTRATOR, TRANSFER |
| Philadelphia, PA 19103 | | AGENT AND FUND ACCOUNTANT |
| | Huntington Asset Services, Inc. |
| DISTRIBUTOR | | 2960 North Meridian Street, Suite 300 |
| Unified Financial Securities, Inc. 2960 | | Indianapolis, IN 46208 |
| North Meridian Street, Suite 300 | | |
| Indianapolis, IN 46208 | | |
This report is intended only for the information of shareholders or those who have received the Fund’s prospectus which contains information about the Fund’s management fee and expenses. Please read the prospectus carefully before investing.
Distributed by Unified Financial Securities, Inc.
Member FINRA/SIPC
Item 2. Code of Ethics.
As of the end of the period covered by this report, the registrant has adopted a code of ethics that applies to the registrant’s principal executive officer, principal financial officer, principal accounting officer or controller, or persons performing similar functions, regardless of whether these individuals are employed by the registrant or a third party. Pursuant to Item 12(a)(1), a copy of registrant’s code of ethics is filed as an exhibit to this Form N-CSR. During the period covered by this report, the code of ethics has not been amended, and the registrant has not granted any waivers, including implicit waivers, from the provisions of the code of ethics.
Item 3. Audit Committee Financial Expert.
(a) The registrant’s board of trustees has determined that the registrant does not have an audit committee financial expert. The committee members and the full Board considered a possibility of adding a member that would qualify as an expert. The audit committee determined that, although none of its members meet the technical definition of an audit committee expert, the committee has sufficient financial expertise to adequately perform its duties under the Audit Committee Charter without the addition of a qualified expert.
Item 4. Principal Accountant Fees and Services.
(a) Audit Fees
| | | | | | | | |
The LS Opportunity Fund: | | | FY 2012 | | | $ | 12,500 | |
| | | FY 2011 | | | $ | 12,500 | |
The Longview Fund: | | | FY 2012 | | | $ | 12,500 | |
| | | FY 2011 | | | | NA | |
The Cloud Funds: | | | FY 2012 | | | $ | 25,000 | |
| | | FY 2011 | | | | NA | |
(b) Audit-Related Fees
| | | | | | | | |
Registrant | | | | | | |
The LS Opportunity Fund: | | | FY 2012 | | | $ | 0 | |
| | | FY 2011 | | | $ | 0 | |
The Longview Fund: | | | FY 2012 | | | $ | 0 | |
| | | FY 2011 | | | | NA | |
The Cloud Funds: | | | FY 2012 | | | $ | 0 | |
| | | FY 2011 | | | | NA | |
(c) Tax Fees
| | | | | | | | |
| Registrant | | | | | | |
The LS Opportunity Fund: | | | FY 2012 | | | $ | 2,500 | |
| | | FY 2011 | | | $ | 2,500 | |
The Longview Fund: | | | FY 2012 | | | $ | 2,500 | |
| | | FY 2011 | | | | NA | |
The Cloud Funds: | | | FY 2012 | | | $ | 5,000 | |
| | | FY 2011 | | | | NA | |
-2-
Nature of the fees: Preparation of the 1120 RIC and Excise review
(d) All Other Fees
| | | | | | | | |
Registrant | | | | | | |
The LS Opportunity Fund: | | | FY 2012 | | | $ | 0 | |
| | | FY 2011 | | | $ | 0 | |
The Longview Fund: | | | FY 2012 | | | $ | 0 | |
| | | FY 2011 | | | | NA | |
The Cloud Funds: | | | FY 2012 | | | $ | 15,800 | |
| | | FY 2011 | | | | NA | |
Nature of the fees: Rule 17f-1 Examination
(e) (1) Audit Committee’s Pre-Approval Policies
The Audit Committee Charter requires the Audit Committee to be responsible for the selection, retention or termination of auditors and, in connection therewith, to (i) evaluate the proposed fees and other compensation, if any, to be paid to the auditors, (ii) evaluate the independence of the auditors, (iii) pre-approve all audit services and, when appropriate, any non-audit services provided by the independent auditors to the Trust, (iv) pre-approve, when appropriate, any non-audit services provided by the independent auditors to the Trust’s investment adviser, or any entity controlling, controlled by, or under common control with the investment adviser and that provides ongoing services to the Trust if the engagement relates directly to the operations and financial reporting of the Trust, and (v) receive the auditors’ specific representations as to their independence;
(2) Percentages of Services Approved by the Audit Committee
| | | | |
Registrant | | | |
Audit-Related Fees: | | | 0 | % |
Tax Fees: | | | 0 | % |
All Other Fees: | | | 0 | % |
(f) During audit of registrant’s financial statements for the most recent fiscal year, less than 50 percent of the hours expended on the principal accountant’s engagement were attributed to work performed by persons other than the principal accountant’s full-time, permanent employees.
(g) The aggregate non-audit fees billed by the registrant’s accountant for services rendered to the registrant, and rendered to the registrant’s investment adviser (not including any sub-adviser whose role is primarily portfolio management and is subcontracted with or overseen by another investment adviser), and any entity controlling, controlled by, or under common control with the adviser that provides ongoing services to the registrant:
| | | | | | | | |
| | | Registrant | | | Adviser | |
FY 2012 | | $ | 0 | | | $ | 0 | |
FY 2011 | | | NA | | | | NA | |
-3-
(h) Not applicable. The auditor performed no services for the registrant’s investment adviser or any entity controlling, controlled by, or under common control with the investment adviser that provides ongoing services to the registrant.
Item 5. Audit Committee of Listed Companies. NOT APPLICABLE – applies to listed companies only
Item 6. Schedule of Investments. Schedule filed with Item 1.
Item 7. Disclosure of Proxy Voting Policies and Procedures for Closed-End Management Investment Companies. NOT APPLICABLE – applies to closed-end funds only
Item 8. Portfolio Managers of Closed-End Investment Companies. NOT APPLICABLE – applies to closed-end funds only
Item 9. Purchases of Equity Securities by Closed-End Management Investment Company and Affiliated Purchasers. NOT APPLICABLE – applies to closed-end funds only
Item 10. Submission of Matters to a Vote of Security Holders.
The guidelines applicable to shareholders desiring to submit recommendations for nominees to the Registrant’s board of trustees are contained in the statement of additional information of the Trust with respect to the Fund(s) for which this Form N-CSR is being filed.
Item 11. Controls and Procedures.
(a) Based on their evaluation of the registrant’s disclosure controls and procedures (as defined in Rule 30a-3(c) under the Investment Company Act of 1940, as amended (the “Act”)) as of a date within 90 days of the filing date of this report, the registrant’s principal executive officer and principal financial officer have concluded that such disclosure controls and procedures are reasonably designed and are operating effectively to ensure that material information relating to the registrant is made known to them by others within those entities, particularly during the period in which this report is being prepared, and that the information required in filings on Form N-CSR is recorded, processed, summarized, and reported on a timely basis.
(b) There were no changes in the registrant’s internal control over financial reporting (as defined in Rule 30a-3(d) under the Investment Company Act of 1940) that occurred during the second fiscal quarter of the period covered by this report that have materially affected, or are reasonably likely to materially affect, the registrant’s internal control over financial reporting.
Item 12. Exhibits.
| | | | |
| | |
| (a) | | (1) | | Code is filed herewith. |
| | |
| | (2) | | Certifications by the registrant’s principal executive officer and principal financial officer, pursuant to Section 302 of the Sarbanes- Oxley Act of 2002 and required by Rule 30a-2under the Investment Company Act of 1940 are filed herewith. |
| | |
| | (3) | | Not Applicable |
| | |
| (b) | | | | Certification pursuant to 18 U.S.C. Section 1350, as adopted pursuant to Section 906 of the Sarbanes-Oxley Act of 2002 is filed herewith. |
-4-
SIGNATURES
Pursuant to the requirements of the Securities Exchange Act of 1934 and the Investment Company Act of 1940, the registrant has duly caused this report to be signed on its behalf by the undersigned, thereunto duly authorized.
(Registrant) Valued Advisers Trust
|
| By |
|
| /s/ R. Jeffrey Young |
| R. Jeffrey Young, President and Principal Executive Officer |
|
| Date 8/8/12 |
Pursuant to the requirements of the Securities Exchange Act of 1934 and the Investment Company Act of 1940, this report has been signed below by the following persons on behalf of the registrant and in the capacities and on the dates indicated.
|
| By |
|
| /s/ R. Jeffrey Young |
| R. Jeffrey Young, President and Principal Executive Officer |
|
| Date 8/8/12 |
|
| By |
|
| /s/ William J. Murphy |
| William J. Murphy, Treasurer and Principal Financial Officer |
|
| Date 8/8/12 |