united states
securities and exchange commission
washington, d.c. 20549
form n-csr
certified shareholder report of registered management
investment companies
Investment Company Act file number 811-22208
Valued Advisers Trust
(Exact name of registrant as specified in charter)
Ultimus Fund Solutions, LLC 225 Pictoria Drive, Suite 450 Cincinnati, OH 45246
(Address of principal executive offices) (Zip code)
Ultimus Fund Solutions, LLC
Attn: Zachary Richmond
225 Pictoria Drive, Suite 450
Cincinnati, OH 45246
(Name and address of agent for service)
Registrant's telephone number, including area code: 513-587-3400
Date of fiscal year end: 10/31
Date of reporting period: 4/30/2023
Item 1. Reports to Stockholders.
(a)

DANA LARGE CAP EQUITY FUND
DANA EPIPHANY ESG SMALL CAP EQUITY FUND
DANA EPIPHANY ESG EQUITY FUND
Semi-Annual Report
April 30, 2023
Dana Investment Advisors, Inc.
20700 Swenson Drive, Suite 400
Waukesha, WI 53186
(855) 280-9648
www.danafunds.com
| Investment Results (Unaudited) |
| |
Average Annual Total Returns(a) as of April 30, 2023
| | | | | | Since |
| | | | | | Inception |
| | Six Months | One Year | Five Year | Ten Year | (10/29/13) |
| Dana Large Cap Equity Fund | | | | | |
| Institutional Class | 6.66% | (0.37)% | 8.41% | N/A | 9.73% |
| Investor Class | 6.58% | (0.59)% | 8.15% | 10.05% | N/A |
| S&P 500® Index(b) | 8.63% | 2.66% | 11.45% | 12.20% | 11.53% |
| | | | | | |
| | | Expense Ratios(c) | | |
| | | Institutional | Investor | | |
| | | Class | Class | | |
| Gross | | 0.87% | 1.12% | | |
| With Applicable Waivers | | 0.73% | 0.98% | | |
The performance quoted represents past performance, which does not guarantee future results. The investment return and principal value of an investment will fluctuate so that an investor’s shares, when redeemed, may be worth more or less than their original cost. The returns shown do not reflect deduction of taxes that a shareholder would pay on Dana Large Cap Equity Fund (the “Large Cap Fund”) distributions or the redemption of Large Cap Fund shares. Current performance of the Large Cap Fund may be lower or higher than the performance quoted. Performance data current to the most recent month end may be obtained by calling 1-855-280-9648.
| (a) | Average annual total returns reflect any change in price per share and assume the reinvestment of all distributions. The Large Cap Fund’s returns reflect any fee reductions during the applicable period. If such reductions had not occurred, the quoted performance would have been lower. Total returns for periods less than one year are not annualized. |
| (b) | The S&P 500® Index (“S&P Index”) is a widely recognized unmanaged index of equity securities and is representative of a broader domestic equity market and range of securities than is found in the Large Cap Fund’s portfolio. Individuals cannot invest directly in the S&P Index; however, an individual can invest in exchange-traded funds (“ETFs”) or other investment vehicles that attempt to track the performance of a benchmark index. |
| (c) | The expense ratios are from the Large Cap Fund’s prospectus dated February 28, 2023. Expense ratios with applicable waivers reflect that Dana Investment Advisors, Inc. (the “Adviser”) has contractually agreed to waive or limit its fees and to assume other expenses of the Large Cap Fund until February 29, 2024, so that total annual fund operating expenses do not exceed 0.73% of the Large Cap Fund’s average daily net assets. This operating expense limitation does not apply to brokerage fees and commissions, borrowing costs (such as interest and dividend expenses on securities sold short), taxes, extraordinary expenses, fees and expenses paid under a distribution plan adopted pursuant to Rule 12b-1, fees and expenses paid under a shareholder services plan, and indirect expenses (such as “Acquired Fund Fees and Expenses”). Each waiver or reimbursement of an expense by the Adviser is subject to repayment by the Large Cap Fund within three years following the date of such waiver or reimbursement, provided that the Large Cap Fund is able to make the repayment without exceeding the expense limitation in place at the time of the waiver or reimbursement and the expense limitation in place at the time of the repayment. This agreement may only be terminated by mutual consent of the Adviser and the Board of Trustees. Additional |
| Investment Results (Unaudited) (continued) |
| |
information pertaining to the Large Cap Fund’s expense ratios as of April 30, 2023 can be found in the financial highlights.
The Large Cap Fund’s investment objectives, strategies, risks, charges and expenses must be considered carefully before investing. The prospectus contains this and other important information about the Large Cap Fund and may be obtained by calling the same number as above. Please read it carefully before investing.
The Large Cap Fund is distributed by Ultimus Fund Distributors, LLC, Member FINRA/SIPC.
| Investment Results (Unaudited) (continued) |
| |
Average Annual Total Returns(a) as of April 30, 2023
| | | | | Since |
| | | | | Inception |
| | Six Months | One Year | Five Year | (11/3/15) |
| Dana Epiphany ESG Small Cap Equity Fund | | | | |
| Institutional Class | 3.52% | (0.67)% | 4.88% | 4.93% |
| Morningstar US Small Core Index(b) | 4.03% | 2.56% | 5.61% | 7.42% |
| | | | | |
| | | Expense | | |
| | | Ratios(c) | | |
| | | Institutional | | |
| | | Class | | |
| Gross | | 1.95% | | |
| With Applicable Waivers | | 0.95% | | |
| | | | | |
The performance quoted represents past performance, which does not guarantee future results. The investment return and principal value of an investment will fluctuate so that an investor’s shares, when redeemed, may be worth more or less than their original cost. The returns shown do not reflect deduction of taxes that a shareholder would pay on Dana Epiphany ESG Small Cap Equity Fund (the “Small Cap Fund”) distributions or the redemption of Small Cap Fund shares. Current performance of the Small Cap Fund may be lower or higher than the performance quoted. Performance data current to the most recent month end may be obtained by calling 1-855-280-9648.
| (a) | Average annual total returns reflect any change in price per share and assume the reinvestment of all distributions. The Small Cap Fund’s returns reflect any fee reductions during the applicable period. If such reductions had not occurred, the quoted performance would have been lower. Total returns for periods less than one year are not annualized. |
| (b) | The Morningstar US Small Core Index (“Morningstar Index”) provides a comprehensive depiction of the performance and fundamental characteristics of the Small Core segment of U.S. equity markets. The Morningstar Index does not incorporate Environmental, Social, or Governance (ESG) criteria. Individuals can not invest directly in the Morningstar Index; however, an individual can invest in ETFs or other investment vehicles that attempt to track the performance of a benchmark index. |
The Small Cap Fund is not sponsored, endorsed, sold or promoted by Morningstar, Inc. or any of its affiliates (all such entities, collectively, “Morningstar Entities”). The Morningstar Entities make no representation or warranty, express or implied, to individuals who invest in the Small Cap Fund or any member of the public regarding the advisability of investing in equity securities generally or in the Small Cap Fund in particular or the ability of the Small Cap Fund to track the Morningstar Indices or general equity market performance. THE MORNINGSTAR ENTITIES DO NOT GUARANTEE THE ACCURACY AND/OR THE COMPLETENESS OF THE MORNINGSTAR US SMALL CORE INDEX OR ANY DATA INCLUDED THEREIN AND MORNINGSTAR ENTITIES SHALL HAVE NO LIABILITY FOR ANY ERRORS, OMISSIONS, OR INTERRUPTIONS THEREIN.
| (c) | The expense ratios are from the Small Cap Fund’s prospectus dated February 28, 2023. Expense ratios with applicable waivers reflect that the Adviser has contractually agreed to waive or limit its fees and to assume other expenses of the Small Cap Fund until February 29, 2024, so that total annual fund operating expenses do not exceed 0.95% of the Small Cap Fund’s average daily net assets. This |
| Investment Results (Unaudited) (continued) |
| |
operating expense limitation does not apply to brokerage fees and commissions, borrowing costs (such as interest and dividend expenses on securities sold short), taxes, extraordinary expenses, fees and expenses paid under a distribution plan adopted pursuant to Rule 12b-1, fees and expenses paid under a shareholder services plan, and indirect expenses (such as “Acquired Fund Fees and Expenses”). Each waiver or reimbursement of an expense by the Adviser is subject to repayment by the Small Cap Fund within three years following the date of such waiver or reimbursement, provided that the Small Cap Fund is able to make the repayment without exceeding the expense limitation in place at the time of the waiver or reimbursement and the expense limitation in place at the time of the repayment. This agreement may only be terminated by mutual consent of the Adviser and the Board of Trustees. Additional information pertaining to the Small Cap Fund’s expense ratios as of April 30, 2023 can be found in the financial highlights.
The Small Cap Fund’s investment objectives, strategies, risks, charges and expenses must be considered carefully before investing. The prospectus contains this and other important information about the Small Cap Fund and may be obtained by calling the same number as above. Please read it carefully before investing.
The Small Cap Fund is distributed by Ultimus Fund Distributors, LLC, Member FINRA/SIPC.
| Investment Results (Unaudited) (continued) |
| |
Average Annual Total Returns(a) as of April 30, 2023
| | Six Months | One Year | Five Year | Ten Year |
| Dana Epiphany ESG Equity Fund | | | | |
| Institutional Class | 4.11% | (2.78)% | 7.65% | 8.57% |
| S&P 500® Index(b) | 8.63% | 2.66% | 11.45% | 12.20% |
| | | | | |
| | | | Expense | |
| | | | Ratios(c) | |
| | | | Institutional | |
| | | | Class | |
| Gross | | | 0.96% | |
| With Applicable Waivers | | | 0.85% | |
| | | | | |
The performance quoted represents past performance, which does not guarantee future results. The investment return and principal value of an investment will fluctuate so that an investor’s shares, when redeemed, may be worth more or less than their original cost. The returns shown do not reflect deduction of taxes that a shareholder would pay on Dana Epiphany ESG Equity Fund (the “Epiphany ESG Fund”) distributions or the redemption of Epiphany ESG Fund shares. Current performance of the Epiphany ESG Fund may be lower or higher than the performance quoted. Performance data current to the most recent month end may be obtained by calling 1-855-280-9648.
| (a) | Average annual total returns reflect any change in price per share and assume the reinvestment of all distributions. The Epiphany ESG Fund’s returns reflect any fee reductions during the applicable period. If such reductions had not occurred, the quoted performance would have been lower. Total returns for periods less than one year are not annualized. |
| (b) | The S&P 500® Index (“S&P Index”) is a widely recognized unmanaged index of equity securities and is representative of a broader domestic equity market and range of securities than is found in the Epiphany ESG Fund’s portfolio. Individuals cannot invest directly in the S&P Index; however, an individual can invest in ETFs or other investment vehicles that attempt to track the performance of a benchmark index. |
| (c) | The expense ratios are from the Epiphany ESG Fund’s prospectus dated February 28, 2023. Expense ratios with applicable waivers reflect that the Adviser has contractually agreed to waive or limit its fees and to assume other expenses of the Epiphany ESG Fund until February 29, 2024, so that total annual fund operating expenses do not exceed 0.85% of the Epiphany ESG Fund’s average net assets. This operating expense limitation does not apply to brokerage fees and commissions, borrowing costs (such as interest and dividend expenses on securities sold short), taxes, extraordinary expenses, fees and expenses paid under a distribution plan adopted pursuant to Rule 12b-1, fees and expenses paid under a shareholder services plan, and indirect expenses (such as “Acquired Fund Fees and Expenses”). Each waiver or reimbursement of an expense by the Adviser is subject to repayment by the Epiphany ESG Fund within three years following the date of such waiver or reimbursement, provided that the Epiphany ESG Fund is able to make the repayment without exceeding the expense limitation in place at the time of the waiver or reimbursement and the expense limitation in place at the time of the repayment. This agreement may only be terminated by mutual consent of the Adviser and the Board of Trustees. Additional information pertaining to the Epiphany ESG Fund’s expense ratios as of April 30, 2023 can be found in the financial highlights. |
| Investment Results (Unaudited) (continued) |
| |
The Epiphany ESG Fund’s investment objectives, strategies, risks, charges and expenses must be considered carefully before investing. The prospectus contains this and other important information about the Epiphany ESG Fund and may be obtained by calling the same number as above. Please read it carefully before investing.
The Epiphany ESG Fund is distributed by Ultimus Fund Distributors, LLC, Member FINRA/SIPC.
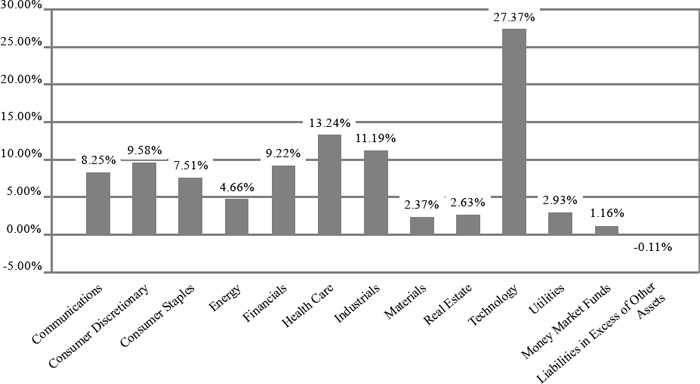
| Fund Holdings (Unaudited) |
| |
The following chart gives a visual breakdown of the Large Cap Fund by sector weighting as a percentage of net assets as of April 30, 2023.
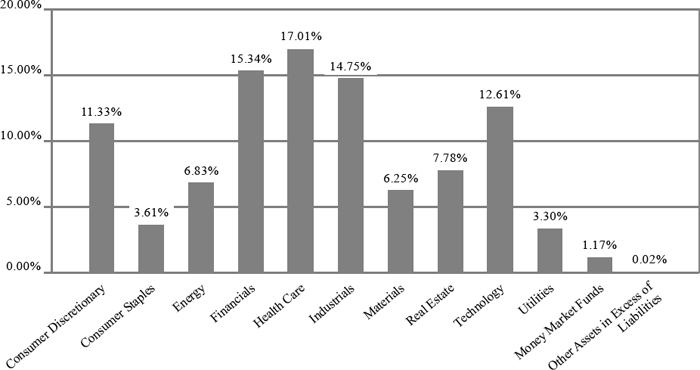
The following chart gives a visual breakdown of the Small Cap Fund by sector weighting as a percentage of net assets as of April 30, 2023.
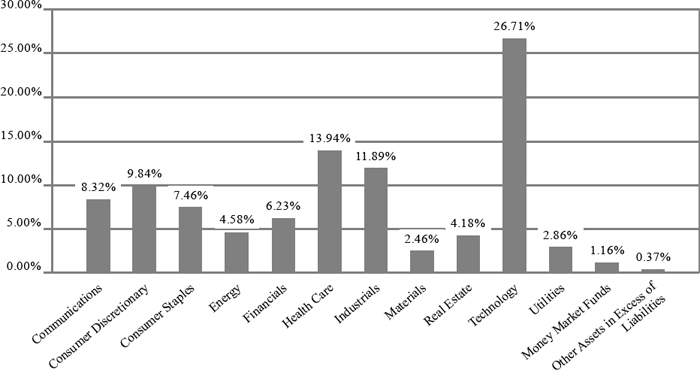
| Fund Holdings (Unaudited) |
| |
The following chart gives a visual breakdown of the Epiphany ESG Fund by sector weighting as a percentage of net assets as of April 30, 2023.
| Availability of Portfolio Schedules (Unaudited) |
| |
The Large Cap Fund, the Small Cap Fund and the Epiphany ESG Fund (each a “Fund” and collectively the “Funds”) file their complete schedules of portfolio holdings with the Securities and Exchange Commission (“SEC”) for the first and third quarters of each fiscal year as an exhibit to its reports on Form N-PORT. The Funds’ Form N-PORT reports are available on the SEC’s website at http://www.sec.gov and on the Funds’ website at http://www.danafunds.com.
| Dana Large Cap Equity Fund |
| Schedule of Investments |
| April 30, 2023 - (Unaudited) |
| COMMON STOCKS — 98.95% | | Shares | | | Fair Value | |
| Communications — 8.25% | | | | | | | | |
| Alphabet, Inc., Class A(a) | | | 36,000 | | | $ | 3,864,240 | |
| AT&T, Inc. | | | 1,000 | | | | 17,670 | |
| Comcast Corp., Class A | | | 52,000 | | | | 2,151,240 | |
| Interpublic Group of Cos., Inc. | | | 53,000 | | | | 1,893,690 | |
| Verizon Communications, Inc. | | | 6,000 | | | | 232,980 | |
| | | | | | | | 8,159,820 | |
| Consumer Discretionary — 9.58% | | | | | | | | |
| Amazon.com, Inc.(a) | | | 23,700 | | | | 2,499,165 | |
| BorgWarner, Inc. | | | 37,000 | | | | 1,780,810 | |
| Crocs, Inc.(a) | | | 13,000 | | | | 1,607,710 | |
| Tapestry, Inc. | | | 42,000 | | | | 1,714,020 | |
| Ulta Beauty, Inc.(a) | | | 3,400 | | | | 1,874,862 | |
| | | | | | | | 9,476,567 | |
| Consumer Staples — 7.51% | | | | | | | | |
| Keurig Dr Pepper, Inc. | | | 19,000 | | | | 621,300 | |
| Kimberly-Clark Corp. | | | 11,000 | | | | 1,593,790 | |
| Mondelez International, Inc., Class A | | | 29,000 | | | | 2,224,880 | |
| PepsiCo, Inc. | | | 5,800 | | | | 1,107,162 | |
| Walmart, Inc. | | | 12,500 | | | | 1,887,125 | |
| | | | | | | | 7,434,257 | |
| Energy — 4.66% | | | | | | | | |
| Cheniere Energy, Inc. | | | 3,400 | | | | 520,200 | |
| Chevron Corp. | | | 500 | | | | 84,290 | |
| ConocoPhillips | | | 11,600 | | | | 1,193,524 | |
| Exxon Mobil Corp. | | | 1,000 | | | | 118,340 | |
| Marathon Petroleum Corp. | | | 7,800 | | | | 951,600 | |
| Pioneer Natural Resources Co. | | | 8,000 | | | | 1,740,400 | |
| | | | | | | | 4,608,354 | |
| Financials — 9.22% | | | | | | | | |
| American Express Co. | | | 11,000 | | | | 1,774,740 | |
| Bank of America Corp. | | | 47,000 | | | | 1,376,160 | |
| Bank of New York Mellon Corp. (The) | | | 40,000 | | | | 1,703,600 | |
| Interactive Brokers Group, Inc., Class A | | | 21,000 | | | | 1,634,850 | |
| JPMorgan Chase & Co. | | | 3,000 | | | | 414,720 | |
| Reinsurance Group of America, Inc. | | | 7,500 | | | | 1,067,400 | |
| Wells Fargo & Co. | | | 29,000 | | | | 1,152,750 | |
| | | | | | | | 9,124,220 | |
| Health Care — 13.24% | | | | | | | | |
| AbbVie, Inc. | | | 12,800 | | | | 1,934,336 | |
| Anthem, Inc. | | | 3,700 | | | | 1,734,005 | |
| Bristol-Myers Squibb Co. | | | 26,000 | | | | 1,736,020 | |
| IQVIA Holdings, Inc.(a) | | | 7,700 | | | | 1,449,371 | |
| McKesson Corp. | | | 5,600 | | | | 2,039,744 | |
| Merck & Co., Inc. | | | 18,500 | | | | 2,136,195 | |
| UnitedHealth Group, Inc. | | | 4,200 | | | | 2,066,778 | |
| | | | | | | | 13,096,449 | |
| | | | | | | | | |
See accompanying notes which are an integral part of these financial statements.
| Dana Large Cap Equity Fund |
| Schedule of Investments (continued) |
| April 30, 2023 - (Unaudited) |
| COMMON STOCKS — 98.95% - continued | | Shares | | | Fair Value | |
| Industrials — 11.19% | | | | | | | | |
| Boeing Co. (The)(a) | | | 200 | | | $ | 41,356 | |
| Boston Scientific Corp. (a) | | | 18,000 | | | | 938,160 | |
| Deere & Co. | | | 4,500 | | | | 1,701,090 | |
| Dover Corp. | | | 12,300 | | | | 1,797,768 | |
| Norfolk Southern Corp. | | | 7,000 | | | | 1,421,210 | |
| Parker-Hannifin Corp. | | | 6,000 | | | | 1,949,280 | |
| Raytheon Technologies Corp. | | | 14,400 | | | | 1,438,560 | |
| TE Connectivity Ltd. | | | 14,600 | | | | 1,786,602 | |
| | | | | | | | 11,074,026 | |
| Materials — 2.37% | | | | | | | | |
| Albemarle Corp. | | | 3,400 | | | | 630,564 | |
| Avery Dennison Corp. | | | 5,200 | | | | 907,296 | |
| Packaging Corp. of America | | | 6,000 | | | | 811,560 | |
| | | | | | | | 2,349,420 | |
| Real Estate — 2.63% | | | | | | | | |
| Gaming and Leisure Properties, Inc. | | | 24,600 | | | | 1,279,200 | |
| Iron Mountain, Inc. | | | 24,000 | | | | 1,325,760 | |
| | | | | | | | 2,604,960 | |
| Technology — 27.37% | | | | | | | | |
| Accenture PLC, Class A | | | 6,600 | | | | 1,849,914 | |
| Adobe, Inc.(a) | | | 4,600 | | | | 1,736,776 | |
| Analog Devices, Inc. | | | 10,200 | | | | 1,834,776 | |
| Apple, Inc. | | | 27,000 | | | | 4,581,360 | |
| Broadcom, Inc. | | | 3,600 | | | | 2,255,400 | |
| CDW Corp. | | | 9,400 | | | | 1,594,146 | |
| Cisco Systems, Inc. | | | 38,000 | | | | 1,795,500 | |
| Fiserv, Inc.(a) | | | 14,400 | | | | 1,758,528 | |
| Microchip Technology, Inc. | | | 24,600 | | | | 1,795,554 | |
| Microsoft Corp. | | | 12,600 | | | | 3,871,476 | |
| Oracle Corp. | | | 5,400 | | | | 511,488 | |
| Visa, Inc., Class A | | | 8,600 | | | | 2,001,478 | |
| Workday, Inc., Class A(a) | | | 8,000 | | | | 1,489,120 | |
| | | | | | | | 27,075,516 | |
| Utilities — 2.93% | | | | | | | | |
| Eversource Energy | | | 18,600 | | | | 1,443,546 | |
| NextEra Energy, Inc. | | | 19,000 | | | | 1,455,970 | |
| | | | | | | | 2,899,516 | |
| | | | | | | | | |
| Total Common Stocks (Cost $79,870,298) | | | | | | | 97,903,105 | |
| | | | | | | | | |
See accompanying notes which are an integral part of these financial statements.
| Dana Large Cap Equity Fund |
| Schedule of Investments (continued) |
| April 30, 2023 - (Unaudited) |
| MONEY MARKET FUNDS - 1.16% | | Shares | | | Fair Value | |
| Fidelity Investments Money Market Government Portfolio, Institutional Class, 4.77%(b) | | | 1,143,845 | | | $ | 1,143,845 | |
| Total Money Market Funds (Cost $1,143,845) | | | | | | | 1,143,845 | |
| | | | | | | | | |
| Total Investments — 100.11% (Cost $81,014,143) | | | | | | | 99,046,950 | |
| Liabilities in Excess of Other Assets — (0.11)% | | | | | | | (106,199 | ) |
| NET ASSETS — 100.00% | | | | | | $ | 98,940,751 | |
| | | | | | | | | |
| (a) | Non-income producing security. |
| (b) | Rate disclosed is the seven day effective yield as of April 30, 2023. |
See accompanying notes which are an integral part of these financial statements.
| Dana Epiphany ESG Small Cap Equity Fund |
| Schedule of Investments |
| April 30, 2023 - (Unaudited) |
| COMMON STOCKS — 98.81% | | Shares | | | Fair Value | |
| Consumer Discretionary — 11.33% | | | | | | | | |
| Bloomin’ Brands, Inc. | | | 20,820 | | | $ | 515,711 | |
| Boot Barn Holdings, Inc.(a) | | | 6,344 | | | | 459,750 | |
| Deckers Outdoor Corp.(a) | | | 1,205 | | | | 577,605 | |
| GMS, Inc.(a) | | | 8,082 | | | | 469,241 | |
| Group 1 Automotive, Inc. | | | 2,087 | | | | 468,490 | |
| Malibu Boats, Inc., Class A(a) | | | 6,619 | | | | 375,628 | |
| | | | | | | | 2,866,425 | |
| Consumer Staples — 3.61% | | | | | | | | |
| e.l.f. Beauty, Inc.(a) | | | 4,827 | | | | 447,753 | |
| Simply Good Foods Co. (The)(a) | | | 12,803 | | | | 465,645 | |
| | | | | | | | 913,398 | |
| Energy — 6.83% | | | | | | | | |
| Chord Energy Corp. | | | 3,166 | | | | 450,617 | |
| EnerSys | | | 5,965 | | | | 494,916 | |
| Matador Resources Co. | | | 8,740 | | | | 428,522 | |
| Ovintiv, Inc. | | | 9,779 | | | | 352,826 | |
| | | | | | | | 1,726,881 | |
| Financials — 15.34% | | | | | | | | |
| Atlantic Union Bancshares Corp. | | | 13,259 | | | | 379,473 | |
| AXIS Capital Holdings Ltd. | | | 7,707 | | | | 435,754 | |
| Evercore, Inc., Class A | | | 3,629 | | | | 413,960 | |
| Pinnacle Financial Partners, Inc. | | | 8,288 | | | | 449,458 | |
| Primerica, Inc. | | | 2,446 | | | | 446,419 | |
| SouthState Corp. | | | 6,258 | | | | 431,677 | |
| Stifel Financial Corp. | | | 7,283 | | | | 436,762 | |
| Synovus Financial Corp. | | | 14,553 | | | | 448,232 | |
| Wintrust Financial Corp. | | | 6,394 | | | | 437,158 | |
| | | | | | | | 3,878,893 | |
| Health Care — 17.01% | | | | | | | | |
| Axsome Therapeutics, Inc.(a) | | | 6,125 | | | | 438,120 | |
| Blueprint Medicines Corp.(a) | | | 7,234 | | | | 369,296 | |
| Cytokinetics, Inc.(a) | | | 6,630 | | | | 247,962 | |
| Deciphera Pharmaceuticals, Inc.(a) | | | 11,515 | | | | 163,628 | |
| Denali Therapeutics, Inc.(a) | | | 9,540 | | | | 236,974 | |
| DocGo, Inc.(a) | | | 63,100 | | | | 536,350 | |
| Ensign Group, Inc. (The) | | | 5,495 | | | | 533,510 | |
| Envista Holdings Corp.(a) | | | 13,001 | | | | 500,408 | |
| Halozyme Therapeutics, Inc.(a) | | | 5,462 | | | | 175,494 | |
| ShockWave Medical, Inc.(a) | | | 2,077 | | | | 602,663 | |
| TG Therapeutics, Inc.(a) | | | 12,889 | | | | 320,034 | |
| Travere Therapeutics, Inc.(a) | | | 8,107 | | | | 174,868 | |
| | | | | | | | 4,299,307 | |
| Industrials — 14.75% | | | | | | | | |
| Atkore, Inc.(a) | | | 3,664 | | | | 462,873 | |
| Cactus, Inc., Class A | | | 10,510 | | | | 425,445 | |
| Clean Harbors, Inc.(a) | | | 3,738 | | | | 542,608 | |
| | | | | | | | | |
See accompanying notes which are an integral part of these financial statements.
| Dana Epiphany ESG Small Cap Equity Fund |
| Schedule of Investments (continued) |
| April 30, 2023 - (Unaudited) |
| COMMON STOCKS — 98.81% - continued | | Shares | | | Fair Value | |
| Industrials — 14.75% - continued | | | | | | | | |
| FTI Consulting, Inc.(a) | | | 2,309 | | | $ | 416,775 | |
| Hub Group, Inc., Class A(a) | | | 5,361 | | | | 404,219 | |
| John Bean Technologies Corp. | | | 4,454 | | | | 484,194 | |
| MasTec, Inc.(a) | | | 4,947 | | | | 439,343 | |
| TopBuild Corp.(a) | | | 2,461 | | | | 554,907 | |
| | | | | | | | 3,730,364 | |
| Materials — 6.25% | | | | | | | | |
| Advanced Drainage Systems, Inc. | | | 5,059 | | | | 433,657 | |
| Avient Corp. | | | 10,351 | | | | 398,617 | |
| Eagle Materials, Inc. | | | 2,664 | | | | 394,831 | |
| Element Solutions, Inc. | | | 19,450 | | | | 353,018 | |
| | | | | | | | 1,580,123 | |
| Real Estate — 7.78% | | | | | | | | |
| Agree Realty Corp. | | | 5,306 | | | | 360,755 | |
| Global Medical REIT, Inc. | | | 42,144 | | | | 391,096 | |
| Radius Global Infrastructure, Inc., Class A(a) | | | 27,655 | | | | 406,252 | |
| Spirit Realty Capital, Inc. | | | 10,225 | | | | 393,253 | |
| STAG Industrial, Inc. | | | 12,311 | | | | 416,974 | |
| | | | | | | | 1,968,330 | |
| Technology — 12.61% | | | | | | | | |
| ADTRAN Holdings, Inc. | | | 28,148 | | | | 256,710 | |
| Axcelis Technologies, Inc.(a) | | | 3,020 | | | | 357,266 | |
| Box, Inc., Class A(a) | | | 15,229 | | | | 402,960 | |
| i3 Verticals, Inc., Class A(a) | | | 17,274 | | | | 401,621 | |
| Lattice Semiconductor Corp.(a) | | | 4,487 | | | | 357,613 | |
| Perficient, Inc. (a) | | | 6,314 | | | | 409,904 | |
| Perion Network Ltd.(a) | | | 8,874 | | | | 310,856 | |
| Tenable Holdings, Inc.(a) | | | 9,088 | | | | 336,165 | |
| Veeco Instruments, Inc.(a) | | | 19,311 | | | | 355,709 | |
| | | | | | | | 3,188,804 | |
| Utilities — 3.30% | | | | | | | | |
| Chesapeake Utilities Corp. | | | 3,640 | | | | 449,540 | |
| Clearway Energy, Inc., Class C | | | 12,691 | | | | 385,426 | |
| | | | | | | | 834,966 | |
| | | | | | | | | |
| Total Common Stocks (Cost $24,638,544) | | | | | | | 24,987,491 | |
| | | | | | | | | |
See accompanying notes which are an integral part of these financial statements.
| Dana Epiphany ESG Small Cap Equity Fund |
| Schedule of Investments (continued) |
| April 30, 2023 - (Unaudited) |
| MONEY MARKET FUNDS - 1.17% | | Shares | | | Fair Value | |
| Fidelity Investments Money Market Government Portfolio, Institutional Class, 4.77%(b) | | | 296,188 | | | $ | 296,188 | |
| Total Money Market Funds (Cost $296,188) | | | | | | | 296,188 | |
| | | | | | | | | |
| Total Investments — 99.98% (Cost $24,934,732) | | | | | | | 25,283,679 | |
| Other Assets in Excess of Liabilities — 0.02% | | | | | | | 5,659 | |
| NET ASSETS — 100.00% | | | | | | $ | 25,289,338 | |
| | | | | | | | | |
| (a) | Non-income producing security. |
| (b) | Rate disclosed is the seven day effective yield as of April 30, 2023. |
REIT- Real Estate Investment Trust
See accompanying notes which are an integral part of these financial statements.
| Dana Epiphany ESG Equity Fund |
| Schedule of Investments |
| April 30, 2023 - (Unaudited) |
| COMMON STOCKS — 98.47% | | Shares | | | Fair Value | |
| Communications — 8.32% | | | | | | | | |
| Alphabet, Inc., Class A(a) | | | 18,200 | | | $ | 1,953,588 | |
| Alphabet, Inc., Class C(a) | | | 4,600 | | | | 497,812 | |
| Comcast Corp., Class A | | | 31,000 | | | | 1,282,470 | |
| Interpublic Group of Cos., Inc. | | | 34,000 | | | | 1,214,820 | |
| Verizon Communications, Inc. | | | 9,000 | | | | 349,470 | |
| | | | | | | | 5,298,160 | |
| Consumer Discretionary — 9.84% | | | | | | | | |
| Amazon.com, Inc.(a) | | | 7,500 | | | | 790,875 | |
| Best Buy Co., Inc. | | | 5,200 | | | | 387,504 | |
| BorgWarner, Inc. | | | 24,000 | | | | 1,155,120 | |
| Crocs, Inc.(a) | | | 8,000 | | | | 989,360 | |
| Home Depot, Inc. (The) | | | 1,840 | | | | 552,994 | |
| Tapestry, Inc. | | | 27,400 | | | | 1,118,194 | |
| Ulta Beauty, Inc.(a) | | | 2,300 | | | | 1,268,289 | |
| | | | | | | | 6,262,336 | |
| Consumer Staples — 7.46% | | | | | | | | |
| Darling Ingredients, Inc.(a) | | | 16,800 | | | | 1,000,776 | |
| General Mills, Inc. | | | 14,400 | | | | 1,276,272 | |
| Kimberly-Clark Corp. | | | 8,400 | | | | 1,217,076 | |
| Mondelez International, Inc., Class A | | | 16,400 | | | | 1,258,208 | |
| | | | | | | | 4,752,332 | |
| Energy — 4.58% | | | | | | | | |
| Cheniere Energy, Inc. | | | 6,600 | | | | 1,009,800 | |
| ConocoPhillips | | | 1,000 | | | | 102,890 | |
| Ovintiv, Inc. | | | 21,000 | | | | 757,680 | |
| Pioneer Natural Resources Co. | | | 4,800 | | | | 1,044,240 | |
| | | | | | | | 2,914,610 | |
| Financials — 6.23% | | | | | | | | |
| American Express Co. | | | 6,500 | | | | 1,048,710 | |
| Bank of New York Mellon Corp. (The) | | | 25,200 | | | | 1,073,268 | |
| Morgan Stanley | | | 5,000 | | | | 449,850 | |
| Reinsurance Group of America, Inc. | | | 5,600 | | | | 796,992 | |
| Webster Financial Corp. | | | 16,000 | | | | 596,800 | |
| | | | | | | | 3,965,620 | |
| Health Care — 13.94% | | | | | | | | |
| Anthem, Inc. | | | 2,500 | | | | 1,171,625 | |
| Cigna Corp. | | | 4,600 | | | | 1,165,134 | |
| CVS Health Corp. | | | 16,000 | | | | 1,172,960 | |
| Halozyme Therapeutics, Inc.(a) | | | 27,800 | | | | 893,214 | |
| Humana, Inc. | | | 2,500 | | | | 1,326,225 | |
| IQVIA Holdings, Inc.(a) | | | 5,500 | | | | 1,035,265 | |
| Truist Financial Corp. | | | 26,000 | | | | 847,080 | |
| Zoetis, Inc., Class A | | | 7,200 | | | | 1,265,616 | |
| | | | | | | | 8,877,119 | |
| Industrials — 11.89% | | | | | | | | |
| Boston Scientific Corp.(a) | | | 21,000 | | | | 1,094,520 | |
| | | | | | | | | |
See accompanying notes which are an integral part of these financial statements.
| Dana Epiphany ESG Equity Fund |
| Schedule of Investments (continued) |
| April 30, 2023 - (Unaudited) |
| COMMON STOCKS — 98.47% - continued | | Shares | | | Fair Value | |
| Industrials — 11.89% - continued | | | | | | | | |
| CSX Corp. | | | 42,000 | | | $ | 1,286,880 | |
| Deere & Co. | | | 3,500 | | | | 1,323,070 | |
| Regal-Beloit Corp. | | | 9,100 | | | | 1,184,456 | |
| TE Connectivity Ltd. | | | 9,400 | | | | 1,150,278 | |
| W.W. Grainger, Inc. | | | 2,200 | | | | 1,530,254 | |
| | | | | | | | 7,569,458 | |
| Materials — 2.46% | | | | | | | | |
| Albemarle Corp. | | | 2,900 | | | | 537,834 | |
| Avery Dennison Corp. | | | 2,800 | | | | 488,544 | |
| Packaging Corp. of America | | | 4,000 | | | | 541,040 | |
| | | | | | | | 1,567,418 | |
| Real Estate — 4.18% | | | | | | | | |
| American Tower Corp., Class A | | | 1,800 | | | | 367,902 | |
| Hannon Armstrong Sustainable Infrastructure Capital, Inc. | | | 34,000 | | | | 964,920 | |
| Iron Mountain, Inc. | | | 15,000 | | | | 828,600 | |
| Spirit Realty Capital, Inc. | | | 13,000 | | | | 499,980 | |
| | | | | | | | 2,661,402 | |
| Technology — 26.71% | | | | | | | | |
| Accenture PLC, Class A | | | 4,800 | | | | 1,345,392 | |
| Allegro MicroSystems, Inc.(a) | | | 30,000 | | | | 1,073,100 | |
| Analog Devices, Inc. | | | 6,900 | | | | 1,241,172 | |
| Apple, Inc. | | | 15,000 | | | | 2,545,200 | |
| Cadence Design Systems, Inc.(a) | | | 6,600 | | | | 1,382,370 | |
| CDW Corp. | | | 6,000 | | | | 1,017,540 | |
| Cisco Systems, Inc. | | | 27,000 | | | | 1,275,750 | |
| Fiserv, Inc.(a) | | | 8,800 | | | | 1,074,656 | |
| Microchip Technology, Inc. | | | 16,400 | | | | 1,197,036 | |
| Microsoft Corp. | | | 8,000 | | | | 2,458,080 | |
| Visa, Inc., Class A | | | 5,500 | | | | 1,280,015 | |
| Workday, Inc., Class A(a) | | | 6,000 | | | | 1,116,840 | |
| | | | | | | | 17,007,151 | |
| Utilities — 2.86% | | | | | | | | |
| Eversource Energy | | | 11,400 | | | | 884,754 | |
| NextEra Energy, Inc. | | | 12,200 | | | | 934,886 | |
| | | | | | | | 1,819,640 | |
| | | | | | | | | |
| Total Common Stocks (Cost $62,961,261) | | | | | | | 62,695,246 | |
| | | | | | | | | |
See accompanying notes which are an integral part of these financial statements.
| Dana Epiphany ESG Equity Fund |
| Schedule of Investments (continued) |
| April 30, 2023 - (Unaudited) |
| MONEY MARKET FUNDS - 1.16% | | Shares | | | Fair Value | |
| Fidelity Investments Money Market Government Portfolio, Institutional Class, 4.77%(b) | | | 740,141 | | | $ | 740,141 | |
| Total Money Market Funds (Cost $740,141) | | | | | | | 740,141 | |
| | | | | | | | | |
| Total Investments — 99.63% (Cost $63,701,402) | | | | | | | 63,435,387 | |
| Other Assets in Excess of Liabilities — 0.37% | | | | | | | 237,307 | |
| NET ASSETS — 100.00% | | | | | | $ | 63,672,694 | |
| | | | | | | | | |
| (a) | Non-income producing security. |
| (b) | Rate disclosed is the seven day effective yield as of April 30, 2023. |
See accompanying notes which are an integral part of these financial statements.
| Dana Funds |
| Statements of Assets and Liabilities |
| April 30, 2023 - (Unaudited) |
| | | | | | Dana | | | | |
| | | | | | Epiphany | | | Dana | |
| | | Dana Large | | | ESG Small | | | Epiphany | |
| | | Cap Equity | | | Cap Equity | | | ESG Equity | |
| | | Fund | | | Fund | | | Fund | |
| Assets | | | | | | | | | | | | |
| Investments in securities at fair value (cost $81,014,143, $24,934,732 and $63,701,402) (Note 3) | | $ | 99,046,950 | | | $ | 25,283,679 | | | $ | 63,435,387 | |
| Cash | | | 3,000 | | | | — | | | | — | |
| Receivable for fund shares sold | | | 4,021 | | | | 18,153 | | | | 227,789 | |
| Dividends receivable | | | 76,253 | | | | 3,964 | | | | 55,970 | |
| Prepaid expenses | | | 15,147 | | | | 11,871 | | | | 15,285 | |
| Total Assets | | | 99,145,371 | | | | 25,317,667 | | | | 63,734,431 | |
| | | | | | | | | | | | | |
| Liabilities | | | | | | | | | | | | |
| Payable for fund shares redeemed | | | 132,107 | | | | 1,630 | | | | 6,905 | |
| Payable to Adviser (Note 4) | | | 38,340 | | | | 4,462 | | | | 27,631 | |
| Accrued Distribution (12b-1) fees (Note 4) | | | 4,197 | | | | — | | | | — | |
| Payable to Administrator (Note 4) | | | 10,161 | | | | 6,370 | | | | 7,568 | |
| Payable to trustees (Note 4) | | | 2,215 | | | | 2,215 | | | | 2,215 | |
| Other accrued expenses | | | 17,600 | | | | 13,652 | | | | 17,418 | |
| Total Liabilities | | | 204,620 | | | | 28,329 | | | | 61,737 | |
| Net Assets | | $ | 98,940,751 | | | $ | 25,289,338 | | | $ | 63,672,694 | |
| | | | | | | | | | | | | |
| Net Assets consist of: | | | | | | | | | | | | |
| Paid-in capital | | $ | 74,991,247 | | | $ | 24,818,858 | | | $ | 63,824,343 | |
| Accumulated earnings (deficit) | | | 23,949,504 | | | | 470,480 | | | | (151,649 | ) |
| Net Assets | | $ | 98,940,751 | | | $ | 25,289,338 | | | $ | 63,672,694 | |
| Institutional Class: | | | | | | | | | | | | |
| Net Assets | | $ | 78,675,049 | | | $ | 25,289,338 | | | $ | 63,672,694 | |
| Shares outstanding (unlimited number of shares authorized, no par value) | | | 3,782,006 | | | | 2,210,202 | | | | 5,340,156 | |
| Net asset value, offering and redemption price per share (Note 2) | | $ | 20.80 | | | $ | 11.44 | | | $ | 11.92 | |
| Investor Class: | | | | | | | | | | | | |
| Net Assets | | $ | 20,265,702 | | | | | | | | | |
| Shares outstanding (unlimited number of shares authorized, no par value) | | | 973,991 | | | | | | | | | |
| Net asset value, offering and redemption price per share (Note 2) | | $ | 20.81 | | | | | | | | | |
| | | | | | | | | | | | | |
See accompanying notes which are an integral part of these financial statements.
| Dana Funds |
| Statements of Operations |
| For the six months ended April 30, 2023 - (Unaudited) |
| | | | | | Dana Epiphany | | | Dana Epiphany | |
| | | Dana Large Cap | | | ESG Small Cap | | | ESG Equity | |
| | | Equity Fund | | | Equity Fund | | | Fund | |
| Investment Income | | | | | | | | | | | | |
| Dividend income | | $ | 1,053,230 | | | $ | 161,106 | | | $ | 586,001 | |
| Total investment income | | | 1,053,230 | | | | 161,106 | | | | 586,001 | |
| | | | | | | | | | | | | |
| Expenses | | | | | | | | | | | | |
| Investment Adviser fees (Note 4) | | | 327,423 | | | | 88,896 | | | | 204,864 | |
| Administration fees (Note 4) | | | 29,950 | | | | 15,395 | | | | 19,265 | |
| Distribution (12b-1) fees, Investor Class (Note 4) | | | 25,407 | | | | — | | | | — | |
| Fund accounting fees (Note 4) | | | 19,889 | | | | 12,829 | | | | 13,429 | |
| Registration expenses | | | 19,152 | | | | 11,389 | | | | 13,684 | |
| Transfer agent fees (Note 4) | | | 11,803 | | | | 9,237 | | | | 9,237 | |
| Audit and tax preparation fees | | | 9,372 | | | | 9,372 | | | | 9,372 | |
| Legal fees | | | 9,325 | | | | 9,325 | | | | 9,325 | |
| Custodian fees | | | 7,612 | | | | 3,144 | | | | 6,769 | |
| Printing and postage expenses | | | 4,606 | | | | 1,578 | | | | 3,614 | |
| Trustee fees (Note 4) | | | 3,845 | | | | 3,845 | | | | 3,845 | |
| Insurance expenses | | | 2,305 | | | | 1,659 | | | | 2,126 | |
| Compliance service fees (Note 4) | | | 1,488 | | | | 1,488 | | | | 1,488 | |
| Miscellaneous expenses | | | 11,952 | | | | 10,808 | | | | 11,799 | |
| Total expenses | | | 484,129 | | | | 178,965 | | | | 308,817 | |
| Fees contractually waived by Adviser (Note 4) | | | (91,036 | ) | | | (66,378 | ) | | | (40,860 | ) |
| Net operating expenses | | | 393,093 | | | | 112,587 | | | | 267,957 | |
| Net investment income | | | 660,137 | | | | 48,519 | | | | 318,044 | |
| Net Realized and Change in Unrealized Gain (Loss) on Investments | | | | | | | | | | | | |
| Net realized gain on investment securities transactions | | | 5,931,866 | | | | 120,102 | | | | 1,175,934 | |
| Net change in unrealized appreciation (depreciation) on investment securities | | | (105,521 | ) | | | 440,125 | | | | 1,274,887 | |
| Net realized and change in unrealized gain on investments | | | 5,826,345 | | | | 560,227 | | | | 2,450,821 | |
| Net increase in net assets resulting from operations | | $ | 6,486,482 | | | $ | 608,746 | | | $ | 2,768,865 | |
| | | | | | | | | | | | | |
See accompanying notes which are an integral part of these financial statements.
| Dana Funds |
| Statements of Changes in Net Assets |
| | | Dana Large Cap Equity Fund | |
| | | For the Six | | | For the Year | |
| | | Months Ended | | | Ended October | |
| | | April 30, 2023 | | | 31, 2022 | |
| | | (Unaudited) | | | | |
| Increase (Decrease) in Net Assets due to: | | | | | | | | |
| Operations | | | | | | | | |
| Net investment income | | $ | 660,137 | | | $ | 1,335,454 | |
| Net realized gain on investment securities transactions | | | 5,931,866 | | | | 7,882,982 | |
| Net change in unrealized depreciation of investment securities | | | (105,521 | ) | | | (32,144,030 | ) |
| Net increase (decrease) in net assets resulting from operations | | | 6,486,482 | | | | (22,925,594 | ) |
| | | | | | | | | |
| Distributions to Shareholders from Earnings (Note 2) | | | | | | | | |
| Institutional Class | | | (6,816,196 | ) | | | (14,198,810 | ) |
| Investor Class | | | (1,625,947 | ) | | | (3,218,987 | ) |
| Total distributions | | | (8,442,143 | ) | | | (17,417,797 | ) |
| Capital Transactions – Institutional Class | | | | | | | | |
| Proceeds from shares sold | | | 2,821,475 | | | | 14,475,937 | |
| Reinvestment of distributions | | | 3,856,168 | | | | 7,925,662 | |
| Amount paid for shares redeemed | | | (8,758,982 | ) | | | (22,829,242 | ) |
| Total – Institutional Class | | | (2,081,339 | ) | | | (427,643 | ) |
| Capital Transactions – Investor Class | | | | | | | | |
| Proceeds from shares sold | | | 110,642 | | | | 368,279 | |
| Reinvestment of distributions | | | 1,528,170 | | | | 3,041,633 | |
| Amount paid for shares redeemed | | | (966,100 | ) | | | (2,415,054 | ) |
| Total – Investor Class | | | 672,712 | | | | 994,858 | |
| Net increase (decrease) in net assets resulting from capital transactions | | | (1,408,627 | ) | | | 567,215 | |
| Total Decrease in Net Assets | | | (3,364,288 | ) | | | (39,776,176 | ) |
| | | | | | | | | |
| Net Assets | | | | | | | | |
| Beginning of period | | | 102,305,039 | | | | 142,081,215 | |
| End of period | | $ | 98,940,751 | | | $ | 102,305,039 | |
| | | | | | | | | |
| Share Transactions - Institutional Class | | | | | | | | |
| Shares sold | | | 132,969 | | | | 577,714 | |
| Shares issued in reinvestment of distributions | | | 195,783 | | | | 299,112 | |
| Shares redeemed | | | (421,098 | ) | | | (959,176 | ) |
| Total – Institutional Class | | | (92,346 | ) | | | (82,350 | ) |
| Share Transactions - Investor Class | | | | | | | | |
| Shares sold | | | 5,307 | | | | 15,632 | |
| Shares issued in reinvestment of distributions | | | 77,552 | | | | 114,484 | |
| Shares redeemed | | | (46,227 | ) | | | (101,487 | ) |
| Total – Investor Class | | | 36,632 | | | | 28,629 | |
| | | | | | | | | |
See accompanying notes which are an integral part of these financial statements.
| Dana Funds |
| Statements of Changes in Net Assets (continued) |
| |
| | | Dana Epiphany ESG Small Cap | |
| | | Equity Fund | |
| | | For the Six | | | For the Year | |
| | | Months Ended | | | Ended October | |
| | | April 30, 2023 | | | 31, 2022 | |
| | | (Unaudited) | | | | |
| Increase (Decrease) in Net Assets due to: | | | | | | | | |
| Operations | | | | | | | | |
| Net investment income | | $ | 48,519 | | | $ | 9,163 | |
| Net realized gain on investment securities transactions | | | 120,102 | | | | 1,159,913 | |
| Net change in unrealized appreciation (depreciation) of investment securities | | | 440,125 | | | | (4,828,049 | ) |
| Net increase (decrease) in net assets resulting from operations | | | 608,746 | | | | (3,658,973 | ) |
| | | | | | | | | |
| Distributions to Shareholders from Earnings (Note 2) | | | | | | | | |
| Institutional Class | | | (1,160,149 | ) | | | (1,429,190 | ) |
| Total distributions | | | (1,160,149 | ) | | | (1,429,190 | ) |
| Capital Transactions – Institutional Class | | | | | | | | |
| Proceeds from shares sold | | | 15,138,831 | | | | 4,022,076 | |
| Reinvestment of distributions | | | 1,149,796 | | | | 1,400,259 | |
| Amount paid for shares redeemed | | | (3,905,945 | ) | | | (4,314,843 | ) |
| Total – Institutional Class | | | 12,382,682 | | | | 1,107,492 | |
| Net increase in net assets resulting from capital transactions | | | 12,382,682 | | | | 1,107,492 | |
| Total Increase (Decrease) in Net Assets | | | 11,831,279 | | | | (3,980,671 | ) |
| | | | | | | | | |
| Net Assets | | | | | | | | |
| Beginning of period | | | 13,458,059 | | | | 17,438,730 | |
| End of period | | $ | 25,289,338 | | | $ | 13,458,059 | |
| | | | | | | | | |
| Share Transactions - Institutional Class | | | | | | | | |
| Shares sold | | | 1,280,568 | | | | 291,572 | |
| Shares issued in reinvestment of distributions | | | 106,496 | | | | 95,256 | |
| Shares redeemed | | | (335,271 | ) | | | (324,787 | ) |
| Total – Institutional Class | | | 1,051,793 | | | | 62,041 | |
| | | | | | | | | |
See accompanying notes which are an integral part of these financial statements.
| Dana Funds |
| Statements of Changes in Net Assets (continued) |
| | | Dana Epiphany ESG Equity Fund | |
| | | For the Six | | | For the Year | |
| | | Months Ended | | | Ended October | |
| | | April 30, 2023 | | | 31, 2022 | |
| | | (Unaudited) | | | | |
| Increase (Decrease) in Net Assets due to: | | | | | | | | |
| Operations | | | | | | | | |
| Net investment income | | $ | 318,044 | | | $ | 678,437 | |
| Net realized gain (loss) on investment securities transactions | | | 1,175,934 | | | | (1,150,639 | ) |
| Net change in unrealized appreciation (depreciation) of investment securities | | | 1,274,887 | | | | (12,474,484 | ) |
| Net increase (decrease) in net assets resulting from operations | | | 2,768,865 | | | | (12,946,686 | ) |
| | | | | | | | | |
| Distributions to Shareholders from Earnings (Note 2) | | | | | | | | |
| Institutional Class | | | (306,956 | ) | | | (1,696,546 | ) |
| Total distributions | | | (306,956 | ) | | | (1,696,546 | ) |
| Capital Transactions – Institutional Class | | | | | | | | |
| Proceeds from shares sold | | | 9,592,519 | | | | 36,072,130 | |
| Reinvestment of distributions | | | 304,058 | | | | 1,650,842 | |
| Amount paid for shares redeemed | | | (21,676,929 | ) | | | (17,645,598 | ) |
| Total – Institutional Class | | | (11,780,352 | ) | | | 20,077,374 | |
| Net increase (decrease) in net assets resulting from capital transactions | | | (11,780,352 | ) | | | 20,077,374 | |
| Total Increase (Decrease) in Net Assets | | | (9,318,443 | ) | | | 5,434,142 | |
| | | | | | | | | |
| Net Assets | | | | | | | | |
| Beginning of period | | | 72,991,137 | | | | 67,556,995 | |
| End of period | | $ | 63,672,694 | | | $ | 72,991,137 | |
| | | | | | | | | |
| Share Transactions - Institutional Class | | | | | | | | |
| Shares sold | | | 801,625 | | | | 2,777,361 | |
| Shares issued in reinvestment of distributions | | | 26,626 | | | | 121,043 | |
| Shares redeemed | | | (1,827,954 | ) | | | (1,394,549 | ) |
| Total – Institutional Class | | | (999,703 | ) | | | 1,503,855 | |
| | | | | | | | | |
See accompanying notes which are an integral part of these financial statements
| Dana Large Cap Equity Fund – Institutional Class |
| Financial Highlights |
| |
| (For a share oustanding during each period) |
| | | For the Six | | | | | | | | | | | | | | | | |
| | | Months | | | | | | | | | | | | | | | | |
| | | Ended April | | | | | | | | | | | | | | | | |
| | | 30, 2023 | | | For the Years Ended October 31, | |
| | | (Unaudited) | | | 2022 | | | 2021 | | | 2020 | | | 2019 | | | 2018 | |
| Selected Per Share Data | | | | | | | | | | | | | | | | | | | | | | | | |
| Net asset value, beginning of period | | $ | 21.26 | | | $ | 29.20 | | | $ | 21.25 | | | $ | 22.69 | | | $ | 22.35 | | | $ | 22.64 | |
| Investment operations: | | | | | | | | | | | | | | | | | | | | | | | | |
| Net investment income | | | 0.14 | | | | 0.28 | | | | 0.17 | | | | 0.23 | | | | 0.38 | | | | 0.32 | |
| Net realized and unrealized gain (loss) on investments | | | 1.17 | | | | (4.60 | ) | | | 8.39 | | | | 0.86 | | | | 2.46 | | | | 0.45 | |
| Total from investment operations | | | 1.31 | | | | (4.32 | ) | | | 8.56 | | | | 1.09 | | | | 2.84 | | | | 0.77 | |
| Less distributions to shareholders from: | | | | | | | | | | | | | | | | | | | | | | | | |
| Net investment income | | | (0.15 | ) | | | (0.25 | ) | | | (0.17 | ) | | | (0.23 | ) | | | (0.36 | ) | | | (0.32 | ) |
| Net realized gains | | | (1.62 | ) | | | (3.37 | ) | | | (0.44 | ) | | | (2.30 | ) | | | (2.14 | ) | | | (0.74 | ) |
| Total distributions | | | (1.77 | ) | | | (3.62 | ) | | | (0.61 | ) | | | (2.53 | ) | | | (2.50 | ) | | | (1.06 | ) |
| Net asset value, end of period | | $ | 20.80 | | | $ | 21.26 | | | $ | 29.20 | | | $ | 21.25 | | | $ | 22.69 | | | $ | 22.35 | |
| Total Return(a) | | | 6.66 | % (b) | | | (17.16 | )% | | | 40.89 | % | | | 4.65 | % | | | 15.55 | % | | | 3.27 | % |
| Ratios and Supplemental Data: | | | | | | | | | | | | | | | | | | | | | | | | |
| Net assets, end of period (000 omitted) | | $ | 78,675 | | | $ | 82,373 | | | $ | 115,544 | | | $ | 91,379 | | | $ | 107,026 | | | $ | 176,954 | |
| Before waiver | | | | | | | | | | | | | | | | | | | | | | | | |
| Ratio of expenses to average net assets | | | 0.90 | % (c) | | | 0.87 | % | | | 0.86 | % | | | 0.91 | % | | | 0.85 | % | | | 0.86 | % |
| After waiver | | | | | | | | | | | | | | | | | | | | | | | | |
| Ratio of expenses to average net assets | | | 0.73 | % (c) | | | 0.73 | % | | | 0.73 | % | | | 0.73 | % | | | 0.73 | % | | | 0.73 | % |
| Ratio of net investment income to average net assets | | | 1.36 | % (c) | | | 1.14 | % | | | 0.65 | % | | | 1.10 | % | | | 1.68 | % | | | 1.41 | % |
| Portfolio turnover rate(d) | | | 19 | % (b) | | | 38 | % | | | 30 | % | | | 57 | % | | | 50 | % | | | 58 | % |
| | | | | | | | | | | | | | | | | | | | | | | | | |
| (a) | Total return in the above table represents the rate that the investor would have earned or lost on an investment in the Fund, assuming reinvestment of distributions. |
| (d) | Portfolio turnover is calculated on the basis of the Fund as a whole without distinguishing among the classes of shares. |
See accompanying notes which are an integral part of these financial statements.
| Dana Large Cap Equity Fund – Investor Class |
| Financial Highlights |
| |
| (For a share oustanding during each period) |
| | | For the Six | | | | | | | | | | |
| | | Months | | | | | | | | | | | | | | | | |
| | | Ended April | | | | | | | | | | | | | | | | |
| | | 30, 2023 | | | For the Years Ended October 31, | |
| | | (Unaudited) | | | 2022 | | | 2021 | | | 2020 | | | 2019 | | | 2018 | |
| Selected Per Share Data | | | | | | | | | | | | | | | | | | | | | | | | |
| Net asset value, beginning of period | | $ | 21.26 | | | $ | 29.20 | | | $ | 21.26 | | | $ | 22.69 | | | $ | 22.35 | | | $ | 22.64 | |
| Investment operations: | | | | | | | | | | | | | | | | | | | | | | | | |
| Net investment income | | | 0.12 | | | | 0.22 | | | | 0.10 | | | | 0.18 | | | | 0.30 | | | | 0.28 | |
| Net realized and unrealized gain (loss) on investments | | | 1.18 | | | | (4.60 | ) | | | 8.39 | | | | 0.87 | | | | 2.50 | | | | 0.43 | |
| Total from investment operations | | | 1.30 | | | | (4.38 | ) | | | 8.49 | | | | 1.05 | | | | 2.80 | | | | 0.71 | |
| Less distributions to shareholders from: | | | | | | | | | | | | | | | | | | | | | | | | |
| Net investment income | | | (0.13 | ) | | | (0.19 | ) | | | (0.11 | ) | | | (0.18 | ) | | | (0.32 | ) | | | (0.26 | ) |
| Net realized gains | | | (1.62 | ) | | | (3.37 | ) | | | (0.44 | ) | | | (2.30 | ) | | | (2.14 | ) | | | (0.74 | ) |
| Total distributions | | | (1.75 | ) | | | (3.56 | ) | | | (0.55 | ) | | | (2.48 | ) | | | (2.46 | ) | | | (1.00 | ) |
| Net asset value, end of period | | $ | 20.81 | | | $ | 21.26 | | | $ | 29.20 | | | $ | 21.26 | | | $ | 22.69 | | | $ | 22.35 | |
| Total Return(a) | | | 6.58 | % (b) | | | (17.38 | )% | | | 40.48 | % | | | 4.43 | % | | | 15.29 | % | | | 3.01 | % |
| Ratios and Supplemental Data: | | | | | | | | | | | | | | | | | | | | | | | | |
| Net assets, end of period (000 omitted) | | $ | 20,266 | | | $ | 19,932 | | | $ | 26,537 | | | $ | 24,615 | | | $ | 25,398 | | | $ | 28,870 | |
| Before waiver | | | | | | | | | | | | | | | | | | | | | | | | |
| Ratio of expenses to average net assets | | | 1.20 | % (c) | | | 1.12 | % | | | 1.11 | % | | | 1.16 | % | | | 1.10 | % | | | 1.11 | % |
| After waiver | | | | | | | | | | | | | | | | | | | | | | | | |
| Ratio of expenses to average net assets | | | 0.98 | % (c) | | | 0.98 | % | | | 0.98 | % | | | 0.98 | % | | | 0.98 | % | | | 0.98 | % |
| Ratio of net investment income to average net assets | | | 1.11 | % (c) | | | 0.89 | % | | | 0.40 | % | | | 0.85 | % | | | 1.40 | % | | | 1.17 | % |
| Portfolio turnover rate(d) | | | 19 | % (b) | | | 38 | % | | | 30 | % | | | 57 | % | | | 50 | % | | | 58 | % |
| | | | | | | | | | | | | | | | | | | | | | | | | |
| (a) | Total return in the above table represents the rate that the investor would have earned or lost on an investment in the Fund, assuming reinvestment of distributions. |
| (d) | Portfolio turnover is calculated on the basis of the Fund as a whole without distinguishing among the classes of shares. |
See accompanying notes which are an integral part of these financial statements.
| Dana Epiphany ESG Small Cap Equity Fund – Institutional Class |
| Financial Highlights |
| |
| (For a share oustanding during each period) |
| | | For the Six | | | | | | | | | | | | | | | | |
| | | Months | | | | | | | | | | | | | | | | |
| | | Ended April | | | | | | | | | | | | | | | | |
| | | 30, 2023 | | | For the Years Ended October 31, | |
| | | (Unaudited) | | | 2022 | | | 2021 | | | 2020 | | | 2019 | | | 2018 | |
| Selected Per Share Data | | | | | | | | | | | | | | | | | | | | | | | | |
| Net asset value, beginning of period | | $ | 11.62 | | | $ | 15.91 | | | $ | 9.82 | | | $ | 10.24 | | | $ | 11.09 | | | $ | 11.43 | |
| Investment operations: | | | | | | | | | | | | | | | | | | | | | | | | |
| Net investment income (loss) | | | 0.03 | | | | 0.01 | | | | (0.03 | ) | | | 0.01 | | | | 0.01 | | | | (0.03 | ) |
| Net realized and unrealized gain (loss) on investments | | | 0.35 | | | | (3.02 | ) | | | 6.12 | | | | (0.42 | ) | | | (0.05 | ) | | | (0.31 | ) |
| Total from investment operations | | | 0.38 | | | | (3.01 | ) | | | 6.09 | | | | (0.41 | ) | | | (0.04 | ) | | | (0.34 | ) |
| Less distributions to shareholders from: | | | | | | | | | | | | | | | | | | | | | | | | |
| Net investment income | | | (0.02 | ) | | | — | | | | — | | | | (0.01 | ) | | | — | | | | — | (a) |
| Net realized gains | | | (0.54 | ) | | | (1.28 | ) | | | — | | | | — | | | | (0.81 | ) | | | — | |
| Total distributions | | | (0.56 | ) | | | (1.28 | ) | | | — | | | | (0.01 | ) | | | (0.81 | ) | | | — | (a) |
| Net asset value, end of period | | $ | 11.44 | | | $ | 11.62 | | | $ | 15.91 | | | $ | 9.82 | | | $ | 10.24 | | | $ | 11.09 | |
| Total Return(b) | | | 3.52 | % (c) | | | (20.59 | )% | | | 62.02 | % | | | (4.04 | )% | | | 0.83 | % | | | (2.95 | )% |
| Ratios and Supplemental Data: | | | | | | | | | | | | | | | | | | | | | | | | |
| Net assets, end of period (000 omitted) | | $ | 25,289 | | | $ | 13,458 | | | $ | 17,439 | | | $ | 9,861 | | | $ | 12,421 | | | $ | 16,196 | |
| Before waiver | | | | | | | | | | | | | | | | | | | | | | | | |
| Ratio of expenses to average net assets | | | 1.51 | % (d) | | | 1.95 | % | | | 2.05 | % | | | 2.58 | % | | | 1.88 | % | | | 1.75 | % |
| After waiver | | | | | | | | | | | | | | | | | | | | | | | | |
| Ratio of expenses to average net assets | | | 0.95 | % (d) | | | 0.95 | % | | | 0.95 | % | | | 0.95 | % | | | 0.95 | % | | | 0.95 | % |
| Ratio of net investment income (loss) to average net assets | | | 0.41 | % (d) | | | 0.06 | % | | | (0.24 | )% | | | 0.02 | % | | | 0.11 | % | | | (0.24 | )% |
| Portfolio turnover rate | | | 28 | % (c) | | | 82 | % | | | 92 | % | | | 88 | % | | | 50 | % | | | 78 | % |
| | | | | | | | | | | | | | | | | | | | | | | | | |
| (a) | Rounds to less than $0.005 per share. |
| (b) | Total return in the above table represents the rate that the investor would have earned or lost on an investment in the Fund, assuming reinvestment of distributions. |
See accompanying notes which are an integral part of these financial statements.
| Dana Epiphany ESG Equity Fund – Institutional Class |
| Financial Highlights |
| |
| (For a share oustanding during each period) |
| | | For the Six | | | | | | | | | | | | | | | | |
| | | Months | | | | | | | | | | | | | | | | |
| | | Ended April | | | | | | | | | | | | | | | | |
| | | 30, 2023 | | | For the Years Ended October 31, | |
| | | (Unaudited) | | | 2022 | | | 2021 | | | 2020 | | | 2019 | | | 2018 | |
| Selected Per Share Data | | | | | | | | | | | | | | | | | | | | | | | | |
| Net asset value, beginning of period | | $ | 11.51 | | | $ | 13.97 | | | $ | 10.25 | | | $ | 11.58 | | | $ | 11.80 | | | $ | 13.09 | |
| Investment operations: | | | | | | | | | | | | | | | | | | | | | | | | |
| Net investment income | | | 0.07 | | | | 0.11 | | | | 0.06 | | | | 0.09 | | | | 0.14 | | | | 0.08 | (a) |
| Net realized and unrealized gain (loss) on investments | | | 0.40 | | | | (2.27 | ) | | | 3.87 | | | | 0.47 | | | | 1.15 | | | | 0.74 | |
| Total from investment operations | | | 0.47 | | | | (2.16 | ) | | | 3.93 | | | | 0.56 | | | | 1.29 | | | | 0.82 | |
| Less distributions to shareholders from: | | | | | | | | | | | | | | | | | | | | | | | | |
| Net investment income | | | (0.06 | ) | | | (0.11 | ) | | | (0.06 | ) | | | (0.10 | ) | | | (0.12 | ) | | | (0.08 | ) |
| Net realized gains | | | — | | | | (0.19 | ) | | | (0.15 | ) | | | (1.79 | ) | | | (1.39 | ) | | | (2.03 | ) |
| Total distributions | | | (0.06 | ) | | | (0.30 | ) | | | (0.21 | ) | | | (1.89 | ) | | | (1.51 | ) | | | (2.11 | ) |
| Net asset value, end of period | | $ | 11.92 | | | $ | 11.51 | | | $ | 13.97 | | | $ | 10.25 | | | $ | 11.58 | | | $ | 11.80 | |
| Total Return(b) | | | 4.11 | % (c) | | | (15.76 | )% | | | 38.70 | % | | | 4.76 | % | | | 12.76 | % | | | 6.32 | % |
| Ratios and Supplemental Data: | | | | | | | | | | | | | | | | | | | | | | | | |
| Net assets, end of period (000 omitted) | | $ | 63,673 | | | $ | 72,991 | | | $ | 67,557 | | | $ | 13,062 | | | $ | 5,079 | | | $ | 6,485 | |
| Before waiver | | | | | | | | | | | | | | | | | | | | | | | | |
| Ratio of expenses to average net assets | | | 0.98 | % (d) | | | 0.96 | % | | | 1.12 | % | | | 2.00 | % | | | 2.13 | % | | | 1.63 | % |
| After waiver | | | | | | | | | | | | | | | | | | | | | | | | |
| Ratio of expenses to average net assets | | | 0.85 | % (d) | | | 0.85 | % | | | 0.85 | % | | | 0.85 | % | | | 0.90 | % | | | 1.25 | % |
| Ratio of net investment income to average net assets | | | 1.01 | % (d) | | | 0.91 | % | | | 0.57 | % | | | 0.89 | % | | | 1.19 | % | | | 0.62 | % |
| Portfolio turnover rate | | | 28 | % (c) | | | 33 | % | | | 18 | % | | | 67 | % | | | 60 | % | | | 23 | % |
| | | | | | | | | | | | | | | | | | | | | | | | | |
| (a) | Per share net investment income (loss) has been determined on the basis of average shares outstanding during the period. |
| (b) | Total return in the above table represents the rate that the investor would have earned or lost on an investment in the Fund, assuming reinvestment of distributions. |
See accompanying notes which are an integral part of these financial statements.
| Dana Funds |
| Notes to the Financial Statements |
| April 30, 2023 - (Unaudited) |
NOTE 1. ORGANIZATION
The Dana Large Cap Equity Fund (the “Large Cap Fund”), the Dana Epiphany ESG Small Cap Equity Fund (the “Small Cap Fund”), and the Dana Epiphany ESG Equity Fund (the “Epiphany ESG Fund”) (each a “Fund” and collectively, the “Funds”) are each registered under the Investment Company Act of 1940, as amended (“1940 Act”), as an open-end diversified series of Valued Advisers Trust (the “Trust”). The Trust is a management investment company established under the laws of Delaware by an Agreement and Declaration of Trust dated June 13, 2008 (the “Trust Agreement”). The Trust Agreement permits the Board of Trustees (“Board”) to issue an unlimited number of shares of beneficial interest of separate series without par value. Each Fund is one of a series of funds currently authorized by the Board. The investment adviser to the Funds is Dana Investment Advisors, Inc. (the “Adviser”). Each Fund seeks long-term growth of capital.
The Large Cap Fund currently offers Investor Class shares and Institutional Class shares. The Small Cap Fund and Epiphany ESG Fund currently offer Institutional Class shares. Each share represents an equal proportionate interest in the assets and liabilities belonging to the Fund and is entitled to such dividends and distributions out of income belonging to the Fund as declared by the Board.
NOTE 2. SIGNIFICANT ACCOUNTING POLICIES
The Funds are investment companies and follow accounting and reporting guidance under Financial Accounting Standards Board Accounting Standards Codification (“ASC”) Topic 946, “Financial Services-Investment Companies” including Accounting Standards Update 2013-08. The following is a summary of significant accounting policies followed by the Funds in the preparation of their financial statements. These policies are in conformity with generally accepted accounting principles in the United States of America (“GAAP”).
Estimates
The preparation of financial statements in conformity with GAAP requires management to make estimates and assumptions that affect the reported amounts of assets and liabilities and disclosure of contingent assets and liabilities at the date of the financial statements and the reported amounts of increases and decreases in net assets from operations during the reporting period. Actual results could differ from those estimates.
Federal Income Taxes – The Funds make no provision for federal income or excise tax. Each Fund has qualified and intends to qualify each year as a regulated investment company (“RIC”) under subchapter M of the Internal Revenue Code of 1986, as amended, by complying with the requirements applicable to RICs and by distributing substantially all of its taxable income. Each Fund also intends to distribute sufficient net investment
| Dana Funds |
| Notes to the Financial Statements (continued) |
| April 30, 2023 - (Unaudited) |
income and net capital gains, if any, so that it will not be subject to excise tax on undistributed income and gains. If the required amount of net investment income or gains is not distributed, the Funds could incur a tax expense.
As of and during the six months ended April 30, 2023, the Funds did not have any liabilities for any unrecognized tax benefits. The Funds recognize interest and penalties, if any, related to unrecognized tax benefits as income tax expense on the Statements of Operations when incurred. During the six months ended April 30, 2023, the Funds did not incur any interest or penalties. Management of the Funds has reviewed tax positions taken in tax years that remain subject to examination by all major tax jurisdictions, including federal (i.e., the last three tax year ends and the interim tax period since then, as applicable). Management believes that there is no tax liability resulting from unrecognized tax benefits related to uncertain tax positions taken.
Expenses – Expenses incurred by the Trust that do not relate to a specific fund of the Trust are allocated to the individual funds based on each fund’s relative net assets or another appropriate basis (as determined by the Board). Expenses specifically attributable to any class are borne by that class. Income, realized gains and losses, unrealized appreciation and depreciation, and fund-wide expenses not allocated to a particular class shall be allocated to each class based on the net assets of that class in relation to the net assets of the entire fund.
Security Transactions and Related Income – The Funds follow industry practice and record security transactions on the trade date for financial reporting purposes. The specific identification method is used for determining gains or losses for financial statement and income tax purposes. Dividend income is recorded on the ex-dividend date and interest income is recorded on an accrual basis. Withholding taxes on foreign dividends, if any, have been provided for in accordance with the Funds’ understanding of the applicable country’s tax rules and rates.
The Funds may hold Real Estate Investment Trusts (“REITs”) which pay dividends to their shareholders based upon available funds from operations. It is possible for these dividends to exceed the REIT’s underlying taxable earnings and profits resulting in the excess portion of such dividends being designated as a return of capital. Distributions received from REITs that represent a return of capital or capital gains are recorded as a reduction of the cost of the REITs or as a realized gain, respectively.
Dividends and Distributions – The Funds intend to distribute substantially all of their net investment income, if any, at least quarterly. The Funds intend to distribute their net realized long-term and short-term capital gains, if any, annually. Distributions to shareholders, which are determined in accordance with income tax regulations, are recorded on the ex-dividend date. The treatment for financial reporting purposes of distributions made to
| Dana Funds |
| Notes to the Financial Statements (continued) |
| April 30, 2023 - (Unaudited) |
shareholders during the year from net investment income or net realized capital gains may differ from their ultimate treatment for federal income tax purposes. These differences are caused primarily by differences in the timing of the recognition of certain components of income, expense or realized capital gain for federal income tax purposes. Where such differences are permanent in nature, they are reclassified in the components of the net assets based on their ultimate characterization for federal income tax purposes. Any such reclassifications will have no effect on net assets, results of operations or net asset value (“NAV”) per share of the Funds.
Share Valuation – The NAV per share of each class of each Fund is calculated each day the New York Stock Exchange (“NYSE”) is open by dividing the total value of the assets attributable to that class, less liabilities attributable to that class, by the number of shares outstanding of that class.
NOTE 3. SECURITIES VALUATION AND FAIR VALUE MEASUREMENTS
Each Fund values its portfolio securities at fair value as of the close of regular trading on the NYSE (normally 4:00 p.m. Eastern time) on each business day the NYSE is open for business. Fair value is defined as the price that a Fund would receive upon selling an investment in a timely transaction to an independent buyer in the principal or most advantageous market of the investment. GAAP establishes a three-tier hierarchy to maximize the use of observable market data and minimize the use of unobservable inputs and to establish classification of fair value measurements for disclosure purposes.
Inputs refer broadly to the assumptions that market participants would use in pricing the asset or liability, including assumptions about risk (the risk inherent in a particular valuation technique used to measure fair value including a pricing model and/or the risk inherent in the inputs to the valuation technique). Inputs may be observable or unobservable. Observable inputs are inputs that reflect the assumptions market participants would use in pricing the asset or liability developed based on market data obtained and available from sources independent of the reporting entity. Unobservable inputs are inputs that reflect the reporting entity’s own assumptions about the assumptions market participants would use in pricing the asset or liability developed based on the best information available in the circumstances.
Various inputs are used in determining the value of each Fund’s investments. These inputs are summarized in the three broad levels listed below.
| ● | Level 1 – unadjusted quoted prices in active markets for identical investments and/or registered investment companies where the value per share is determined and published |
| Dana Funds |
| Notes to the Financial Statements (continued) |
| April 30, 2023 - (Unaudited) |
and is the basis for current transactions for identical assets or liabilities at the valuation date
| ● | Level 2 – other significant observable inputs (including, but not limited to, quoted prices for an identical security in an inactive market, quoted prices for similar securities, interest rates, prepayment speeds, credit risk, etc.) |
| ● | Level 3 – significant unobservable inputs (including the Funds’ own assumptions in determining fair value of investments based on the best information available) |
The inputs used to measure fair value may fall into different levels of the fair value hierarchy. In such cases, for disclosure purposes, the level in the fair value hierarchy which is reported is determined based on the lowest level input that is significant to the fair value measurement in its entirety.
Equity securities that are traded on any stock exchange are generally valued at the last quoted sale price on the security’s primary exchange. Lacking a last sale price, an exchange-traded security is generally valued at its last bid price. Securities traded in the Nasdaq over-the-counter market are generally valued at the Nasdaq Official Closing Price. When using the market quotations and when the market is considered active, the security is classified as a Level 1 security. In the event that market quotations are not readily available or are considered unreliable due to market or other events, securities are valued in good faith by the Adviser as “Valuation Designee” under the oversight of the Board. The Adviser has adopted written policies and procedures for valuing securities and other assets in circumstances where market quotes are not readily available. In the event that market quotes are not readily available, and the security or asset cannot be valued pursuant to one of the valuation methods, the value of the security or asset will be determined in good faith by the Adviser pursuant to its policies and procedures. On a quarterly basis, the Adviser’s fair valuation determinations will be reviewed by the Board. Under these policies, the securities will be classified as Level 2 or 3 within the fair value hierarchy, depending on the inputs used.
Investments in mutual funds, including money market mutual funds, are generally priced at the ending NAV. These securities are categorized as Level 1 securities.
| Dana Funds |
| Notes to the Financial Statements (continued) |
| April 30, 2023 - (Unaudited) |
The following is a summary of the inputs used to value the Funds’ investments as of April 30, 2023:
| Large Cap Fund | | | | | Valuation Inputs | | | | | | | |
| Assets | | Level 1 | | | Level 2 | | | Level 3 | | | Total | |
| Common Stocks(a) | | $ | 97,903,105 | | | $ | — | | | $ | — | | | $ | 97,903,105 | |
| Money Market Funds | | | 1,143,845 | | | | — | | | | — | | | | 1,143,845 | |
| Total | | $ | 99,046,950 | | | $ | — | | | $ | — | | | $ | 99,046,950 | |
| | | | | | | | | | | | | | | | | |
| Small Cap Fund | | | | | Valuation Inputs | | | | | | | |
| Assets | | Level 1 | | | Level 2 | | | Level 3 | | | Total | |
| Common Stocks(a) | | $ | 24,987,491 | | | $ | — | | | $ | — | | | $ | 24,987,491 | |
| Money Market Funds | | | 296,188 | | | | — | | | | — | | | | 296,188 | |
| Total | | $ | 25,283,679 | | | $ | — | | | $ | — | | | $ | 25,283,679 | |
| | | | | | | | | | | | | | | | | |
| Epiphany ESG Fund | | | | | Valuation Inputs | | | | | | | |
| Assets | | Level 1 | | | Level 2 | | | Level 3 | | | Total | |
| Common Stocks(a) | | $ | 62,695,246 | | | $ | — | | | $ | — | | | $ | 62,695,246 | |
| Money Market Funds | | | 740,141 | | | | — | | | | — | | | | 740,141 | |
| Total | | $ | 63,435,387 | | | $ | — | | | $ | — | | | $ | 63,435,387 | |
| (a) | Refer to Schedule of Investments for sector classifications. |
The Funds did not hold any investments at the end of the reporting period in which significant unobservable inputs (Level 3) were used in determining fair value; therefore, no reconciliation of Level 3 securities is included for this reporting period.
NOTE 4. FEES AND OTHER TRANSACTIONS WITH AFFILIATES AND OTHER SERVICE PROVIDERS
The Adviser, under the terms of the management agreement for each Fund, manages the Funds’ investments subject to oversight of the Board. As compensation for its management services, the Funds are obligated to pay the Adviser a fee computed and accrued daily and paid monthly at an annual rate of 0.65%, 0.75% and 0.65% of the average daily net assets of the Large Cap Fund, the Small Cap Fund and the Epiphany ESG Fund, respectively.
The Adviser has contractually agreed to waive its management fee and/or reimburse certain operating expenses through February 29, 2024, but only to the extent necessary so that the Funds’ net expenses, excluding brokerage fees and commissions, borrowing costs (such as interest and dividend expenses on securities sold short), taxes, extraordinary expenses, fees and expenses paid under a distribution plan adopted pursuant to Rule 12b-1, fees and expenses paid under a shareholder services plan, and indirect expenses (such as “acquired fund fees and expenses”) do not exceed 0.73% of the average daily net assets of the Institutional Class and the Investor Class for the Large Cap Fund, 0.95% of the average daily net assets of the Institutional Class for the Small Cap Fund, and 0.85% of the average daily net assets of the Institutional Class for the Epiphany ESG Fund.
| Dana Funds |
| Notes to the Financial Statements (continued) |
| April 30, 2023 - (Unaudited) |
Each fee waiver or expense reimbursement by the Adviser is subject to repayment by the applicable Fund within three years following the date in which the fee waiver or expense reimbursement occurred, provided that the Fund is able to make the repayment without exceeding the expense limitation that is in effect at the time of the waiver or expense reimbursement, and the expense limitation in effect at the time of the repayment. The expense limitation agreements may not be terminated except by mutual consent of the Adviser and the Board.
The amounts subject to repayment by the Funds, pursuant to the aforementioned conditions are as follows:
| | | Large Cap | | | Small Cap | | | Epiphany | |
| Recoverable Through | | Fund | | | Fund | | | ESG Fund | |
| October 31, 2023 | | $ | 110,110 | | | $ | 92,831 | | | $ | 73,342 | |
| October 31, 2024 | | | 174,396 | | | | 164,133 | | | | 108,826 | |
| October 31, 2025 | | | 176,583 | | | | 153,559 | | | | 84,961 | |
| April 30, 2026 | | | 91,036 | | | | 66,378 | | | | 40,860 | |
The Trust retains Ultimus Fund Solutions, LLC (“Ultimus” or “Administrator”) to provide the Funds with administration, fund accounting and transfer agent services, including all regulatory reporting.
Northern Lights Compliance Services, LLC (“NLCS”), an affiliate of Ultimus, provides a Chief Compliance Officer and an Anti-Money Laundering Compliance Officer to the Trust, as well as related compliance services, pursuant to a consulting agreement between NLCS and the Trust. Under the terms of such agreement, NLCS receives fees from the Funds.
The officers and one trustee of the Trust are members of management and/or employees of the Administrator or of NLCS and are not paid by the Trust for services to the Funds. Ultimus Fund Distributors, LLC (the “Distributor”), a wholly-owned subsidiary of Ultimus, acts as the distributor of the Funds’ shares. There were no payments made to the Distributor by the Funds for the six months ended April 30, 2023.
The Trust, with respect to the Large Cap Fund, has adopted a Distribution Plan (the “Plan”) pursuant to Rule 12b-1 under the Investment Company Act of 1940, as amended (the “1940 Act”). The Plan provides that the Large Cap Fund will pay the Distributor and any registered securities dealer, financial institution or any other person (a “Recipient”) a shareholder servicing fee aggregating at a rate of 0.25% of the average daily net assets for the Investor Class shares in connection with the promotion and distribution of the Large Cap Fund’s shares or the provision of shareholder support services to shareholders, including, but not necessarily limited to, advertising, compensation to underwriters, dealers and selling personnel, the printing and mailing of prospectuses to other than current Investor
| Dana Funds |
| Notes to the Financial Statements (continued) |
| April 30, 2023 - (Unaudited) |
Class shareholders, the printing and mailing of sales literature and servicing shareholder accounts (“12b-1 Expenses”). The Large Cap Fund or Distributor may pay all or a portion of these fees to any Recipient who renders assistance in distributing or promoting the sale of shares, or who provides certain shareholder services, pursuant to a written agreement. The Plan is a compensation plan, which means that compensation is paid regardless of 12b-1 Expenses actually incurred. It is anticipated that the Plan will benefit shareholders because an effective sales program typically is necessary in order for the Large Cap Fund to reach and maintain a sufficient size to achieve efficiently its investment objectives and to realize economies of scale.
NOTE 5. PURCHASES AND SALES OF SECURITIES
For the six months ended April 30, 2023, purchases and sales of investment securities, other than short-term investments, were as follows:
| | | Purchases | | | Sales | |
| Large Cap Fund | | $ | 19,572,197 | | | $ | 28,627,453 | |
| Small Cap Fund | | | 17,188,899 | | | | 6,165,937 | |
| Epiphany ESG Fund | | | 17,802,347 | | | | 29,514,532 | |
There were no purchases or sales of long-term U.S. government obligations during the six months ended April 30, 2023.
NOTE 6. FEDERAL TAX INFORMATION
At April 30, 2023, the net unrealized appreciation (depreciation) and tax cost of investments for tax purposes was as follows:
| | | Large Cap | | | Small Cap | | | Epiphany | |
| | | Fund | | | Fund | | | ESG Fund | |
| Gross unrealized appreciation | | $ | 19,986,881 | | | $ | 2,178,530 | | | $ | 4,661,840 | |
| Gross unrealized depreciation | | | (2,140,945 | ) | | | (1,843,161 | ) | | | (5,169,606 | ) |
| Net unrealized appreciation/(depreciation) on investments | | | 17,845,936 | | | | 335,369 | | | | (507,766 | ) |
| Tax cost of investments | | | 81,201,014 | | | | 24,948,310 | | | | 63,943,153 | |
At April 30, 2023, the difference between book basis and tax basis unrealized appreciation for the Large Cap Fund, Small Cap Fund and Epiphany ESG Fund was attributable primarily to the tax deferral of losses on wash sales.
| Dana Funds |
| Notes to the Financial Statements (continued) |
| April 30, 2023 - (Unaudited) |
The tax character of distributions paid for the fiscal year ended October 31, 2022, the Funds’ most recent fiscal year end, were as follows:
| | | Large Cap | | | Small Cap | | | Epiphany | |
| | | Fund | | | Fund | | | ESG Fund | |
| Distributions paid from: | | | | | | | | | | | | |
| Ordinary income(a) | | $ | 4,378,734 | | | $ | 120,827 | | | $ | 862,208 | |
| Long-term capital gains | | | 13,039,063 | | | | 1,308,363 | | | | 834,338 | |
| Total distributions paid | | $ | 17,417,797 | | | $ | 1,429,190 | | | $ | 1,696,546 | |
| (a) | Short-term capital gain distributions are treated as ordinary income for tax purposes. |
At October 31, 2022, the components of accumulated earnings (deficit) on a tax basis were as follows:
| | | Large Cap | | | Small Cap | | | Epiphany | |
| | | Fund | | | Fund | | | ESG Fund | |
| Undistributed ordinary income | | $ | 222,949 | | | $ | 1,085 | | | $ | 99,294 | |
| Undistributed long-term capital gains | | | 7,730,759 | | | | 1,125,554 | | | | — | |
| Accumulated capital and other losses | | | — | | | | — | | | | (930,199 | ) |
| Unrealized appreciation (depreciation) on investments | | | 17,951,457 | | | | (104,756 | ) | | | (1,782,653 | ) |
| Total accumulated earnings (deficit) | | $ | 25,905,165 | | | $ | 1,021,883 | | | $ | (2,613,558 | ) |
As of October 31, 2022, the Epiphany ESG Fund had short-term capital loss carryforwards of $930,199. These capital loss carryforwards, which do not expire, may be utilized in future years to offset net realized capital gains, if any, prior to distributing such gains to shareholders.
NOTE 7. SECTOR RISK
If a Fund has significant investments in the securities of issuers within a particular sector, any development affecting that sector will have a greater impact on the value of the net assets of the Fund than would be the case if the Fund did not have significant investments in that sector. In addition, this may increase the risk of loss in the Fund and increase the volatility of the Fund’s NAV per share. For instance, economic or market factors, regulatory changes or other developments may negatively impact all companies in a particular sector, and therefore the value of the Fund’s portfolio will be adversely affected. As of April 30, 2023, the Large Cap Fund and Epiphany ESG Fund had 27.37% and 26.71% of the value of their net assets invested in stocks within the Technology sector, respectively.
| Dana Funds |
| Notes to the Financial Statements (continued) |
| April 30, 2023 - (Unaudited) |
NOTE 8. COMMITMENTS AND CONTINGENCIES
Under the Trust’s organizational documents, its Officers and Trustees are indemnified against certain liabilities arising out of the performance of their duties to the Funds. In addition, in the normal course of business, the Trust enters into contracts with its service providers, on behalf of the Funds, and others that provide for general indemnifications. The Funds’ maximum exposure under these arrangements is unknown, as this would involve future claims that may be made against the Trust. The Funds expect the risk of loss to be remote, however, there can be no assurance that such obligations will not result in material liabilities that adversely affect the Funds.
NOTE 9. SUBSEQUENT EVENTS
Management of the Funds has evaluated the need for disclosures and/or adjustments resulting from subsequent events through the date at which these financial statements were issued. Based upon this evaluation, management has determined there were no items requiring adjustment of the financial statements or additional disclosure.
| Summary of Fund Expenses (Unaudited) |
As a shareholder of a Fund, you incur two types of costs: (1) transaction costs and (2) ongoing costs, including management fees and other Fund expenses. These examples are intended to help you understand your ongoing costs (in dollars) of investing in each Fund and to compare these costs with the ongoing costs of investing in other funds. Each Fund’s example is based on an investment of $1,000 invested at the beginning of the period and held for the entire period from November 1, 2022 through April 30, 2023.
Actual Expenses
The first line of the table for each class provides information about actual account values and actual expenses. You may use the information in these lines, together with the amount you invested, to estimate the expenses that you paid over the period. Simply divide your account value by $1,000 (for example, an $8,600 account value divided by $1,000 = 8.6), then multiply the result by the number in the first line under the heading “Expenses Paid During Period” to estimate the expenses you paid on your account during this period.
Hypothetical Example for Comparison Purposes
The second line of the table for each class provides information about hypothetical account values and hypothetical expenses based on each Fund’s actual expense ratios and an assumed rate of return of 5% per year before expenses, which is not the Fund’s actual return. The hypothetical account values and expenses may not be used to estimate the actual ending account balances or expenses you paid for the period. You may use this information to compare the ongoing costs of investing in the Funds and other funds. To do so, compare this 5% hypothetical example with the 5% hypothetical examples that appear in the shareholder reports of other funds.
Expenses shown in the table are meant to highlight your ongoing costs only and do not reflect any transactional costs. Therefore, the second line of the table for each class is useful in comparing ongoing costs only and will not help you determine the relative total costs of owning different funds. In addition, if transaction costs were included, your costs would have been higher.
| Summary of Fund Expenses (Unaudited) (continued) |
| | | | | Beginning | | | Ending | | | | | | |
| | | | | Account | | | Account | | | Expenses | | | |
| | | | | Value | | | Value | | | Paid | | | Annualized |
| | | | | November | | | April 30, | | | During | | | Expense |
| | | | | 1, 2022 | | | 2023 | | | Period(a) | | | Ratio |
| Large Cap Fund | | | | | | | | | | | | | | | | |
| Institutional Class | | Actual | | $ | 1,000.00 | | | $ | 1,066.60 | | | $ | 3.74 | | | 0.73% |
| | | Hypothetical(b) | | $ | 1,000.00 | | | $ | 1,021.17 | | | $ | 3.66 | | | 0.73% |
| Investor Class | | Actual | | $ | 1,000.00 | | | $ | 1,065.80 | | | $ | 5.02 | | | 0.98% |
| | | Hypothetical(b) | | $ | 1,000.00 | | | $ | 1,019.93 | | | $ | 4.91 | | | 0.98% |
| Small Cap Fund | | | | | | | | | | | | | | | | |
| Institutional Class | | Actual | | $ | 1,000.00 | | | $ | 1,035.20 | | | $ | 4.79 | | | 0.95% |
| | | Hypothetical(b) | | $ | 1,000.00 | | | $ | 1,020.08 | | | $ | 4.76 | | | 0.95% |
| Epiphany ESG Fund | | | | | | | | | | | | | | | | |
| Institutional Class | | Actual | | $ | 1,000.00 | | | $ | 1,041.10 | | | $ | 4.30 | | | 0.85% |
| | | Hypothetical(b) | | $ | 1,000.00 | | | $ | 1,020.58 | | | $ | 4.26 | | | 0.85% |
| (a) | Expenses are equal to the Fund’s annualized expense ratios, multiplied by the average account value over the period, multiplied by 181/365 (to reflect the one-half year period). The annualized expense ratios reflect reimbursement of expenses by the Fund’s investment adviser for the period beginning November 1, 2022 to April 30, 2023. The “Financial Highlights” tables in the Fund’s financial statements, included in this report, also show the gross expense ratios, without such reimbursements. |
| (b) | Hypothetical assumes 5% annual return before expenses. |
| FACTS | WHAT DO THE DANA FUNDS (the “FUNDS”) DO WITH YOUR PERSONAL INFORMATION? |
| |
| Why? | Financial companies choose how they share your personal information. Federal law gives consumers the right to limit some but not all sharing. Federal law also requires us to tell you how we collect, share, and protect your personal information. Please read this notice carefully to understand what we do. |
| |
| What? | The types of personal information we collect and share depend on the product or service you have with us. This information can include: ■ Social Security number ■ account balances and account transactions ■ transaction or loss history and purchase history ■ checking account information and wire transfer instructions When you are no longer our customer, we continue to share your information as described in this notice. |
| |
| How? | All financial companies need to share customers’ personal information to run their everyday business. In the section below, we list the reasons financial companies can share their customers’ personal information; the reasons the Funds choose to share; and whether you can limit this sharing. |
| |
| Reasons we can share your personal information | Do the Funds share? |
For our everyday business purposes — such as to process your transactions, maintain your account(s), respond to court orders and legal investigations, or report to credit bureaus | Yes |
For our marketing purposes — to offer our products and services to you | No |
| For joint marketing with other financial companies | No |
For our affiliates’ everyday business purposes – information about your transactions and experiences | No |
For our affiliates’ everyday business purposes – information about your creditworthiness | No |
| For nonaffiliates to market to you | No |
| | | |
| Questions? | Call (855) 280-9648 |
| Who we are |
| Who is providing this notice? | Dana Funds Ultimus Fund Distributors, LLC (Distributor) Ultimus Fund Solutions, LLC (Administrator) |
| What we do |
How do the Funds protect my
personal information? | To protect your personal information from unauthorized access and use, we use security measures that comply with federal law. These measures include computer safeguards and secured files and buildings. Our service providers are held accountable for adhering to strict policies and procedures to prevent any misuse of your nonpublic personal information. |
How do the Funds collect my
personal information? | We collect your personal information, for example, when you ■ open an account or deposit money ■ buy securities from us or sell securities to us ■ make deposits or withdrawals from your account ■ give us your account information ■ make a wire transfer ■ tell us who receives the money ■ tell us where to send the money ■ show your government-issued ID ■ show your driver’s license |
| Why can’t I limit all sharing? | Federal law gives you the right to limit only ■ sharing for affiliates’ everyday business purposes— information about your creditworthiness ■ affiliates from using your information to market to you ■ sharing for nonaffiliates to market to you State laws and individual companies may give you additional rights to limit sharing. |
| Definitions |
| Affiliates | Companies related by common ownership or control. They can be financial and nonfinancial companies. ■ Dana Investment Advisors, Inc., the investment adviser to the Funds, could be deemed to be an affiliate. |
| Nonaffiliates | Companies not related by common ownership or control. They can be financial and nonfinancial companies. ■ The Dana Funds do not share your personal information with nonaffiliates so they can market to you. |
| Joint marketing | A formal agreement between nonaffiliated financial companies that together market financial products or services to you. ■ The Dana Funds do not jointly market. |
A description of the policies and procedures that each Fund uses to determine how to vote proxies relating to portfolio securities and information regarding how each Fund voted those proxies during the most recent twelve month period ended June 30, are available (1) without charge upon request by calling the Funds at (855) 280-9648 and (2) in Fund documents filed with the SEC on the SEC’s website at www.sec.gov.
TRUSTEES
Andrea N. Mullins, Chairperson
Ira P. Cohen
Mark J. Seger | INDEPENDENT REGISTERED
PUBLIC ACCOUNTING FIRM
Cohen & Company, Ltd.
1350 Euclid Avenue, Suite 800
Cleveland, OH 44115 |
| | |
| | |
OFFICERS
Matthew J. Miller, Principal Executive Officer and
President
Zachary P. Richmond, Principal Financial Officer and Treasurer
N. Lynn Bowley, Chief Compliance Officer
Carol J. Highsmith, Vice President and Secretary | LEGAL COUNSEL
Troutman Pepper Hamilton Sanders LLP
3000 Two Logan Square
18th and Arch Streets
Philadelphia, PA 19103 |
| | |
| | |
INVESTMENT ADVISER
Dana Investment Advisors, Inc.
20700 Swenson Drive, Suite 400
Waukesha, WI 53186 | CUSTODIAN
Huntington National Bank
41 South High Street
Columbus, OH 43215 |
| | |
| | |
DISTRIBUTOR
Ultimus Fund Distributors, LLC
225 Pictoria Drive, Suite 450
Cincinnati, OH 45246 | ADMINISTRATOR, TRANSFER
AGENT AND FUND ACCOUNTANT
Ultimus Fund Solutions, LLC
225 Pictoria Drive, Suite 450
Cincinnati, OH 45246 |
| | |
This report is intended only for the information of shareholders or those who have received the Funds’ prospectus which contains information about each Fund’s management fee and expenses. Please read the prospectus carefully before investing.
Distributed by Ultimus Fund Distributors, LLC, Member FINRA/SIPC
DANA-SAR-23
Foundry Partners Fundamental
Small Cap Value Fund
Investor Class – DRSVX
Institutional Class – DRISX
Semi-Annual Report
April 30, 2023
Foundry Funds
c/o Ultimus Fund Solutions, LLC
225 Pictoria Drive, Suite 450
Cincinnati, Ohio 45246
(800) 247-1014
��
Management Discussion of Fund Performance (Unaudited)
April 30, 2023
Market Review
Despite facing some challenging market conditions, we are pleased to report that the Foundry Partners Fundamental Small Cap Value Fund (the “Fund”) (Institutional Class) achieved a modest return of -2.39% over the past six months. Comparatively, our benchmark, the Russell 2000® Value Index, experienced a decline of -6.72% during the same period. Effective July 7, 2023, the Fund will be known as the Foundry Partners Small Cap Value Fund.
During this period, our Fund benefited from the strong performance of several sectors, including Financials, Materials, Healthcare, Technology, Industrials, and Consumer Discretionary. These sectors contributed positively to our overall performance and helped mitigate the impact of broader market declines. The Fund experienced some head winds from the Energy, Consumer Staples, Utilities, and Real Estate sectors. Despite these detractors, we continue to believe that the fundamentals for energy stocks remain robust, as energy markets continue to face tight supply conditions. We remain optimistic about the long-term prospects of this sector and have maintained our exposure to energy-related investments accordingly.
In the first quarter of 2023, global financial markets experienced a series of significant events, notably the banking crisis, which profoundly impacted investor confidence and resulted in heightened market volatility. Responding to these conditions, we took strategic measures to reduce our exposure to the banking sector. Our decision was based on a thorough assessment of various factors, including our analysis of banks’ net interest margins (NIM), loan loss reserves, and overall valuation. NIMs had been rising in tandem with the Federal Reserve’s (the “Fed”) rate hikes for several quarters, and we believed they could be reaching their peak as the Fed hinted at a potential pause. Additionally, with the carry-on debt increasing as interest rates rose, there was a potential for higher problem loans and charge-offs, leading to negative earnings revisions. Finally, we found that bank valuations were comparatively less attractive than other areas in the market. Although we did not predict the specific events that unfolded, such as the run-on bank deposit in certain stocks and subsequent volatility, our swift actions proved to be timely.
The ongoing efforts by the Fed to combat rising inflation have also contributed to market volatility. Over the past six months, the Fed has maintained a proactive stance, gradually increasing interest rates to address inflationary pressures. While these rate hikes have introduced short-term uncertainties, some investors have expressed concerns that the Fed may have taken them too far. In our view, it is important for rates to remain at least in the
Management Discussion of Fund Performance (Unaudited)
(continued)
April 30, 2023
3% to 4% range to establish a more balanced and normal interest rate environment where risk and return can coexist.
Looking beyond the volatility, we have observed several notable trends and developments. The continued advancement of technology and innovation has driven strong performance in the Technology sector. Additionally, the Materials and Industrials sectors have benefited from increased infrastructure spending and a recovery in global manufacturing activity.
We acknowledge that the recent performance of the broader market has been challenging, but we remain confident in our investment strategy. Our focus on identifying high-quality companies with sustainable competitive advantages and attractive valuations remains unchanged.
While we have had a negative return over the past six months, we will continue with our disciplined approach. We are in a new and exciting phase for the market where valuation and fundamentals matter. A market where companies ridden with debt and unable to make money will fall to the wayside as easy monetary policy will cease to provide liquidity for their survival. Simply put; a market where the art of stock picking and understanding companies will matter. It should be a great time to be a value investor!
We are committed to diligently managing your investments and taking advantage of attractive opportunities in the market.
The Fund’s performance quoted is past performance and does not guarantee future results. The investment return and principal value of an investment in the Fund will fluctuate so that an investor’s shares, when redeemed, may be worth more or less than their original cost. Current performance of the Fund may be lower or higher than the performance quoted. Performance data current to the most recent month end may be obtained by calling 1-800-247-1014. Information provided with respect to the Fund’s Portfolio Holdings, Sector Weightings and Number of Holdings are as of April 30, 2023 and are subject to change at any time.
Value stocks may remain undervalued for extended periods of time and the market may not recognize the intrinsic value of these securities.
Management Discussion of Fund Performance (Unaudited)
(continued)
April 30, 2023
Micro cap and small cap investing involves greater risk not associated with investing in more established companies, such as greater price volatility, business risk, less liquidity and increased competitive threat.
The opinions expressed are those of the investment management team and are subject to change without notice, as are statements of financial market trends, which are based on current conditions. Under no circumstances does the information contained within represent a recommendation to buy, hold or sell any security and it should not be assumed that the companies discussed were, or will prove to be, profitable. Current and future holdings are subject to risk.
Investment Results (Unaudited)
Average Annual Total Returns(a) as of April 30, 2023
| | Six Months | One Year | Three Year | Five Year | Ten Year |
| Foundry Partners Fundamental Small Cap Value Fund | | | | | |
| Investor Class | (2.53)% | 2.07% | 18.40% | 4.97% | 7.68% |
| Institutional Class | (2.39)% | 2.33% | 18.70% | 5.24% | 7.94% |
| Russell 2000® Value Index(b) | (6.72)% | (7.99)% | 15.44% | 3.66% | 6.96% |
| | | | | | |
| | | | Expense Ratios(c) | |
| | | | Investor | Institutional | |
| | | | Class | Class | |
| Gross | | | 1.29% | 1.04% | |
| With Applicable Waivers | | | 1.25% | 1.00% | |
The investment return and principal value of an investment will fluctuate so that an investor’s shares, when redeemed, may be worth more or less than their original cost. The returns shown do not reflect deduction of taxes that a shareholder would pay on Foundry Partners Fundamental Small Cap Value Fund (the “Fund”) distributions or the redemption of Fund shares. THE FUND’S RETURNS REPRESENT PAST PERFORMANCE AND DO NOT PREDICT FUTURE RESULTS. The returns shown are net of all recurring expenses. Current performance of the Fund may be lower or higher than the performance quoted. For more information on the Fund, and to obtain performance data current to the most recent month end, or to request a prospectus, please call 1-800-247-1014.
You should carefully consider the investment objectives, potential risk, management fees, and charges and expenses of the Fund before investing. The Fund’s prospectus contains this and other information about the Fund and should be read carefully before investing.
| (a) | Average annual total returns reflect any change in price per share and assume the reinvestment of all distributions. The Fund’s returns reflect any fee reductions during the applicable periods. If such fee reductions had not occurred, the quoted performance would have been lower. Total returns for periods less than one year are not annualized. |
| (b) | The Russell 2000® Value Index (“Index”) is an unmanaged benchmark that assumes reinvestment of all distributions and excludes the effect of taxes and fees. The Index is a widely recognized unmanaged index of equity prices and is representative of a broader market and range of securities than are found in the Fund’s portfolio. Individuals cannot invest directly in the Index; however, an individual can invest in exchange-traded funds or other investment vehicles that attempt to track the performance of a benchmark index. |
| (c) | The expense ratios are from the Fund’s prospectus dated February 28, 2023. Foundry Partners, LLC (the “Adviser”) has contractually agreed to waive its management fee and/or reimburse certain Fund operating expenses, but only to the extent necessary so that the Fund’s net expenses, excluding brokerage fees and commissions, borrowing costs (such as interest and dividend expenses on securities sold short), taxes, distribution and service (12b-1) fees, extraordinary expenses and indirect expenses (such as fees and expenses of acquired funds), does not exceed 0.99% of the Fund’s average daily net assets. The contractual agreement is effective through February 29, 2024. |
Investment Results (Unaudited) (continued)
This contractual arrangement may only be terminated by mutual consent of the Adviser and the Board of Trustees, and it will automatically terminate upon the termination of the investment advisory agreement between the Trust and the Adviser. Each waiver or reimbursement of an expense by the Adviser is subject to repayment by the Fund within the three years following the date of such waiver or reimbursement, provided that the Fund is able to make the repayment without exceeding the expense limitation in place at the time of the waiver or reimbursement, and the expense limitation in place at the time of the repayment. Information pertaining to the Fund’s expense ratios as of April 30, 2023 can be found in the financial highlights.
The Fund is distributed by Ultimus Fund Distributors, LLC, member FINRA/SIPC.
Fund Holdings (Unaudited)
Foundry Partners Fundamental Small Cap Value Fund Portfolio Analysis as of April 30, 2023(a)
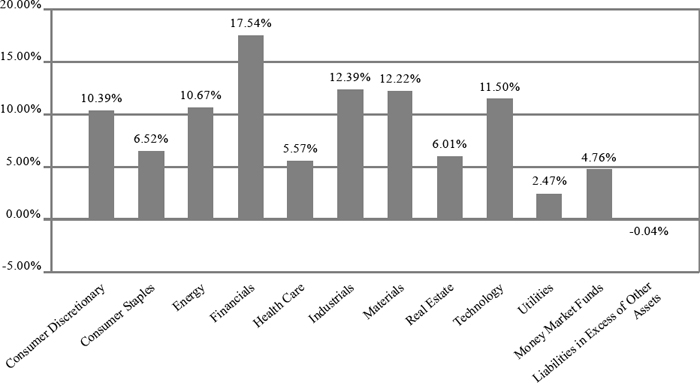
| (a) | As a percentage of net assets. |
Availability of Portfolio Schedule (Unaudited)
The Fund files its complete schedule of portfolio holdings with the Securities and Exchange Commission (“SEC”) for the first and third quarters of each fiscal year as an exhibit to its reports on Form N-PORT. The Fund’s Form N-PORT reports are available on the SEC’s website at http://www. sec.gov and on the Fund’s website at www.foundrypartnersllc.com.
| Foundry Partners Fundamental Small Cap Value Fund |
| Schedule of Investments |
| April 30, 2023 - (Unaudited) |
| COMMON STOCKS — 95.28% | | Shares | | | Fair Value | |
| Consumer Discretionary — 10.39% | | | | | | | | |
| BlueLinx Holdings, Inc.(a) | | | 29,361 | | | $ | 2,057,032 | |
| Build-A-Bear Workshop, Inc. | | | 94,670 | | | | 2,196,344 | |
| Ethan Allen Interiors, Inc. | | | 123,119 | | | | 3,438,713 | |
| Group 1 Automotive, Inc. | | | 10,214 | | | | 2,292,839 | |
| Guess, Inc. | | | 142,241 | | | | 2,681,243 | |
| Hudson Technologies, Inc.(a) | | | 258,369 | | | | 1,997,192 | |
| KB Home | | | 50,176 | | | | 2,198,712 | |
| Kontoor Brands, Inc. | | | 60,622 | | | | 2,738,296 | |
| Movado Group, Inc. | | | 54,658 | | | | 1,400,338 | |
| Shoe Carnival, Inc. | | | 84,756 | | | | 1,970,577 | |
| | | | | | | | 22,971,286 | |
| Consumer Staples — 6.52% | | | | | | | | |
| Fresh Del Monte Produce, Inc. | | | 77,678 | | | | 2,230,135 | |
| Ingles Markets, Inc., Class A | | | 40,283 | | | | 3,707,647 | |
| John B. Sanfilippo & Son, Inc. | | | 22,086 | | | | 2,295,840 | |
| Primo Water Corp. | | | 237,916 | | | | 3,613,944 | |
| United Natural Foods, Inc.(a) | | | 94,037 | | | | 2,564,389 | |
| | | | | | | | 14,411,955 | |
| Energy — 10.67% | | | | | | | | |
| Berry Corp. | | | 255,678 | | | | 1,953,380 | |
| Chord Energy Corp. | | | 27,340 | | | | 3,891,302 | |
| Comstock Resources, Inc. | | | 259,640 | | | | 2,985,860 | |
| Enerplus Corp. | | | 256,724 | | | | 3,840,591 | |
| Murphy Oil Corp. | | | 46,442 | | | | 1,704,886 | |
| Oil States International, Inc.(a) | | | 365,259 | | | | 2,571,423 | |
| VAALCO Energy, Inc. | | | 782,321 | | | | 3,348,334 | |
| World Fuel Services Corp. | | | 139,851 | | | | 3,306,078 | |
| | | | | | | | 23,601,854 | |
| Financials — 17.54% | | | | | | | | |
| Columbia Banking System, Inc. | | | 92,542 | | | | 1,976,697 | |
| Enact Holdings, Inc. | | | 80,808 | | | | 1,950,705 | |
| Enova International, Inc.(a) | | | 75,758 | | | | 3,327,291 | |
| Genworth Financial, Inc., Class A(a) | | | 448,733 | | | | 2,607,139 | |
| Hancock Whitney Corp. | | | 96,594 | | | | 3,527,612 | |
| Hope Bancorp, Inc. | | | 191,485 | | | | 1,742,514 | |
| International Money Express, Inc.(a) | | | 145,519 | | | | 3,751,480 | |
| Lazard Ltd., Class A | | | 119,060 | | | | 3,726,578 | |
| MGIC Investment Corp. | | | 353,366 | | | | 5,254,552 | |
| Pathward Financial Group, Inc. | | | 61,026 | | | | 2,717,488 | |
| Sandy Spring Bancorp, Inc. | | | 67,994 | | | | 1,528,505 | |
| Stewart Information Services Corp. | | | 76,321 | | | | 3,178,770 | |
| Victory Capital Holdings, Inc., Class A | | | 115,442 | | | | 3,525,599 | |
| | | | | | | | 38,814,930 | |
| Health Care — 5.57% | | | | | | | | |
| Avanos Medical, Inc.(a) | | | 85,108 | | | | 2,514,090 | |
| Collegium Pharmaceutical, Inc.(a) | | | 96,635 | | | | 2,248,696 | |
See accompanying notes which are an integral part of these financial statements.
| Foundry Partners Fundamental Small Cap Value Fund |
| Schedule of Investments (continued) |
| April 30, 2023 - (Unaudited) |
| COMMON STOCKS — 95.28% - continued | | Shares | | | Fair Value | |
| Health Care — 5.57% - continued | | | | | | | | |
| Ironwood Pharmaceuticals, Inc., Class A(a) | | | 342,605 | | | $ | 3,566,519 | |
| Select Medical Holdings Corp. | | | 130,714 | | | | 3,986,777 | |
| | | | | | | | 12,316,082 | |
| Industrials — 12.39% | | | | | | | | |
| Allison Transmission Holdings, Inc. | | | 113,637 | | | | 5,544,349 | |
| Covenant Logistics Group, Inc. | | | 56,915 | | | | 2,241,882 | |
| Deluxe Corp. | | | 110,943 | | | | 1,680,786 | |
| Hillenbrand, Inc. | | | 74,715 | | | | 3,408,499 | |
| Moog, Inc., Class A | | | 38,010 | | | | 3,425,081 | |
| OSI Systems, Inc.(a) | | | 39,799 | | | | 4,495,695 | |
| SMART Global Holdings, Inc.(a) | | | 139,053 | | | | 2,144,197 | |
| Titan International, Inc.(a) | | | 214,945 | | | | 2,097,863 | |
| Titan Machinery, Inc.(a) | | | 76,173 | | | | 2,388,024 | |
| | | | | | | | 27,426,376 | |
| Materials — 12.22% | | | | | | | | |
| AdvanSix, Inc. | | | 63,098 | | | | 2,377,533 | |
| Alamos Gold, Inc., Class A | | | 370,287 | | | | 4,787,810 | |
| CVR Partners, LP | | | 37,375 | | | | 3,352,911 | |
| Hudbay Minerals, Inc. | | | 624,156 | | | | 3,127,022 | |
| Minerals Technologies, Inc. | | | 46,603 | | | | 2,761,694 | |
| Pan American Silver Corp. | | | 165,847 | | | | 2,953,735 | |
| UFP Industries, Inc. | | | 46,742 | | | | 3,670,182 | |
| Warrior Met Coal, Inc. | | | 116,155 | | | | 4,015,478 | |
| | | | | | | | 27,046,365 | |
| Real Estate — 6.01% | | | | | | | | |
| Apple Hospitality REIT, Inc. | | | 203,920 | | | | 3,036,369 | |
| CoreCivic, Inc.(a) | | | 379,567 | | | | 3,336,394 | |
| Empire State Realty Trust, Inc., Class A | | | 456,772 | | | | 2,790,877 | |
| Newmark Group, Inc., Class A | | | 385,526 | | | | 2,444,235 | |
| Summit Hotel Properties, Inc. | | | 258,369 | | | | 1,663,896 | |
| | | | | | | | 13,271,771 | |
| Technology — 11.50% | | | | | | | | |
| Celestica, Inc.(a) | | | 187,371 | | | | 2,034,849 | |
| Cohu, Inc.(a) | | | 102,576 | | | | 3,471,172 | |
| Photronics, Inc.(a) | | | 215,312 | | | | 3,113,412 | |
| Progress Software Corp. | | | 53,083 | | | | 2,913,195 | |
| Sanmina Corp.(a) | | | 65,299 | | | | 3,412,526 | |
| Sapiens International Corp. N.V. | | | 57,198 | | | | 1,151,396 | |
| Science Applications International Corp. | | | 45,112 | | | | 4,602,777 | |
| Vishay Intertechnology, Inc. | | | 222,534 | | | | 4,737,748 | |
| | | | | | | | 25,437,075 | |
| Utilities — 2.47% | | | | | | | | |
| National Fuel Gas Co. | | | 97,535 | | | | 5,452,207 | |
| | | | | | | | | |
| Total Common Stocks (Cost $207,523,801) | | | | | | | 210,749,901 | |
See accompanying notes which are an integral part of these financial statements.
| Foundry Partners Fundamental Small Cap Value Fund |
| Schedule of Investments (continued) |
| April 30, 2023 - (Unaudited) |
| MONEY MARKET FUNDS - 4.76% | | Shares | | | Fair Value | |
| Federated Hermes Government Obligations Fund, Institutional Class, 4.67%(b) | | | 10,525,799 | | | $ | 10,525,799 | |
| Total Money Market Funds (Cost $10,525,799) | | | | | | | 10,525,799 | |
| Total Investments — 100.04% (Cost $218,049,600) | | | | | | | 221,275,700 | |
| Liabilities in Excess of Other Assets — (0.04)% | | | | | | | (91,880 | ) |
| NET ASSETS — 100.00% | | | | | | $ | 221,183,820 | |
| (a) | Non-income producing security. |
| (b) | Rate disclosed is the seven day effective yield as of April 30, 2023. |
REIT - Real Estate Investment Trust
See accompanying notes which are an integral part of these financial statements.
| Foundry Partners Fundamental Small Cap Value Fund |
| Statement of Assets and Liabilities |
| April 30, 2023 - (Unaudited) |
| Assets | | | | |
| Investments in securities at fair value (cost $218,049,600) (Note 3) | | $ | 221,275,700 | |
| Receivable for fund shares sold | | | 39,832 | |
| Dividends receivable | | | 70,854 | |
| Prepaid expenses | | | 30,519 | |
| Total Assets | | | 221,416,905 | |
| | | | | |
| Liabilities | | | | |
| Payable for fund shares redeemed | | | 42,619 | |
| Payable to Adviser (Note 4) | | | 145,166 | |
| Accrued distribution (12b-1) fees | | | 2,352 | |
| Payable to Administrator (Note 4) | | | 22,537 | |
| Payable to trustees | | | 2,202 | |
| Other accrued expenses | | | 18,209 | |
| Total Liabilities | | | 233,085 | |
| Net Assets | | $ | 221,183,820 | |
| | | | | |
| Net Assets consist of: | | | | |
| Paid-in capital | | $ | 195,329,459 | |
| Accumulated earnings | | | 25,854,361 | |
| Net Assets | | $ | 221,183,820 | |
| | | | | |
| Investor Class: | | | | |
| Net Assets | | $ | 11,157,280 | |
| Shares outstanding | | | 564,932 | |
| Net asset value, offering and redemption price per share (Note 2) | | $ | 19.75 | |
| Institutional Class: | | | | |
| Net Assets | | $ | 210,026,540 | |
| Shares outstanding | | | 10,582,663 | |
| Net asset value, offering and redemption price per share (Note 2) | | $ | 19.85 | |
See accompanying notes which are an integral part of these financial statements.
| Foundry Partners Fundamental Small Cap Value Fund |
| Statement of Operations |
| For the six months ended April 30, 2023 (Unaudited) |
| Investment Income | | | | |
| Dividend income (net of foreign taxes withheld of $16,438) | | $ | 3,078,793 | |
| Total investment income | | | 3,078,793 | |
| | | | | |
| Expenses | | | | |
| Investment Adviser fees (Note 4) | | | 1,012,813 | |
| Administration fees (Note 4) | | | 84,044 | |
| Fund accounting fees (Note 4) | | | 30,743 | |
| Registration expenses | | | 24,079 | |
| Distribution (12b-1), Investor Class | | | 15,073 | |
| Custodian fees | | | 15,065 | |
| Transfer agent fees (Note 4) | | | 11,748 | |
| Legal fees | | | 10,468 | |
| Audit and tax preparation fees | | | 9,402 | |
| Printing and postage expenses | | | 6,337 | |
| Trustee fees | | | 3,832 | |
| Insurance expenses | | | 3,187 | |
| Compliance service fees (Note 4) | | | 1,488 | |
| Overdraft fees | | | 428 | |
| Miscellaneous expenses | | | 20,443 | |
| Total expenses | | | 1,249,150 | |
| Fees contractually waived by Adviser | | | (38,662 | ) |
| Net operating expenses | | | 1,210,488 | |
| Net investment income | | | 1,868,305 | |
| | | | | |
| Net Realized and Change in Unrealized Gain (Loss) on Investments | | | | |
| Net realized gain on investment securities transactions | | | 22,389,813 | |
| Net realized loss on foreign currency transactions | | | (32 | ) |
| Net change in unrealized depreciation of investment securities and foreign currency translations | | | (28,775,755 | ) |
| Net realized and change in unrealized loss on investments | | | (6,385,974 | ) |
| Net decrease in net assets resulting from operations | | $ | (4,517,669 | ) |
See accompanying notes which are an integral part of these financial statements.
| Foundry Partners Fundamental Small Cap Value Fund |
| Statements of Changes in Net Assets |
| | | | | | For the | |
| | | For the Six | | | Year Ended | |
| | | Months Ended | | | October 31, | |
| | | April 30, 2023 | | | 2022 | |
| | | (Unaudited) | | | | |
| Increase (Decrease) in Net Assets due to: | | | | | | | | |
| Operations | | | | | | | | |
| Net investment income | | $ | 1,868,305 | | | $ | 2,116,808 | |
| Net realized gain on investment securities transactions | | | 22,389,781 | | | | 22,742,813 | |
| Net change in unrealized depreciation of investment securities | | | (28,775,755 | ) | | | (25,312,055 | ) |
| Net decrease in net assets resulting from operations | | | (4,517,669 | ) | | | (452,434 | ) |
| | | | | | | | | |
| Distributions to Shareholders From Earnings (Note 2) | | | | | | | | |
| Investor Class | | | (1,234,139 | ) | | | (1,829,560 | ) |
| Institutional Class | | | (24,191,148 | ) | | | (35,166,584 | ) |
| Total Distributions | | | (25,425,287 | ) | | | (36,996,144 | ) |
| | | | | | | | | |
| Capital Transactions - Investor Class | | | | | | | | |
| Proceeds from shares sold | | | 619,149 | | | | 427,784 | |
| Reinvestment of distributions | | | 1,216,320 | | | | 1,803,645 | |
| Amount paid for shares redeemed | | | (1,159,951 | ) | | | (2,121,276 | ) |
| Total Capital Transactions - Investor Class | | | 675,518 | | | | 110,153 | |
| | | | | | | | | |
| Capital Transactions - Institutional Class | | | | | | | | |
| Proceeds from shares sold | | | 12,831,644 | | | | 22,789,789 | |
| Reinvestment of distributions | | | 23,535,633 | | | | 34,018,201 | |
| Amount paid for shares redeemed | | | (34,502,304 | ) | | | (53,656,851 | ) |
| Total Capital Transactions - Institutional Class | | | 1,864,973 | | | | 3,151,139 | |
| Net increase in net assets resulting from capital transactions | | | 2,540,491 | | | | 3,261,292 | |
| Total Decrease in Net Assets | | | (27,402,465 | ) | | | (34,187,286 | ) |
| | | | | | | | | |
| Net Assets | | | | | | | | |
| Beginning of period | | | 248,586,285 | | | | 282,773,571 | |
| End of period | | $ | 221,183,820 | | | $ | 248,586,285 | |
| | | | | | | | | |
| Share Transactions - Investor Class | | | | | | | | |
| Shares sold | | | 28,942 | | | | 18,536 | |
| Shares issued in reinvestment of distributions | | | 60,938 | | | | 76,491 | |
| Shares redeemed | | | (55,760 | ) | | | (91,262 | ) |
| Total Share Transactions - Investor Class | | | 34,120 | | | | 3,765 | |
| Share Transactions - Institutional Class | | | | | | | | |
| Shares sold | | | 608,067 | | | | 987,033 | |
| Shares issued in reinvestment of distributions | | | 1,174,433 | | | | 1,437,186 | |
| Shares redeemed | | | (1,595,990 | ) | | | (2,257,766 | ) |
| Total Share Transactions - Institutional Class | | | 186,510 | | | | 166,453 | |
See accompanying notes which are an integral part of these financial statements.
| Foundry Partners Fundamental Small Cap Value Fund - |
| Investor Class |
| Financial Highlights |
(For a share outstanding during each period)
| | | For the Six | | | | |
| | | Months | | | | | | | | | | | | | | | | |
| | | Ended April | | | | | | | | | | | | | | | | |
| | | 30, 2023 | | | For the Years Ended October 31, | |
| | | (Unaudited) | | | 2022 | | | 2021 | | | 2020 | | | 2019 | | | 2018 | |
| Selected Per Share Data | | | | | | | | | | | | | | | | | | |
| Net asset value, beginning of period | | $ | 22.63 | | | $ | 26.16 | | | $ | 16.85 | | | $ | 20.55 | | | $ | 22.11 | | | $ | 24.32 | |
| | | | | | | | | | | | | | | | | | | | | | | | | |
| Investment operations: | | | | | | | | | | | | | | | | | | | | | | | | |
| Net investment income | | | 0.15 | | | | 0.14 | | | | 0.17 | | | | 0.18 | | | | 0.25 | | | | 0.12 | |
| Net realized and unrealized gain (loss) on investments | | | (0.70 | ) | | | (0.10 | ) | | | 9.30 | | | | (3.15 | ) | | | (0.03 | ) | | | (1.52 | ) |
| Total from investment operations | | | (0.55 | ) | | | 0.04 | | | | 9.47 | | | | (2.97 | ) | | | 0.22 | | | | (1.40 | ) |
| | | | | | | | | | | | | | | | | | | | | | | | | |
| Less distributions to shareholders from: | | | | | | | | | | | | | | | | | | | | | | | | |
| Net investment income | | | (0.17 | ) | | | (0.13 | ) | | | (0.16 | ) | | | (0.26 | ) | | | (0.08 | ) | | | (0.08 | ) |
| Net realized gains | | | (2.16 | ) | | | (3.44 | ) | | | — | | | | (0.47 | ) | | | (1.70 | ) | | | (0.73 | ) |
| Total distributions | | | (2.33 | ) | | | (3.57 | ) | | | (0.16 | ) | | | (0.73 | ) | | | (1.78 | ) | | | (0.81 | ) |
| | | | | | | | | | | | | | | | | | | | | | | | | |
| Net asset value, end of period | | $ | 19.75 | | | $ | 22.63 | | | $ | 26.16 | | | $ | 16.85 | | | $ | 20.55 | | | $ | 22.11 | |
| | | | | | | | | | | | | | | | | | | | | | | | | |
| Total Return(a) | | | (2.53 | )% (b) | | | (0.40 | )% | | | 56.45 | % | | | (15.17 | )% | | | 2.28 | % | | | (6.02 | )% |
| | | | | | | | | | | | | | | | | | | | | | | | | |
| Ratios and Supplemental Data: | | | | | | | | | | | | | | | | | | | | | | | | |
| Net assets, end of period (000 omitted) | | $ | 11,157 | | | $ | 12,010 | | | $ | 13,785 | | | $ | 12,443 | | | $ | 21,048 | | | $ | 25,715 | |
| Ratio of expenses to average net assets before waiver | | | 1.30 | % (c) | | | 1.28 | % | | | 1.28 | % | | | 1.32 | % | | | 1.32 | % | | | 1.31 | % |
| Ratio of expenses to average net assets | | | 1.25 | % (c) | | | 1.28 | % | | | 1.28 | % | | | 1.32 | % | | | 1.32 | % | | | 1.31 | % |
| Ratio of net investment income to average net assets | | | 1.34 | % (c) | | | 0.59 | % | | | 0.56 | % | | | 0.90 | % | | | 1.15 | % | | | 0.49 | % |
| Portfolio turnover rate(d) | | | 66.31 | % (b) | | | 54.76 | % | | | 72.73 | % | | | 60.56 | % | | | 47.17 | % | | | 34.41 | % |
| (a) | Total return represents the rate that the investor would have earned or lost on an investment in the Fund, assuming reinvestment of dividends. |
| (d) | Portfolio turnover is calculated on the basis of the Fund as a whole without distinguishing among the classes of shares. |
See accompanying notes which are an integral part of these financial statements.
| Foundry Partners Fundamental Small Cap Value Fund - |
| Institutional Class |
| Financial Highlights |
(For a share outstanding during each period)
| | | For the Six | | | | |
| | | Months | | | | | | | | | | | | | | | | |
| | | Ended April | | | | | | | | | | | | | | | | |
| | | 30, 2023 | | | For the Years Ended October 31, | |
| | | (Unaudited) | | | 2022 | | | 2021 | | | 2020 | | | 2019 | | | 2018 | |
| Selected Per Share Data | | | | | | | | | | | | | | | | | | |
| Net asset value, beginning of period | | $ | 22.76 | | | $ | 26.29 | | | $ | 16.94 | | | $ | 20.66 | | | $ | 22.24 | | | $ | 24.46 | |
| | | | | | | | | | | | | | | | | | | | | | | | | |
| Investment operations: | | | | | | | | | | | | | | | | | | | | | | | | |
| Net investment income | | | 0.18 | | | | 0.21 | | | | 0.18 | | | | 0.21 | | | | 0.27 | | | | 0.18 | |
| Net realized and unrealized gain (loss) on investments | | | (0.70 | ) | | | (0.10 | ) | | | 9.38 | | | | (3.14 | ) | | | — | (a) | | | (1.53 | ) |
| Total from investment operations | | | (0.52 | ) | | | 0.11 | | | | 9.56 | | | | (2.93 | ) | | | 0.27 | | | | (1.35 | ) |
| | | | | | | | | | | | | | | | | | | | | | | | | |
| Less distributions to shareholders from: | | | | | | | | | | | | | | | | | | | | | | | | |
| Net investment income | | | (0.23 | ) | | | (0.20 | ) | | | (0.21 | ) | | | (0.32 | ) | | | (0.15 | ) | | | (0.14 | ) |
| Net realized gains | | | (2.16 | ) | | | (3.44 | ) | | | — | | | | (0.47 | ) | | | (1.70 | ) | | | (0.73 | ) |
| Total distributions | | | (2.39 | ) | | | (3.64 | ) | | | (0.21 | ) | | | (0.79 | ) | | | (1.85 | ) | | | (0.87 | ) |
| | | | | | | | | | | | | | | | | | | | | | | | | |
| Net asset value, end of period | | $ | 19.85 | | | $ | 22.76 | | | $ | 26.29 | | | $ | 16.94 | | | $ | 20.66 | | | $ | 22.24 | |
| | | | | | | | | | | | | | | | | | | | | | | | | |
| Total Return(b) | | | (2.39 | )% (c) | | | (0.11 | )% | | | 56.77 | % | | | (14.97 | )% | | | 2.55 | % | | | (5.78 | )% |
| | | | | | | | | | | | | | | | | | | | | | | | | |
| Ratios and Supplemental Data: | | | | | | | | | | | | | | | | | | | | | | | | |
| Net assets, end of period (000 omitted) | | $ | 210,027 | | | $ | 236,576 | | | $ | 268,989 | | | $ | 182,343 | | | $ | 173,600 | | | $ | 157,758 | |
| Ratio of expenses to average net assets before waiver | | | 1.04 | % (d) | | | 1.03 | % | | | 1.03 | % | | | 1.07 | % | | | 1.07 | % | | | 1.06 | % |
| Ratio of expenses to average net assets | | | 1.00 | % (d) | | | 1.03 | % | | | 1.03 | % | | | 1.07 | % | | | 1.07 | % | | | 1.06 | % |
| Ratio of net investment income to average net assets | | | 1.58 | % (d) | | | 0.84 | % | | | 0.80 | % | | | 1.16 | % | | | 1.34 | % | | | 0.76 | % |
| Portfolio turnover rate(e) | | | 66.31 | % (c) | | | 54.76 | % | | | 72.73 | % | | | 60.56 | % | | | 47.17 | % | | | 34.41 | % |
| (a) | Rounds to less than $0.005 per share. |
| (b) | Total return represents the rate that the investor would have earned or lost on an investment in the Fund, assuming reinvestment of dividends. |
| (e) | Portfolio turnover is calculated on the basis of the Fund as a whole without distinguishing among the classes of shares. |
See accompanying notes which are an integral part of these financial statements.
| Foundry Partners Fundamental Small Cap Value Fund |
| Notes to the Financial Statements |
| April 30, 2023 - (Unaudited) |
NOTE 1. ORGANIZATION
The Foundry Partners Fundamental Small Cap Value Fund (the “Fund”) is registered under the Investment Company Act of 1940, as amended (“1940 Act”), as an open-end diversified series of Valued Advisers Trust (the “Trust”). The Trust is a management investment company established under the laws of Delaware by an Agreement and Declaration of Trust dated June 13, 2008 (the “Trust Agreement”). The Trust Agreement permits the Board of Trustees (the “Board”) to issue an unlimited number of shares of beneficial interest of separate series without par value. The Fund is one of a series of funds authorized by the Board. The Fund’s investment adviser is Foundry Partners, LLC (the “Adviser”). The investment objective of the Fund is long-term capital appreciation.
The Fund currently offers Investor Class shares and Institutional Class shares. Each share represents an equal proportionate interest in the assets and liabilities belonging to the applicable class of the Fund and is entitled to such dividends and distributions out of income belonging to the applicable class of the Fund as are declared by the Board. On matters that affect the Fund as a whole, each class has the same voting and other rights and preferences as any other class. On matters that affect only one class, only shareholders of that class may vote. The Fund may offer additional classes of shares in the future.
NOTE 2. SIGNIFICANT ACCOUNTING POLICIES
The Fund is an investment company and follows accounting and reporting guidance under Financial Accounting Standards Board Accounting Standards Codification (“ASC”) Topic 946, “Financial Services-Investment Companies”. The following is a summary of significant accounting policies followed by the Fund in the preparation of its financial statements. These policies are in conformity with generally accepted accounting principles in the United States of America (“GAAP”).
Estimates
The preparation of financial statements in conformity with GAAP requires management to make estimates and assumptions that affect the reported amounts of assets and liabilities and disclosure of contingent assets and liabilities at the date of the financial statements and the reported amounts of increases and decreases in net assets from operations during the reporting period. Actual results could differ from those estimates.
Federal Income Taxes – The Fund makes no provision for federal income or excise tax. The Fund has qualified and intends to qualify each year as a regulated investment company (“RIC”) under subchapter M of the Internal Revenue Code of 1986, as amended, by complying with the requirements applicable to RICs and by distributing substantially all of its taxable income. The Fund also intends to distribute sufficient net investment
| Foundry Partners Fundamental Small Cap Value Fund |
| Notes to the Financial Statements (continued) |
| April 30, 2023 - (Unaudited) |
income and net realized capital gains, if any, so that it will not be subject to excise tax on undistributed income and gains. If the required amount of net investment income or gains is not distributed, the Fund could incur a tax expense.
As of and during the six months ended April 30, 2023, the Fund did not have any liabilities for any unrecognized tax benefits. The Fund recognizes interest and penalties, if any, related to unrecognized tax benefits as income tax expense on the Statement of Operations when incurred. During the six months ended April 30, 2023, the Fund did not incur any interest or penalties. Management of the Fund has reviewed tax positions taken in tax years that remain subject to examination by all major tax jurisdictions, including federal (i.e., the last three tax year ends and the interim tax period since then, as applicable). Management believes that there is no tax liability resulting from unrecognized tax benefits related to uncertain tax positions taken.
Expenses – Expenses incurred by the Trust that do not relate to a specific fund of the Trust are allocated to the individual funds based on each fund’s relative net assets or another appropriate basis (as determined by the Board). Expenses specifically attributable to any class are borne by that class. Income, realized gains and losses, unrealized appreciation and depreciation, and fund-wide expenses not allocated to a particular class shall be allocated to each class based on the net assets of that class in relation to the net assets of the entire fund.
Security Transactions and Related Income – The Fund follows industry practice and records security transactions on the trade date for financial reporting purposes. The specific identification method is used for determining gains or losses for financial statement and income tax purposes. Dividend income is recorded on the ex-dividend date. Non-cash income, if any, is recorded at the fair market value of the securities received. Withholding taxes on foreign dividends, if any, have been provided for in accordance with the Fund’s understanding of the applicable country’s tax rules and rates.
The Fund holds Real Estate Investment Trusts (“REITs”) which pay dividends to their shareholders based upon available funds from operations. It is possible for these dividends to exceed the REIT’s underlying taxable earnings and profits resulting in the excess portion of such dividends being designated as a return of capital. Distributions received from REITs that represent a return of capital or capital gains are recorded as a reduction of the cost of the REITs or as a realized gain, respectively.
Dividends and Distributions – The Fund intends to distribute its net investment income and net realized long-term and short-term capital gains, if any, at least annually. Dividends and distributions to shareholders, which are determined in accordance with income tax regulations, are recorded on the ex-dividend date. The treatment for financial reporting purposes of distributions made to shareholders during the period from net investment
| Foundry Partners Fundamental Small Cap Value Fund |
| Notes to the Financial Statements (continued) |
| April 30, 2023 - (Unaudited) |
income or net realized capital gains may differ from their ultimate treatment for federal income tax purposes. These differences are caused primarily by differences in the timing of the recognition of certain components of income, expense or realized capital gain for federal income tax purposes. Where such differences are permanent in nature, they are reclassified among the components of net assets based on their ultimate characterization for federal income tax purposes. Any such reclassifications will have no effect on net assets, results of operations or net asset value (“NAV”) per share of the Fund.
Share Valuation – The NAV is calculated each day the New York Stock Exchange (the “NYSE”) is open by dividing the total value of the Fund’s assets, less liabilities, by the number of shares outstanding for the Fund.
Other – The Securities and Exchange Commission (“SEC”) adopted Rule 18f-4 under the 1940 Act which, effective August 19, 2022, regulates the use of derivatives for certain funds registered under the 1940 Act (“Rule 18f-4”). The Trust has adopted a Rule 18f-4 Policy which provides, among other things, that unless a Fund qualifies as a “limited derivatives user” as defined in Rule 18f-4, the Fund is required to establish and maintain a comprehensive derivatives risk management program, subject to oversight by the Board, to appoint a derivatives risk manager, to comply with certain value-at-risk based leverage limits and to provide additional disclosure both publicly and to the SEC regarding its derivatives positions. If a Fund qualifies as a limited derivatives user, Rule 18f-4 requires the Fund to have policies and procedures to manage its aggregate derivatives risk.
NOTE 3. SECURITIES VALUATION AND FAIR VALUE MEASUREMENTS
The Fund values its portfolio securities at fair value as of the close of regular trading on the NYSE (normally 4:00 p.m. Eastern time) on each business day the NYSE is open for business. Fair value is defined as the price that the Fund would receive upon selling an investment in a timely transaction to an independent buyer in the principal or most advantageous market of the investment. GAAP establishes a three-tier hierarchy to maximize the use of observable market data and minimize the use of unobservable inputs and to establish classification of fair value measurements for disclosure purposes.
Inputs refer broadly to the assumptions that market participants would use in pricing the asset or liability, including assumptions about risk (the risk inherent in a particular valuation technique used to measure fair value including a pricing model and/or the risk inherent in the inputs to the valuation technique). Inputs may be observable or unobservable. Observable inputs are inputs that reflect the assumptions market participants would use in pricing the asset or liability developed based on market data obtained and available from sources independent of the reporting entity. Unobservable inputs are inputs that reflect the reporting entity’s own assumptions about the assumptions market participants would use
| Foundry Partners Fundamental Small Cap Value Fund |
| Notes to the Financial Statements (continued) |
| April 30, 2023 - (Unaudited) |
in pricing the asset or liability developed based on the best information available in the circumstances.
Various inputs are used in determining the value of the Fund’s investments. These inputs are summarized in the three broad levels listed below.
| ● | Level 1 – unadjusted quoted prices in active markets for identical investments and/or registered investment companies where the value per share is determined and published and is the basis for current transactions for identical assets or liabilities at the valuation date |
| ● | Level 2 – other significant observable inputs (including, but not limited to, quoted prices for an identical security in an inactive market, quoted prices for similar securities, interest rates, prepayment speeds, credit risk, etc.) |
| ● | Level 3 – significant unobservable inputs (including the Fund’s own assumptions in determining fair value of investments based on the best information available) |
The inputs used to measure fair value may fall into different levels of the fair value hierarchy. In such cases, for disclosure purposes, the level in the fair value hierarchy which is reported is determined based on the lowest level input that is significant to the fair value measurement in its entirety.
Equity securities that are traded on any stock exchange are generally valued at the last quoted sale price on the security’s primary exchange. Lacking a last sale price, an exchange-traded security is generally valued at its last bid price. Securities traded in the Nasdaq over-the-counter market are generally valued at the Nasdaq Official Closing Price. When using the market quotations and when the market is considered active, the security is classified as a Level 1 security. In the event that market quotations are not readily available or are considered unreliable due to market or other events, securities are valued in good faith by the Adviser as “Valuation Designee” under the oversight of the Board. The Adviser has adopted written policies and procedures for valuing securities and other assets in circumstances where market quotes are not readily available. In the event that market quotes are not readily available, and the security or asset cannot be valued pursuant to one of the valuation methods, the value of the security or asset will be determined in good faith by the Adviser pursuant to its policies and procedures. On a quarterly basis, the Adviser’s fair valuation determinations will be reviewed by the Board. Under these policies, the securities will be classified as Level 2 or 3 within the fair value hierarchy, depending on the inputs used.
Investments in mutual funds, including money market mutual funds, are generally priced at the ending NAV. These securities are categorized as Level 1 securities.
| Foundry Partners Fundamental Small Cap Value Fund |
| Notes to the Financial Statements (continued) |
| April 30, 2023 - (Unaudited) |
The following is a summary of the inputs used to value the Fund’s investments as of April 30, 2023:
| | | | | | Valuation Inputs | | | | | | | |
| Assets | | Level 1 | | | Level 2 | | | Level 3 | | | Total | |
| Common Stocks(a) | | $ | 210,749,901 | | | $ | — | | | $ | — | | | $ | 210,749,901 | |
| Money Market Funds | | | 10,525,799 | | | | — | | | | — | | | | 10,525,799 | |
| Total | | $ | 221,275,700 | | | $ | — | | | $ | — | | | $ | 221,275,700 | |
| (a) | Refer to Schedule of Investments for sector classifications. |
The Fund did not hold any investments at the end of the reporting period for which significant unobservable inputs (Level 3) were used in determining fair value; therefore, no reconciliation of Level 3 securities is included for this reporting period.
NOTE 4. FEES AND OTHER TRANSACTIONS WITH AFFILIATES AND OTHER SERVICE PROVIDERS
Under the terms of the management agreement between the Trust and the Adviser for the Fund, the Adviser manages the Fund’s investments subject to oversight of the Board. As compensation for its management services, the Fund is obligated to pay the Adviser a fee computed and accrued daily and paid monthly at an annual rate of 0.85% of the average daily net assets of the Fund.
The Adviser has contractually agreed to waive its management fee and/or reimburse certain operating expenses through February 29, 2024, but only to the extent necessary so that the Fund’s net expenses, excluding brokerage fees and commissions, borrowing costs (such as interest expense and dividends on securities sold short), taxes, distribution and service (12b-1) fees, extraordinary expenses, and any indirect expenses (such as fees and expenses of acquired funds), do not exceed an annual rate of 0.99% of the average daily net assets of the Fund. Prior to January 1, 2023, the Adviser contractually agreed to waive its management fee and/or reimburse certain Fund operating expenses, as described above, so that the Fund’s net expenses did not exceed an annual rate of 1.25%.
| Foundry Partners Fundamental Small Cap Value Fund |
| Notes to the Financial Statements (continued) |
| April 30, 2023 - (Unaudited) |
Each fee waiver or expense reimbursement by the Adviser is subject to repayment by the Fund within the three years following the date in which the fee waiver or expense reimbursement occurred, provided that the Fund is able to make the repayment without exceeding the expense limitation that is in effect at the time of the repayment, and the expense limitation that is in effect at the time of the fee waiver or expense reimbursement. The expense cap may not be terminated prior to this date except by mutual consent of the Adviser and the Board. The amount subject to repayment by the Fund, pursuant to the aforementioned conditions is as follows:
| Recoverable Through | |
| April 30, 2026 | | $ | 38,662 | |
The Trust retains Ultimus Fund Solutions, LLC (“Ultimus” or the “Administrator”), to provide the Fund with administration, fund accounting and transfer agent services, including all regulatory reporting.
Northern Lights Compliance Services, LLC (“NLCS”), an affiliate of Ultimus, provides a Chief Compliance Officer and an Anti-Money Laundering Compliance Officer to the Trust, as well as related compliance services, pursuant to a consulting agreement between NLCS and the Trust. Under the terms of such agreement, NLCS receives fees from the Fund.
The officers and one trustee of the Trust are members of management and/or employees of the Administrator or of NLCS, and are not paid by the Trust for services to the Fund. Ultimus Fund Distributors, LLC (the “Distributor”) acts as the distributor of the Fund’s shares. The Distributor is a wholly-owned subsidiary of Ultimus. There were no payments made to the Distributor by the Fund for the six months ended April 30, 2023.
The Fund has adopted a Distribution Plan (the “Plan”) pursuant to Rule 12b-1 under the 1940 Act. The Plan provides that the Fund will pay the Distributor or any registered securities dealer, financial institution or any other person (a “Recipient”) a fee aggregating at a rate of 0.25% of the average daily net assets of the Investor Class shares in connection with the promotion and distribution of the Fund’s shares or the provision of personal services to shareholders, including, but not necessarily limited to, advertising, compensation to underwriters, dealers and selling personnel; the printing and mailing of prospectuses to other than current Fund shareholders; the printing and mailing of sales literature; and servicing shareholder accounts. The Fund or the Adviser may pay all or a portion of these fees to any Recipient who renders assistance in distributing or promoting the sale of shares, or who provides certain shareholder services, pursuant to a written agreement. The Plan is a compensation plan, which means that compensation is paid regardless of 12b-1 expenses actually incurred. It is anticipated that the Plan will benefit shareholders because an effective sales program typically is necessary in order for the Fund to reach and maintain a sufficient size to achieve efficiently its investment objectives and to realize economies of scale.
NOTE 5. PURCHASES AND SALES OF SECURITIES
For the six months ended April 30, 2023, purchases and sales of investment securities, other than short-term investments, were $153,851,342 and $177,233,048, respectively.
| Foundry Partners Fundamental Small Cap Value Fund |
| Notes to the Financial Statements (continued) |
| April 30, 2023 - (Unaudited) |
There were no purchases or sales of long-term U.S. government obligations during the six months ended April 30, 2023.
NOTE 6. FEDERAL TAX INFORMATION
At April 30, 2023, the net unrealized appreciation (depreciation) and tax cost of investments for tax purposes was as follows:
| Gross unrealized appreciation | | $ | 17,536,761 | |
| Gross unrealized depreciation | | | (14,972,855 | ) |
| Net unrealized appreciation on investments | | $ | 2,563,906 | |
| Tax cost of investments | | $ | 218,711,794 | |
The tax character of distributions paid for the fiscal year ended October 31, 2022, the Fund’s most recent fiscal year end, was as follows:
| Distributions paid from: | | | | |
| Ordinary income(a) | | $ | 30,651,097 | |
| Long-term capital gains | | | 6,345,047 | |
| Total taxable distributions | | | 36,996,144 | |
| Total distributions paid | | $ | 36,996,144 | |
| (a) | The difference between book basis and tax basis unrealized appreciation (depreciation) is primarily attributable to the tax deferral of wash losses and return of capital adjustments. |
At October 31, 2022, the components of accumulated earnings (deficit) on a tax basis were as follows:
| Undistributed ordinary income | | $ | 1,403,803 | |
| Undistributed long-term capital gains | | | 23,053,852 | |
| Unrealized appreciation on investments | | | 31,339,662 | |
| Total accumulated earnings | | $ | 55,797,317 | |
NOTE 7. OTHER MATTERS
In April 2014, New York based fashion company The Jones Group went private through a leveraged buyout (the “LBO”). In connection with the LBO, Jones Group paid out roughly $1.2 billion to its shareholders to buy back its outstanding stock at $15 per share. Four years later, Nine West Holdings, the company that emerged from the LBO, filed for bankruptcy under Chapter 11. After Nine West’s Chapter 11 plan was confirmed, the Trustee of a Litigation Trust formed under the plan, together with the Indenture Trustee for
| Foundry Partners Fundamental Small Cap Value Fund |
| Notes to the Financial Statements (continued) |
| April 30, 2023 - (Unaudited) |
certain notes issued by Jones Group/ Nine West, commenced a series of lawsuits against the former Jones Group shareholders who tendered their shares in the LBO, including the Fund. The plaintiffs in these suits seek to unwind the stock repurchase transactions that were part of the LBO on the grounds that they constitute fraudulent conveyances under the Bankruptcy Code and state law and to recover the amounts paid to the former Jones Group shareholders. Plaintiffs allege that the Fund received $1,209,420 for its shares in the LBO and seek to claw back those funds as part of the lawsuit.
On August 27, 2020, the Southern District of New York dismissed all fraudulent conveyance and unjust enrichment claims with respect to the payments made to stockholders in connection with the LBO, including the payments made to the Fund, on the basis that the transaction qualified for protection under the safe harbor provided for in Section 546(e) of the Bankruptcy Code. As part of the ruling, all claims against the Fund were dismissed and judgment was entered in its favor. The Trustee has appealed the ruling, and the matter is now pending before the United States Court of Appeals for the Second Circuit.
NOTE 8. COMMITMENTS AND CONTINGENCIES
The Trust indemnifies its officers and Trustees for certain liabilities that may arise from their performance of their duties to the Trust or the Fund. Additionally, in the normal course of business, the Trust enters into contracts that contain a variety of representations and warranties which provide general indemnifications. The Trust’s maximum exposure under these arrangements is unknown, as this would involve future claims that may be made against the Trust that have not yet occurred.
NOTE 9. SUBSEQUENT EVENTS
Effective July 7, 2023, the Fund will be known as the Foundry Partners Small Cap Value Fund.
Management of the Fund has evaluated the need for disclosures and/or adjustments resulting from subsequent events through the date at which these financial statements were issued. Based upon this evaluation, management has determined there were no additional items requiring adjustment of the financial statements or additional disclosure.
| Summary of Fund Expenses (Unaudited) |
As a shareholder of the Fund, you incur two types of costs: (1) transaction and (2) ongoing costs, including management fees and other Fund expenses. These examples are intended to help you understand your ongoing costs (in dollars) of investing in the Fund and to compare these costs with the ongoing costs of investing in other mutual funds. The example is based on an investment of $1,000 invested at the beginning of the period and held for the entire period from November 1, 2022 through April 30, 2023.
Actual Expenses
The first line of the table below provides information about actual account values and actual expenses. You may use the information in this line, together with the amount you invested, to estimate the expenses that you paid over the period. Simply divide your account value by $1,000 (for example, an $8,600 account value divided by $1,000 = 8.6), then multiply the result by the number in the first line under the heading “Expenses Paid During Period” to estimate the expenses you paid on your account during this period.
Hypothetical Example for Comparison Purposes
The second line of the table below provides information about hypothetical account values and hypothetical expenses based on the Fund’s actual expense ratio and an assumed rate of return of 5% per year before expenses, which is not the Fund’s actual return. The hypothetical account values and expenses may not be used to estimate the actual ending account balance or expenses you paid for the period. You may use this information to compare the ongoing costs of investing in the Fund and other funds. To do so, compare this 5% hypothetical example with the 5% hypothetical examples that appear in the shareholder reports of other funds.
Expenses shown in the table are meant to highlight your ongoing costs only and do not reflect any transactional costs. Therefore, the second line of the table below is useful in comparing ongoing costs only and will not help you determine the relative total costs of owning different funds. In addition, if transaction costs were included, your costs would have been higher.
| | | | | Beginning | | | Ending | | | | | | |
| | | | | Account | | | Account | | | Expenses | | | |
| | | | | Value | | | Value | | | Paid | | | Annualized |
| | | | | November 1, | | | April 30, | | | During | | | Expense |
| | | | | 2022 | | | 2023 | | | Period(a) | | | Ratio |
| Foundry Partners Fundamental Small Cap Value Fund | | | | | | | | | | | | | | |
| Investor Class | | Actual | | $ | 1,000.00 | | | $ | 974.70 | | | $ | 6.12 | | | 1.25% |
| | | Hypothetical(b) | | $ | 1,000.00 | | | $ | 1,018.60 | | | $ | 6.26 | | | 1.25% |
| Institutional Class | | Actual | | $ | 1,000.00 | | | $ | 976.10 | | | $ | 4.90 | | | 1.00% |
| | | Hypothetical(b) | | $ | 1,000.00 | | | $ | 1,019.84 | | | $ | 5.01 | | | 1.00% |
| (a) | Expenses are equal to the Fund’s annualized expense ratios, multiplied by the average account value over the period, multiplied by 181/365 (to reflect the one-half year period). |
| (b) | Hypothetical assumes 5% annual return before expenses. |
| FACTS | WHAT DOES FOUNDRY PARTNERS FUNDAMENTAL SMALL CAP VALUE FUND (THE “FUND”) DO WITH YOUR PERSONAL INFORMATION? |
| |
| Why? | Financial companies choose how they share your personal information. Federal law gives consumers the right to limit some but not all sharing. Federal law also requires us to tell you how we collect, share, and protect your personal information. Please read this notice carefully to understand what we do. |
| |
| What? | The types of personal information we collect and share depend on the product or service you have with us. This information can include: ■ Social Security number ■ account balances and account transactions ■ transaction or loss history and purchase history ■ checking account information and wire transfer instructions When you are no longer our customer, we continue to share your information as described in this notice. |
| |
| How? | All financial companies need to share customers’ personal information to run their everyday business. In the section below, we list the reasons financial companies can share their customers’ personal information; the reasons the Funds choose to share; and whether you can limit this sharing. |
| |
| Reasons we can share your personal information | Does the Fund share? |
For our everyday business purposes— such as to process your transactions, maintain your account(s), respond to court orders and legal investigations, or report to credit bureaus | Yes |
For our marketing purposes— to offer our products and services to you | No |
| For joint marketing with other financial companies | No |
For our affiliates’ everyday business purposes— information about your transactions and experiences | No |
For our affiliates’ everyday business purposes— information about your creditworthiness | No |
| For nonaffiliates to market to you | No |
| | | |
| Questions? | Call (800) 247-1014 |
| Who we are |
| Who is providing this notice? | Foundry Partners Fundamental Small Cap Value Fund Ultimus Fund Distributors, LLC (Distributor) Ultimus Fund Solutions, LLC (Administrator) |
| What we do |
| How does the Fund protect my personal information? | To protect your personal information from unauthorized access and use, we use security measures that comply with federal law. These measures include computer safeguards and secured files and buildings. Our service providers are held accountable for adhering to strict policies and procedures to prevent any misuse of your nonpublic personal information. |
| How does the Fund collect my personal information? | We collect your personal information, for example, when you ■ open an account or deposit money ■ buy securities from us or sell securities to us ■ make deposits or withdrawals from your account ■ give us your account information ■ make a wire transfer ■ tell us who receives the money ■ tell us where to send the money ■ show your government-issued ID ■ show your driver’s license |
| Why can’t I limit all sharing? | Federal law gives you the right to limit only ■ sharing for affiliates’ everyday business purposes— information about your creditworthiness ■ affiliates from using your information to market to you ■ sharing for nonaffiliates to market to you State laws and individual companies may give you additional rights to limit sharing. |
| Definitions |
| Affiliates | Companies related by common ownership or control. They can be financial and nonfinancial companies. ■ Foundry Partners, LLC, the investment adviser to the Fund, could be deemed to be an affiliate. |
| Nonaffiliates | Companies not related by common ownership or control. They can be financial and nonfinancial companies. ■ The Fund does not share your personal information with nonaffiliates so they can market to you. |
| Joint marketing | A formal agreement between nonaffiliated financial companies that together market financial products or services to you. ■ The Fund does not jointly market. |
Proxy Voting
A description of the policies and procedures that the Fund uses to determine how to vote proxies relating to portfolio securities and information regarding how the Fund voted those proxies during the most recent twelve month period ended June 30, are available (1) without charge upon request by calling the Fund at (800) 247-1014 and (2) in Fund documents filed with the SEC on the SEC’s website at www.sec.gov.
TRUSTEES
Andrea N. Mullins, Chairperson
Ira P. Cohen
Mark J. Seger | INDEPENDENT REGISTERED
PUBLIC ACCOUNTING FIRM
Cohen & Company, Ltd.
1350 Euclid Avenue, Suite 800
Cleveland, OH 44115 |
| | |
| | |
OFFICERS
Matthew J. Miller, Principal Executive Officer and
President
Zachary P. Richmond, Principal Financial Officer and
Treasurer
N. Lynn Bowley, Chief Compliance Officer
Carol J. Highsmith, Vice President and Secretary | LEGAL COUNSEL
Troutman Pepper Hamilton Sanders LLP
3000 Two Logan Square
18th and Arch Streets
Philadelphia, PA 19103 |
| | |
| | |
INVESTMENT ADVISER
Foundry Partners, LLC
323 Washington Avenue North, Suite 360
Minneapolis, MN 55401 | CUSTODIAN
Huntington National Bank
41 South High Street
Columbus, OH 43215 |
| | |
| | |
DISTRIBUTOR
Ultimus Fund Distributors, LLC
225 Pictoria Drive, Suite 450
Cincinnati, OH 45246 | ADMINISTRATOR, TRANSFER
AGENT AND FUND ACCOUNTANT
Ultimus Fund Solutions, LLC
225 Pictoria Drive, Suite 450
Cincinnati, OH 45246 |
| | |
This report is intended only for the information of shareholders or those who have received the Fund’s prospectus which contains information about the Fund’s management fee and expenses. Please read the prospectus carefully before investing.
Distributed by Ultimus Fund Distributors, LLC Member FINRA/SIPC
Foundry-SAR-23
 |
| |
| |
| |
| |
| |
| |
| |
| |
| |
| Kovitz Core Equity ETF |
| |
| |
| |
| Semi-Annual Report |
| |
| April 30, 2023 |
| |
| |
| |
| |
| |
| |
| |
| |
| |
| |
| |
| |
| |
| |
| |
| |
| Fund Adviser: |
| Kovitz Investment Group Partners, LLC |
| 71 South Wacker Drive, Suite 1860 |
| Chicago, IL 60606 |
| Toll Free (877) 714-2327 |
| |
| |
| Investment Results (Unaudited) |
| |
Average Annual Total Returns(a) as of April 30, 2023
| | | | | | Since | Inception |
| | Six Months | One Year | Five Year | Ten Year | Inception | Date |
| Kovitz Core Equity ETF - NAV | 9.66% | 1.37% | 8.35% | 8.89% | 10.85% | 12/27/11 |
| Kovitz Core Equity ETF – Market Price | N/A | N/A | N/A | N/A | 8.92% | 12/9/22 |
| S&P 500® Index(b) | 8.63% | 2.66% | 11.45% | 12.20% | 13.27% | 12/27/11 |
| | | | | | | |
Total annual operating expenses, as disclosed in the Kovitz Core Equity ETF (the “Fund”) prospectus dated February 28, 2023, were 0.99% of average daily net assets. Kovitz Investment Group Partners, LLC (the “Adviser”) is required to pay all of the operating expenses of the Fund except portfolio transactions and other investment related costs (such as brokerage fees and commissions, and fees and expenses associated with investments in derivative instruments, including futures, option and swap fees and expenses), taxes, borrowing costs (such as interest and dividend expense on securities sold short), extraordinary expenses, and any indirect expenses (such as fees and expenses associated with investment in acquired funds and other collective investment vehicles). Additional information pertaining to the Fund’s expense ratios as of April 30, 2023 can be found in the financial highlights.
The performance quoted represents past performance, which does not guarantee future results. The investment return and principal value of an investment will fluctuate so that an investor’s shares, when redeemed, may be worth more or less than their original cost. The returns shown do not reflect deduction of taxes that a shareholder would pay on Fund distributions or the redemption of Fund shares. The Fund’s investment objective, risks, charges and expenses must be considered carefully before investing. Current performance of the Fund may be lower or higher than the performance quoted. Performance data current to the most recent month end may be obtained by calling (877) 714-2327.
The returns presented above for the Fund reflect the performance of the Green Owl Intrinsic Value Fund (the “Predecessor Fund”) for periods prior to December 9, 2022. The Fund has adopted the performance of the Predecessor Fund as the result of a reorganization consummated after the close of business on December 9, 2022, in which the Fund acquired all or substantially all of the assets and all of the stated liabilities included in the financial statements of the Predecessor Fund (the “Reorganization”). Prior to the Reorganization, the Fund was a “shell” fund with no assets and had not commenced operations.
| (a) | Return figures reflect any change in price per share and assume the reinvestment of all distributions. The Fund’s returns reflect any fee reductions during the applicable periods. If such fee reductions had not occurred, the quoted performance would have been lower. Total returns for periods less than one year are not annualized. |
| (b) | The S&P 500 ® Index (the “Index”) is an unmanaged index generally representing the performance of the broad domestic economy through changes in the aggregate market value of 500 stocks representing all major industries. Individuals cannot invest directly in the Index; however, an individual may invest in exchange-traded funds or other investment vehicles that attempt to track the performance of a benchmark index. |
The Fund is distributed by Northern Lights Distributors, LLC, Member FINRA/SIPC.
| Fund Holdings (Unaudited) |
| |
Kovitz Core Equity ETF Holdings as of April 30, 2023*
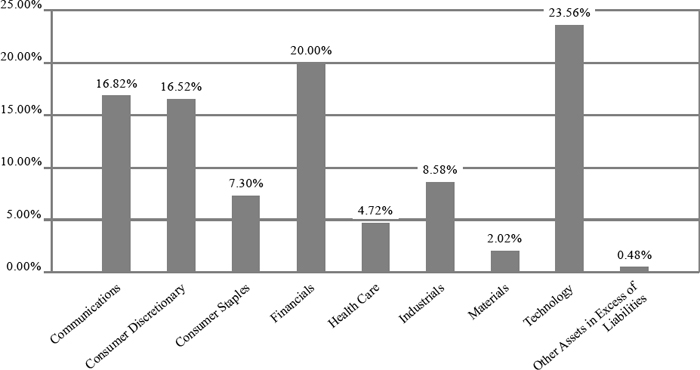
| * | As a percentage of net assets. |
The investment objective of the Kovitz Core Equity ETF is long-term capital appreciation.
| Availability of Portfolio Schedule (Unaudited) |
| |
The Fund files its complete schedule of portfolio holdings with the Securities and Exchange Commission (“SEC”) for the first and third quarters of each fiscal year as an exhibit to its reports on Form N-PORT. The Fund’s Form N-PORT reports are available on the SEC’s website at www.sec. gov and on the Fund’s website at www.kovitzetf.com.
| Kovitz Core Equity ETF |
| Schedule of Investments |
| April 30, 2023 (Unaudited) |
| COMMON STOCKS — 99.52% | | Shares | | | Fair Value | |
| Communications — 16.82% | | | | | | | | |
| Alphabet, Inc., Class A(a) | | | 75,364 | | | $ | 8,089,572 | |
| Alphabet, Inc., Class C(a) | | | 312,595 | | | | 33,829,031 | |
| Charter Communications, Inc., Class A(a) | | | 56,281 | | | | 20,750,805 | |
| Expedia Group, Inc.(a) | | | 78,828 | | | | 7,406,679 | |
| GoDaddy, Inc., Class A(a) | | | 234,156 | | | | 17,720,926 | |
| Meta Platforms, Inc., Class A(a) | | | 117,731 | | | | 28,293,113 | |
| Spotify Technology SA(a) | | | 56,324 | | | | 7,524,886 | |
| Walt Disney Co. (The)(a) | | | 137,973 | | | | 14,142,233 | |
| | | | | | | | 137,757,245 | |
| Consumer Discretionary — 16.52% | | | | | | | | |
| Amazon.com, Inc.(a) | | | 239,775 | | | | 25,284,274 | |
| CarMax, Inc.(a) | | | 290,466 | | | | 20,341,334 | |
| General Motors Co. | | | 474,802 | | | | 15,687,458 | |
| Gildan Activewear, Inc. | | | 595,174 | | | | 19,390,769 | |
| Hasbro, Inc. | | | 234,328 | | | | 13,876,904 | |
| Las Vegas Sands Corp.(a) | | | 323,063 | | | | 20,627,573 | |
| Lowe's Companies, Inc. | | | 96,946 | | | | 20,148,287 | |
| | | | | | | | 135,356,599 | |
| Consumer Staples — 7.30% | | | | | | | | |
| Dollar Tree, Inc.(a) | | | 161,136 | | | | 24,768,215 | |
| PepsiCo, Inc. | | | 4,300 | | | | 820,827 | |
| Philip Morris International, Inc. | | | 341,887 | | | | 34,178,443 | |
| | | | | | | | 59,767,485 | |
| Financials — 20.00% | | | | | | | | |
| American Express Co. | | | 140,401 | | | | 22,652,297 | |
| Aon PLC, Class A | | | 39,385 | | | | 12,807,214 | |
| Berkshire Hathaway, Inc., Class A(a) | | | 1 | | | | 502,880 | |
| Berkshire Hathaway, Inc., Class B(a) | | | 100,557 | | | | 33,038,002 | |
| Blackstone Group L.P. (The), Class A | | | 189,042 | | | | 16,887,122 | |
| Charles Schwab Corp. (The) | | | 543,114 | | | | 28,372,276 | |
| Intercontinental Exchange, Inc. | | | 190,758 | | | | 20,779,269 | |
| JPMorgan Chase & Co. | | | 208,493 | | | | 28,822,072 | |
| | | | | | | | 163,861,132 | |
| Health Care — 4.72% | | | | | | | | |
| Abbott Laboratories | | | 6,255 | | | | 690,990 | |
| Becton, Dickinson and Co. | | | 138,891 | | | | 36,710,280 | |
| Stryker Corp. | | | 4,291 | | | | 1,285,798 | |
| | | | | | | | 38,687,068 | |
| Industrials — 8.58% | | | | | | | | |
| Equifax, Inc. | | | 2,885 | | | | 601,176 | |
| Graco, Inc. | | | 13,898 | | | | 1,101,973 | |
| Hayward Holdings, Inc.(a) | | | 444,942 | | | | 5,357,102 | |
| Illinois Tool Works, Inc. | | | 3,680 | | | | 890,339 | |
| Jacobs Solutions, Inc. | | | 243,717 | | | | 28,139,565 | |
| Johnson Controls International PLC | | | 10,418 | | | | 623,413 | |
| Keysight Technologies, Inc.(a) | | | 85,935 | | | | 12,429,638 | |
| | | | | | | | | |
See accompanying notes which are an integral part of these financial statements.
| Kovitz Core Equity ETF |
| Schedule of Investments (continued) |
| April 30, 2023 (Unaudited) |
| COMMON STOCKS — 99.52% - continued | | Shares | | | Fair Value | |
| Industrials — 8.58% - continued | | | | | | | | |
| Lincoln Electric Holdings, Inc. | | | 6,108 | | | $ | 1,024,922 | |
| PACCAR, Inc. | | | 262,890 | | | | 19,635,254 | |
| Verisk Analytics, Inc. | | | 3,469 | | | | 673,368 | |
| | | | | | | | 70,476,750 | |
| Materials — 2.02% | | | | | | | | |
| PPG Industries, Inc. | | | 117,886 | | | | 16,534,690 | |
| Technology — 23.56% | | | | | | | | |
| Analog Devices, Inc. | | | 150,292 | | | | 27,034,525 | |
| Apple, Inc. | | | 206,906 | | | | 35,107,811 | |
| Arista Networks, Inc.(a) | | | 79,165 | | | | 12,679,066 | |
| Autodesk, Inc.(a) | | | 83,897 | | | | 16,342,297 | |
| Microsoft Corp. | | | 6,908 | | | | 2,122,552 | |
| Motorola Solutions, Inc. | | | 113,409 | | | | 33,047,383 | |
| Salesforce.com, Inc.(a) | | | 128,524 | | | | 25,495,306 | |
| Splunk, Inc.(a) | | | 106,806 | | | | 9,210,949 | |
| TE Connectivity Ltd. | | | 3,636 | | | | 444,937 | |
| Texas Instruments, Inc. | | | 7,514 | | | | 1,256,341 | |
| Visa, Inc., Class A | | | 128,826 | | | | 29,981,675 | |
| | | | | | | | 192,722,842 | |
| Total Common Stocks/Investments — 99.52% (Cost $671,675,713) | | | | | | | 815,163,811 | |
| | | | | | | | | |
| Other Assets in Excess of Liabilities — 0.48% | | | | | | | 3,938,936 | |
| NET ASSETS — 100.00% | | | | | | $ | 819,102,747 | |
| | | | | | | | | |
| (a) | Non-income producing security. |
See accompanying notes which are an integral part of these financial statements.
| Kovitz Core Equity ETF |
| Statement of Assets and Liabilities |
| April 30, 2023 (Unaudited) |
| Assets | | | | |
| Investments in securities at fair value (cost $671,675,713) (Note 3) | | $ | 815,163,811 | |
| Cash | | | 6,898,841 | |
| Dividends and interest receivable | | | 549,949 | |
| Tax reclaims receivable | | | 32,784 | |
| Total Assets | | | 822,645,385 | |
| | | | | |
| Liabilities | | | | |
| Payable for investments purchased | | | 2,879,112 | |
| Payable to Adviser (Note 4) | | | 663,526 | |
| Total Liabilities | | | 3,542,638 | |
| Net Assets | | $ | 819,102,747 | |
| | | | | |
| Net Assets consist of: | | | | |
| Paid-in capital | | $ | 633,728,493 | |
| Accumulated earnings | | | 185,374,254 | |
| | | | | |
| Net Assets | | $ | 819,102,747 | |
| Shares outstanding (unlimited number of shares authorized, no par value) | | | 46,823,196 | |
| Net asset value, offering and redemption price per share (Note 2) | | $ | 17.49 | |
| | | | | |
See accompanying notes which are an integral part of these financial statements.
| Kovitz Core Equity ETF |
| Statement of Operations |
| For the six months ended April 30, 2023 (Unaudited) |
| Investment Income | | | | |
| Dividend income (net of foreign taxes withheld of $10,239) | | $ | 3,709,240 | |
| Interest income | | | 83,398 | |
| Total investment income | | | 3,792,638 | |
| | | | | |
| Expenses | | | | |
| Investment Adviser fees (Note 4) | | | 2,875,544 | |
| Administration fees (Note 4) | | | 5,255 | |
| Fund accounting fees (Note 4) | | | 2,628 | |
| Custodian fees | | | 2,494 | |
| Transfer agent fees | | | 2,434 | |
| Compliance service fees (Note 4) | | | 1,999 | |
| Legal fees | | | 1,500 | |
| Miscellaneous expenses | | | 26,652 | |
| Total expenses | | | 2,918,506 | |
| Fees contractually waived by Adviser | | | (35,053 | ) |
| Net operating expenses | | | 2,883,453 | |
| Net investment income | | | 909,185 | |
| | | | | |
| Net Realized and Change in Unrealized Gain (Loss) on Investments | | | | |
| Net realized gain on: | | | | |
| Investment securities | | | 41,634,298 | |
| Foreign currency translations | | | 6 | |
| Net change in unrealized appreciation on: | | | | |
| Investment securities transactions | | | 127,145,084 | |
| Foreign currency translations | | | 773 | |
| Net realized and change in unrealized gain on investments | | | 168,780,161 | |
| Net increase in net assets resulting from operations | | $ | 169,689,346 | |
| | | | | |
See accompanying notes which are an integral part of these financial statements.
| Kovitz Core Equity ETF |
| Statements of Changes in Net Assets |
| | | For the Six | | | For the Year | |
| | | Months Ended | | | Ended October | |
| | | April 30, 2023 | | | 31, 2022 | |
| | | (Unaudited) | | | | |
| Increase (Decrease) in Net Assets due to: | | | | | | | | |
| Operations | | | | | | | | |
| Net investment income (loss) | | $ | 909,185 | | | $ | (155,809 | ) |
| Net realized gain on investment securities transactions and foreign currency translations | | | 41,634,304 | | | | 7,554,422 | |
| Net change in unrealized appreciation (depreciation) of investment securities and foreign currency translations | | | 127,145,857 | | | | (26,915,653 | ) |
| Net increase (decrease) in net assets resulting from operations | | | 169,689,346 | | | | (19,517,040 | ) |
| | | | | | | | | |
| Distributions to Shareholders from Earnings (Note 2) | | | (8,121,134 | ) | | | (15,703,324 | ) |
| | | | | | | | | |
| Capital Transactions | | | | | | | | |
| Proceeds from shares sold | | | 676,132,799 | | | | 10,452,803 | |
| Reinvestment of distributions | | | 7,301,870 | | | | 15,022,739 | |
| Amount paid for shares redeemed | | | (102,475,720 | ) | | | (13,046,563 | ) |
| Net increase in net assets resulting from capital transactions | | | 580,958,949 | | | | 12,428,979 | |
| Total Increase (Decrease) in Net Assets | | | 742,527,161 | | | | (22,791,385 | ) |
| | | | | | | | | |
| Net Assets | | | | | | | | |
| Beginning of period | | | 76,575,586 | | | | 99,366,971 | |
| End of period | | $ | 819,102,747 | | | $ | 76,575,586 | |
| | | | | | | | | |
| Share Transactions | | | | | | | | |
| Shares sold | | | 48,345,572 | | | | 525,123 | |
| Shares issued in reinvestment of distributions | | | 452,689 | | | | 684,095 | |
| Shares redeemed | | | (6,292,397 | ) | | | (654,391 | ) |
| Net increase in shares outstanding | | | 42,505,864 | | | | 554,827 | |
| | | | | | | | | |
See accompanying notes which are an integral part of these financial statements.
| Kovitz Core Equity ETF |
| Financial Highlights |
| |
| (For a share outstanding during each period) |
| | | For the Six | | | | | | | | | | | | | | | | |
| | | Months | | | | | | | | | | | | | | | | |
| | | Ended April | | | | | | | | | | | | | | | | |
| | | 30, 2023 | | | For the Years Ended October 31, | |
| | | (Unaudited) | | | 2022 | | | 2021 | | | 2020 | | | 2019 | | | 2018 | |
| Selected Per Share Data | | | | | | | | | | | | | | | | | | | | | | | | |
| Net asset value, beginning of period | | $ | 17.74 | | | $ | 26.41 | | | $ | 17.94 | | | $ | 18.81 | | | $ | 18.99 | | | $ | 19.09 | |
| Investment operations: | | | | | | | | | | | | | | | | | | | | | | | | |
| Net investment income (loss) | | | 0.04 | | | | (0.04 | ) | | | (0.04 | ) | | | 0.03 | | | | 0.19 | | | | 0.05 | |
| Net realized and unrealized gain (loss) on investments | | | 1.52 | | | | (4.44 | ) | | | 9.10 | | | | 0.05 | | | | 1.47 | | | | 0.24 | |
| Total from investment operations | | | 1.56 | | | | (4.48 | ) | | | 9.06 | | | | 0.08 | | | | 1.66 | | | | 0.29 | |
| Less distributions to shareholders from: | | | | | | | | | | | | | | | | | | | | | | | | |
| Net investment income | | | (0.01 | ) | | | — | | | | — | (a) | | | (0.17 | ) | | | (0.05 | ) | | | (0.04 | ) |
| Net realized gains | | | (1.80 | ) | | | (4.19 | ) | | | (0.59 | ) | | | (0.78 | ) | | | (1.79 | ) | | | (0.35 | ) |
| Total distributions | | | (1.81 | ) | | | (4.19 | ) | | | (0.59 | ) | | | (0.95 | ) | | | (1.84 | ) | | | (0.39 | ) |
| Net asset value, end of period | | $ | 17.49 | | | $ | 17.74 | | | $ | 26.41 | | | $ | 17.94 | | | $ | 18.81 | | | $ | 18.99 | |
| Market price, end of period | | $ | 17.51 | | | $ | — | | | $ | — | | | $ | — | | | $ | — | | | $ | — | |
| Total Return(b) | | | 9.66 | % (c) | | | (20.01 | )% | | | 51.56 | % | | | 0.23 | % | | | 10.34 | % | | | 1.50 | % |
| Ratios and Supplemental Data: | | | | | | | | | | | | | | | | | | | | | | | | |
| Net assets, end of period (000 omitted) | | $ | 819,103 | | | $ | 76,576 | | | $ | 99,367 | | | $ | 77,665 | | | $ | 83,966 | | | $ | 78,417 | |
| Ratio of expenses to average net assets after expense waiver | | | 0.99 | % (d) | | | 1.10 | % | | | 1.10 | % | | | 1.10 | % | | | 1.10 | % | | | 1.10 | % |
| Ratio of expenses to average net assets before expense waiver | | | 1.00 | % (d) | | | 1.30 | % | | | 1.28 | % | | | 1.34 | % | | | 1.32 | % | | | 1.32 | % |
| Ratio of net investment income (loss) to average net assets after expense waiver | | | 0.31 | % (d) | | | (0.18 | )% | | | (0.17 | )% | | | 0.15 | % | | | 1.04 | % | | | 0.26 | % |
| Portfolio turnover rate | | | 12 | % (c) | | | 26 | % | | | 20 | % | | | 46 | % | | | 29 | % | | | 33 | % |
| | | | | | | | | | | | | | | | | | | | | | | | | |
| (a) | Rounds to less than $0.005 per share. |
| (b) | Total return is calculated assuming a purchase of shares at net asset value on the first day and a sale at net asset value on the last day of the period. Distributions are assumed, for the purpose of this calculation, to be reinvested at the ex-dividend date net asset value per share on their respective payment dates. |
See accompanying notes which are an integral part of these financial statements.
| Kovitz Core Equity ETF |
| Notes to the Financial Statements |
| April 30, 2023 (Unaudited) |
NOTE 1. ORGANIZATION
The Kovitz Core Equity ETF (the “Fund”) is registered under the Investment Company Act of 1940, as amended (“1940 Act”), as an open-end diversified series of Valued Advisers Trust (the “Trust”). The Trust is a management investment company established under the laws of Delaware by an Agreement and Declaration of Trust dated June 13, 2008 (the “Trust Agreement”). The Trust Agreement permits the Board of Trustees (the “Board”) to issue an unlimited number of shares of beneficial interest of separate series without par value. The Fund is one of a series of funds authorized by the Board. The Fund’s investment adviser is Kovitz Investment Group Partners, LLC (the “Adviser”). The investment objective of the Fund is to provide long-term capital appreciation.
The Fund is the successor in interest to the Green Owl Intrinsic Value Fund (the “Predecessor Fund”). The Predecessor Fund was previously organized as a series of the Trust, and advised by the Adviser. On June 1-2, 2022, the Board of Trustees of the Trust (the “Board”) approved the reorganization of the Predecessor Fund with and into the Fund, a “shell” series of the Trust, and effective as of the close of business on December 9, 2022, the Fund acquired all or substantially all of the assets and all of the stated liabilities included in the financial statements of the Predecessor Fund (the “Reorganization”). The Fund succeeded to the accounting and performance histories of the Predecessor Fund. Any such historical information provided in these financial statements for the Fund that relates to periods prior to December 9, 2022, is therefore that of the Predecessor Fund. The Predecessor Fund had the same investment objectives and substantially similar investment strategies to the Fund, and was managed by the same portfolio managers as the Fund. The Predecessor Fund commenced operations in 2011.
On June 1-2, 2022, the Board also approved the reorganization of The Marathon Value Portfolio, a series of Northern Lights Fund Trust III (the “Marathon Fund”), with and into the Fund, and effective as of the close of business on December 9, 2022 the assets and liabilities of the Marathon Fund were transferred to the Fund in exchange for shares of the Fund. The Marathon Fund had similar investment objectives and policies as the Fund and was managed by the same portfolio managers. The Adviser also managed the assets of multiple separately managed accounts (the “SMAs”) that were transferred to the Fund.
NOTE 2. SIGNIFICANT ACCOUNTING POLICIES
The Fund is an investment company and follows accounting and reporting guidance under Financial Accounting Standards Board Accounting Standards Codification (“ASC”) Topic 946, “Financial Services-Investment Companies” including Accounting Standards Update 2013-08. The following is a summary of significant accounting policies followed by the
| Kovitz Core Equity ETF |
| Notes to the Financial Statements (continued) |
| April 30, 2023 (Unaudited) |
Fund in the preparation of its financial statements. These policies are in conformity with generally accepted accounting principles in the United States of America (“GAAP”).
Estimates – The preparation of financial statements in conformity with GAAP requires management to make estimates and assumptions that affect the reported amounts of assets and liabilities and disclosure of contingent assets and liabilities at the date of the financial statements and the reported amounts of increases and decreases in net assets from operations during the reporting period. Actual results could differ from those estimates.
Foreign Currency Translation – The accounting records of the Fund are maintained in U.S. dollars. Foreign currency amounts are translated into U.S. dollars at the current rate of exchange each business day to determine the value of investments, and other assets and liabilities. Purchases and sales of foreign securities, and income and expenses, are translated at the prevailing rate of exchange on the respective date of these transactions. The Fund does not isolate that portion of the results of operations resulting from changes in foreign exchange rates on investments from fluctuation arising from changes in market prices of securities held. These fluctuations are included with the unrealized gain or loss from investments. Reported net realized foreign exchange gains or losses arise from sales of foreign currencies, currency gains or losses realized between the trade and settlement dates on securities transactions, and the difference between the amounts of dividends, interest, and foreign withholding taxes recorded on the Fund’s books and the U.S. dollar equivalent of the amounts actually received or paid. Net unrealized foreign exchange gains and losses arise from changes in the fair values of assets and liabilities, other than investments in securities at period end, resulting from changes in exchange rates.
Federal Income Taxes – The Fund makes no provision for federal income or excise tax. The Fund has qualified and intends to qualify each year as a regulated investment company (“RIC”) under subchapter M of the Internal Revenue Code of 1986, as amended, by complying with the requirements applicable to RICs and by distributing substantially all of its taxable income. The Fund also intends to distribute sufficient net investment income and net realized capital gains, if any, so that it will not be subject to excise tax on undistributed income and gains. If the required amount of net investment income or gains is not distributed, the Fund could incur a tax expense.
As of and during the six months ended April 30, 2023, the Fund did not have any liabilities for any unrecognized tax benefits. The Fund recognizes interest and penalties, if any, related to unrecognized tax benefits as income tax expense on the Statement of Operations when incurred. During the six months ended April 30, 2023, the Fund did not incur any interest or penalties. Management of the Fund has reviewed tax positions taken in tax years that remain subject to examination by all major tax jurisdictions, including federal (i.e., the last three tax year ends and the interim tax period since then, as applicable). Management
| Kovitz Core Equity ETF |
| Notes to the Financial Statements (continued) |
| April 30, 2023 (Unaudited) |
believes that there is no tax liability resulting from unrecognized tax benefits related to uncertain tax positions taken.
Expenses – Expenses incurred by the Trust that do not relate to a specific fund of the Trust are allocated to the individual funds based on each fund’s relative net assets or another appropriate basis (as determined by the Board). The Adviser has agreed to pay all regular and recurring expenses of the Fund under terms of the management agreement.
Security Transactions and Related Income – The Fund follows industry practice and records security transactions on the trade date for financial reporting purposes. The specific identification method is used for determining gains or losses for financial statement and income tax purposes. Dividend income is recorded on the ex-dividend date and interest income is recorded on an accrual basis. Non-cash income, if any, is recorded at the fair market value of the securities received. Withholding taxes on foreign dividends, if any, have been provided for in accordance with the Fund’s understanding of the applicable country’s tax rules and rates.
Dividends and Distributions – The Fund intends to distribute its net investment income and net realized long-term and short-term capital gains, if any, at least annually. Dividends and distributions to shareholders, which are determined in accordance with income tax regulations, are recorded on the ex-dividend date. The treatment for financial reporting purposes of distributions made to shareholders during the period from net investment income or net realized capital gains may differ from their ultimate treatment for federal income tax purposes. These differences are caused primarily by differences in the timing of the recognition of certain components of income, expense or realized capital gain for federal income tax purposes. Where such differences are permanent in nature, they are reclassified among the components of net assets based on their ultimate characterization for federal income tax purposes. Any such reclassifications will have no effect on net assets, results of operations or net asset value (“NAV”) per share of the Fund.
Share Valuation – The NAV is calculated each day the New York Stock Exchange (the “NYSE”) is open by dividing the total value of the Fund’s assets, less liabilities, by the number of shares outstanding for the Fund.
NOTE 3. SECURITIES VALUATION AND FAIR VALUE MEASUREMENTS
The Fund values its portfolio securities at fair value as of the close of regular trading on the NYSE (normally 4:00 p.m. Eastern Time) on each business day the NYSE is open for business. Fair value is defined as the price that the Fund would receive upon selling an investment in a timely transaction to an independent buyer in the principal or most advantageous market of the investment. GAAP establishes a three-tier hierarchy to
| Kovitz Core Equity ETF |
| Notes to the Financial Statements (continued) |
| April 30, 2023 (Unaudited) |
maximize the use of observable market data and minimize the use of unobservable inputs and to establish classification of fair value measurements for disclosure purposes.
Inputs refer broadly to the assumptions that market participants would use in pricing the asset or liability, including assumptions about risk (the risk inherent in a particular valuation technique used to measure fair value including a pricing model and/or the risk inherent in the inputs to the valuation technique). Inputs may be observable or unobservable. Observable inputs are inputs that reflect the assumptions market participants would use in pricing the asset or liability developed based on market data obtained and available from sources independent of the reporting entity. Unobservable inputs are inputs that reflect the reporting entity’s own assumptions about the assumptions market participants would use in pricing the asset or liability developed based on the best information available in the circumstances.
Various inputs are used in determining the value of the Fund’s investments. These inputs are summarized in the three broad levels listed below.
| ● | Level 1 – unadjusted quoted prices in active markets for identical investments and/or registered investment companies where the value per share is determined and published and is the basis for current transactions for identical assets or liabilities at the valuation date |
| ● | Level 2 – other significant observable inputs (including, but not limited to, quoted prices for an identical security in an inactive market, quoted prices for similar securities, interest rates, prepayment speeds, credit risk, etc.) |
| ● | Level 3 – significant unobservable inputs (including the Fund’s own assumptions in determining fair value of investments based on the best information available) |
The inputs used to measure fair value may fall into different levels of the fair value hierarchy. In such cases, for disclosure purposes, the level in the fair value hierarchy which is reported is determined based on the lowest level input that is significant to the fair value measurement in its entirety.
Equity securities that are traded on any stock exchange are generally valued at the last quoted sale price on the security’s primary exchange. Lacking a last sale price, an exchange-traded security is generally valued at its last bid price. Securities traded in the Nasdaq over-the-counter market are generally valued at the Nasdaq Official Closing Price. When using the market quotations and when the market is considered active, the security is classified as a Level 1 security. In the event that market quotations are not readily available or are considered unreliable due to market or other events, securities are valued in good faith by the Adviser as “Valuation Designee” under the oversight of the Board. The
| Kovitz Core Equity ETF |
| Notes to the Financial Statements (continued) |
| April 30, 2023 (Unaudited) |
Adviser has adopted written policies and procedures for valuing securities and other assets in circumstances where market quotes are not readily available. In the event that market quotes are not readily available, and the security or asset cannot be valued pursuant to one of the valuation methods, the value of the security or asset will be determined in good faith by the Adviser pursuant to its policies and procedures. On a quarterly basis, the Adviser’s fair valuation determinations will be reviewed by the Board. Under these policies, the securities will be classified as Level 2 or 3 within the fair value hierarchy, depending on the inputs used.
Investments in mutual funds, including money market mutual funds, are generally priced at the ending NAV. These securities are categorized as Level 1 securities.
The following is a summary of the inputs used to value the Fund’s investments as of April 30, 2023:
| | | | | | Valuation Inputs | | | | | | | |
| Assets | | Level 1 | | | Level 2 | | | Level 3 | | | Total | |
| Common Stocks (a) | | $ | 815,163,811 | | | $ | — | | | $ | — | | | $ | 815,163,811 | |
| Total | | $ | 815,163,811 | | | $ | — | | | $ | — | | | $ | 815,163,811 | |
| (a) | Refer to Schedule of Investments for sector classifications. |
The Fund did not hold any investments at the end of the reporting period for which significant unobservable inputs (Level 3) were used in determining fair value; therefore, no reconciliation of Level 3 securities is included for this reporting period.
NOTE 4. ADVISER FEES AND OTHER TRANSACTIONS
Under the terms of the management agreement, on behalf of the Fund, the Adviser is responsible for substantially all expenses of the Fund, including the cost of transfer agency, custody, fund administration, compensation paid to the Independent Board Members, legal, audit and other services, except for the fee payments to the Adviser under the Investment Advisory Agreement (also known as a “unitary advisory fee”), interest expense, acquired fund fees and expenses, taxes, brokerage expenses, distribution fees or expenses (if any), litigation expenses and other extraordinary expenses. The Fund pays the Adviser a unitary advisory fee at an annual rate equal to 0.99% of the Fund’s average daily net assets. Prior to the close of business on December 9, 2022 the Fund paid the Adviser a management fee, computed and accrued daily and paid monthly, at an annual rate of 1.00% of the Fund’s average daily net assets. For the six months ended April 30, 2023, the Adviser earned a fee of $2,875,544 from the Fund. At April 30, 2023, the Fund owed the Adviser $663,526.
The Adviser and the Predecessor Fund entered into an expense limitation agreement in which the Adviser agreed to waive its fees and/or reimburse other expenses so that
| Kovitz Core Equity ETF |
| Notes to the Financial Statements (continued) |
| April 30, 2023 (Unaudited) |
Total Annual Fund Operating Expenses did not exceed 1.10%. This operating expense limitation did not apply to interest, taxes, brokerage commissions, other expenditures which are capitalized in accordance with GAAP, other extraordinary expenses not incurred in the ordinary course of the Predecessor Fund’s business, dividend expense on short sales, expenses incurred under a Rule 12b-1 plan of distribution, “acquired fund fees and expenses,” and expenses that the Predecessor Fund had incurred but did not actually pay because of an expense offset arrangement.
For the six months ended April 30, 2023, the Adviser waived fees and/or reimbursed expenses of the Predecessor Fund of $35,053.
Ultimus Fund Solutions, LLC (the “Ultimus”) provides administration and fund accounting to the Funds. The Fund pays Ultimus fees in accordance with the agreement for such services.
Northern Lights Compliance Services, LLC (“NLCS”), an affiliate of Ultimus, provides a Chief Compliance Officer and an Anti-Money Laundering Compliance Officer to the Trust, as well as related compliance services, pursuant to a consulting agreement between NLCS and the Trust. Under the terms of such agreement, NLCS receives fees from the Fund.
The officers and one trustee of the Trust are members of management and/or employees of the Administrator or of NLCS, and are not paid by the Trust for services to the Fund. Northern Lights Distributors, LLC (the “Distributor”) acts as the distributor of the Fund’s shares. The Distributor is an affiliate of Ultimus. The Distributor is compensated by the Adviser (not the Fund) for acting as principal underwriter.
NOTE 5. PURCHASES AND SALES OF SECURITIES
For the period ended April 30, 2023, purchases and sales of investment securities, other than short-term investments, were $67,082,459 and $72,550,943, respectively.
For the period ended April 30, 2023, purchases and sales for in-kind transactions were $718,545,103 and $91,778,629, respectively.
For the period ended April 30, 2023, the Fund had in-kind net realized gains of $45,367,656.
NOTE 6. CAPITAL SHARE TRANSACTIONS
Shares are not individually redeemable and may be redeemed by the Fund at NAV only in large blocks known as “Creation Units”. Only Authorized Participants or transactions done through an Authorized Participant are permitted to purchase or redeem Creation Units from the Fund. An Authorized Participant is either (i) a broker-dealer or other
| Kovitz Core Equity ETF |
| Notes to the Financial Statements (continued) |
| April 30, 2023 (Unaudited) |
participant in the clearing process through the Continuous Net Settlement System of the National Securities Clearing Corporation or (ii) a Depository Trust Company participant and, in each case, must have executed a Participant Agreement with the Distributor. Such transactions are generally permitted on an in-kind basis, with a balancing cash component to equate the transaction to the NAV per share of the Fund on the transaction date. Cash may be substituted equivalent to the value of certain securities generally when they are not available in sufficient quantity for delivery, not eligible for trading by the Authorized Participant or as a result of other market circumstances. In addition, the Fund may impose transaction fees on purchases and redemptions of Fund shares to cover the custodial and other costs incurred by the Fund in effecting trades. A fixed fee payable to the Custodian may be imposed on each creation and redemption transaction regardless of the number of Creation Units involved in the transaction (“Fixed Fee”). Purchases and redemptions of Creation Units for cash or involving cash-in-lieu are required to pay an additional variable charge to compensate the Fund and its ongoing shareholders for brokerage and market impact expenses relating to Creation Unit transactions (“Variable Charge”, and together with the Fixed Fee, the “Transaction Fees”). Transactions in capital shares for the Fund are disclosed in the Statement of Changes in Net Assets. For the period ended April 30, 2023, the Fund received $15,900 and $0 in fixed fees and variable fees, respectively. The Transaction Fees for the Fund are listed in the table below:
| Fixed Fee | | | Variable Charge |
| $ | 300 | | | 2.00%* |
| * | The maximum Transaction Fee may be up to 2.00% of the amount invested. |
NOTE 7. FEDERAL TAX INFORMATION
At April 30, 2023, the net unrealized appreciation (depreciation) and tax cost of investments for tax purposes was as follows:
| Gross unrealized appreciation | | $ | 166,635,908 | |
| Gross unrealized depreciation | | | (23,147,810 | ) |
| Net unrealized appreciation on investments | | $ | 143,488,098 | |
| Tax cost of investments | | $ | 671,675,713 | |
At April 30, 2023, the difference between book basis and tax basis unrealized appreciation (depreciation) is attributable to the tax deferral of losses on organizational expense amortization and ROC basis adjustments.
| Kovitz Core Equity ETF |
| Notes to the Financial Statements (continued) |
| April 30, 2023 (Unaudited) |
The tax character of distributions paid for the fiscal year ended October 31, 2022, the Fund’s most recent fiscal year end, was as follows:
| Distributions paid from: | | | | |
| Ordinary income(a) | | | $355, 616 | |
| Long-term capital gains | | | 15,347,708 | |
| Total distributions paid | | $ | 15,703,324 | |
| (a) | Short-term capital gain distributions are treated as ordinary income for tax purposes. |
At October 31, 2022, the Fund’s most recent fiscal year end, the components of accumulated earnings (deficit) on a tax basis were as follows:
| Undistributed Long-Term Capital Gains | | $ | 7,544,498 | |
| Accumulated Capital and Other Losses | | | (132,757 | ) |
| Unrealized Appreciation on Investments | | | 16,394,301 | |
| Total Accumulated Earnings | | $ | 23,806,042 | |
Capital losses and specified gains realized after October 31, and net investment losses realized after December 31 of a Fund’s fiscal year may be deferred and treated as occurring on the first business day of the flowing fiscal year for tax purposes. For the year ended October 31, 2022, the Fund deferred $131,729 of late year ordinary losses.
NOTE 8. COMMITMENTS AND CONTINGENCIES
The Trust indemnifies its officers and Trustees for certain liabilities that may arise from their performance of their duties to the Trust or the Fund. Additionally, in the normal course of business, the Trust enters into contracts that contain a variety of representations and warranties which provide general indemnifications. The Trust’s maximum exposure under these arrangements is unknown, as this would involve future claims that may be made against the Trust that have not yet occurred.
NOTE 9. SUBSEQUENT EVENTS
Management of the Fund has evaluated the need for disclosures and/or adjustments resulting from subsequent events through the date at which these financial statements were issued. Based upon this evaluation, management has determined there were no items requiring adjustment of the financial statements or additional disclosure.
| Summary of Fund Expenses (Unaudited) |
As a shareholder of the Fund, you incur two types of costs: (1) transaction and (2) ongoing costs, including management fees and other Fund expenses. These examples are intended to help you understand your ongoing costs (in dollars) of investing in the Fund and to compare these costs with the ongoing costs of investing in other funds. You may pay brokerage commissions on purchases and sales of exchange-traded fund shares, which are not reflected in the example. The example is based on an investment of $1,000 invested at the beginning of the period and held for the entire period from November 1, 2022 through April 30, 2023.
Actual Expenses
The first line of the table below provides information about actual account values and actual expenses. You may use the information in this line, together with the amount you invested, to estimate the expenses that you paid over the period. Simply divide your account value by $1,000 (for example, an $8,600 account value divided by $1,000 = 8.6), then multiply the result by the number in the first line under the heading “Expenses Paid During Period” to estimate the expenses you paid on your account during this period.
Hypothetical Example for Comparison Purposes
The second line of the table below provides information about hypothetical account values and hypothetical expenses based on the Fund’s actual expense ratio and an assumed rate of return of 5% per year before expenses, which is not the Fund’s actual return. The hypothetical account values and expenses may not be used to estimate the actual ending account balance or expenses you paid for the period. You may use this information to compare the ongoing costs of investing in the Fund and other funds. To do so, compare this 5% hypothetical example with the 5% hypothetical examples that appear in the shareholder reports of other funds.
Expenses shown in the table are meant to highlight your ongoing costs only and do not reflect any transactional costs. Therefore, the second line of the table below is useful in comparing ongoing costs only and will not help you determine the relative total costs of owning different funds. In addition, if transaction costs were included, your costs would have been higher.
| | | | | Beginning | | | Ending | | | | | | |
| | | | | Account | | | Account | | | Expenses | | | |
| | | | | Value | | | Value | | | Paid | | | Annualized |
| | | | | November 1, | | | April 30, | | | During | | | Expense |
| | | | | 2022 | | | 2023 | | | Period(a) | | | Ratio |
| Kovitz Core Equity ETF | | | | | | | | | | | | | | |
| | | Actual | | $ | 1,000.00 | | | $ | 1,096.60 | | | $ | 5.15 | | | 0.99% |
| | | Hypothetical(b) | | $ | 1,000.00 | | | $ | 1,019.88 | | | $ | 4.96 | | | 0.99% |
| (a) | Expenses are equal to the Fund’s annualized expense ratios, multiplied by the average account value over the period, multiplied by 181/365 (to reflect the one-half year period). |
| (b) | Hypothetical assumes 5% annual return before expenses. |
| Investment Advisory Agreement Approval (Unaudited) |
At a meeting held on June 1-2, 2022, the Board of Trustees (the “Board”) considered the approval of the Investment Advisory Agreement (the “Kovitz ETF Agreement”) between Valued Advisers Trust (the “Trust”) and Kovitz Investment Group Partners, LLC (“Kovitz”) with respect to the Kovitz Core Equity ETF (the “Kovitz ETF”). Kovitz provided written information to the Board to assist the Board in its considerations.
The Board discussed the proposed contractual arrangements between Kovitz and the Trust with respect to the Kovitz ETF. Trust counsel reminded the Trustees of their fiduciary duties and responsibilities, including the factors to be considered, and the application of those factors to Kovitz. The Trustees considered the information provided for their review in advance of the meeting, which included, among other things, a letter from counsel to Kovitz, Kovitz’s response to that letter, financial information relating to Kovitz, and Kovitz’s Form ADV. The Board did not identify any particular information that was most relevant to its consideration to approve the Kovitz ETF Agreement and each Trustee may have afforded different weight to the various factors.
1. The nature, extent, and quality of the services to be provided by Kovitz. In this regard, the Board considered responsibilities that Kovitz would have under the Kovitz ETF Agreement. The Trustees considered the services proposed to be provided by Kovitz to the Kovitz ETF including without limitation: Kovitz’s procedures for formulating investment recommendations and assuring compliance with the Kovitz ETF’s investment objectives and limitations; the efforts of Kovitz during the Kovitz ETF’s start-up phase, its anticipated coordination of services for the Kovitz ETF among the Kovitz ETF’s service providers, and its anticipated efforts to promote the Kovitz ETF and grow its assets. The Trustees considered Kovitz’s continuity of, and commitment to retain, qualified personnel and Kovitz’s commitment to maintain and enhance its resources and systems, and Kovitz’s cooperation with the Board and counsel for the Kovitz ETF. The Trustees acknowledged their reliance, in part, on their experience with Kovitz in its management of the Green Owl Intrinsic Value Fund (the “Green Owl Fund”), another series of the Trust with a substantially similar investment strategy. The Trustees considered Kovitz’s personnel, including the education and experience of Kovitz’s personnel and Kovitz’s compliance program, policies and procedures. After considering the foregoing information and further information previously provided by Kovitz (including Kovitz’s Form ADV), the Board concluded that, in light of all the facts and circumstances, the nature, extent, and quality of the services proposed to be provided by Kovitz will be satisfactory and adequate for the Kovitz ETF.
2. Investment performance of the Kovitz ETF and Kovitz. The Board noted that while the Kovitz ETF had not commenced operations and thus did not have investment performance information to review, the Board could consider the investment performance of Kovitz in managing the Green Owl Fund. The Trustees noted that the Green Owl Fund had underperformed as compared to its benchmark for the one-year, three-year, five-year and since inception periods ended March 31, 2022. The Trustees reflected upon their discussion with personnel of Kovitz at recent meetings of the Board, discussed such persons’ background and qualifications, and the anticipated implementation of the Kovitz ETF’s investment strategies. The Board concluded, in light of the foregoing factors, that the investment performance of Kovitz was satisfactory.
3. The costs of the services to be provided and profits to be realized by Kovitz from the relationship with the Kovitz ETF. In this regard, the Board considered: the financial condition of Kovitz and the level of commitment to the Kovitz ETF and Kovitz by the principals of Kovitz; the
| Investment Advisory Agreement Approval (Unaudited)(continued) |
projected assets levels of the Kovitz ETF; Kovitz’s payment of startup and reorganization costs for the Kovitz ETF; and the overall anticipated expenses of the Kovitz ETF, including the expected nature and frequency of advisory fee payments. The Board considered the proposed management fee and noted that it is lower than the current advisory fee in place with respect to the Green Owl Fund. The Board also acknowledged the proposed “unitary fee” structure, by which Kovitz would pay the majority of the Kovitz ETF’s expenses. Upon further consideration and discussion of the foregoing, the Board concluded that the fees to be paid to Kovitz by the Kovitz ETF were fair and reasonable in light of the services to be provided.
4. The extent to which economies of scale would be realized as the Kovitz ETF grows and whether advisory fee levels reflect these economies of scale for the benefit of the Kovitz ETF’s investors. In this regard, the Board considered that while the management fee remained the same at all asset levels, the Kovitz ETF’s shareholders would benefit from economies of scale under the Trust’s agreements with service providers other than Kovitz. Following further discussion of the Kovitz ETF’s projected asset levels, expectations for growth, and levels of fees, the Board determined that the Kovitz ETF’s proposed fee arrangements with Kovitz were fair and reasonable in relation to the nature and qualify of the services to be provided by Kovitz.
5. Possible conflicts of interest and benefits to Kovitz. In evaluating the possibility for conflicts of interest, the Board considered such matters as: the experience and ability of the advisory personnel assigned to the Kovitz ETF, the basis of decisions to buy or sell securities for the Kovitz ETF and/or Kovitz’s other accounts, and the substance and administration of Kovitz’s code of ethics. The Trustees noted that Kovitz does not utilize soft dollars. With respect to benefits to Kovitz (in addition to fees under the Kovitz ETF Agreement), the Board noted that Kovitz would benefit from its relationship with the Kovitz ETF as the Kovitz ETF would provide certain cost efficiencies due to its structure as an ETF, and due to the anticipated merger of the Green Owl Fund and another fund managed by Kovitz into the Kovitz ETF. Following further consideration and discussion, the Board determined that Kovitz’s standards and practices relating to the identification and mitigation of potential conflicts of interest were satisfactory and the anticipated benefits to be realized by Kovitz from managing the Kovitz ETF were acceptable.
After additional consideration of the factors discussed by counsel and further discussion among the Board members, the Board determined to approve the continuation of the Kovitz Agreement.
Proxy Voting
A description of the policies and procedures that the Fund uses to determine how to vote proxies relating to portfolio securities and information regarding how the Fund voted those proxies during the most recent twelve month period ended June 30, are available (1) without charge upon request by calling the Fund at (877) 714-2327 and (2) in Fund documents filed with the SEC on the SEC’s website at www.sec.gov.
TRUSTEES
Andrea N. Mullins, Chairperson
Ira P. Cohen
Mark J. Seger | INDEPENDENT REGISTERED
PUBLIC ACCOUNTING FIRM
Cohen & Company, Ltd.
1350 Euclid Avenue, Suite 800
Cleveland, OH 44115 |
| | |
| | |
OFFICERS
Matthew J. Miller, Principal Executive Officer and
President
Zachary P. Richmond, Principal Financial Officer and
Treasurer
N. Lynn Bowley, Chief Compliance Officer
Carol J. Highsmith, Vice President and Secretary | LEGAL COUNSEL
Troutman Pepper Hamilton Sanders LLP
3000 Two Logan Square
18th and Arch Streets
Philadelphia, PA 19103 |
| | |
| | |
INVESTMENT ADVISER
Kovitz Investment Group Partners, LLC
71 S. Wacker Dr., Suite 1860
Chicago, IL 60606 | CUSTODIAN AND TRANSFER AGENT
Brown Brothers Harriman & Co.
50 Post Office Square
Boston, MA 02110 |
| | |
DISTRIBUTOR
Northern Lights Distributors, LLC
4221 North 203rd Street, Suite 100
Elkhorn, NE 68022 | ADMINISTRATOR AND FUND
ACCOUNTANT
Ultimus Fund Solutions, LLC
225 Pictoria Drive, Suite 450
Cincinnati, OH 45246 |
| | |
This report is intended only for the information of shareholders or those who have received the Fund’s prospectus which contains information about the Fund’s management fee and expenses. Please read the prospectus carefully before investing.
Distributed by Northern Lights Distributors, LLC Member FINRA/SIPC
Kovitz-SAR-23

| SOUND MIND INVESTING FUND (SMIFX) |
| SMI DYNAMIC ALLOCATION FUND (SMIDX) |
| SMI MULTI-STRATEGY FUND (SMILX) |
| SEMI-ANNUAL REPORT |
| April 30, 2023 |
Funds’ Adviser:
SMI Advisory Services, LLC
4400 Ray Boll Blvd.
Columbus, IN 47203
(877) 764-3863
(877) SMI-FUND
www.smifund.com
Dear Fellow Shareholder,
The six month period covered in this report (November 2022-April 2023) was characterized by generally rising equity markets, albeit with considerable volatility. Following immediately after last year’s October bear market low, this naturally raises the question whether that low was the bear market bottom, with the six-month period that followed representing a new bull market? Or was last October merely a temporary low followed by a bear market rally, akin to the long rally in 2001 that interrupted that long bear market?
The chart of the S&P 500® Index (“S&P 500”) below shows the setup clearly. The red box illustrates the 3,600 - 4,200 trading range for the S&P 500 over the past year. The red vertical line drawn at November 1, 2022 shows the beginning of this report’s period, nearly exactly in the middle of the year-long range. To the right of that line (the period since November 1, 2022), it’s easy to see the upward trend of the market, and yet stocks have been unable to break out above 4,200 to establish highs that exceed last summer’s August peak.
The SMI Funds utilize trend-following strategies, so it’s no surprise that our portfolios were extremely defensive as the reporting period began last November, following the market’s sharp 2022 decline. While that defensive posture helped throughout last year, it caused the funds to lag the S&P 500 over the past six months as stocks have rebounded. As a result, only the SMI Dynamic Allocation Fund (“SMIDX”) outperformed the index over the last six months.
Despite generally rising stock prices during the period, the recent economic data suggests a high probability of future recession. In fact, a closer look under the stock market surface shows that an unusually high portion of the market’s 2023 gains have been driven by a relative handful of the largest stocks. As a result, looking at an equally-weighted version of the S&P 500, or the Russell 2000® Index (“Russell 2000”) of smaller companies, provides a less impressive picture.
Still, the SMI strategies are purposely tailored to respond to changing market trends. This isn’t a bug, it’s a feature — there’s always a story to tell in markets, on both sides of the action. Will the recession narrative ultimately prove correct and take the market lower again, or will the “AI” (artificial intelligence) hype continue to power the largest stocks higher, dragging the broader indexes with them? The managers believe the former is more likely, but we’ll continue to adjust our portfolios as the market action dictates. This process of adjusting risk levels is incremental — just as we reduced risk as the market broke down in 2022, we’ve begun slowly adding it back as the market has climbed back in 2023.
We continue to believe that risk management is paramount. It also helps that our cash positions are earning a solid return for the first time in a dozen or more years!
Performance Review
SMI’s Stock Upgrading strategy (the sole strategy used in the Sound Mind Investing Fund (“SMIFX”) and 40% of the SMI Multi-Strategy Fund (“SMILX”)) gained +2.31% between November 1, 2022 and April 30, 2023. That lagged the S&P 500’s gain of +8.63% and the Wilshire 5000 Index’s gain of +7.26%. However, illustrating how the gains of a relatively small group of the largest stocks drove the bulk of the index’s returns during the period, the S&P 500® Equal Weight Index gained just +5.01%, while the Russell 2000 small company index was down -3.45%.
The biggest factor by far in Stock Upgrading’s performance was the roughly 70% cash allocation this strategy maintained throughout the period. As a reminder, Stock Upgrading only holds cash during periods that the managers believe are extremely high risk, based on our quantitative model. It’s not surprising that the portfolio would be positioned “max defensive” given that the period began just a matter of weeks after the bear market’s October low.
It’s worth noting that after riding commodities to significant gains in 2021 and the first half of 2022, Stock Upgrading’s commodity trend system had us exit commodities completely at the end of July 2022. This decision helped the funds avoid the -6.84% decline this holding would have experienced during the six months covered in this report.
SMI’s Dynamic Asset Allocation (“DAA”) strategy (the sole strategy used in SMIDX and 50% of SMILX) ended the 6-month period with a gain of +9.92%. That was better than the returns of the broad market indexes.
DAA’s performance was worse than we expected during the first half of last year when the market was falling, and was better than we would have expected over the past six months while it was rebounding. So there’s definitely a bit of averaging out in play in the returns of both periods. But DAA’s strong performance
over the past six months wasn’t a complete surprise. It was the first of SMI’s strategies to react to the stronger trend in international stocks, shifting one-third of the portfolio into foreign equities at the beginning of December 2022. That felt very early to make such a significant move, but it paid off. DAA followed that by shifting another third of the portfolio back into U.S. stocks at the end of March 2023. So, in addition to the hefty gold position DAA maintained throughout the six-month reporting period (which gained +21.82%), DAA had more stock exposure than Stock Upgrading.
It’s unusual for DAA to be more exposed to risk assets than Stock Upgrading, but that’s where things stood at the end of April 2023 as a result of Stock Upgrading’s seldom-used defensive protocols being fully triggered.
SMI’s Multi-Strategy portfolio (used in SMILX) consists of 50% DAA, 40% Stock Upgrading, and 10% in a strategy called Sector Rotation (“SR”). From November 1, 2022 through April 30, 2023, the SMI Multi-Strategy Fund gained +4.93%. It’s no surprise that this largely splits the difference between the DAA and Stock Upgrading returns, as they collectively make up 90% of the holdings. But as the last paragraph pointed out, it’s another nod to the diversification benefit of utilizing all three strategies, as sometimes the performance of each can surprise us over the short-term.
Having already covered Stock Upgrading and DAA, the final component to discuss is the 10% Sector Rotation allocation. Sector Rotation was a star performer during the first leg of last year’s bear market, gaining +24.74% through the first 10 months of 2022. Unfortunately, SR would give a significant portion of those gains back over the following six months (the period covered here), as the energy stocks that led to 2022’s success turned south on recession fears. From November 2022 – April 2023, SR lost -15.12%.
It’s always unpleasant to give back gains like this, but if it had to happen, SR’s recent path at least provided a diversification benefit. SR rose last year while nearly everything else (stocks, bonds, etc.) was falling, then fell as most other assets recovered. The net effect was to smooth the overall ride somewhat for SMILX owners, while still providing a positive net gain.
Conclusion
It’s been two decades since investors have experienced a “normal” business cycle recession and bear market. Both 2020 and 2008 were crisis events — COVID and the Global Financial Crisis. Those crisis bear markets tend to be faster and sharper than normal. Given the last “normal” recessionary bear market took place over 20 years ago, there are many investors who have either never experienced one or have largely forgotten how slow a process it can be.
When we go back and look at the last non-crisis bear, we find that it began in March 2000 and, while the official low came in October 2002, there was a retest of that low that barely held in March 2003. So it’s fair to say that it felt like a three year bear market. However, it wasn’t obvious at the time that it was a bear market all the way through. Much of 2001 was spent with markets either rising or at least neutral, and the economy didn’t seem too bad for much of that year either.
The parallels to today are clear. After a rough 2022, markets have stabilized and the jury is out regarding how quickly a recession will arrive, and how severe it will be if/when it does. Our belief is that the most aggressive monetary policy easing in history from 2009-2021 produced extreme valuations across most asset classes. That was followed by the most aggressive tightening of monetary policy in at least 40 years, beginning roughly a year ago.
Not surprisingly then, we think the odds that this bear market will be less severe than the average historical recessionary bear market are slim. If last October’s low was the end of this bear market, it would be milder than most past recessionary bears. We can’t rule out that possibility, but it helps explain why we’ve been slow to reduce our defensive positioning.
Ultimately though, the SMI strategies are designed in such a way to gradually force us to follow the market’s action. So we’re not particularly worried about missing out on the market’s upside if this is a new bull market. If that’s the case, our equity positioning will gradually expand, and the SMI strategies have historically been strong performers in the early stages of new bull markets. As such, we can afford to be patient and add back slowly, making sure the market has truly changed course before re-committing fully to stocks again.
Of course, no one knows for certain (at the time) when a bear market begins or ends. That’s why the strategies SMI Advisory has developed through years of analysis and practice adjust our risk exposure incrementally based on signals the market provides. We’ve seen some of these incremental moves in recent months. More will follow depending on which way the market breaks from here.
We appreciate the opportunity to serve you!
Blessings,

Mark Biller
Senior Portfolio Manager
The Sound Mind Investing Funds
The SMI Fund lineup, shown below, now offers investors a way to mix and match professionally managed funds to custom tailor the risk level desired for their portfolio. If you’d like assistance customizing your portfolio in this manner, please call a Stewardship Advisor at (800) 796-4975.
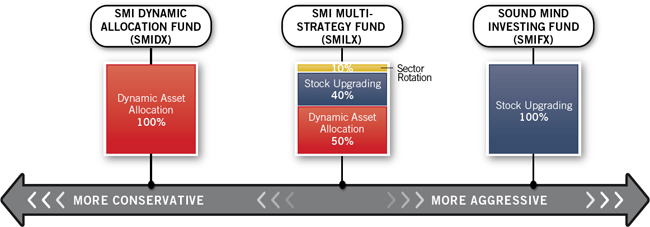
| PERFORMANCE RESULTS – (Unaudited) |
Average Annual Total Returns(a) (For the periods ended April 30, 2023) |
| | | | | | | | | | | | |
| | | Three | | | | | | | | | |
| | | Months | | Six Months | | One Year | | Five Year | | Ten Year | |
| Sound Mind Investing Fund | | -0.47% | | 2.31% | | -1.83% | | 5.78% | | 7.69% | |
| S&P 500® Index(b) | | 2.72% | | 8.63% | | 2.66% | | 11.45% | | 12.20% | |
| SMI Custom Index(c) | | -1.87% | | 6.38% | | 1.14% | | 6.84% | | 8.96% | |
| Wilshire 5000® Total Market Index (b)(d) | | 1.38% | | 7.26% | | 1.48% | | 10.83% | | 11.84% | |
| | | | | | | | | | | | |
| Total annual operating expenses, as disclosed in the Sound Mind Investing Fund’s (“SMI Fund”) prospectus dated February 28, 2023, were 1.61% of average daily net assets, which includes acquired fund fees and expenses. All expenses are reflected in performance results. SMI Advisory Services, LLC (the “Adviser”) contractually has agreed to waive its fee and/or reimburse certain operating expenses, but only to the extent necessary so that total annual operating expenses (excluding interest, taxes, brokerage commissions, other expenses which are capitalized in accordance with generally accepted accounting principles, extraordinary expenses, dividend expense on short sales, 12b-1 fees, and acquired fund fees and expenses) do not exceed 1.45% of the SMI Fund’s average daily net assets through February 29, 2024. Prior to March 1, 2023, the expense cap for SMI Fund was 1.50%. Each waiver or reimbursement of an expense by the Adviser is subject to repayment by the SMI Fund within the three years following the date of such waiver or reimbursement, provided that the SMI Fund is able to make the repayment without exceeding the expense limitation in place at the time of the fee waiver or reimbursement and the expense limitation at the time of the repayment. This expense cap may not be terminated prior to this date except by the Board of Trustees (the “Board”). |
Average Annual Total Returns(a) (For the periods ended April 30, 2023) |
| | | | | | | | | | | | |
| | | Three | | | | | | | | | |
| | | Months | | Six Months | | One Year | | Five Year | | Ten Year | |
| SMI Dynamic Allocation Fund | | 2.52% | | 9.92% | | -4.36% | | 2.58% | | 2.79% | |
| S&P 500® Index(b) | | 2.72% | | 8.63% | | 2.66% | | 11.45% | | 12.20% | |
| Bloomberg U.S. Aggregate Bond Index(b) | | 0.49% | | 6.91% | | -0.43% | | 1.18% | | 1.32% | |
| Weighted Index (c) | | 1.83% | | 8.00% | | 1.72% | | 7.61% | | 7.99% | |
| Wilshire 5000® Total Market Index (b)(d) | | 1.38% | | 7.26% | | 1.48% | | 10.83% | | 11.84% | |
| | | | | | | | | | | | |
| Total annual operating expenses, as disclosed in the SMI Dynamic Allocation Fund’s prospectus dated February 28, 2023, were 1.48% of average daily net assets, which includes acquired fund fees and expenses. All expenses are reflected in performance results. The Adviser contractually has agreed to waive its fee and/or reimburse certain operating expenses, but only to the extent necessary so that total annual operating expenses (excluding interest, taxes, brokerage commissions, other expenses which are capitalized in accordance with generally accepted accounting principles, extraordinary expenses, dividend expense on short sales, 12b-1 fees, and acquired fund fees and expenses) do not exceed 1.45% of the SMI Dynamic Allocation Fund’s average daily net assets through February 29, 2024. Each waiver or reimbursement of an expense by the Adviser is subject to repayment by the SMI Dynamic Allocation Fund within the three years following the date of such waiver or reimbursement, provided that the SMI Dynamic Allocation Fund is able to make the repayment without exceeding the expense limitation in place at the time of the fee waiver or reimbursement and the expense limitation at the time of the repayment. This expense cap may not be terminated prior to this date except by the Board. |
| PERFORMANCE RESULTS – (Unaudited), (Continued) |
Average Annual Total Returns(a) (For the periods ended April 30, 2023) |
| | | | | | | | | | | | |
| | | Three | | | | | | | | Since Inception | |
| | | Months | | Six Months | | One Year | | Five Year | | (April 29, 2015) | |
| SMI Multi-Strategy Fund | | -0.21% | | 4.93% | | -2.24% | | 4.03% | | 4.02% | |
| S&P 500® Index(b) | | 2.72% | | 8.63% | | 2.66% | | 11.45% | | 10.97% | |
| Bloomberg U.S. Aggregate Bond Index(b) | | 0.49% | | 6.91% | | -0.43% | | 1.18% | | 1.13% | |
| Weighted Index (c) | | 1.83% | | 8.00% | | 1.72% | | 7.61% | | 7.22% | |
| Wilshire 5000® Total Market Index (b)(d) | | 1.38% | | 7.26% | | 1.48% | | 10.83% | | 10.54% | |
| | | | | | | | | | | | |
| Total annual operating expenses, as disclosed in the SMI Multi-Strategy Fund’s prospectus dated February 28, 2023 were 1.52% of average daily net assets, which includes acquired fund fees and expenses. All expenses are reflected in performance results. The Adviser contractually has agreed to waive its fee and/or reimburse certain operating expenses, but only to the extent necessary so that total annual operating expenses (excluding interest, taxes, brokerage commissions, other expenses which are capitalized in accordance with generally accepted accounting principles, extraordinary expenses, dividend expense on short sales, 12b-1 fees, and acquired fund fees and expenses) do not exceed 1.30% of the SMI Multi-Strategy Fund’s average daily net assets through February 29, 2024. Prior to March 1, 2023, the expense cap for SMI Multi-Strategy Fund was 1.15%. Each waiver or reimbursement of an expense by the Adviser is subject to repayment by the SMI Multi-Strategy Fund within the three years following the date of such waiver or reimbursement, provided that the SMI Multi-Strategy Fund is able to make the repayment without exceeding the expense limitation in place at the time of the fee waiver or reimbursement and the expense limitation at the time of the repayment. This expense cap may not be terminated prior to this date except by the Board. |
The performance quoted represents past performance, which does not guarantee future results. The investment return and principal value of an investment will fluctuate so that an investor’s shares, when redeemed, may be worth more or less than their original cost. The returns shown do not reflect deduction of taxes that a shareholder would pay on Fund distributions or the redemption of Fund shares. Current performance of the Sound Mind Investing Fund, SMI Dynamic Allocation Fund, and SMI Multi-Strategy Fund (each a “Fund” and collectively the “Funds”) may be lower or higher than the performance quoted. Performance data current to the most recent month end may be obtained by calling (877) 764-3863.
| (a) | Average annual total returns reflect any change in price per share and assume the reinvestment of all distributions. The Funds’ returns reflect any fee reductions during the applicable periods. If such fee reductions had not occurred, the quoted performance would have been lower. Total returns for periods less than one year are not annualized. |
| (b) | The S&P 500® Index (“S&P 500”), Wilshire 5000® Total Market Index (“Wilshire 5000”), Bloomberg U.S. Aggregate Bond Index, Russell 1000® Value Index, Russell 1000® Growth Index, Russell 2000® Value Index, Russell 2000® Growth Index and MSCI EAFE Index (collectively, the “Indices”) are unmanaged indices that assume reinvestment of all distributions and exclude the effect of taxes and fees. These Indices are widely recognized unmanaged indices and are representative of a broader market and range of securities than is found in each Fund’s portfolio. The returns of the Indices are not reduced by any fees or operating expenses. Individuals cannot invest directly in the Indices; however, an individual can invest in exchange-traded funds or other investment vehicles that attempt to track the performance of a benchmark index. |
| (c) | The SMI Custom Index for the Sound Mind Investing Fund is comprised of 20% Russell 1000® Value Index, 20% Russell 1000® Growth Index, 20% Russell 2000® Value Index, 20% Russell 2000® Growth Index and 20% MSCI EAFE Index and the Weighted Index for the SMI Dynamic Allocation Fund and the SMI Multi-Strategy Fund is comprised of 60% S&P 500 and 40% Bloomberg U.S. Aggregate Bond Index. |
| (d) | Prior to February 6, 2023, the Funds’ benchmark was the Wilshire 5000. Effective February 6, 2023, the Funds’ benchmark changed to the S&P 500. Access to Wilshire 5000 data has become cost-prohibitive for the Funds. The composition of the two indexes is substantially similar, and in the opinion of the Adviser, the S&P 500 provides an appropriate broad-based market comparison for the Funds. |
The Funds’ investment objectives, risks, charges and expenses must be considered carefully before investing. The prospectus contains this and other important information about the Funds and may be obtained by calling the same number as above. Please read it carefully before investing.
| FUND HOLDINGS – (Unaudited) |
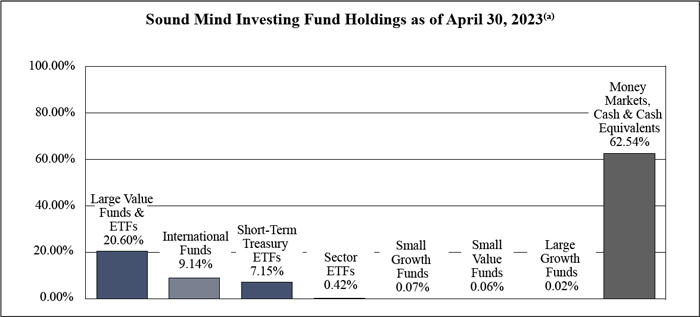
| (a) | As a percentage of net assets. |
Sound Mind Investing Fund seeks long-term capital appreciation. The Fund seeks to achieve its objective by investing in a diversified portfolio of other investment companies using a “Stock Upgrading” strategy. The Stock Upgrading investment strategy is a systematic investment approach that is based on the belief of the Adviser that superior returns can be obtained by constantly monitoring the performance of a wide universe of other investment companies and standing ready to move assets into the funds deemed by the Adviser to be most attractive at the time of analysis. This upgrading process strives to keep assets invested in funds that are demonstrating superior current performance relative to their peers as determined by a combination of size and investment style criteria.
| FUND HOLDINGS – (Unaudited), (Continued) |
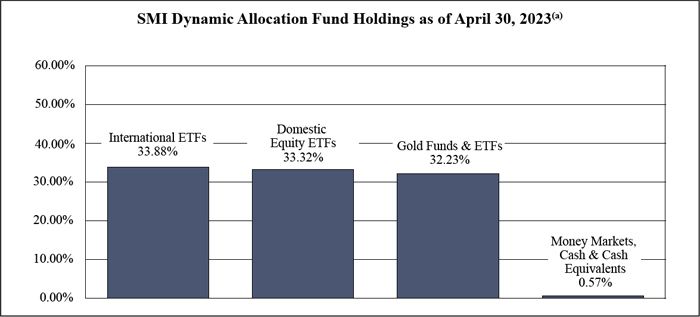
| (a) | As a percentage of net assets. |
SMI Dynamic Allocation Fund seeks total return. Total return is composed of both income and capital appreciation. The Fund uses a “Dynamic Asset Allocation” investment strategy to achieve its investment objective. This is done by investing in open-end mutual funds and exchange-traded funds (“ETFs”) that invest in securities from the following six asset classes – U.S. Equities, International Equities, Fixed Income Securities, Real Estate, Precious Metals, and Cash.
| FUND HOLDINGS – (Unaudited), (Continued) |
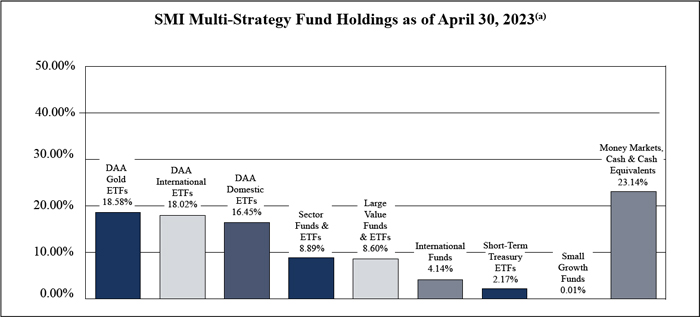
| (a) | As a percentage of net assets. |
SMI Multi-Strategy Fund seeks total return. Total return is composed of both income and capital appreciation. The Adviser allocates the Fund’s assets on a 50/40/10 basis among various investment strategies as follows:
| • | 50% - Dynamic Asset Allocation Strategy (“DAA”) |
| • | 40% - Stock Upgrading Strategy |
| • | 10% - Sector Rotation Strategy |
The “Sector Rotation Strategy” involves the Adviser selecting from a universe of mutual funds and ETFs it has compiled using proprietary methods (“Underlying Funds”). This universe is specifically designed by the Adviser to balance exposure to a wide variety of market sectors and industries. This universe includes leveraged, non-leveraged and inverse Underlying Funds. The Adviser ranks these Underlying Funds based on their recent performance across multiple short-term performance periods, then uses an upgrading approach to invest in the top performing market sector or sectors. Once a particular sector or sectors is identified, the Adviser purchases one or more Underlying Funds to gain the desired exposure to that particular sector. This portion of the Fund may be concentrated, meaning that the Fund may be invested in as few as one or two sectors at a time and potentially as few as one Underlying Fund.
Availability of Portfolio Schedules – (Unaudited)
The Funds file their complete schedules of portfolio holdings with the Securities and Exchange Commission (“SEC”) for the first and third quarters of each fiscal year as an exhibit to its reports on Form N-PORT. The Funds’ Form N-PORT reports are available on the SEC’s website at http://www.sec.gov and on the Funds’ website at www.smifund.com.
| SOUND MIND INVESTING FUND |
| SCHEDULE OF INVESTMENTS |
| April 30, 2023 (Unaudited) |
| EXCHANGE-TRADED FUNDS — 28.14% | | Shares | | | Fair Value | |
| iShares S&P 500® Value ETF | | | 146,180 | | | $ | 22,568,731 | |
| iShares U.S. Aerospace & Defense ETF | | | 4,050 | | | | 461,538 | |
| SPDR® Bloomberg 1-3 Month T-Bill ETF | | | 85,430 | | | | 7,840,765 | |
| Total Exchange-Traded Funds (Cost $29,923,894) | | | | | | | 30,871,034 | |
| | | | | | | | | |
| MUTUAL FUNDS — 9.31% | | | | | | | | |
| | | | | | | | | |
| Akre Focus Fund, Institutional Class | | | 101 | | | | 5,295 | |
| AllianzGI Dividend Value Fund | | | 200 | | | | 2,062 | |
| AllianzGI NFJ Small-Cap Value Fund | | | 162 | | | | 2,249 | |
| American Century Equity Income Fund, Investor Class | | | 100 | | | | 897 | |
| American Century International Opportunities Fund, Institutional Class | | | 360 | | | | 3,251 | |
| AMG Yacktman Focused Fund, Institutional Class | | | 100 | | | | 1,923 | |
| AMG Yacktman Fund, Institutional Class | | | 100 | | | | 2,232 | |
| Artisan International Small Cap Fund, Investor Class(a) | | | 100 | | | | 1,646 | |
| Artisan International Value Fund, Investor Class | | | 150 | | | | 6,486 | |
| Artisan Mid Cap Value Fund, Investor Class | | | 279 | | | | 4,575 | |
| Artisan Small Cap Fund, Investor Class | | | 125 | | | | 3,716 | |
| BlackRock International Opportunities Portfolio, Institutional Class | | | 100 | | | | 3,453 | |
| BNY Mellon Opportunistic Small Cap Fund, Investor Class | | | 100 | | | | 2,750 | |
| Bridgeway Ultra-Small Company Market Fund, Class N | | | 100 | | | | 1,002 | |
| Buffalo Small Cap Fund, Inc., Investor Class(a) | | | 150 | | | | 2,036 | |
| Causeway International Value Fund, Institutional Class | | | 525,519 | | | | 9,958,580 | |
| Champlain Small Company Fund, Institutional Class | | | 100 | | | | 2,032 | |
| Chartwell Small Cap Value Fund | | | 118 | | | | 2,034 | |
| Columbia Acorn Fund, Institutional Class | | | 137 | | | | 1,334 | |
| Columbia Acorn International, Institutional Class | | | 100 | | | | 2,411 | |
| Columbia Contrarian Core Fund, Institutional Class | | | 91 | | | | 2,491 | |
| Columbia Small Cap Growth Fund I, Institutional Class(a) | | | 100 | | | | 2,008 | |
| Davis Opportunity Fund, Class Y | | | 100 | | | | 3,658 | |
| Delaware Select Growth Fund, Institutional Class(a) | | | 100 | | | | 2,479 | |
| Delaware Small Cap Value Fund, Institutional Class | | | 100 | | | | 6,551 | |
| Delaware Value Fund, Institutional Class | | | 144 | | | | 2,604 | |
| DFA International Small Cap Value Portfolio, Institutional Class | | | 100 | | | | 2,049 | |
| DFA International Small Company Portfolio, Institutional Class | | | 100 | | | | 1,882 | |
| DFA U.S. Small Cap Value Portfolio, Institutional Class | | | 100 | | | | 3,839 | |
| Fidelity Mid-Cap Stock Fund | | | 150 | | | | 5,709 | |
| Fidelity Small Cap Discovery Fund | | | 100 | | | | 2,370 | |
| Fidelity Small Cap Stock Fund | | | 150 | | | | 2,214 | |
| Fidelity Small Cap Value Fund | | | 150 | | | | 2,675 | |
See accompanying notes which are an integral part of these financial statements.
| SOUND MIND INVESTING FUND |
| SCHEDULE OF INVESTMENTS |
| April 30, 2023 (Unaudited) – (Continued) |
| MUTUAL FUNDS — 9.31% - continued | | Shares | | | Fair Value | |
| Franklin Small Cap Value Fund, Advisor Class | | | 100 | | | $ | 5,345 | |
| Hartford International Opportunities Fund (The), Class Y | | | 248 | | | | 4,324 | |
| Heartland Value Fund | | | 100 | | | | 4,139 | |
| Hennessy Cornerstone Mid Cap 30 Fund, Institutional Class | | | 100 | | | | 1,837 | |
| Hennessy Focus Fund, Investor Class | | | 50 | | | | 2,400 | |
| Invesco Oppenheimer International Small-Mid Company Fund, Class Y | | | 100 | | | | 4,242 | |
| Invesco Value Opportunities Fund, Class Y | | | 255 | | | | 3,898 | |
| Janus Henderson Contrarian Fund, Class T | | | 100 | | | | 2,500 | |
| Janus Henderson Mid Cap Value Fund, Class T | | | 200 | | | | 2,976 | |
| Janus Henderson Overseas Fund, Class T | | | 100 | | | | 4,328 | |
| Janus Henderson Venture Fund, Class T | | | 100 | | | | 7,344 | |
| JOHCM International Select Fund, Institutional Class | | | 100 | | | | 2,171 | |
| JPMorgan Mid Cap Value Fund, Institutional Class | | | 100 | | | | 3,422 | |
| JPMorgan Small Cap Equity Fund, Select Class | | | 100 | | | | 5,114 | |
| JPMorgan Small Cap Growth Fund, Class L | | | 100 | | | | 1,792 | |
| JPMorgan U.S. Research Enhanced Equity Fund, Institutional Class | | | 100 | | | | 3,199 | |
| Longleaf Partners Fund | | | 150 | | | | 3,065 | |
| Longleaf Partners International Fund | | | 150 | | | | 2,342 | |
| Longleaf Partners Small-Cap Fund | | | 100 | | | | 2,198 | |
| Lord Abbett Developing Growth Fund, Inc., Institutional Class(a) | | | 100 | | | | 2,358 | |
| Miller Opportunity Trust, Institutional Class | | | 100 | | | | 2,598 | |
| Morgan Stanley Discovery Portfolio, Institutional Class(a) | | | 100 | | | | 1,124 | |
| Morgan Stanley Growth Portfolio, Institutional Class(a) | | | 100 | | | | 2,821 | |
| Neuberger Berman Genesis Fund, Institutional Class | | | 100 | | | | 5,683 | |
| Nicholas Fund, Inc.(a) | | | 50 | | | | 3,866 | |
| Oakmark International Fund, Investor Class | | | 150 | | | | 4,002 | |
| Oakmark International Small Cap Fund, Institutional Class | | | 150 | | | | 2,799 | |
| Oakmark Select Fund, Institutional Class | | | 150 | | | | 8,417 | |
| PRIMECAP Odyssey Aggressive Growth Fund(a) | | | 100 | | | | 3,901 | |
| Principal SmallCap Growth Fund I, Institutional Class(a) | | | 200 | | | | 2,556 | |
| Prudential Jennison International Opportunities, Class Z | | | 185 | | | | 5,040 | |
| Royce Micro-Cap Fund, Investment Class | | | 106 | | | | 1,018 | |
| Royce Opportunity Fund, Investment Class | | | 318 | | | | 4,306 | |
| Royce Premier Fund, Investment Class | | | 300 | | | | 3,252 | |
| Royce Special Equity Fund, Institutional Class | | | 150 | | | | 2,373 | |
| T. Rowe Price International Discovery Fund, Investor Class | | | 75 | | | | 4,586 | |
| T. Rowe Price Mid-Cap Growth Fund, Investor Class | | | 50 | | | | 4,704 | |
| T. Rowe Price New Horizons Fund, Investor Class | | | 100 | | | | 4,890 | |
| T. Rowe Price Small-Cap Value Fund, Investor Class | | | 100 | | | | 4,735 | |
See accompanying notes which are an integral part of these financial statements.
| SOUND MIND INVESTING FUND |
| SCHEDULE OF INVESTMENTS |
| April 30, 2023 (Unaudited) – (Continued) |
| MUTUAL FUNDS — 9.31% - continued | | Shares | | | Fair Value | |
| Thornburg Value Fund, Institutional Class | | | 100 | | | $ | 6,177 | |
| TIAA-CREF International Equity Fund, Institutional Class | | | 100 | | | | 1,266 | |
| Touchstone Sands Capital Select Growth Fund, Class Y(a) | | | 100 | | | | 1,092 | |
| Tweedy Browne International Value Fund | | | 150 | | | | 4,175 | |
| Vanguard Strategic Equity Fund, Investor Class | | | 100 | | | | 3,115 | |
| Victory RS Small Cap Growth Fund, Class Y | | | 100 | | | | 5,042 | |
| Wasatch International Growth Fund, Investor Class(a) | | | 150 | | | | 3,462 | |
| Wasatch Micro Cap Fund, Investor Class(a) | | | 100 | | | | 591 | |
| Total Mutual Funds (Cost $9,597,174) | | | | | | | 10,217,078 | |
| | | | | | | | | |
| MONEY MARKET FUNDS - 62.41% | | | | | | | | |
| Fidelity Investments Money Market Government Portfolio, Institutional Class, 4.77%(b) (c) | | | 68,466,311 | | | | 68,466,311 | |
| Total Money Market Funds (Cost $68,466,311) | | | | | | | 68,466,311 | |
| Total Investments — 99.86% (Cost $107,987,379) | | | | | | $ | 109,554,423 | |
| Other Assets in Excess of Liabilities — 0.14% | | | | | | | 151,494 | |
| NET ASSETS — 100.00% | | | | | | $ | 109,705,917 | |
| (a) | Non-income producing security. |
| (b) | Rate disclosed is the seven day effective yield as of April 30, 2023. |
| (c) | Represents an investment greater than 25% of the Fund’s net assets. Performance of the Fund may be adversely impacted by concentrated investments in securities. The financial statements and portfolio holdings for these securities can be found at www.sec.gov. As of April 30, 2023, the percentage of net assets invested in Fidelity Investments Money Market Government Portfolio was 62.41% of the Fund. |
ETF - Exchange-Traded Fund
SPDR - Standard & Poor’s Depositary Receipt
See accompanying notes which are an integral part of these financial statements.
| SMI DYNAMIC ALLOCATION FUND |
| SCHEDULE OF INVESTMENTS |
| April 30, 2023 (Unaudited) |
| EXCHANGE-TRADED FUNDS — 67.20% | | Shares | | | Fair Value | |
| iShares MSCI EAFE ETF(a) | | | 400,680 | | | $ | 29,498,062 | |
| SPDR S&P 500® ETF(a) | | | 69,760 | | | | 29,015,277 | |
| Total Exchange-Traded Funds (Cost $55,547,527) | | | | | | | 58,513,339 | |
| | | | | | | | | |
| CLOSED END FUNDS — 27.40% | | | | | | | | |
| Sprott Physical Gold Trust(a) (b) | | | 1,536,990 | | | | 23,854,085 | |
| Total Closed End Funds (Cost $22,662,255) | | | | | | | 23,854,085 | |
| | | | | | | | | |
| MUTUAL FUNDS — 4.83% | | | | | | | | |
| Gold Bullion Strategy Fund (The), Investor Class | | | 184,150 | | | | 4,207,821 | |
| Total Mutual Funds (Cost $4,312,448) | | | | | | | 4,207,821 | |
| | | | | | | | | |
| MONEY MARKET FUNDS - 0.71% | | | | | | | | |
| Fidelity Investments Money Market Government Portfolio, Institutional Class, 4.77%(c) | | | 621,454 | | | | 621,454 | |
| Total Money Market Funds (Cost $621,454) | | | | | | | 621,454 | |
| Total Investments — 100.14% (Cost $83,143,684) | | | | | | $ | 87,196,699 | |
| Liabilities in Excess of Other Assets — (0.14)% | | | | | | | (125,070 | ) |
| NET ASSETS — 100.00% | | | | | | $ | 87,071,629 | |
| (a) | Represents an investment greater than 25% of the Fund’s net assets. Performance of the Fund may be adversely impacted by concentrated investments in securities. The financial statements and portfolio holdings for these securities can be found at www.sec.gov. As of April 30, 2023, the percentage of net assets invested in iShares MSCI EAFE ETF, SPDR S&P 500 ETF and Sprott Physical Gold Trust were 33.88%, 33.32% and 27.40% of the Fund, respectively. |
| (b) | Non-income producing security. |
| (c) | Rate disclosed is the seven day effective yield as of April 30, 2023. |
ETF - Exchange-Traded Fund
SPDR - Standard & Poor’s Depositary Receipt
See accompanying notes which are an integral part of these financial statements.
| SMI MULTI-STRATEGY FUND |
| SCHEDULE OF INVESTMENTS |
| April 30, 2023 (Unaudited) |
| EXCHANGE-TRADED FUNDS — 51.70% | | Shares | | | Fair Value | |
| iShares MSCI EAFE ETF | | | 136,480 | | | $ | 10,047,657 | |
| iShares Expanded Tech-Software Sector ETF | | | 2,250 | | | | 667,125 | |
| iShares S&P 500® Value ETF | | | 31,050 | | | | 4,793,810 | |
| iShares U.S. Home Construction ETF | | | 29,810 | | | | 2,259,300 | |
| SPDR® Bloomberg 1-3 Month T-Bill ETF | | | 13,200 | | | | 1,211,496 | |
| SPDR® S&P 500® ETF | | | 22,060 | | | | 9,175,416 | |
| Technology Select Sector SPDR® Fund | | | 4,510 | | | | 680,243 | |
| Total Exchange-Traded Funds (Cost $27,591,832) | | | | | | | 28,853,048 | |
| | | | | | | | | |
| CLOSED END FUNDS — 18.58% | | | | | | | | |
| Sprott Physical Gold Trust(a) | | | 667,452 | | | | 10,358,855 | |
| Total Closed End Funds (Cost $9,972,044) | | | | | | | 10,358,855 | |
| | | | | | | | | |
| MUTUAL FUNDS — 6.58% | | | | | | | | |
| AMG Yacktman Focused Fund, Institutional Class | | | 100 | | | | 1,923 | |
| Causeway International Value Fund, Institutional Class | | | 121,144 | | | | 2,295,682 | |
| Fidelity Select Natural Resources Portfolio | | | 17,179 | | | | 688,686 | |
| Fidelity Select Semiconductors Portfolio | | | 35,861 | | | | 664,145 | |
| Invesco International Small-Mid Company Fund, Class Y | | | 100 | | | | 4,242 | |
| Longleaf Partners International Fund | | | 150 | | | | 2,342 | |
| Lord Abbett Developing Growth Fund, Inc., Institutional Class(a) | | | 100 | | | | 2,358 | |
| Miller Opportunity Trust, Institutional Class | | | 100 | | | | 2,598 | |
| Morgan Stanley Discovery Portfolio, Institutional Class(a) | | | 100 | | | | 1,124 | |
| Oakmark International Fund, Investor Class | | | 50 | | | | 1,334 | |
| Wasatch International Growth Fund, Investor Class(a) | | | 100 | | | | 2,308 | |
| Total Mutual Funds (Cost $3,580,435) | | | | | | | 3,666,741 | |
See accompanying notes which are an integral part of these financial statements.
| SMI MULTI-STRATEGY FUND |
| SCHEDULE OF INVESTMENTS |
| April 30, 2023 (Unaudited) – (Continued) |
| MONEY MARKET FUNDS - 23.15% | | Shares | | | Fair Value | |
| Fidelity Investments Money Market Government Portfolio, Institutional Class, 4.77%(b) | | | 12,907,828 | | | $ | 12,907,828 | |
| Total Money Market Funds (Cost $12,907,828) | | | | | | | 12,907,828 | |
| Total Investments — 100.01% (Cost $54,052,139) | | | | | | $ | 55,768,472 | |
| Liabilities in Excess of Other Assets — (0.01)% | | | | | | | (3,562 | ) |
| NET ASSETS — 100.00% | | | | | | $ | 55,764,910 | |
| (a) | Non-income producing security. |
| (b) | Rate disclosed is the seven day effective yield as of April 30, 2023. |
ETF - Exchange-Traded Fund
SPDR - Standard & Poor’s Depositary Receipt
See accompanying notes which are an integral part of these financial statements.
| SMI FUNDS |
| STATEMENTS OF ASSETS AND LIABILITIES |
| April 30, 2023 (Unaudited) |
| | | | | | | | | SMI | |
| | | Sound Mind | | | SMI Dynamic | | | Multi-Strategy | |
| | | Investing Fund | | | Allocation Fund | | | Fund | |
| Assets | | | | | | | | | | | | |
| Investments in securities at fair value (cost $107,987,379, $83,143,684 and $54,052,139) (Note 3) | | $ | 109,554,423 | | | $ | 87,196,699 | | | $ | 55,768,472 | |
| Receivable for fund shares sold | | | 1,656 | | | | 1,138 | | | | 902 | |
| Receivable for investments sold | | | — | | | | — | | | | 1,511,094 | |
| Dividends receivable | | | 269,408 | | | | 2,126 | | | | 57,032 | |
| Prepaid expenses | | | 13,966 | | | | 16,458 | | | | 15,807 | |
| Total Assets | | | 109,839,453 | | | | 87,216,421 | | | | 57,353,307 | |
| | | | | | | | | | | | | |
| Liabilities | | | | | | | | | | | | |
| Payable for fund shares redeemed | | | 10,000 | | | | 46,000 | | | | 2,000 | |
| Payable for investments purchased | | | — | | | | — | | | | 1,520,739 | |
| Payable to Adviser (Note 4) | | | 90,193 | | | | 71,675 | | | | 41,539 | |
| Payable to Administrator (Note 4) | | | 7,340 | | | | 4,821 | | | | 3,619 | |
| Payable to trustees | | | 2,244 | | | | 2,244 | | | | 2,244 | |
| Other accrued expenses | | | 23,759 | | | | 20,052 | | | | 18,256 | |
| Total Liabilities | | | 133,536 | | | | 144,792 | | | | 1,588,397 | |
| Net Assets | | $ | 109,705,917 | | | $ | 87,071,629 | | | $ | 55,764,910 | |
| | | | | | | | | | | | | |
| Net Assets consist of: | | | | | | | | | | | | |
| Paid-in capital | | | 119,530,596 | | | | 83,779,981 | | | | 56,230,530 | |
| Accumulated earnings (deficit) | | | (9,824,679 | ) | | | 3,291,648 | | | | (465,620 | ) |
| Net Assets | | $ | 109,705,917 | | | $ | 87,071,629 | | | $ | 55,764,910 | |
| Shares outstanding (unlimited number of shares authorized, no par value) | | | 13,022,444 | | | | 7,632,597 | | | | 5,927,442 | |
| Net asset value, offering and redemption price per share (Note 2) | | $ | 8.42 | | | $ | 11.41 | | | $ | 9.41 | |
| | | | | | | | | | | | | |
See accompanying notes which are an integral part of these financial statements.
| SMI FUNDS |
| STATEMENTS OF OPERATIONS |
| For the six months ended April 30, 2023 (Unaudited) |
| | | | | | | | | SMI | |
| | | Sound Mind | | | SMI Dynamic | | | Multi-Strategy | |
| | | Investing Fund | | | Allocation Fund | | | Fund | |
| Investment Income | | | | | | | | | | | | |
| Dividend income | | $ | 2,068,978 | | | $ | 583,624 | | | $ | 681,334 | |
| Total investment income | | | 2,068,978 | | | | 583,624 | | | | 681,334 | |
| | | | | | | | | | | | | |
| Expenses | | | | | | | | | | | | |
| Investment Adviser fees (Note 4) | | | 559,913 | | | | 429,167 | | | | 253,359 | |
| Administration fees (Note 4) | | | 17,987 | | | | 13,578 | | | | 8,931 | |
| Registration fees | | | 16,326 | | | | 15,059 | | | | 17,267 | |
| Transfer agent fees (Note 4) | | | 9,958 | | | | 4,327 | | | | 4,614 | |
| Fund accounting fees (Note 4) | | | 9,512 | | | | 7,181 | | | | 4,723 | |
| Audit and tax preparation fees | | | 9,402 | | | | 9,402 | | | | 9,402 | |
| Legal fees | | | 9,114 | | | | 9,114 | | | | 9,114 | |
| Printing and postage expenses | | | 5,973 | | | | 3,998 | | | | 3,052 | |
| Compliance service fees (Note 4) | | | 4,016 | | | | 4,016 | | | | 4,016 | |
| Trustee fees (Note 4) | | | 3,874 | | | | 3,874 | | | | 3,874 | |
| Line of credit | | | 3,177 | | | | 2,397 | | | | 1,583 | |
| Custodian fees | | | 3,149 | | | | 2,375 | | | | 1,596 | |
| Insurance expenses | | | 2,472 | | | | 2,313 | | | | 2,005 | |
| Interest expense | | | — | | | | 478 | | | | — | |
| Miscellaneous expenses | | | 19,395 | | | | 13,352 | | | | 13,325 | |
| Total expenses | | | 674,268 | | | | 520,631 | | | | 336,861 | |
| Fees contractually waived by Adviser | | | — | | | | — | | | | (6,245 | ) |
| Net operating expenses | | | 674,268 | | | | 520,631 | | | | 330,616 | |
| Net investment income | | | 1,394,710 | | | | 62,993 | | | | 350,718 | |
| | | | | | | | | | | | | |
| Net Realized and Change in Unrealized Gain (Loss) on Investments | | | | | | | | | | | | |
| Long term capital gain dividends from investment companies | | | 11,359 | | | | — | | | | 2,014 | |
| Net realized gain (loss) on investment securities transactions | | | (239,944 | ) | | | 203,236 | | | | 493,531 | |
| Net change in unrealized appreciation on investment securities | | | 1,398,569 | | | | 7,900,516 | | | | 1,872,794 | |
| Net realized and change in unrealized gain on investments | | | 1,169,984 | | | | 8,103,752 | | | | 2,368,339 | |
| Net increase in net assets resulting from operations | | $ | 2,564,694 | | | $ | 8,166,745 | | | $ | 2,719,057 | |
| | | | | | | | | | | | | |
See accompanying notes which are an integral part of these financial statements.
| SOUND MIND INVESTING FUND |
| STATEMENTS OF CHANGES IN NET ASSETS |
| | | For the Six | | | | |
| | | Months Ended | | | For the Year | |
| | | April 30, 2023 | | | Ended | |
| | | (Unaudited) | | | October 31, 2022 | |
| Increase (Decrease) in Net Assets due to: | | | | | | | | |
| Operations | | | | | | | | |
| Net investment income | | $ | 1,394,710 | | | $ | 6,253,824 | |
| Long term capital gain dividends from investment companies | | | 11,359 | | | | 822,179 | |
| Net realized loss on investment securities transactions | | | (239,944 | ) | | | (13,402,573 | ) |
| Net change in unrealized appreciation (depreciation) of investment securities | | | 1,398,569 | | | | (8,751,073 | ) |
| Net increase (decrease) in net assets resulting from operations | | | 2,564,694 | | | | (15,077,643 | ) |
| | | | | | | | | |
| Distributions to Shareholders from Earnings (Note 2) | | | (1,085,594 | ) | | | (46,567,403 | ) |
| | | | | | | | | |
| Capital Transactions | | | | | | | | |
| Proceeds from shares sold | | | 2,061,267 | | | | 3,534,921 | |
| Reinvestment of distributions | | | 1,071,473 | | | | 45,907,374 | |
| Amount paid for shares redeemed | | | (9,317,521 | ) | | | (23,502,932 | ) |
| Net increase (decrease) in net assets resulting from capital transactions | | | (6,184,781 | ) | | | 25,939,363 | |
| Total Decrease in Net Assets | | | (4,705,681 | ) | | | (35,705,683 | ) |
| | | | | | | | | |
| Net Assets | | | | | | | | |
| Beginning of period | | | 114,411,598 | | | | 150,117,281 | |
| End of period | | $ | 109,705,917 | | | $ | 114,411,598 | |
| | | | | | | | | |
| Share Transactions | | | | | | | | |
| Shares sold | | | 246,031 | | | | 376,993 | |
| Shares issued in reinvestment of distributions | | | 129,405 | | | | 4,989,932 | |
| Shares redeemed | | | (1,112,813 | ) | | | (2,595,854 | ) |
| Net increase (decrease) in shares outstanding | | | (737,377 | ) | | | 2,771,071 | |
| | | | | | | | | |
See accompanying notes which are an integral part of these financial statements.
| SMI DYNAMIC ALLOCATION FUND |
| STATEMENTS OF CHANGES IN NET ASSETS |
| | | For the Six | | | | |
| | | Months Ended | | | For the Year | |
| | | April 30, 2023 | | | Ended | |
| | | (Unaudited) | | | October 31, 2022 | |
| Increase (Decrease) in Net Assets due to: | | | | | | | | |
| Operations | | | | | | | | |
| Net investment income (loss) | | $ | 62,993 | | | $ | (37,045 | ) |
| Long term capital gain dividends from investment companies | | | — | | | | 76,168 | |
| Net realized gain (loss) on investment securities transactions | | | 203,236 | | | | (809,037 | ) |
| Net change in unrealized appreciation (depreciation) of investment securities | | | 7,900,516 | | | | (21,788,614 | ) |
| Net increase (decrease) in net assets resulting from operations | | | 8,166,745 | | | | (22,558,528 | ) |
| | | | | | | | | |
| Distributions to Shareholders from Earnings (Note 2) | | | — | | | | (8,760,391 | ) |
| | | | | | | | | |
| Capital Transactions | | | | | | | | |
| Proceeds from shares sold | | | 2,057,174 | | | | 5,681,085 | |
| Reinvestment of distributions | | | — | | | | 8,579,626 | |
| Amount paid for shares redeemed | | | (8,901,193 | ) | | | (17,156,548 | ) |
| Net decrease in net assets resulting from capital transactions | | | (6,844,019 | ) | | | (2,895,837 | ) |
| Total Increase (Decrease) in Net Assets | | | 1,322,726 | | | | (34,214,756 | ) |
| | | | | | | | | |
| Net Assets | | | | | | | | |
| Beginning of period | | | 85,748,903 | | | | 119,963,659 | |
| End of period | | $ | 87,071,629 | | | $ | 85,748,903 | |
| | | | | | | | | |
| Share Transactions | | | | | | | | |
| Shares sold | | | 188,860 | | | | 462,036 | |
| Shares issued in reinvestment of distributions | | | — | | | | 653,437 | |
| Shares redeemed | | | (819,422 | ) | | | (1,442,468 | ) |
| Net decrease in shares outstanding | | | (630,562 | ) | | | (326,995 | ) |
| | | | | | | | | |
See accompanying notes which are an integral part of these financial statements.
| SMI MULTI-STRATEGY FUND |
| STATEMENTS OF CHANGES IN NET ASSETS |
| | | For the Six | | | | |
| | | Months Ended | | | For the Year | |
| | | April 30, 2023 | | | Ended | |
| | | (Unaudited) | | | October 31, 2022 | |
| Increase (Decrease) in Net Assets due to: | | | | | | | | |
| Operations | | | | | | | | |
| Net investment income | | $ | 350,718 | | | $ | 1,346,968 | |
| Long term capital gain dividends from investment companies | | | 2,014 | | | | 182,572 | |
| Net realized gain (loss) on investment securities transactions | | | 493,531 | | | | (2,985,753 | ) |
| Net change in unrealized appreciation (depreciation) of investment securities | | | 1,872,794 | | | | (7,341,851 | ) |
| Net increase (decrease) in net assets resulting from operations | | | 2,719,057 | | | | (8,798,064 | ) |
| | | | | | | | | |
| Distributions to Shareholders from Earnings (Note 2) | | | (203,162 | ) | | | (10,781,785 | ) |
| Capital Transactions | | | | | | | | |
| Proceeds from shares sold | | | 3,710,273 | | | | 5,919,742 | |
| Reinvestment of distributions | | | 200,477 | | | | 10,619,805 | |
| Amount paid for shares redeemed | | | (6,571,832 | ) | | | (9,934,151 | ) |
| Net increase (decrease) in net assets resulting from capital transactions | | | (2,661,082 | ) | | | 6,605,396 | |
| Total Decrease in Net Assets | | | (145,187 | ) | | | (12,974,453 | ) |
| | | | | | | | | |
| Net Assets | | | | | | | | |
| Beginning of period | | | 55,910,097 | | | | 68,884,550 | |
| End of period | | $ | 55,764,910 | | | $ | 55,910,097 | |
| | | | | | | | | |
| Share Transactions | | | | | | | | |
| Shares sold | | | 400,687 | | | | 605,232 | |
| Shares issued in reinvestment of distributions | | | 22,030 | | | | 1,024,089 | |
| Shares redeemed | | | (707,010 | ) | | | (991,783 | ) |
| Net increase (decrease) in shares outstanding | | | (284,293 | ) | | | 637,538 | |
| | | | | | | | | |
See accompanying notes which are an integral part of these financial statements.
THIS PAGE INTENTIONALLY LEFT BLANK
| SOUND MIND INVESTING FUND |
| FINANCIAL HIGHLIGHTS |
| (For a share outstanding during each period) |
| | | For the Six | |
| | | Months Ended | |
| | | April 30, | |
| | | 2023 | |
| | | (Unaudited) | |
| Selected Per Share Data: | | | | |
| Net asset value, beginning of period | | $ | 8.31 | |
| | | | | |
| Income from investment operations: | | | | |
| Net investment income (loss)(a) | | | 0.11 | |
| Net realized and unrealized gain (loss) on investments | | | 0.08 | |
| Total from investment operations | | | 0.19 | |
| | | | | |
| Less distributions to shareholders from: | | | | |
| Net investment income | | | (0.08 | ) |
| Net realized gains | | | — | |
| Total distributions | | | (0.08 | ) |
| | | | | |
| Net asset value, end of period | | $ | 8.42 | |
| | | | | |
| Total Return(b) | | | 2.31 | % (c) |
| | | | | |
| Ratios and Supplemental Data: | | | | |
| Net assets, end of period (000 omitted) | | $ | 109,706 | |
| Ratio of expenses to average net assets(d) | | | 1.20 | % (e) |
| Ratio of expenses to average net assets excluding interest expenses(d) (f) | | | 1.20 | % (e) |
| Ratio of net investment income (loss) to average net assets(a) (d) | | | 2.49 | % (e) |
| Portfolio turnover rate | | | 97.83 | % (c) |
| | | | | |
| (a) | Recognition of net investment income by the Fund is affected by the timing of the declaration of dividends by the underlying funds in which the Fund invests. |
| (b) | Total return in the above table represents the rate that the investor would have earned or lost on an investment in the Fund, assuming reinvestment of distributions. |
| (d) | These ratios exclude the impact of expenses of the underlying funds in which the Fund invests as represented in the Schedule of Investments. |
| (f) | These ratios do not include the effects of line of credit interest expense and borrowing costs. |
See accompanying notes which are an integral part of these financial statements.
| SOUND MIND INVESTING FUND |
| FINANCIAL HIGHLIGHTS |
| (For a share outstanding during each period) – (Continued) |
| For the Year | | | For the Year | | | For the Year | | | For the Year | | | For the Year | |
| Ended | | | Ended | | | Ended | | | Ended | | | Ended | |
| October 31, | | | October 31, | | | October 31, | | | October 31, | | | October 31, | |
| 2022 | | | 2021 | | | 2020 | | | 2019 | | | 2018 | |
| | | | | | | | | | | | | | |
| $ | 13.66 | | | $ | 9.97 | | | $ | 9.64 | | | $ | 11.65 | | | $ | 12.52 | |
| | | | | | | | | | | | | | | | | | | |
| | 0.55 | | | | (0.02 | ) | | | (0.04 | ) | | | 0.05 | | | | 0.04 | |
| | (1.59 | ) | | | 3.71 | | | | 0.42 | | | | 0.14 | | | | 0.26 | |
| | (1.04 | ) | | | 3.69 | | | | 0.38 | | | | 0.19 | | | | 0.30 | |
| | | | | | | | | | | | | | | | | | | |
| | (0.42 | ) | | | — | | | | (0.05 | ) | | | (0.05 | ) | | | — | |
| | (3.89 | ) | | | — | | | | — | | | | (2.15 | ) | | | (1.17 | ) |
| | (4.31 | ) | | | — | | | | (0.05 | ) | | | (2.20 | ) | | | (1.17 | ) |
| | | | | | | | | | | | | | | | | | | |
| $ | 8.31 | | | $ | 13.66 | | | $ | 9.97 | | | $ | 9.64 | | | $ | 11.65 | |
| | | | | | | | | | | | | | | | | | | |
| | (10.72 | )% | | | 37.01 | % | | | 3.92 | % | | | 4.28 | % | | | 2.36 | % |
| | | | | | | | | | | | | | | | | | | |
| $ | 114,412 | | | $ | 150,117 | | | $ | 124,775 | | | $ | 147,650 | | | $ | 174,473 | |
| | 1.19 | % | | | 1.17 | % | | | 1.20 | % | | | 1.18 | % | | | 1.16 | % |
| | 1.19 | % | | | 1.16 | % | | | 1.20 | % | | | 1.17 | % | | | 1.16 | % |
| | 4.87 | % | | | (0.09 | )% | | | (0.38 | )% | | | 0.45 | % | | | 0.34 | % |
| | 259.58 | % | | | 300.02 | % | | | 214.07 | % | | | 192.77 | % | | | 163.54 | % |
| | | | | | | | | | | | | | | | | | | |
See accompanying notes which are an integral part of these financial statements.
| SMI DYNAMIC ALLOCATION FUND |
| FINANCIAL HIGHLIGHTS |
| (For a share outstanding during each period) |
| | | For the Six | |
| | | Months Ended | |
| | | April 30, | |
| | | 2023 | |
| | | (Unaudited) | |
| Selected Per Share Data: | | | | |
| Net asset value, beginning of period | | $ | 10.38 | |
| | | | | |
| Income from investment operations: | | | | |
| Net investment income(a) | | | 0.01 | |
| Net realized and unrealized gain (loss) on investments | | | 1.02 | |
| Total from investment operations | | | 1.03 | |
| | | | | |
| Less distributions to shareholders from: | | | | |
| Net investment income | | | — | |
| Net realized gains | | | — | |
| Total distributions | | | — | |
| | | | | |
| Net asset value, end of period | | $ | 11.41 | |
| | | | | |
| Total Return(c) | | | 9.92 | % (d) |
| | | | | |
| Ratios and Supplemental Data: | | | | |
| Net assets, end of period (000 omitted) | | $ | 87,072 | |
| Ratio of expenses to average net assets(e) | | | 1.21 | % (f) |
| Ratio of expenses to average net assets excluding interest expenses(e) (g) | | | 1.21 | % (f) |
| Ratio of net investment income (loss) to average net assets(a) (e) | | | 0.15 | % (f) |
| Portfolio turnover rate | | | 90.27 | % (d) |
| | | | | |
| (a) | Recognition of net investment income by the Fund is affected by the timing of the declaration of dividends by the underlying funds in which the Fund invests. |
| (b) | Rounds to less than $0.005 per share. |
| (c) | Total return in the above table represents the rate that the investor would have earned or lost on an investment in the Fund, assuming reinvestment of distributions. |
| (e) | These ratios exclude the impact of expenses of the underlying funds in which the Fund invests as represented in the Schedule of Investments. |
| (g) | These ratios do not include the effects of line of credit interest expense and borrowing costs. |
See accompanying notes which are an integral part of these financial statements.
| SMI DYNAMIC ALLOCATION FUND |
| FINANCIAL HIGHLIGHTS |
| (For a share outstanding during each period) – (Continued) |
| For the Year | | | For the Year | | | For the Year | | | For the Year | | | For the Year | |
| Ended | | | Ended | | | Ended | | | Ended | | | Ended | |
| October 31, | | | October 31, | | | October 31, | | | October 31, | | | October 31, | |
| 2022 | | | 2021 | | | 2020 | | | 2019 | | | 2018 | |
| | | | | | | | | | | | | | |
| $ | 13.97 | | | $ | 12.45 | | | $ | 12.17 | | | $ | 11.66 | | | $ | 11.75 | |
| | | | | | | | | | | | | | | | | | | |
| | — | (b) | | | 0.10 | | | | 0.06 | | | | 0.12 | | | | 0.18 | |
| | (2.55 | ) | | | 2.08 | | | | 0.37 | | | | 0.56 | | | | (0.16 | ) |
| | (2.55 | ) | | | 2.18 | | | | 0.43 | | | | 0.68 | | | | 0.02 | |
| | | | | | | | | | | | | | | | | | | |
| | (0.06 | ) | | | (0.09 | ) | | | (0.15 | ) | | | (0.17 | ) | | | (0.11 | ) |
| | (0.98 | ) | | | (0.57 | ) | | | — | | | | — | | | | — | |
| | (1.04 | ) | | | (0.66 | ) | | | (0.15 | ) | | | (0.17 | ) | | | (0.11 | ) |
| | | | | | | | | | | | | | | | | | | |
| $ | 10.38 | | | $ | 13.97 | | | $ | 12.45 | | | $ | 12.17 | | | $ | 11.66 | |
| | | | | | | | | | | | | | | | | | | |
| | (19.82 | )% | | | 18.17 | % | | | 3.55 | % | | | 5.97 | % | | | 0.15 | % |
| | | | | | | | | | | | | | | | | | | |
| $ | 85,749 | | | $ | 119,964 | | | $ | 113,195 | | | $ | 119,339 | | | $ | 132,999 | |
| | 1.20 | % | | | 1.17 | % | | | 1.19 | % | | | 1.18 | % | | | 1.16 | % |
| | 1.19 | % | | | 1.16 | % | | | 1.19 | % | | | 1.17 | % | | | 1.16 | % |
| | (0.04 | )% | | | 0.80 | % | | | 0.44 | % | | | 1.02 | % | | | 1.45 | % |
| | 317.28 | % | | | 175.11 | % | | | 275.33 | % | | | 218.06 | % | | | 61.28 | % |
| | | | | | | | | | | | | | | | | | | |
See accompanying notes which are an integral part of these financial statements.
| SMI MULTI-STRATEGY FUND |
| FINANCIAL HIGHLIGHTS |
| (For a share outstanding during each period) |
| | | For the Six | |
| | | Months Ended | |
| | | April 30, | |
| | | 2023 | |
| | | (Unaudited) | |
| Selected Per Share Data: | | | | |
| Net asset value, beginning of period | | $ | 9.00 | |
| Income from investment operations: | | | | |
| Net investment income(b) | | | 0.05 | |
| Net realized and unrealized gain (loss) on investments | | | 0.39 | |
| Total from investment operations | | | 0.44 | |
| | | | | |
| Less distributions to shareholders from: | | | | |
| Net investment income | | | (0.03 | ) |
| Net realized gains | | | — | |
| Total distributions | | | (0.03 | ) |
| | | | | |
| Net asset value, end of period | | $ | 9.41 | |
| | | | | |
| Total Return(d) | | | 4.93 | % (e) |
| | | | | |
| Ratios and Supplemental Data: | | | | |
| Net assets, end of period (000 omitted) | | $ | 55,765 | |
| Ratio of expenses to average net assets(f) | | | 1.17 | % (g) |
| Ratio of expenses to average net assets excluding interest expenses(f) (h) | | | 1.17 | % (g) |
| Ratio of expenses to average net assets before waiver and reimbursement(f) | | | 1.20 | % (g) |
| Ratio of net investment income to average net assets(b) (f) | | | 1.25 | % (g) |
| Portfolio turnover rate | | | 93.39 | % (e) |
| | | | | |
| (a) | As described in Note 1 of the Notes to the Financial Statements, the Former 50/40/10 Fund was reorganized into the SMI Conservative Allocation Fund as of the close of business, April 27, 2018 and subsequently renamed. The Fund is the successor to the Former 50/40/10 Fund. The performance and financial information presented incorporates the operations of the Former 50/40/10 Fund, which, is a result of the reorganization, are the Fund’s operations. The per share amounts have been adjusted for a stock split that occurred on April 27, 2018. On February 28, 2022, the SMI 50/40/10 Fund was renamed SMI Multi-Strategy Fund. |
| (b) | Recognition of net investment income by the Fund is affected by the timing of the declaration of dividends by the underlying funds in which the Fund invests. |
| (c) | Per share net investment income has been determined on the basis of average shares outstanding during the year. |
| (d) | Total return in the above table represents the rate that the investor would have earned or lost on an investment in the Fund, assuming reinvestment of distributions. |
| (f) | These ratios exclude the impact of expenses of the underlying funds in which the Fund invests as represented in the Schedule of Investments. |
| (h) | These ratios do not include the effects of line of credit interest expense and borrowing costs. |
See accompanying notes which are an integral part of these financial statements.
| SMI MULTI-STRATEGY FUND |
| FINANCIAL HIGHLIGHTS |
| (For a share outstanding during each period) – (Continued) |
| For the Year | | | For the Year | | | For the Year | | | For the Year | | | For the Year | |
| Ended | | | Ended | | | Ended | | | Ended | | | Ended | |
| October 31, | | | October 31, | | | October 31, | | | October 31, | | | October 31, | |
| 2022 | | | 2021 | | | 2020 | | | 2019 | | | 2018(a) | |
| | | | | | | | | | | | | | | | | | | |
| $ | 12.36 | | | $ | 9.88 | | | $ | 9.46 | | | $ | 9.46 | | | $ | 9.65 | |
| | | | | | | | | | | | | | | | | | | |
| | 0.25 | | | | 0.04 | | | | 0.01 | | | | 0.05 | | | | 0.10 | (c) |
| | (1.63 | ) | | | 2.48 | | | | 0.45 | | | | 0.26 | | | | (0.04 | ) |
| | (1.38 | ) | | | 2.52 | | | | 0.46 | | | | 0.31 | | | | 0.06 | |
| | | | | | | | | | | | | | | | | | | |
| | (0.25 | ) | | | (0.04 | ) | | | (0.04 | ) | | | (0.07 | ) | | | (0.11 | ) |
| | (1.73 | ) | | | — | | | | — | | | | (0.24 | ) | | | (0.14 | ) |
| | (1.98 | ) | | | (0.04 | ) | | | (0.04 | ) | | | (0.31 | ) | | | (0.25 | ) |
| | | | | | | | | | | | | | | | | | | |
| $ | 9.00 | | | $ | 12.36 | | | $ | 9.88 | | | $ | 9.46 | | | $ | 9.46 | |
| | | | | | | | | | | | | | | | | | | |
| | (13.29 | )% | | | 25.51 | % | | | 4.91 | % | | | 3.55 | % | | | 0.36 | % |
| | | | | | | | | | | | | | | | | | | |
| $ | 55,910 | | | $ | 68,885 | | | $ | 56,291 | | | $ | 62,614 | | | $ | 66,305 | |
| | 1.16 | % | | | 1.16 | % | | | 1.16 | % | | | 1.15 | % | | | 1.24 | % |
| | 1.15 | % | | | 1.15 | % | | | 1.15 | % | | | 1.15 | % | | | 1.23 | % |
| | 1.19 | % | | | 1.14 | % | | | 1.19 | % | | | 1.21 | % | | | 1.39 | % |
| | 2.20 | % | | | 0.35 | % | | | 0.09 | % | | | 0.53 | % | | | 1.03 | % |
| | 292.22 | % | | | 231.35 | % | | | 252.74 | % | | | 225.42 | % | | | 155.28 | % |
| | | | | | | | | | | | | | | | | | | |
See accompanying notes which are an integral part of these financial statements.
| SMI FUNDS |
| NOTES TO THE FINANCIAL STATEMENTS |
| April 30, 2023 (Unaudited) |
NOTE 1. ORGANIZATION
The Sound Mind Investing Fund (“SMI Fund”), SMI Dynamic Allocation Fund and SMI Multi-Strategy Fund (each a “Fund” and collectively, the “Funds”) are each registered under the Investment Company Act of 1940, as amended (“1940 Act”), as a diversified series of Valued Advisers Trust (the “Trust”). The Trust is a management investment company established under the laws of Delaware by an Agreement and Declaration of Trust dated June 13, 2008 (the “Trust Agreement”). The Trust Agreement permits the Board of Trustees (the “Board” or the “Trustees”) to issue an unlimited number of shares of beneficial interest of separate series without par value. Each Fund is one of a series of funds currently authorized by the Trustees. The investment adviser to the Funds is SMI Advisory Services, LLC (the “Adviser”). The SMI Fund seeks to provide long-term capital appreciation. The SMI Dynamic Allocation Fund and SMI Multi-Strategy Fund seek total return. Total return is composed of both income and capital appreciation.
Each of the Funds is a “fund-of-funds” in which each Fund may invest in other investment companies, including exchange-traded and closed-end funds. For a discussion on the strategies employed by each of the Funds, please refer to pages 7-9 of this report.
On February 28, 2022, the SMI 50/40/10 Fund was renamed the SMI Multi-Strategy Fund. At the close of business on April 27, 2018, the SMI Conservative Allocation Fund was renamed the SMI 50/40/10 Fund and acquired all of the assets and assumed all of the liabilities of the previous SMI 50/40/10 Fund (the “Former 50/40/10 Fund”), pursuant to an agreement and plan of reorganization approved by the Board on December 12, 2017. The reorganization qualified as a tax-free reorganization for federal income tax purposes with no gain or loss recognized to the Funds or their shareholders. The SMI 50/40/10 Fund is considered the surviving entity for tax purposes.
Due to the reorganization on April 27, 2018, the number of outstanding shares of the Former 50/40/10 Fund increased by a factor of 1.132099; and since the Former 50/40/10 Fund’s total number of shares outstanding increased, the net asset value decreased. The reorganization did not affect the value of the Former 50/40/10 Fund’s net assets or each shareholder’s proportional ownership interest in those assets. The per share data presented in the Financial Highlights have been adjusted for periods prior to April 27, 2018 as a result.
NOTE 2. SIGNIFICANT ACCOUNTING POLICIES
The Funds are investment companies and follow accounting and reporting guidance under Financial Accounting Standards Board Accounting Standards Codification (“ASC”) Topic 946, “Financial Services-Investment Companies” including Accounting Standards Update 2013-08. The following is a summary of significant accounting policies followed by the Funds in the preparation of their financial statements. These policies are in conformity with generally accepted accounting principles in the United States of America (“GAAP”).
| SMI FUNDS |
| NOTES TO THE FINANCIAL STATEMENTS |
| April 30, 2023 (Unaudited) – (Continued) |
NOTE 2. SIGNIFICANT ACCOUNTING POLICIES – (Continued)
Estimates – The preparation of financial statements in conformity with GAAP requires management to make estimates and assumptions that affect the reported amounts of assets and liabilities and disclosure of contingent assets and liabilities at the date of the financial statements and the reported amounts of increases and decreases in net assets from operations during the reporting period. Actual results could differ from those estimates.
Federal Income Taxes – The Funds make no provision for federal income or excise tax. Each Fund has qualified and intends to qualify each year as a regulated investment company (“RIC”) under subchapter M of the Internal Revenue Code of 1986, as amended, by complying with the requirements applicable to RICs and by distributing substantially all of its taxable income. Each Fund also intends to distribute sufficient net investment income and net capital gains, if any, so that it will not be subject to excise tax on undistributed income and gains. If the required amount of net investment income or gains is not distributed, the Funds could incur a tax expense.
As of and during the six months ended April 30, 2023, the Funds did not have any liabilities for any unrecognized tax benefits. The Funds recognize interest and penalties, if any, related to unrecognized tax benefits as income tax expense on the Statements of Operations when incurred. During the six months ended April 30, 2023, the Funds did not incur any interest or penalties. Management of the Funds has reviewed tax positions taken in tax years that remain subject to examination by all major tax jurisdictions, including federal (i.e., the last three tax year ends and the interim tax period since then, as applicable). Management believes that there is no tax liability resulting from unrecognized tax benefits related to uncertain tax positions taken.
Expenses – Expenses incurred by the Trust that do not relate to the Fund are allocated to the individual funds of the Trust based on each fund’s relative net assets or another appropriate basis (as determined by the Board).
Security Transactions and Related Income – The Funds follow industry practice and record security transactions on the trade date for financial reporting purposes. The specific identification method is used for determining gains or losses for financial statement and income tax purposes. Dividend income and long-term capital gains dividends from investment companies are recorded on the ex-dividend date and interest income is recorded on an accrual basis. Discounts and premiums on securities purchased are accreted or amortized using the effective interest method, if applicable. Withholding taxes on foreign dividends, if any, have been provided for in accordance with the Funds’ understanding of the applicable country’s tax rules and rates.
Dividends and Distributions – Each Fund intends to distribute its net investment income and net realized long-term and short-term capital gains, if any, at least annually. Dividends and distributions to shareholders, which are determined in accordance with income tax regulations, are recorded on the ex-dividend date. The treatment for financial reporting purposes of distributions made to shareholders during the period from net investment income or net realized capital gains may differ from their ultimate treatment for federal income tax purposes. These differences are caused primarily by differences in the timing of the recognition of certain components of income, expense or realized capital gain for federal income tax purposes. Where such differences are permanent in nature, they are reclassified among the components of the net assets based on their ultimate characterization for federal income tax purposes. Any such reclassifications will have no effect on net assets, results of operations or net asset value (“NAV”) per share of the Funds.
| SMI FUNDS |
| NOTES TO THE FINANCIAL STATEMENTS |
| April 30, 2023 (Unaudited) – (Continued) |
NOTE 2. SIGNIFICANT ACCOUNTING POLICIES – (Continued)
Share Valuation – The NAV is calculated each day the New York Stock Exchange (the “NYSE”) is open by dividing the total value of the Fund’s assets, less liabilities, by the number of shares outstanding for the Fund.
NOTE 3. SECURITIES VALUATION AND FAIR VALUE MEASUREMENTS
Each Fund values its portfolio securities at fair value as of the close of regular trading on the NYSE (normally 4:00 p.m. Eastern time) on each business day the NYSE is open for business. Fair value is defined as the price that a Fund would receive upon selling an investment in a timely transaction to an independent buyer in the principal or most advantageous market of the investment. GAAP establishes a three-tier hierarchy to maximize the use of observable market data and minimize the use of unobservable inputs and to establish classification of fair value measurements for disclosure purposes.
Inputs refer broadly to the assumptions that market participants would use in pricing the asset or liability, including assumptions about risk (the risk inherent in a particular valuation technique used to measure fair value including a pricing model and/or the risk inherent in the inputs to the valuation technique). Inputs may be observable or unobservable. Observable inputs are inputs that reflect the assumptions market participants would use in pricing the asset or liability developed based on market data obtained and available from sources independent of the reporting entity. Unobservable inputs are inputs that reflect the reporting entity’s own assumptions about the assumptions market participants would use in pricing the asset or liability developed based on the best information available in the circumstances.
Various inputs are used in determining the value of each Fund’s investments. These inputs are summarized in the three broad levels listed below.
| ● | Level 1 – unadjusted quoted prices in active markets for identical investments and/or registered investment companies where the value per share is determined and published and is the basis for current transactions for identical assets or liabilities at the valuation date |
| ● | Level 2 – other significant observable inputs (including, but not limited to, quoted prices for an identical security in an inactive market, quoted prices for similar securities, interest rates, prepayment speeds, credit risk, etc.) |
| ● | Level 3 – significant unobservable inputs (including the Funds’ own assumptions in determining fair value of investments based on the best information available) |
The inputs used to measure fair value may fall into different levels of the fair value hierarchy. In such cases, for disclosure purposes, the level in the fair value hierarchy which is reported is determined based on the lowest level input that is significant to the fair value measurement in its entirety.
| SMI FUNDS |
| NOTES TO THE FINANCIAL STATEMENTS |
| April 30, 2023 (Unaudited) – (Continued) |
NOTE 3. SECURITIES VALUATION AND FAIR VALUE MEASUREMENTS – (Continued)
Equity securities, including ETFs and closed-end funds, that are traded on any stock exchange are generally valued at the last quoted sale price on the security’s primary exchange. Lacking a last sale price, an exchange-traded security is generally valued at its last bid price. Securities traded in the NASDAQ over-the-counter market are generally valued at the NASDAQ Official Closing Price. When using the market quotations and when the market is considered active, the security is classified as a Level 1 security. In the event that market quotations are not readily available or are considered unreliable due to market or other events, securities are valued in good faith by the Adviser as “valuation designee” under the oversight of the Board. The Adviser has adopted written policies and procedures for valuing securities and other assets in circumstances where market quotes are not readily available. In the event that market quotes are not readily available, and the security or asset cannot be valued pursuant to one of the valuation methods, the value of the security or asset will be determined in good faith by the Adviser pursuant to its policies and procedures. On a quarterly basis, the Adviser’s fair valuation determinations will be reviewed by the Board. Under these policies, the securities will be classified as Level 2 or 3 within the fair value hierarchy, depending on the inputs used.
Investments in mutual funds, including money market mutual funds, are generally priced at the ending NAV. These securities are categorized as Level 1 securities. In the event that the ending NAV for a mutual fund is unavailable at the end of day pricing time, the Adviser may, in accordance with the Trust’s valuation policies, consider all appropriate factors in determining the fair value of the mutual fund. In such cases the security will generally be categorized as a Level 2 security.
The following is a summary of the inputs used to value the Funds’ investments as of April 30, 2023:
| | | Valuation Inputs | |
| SMI Fund | | Level 1 | | | Level 2 | | | Level 3 | | | Total | |
| Exchange-Traded Funds | | $ | 30,871,034 | | | $ | — | | | $ | — | | | $ | 30,871,034 | |
| Mutual Funds | | | 10,217,078 | | | | — | | | | — | | | | 10,217,078 | |
| Money Market Funds | | | 68,466,311 | | | | — | | | | — | | | | 68,466,311 | |
| Total | | $ | 109,554,423 | | | $ | — | | | $ | — | | | $ | 109,554,423 | |
| | | | | | | | | | | | | | | | | |
| | | Valuation Inputs | |
| SMI Dynamic Allocation Fund | | Level 1 | | | Level 2 | | | Level 3 | | | Total | |
| Exchange-Traded Funds | | $ | 58,513,339 | | | $ | — | | | $ | — | | | $ | 58,513,339 | |
| Closed End Funds | | | 23,854,085 | | | | — | | | | — | | | | 23,854,085 | |
| Money Market Funds | | | 621,454 | | | | — | | | | — | | | | 621,454 | |
| Mutual Funds | | | 4,207,821 | | | | — | | | | — | | | | 4,207,821 | |
| Total | | $ | 87,196,699 | | | $ | — | | | $ | — | | | $ | 87,196,699 | |
| SMI FUNDS |
| NOTES TO THE FINANCIAL STATEMENTS |
| April 30, 2023 (Unaudited) – (Continued) |
NOTE 3. SECURITIES VALUATION AND FAIR VALUE MEASUREMENTS – (Continued)
| | | Valuation Inputs | |
| SMI Multi-Strategy Fund | | Level 1 | | | Level 2 | | | Level 3 | | | Total | |
| Exchange-Traded Funds | | $ | 28,835,048 | | | $ | — | | | $ | — | | | $ | 28,835,048 | |
| Closed End Funds | | | 10,358,855 | | | | — | | | | — | | | | 10,358,855 | |
| Mutual Funds | | | 3,666,741 | | | | — | | | | — | | | | 3,666,741 | |
| Money Market Funds | | | 12,907,828 | | | | — | | | | — | | | | 12,907,828 | |
| Total | | $ | 55,768,472 | | | $ | — | | | $ | — | | | $ | 55,768,472 | |
The Funds did not hold any investments at the end of the reporting period in which significant unobservable inputs (Level 3) were used in determining fair value; therefore, no reconciliation of Level 3 securities is included for this reporting period.
NOTE 4. FEES AND OTHER TRANSACTIONS WITH AFFILIATES
Under the terms of the investment advisory agreement with respect to each Fund (the “Advisory Agreements”), the Adviser is responsible for managing each Fund’s investments. As compensation for its management services, each Fund is obligated to pay the Adviser a fee based on the Fund’s average daily net assets as follows:
| | | | | | | SMI |
| | | | | SMI Dynamic | | Multi-Strategy |
| | | SMI Fund | | Allocation Fund | | Fund |
| Fund Assets | | Management Fee | | Management Fee | | Management Fee |
| $1 – $100 million | | 1.00% | | 1.00% | | 0.90% |
| $100,000,001 – $250 million | | 1.00% | | 1.00% | | 0.80% |
| $250,000,001 to $500 million | | 0.90% | | 0.90% | | 0.70% |
| Over $500 million | | 0.80% | | 0.80% | | 0.60% |
The Adviser contractually has agreed to waive its management fee and/or reimburse certain operating expenses, but only to the extent necessary so that each Fund’s total annual operating expenses (excluding interest, taxes, brokerage commissions, other expenses which are capitalized in accordance with GAAP, extraordinary expenses, dividend expense on short sales, 12b-1 fees, and acquired fund fees and expenses) do not exceed 1.45% of the Fund’s average daily net assets with respect to the SMI Fund, 1.45% with respect to the SMI Dynamic Allocation Fund, and 1.30% with respect to the SMI Multi-Strategy Fund. Prior to March 1, 2023, the expense cap for the SMI Fund and the SMI Multi-Strategy Fund was 1.50% and 1.15%, respectively. The contractual arrangement for each Fund is in place through February 29, 2024.
| SMI FUNDS |
| NOTES TO THE FINANCIAL STATEMENTS |
| April 30, 2023 (Unaudited) – (Continued) |
NOTE 4. FEES AND OTHER TRANSACTIONS WITH AFFILIATES – (Continued)
Each fee waiver or expense reimbursement by the Adviser is subject to repayment by the applicable Fund within the three years following the date in which the fee waiver or expense reimbursement occurred, provided that the Fund is able to make the repayment without exceeding the expense limitation in effect at the time of the fee waiver or expense reimbursement and the expense limitation at the time of the repayment.
As of April 30, 2023, the Adviser may seek repayment of investment advisory fee waivers and expense reimbursements from the SMI Multi-Strategy Fund as follows:
| Recoverable through | | Amount | |
| October 31, 2023 | | $ | 5,816 | |
| October 31, 2025 | | | 21,003 | |
| April 30, 2026 | | | 6,245 | |
The Trust retains Ultimus Fund Solutions, LLC (“Ultimus” or “Administrator”), to provide the Funds with administration, fund accounting, and transfer agent services, including all regulatory reporting. Expenses incurred by the Funds for these services are allocated to the individual Funds based on each Fund’s relative net assets.
Northern Lights Compliance Services, LLC (“NLCS”), an affiliate of Ultimus, provides a Chief Compliance Officer and an Anti-Money Laundering Compliance Officer to the Trust, as well as related compliance services, pursuant to a consulting agreement between NLCS and the Trust. Under the terms of such agreement, NLCS receives fees from the Funds.
The officers and one trustee of the Trust are members of management and/or employees of the Administrator or of NLCS and are not paid by the Trust for services to the Funds. Ultimus Fund Distributors, LLC (the “Distributor”), a wholly-owned subsidiary of Ultimus, acts as the distributor of the Funds’ shares. There were no payments made to the Distributor by the Funds for the six months ended April 30, 2023.
NOTE 5. PURCHASES AND SALES OF SECURITIES
For the six months ended April 30, 2023, purchases and sales of investment securities, other than short-term investments, were as follows:
| | | | | | | | | SMI | |
| | | | | | SMI Dynamic | | | Multi-Strategy | |
| | | SMI Fund | | | Allocation Fund | | | Fund | |
| Purchases | | $ | 40,530,432 | | | $ | 89,535,417 | | | $ | 40,849,104 | |
| Sales | | $ | 40,349,876 | | | $ | 60,500,494 | | | $ | 31,955,743 | |
| SMI FUNDS |
| NOTES TO THE FINANCIAL STATEMENTS |
| April 30, 2023 (Unaudited) – (Continued) |
NOTE 5. PURCHASES AND SALES OF SECURITIES – (Continued)
There were no purchases or sales of long-term U.S. government obligations during the six months ended April 30, 2023.
NOTE 6. LINE OF CREDIT
During the six months ended April 30, 2023, the Trust, on behalf of the Funds, entered into a short-term credit agreement (“Line of Credit”) with Huntington National Bank (“Huntington”), expiring on January 19, 2024. Under the terms of the agreement, each of the Funds may borrow up to the lesser of 10% of a Fund’s daily market value or $5 million at an interest rate equal to the Secured Overnight Financing Rate (“SOFR”) plus 161.50 basis points (if SOFR is less than 0.385%, such rate shall be deemed to be 0.385%), 6.56% as of April 30, 2023. The purpose of the agreement is to meet temporary or emergency cash needs, including redemption requests that might otherwise require the untimely disposition of securities. Huntington receives an annual facility fee of 0.125% on $5 million as well as an additional annual fee of 0.125% on any unused portion of the credit facility, invoiced quarterly, for providing the Line of Credit. The Funds will not borrow money, except (a) from a bank, provided that immediately after such borrowing there is an asset coverage of 300% for all borrowings of a Fund; or (b) from a bank or other persons for temporary purposes only, provided that such temporary borrowings are in an amount not exceeding 5% of a Fund’s total assets at the time when the borrowing is made. To the extent that the line of credit is utilized, it will be collateralized by securities in the Funds’ portfolios.
As of April 30, 2023, the Funds had no outstanding borrowings under this Line of Credit.
| | | | | | | Weighted | | | | | | | | | | |
| | | | Average | | | Average | | | | | | Interest | | | Maximum | |
| | | | Daily Loan | | | Interest | | | Number of Days | | | Expense | | | Loan | |
| Fund | | | Balance(a) | | | Rate(a) | | | Outstanding(b) | | | Accrued | | | Outstanding | |
| SMI Dynamic Allocation Fund | | | $ | 305,558 | | | 6.26% | | | 9 | | | $ | 478 | | | $ | 500,000 | |
| | | | | | | | | | | | | | | | | | | | | |
| (a) | Averages based on the number of days outstanding. |
| (b) | Number of Days Outstanding represents the total days during the six months ended April 30, 2023, that a Fund utilized the Line of Credit. |
| SMI FUNDS |
| NOTES TO THE FINANCIAL STATEMENTS |
| April 30, 2023 (Unaudited) – (Continued) |
NOTE 7. FEDERAL TAX INFORMATION
At April 30, 2023, the net unrealized appreciation (depreciation) and tax cost of investments for tax purposes was as follows:
| | | | | | | | | SMI | |
| | | | | | SMI Dynamic | | | Multi-Strategy | |
| | | SMI Fund | | | Allocation Fund | | | Fund | |
| Gross unrealized appreciation | | $ | 1,588,241 | | | $ | 4,157,642 | | | $ | 1,779,469 | |
| Gross unrealized depreciation | | | (23,058 | ) | | | (104,627 | ) | | | (63,203 | ) |
| Net unrealized appreciation/(depreciation) on investments | | $ | 1,565,183 | | | $ | 4,053,015 | | | $ | 1,716,266 | |
| Tax cost of investments | | $ | 107,989,240 | | | $ | 83,143,684 | | | $ | 54,052,206 | |
The tax character of distributions for the fiscal year ended October 31, 2022, the Funds’ most recent fiscal year end, were as follows:
| | | | | | | | | SMI | |
| | | | | | SMI Dynamic | | | Multi-Strategy | |
| | | SMI Fund | | | Allocation Fund | | | Fund | |
| Distributions paid from: | | | | | | | | | | | | |
| Ordinary income(a) | | $ | 27,151,153 | | | $ | 5,887,026 | | | $ | 6,876,889 | |
| Long-term capital gains | | | 19,416,250 | | | | 2,873,365 | | | | 3,904,896 | |
| Total distributions paid | | $ | 46,567,403 | | | $ | 8,760,391 | | | $ | 10,781,785 | |
| (a) | For federal income tax purposes, distributions of short-term capital gains are treated as ordinary income distributions. |
At October 31, 2022, the components of distributable earnings (accumulated losses) on a tax basis were as follows:
| | | | | | | | | SMI | |
| | | | | | SMI Dynamic | | | Multi-Strategy | |
| | | SMI Fund | | | Allocation Fund | | | Fund | |
| Undistributed ordinary income | | $ | 1,084,984 | | | $ | — | | | $ | — | |
| Undistributed long-term capital gains | | | — | | | | — | | | | — | |
| Accumulated capital and other losses | | | (12,555,377 | ) | | | (1,027,596 | ) | | | (2,824,987 | ) |
| Unrealized appreciation (depreciation) on investments | | | 166,614 | | | | (3,847,501 | ) | | | (156,528 | ) |
| Total accumulated deficits | | $ | (11,303,779 | ) | | $ | (4,875,097 | ) | | $ | (2,981,515 | ) |
| SMI FUNDS |
| NOTES TO THE FINANCIAL STATEMENTS |
| April 30, 2023 (Unaudited) – (Continued) |
NOTE 7. FEDERAL TAX INFORMATION – (Continued)
At October 31, 2022, the difference between book basis and tax basis unrealized appreciation (depreciation) is attributable to the tax deferral of losses on wash sales.
At October 31, 2022, the following Funds had net capital loss carryforwards which are available to offset future net capital gains, if any:
| | | SMI Fund | | | SMI Dynamic Allocation Fund | |
| | | Short-Term | | | Long-Term | | | Short-Term | | | Long-Term | |
| Non-Expiring | | $ | 12,555,377 | | | $ | — | | | $ | 729,602 | | | $ | — | |
| | | | | | | | | | | | | | | | | |
| | | SMI Multi-Strategy Fund | |
| | | Short-Term | | | Long-Term | |
| Non-Expiring | | | $ | 2,824,987 | | | $ | — | |
Certain qualified late year ordinary losses incurred after December 31, and within the current taxable year, are deemed to arise on the first business day of the Fund’s following taxable year. For the tax year ended October 31, 2022, the SMI Dynamic Allocation Fund Qualified Late Year Ordinary Losses in the amount of $297,994.
NOTE 8. INVESTMENT IN OTHER INVESTMENT COMPANIES
Each Fund may invest a significant portion of its assets in shares of one or more investment companies, including ETFs, open-end and closed-end mutual funds and money market mutual funds. Each Fund will incur additional indirect expenses (acquired fund fees and expenses) to the extent it invests in shares of other investment companies. As of April 30, 2023, the SMI Fund had 28.14% and 9.31% of the value of its net assets invested in ETFs and open-end mutual funds, respectively. As of April 30, 2023, the SMI Dynamic Allocation Fund had 67.20%, 27.40% and 4.83% of the value of its net assets invested in ETFs, closed end funds and mutual funds, respectively. As of April 30, 2023, the SMI Multi-Strategy Fund had 51.70%, 18.58% and 6.58% of the value of its net assets invested in ETFs, closed end funds and mutual funds, respectively. The financial statements of these ETFs and open-end and closed-end mutual funds can be found at www.sec.gov.
| SMI FUNDS |
| NOTES TO THE FINANCIAL STATEMENTS |
| April 30, 2023 (Unaudited) – (Continued) |
NOTE 9. COMMITMENTS AND CONTINGENCIES
Under the Trust’s organizational documents, its Officers and Trustees are indemnified against certain liabilities arising out of the performance of their duties to the Funds. In addition, in the normal course of business, the Trust enters into contracts with its service providers, on behalf of the Funds, and others that provide for general indemnifications. The Funds’ maximum exposure under these arrangements is unknown, as this would involve future claims that may be made against the Funds. The Funds expect the risk of loss to be remote, however, there can be no assurance that such obligations will not result in material liabilities that adversely affect the Funds.
NOTE 10. SUBSEQUENT EVENTS
Management of the Funds has evaluated the need for disclosures and/or adjustments resulting from subsequent events through the date at which these financial statements were issued. Based upon this evaluation, management has determined there were no items requiring adjustment of the financial statements or additional disclosure.
| SUMMARY OF FUND EXPENSES – (Unaudited) |
As a shareholder of a Fund, you incur two types of costs: (1) transaction costs and (2) ongoing costs, including management fees and other Fund expenses. These examples are intended to help you understand your ongoing costs (in dollars) of investing in each Fund and to compare these costs with the ongoing costs of investing in other funds. Each Fund’s example is based on an investment of $1,000 invested at the beginning of the period and held for the entire period from November 1, 2022 through April 30, 2023.
Actual Expenses
The first line of the table below provides information about actual account values and actual expenses. You may use the information in this line, together with the amount you invested, to estimate the expenses that you paid over the period. Simply divide your account value by $1,000 (for example, an $8,600 account value divided by $1,000 = 8.6), then multiply the result by the number in the first line under the heading “Expenses Paid During Period” to estimate the expenses you paid on your account during this period.
Hypothetical Example for Comparison Purposes
The second line of the table below provides information about hypothetical account values and hypothetical expenses based on each Fund’s actual expense ratio and an assumed rate of return of 5% per year before expenses, which is not the Fund’s actual return. The hypothetical account values and expenses may not be used to estimate the actual ending account balance or expenses you paid for the period. You may use this information to compare the ongoing costs of investing in the Funds and other funds. To do so, compare this 5% hypothetical example with the 5% hypothetical examples that appear in the shareholder reports of other funds.
Expenses shown in the table are meant to highlight your ongoing costs only and do not reflect any transactional costs. Therefore, the second line of the table below is useful in comparing ongoing costs only and will not help you determine the relative total costs of owning different funds. In addition, if transaction costs were included, your costs would have been higher.
| SUMMARY OF FUND EXPENSES – (Unaudited), (Continued) |
| | | | Beginning | | Ending | | | | | |
| | | | Account Value | | Account Value | | Expenses Paid | | Annualized | |
| | | | November 1, 2022 | | April 30, 2023 | | During Period(a) | | Expense Ratio | |
| | SMI FUND | | | | | | | | | |
| | Actual | | $1,000.00 | | $1,023.10 | | $6.04 | | 1.20% | |
| | Hypothetical(b) | | $1,000.00 | | $1,018.82 | | $6.03 | | 1.20% | |
| | | | | | | | | | | |
| | SMI DYNAMIC ALLOCATION FUND | | | | | | | | | |
| | Actual | | $1,000.00 | | $1,099.20 | | $6.31 | | 1.21% | |
| | Hypothetical(b) | | $1,000.00 | | $1,018.78 | | $6.07 | | 1.21% | |
| | | | | | | | | | | |
| | SMI MULTI-STRATEGY FUND | | | | | | | | | |
| | Actual | | $1,000.00 | | $1,049.30 | | $5.97 | | 1.17% | |
| | Hypothetical(b) | | $1,000.00 | | $1,018.97 | | $5.88 | | 1.17% | |
| (a) | Expenses are equal to the Fund’s annualized expense ratios, multiplied by the average account value over the period, multiplied by 181/365 (to reflect the one-half year period). |
| (b) | Hypothetical assumes 5% annual return before expenses. |
| INVESTMENT ADVISORY AGREEMENT APPROVAL |
| (Unaudited) |
At a meeting held on December 20-21, 2022, the Board of Trustees (the “Board”) considered the renewal of the Investment Advisory Agreements (the “SMI Agreements”) between Valued Advisers Trust (the “Trust”) and SMI Advisory Services, LLC (“SMI”) with respect to the Sound Mind Investing Fund, the SMI Dynamic Allocation Fund, and the SMI Multi-Strategy Fund (the “SMI Funds”). SMI provided written information to the Board to assist the Board in its considerations.
Counsel reminded the Trustees of their fiduciary duties and responsibilities as summarized in a memorandum from his firm, including the factors to be considered, and the application of those factors to SMI and the SMI Agreements. In assessing the factors and reaching its decision, the Board took into consideration information furnished by SMI and the Trust’s other service providers for the Board’s review and consideration throughout the year at regular Board meetings, as well as information specifically prepared or presented in connection with the annual renewal process, including information presented at the meeting. The Board requested and was provided with, and reflected on, information and reports relevant to the annual renewal of the SMI Agreements, including: (i) reports regarding the services and support provided to the SMI Funds by SMI; (ii) quarterly assessments of the investment performance of the SMI Funds by personnel of SMI; (iii) commentary on the reasons for the SMI Funds’ performance; (iv) presentations by SMI addressing its investment philosophy, investment strategy, personnel, and operations; (v) compliance and audit reports concerning the SMI Funds and SMI; (vi) disclosure information contained in the Trust’s registration statement and SMI’s Form ADV; and (vii) a memorandum from counsel, that summarized the fiduciary duties and responsibilities of the Board in considering and approving the SMI Agreements. The Board also requested and received various informational materials including, without limitation: (a) documents containing information about SMI, including its financial information, a description of its personnel and the services it provides to the SMI Funds; information on SMI’s investment advice and performance; summaries of the SMI Funds’ expenses, compliance program, current legal matters, and other general information; (b) comparative expense and performance information for other mutual funds with strategies similar to the SMI Funds; and (c) the benefits to be realized by SMI from its relationship with the SMI Funds. The Board did not identify any particular information that was most relevant to its consideration of the SMI Agreements and each Trustee may have afforded different weight to the various factors.
| 1. | The nature, extent, and quality of the services to be provided by SMI. In this regard, the Board considered SMI’s responsibilities under the SMI Agreements. The Trustees considered the services being provided by SMI to the SMI Funds, including, without limitation: the quality of its investment advisory services (including research and recommendations with respect to portfolio securities), its process for formulating investment recommendations and assuring compliance with the investment objectives and limitations, its coordination of services for the SMI Funds among the service providers to the SMI Funds and its efforts to promote the SMI Funds and grow their assets. The Trustees considered SMI’s continuity of, and commitment to retain, qualified personnel and SMI’s commitment to maintain and enhance its resources and systems. The Trustees considered SMI’s personnel, including the education and experience of SMI’s personnel. After considering the foregoing information and further information in the Meeting materials provided by SMI (including SMI’s Form ADV), the Board concluded that, in light of all the facts and circumstances, the nature, extent, and quality of the services provided by SMI were satisfactory and adequate for the SMI Funds. |
| INVESTMENT ADVISORY AGREEMENT APPROVAL |
| (Unaudited), (Continued) |
| 2. | Investment Performance of the SMI Funds and SMI. In considering the investment performance of the SMI Funds and SMI, the Trustees compared the performance of the SMI Funds with the performance of funds in the same Morningstar category, as well as with peer group data. They also compared the performance of the SMI Funds to the performance of composites of separately managed accounts (“SMAs”) utilizing the same strategies utilized by the SMI Funds. The Trustees also considered the consistency of SMI’s management of the SMI Funds with each of the SMI Fund’s investment objective, strategies, and limitations. The Trustees noted that the performance of each of the various SMA strategies varied as compared to the performance of the applicable SMI Fund(s) using those strategies. They considered the explanations provided by SMI regarding the reasons for differences in performance, and determined them to be reasonable. The Trustees noted and gave significant consideration to SMI’s view that the “upgrading” strategy utilized by the Sound Mind Investing Fund did not allow it to be appropriately compared to any particular peer category, although data for the Morningstar category was reviewed and considered. The Trustees observed that for the one year, three year, five year, and ten year periods ended September 30, 2022, the Sound Mind Investing Fund performed above its category average and median. For the period since inception of the Fund, they noted that the Fund outperformed the category median. With respect to its peer group, the Trustees noted that the Sound Mind Investing Fund outperformed the median for the one year, three year, five year, and since inception periods ended September 30, 2022. They also noted that the Sound Mind Investing Fund outperformed its benchmark for the one year period, but performed below the benchmark for the three year, five year, and since inception periods. With respect to the SMI Dynamic Allocation Fund, the Trustees noted that the fund performed below the category average and median for the one year, three year, and five year periods ended September 30, 2022, and below the category median for the period since inception. They also noted that the SMI Dynamic Allocation Fund underperformed as compared to its peer group median for the one year, three year, five year, and since inception periods. They also observed that the SMI Dynamic Allocation Fund underperformed as compared to its fixed income benchmark for the one year period ended September 30, 2022, but outperformed for the three year, five year, and since inception periods. With respect to its equity benchmark, the Trustees noted that the Fund outperformed for the one year period, but underperformed for the three year, five year, and since inception periods. The Trustees observed that the SMI Multi-Strategy Fund performed above its category average and median for the one year, three year, and five year periods ended September 30, 2022. For the since inception period, the Trustees noted that the SMI Multi-Strategy Fund performed below its category median. As compared to its peer group, the Trustees noted that the SMI Multi-Strategy Fund outperformed the median for the one year and three year periods ended September 30, 2022, and underperformed for the five year and since inception periods. They also observed that the SMI Multi-Strategy Fund outperformed as compared to its fixed income benchmark for the one year, three year, five year, and since inception periods. With respect to its equity benchmark, the Trustees observed that the Fund outperformed for the one year period, and underperformed for the three year, five year, and since inception periods. After reviewing and discussing the investment performance of the SMI Funds further, SMI’s experience managing the SMI Funds, and other relevant factors, the Board concluded, in light of all the facts and circumstances, that the investment performance of the SMI Funds was acceptable. |
| INVESTMENT ADVISORY AGREEMENT APPROVAL |
| (Unaudited), (Continued) |
| 3. | The costs of the services to be provided and profits to be realized by SMI from the relationship with the SMI Funds. In considering the costs of services to be provided and the profits to be realized by SMI from the relationship with the SMI Funds, the Trustees considered: (1) SMI’s financial condition; (2) the asset levels of the SMI Funds; (3) the overall expenses of the SMI Funds; and (4) the nature and frequency of advisory fee payments. The Trustees reviewed information provided by SMI regarding its profits associated with managing the SMI Funds. The Trustees also considered potential benefits for SMI in managing the SMI Funds. The Trustees then compared the fees and expenses of the SMI Funds (including the management fee) to other comparable mutual funds, including each of the SMI Fund’s Morningstar category averages, and each of the SMI Fund’s peer group averages. The Trustees noted that the Sound Mind Investing Fund’s management fee and net expense ratio were higher than the category average and median. They also noted that the management and net expense ratio were equal to the median of the Sound Mind Investment Fund’s peer group and were below the average of its peer group. With respect to the SMI Dynamic Allocation Fund, the Trustees observed that the management fee and net expense ratio were higher than the category average and median. They also noted that the SMI Dynamic Allocation Fund’s management fee was higher than the median and average of its peer group, while its net expense ratio was higher than the average and equal to the median of its peer group. With respect to the SMI Multi-Strategy Fund, the Trustees noted that both the management fee and net expense ratio were higher than the category average and median. They noted that both the management fee and net expense ratio were also higher than the peer group average and median. In light of the unique services rendered to the SMI Funds by SMI, the profits realized by SMI in managing the SMI Funds, and all other facts and circumstances they deemed relevant, the Trustees concluded that the management fees paid by the SMI Funds were fair and reasonable in relation to the nature and quality of the services provided by SMI. |
| 4. | The extent to which economies of scale would be realized as the SMI Funds grow and whether advisory fee levels reflect these economies of scale for the benefit of the SMI Funds’ investors. In this regard, the Trustees considered the fee arrangements with SMI for the SMI Funds. The Trustees considered that the management fee for each of the SMI Funds has breakpoints that would allow shareholders to realize economies of scale as assets grow. The Trustees noted that none of the SMI Funds were currently at an asset level to take advantage of the breakpoints; however, the Board also noted the expense limitation arrangements in place with respect to each of the SMI Funds, and that each SMI Fund’s shareholders had experienced benefits from those arrangements. In light of its ongoing consideration of the asset levels of each of the SMI Funds, expectations for growth, and fee levels, the Board determined that the fee arrangements for each of the SMI Funds, in light of all the facts and circumstances, were fair and reasonable in relation to the nature and quality of the services provided by SMI. |
| 5. | Possible conflicts of interest and benefits to SMI. In considering SMI’s practices regarding conflicts of interest, the Trustees evaluated the potential for conflicts of interest and considered such matters as the experience and ability of the advisory personnel assigned to the SMI Funds; the basis of decisions to buy or sell securities for the SMI Funds; and the substance and administration of SMI’s code of ethics. The Trustees also considered disclosure in the registration statement of the Trust relating to SMI’s potential conflicts of interest. The Board noted that SMI has a separately managed account (“SMA”) product, and that if an SMI Fund is owned within an SMA, the SMA will not charge a management fee for those assets |
| INVESTMENT ADVISORY AGREEMENT APPROVAL |
| (Unaudited), (Continued) |
invested in an SMI Fund. The Board also noted that SMI does not engage in soft dollar arrangements and has not identified any indirect benefits from its relationship with the SMI Funds. Based on the foregoing, the Board determined that SMI’s standards and practices relating to the identification and mitigation of potential conflicts of interest were satisfactory.
After additional consideration of the factors delineated in the memorandum provided by counsel and further discussion among the Board members, the Board determined to approve the continuation of the SMI Agreements between the Trust and SMI.
| FACTS | WHAT DO THE SMI FUNDS DO WITH YOUR PERSONAL INFORMATION? |
| |
| Why? | Financial companies choose how they share your personal information. Federal law gives consumers the right to limit some but not all sharing. Federal law also requires us to tell you how we collect, share, and protect your personal information. Please read this notice carefully to understand what we do. |
| |
| What? | The types of personal information we collect and share depend on the product or service you have with us. This information can include: ● Social Security number ● account balances and account transactions ● transaction or loss history and purchase history ● checking account information and wire transfer instructions |
| | When you are no longer our customer, we continue to share your information as described in this notice. |
| | |
| How? | All financial companies need to share customers’ personal information to run their everyday business. In the section below, we list the reasons financial companies can share their customers’ personal information; the reasons SMI Funds choose to share; and whether you can limit this sharing. |
| Reasons we can share your personal information | Do SMI Funds
share? |
For our everyday business purposes— such as to process your transactions, maintain your account(s), respond to court orders and legal investigations, or report to credit bureaus | Yes |
For our marketing purposes— to offer our products and services to you | No |
| For joint marketing with other financial companies | No |
For our affiliates’ everyday business purposes— information about your transactions and experiences | No |
For our affiliates’ everyday business purposes— information about your creditworthiness | No |
| For nonaffiliates to market to you | No |
| Questions? | Call (877) 764-3863 |
| Who we are |
| Who is providing this notice? | SMI Funds
Ultimus Fund Distributors, LLC (Distributor)
Ultimus Fund Solutions, LLC (Administrator) |
| |
| What we do |
| How do SMI Funds protect my personal information? | To protect your personal information from unauthorized access and use, we use security measures that comply with federal law. These measures include computer safeguards and secured files and buildings. Our service providers are held accountable for adhering to strict policies and procedures to prevent any misuse of your nonpublic personal information. |
| How do SMI Funds collect my personal information? | We collect your personal information, for example, when you ● open an account or deposit money ● buy securities from us or sell securities to us ● make deposits or withdrawals from your account or provide account information ● give us your account information ● make a wire transfer ● tell us who receives the money ● tell us where to send the money ● show your government-issued ID ● show your driver’s license |
| Why can’t I limit all sharing? | Federal law gives you the right to limit only ● sharing for affiliates’ everyday business purposes—information about your creditworthiness ● affiliates from using your information to market to you ● sharing for nonaffiliates to market to you State laws and individual companies may give you additional rights to limit sharing. |
| Definitions |
| Affiliates | Companies related by common ownership or control. They can be financial and nonfinancial companies. ● SMI Advisory Services, LLC, the investment adviser to the Fund, could be deemed to be an affiliate. |
| Nonaffiliates | Companies not related by common ownership or control. They can be financial and nonfinancial companies. ● The SMI Funds do not share your personal information with nonaffiliates so they can market to you. |
| Joint marketing | A formal agreement between nonaffiliated financial companies that together market financial products or services to you. ● The SMI Funds do not jointly market. |
PROXY VOTING
A description of the policies and procedures that each Fund uses to determine how to vote proxies relating to portfolio securities and information regarding how each Fund voted those proxies during the most recent twelve month period ended June 30, are available (1) without charge upon request by calling the Funds at (877) 764-3863 and (2) in Fund documents filed with the SEC on the SEC’s website at www.sec.gov.
TRUSTEES Andrea N. Mullins, Chairperson Ira P. Cohen
Mark J. Seger OFFICERS Matthew J. Miller, Principal Executive Officer and President
Zachary P. Richmond, Principal Financial
Officer and Treasurer N. Lynn Bowley, Chief Compliance Officer
Carol J. Highsmith, Vice President and Secretary INVESTMENT ADVISER SMI Advisory Services, LLC
4400 Ray Boll Blvd.
Columbus, IN 47203 DISTRIBUTOR Ultimus Fund Distributors, LLC
225 Pictoria Drive, Suite 450
Cincinnati, OH 45246 | INDEPENDENT REGISTERED PUBLIC ACCOUNTING FIRM Cohen & Company, Ltd.
1350 Euclid Avenue, Suite 800
Cleveland, OH 44115 LEGAL COUNSEL Troutman Pepper Hamilton Sanders LLP
3000 Two Logan Square
18th and Arch Streets Philadelphia, PA 19103 CUSTODIAN Huntington National Bank
41 South High Street
Columbus, OH 43215 ADMINISTRATOR, TRANSFER AGENT AND FUND ACCOUNTANT Ultimus Fund Solutions, LLC 225 Pictoria Drive, Suite 450 Cincinnati, OH 45246 |
| | |
This report is intended only for the information of shareholders or those who have received the Funds’ prospectus which contains information about each Fund’s management fee and expenses. Please read the prospectus carefully before investing.
Distributed by Ultimus Fund Distributors, LLC, Member FINRA/SIPC
THIS PAGE INTENTIONALLY LEFT BLANK
THIS PAGE INTENTIONALLY LEFT BLANK
THIS PAGE INTENTIONALLY LEFT BLANK
| | |
| |  |
| | |
| | |
| | |
| | SOUND MIND |
| | INVESTING FUND |
| | (SMIFX) |
| | |
| | SMI DYNAMIC |
| | ALLOCATION FUND |
| | (SMIDX) |
| | |
| | SMI MULTI-STRATEGY |
| | FUND |
| | (SMILX) |
| | |
| | |
| | SEMI-ANNUAL |
| | REPORT |
| | April 30, 2023 |
| | |
| | |
| | Funds’ Adviser: |
| | SMI Advisory Services, LLC |
| | 4400 Ray Boll Blvd. |
| | Columbus, IN 47203 |
| | |
| | (877) 764-3863 |
| | (877) SMI-FUND |
| | www.smifund.com |
| SMI-SAR-23 | |
(b) Not applicable
Item 2. Code of Ethics. Not applicable – disclosed with annual report
Item 3. Audit Committee Financial Expert. Not applicable – disclosed with annual report
Item 4. Principal Accountant Fees and Services. Not applicable – disclosed with annual report
Item 5. Audit Committee of Listed Companies. Not applicable – applies to listed companies only
Item 6. Schedule of Investments. Schedules filed with Item 1.
Item 7. Disclosure of Proxy Voting Policies and Procedures for Closed-End Management Investment Companies. Not applicable – applies to closed-end funds only
Item 8. Portfolio Managers of Closed-End Investment Companies. Not applicable – applies to closed-end funds only
Item 9. Purchases of Equity Securities by Closed-End Management Investment Company and Affiliated Purchasers. Not applicable – applies to closed-end funds only
Item 10. Submission of Matters to a Vote of Security Holders.
The guidelines applicable to shareholders desiring to submit recommendations for nominees to the Registrant's board of trustees are contained in the statement of additional information of the Trust with respect to the Fund(s) for which this Form N-CSR is being filed.
Item 11. Controls and Procedures.
(a) Based on their evaluation of the registrant’s disclosure controls and procedures (as defined in Rule 30a-3(c) under the Investment Company Act of 1940, as amended (the “Act”)) as of a date within 90 days of the filing date of this report, the registrant’s principal executive officer and principal financial officer have concluded that such disclosure controls and procedures are reasonably designed and are operating effectively to ensure that material information relating to the registrant is made known to them by others within those entities, particularly during the period in which this report is being prepared, and that the information required in filings on Form N-CSR is recorded, processed, summarized, and reported on a timely basis.
(b) There were no changes in the registrant’s internal control over financial reporting (as defined in Rule 30a-3(d) under the Investment Company Act of 1940) that occurred during the period covered by this report that have materially affected, or are reasonably likely to materially affect, the registrant’s internal control over financial reporting.
Item 12. Disclosure of Securities Lending Activities for Closed-End Management Investment Companies. Not applicable – applies to closed-end funds only
Item 13. Exhibits.
(a) (1) Not applicable – disclosed with annual report
(3) Not Applicable
Pursuant to the requirements of the Securities Exchange Act of 1934 and the Investment Company Act of 1940, the registrant has duly caused this report to be signed on its behalf by the undersigned, thereunto duly authorized.
(Registrant) Valued Advisers Trust
By /s/ Matthew J. Miller
Matthew J. Miller, President and Principal Executive Officer
Date 6/30/2023
Pursuant to the requirements of the Securities Exchange Act of 1934 and the Investment Company Act of 1940, this report has been signed below by the following persons on behalf of the registrant and in the capacities and on the dates indicated.
By /s/ Matthew J. Miller
Matthew J. Miller, President and Principal Executive Officer
Date 6/30/2023
By /s/ Zachary P. Richmond
Zachary P. Richmond, Treasurer and Principal Financial Officer
Date 6/30/2023