united states
securities and exchange commission
washington, d.c. 20549
form n-csr
certified shareholder report of registered management
investment companies
Investment Company Act file number 811-22208
Valued Advisers Trust
(Exact name of registrant as specified in charter)
Ultimus Fund Solutions, LLC 225 Pictoria Drive, Suite 450 Cincinnati, OH 45246
(Address of principal executive offices) (Zip code)
Ultimus Fund Solutions, LLC
Attn: Zachary P. Richmond
225 Pictoria Drive, Suite 450
Cincinnati, OH 45246
(Name and address of agent for service)
Registrant's telephone number, including area code: 513-587-3400
Date of fiscal year end: 1/31
Date of reporting period: 1/31/2024
Item 1. Reports to Stockholders.
| |
| |
| |
| |
| |
| |
| |
| |
| |
| |
 |
| |
| |
| |
| |
| |
| Belmont Theta Income Fund |
| |
| |
| |
| |
| |
| Annual Report |
| |
| January 31, 2024 |
| |
| |
| |
| |
| |
| |
| |
| |
| |
| |
| Fund Adviser: |
Belmont Capital, LLC d/b/a Belmont Capital GroupTM
1875 Century Park East, Suite 1780
Los Angeles, CA 90067 |
| |
| |
| |
| |
| |
| |
| |
| |
| |
| |
| Belmont Theta Income Fund |
| Management’s Discussion of Fund Performance (Unaudited) |
| January 31, 2024 |
| |
Dear Shareholders:
Overview:
The Belmont Theta Income Fund (the “Fund”) was launched on April 30, 2018, with the goal of offering our income generating Theta Overlay Program options strategy in a mutual fund format. The Fund’s investment objective transitioned in early 2023 to replicate our Hedged Put Write Strategy collateralized by US Treasury Bills. The objective of the Fund’s HPW strategy is to provide long-term growth of capital and income generation.
Performance Results:
For the fiscal year ended January 31, 2024, Belmont Theta Income Fund Institutional Class returned 12.72% at net asset value. The Fund’s primary benchmark, the S&P 500® Total Return Index, returned 20.82% for the same period.
Explanation of Fund Performance:
The Fund seeks to generate returns through interest income received from Government short-term fixed income securities and net realized option premium income. The Fund purchases US Treasury Bills as collateral for the Hedged Put Write strategy. The options portion of the strategy utilizes the collateral to write multiple structures of out of the money put spreads on the S&P 500® Index. The Fund seeks to capitalize on time decay and the volatility risk premium (VRP) typically imbedded in option pricing to fully realize the net option premium collected. Additionally, a percentage of the net option premium collected is used to purchase out of the money Cboe Volatility Index (“VIX”) calls, which may help the Fund’s overall performance when implied volatility in S&P 500® Index option pricing sharply increases to extreme levels.
The Fund will generally perform positively when the price of the S&P 500® Index trades in a range-bound pattern throughout the duration of the option structures written. In periods where the S&P 500® Index has more significant moves in price, the Fund would expect to outperform its benchmark to the downside and conversely lag it to the upside. During periods of extreme price decline in the S&P 500® Index, the Fund potentially may meaningfully outperform its benchmark.
The broader equity indices in the United States including the S&P 500® Index had higher than average historical returns for the 2023 calendar year, while implied volatility in option pricing steadily decreased throughout the year. These were the primary factors in the Fund’s relative underperformance to its benchmark. The strategy prefers more range
| Belmont Theta Income Fund |
| Management’s Discussion of Fund Performance (Unaudited) (continued) |
| January 31, 2024 |
| |
bound price movement in the S&P 500® Index and higher implied volatility in option pricing for greater net option premiums collected.
The fixed income portion of the Fund’s strategy provided a stable, consistent return stream for the Fund as the Federal Funds Rate inched higher to its peak of the recent cycle. The Fund’s strategy of laddering 12-month US Treasury Bills helped the Fund manage its current cash flow needs along with diversifying potential interest rate risk.
Outlook:
Looking forward, the options portion of the Hedged Put Write strategy would generally benefit if the S&P 500® Index generates either a positive or modestly negative return over the next calendar year. Additionally, there is an opportunity to collect higher net option premiums if implied volatility in option pricing increases, as it is currently below historical averages. The fixed income strategy will continue to be invested in US Treasury Bills and would benefit if projected rate cuts from the Federal Open Market Committee aren’t as aggressive as currently projected by most.
Thank you for your continued support and please reach out with any questions or visit www.belmontcapfunds.com for other information about the Fund.
Stephen J. Solaka
Managing Partner & Portfolio Manager
| Investment Results (Unaudited) |
| |
Average Annual Total Returns* as of January 31, 2024
| | | | | | | | | Since |
| | | | | | | | | Inception |
| | | | | | | | | (April 30, |
| | | One Year | | Three Years | | Five Years | | 2018) |
| Belmont Theta Income Fund | | 12.72% | | 4.94% | | 2.30% | | 1.78% |
| S&P 500® Index(a) | | 20.82% | | 10.99% | | 14.30% | | 13.01% |
| Cboe S&P 500® Iron Condor Index(b) | | 3.94% | | 1.03% | | 0.02% | | (1.16)% |
| ICE BofA 3-Month U.S. Treasury Bill(c) | | 5.16% | | 2.31% | | 1.94% | | 1.96% |
| | | | | | | | | |
Total annual operating expenses as disclosed in the Belmont Theta Income Fund’s (the “Fund”) prospectus dated May 31, 2023, were 3.59% of the Fund’s average daily net assets (2.13% after fee waivers/expense reimbursements by Belmont Capital, LLC (the “Adviser”)). The Adviser has contractually agreed to waive or limit its fees and to assume other expenses of the Fund until May 31, 2024, so that total annual fund operating expenses do not exceed 1.99%. This contractual arrangement may only be terminated by mutual consent of the Adviser and the Board of Trustees of the Value Advisers Trust (the “Trust”), and it will automatically terminate upon the termination of the investment advisory agreement between the Trust and the Adviser. This operating expense limitation does not apply to: (i) interest, (ii) taxes, (iii) brokerage commissions, (iv) other expenditures which are capitalized in accordance with generally accepted accounting principles, (v) other extraordinary expenses not incurred in the ordinary course of the Fund’s business, (vi) dividend expense on short sales, (vii) expenses incurred under a plan of distribution under Rule 12b-1, and (viii) expenses that the Fund has incurred but did not actually pay because of an expense offset arrangement, if applicable, in any fiscal year. The operating expense limitation also excludes any “Acquired Fund Fees and Expenses”, which are the expenses indirectly incurred by the Fund as a result of investing in money market funds or other investment companies, including exchange-traded funds, that have their own expenses. Each waiver or reimbursement of an expense by the Adviser is subject to repayment by the Fund within the three years following the date on which the fee waiver or expense reimbursement occurred, provided that the Fund is able to make the repayment without exceeding the expense limitation in place at the time of the waiver or reimbursement and the expense limitation in place at the time of the repayment. Additional information pertaining to the Fund’s expense ratios as of January 31, 2024 can be found in the financial highlights.
The performance quoted represents past performance, which does not guarantee future results. The investment return and principal value of an investment will fluctuate so that an investor’s shares, when redeemed, may be worth more or less than their original cost. The returns shown do not reflect deduction of taxes that a shareholder would pay on Fund distributions or the redemption of Fund shares. Current performance of the Fund may be lower or higher than the performance quoted. The Fund’s investment objective, risks, charges and expenses should be considered carefully before investing. Performance data current to the most recent month end may be obtained by calling (800) 789-1087.
| * | Average annual total returns reflect any change in price per share and assume the reinvestment of all distributions. The Fund’s returns reflect any fee reductions during the applicable periods. If such fee reductions had not occurred, the quoted performance would have been lower. |
| (a) | Effective on or about March 30, 2023, the S&P 500® Index replaced the ICE BofA U.S. 3-Month Treasury Index as the Fund’s primary benchmark. The S&P 500® Index (the “Index”) is an unmanaged index generally representing the performance of the broad domestic economy through changes in the aggregate market value of 500 stocks representing all major industries. Individuals |
| Investment Results (Unaudited) (continued) |
| |
cannot invest directly in the Index; however, an individual may invest in exchange-traded funds or other investment vehicles that attempt to track the performance of a benchmark index.
| (b) | Cboe S&P 500® Iron Condor Index (the “Index”) is designed to track the performance of a hypothetical option trading strategy that 1) sells a rolling monthly out-of-the-money (OTM) S&P 500® Index (SPX) put option (delta ≈ - 0.20) and a rolling monthly OTM SPX call option (delta ≈ 0.20); 2) buys a rolling monthly OTM SPX put option (delta ≈ - 0.05) and a rolling monthly OTM SPX call option (delta ≈ 0.05) to reduce risk; and 3) holds a money market account invested in one-month Treasury bills, which is rebalanced on option roll days and is designed to limit the downside return of the Index. |
| (c) | ICE BofA US 3-Month Treasury Bill Index is comprised of a single issue purchased at the beginning of the month and held for a full month. At the end of the month that issue is sold and rolled into a newly selected issue. The issue selected at each month-end rebalancing is the outstanding Treasury Bill that matures closest to, but not beyond, three months from the rebalancing date. To qualify, an issue must have settled on or before the rebalancing date. |
The Fund’s investment objective, strategies, risks, charges and expenses should be considered carefully before investing. The prospectus contains this and other important information about the Fund and may be obtained by calling (800) 789-1087. Please read it carefully before investing.
| Investment Results (Unaudited) (continued) |
| |
Comparison of the Growth of a $10,000 Investment in the Belmont Theta Income Fund, the S&P 500® Index and the Cboe S&P 500® Iron Condor Index.
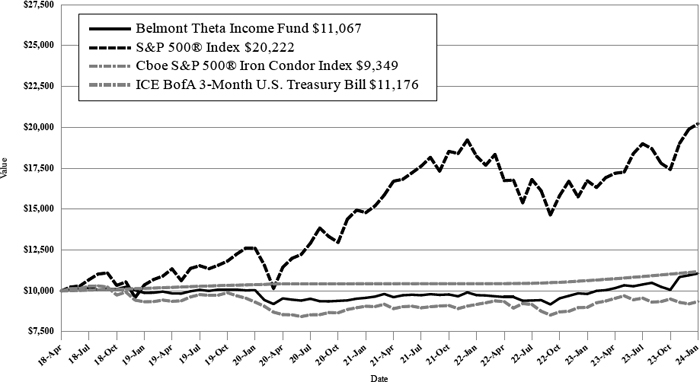
The chart above assumes an initial investment of $10,000 made on April 30, 2018 (commencement of operations) and held through January 31, 2024. THE FUND’S RETURNS REPRESENTS PAST PERFORMANCE AND DO NOT GUARANTEE FUTURE RESULTS. The returns shown do not reflect deduction of taxes that a shareholder would pay on Fund distributions or the redemption of Fund shares. Investment returns and principal values will fluctuate so that your shares, when redeemed, may be worth more or less than their original purchase price.
Current performance may be lower or higher than the performance data quoted. For more information on the Fund, and to obtain performance data current to the most recent month-end, or to request a prospectus, please call (800) 789-1087. You should carefully consider the investment objective, potential risks, management fees, and charges and expenses of the Fund before investing. The Fund’s prospectus contains this and other information about the Fund, and should be read carefully before investing.
The Fund is distributed by Ultimus Fund Distributors, LLC, Member FINRA/SIPC.
| Fund Holdings (Unaudited) |
| |
Belmont Theta Income Fund Holdings as of January 31, 2024*
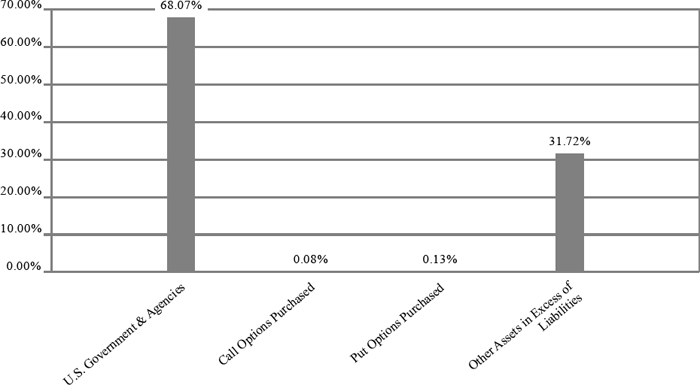
| * | As a percentage of net assets. |
The investment objective of the Fund is to seek long-term growth of capital and income generation.
| Availability of Portfolio Schedule (Unaudited) |
| |
The Fund files its complete schedule of portfolio holdings with the Securities and Exchange Commission (the “SEC”) for the first and third quarters of each fiscal year as an exhibit to its reports on Form N-PORT. The Fund’s Form N-PORT reports are available on the SEC’s website at www.sec.gov and on the Fund’s website at www.belmontcapfunds.com.
| Belmont Theta Income Fund |
| Schedule of Investments |
| January 31, 2024 |
| |
| | | Principal | | | | |
| U.S. GOVERNMENT & AGENCIES(a)(b)(c) — 68.07% | | Amount | | | Fair Value | |
| United States Treasury Bill, 4.49%, 3/21/2024 | | $ | 2,000,000 | | | $ | 1,985,698 | |
| United States Treasury Bill, 5.02%, 5/16/2024 | | | 2,000,000 | | | | 1,969,823 | |
| United States Treasury Bill, 5.02%, 8/8/2024 | | | 2,000,000 | | | | 1,949,125 | |
| United States Treasury Bill, 4.65%, 10/31/2024 | | | 2,250,000 | | | | 2,170,966 | |
| Total U.S. Government & Agencies (Cost $8,078,371) | | | | | | | 8,075,612 | |
| | | | | | | | | |
| | | Number of | | Notional | | | Exercise | | | Expiration | | | |
| Description | | Contracts | | Amount | | | Price | | | Date | | Fair Value | |
| OPTIONS PURCHASED - 0.21% | | | | | | | | | | | | | |
| CALL OPTIONS PURCHASED - 0.08% | | | | | | | | | | | | | | | | |
| | | | | | | | | | | | | February | | | | |
| Cboe Volatility Index | | 260 | | $ | 373,100 | | | $ | 37.00 | | | 2024 | | $ | 2,080 | |
| Cboe Volatility Index | | 285 | | | 408,975 | | | | 39.00 | | | March 2024 | | | 6,555 | |
| Total Call Options Purchased (Cost $19,046) | | | | | | | | | | | 8,635 | |
| PUT OPTIONS PURCHASED - 0.13% | | | | | | | | | | | | | | |
| | | | | | | | | | | | | February | | | | |
| S&P 500® Index | | 25 | | | 12,114,125 | | | | 4,170.00 | | | 2024 | | | 3,625 | |
| S&P 500® Index | | 25 | | | 12,114,125 | | | | 4,150.00 | | | March 2024 | | | 12,250 | |
| Total Put Options Purchased (Cost $43,193) | | | | | | | | | | | | 15,875 | |
| Total Options Purchased (Cost $62,239) | | | | | | | | | | | | | 24,510 | |
| Total Investments — 68.28% (Cost $8,140,610) | | | | | | | | | | | 8,100,122 | |
| Other Assets in Excess of Liabilities — 31.72% | | | | | | | | | | | 3,762,438 | |
| NET ASSETS — 100.00% | | | | | | | | | | $ | 11,862,560 | |
| | | | | | | | | | | | | | | | | |
| (a) | The rate shown represents effective yield at time of purchase. |
| (b) | Securities, or a portion thereof, have been pledged as collateral on written options. The total collateral pledged is $8,073,377. |
| (c) | Non-income producing security. |
See accompanying notes which are an integral part of these financial statements.
| Belmont Theta Income Fund |
| Schedule of Open Written Option Contracts |
| January 31, 2024 |
| |
| | | Number of | | Notional | | | Exercise | | | Expiration | | | |
| Description | | Contracts | | Amount | | | Price | | | Date | | Fair Value | |
| WRITTEN OPTIONS - (0.63)% | | | | | | | | | | | | | | | | |
| WRITTEN PUT OPTIONS - (0.63)% | | | | | | | | | | | | | | | | |
| | | | | | | | | | | | | February | | | | |
| S&P 500® Index | | (25) | | $ | (12,114,125 | ) | | $ | 4,620.00 | | | 2024 | | $ | (14,000 | ) |
| S&P 500® Index | | (25) | | | (12,114,125 | ) | | | 4,640.00 | | | March 2024 | | | (60,625 | ) |
| Total Written Put Options (Premiums Received $228,682) | | | | | | | | | | (74,625 | ) |
| Total Written Options (Premiums Received $228,682) | | | | | | | | | $ | (74,625 | ) |
| | | | | | | | | | | | | | | | | |
See accompanying notes which are an integral part of these financial statements.
| Belmont Theta Income Fund |
| Statement of Assets and Liabilities |
| January 31, 2024 |
| |
| Assets | | | | |
| Investments in securities at fair value (cost $8,140,610) (Note 3) | | $ | 8,100,122 | |
| Cash | | | 2,339,243 | |
| Cash held at broker for options contracts | | | 1,523,335 | |
| Interest receivable | | | 3,411 | |
| Receivable from Adviser | | | 2,673 | |
| Prepaid expenses | | | 6,655 | |
| Total Assets | | | 11,975,439 | |
| Liabilities | | | | |
| Written options, at fair value (premiums received $228,682) | | | 74,625 | |
| Payable to affiliates (Note 4) | | | 11,054 | |
| Payable to trustees | | | 1,196 | |
| Other accrued expenses | | | 26,004 | |
| Total Liabilities | | | 112,879 | |
| Net Assets | | $ | 11,862,560 | |
| Net Assets consist of: | | | | |
| Paid-in capital | | $ | 10,684,330 | |
| Accumulated earnings | | | 1,178,230 | |
| Net Assets | | $ | 11,862,560 | |
| Shares outstanding (unlimited number of shares authorized, no par value) | | | 544,497 | |
| Net asset value, offering and redemption price per share (Note 2) | | $ | 21.79 | |
| | | | | |
See accompanying notes which are an integral part of these financial statements.
| Belmont Theta Income Fund |
| Statement of Operations |
| For the year ended January 31, 2024 |
| |
| Investment Income | | | | |
| Interest income | | $ | 496,629 | |
| Total investment income | | | 496,629 | |
| | | | | |
| Expenses | | | | |
| Investment Adviser fees (Note 4) | | | 200,378 | |
| Administration fees (Note 4) | | | 40,574 | |
| Fund accounting fees (Note 4) | | | 33,721 | |
| Legal fees | | | 30,179 | |
| Audit and tax preparation fees | | | 18,915 | |
| Compliance service fees (Note 4) | | | 17,000 | |
| Registration expenses | | | 14,102 | |
| Transfer agent fees (Note 4) | | | 13,029 | |
| Printing and postage expenses | | | 10,432 | |
| Trustee fees | | | 7,647 | |
| Custodian fees | | | 3,000 | |
| Miscellaneous expense | | | 33,328 | |
| Total expenses | | | 422,305 | |
| Fees contractually waived by Adviser (Note 4) | | | (194,325 | ) |
| Net operating expenses | | | 227,980 | |
| Net investment income | | | 268,649 | |
| | | | | |
| Net Realized and Change in Unrealized Gain (Loss) on Investments | | | | |
| Net realized gain (loss) on: | | | | |
| Purchased options | | | (423,003 | ) |
| Written options | | | 1,298,804 | |
| Change in unrealized appreciation (depreciation) on: | | | | |
| Investment securities | | | 26,345 | |
| Purchased options | | | (22,057 | ) |
| Written options | | | 218,196 | |
| Net realized and change in unrealized gain on investments | | | 1,098,285 | |
| Net increase in net assets resulting from operations | | $ | 1,366,934 | |
| | | | | |
See accompanying notes which are an integral part of these financial statements.
| Belmont Theta Income Fund |
| Statements of Changes in Net Assets |
| January 31. 2024 |
| |
| | | For the Year | | | For the Year | |
| | | Ended January | | | Ended January | |
| | | 31, 2024 | | | 31, 2023 | |
| Increase (Decrease) in Net Assets due to: | | | | | | | | |
| Operations | | | | | | | | |
| Net investment income (loss) | | $ | 268,649 | | | $ | (141,196 | ) |
| Net realized gain on investment securities transactions, purchased options and written options | | | 875,801 | | | | 550,691 | |
| Net change in unrealized appreciation (depreciation) of investment securities, purchased options and written options | | | 222,484 | | | | (396,866 | ) |
| Net increase in net assets resulting from operations | | | 1,366,934 | | | | 12,629 | |
| | | | | | | | | |
| Distributions to shareholders from Earnings (Note 2) | | | (143,564 | ) | | | — | |
| Total distributions | | | (143,564 | ) | | | — | |
| | | | | | | | | |
| Capital Transactions - Institutional Class: | | | | | | | | |
| Proceeds from shares sold | | | 930,482 | | | | 1,189,581 | |
| Reinvestment of distributions | | | 143,564 | | | | — | |
| Amount paid for shares redeemed | | | (1,324,236 | ) | | | (3,235,775 | ) |
| Net decrease in net assets resulting from capital transactions | | | (250,190 | ) | | | (2,046,194 | ) |
| Total Increase (Decrease) in Net Assets | | | 973,180 | | | | (2,033,565 | ) |
| | | | | | | | | |
| Net Assets | | | | | | | | |
| Beginning of year | | | 10,889,380 | | | | 12,922,945 | |
| End of year | | $ | 11,862,560 | | | $ | 10,889,380 | |
| | | | | | | | | |
| Share Transactions - Institutional Class: | | | | | | | | |
| Shares sold | | | 45,255 | | | | 62,447 | |
| Shares issued in reinvestment of distributions | | | 6,690 | | | | — | |
| Shares redeemed | | | (63,762 | ) | | | (171,532 | ) |
| Net decrease in shares | | | (11,817 | ) | | | (109,085 | ) |
| | | | | | | | | |
See accompanying notes which are an integral part of these financial statements.
| Belmont Theta Income Fund - Institutional Class |
| Financial Highlights |
| |
| (For a share outstanding during each year) |
| |
| | | For the Years Ended January 31, | |
| | | 2024 | | | 2023 | | | 2022 | | | 2021 | | | 2020 | |
| Selected Per Share Data: | | | | | | | | | | | | | | | | | | | | |
| Net asset value, beginning of period | | $ | 19.57 | | | $ | 19.42 | | | $ | 19.09 | | | $ | 20.03 | | | $ | 19.76 | |
| | | | | | | | | | | | | | | | | | | | | |
| Investment operations: | | | | | | | | | | | | | | | | | | | | |
| Net investment income (loss) | | | 0.49 | | | | (0.26 | ) | | | (0.39 | ) | | | (0.22 | ) | | | 0.01 | |
| Net realized and unrealized gain (loss) | | | 1.99 | | | | 0.41 | | | | 0.72 | | | | (0.72 | ) | | | 0.32 | |
| Total from investment operations | | | 2.48 | | | | 0.15 | | | | 0.33 | | | | (0.94 | ) | | | 0.33 | |
| | | | | | | | | | | | | | | | | | | | | |
| Less distributions to shareholders from: | | | | | | | | | | | | | | | | | | | | |
| Net investment income | | | (0.14 | ) | | | — | | | | — | | | | — | | | | (0.01 | ) |
| Net realized gains | | | (0.12 | ) | | | — | | | | — | | | | — | | | | (0.05 | ) |
| Total distributions | | | (0.26 | ) | | | — | | | | — | | | | — | | | | (0.06 | ) |
| | | | | | | | | | | | | | | | | | | | | |
| Net asset value, end of period | | $ | 21.79 | | | $ | 19.57 | | | $ | 19.42 | | | $ | 19.09 | | | $ | 20.03 | |
| | | | | | | | | | | | | | | | | | | | | |
| Total Return(a) | | | 12.72 | % | | | 0.77 | % | | | 1.73 | % | | | (4.69 | )% | | | 1.71 | % |
| | | | | | | | | | | | | | | | | | | | | |
| Ratios and Supplemental Data: | | | | | | | | | | | | | | | | | | | | |
| Net assets, end of period (000 omitted) | | $ | 11,863 | | | $ | 10,889 | | | $ | 12,923 | | | $ | 12,825 | | | $ | 16,014 | |
| Ratio of net expenses to average net assets (b) | | | 1.99 | % | | | 2.13 | % | | | 2.02 | % | | | 2.10 | % | | | 2.14 | % |
| Ratio of expenses to average net assets before waiver and reimbursement | | | 3.69 | % | | | 3.59 | % | | | 3.19 | % | | | 3.20 | % | | | 3.02 | % |
| Ratio of net investment income (loss) to average net assets | | | 2.35 | % | | | (1.21 | )% | | | (1.97 | )% | | | (1.08 | )% | | | 0.06 | % |
| Portfolio turnover rate | | | — | % | | | — | % | | | —% | | | | — | % | | | — | % |
| | | | | | | | | | | | | | | | | | | | | |
| (a) | Total return represents the rate that the investor would have earned or lost on an investment in the Fund, assuming reinvestment of distributions. |
| (b) | This ratio includes the impact of broker interest fees. If this cost had been excluded, the ratio of expenses to average net assets would have been 1.99% for the periods ended January 31, 2024, January 31, 2023, January 31, 2022, January 31, 2021, and January 31, 2020, respectively. |
See accompanying notes which are an integral part of these financial statements.
| Belmont Theta Income Fund |
| Notes to the Financial Statements |
| January 31, 2024 |
NOTE 1. ORGANIZATION
The Belmont Theta Income Fund (the “Fund”) is registered under the Investment Company Act of 1940, as amended (“1940 Act”), as an open-end diversified series of Valued Advisers Trust (the “Trust”). The Trust is a management investment company established under the laws of Delaware by an Agreement and Declaration of Trust dated June 13, 2008 (the “Trust Agreement”). The Trust Agreement permits the Board of Trustees (the “Board”) to issue an unlimited number of shares of beneficial interest of separate series without par value. The Fund is one of a series of funds authorized by the Board. The Fund currently offers one class of shares: Institutional Shares. The Fund commenced operations on April 30, 2018. The Fund’s investment adviser is Belmont Capital, LLC d/b/a Belmont Capital GroupTM (the “Adviser”). The investment objective of the Fund is to seek long-term growth of capital and income generation.
NOTE 2. SIGNIFICANT ACCOUNTING POLICIES
The Fund is an investment company and follows accounting and reporting guidance under Financial Accounting Standards Board Accounting Standards Codification (“ASC”) Topic 946, “Financial Services-Investment Companies”. The following is a summary of significant accounting policies followed by the Fund in the preparation of its financial statements. These policies are in conformity with generally accepted accounting principles in the United States of America (“GAAP”).
Regulatory Update – Tailored Shareholder Reports for Mutual Funds and Exchange-Traded Funds (“ETFs”) – Effective January 24, 2023, the Securities and Exchange Commission adopted rule and form amendments that will result in changes to the design and delivery of shareholder reports of mutual funds and ETFs, requiring them to transmit concise and visually engaging streamlined annual and semi-annual reports to shareholders that highlight key information. Other information, including financial statements, will no longer appear in a streamlined shareholder report but must be available online, delivered free of charge upon request, and filed on a semi-annual basis on Form N-CSR. The rule and form amendments have a compliance date of July 24, 2024.
Estimates – The preparation of financial statements in conformity with GAAP requires management to make estimates and assumptions that affect the reported amounts of assets and liabilities and disclosure of contingent assets and liabilities at the date of the financial statements and the reported amounts of increases and decreases in net assets from operations during the reporting period. Actual results could differ from those estimates.
Federal Income Taxes – The Fund makes no provision for federal income or excise tax. The Fund has qualified and intends to qualify each year as a regulated investment
| Belmont Theta Income Fund |
| Notes to the Financial Statements (continued) |
| January 31, 2024 |
company (“RIC”) under subchapter M of the Internal Revenue Code of 1986, as amended, by complying with the requirements applicable to RICs and by distributing substantially all of its taxable income. The Fund also intends to distribute sufficient net investment income and net realized capital gains, if any, so that it will not be subject to excise tax on undistributed income and gains. If the required amount of net investment income or gains is not distributed, the Fund could incur a tax expense.
As of and during the fiscal year ended January 31, 2024, the Fund did not have any liabilities for any unrecognized tax benefits. The Fund recognizes interest and penalties, if any, related to unrecognized tax benefits as income tax expense on the Statement of Operations when incurred. During the fiscal year ended January 31, 2024, the Fund did not incur any interest or penalties. Management of the Fund has reviewed tax positions taken in tax years that remain subject to examination by all major tax jurisdictions, including federal (i.e., the last three tax year ends and the interim tax period since then, as applicable). Management believes that there is no tax liability resulting from unrecognized tax benefits related to uncertain tax positions taken.
Expenses – Expenses incurred by the Trust that do not relate to a specific fund of the Trust are allocated to the individual funds of the Trust based on each fund’s relative net assets or another appropriate basis (as determined by the Board).
Security Transactions and Related Income – The Fund follows industry practice and records security transactions on the trade date for financial reporting purposes. The specific identification method is used for determining gains or losses for financial statement and income tax purposes. Dividend income is recorded on the ex-dividend date and interest income is recorded on an accrual basis. Discounts and premiums on securities purchased are accreted or amortized using the effective interest method. Non-cash income, if any, is recorded at the fair market value of the securities received. Withholding taxes on foreign dividends, if any, have been provided for in accordance with the Fund’s understanding of the applicable country’s tax rules and rates.
Dividends and Distributions – The Fund intends to distribute its net investment income and net realized long-term and short-term capital gains, if any, at least annually. Dividends and distributions to shareholders, which are determined in accordance with income tax regulations, are recorded on the ex-dividend date. The treatment for financial reporting purposes of distributions made to shareholders during the period from net investment income or net realized capital gains may differ from their ultimate treatment for federal income tax purposes. These differences are caused primarily by differences in the timing of the recognition of certain components of income, expense or realized capital gain for federal income tax purposes. Where such differences are permanent in nature, they are reclassified among the components of net assets based on their ultimate characterization
| Belmont Theta Income Fund |
| Notes to the Financial Statements (continued) |
| January 31, 2024 |
for federal income tax purposes. Any such reclassifications will have no effect on net assets, results of operations or net asset value (“NAV”) per share of the Fund.
Share Valuation – The NAV is calculated each day the New York Stock Exchange (the “NYSE”) is open by dividing the total value of the Fund’s assets, less liabilities, by the number of shares outstanding for the Fund.
Options – The Fund utilizes a strategy of writing collateralized put spread options on U.S. indices, including the S&P 500® Index (SPX). The Fund attempts to generate returns through the receipt of options premiums from selling put spreads, as well as through investments in fixed income instruments and the purchase of call options on U.S. indices, including the Cboe Volatility Index (VIX), which collectively, are intended to reduce volatility relative to what it would be if the Fund held the underlying equity index on which the put spread options are written. The Fund’s investment in fixed income instruments typically consist of cash, investment grade money market instruments and short term U.S. Treasury obligations.
In a put spread writing strategy, the Fund (as the seller of the put spread) is short a put option and long another put option with the same expiration but with a lower strike price in the same underlying instrument. The short put generates premiums for the Fund while the long put defines the maximum loss potential for the put spread. If the market price of the instrument underlying the option exceeds the short put strike price at expiration the Fund will realize the full premium. If the market price of the instrument underlying the option drops below the short put strike price at expiration the Fund will pay the difference between the market value of the underlying instrument and the short put strike price. The maximum loss at expiration is limited to the difference between the short strike price and the long strike price.
The Fund may also purchase call options on U.S. indices including the VIX. In a call buying strategy, the Fund (as the buyer of the option) is long a call and pays premiums for the right but not obligation to purchase an underlying instrument at a specific price (i.e.. the strike price) at some point in the future. If the market price of the instrument underlying the option exceeds the long call strike price at expiration the Fund will make the difference between the market value of the underlying instrument and the long call strike price. If the market price of the instrument underlying the option is below the long call strike at expiration, the Fund’s maximum loss will be any premiums it paid to purchase the call.
The Portfolio Managers will select option investments based on their estimate of current and future market volatility levels, underlying instrument valuations and perceived market risks. Further, the Portfolio Managers will evaluate relative option premiums in determining preferred option contract terms, such as strike prices and expiration dates.
| Belmont Theta Income Fund |
| Notes to the Financial Statements (continued) |
| January 31, 2024 |
The Portfolio Managers will also be responsible for determining the aggregate option investment exposure for the Fund at any given time.
The Fund’s investments in fixed income instruments typically consists of cash, investment grade money market instruments and short term U.S. Treasury obligations. The Fund’s fixed income instruments are intended to provide liquidity and preserve capital as well as serving as collateral for the Fund’s investments in options. Because the Fund uses options to gain exposure to the equity markets, and because options will not require the Fund to deposit the full notional amount of the investment, the Fund will invest a significant amount of its total assets in fixed income instruments. It’s investments in options generally will not constitute a significant amount of its total assets, however, the aggregate investment exposure of its investments in options will generally be greater than 100% of its total assets.
While the Fund may invest in both American-style and European-style options, for efficient portfolio management the Portfolio Managers generally prefer European-style options, which can be exercised only at expiration, as opposed to American-style options, which can be exercised at any time prior to the option’s expiration. The Fund may write call options on securities and indices, including writing both covered calls (i.e., where the Fund holds an equivalent position in the instrument underlying the option) and uncovered calls (i.e., where the Fund does not own the instrument underlying the option and must purchase the underlying instrument to meet its call obligations). The Fund may also gain exposure to the equity markets by purchasing shares of other investment companies, including exchange-traded funds (“ETFs”), that track an index.
Derivative Transactions – The following tables identify the location and fair value of derivative instruments on the Statement of Assets and Liabilities as of January 31, 2024 and the effect of derivative instruments on the Statement of Operations for the fiscal year ended January 31, 2024.
| Location of Derivatives on Statement of Assets and Liabilities |
| Derivatives | | Asset Derivatives | | Liability Derivatives | | Fair Value | |
| Equity Price Risk: | | | | | |
| Purchased Options | | Investments in securities at fair value | | | | $ | 24,510 | |
| Written Options | | | | Options written,at fair value | | | (74,625 | ) |
| Belmont Theta Income Fund |
| Notes to the Financial Statements (continued) |
| January 31, 2024 |
For the fiscal year ended January 31, 2024:
| | | | | | | | Change in Unrealized | |
| | | Location of Gain (Loss) on | | Realized Gain | | | Appreciation | |
| | | Derivatives on Statement of | | (Loss) on | | | (Depreciation) on | |
| Derivatives | | Operations | | Derivatives | | | Derivatives | |
| Equity Price Risk: | | | | | | | | | | |
| Purchased Options | | Net realized gain (loss) and change in unrealized appreciation (depreciation) on purchased options | | $ | (423,003 | ) | | $ | (22,057 | ) |
| Written Options | | Net realized gain (loss) and change in unrealized appreciation (depreciation) on written options | | | 1,298,804 | | | | 218,196 | |
The following table summarizes the average ending monthly fair value of derivatives outstanding during the fiscal year ended January 31, 2024:
| | | Average Ending Monthly | |
| Derivatives | | Fair Value(a) | |
| Purchased Options | | $ | 31,471 | |
| Written Options | | | (209,272 | ) |
| (a) | Average based on the 12 months during the period that had activity. |
The following table provides a summary of offsetting financial liabilities and derivatives and the effect of derivative instruments on the Statement of Assets and Liabilities as of January 31, 2024:
| | | | | | | | | | | | Gross Amounts Not Offset | | | | |
| | | | | | | | | | | | in Statement of Assets and | | | | |
| | | | | | | | | | | | Liabilities | | | | |
| | | | | | | | | Net Amounts | | | | | | | | | | |
| | | | | | Gross Amounts | | | of Liabilities | | | | | | | | | | |
| | | | | | Offset in | | | Presented in | | | | | | | | | | |
| | | Gross Amounts | | | Statement of | | | Statement of | | | | | | | | | | |
| | | of Recognized | | | Assets and | | | Assets and | | | Financial | | | Collateral | | | Net | |
| | | Liabilities | | | liabilities | | | Liabilities | | | Instruments | | | Pledged | | | Amount | |
| Written Options | | $ | 74,625 | | | $ | — | | | $ | 74,625 | | | $ | (74,625 | ) | | $ | — | | | $ | — | |
| Belmont Theta Income Fund |
| Notes to the Financial Statements (continued) |
| January 31, 2024 |
NOTE 3. SECURITIES VALUATION AND FAIR VALUE MEASUREMENTS
The Fund values its portfolio securities at fair value as of the close of regular trading on the NYSE (normally 4:00 p.m. Eastern Time) on each business day the NYSE is open for business. Fair value is defined as the price that the Fund would receive upon selling an investment in a timely transaction to an independent buyer in the principal or most advantageous market of the investment. GAAP establishes a three-tier hierarchy to maximize the use of observable market data and minimize the use of unobservable inputs and to establish classification of fair value measurements for disclosure purposes.
Inputs refer broadly to the assumptions that market participants would use in pricing the asset or liability, including assumptions about risk (the risk inherent in a particular valuation technique used to measure fair value including a pricing model and/or the risk inherent in the inputs to the valuation technique). Inputs may be observable or unobservable. Observable inputs are inputs that reflect the assumptions market participants would use in pricing the asset or liability developed based on market data obtained and available from sources independent of the reporting entity. Unobservable inputs are inputs that reflect the reporting entity’s own assumptions about the assumptions market participants would use in pricing the asset or liability developed based on the best information available in the circumstances.
Various inputs are used in determining the value of the Fund’s investments. These inputs are summarized in the three broad levels listed below.
| ● | Level 1 – unadjusted quoted prices in active markets for identical investments and/or registered investment companies where the value per share is determined and published and is the basis for current transactions for identical assets or liabilities at the valuation date |
| ● | Level 2 – other significant observable inputs (including, but not limited to, quoted prices for an identical security in an inactive market, quoted prices for similar securities, interest rates, prepayment speeds, credit risk, etc.) |
| ● | Level 3 – significant unobservable inputs (including the Fund’s own assumptions in determining fair value of investments based on the best information available) |
The inputs used to measure fair value may fall into different levels of the fair value hierarchy. In such cases, for disclosure purposes, the level in the fair value hierarchy which is reported is determined based on the lowest level input that is significant to the fair value measurement in its entirety.
| Belmont Theta Income Fund |
| Notes to the Financial Statements (continued) |
| January 31, 2024 |
Debt securities are valued by the Adviser as “Valuation Designee” under the oversight of the Board, by using the mean between the closing bid and ask prices provided by a pricing service. If the closing bid and ask prices are not readily available, the pricing service may provide a price determined by a matrix pricing method. Matrix pricing is a mathematical technique used to value fixed income securities without relying exclusively on quoted prices. Matrix pricing takes into consideration recent transactions, yield, liquidity, risk, credit quality, coupon, maturity, type of issue and any other factors or market data the pricing service deems relevant for the actual security being priced and for other securities with similar characteristics. These securities will generally be categorized as Level 2 securities. If the Adviser decides that a price provided by the pricing service does not accurately reflect the fair value of the securities or when prices are not readily available from a pricing service, securities are valued at fair value as determined by the Adviser, in conformity with guidelines adopted by and subject to review of the Board. These securities will generally be categorized as Level 3 securities.
Equity securities that are traded on any stock exchange are generally valued at the last quoted sale price on the security’s primary exchange. Lacking a last sale price, an exchange-traded security is generally valued at the mean between the most recent quoted bid and ask prices. Securities traded in the Nasdaq over-the-counter market are generally valued at the Nasdaq Official Closing Price. When using market quotations and when the market is considered active, the security is classified as a Level 1 security. In the event that market quotations are not readily available or are considered unreliable due to market or other events, securities are valued in good faith by the Adviser as “Valuation Designee” under the oversight of the Board. The Adviser has adopted written policies and procedures for valuing securities and other assets in circumstances where market quotes are not readily available. In the event that market quotes are not readily available, and the security or asset cannot be valued pursuant to one of the valuation methods, the value of the security or asset will be determined in good faith by the Adviser pursuant to its policies and procedures. On a quarterly basis, the Adviser’s fair valuation determinations will be reviewed by the Board. Under these policies, the securities will be classified as Level 2 or 3 within the fair value hierarchy, depending on the inputs used.
Investments in mutual funds, including money market mutual funds, are generally priced at the ending NAV as reported by the underlying Fund companies. These securities are categorized as Level 1 securities.
Exchange-traded options on securities and indices purchased or sold by the Fund generally will be valued at the mean of the last bid and ask prices. If there is no such reported ask on the valuation date, purchased options are valued at the most recent bid price. If there is no such reported bid on the valuation date, written options are valued at the most
| Belmont Theta Income Fund |
| Notes to the Financial Statements (continued) |
| January 31, 2024 |
recent ask price. On the last business day of each month, the Cboe Options Exchange (“Cboe”) conducts special end-of-month non-trading closing rotations for the sole purpose of determining the fair value of the S&P 500® Index (SPX) option series. For month end valuations of SPX, the Cboe adjusted price will be used if the special end-of-month non-trading closing rotation fair value price differs from the price provided at market close. Options will generally be categorized as Level 2 securities.
In accordance with the Trust’s valuation policies and fair value determinations pursuant to Rule 2a-5 under the 1940 Act, the Valuation Designee is required to consider all appropriate factors relevant to the value of securities for which it has determined other pricing sources are not available or reliable as described above. No single method exists for determining fair value because fair value depends upon the circumstances of each individual case. As a general principle, the current fair value of a security being valued by the Valuation Designee would be the amount that the Fund might reasonably expect to receive upon the current sale. Methods that are in accordance with this principle may, for example, be based on (i) a multiple of earnings; (ii) a discount from market prices of a similar freely traded security (including a derivative security or a basket of securities traded on other markets, exchanges or among dealers); or (iii) yield to maturity with respect to debt issues, or a combination of these and other methods. Fair-value pricing is permitted if, in the Valuation Designee’s opinion, the validity of market quotations appears to be questionable based on factors such as evidence of a thin market in the security based on a small number of quotations, a significant event occurs after the close of a market but before the Fund’s NAV calculation that may affect a security’s value, or the Valuation Designee is aware of any other data that calls into question the reliability of market quotations.
| Belmont Theta Income Fund |
| Notes to the Financial Statements (continued) |
| January 31, 2024 |
The following is a summary of the inputs used to value the Fund’s investments as of January 31, 2024:
| | | | | | Valuation Inputs | | | | | | | |
| Assets | | Level 1 | | | Level 2 | | | Level 3 | | | Total | |
| U.S. Government & Agencies | | $ | — | | | $ | 8,075,612 | | | $ | — | | | $ | 8,075,612 | |
| Call Options Purchased | | | 8,635 | | | | — | | | | — | | | | 8,635 | |
| Put Options Purchased | | | 15,875 | | | | — | | | | — | | | | 15,875 | |
| Total | | $ | 24,510 | | | $ | 8,075,612 | | | $ | — | | | $ | 8,100,122 | |
| | | | | | | | | | | | | | | | | |
| | | | | | Valuation Inputs | | | | | | | |
| Liabilities | | Level 1 | | | Level 2 | | | Level 3 | | | Total | |
| Written Put Options | | $ | (74,625 | ) | | $ | — | | | $ | — | | | $ | (74,625 | ) |
| Total | | $ | (74,625 | ) | | $ | — | | | $ | — | | | $ | (74,625 | ) |
The Fund did not hold any investments at the end of the reporting period for which significant unobservable inputs (Level 3) were used in determining fair value; therefore, no reconciliation of Level 3 securities is included for this reporting period.
NOTE 4. FEES AND OTHER TRANSACTIONS WITH AFFILIATES AND OTHER SERVICE PROVIDERS
Under the terms of the investment advisory agreement, on behalf of the Fund (the “Agreement”), the Adviser manages the Fund’s investments subject to oversight of the Board. As compensation for its services, the Fund pays the Adviser a fee, computed and accrued daily and paid monthly at an annual rate of 1.75% of the average daily net assets of the Fund. For the fiscal year ended January 31, 2024, the Adviser earned a fee of $200,378 from the Fund before the waivers described below. At January 31, 2024, the Adviser owed the Fund $2,673.
The Adviser has contractually agreed to waive or limit its fees and to assume other expenses of the Fund until May 31, 2024, so that total annual fund operating expenses do not exceed 1.99%. This contractual arrangement may only be terminated by mutual consent of the Adviser and the Board, and it will automatically terminate upon the termination of the investment advisory agreement between the Trust and the Adviser. This operating expense limitation does not apply to: (i) interest, (ii) taxes, (iii) brokerage commissions, (iv) other expenditures which are capitalized in accordance with generally accepted accounting principles, (v) other extraordinary expenses not incurred in the ordinary course of the Fund’s business, (vi) dividend expense on short sales, (vii) expenses incurred under a plan of distribution under Rule 12b-1, and (viii) expenses that the Fund has incurred but did not actually pay because of an expense offset arrangement, if applicable, in any fiscal year. The operating expense limitation also excludes any “Acquired Fund Fees and Expenses,” which are the expenses indirectly incurred by the Fund as a result of investing in money
| Belmont Theta Income Fund |
| Notes to the Financial Statements (continued) |
| January 31, 2024 |
market funds or other investment companies, including exchange-traded funds, that have their own expenses.
Each fee waiver or expense reimbursement by the Adviser is subject to repayment by the Fund within the three years following the date the fee waiver or expense reimbursement occurred, provided that the Fund is able to make the repayment without exceeding the expense limitation that is in effect at the time of the repayment or at the time of the fee waiver or expense reimbursement, whichever is lower. For the fiscal year ended January 31, 2024, the Adviser waived fees or reimbursed expenses totaling $194,325. As of January 31, 2024, the Adviser may seek repayment of investment advisory fee waivers and expense reimbursements as follows:
| Recoverable Through | | | |
| January 31, 2025 | | $ | 153,403 | |
| January 31, 2026 | | | 170,269 | |
| January 31, 2027 | | | 194,325 | |
Ultimus Fund Solutions, LLC (“Ultimus”) provides administration, fund accounting and transfer agent services to the Fund. The Fund pays Ultimus fees in accordance with the agreements for such services.
Northern Lights Compliance Services, LLC (“NLCS”), an affiliate of Ultimus, provides a Chief Compliance Officer and an Anti-Money Laundering Officer to the Trust, as well as related compliance services, pursuant to a consulting agreement between NLCS and the Trust. Under the terms of such agreement, NLCS receives fees from the Fund, which are approved annually by the Board.
Under the terms of a Distribution Agreement with the Trust, Ultimus Fund Distributors, LLC (the “Distributor”) serves as principal underwriter to the Fund. The Distributor is a wholly-owned subsidiary of Ultimus. The Distributor is compensated by the Adviser (not the Fund) for acting as principal underwriter.
The officers and one trustee of the Trust are members of management and/or employees of Ultimus or of NLCS, and are not paid by the Trust for services to the Fund. Ultimus Fund Distributors, LLC (the “Distributor”) acts as the distributor of the Fund’s shares. The Distributor is a wholly-owned subsidiary of Ultimus. There were no payments made to the Distributor by the Fund for the fiscal year ended January 31, 2024.
NOTE 5. PURCHASES AND SALES OF SECURITIES
For the fiscal year ended January 31, 2024, there were no purchases or sales of investment securities, other than short-term investments and short-term U.S. government obligations.
| Belmont Theta Income Fund |
| Notes to the Financial Statements (continued) |
| January 31, 2024 |
NOTE 6. FEDERAL TAX INFORMATION
At January 31, 2024, the net unrealized appreciation (depreciation) and tax cost of investments, including written options, for tax purposes was as follows:
| Gross unrealized appreciation | | $ | 40,653 | |
| Gross unrealized depreciation | | | (43,413 | ) |
| Net unrealized depreciation on investments | | $ | (2,760 | ) |
| Tax cost of investments | | $ | 8,028,257 | |
The difference between book basis and tax basis of unrealized appreciation (depreciation) is primarily attributable to the mark to market adjustments on options contracts.
The tax character of distributions paid for the fiscal years ended January 31, 2024 and January 31, 2023, were as follows:
| | | 2024 | | | 2023 | |
| Distributions paid from: | | | | | | | | |
| Ordinary income(a) | | $ | 102,870 | | | $ | — | |
| Long-term capital gains | | | 40,694 | | | | — | |
| Total distributions paid | | $ | 143,564 | | | $ | — | |
| (a) | Short-term capital gain distributions are treated as ordinary income for tax purposes. |
At January 31, 2024, the components of accumulated earnings (deficit) on a tax basis were as follows:
| Undistributed ordinary income | | $ | 586,676 | |
| Undistributed long-term capital gains | | | 594,314 | |
| Unrealized depreciation on investments | | | (2,760 | ) |
| Total accumulated earnings | | $ | 1,178,230 | |
As of January 31, 2024, the Fund had no short-term and long-term capital loss carryforwards.
During the fiscal year ended January 31, 2024, the Fund utilized capital loss carryforwards of $16,035.
NOTE 7. REGULATORY UPDATES
In October 2020, the Securities and exchange Commission (the “SEC”) adopted new regulations governing the use of derivatives by registered investment companies (“Rule 18f-4”). Rule 18f-4 imposes limits on the amount of derivatives a fund can enter into, eliminates the asset segregation framework currently used by funds to comply with section 18 of the 1940 Act, treats derivatives as senior securities and requires funds whose use of derivatives is more than a limited specified exposure amount to establish and maintain
| Belmont Theta Income Fund |
| Notes to the Financial Statements (continued) |
| January 31, 2024 |
a comprehensive derivatives risk management program and appoint a derivatives risk manager.
NOTE 8. COMMITMENTS AND CONTINGENCIES
The Trust indemnifies its officers and Trustees for certain liabilities that may arise from their performance of their duties to the Trust or the Fund. Additionally, in the normal course of business, the Trust enters into contracts that contain a variety of representations and warranties which provide general indemnifications. The Trust’s maximum exposure under these arrangements is unknown, as this would involve future claims that may be made against the Trust that have not yet occurred.
NOTE 9. SUBSEQUENT EVENTS
Management of the Fund has evaluated the need for disclosures and/or adjustments resulting from subsequent events through the date at which these financial statements were issued. Based upon this evaluation, management has determined there were no items requiring adjustment of the financial statements or additional disclosure.
| Report of Independent Registered Public Accounting Firm |
To the Shareholders of Belmont Theta Income Fund and
Board of Trustees of Valued Advisers Trust
Opinion on the Financial Statements
We have audited the accompanying statement of assets and liabilities, including the schedules of investments and open written option contracts, of Belmont Theta Income Fund (the “Fund”), a series of Valued Advisers Trust, as of January 31, 2024, the related statement of operations for the year then ended, the statements of changes in net assets for each of the two years in the period then ended, the related notes, and the financial highlights for each of the five years in the period then ended (collectively referred to as the “financial statements”). In our opinion, the financial statements present fairly, in all material respects, the financial position of the Fund as of January 31, 2024, the results of its operations for the year then ended, the changes in net assets for each of the two years in the period then ended, and the financial highlights for each of the five years in the period then ended, in conformity with accounting principles generally accepted in the United States of America.
Basis for Opinion
These financial statements are the responsibility of the Fund’s management. Our responsibility is to express an opinion on the Fund’s financial statements based on our audits. We are a public accounting firm registered with the Public Company Accounting Oversight Board (United States) (“PCAOB”) and are required to be independent with respect to the Fund in accordance with the U.S. federal securities laws and the applicable rules and regulations of the Securities and Exchange Commission and the PCAOB.
We conducted our audits in accordance with the standards of the PCAOB. Those standards require that we plan and perform the audit to obtain reasonable assurance about whether the financial statements are free of material misstatement whether due to error or fraud.
Our audits included performing procedures to assess the risks of material misstatement of the financial statements, whether due to error or fraud, and performing procedures that respond to those risks. Such procedures included examining, on a test basis, evidence regarding the amounts and disclosures in the financial statements. Our procedures included confirmation of securities owned as of January 31, 2024, by correspondence with the custodian and broker. Our audits also included evaluating the accounting principles used and significant estimates made by management, as well as evaluating the overall presentation of the financial statements. We believe that our audits provide a reasonable basis for our opinion.
We have served as the Fund’s auditor since 2018.
COHEN & COMPANY, LTD.
Cleveland, Ohio
March 27, 2024
| Liquidity Risk Management Program (Unaudited) |
Valued Advisers Trust has adopted and implemented a written liquidity risk management program as required by Rule 22e-4 (the “Liquidity Rule”) under the Investment Company Act. The program is reasonably designed to assess and manage the Fund’s liquidity risk, taking into consideration, among other factors, the Fund’s investment strategy and the liquidity of its portfolio investments during normal and reasonably foreseeable stressed conditions; its short and long-term cash flow projections; and its cash holdings and access to other funding sources. The Board of Trustees approved the appointment of a Liquidity Administrator Committee, which includes representatives from Belmont Capital, LLC, the Fund’s investment adviser, and Ultimus Fund Solutions, LLC, the Fund’s Administrator. The Liquidity Administrator Committee is responsible for the program’s administration and oversight and for reporting to the Board on at least an annual basis regarding the program’s operation and effectiveness. The Liquidity Administrator Committee updated its assessment of the Fund’s liquidity risk profile, considering additional data gathered during the period June 1, 2022 through May 31, 2023 (the “Review Period”) and the adequacy and effectiveness of the liquidity risk management program’s operations during the Review Period in order to prepare a written report for the Board of Trustees (the “Report”) for consideration at its meeting held on September 8, 2023. The Report noted that during the Review Period the Fund did not experience unusual stress or disruption to its operations related to purchase and redemption activity. It further noted that during the Review Period the Fund held adequate levels of cash and highly liquid investments to meet shareholder redemption activities in accordance with applicable requirements. The Report concluded that (i) the Trust’s liquidity risk management program is reasonably designed to prevent violations of the Liquidity Rule and (ii) the Trust’s liquidity risk management program had been effectively implemented during the Review Period.
| Summary of Fund Expenses (Unaudited) |
As a shareholder of the Fund, you incur two types of costs: (1) transaction costs, including reinvested dividends, or other distributions; and (2) ongoing costs, including management fees and other Fund expenses. These examples are intended to help you understand your ongoing costs (in dollars) of investing in the Fund and to compare these costs with the ongoing costs of investing in other mutual funds. The example is based on an investment of $1,000 invested at the beginning of the period and held for the entire period from August 1, 2023 through January 31, 2024.
Actual Expenses
The first line of the table below provides information about actual account values and actual expenses. You may use the information in this line, together with the amount you invested, to estimate the expenses that you paid over the period. Simply divide your account value by $1,000 (for example, an $8,600 account value divided by $1,000 = 8.6), then multiply the result by the number in the first line under the heading “Expenses Paid During Period” to estimate the expenses you paid on your account during this period.
Hypothetical Example for Comparison Purposes
The second line of the table below provides information about hypothetical account values and hypothetical expenses based on the Fund’s actual expense ratio and an assumed rate of return of 5% per year before expenses, which is not the Fund’s actual return. The hypothetical account values and expenses may not be used to estimate the actual ending account balance or expenses you paid for the period. You may use this information to compare the ongoing costs of investing in the Fund and other funds. To do so, compare this 5% hypothetical example with the 5% hypothetical examples that appear in the shareholder reports of other funds.
Expenses shown in the table are meant to highlight your ongoing costs only and do not reflect any transactional costs. Therefore, the second line of the table below is useful in comparing ongoing costs only and will not help you determine the relative total costs of owning different funds. In addition, if transaction costs were included, your costs would have been higher.
| | | Beginning | | | Ending | | | | | | |
| | | Account | | | Account | | | Expenses | | | |
| | | Value | | | Value | | | Paid | | | Annualized |
| | | August 1, | | | January 31, | | | During | | | Expense |
| | | 2023 | | | 2024 | | | Period(a) | | | Ratio |
| Actual | | $ | 1,000.00 | | | $ | 1,064.60 | | | $ | 8.56 | | | 1.64% |
| Hypothetical(b) | | $ | 1,000.00 | | | $ | 1,016.92 | | | $ | 8.36 | | | 1.64% |
| (a) | Expenses are equal to the Fund’s annualized expense ratios, multiplied by the average account value over the period, multiplied by 184/365 (to reflect the one-half year period). |
| (b) | Hypothetical assumes 5% annual return before expenses. |
| Additional Federal Income Tax Information (Unaudited) |
The Form 1099-DIV you receive in January 2024 will show the tax status of all distributions paid to your account in calendar year 2024. Shareholders are advised to consult their own tax adviser with respect to the tax consequences of their investment in the Fund. As required by the Internal Revenue Code and/or regulations, shareholders must be notified regarding the status of qualified dividend income for individuals and the dividends received deduction for corporations.
Qualified Dividend Income. The Fund designates approximately 0% or up to the maximum amount of such dividends allowable pursuant to the Internal Revenue Code, as qualified dividend income eligible for a reduced tax rate.
Qualified Business Income. The Fund designates approximately 0% of its ordinary income dividends, or up to the maximum amount of such dividends allowable pursuant to the Internal Revenue Code, as qualified business income.
Dividends Received Deduction. Corporate shareholders are generally entitled to take the dividends received deduction on the portion of the Fund’s dividend distribution that qualifies under tax law. For the Fund’s calendar year 2024 ordinary income dividends, 0% qualifies for the corporate dividends received deduction.
For the year ended January 31, 2024, the Fund designated $40,694 as long-term capital gain distributions.
| Investment Advisory Agreement Approval (Unaudited) |
At a meeting held on December 11-12, 2023, the Board of Trustees (the “Board”) considered the renewal of the Investment Advisory Agreement (the “Belmont Agreement”) between Valued Advisers Trust (the “Trust”) and Belmont Capital, LLC (“Belmont”) with respect to the Belmont Theta Income Fund (the “Belmont Fund”). Belmont provided written information to the Board to assist the Board in its considerations.
Counsel reminded the Trustees of their fiduciary duties and responsibilities as summarized in a memorandum from his firm, including the factors to be considered, and the application of those factors to Belmont and the Belmont Agreement. In assessing the Factors and reaching its decision, the Board took into consideration information furnished by Belmont and the Trust’s other service providers for the Board’s review and consideration throughout the year at regular Board meetings, as well as information specifically prepared or presented in connection with the renewal process, including information presented at this Meeting. The Board requested and was provided with, and reflected on, information and reports relevant to the annual renewal of the Belmont Agreement, including: (i) reports regarding the services and support provided to the Belmont Fund by Belmont; (ii) quarterly assessments of the investment performance of the Belmont Fund by personnel of Belmont; (iii) commentary on the reasons for the performance; (iv) presentations by Belmont addressing its investment philosophy, investment strategy, personnel, and operations; (v) compliance and audit reports concerning the Belmont Fund and Belmont; (vi) disclosure information contained in the Trust’s registration statement and Belmont’s Form ADV; and (vii) a memorandum from Counsel, that summarized the fiduciary duties and responsibilities of the Board in considering and approving the Belmont Agreement. The Board also requested and received various informational materials including, without limitation: (a) documents containing information about Belmont, including its financial information; a description of its personnel and the services it provides to the Belmont Fund; information on Belmont’s investment advice and performance; summaries of the Belmont Fund’s expenses, compliance program, current legal matters, and other general information; (b) comparative expense and performance information for other mutual funds with strategies similar to the Belmont Fund; and (c) the benefits to be realized by Belmont from its relationship with the Belmont Fund. The Board did not identify any particular information that was most relevant to its consideration of the Belmont Agreement and each Trustee may have afforded different weight to the various Factors.
1. The nature, extent, and quality of the services to be provided by Belmont. In this regard, the Board considered Belmont’s responsibilities under the Belmont Agreement. The Trustees considered the services being provided by Belmont to the Belmont Fund. The Trustees discussed, among other things: the quality of Belmont’s investment advisory services (including research and recommendations with respect to portfolio securities), its process for formulating investment recommendations and assuring compliance with the Belmont Fund’s investment objectives and limitations, its coordination of services for the Belmont Fund among the Belmont Fund’s service providers, and its efforts to promote the Belmont Fund and grow its assets. The Trustees considered Belmont’s continuity of, and commitment to retain, qualified personnel and Belmont’s commitment to maintain and enhance its resources and systems. The Trustees considered Belmont’s personnel, including the education and experience of the personnel. After considering the foregoing information and further information in the Meeting materials provided by Belmont (including Belmont’s Form ADV), the Board concluded that, in light of all the facts and circumstances, the nature, extent, and quality of the services provided by Belmont were satisfactory and adequate for the Belmont Fund.
| Investment Advisory Agreement Approval (Unaudited) (continued) |
2. Investment performance of the Belmont Fund and Belmont. In considering the investment performance of the Belmont Fund and Belmont, the Trustees compared the performance of the Belmont Fund with the performance of funds in the same Morningstar category, as well as with peer group data and the Belmont Fund’s benchmarks. The Trustees noted that the Belmont Fund had outperformed compared to its peer group median for the one year period ended September 30, 2023, had performed comparably to its peer group median for the three year period, and had underperformed for the five year and since inception periods ended September 30, 2023. They observed that the Belmont Fund performed better than its style-specific benchmark for the one year and three year periods, and underperformed for the five year and since inception periods ended September 30, 2023. With regard to its broad market benchmark, they noted that the Belmont Fund performed worse for all periods presented. The Trustees observed that the Belmont Fund had performed below its category average for the one year, three year, and five year periods ended September 30, 2023. The Trustees also considered the consistency of Belmont’s management of the Belmont Fund with its investment objective, strategies, and limitations. The Trustees considered the Belmont Fund’s performance relative to the performance of Belmont’s Hedged Put Write strategy and noted that the performance was very close. They considered Belmont’s explanation regarding the reasons for the small difference, and determined that the explanation was reasonable. After reviewing and discussing the investment performance of the Belmont Fund further, Belmont’s experience managing the Belmont Fund, Belmont’s historical performance, and other relevant factors, the Board concluded, in light of all the facts and circumstances, that the investment performance of the Belmont Fund and Belmont was acceptable.
3. The costs of the services to be provided and profits to be realized by Belmont from its relationship with the Belmont Fund. In considering the costs of services to be provided and the profits to be realized by Belmont from the relationship with the Belmont Fund, the Trustees considered: (1) Belmont’s financial condition; (2) the asset level of the Belmont Fund; (3) the overall expenses of the Belmont Fund; and (4) the nature and frequency of advisory fee payments. The Trustees reviewed information provided by Belmont regarding its profits associated with managing the Belmont Fund. The Trustees also considered potential benefits for Belmont in managing the Belmont Fund. The Trustees then compared the fees and expenses of the Belmont Fund (including the management fee) to other comparable mutual funds. The Trustees observed that the Belmont Fund’s advisory fee was the highest in its Morningstar category, and equal to the highest of its peer group. They also noted that the Belmont Fund’s net expense ratio was above the average and median of its peer group and its Morningstar category. The Trustees considered Belmont’s view that the funds included in the Morningstar category and in the peer group are not comparable to the Belmont Fund, and the Board was satisfied that Belmont had sufficiently differentiated the Belmont Fund from others in the peer group. Based on the foregoing, the Board concluded that the fees to be paid to Belmont by the Belmont Fund and the profits to be realized by Belmont, in light of all the facts and circumstances, were fair and reasonable in relation to the nature and quality of the services provided by Belmont.
4. The extent to which economies of scale would be realized as the Belmont Fund grows and whether advisory fee levels reflect these economies of scale for the benefit of the Belmont Fund’s investors. In this regard, the Board considered the Belmont Fund’s fee arrangements with Belmont. The Board considered that while the management fee remained the same at all asset levels, the Belmont Fund’s shareholders had experienced benefits from the Belmont Fund’s expense limitation arrangement, and that Belmont had agreed to extend that arrangement for another year.
| Investment Advisory Agreement Approval (Unaudited) (continued) |
They also noted that the Belmont Fund’s shareholders would continue to benefit from the economies of scale under the Trust’s agreements with service providers other than Belmont. In light of the foregoing, the Board determined that the Belmont Fund’s fee arrangements, in light of all the facts and circumstances, were fair and reasonable in relation to the nature and quality of the services provided by Belmont.
5. Possible conflicts of interest and benefits to Belmont. In considering Belmont’s practices regarding conflicts of interest, the Trustees evaluated the potential for conflicts of interest and considered such matters as the experience and ability of the advisory personnel assigned to the Belmont Fund; the basis of decisions to buy or sell securities for the Belmont Fund and/or Belmont’s other accounts; and the substance and administration of Belmont’s code of ethics. The Trustees also considered disclosure in the registration statement of the Trust relating to Belmont’s potential conflicts of interest. The Trustees discussed Belmont’s practices for seeking best execution for the Belmont Fund’s portfolio transactions. The Board noted that Belmont does not engage in soft dollar arrangements and has not identified any indirect benefits from its relationship with the Belmont Fund other than reputational benefit when marketing the Fund and its other separately managed account services. Based on the foregoing, the Board determined that Belmont’s standards and practices relating to the identification and mitigation of potential conflicts of interest were satisfactory.
After additional consideration of the factors delineated in the memorandum provided by counsel and further discussion among the Board members, the Board determined to approve the continuation of the Belmont Agreement.
Trustees and Officers (Unaudited)
The following table provides information regarding each of the Trustees.
Name, Address*, Age,
Position with Trust**,
Term of Position with
Trust | Principal Occupation
During Past 5 Years | Other Directorships |
| INDEPENDENT TRUSTEES |
Ira P. Cohen, 64
Independent Trustee
Since June 2010 | Current:Independent financial services consultant (since February 2005); Executive Vice President of Asset Management Services, Recognos Financial (since August 2015). | Trustee and Audit Committee Chairman, Apollo Diversified Real Estate Fund (since March 2022); Trustee, Chairman and Nominating and Governance Committee Chairman, Angel Oak Funds Trust (since October 2014) (7 portfolios); Trustee, Chairman, and Nominating and Governance Committee Chairman, Angel Oak Strategic Credit Fund (since December 2017); Trustee, Chairman, and Nominating and Governance Committee Chairman, Angel Oak Financial Strategies Income Term Trust (since May 2019); Trustee, Chairman, and Nominating and Governance Committee Chairman, Angel Oak Credit Opportunities Term Trust (since January 2021); Trustee and Nominating and Governance Committee Chairman, U.S. Fixed Income Trust (since March 2019). |
Andrea N. Mullins, 56
Independent Trustee
Since December 2013 Chairperson Since
March 2017 | Current:Private investor; Independent Contractor, SWM Advisors (since April 2014). | Trustee, Angel Oak Funds Trust (since February 2019) (7 portfolios); Trustee, Angel Oak Strategic Credit Fund (since February 2019); Trustee, Angel Oak Financial Strategies Income Term Trust (since May 2019); Trustee, Angel Oak Credit Opportunities Term Trust (since January 2021); Trustee and Audit Committee Chair, NXG Next Gen Infrastructure Income Fund (since November 2021); Trustee and Audit Committee Chair, NXG Cushing Midstream Energy Fund (since November 2021). |
| INTERESTED TRUSTEE |
Mark J. Seger***, 62
Trustee Since March
2017 | Current:Vice Chairman and Co-Founder, Ultimus Fund Solutions, LLC and its subsidiaries (since 1999). | None. |
| * | The address for each Trustee is 225 Pictoria Drive, Suite 450, Cincinnati, Ohio 45246. |
| ** | As of the date of this report, the Trust consists of 15 series. |
| *** | Mr. Seger is considered an “interested person” of the Trust because of his relationship with the Trust’s administrator, transfer agent, and distributors. |
| Trustees and Officers (Unaudited) (continued) |
The following table provides information regarding the Officers of the Trust:
Name, Address*, Age,
Position with Trust**,
Term of Position with
Trust | Principal Occupation During Past 5 Years |
Matthew J. Miller, 47
Principal Executive
Officer and
President Since March
2022 Vice President
From December 2011 to
March 2022 | Current:Vice President, Relationship Management, Ultimus Fund Solutions, LLC (since December 2015). |
N. Lynn Bowley, 65 Chief Compliance
Officer Since April 2022 | Current:Senior Vice President, Senior Compliance Officer,Northern Lights Compliance Services, LLC (since January 2007). |
Carol J. Highsmith, 59
Vice President Since
August 2008 Secretary Since March
2014 | Current:Vice President, Ultimus Fund Solutions, LLC (since December 2015). |
Zachary P. Richmond,43
Principal Financial
Officer and Treasurer
Since September 2021 | Current:Vice President, Financial Administration, Ultimus Fund Solutions, LLC (since February 2019). Previous:Assistant Vice President, Associate Director of Financial Administration, Ultimus Fund Solutions, LLC (December 2015 to February 2019). |
Jared D. Lahman, 37
AML Officer
Since March 2023 | Current:Senior Compliance Analyst, Northern Lights Compliance Services, LLC (since January 2019). Previous: Manager of Fund Accounting, Gemini Fund Services (September 2016 to December 2018) |
| * | The address for each Officer is 225 Pictoria Drive, Suite 450, Cincinnati, Ohio 45246. |
| ** | As of the date of this report, the Trust consists of 15 series. |
Other Information (Unaudited)
The Fund’s Statement of Additional Information (“SAI”) includes additional information about the trustees and is available without charge, upon request. You may call toll-free at (800) 789-1087 to request a copy of the SAI or to make shareholder inquiries.
| FACTS | WHAT DOES BELMONT THETA INCOME FUND (THE “FUND”) DO WITH YOUR PERSONAL INFORMATION? |
| |
| Why? | Financial companies choose how they share your personal information. Federal law gives consumers the right to limit some but not all sharing. Federal law also requires us to tell you how we collect, share, and protect your personal information. Please read this notice carefully to understand what we do. |
| |
| What? | The types of personal information we collect and share depend on the product or service you have with us. This information can include: |
| | |
| | ■ Social Security number |
| | |
| | ■ account balances and account transactions |
| | |
| | ■ transaction or loss history and purchase history |
| | |
| | ■ checking account information and wire transfer instructions |
| | |
| | When you are no longer our customer, we continue to share your information as described in this notice. |
| |
| How? | All financial companies need to share customers’ personal information to run their everyday business. In the section below, we list the reasons financial companies can share their customers’ personal information; the reasons the Fund chooses to share; and whether you can limit this sharing. |
| Reasons we can share your personal information | Does the Fund share? |
For our everyday business purposes—
such as to process your transactions, maintain your account(s), respond to court orders and legal investigations, or report to credit bureaus | Yes |
For our marketing purposes—
to offer our products and services to you | No |
| For joint marketing with other financial companies | No |
For our affiliates’ everyday business purposes—
information about your transactions and experiences | No |
For our affiliates’ everyday business purposes—
information about your creditworthiness | No |
| For nonaffiliates to market to you | No |
| Questions? | Call (800) 789-1087 |
| Who we are |
| Who is providing this notice? | Belmont Theta Income Fund
Ultimus Fund Distributors, LLC (Distributor)
Ultimus Fund Solutions, LLC (Administrator) |
| |
| What we do |
| How does the Fund protect my personal information? | To protect your personal information from unauthorized access and use, we use security measures that comply with federal law. These measures include computer safeguards and secured files and buildings. Our service providers are held accountable for adhering to strict policies and procedures to prevent any misuse of your nonpublic personal information. |
| How does the Fund collect my personal information? | We collect your personal information, for example, when you ■ open an account or deposit money ■ buy securities from us or sell securities to us ■ make deposits or withdrawals from your account ■ give us your account information ■ make a wire transfer ■ tell us who receives the money ■ tell us where to send the money ■ show your government-issued ID ■ show your driver’s license |
| Why can’t I limit all sharing? | Federal law gives you the right to limit only ■ sharing for affiliates’ everyday business purposes — information about your creditworthiness ■ affiliates from using your information to market to you ■ sharing for nonaffiliates to market to you State laws and individual companies may give you additional rights to limit sharing. |
| Definitions |
| Affiliates | Companies related by common ownership or control. They can be financial and nonfinancial companies. ■ Belmont Capital, LLC d/b/a Belmont Capital GroupTM., the investment adviser to the Fund, could be deemed to be an affiliate. |
| Nonaffiliates | Companies not related by common ownership or control. They can be financial and nonfinancial companies. ■ The Fund does not share your personal information with nonaffiliates so they can market to you |
| Joint marketing | A formal agreement between nonaffiliated financial companies that together market financial products or services to you. ■ The Fund does not jointly market. |
A description of the policies and procedures that the Fund uses to determine how to vote proxies relating to portfolio securities and information regarding how the Fund voted those proxies during the most recent twelve month period ended June 30, are available (1) without charge upon request by calling the Fund at (800) 789-1087 and (2) in Fund documents filed with the SEC on the SEC’s website at www.sec.gov.
TRUSTEES
Andrea N. Mullins, Chairperson
Ira P. Cohen
Mark J. Seger
| INDEPENDENT REGISTERED
PUBLIC ACCOUNTING FIRM
Cohen & Company, Ltd.
1350 Euclid Avenue, Suite 800
Cleveland, OH 44115
|
| | |
OFFICERS
Matthew J. Miller, Principal Executive Officer and
President
Zachary P. Richmond, Principal Financial Officer and
Treasurer
N. Lynn Bowley, Chief Compliance Officer
Carol J. Highsmith, Vice President and Secretary
| LEGAL COUNSEL
Troutman Pepper Hamilton Sanders LLP
3000 Two Logan Square
18th and Arch Streets
Philadelphia, PA 19103
|
| | |
INVESTMENT ADVISER
Belmont Capital, LLC d/b/a Belmont Capital Group™
1875 Century Park East, Suite 1780
Los Angeles,CA 90067 | CUSTODIAN
Huntington National Bank
41 South High Street
Columbus, OH 43215
|
| | |
DISTRIBUTOR
Ultimus Fund Distributors, LLC
225 Pictoria Drive, Suite 450
Cincinnati, OH 45246
| ADMINISTRATOR, TRANSFER
AGENT AND FUND ACCOUNTANT
Ultimus Fund Solutions, LLC
225 Pictoria Drive, Suite 450
Cincinnati, OH 45246 |
This report is intended only for the information of shareholders or those who have received the Fund’s prospectus which contains information about the Fund’s management fee and expenses. Please read the prospectus carefully before investing.
Distributed by Ultimus Fund Distributors, LLC
Member FINRA/SIPC
BELMONT-AR-24

Channing Intrinsic Value Small-Cap Fund
Institutional Class - OWLLX
Annual Report
January 31, 2024
Fund Adviser:
Channing Capital Management, LLC
10 S. LaSalle Street, Suite 2401
Chicago, IL 60603
(312) 223-0211
www.channingcapital.com
| Channing Intrinsic Value Small-Cap Fund |
| Management’s Discussion of Fund Performance |
| (Unaudited) |
| January 31, 2024 |
| |
2023 was full of surprises as investors went into the year with inflation, a potential soft landing and the risk of recession as the primary drivers of investor expectations for most of the year. In actuality, the strong rebound was a reflection of readjusted expectations of a recession that failed to materialize. Moreover, our intrinsic value approach took full advantage of this disconnect as many of our companies recovered much of what was lost in 2022 while posting results that underscore strength despite the risk of higher interest rates or an economic slowdown. In stark contrast to widely held expectations that a recession was imminent, stocks experienced gains driven by the largest and more growth-oriented areas of the market.
As we moved into the second half of the year, investors pulled back from the optimism that drove stocks up during the first half of the year. Higher interest rates coupled with rising oil prices following supply cuts from OPEC Plus increased anxiety among investors. Moreover, investors also contemplated how rates remaining higher for longer could weaken economic activity and hasten an expected slowdown or potential recession. Much of this negative sentiment reversed in the 4th quarter at the December FOMC meeting, as the FED signaled to the market that officials expected no additional fed funds rates increases, and the forward outlook dot-plot hinted that the FOMC would likely lower rates in 2024.
For the 1-year ended 1/31/2024, the Channing Small-Cap Value strategy outperformed the Russell 2000® Value Index. The top three performing sectors, relative to performance, were Industrials, Health Care, and Financials. Within Industrials, performance was broad-based, led by holdings in the Ground Transportation, Commercial Services & Supplies, and Professional Service industries. The Health Care sector outperformed the benchmark due to our underweight in the Biotechnology industry coupled with strong relative performance from our Health Care Equipment and Supplies holdings. Our underweight in the Financials sector combined with stock election among our banks contributed positively to performance as the strategy avoided the regional bank crisis that occurred earlier in the year.
The three lowest contributing sectors, relative to performance, were Consumer Staples, Energy, and Technology. The Consumer Staples sector detracted from overall portfolio performance due largely to our holding in the Food Products industry which failed to keep pace with the benchmark sector return. Our underweight position in Energy, while contributing positively to performance, was offset by stock selection as investors favored generally lower-quality companies. The Technology sector detracted from performance due to our overweight positions in the Electric Equipment, Semiconductors & Semiconductor Equipment industry, which is continuing to recover from “trough levels.”
| Channing Intrinsic Value Small-Cap Fund |
| Management’s Discussion of Fund Performance |
| (Unaudited) (continued) |
| January 31, 2024 |
| |
Overall, we like our positioning given the current environment. In the near term, we believe volatility will remain an ongoing theme as investors continue to seek safety while insulating themselves from the uncertainties of high inflation, interest rates, potentially slower global growth, and an uncertain market environment.
Wendell Mackey, CFA
Founder, Co-Chief Executive Officer & Chief Investment Officer
| Investment Results (Unaudited) |
| |
Total Returns* as of January 31, 2024
| | | | | Since |
| | | | | Inception |
| | | | | (June 30, |
| | | One Year | | 2021) |
| Channing Intrinsic Value Small-Cap Fund | | 4.72% | | (0.87)% |
| Russell 2000® Value Index(a) | | (0.09)% | | (2.06)% |
| | | | | |
Total annual operating expenses, as disclosed in the Channing Intrinsic Value Small-Cap Fund (the “Fund”) prospectus dated May 31, 2023, were 3.90% of average daily net assets (0.95% after fee waivers/expense reimbursements by Channing Capital Management, LLC (the “Adviser”)). The Adviser has contractually agreed to waive or limit its fees and to assume other expenses of the Fund until May 31, 2024, so that total annual fund operating expenses do not exceed 0.95%. This contractual arrangement may only be terminated by mutual consent of the Adviser and the Board of Trustees of Valued Advisers Trust (the “Trust”), and it will automatically terminate upon the termination of the investment advisory agreement between the Trust and the Adviser. This operating expense limitation does not apply to: (i) interest, (ii) taxes, (iii) brokerage commissions, (iv) other expenditures which are capitalized in accordance with generally accepted accounting principles, (v) other extraordinary expenses not incurred in the ordinary course of the Fund’s business, (vi) dividend expense on short sales, (vii) expenses incurred under a plan of distribution under Rule 12b-1, and (viii) expenses that the Fund has incurred but did not actually pay because of an expense offset arrangement, if applicable, in any fiscal year. The operating expense limitation also excludes any “Acquired Fund Fees and Expenses,” which are the expenses indirectly incurred by the Fund as a result of investing in money market funds or other investment companies, including exchange-traded funds, that have their own expenses. Each fee waiver or reimbursement of an expense by the Adviser is subject to repayment by the Fund within the three years following the date on which the fee waiver or expense reimbursement occurred, provided that the Fund is able to make the repayment without exceeding the expense limitation in place at the time of the waiver or reimbursement and the expense limitation in place at the time of the repayment. Additional information pertaining to the Fund’s expense ratios as of January 31, 2024 can be found in the financial highlights.
The performance quoted represents past performance, which does not guarantee future results. The investment return and principal value of an investment will fluctuate so that an investor’s shares, when redeemed, may be worth more or less than their original cost. The returns shown do not reflect deduction of taxes that a shareholder would pay on Fund distributions or the redemption of Fund shares. The Fund’s investment objectives, risks, charges and expenses must be considered carefully before investing. The prospectus contains this and other important information about the Fund and may be obtained by calling (833) 565-1919. Current performance of the Fund may be lower or higher than the performance quoted.
| * | Total returns reflect any change in price per share and assume the reinvestment of all distributions. The Fund’s returns reflect any fee reductions during the applicable periods. If such fee reductions had not occurred, the quoted performance would have been lower. |
| (a) | The Russell 2000® Value Index (“Index”) is a widely recognized unmanaged index of equity prices and is representative of a broader market and range of securities than are found in the Fund’s portfolio. The Index measures the performance of those Russell 2000® Index companies (the 2,000 smallest companies in the Russell 3000® Index (the 3,000 largest U.S. companies based on total market capitalization), which represents approximately 10% of the total market capitalization of |
| Investment Results (Unaudited) (continued) |
| |
the Russell 3000® Index) with lower price-to-book ratios and lower forecasted growth values. Individuals cannot invest directly in an index; however, an individual can invest in exchange-traded funds or other investment vehicles that attempt to track the performance of a benchmark index.
The Fund is distributed by Ultimus Fund Distributors, LLC, Member FINRA/SIPC.
Comparison of the Growth of a $100,000 Investment in the Channing Intrinsic Value Small-Cap Fund and the Russell 2000® Value Index.
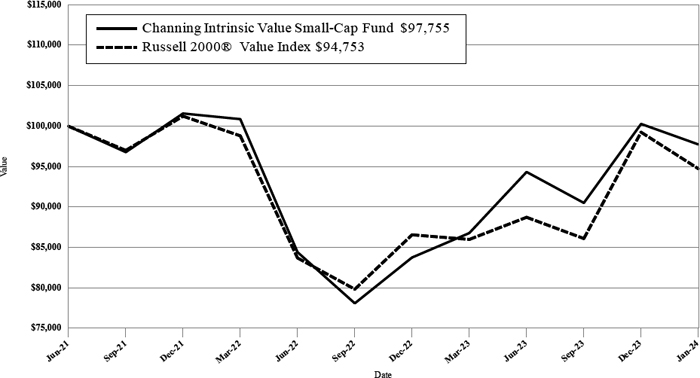
The chart above assumes an initial investment of $100,000 made on June 30, 2021 (commencement of operations) and held through January 31, 2024. THE FUND’S RETURN REPRESENTS PAST PERFORMANCE AND DOES NOT GUARANTEE FUTURE RESULTS. The returns shown do not reflect deduction of taxes that a shareholder would pay on Fund distributions or the redemption of Fund shares. Investment returns and principal values will fluctuate so that your shares, when redeemed, may be worth more or less than their original purchase price.
Current performance may be lower or higher than the performance data quoted. For more information on the Fund, and to obtain performance data current to the most recent month-end, or to request a prospectus, please call (833) 565-1919. You should carefully consider the investment objectives, potential risks, management fees, and charges and expenses of the Fund before investing. The Fund’s prospectus contains this and other information about the Fund and should be read carefully before investing.
The Fund is distributed by Ultimus Fund Distributors, LLC, Member FINRA/SIPC.
| Fund Holdings (Unaudited) |
| |
Channing Intrinsic Value Small-Cap Fund Holdings as of January 31, 2024*
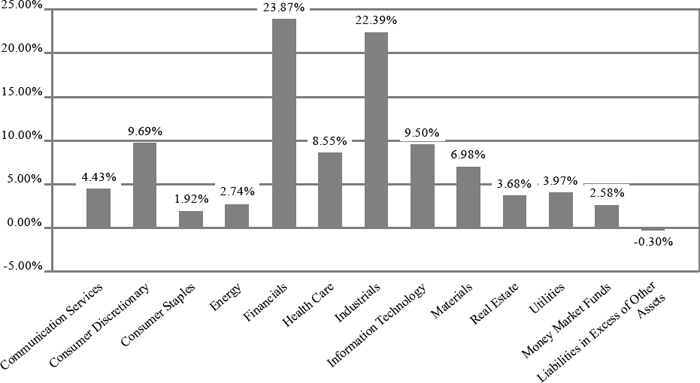
| * | As a percentage of net assets. |
The investment objective of the Fund is long-term capital appreciation.
| Availability of Portfolio Schedule (Unaudited) |
| |
The Fund files its complete schedule of portfolio holdings with the Securities and Exchange Commission (the “SEC”) for the first and third quarters of each fiscal year as an exhibit to its reports on Form N-PORT. The Fund’s Form N-PORT reports are available on the SEC’s website at http:// www.sec.gov and on the Fund’s website at www.channingcapital.com/mutual-fund.
| Channing Intrinsic Value Small-Cap Fund |
| Schedule of Investments |
| January 31, 2024 |
| |
| COMMON STOCKS — 97.72% | | Shares | | | Fair Value | |
| Communication Services — 4.43% | | | | | | | | |
| Madison Square Garden Entertainment Corp.(a) | | | 4,480 | | | $ | 149,363 | |
| Nexstar Media Group, Inc. | | | 902 | | | | 160,295 | |
| | | | | | | | 309,658 | |
| Consumer Discretionary — 9.69% | | | | | | | | |
| Asbury Automotive Group, Inc.(a) | | | 593 | | | | 123,973 | |
| Boyd Gaming Corp. | | | 2,168 | | | | 137,646 | |
| Installed Building Products, Inc. | | | 826 | | | | 160,946 | |
| OneSpaWorld Holdings Ltd.(a) | | | 7,398 | | | | 100,835 | |
| PVH Corp. | | | 1,277 | | | | 153,572 | |
| | | | | | | | 676,972 | |
| Consumer Staples — 1.92% | | | | | | | | |
| Darling Ingredients, Inc.(a) | | | 3,101 | | | | 134,273 | |
| | | | | | | | | |
| Energy — 2.74% | | | | | | | | |
| Patterson-UTI Energy, Inc. | | | 6,802 | | | | 75,434 | |
| SM Energy Co. | | | 3,134 | | | | 116,209 | |
| | | | | | | | 191,643 | |
| Financials — 23.87% | | | | | | | | |
| Affiliated Managers Group, Inc. | | | 1,070 | | | | 159,259 | |
| Artisan Partners Asset Management, Inc., Class A | | | 3,389 | | | | 141,999 | |
| Evercore, Inc., Class A | | | 1,073 | | | | 184,266 | |
| Hancock Whitney Corp. | | | 1,474 | | | | 66,492 | |
| Old National Bancorp | | | 11,250 | | | | 185,288 | |
| Pinnacle Financial Partners, Inc. | | | 1,977 | | | | 174,727 | |
| Selective Insurance Group, Inc. | | | 639 | | | | 67,006 | |
| SouthState Corp. | | | 1,858 | | | | 154,400 | |
| Stifel Financial Corp. | | | 2,571 | | | | 187,554 | |
| Synovus Financial Corp. | | | 4,934 | | | | 185,813 | |
| Wintrust Financial Corp. | | | 1,643 | | | | 159,338 | |
| | | | | | | | 1,666,142 | |
| Health Care — 8.55% | | | | | | | | |
| Enovis Corp.(a) | | | 3,558 | | | | 208,855 | |
| Integer Holdings Corp.(a) | | | 1,158 | | | | 117,329 | |
| Medpace Holdings, Inc.(a) | | | 426 | | | | 124,213 | |
| Merit Medical Systems, Inc.(a) | | | 1,875 | | | | 146,812 | |
| | | | | | | | 597,209 | |
| Industrials — 22.39% | | | | | | | | |
| Brink’s Co. (The) | | | 2,408 | | | | 194,663 | |
| Herc Holdings, Inc. | | | 1,285 | | | | 189,525 | |
| Hexcel Corp. | | | 2,424 | | | | 160,929 | |
| Hillenbrand, Inc. | | | 3,143 | | | | 146,370 | |
| MSA Safety, Inc. | | | 937 | | | | 154,633 | |
| Parsons Corp.(a) | | | 2,600 | | | | 169,390 | |
| SPX Technologies, Inc.(a) | | | 1,850 | | | | 186,184 | |
| Vestis Corp. | | | 8,836 | | | | 189,090 | |
| | | | | | | | | |
See accompanying notes which are an integral part of these financial statements.
| Channing Intrinsic Value Small-Cap Fund |
| Schedule of Investments (continued) |
| January 31, 2024 |
| |
| COMMON STOCKS — 97.72% - (continued) | | Shares | | | Fair Value | |
| Industrials — 22.39% - continued | | | | | | | | |
| XPO, Inc.(a) | | | 2,012 | | | $ | 171,905 | |
| | | | | | | | 1,562,689 | |
| Information Technology — 9.50% | | | | | | | | |
| Advanced Energy Industries, Inc. | | | 1,623 | | | | 169,084 | |
| Belden, Inc. | | | 2,366 | | | | 175,510 | |
| Diodes, Inc.(a) | | | 2,301 | | | | 154,903 | |
| IPG Photonics Corp.(a) | | | 1,675 | | | | 163,966 | |
| | | | | | | | 663,463 | |
| Materials — 6.98% | | | | | | | | |
| Allegheny Technologies, Inc.(a) | | | 3,362 | | | | 137,405 | |
| Avient Corp. | | | 4,754 | | | | 172,142 | |
| Louisiana-Pacific Corp. | | | 2,677 | | | | 178,155 | |
| | | | | | | | 487,702 | |
| Real Estate — 3.68% | | | | | | | | |
| Corporate Office Properties Trust | | | 5,230 | | | | 123,219 | |
| STAG Industrial, Inc. | | | 3,618 | | | | 133,649 | |
| | | | | | | | 256,868 | |
| Utilities — 3.97% | | | | | | | | |
| Portland General Electric Co. | | | 2,959 | | | | 121,112 | |
| Southwest Gas Holdings, Inc. | | | 2,659 | | | | 156,030 | |
| | | | | | | | 277,142 | |
| Total Common Stocks (Cost $5,873,451) | | | | | | | 6,823,761 | |
| | | | | | | | | |
| MONEY MARKET FUNDS - 2.58% | | | | | | | | |
| First American Treasury Obligations Fund, Class X, 5.28%(b) | | | 180,146 | | | | 180,146 | |
| Total Money Market Funds (Cost $180,146) | | | | | | | 180,146 | |
| Total Investments — 100.30% (Cost $6,053,597) | | | | | | | 7,003,907 | |
| Liabilities in Excess of Other Assets — (0.30)% | | | | | | | (21,036 | ) |
| NET ASSETS — 100.00% | | | | | | $ | 6,982,871 | |
| | | | | | | | | |
| (a) | Non-income producing security. |
| (b) | Rate disclosed is the seven day effective yield as of January 31, 2024. |
The sectors shown on the schedule of investments are based on the Global Industry Classification Standard, or GICS® (“GICS”). The GICS was developed by and/or is the exclusive property of MSCI, Inc. and Standard & Poor’s Financial Services LLC (“S&P”). GICS is a service mark of MSCI, Inc. and S&P and has been licensed for use by Ultimus Fund Solutions, LLC.
See accompanying notes which are an integral part of these financial statements.
| Channing Intrinsic Value Small-Cap Fund |
| Statement of Assets and Liabilities |
| January 31, 2024 |
| |
| Assets | | | |
| Investments in securities at fair value (cost $6,053,597) (Note 3) | | $ | 7,003,907 | |
| Dividends receivable | | | 1,767 | |
| Receivable from Adviser (Note 4) | | | 12,767 | |
| Prepaid expenses | | | 3,913 | |
| Total Assets | | | 7,022,354 | |
| Liabilities | | | | |
| Payable to affiliates (Note 4) | | | 10,335 | |
| Payable to trustees | | | 1,198 | |
| Other accrued expenses | | | 27,950 | |
| Total Liabilities | | | 39,483 | |
| Net Assets | | $ | 6,982,871 | |
| Net Assets consist of: | | | | |
| Paid-in capital | | $ | 7,193,072 | |
| Accumulated deficit | | | (210,201 | ) |
| Net Assets | | $ | 6,982,871 | |
| Shares outstanding (unlimited number of shares authorized, no par value) | | | 722,790 | |
| Net asset value, offering and redemption price per share (Note 2) | | $ | 9.66 | |
| | | | | |
See accompanying notes which are an integral part of these financial statements.
| Channing Intrinsic Value Small-Cap Fund |
| Statement of Operations |
| For the year ended January 31, 2024 |
| |
| Investment Income | | | | |
| Dividend income | | $ | 98,867 | |
| Total investment income | | | 98,867 | |
| | | | | |
| Expenses | | | | |
| Investment Adviser fees (Note 4) | | | 47,902 | |
| Administration and fund accounting fees (Note 4) | | | 63,250 | |
| Legal fees | | | 25,572 | |
| Compliance service fees (Note 4) | | | 20,834 | |
| Audit and tax preparation fees | | | 18,832 | |
| Transfer agent fees (Note 4) | | | 15,957 | |
| Custodian fees | | | 10,215 | |
| Printing and postage expenses | | | 8,568 | |
| Registration expenses | | | 8,390 | |
| Trustee fees | | | 7,388 | |
| Miscellaneous expense | | | 26,297 | |
| Total expenses | | | 253,205 | |
| Fees contractually waived and expenses reimbursed by Adviser (Note 4) | | | (188,169 | ) |
| Net operating expenses | | | 65,036 | |
| Net investment income | | | 33,831 | |
| | | | | |
| Net Realized and Change in Unrealized Gain (Loss) on Investments | | | | |
| Net realized loss on investment securities transactions | | | (429,213 | ) |
| Net change in unrealized appreciation on investment securities | | | 747,582 | |
| Net realized and change in unrealized gain on investments | | | 318,369 | |
| Net increase in net assets resulting from operations | | $ | 352,200 | |
| | | | | |
See accompanying notes which are an integral part of these financial statements.
| Channing Intrinsic Value Small-Cap Fund |
| Statements of Changes in Net Assets |
| |
| | | For the Year Ended | | | For the Year Ended | |
| | | January 31, 2024 | | | January 31, 2023 | |
| Increase (Decrease) in Net Assets due to: | | | | | | | | |
| Operations | | | | | | | | |
| Net investment income | | $ | 33,831 | | | $ | 20,286 | |
| Net realized loss on investment securities transactions | | | (429,213 | ) | | | (720,633 | ) |
| Net change in unrealized appreciation of investment securities | | | 747,582 | | | | 215,297 | |
| Net increase (decrease) in net assets resulting from operations | | | 352,200 | | | | (485,050 | ) |
| | | | | | | | | |
| Distributions to shareholders from Earnings (Note 2) | | | (35,258 | ) | | | (26,908 | ) |
| Total distributions | | | (35,258 | ) | | | (26,908 | ) |
| | | | | | | | | |
| Capital Transactions - Institutional Class: | | | | | | | | |
| Proceeds from shares sold | | | 10,000 | | | | 6,050,000 | |
| Reinvestment of distributions | | | 32,068 | | | | 24,682 | |
| Amount paid for shares redeemed | | | (700,000 | ) | | | (106,643 | ) |
| Net increase (decrease) in net assets resulting from capital transactions | | | (657,932 | ) | | | 5,968,039 | |
| Total Increase (Decrease) in Net Assets | | | (340,990 | ) | | | 5,456,081 | |
| | | | | | | | | |
| Net Assets | | | | | | | | |
| Beginning of year | | | 7,323,861 | | | | 1,867,780 | |
| End of year | | $ | 6,982,871 | | | $ | 7,323,861 | |
| | | | | | | | | |
| Share Transactions - Institutional Class: | | | | | | | | |
| Shares sold | | | 1,185 | | | | 608,018 | |
| Shares issued in reinvestment of distributions | | | 3,249 | | | | 2,999 | |
| Shares redeemed | | | (71,429 | ) | | | (12,487 | ) |
| Net increase (decrease) in shares | | | (66,995 | ) | | | 598,530 | |
| | | | | | | | | |
See accompanying notes which are an integral part of these financial statements.
| Channing Intrinsic Value Small-Cap Fund - Institutional Class |
| Financial Highlights |
| |
| (For a share outstanding during each period) |
| |
| | | | | | | | | For the | |
| | | | | | | | | Period | |
| | | For the Years Ended | | | Ended | |
| | | January 31, | | | January 31, | |
| | | 2024 | | | 2023 | | | 2022(a) | |
| Selected Per Share Data: | | | | | | | | | | | | |
| Net asset value, beginning of period | | $ | 9.27 | | | $ | 9.77 | | | $ | 10.00 | |
| | | | | | | | | | | | | |
| Investment operations: | | | | | | | | | | | | |
| Net investment income | | | 0.05 | | | | 0.03 | | | | 0.02 | |
| Net realized and unrealized gain (loss) on investments | | | 0.39 | | | | (0.50 | ) | | | (0.22 | ) |
| Total from investment operations | | | 0.44 | | | | (0.47 | ) | | | (0.20 | ) |
| | | | | | | | | | | | | |
| Less distributions to shareholders from: | | | | | | | | | | | | |
| Net investment income | | | (0.05 | ) | | | (0.03 | ) | | | (0.03 | ) |
| Total distributions | | | (0.05 | ) | | | (0.03 | ) | | | (0.03 | ) |
| | | | | | | | | | | | | |
| Net asset value, end of period | | $ | 9.66 | | | $ | 9.27 | | | $ | 9.77 | |
| | | | | | | | | | | | | |
| Total Return(b) | | | 4.72 | % | | | (4.72 | )% | | | (2.03 | )% (c) |
| | | | | | | | | | | | | |
| Ratios and Supplemental Data: | | | | | | | | | | | | |
| Net assets, end of period (000 omitted) | | $ | 6,983 | | | $ | 7,324 | | | $ | 1,868 | |
| Ratio of net expenses to average net assets | | | 0.95 | % | | | 0.95 | % | | | 0.95 | % (d) |
| Ratio of expenses to average net assets before waiver and reimbursement | | | 3.70 | % | | | 3.90 | % | | | 12.86 | % (d) |
| Ratio of net investment income to average net assets | | | 0.49 | % | | | 0.34 | % | | | 0.27 | % (d) |
| Portfolio turnover rate | | | 65 | % | | | 72 | % | | | 23 | % (c) |
| | | | | | | | | | | | | |
| (a) | For the period June 30, 2021 (commencement of operations) to January 31, 2022. |
| (b) | Total return represents the rate that the investor would have earned or lost on an investment in the Fund, assuming reinvestment of distributions. |
See accompanying notes which are an integral part of these financial statements.
| Channing Intrinsic Value Small-Cap Fund |
| Notes to the Financial Statements |
| January 31, 2024 |
| |
NOTE 1. ORGANIZATION
The Channing Intrinsic Value Small-Cap Fund (the “Fund”) is registered under the Investment Company Act of 1940, as amended (“1940 Act”), as an open-end diversified series of Valued Advisers Trust (the “Trust”). The Trust is a management investment company established under the laws of Delaware by an Agreement and Declaration of Trust dated June 13, 2008 (the “Trust Agreement”). The Trust Agreement permits the Board of Trustees (the “Board” or “Trustees”) to issue an unlimited number of shares of beneficial interest of separate series without par value. The Fund is one of a series of funds authorized by the Board. The Fund currently offers one class of shares: Institutional Shares. The Fund commenced operations on June 30, 2021. The Fund’s investment adviser is Channing Capital Management, LLC (the “Adviser”). The investment objective of the Fund is long-term capital appreciation.
NOTE 2. SIGNIFICANT ACCOUNTING POLICIES
The Fund is an investment company and follows accounting and reporting guidance under Financial Accounting Standards Board Accounting Standards Codification (“ASC”) Topic 946, “Financial Services-Investment Companies”. The following is a summary of significant accounting policies followed by the Fund in the preparation of its financial statements. These policies are in conformity with generally accepted accounting principles in the United States of America (“GAAP”).
Regulatory Update – Tailored Shareholder Reports for Mutual Funds and Exchange-Traded Funds (“ETFs”) – Effective January 24, 2023, the Securities and Exchange Commission adopted rule and form amendments that will result in changes to the design and delivery of shareholder reports of mutual funds and ETFs, requiring them to transmit concise and visually engaging streamlined annual and semi-annual reports to shareholders that highlight key information. Other information, including financial statements, will no longer appear in a streamlined shareholder report but must be available online, delivered free of charge upon request, and filed on a semi-annual basis on Form N-CSR. The rule and form amendments have a compliance date of July 24, 2024.
Estimates – The preparation of financial statements in conformity with GAAP requires management to make estimates and assumptions that affect the reported amounts of assets and liabilities and disclosure of contingent assets and liabilities at the date of the financial statements and the reported amounts of increases and decreases in net assets from operations during the reporting period. Actual results could differ from those estimates.
Federal Income Taxes – The Fund makes no provision for federal income or excise tax. The Fund intends to qualify each year as a regulated investment company (“RIC”) under
| Channing Intrinsic Value Small-Cap Fund |
| Notes to the Financial Statements (continued) |
| January 31, 2024 |
| |
subchapter M of the Internal Revenue Code of 1986, as amended, by complying with the requirements applicable to RICs and by distributing substantially all of its taxable income. The Fund also intends to distribute sufficient net investment income and net realized capital gains, if any, so that it will not be subject to excise tax on undistributed income and gains. If the required amount of net investment income or gains is not distributed, the Fund could incur a tax expense.
As of and during the fiscal year ended January 31, 2024, the Fund did not have any liabilities for any unrecognized tax benefits. The Fund recognizes interest and penalties, if any, related to unrecognized tax benefits as income tax expense on the Statement of Operations when incurred. During the fiscal year ended January 31, 2024, the Fund did not incur any interest or penalties. Management of the Fund has reviewed tax positions taken in tax years that remain subject to examination by all major tax jurisdictions, including federal (i.e., the last tax year end and the interim tax period since then, as applicable). Management believes that there is no tax liability resulting from unrecognized tax benefits related to uncertain tax positions taken.
Expenses – Expenses incurred by the Trust that do not relate to a specific fund of the Trust are allocated to the individual funds of the Trust based on each fund’s relative net assets or another appropriate basis (as determined by the Board).
Security Transactions and Related Income – The Fund follows industry practice and records security transactions on the trade date for financial reporting purposes. The specific identification method is used for determining gains or losses for financial statement and income tax purposes. Dividend income is recorded on the ex-dividend date.
The calendar year end classification of distributions received from REITs during the fiscal year are reported subsequent to year end; accordingly, the Fund estimates the character of REIT distributions based on the most recent information available. Non-cash income, if any, is recorded at the fair market value of the securities received. Withholding taxes on foreign dividends, if any, have been provided for in accordance with the Fund’s understanding of the applicable country’s tax rules and rates.
Dividends and Distributions – The Fund intends to distribute its net investment income and net realized long-term and short-term capital gains, if any, at least annually. Dividends and distributions to shareholders, which are determined in accordance with income tax regulations, are recorded on the ex-dividend date. The treatment for financial reporting purposes of distributions made to shareholders during the period from net investment income or net realized capital gains may differ from their ultimate treatment for federal income tax purposes. These differences are caused primarily by differences in the timing of the recognition of certain components of income, expense or realized capital gain for
| Channing Intrinsic Value Small-Cap Fund |
| Notes to the Financial Statements (continued) |
| January 31, 2024 |
| |
federal income tax purposes. Where such differences are permanent in nature, they are reclassified among the components of net assets based on their ultimate characterization for federal income tax purposes. Any such reclassifications will have no effect on net assets, results of operations or Net Asset Value (“NAV”) per share of the Fund.
For the fiscal year ended January 31, 2024, the Fund made the following reclassifications to increase (decrease) the components of net assets:
| | | | Accumulated Earnings | |
| Paid-In Capital | | | (Deficit) | |
| $ | (1,355 | ) | | $ | 1,355 | |
| | | | | | | |
Share Valuation – The NAV is calculated each day the New York Stock Exchange (the “NYSE”) is open by dividing the total value of the Fund’s assets, less liabilities, by the number of shares outstanding for the Fund.
NOTE 3. SECURITIES VALUATION AND FAIR VALUE MEASUREMENTS
The Fund values its portfolio securities at fair value as of the close of regular trading on the NYSE (normally 4:00 p.m. Eastern time) on each business day the NYSE is open for business. Fair value is defined as the price that the Fund would receive upon selling an investment in a timely transaction to an independent buyer in the principal or most advantageous market of the investment. GAAP establishes a three-tier hierarchy to maximize the use of observable market data and minimize the use of unobservable inputs and to establish classification of fair value measurements for disclosure purposes.
Inputs refer broadly to the assumptions that market participants would use in pricing the asset or liability, including assumptions about risk (the risk inherent in a particular valuation technique used to measure fair value including a pricing model and/or the risk inherent in the inputs to the valuation technique). Inputs may be observable or unobservable. Observable inputs are inputs that reflect the assumptions market participants would use in pricing the asset or liability developed based on market data obtained and available from sources independent of the reporting entity. Unobservable inputs are inputs that reflect the reporting entity’s own assumptions about the assumptions market participants would use in pricing the asset or liability developed based on the best information available in the circumstances.
Various inputs are used in determining the value of the Fund’s investments. These inputs are summarized in the three broad levels listed below.
| ● | Level 1 – unadjusted quoted prices in active markets for identical investments and/or registered investment companies where the value per share is determined and published |
| Channing Intrinsic Value Small-Cap Fund |
| Notes to the Financial Statements (continued) |
| January 31, 2024 |
| |
and is the basis for current transactions for identical assets or liabilities at the valuation date
| ● | Level 2 – other significant observable inputs (including, but not limited to, quoted prices for an identical security in an inactive market, quoted prices for similar securities, interest rates, prepayment speeds, credit risk, etc.) |
| ● | Level 3 – significant unobservable inputs (including the Fund’s own assumptions in determining fair value of investments based on the best information available) |
The inputs used to measure fair value may fall into different levels of the fair value hierarchy. In such cases, for disclosure purposes, the level in the fair value hierarchy which is reported is determined based on the lowest level input that is significant to the fair value measurement in its entirety.
Equity securities that are traded on any stock exchange are generally valued at the last quoted sale price on the security’s primary exchange. Lacking a last sale price, an exchange-traded security is generally valued at its last bid price. Securities traded in the Nasdaq over-the-counter market are generally valued at the Nasdaq Official Closing Price. When using the market quotations and when the market is considered active, the security is classified as a Level 1 security. In the event that market quotations are not readily available or are considered unreliable due to market or other events, securities are valued in good faith by the Adviser as “Valuation Designee” under the oversight of the Board. The Adviser has adopted written policies and procedures for valuing securities and other assets in circumstances where market quotes are not readily available. In the event that market quotes are not readily available, and the security or asset cannot be valued pursuant to one of the valuation methods, the value of the security or asset will be determined in good faith by the Adviser pursuant to its policies and procedures. On a quarterly basis, the Adviser’s fair valuation determinations will be reviewed by the Board. Under these policies, the securities will be classified as Level 2 or 3 within the fair value hierarchy, depending on the inputs used.
Investments in mutual funds, including money market mutual funds, are generally priced at the ending NAV as reported by the underlying Fund companies. These securities are categorized as Level 1 securities.
In accordance with the Trust’s valuation policies and fair value determinations pursuant to Rule 2a-5 under the 1940 Act, the Adviser as Valuation Designee is required to consider all appropriate factors relevant to the value of securities for which it has determined other pricing sources are not available or reliable as described above. No single method exists for determining fair value, because fair value depends upon the circumstances of each
| Channing Intrinsic Value Small-Cap Fund |
| Notes to the Financial Statements (continued) |
| January 31, 2024 |
| |
individual case. As a general principle, the current fair value of a security being valued by the Valuation Designee would be the amount that the Funds might reasonably expect to receive upon the current sale. Methods that are in accordance with this principle may, for example, be based on (i) a multiple of earnings; (ii) a discount from market prices of a similar freely traded security (including a derivative security or a basket of securities traded on other markets, exchanges or among dealers); or (iii) yield to maturity with respect to debt issues, or a combination of these and other methods. Fair-value pricing is permitted if, in the Valuation Designee’s opinion, the validity of market quotations appears to be questionable based on factors such as evidence of a thin market in the security based on a small number of quotations, a significant event occurs after the close of a market but before the Fund’s NAV calculation that may affect a security’s value, or the Valuation Designee is aware of any other data that calls into question the reliability of market quotations.
The following is a summary of the inputs used to value the Fund’s investments as of January 31, 2024:
| | | Valuation Inputs | | | | |
| Assets | | Level 1 | | | Level 2 | | | Level 3 | | | Total | |
| Common Stocks(a) | | $ | 6,823,761 | | | $ | — | | | $ | — | | | $ | 6,823,761 | |
| Money Market Funds | | | 180,146 | | | | — | | | | — | | | | 180,146 | |
| Total | | $ | 7,003,907 | | | $ | — | | | $ | — | | | $ | 7,003,907 | |
| | | | | | | | | | | | | | | | | |
| (a) | Refer to Schedule of Investments for sector classifications. |
The Fund did not hold any investments at the end of the reporting period for which significant unobservable inputs (Level 3) were used in determining fair value; therefore, no reconciliation of Level 3 securities is included for this reporting period.
NOTE 4. FEES AND OTHER TRANSACTIONS WITH AFFILIATES AND OTHER SERVICE PROVIDERS
Under the terms of the investment advisory agreement, on behalf of the Fund (the “Agreement”), the Adviser manages the Fund’s investments subject to oversight of the Board. As compensation for its services, the Fund pays the Adviser a fee, computed and accrued daily and paid monthly at an annual rate of 0.70% of the average daily net assets of the Fund. For the fiscal year ended January 31, 2024, the Adviser earned a fee of $47,902 from the Fund before the waivers and reimbursements described below. At January 31, 2024, the Adviser owed the Fund $12,767.
The Adviser has contractually agreed to waive or limit its fees and to assume other expenses of the Fund until May 31, 2024, so that total annual fund operating expenses do not exceed 0.95%. This contractual arrangement may only be terminated by mutual consent of the Adviser and the Board, and it will automatically terminate upon the termination of the
| Channing Intrinsic Value Small-Cap Fund |
| Notes to the Financial Statements (continued) |
| January 31, 2024 |
| |
investment advisory agreement between the Trust and the Adviser. This operating expense limitation does not apply to: (i) interest, (ii) taxes, (iii) brokerage commissions, (iv) other expenditures which are capitalized in accordance with GAAP, (v) other extraordinary expenses not incurred in the ordinary course of the Fund’s business, (vi) dividend expense on short sales, (vii) expenses incurred under a plan of distribution under Rule 12b-1, and (viii) expenses that the Fund has incurred but did not actually pay because of an expense offset arrangement, if applicable, in any fiscal year. The operating expense limitation also excludes any “Acquired Fund Fees and Expenses,” which are the expenses indirectly incurred by the Fund as a result of investing in money market funds or other investment companies, including exchange-traded funds, that have their own expenses.
Each fee waiver or expense reimbursement by the Adviser is subject to repayment by the Fund within the three years following the date the fee waiver or expense reimbursement occurred, provided that the Fund is able to make the repayment without exceeding the expense limitation that is in effect at the time of the repayment or at the time of the fee waiver or expense reimbursement, whichever is lower. For the fiscal year ended January 31, 2024, the Adviser waived fees or reimbursed expenses totaling $188,169. As of January 31, 2024, the Adviser may seek repayment of investment advisory fee waivers and expense reimbursements as follows:
| Recoverable Through | | | |
| January 31, 2025 | | $ | 105,136 | |
| January 31, 2026 | | | 173,901 | |
| January 31, 2027 | | | 188,169 | |
| | | | | |
Ultimus Fund Solutions, LLC (“Ultimus”) provides administration, fund accounting and transfer agent services to the Fund. The Fund pays Ultimus fees in accordance with the agreements for such services.
Northern Lights Compliance Services, LLC (“NLCS”), an affiliate of Ultimus, provides a Chief Compliance Officer and an Anti-money Laundering Officer to the Trust, as well as related compliance services, pursuant to a consulting agreement between NLCS and the Trust. Under the terms of such agreement, NLCS receives fees from the Fund.
The officers and one trustee of the Trust are members of management and/or employees of Ultimus or of NLCS, and are not paid by the Trust for services to the Fund. Ultimus Fund Distributors, LLC (the “Distributor”) acts as the distributor of the Fund’s shares. The Distributor is a wholly-owned subsidiary of Ultimus. There were no payments made to the Distributor by the Fund for the fiscal year ended January 31, 2024.
| Channing Intrinsic Value Small-Cap Fund |
| Notes to the Financial Statements (continued) |
| January 31, 2024 |
| |
NOTE 5. PURCHASES AND SALES OF SECURITIES
For the fiscal year ended January 31, 2024, purchases and sales of investment securities, other than short-term investments, were $4,407,093 and $5,003,279, respectively.
There were no purchases or sales of long-term U.S. government obligations during the fiscal year ended January 31, 2024.
NOTE 6. FEDERAL TAX INFORMATION
At January 31, 2024, the net unrealized appreciation (depreciation) and tax cost of investments for tax purposes was as follows:
| Gross unrealized appreciation | | $ | 1,006,394 | |
| Gross unrealized depreciation | | | (141,150 | ) |
| Net unrealized appreciation on investments | | | 865,244 | |
| Tax cost of investments | | $ | 6,138,663 | |
| | | | | |
At January 31, 2024, the difference between book basis and tax basis unrealized appreciation (depreciation) is attributable to the tax deferral of losses on wash sales.
The tax character of distributions paid for the years ended January 31, 2024 and January 31, 2023 were as follows:
| | | 2024 | | | 2023 | |
| Distributions paid from: | | | |
| Ordinary income(a) | | $ | 35,258 | | | $ | 26,908 | |
| Total distributions paid | | $ | 35,258 | | | $ | 26,908 | |
| | | | | | | | | |
| (a) | Short-term capital gain distributions are treated as ordinary income for tax purposes. |
At January 31, 2024, the components of accumulated earnings (deficit) on a tax basis were as follows:
| Accumulated capital and other losses | | $ | (1,075,445 | ) |
| Unrealized appreciation on investments | | | 865,244 | |
| Total accumulated deficit | | $ | (210,201 | ) |
| | | | | |
As of January 31, 2024, the Fund had short-term and long-term capital loss carryforwards of $581,620 and $489,868, respectively. These capital loss carryforwards, which do not expire, may be utilized in future years to offset net realized capital gains, if any, prior to distributing such gains to shareholders. As of January 31, 2024, the Fund had deferred Qualified Late Year Ordinary losses of $3,957.
| Channing Intrinsic Value Small-Cap Fund |
| Notes to the Financial Statements (continued) |
| January 31, 2024 |
| |
NOTE 7. COMMITMENTS AND CONTINGENCIES
The Trust indemnifies its officers and Trustees for certain liabilities that may arise from their performance of their duties to the Trust or the Fund. Additionally, in the normal course of business, the Trust enters into contracts that contain a variety of representations and warranties which provide general indemnifications. The Trust’s maximum exposure under these arrangements is unknown, as this would involve future claims that may be made against the Trust that have not yet occurred.
NOTE 8. SUBSEQUENT EVENTS
Management of the Fund has evaluated the need for disclosures and/or adjustments resulting from subsequent events through the date at which these financial statements were issued. Based upon this evaluation, management has determined there were no items requiring adjustment of the financial statements or additional disclosure.
| Report of Independent Registered Public Accounting Firm |
| |
To the Shareholders of Channing Intrinsic Value Small-Cap Fund and
Board of Trustees of Valued Advisers Trust
Opinion on the Financial Statements
We have audited the accompanying statement of assets and liabilities, including the schedule of investments, of Channing Intrinsic Value Small-Cap Fund (the “Fund”), a series of Valued Advisers Trust, as of January 31, 2024, the related statement of operations for the year then ended, the statements of changes in net assets for each of the two years in the period then ended, the related notes, and the financial highlights for the years ended January 31, 2024 and January 31, 2023, and the period June 30, 2021 (commencement of operations) through January 31, 2022 (collectively referred to as the “financial statements”). In our opinion, the financial statements present fairly, in all material respects, the financial position of the Fund as of January 31, 2024, the results of its operations for the year then ended, the changes in net assets for each of the two years in the period then ended, and the financial highlights for the years ended January 31, 2024 and January 31, 2023, and the period June 30, 2021 (commencement of operations) through January 31, 2022, in conformity with accounting principles generally accepted in the United States of America.
Basis for Opinion
These financial statements are the responsibility of the Fund’s management. Our responsibility is to express an opinion on the Fund’s financial statements based on our audits. We are a public accounting firm registered with the Public Company Accounting Oversight Board (United States) (“PCAOB”) and are required to be independent with respect to the Fund in accordance with the U.S. federal securities laws and the applicable rules and regulations of the Securities and Exchange Commission and the PCAOB.
We conducted our audits in accordance with the standards of the PCAOB. Those standards require that we plan and perform the audit to obtain reasonable assurance about whether the financial statements are free of material misstatement whether due to error or fraud.
Our audits included performing procedures to assess the risks of material misstatement of the financial statements, whether due to error or fraud, and performing procedures that respond to those risks. Such procedures included examining, on a test basis, evidence regarding the amounts and disclosures in the financial statements. Our procedures included confirmation of securities owned as of January 31, 2024, by correspondence with the custodian. Our audits also included evaluating the accounting principles used and significant estimates made by management, as well as evaluating the overall presentation of the financial statements. We believe that our audits provide a reasonable basis for our opinion.
We have served as the Fund’s auditor since 2021.
COHEN & COMPANY, LTD.
Cleveland, Ohio
March 27, 2024
| Liquidity Risk Management Program (Unaudited) |
| |
Valued Advisers Trust has adopted and implemented a written liquidity risk management program as required by Rule 22e-4 (the “Liquidity Rule”) under the Investment Company Act. The program is reasonably designed to assess and manage the Fund’s liquidity risk, taking into consideration, among other factors, the Fund’s investment strategy and the liquidity of its portfolio investments during normal and reasonably foreseeable stressed conditions; its short and long-term cash flow projections; and its cash holdings and access to other funding sources. The Board of Trustees approved the appointment of a Liquidity Administrator Committee, which includes representatives from Channing Capital Management, LLC, the Fund’s investment adviser, and Ultimus Fund Solutions, LLC, the Fund’s Administrator. The Liquidity Administrator Committee is responsible for the program’s administration and oversight and for reporting to the Board on at least an annual basis regarding the program’s operation and effectiveness. The Liquidity Administrator Committee updated its assessment of the Fund’s liquidity risk profile, considering additional data gathered during the period June 1, 2022 through May 31, 2023 (the “Review Period”) and the adequacy and effectiveness of the liquidity risk management program’s operations during the Review Period in order to prepare a written report for the Board of Trustees (the “Report”) for consideration at its meeting held on September 8, 2023. The Report noted that during the Review Period the Fund did not experience unusual stress or disruption to its operations related to purchase and redemption activity. It further noted that during the Review Period the Fund held adequate levels of cash and highly liquid investments to meet shareholder redemption activities in accordance with applicable requirements. The Report concluded that (i) the Trust’s liquidity risk management program is reasonably designed to prevent violations of the Liquidity Rule and (ii) the Trust’s liquidity risk management program had been effectively implemented during the Review Period.
| Summary of Fund Expenses (Unaudited) |
| |
As a shareholder of the Fund, you incur two types of costs: (1) transaction and (2) ongoing costs, including management fees and other Fund expenses. These examples are intended to help you understand your ongoing costs (in dollars) of investing in the Fund and to compare these costs with the ongoing costs of investing in other funds. The example is based on an investment of $1,000 invested at the beginning of the period and held for the entire period from August 1, 2023 through January 31, 2024.
Actual Expenses
The first line of the table below provides information about actual account values and actual expenses. You may use the information in this line, together with the amount you invested, to estimate the expenses that you paid over the period. Simply divide your account value by $1,000 (for example, an $8,600 account value divided by $1,000 = 8.6), then multiply the result by the number in the first line under the heading “Expenses Paid During Period” to estimate the expenses you paid on your account during this period.
Hypothetical Example for Comparison Purposes
The second line of the table below provides information about hypothetical account values and hypothetical expenses based on the Fund’s actual expense ratio and an assumed rate of return of 5% per year before expenses, which is not the Fund’s actual return. The hypothetical account values and expenses may not be used to estimate the actual ending account balance or expenses you paid for the period. You may use this information to compare the ongoing costs of investing in the Fund and other funds. To do so, compare this 5% hypothetical example with the 5% hypothetical examples that appear in the shareholder reports of other funds.
Expenses shown in the table are meant to highlight your ongoing costs only and do not reflect any transactional costs. Therefore, the second line of the table below is useful in comparing ongoing costs only and will not help you determine the relative total costs of owning different funds. In addition, if transaction costs were included, your costs would have been higher.
| | | Beginning | | | Ending | | | | | | |
| | | Account | | | Account | | | Expenses | | | |
| | | Value | | | Value | | | Paid | | | Annualized |
| | | August 1, | | | January 31, | | | During | | | Expense |
| | | 2023 | | | 2024 | | | Period(a) | | | Ratio |
| Actual | | $ | 1,000.00 | | | $ | 990.60 | | | $ | 4.77 | | | 0.95% |
| Hypothetical(b) | | $ | 1,000.00 | | | $ | 1,020.42 | | | $ | 4.84 | | | 0.95% |
| | | | | | | | | | | | | | | |
| (a) | Expenses are equal to the Fund’s annualized expense ratios, multiplied by the average account value over the period, multiplied by 184/365 (to reflect the one-half year period). |
| (b) | Hypothetical assumes 5% annual return before expenses. |
| Additional Federal Income Tax Information (Unaudited) |
| |
The Form 1099-DIV you receive in January 2025 will show the tax status of all distributions paid to your account in calendar year 2024. Shareholders are advised to consult their own tax adviser with respect to the tax consequences of their investment in the Fund. As required by the Internal Revenue Code and/or regulations, shareholders must be notified regarding the status of qualified dividend income for individuals and the dividends received deduction for corporations.
Qualified Dividend Income. The Fund designates approximately 100% or up to the maximum amount of such dividends allowable pursuant to the Internal Revenue Code, as qualified dividend income eligible for a reduced tax rate.
Qualified Business Income. The Fund designates approximately 0% of its ordinary income dividends, or up to the maximum amount of such dividends allowable pursuant to the Internal Revenue Code, as qualified business income.
Dividends Received Deduction. Corporate shareholders are generally entitled to take the dividends received deduction on the portion of the Fund’s dividend distribution that qualifies under tax law. For the Fund’s calendar year 2024 ordinary income dividends, 100% qualifies for the corporate dividends received deduction.
| Trustees and Officers (Unaudited) |
| |
The following table provides information regarding each of the Trustees.
Name, Address*, Age,
Position with Trust**,
Term of Position with
Trust | Principal Occupation
During Past 5 Years | Other Directorships |
| INDEPENDENT TRUSTEES |
Ira P. Cohen, 64
Independent Trustee
Since June 2010 | Current: Independent financial services Real Estate consultant (since February 2005); Executive Vice President of Asset Management Services, Recognos Financial (since August 2015). | Trustee and Audit Committee Chairman, Apollo Fund Diversified (since March 2022); Trustee, Chairman and Nominating and Governance Committee Chairman, Angel Oak Funds Trust (since October 2014) (7 portfolios); Trustee, Chairman, and Nominating and Governance Committee Chairman, Angel Oak Strategic Credit Fund (since December 2017); Trustee, Chairman, and Nominating and Governance Committee Chairman, Angel Oak Financial Strategies Income Term Trust (since May 2019); Trustee, Chairman, and Nominating and Governance Committee Chairman, Angel Oak Credit Opportunities Term Trust (since January 2021); Trustee and Nominating and Governance Committee Chairman, U.S. Fixed Income Trust (since March 2019). |
Andrea N. Mullins, 56
Independent Trustee
Since December 2013 Chairperson Since
March 2017 | Current: Private investor; Independent Contractor, SWM Advisors (since April 2014). | Trustee, Angel Oak Funds Trust (since February 2019) (7 portfolios); Trustee, Angel Oak Strategic Credit Fund (since February 2019); Trustee, Angel Oak Financial Strategies Income Term Trust (since May 2019); Trustee, Angel Oak Credit Opportunities Term Trust (since January 2021); Trustee and Audit Committee Chair, NXG NextGen Infrastructure Income Fund (since November 2021); Trustee and Audit Committee Chair, NXG Cushing Midstream Energy Fund (since November 2021). |
| INTERESTED TRUSTEE |
Mark J. Seger***, 62
Trustee Since March
2017 | Current: Vice Chairman and Co-Founder, Ultimus Fund Solutions, LLC and its subsidiaries (since 1999). | None. |
| | | |
| * | The address for each Trustee is 225 Pictoria Drive, Suite 450, Cincinnati, Ohio 45246. |
| ** | As of the date of this report, the Trust consists of 15 series. |
| *** | Mr. Seger is considered an “interested person” of the Trust because of his relationship with the Trust’s administrator, transfer agent, and distributors. |
| Trustees and Officers (Unaudited) (continued) |
| |
The following table provides information regarding the Officers of the Trust:
Name, Address*, Age,
Position with Trust**,
Term of Position with
Trust | Principal Occupation During Past 5 Years |
Matthew J. Miller, 47
Principal Executive
Officer and
President Since March
2022 | Current: Vice President, Relationship Management, Ultimus Fund Solutions, LLC (since December 2015). |
| | |
Vice President
From December 2011 to
March 2022 | |
N. Lynn Bowley, 65
Chief Compliance
Officer Since April 2022 | Current: Senior Vice President, Senior Compliance Officer, Northern Lights Compliance Services, LLC (since January 2007). |
Carol J. Highsmith, 59
Vice President Since
August 2008 | Current: Vice President, Ultimus Fund Solutions, LLC (since December 2015). |
| | |
Secretary Since March
2014 | |
Zachary P. Richmond, 43
Principal Financial
Officer and Treasurer
Since September 2021 | Current: Vice President, Financial Administration, Ultimus Fund Solutions, LLC (since February 2019). Previous: Assistant Vice President, Associate Director of Financial Administration, Ultimus Fund Solutions, LLC (December 2015 to February 2019). |
Jared D. Lahman, 37
AML Officer
Since March 2023 | Current: Senior Compliance Analyst, Northern Lights Compliance Services, LLC (since January 2019). |
| | Previous: Manager of Fund Accounting, Gemini Fund Services (September 2016 to December 2018) |
| | |
| * | The address for each Officer is 225 Pictoria Drive, Suite 450, Cincinnati, Ohio 45246. |
| ** | As of the date of this report, the Trust consists of 15 series. |
| Other Information (Unaudited) |
| |
The Fund’s Statement of Additional Information (“SAI”) includes additional information about the trustees and is available without charge, upon request. You may call toll-free at (833) 565-1919 to request a copy of the SAI or to make shareholder inquiries.
| FACTS | WHAT DOES CHANNING INTRINSIC VALUE SMALL-CAP FUND (THE “FUND”) DO WITH YOUR PERSONAL INFORMATION? |
| |
| Why? | Financial companies choose how they share your personal information. Federal law gives consumers the right to limit some but not all sharing. Federal law also requires us to tell you how we collect, share, and protect your personal information. Please read this notice carefully to understand what we do. |
| |
| What? | The types of personal information we collect and share depend on the product or service you have with us. This information can include: |
| | |
| | ■ Social Security number |
| | |
| | ■ account balances and account transactions |
| | |
| | ■ transaction or loss history and purchase history |
| | |
| | ■ checking account information and wire transfer instructions |
| | |
| | When you are no longer our customer, we continue to share your information as described in this notice. |
| |
| How? | All financial companies need to share customers’ personal information to run their everyday business. In the section below, we list the reasons financial companies can share their customers’ personal information; the reasons the Fund chooses to share; and whether you can limit this sharing. |
| Reasons we can share your personal information | Does the Fund share? |
For our everyday business purposes—
such as to process your transactions, maintain your account(s), respond to court orders and legal investigations, or report to credit bureaus | Yes |
For our marketing purposes—
to offer our products and services to you | No |
| For joint marketing with other financial companies | No |
For our affiliates’ everyday business purposes—
information about your transactions and experiences | No |
For our affiliates’ everyday business purposes—
information about your creditworthiness | No |
| For nonaffiliates to market to you | No |
| Questions? | Call (833) 565-1919 |
| Who we are |
| Who is providing this notice? | Channing Intrinsic Value Small-Cap Fund
Ultimus Fund Distributors, LLC (Distributor)
Ultimus Fund Solutions, LLC (Administrator) |
| |
| What we do |
| How does the Fund protect my personal information? | To protect your personal information from unauthorized access and use, we use security measures that comply with federal law. These measures include computer safeguards and secured files and buildings. Our service providers are held accountable for adhering to strict policies and procedures to prevent any misuse of your nonpublic personal information. |
| How does the Fund collect my personal information? | We collect your personal information, for example, when you ■ open an account or deposit money ■ buy securities from us or sell securities to us ■ make deposits or withdrawals from your account ■ give us your account information ■ make a wire transfer ■ tell us who receives the money ■ tell us where to send the money ■ show your government-issued ID ■ show your driver’s license |
| Why can’t I limit all sharing? | Federal law gives you the right to limit only ■ sharing for affiliates’ everyday business purposes — information about your creditworthiness ■ affiliates from using your information to market to you ■ sharing for nonaffiliates to market to you State laws and individual companies may give you additional rights to limit sharing. |
| Definitions |
| Affiliates | Companies related by common ownership or control. They can be financial and nonfinancial companies. ■ Channing Capital Management, LLC the investment adviser to the Fund, could be deemed to be an affiliate. |
| Nonaffiliates | Companies not related by common ownership or control. They can be financial and nonfinancial companies. ■ The Fund does not share your personal information with nonaffiliates so they can market to you |
| Joint marketing | A formal agreement between nonaffiliated financial companies that together market financial products or services to you. ■ The Fund does not jointly market. |
Proxy Voting
A description of the policies and procedures that the Fund uses to determine how to vote proxies relating to portfolio securities and information regarding how the Fund voted those proxies during the most recent twelve month period ended June 30, are available (1) without charge upon request by calling the Fund at (833) 565-1919 and (2) in Fund documents filed with the SEC on the SEC’s website at www.sec.gov.
TRUSTEES
Andrea N. Mullins, Chairperson
Ira P. Cohen
Mark J. Seger | INDEPENDENT REGISTERED
PUBLIC ACCOUNTING FIRM
Cohen & Company, Ltd.
1350 Euclid Avenue, Suite 800
Cleveland, OH 44115 |
| | |
| | |
OFFICERS
Matthew J. Miller, Principal Executive Officer and
President
Zachary P. Richmond, Principal Financial Officer and
Treasurer
N. Lynn Bowley, Chief Compliance Officer
Carol J. Highsmith, Vice President and Secretary | LEGAL COUNSEL
Troutman Pepper Hamilton Sanders LLP
3000 Two Logan Square
18th and Arch Streets
Philadelphia, PA 19103 |
| | |
| | |
INVESTMENT ADVISER
Channing Capital Management, LLC
10 S. LaSalle Street, Suite 2401
Chicago, IL 60603 | CUSTODIAN
U.S. Bank, N.A.
425 Walnut Street
Cincinnati, OH 45202 |
| | |
| | |
DISTRIBUTOR
Ultimus Fund Distributors, LLC
225 Pictoria Drive, Suite 450
Cincinnati, OH 45246 | ADMINISTRATOR, TRANSFER
AGENT AND FUND ACCOUNTANT
Ultimus Fund Solutions, LLC
225 Pictoria Drive, Suite 450
Cincinnati, OH 45246 |
| | |
This report is intended only for the information of shareholders or those who have received the Fund’s prospectus which contains information about the Fund’s management fee and expenses. Please read the prospectus carefully before investing.
Distributed by Ultimus Fund Distributors, LLC, Member FINRA/SIPC.
Channing-AR-2024
| |
| |
| |
| |
| |
| MDP Low Volatility Fund |
| |
| Class I Shares – MDPLX |
| |
| |
| |
| |
| |
| |
| |
| Annual Report |
| |
| January 31, 2024 |
| |
| |
| |
| |
| |
| |
| |
| |
| |
| |
| |
| |
| |
| |
| |
| |
| |
| |
| |
| |
| |
| |
| |
| Fund Adviser: |
Millbank Dartmoor Portsmouth LLC
22 South Pack Square, Suite 401
Asheville, NC 28801 |
| |
| |
| |
| |
| |
| MDP Low Volatility Fund |
| Management’s discussion of Fund performance (Unaudited) |
| |
MDP Low Volatility Fund (the “Fund” or “MDPLX”) reported a positive 11.22% return on a trailing 12-month (“TTM”) basis compared to the S&P 500, which was 18.86%. The portfolio’s annualized TTM volatility was 6.86%, which is 50% of the annualized volatility of the S&P 500. The Fund seeks to provide capital appreciation and mitigate volatility by combining index investments and index options to capture long-term risk-adjusted returns.
Millbank Dartmoor Portsmouth (“MDP”), the investment advisor of the Fund, steadfastly believes that employing one volatility strategy is unsuitable for all market conditions.
Sourcing the ideal market hedge should be dependent on current volatility conditions. The Fund is designed to provide a downside buffer with the potential for upside participation. Using a combination of long equities and equity options, MDP strives to provide a long-only, daily liquid, low-cost solution with reduced volatility.
Our approach to hedged equity revolves around wisdom gained through years of running risk-adjusted portfolios.
We have seen significant equity market returns in the past five years; these returns have not been for the faint of heart. Pandemics, bank failures, impeachments, government shutdowns and wars have made this a journey full of seemingly unsurmountable obstacles. These obstacles are reflected in measures of volatility in the public equity market.
The goal of our low volatility portfolio is to give investors equity market returns and lower volatility. We strive to deliver this with daily liquidity and a minimal fee. Being a long-term investor is not easy. Often investors’ resilience is tested in the most stressful market conditions. That is why we believe our strategy helps buffer, but in a more transparent, liquid, cost-effective nature.
Dennis Davitt, CIO
MDPLX
| Investment Results (Unaudited) |
| |
Total Return(a) as of January 31, 2024
| | | | | Since |
| | | | | Inception |
| | | | | March 31, |
| | | One Year | | 2022(b) |
| MDP Low Volatility Fund — Class I | | 11.22% | | 3.72% |
| S&P 500®(c) | | 18.86% | | 3.73% |
| S&P 500® total return | | 20.82% | | 5.44% |
| | | | | |
| | | | | Expense |
| | | | | Ratio(d) |
| Gross | | | | 54.71% |
| With Applicable Waivers | | | | 1.52% |
| | | | | |
The performance quoted represents past performance, which does not guarantee future results. The investment return and principal value of an investment will fluctuate so that an investor’s shares, when redeemed, may be worth more or less than their original cost. The returns shown do not reflect deduction of taxes that a shareholder would pay on MDP Low Volatility Fund (the “Fund”) distributions or the redemption of Fund shares. Current performance of the Fund may be lower or higher than the performance quoted. The Fund’s investment objectives, risks, charges and expenses must be considered carefully before investing. Performance data current to the most recent month end may be obtained by calling (833) 914-3344.
| (a) | Return figures reflect any change in price per share and assume the reinvestment of all distributions. The Fund’s return reflects any fee reductions during the applicable periods. If such fee reductions had not occurred, the quoted performance would have been lower. |
| (b) | The inception date of the Fund was March 11, 2022. However, the Fund did not invest in long-term securities towards the investment objective and commence operations until March 31, 2022. March 31, 2022 is the performance calculation inception date. |
| (c) | Effective on or about December 11, 2023, the S&P 500® Index replaced the S&P 500® Total Return Index as the Fund’s primary benchmark. The S&P 500® Index (the “Index”) is an unmanaged index generally representing the performance of the broad domestic economy through changes in the aggregate market value of 500 stocks representing all major industries. Individuals cannot invest directly in the Index; however, an individual may invest in exchange-traded funds or other investment vehicles that attempt to track the performance of a benchmark index. |
| (d) | The expense ratios are from the Fund’s prospectus dated May 31, 2023. Millbank Dartmoor Portsmouth LLC (the “Adviser”) has contractually agreed to waive or limit its management fees and to assume other expenses of the Fund until May 31, 2024, so that total annual fund operating expenses does not exceed 1.25%. This contractual arrangement may only be terminated by mutual consent of the Adviser and the Board of Trustees of the Valued Advisers Trust, and it will automatically terminate upon the termination of the investment advisory agreement between the Fund and the Adviser. This operating expense limitation does not apply to: (i) interest, (ii) taxes, (iii) brokerage commissions, (iv) other expenditures which are capitalized in accordance with generally accepted accounting principles, (v) other extraordinary expenses not incurred in the ordinary course of the Fund’s business, (vi) dividend expense on short sales, (vii) expenses incurred under a plan of |
| Investment Results (Unaudited) (continued) |
| |
distribution under Rule 12b-1, and (viii) expenses that the Fund has incurred but did not actually pay because of an expense offset arrangement, if applicable, in any fiscal year. The operating expense limitation also excludes any “Acquired Fund Fees and Expenses,” which are the expenses indirectly incurred by the Fund as a result of investing in money market funds or other investment companies, including exchange-traded funds, that have their own expenses. Each waiver or reimbursement of an expense by the Adviser is subject to repayment by the Fund within the three years following the date the particular expense payment occurred, provided that the Fund is able to make the repayment without exceeding the expense limitation in place at the time of the waiver or reimbursement and the expense limitation in place at the time of the repayment.
An investor should consider the investment objectives, risks, charges, and expenses of the Fund carefully before investing. The Fund’s prospectus contains this and other important information. To obtain a copy of the Fund’s prospectus please call (833) 914-3344 and a copy will be sent to you free of charge. Please read the prospectus carefully before you invest.
| Investment Results (Unaudited) (continued) |
| |
Comparison of the Growth of a $10,000 Investment in the MDP Low Volatility Fund – Class I and the S&P 500® Index.
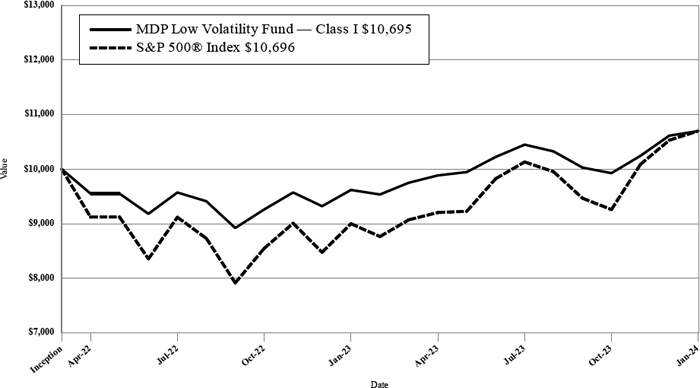
The chart above assumes an initial investment of $10,000 made on March 31, 2022 (commencement of operations) and held through January 31, 2024. THE FUND’S RETURN REPRESENTS PAST PERFORMANCE AND DOES NOT GUARANTEE FUTURE RESULTS. The returns shown do not reflect deduction of taxes that a shareholder would pay on Fund distributions or the redemption of Fund shares. Investment returns and principal values will fluctuate so that your shares, when redeemed, may be worth more or less than their original purchase price.
Current performance may be lower or higher than the performance data quoted. For more information on the Fund, and to obtain performance data current to the most recent month-end, or to request a prospectus, please call (833) 914-3344. You should carefully consider the investment objectives, potential risks, management fees, and charges and expenses of the Fund before investing. The Fund’s prospectus contains this and other information about the Fund and should be read carefully before investing.
The Fund is distributed by Ultimus Fund Distributors, LLC, Member FINRA/SIPC.
| Fund Holdings (Unaudited) |
| |
MDP Low Volatility Fund Portfolio Holdings as of January 31, 2024*
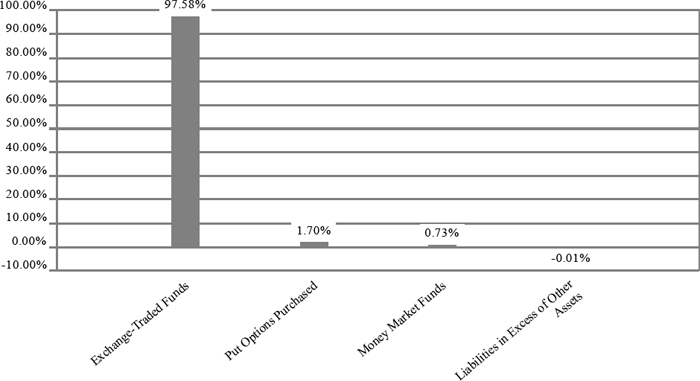
| * | As a percentage of net assets. |
The investment objective of the Fund is to provide capital appreciation and mitigate volatility by combining index investments and index options to capture long-term, risk-adjusted returns.
| Availability of Portfolio Schedule (Unaudited) |
| |
The Fund files its complete schedule of portfolio holdings with the Securities and Exchange Commission (the “SEC”) for the first and third quarters of each fiscal year as an exhibit to its reports on Form N-PORT. The Fund’s Form N-PORT reports are available on the SEC’s website at http:// www.sec.gov.
| MDP Low Volatility Fund |
| Schedule of Investments |
| January 31, 2024 |
| |
| EXCHANGE-TRADED FUNDS — 97.58% | | Shares | | | Fair Value | |
| SPDR® S&P 500® ETF Trust(a)(b) | | | 1,800 | | | $ | 869,184 | |
| Total Exchange-Traded Funds (Cost $741,944) | | | | | | | 869,184 | |
| | | | | | | | | |
| | | Number of | | Notional | | | Exercise | | | Expiration | | | |
| Description | | Contracts | | Amount | | | Price | | | Date | | Fair Value | |
| PUT OPTIONS PURCHASED — 1.70% | | | | | | | | | | | | | | | | |
| SPDR S&P 500 ETF Trust(c) | | 16 | | $ | 772,608 | | | $ | 483.00 | | | April 2024 | | $ | 15,192 | |
| Total Options Purchased (Cost $14,839) | | | | | | | | | | | 15,192 | |
| | | | | | | | | | | | | | | | | |
| MONEY MARKET FUNDS - 0.73% | | Shares | | | Fair Value | |
| Federated Hermes Government Obligations Fund - Institutional Class, 5.23% (a)(d) | | | 6,522 | | | $ | 6,522 | |
| Total Money Market Funds (Cost $6,522) | | | | | | | 6,522 | |
| Total Investments — 100.01% (Cost $763,305) | | | | | | | 890,898 | |
| Liabilities in Excess of Other Assets — (0.01)% | | | | | | | (184 | ) |
| NET ASSETS — 100.00% | | | | | | $ | 890,714 | |
| | | | | | | | | |
| (a) | All or a portion of the security is held as collateral for written options. As of January 31, 2024, the fair value of collateral held is $489,402. |
| (b) | Represents an investment greater than 25% of the Fund’s net assets. Performance of the Fund may be adversely impacted by concentrated investments in securities. The financial statements and portfolio holdings for these securities can be found at www.sec.gov. As of January 31, 2024, the percentage of net assets invested in SPDR® S&P 500 ETF Trust was 97.58% of the Fund. |
| (c) | Non-income producing security. |
| (d) | Rate disclosed is the seven day effective yield as of January 31, 2024. |
| ETF | - Exchange-Traded Fund |
| | |
| SPDR | - Standard & Poor’s Depositary Receipt |
| | |
See accompanying notes which are an integral part of these financial statements.
| MDP Low Volatility Fund |
| Schedule of Open Written Option Contracts |
| January 31, 2024 |
| | | Number of | | Notional | | | Exercise | | | Expiration | | | |
| Description | | Contracts | | Amount | | | Price | | | Date | | Fair Value | |
| WRITTEN CALL OPTIONS — (0.27)% | | | | | | | | | | | | | | |
| SPDR S&P 500 ETF Trust(a) | | (16) | | $ | (772,608 | ) | | $ | 505.00 | | | March 2024 | | $ | (2,448 | ) |
| | | | | | | | | | | | | | | | | |
| WRITTEN PUT OPTIONS — (0.40)% | | | | | | | | | | | | | | |
| SPDR S&P 500 ETF Trust(a) | | (16) | | | (772,608 | ) | | | 460.00 | | | March 2024 | | | (3,592 | ) |
| | | | | | | | | | | | | | | | | |
| Total Written Options (Premiums Received $6,049) | | | | | | | | | | $ | (6,040 | ) |
| | | | | | | | | | | | | | | | | |
| (a) | Non-income producing security. |
See accompanying notes which are an integral part of these financial statements.
| MDP Low Volatility Fund |
| Statement of Assets and Liabilities |
| January 31, 2024 |
| |
| Assets | | | | |
| Investments in securities at fair value (cost $763,305) (Note 3) | | $ | 890,898 | |
| Cash | | | 20,905 | |
| Cash held at broker for options contracts | | | 5,983 | |
| Receivable for investments sold | | | 13,095 | |
| Dividends receivable | | | 47 | |
| Receivable from Adviser | | | 18,231 | |
| Prepaid expenses | | | 2,587 | |
| Total Assets | | | 951,746 | |
| | | | | |
| Liabilities | | | | |
| Options written, at fair value (premiums received $6,049) | | | 6,040 | |
| Payable for investments purchased | | | 15,215 | |
| Payable to affiliates (Note 4) | | | 11,321 | |
| Other accrued expenses | | | 28,456 | |
| Total Liabilities | | | 61,032 | |
| Net Assets | | $ | 890,714 | |
| Net Assets consist of: | | | | |
| Paid-in capital | | $ | 837,311 | |
| Accumulated earnings | | | 53,403 | |
| Net Assets | | $ | 890,714 | |
| Shares outstanding (unlimited number of shares authorized, no par value) | | | 86,831 | |
| Net asset value, offering and redemption price per share (Note 2) | | $ | 10.26 | |
| | | | | |
See accompanying notes which are an integral part of these financial statements.
| MDP Low Volatility Fund |
| Statement of Operations |
| For the year ended January 31, 2024 |
| |
| Investment Income | | | | |
| Dividend income | | $ | 12,698 | |
| Total investment income | | | 12,698 | |
| | | | | |
| Expenses | | | | |
| Administration fees (Note 4) | | | 73,230 | |
| Compliance services fees (Note 4) | | | 26,251 | |
| Audit and tax preparation fees | | | 20,830 | |
| Legal fees | | | 20,395 | |
| Transfer agent fees (Note 4) | | | 15,878 | |
| Printing and postage expenses | | | 10,647 | |
| Trustee fees | | | 7,709 | |
| Registration expenses | | | 6,309 | |
| Custodian fees | | | 5,188 | |
| Investment Adviser fees (Note 4) | | | 4,930 | |
| Offering cost (Note 2) | | | 4,714 | |
| Interest expense | | | 1,928 | |
| Miscellaneous expense | | | 28,234 | |
| Total expenses | | | 226,243 | |
| Fees contractually waived and expenses reimbursed by Adviser (Note 4) | | | (214,037 | ) |
| Net operating expenses | | | 12,206 | |
| Net investment income | | | 492 | |
| | | | | |
| Net Realized and Change in Unrealized Gain (Loss) on Investments | | | | |
| Net realized (loss) on: | | | | |
| Written options | | | (1,247 | ) |
| Purchased options | | | (48,834 | ) |
| Change in unrealized appreciation (depreciation) on: | | | | |
| Investment securities | | | 137,521 | |
| Written options | | | (11 | ) |
| Purchased options | | | 207 | |
| Net realized and change in unrealized gain on investments | | | 87,636 | |
| Net increase in net assets resulting from operations | | $ | 88,128 | |
| | | | | |
See accompanying notes which are an integral part of these financial statements.
| MDP Low Volatility Fund |
| Statements of Changes in Net Assets |
| |
| | | For the Year | | | For the Period | |
| | | Ended January | | | Ended January | |
| | | 31, 2024 | | | 31, 2023(a) | |
| Increase (Decrease) in Net Assets due to: | | | | | | | | |
| Operations | | | | | | | | |
| Net investment income | | $ | 492 | | | $ | 506 | |
| Net realized gain (loss) on written options and purchased options | | | (50,081 | ) | | | 7,713 | |
| Net change in unrealized appreciation (depreciation) of investment securities, written options and purchased options | | | 137,717 | | | | (10,115 | ) |
| Net increase (decrease) in net assets resulting from operations | | | 88,128 | | | | (1,896 | ) |
| | | | | | | | | |
| Distributions to shareholders from Earnings Class I (Note 2) | | | (14,534 | ) | | | (18,308 | ) |
| Total distributions | | | (14,534 | ) | | | (18,308 | ) |
| | | | | | | | | |
| Capital Transactions - Class I: | | | | | | | | |
| Proceeds from shares sold | | | 24,949 | | | | 918,900 | |
| Reinvestment of distributions | | | 14,534 | | | | 18,309 | |
| Amount paid for shares redeemed | | | (17 | ) | | | (139,351 | ) |
| Net increase in net assets resulting from capital transactions | | | 39,466 | | | | 797,858 | |
| Total Increase in Net Assets | | | 113,060 | | | | 777,654 | |
| | | | | | | | | |
| Net Assets | | | | | | | | |
| Beginning of year | | | 777,654 | | | | — | |
| End of year | | $ | 890,714 | | | $ | 777,654 | |
| | | | | | | | | |
| Share Transactions - Class I: | | | | | | | | |
| Shares sold | | | 2,506 | | | | 95,868 | |
| Shares issued in reinvestment of distributions | | | 1,425 | | | | 2,034 | |
| Shares redeemed | | | (2 | ) | | | (15,000 | ) |
| Net increase in shares | | | 3,929 | | | | 82,902 | |
| | | | | | | | | |
| (a) | For the period March 31, 2022 (commencement of operations) to January 31, 2023. |
See accompanying notes which are an integral part of these financial statements.
| MDP Low Volatility Fund – Class I |
| Financial Highlights |
| |
| (For a share outstanding during each period) |
| | | | | | For the | |
| | | For the | | | Period | |
| | | Year Ended | | | Ended | |
| | | January 31, | | | January 31, | |
| | | 2024 | | | 2023(a) | |
| Selected Per Share Data: | | | | | | | | |
| Net asset value, beginning of period | | $ | 9.38 | | | $ | 10.00 | |
| | | | | | | | | |
| Investment operations: | | | | | | | | |
| Net investment income (loss) | | | 0.01 | | | | 0.01 | |
| Net realized and unrealized gain (loss) | | | 1.04 | | | | (0.40 | ) |
| Total from investment operations | | | 1.05 | | | | (0.39 | ) |
| | | | | | | | | |
| Less distributions to shareholders from: | | | | | | | | |
| Net investment income | | | — | | | | (0.02 | ) |
| Net realized gains | | | (0.17 | ) | | | (0.21 | ) |
| Total distributions | | | (0.17 | ) | | | (0.23 | ) |
| | | | | | | | | |
| Net asset value, end of period | | $ | 10.26 | | | $ | 9.38 | |
| | | | | | | | | |
| Total Return(b) | | | 11.22 | % | | | (3.84 | )% (c) |
| | | | | | | | | |
| Ratios and Supplemental Data: | | | | | | | | |
| Net assets, end of period (000 omitted) | | $ | 891 | | | $ | 778 | |
| Ratio of net expenses to average net assets(d) | | | 1.48 | % | | | 1.43 | % (e) |
| Ratio of expenses to average net assets before waiver and reimbursement | | | 27.52 | % | | | 54.62 | % (e) |
| Ratio of net investment income to average net assets | | | 0.06 | % | | | 0.12 | % (e) |
| Portfolio turnover rate | | | — | % | | | — | % (c) |
| | | | | | | | | |
| (a) | For the period March 31, 2022 (commencement of operations) to January 31, 2023. |
| (b) | Total return represents the rate that the investor would have earned or lost on an investment in the Fund, assuming reinvestment of distributions. |
| (d) | This ratio includes the impact of broker interest fees. If this cost had been excluded, the ratio of expenses to average net assets would have been 1.25% for the year ended January 31, 2024 and the period ended January 31, 2023. |
See accompanying notes which are an integral part of these financial statements.
| MDP Low Volatility Fund |
| Notes to the Financial Statements |
| January 31, 2024 |
NOTE 1. ORGANIZATION
The MDP Low Volatility Fund (the “Fund”) is registered under the Investment Company Act of 1940, as amended (“1940 Act”), as an open-end diversified series of Valued Advisers Trust (the “Trust”). The Trust is a management investment company established under the laws of Delaware by an Agreement and Declaration of Trust dated June 13, 2008 (the “Trust Agreement”). The Trust Agreement permits the Board of Trustees (the “Board”) to issue an unlimited number of shares of beneficial interest of separate series without par value. The Fund is one of a series of funds authorized by the Board. The Fund currently offers one class of shares, Class I. Class A shares have been approved by the Board, but are not yet available for purchase and are not being offered at this time. Inception date of the Fund was March 11, 2022. The Fund commenced operations on March 31, 2022. The Fund’s investment adviser is Millbank Dartmoor Portsmouth LLC (the “Adviser”). The investment objective of the Fund is to seek capital appreciation and mitigate volatility by combining index investments and index options to capture long-term, risk adjusted returns.
NOTE 2. SIGNIFICANT ACCOUNTING POLICIES
The Fund is an investment company and follows accounting and reporting guidance under Financial Accounting Standards Board Accounting Standards Codification (“ASC”) Topic 946, “Financial Services-Investment Companies”. The following is a summary of significant accounting policies followed by the Fund in the preparation of its financial statements. These policies are in conformity with generally accepted accounting principles in the United States of America (“GAAP”).
Regulatory Update – Tailored Shareholder Reports for Mutual Funds and Exchange-Traded Funds (“ETFs”) – Effective January 24, 2023, the Securities and Exchange Commission adopted rule and form amendments that will result in changes to the design and delivery of shareholder reports of mutual funds and ETFs, requiring them to transmit concise and visually engaging streamlined annual and semi-annual reports to shareholders that highlight key information. Other information, including financial statements, will no longer appear in a streamlined shareholder report but must be available online, delivered free of charge upon request, and filed on a semi-annual basis on Form N-CSR. The rule and form amendments have a compliance date of July 24, 2024.
Estimates – The preparation of financial statements in conformity with GAAP requires management to make estimates and assumptions that affect the reported amounts of assets and liabilities and disclosure of contingent assets and liabilities at the date of the financial statements and the reported amounts of increases and decreases in net assets from operations during the reporting period. Actual results could differ from those estimates.
| MDP Low Volatility Fund |
| Notes to the Financial Statements (continued) |
| January 31, 2024 |
Federal Income Taxes – The Fund makes no provision for federal income or excise tax. The Fund has qualified and intends to qualify each year as a regulated investment company (“RIC”) under subchapter M of the Internal Revenue Code of 1986, as amended, by complying with the requirements applicable to RICs and by distributing substantially all of its taxable income. The Fund also intends to distribute sufficient net investment income and net realized capital gains, if any, so that it will not be subject to excise tax on undistributed income and gains. If the required amount of net investment income or gains is not distributed, the Fund could incur a tax expense.
As of and during the fiscal year ended January 31, 2024, the Fund did not have any liabilities for any unrecognized tax benefits. The Fund recognizes interest and penalties, if any, related to unrecognized tax benefits as income tax expense on the Statement of Operations when incurred. During the fiscal year ended January 31, 2024, the Fund did not incur any interest or penalties. Management of the Fund has reviewed tax positions taken in tax years that remain subject to examination by all major tax jurisdictions, including federal (i.e., the last three tax year ends and the interim tax period since then, as applicable). Management believes that there is no tax liability resulting from unrecognized tax benefits related to uncertain tax positions taken.
Expenses – Expenses incurred by the Trust that do not relate to a specific fund of the Trust are allocated to the individual funds of the Trust based on each fund’s relative net assets or another appropriate basis (as determined by the Board).
Security Transactions and Related Income – The Fund follows industry practice and records security transactions on the trade date for financial reporting purposes. The specific identification method is used for determining gains or losses for financial statement and income tax purposes. Dividend income is recorded on the ex-dividend date and interest income is recorded on an accrual basis. Non-cash income, if any, is recorded at the fair market value of the securities received. Withholding taxes on foreign dividends, if any, have been provided for in accordance with the Fund’s understanding of the applicable country’s tax rules and rates.
Dividends and Distributions – The Fund intends to distribute its net investment income and net realized long-term and short-term capital gains, if any, at least annually. Dividends and distributions to shareholders, which are determined in accordance with income tax regulations, are recorded on the ex-dividend date. The treatment for financial reporting purposes of distributions made to shareholders during the period from net investment income or net realized capital gains may differ from their ultimate treatment for federal income tax purposes. These differences are caused primarily by differences in the timing of the recognition of certain components of income, expense or realized capital gain for federal income tax purposes. Where such differences are permanent in nature, they are
| MDP Low Volatility Fund |
| Notes to the Financial Statements (continued) |
| January 31, 2024 |
reclassified among the components of net assets based on their ultimate characterization for federal income tax purposes. Any such reclassifications will have no effect on net assets, results of operations or net asset value (“NAV”) per share of the Fund.
Share Valuation – The NAV is calculated each day the New York Stock Exchange (the “NYSE”) is open by dividing the total value of the Fund’s assets, less liabilities, by the number of shares outstanding for the Fund.
Organization and Offering Costs – The Adviser advanced some of the Fund’s organization and initial offering costs and was subsequently reimbursed by the Fund. Costs of $31,019 incurred in connection with the offering and initial registration of the Fund have been deferred and are being amortized on a straight-line basis over the first twelve months after commencement of operations. Costs of $15,500 incurred in connection with the organization of the Fund were expensed as incurred. As of January 31, 2024, there were $0 in unamortized offering costs remaining in the Fund.
Purchased/Written Option Contracts – The Fund may write or purchase option contracts to adjust risk and return of its overall investment positions. When the Fund writes or purchases an option, an amount equal to the premium received or paid by the Fund is recorded as a liability or an asset and is subsequently adjusted to the current market value of the option written or purchased. Premiums received or paid from writing or purchasing options that expire unexercised are treated by the Fund on the expiration date as realized gains or losses. The difference between the premium and the amount paid or received on affecting a closing purchase or sale transaction, including brokerage commissions, is also treated as a realized gain or loss. If an option is exercised, the premium paid or received is added to or subtracted from the cost of the purchase or proceeds from the sale in determining whether the Fund has realized a gain or loss on investment transactions. Investing in purchased and written options contracts exposes the Fund to equity price risk.
| MDP Low Volatility Fund |
| Notes to the Financial Statements (continued) |
| January 31, 2024 |
The following tables identify the location and fair value of derivative instruments on the Statement of Assets and Liabilities as of January 31, 2024, and the effect of derivative instruments on the Statement of Operations for the fiscal year ended January 31, 2024.
As of January 31, 2024:
| Location of Derivatives on Statement of Assets and Liabilities | | | |
| Derivatives | | Asset Derivatives | | Liability Derivatives | | Fair Value | |
| Equity Price Risk: | | | | | |
| Purchased Options | | Investments in securities at fair value | | | | $ | 15,192 | |
| Written Options | | | | Options Written,at fair value | | | (6,040 | ) |
For the fiscal year ended January 31, 2024:
| | | | | | | | Change in Unrealized | |
| | | Location of Gain (Loss) on | | Realized Gain | | | Appreciation | |
| | | Derivatives on Statement of | | (Loss) on | | | (Depreciation) on | |
| Derivatives | | Operations | | Derivatives | | | Derivatives | |
| Equity Price Risk: | | | | | | | | | | |
| Purchased Options | | Net realized gain (loss) and change in unrealized appreciation (depreciation) on investment securities | | $ | (48,834 | ) | | $ | 207 | |
| Written Options | | Net realized gain and change in unrealized appreciation (depreciation) on written options | | | (1,247 | ) | | | (11 | ) |
The following table summarizes the average ending monthly fair value of derivatives outstanding during the fiscal year ended January 31, 2024:
| | | Average Ending Monthly | |
| Derivatives | | Fair Value(a) | |
| Purchased Options | | $ | 12,934 | |
| Written Options | | | (9,273 | ) |
| (a) | Average based on the 12 months during the period that had activity. |
| MDP Low Volatility Fund |
| Notes to the Financial Statements (continued) |
| January 31, 2024 |
The following table provides a summary of offsetting financial liabilities and derivatives and the effect of derivative instruments on the Statement of Assets and Liabilities as of January 31, 2024:
| | | | | | | | | | | | Gross Amounts Not Offset | | | | |
| | | | | | | | | | | | in Statement of Assets and | | | | |
| | | | | | | | | | | | Liabilities | | | | |
| | | | | | | | | Net Amounts | | | | | | | | | | |
| | | | | | Gross Amounts | | | of Liabilities | | | | | | | | | | |
| | | | | | Offset in | | | Presented in | | | | | | | | | | |
| | | Gross Amounts | | | Statement of | | | Statement of | | | | | | | | | | |
| | | of Recognized | | | Assets and | | | Assets and | | | Financial | | | Collateral | | | Net | |
| | | Liabilities | | | liabilities | | | Liabilities | | | Instruments | | | Pledged | | | Amount | |
| Written Options | | $ | 6,040 | | | $ | — | | | $ | 6,040 | | | $ | (6,040 | ) | | $ | — | | | $ | — | |
NOTE 3. SECURITIES VALUATION AND FAIR VALUE MEASUREMENTS
The Fund values its portfolio securities at fair value as of the close of regular trading on the NYSE (normally 4:00 p.m. Eastern time) on each business day the NYSE is open for business. Fair value is defined as the price that the Fund would receive upon selling an investment in a timely transaction to an independent buyer in the principal or most advantageous market of the investment. GAAP establishes a three-tier hierarchy to maximize the use of observable market data and minimize the use of unobservable inputs and to establish classification of fair value measurements for disclosure purposes.
Inputs refer broadly to the assumptions that market participants would use in pricing the asset or liability, including assumptions about risk (the risk inherent in a particular valuation technique used to measure fair value including a pricing model and/or the risk inherent in the inputs to the valuation technique). Inputs may be observable or unobservable. Observable inputs are inputs that reflect the assumptions market participants would use in pricing the asset or liability developed based on market data obtained and available from sources independent of the reporting entity. Unobservable inputs are inputs that reflect the reporting entity’s own assumptions about the assumptions market participants would use in pricing the asset or liability developed based on the best information available in the circumstances.
Various inputs are used in determining the value of the Fund’s investments. These inputs are summarized in the three broad levels listed below.
| ● | Level 1 – unadjusted quoted prices in active markets for identical investments and/or registered investment companies where the value per share is determined and published |
| MDP Low Volatility Fund |
| Notes to the Financial Statements (continued) |
| January 31, 2024 |
and is the basis for current transactions for identical assets or liabilities at the valuation date
| ● | Level 2 – other significant observable inputs (including, but not limited to, quoted prices for an identical security in an inactive market, quoted prices for similar securities, interest rates, prepayment speeds, credit risk, etc.) |
| ● | Level 3 – significant unobservable inputs (including the Fund’s own assumptions in determining fair value of investments based on the best information available) |
The inputs used to measure fair value may fall into different levels of the fair value hierarchy. In such cases, for disclosure purposes, the level in the fair value hierarchy which is reported is determined based on the lowest level input that is significant to the fair value measurement in its entirety.
Equity securities that are traded on any stock exchange are generally valued at the last quoted sale price on the security’s primary exchange. Lacking a last sale price, an exchange-traded security is generally valued at the mean between the most recent quoted bid and ask prices. Securities traded in the Nasdaq over-the-counter market are generally valued at the Nasdaq Official Closing Price. When using market quotations and when the market is considered active, the security is classified as a Level 1 security. In the event that market quotations are not readily available or are considered unreliable due to market or other events, securities are valued in good faith by the Adviser as “Valuation Designee” under the oversight of the Board. The Adviser has adopted written policies and procedures for valuing securities and other assets in circumstances where market quotes are not readily available. In the event that market quotes are not readily available, and the security or asset cannot be valued pursuant to one of the valuation methods, the value of the security or asset will be determined in good faith by the Adviser pursuant to its policies and procedures. On a quarterly basis, the Adviser’s fair valuation determinations will be reviewed by the Board. Under these policies, the securities will be classified as Level 2 or 3 within the fair value hierarchy, depending on the inputs used.
Investments in mutual funds, including money market mutual funds, are generally priced at the ending NAV as reported by the underlying Fund companies. These securities are categorized as Level 1 securities.
Exchange-traded options on securities and indices purchased or sold by the Fund generally will be valued by the Valuation Designee at the mean of the last bid and ask prices. If there is no such reported ask on the valuation date, purchased options are valued at the most recent bid price. If there is no such reported bid on the valuation date, written options are valued at the most recent ask price. On the last business day of each month, the Cboe
| MDP Low Volatility Fund |
| Notes to the Financial Statements (continued) |
| January 31, 2024 |
Options Exchange (“Cboe”) conducts special end-of-month non-trading closing rotations for the sole purpose of determining the fair value of the S&P 500® Index (SPX) option series. For month end valuations of SPX, the Cboe adjusted price will be used if the special end-of-month non-trading closing rotation fair value price differs from the price provided at market close. Options will generally be categorized as Level 2 securities.
In accordance with the Trust’s valuation policies and fair value determinations pursuant to Rule 2a-5 under the 1940 Act, the Adviser as Valuation Designee is required to consider all appropriate factors relevant to the value of securities for which it has determined other pricing sources are not available or reliable as described above. No single method exists for determining fair value, because fair value depends upon the circumstances of each individual case. As a general principle, the current fair value of a security being valued by the Valuation Designee would be the amount that the Funds might reasonably expect to receive upon the current sale. Methods that are in accordance with this principle may, for example, be based on (i) a multiple of earnings; (ii) a discount from market prices of a similar freely traded security (including a derivative security or a basket of securities traded on other markets, exchanges or among dealers); or (iii) yield to maturity with respect to debt issues, or a combination of these and other methods. Fair-value pricing is permitted if, in the Valuation Designee’s opinion, the validity of market quotations appears to be questionable based on factors such as evidence of a thin market in the security based on a small number of quotations, a significant event occurs after the close of a market but before a Fund’s NAV calculation that may affect a security’s value, or the Valuation Designee is aware of any other data that calls into question the reliability of market quotations.
The following is a summary of the inputs used to value the Fund’s investments as of January 31, 2024:
| | | | | | Valuation Inputs | | | | | | | |
| Assets | | Level 1 | | | Level 2 | | | Level 3 | | | Total | |
| Exchange-Traded Funds | | $ | 869,184 | | | $ | — | | | $ | — | | | $ | 869,184 | |
| Put Options Purchased | | | 15,192 | | | | — | | | | — | | | | 15,192 | |
| Money Market Funds | | | 6,522 | | | | — | | | | — | | | | 6,522 | |
| Total | | $ | 890,898 | | | $ | — | | | $ | — | | | $ | 890,898 | |
| | | | | | | | | | | | | | | | | |
| | | | | | Valuation Inputs | | | | | | | |
| Liabilities | | Level 1 | | | Level 2 | | | Level 3 | | | Total | |
| Written Call Options | | $ | (2,448 | ) | | $ | — | | | $ | — | | | $ | (2,448 | ) |
| Written Put Options | | | (3,592 | ) | | | — | | | | — | | | | (3,592 | ) |
| Total | | $ | (6,040 | ) | | $ | — | | | $ | — | | | $ | (6,040 | ) |
The Fund did not hold any investments at the end of the reporting period for which significant unobservable inputs (Level 3) were used in determining fair value; therefore, no reconciliation of Level 3 securities is included for this reporting period.
| MDP Low Volatility Fund |
| Notes to the Financial Statements (continued) |
| January 31, 2024 |
NOTE 4. FEES AND OTHER TRANSACTIONS WITH AFFILIATES AND OTHER SERVICE PROVIDERS
Under the terms of the investment advisory agreement, on behalf of the Fund (the “Agreement”), the Adviser manages the Fund’s investments subject to oversight of the Board. As compensation for its services, the Fund pays the Adviser a fee, computed and accrued daily and paid monthly at an annual rate of 0.60% of the average daily net assets of the Fund. For the fiscal year ended January 31, 2024, the Adviser earned a fee of $4,930 from the Fund before the waivers and reimbursements described below. At January 31, 2024, the Adviser owed the Fund $18,231.
The Adviser has entered into an expense limitation agreement where it has contractually agreed to waive or limit its fees and to assume other expenses of the Fund until May 31, 2024 so that Total Annual Fund Operating Expenses does not exceed 1.25%. This contractual arrangement may only be terminated by mutual consent of the Adviser and the Board, and it will automatically terminate upon the termination of the investment advisory agreement between the Fund and the Adviser. This operating expense limitation does not apply to: (i) interest, (ii) taxes, (iii) brokerage commissions, (iv) other expenditures which are capitalized in accordance with generally accepted accounting principles, (v) other extraordinary expenses not incurred in the ordinary course of the Fund’s business, (vi) dividend expense on short sales, (vii) expenses incurred under a plan of distribution under Rule 12b-1, and (viii) expenses that the Fund has incurred but did not actually pay because of an expense offset arrangement, if applicable, in any fiscal year. The operating expense limitation also excludes any “Acquired Funds Fees and Expenses,” which are the expenses indirectly incurred by the Fund as a result of investing in money market funds or other investment companies, including ETFs, that have their own expenses.
Each Fee waiver or expense reimbursement by the Adviser is subject to repayment by the Fund within the three years following the date the fee waiver or expense reimbursement occurred, provided that the Fund is able to make the repayment without exceeding the expense limitation in effect at the time of the waiver or reimbursement and any expense limitation in place at the time of the repayments. For the fiscal year ended January 31, 2024, the Adviser waived fees and reimbursed expenses totaling $214,037. As of January 31, 2024, the Adviser may seek repayment of investment advisory fees waivers and expense reimbursement as follows:
| Recoverable Through | | | |
| January 31, 2026 | | | 233,084 | |
| January 31, 2027 | | | 214,037 | |
| MDP Low Volatility Fund |
| Notes to the Financial Statements (continued) |
| January 31, 2024 |
Ultimus Fund Solutions, LLC (“Ultimus”) provides administration, fund accounting and transfer agent services to the Fund. The Fund pays Ultimus fees in accordance with the agreements for such services.
Northern Lights Compliance Services, LLC (“NLCS”), an affiliate of Ultimus, provides a Chief Compliance Officer and Anti-Money Laundering Officer to the Trust, as well as related compliance services, pursuant to a consulting agreement between NLCS and the Trust. Under the terms of such agreement, NLCS receives fees from the Fund, which are approved annually by the Board.
Under the terms of a Distribution Agreement with the Trust, Ultimus Fund Distributors, LLC (the “Distributor”) serves as principal underwriter to the Fund. The Distributor is a wholly-owned subsidiary of Ultimus. The Distributor is compensated by the Adviser (not the Fund) for acting as principal underwriter.
The officers and one trustee of the Trust are members of management and/or employees of Ultimus or of NLCS, and are not paid by the Trust for services to the Fund. Ultimus Fund Distributors, LLC (the “Distributor”) acts as the distributor of the Fund’s shares. The Distributor is a wholly-owned subsidiary of Ultimus. There were no payments made to the Distributor by the Fund for the fiscal year ended January 31, 2024.
NOTE 5. PURCHASES AND SALES OF SECURITIES
For the fiscal year ended January 31, 2024, there were no purchases and sales of investment securities, other than short-term investments.
There were no purchases or sales of long-term U.S. government obligations during the fiscal year ended January 31, 2024.
NOTE 6. FEDERAL TAX INFORMATION
At January 31, 2024, the net unrealized appreciation (depreciation) and tax cost of investments, including written options, for tax purposes was as follows:
| Gross unrealized appreciation | | $ | 526 | |
| Gross unrealized depreciation | | | (163 | ) |
| Net unrealized appreciation on investments | | $ | 363 | |
| Tax cost of investments | | $ | 884,495 | |
The difference between book basis and tax basis of unrealized appreciation (depreciation) is primarily attributable to straddle deferrals.
| MDP Low Volatility Fund |
| Notes to the Financial Statements (continued) |
| January 31, 2024 |
The tax character of distributions paid for the fiscal years ended January 31, 2024 and January 31, 2023 were as follows:
| | | 2024 | | | 2023 | |
| Distributions paid from: | | | | | | | | |
| Ordinary income(a) | | $ | 14,534 | | | $ | 18,308 | |
| Total distributions paid | | $ | 14,534 | | | $ | 18,308 | |
| (a) | Short-term capital gain distributions are treated as ordinary income for tax purposes. |
At January 31, 2024, the components of accumulated earnings (deficit) on a tax basis were as follows:
| Undistributed ordinary income | | $ | 53,040 | |
| Unrealized appreciation on investments | | | 363 | |
| Total accumulated earnings | | $ | 53,403 | |
NOTE 7. BENEFICIAL OWNERSHIP
The beneficial ownership, either directly or indirectly, of more than 25% of the voting securities of a fund creates a presumption of control of the fund, under Section 2(a) (9) of the 1940 Act. At January 31, 2024, an unaffiliated person owned 62.78% of the outstanding shares of the Fund. As a result, an unaffiliated person may be deemed to control the Fund.
NOTE 8. REGULATORY UPDATES
In October 2020, the Securities and exchange Commission (the “SEC”) adopted new regulations governing the use of derivatives by registered investment companies (“Rule 18f-4”). Rule 18f-4 imposes limits on the amount of derivatives a fund can enter into, eliminates the asset segregation framework currently used by funds to comply with section 18 of the 1940 Act, treats derivatives as senior securities and requires funds whose use of derivatives is more than a limited specified exposure amount to establish and maintain a comprehensive derivatives risk management program and appoint a derivatives risk manager.
NOTE 9. COMMITMENTS AND CONTINGENCIES
The Trust indemnifies its officers and Trustees for certain liabilities that may arise from their performance of their duties to the Trust or the Fund. Additionally, in the normal course of business, the Trust enters into contracts that contain a variety of representations and warranties which provide general indemnifications. The Trust’s maximum exposure under these arrangements is unknown, as this would involve future claims that may be made against the Trust that have not yet occurred.
| MDP Low Volatility Fund |
| Notes to the Financial Statements (continued) |
| January 31, 2024 |
NOTE 10. SUBSEQUENT EVENTS
Management of the Fund has evaluated the need for disclosures and/or adjustments resulting from subsequent events through the date at which these financial statements were issued. Based upon this evaluation, management has determined there were no items requiring adjustment of the financial statements or additional disclosure.
| Report of Independent Registered Public Accounting Firm |
To the Shareholders of MDP Low Volatility Fund and
Board of Trustees of Valued Advisers Trust
Opinion on the Financial Statements
We have audited the accompanying statement of assets and liabilities, including the schedules of investments and open written option contracts, of MDP Low Volatility Fund (the “Fund”), a series of Valued Advisers Trust, as of January 31, 2024, the related statement of operations for the year then ended, and the statements of changes in net assets, the related notes, and the financial highlights for the year ended January 31, 2024 and the period March 31, 2022 (commencement of operations) through January 31, 2023 (collectively referred to as the “financial statements”). In our opinion, the financial statements present fairly, in all material respects, the financial position of the Fund as of January 31, 2024, the results of its operations for the year then ended, and the changes in net assets and the financial highlights for the year ended January 31, 2024 and the period March 31, 2022 (commencement of operations) through January 31, 2023, in conformity with accounting principles generally accepted in the United States of America.
Basis for Opinion
These financial statements are the responsibility of the Fund’s management. Our responsibility is to express an opinion on the Fund’s financial statements based on our audits. We are a public accounting firm registered with the Public Company Accounting Oversight Board (United States) (“PCAOB”) and are required to be independent with respect to the Fund in accordance with the U.S. federal securities laws and the applicable rules and regulations of the Securities and Exchange Commission and the PCAOB.
We conducted our audits in accordance with the standards of the PCAOB. Those standards require that we plan and perform the audit to obtain reasonable assurance about whether the financial statements are free of material misstatement whether due to error or fraud.
Our audits included performing procedures to assess the risks of material misstatement of the financial statements, whether due to error or fraud, and performing procedures that respond to those risks. Such procedures included examining, on a test basis, evidence regarding the amounts and disclosures in the financial statements. Our procedures included confirmation of securities owned as of January 31, 2024, by correspondence with the custodian and brokers. Our audits also included evaluating the accounting principles used and significant estimates made by management, as well as evaluating the overall presentation of the financial statements. We believe that our audits provide a reasonable basis for our opinion.
We have served as the Fund’s auditor since 2022.
COHEN & COMPANY, LTD.
Cleveland, Ohio
March 27, 2024
| Liquidity Risk Management Program (Unaudited) |
Valued Advisers Trust has adopted and implemented a written liquidity risk management program as required by Rule 22e-4 (the “Liquidity Rule”) under the Investment Company Act. The program is reasonably designed to assess and manage the Fund’s liquidity risk, taking into consideration, among other factors, the Fund’s investment strategy and the liquidity of its portfolio investments during normal and reasonably foreseeable stressed conditions; its short and long-term cash flow projections; and its cash holdings and access to other funding sources. The Board of Trustees approved the appointment of a Liquidity Administrator Committee, which includes representatives from Millbank Dartmoor Portsmouth LLC, the Fund’s investment adviser, and Ultimus Fund Solutions, LLC, the Fund’s Administrator. The Liquidity Administrator Committee is responsible for the program’s administration and oversight and for reporting to the Board on at least an annual basis regarding the program’s operation and effectiveness. The Liquidity Administrator Committee updated its assessment of the Fund’s liquidity risk profile, considering additional data gathered during the period June 1, 2022 through May 31, 2023 (the “Review Period”) and the adequacy and effectiveness of the liquidity risk management program’s operations during the Review Period in order to prepare a written report for the Board of Trustees (the “Report”) for consideration at its meeting held on September 8, 2023. The Report noted that during the Review Period the Fund did not experience unusual stress or disruption to its operations related to purchase and redemption activity. It further noted that during the Review Period the Fund held adequate levels of cash and highly liquid investments to meet shareholder redemption activities in accordance with applicable requirements. The Report concluded that (i) the Trust’s liquidity risk management program is reasonably designed to prevent violations of the Liquidity Rule and (ii) the Trust’s liquidity risk management program had been effectively implemented during the Review Period.
| Summary of Fund Expenses (Unaudited) |
As a shareholder of the Fund, you incur two types of costs: (1) transaction costs and (2) ongoing costs, including management fees, distribution (12b-1) fees and other Fund expenses. These examples are intended to help you understand your ongoing costs (in dollars) of investing in the Fund and to compare these costs with the ongoing costs of investing in other funds. The example is based on an investment of $1,000 invested at the beginning of the period and held for the entire period from August 1, 2023 through January 31, 2024.
Actual Expenses
The first line of the table below provides information about actual account values and actual expenses. You may use the information in this line, together with the amount you invested, to estimate the expenses that you paid over the period. Simply divide your account value by $1,000 (for example, an $8,600 account value divided by $1,000 = 8.6), then multiply the result by the number in the first line under the heading “Expenses Paid During Period” to estimate the expenses you paid on your account during this period.
Hypothetical Example for Comparison Purposes
The second line of the table below provides information about hypothetical account values and hypothetical expenses based on the Fund’s actual expense ratio and an assumed rate of return of 5% per year before expenses, which is not the Fund’s actual return. The hypothetical account values and expenses may not be used to estimate the actual ending account balance or expenses you paid for the period. You may use this information to compare the ongoing costs of investing in the Fund and other funds. To do so, compare this 5% hypothetical example with the 5% hypothetical examples that appear in the shareholder reports of other funds.
Expenses shown in the table are meant to highlight your ongoing costs only and do not reflect any transactional costs. Therefore, the second line of the table below is useful in comparing ongoing costs only and will not help you determine the relative total costs of owning different funds. In addition, if transaction costs were included, your costs would have been higher.
| | | Beginning | | | Ending | | | | | | |
| | | Account | | | Account | | | Expenses | | | |
| | | Value | | | Value | | | Paid | | | Annualized |
| | | August 1, | | | January 31, | | | During | | | Expense |
| | | 2023 | | | 2024 | | | Period(a) | | | Ratio |
| Actual | | $ | 1,000.00 | | | $ | 1,023.80 | | | $ | 7.17 | | | 1.43% |
| Hypothetical(b) | | $ | 1,000.00 | | | $ | 1,017.71 | | | $ | 7.15 | | | 1.43% |
| (a) | Expenses are equal to the Fund’s annualized expense ratios, multiplied by the average account value over the period, multiplied by 184/365 (to reflect the one-half year period). |
| (b) | Hypothetical assumes 5% annual return before expenses. |
| Additional Federal Income Tax Information (Unaudited) |
The Form 1099-DIV you receive in January 2025 will show the tax status of all distributions paid to your account in calendar year 2024. Shareholders are advised to consult their own tax adviser with respect to the tax consequences of their investment in the Fund. As required by the Internal Revenue Code and/or regulations, shareholders must be notified regarding the status of qualified dividend income for individuals and the dividends received deduction for corporations.
Qualified Dividend Income. The Fund designates approximately 17% or up to the maximum amount of such dividends allowable pursuant to the Internal Revenue Code, as qualified dividend income eligible for a reduced tax rate.
Qualified Business Income. The Fund designates approximately 0% of its ordinary income dividends, or up to the maximum amount of such dividends allowable pursuant to the Internal Revenue Code, as qualified business income.
Dividends Received Deduction. Corporate shareholders are generally entitled to take the dividends received deduction on the portion of the Fund’s dividend distribution that qualifies under tax law. For the Fund’s calendar year 2024 ordinary income dividends, 17% qualifies for the corporate dividends received deduction.
| Trustees and Officers (Unaudited) |
The following table provides information regarding each of the Trustees.
Name, Address*, Age,
Position with Trust**,
Term of Position with
Trust | Principal Occupation
During Past 5
Years and Other
Directorships | Other Directorships |
| INDEPENDENT TRUSTEES |
Ira P. Cohen, 64
Independent Trustee
Since June 2010 | Current: Independent financial services consultant (since February 2005); Executive Vice President of Asset Management Services, Recognos Financial (since August 2015). | Trustee and Audit Committee Chairman, Apollo Diversified Real Estate Fund (since March 2022); Trustee, Chairman and Nominating and Governance Committee Chairman, Angel Oak Funds Trust (since October 2014) (7 portfolios); Trustee, Chairman, and Nominating and Governance Committee Chairman, Angel Oak Strategic Credit Fund (since December 2017); Trustee, Chairman, and Nominating and Governance Committee Chairman, Angel Oak Financial Strategies Income Term Trust (since May 2019); Trustee, Chairman, and Nominating and Governance Committee Chairman, Angel Oak Credit Opportunities Term Trust (since January 2021); Trustee and Nominating and Governance Committee Chairman, U.S. Fixed Income Trust (since March 2019). |
Andrea N. Mullins, 56
Independent Trustee
Since December 2013
Chairperson Since
March 2017 | Current: Private investor; Independent Contractor, SWM Advisors (since April 2014). | Trustee, Angel Oak Funds Trust (since February 2019) (7 portfolios); Trustee, Angel Oak Strategic Credit Fund (since February 2019); Trustee, Angel Oak Financial Strategies Income Term Trust (since May 2019); Trustee, Angel Oak Credit Opportunities Term Trust (since January 2021); Trustee and Audit Committee Chair, NXG NextGen Infrastructure Income Fund (since November 2021); Trustee and Audit Committee Chair, NXG Cushing Midstream Energy Fund (since November 2021). |
| INTERESTED TRUSTEE |
Mark J. Seger***, 62
Trustee Since March
2017 | Current: Vice Chairman and Co-Founder, Ultimus Fund Solutions, LLC and its subsidiaries (since 1999). | None. |
| * | The address for each Trustee is 225 Pictoria Drive, Suite 450, Cincinnati, Ohio 45246. |
| ** | As of the date of this report, the Trust consists of 15 series. |
| *** | Mr. Seger is considered an “interested person” of the Trust because of his relationship with the Trust’s administrator, transfer agent, and distributors. |
| Trustees and Officers (Unaudited) (continued) |
The following table provides information regarding the Officers of the Trust:
Name, Address*, Age,
Position with Trust**,
Term of Position with
Trust | Principal Occupation During Past 5 Years |
Matthew J. Miller, 47
Principal Executive
Officer and
President Since March
2022
Vice President
From December 2011 to
March 2022 | Current: Vice President, Relationship Management, Ultimus Fund Solutions, LLC (since December 2015). |
N. Lynn Bowley, 65
Chief Compliance
Officer Since April 2022 | Current: Senior Vice President, Senior Compliance Officer,Northern Lights Compliance Services, LLC (since January 2007). |
Carol J. Highsmith, 59
Vice President Since
August 2008
Secretary Since March
2014 | Current: Vice President, Ultimus Fund Solutions, LLC (since December 2015). |
Zachary P. Richmond,43
Principal Financial
Officer and Treasurer
Since September 2021 | Current:Vice President, Financial Administration, Ultimus Fund Solutions, LLC (since February 2019). Previous:Assistant Vice President, Associate Director of Financial Administration, Ultimus Fund Solutions, LLC (December 2015 to February 2019). |
Jared D. Lahman, 37
AML Officer
Since March 2023 | Current: Senior Compliance Analyst, Northern Lights Compliance Services, LLC (since January 2019). Previous: Manager of Fund Accounting, Gemini Fund Services (September 2016 to December 2018) |
| * | The address for each Officer is 225 Pictoria Drive, Suite 450, Cincinnati, Ohio 45246. |
| ** | As of the date of this report, the Trust consists of 15 series. |
| Other Information (Unaudited) |
The Fund’s Statement of Additional Information (“SAI”) includes additional information about the trustees and is available without charge, upon request. You may call toll-free at (833) 914-3344 to request a copy of the SAI or to make shareholder inquiries.
| FACTS | WHAT DOES MDP LOW VOLATILITY FUND (THE “FUND”) DO WITH YOUR PERSONAL INFORMATION? |
| |
| Why? | Financial companies choose how they share your personal information. Federal law gives consumers the right to limit some but not all sharing. Federal law also requires us to tell you how we collect, share, and protect your personal information. Please read this notice carefully to understand what we do. |
| |
| What? | The types of personal information we collect and share depend on the product or service you have with us. This information can include: |
| | |
| | ■ Social Security number |
| | |
| | ■ account balances and account transactions |
| | |
| | ■ transaction or loss history and purchase history |
| | |
| | ■ checking account information and wire transfer instructions |
| | |
| | When you are no longer our customer, we continue to share your information as described in this notice. |
| |
| How? | All financial companies need to share customers’ personal information to run their everyday business. In the section below, we list the reasons financial companies can share their customers’ personal information; the reasons the Fund chooses to share; and whether you can limit this sharing. |
| Reasons we can share your personal information | Does the Fund share? |
For our everyday business purposes—
such as to process your transactions, maintain your account(s), respond to court orders and legal investigations, or report to credit bureaus | Yes |
For our marketing purposes—
to offer our products and services to you | No |
| For joint marketing with other financial companies | No |
For our affiliates’ everyday business purposes—
information about your transactions and experiences | No |
For our affiliates’ everyday business purposes—
information about your creditworthiness | No |
| For nonaffiliates to market to you | No |
| Questions? | Call (833) 914-3344 |
| Who we are |
| Who is providing this notice? | MDP Low Volatility Fund
Ultimus Fund Distributors, LLC (Distributor)
Ultimus Fund Solutions, LLC (Administrator) |
| |
| What we do |
| How does the Fund protect my personal information? | To protect your personal information from unauthorized access and use, we use security measures that comply with federal law. These measures include computer safeguards and secured files and buildings. Our service providers are held accountable for adhering to strict policies and procedures to prevent any misuse of your nonpublic personal information. |
| How does the Fund collect my personal information? | We collect your personal information, for example, when you ■ open an account or deposit money ■ buy securities from us or sell securities to us ■ make deposits or withdrawals from your account ■ give us your account information ■ make a wire transfer ■ tell us who receives the money ■ tell us where to send the money ■ show your government-issued ID ■ show your driver’s license |
| Why can’t I limit all sharing? | Federal law gives you the right to limit only ■ sharing for affiliates’ everyday business purposes — information about your creditworthiness ■ affiliates from using your information to market to you ■ sharing for nonaffiliates to market to you State laws and individual companies may give you additional rights to limit sharing. |
| Definitions |
| Affiliates | Companies related by common ownership or control. They can be financial and nonfinancial companies. ■ Millbank Dartmoor Portsmouth LLC, the investment adviser to the Fund, could be deemed to be an affiliate. |
| Nonaffiliates | Companies not related by common ownership or control. They can be financial and nonfinancial companies. ■ The Fund does not share your personal information with nonaffiliates so they can market to you |
| Joint marketing | A formal agreement between nonaffiliated financial companies that together market financial products or services to you. ■ The Fund does not jointly market. |
Proxy Voting
A description of the policies and procedures that the Fund uses to determine how to vote proxies relating to portfolio securities and information regarding how the Fund voted those proxies during the most recent twelve month period ended June 30, are available (1) without charge upon request by calling the Fund at (833) 914-3344 and (2) in Fund documents filed with the SEC on the SEC’s website at www.sec.gov.
TRUSTEES
Andrea N. Mullins, Chairperson
Ira P. Cohen
Mark J. Seger | INDEPENDENT REGISTERED
PUBLIC ACCOUNTING FIRM
Cohen & Company, Ltd.
1350 Euclid Avenue, Suite 800
Cleveland, OH 44115 |
| | |
| | |
OFFICERS
Matthew J. Miller, Principal Executive Officer and
President
Zachary P. Richmond, Principal Financial Officer and
Treasurer
N. Lynn Bowley, Chief Compliance Officer
Carol J. Highsmith, Vice President and Secretary | LEGAL COUNSEL
Troutman Pepper Hamilton Sanders LLP
3000 Two Logan Square
18th and Arch Streets
Philadelphia, PA 19103 |
| | |
| | |
INVESTMENT ADVISER
Millbank Dartmoor Portsmouth LLC
22 South Pack Square, Suite 401
Asheville, NC 28801 | CUSTODIAN
U.S. Bank, N.A.
425 Walnut Street
Cincinnati, OH 45202 |
| | |
| | |
DISTRIBUTOR
Ultimus Fund Distributors, LLC
225 Pictoria Drive, Suite 450
Cincinnati, OH 45246 | ADMINISTRATOR, TRANSFER
AGENT AND FUND ACCOUNTANT
Ultimus Fund Solutions, LLC
225 Pictoria Drive, Suite 450
Cincinnati, OH 45246 |
| | |
This report is intended only for the information of shareholders or those who have received the Fund’s prospectus which contains information about the Fund’s management fee and expenses. Please read the prospectus carefully before investing.
Distributed by Ultimus Fund Distributors, LLC
Member FINRA/SIPC
MDP-AR-24

Summitry Equity Fund
GGEFX
Annual Report
January 31, 2024
Summitry LLC
919 E. Hillsdale Boulevard, Suite 150
Foster City, CA 94404
(866) 954-6682
Summitry Equity Fund
Management’s Discussion of Fund Performance
For The Fiscal Year Ended January 31, 2024 (Unaudited)
The Summitry Equity Fund (the “Fund”) returned 21.71% for the fiscal year ended January 31, 2024. In comparison, the benchmark, the S&P 500® Index (the “S&P 500”), returned 20.82% during the same period. Since inception on April 1, 2009, the Fund has returned 12.48% as compared to the 15.03% return of the benchmark.
The markets registered solid gains in the fourth quarter of calendar 2023, driven in part by declining interest rates in reaction to diminishing inflationary pressures and continued growth of the American economy despite significant monetary and fiscal tightening by the Federal Reserve (the “Fed”).
For the quarter, the S&P 500 gained 11.7% including dividends, closing out a year when the index produced a total return of 26.3%. The Nasdaq Composite Index produced returns for the quarter and year of 13.8% and 44.6%, respectively. Returns in the US markets during 2023 were strong, but were mostly concentrated among a few sectors, and within those sectors among a few names. For context, many of these outperforming stocks began the year with what we saw as depressed share prices (they suffered losses in the prior year) and rank among the best businesses in the world in terms of their earnings power, financial strength and growth prospects.
It seems a distant memory now that the S&P 500 had slipped into a “correction” on Friday, October 27th (a correction is defined as a 10% drop from a previous high), only two months before calendar year end. The strong equity returns of the preceding half year seemed to be melting away in the face of persistent inflation and high interest rates. Sentiment changed 180 degrees the following Monday, launching a 15.8% recovery in the S&P 500 to year-end. For Fed watchers, the discussion shifted from talk of whether the Fed would stop increasing benchmark interest rates, to when the Fed would reverse course and add monetary stimulus through rate cuts. For their part, the Fed effectively declared “mission accomplished” in its inflation battle when it detailed the Fed board governors’ interest rate and inflation projections.
The improving inflation picture led the bond market higher, with the 10-year Treasury yield dropping by 106 basis points from October 27th, the day referenced above when the stock market reached a technical correction, to December 31st, finishing the year at 3.87%. The Bloomberg Aggregate Bond Index generated a total return of 6.82% and 5.53% for the fourth quarter and full-year 2023, a welcome reversal from the losses earned by bond investors in 2022. With short term market interest rates pegged to the Fed’s mandated 5.25%-5.50% Fed Funds target, the yield curve ended the year severely inverted, meaning bond investors earn higher yields holding short-term paper than long-term bonds.
Summitry Equity Fund
Management’s Discussion of Fund Performance (continued)
For The Fiscal Year Ended January 31, 2024 (Unaudited)
International markets shared in improvement in investor sentiment, albeit to a lesser degree, with the MSCI EAFE (Europe, Australasia, and the Far East) Index, a broad measure of developed economies outside of the US, rising 4.6% and 13.0%, respectively for the fourth quarter and full year 2023. Domestic small cap markets staged a strong recovery in the fourth quarter after treading water for the first nine months of the year. The Russell 2000® (small cap) Index returned 14.0% and 16.9% for the fourth quarter and full year 2023, respectively.
Looking forward
We know from experience that it’s not helpful to try to predict the direction of the markets. We would not have imagined that in the face of rising interest rates, a crisis among commercial banks whose asset values were severely impacted by said rising rates, persistent inflationary pressures and significant monetary tightening by the Fed, that the markets would have performed as well as they did in 2023. Fortunately, our approach to investing does not require us to think about near-term market direction. Our faith in a capitalist system that rewards strong management teams and sound business models allows us to focus on the fundamentals of the individual securities we evaluate for ownership. We let market forces do as they will with prices, with the conviction that if our analysis is sound, we will be rewarded in time.
Sometimes whole markets are cheap, typically in times of maximum pessimism among people on Wall Street and Main Street. In our opinion, this is not one of those times. We believe that stock prices reflect a degree of complacency that inflation is well under control, and that an accommodating Fed will lead us back to an easy money environment. While we have no opinion as to where markets will go in 2024, we’re less sanguine. By investing in individual stocks instead of broad indexes, we can focus our capital on those companies where we believe there is both room for upside and protection on the downside.
During the fiscal year, the Fund outperformed on a relative basis primarily due to security selection. From a sector perspective, relative to the benchmark, the portfolio maintained an overweight position in Communication Services, Consumer Discretionary, and Financials. Our largest sector weighting remained Technology. Our best performing stocks came from multiple sectors but held in common that they were internet enabled platform companies that continue to benefit from the secular trend of software and cloud computing. Meta Platforms, Inc., Class A was up 161.5%, Salesforce.com, Inc. up 67.4%, and Microsoft Corp. increased 62.8% for the fiscal year. Ulta Beauty, Inc. ended the fiscal year as our largest holding followed by Taiwan Semiconductor Manufacturing Co., Ltd., Berkshire Hathaway, Inc., Class B, Fiserv, Inc., and Visa Inc., Class A.
Summitry Equity Fund
Management’s Discussion of Fund Performance (continued)
For The Fiscal Year Ended January 31, 2024 (Unaudited)
Consumer Staples and its lone sector holding for us, Dollar General Corp. was both our worst performing sector and stock and returned -45.8%. Our Healthcare sector holdings also weighed on performance with the sector returning -5.0%. In addition to Dollar General Corp., Zebra Technologies Corp., Class A, Charles Schwab Corp. and Agilent Technologies, Inc. were our worst performing positions, falling 24.2%, 18.5%, and 13.6% respectively during the period.
There were no new positions added during the period and we sold out of one (1) position in its entirety, which was Dollar General Corp.
In addition to the stock and security selection, the advisor’s decision to waive fees and reimburse expenses to the Fund due to the expense limitation cap impacted performance. Had the advisor not waived and reimbursed these expenses, the performance of the Fund would have been lower.
We remain focused on our long-term discipline of investing in our evaluation of high-quality, large-cap businesses that trade at attractive valuations and are confident in our belief that our style of investing is particularly well-suited for the period ahead.
Sincerely,
Summitry, LLC
| * | The S&P 500® Index is a widely recognized unmanaged index of equity prices and is representative of a broader market and range of securities than is found in the Fund’s portfolio. Individuals cannot invest directly in the Index; however, an individual can invest in exchange-traded funds or other investment vehicles that attempt to track the performance of a benchmark index. |
The views in the foregoing discussion were those of the Fund’s investment advisor as of the date set forth above and may not reflect its views on the date this Annual Report is first published or anytime thereafter.
These views are intended to assist shareholders in understanding their investment in the Fund and do not constitute investment advice.
The performance information quoted above represents past performance and past performance does not guarantee future results. Investment return and principal value of an investment will fluctuate so that an investor’s shares, when redeemed, may be worth more or less than their original cost. Current performance may be lower or higher than the performance data quoted. Performance data, current to the most recent month-
Summitry Equity Fund
Management’s Discussion of Fund Performance (continued)
For The Fiscal Year Ended January 31, 2024 (Unaudited)
end, may be obtained by calling the Fund at (866) 954-6682. Fee waivers and expense reimbursements have positively impacted Fund performance. An investor should consider the Fund’s investment objective, risks, and charges and expenses carefully before investing. The Fund’s Prospectus contains this and other important information. For information on the Fund’s expense ratio, please see the Financial Highlights Table found within the accompanying Annual Report.
Investment Results (Unaudited)
Average Annual Total Returns* as of January 31, 2024
| | One Year | | Five Year | | Ten Year |
| Summitry Equity Fund | 21.71% | | 12.45% | | 10.16% |
| S&P 500® Index(a) | 20.82% | | 14.30% | | 12.62% |
Total annual operating expenses, as disclosed in the most recent Summitry Equity Fund (the “Fund”) prospectus dated May 31, 2023, were 1.34% of the Fund’s average daily net assets (1.25% after fee waivers/expense reimbursements by Summitry LLC (the “Adviser”)). The Adviser has contractually agreed to waive or limit its fees and to assume other expenses of the Fund until May 31, 2024, so that Total Annual Fund Operating Expenses do not exceed 1.25%. This contractual arrangement may only be terminated by mutual consent of the Adviser and the Board of Trustees of Valued Advisers Trust (the “Trust”), and it will automatically terminate upon the termination of the investment advisory agreement between the Trust and the Adviser. This operating expense limitation does not apply to: (i) interest, (ii) taxes, (iii) brokerage commissions, (iv) other expenditures which are capitalized in accordance with generally accepted accounting principles, (v) other extraordinary expenses not incurred in the ordinary course of the Fund’s business, (vi) dividend expense on short sales, (vii) expenses incurred under a plan of distribution under Rule 12b-1, and (viii) expenses that the Fund has incurred but did not actually pay because of an expense offset arrangement, if applicable, incurred by the Fund in any fiscal year. The operating expense limitation also excludes any “Acquired Fund Fees and Expenses”, which are the expenses indirectly incurred by the Fund as a result of investing in money market funds or other investment companies that have their own expenses. Each fee waiver or reimbursement of an expense by the Adviser is subject to repayment by the Fund within the three years following the date on which the fee waiver or expense reimbursement occurred, provided that the Fund is able to make the repayment without exceeding the expense limitation in place at the time of the waiver or reimbursement and the expense limitation in place at the time of the repayment.
The performance quoted represents past performance, which does not guarantee future results. The investment return and principal value of an investment will fluctuate so that an investor’s shares, when redeemed, may be worth more or less than their original cost. The returns shown do not reflect deduction of taxes that a shareholder would pay on Fund distributions or the redemption of Fund shares. Current performance of the Fund may be lower or higher than the performance quoted. Performance data current to the most recent month-end may be obtained by calling (866) 954-6682.
| * | Average annual total returns reflect any change in price per share and assume the reinvestment of all distributions. The Fund’s returns reflect any fee reductions during the applicable periods. If such fee reductions had not occurred, the quoted performance would have been lower. Information pertaining to the Fund’s expense ratios as of January 31, 2024 can be found in the financial highlights. |
| (a) | The S&P 500® Index (the “S&P 500”) is a widely recognized unmanaged index of equity securities and is representative of a broader domestic equity market and range of securities than is found in the Fund’s portfolio. Individuals cannot invest directly in the S&P 500; however, an individual can invest in exchange-traded funds or other investment vehicles that attempt to track the performance of a benchmark index. |
The Fund’s investment objective, strategies, risks, charges and expenses should be considered carefully before investing. The prospectus contains this and other important information about the Fund and may be obtained by calling (866) 954-6682. Please read it carefully before investing.
The Fund is distributed by Ultimus Fund Distributors, LLC, Member FINRA/SIPC.
Investment Results (Unaudited) (continued)
Comparison of the Growth of a $10,000 Investment in the Summitry Equity Fund and the S&P 500® Index.
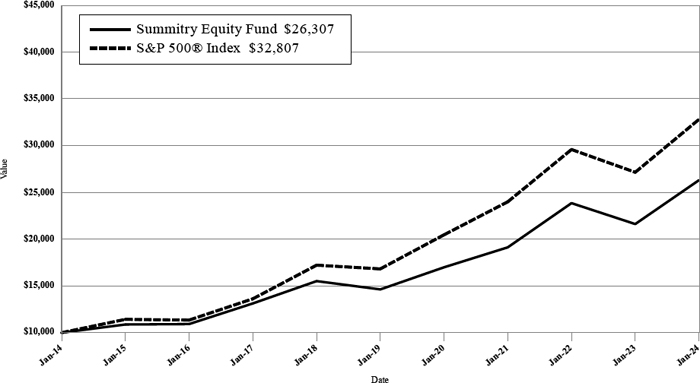
The chart above assumes an initial investment of $10,000 made on January 31, 2014 and held through January 31, 2024. THE FUND’S RETURNS REPRESENT PAST PERFORMANCE AND DO NOT GUARANTEE FUTURE RESULTS. The returns shown do not reflect deduction of taxes that a shareholder would pay on Fund distributions or the redemption of Fund shares. Investment returns and principal values will fluctuate so that your shares, when redeemed, may be worth more or less than their original purchase price.
Current performance may be lower or higher than the performance data quoted. For more information on the Fund, and to obtain performance data current to the most recent month-end, or to request a prospectus, please call (866) 954-6682. You should carefully consider the investment objective, potential risks, management fees, and charges and expenses of the Fund before investing. The Fund’s prospectus contains this and other information about the Fund and should be read carefully before investing.
Fund Holdings (Unaudited)
Summitry Equity Fund Holdings as of January 31, 2024*
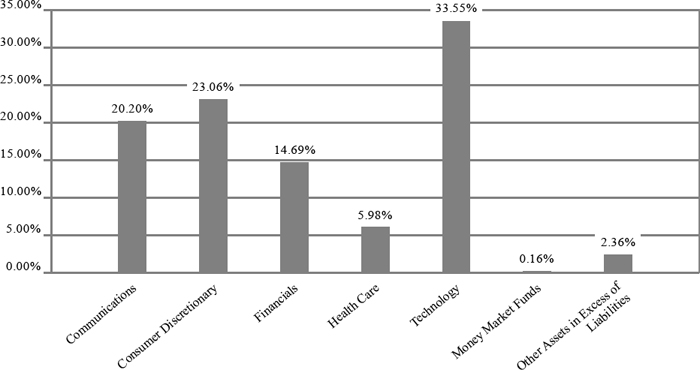
| * | As a percentage of net assets. |
The investment objective of the Fund is to provide long-term capital appreciation. A secondary objective is to provide current income.
Availability of Portfolio Schedule (Unaudited)
The Fund files its complete schedule of portfolio holdings with the Securities and Exchange Commission (the “SEC”) for the first and third quarters of each fiscal year as an exhibit to its reports on Form N-PORT. The Fund’s Form N-PORT reports are available on the SEC’s website at www.sec.gov and on the Fund’s website at www.summitryfunds.com.
| Summitry Equity Fund |
| Schedule of Investments |
| January 31, 2024 |
| COMMON STOCKS — 97.48% | | Shares | | | Fair Value | |
| Communications — 20.20% | | | | | | | | |
| Alphabet, Inc., Class A(a) | | | 25,559 | | | $ | 3,580,816 | |
| Meta Platforms, Inc., Class A(a) | | | 9,037 | | | | 3,525,695 | |
| Netflix, Inc(a) | | | 3,402 | | | | 1,919,102 | |
| Universal Music Group NV - ADR | | | 151,840 | | | | 2,235,085 | |
| Walt Disney Co. (The) | | | 27,550 | | | | 2,646,178 | |
| | | | | | | | 13,906,876 | |
| Consumer Discretionary — 23.06% | | | | | | | | |
| Amazon.com, Inc.(a) | | | 21,203 | | | | 3,290,706 | |
| CarMax, Inc.(a) | | | 35,318 | | | | 2,513,935 | |
| Lowe’s Companies, Inc. | | | 11,159 | | | | 2,375,082 | |
| Ross Stores, Inc. | | | 16,006 | | | | 2,245,322 | |
| Starbucks Corp. | | | 16,445 | | | | 1,529,878 | |
| Ulta Beauty, Inc.(a) | | | 7,814 | | | | 3,923,018 | |
| | | | | | | | 15,877,941 | |
| Financials — 14.69% | | | | | | | | |
| Berkshire Hathaway, Inc., Class B(a) | | | 9,778 | | | | 3,752,210 | |
| Charles Schwab Corp. (The) | | | 39,800 | | | | 2,504,215 | |
| Moody’s Corp. | | | 5,218 | | | | 2,045,665 | |
| Wells Fargo & Co. | | | 36,142 | | | | 1,813,606 | |
| | | | | | | | 10,115,696 | |
| Health Care — 5.98% | | | | | | | | |
| Agilent Technologies, Inc. | | | 21,129 | | | | 2,748,883 | |
| Medtronic PLC | | | 15,630 | | | | 1,368,250 | |
| | | | | | | | 4,117,133 | |
| Technology — 33.55% | | | | | | | | |
| Fiserv, Inc.(a) | | | 25,737 | | | | 3,651,308 | |
| Mastercard, Inc., Class A | | | 7,019 | | | | 3,153,145 | |
| Microsoft Corp. | | | 5,130 | | | | 2,039,585 | |
| Nintendo Co. Ltd. - ADR | | | 170,175 | | | | 2,363,731 | |
| Salesforce.com, Inc.(a) | | | 8,083 | | | | 2,272,051 | |
| Taiwan Semiconductor Manufacturing Co. Ltd. - ADR | | | 34,117 | | | | 3,853,856 | |
| Visa, Inc., Class A | | | 13,207 | | | | 3,608,945 | |
| Zebra Technologies Corp., Class A(a) | | | 8,960 | | | | 2,146,368 | |
| | | | | | | | 23,088,989 | |
| | | | | | | | | |
| Total Common Stocks (Cost $44,345,952) | | | | | | | 67,106,635 | |
See accompanying notes which are an integral part of these financial statements.
| Summitry Equity Fund |
| Schedule of Investments (continued) |
| January 31, 2024 |
| MONEY MARKET FUNDS - 0.16% | | Shares | | | Fair Value | |
| Fidelity Investments Money Market Government Portfolio, Institutional Class, 5.26%(b) | | | 112,901 | | | $ | 112,901 | |
| Total Money Market Funds (Cost $112,901) | | | | | | | 112,901 | |
| | | | | | | | | |
| Total Investments — 97.64% (Cost $44,458,853) | | | | | | | 67,219,536 | |
| Other Assets in Excess of Liabilities — 2.36% | | | | | | | 1,622,106 | |
| NET ASSETS — 100.00% | | | | | | $ | 68,841,642 | |
| (a) | Non-income producing security. |
| (b) | Rate disclosed is the seven day effective yield as of January 31, 2024. |
ADR - American Depositary Receipt
See accompanying notes which are an integral part of these financial statements.
| Summitry Equity Fund |
| Statement of Assets and Liabilities |
| January 31, 2024 |
| Assets | | | | |
| Investments in securities at fair value (cost $44,458,853) (Note 3) | | $ | 67,219,536 | |
| Receivable for fund shares sold | | | 124,595 | |
| Receivable for investments sold | | | 1,561,231 | |
| Dividends receivable | | | 17,214 | |
| Prepaid expenses | | | 15,999 | |
| Total Assets | | | 68,938,575 | |
| Liabilities | | | | |
| Payable for fund shares redeemed | | | 4,841 | |
| Payable to Adviser (Note 4) | | | 50,546 | |
| Payable to affiliates (Note 4) | | | 12,199 | |
| Payable to Trustees | | | 1,335 | |
| Other accrued expenses | | | 28,012 | |
| Total Liabilities | | | 96,933 | |
| Net Assets | | $ | 68,841,642 | |
| Net Assets consist of: | | | | |
| Paid-in capital | | $ | 44,052,414 | |
| Accumulated earnings | | | 24,789,228 | |
| Net Assets | | $ | 68,841,642 | |
| Shares outstanding (unlimited number of shares authorized, no par value) | | | 3,127,131 | |
| Net asset value (“NAV”), offering and redemption price per share (Note 2) | | $ | 22.01 | |
See accompanying notes which are an integral part of these financial statements.
| Summitry Equity Fund |
| Statement of Operations |
| For the year ended January 31, 2024 |
| Investment Income | | | | |
| Dividend income (net of foreign taxes withheld of $41,713) | | $ | 529,116 | |
| Total investment income | | | 529,116 | |
| Expenses | | | | |
| Investment Adviser fees (Note 4) | | | 631,546 | |
| Administration (Note 4) | | | 56,461 | |
| Fund accounting fees (Note 4) | | | 25,665 | |
| Legal fees | | | 22,307 | |
| Transfer agent fees (Note 4) | | | 20,000 | |
| Audit and tax preparation fees | | | 18,415 | |
| Registration expenses | | | 14,832 | |
| Custodian fees | | | 9,851 | |
| Printing and postage expenses | | | 9,370 | |
| Compliance service fees (Note 4) | | | 8,500 | |
| Trustee fees | | | 7,127 | |
| Insurance expenses | | | 4,096 | |
| Miscellaneous | | | 24,303 | |
| Total expenses | | | 852,473 | |
| Fees contractually waived by Adviser (Note 4) | | | (62,038 | ) |
| Net operating expenses | | | 790,435 | |
| Net investment loss | | | (261,319 | ) |
| Net Realized and Change in Unrealized Gain (Loss) on Investments | | | | |
| Net realized gain on investment securities transactions | | | 6,432,277 | |
| Net change in unrealized appreciation of investment securities | | | 6,517,744 | |
| Net realized and change in unrealized gain on investments | | | 12,950,021 | |
| Net increase in net assets resulting from operations | | $ | 12,688,702 | |
See accompanying notes which are an integral part of these financial statements.
| Summitry Equity Fund |
| Statements of Changes in Net Assets |
| | | For the Year | | | For the Year | |
| | | Ended January 31, | | | Ended January 31, | |
| | | 2024 | | | 2023 | |
| Increase (Decrease) in Net Assets due to: | | | | | | | | |
| Operations | | | | | | | | |
| Net investment loss | | $ | (261,319 | ) | | $ | (273,466 | ) |
| Net realized gain on investment securities transactions | | | 6,432,277 | | | | 6,446,329 | |
| Net change in unrealized appreciation (depreciation) of investment securities | | | 6,517,744 | | | | (13,181,767 | ) |
| Net increase (decrease) in net assets resulting from operations | | | 12,688,702 | | | | (7,008,904 | ) |
| Distributions to Shareholders (Note 2) | | | | | | | | |
| Earnings | | | (5,291,128 | ) | | | (7,977,565 | ) |
| Total distributions | | | (5,291,128 | ) | | | (7,977,565 | ) |
| Capital Transactions | | | | | | | | |
| Proceeds from shares sold | | | 5,232,409 | | | | 4,744,349 | |
| Reinvestment of distributions | | | 5,291,128 | | | | 7,977,565 | |
| Amount paid for shares redeemed | | | (9,993,306 | ) | | | (9,628,400 | ) |
| Net increase in net assets resulting from capital transactions | | | 530,231 | | | | 3,093,514 | |
| Total Increase (Decrease) in Net Assets | | | 7,927,805 | | | | (11,892,955 | ) |
| Net Assets | | | | | | | | |
| Beginning of year | | | 60,913,837 | | | | 72,806,792 | |
| End of year | | $ | 68,841,642 | | | $ | 60,913,837 | |
| Share Transactions | | | | | | | | |
| Shares sold | | | 253,203 | | | | 226,252 | |
| Shares issued in reinvestment of distributions | | | 257,601 | | | | 439,293 | |
| Shares redeemed | | | (481,092 | ) | | | (456,444 | ) |
| Net increase in shares outstanding | | | 29,712 | | | | 209,101 | |
See accompanying notes which are an integral part of these financial statements.
| Summitry Equity Fund |
| Financial Highlights |
| (For a share outstanding during each year) |
| | | For the Years Ended January 31, | |
| | | 2024 | | | 2023 | | | 2022 | | �� | 2021 | | | 2020 | |
| Selected Per Share Data Net asset value, beginning of year | | $ | 19.67 | | | $ | 25.21 | | | $ | 21.60 | | | $ | 19.19 | | | $ | 16.97 | |
| Investment operations: | | | | | | | | | | | | | | | | | | | | |
| Net investment income (loss) | | | (0.08 | ) | | | (0.09 | ) | | | (0.16 | ) | | | (0.07 | ) | | | 0.02 | |
| Net realized and unrealized gain (loss) on investments | | | 4.22 | | | | (2.52 | ) | | | 5.54 | | | | 2.48 | | | | 2.72 | |
| Total from investment operations | | | 4.14 | | | | (2.61 | ) | | | 5.38 | | | | 2.41 | | | | 2.74 | |
| Less distributions to shareholders from: | | | | | | | | | | | | | | | | | | | | |
| Net investment income | | | — | | | | — | | | | — | | | | — | | | | (0.03 | ) |
| Net realized gains | | | (1.80 | ) | | | (2.93 | ) | | | (1.77 | ) | | | — | | | | (0.49 | ) |
| Total distributions | | | (1.80 | ) | | | (2.93 | ) | | | (1.77 | ) | | | — | | | | (0.52 | ) |
| Net asset value, end of year | | $ | 22.01 | | | $ | 19.67 | | | $ | 25.21 | | | $ | 21.60 | | | $ | 19.19 | |
| Total Return(a) | | | 21.71 | % | | | (9.38 | )% | | | 24.72 | % | | | 12.56 | % | | | 16.15 | % |
| Ratios and Supplemental Data: | | | | | | | | | | | | | | | | | | | | |
| Net assets, end of year (000 omitted) | | $ | 68,842 | | | $ | 60,914 | | | $ | 72,807 | | | $ | 63,321 | | | $ | 60,960 | |
| Ratio of expenses to average net assets after expense waiver | | | 1.25 | % | | | 1.25 | % | | | 1.25 | % | | | 1.25 | % | | | 1.25 | % |
| Ratio of expenses to average net assets before expense waiver | | | 1.35 | % | | | 1.34 | % | | | 1.31 | % | | | 1.35 | % | | | 1.35 | % |
| Ratio of net investment income (loss) to average net assets after expense waiver | | | (0.41 | )% | | | (0.45 | )% | | | (0.61 | )% | | | (0.36 | )% | | | 0.11 | % |
| Portfolio turnover rate | | | 10.61 | % | | | 22.53 | % | | | 23.57 | % | | | 23.21 | % | | | 27.62 | % |
| (a) | Total return in the above table represents the rate that the investor would have earned or lost on an investment in the Fund, assuming reinvestment of distributions. |
See accompanying notes which are an integral part of these financial statements.
Summitry Equity Fund
Notes to the Financial Statements
January 31, 2024
NOTE 1. ORGANIZATION
The Summitry Equity Fund (the “Fund”) is registered under the Investment Company Act of 1940, as amended (the “1940 Act”), as an open-end diversified series of Valued Advisers Trust (the “Trust”), and commenced operations on April 1, 2009. The Trust is a management investment company established under the laws of Delaware by an Agreement and Declaration of Trust dated June 13, 2008 (the “Trust Agreement”). The Trust Agreement permits the Board of Trustees (the “Board” or “Trustees”) to issue an unlimited number of shares of beneficial interest of separate series without par value. The Fund is one of a series of funds authorized by the Board. The Fund’s investment adviser is Summitry LLC (the “Adviser”). The investment objective of the Fund is to provide long-term capital appreciation. A secondary objective is to provide current income.
NOTE 2. SIGNIFICANT ACCOUNTING POLICIES
The Fund is an investment company and follows accounting and reporting guidance under Financial Accounting Standards Board Accounting Standards Codification (“ASC”) Topic 946, “Financial Services-Investment Companies”. The following is a summary of significant accounting policies followed by the Fund in the preparation of its financial statements. These policies are in conformity with generally accepted accounting principles in the United States of America (“GAAP”).
Regulatory Update – Tailored Shareholder Reports for Mutual Funds and Exchange-Traded Funds (“ETFs”) – Effective January 24, 2023, the Securities and Exchange Commission adopted rule and form amendments that will result in changes to the design and delivery of shareholder reports of mutual funds and ETFs, requiring them to transmit concise and visually engaging streamlined annual and semiannual reports to shareholders that highlight key information. Other information, including financial statements, will no longer appear in a streamlined shareholder report but must be available online, delivered free of charge upon request, and filed on a semi-annual basis on Form N-CSR. The rule and form amendments have a compliance date of July 24, 2024.
Estimates – The preparation of financial statements in conformity with GAAP requires management to make estimates and assumptions that affect the reported amounts of assets and liabilities and disclosure of contingent assets and liabilities at the date of the financial statements and the reported amounts of increases and decreases in net assets from operations during the reporting period. Actual results could differ from those estimates.
Federal Income Taxes – The Fund makes no provision for federal income or excise tax. The Fund has qualified and intends to qualify each year as a regulated investment company (“RIC”) under subchapter M of the Internal Revenue Code of 1986, as amended,
Summitry Equity Fund
Notes to the Financial Statements (continued)
January 31, 2024
by complying with the requirements applicable to RICs and by distributing substantially all of its taxable income. The Fund also intends to distribute sufficient net investment income and net realized capital gains, if any, so that it will not be subject to excise tax on undistributed income and gains. If the required amount of net investment income or gains is not distributed, the Fund could incur a tax expense.
As of and during the fiscal year ended January 31, 2024, the Fund did not have any liabilities for any unrecognized tax benefits. The Fund recognizes interest and penalties, if any, related to unrecognized tax benefits as income tax expense on the Statement of Operations when incurred. During the fiscal year ended January 31, 2024, the Fund did not incur any interest or penalties. Management of the Fund has reviewed tax positions taken in tax years that remain subject to examination by all major tax jurisdictions, including federal (i.e., the last three tax year ends and the interim tax period since then, as applicable). Management believes that there is no tax liability resulting from unrecognized tax benefits related to uncertain tax positions taken.
Expenses – Expenses incurred by the Trust that do not relate to a specific fund of the Trust are allocated to the individual funds of the Trust based on each fund’s relative net assets or another appropriate basis (as determined by the Board).
Security Transactions and Related Income – The Fund follows industry practice and records security transactions on the trade date for financial reporting purposes. The specific identification method is used for determining gains or losses for financial statement and income tax purposes. Dividend income is recorded on the ex-dividend date and interest income is recorded on an accrual basis. Non-cash income, if any, is recorded at the fair market value of the securities received. Withholding taxes on foreign dividends, if any, have been provided for in accordance with the Fund’s understanding of the applicable country’s tax rules and rates.
Dividends and Distributions – The Fund intends to distribute its net investment income and net realized long-term and short-term capital gains, if any, at least annually. Dividends and distributions to shareholders, which are determined in accordance with income tax regulations, are recorded on the ex-dividend date. The treatment for financial reporting purposes of distributions made to shareholders during the period from net investment income or net realized capital gains may differ from their ultimate treatment for federal income tax purposes. These differences are caused primarily by differences in the timing of the recognition of certain components of income, expense or realized capital gain for federal income tax purposes. Where such differences are permanent in nature, they are reclassified among the components of net assets based on their ultimate characterization for federal income tax purposes. Any such reclassifications will have no effect on net assets, results of operations or net asset value (“NAV”) per share of the Fund.
Summitry Equity Fund
Notes to the Financial Statements (continued)
January 31, 2024
For the fiscal year ended January 31, 2024, the Fund made the following reclassifications to increase (decrease) the components of net assets due to net operating losses:
| | | Accumulated Earnings |
| Paid-In Capital | | (Deficit) |
| $(252,989) | | $252,989 |
Share Valuation – The NAV is calculated each day the New York Stock Exchange (the “NYSE”) is open by dividing the total value of the Fund’s assets, less liabilities, by the number of shares outstanding for the Fund.
NOTE 3. SECURITIES VALUATION AND FAIR VALUE MEASUREMENTS
The Fund values its portfolio securities at fair value as of the close of regular trading on the NYSE (normally 4:00 p.m. Eastern Time) on each business day the NYSE is open for business. Fair value is defined as the price that the Fund would receive upon selling an investment in a timely transaction to an independent buyer in the principal or most advantageous market of the investment. GAAP establishes a three-tier hierarchy to maximize the use of observable market data and minimize the use of unobservable inputs and to establish classification of fair value measurements for disclosure purposes.
Inputs refer broadly to the assumptions that market participants would use in pricing the asset or liability, including assumptions about risk (the risk inherent in a particular valuation technique used to measure fair value including a pricing model and/or the risk inherent in the inputs to the valuation technique). Inputs may be observable or unobservable. Observable inputs are inputs that reflect the assumptions market participants would use in pricing the asset or liability developed based on market data obtained and available from sources independent of the reporting entity. Unobservable inputs are inputs that reflect the reporting entity’s own assumptions about the assumptions market participants would use in pricing the asset or liability developed based on the best information available in the circumstances.
Various inputs are used in determining the value of the Fund’s investments. These inputs are summarized in the three broad levels listed below.
| ● | Level 1 – unadjusted quoted prices in active markets for identical investments and/or registered investment companies where the value per share is determined and published and is the basis for current transactions for identical assets or liabilities at the valuation date |
| ● | Level 2 – other significant observable inputs (including, but not limited to, quoted prices for an identical security in an inactive market, quoted prices for similar securities, interest rates, prepayment speeds, credit risk, etc.) |
Summitry Equity Fund
Notes to the Financial Statements (continued)
January 31, 2024
| ● | Level 3 – significant unobservable inputs (including the Fund’s own assumptions in determining fair value of investments based on the best information available) |
The inputs used to measure fair value may fall into different levels of the fair value hierarchy. In such cases, for disclosure purposes, the level in the fair value hierarchy which is reported is determined based on the lowest level input that is significant to the fair value measurement in its entirety.
Equity securities that are traded on any stock exchange are generally valued at the last quoted sale price on the security’s primary exchange. Lacking a last sale price, an exchange-traded security is generally valued at its last bid price. Securities traded in the Nasdaq over-the-counter market are generally valued at the Nasdaq Official Closing Price. When using the market quotations and when the market is considered active, the security is classified as a Level 1 security. In the event that market quotations are not readily available or are considered unreliable due to market or other events, securities are valued in good faith by the Adviser as “Valuation Designee” under the oversight of the Board. The Adviser has adopted written policies and procedures for valuing securities and other assets in circumstances where market quotes are not readily available. In the event that market quotes are not readily available, and the security or asset cannot be valued pursuant to one of the valuation methods, the value of the security or asset will be determined in good faith by the Adviser pursuant to its policies and procedures. On a quarterly basis, the Adviser’s fair valuation determinations will be reviewed by the Board. Under these policies, the securities will be classified as Level 2 or 3 within the fair value hierarchy, depending on the inputs used.
In accordance with the Trust’s valuation policies and fair value determinations pursuant to Rule 2a-5 under the 1940 Act, the Valuation Designee is required to consider all appropriate factors relevant to the value of securities for which it has determined other pricing sources are not available or reliable as described above. No single method exists for determining fair value because fair value depends upon the circumstances of each individual case. As a general principle, the current fair value of a security being valued by the Valuation Designee would be the amount that the Fund might reasonably expect to receive upon the current sale. Methods that are in accordance with this principle may, for example, be based on (i) a multiple of earnings; (ii) a discount from market prices of a similar freely traded security (including a derivative security or a basket of securities traded on other markets, exchanges or among dealers); or (iii) yield to maturity with respect to debt issues, or a combination of these and other methods. Fair-value pricing is permitted if, in the Valuation Designee’s opinion, the validity of market quotations appears to be questionable based on factors such as evidence of a thin market in the security based on a small number of quotations, a significant event occurs after the close of a market but before the Fund’s NAV
Summitry Equity Fund
Notes to the Financial Statements (continued)
January 31, 2024
calculation that may affect a security’s value, or the Valuation Designee is aware of any other data that calls into question the reliability of market quotations.
Investments in mutual funds, including money market mutual funds, are generally priced at the ending NAV as reported by the underlying Fund companies. These securities are categorized as Level 1 securities.
The following is a summary of the inputs used to value the Fund’s investments as of January 31, 2024:
| | | | | | Valuation Inputs | | | | | | | |
| Assets | | Level 1 | | | Level 2 | | | Level 3 | | | Total | |
| Common Stocks(a) | | $ | 67,106,635 | | | $ | — | | | $ | — | | | $ | 67,106,635 | |
| Money Market Funds | | | 112,901 | | | | — | | | | — | | | | 112,901 | |
| Total | | $ | 67,219,536 | | | $ | — | | | $ | — | | | $ | 67,219,536 | |
| (a) | Refer to Schedule of Investments for sector classifications. |
The Fund did not hold any investments at the end of the reporting period for which significant unobservable inputs (Level 3) were used in determining fair value; therefore, no reconciliation of Level 3 securities is included for this reporting period.
NOTE 4. FEES AND OTHER TRANSACTIONS WITH AFFILIATES AND OTHER SERVICE PROVIDERS
Under the terms of the investment advisory agreement on behalf of the Fund, the Adviser manages the Fund’s investments subject to oversight of the Board. As compensation for its services, the Fund pays the Adviser a fee, computed and accrued daily and paid monthly, at an annual rate of 1.00% of the average daily net assets of the Fund. For the fiscal year ended January 31, 2024, the Adviser earned a fee of $631,546 from the Fund before the waivers described below. At January 31, 2024, the Fund owed the Adviser $50,546.
The Adviser has contractually agreed to waive or limit its fees and to assume certain Fund operating expenses, until May 31, 2024, so that total annual operating expenses do not exceed 1.25%. This contractual arrangement may only be terminated by mutual consent of the Adviser and the Board, and it will automatically terminate upon the termination of the investment advisory agreement between the Trust and the Adviser. This operating expense limitation does not apply to interest, taxes, brokerage commissions, other expenditures which are capitalized in accordance with GAAP, other extraordinary expenses not incurred in the ordinary course of the Fund’s business, dividend expense on short sales, expenses incurred under a plan of distribution under Rule 12b-1, and expenses that the Fund has incurred but did not actually pay because of an expense offset arrangement, if applicable, incurred by the Fund in any fiscal year. The operating expense limitation also excludes any
Summitry Equity Fund
Notes to the Financial Statements (continued)
January 31, 2024
“Acquired Fund Fees and Expenses”. Acquired Fund Fees and Expenses represent the pro rata expense indirectly incurred by the Fund as a result of investing in other investment companies, including exchange-traded funds, closed-end funds and money market funds that have their own expenses. For the fiscal year ended January 31, 2024, the Adviser waived fees of $62,038.
Each fee waiver or expense reimbursement by the Adviser is subject to repayment by the Fund within the three years following the date the fee waiver or expense reimbursement occurred, provided that the Fund is able to make the repayment without exceeding the expense limitation in effect at the time of the waiver or reimbursement and any expense limitation in place at the time of the repayment. As of January 31, 2024, the Adviser may seek repayment of investment advisory fee waivers and expense reimbursements as follows:
| Recoverable Through | | | |
| January 31, 2025 | | $ | 43,156 | |
| January 31, 2026 | | | 52,327 | |
| January 31, 2027 | | | 62,038 | |
Ultimus Fund Solutions, LLC (“Ultimus”) provides administration, fund accounting and transfer agent services to the Fund. The Fund pays Ultimus fees in accordance with the agreements for such services.
Northern Lights Compliance Services, LLC (“NLCS”), an affiliate of Ultimus, provides a Chief Compliance Officer and an Anti-Money Laundering Officer to the Trust, as well as related compliance services, pursuant to a consulting agreement between NLCS and the Trust. Under the terms of such agreement, NLCS receives fees from the Fund.
The officers and one trustee of the Trust are members of management and/or employees of Ultimus or of NLCS, and are not paid by the Trust for services to the Fund. Ultimus Fund Distributors, LLC (the “Distributor”) acts as the distributor of the Fund’s shares. The Distributor is a wholly-owned subsidiary of Ultimus. There were no payments made to the Distributor by the Fund for the fiscal year ended January 31, 2024.
The Fund has adopted a Distribution Plan (the “Plan”) pursuant to Rule 12b-1 under the 1940 Act. The Plan provides that the Fund will pay the Distributor and/or any registered securities dealer, financial institution or any other person (the “Recipient”) a shareholder servicing fee of 0.25% of the average daily net assets of the Fund in connection with the promotion and distribution of the Fund’s shares or the provision of personal services to shareholders, including, but not necessarily limited to, advertising, compensation to underwriters, dealers and selling personnel, the printing and mailing of prospectuses to other than current Fund shareholders, the printing and mailing of sales literature and
Summitry Equity Fund
Notes to the Financial Statements (continued)
January 31, 2024
servicing shareholder accounts (“12b-1 Expenses”). The Fund or Distributor may pay all or a portion of these fees to any Recipient who renders assistance in distributing or promoting the sale of shares, or who provides certain shareholder services, pursuant to a written agreement. The Plan is a compensation plan, which means that compensation is provided regardless of 12b-1 Expenses actually incurred. It is anticipated that the Plan will benefit shareholders because an effective sales program typically is necessary in order for the Fund to reach and maintain a sufficient size to achieve efficiently its investment objectives and to realize economies of scale. The Plan is not active and will not be activated prior to May 31, 2024.
NOTE 5. PURCHASES AND SALES OF SECURITIES
For the fiscal year ended January 31, 2024, purchases and sales of investment securities, other than short-term investments, were $6,605,715 and $13,500,401, respectively.
There were no purchases or sales of long-term U.S. government obligations during the fiscal year ended January 31, 2024.
NOTE 6. FEDERAL TAX INFORMATION
At January 31, 2024, the net unrealized appreciation (depreciation) and tax cost of investments for tax purposes were as follows:
| Gross unrealized appreciation | | $ | 23,624,503 | |
| Gross unrealized depreciation | | | (863,820 | ) |
| Net unrealized appreciation on investments | | $ | 22,760,683 | |
| Tax cost of investments | | $ | 44,458,853 | |
The tax character of distributions paid for the fiscal years ended January 31, 2024 and January 31, 2023 were as follows:
| | | 2024 | | | 2023 | |
| Distributions paid from: | | | | | | | | |
| Long-term capital gains | | $ | 5,291,128 | | | $ | 7,977,565 | |
| Total distributions paid | | $ | 5,291,128 | | | $ | 7,977,565 | |
At January 31, 2024, the components of accumulated earnings (deficit) on a tax basis were as follows:
| Undistributed long-term capital gains | | $ | 2,083,106 | |
| Accumulated capital and other losses | | | (54,561 | ) |
| Unrealized appreciation on investments | | | 22,760,683 | |
| Total accumulated earnings | | $ | 24,789,228 | |
Summitry Equity Fund
Notes to the Financial Statements (continued)
January 31, 2024
As of January 31, 2024, the Fund had deferred Qualified Later Year Ordinary losses of $54,561.
NOTE 7. SECTOR RISK
If the Fund has significant investments in the securities of issuers within a particular sector, any development affecting that sector will have a greater impact on the value of the net assets of the Fund than would be the case if the Fund did not have significant investments in that sector. In addition, this may increase the risk of loss in the Fund and increase the volatility of the Fund’s NAV per share. For instance, economic or market factors, regulatory changes or other developments may negatively impact all companies in a particular sector, and therefore the value of the Fund’s portfolio will be adversely affected. As of January 31, 2024, the Fund had 33.55% of the value of its net assets invested in stocks within the Technology sector.
NOTE 8. COMMITMENTS AND CONTINGENCIES
The Trust indemnifies its officers and Trustees for certain liabilities that may arise from their performance of their duties to the Trust or the Fund. Additionally, in the normal course of business, the Trust enters into contracts that contain a variety of representations and warranties which provide general indemnifications. The Trust’s maximum exposure under these arrangements is unknown, as this would involve future claims that may be made against the Trust that have not yet occurred.
NOTE 9. SUBSEQUENT EVENTS
Management of the Fund has evaluated the need for disclosures and/or adjustments resulting from subsequent events through the date at which these financial statements were issued. Based upon this evaluation, management has determined there were no items requiring adjustment of the financial statements or additional disclosure.
Report of Independent Registered Public Accounting Firm
To the Shareholders of Summitry Equity Fund and
Board of Trustees of Valued Advisers Trust
Opinion on the Financial Statements
We have audited the accompanying statement of assets and liabilities, including the schedule of investments, of Summitry Equity Fund (the “Fund”), a series of Valued Trust Advisers Trust, as of January 31, 2024, the related statement of operations for the year then ended, the statements of changes in net assets for each of the two years in the period then ended, the related notes, and the financial highlights for each of the five years in the period then ended (collectively referred to as the “financial statements”). In our opinion, the financial statements present fairly, in all material respects, the financial position of the Fund as of January 31, 2024, the results of its operations for the year then ended, the changes in net assets for each of the two years in the period then ended, and the financial highlights for each of the five years in the period then ended, in conformity with accounting principles generally accepted in the United States of America.
Basis for Opinion
These financial statements are the responsibility of the Fund’s management. Our responsibility is to express an opinion on the Fund’s financial statements based on our audits. We are a public accounting firm registered with the Public Company Accounting Oversight Board (United States) (“PCAOB”) and are required to be independent with respect to the Fund in accordance with the U.S. federal securities laws and the applicable rules and regulations of the Securities and Exchange Commission and the PCAOB.
We conducted our audits in accordance with the standards of the PCAOB. Those standards require that we plan and perform the audit to obtain reasonable assurance about whether the financial statements are free of material misstatement whether due to error or fraud.
Our audits included performing procedures to assess the risks of material misstatement of the financial statements, whether due to error or fraud, and performing procedures that respond to those risks. Such procedures included examining, on a test basis, evidence regarding the amounts and disclosures in the financial statements. Our procedures included confirmation of securities owned as of January 31, 2024, by correspondence with the custodian. Our audits also included evaluating the accounting principles used and significant estimates made by management, as well as evaluating the overall presentation of the financial statements. We believe that our audits provide a reasonable basis for our opinion.
We have served as the Fund’s auditor since 2011.
COHEN & COMPANY, LTD.
Cleveland, Ohio
March 27, 2024
Summary of Fund Expenses (Unaudited)
As a shareholder of the Fund, you incur two types of costs: (1) transaction and (2) ongoing costs, including management fees, distribution (12b-1) fees and other Fund expenses. These examples are intended to help you understand your ongoing costs (in dollars) of investing in the Fund and to compare these costs with the ongoing costs of investing in other funds. The example is based on an investment of $1,000 invested at the beginning of the period and held for the entire period from August 1, 2023 through January 31, 2024.
Actual Expenses
The first line of the table below provides information about actual account values and actual expenses. You may use the information in this line, together with the amount you invested, to estimate the expenses that you paid over the period. Simply divide your account value by $1,000 (for example, an $8,600 account value divided by $1,000 = 8.6), then multiply the result by the number in the first line under the heading “Expenses Paid During Period” to estimate the expenses you paid on your account during this period.
Hypothetical Example for Comparison Purposes
The second line of the table below provides information about hypothetical account values and hypothetical expenses based on the Fund’s actual expense ratio and an assumed rate of return of 5% per year before expenses, which is not the Fund’s actual return. The hypothetical account values and expenses may not be used to estimate the actual ending account balance or expenses you paid for the period. You may use this information to compare the ongoing costs of investing in the Fund and other funds. To do so, compare this 5% hypothetical example with the 5% hypothetical examples that appear in the shareholder reports of other funds.
Expenses shown in the table are meant to highlight your ongoing costs only and do not reflect any transactional costs. Therefore, the second line of the table below is useful in comparing ongoing costs only and will not help you determine the relative total costs of owning different funds. In addition, if transaction costs were included, your costs would have been higher.
| | | Beginning | | | Ending | | | | | | |
| | | Account | | | Account | | | Expenses | | | |
| | | Value | | | Value | | | Paid | | | Annualized |
| | | August 1, | | | January 31, | | | During | | | Expense |
| | | 2023 | | | 2024 | | | Period(a) | | | Ratio |
| Actual | | $ | 1,000.00 | | | $ | 1,086.70 | | | $ | 6.57 | | | 1.25% |
| Hypothetical(b) | | $ | 1,000.00 | | | $ | 1,018.90 | | | $ | 6.36 | | | 1.25% |
| (a) | Expenses are equal to the Fund’s annualized expense ratios, multiplied by the average account value over the period, multiplied by 184/365 (to reflect the one-half year period). |
| (b) | Hypothetical assumes 5% annual return before expenses. |
Additional Federal Income Tax Information (Unaudited)
The Form 1099-DIV you receive in January 2025 will show the tax status of all distributions paid to your account in calendar year 2024. Shareholders are advised to consult their own tax adviser with respect to the tax consequences of their investment in the Fund. As required by the Internal Revenue Code and/or regulations, shareholders must be notified regarding the status of qualified dividend income for individuals and the dividends received deduction for corporations.
Qualified Dividend Income. The Fund designates approximately 0% or up to the maximum amount of such dividends allowable pursuant to the Internal Revenue Code, as qualified dividend income eligible for a reduced tax rate.
Qualified Business Income. The Fund designates approximately 0% of its ordinary income dividends, or up to the maximum amount of such dividends allowable pursuant to the Internal Revenue Code, as qualified business income.
Dividends Received Deduction. Corporate shareholders are generally entitled to take the dividends received deduction on the portion of the Fund’s dividend distribution that qualifies under tax law. For the Fund’s calendar year 2024 ordinary income dividends, 0% qualifies for the corporate dividends received deduction.
For the fiscal year ended January 31, 2024, the Fund designated $5,291,128 as long-term capital gain distributions.
Liquidity Risk Management Program (Unaudited)
Valued Advisers Trust has adopted and implemented a written liquidity risk management program as required by Rule 22e-4 (the “Liquidity Rule”) under the Investment Company Act. The program is reasonably designed to assess and manage the Fund’s liquidity risk, taking into consideration, among other factors, the Fund’s investment strategy and the liquidity of its portfolio investments during normal and reasonably foreseeable stressed conditions; its short and long-term cash flow projections; and its cash holdings and access to other funding sources. The Board of Trustees approved the appointment of a Liquidity Administrator Committee, which includes representatives from Summitry LLC, the Fund’s investment adviser, and Ultimus Fund Solutions, LLC, the Fund’s Administrator. The Liquidity Administrator Committee is responsible for the program’s administration and oversight and for reporting to the Board on at least an annual basis regarding the program’s operation and effectiveness. The Liquidity Administrator Committee updated its assessment of the Fund’s liquidity risk profile, considering additional data gathered during the period June 1, 2022 through May 31, 2023 (the “Review Period”) and the adequacy and effectiveness of the liquidity risk management program’s operations during the Review Period in order to prepare a written report for the Board of Trustees (the “Report”) for consideration at its meeting held on September 8, 2023. The Report noted that during the Review Period the Fund did not experience unusual stress or disruption to its operations related to purchase and redemption activity. It further noted that during the Review Period the Fund held adequate levels of cash and highly liquid investments to meet shareholder redemption activities in accordance with applicable requirements. The Report concluded that (i) the Trust’s liquidity risk management program is reasonably designed to prevent violations of the Liquidity Rule and (ii) the Trust’s liquidity risk management program had been effectively implemented during the Review Period.
Investment Advisory Agreement Approval (Unaudited)
At a meeting held on December 11-12, 2023, the Board of Trustees (the “Board”) considered the renewal of the Investment Advisory Agreement (the “Summitry Agreement”) between Valued Advisers Trust (the “Trust”) and Summitry LLC (“Summitry”) with respect to the Summitry Equity Fund (the “Summitry Fund”). Summitry provided written information to the Board to assist the Board in its considerations.
Counsel reminded the Trustees of their fiduciary duties and responsibilities as summarized in a memorandum from his firm, including the factors to be considered, and the application of those factors to Summitry and the Summitry Agreement. In assessing the Factors and reaching its decision, the Board took into consideration information furnished by Summitry and the Trust’s other service providers for the Board’s review and consideration throughout the year at regular Board meetings, as well as information specifically prepared or presented in connection with the annual renewal process, including information presented at this Meeting. The Board requested and was provided with, and reflected on, information and reports relevant to the annual renewal of the Summitry Agreement, including: (i) reports regarding the services and support provided to the Summitry Fund by Summitry; (ii) quarterly assessments of the investment performance of the Summitry Fund by personnel of Summitry; (iii) commentary on the reasons for the performance; (iv) presentations by Summitry addressing its investment philosophy, investment strategy, personnel, and operations; (v) compliance and audit reports concerning the Summitry Fund and Summitry; (vi) disclosure information contained in the Trust’s registration statement and Summitry’s Form ADV; and (vii) a memorandum from Counsel, that summarized the fiduciary duties and responsibilities of the Board in considering and approving the Summitry Agreement. The Board also requested and received various informational materials including, without limitation: (a) documents containing information about Summitry, including its financial information, a description of personnel and the services it provides to the Summitry Fund; information on Summitry’s investment advice and performance; summaries of Summitry Fund expenses, compliance program, current legal matters, and other general information; (b) comparative expense and performance information for other mutual funds with strategies similar to the Summitry Fund; and (c) the benefits to be realized by Summitry from its relationship with the Summitry Fund. The Board did not identify any particular information that was most relevant to its consideration of the Summitry Agreement and each Trustee may have afforded different weight to the various Factors.
1. The nature, extent, and quality of the services to be provided by LSA. In this regard, the Board considered Summitry’s responsibilities under the Summitry Agreement. The Trustees considered the services being provided by Summitry to the Summitry Fund. The Trustees discussed, among other things: the quality of Summitry’s investment advisory services (including research and recommendations with respect to portfolio securities), its process for formulating investment recommendations and assuring compliance with the Summitry Fund’s investment objectives and limitations, its coordination of services for the Summitry Fund among the Summitry Fund’s service providers, and its efforts to promote the Summitry Fund and grow its assets. The Trustees considered Summitry’s continuity of, and commitment to retain, qualified personnel and Summitry’s commitment to maintain and enhance its resources and systems. The Trustees considered Summitry’s personnel, including the education and experience of the personnel. After considering the foregoing information and further information in the Meeting materials provided by Summitry (including Summitry’s Form ADV), the Board concluded that, in light of all the facts and circumstances, the nature, extent, and quality of the services provided by Summitry were satisfactory and adequate for the Summitry Fund.
Investment Advisory Agreement Approval (Unaudited) (continued)
2. Investment performance of the LS Fund and LSA. In considering the investment performance of the Summitry Fund and Summitry, the Trustees compared the performance of the Summitry Fund with the performance of funds in the same Morningstar category, as well as with peer group data and the Summitry Fund’s benchmark. The Trustees noted that the Summitry Fund had performed worse than its peer group median for the one year, five year, and since inception periods ended September 30, 2023, and had outperformed for the three year period. They observed that the Summitry Fund also performed below its benchmark for each of those periods. The Trustees observed that the Summitry Fund had outperformed compared to its category average and median for the one year and three year periods ended September 30, 2023, and underperformed for the five year and ten year periods, and had also underperformed compared to the median for the since inception period. The Trustees also considered the consistency of Summitry’s management of the Summitry Fund with its investment objective, strategies, and limitations. The Trustees considered the Summitry Fund’s performance relative to the performance of Summitry’s equity composite and noted that the performance of the Fund was lower for the one year period ended September 30, 2023. They considered Summitry’s explanation regarding the reasons for the difference, and determined that the explanation was reasonable. After reviewing and discussing the investment performance of the Summitry Fund further, Summitry’s experience managing the Summitry Fund, Summitry’s historical performance, and other relevant factors, the Board concluded, in light of all the facts and circumstances, that the investment performance of the Summitry Fund and Summitry was acceptable.
3. The costs of the services to be provided and profits to be realized by LSA from its relationship with the LS Fund. In considering the costs of services to be provided and the profits to be realized by Summitry from the relationship with the Summitry Fund, the Trustees considered: (1) Summitry’s financial condition; (2) the asset level of the Summitry Fund; (3) the overall expenses of the Summitry Fund; and (4) the nature and frequency of advisory fee payments. The Trustees reviewed information provided by Summitry regarding its profits associated with managing the Summitry Fund. The Trustees also considered potential benefits for Summitry in managing the Summitry Fund. The Trustees then compared the fees and expenses of the Summitry Fund (including the management fee) to other comparable mutual funds. The Trustees observed that the Summitry Fund’s advisory fee and net expense ratio were above the average and median of its Morningstar category, but below the maximum in each case. They also noted that the Summitry Fund’s advisory fee and net expense ratio were higher than the average and median of its custom peer group. Based on the foregoing, the Board concluded that the fees to be paid to Summitry by the Summitry Fund and the profits to be realized by Summitry, in light of all the facts and circumstances, were fair and reasonable in relation to the nature and quality of the services provided by Summitry.
4. The extent to which economies of scale would be realized as the LS Fund grows and whether advisory fee levels reflect these economies of scale for the benefit of the LS Fund’s investors. In this regard, the Board considered the Summitry Fund’s fee arrangements with Summitry. The Board considered that while the management fee remained the same at all asset levels, the Summitry Fund’s shareholders had experienced benefits from the Summitry Fund’s expense limitation arrangement, and that Summitry had agreed to extend that arrangement for another year. They also noted that the Summitry Fund’s shareholders would continue to benefit from the economies of scale under the Trust’s agreements with service providers other than Summitry. In light of the foregoing, the Board
Investment Advisory Agreement Approval (Unaudited) (continued)
determined that the Summitry Fund’s fee arrangements, in light of all the facts and circumstances, were fair and reasonable in relation to the nature and quality of the services provided by Summitry.
5. Possible conflicts of interest and benefits to LSA. In considering Summitry’s practices regarding conflicts of interest, the Trustees evaluated the potential for conflicts of interest and considered such matters as the experience and ability of the advisory personnel assigned to the Summitry Fund; the basis of decisions to buy or sell securities for the Summitry Fund and/or Summitry’s other accounts; and the substance and administration of Summitry’s code of ethics. The Trustees also considered disclosure in the registration statement of the Trust relating to Summitry’s potential conflicts of interest. The Trustees discussed Summitry’s practices for seeking best execution for the Summitry Fund’s portfolio transactions. In terms of other benefits to Summitry, the Trustees considered Summitry’s perspective that the Summitry Fund provides an investment option for smaller accounts, and that the public nature of the Summitry Fund provides credibility to Summitry’s operations. Based on the foregoing, the Board determined that Summitry’s standards and practices relating to the identification and mitigation of potential conflicts of interest were satisfactory.
After additional consideration of the factors delineated in the memorandum provided by counsel and further discussion among the Board members, the Board determined to approve the continuation of the Summitry Agreement.
| Trustees and Officers (Unaudited) |
The following table provides information regarding each of the Trustees.
Name, Address*, Age,
Position with Trust**,
Term of Position with
Trust | Principal Occupation
During Past 5 Years | Other Directorships |
| INDEPENDENT TRUSTEES |
Ira P. Cohen, 64
Independent Trustee
Since June 2010 | Current:Independent financial services consultant (since February 2005); Executive Vice President of Asset Management Services, Recognos Financial (since August 2015). | Trustee and Audit Committee Chairman, Apollo Diversified Real Estate Fund (since March 2022); Trustee, Chairman and Nominating and Governance Committee Chairman, Angel Oak Funds Trust (since October 2014) (7 portfolios); Trustee, Chairman, and Nominating and Governance Committee Chairman, Angel Oak Strategic Credit Fund (since December 2017); Trustee, Chairman, and Nominating and Governance Committee Chairman, Angel Oak Financial Strategies Income Term Trust (since May 2019); Trustee, Chairman, and Nominating and Governance Committee Chairman, Angel Oak Credit Opportunities Term Trust (since January 2021); Trustee and Nominating and Governance Committee Chairman, U.S. Fixed Income Trust (since March 2019). |
Andrea N. Mullins, 56
Independent Trustee
Since December 2013
Chairperson Since
March 2017 | Current:Private investor; Independent Contractor, SWM Advisors (since April 2014). | Trustee, Angel Oak Funds Trust (since February 2019) (7 portfolios); Trustee, Angel Oak Strategic Credit Fund (since February 2019); Trustee, Angel Oak Financial Strategies Income Term Trust (since May 2019); Trustee, Angel Oak Credit Opportunities Term Trust (since January 2021); Trustee and Audit Committee Chair, NXG Next Gen Infrastructure Income Fund (since November 2021); Trustee and Audit Committee Chair, NXG Cushing Midstream Energy Fund (since November 2021). |
| INTERESTED TRUSTEE |
Mark J. Seger***, 62
Trustee Since March
2017 | Current:Vice Chairman and Co-Founder, Ultimus Fund Solutions, LLC and its subsidiaries (since 1999). | None. |
| * | The address for each Trustee is 225 Pictoria Drive, Suite 450, Cincinnati, Ohio 45246. |
| ** | As of the date of this report, the Trust consists of 15 series. |
| *** | Mr. Seger is considered an “interested person” of the Trust because of his relationship with the Trust’s administrator, transfer agent, and distributors. |
| Trustees and Officers (Unaudited) (continued) |
The following table provides information regarding the Officers of the Trust:
Name, Address*, Age,
Position with Trust**,
Term of Position with Trust | Principal Occupation During Past 5 Years |
Matthew J. Miller, 47
Principal Executive
Officer and
President Since March
2022
Vice President
From December 2011 to
March 2022 | Current:Vice President, Relationship Management, Ultimus Fund Solutions, LLC (since December 2015). |
N. Lynn Bowley, 65
Chief Compliance
Officer Since April 2022 | Current:Senior Vice President, Senior Compliance Officer,Northern Lights Compliance Services, LLC (since January 2007). |
Carol J. Highsmith, 59
Vice President Since
August 2008
Secretary Since March
2014 | Current:Vice President, Ultimus Fund Solutions, LLC (since December 2015). |
Zachary P. Richmond,43
Principal Financial
Officer and Treasurer
Since September 2021 | Current:Vice President, Financial Administration, Ultimus Fund Solutions, LLC (since February 2019). Previous:Assistant Vice President, Associate Director of Financial Administration, Ultimus Fund Solutions, LLC (December 2015 to February 2019). |
Jared D. Lahman, 37
AML Officer
Since March 2023
| Current:Senior Compliance Analyst, Northern Lights Compliance Services, LLC (since January 2019). Previous: Manager of Fund Accounting, Gemini Fund Services (September 2016 to December 2018) |
| * | The address for each Officer is 225 Pictoria Drive, Suite 450, Cincinnati, Ohio 45246. |
| ** | As of the date of this report, the Trust consists of 15 series. |
| Other Information (Unaudited) |
The Fund’s Statement of Additional Information (“SAI”) includes additional information about the trustees and is available without charge, upon request. You may call toll-free at (866) 954-6682 to request a copy of the SAI or to make shareholder inquiries
| FACTS | WHAT DOES SUMMITRY EQUITY FUND (THE “FUND”) DO WITH YOUR PERSONAL INFORMATION? |
| |
| Why? | Financial companies choose how they share your personal information. Federal law gives consumers the right to limit some but not all sharing. Federal law also requires us to tell you how we collect, share, and protect your personal information. Please read this notice carefully to understand what we do. |
| |
| What? | The types of personal information we collect and share depend on the product or service you have with us. This information can include: |
| | |
| | ■ Social Security number |
| | |
| | ■ account balances and account transactions |
| | |
| | ■ transaction or loss history and purchase history |
| | |
| | ■ checking account information and wire transfer instructions |
| | |
| | When you are no longer our customer, we continue to share your information as described in this notice. |
| |
| How? | All financial companies need to share customers’ personal information to run their everyday business. In the section below, we list the reasons financial companies can share their customers’ personal information; the reasons the Fund chooses to share; and whether you can limit this sharing. |
| Reasons we can share your personal information | Does the Fund share? |
For our everyday business purposes—
such as to process your transactions, maintain your account(s), respond to court orders and legal investigations, or report to credit bureaus | Yes |
For our marketing purposes—
to offer our products and services to you | No |
| For joint marketing with other financial companies | No |
For our affiliates’ everyday business purposes—
information about your transactions and experiences | No |
For our affiliates’ everyday business purposes—
information about your creditworthiness | No |
| For nonaffiliates to market to you | No |
| Questions? | Call (866) 954-6682 |
| Who we are |
| Who is providing this notice? | Summitry Equity Fund
Ultimus Fund Distributors, LLC (Distributor)
Ultimus Fund Solutions, LLC (Administrator) |
| |
| What we do |
| How does the Fund protect my personal information? | To protect your personal information from unauthorized access and use, we use security measures that comply with federal law. These measures include computer safeguards and secured files and buildings. Our service providers are held accountable for adhering to strict policies and procedures to prevent any misuse of your nonpublic personal information. |
| How does the Fund collect my personal information? | We collect your personal information, for example, when you ■ open an account or deposit money ■ buy securities from us or sell securities to us ■ make deposits or withdrawals from your account ■ give us your account information ■ make a wire transfer ■ tell us who receives the money ■ tell us where to send the money ■ show your government-issued ID ■ show your driver’s license |
| Why can’t I limit all sharing? | Federal law gives you the right to limit only ■ sharing for affiliates’ everyday business purposes — information about your creditworthiness ■ affiliates from using your information to market to you ■ sharing for nonaffiliates to market to you State laws and individual companies may give you additional rights to limit sharing. |
| Definitions |
| Affiliates | Companies related by common ownership or control. They can be financial and nonfinancial companies. ■ Summitry LLC, the investment adviser to the Fund, could be deemed to be an affiliate. |
| Nonaffiliates | Companies not related by common ownership or control. They can be financial and nonfinancial companies. ■ The Fund does not share your personal information with nonaffiliates so they can market to you |
| Joint marketing | A formal agreement between nonaffiliated financial companies that together market financial products or services to you. ■ The Fund does not jointly market. |
Proxy Voting
A description of the policies and procedures that the Fund uses to determine how to vote proxies relating to portfolio securities and information regarding how the Fund voted those proxies during the most recent twelve month period ended June 30, are available (1) without charge upon request by calling the Fund at (866) 954-6682 and (2) in Fund documents filed with the SEC on the SEC’s website at www.sec.gov.
TRUSTEES
Andrea N. Mullins, Chairperson
Ira P. Cohen
Mark J. Seger
| INDEPENDENT REGISTERED
PUBLIC ACCOUNTING FIRM
Cohen & Company, Ltd.
1350 Euclid Avenue, Suite 800
Cleveland, OH 44115
|
| | |
OFFICERS
Matthew J. Miller, Principal Executive Officer and
President
Zachary P. Richmond, Principal Financial Officer and
Treasurer
N. Lynn Bowley, Chief Compliance Officer
Carol J. Highsmith, Vice President and Secretary | LEGAL COUNSEL
Troutman Pepper Hamilton Sanders LLP
3000 Two Logan Square
18th and Arch Streets
Philadelphia, PA 19103 |
| | |
INVESTMENT ADVISER
Summitry LLC
919 E. Hillsdale Boulevard, Suite 150
Foster City, CA 94404 | CUSTODIAN
Huntington National Bank
41 South High Street
Columbus, OH 43215
|
| | |
DISTRIBUTOR
Ultimus Fund Distributors, LLC
225 Pictoria Drive, Suite 450
Cincinnati, OH 45246 | ADMINISTRATOR, TRANSFER
AGENT AND FUND ACCOUNTANT
Ultimus Fund Solutions, LLC
225 Pictoria Drive, Suite 450
Cincinnati, OH 45246 |
This report is intended only for the information of shareholders or those who have received the Fund’s prospectus which contains information about the Fund’s management fee and expenses. Please read the prospectus carefully before investing.
Distributed by Ultimus Fund Distributors, LLC, Member FINRA/SIPC
Summitry-AR-2024
Item 2. Code of Ethics.
As of the end of the period covered by this report, the registrant has adopted a code of ethics that applies to the registrant’s principal executive officer, principal financial officer, principal accounting officer or controller, or persons performing similar functions, regardless of whether these individuals are employed by the registrant or a third party. Pursuant to Item 13(a)(1), a copy of registrant’s code of ethics is filed as an exhibit to this Form N-CSR. During the period covered by this report, the code of ethics has not been amended, and the registrant has not granted any waivers, including implicit waivers, from the provisions of the code of ethics.
Item 3. Audit Committee Financial Expert.
(a)(1) The registrant’s Board of Trustees has determined that the registrant has at least one audit committee financial expert serving on its audit committee.
(a)(2) The audit committee financial expert is Andrea N. Mullins, who is “independent” for purposes of this Item 3 of Form N-CSR.
Item 4. Principal Accountant Fees and Services.
| | Summitry Equity Fund | | | | FY 2024 | | | $ | 15,000 | |
| | | | | | FY 2023 | | | $ | 14,500 | |
| | | | | | | | | | | |
| | Belmont Theta Income Fund | | | | FY 2024 | | | $ | 16,000 | |
| | | | | | FY 2023 | | | $ | 15,500 | |
| | | | | | | | | | | |
| | Channing Intrinsic Value Small-Cap Fund | | | | FY 2024 | | | $ | 15,000 | |
| | | | | | FY 2023 | | | $ | 14,500 | |
| | | | | | | | | | | |
| | MDP Low Volatility Fund | | | | FY 2024 | | | $ | 16,000 | |
| | | | | | FY 2023 | | | $ | 15,500 | |
| | Summitry Equity Fund | | | | FY 2024 | | | $ | 0 | |
| | | | | | FY 2023 | | | $ | 0 | |
| | | | | | | | | | | |
| | Belmont Theta Income Fund | | | | FY 2024 | | | $ | 0 | |
| | | | | | FY 2023 | | | $ | 0 | |
| | | | | | | | | | | |
| | Channing Intrinsic Value Small-Cap Fund | | | | FY 2024 | | | $ | 0 | |
| | | | | | FY 2023 | | | $ | 0 | |
| | | | | | | | | | | |
| | MDP Low Volatility Fund | | | | FY 2024 | | | $ | 0 | |
| | | | | | FY 2023 | | | $ | 0 | |
| | Summitry Equity Fund | | | | FY 2024 | | | $ | 3,000 | |
| | | | | | FY 2023 | | | $ | 3,000 | |
| | | | | | | | | | | |
| | Belmont Theta Income Fund | | | | FY 2024 | | | $ | 3,000 | |
| | | | | | FY 2023 | | | $ | 3,000 | |
| | | | | | | | | | | |
| | Channing Intrinsic Value Small-Cap Fund | | | | FY 2024 | | | $ | 3,000 | |
| | | | | | FY 2023 | | | $ | 3,000 | |
| | | | | | | | | | | |
| | MDP Low Volatility Fund | | | | FY 2024 | | | $ | 3,000 | |
| | | | | | FY 2023 | | | $ | 4,500 | |
Nature of the fees: Preparation of the 1120 RIC and Excise review
| | Summitry Equity Fund | | | | FY 2024 | | | $ | 0 | |
| | | | | | FY 2023 | | | $ | 0 | |
| | | | | | | | | | | |
| | Belmont Theta Income Fund | | | | FY 2024 | | | $ | 0 | |
| | | | | | FY 2023 | | | $ | 0 | |
| | | | | | | | | | | |
| | Channing Intrinsic Value Small-Cap Fund | | | | FY 2024 | | | $ | 0 | |
| | | | | | FY 2023 | | | $ | 0 | |
| | | | | | | | | | | |
| | MDP Low Volatility Fund | | | | FY 2024 | | | $ | 0 | |
| | | | | | FY 2023 | | | $ | 0 | |
| (e) | (1) Audit Committee’s Pre-Approval Policies |
The Audit Committee Charter requires the Audit Committee to be responsible for the selection, retention or termination of auditors and, in connection therewith, to (i) evaluate the proposed fees and other compensation, if any, to be paid to the auditors, (ii) evaluate the independence of the auditors, (iii) pre-approve all audit services and, when appropriate, any non-audit services provided by the independent auditors to the Trust, (iv) pre-approve, when appropriate, any non-audit services provided by the independent auditors to the Trust's investment adviser, or any entity controlling, controlled by, or under common control with the investment adviser and that provides ongoing services to the Trust if the engagement relates directly to the operations and financial reporting of the Trust, and (v) receive the auditors’ specific representations as to their independence.
| (2) | None of the services described in paragraph (b) through (d) of this Item were approved by the audit committee pursuant to paragraph (c)(7)(i)(C) of Rule 2-01 of Regulation S-X. |
(f) During audit of registrant's financial statements for the most recent fiscal year, less than 50 percent of the hours expended on the principal accountant's engagement were attributed to work performed by persons other than the principal accountant's full-time, permanent employees.
(g) The aggregate non-audit fees billed by the registrant's accountant for services rendered to the registrant, and rendered to the registrant's investment adviser (not including any sub-adviser whose role is primarily portfolio management and is subcontracted with or overseen by another investment adviser), and any entity controlling, controlled by, or under common control with the adviser that provides ongoing services to the registrant:
| | Registrant | | Adviser | |
| FY 2024 | $ 12,000 | | $ 0 | |
| FY 2023 | $ 13,500 | | $ 0 | |
| | | | | |
(h) Not applicable. The auditor performed no services for the registrant’s investment adviser or any entity controlling, controlled by, or under common control with the investment adviser that provides ongoing services to the registrant.
(i) Not applicable.
(j) Not applicable.
Item 5. Audit Committee of Listed Companies. N/A
Item 6. Schedule of Investments. Schedules filed with Item 1.
Item 7. Disclosure of Proxy Voting Policies and Procedures for Closed-End Management Investment Companies. NOT APPLICABLE – applies to closed-end funds only
Item 8. Portfolio Managers of Closed-End Investment Companies. NOT APPLICABLE – applies to closed-end funds only
Item 9. Purchases of Equity Securities by Closed-End Management Investment Company and Affiliated Purchasers. NOT APPLICABLE – applies to closed-end funds only
Item 10. Submission of Matters to a Vote of Security Holders.
The guidelines applicable to shareholders desiring to submit recommendations for nominees to the Registrant's board of trustees are contained in the statement of additional information of the Trust with respect to the Fund(s) for which this Form N-CSR is being filed.
Item 11. Controls and Procedures.
(a) Based on their evaluation of the registrant’s disclosure controls and procedures (as defined in Rule 30a-3(c) under the Investment Company Act of 1940, as amended (the “Act”)) as of a date within 90 days of the filing date of this report, the registrant’s principal executive officer and principal financial officer have concluded that such disclosure controls and procedures are reasonably designed and are operating effectively to ensure that material information relating to the registrant is made known to them by others within those entities, particularly during the period in which this report is being prepared, and that the information required in filings on Form N-CSR is recorded, processed, summarized, and reported on a timely basis.
(b) There were no changes in the registrant’s internal control over financial reporting (as defined in Rule 30a-3(d) under the Investment Company Act of 1940) that occurred during the period covered by this report that have materially affected, or are reasonably likely to materially affect, the registrant’s internal control over financial reporting.
Item 12. Disclosure of Securities Lending Activities for Closed-End Management Investment Companies.
NOT APPLICABLE
Item 13. Exhibits.
(a) (1) Code is filed herewith.
(3) Not applicable
Pursuant to the requirements of the Securities Exchange Act of 1934 and the Investment Company Act of 1940, the registrant has duly caused this report to be signed on its behalf by the undersigned, thereunto duly authorized.
(Registrant) Valued Advisers Trust
By /s/ Matthew J. Miller
Matthew J. Miller, President and Principal Executive Officer
Date 4/5/2024
Pursuant to the requirements of the Securities Exchange Act of 1934 and the Investment Company Act of 1940, this report has been signed below by the following persons on behalf of the registrant and in the capacities and on the dates indicated.
By /s/ Matthew J. Miller
Matthew J. Miller, President and Principal Executive Officer
Date 4/5/2024
By /s/ Zachary P. Richmond
Zachary P. Richmond, Treasurer and Principal Financial Officer
Date 4/5/2024