united states
securities and exchange commission
washington, d.c. 20549
form n-csr
certified shareholder report of registered management
investment companies
Investment Company Act file number 811-22208
Valued Advisers Trust
(Exact name of registrant as specified in charter)
Ultimus Fund Solutions, LLC 225 Pictoria Drive, Suite 450 Cincinnati, OH 45246
(Address of principal executive offices) (Zip code)
Ultimus Fund Solutions, LLC
Attn: Zachary Richmond
225 Pictoria Drive, Suite 450
Cincinnati, OH 45246
(Name and address of agent for service)
Registrant's telephone number, including area code: 513-587-3400
Date of fiscal year end: 10/31
Date of reporting period: 10/31/2023
Item 1. Reports to Stockholders.
(a)

DANA LARGE CAP EQUITY FUND
DANA EPIPHANY ESG SMALL CAP EQUITY FUND
DANA EPIPHANY ESG EQUITY FUND
Annual Report
October 31, 2023
Dana Investment Advisors, Inc.
20700 Swenson Drive, Suite 400
Waukesha, WI 53186
(855) 280-9648
www.danafunds.com
Management Discussion of Fund Performance (Unaudited)
Dear Fellow Shareholders,
At this time last year, we were eager to put the previous twelve months behind us. The Federal Reserve (“Fed”) had raised rates repeatedly in 2022 to fight inflation, and this pressured asset prices. While bear markets are never welcome, we wrote that they often create new opportunities for growth and value creation. The recovery in equities that started in October 2022 was fairly broad across market cap ranges through year end. However, this breadth gave way to a more narrow market focus in 2023. Large cap stocks, particularly mega-cap stocks, outperformed the smaller cap indexes in the New Year, a recurring theme that played out for much of 2023. After lagging the concentrated, strong performance of a handful of companies, many stocks now have better relative valuations across market cap ranges. We have confidence that Dana’s investment philosophy, which relies on fundamental analysis and valuation discipline, should serve us well. We remain thankful for your continued trust and support of the Dana Funds. We are happy to share this discussion and analysis of the prior twelve months in the financial markets and the Dana Funds performance.
Economic and Market Recap
The S&P 500® Index rose over 10% for the fiscal year ended October 31, 2023, but in March 2023, it touched a short-term low immediately following the collapse of Silicon Valley Bank. Investors were understandably concerned and moved out of riskier assets. However, the equity market quickly turned upward following Fed and U.S. Treasury actions. The S&P 500® Index finished the first quarter with a positive +7.50% return, pleasantly surprising investors. Market breadth was not as remarkable, and the S&P 500® Equal Weight Index gained only +2.93%, roughly in line with the Russell® 2000 Index return of +2.74%.
The Fed continued to dominate market psychology and persisted in raising rates through all three quarters of 2023, albeit at a much more modest pace compared to 2022. The economy remained resilient with GDP up 2.1% in Q2 and 4.9% in Q3, and equities rose during the second quarter. While mega-cap names continued to outperform, small cap stocks experienced a good rally as well. However, equities hit the pause button in Q3 and ultimately gave up ground due to increasing pressure on valuations caused by higher interest rates. By the end of the quarter, rates were at their highest level in over 15 years. Energy costs also rose in Q3 as oil moved from $70 to $90 a barrel. This added to concerns for all sectors with the exception of the Energy sector, the only sector to deliver a positive return in the S&P 500® Index during the third quarter.
Fed policy and interest rate expectations remain the dominant influence on the markets. The Fed seems to be on hold for now; indeed inflation as measured by CPI has fallen to much lower levels compared to 2022 and corporate earnings have been favorable. These factors have thus far overcome the geopolitical and economic concerns posed by the
1
Management Discussion of Fund Performance (Unaudited) (continued)
sudden war in Israel that began in early October. Many stocks have negative returns for the year and are increasingly attractive on a relative basis. We will continue to seek these opportunities as we remain vigilant on the impacts of a potentially escalating situation in the Middle East and the uncertainties in a U.S. presidential election next year.
Dana Large Cap Equity Fund (the “Large Cap Fund” or “Fund”) Discussion
Over the Fund’s fiscal year ended October 31, 2023, the S&P 500® Index returned +10.14% and the Dana Large Cap Equity Fund (DLCIX) gained +6.44%. The concentration of performance in mega-cap names drove returns in the cap-weighted S&P 500® Index. In fact, stocks deemed the “Magnificent 7” accounted for approximately 85% of the S&P 500® Index’s total return through the first three quarters of 2023, a staggering concentration. The Fund has held several of these stocks for a long period, including Apple, Inc. (AAPL), Microsoft Corp. (MSFT) and Alphabet, Inc. (GOOGL), and they have been very accretive over time. We added Meta Platforms, Inc. (META) back to the Fund and purchased AI champion NVIDIA Corp. (NVDA) partway through 2023.
Last year, we noted that there were some names in the portfolio that we felt had been unfairly punished; names where the fundamentals held up and valuation looked compelling, yet they underperformed. One such example was Adobe, Inc. (ADBE), the dominant provider of digital market software. Our patience paid off, and the stock rallied 67%, the second-best returning holding during the fiscal year. Broadcom, Inc. (AVGO) performed even better, and Dell Technologies, Inc. (DELL) rounded out the top three Fund performers, all of which are in the Technology sector. Despite these strong returns, the Fund’s holdings lagged this best performing benchmark sector due to the significant impact of not holding NVIDIA Corp. (NVDA) early in the year and, to a lesser extent, having a smaller weight in Microsoft Corp. (MSFT) versus the benchmark and holding security firm, Fortinet, Inc. (FTNT).
The Communications Sector’s performance is similar in that not holding Meta Platforms, Inc. (META) early on detracted from relative performance. Fund holding Alphabet, Inc. (GOOGL) was the strongest absolute and relative performer in this sector. Interpublic Group of Companies (IPG) weakened this year on lower revenue expectations largely driven by cutbacks in technology firms, and Verizon (VZ) had weak price action. We sold both stocks in October on their more uncertain outlooks.
The best relative performance sector for the Fund was Financials. The Fund’s Financial holdings delivered a positive return versus the benchmark’s sector holdings posting a negative return. Morgan Stanley (MS) and Visa, Inc. (V) were up double digits. The Fund’s Real Estate sector had the second-best relative return and again was positive versus a negative return for the benchmark’s sector holdings. Solid performance in stable cash flow
2
Management Discussion of Fund Performance (Unaudited) (continued)
generator Iron Mountain, Inc. (IRM) more than offset the weaker performing Gaming and Leisure Properties, Inc. (GLPI).
The persistence in the Fed and the economy proved to be a tug of war for investors. Valuations certainly fluctuated with the changes in expectations. We placed more trades than is typical for us to take advantage where we saw opportunities. With the concentrated performance in the largest cap names, many stocks in our universe experienced a negative return for the fiscal year and are flying “under the radar screen.” We believe it is likely this disparity will not persist for much longer and that we will see more relative valuation beyond those most heavily weighted benchmark stocks.
Dana Epiphany ESG Equity Fund (the “Epiphany ESG Fund” or “Fund”) Discussion
The Dana Epiphany ESG Equity Fund (ESGIX) posted a return of -0.71%, trailing the benchmark S&P 500® Index return of +10.14% during the fiscal year ended October 31, 2023. The Epiphany ESG Fund shares an investment philosophy that is common to all the Dana Funds, then adds a faith-based values component to security selection. This Fund has an all-cap universe, so it invests across stocks in the large, mid, and small market cap ranges. The frequent shifts in market dynamics, the persistence of the Fed, and extreme concentration of performance in a few mega-cap names impacted this Fund as well as the Dana Large Cap Equity Fund. While we are disappointed in the performance of this Fund over the past fiscal year, we know that value-oriented strategies have lagged in this more concentrated, growth-focused market. The Fund has strong valuation characteristics that we believe will be rewarded over time.
On a sector level, the Epiphany ESG Fund outperformed the benchmark S&P 500® Index in the Real Estate and Energy sectors. Iron Mountain, Inc. (IRM) had a double-digit return. In the Energy sector, we made some recent changes, one of which was adding Weatherford International plc (WFRD) to the Fund. This was the primary contributor to the Fund in this sector. Both the Real Estate and Energy sectors in the Fund delivered positive returns versus the negative returns of their corresponding benchmark sector holdings.
The two weakest sectors were Technology and Consumer Discretionary. Similar to the Large Cap Fund, there are names in the portfolio where the mega-cap, growth-oriented stocks accounted for a substantial share of the benchmark’s performance. NVIDIA Corp. (NVDA) was one such company that we did not own early on and detracted from performance. We have added NVDA and are excited about this semiconductor company that specializes in advanced chips suited for AI development, a field that is still at the early stages and growing rapidly. We also purchased CrowdStrike Holdings, Inc. (CRWD), a global leader in cybersecurity applications. The Consumer Discretionary sector was hurt by weakness in Crocs, Inc. (CROX). The company hit its July earning report, yet revenue projections were below expectations.
3
Management Discussion of Fund Performance (Unaudited) (continued)
The past year was challenging, especially for value-oriented active management, as market index performance was largely determined by a small group of mega-cap stocks with exceptionally strong returns. The vast majority of stocks posted returns well below the major broad market indexes (S&P 500, Russell 1000, Russell 3000), with value stocks and mid- and small-cap stocks, on average, lagging substantially behind the mega-cap-dominated indexes. We believe the market will become more balanced and recognize the steady and solid performance of businesses outside of the mega-cap darlings, and that the portfolio is well positioned with attractive stocks that will benefit from this change in dynamic going forward. We remain focused on our fundamental and value-oriented approach to stock selection and believe shareholders will be rewarded over time.
Dana Epiphany ESG Small Cap Equity Fund (the “Small Cap Fund” or “Fund”) Discussion
The Dana Epiphany ESG Small Cap Equity Fund (DSCIX) returned -0.81% compared +1.28% for the benchmark Morningstar US Small Core Index during the fiscal year ended October 31, 2023. This Fund also shares an investment philosophy that is common to all the Dana Funds, then adds a faith-based values component to security selection. The small cap portion of the market as measured by the Russell 2000® Index began to rally toward the end of 2022, yet consistently remained in the shadow of the larger cap indices for much of the fiscal year. This index pushed higher in the first half of 2023, but this quickly faded in the third quarter. Persistently higher interest rates and higher energy costs weighed heavily on smaller companies, and the collapse of Silicon Valley Bank early in the year put regional banks more at risk relative to larger banks. The range of sector returns was wide. Five of the eleven sectors in the Russell 2000® Index had double-digit declines, and the best performing sector, Energy, was only up a bit more than 6%. The Fund lagged the Morningingstar US Small Core Index benchmark, yet outperformed the Russell 2000® Index significantly.
Many Consumer Discretionary sector holdings performed quite well. These include Deckers Outdoor Corporation (DECK), Group 1 Automotive, Inc. (GPI), TopBuild Corp. (BLD), and Boot Barn Holdings, Inc. (BOOT). All delivered significant double-digit returns. Most of these companies raised revenue and earnings estimates. Fund holdings in the Industrial sector also delivered double-digit returns, including FTI Consulting, Inc. (FCN), EnerSys (ENS), and Clean Harbors, Inc. (CLH).
Communication Services sector holdings disappointed. Ooma, Inc. (OOMA) is a cloud phone system provider that offers low-cost subscription communication services for small businesses and residences. It has a strong balance sheet, yet missed consensus earnings estimates, and its price declined. TechTarget, Inc. (TTGT) was also weak. ADTRAN Holdings, Inc. (ADTN), a fiber networking company, and TransMedics Group, Inc.
4
Management Discussion of Fund Performance (Unaudited) (continued)
(TMDX), a unique health care company striving to improve transport for organ donations, were two of the largest detractors in the Fund. Also in Health Care, Lantheus Holdings, Inc. (LNTH), Travere Therapeutics, Inc. (TVTX), and Omnicell, Inc. (OMCL) declined, yet were more than offset by other Health Care holdings in the sector that soared. In particular, Horizon Therapeutics plc (HZNP) was taken over at a significant premium by Amgen, Inc. (AMGN). In Energy, Ovintiv, Inc. (OVV) and in Utilities, Clearway Energy, Inc. (CWEN) disappointed. Qvintiv, Inc. was replaced with Weatherford International PLC (WFRD) for its energy diversification and upside potential.
We see strong relative valuations in the small cap portion of the market in good quality stocks. Companies that manage their balance sheets and grow their EBITDA are companies that we want to know better because they can be great additions to our Strategy. Our relative value bias means we are exposed to dynamic market segments, while we continually watch valuation multiples. We are excited about the opportunities we see for the Dana Epiphany ESG Small Cap Equity Fund.
5
Investment Results (Unaudited)
Average Annual Total Returns(a) as of October 31, 2023
| One Year | Five Year | Ten Year | |
| Dana Large Cap Equity Fund | |||
| Institutional Class | 6.44% | 8.48% | 9.17% |
| Investor Class | 6.22% | 8.22% | 8.89% |
| S&P 500® Index(b) | 10.14% | 11.01% | 11.18% |
| Expense Ratios(c) | |||
| Institutional | Investor | ||
| Class | Class | ||
| Gross | 0.87% | 1.12% | |
| With Applicable Waivers | 0.73% | 0.98% | |
The performance quoted represents past performance, which does not guarantee future results. The investment return and principal value of an investment will fluctuate so that an investor’s shares, when redeemed, may be worth more or less than their original cost. The returns shown do not reflect deduction of taxes that a shareholder would pay on Dana Large Cap Equity Fund (the “Large Cap Fund”) distributions or the redemption of Large Cap Fund shares. Current performance of the Large Cap Fund may be lower or higher than the performance quoted. Performance data current to the most recent month end may be obtained by calling 1-855-280-9648.
| (a) | Average annual total returns reflect any change in price per share and assume the reinvestment of all distributions. The Large Cap Fund’s returns reflect any fee reductions during the applicable period. If such reductions had not occurred, the quoted performance would have been lower. |
| (b) | The S&P 500® Index (“S&P Index”) is a widely recognized unmanaged index of equity securities and is representative of a broader domestic equity market and range of securities than is found in the Large Cap Fund’s portfolio. Individuals cannot invest directly in the S&P Index; however, an individual can invest in exchange-traded funds (“ETFs”) or other investment vehicles that attempt to track the performance of a benchmark index. |
| (c) | The expense ratios are from the Large Cap Fund’s prospectus dated February 28, 2023. Expense ratios with applicable waivers reflect that Dana Investment Advisors, Inc. (the “Adviser”) has contractually agreed to waive or limit its fees and to assume other expenses of the Large Cap Fund until February 29, 2024, so that total annual fund operating expenses do not exceed 0.73% of the Large Cap Fund’s average daily net assets. This operating expense limitation does not apply to brokerage fees and commissions, borrowing costs (such as interest and dividend expenses on securities sold short), taxes, extraordinary expenses, fees and expenses paid under a distribution plan adopted pursuant to Rule 12b-1, fees and expenses paid under a shareholder services plan, and indirect expenses (such as “Acquired Fund Fees and Expenses”). Each waiver or reimbursement of an expense by the Adviser is subject to repayment by the Large Cap Fund within three years following the date of such waiver or reimbursement, provided that the Large Cap Fund is able to make the repayment without exceeding the expense limitation in place at the time of the waiver or reimbursement and the expense limitation in place at the time of the repayment. This agreement may only be terminated by mutual consent of the Adviser and the Board of Trustees. Additional information pertaining to the Large Cap Fund’s expense ratios as of October 31, 2023 can be found in the financial highlights. |
6
Investment Results (Unaudited) (continued)
The Large Cap Fund’s investment objectives, strategies, risks, charges and expenses must be considered carefully before investing. The prospectus contains this and other important information about the Large Cap Fund and may be obtained by calling the same number as above. Please read it carefully before investing.
The Large Cap Fund is distributed by Ultimus Fund Distributors, LLC, Member FINRA/SIPC.
7
Investment Results (Unaudited) (continued)
Average Annual Total Returns(a) as of October 31, 2023
| Since | |||
| Inception | |||
| One Year | Five Year | (11/3/15) | |
| Dana Epiphany ESG Small Cap Equity Fund | |||
| Institutional Class | (0.81)% | 4.31% | 4.05% |
| Morningstar US Small Core Index(b) | 1.28% | 5.64% | 6.58% |
| Expense Ratios(c) | |||
| Institutional | |||
| Class | |||
| Gross | 1.95% | ||
| With Applicable Waivers | 0.95% | ||
The performance quoted represents past performance, which does not guarantee future results. The investment return and principal value of an investment will fluctuate so that an investor’s shares, when redeemed, may be worth more or less than their original cost. The returns shown do not reflect deduction of taxes that a shareholder would pay on Dana Epiphany ESG Small Cap Equity Fund (the “Small Cap Fund”) distributions or the redemption of Small Cap Fund shares. Current performance of the Small Cap Fund may be lower or higher than the performance quoted. Performance data current to the most recent month end may be obtained by calling 1-855-280-9648.
| (a) | Average annual total returns reflect any change in price per share and assume the reinvestment of all distributions. The Small Cap Fund’s returns reflect any fee reductions during the applicable period. If such reductions had not occurred, the quoted performance would have been lower. |
| (b) | The Morningstar US Small Core Index (“Morningstar Index”) provides a comprehensive depiction of the performance and fundamental characteristics of the Small Core segment of U.S. equity markets. The Morningstar Index does not incorporate Environmental, Social, or Governance (ESG) criteria. Individuals can not invest directly in the Morningstar Index; however, an individual can invest in ETFs or other investment vehicles that attempt to track the performance of a benchmark index. |
The Small Cap Fund is not sponsored, endorsed, sold or promoted by Morningstar, Inc. or any of its affiliates (all such entities, collectively, “Morningstar Entities”). The Morningstar Entities make no representation or warranty, express or implied, to individuals who invest in the Small Cap Fund or any member of the public regarding the advisability of investing in equity securities generally or in the Small Cap Fund in particular or the ability of the Small Cap Fund to track the Morningstar Indices or general equity market performance. THE MORNINGSTAR ENTITIES DO NOT GUARANTEE THE ACCURACY AND/OR THE COMPLETENESS OF THE MORNINGSTAR US SMALL CORE INDEX OR ANY DATA INCLUDED THEREIN AND MORNINGSTAR ENTITIES SHALL HAVE NO LIABILITY FOR ANY ERRORS, OMISSIONS, OR INTERRUPTIONS THEREIN.
| (c) | The expense ratios are from the Small Cap Fund’s prospectus dated February 28, 2023. Expense ratios with applicable waivers reflect that the Adviser has contractually agreed to waive or limit its fees and to assume other expenses of the Small Cap Fund until February 29, 2024, so that total annual fund operating expenses do not exceed 0.95% of the Small Cap Fund’s average daily net assets. This operating expense limitation does not apply to brokerage fees and commissions, borrowing costs (such as interest and dividend expenses on securities sold short), taxes, extraordinary expenses, |
8
Investment Results (Unaudited) (continued)
fees and expenses paid under a distribution plan adopted pursuant to Rule 12b-1, fees and expenses paid under a shareholder services plan, and indirect expenses (such as “Acquired Fund Fees and Expenses”). Each waiver or reimbursement of an expense by the Adviser is subject to repayment by the Small Cap Fund within three years following the date of such waiver or reimbursement, provided that the Small Cap Fund is able to make the repayment without exceeding the expense limitation in place at the time of the waiver or reimbursement and the expense limitation in place at the time of the repayment. This agreement may only be terminated by mutual consent of the Adviser and the Board of Trustees. Additional information pertaining to the Small Cap Fund’s expense ratios as of October 31, 2023 can be found in the financial highlights.
The Small Cap Fund’s investment objectives, strategies, risks, charges and expenses must be considered carefully before investing. The prospectus contains this and other important information about the Small Cap Fund and may be obtained by calling the same number as above. Please read it carefully before investing.
The Small Cap Fund is distributed by Ultimus Fund Distributors, LLC, Member FINRA/SIPC.
9
Investment Results (Unaudited) (continued)
Average Annual Total Returns(a) as of October 31, 2023
| One Year | Five Year | Ten Year | |
| Dana Epiphany ESG Equity Fund | |||
| Institutional Class | (0.71)% | 6.50% | 6.92% |
| S&P 500® Index(b) | 10.14% | 11.01% | 11.18% |
| Expense Ratios(c) | |||
| Institutional | |||
| Class | |||
| Gross | 0.96% | ||
| With Applicable Waivers | 0.85% | ||
The performance quoted represents past performance, which does not guarantee future results. The investment return and principal value of an investment will fluctuate so that an investor’s shares, when redeemed, may be worth more or less than their original cost. The returns shown do not reflect deduction of taxes that a shareholder would pay on Dana Epiphany ESG Equity Fund (the “Epiphany ESG Fund”) distributions or the redemption of Epiphany ESG Fund shares. Current performance of the Epiphany ESG Fund may be lower or higher than the performance quoted. Performance data current to the most recent month end may be obtained by calling 1-855-280-9648.
| (a) | Average annual total returns reflect any change in price per share and assume the reinvestment of all distributions. The Epiphany ESG Fund’s returns reflect any fee reductions during the applicable period. If such reductions had not occurred, the quoted performance would have been lower. |
| (b) | The S&P 500® Index (“S&P Index”) is a widely recognized unmanaged index of equity securities and is representative of a broader domestic equity market and range of securities than is found in the Epiphany ESG Fund’s portfolio. Individuals cannot invest directly in the S&P Index; however, an individual can invest in ETFs or other investment vehicles that attempt to track the performance of a benchmark index. |
| (c) | The expense ratios are from the Epiphany ESG Fund’s prospectus dated February 28, 2023. Expense ratios with applicable waivers reflect that the Adviser has contractually agreed to waive or limit its fees and to assume other expenses of the Epiphany ESG Fund until February 29, 2024, so that total annual fund operating expenses do not exceed 0.85% of the Epiphany ESG Fund’s average net assets. This operating expense limitation does not apply to brokerage fees and commissions, borrowing costs (such as interest and dividend expenses on securities sold short), taxes, extraordinary expenses, fees and expenses paid under a distribution plan adopted pursuant to Rule 12b-1, fees and expenses paid under a shareholder services plan, and indirect expenses (such as “Acquired Fund Fees and Expenses”). Each waiver or reimbursement of an expense by the Adviser is subject to repayment by the Epiphany ESG Fund within three years following the date of such waiver or reimbursement, provided that the Epiphany ESG Fund is able to make the repayment without exceeding the expense limitation in place at the time of the waiver or reimbursement and the expense limitation in place at the time of the repayment. This agreement may only be terminated by mutual consent of the Adviser and the Board of Trustees. Additional information pertaining to the Epiphany ESG Fund’s expense ratios as of October 31, 2023 can be found in the financial highlights. |
10
Investment Results (Unaudited) (continued)
The Epiphany ESG Fund’s investment objectives, strategies, risks, charges and expenses must be considered carefully before investing. The prospectus contains this and other important information about the Epiphany ESG Fund and may be obtained by calling the same number as above. Please read it carefully before investing.
The Epiphany ESG Fund is distributed by Ultimus Fund Distributors, LLC, Member FINRA/SIPC.
11
Investment Results (Unaudited) (continued)
Comparison of the Growth of a $10,000 Investment in the Dana Large Cap Equity Fund, Investor Class and the S&P 500® Index (Unaudited)
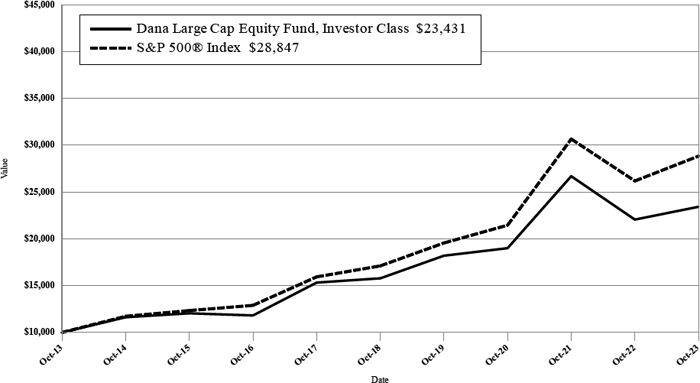
The chart above assumes an initial investment of $10,000 made on October 31, 2013 held through October 31, 2023. THE LARGE CAP FUND’S RETURN REPRESENTS PAST PERFORMANCE AND DOES NOT GUARANTEE FUTURE RESULTS. The returns shown do not reflect deduction of taxes that a shareholder would pay on Large Cap Fund distributions or the redemption of Large Cap Fund shares. Investment returns and principal values will fluctuate so that your shares, when redeemed, may be worth more or less than their original purchase price.
Current performance may be lower or higher than the performance data quoted. For more information on the Large Cap Fund, and to obtain performance data current to the most recent month end or to request a prospectus, please call (855) 280-9648. You should carefully consider the investment objectives, potential risks, management fees, and charges and expenses of the Large Cap Fund before investing. The Large Cap Fund’s prospectus contains this and other information about the Large Cap Fund, and should be read carefully before investing.
The Large Cap Fund is distributed by Ultimus Fund Distributors, LLC, member FINRA/SIPC.
12
Investment Results (Unaudited) (continued)
Comparison of the Growth of a $1,000,000 Investment in the Dana Epiphany ESG Small Cap Equity Fund, Institutional Class and Morningstar US Small Core Index (Unaudited)
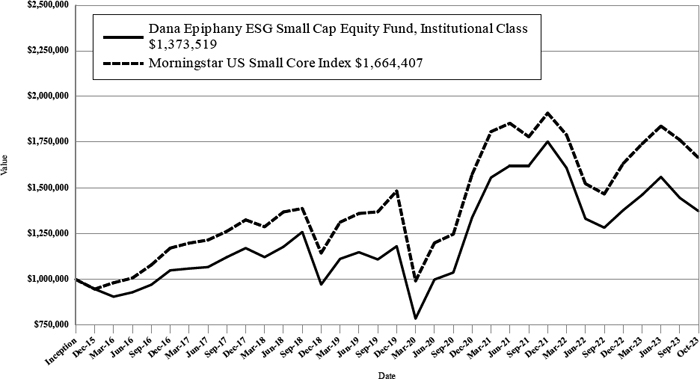
The chart above assumes an initial investment of $1,000,000 made on November 3, 2015 (commencement of Institutional Class operations) held through October 31, 2023. THE SMALL CAP FUND’S RETURN REPRESENTS PAST PERFORMANCE AND DOES NOT GUARANTEE FUTURE RESULTS. The returns shown do not reflect deduction of taxes that a shareholder would pay on Small Cap Fund distributions or the redemption of Small Cap Fund shares. Investment returns and principal values will fluctuate so that your shares, when redeemed, may be worth more or less than their original purchase price.
Current performance may be lower or higher than the performance data quoted. For more information on the Small Cap Fund, and to obtain performance data current to the most recent month end or to request a prospectus, please call (855) 280-9648. You should carefully consider the investment objectives, potential risks, management fees, and charges and expenses of the Small Cap Fund before investing. The Small Cap Fund’s prospectus contains this and other information about the Small Cap Fund, and should be read carefully before investing.
The Small Cap Fund is distributed by Ultimus Fund Distributors, LLC, member FINRA/SIPC.
13
Investment Results (Unaudited) (continued)
Comparison of the Growth of a $1,000,000 Investment in the Dana Epiphany ESG Equity Fund, Institutional Class and the S&P 500® Index (Unaudited)
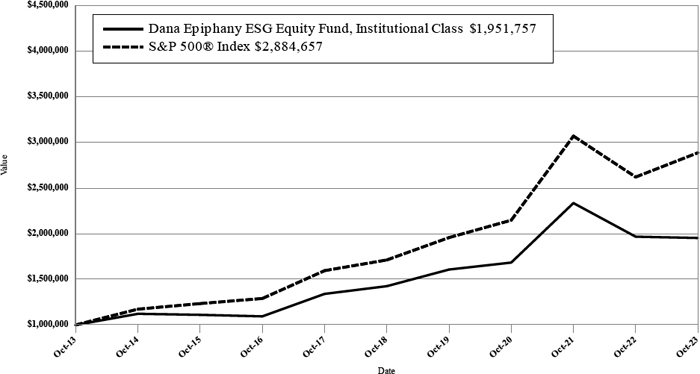
The chart above assumes an initial investment of $1,000,000 made on October 31, 2013 held through October 31, 2023. THE EPIPHANY ESG FUND’S RETURN REPRESENTS PAST PERFORMANCE AND DOES NOT GUARANTEE FUTURE RESULTS. The returns shown do not reflect deduction of taxes that a shareholder would pay on Epiphany ESG Fund distributions or the redemption of Epiphany ESG Fund shares. Investment returns and principal values will fluctuate so that your shares, when redeemed, may be worth more or less than their original purchase price.
Current performance may be lower or higher than the performance data quoted. For more information on the Epiphany ESG Fund, and to obtain performance data current to the most recent month end or to request a prospectus, please call (855) 280-9648. You should carefully consider the investment objectives, potential risks, management fees, and charges and expenses of the Epiphany ESG Fund before investing. The Epiphany ESG Fund’s prospectus contains this and other information about the Epiphany ESG Fund, and should be read carefully before investing.
The Epiphany ESG Fund is distributed by Ultimus Fund Distributors, LLC, member FINRA/SIPC.
14
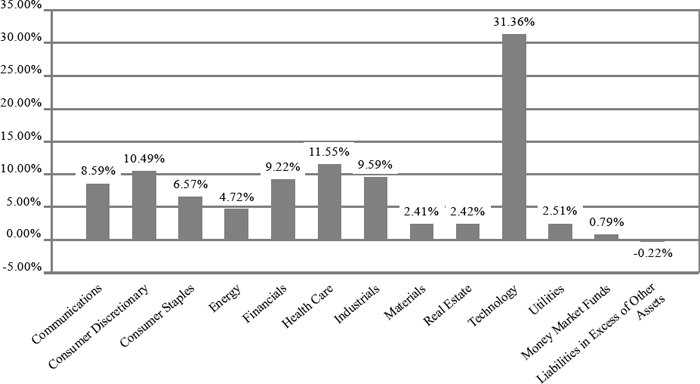
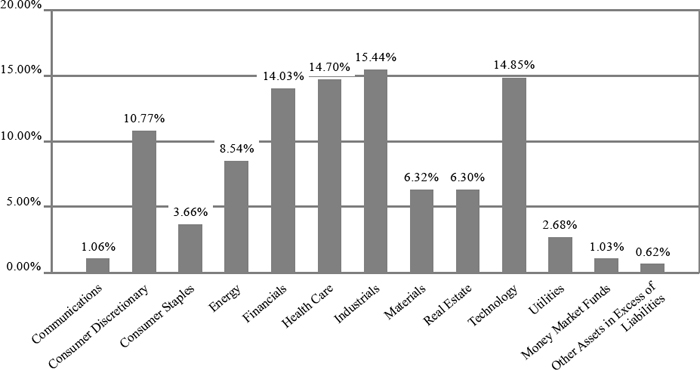
Fund Holdings (Unaudited)
The following chart gives a visual breakdown of the Large Cap Fund by sector weighting as a percentage of net assets as of October 31, 2023.
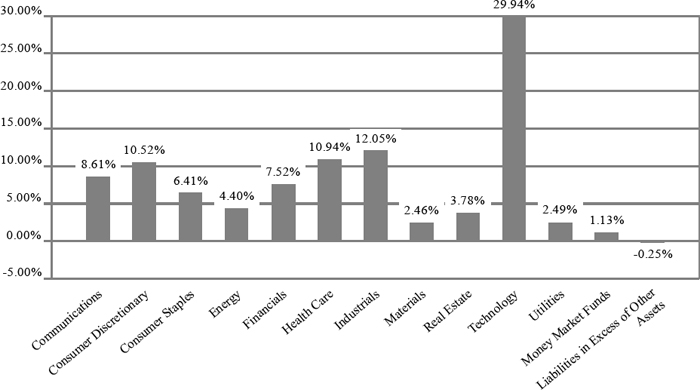
The following chart gives a visual breakdown of the Small Cap Fund by sector weighting as a percentage of net assets as of October 31, 2023.
15
Fund Holdings (Unaudited)
The following chart gives a visual breakdown of the Epiphany ESG Fund by sector weighting as a percentage of net assets as of October 31, 2023.
Availability of Portfolio Schedules (Unaudited)
The Large Cap Fund, the Small Cap Fund and the Epiphany ESG Fund (each a “Fund” and collectively the “Funds”) file their complete schedules of portfolio holdings with the Securities and Exchange Commission (“SEC”) for the first and third quarters of each fiscal year as an exhibit to its reports on Form N-PORT. The Funds’ Form N-PORT reports are available on the SEC’s website at http://www.sec.gov and on the Funds’ website at http://www.danafunds.com.
16
| Dana Large Cap Equity Fund |
| Schedule of Investments |
| October 31, 2023 |
| COMMON STOCKS — 99.43% | Shares | Fair Value | ||||||
| Communications — 8.59% | ||||||||
| Alphabet, Inc., Class A(a) | 30,400 | $ | 3,772,032 | |||||
| Comcast Corp., Class A | 27,400 | 1,131,346 | ||||||
| Meta Platforms, Inc., Class A(a) | 3,400 | 1,024,318 | ||||||
| T-Mobile US, Inc.(a) | 7,200 | 1,035,792 | ||||||
| 6,963,488 | ||||||||
| Consumer Discretionary — 10.49% | ||||||||
| Amazon.com, Inc.(a) | 21,800 | 2,901,362 | ||||||
| Lululemon Athletica, Inc.(a) | 3,340 | 1,314,223 | ||||||
| Marriott International, Inc., Class A | 8,200 | 1,546,192 | ||||||
| PulteGroup, Inc. | 19,000 | 1,398,210 | ||||||
| Restaurant Brands International, Inc. | 20,000 | 1,344,000 | ||||||
| 8,503,987 | ||||||||
| Consumer Staples — 6.57% | ||||||||
| Kimberly-Clark Corp. | 11,000 | 1,316,040 | ||||||
| Kroger Co. (The) | 31,000 | 1,406,470 | ||||||
| Mondelez International, Inc., Class A | 17,800 | 1,178,538 | ||||||
| Sysco Corp. | 19,000 | 1,263,310 | ||||||
| Walmart, Inc. | 1,000 | 163,410 | ||||||
| 5,327,768 | ||||||||
| Energy — 4.72% | ||||||||
| Baker Hughes Co., Class A | 10,000 | 344,200 | ||||||
| Chevron Corp. | 500 | 72,865 | ||||||
| ConocoPhillips | 7,400 | 879,120 | ||||||
| Exxon Mobil Corp. | 1,000 | 105,850 | ||||||
| Marathon Petroleum Corp. | 7,800 | 1,179,750 | ||||||
| Pioneer Natural Resources Co. | 5,200 | 1,242,800 | ||||||
| 3,824,585 | ||||||||
| Financials — 9.22% | ||||||||
| American Express Co. | 8,600 | 1,255,858 | ||||||
| Bank of America Corp. | 5,000 | 131,700 | ||||||
| Bank of New York Mellon Corp. (The) | 37,000 | 1,572,500 | ||||||
| Interactive Brokers Group, Inc., Class A | 19,400 | 1,553,358 | ||||||
| JPMorgan Chase & Co. | 5,200 | 723,112 | ||||||
| Reinsurance Group of America, Inc. | 7,500 | 1,121,025 | ||||||
| Wells Fargo & Co. | 28,000 | 1,113,560 | ||||||
| 7,471,113 | ||||||||
| Health Care — 11.55% | ||||||||
| AbbVie, Inc. | 11,000 | 1,552,980 | ||||||
| Bristol-Myers Squibb Co. | 20,000 | 1,030,600 | ||||||
| Eli Lilly & Co. | 1,900 | 1,052,467 | ||||||
| IQVIA Holdings, Inc.(a) | 4,400 | 795,652 | ||||||
| McKesson Corp. | 3,800 | 1,730,368 | ||||||
| Merck & Co., Inc. | 15,000 | 1,540,500 | ||||||
| UnitedHealth Group, Inc. | 3,100 | 1,660,236 | ||||||
| 9,362,803 | ||||||||
See accompanying notes which are an integral part of these financial statements.
17
| Dana Large Cap Equity Fund |
| Schedule of Investments (continued) |
| October 31, 2023 |
| COMMON STOCKS — 99.43% - continued | Shares | Fair Value | ||||||
| Industrials — 9.59% | ||||||||
| Boston Scientific Corp.(a) | 24,000 | $ | 1,228,560 | |||||
| Caterpillar, Inc. | 5,700 | 1,288,485 | ||||||
| Huntington Ingalls Industries, Inc. | 5,000 | 1,099,100 | ||||||
| Lincoln Electric Holdings, Inc. | 8,600 | 1,503,280 | ||||||
| Norfolk Southern Corp. | 5,400 | 1,030,266 | ||||||
| Parker-Hannifin Corp. | 4,400 | 1,623,204 | ||||||
| 7,772,895 | ||||||||
| Materials — 2.41% | ||||||||
| Graphic Packaging Holding Co. | 43,000 | 924,930 | ||||||
| Linde PLC | 2,700 | 1,031,832 | ||||||
| 1,956,762 | ||||||||
| Real Estate — 2.42% | ||||||||
| Gaming and Leisure Properties, Inc. | 21,000 | 953,190 | ||||||
| Iron Mountain, Inc. | 17,000 | 1,004,190 | ||||||
| 1,957,380 | ||||||||
| Technology — 31.36% | ||||||||
| Accenture PLC, Class A | 3,200 | 950,688 | ||||||
| Adobe, Inc.(a) | 3,100 | 1,649,386 | ||||||
| Apple, Inc. | 27,000 | 4,610,790 | ||||||
| Broadcom, Inc. | 2,200 | 1,851,014 | ||||||
| CrowdStrike Holdings, Inc., Class A(a) | 4,700 | 830,819 | ||||||
| Dell Technologies, Inc., Class C | 25,000 | 1,672,750 | ||||||
| Fiserv, Inc.(a) | 9,600 | 1,092,000 | ||||||
| Microsoft Corp. | 12,600 | 4,260,187 | ||||||
| NVIDIA Corp. | 3,800 | 1,549,640 | ||||||
| Oracle Corp. | 9,400 | 971,960 | ||||||
| Palo Alto Networks, Inc.(a) | 4,200 | 1,020,684 | ||||||
| Salesforce, Inc.(a) | 5,400 | 1,084,482 | ||||||
| ServiceNow, Inc.(a) | 1,800 | 1,047,330 | ||||||
| Visa, Inc., Class A | 7,000 | 1,645,700 | ||||||
| Workday, Inc., Class A(a) | 5,600 | 1,185,576 | ||||||
| 25,423,006 | ||||||||
| Utilities — 2.51% | ||||||||
| CenterPoint Energy, Inc. | 37,000 | 994,560 | ||||||
| NextEra Energy, Inc. | 17,800 | 1,037,740 | ||||||
| 2,032,300 | ||||||||
| Total Common Stocks (Cost $65,990,383) | 80,596,087 | |||||||
See accompanying notes which are an integral part of these financial statements.
18
| Dana Large Cap Equity Fund |
| Schedule of Investments (continued) |
| October 31, 2023 |
| MONEY MARKET FUNDS - 0.79% | Shares | Fair Value | ||||||
| Fidelity Investments Money Market Government Portfolio, Institutional Class, 5.28%(b) | 643,800 | $ | 643,800 | |||||
| Total Money Market Funds (Cost $643,800) | 643,800 | |||||||
| Total Investments — 100.22% (Cost $66,634,183) | 81,239,887 | |||||||
| Liabilities in Excess of Other Assets — (0.22)% | (178,341 | ) | ||||||
| NET ASSETS — 100.00% | $ | 81,061,546 | ||||||
| (a) | Non-income producing security. |
| (b) | Rate disclosed is the seven day effective yield as of October 31, 2023. |
See accompanying notes which are an integral part of these financial statements.
19
| Dana Epiphany ESG Small Cap Equity Fund |
| Schedule of Investments |
| October 31, 2023 |
| COMMON STOCKS — 98.35% | Shares | Fair Value | ||||||
| Communications — 1.06% | ||||||||
| Ooma, Inc.(a) | 22,522 | $ | 245,715 | |||||
| Consumer Discretionary — 10.77% | ||||||||
| Bloomin’ Brands, Inc. | 17,389 | 405,859 | ||||||
| Boot Barn Holdings, Inc.(a) | 5,248 | 364,736 | ||||||
| Deckers Outdoor Corp.(a) | 829 | 494,963 | ||||||
| GMS, Inc.(a) | 7,493 | 438,190 | ||||||
| Group 1 Automotive, Inc. | 1,655 | 417,606 | ||||||
| Modine Manufacturing Co.(a) | 9,717 | 383,822 | ||||||
| 2,505,176 | ||||||||
| Consumer Staples — 3.66% | ||||||||
| e.l.f. Beauty, Inc.(a) | 4,142 | 383,673 | ||||||
| Simply Good Foods Co. (The)(a) | 12,519 | 466,834 | ||||||
| 850,507 | ||||||||
| Energy — 8.54% | ||||||||
| Chord Energy Corp. | 3,165 | 523,238 | ||||||
| EnerSys | 4,896 | 419,000 | ||||||
| Matador Resources Co. | 8,740 | 539,170 | ||||||
| Weatherford International PLC(a) | 5,434 | 505,851 | ||||||
| 1,987,259 | ||||||||
| Financials — 14.03% | ||||||||
| Atlantic Union Bancshares Corp. | 14,204 | 409,217 | ||||||
| AXIS Capital Holdings Ltd. | 7,161 | 408,893 | ||||||
| Evercore, Inc., Class A | 3,125 | 406,813 | ||||||
| Pinnacle Financial Partners, Inc. | 6,555 | 408,770 | ||||||
| Primerica, Inc. | 2,145 | 410,038 | ||||||
| SouthState Corp. | 6,153 | 406,713 | ||||||
| Stifel Financial Corp. | 7,137 | 406,809 | ||||||
| Wintrust Financial Corp. | 5,451 | 407,135 | ||||||
| 3,264,388 | ||||||||
| Health Care — 14.70% | ||||||||
| Alkermes PLC(a) | 6,709 | 162,291 | ||||||
| Axsome Therapeutics, Inc.(a) | 4,970 | 309,532 | ||||||
| Blueprint Medicines Corp.(a) | 5,945 | 349,923 | ||||||
| Cytokinetics, Inc.(a) | 6,287 | 219,165 | ||||||
| Deciphera Pharmaceuticals, Inc.(a) | 11,515 | 138,065 | ||||||
| Denali Therapeutics, Inc.(a) | 8,780 | 165,327 | ||||||
| DocGo, Inc.(a) | 73,299 | 435,396 | ||||||
| Ensign Group, Inc. (The) | 5,003 | 483,290 | ||||||
| Insmed, Inc.(a) | 5,656 | 141,739 | ||||||
| Lantheus Holdings, Inc.(a) | 7,623 | 492,446 | ||||||
| Madrigal Pharmaceuticals, Inc.(a) | 1,229 | 161,466 | ||||||
| TransMedics Group, Inc.(a) | 9,651 | 361,719 | ||||||
| 3,420,359 | ||||||||
| Industrials — 15.44% | ||||||||
| Applied Industrial Technologies, Inc. | 3,039 | 466,517 | ||||||
| Atkore, Inc.(a) | 3,266 | 405,898 | ||||||
See accompanying notes which are an integral part of these financial statements.
20
| Dana Epiphany ESG Small Cap Equity Fund |
| Schedule of Investments (continued) |
| October 31, 2023 |
| COMMON STOCKS — 98.35% - continued | Shares | Fair Value | ||||||
| Industrials — 15.44% - continued | ||||||||
| Cactus, Inc., Class A | 10,167 | $ | 477,239 | |||||
| Clean Harbors, Inc.(a) | 2,786 | 428,125 | ||||||
| FTI Consulting, Inc.(a) | 2,608 | 553,575 | ||||||
| Hub Group, Inc., Class A(a) | 5,832 | 400,950 | ||||||
| John Bean Technologies Corp. | 4,496 | 467,674 | ||||||
| TopBuild Corp.(a) | 1,707 | 390,493 | ||||||
| 3,590,471 | ||||||||
| Materials — 6.32% | ||||||||
| Advanced Drainage Systems, Inc. | 4,099 | 437,896 | ||||||
| Avient Corp. | 10,351 | 327,299 | ||||||
| Eagle Materials, Inc. | 2,304 | 354,609 | ||||||
| Element Solutions, Inc. | 19,272 | 351,328 | ||||||
| 1,471,132 | ||||||||
| Real Estate — 6.30% | ||||||||
| Agree Realty Corp. | 6,483 | 362,659 | ||||||
| Spirit Realty Capital, Inc. | 10,565 | 380,234 | ||||||
| STAG Industrial, Inc. | 10,552 | 350,537 | ||||||
| Tanger Factory Outlet Centers, Inc. | 16,460 | 371,173 | ||||||
| 1,464,603 | ||||||||
| Technology — 14.85% | ||||||||
| Axcelis Technologies, Inc.(a) | 2,849 | 363,248 | ||||||
| Box, Inc., Class A(a) | 18,619 | 462,869 | ||||||
| i3 Verticals, Inc., Class A(a) | 21,079 | 395,231 | ||||||
| Lattice Semiconductor Corp.(a) | 5,403 | 300,461 | ||||||
| Perficient, Inc. (a) | 7,536 | 438,520 | ||||||
| Perion Network Ltd.(a) | 9,765 | 248,031 | ||||||
| Tenable Holdings, Inc.(a) | 9,775 | 411,625 | ||||||
| Teradata Corp.(a) | 10,077 | 430,490 | ||||||
| Veeco Instruments, Inc.(a) | 16,890 | 404,346 | ||||||
| 3,454,821 | ||||||||
| Utilities — 2.68% | ||||||||
| Chesapeake Utilities Corp. | 3,323 | 294,451 | ||||||
| Clearway Energy, Inc., Class C | 15,133 | 328,537 | ||||||
| 622,988 | ||||||||
| Total Common Stocks (Cost $23,427,464) | 22,877,419 | |||||||
See accompanying notes which are an integral part of these financial statements.
21
| Dana Epiphany ESG Small Cap Equity Fund |
| Schedule of Investments (continued) |
| October 31, 2023 |
| MONEY MARKET FUNDS - 1.03% | Shares | Fair Value | ||||||
| Fidelity Investments Money Market Government Portfolio, Institutional Class, 5.28%(b) | 240,535 | $ | 240,535 | |||||
| Total Money Market Funds (Cost $240,535) | 240,535 | |||||||
| Total Investments — 99.38% (Cost $23,667,999) | 23,117,954 | |||||||
| Other Assets in Excess of Liabilities — 0.62% | 144,770 | |||||||
| NET ASSETS — 100.00% | $ | 23,262,724 | ||||||
| (a) | Non-income producing security. |
| (b) | Rate disclosed is the seven day effective yield as of October 31, 2023. |
See accompanying notes which are an integral part of these financial statements.
22
| Dana Epiphany ESG Equity Fund |
| Schedule of Investments |
| October 31, 2023 |
| COMMON STOCKS — 99.12% | Shares | Fair Value | ||||||
| Communications — 8.61% | ||||||||
| Alphabet, Inc., Class A(a) | 16,700 | $ | 2,072,136 | |||||
| Alphabet, Inc., Class C(a) | 4,600 | 576,380 | ||||||
| Comcast Corp., Class A | 31,000 | 1,279,990 | ||||||
| Interpublic Group of Cos., Inc. | 36,000 | 1,022,400 | ||||||
| Verizon Communications, Inc. | 5,000 | 175,650 | ||||||
| 5,126,556 | ||||||||
| Consumer Discretionary — 10.52% | ||||||||
| Amazon.com, Inc.(a) | 13,000 | 1,730,170 | ||||||
| BorgWarner, Inc. | 27,000 | 996,300 | ||||||
| Home Depot, Inc. (The) | 2,600 | 740,194 | ||||||
| Lululemon Athletica, Inc.(a) | 2,000 | 786,960 | ||||||
| PulteGroup, Inc. | 15,000 | 1,103,850 | ||||||
| Tapestry, Inc. | 33,000 | 909,480 | ||||||
| 6,266,954 | ||||||||
| Consumer Staples — 6.41% | ||||||||
| Darling Ingredients, Inc.(a) | 10,000 | 442,900 | ||||||
| General Mills, Inc. | 14,400 | 939,456 | ||||||
| Kimberly-Clark Corp. | 8,400 | 1,004,976 | ||||||
| Mondelez International, Inc., Class A | 9,000 | 595,890 | ||||||
| Sysco Corp. | 12,600 | 837,774 | ||||||
| 3,820,996 | ||||||||
| Energy — 4.40% | ||||||||
| ConocoPhillips | 3,000 | 356,400 | ||||||
| Ovintiv, Inc. | 7,000 | 336,000 | ||||||
| Pioneer Natural Resources Co. | 4,400 | 1,051,600 | ||||||
| Weatherford International PLC(a) | 9,400 | 875,046 | ||||||
| 2,619,046 | ||||||||
| Financials — 7.52% | ||||||||
| American Express Co. | 6,900 | 1,007,607 | ||||||
| Bank of New York Mellon Corp. (The) | 27,000 | 1,147,500 | ||||||
| Reinsurance Group of America, Inc. | 8,300 | 1,240,601 | ||||||
| Webster Financial Corp. | 28,600 | 1,085,942 | ||||||
| 4,481,650 | ||||||||
| Health Care — 10.94% | ||||||||
| Cigna Corp. | 4,500 | 1,391,400 | ||||||
| CVS Health Corp. | 16,400 | 1,131,764 | ||||||
| Elevance Health, Inc. | 2,500 | 1,125,225 | ||||||
| IQVIA Holdings, Inc.(a) | 5,700 | 1,030,731 | ||||||
| Waters Corp.(a) | 3,500 | 834,855 | ||||||
| Zoetis, Inc., Class A | 6,400 | 1,004,800 | ||||||
| 6,518,775 | ||||||||
| Industrials — 12.05% | ||||||||
| Boston Scientific Corp. (a) | 23,700 | 1,213,203 | ||||||
| CSX Corp. | 40,400 | 1,205,940 | ||||||
| Deere & Co. | 3,500 | 1,278,760 | ||||||
| Lincoln Electric Holdings, Inc. | 7,200 | 1,258,560 | ||||||
See accompanying notes which are an integral part of these financial statements.
23
| Dana Epiphany ESG Equity Fund |
| Schedule of Investments (continued) |
| October 31, 2023 |
| COMMON STOCKS — 99.12% - continued | Shares | Fair Value | ||||||
| Industrials — 12.05% - continued | ||||||||
| Regal-Beloit Corp. | 9,000 | $ | 1,065,690 | |||||
| TE Connectivity Ltd. | 9,800 | 1,154,930 | ||||||
| 7,177,083 | ||||||||
| Materials — 2.46% | ||||||||
| Graphic Packaging Holding Co. | 34,400 | 739,944 | ||||||
| Linde PLC | 1,900 | 726,104 | ||||||
| 1,466,048 | ||||||||
| Real Estate — 3.78% | ||||||||
| Hannon Armstrong Sustainable Infrastructure Capital, Inc. | 43,000 | 737,020 | ||||||
| Iron Mountain, Inc. | 13,800 | 815,166 | ||||||
| STAG Industrial, Inc. | 21,000 | 697,620 | ||||||
| 2,249,806 | ||||||||
| Technology — 29.94% | ||||||||
| Accenture PLC, Class A | 4,000 | 1,188,360 | ||||||
| Apple, Inc. | 15,000 | 2,561,550 | ||||||
| Cadence Design Systems, Inc.(a) | 5,600 | 1,343,160 | ||||||
| Cisco Systems, Inc. | 26,000 | 1,355,380 | ||||||
| CrowdStrike Holdings, Inc., Class A(a) | 5,200 | 919,204 | ||||||
| Fiserv, Inc.(a) | 8,800 | 1,001,000 | ||||||
| Microchip Technology, Inc. | 16,800 | 1,197,672 | ||||||
| Microsoft Corp. | 8,000 | 2,704,880 | ||||||
| NVIDIA Corp. | 2,700 | 1,101,060 | ||||||
| Salesforce, Inc.(a) | 5,600 | 1,124,648 | ||||||
| ServiceNow, Inc.(a) | 1,900 | 1,105,515 | ||||||
| Visa, Inc., Class A | 5,000 | 1,175,500 | ||||||
| Workday, Inc., Class A(a) | 5,000 | 1,058,550 | ||||||
| 17,836,479 | ||||||||
| Utilities — 2.49% | ||||||||
| NextEra Energy, Inc. | 13,400 | 781,220 | ||||||
| Portland General Electric Co. | 17,600 | 704,352 | ||||||
| 1,485,572 | ||||||||
| Total Common Stocks (Cost $59,970,647) | 59,048,965 | |||||||
| MONEY MARKET FUNDS - 1.13% | ||||||||
| Fidelity Investments Money Market Government Portfolio, Institutional Class, 5.28%(b) | 674,054 | 674,054 | ||||||
| Total Money Market Funds (Cost $674,054) | 674,054 | |||||||
| Total Investments — 100.25% (Cost $60,644,701) | 59,723,019 | |||||||
| Liabilities in Excess of Other Assets — (0.25)% | (147,290 | ) | ||||||
| NET ASSETS — 100.00% | $ | 59,575,729 | ||||||
| (a) | Non-income producing security. |
| (b) | Rate disclosed is the seven day effective yield as of October 31, 2023. |
See accompanying notes which are an integral part of these financial statements.
24
| Dana Funds |
| Statements of Assets and Liabilities |
| October 31, 2023 |
| Dana | ||||||||||||
| Epiphany | Dana | |||||||||||
| Dana Large | ESG Small | Epiphany | ||||||||||
| Cap Equity | Cap Equity | ESG Equity | ||||||||||
| Fund | Fund | Fund | ||||||||||
| Assets | ||||||||||||
| Investments in securities at fair value (cost $66,634,183, $23,667,999 and $60,644,701) (Note 3) | $ | 81,239,887 | $ | 23,117,954 | $ | 59,723,019 | ||||||
| Receivable for fund shares sold | 3,740 | 8,334 | 22,729 | |||||||||
| Receivable for investments sold | — | 597,140 | 2,264,708 | |||||||||
| Dividends receivable | 62,137 | 8,404 | 54,801 | |||||||||
| Receivable from Adviser (Note 4) | — | 566 | — | |||||||||
| Prepaid expenses | 24,941 | 19,103 | 12,923 | |||||||||
| Total Assets | 81,330,705 | 23,751,501 | 62,078,180 | |||||||||
| Liabilities | ||||||||||||
| Payable for fund shares redeemed | 197,976 | 12,428 | 31,878 | |||||||||
| Payable for investments purchased | — | 443,115 | 2,413,288 | |||||||||
| Payable to Adviser (Note 4) | 30,208 | — | 22,499 | |||||||||
| Accrued Distribution (12b-1) fees (Note 4) | 4,098 | — | — | |||||||||
| Payable to Administrator (Note 4) | 10,095 | 7,673 | 7,929 | |||||||||
| Payable to trustees (Note 4) | 2,000 | 2,000 | 2,000 | |||||||||
| Other accrued expenses | 24,782 | 23,561 | 24,857 | |||||||||
| Total Liabilities | 269,159 | 488,777 | 2,502,451 | |||||||||
| Net Assets | $ | 81,061,546 | $ | 23,262,724 | $ | 59,575,729 | ||||||
| Net Assets consist of: | ||||||||||||
| Paid-in capital | $ | 57,217,422 | $ | 23,897,060 | $ | 62,915,773 | ||||||
| Accumulated earnings (deficit) | 23,844,124 | (634,336 | ) | (3,340,044 | ) | |||||||
| Net Assets | $ | 81,061,546 | $ | 23,262,724 | $ | 59,575,729 | ||||||
| Institutional Class: | ||||||||||||
| Net Assets | $ | 62,264,736 | $ | 23,262,724 | $ | 59,575,729 | ||||||
| Shares outstanding (unlimited number of shares authorized, no par value) | 3,016,035 | 2,126,332 | 5,264,956 | |||||||||
| Net asset value, offering and redemption price per share (Note 2) | $ | 20.64 | $ | 10.94 | $ | 11.32 | ||||||
| Investor Class: | ||||||||||||
| Net Assets | $ | 18,796,810 | ||||||||||
| Shares outstanding (unlimited number of shares authorized, no par value) | 910,301 | |||||||||||
| Net asset value, offering and redemption price per share (Note 2) | $ | 20.65 | ||||||||||
See accompanying notes which are an integral part of these financial statements.
25
| Dana Funds |
| Statements of Operations |
| For the year ended October 31, 2023 |
| Dana Epiphany | Dana Epiphany | |||||||||||
| Dana Large Cap | ESG Small Cap | ESG Equity | ||||||||||
| Equity Fund | Equity Fund | Fund | ||||||||||
| Investment Income | ||||||||||||
| Dividend income | $ | 1,905,511 | $ | 322,522 | $ | 1,118,274 | ||||||
| Total investment income | 1,905,511 | 322,522 | 1,118,274 | |||||||||
| Expenses | ||||||||||||
| Investment Adviser fees (Note 4) | 637,750 | 188,796 | 415,988 | |||||||||
| Administration fees (Note 4) | 58,657 | 32,072 | 38,369 | |||||||||
| Distribution (12b-1) fees, Investor Class (Note 4) | 51,184 | — | — | |||||||||
| Fund accounting fees (Note 4) | 38,955 | 26,726 | 27,055 | |||||||||
| Registration expenses | 36,920 | 23,021 | 26,547 | |||||||||
| Transfer agent fees (Note 4) | 24,588 | 19,784 | 20,820 | |||||||||
| Legal fees | 19,849 | 19,837 | 19,849 | |||||||||
| Audit and tax preparation fees | 18,830 | 18,830 | 18,830 | |||||||||
| Custodian fees | 15,055 | 6,299 | 12,715 | |||||||||
| Printing and postage expenses | 10,270 | 7,209 | 9,541 | |||||||||
| Trustee fees (Note 4) | 7,753 | 7,753 | 7,753 | |||||||||
| Compliance service fees (Note 4) | 4,755 | 4,750 | 4,750 | |||||||||
| Insurance expenses | 4,590 | 3,467 | 4,243 | |||||||||
| Miscellaneous expenses | 23,760 | 23,681 | 23,308 | |||||||||
| Total expenses | 952,916 | 382,225 | 629,768 | |||||||||
| Fees contractually waived by Adviser (Note 4) | (185,548 | ) | (143,132 | ) | (85,812 | ) | ||||||
| Net operating expenses | 767,368 | 239,093 | 543,956 | |||||||||
| Net investment income | 1,138,143 | 83,429 | 574,318 | |||||||||
| Net Realized and Change in Unrealized Gain (Loss) on Investments | ||||||||||||
| Net realized gain (loss) on investment securities transactions | 9,293,059 | (72,141 | ) | (1,318,786 | ) | |||||||
| Net change in unrealized appreciation (depreciation) on investment securities | (3,532,624 | ) | (458,867 | ) | 619,220 | |||||||
| Net realized and change in unrealized gain (loss) on investments | 5,760,435 | (531,008 | ) | (699,566 | ) | |||||||
| Net increase (decrease) in net assets resulting from operations | $ | 6,898,578 | $ | (447,579 | ) | $ | (125,248 | ) | ||||
See accompanying notes which are an integral part of these financial statements
26
| Dana Funds |
| Statements of Changes in Net Assets |
| Dana Large Cap Equity Fund | ||||||||
| For the Year | For the Year | |||||||
| Ended October | Ended October | |||||||
| 31, 2023 | 31, 2022 | |||||||
| Increase (Decrease) in Net Assets due to: | ||||||||
| Operations | ||||||||
| Net investment income | $ | 1,138,143 | $ | 1,335,454 | ||||
| Net realized gain on investment securities transactions | 9,293,059 | 7,882,982 | ||||||
| Net change in unrealized depreciation of investment securities | (3,532,624 | ) | (32,144,030 | ) | ||||
| Net increase (decrease) in net assets resulting from operations | 6,898,578 | (22,925,594 | ) | |||||
| Distributions to Shareholders from Earnings (Note 2) | ||||||||
| Institutional Class | (7,243,857 | ) | (14,198,810 | ) | ||||
| Investor Class | (1,715,762 | ) | (3,218,987 | ) | ||||
| Total distributions | (8,959,619 | ) | (17,417,797 | ) | ||||
| Capital Transactions – Institutional Class | ||||||||
| Proceeds from shares sold | 4,190,683 | 14,475,937 | ||||||
| Reinvestment of distributions | 4,106,603 | 7,925,662 | ||||||
| Amount paid for shares redeemed | (26,796,119 | ) | (22,829,242 | ) | ||||
| Total – Institutional Class | (18,498,833 | ) | (427,643 | ) | ||||
| Capital Transactions – Investor Class | ||||||||
| Proceeds from shares sold | 191,295 | 368,279 | ||||||
| Reinvestment of distributions | 1,614,452 | 3,041,633 | ||||||
| Amount paid for shares redeemed | (2,489,366 | ) | (2,415,054 | ) | ||||
| Total – Investor Class | (683,619 | ) | 994,858 | |||||
| Net increase (decrease) in net assets resulting from capital transactions | (19,182,452 | ) | 567,215 | |||||
| Total Decrease in Net Assets | (21,243,493 | ) | (39,776,176 | ) | ||||
| Net Assets | ||||||||
| Beginning of year | 102,305,039 | 142,081,215 | ||||||
| End of year | $ | 81,061,546 | $ | 102,305,039 | ||||
| Share Transactions - Institutional Class | ||||||||
| Shares sold | 196,733 | 577,714 | ||||||
| Shares issued in reinvestment of distributions | 207,383 | 299,112 | ||||||
| Shares redeemed | (1,262,433 | ) | (959,176 | ) | ||||
| Total – Institutional Class | (858,317 | ) | (82,350 | ) | ||||
| Share Transactions - Investor Class | ||||||||
| Shares sold | 9,112 | 15,632 | ||||||
| Shares issued in reinvestment of distributions | 81,545 | 114,484 | ||||||
| Shares redeemed | (117,715 | ) | (101,487 | ) | ||||
| Total – Investor Class | (27,058 | ) | 28,629 | |||||
See accompanying notes which are an integral part of these financial statements.
27
| Dana Funds |
| Statements of Changes in Net Assets (continued) |
| Dana Epiphany ESG Small Cap | ||||||||
| Equity Fund | ||||||||
| For the Year | For the Year | |||||||
| Ended October | Ended October | |||||||
| 31, 2023 | 31, 2022 | |||||||
| Increase (Decrease) in Net Assets due to: | ||||||||
| Operations | ||||||||
| Net investment income | $ | 83,429 | $ | 9,163 | ||||
| Net realized gain (loss) on investment securities transactions | (72,141 | ) | 1,159,913 | |||||
| Net change in unrealized depreciation of investment securities | (458,867 | ) | (4,828,049 | ) | ||||
| Net decrease in net assets resulting from operations | (447,579 | ) | (3,658,973 | ) | ||||
| Distributions to Shareholders from Earnings (Note 2) | ||||||||
| Institutional Class | (1,212,675 | ) | (1,429,190 | ) | ||||
| Total distributions | (1,212,675 | ) | (1,429,190 | ) | ||||
| Capital Transactions – Institutional Class | ||||||||
| Proceeds from shares sold | 19,902,954 | 4,022,076 | ||||||
| Reinvestment of distributions | 1,202,030 | 1,400,259 | ||||||
| Amount paid for shares redeemed | (9,640,065 | ) | (4,314,843 | ) | ||||
| Total – Institutional Class | 11,464,919 | 1,107,492 | ||||||
| Net increase in net assets resulting from capital transactions | 11,464,919 | 1,107,492 | ||||||
| Total Increase (Decrease) in Net Assets | 9,804,665 | (3,980,671 | ) | |||||
| Net Assets | ||||||||
| Beginning of year | 13,458,059 | 17,438,730 | ||||||
| End of year | $ | 23,262,724 | $ | 13,458,059 | ||||
| Share Transactions - Institutional Class | ||||||||
| Shares sold | 1,680,428 | 291,572 | ||||||
| Shares issued in reinvestment of distributions | 110,815 | 95,256 | ||||||
| Shares redeemed | (823,320 | ) | (324,787 | ) | ||||
| Total – Institutional Class | 967,923 | 62,041 | ||||||
See accompanying notes which are an integral part of these financial statements
28
| Dana Funds |
| Statements of Changes in Net Assets (continued) |
| Dana Epiphany ESG Equity Fund | ||||||||
| For the Year | For the Year | |||||||
| Ended October | Ended October | |||||||
| 31, 2023 | 31, 2022 | |||||||
| Increase (Decrease) in Net Assets due to: | ||||||||
| Operations | ||||||||
| Net investment income | $ | 574,318 | $ | 678,437 | ||||
| Net realized loss on investment securities transactions | (1,318,786 | ) | (1,150,639 | ) | ||||
| Net change in unrealized appreciation (depreciation) of investment securities | 619,220 | (12,474,484 | ) | |||||
| Net decrease in net assets resulting from operations | (125,248 | ) | (12,946,686 | ) | ||||
| Distributions to Shareholders from Earnings (Note 2) | ||||||||
| Institutional Class | (576,674 | ) | (1,696,546 | ) | ||||
| Total distributions | (576,674 | ) | (1,696,546 | ) | ||||
| Capital Transactions – Institutional Class | ||||||||
| Proceeds from shares sold | 15,996,248 | 36,072,130 | ||||||
| Reinvestment of distributions | 571,181 | 1,650,842 | ||||||
| Amount paid for shares redeemed | (29,280,915 | ) | (17,645,598 | ) | ||||
| Total – Institutional Class | (12,713,486 | ) | 20,077,374 | |||||
| Net increase (decrease) in net assets resulting from capital transactions | (12,713,486 | ) | 20,077,374 | |||||
| Total Increase (Decrease) in Net Assets | (13,415,408 | ) | 5,434,142 | |||||
| Net Assets | ||||||||
| Beginning of year | 72,991,137 | 67,556,995 | ||||||
| End of year | $ | 59,575,729 | $ | 72,991,137 | ||||
| Share Transactions - Institutional Class | ||||||||
| Shares sold | 1,330,401 | 2,777,361 | ||||||
| Shares issued in reinvestment of distributions | 48,598 | 121,043 | ||||||
| Shares redeemed | (2,453,902 | ) | (1,394,549 | ) | ||||
| Total – Institutional Class | (1,074,903 | ) | 1,503,855 | |||||
See accompanying notes which are an integral part of these financial statements.
29
| Dana Large Cap Equity Fund – Institutional Class |
| Financial Highlights |
| (For a share oustanding during each year) |
| For the Years Ended October 31, | ||||||||||||||||||||
| 2023 | 2022 | 2021 | 2020 | 2019 | ||||||||||||||||
| Selected Per Share Data | ||||||||||||||||||||
| Net asset value, beginning of year | $ | 21.26 | $ | 29.20 | $ | 21.25 | $ | 22.69 | $ | 22.35 | ||||||||||
| Investment operations: | ||||||||||||||||||||
| Net investment income | 0.27 | 0.28 | 0.17 | 0.23 | 0.38 | |||||||||||||||
| Net realized and unrealized gain (loss) on investments | 1.01 | (4.60 | ) | 8.39 | 0.86 | 2.46 | ||||||||||||||
| Total from investment operations | 1.28 | (4.32 | ) | 8.56 | 1.09 | 2.84 | ||||||||||||||
| Less distributions to shareholders from: | ||||||||||||||||||||
| Net investment income | (0.28 | ) | (0.25 | ) | (0.17 | ) | (0.23 | ) | (0.36 | ) | ||||||||||
| Net realized gains | (1.62 | ) | (3.37 | ) | (0.44 | ) | (2.30 | ) | (2.14 | ) | ||||||||||
| Total distributions | (1.90 | ) | (3.62 | ) | (0.61 | ) | (2.53 | ) | (2.50 | ) | ||||||||||
| Net asset value, end of year | $ | 20.64 | $ | 21.26 | $ | 29.20 | $ | 21.25 | $ | 22.69 | ||||||||||
| Total Return(a) | 6.44 | % | (17.16 | )% | 40.89 | % | 4.65 | % | 15.55 | % | ||||||||||
| Ratios and Supplemental Data: | ||||||||||||||||||||
| Net assets, end of year (000 omitted) | $ | 62,265 | $ | 82,373 | $ | 115,544 | $ | 91,379 | $ | 107,026 | ||||||||||
| Before waiver | ||||||||||||||||||||
| Ratio of expenses to average net assets | 0.91 | % | 0.87 | % | 0.86 | % | 0.91 | % | 0.85 | % | ||||||||||
| After waiver | ||||||||||||||||||||
| Ratio of expenses to average net assets | 0.73 | % | 0.73 | % | 0.73 | % | 0.73 | % | 0.73 | % | ||||||||||
| Ratio of net investment income to average net assets | 1.21 | % | 1.14 | % | 0.65 | % | 1.10 | % | 1.68 | % | ||||||||||
| Portfolio turnover rate(b) | 55 | % | 38 | % | 30 | % | 57 | % | 50 | % | ||||||||||
| (a) | Total return in the above table represents the rate that the investor would have earned or lost on an investment in the Fund, assuming reinvestment of distributions. |
| (b) | Portfolio turnover is calculated on the basis of the Fund as a whole without distinguishing among the classes of shares. |
See accompanying notes which are an integral part of these financial statements.
30
| Dana Large Cap Equity Fund – Investor Class |
| Financial Highlights |
| (For a share oustanding during each year) |
| For the Years Ended October 31, | ||||||||||||||||||||
| 2023 | 2022 | 2021 | 2020 | 2019 | ||||||||||||||||
| Selected Per Share Data | ||||||||||||||||||||
| Net asset value, beginning of year | $ | 21.26 | $ | 29.20 | $ | 21.26 | $ | 22.69 | $ | 22.35 | ||||||||||
| Investment operations: | ||||||||||||||||||||
| Net investment income | 0.20 | 0.22 | 0.10 | 0.18 | 0.30 | |||||||||||||||
| Net realized and unrealized gain (loss) on investments | 1.03 | (4.60 | ) | 8.39 | 0.87 | 2.50 | ||||||||||||||
| Total from investment operations | 1.23 | (4.38 | ) | 8.49 | 1.05 | 2.80 | ||||||||||||||
| Less distributions to shareholders from: | ||||||||||||||||||||
| Net investment income | (0.22 | ) | (0.19 | ) | (0.11 | ) | (0.18 | ) | (0.32 | ) | ||||||||||
| Net realized gains | (1.62 | ) | (3.37 | ) | (0.44 | ) | (2.30 | ) | (2.14 | ) | ||||||||||
| Total distributions | (1.84 | ) | (3.56 | ) | (0.55 | ) | (2.48 | ) | (2.46 | ) | ||||||||||
| Net asset value, end of year | $ | 20.65 | $ | 21.26 | $ | 29.20 | $ | 21.26 | $ | 22.69 | ||||||||||
| Total Return(a) | 6.22 | % | (17.38 | )% | 40.48 | % | 4.43 | % | 15.29 | % | ||||||||||
| Ratios and Supplemental Data: | ||||||||||||||||||||
| Net assets, end of year (000 omitted) | $ | 18,797 | $ | 19,932 | $ | 26,537 | $ | 24,615 | $ | 25,398 | ||||||||||
| Before waiver | ||||||||||||||||||||
| Ratio of expenses to average net assets | 1.16 | % | 1.12 | % | 1.11 | % | 1.16 | % | 1.10 | % | ||||||||||
| After waiver | ||||||||||||||||||||
| Ratio of expenses to average net assets | 0.98 | % | 0.98 | % | 0.98 | % | 0.98 | % | 0.98 | % | ||||||||||
| Ratio of net investment income to average net assets | 0.95 | % | 0.89 | % | 0.40 | % | 0.85 | % | 1.40 | % | ||||||||||
| Portfolio turnover rate(b) | 55 | % | 38 | % | 30 | % | 57 | % | 50 | % | ||||||||||
| (a) | Total return in the above table represents the rate that the investor would have earned or lost on an investment in the Fund, assuming reinvestment of distributions. |
| (b) | Portfolio turnover is calculated on the basis of the Fund as a whole without distinguishing among the classes of shares. |
See accompanying notes which are an integral part of these financial statements.
31
| Dana Epiphany ESG Small Cap Equity Fund – Institutional Class |
| Financial Highlights |
| (For a share oustanding during each year) |
| For the Years Ended October 31, | ||||||||||||||||||||
| 2023 | 2022 | 2021 | 2020 | 2019 | ||||||||||||||||
| Selected Per Share Data | ||||||||||||||||||||
| Net asset value, beginning of year | $ | 11.62 | $ | 15.91 | $ | 9.82 | $ | 10.24 | $ | 11.09 | ||||||||||
| Investment operations: | ||||||||||||||||||||
| Net investment income (loss) | 0.04 | 0.01 | (0.03 | ) | 0.01 | 0.01 | ||||||||||||||
| Net realized and unrealized gain (loss) on investments | (0.14 | ) | (3.02 | ) | 6.12 | (0.42 | ) | (0.05 | ) | |||||||||||
| Total from investment operations | (0.10 | ) | (3.01 | ) | 6.09 | (0.41 | ) | (0.04 | ) | |||||||||||
| Less distributions to shareholders from: | ||||||||||||||||||||
| Net investment income | (0.04 | ) | — | — | (0.01 | ) | — | |||||||||||||
| Net realized gains | (0.54 | ) | (1.28 | ) | — | — | (0.81 | ) | ||||||||||||
| Total distributions | (0.58 | ) | (1.28 | ) | — | (0.01 | ) | (0.81 | ) | |||||||||||
| Net asset value, end of year | $ | 10.94 | $ | 11.62 | $ | 15.91 | $ | 9.82 | $ | 10.24 | ||||||||||
| Total Return(a) | (0.81 | )% | (20.59 | )% | 62.02 | % | (4.04 | )% | 0.83 | % | ||||||||||
| Ratios and Supplemental Data: | ||||||||||||||||||||
| Net assets, end of year (000 omitted) | $ | 23,263 | $ | 13,458 | $ | 17,439 | $ | 9,861 | $ | 12,421 | ||||||||||
| Before waiver | ||||||||||||||||||||
| Ratio of expenses to average net assets | 1.52 | % | 1.95 | % | 2.05 | % | 2.58 | % | 1.88 | % | ||||||||||
| After waiver | ||||||||||||||||||||
| Ratio of expenses to average net assets | 0.95 | % | 0.95 | % | 0.95 | % | 0.95 | % | 0.95 | % | ||||||||||
| Ratio of net investment income (loss) to average net assets | 0.33 | % | 0.06 | % | (0.24 | )% | 0.02 | % | 0.11 | % | ||||||||||
| Portfolio turnover rate | 59 | % | 82 | % | 92 | % | 88 | % | 50 | % | ||||||||||
| (a) | Total return in the above table represents the rate that the investor would have earned or lost on an investment in the Fund, assuming reinvestment of distributions. |
See accompanying notes which are an integral part of these financial statements.
32
| Dana Epiphany ESG Equity Fund – Institutional Class |
| Financial Highlights |
| (For a share outstanding during each year) |
| For the Years Ended October 31, | ||||||||||||||||||||
| 2023 | 2022 | 2021 | 2020 | 2019 | ||||||||||||||||
| Selected Per Share Data | ||||||||||||||||||||
| Net asset value, beginning of year | $ | 11.51 | $ | 13.97 | $ | 10.25 | $ | 11.58 | $ | 11.80 | ||||||||||
| Investment operations: | ||||||||||||||||||||
| Net investment income | 0.11 | 0.11 | 0.06 | 0.09 | 0.14 | |||||||||||||||
| Net realized and unrealized gain (loss) on investments | (0.19 | ) | (2.27 | ) | 3.87 | 0.47 | 1.15 | |||||||||||||
| Total from investment operations | (0.08 | ) | (2.16 | ) | 3.93 | 0.56 | 1.29 | |||||||||||||
| Less distributions to shareholders from: | ||||||||||||||||||||
| Net investment income | (0.11 | ) | (0.11 | ) | (0.06 | ) | (0.10 | ) | (0.12 | ) | ||||||||||
| Net realized gains | — | (0.19 | ) | (0.15 | ) | (1.79 | ) | (1.39 | ) | |||||||||||
| Total distributions | (0.11 | ) | (0.30 | ) | (0.21 | ) | (1.89 | ) | (1.51 | ) | ||||||||||
| Net asset value, end of year | $ | 11.32 | $ | 11.51 | $ | 13.97 | $ | 10.25 | $ | 11.58 | ||||||||||
| Total Return(a) | (0.71 | )% | (15.76 | )% | 38.70 | % | 4.76 | % | 12.76 | % | ||||||||||
| Ratios and Supplemental Data: | ||||||||||||||||||||
| Net assets, end of year (000 omitted) | $ | 59,576 | $ | 72,991 | $ | 67,557 | $ | 13,062 | $ | 5,079 | ||||||||||
| Before waiver | ||||||||||||||||||||
| Ratio of expenses to average net assets | 0.98 | % | 0.96 | % | 1.12 | % | 2.00 | % | 2.13 | % | ||||||||||
| After waiver | ||||||||||||||||||||
| Ratio of expenses to average net assets | 0.85 | % | 0.85 | % | 0.85 | % | 0.85 | % | 0.90 | % | ||||||||||
| Ratio of net investment income to average net assets | 0.90 | % | 0.91 | % | 0.57 | % | 0.89 | % | 1.19 | % | ||||||||||
| Portfolio turnover rate | 60 | % | 33 | % | 18 | % | 67 | % | 60 | % | ||||||||||
| (a) | Total return in the above table represents the rate that the investor would have earned or lost on an investment in the Fund, assuming reinvestment of distributions. |
See accompanying notes which are an integral part of these financial statements.
33
| Dana Funds |
| Notes to the Financial Statements |
| October 31, 2023 |
NOTE 1. ORGANIZATION
The Dana Large Cap Equity Fund (the “Large Cap Fund”), the Dana Epiphany ESG Small Cap Equity Fund (the “Small Cap Fund”), and the Dana Epiphany ESG Equity Fund (the “Epiphany ESG Fund”) (each a “Fund” and collectively, the “Funds”) are each registered under the Investment Company Act of 1940, as amended (“1940 Act”), as an open-end diversified series of Valued Advisers Trust (the “Trust”). The Trust is a management investment company established under the laws of Delaware by an Agreement and Declaration of Trust dated June 13, 2008 (the “Trust Agreement”). The Trust Agreement permits the Board of Trustees (“Board”) to issue an unlimited number of shares of beneficial interest of separate series without par value. Each Fund is one of a series of funds currently authorized by the Board. The investment adviser to the Funds is Dana Investment Advisors, Inc. (the “Adviser”). Each Fund seeks long-term growth of capital.
The Large Cap Fund currently offers Investor Class shares and Institutional Class shares. The Small Cap Fund and Epiphany ESG Fund currently offer Institutional Class shares. Each share represents an equal proportionate interest in the assets and liabilities belonging to the Fund and is entitled to such dividends and distributions out of income belonging to the Fund as declared by the Board.
NOTE 2. SIGNIFICANT ACCOUNTING POLICIES
The Funds are investment companies and follow accounting and reporting guidance under Financial Accounting Standards Board Accounting Standards Codification (“ASC”) Topic 946, “Financial Services-Investment Companies”. The following is a summary of significant accounting policies followed by the Funds in the preparation of their financial statements. These policies are in conformity with generally accepted accounting principles in the United States of America (“GAAP”).
Regulatory update – Tailored Shareholder Reports for Mutual Funds and Exchange-Traded Funds (“ETFs”) – Effective January 24, 2023, the SEC adopted rule and form amendments to require mutual funds and ETFs to transmit concise and visually engaging streamlined annual and semiannual reports to shareholders that highlight key information. Other information, including financial statements, will no longer appear in a streamlined shareholder report but must be available online, delivered free of charge upon request, and filed on a semiannual basis on Form N-CSR. The rule and form amendments have a compliance date of July 24, 2024. At this time, management is evaluating the impact of these amendments on the shareholder reports for the Funds.
Estimates – The preparation of financial statements in conformity with GAAP requires management to make estimates and assumptions that affect the reported amounts of
34
| Dana Funds |
| Notes to the Financial Statements (continued) |
| October 31, 2023 |
assets and liabilities and disclosure of contingent assets and liabilities at the date of the financial statements and the reported amounts of increases and decreases in net assets from operations during the reporting period. Actual results could differ from those estimates.
Federal Income Taxes – The Funds make no provision for federal income or excise tax. Each Fund has qualified and intends to qualify each year as a regulated investment company (“RIC”) under subchapter M of the Internal Revenue Code of 1986, as amended, by complying with the requirements applicable to RICs and by distributing substantially all of its taxable income. Each Fund also intends to distribute sufficient net investment income and net capital gains, if any, so that it will not be subject to excise tax on undistributed income and gains. If the required amount of net investment income or gains is not distributed, the Funds could incur a tax expense.
As of and during the fiscal year ended October 31, 2023, the Funds did not have any liabilities for any unrecognized tax benefits. The Funds recognize interest and penalties, if any, related to unrecognized tax benefits as income tax expense on the Statements of Operations when incurred. During the fiscal year ended October 31, 2023, the Funds did not incur any interest or penalties. Management of the Funds has reviewed tax positions taken in tax years that remain subject to examination by all major tax jurisdictions, including federal (i.e., the last three tax year ends and the interim tax period since then, as applicable). Management believes that there is no tax liability resulting from unrecognized tax benefits related to uncertain tax positions taken.
Expenses – Expenses incurred by the Trust that do not relate to a specific fund of the Trust are allocated to the individual funds based on each fund’s relative net assets or another appropriate basis (as determined by the Board). Expenses specifically attributable to any class are borne by that class. Income, realized gains and losses, unrealized appreciation and depreciation, and fund-wide expenses not allocated to a particular class shall be allocated to each class based on the net assets of that class in relation to the net assets of the entire fund.
Security Transactions and Related Income – The Funds follow industry practice and record security transactions on the trade date for financial reporting purposes. The specific identification method is used for determining gains or losses for financial statement and income tax purposes. Dividend income is recorded on the ex-dividend date and interest income is recorded on an accrual basis. Withholding taxes on foreign dividends, if any, have been provided for in accordance with the Funds’ understanding of the applicable country’s tax rules and rates.
The Funds may hold Real Estate Investment Trusts (“REITs”) which pay dividends to their shareholders based upon available funds from operations. It is possible for these dividends to exceed the REIT’s underlying taxable earnings and profits resulting in the
35
| Dana Funds |
| Notes to the Financial Statements (continued) |
| October 31, 2023 |
excess portion of such dividends being designated as a return of capital. Distributions received from REITs that represent a return of capital or capital gains are recorded as a reduction of the cost of the REITs or as a realized gain, respectively.
Dividends and Distributions – The Funds intend to distribute substantially all of their net investment income, if any, at least quarterly. The Funds intend to distribute their net realized long-term and short-term capital gains, if any, annually. Distributions to shareholders, which are determined in accordance with income tax regulations, are recorded on the ex-dividend date. The treatment for financial reporting purposes of distributions made to shareholders during the year from net investment income or net realized capital gains may differ from their ultimate treatment for federal income tax purposes. These differences are caused primarily by differences in the timing of the recognition of certain components of income, expense or realized capital gain for federal income tax purposes. Where such differences are permanent in nature, they are reclassified in the components of the net assets based on their ultimate characterization for federal income tax purposes. Any such reclassifications will have no effect on net assets, results of operations or net asset value (“NAV”) per share of the Funds.
For the fiscal year end of October 31, 2023, the Funds made the following reclassifications to increase (decrease) the components of net assets:
| Accumulated | ||||||||
| Paid-In | Earnings | |||||||
| Capital | (Deficit) | |||||||
| Large Cap Fund | $ | — | $ | — | ||||
| Small Cap Fund | (4,035 | ) | 4,035 | |||||
| Epiphany ESG Fund | 24,564 | (24,564 | ) | |||||
Share Valuation – The NAV per share of each class of each Fund is calculated each day the New York Stock Exchange (“NYSE”) is open by dividing the total value of the assets attributable to that class, less liabilities attributable to that class, by the number of shares outstanding of that class.
NOTE 3. SECURITIES VALUATION AND FAIR VALUE MEASUREMENTS
Each Fund values its portfolio securities at fair value as of the close of regular trading on the NYSE (normally 4:00 p.m. Eastern time) on each business day the NYSE is open for business. Fair value is defined as the price that a Fund would receive upon selling an investment in a timely transaction to an independent buyer in the principal or most advantageous market of the investment. GAAP establishes a three-tier hierarchy to maximize the use of observable market data and minimize the use of unobservable inputs and to establish classification of fair value measurements for disclosure purposes.
36
| Dana Funds |
| Notes to the Financial Statements (continued) |
| October 31, 2023 |
Inputs refer broadly to the assumptions that market participants would use in pricing the asset or liability, including assumptions about risk (the risk inherent in a particular valuation technique used to measure fair value including a pricing model and/or the risk inherent in the inputs to the valuation technique). Inputs may be observable or unobservable. Observable inputs are inputs that reflect the assumptions market participants would use in pricing the asset or liability developed based on market data obtained and available from sources independent of the reporting entity. Unobservable inputs are inputs that reflect the reporting entity’s own assumptions about the assumptions market participants would use in pricing the asset or liability developed based on the best information available in the circumstances.
Various inputs are used in determining the value of each Fund’s investments. These inputs are summarized in the three broad levels listed below.
| ● | Level 1 – unadjusted quoted prices in active markets for identical investments and/or registered investment companies where the value per share is determined and published and is the basis for current transactions for identical assets or liabilities at the valuation date |
| ● | Level 2 – other significant observable inputs (including, but not limited to, quoted prices for an identical security in an inactive market, quoted prices for similar securities, interest rates, prepayment speeds, credit risk, etc.) |
| ● | Level 3 – significant unobservable inputs (including the Funds’ own assumptions in determining fair value of investments based on the best information available) |
The inputs used to measure fair value may fall into different levels of the fair value hierarchy. In such cases, for disclosure purposes, the level in the fair value hierarchy which is reported is determined based on the lowest level input that is significant to the fair value measurement in its entirety.
Equity securities that are traded on any stock exchange are generally valued at the last quoted sale price on the security’s primary exchange. Lacking a last sale price, an exchange-traded security is generally valued at its last bid price. Securities traded in the Nasdaq over-the-counter market are generally valued at the Nasdaq Official Closing Price. When using the market quotations and when the market is considered active, the security is classified as a Level 1 security. In the event that market quotations are not readily available or are considered unreliable due to market or other events, securities are valued in good faith by the Adviser as “Valuation Designee” under the oversight of the Board. The Adviser has adopted written policies and procedures for valuing securities and other assets in circumstances where market quotes are not readily available. In the event that market
37
| Dana Funds |
| Notes to the Financial Statements (continued) |
| October 31, 2023 |
quotes are not readily available, and the security or asset cannot be valued pursuant to one of the valuation methods, the value of the security or asset will be determined in good faith by the Adviser pursuant to its policies and procedures. On a quarterly basis, the Adviser’s fair valuation determinations will be reviewed by the Board. Under these policies, the securities will be classified as Level 2 or 3 within the fair value hierarchy, depending on the inputs used.
Investments in mutual funds, including money market mutual funds, are generally priced at the ending NAV. These securities are categorized as Level 1 securities.
In accordance with the Trust’s valuation policies, the Valuation Designee is required to consider all appropriate factors relevant to the value of securities for which it has determined other pricing sources are not available or reliable as described above. No single method exists for determining fair value, because fair value depends upon the circumstances of each individual case. As a general principle, the current fair value of a security being valued by the Valuation Designee’s would be the amount that the Fund might reasonably expect to receive upon the current sale. Methods that are in accordance with this principle may, for example, be based on (i) a multiple of earnings; (ii) a discount from market prices of a similar freely traded security (including a derivative security or a basket of securities traded on other markets, exchanges or among dealers); or (iii) yield to maturity with respect to debt issues, or a combination of these and other methods. Fair-value pricing is permitted if, in the Valuation Designee’s opinion, the validity of market quotations appears to be questionable based on factors such as evidence of a thin market in the security based on a small number of quotations, a significant event occurs after the close of a market but before a Fund’s NAV calculation that may affect a security’s value, or the Valuation Designee is aware of any other data that calls into question the reliability of market quotations.
The following is a summary of the inputs used to value the Funds’ investments as of October 31, 2023:
| Large Cap Fund | Valuation Inputs | |||||||||||||||
| Assets | Level 1 | Level 2 | Level 3 | Total | ||||||||||||
| Common Stocks(a) | $ | 80,596,087 | $ | — | $ | — | $ | 80,596,087 | ||||||||
| Money Market Funds | 643,800 | — | — | 643,800 | ||||||||||||
| Total | $ | 81,239,887 | $ | — | $ | — | $ | 81,239,887 | ||||||||
| Small Cap Fund | Valuation Inputs | |||||||||||||||
| Assets | Level 1 | Level 2 | Level 3 | Total | ||||||||||||
| Common Stocks(a) | $ | 22,877,419 | $ | — | $ | — | $ | 22,877,419 | ||||||||
| Money Market Funds | 240,535 | — | — | 240,535 | ||||||||||||
| Total | $ | 23,117,954 | $ | — | $ | — | $ | 23,117,954 | ||||||||
38
| Dana Funds |
| Notes to the Financial Statements (continued) |
| October 31, 2023 |
| Epiphany ESG Fund | Valuation Inputs | |||||||||||||||
| Assets | Level 1 | Level 2 | Level 3 | Total | ||||||||||||
| Common Stocks(a) | $ | 59,048,965 | $ | — | $ | — | $ | 59,048,965 | ||||||||
| Money Market Funds | 674,054 | — | — | 674,054 | ||||||||||||
| Total | $ | 59,723,019 | $ | — | $ | — | $ | 59,723,019 | ||||||||
| (a) | Refer to Schedule of Investments for sector classifications. |
The Funds did not hold any investments at the end of the reporting period in which significant unobservable inputs (Level 3) were used in determining fair value; therefore, no reconciliation of Level 3 securities is included for this reporting period.
NOTE 4. FEES AND OTHER TRANSACTIONS WITH AFFILIATES AND OTHER SERVICE PROVIDERS
The Adviser, under the terms of the management agreement for each Fund, manages the Funds’ investments subject to oversight of the Board. As compensation for its management services, the Funds are obligated to pay the Adviser a fee computed and accrued daily and paid monthly at an annual rate of 0.65%, 0.75% and 0.65% of the average daily net assets of the Large Cap Fund, the Small Cap Fund and the Epiphany ESG Fund, respectively.
The Adviser has contractually agreed to waive its management fee and/or reimburse certain operating expenses through February 29, 2024, but only to the extent necessary so that the Funds’ net expenses, excluding brokerage fees and commissions, borrowing costs (such as interest and dividend expenses on securities sold short), taxes, extraordinary expenses, fees and expenses paid under a distribution plan adopted pursuant to Rule 12b-1, fees and expenses paid under a shareholder services plan, and indirect expenses (such as “acquired fund fees and expenses”) do not exceed 0.73% of the average daily net assets of the Institutional Class and the Investor Class for the Large Cap Fund, 0.95% of the average daily net assets of the Institutional Class for the Small Cap Fund, and 0.85% of the average daily net assets of the Institutional Class for the Epiphany ESG Fund.
Each fee waiver or expense reimbursement by the Adviser is subject to repayment by the applicable Fund within three years following the date in which the fee waiver or expense reimbursement occurred, provided that the Fund is able to make the repayment without exceeding the expense limitation that is in effect at the time of the waiver or expense reimbursement, and the expense limitation in effect at the time of the repayment. The expense limitation agreements may not be terminated except by mutual consent of the Adviser and the Board.
39
| Dana Funds |
| Notes to the Financial Statements (continued) |
| October 31, 2023 |
The amounts subject to repayment by the Funds, pursuant to the aforementioned conditions are as follows:
| Large Cap | Small Cap | Epiphany | ||||||||||
| Recoverable Through | Fund | Fund | ESG Fund | |||||||||
| October 31, 2024 | $ | 174,396 | $ | 164,133 | $ | 108,826 | ||||||
| October 31, 2025 | 176,583 | 153,559 | 84,961 | |||||||||
| October 31, 2026 | 185,548 | 143,132 | 85,812 | |||||||||
The Trust retains Ultimus Fund Solutions, LLC (“Ultimus” or “Administrator”) to provide the Funds with administration, fund accounting and transfer agent services, including all regulatory reporting.
Northern Lights Compliance Services, LLC (“NLCS”), an affiliate of Ultimus, provides a Chief Compliance Officer and an Anti-Money Laundering Compliance Officer to the Trust, as well as related compliance services, pursuant to a consulting agreement between NLCS and the Trust. Under the terms of such agreement, NLCS receives fees from the Funds.
The officers and one trustee of the Trust are members of management and/or employees of the Administrator or of NLCS and are not paid by the Trust for services to the Funds. Ultimus Fund Distributors, LLC (the “Distributor”), a wholly-owned subsidiary of Ultimus, acts as the distributor of the Funds’ shares. There were no payments made to the Distributor by the Funds for the fiscal year ended October 31, 2023.
The Trust, with respect to the Large Cap Fund, has adopted a Distribution Plan (the “Plan”) pursuant to Rule 12b-1 under the Investment Company Act of 1940, as amended (the “1940 Act”). The Plan provides that the Large Cap Fund will pay the Distributor and any registered securities dealer, financial institution or any other person (a “Recipient”) a shareholder servicing fee aggregating at a rate of 0.25% of the average daily net assets for the Investor Class shares in connection with the promotion and distribution of the Large Cap Fund’s shares or the provision of shareholder support services to shareholders, including, but not necessarily limited to, advertising, compensation to underwriters, dealers and selling personnel, the printing and mailing of prospectuses to other than current Investor Class shareholders, the printing and mailing of sales literature and servicing shareholder accounts (“12b-1 Expenses”). The Large Cap Fund or Distributor may pay all or a portion of these fees to any Recipient who renders assistance in distributing or promoting the sale of shares, or who provides certain shareholder services, pursuant to a written agreement. The Plan is a compensation plan, which means that compensation is paid regardless of 12b-1 Expenses actually incurred. It is anticipated that the Plan will benefit shareholders because an effective sales program typically is necessary in order for the Large Cap Fund to reach and maintain a sufficient size to achieve efficiently its investment objectives and to realize economies of scale.
40
| Dana Funds |
| Notes to the Financial Statements (continued) |
| October 31, 2023 |
NOTE 5. PURCHASES AND SALES OF SECURITIES
For the fiscal year ended October 31, 2023, purchases and sales of investment securities, other than short-term investments, were as follows:
| Purchases | Sales | |||||||
| Large Cap Fund | $ | 53,108,524 | $ | 79,400,431 | ||||
| Small Cap Fund | 24,236,404 | 14,226,123 | ||||||
| Epiphany ESG Fund | 37,985,434 | 50,182,875 | ||||||
There were no purchases or sales of long-term U.S. government obligations during the fiscal year ended October 31, 2023.
NOTE 6. FEDERAL TAX INFORMATION
At October 31, 2023, the net unrealized appreciation (depreciation) and tax cost of investments for tax purposes was as follows:
| Large Cap | Small Cap | Epiphany | ||||||||||
| Fund | Fund | ESG Fund | ||||||||||
| Gross unrealized appreciation | $ | 16,502,937 | $ | 1,559,826 | $ | 3,728,426 | ||||||
| Gross unrealized depreciation | (1,938,852 | ) | (2,191,868 | ) | (4,685,676 | ) | ||||||
| Net unrealized appreciation/(depreciation) on investments | 14,564,085 | (632,042 | ) | (957,250 | ) | |||||||
| Tax cost of investments | 66,675,802 | 23,749,996 | 60,680,269 | |||||||||
At October 31, 2023, the difference between book basis and tax basis unrealized appreciation for the Large Cap Fund, Small Cap Fund and Epiphany ESG Fund was attributable primarily to the tax deferral of losses on wash sales.
The tax character of distributions paid for the fiscal years ended October 31, 2023 and October 31, 2022 were as follows:
| Large Cap Fund | Small Cap Fund | Epiphany ESG Fund | ||||||||||||||||||||||
| 2023 | 2022 | 2023 | 2022 | 2023 | 2022 | |||||||||||||||||||
| Distributions paid from: | ||||||||||||||||||||||||
| Ordinary income(a) | $ | 1,228,800 | $ | 4,378,734 | $ | 87,013 | $ | 120,827 | $ | 576,674 | $ | 862,208 | ||||||||||||
| Long-term capital gains | 7,730,819 | 13,039,063 | 1,125,662 | 1,308,363 | — | 834,338 | ||||||||||||||||||
| Tax return of capital | — | — | — | — | — | — | ||||||||||||||||||
| Total | $ | 8,959,619 | $ | 17,417,797 | $ | 1,212,675 | $ | 1,429,190 | $ | 576,674 | $ | 1,696,546 | ||||||||||||
| (a) | Short-term capital gain distributions are treated as ordinary income for tax purposes. |
41
| Dana Funds |
| Notes to the Financial Statements (continued) |
| October 31, 2023 |
At October 31, 2023, the components of accumulated earnings (deficit) on a tax basis were as follows:
| Large Cap Fund | Small Cap Fund | Epiphany ESG Fund | ||||||||||
| Undistributed ordinary income | $ | 132,292 | $ | — | $ | 72,373 | ||||||
| Undistributed long-term capital gains | 9,147,747 | — | — | |||||||||
| Accumulated capital and other losses | — | (2,294 | ) | (2,455,167 | ) | |||||||
| Unrealized appreciation (depreciation) on investments | 14,564,085 | (632,042 | ) | (957,250 | ) | |||||||
| Unrealized appreciation on foreign currency translations | — | — | — | |||||||||
| Total accumulated earnings (deficit) | $ | 23,844,124 | $ | (634,336 | ) | $ | (3,340,044 | ) | ||||
As of October 31, 2023, the Small Cap Fund had long-term capital loss carry forwards of $2,294 and the Epiphany ESG Fund had short-term capital loss carryforwards of $2,455,167, respectively. These capital loss carryforwards, which do not expire, may be utilized in future years to offset net realized capital gains, if any, prior to distributing such gains to shareholders.
NOTE 7. SECTOR RISK
If a Fund has significant investments in the securities of issuers within a particular sector, any development affecting that sector will have a greater impact on the value of the net assets of the Fund than would be the case if the Fund did not have significant investments in that sector. In addition, this may increase the risk of loss in the Fund and increase the volatility of the Fund’s NAV per share. For instance, economic or market factors, regulatory changes or other developments may negatively impact all companies in a particular sector, and therefore the value of the Fund’s portfolio will be adversely affected. As of October 31, 2023, the Large Cap Fund and Epiphany ESG Fund had 31.36% and 29.94% of the value of their net assets invested in stocks within the Technology sector, respectively.
NOTE 8. COMMITMENTS AND CONTINGENCIES
The Trust indemnifies its officers and Trustees for certain liabilities that may arise from their performance of their duties to the Trust or the Funds. Additionally, in the normal course of business, the Trust enters into contracts that contain a variety of representations and warranties which provide general indemnifications. The Trust’s maximum exposure under these arrangements is unknown, as this would involve future claims that may be made against the Trust that have not yet occurred.
42
| Dana Funds |
| Notes to the Financial Statements (continued) |
| October 31, 2023 |
NOTE 9. SUBSEQUENT EVENTS
Management of the Funds has evaluated the need for disclosures and/or adjustments resulting from subsequent events through the date at which these financial statements were issued. Based upon this evaluation, management has determined there were no items requiring adjustment of the financial statements or additional disclosure.
43
| Report of Independent Registered Public Accounting Firm |
To the Shareholders of Dana Funds and
Board of Trustees of Valued Advisers Trust
Opinion on the Financial Statements
We have audited the accompanying statements of assets and liabilities, including the schedules of investments, of Dana Funds comprising Dana Large Cap Equity Fund, Dana Epiphany ESG Small Cap Equity Fund, and Dana Epiphany ESG Equity Fund (the “Funds”), each a series of Valued Advisers Trust, as of October 31, 2023, the related statements of operations for the year then ended, the statements of changes in net assets for each of the two years in the period then ended, the related notes, and the financial highlights for each of the five years in the period then ended (collectively referred to as the “financial statements”). In our opinion, the financial statements present fairly, in all material respects, the financial position of each of the Funds as of October 31, 2023, the results of their operations for the year then ended, the changes in net assets for each of the two years in the period then ended, and the financial highlights for each of the five years in the period then ended, in conformity with accounting principles generally accepted in the United States of America.
Basis for Opinion
These financial statements are the responsibility of the Funds’ management. Our responsibility is to express an opinion on the Funds’ financial statements based on our audits. We are a public accounting firm registered with the Public Company Accounting Oversight Board (United States) (“PCAOB”) and are required to be independent with respect to the Funds in accordance with the U.S. federal securities laws and the applicable rules and regulations of the Securities and Exchange Commission and the PCAOB.
We conducted our audits in accordance with the standards of the PCAOB. Those standards require that we plan and perform the audit to obtain reasonable assurance about whether the financial statements are free of material misstatement whether due to error or fraud.
Our audits included performing procedures to assess the risks of material misstatement of the financial statements, whether due to error or fraud, and performing procedures that respond to those risks. Such procedures included examining, on a test basis, evidence regarding the amounts and disclosures in the financial statements. Our procedures included confirmation of securities owned as of October 31, 2023, by correspondence with the custodian and brokers. Our audits also included evaluating the accounting principles used and significant estimates made by management, as well as evaluating the overall presentation of the financial statements. We believe that our audits provide a reasonable basis for our opinion.
We have served as the Funds’ auditor since 2012.
COHEN & COMPANY, LTD.

Cleveland, Ohio
December 22, 2023
44
| Liquidity Risk Management Program (Unaudited) |
Valued Advisers Trust has adopted and implemented a written liquidity risk management program as required by Rule 22e-4 (the “Liquidity Rule”) under the Investment Company Act. The program is reasonably designed to assess and manage each Fund’s liquidity risk, taking into consideration, among other factors, the Fund’s investment strategy and the liquidity of its portfolio investments during normal and reasonably foreseeable stressed conditions; its short and long-term cash flow projections; and its cash holdings and access to other funding sources. The Board of Trustees approved the appointment of a Liquidity Administrator Committee, which includes representatives from Dana Investment Advisors, Inc., the Funds’ investment adviser, and Ultimus Fund Solutions, LLC, the Funds’ Administrator. The Liquidity Administrator Committee is responsible for the program’s administration and oversight and for reporting to the Board on at least an annual basis regarding the program’s operation and effectiveness. The Liquidity Administrator Committee updated its assessment of each Fund’s liquidity risk profile, considering additional data gathered during the period June 1, 2022 through May 31, 2023 (the “Review Period”) and the adequacy and effectiveness of the liquidity risk management program’s operations during the Review Period in order to prepare a written report for the Board of Trustees (the “Report”) for consideration at its meeting held on September 8, 2023. The Report noted that during the Review Period none of the Funds experienced unusual stress or disruption to its operations related to purchase and redemption activity. It further noted that during the Review Period each Fund held adequate levels of cash and highly liquid investments to meet shareholder redemption activities in accordance with applicable requirements. The Report concluded that (i) the Trust’s liquidity risk management program is reasonably designed to prevent violations of the Liquidity Rule and (ii) the Trust’s liquidity risk management program had been effectively implemented during the Review Period.
45
| Summary of Fund Expenses (Unaudited) |
As a shareholder of a Fund, you incur two types of costs: (1) transaction costs and (2) ongoing costs, including management fees, distribution (12b-1) fees and other Fund expenses. These examples are intended to help you understand your ongoing costs (in dollars) of investing in each Fund and to compare these costs with the ongoing costs of investing in other funds. Each Fund’s example is based on an investment of $1,000 invested at the beginning of the period and held for the entire period from May 1, 2023 through October 31, 2023.
Actual Expenses
The first line of the table below for each Fund provides information about actual account values and actual expenses. You may use the information in these lines, together with the amount you invested, to estimate the expenses that you paid over the period. Simply divide your account value by $1,000 (for example, an $8,600 account value divided by $1,000 = 8.6), then multiply the result by the number in the first line under the heading “Expenses Paid During Period” to estimate the expenses you paid on your account during this period.
Hypothetical Example for Comparison Purposes
The second line of the table below for each class provides information about hypothetical account values and hypothetical expenses based on each Fund’s actual expense ratios and an assumed rate of return of 5% per year before expenses, which is not the Fund’s actual return. The hypothetical account values and expenses may not be used to estimate the actual ending account balances or expenses you paid for the period. You may use this information to compare the ongoing costs of investing in the Funds and other funds. To do so, compare this 5% hypothetical example with the 5% hypothetical examples that appear in the shareholder reports of other funds.
Expenses shown in the table are meant to highlight your ongoing costs only and do not reflect any transactional costs. Therefore, the second line of the table for each class is useful in comparing ongoing costs only and will not help you determine the relative total costs of owning different funds. In addition, if transaction costs were included, your costs would have been higher.
46
| Summary of Fund Expenses (Unaudited) (continued) |
| Ending | ||||||||||||||||
| Beginning | Account | Expenses | ||||||||||||||
| Account | Value | Paid | Annualized | |||||||||||||
| Value | October 31, | During | Expense | |||||||||||||
| May 1, 2023 | 2023 | Period(a) | Ratio | |||||||||||||
| Large Cap Fund | ||||||||||||||||
| Institutional Class | Actual | $ | 1,000.00 | $ | 997.90 | $ | 3.68 | 0.73% | ||||||||
| Hypothetical(b) | $ | 1,000.00 | $ | 1,021.53 | $ | 3.72 | 0.73% | |||||||||
| Investor Class | Actual | $ | 1,000.00 | $ | 996.70 | $ | 4.93 | 0.98% | ||||||||
| Hypothetical(b) | $ | 1,000.00 | $ | 1,020.27 | $ | 4.99 | 0.98% | |||||||||
| Small Cap Fund | ||||||||||||||||
| Institutional Class | Actual | $ | 1,000.00 | $ | 958.20 | $ | 4.69 | 0.95% | ||||||||
| Hypothetical(b) | $ | 1,000.00 | $ | 1,020.42 | $ | 4.84 | 0.95% | |||||||||
| Epiphany ESG Fund | ||||||||||||||||
| Institutional Class | Actual | $ | 1,000.00 | $ | 953.60 | $ | 4.19 | 0.85% | ||||||||
| Hypothetical(b) | $ | 1,000.00 | $ | 1,020.92 | $ | 4.33 | 0.85% | |||||||||
| (a) | Expenses are equal to the Fund’s annualized expense ratios, multiplied by the average account value over the period, multiplied by 184/365 (to reflect the one-half year period). The annualized expense ratios reflect reimbursement of expenses by the Fund’s investment adviser for the period beginning May 1, 2023 to October 31, 2023. The “Financial Highlights” tables in the Fund’s financial statements, included in this report, also show the gross expense ratios, without such reimbursements. |
| (b) | Hypothetical assumes 5% annual return before expenses. |
47
| Additional Federal Income Tax Information (Unaudited) |
The Form 1099-DIV you receive in January 2024 will show the tax status of all distributions paid to your account in calendar year 2023. Shareholders are advised to consult their own tax adviser with respect to the tax consequences of their investment in the Fund. As required by the Internal Revenue Code and/or regulations, shareholders must be notified regarding the status of qualified dividend income for individuals and the dividends received deduction for corporations.
Qualified Dividend Income. The Funds designate the following percentage or up to the maximum amount of such dividends allowable pursuant to the Internal Revenue Code, as qualified dividend income eligible for the reduced tax rate.
| Large Cap Fund | Small Cap Fund | Epiphany ESG Fund | ||||
| Qualified Dividend Income | 100% | 100% | 100% |
Qualified Business Income. The Funds designate the following percentage of ordinary income dividends, or up to the maximum amount of such dividends allowable pursuant to the Internal Revenue Code, as qualified business income.
| Large Cap Fund | Small Cap Fund | Epiphany ESG Fund | ||||
| Qualified Business Income | 0% | 0% | 0% |
Dividends Received Deduction. Corporate shareholders are generally entitled to take the dividends received deduction on the portion of the Funds’ dividend distribution that qualifies under tax law. For the Funds’ calendar year 2023 ordinary income dividends, the following percentage qualifies for the corporate dividends received deduction.
| Large Cap Fund | Small Cap Fund | Epiphany ESG Fund | ||||
| Dividends Received Deduction | 100% | 100% | 100% |
The Funds designate the following amounts as long-term capital gains distributions. The amounts designated may not agree with long-term capital gains in the tax character of distribution table due to utilization of earnings and profits distributed to shareholders on redemption of shares.
| Large Cap Fund | Small Cap Fund | Epiphany ESG Fund | ||||||||||
| Long-Term Capital Gains Distributions | $ | 7,730,819 | $ | 1,124,126 | $ | — | ||||||
48
| Trustees and Officers (Unaudited) |
The Board of Trustees supervises the business activities of the Trust. Each Trustee serves as a trustee until termination of the Trust unless the Trustee dies, resigns, retires or is removed.
The following table provides information regarding each of the Independent Trustees.
| Name, Address*, (Age), Position with Trust**, Term of Position with Trust | Principal Occupation During Past 5 Years and Other Directorships | Other Directorships |
| Andrea N. Mullins, 56 Independent Trustee Since December 2013 Chairperson since March 2017 | Current: Private investor; Independent Contractor, SWM Advisors (since April 2014). | Trustee, Angel Oak Funds Trust (since February 2019) (7 portfolios); Trustee, Angel Oak Strategic Credit Fund (since February 2019); Trustee, Angel Oak Financial Strategies Income Term Trust (since May 2019); Trustee, Angel Oak Credit Opportunities Term Trust (since January 2021); Trustee and Audit Committee Chair, NXG NextGenInfrastructure Income Fund (since November 2021); Trustee and Audit Committee Chair, NXG Cushing Midstream Energy Fund (since November 2021). |
49
| Trustees and Officers (Unaudited) (continued) |
| Name, Address*, (Age), Position with Trust**, Term of Position with Trust | Principal Occupation During Past 5 Years and Other Directorships | Other Directorships |
| Ira P. Cohen, 64 Independent Trustee Since June 2010 | Current: Independent financial services consultant (since February 2005); Executive Vice President of Asset Management Services, Recognos Financial (since August 2015). | Trustee and Audit Committee Chairman, Apollo Diversified Real Estate Fund (since March 2022); Trustee, Chairman and Nominating and Governance Committee Chairman, Angel Oak Funds Trust (since October 2014) (7 portfolios); Trustee, Chairman, and Nominating and Governance Committee Chairman, Angel Oak Strategic Credit Fund (since December 2017); Trustee, Chairman, and Nominating and Governance Committee Chairman, Angel Oak Financial Strategies Income Term Trust (since May 2019);Trustee, Chairman, and Nominating and Governance Committee Chairman, Angel Oak Credit Opportunities Term Trust (since January 2021); Trustee and Nominating and Governance Committee Chairman, U.S. Fixed Income Trust (since March 2019). |
| * | The address for each Trustee is 225 Pictoria Drive, Suite 450, Cincinnati, Ohio 45246. |
| ** | As of the date of this report, the Trust consists of 15 series. |
The following table provides information regarding the Trustee who is considered an “interested person” of the Trust, as that term is defined under the 1940 Act.
| Name, Address*, (Age), Position with Trust**, Term of Position with Trust | Principal Occupation During Past 5 Years and Other Directorships | Other Directorships |
| Mark J. Seger***, 61 Trustee Since March 2017 | Current: Vice Chairman and Co-Founder, Ultimus Fund Solutions, LLC and its subsidiaries (since 1999). | None. |
| * | The address for each Trustee is 225 Pictoria Drive, Suite 450, Cincinnati, Ohio 45246. |
| ** | As of the date of this report, the Trust consists of 15 series. |
| *** | Mr. Seger is considered an “interested person” of the Trust because of his relationship with the Trust’s administrator, transfer agent, and distributor. |
50
| Trustees and Officers (Unaudited) (continued) |
The following table provides information regarding the Officers of the Trust:
| Name, Address*, (Age), Position with Trust**, Term of Position with Trust | Principal Occupation During Past 5 Years | Other Directorships |
Matthew J. Miller, 47 Vice President | Current: Vice President, Relationship Management, Ultimus Fund Solutions, LLC (since December 2015). | None. |
| N. Lynn Bowley, 65 Chief Compliance Officer Since April 2022 | Current: Senior Vice President, Senior Compliance Officer, Northern Lights Compliance Services, LLC (since January 2007). | None. |
Carol J. Highsmith, 59
Secretary Since March 2014 | Current: Vice President, Ultimus Fund Solutions, LLC (since December 2015). | None. |
| Zachary P. Richmond,43 Principal Financial Officer and Treasurer Since September 2021 | Current:Vice President, Financial Administration, Ultimus Fund Solutions, LLC (since February 2019).
Previous:Assistant Vice President, Associate Director of Financial Administration, Ultimus Fund Solutions, LLC (December 2015 to February 2019). | None. |
51
| Trustees and Officers (Unaudited) (continued) |
| Name, Address*, (Age), Position with Trust**, Term of Position with Trust | Principal Occupation During Past 5 Years and Other Directorships | Other Directorships |
| Jared D. Lahman, 37 AML Officer Since March 2023 | Current: Senior Compliance Analyst, Northern Lights Compliance Services, LLC (since January 2019).
Previous: Manager of Fund Accounting, Gemini Fund Services (September 2016 to December 2018) | None. |
| * | The address for each Officer is 225 Pictoria Drive, Suite 450, Cincinnati, Ohio 45246. |
| ** | As of the date of this report, the Trust consists of 15 series. |
| Other Information (Unaudited) |
The Funds’ Statement of Additional Information (“SAI”) includes additional information about the trustees and is available without charge, upon request. You may call toll-free at (855) 280-9648 to request a copy of the SAI or to make shareholder inquiries.
52
| Investment Advisory Agreement Approval (Unaudited) |
At a meeting held on June 1, 2023, the Board of Trustees (the “Board”) considered the renewal of the Investment Advisory Agreements (the “Dana Agreements”) between Valued Advisers Trust (the “Trust”) and Dana Investment Advisors, Inc. (“Dana”) with respect to the Dana Large Cap Equity Fund (the “Large Cap Fund”), the Dana Epiphany ESG Small Cap Equity Fund (the “Small Cap Fund”), and the Dana Epiphany ESG Equity Fund (the “ESG Fund”) (collectively, the “Dana Funds”). Dana provided written information to the Board to assist the Board in its considerations.
Counsel reminded the Trustees of their fiduciary duties and responsibilities, including the factors to be considered, and the application of those factors to Dana. In assessing the factors and reaching its decision, the Board took into consideration information furnished by Dana and the Trust’s other service providers for the Board’s review and consideration throughout the year at regular Board meetings, as well as information specifically prepared or presented in connection with the annual renewal process, including information presented at the meeting. The Board requested and was provided with, and reflected on, information and reports relevant to the annual renewal of the Dana Agreements, including: (i) reports regarding the services and support provided to the Dana Funds by Dana; (ii) quarterly assessments of the investment performance of the Dana Funds by personnel of Dana; (iii) commentary on the reasons for the performance; (iv) presentations by Dana addressing its investment philosophy, investment strategy, personnel, and operations; (v) compliance and audit reports concerning the Dana Funds and Dana; (vi) disclosure information contained in the Trust’s registration statement and Dana’s Form ADV; and (vii) a memorandum from counsel, that summarized the fiduciary duties and responsibilities of the Board in considering and approving the Dana Agreements. The Board also requested and received various informational materials including, without limitation: (a) documents containing information about Dana, including its financial information; a description of its personnel and services it provides to the Dana Funds; information on Dana’s investment advice and performance; summaries of Dana Fund expenses, compliance program, current legal matters, and other general information; (b) comparative expense and performance information for other mutual funds with strategies similar to the Dana Funds; and (c) the benefits to be realized by Dana from its relationship with the Dana Funds. The Board did not identify any particular information that was most relevant to its consideration of the Dana Agreements and each Trustee may have afforded different weight to the various Factors.
1. The nature, extent, and quality of the services to be provided by Dana. The Board considered Dana’s responsibilities under the Dana Agreements. The Trustees considered the services being provided by Dana to the Dana Funds including, without limitation: the quality of its investment advisory services (including research and recommendations with respect to portfolio securities), its process for formulating investment recommendations and assuring compliance with the Dana Funds’ investment objectives and limitations, its coordination of services for the Dana Funds among their service providers, and its efforts to promote the Dana Funds and grow their assets. The Trustees considered Dana’s continuity of, and commitment to retain, qualified personnel and Dana’s commitment to maintain and enhance its resources and systems, the commitment of Dana’s personnel to finding alternatives and options that allow the Dana Funds to maintain their goals, and Dana’s continued cooperation with the Board and counsel for the Dana Funds. The Trustees considered Dana’s personnel, including their education and experience. After considering the foregoing information and further information in the Meeting materials provided by Dana, the Board concluded that, in light of all the facts and circumstances, the nature, extent, and quality of the services provided by Dana were satisfactory and adequate for the Dana Funds.
53
| Investment Advisory Agreement Approval (Unaudited) (continued) |
2. Investment Performance of the Dana Funds and Dana. The Trustees compared the performance of each of the Dana Funds with the performance of funds in a peer group with similar objectives managed by other investment advisers, with aggregated Morningstar category data, and with the performance of each of the Dana Funds’ benchmark. The Trustees also considered the consistency of Dana’s management of the Dana Funds with their investment objectives, strategies, and limitations. The Trustees noted that, as of March 31, 2023, the Large Cap Fund’s performance was below its peer group median for the one-year, three-year, five-year, and since inception periods. The Trustees noted that the Large Cap Fund’s performance was above that of its benchmark for the one-year period, and below the benchmark for all other periods presented. When compared to other funds in its custom Morningstar category, the Trustees observed that the Large Cap Fund’s performance was below the average and median for the one-year, three-year, and five-year periods, and below the median for the since inception period. The Trustees also considered the performance of Dana’s separate accounts that were managed in a manner similar to that of the Large Cap Fund and they noted that the performance of Dana’s composite was lower, and that the reasons for the difference were reasonable. The Trustees considered the performance of the Small Cap Fund, and observed that, as of March 31, 2023, the Small Cap Fund performed above the median of its peer group for the one-year and three-year periods, and below the median of its peer group for the five-year and since inception periods. As compared to its benchmark, the Trustees noted that the Small Cap Fund outperformed for the three-year period ended March 31, 2023, and underperformed for one-year, five-year, and since inception periods. They also noted that the Small Cap Fund’s performance was above the average and median of its custom Morningstar category for the one-year and three-year periods, below the average and median of the category for the five-year period, and below the median for the since inception period. The Trustees also considered the performance of Dana’s separate accounts that were managed in a manner similar to that of the Small Cap Fund and they noted that the performance of the separate account composite was higher, and that the reasons for the difference were reasonable. The Trustees then considered the performance of the ESG Fund, noting that Dana began managing the Fund in December of 2018. For this reason, the Trustees focused their attention on the one-year and three-year performance of the ESG Fund. They observed that, as of March 31, 2023, the ESG Fund performed below the average and median of its peer group for the one-year and three-year periods. As compared to its benchmark, the Trustees noted that the ESG Fund underperformed for the one-year and three-year periods. They also noted that the ESG performed below its category average and median for the one-year and three-year periods. The Trustees also considered the performance of Dana’s separate accounts that were managed in a manner similar to that of the ESG Fund and they noted that the performance of both of the separate account composites was higher, and that the reasons for the differences were reasonable. The Trustees took into consideration discussions with representatives of Dana regarding the reasons for the performance of each of the Dana Funds. After reviewing and discussing these and other relevant factors, the Board concluded, in light of all the facts and circumstances, that the investment performance of the Dana Funds and Dana was satisfactory.
3. The costs of the services to be provided and profits to be realized by Dana from the relationship with the Dana Funds. The Trustees considered: (1) Dana’s financial condition; (2) the asset level of the Dana Funds; (3) the overall expenses of each of the Dana Funds; and (4) the nature and frequency of management fee payments. The Trustees reviewed information provided by Dana regarding its profits associated with managing each of the Dana Funds, noting that Dana is currently waiving a portion of its management fee and/or reimbursing other expenses with respect
54
| Investment Advisory Agreement Approval (Unaudited) (continued) |
to each of the Dana Funds. The Trustees also considered potential benefits for Dana in managing the Dana Funds. The Trustees then compared the fees and expenses of the Dana Funds (including the management fee) to other comparable mutual funds. The Trustees noted that the Large Cap Fund’s management fee was above the median and below the average of its peer group and above the average and median of its custom Morningstar category. The Trustees also noted that the Large Cap Fund’s net expense ratio for the Institutional Class was below the average and median of its peer group and above the median and average of its custom Morningstar category. With respect to the Small Cap Fund, the Trustees noted that the management fee was below the average and the median of its peer group and below the average and median of the custom Morningstar category. They also noted that the Small Cap Fund’s net expense ratio for the Institutional Class was below the average and median of its peer group and below the average and median of its custom Morningstar category. With respect to the ESG Fund, the Board noted that the management fee was below the average and equal to the median of its peer group and above both the average and median of its custom Morningstar category. They also noted that the ESG Fund’s net expense ratio for the Institutional Class was below the average and above the median of its peer group and above both the average and the median of its custom Morningstar category. The Board also considered the fact that Dana contractually lowered the management fee for the Large Cap Fund and the Small Cap Fund in the past and had contractually agreed to limit expenses of each of the Dana Funds. The Board noted that the fees that Dana assesses for separate account clients that have strategies similar to that of each of the Dana Funds, respectively, could be comparable or lower and they expressed the view that the reasons for such differences were acceptable and reasonable. Based on the foregoing, the Board concluded that the fees to be paid to Dana by each of the Dana Funds and the profits to be realized by Dana, in light of all the facts and circumstances, were fair and reasonable in relation to the nature and quality of the services provided by Dana.
4. The extent to which economies of scale would be realized as the Dana Funds grow and whether advisory fee levels reflect these economies of scale for the benefit of the Dana Funds’ investors. The Board considered the Dana Funds’ fee arrangements with Dana. The Board considered that while the management fee remained the same at all asset levels, the shareholders experienced benefits from each of the Dana Funds’ expense limitation arrangements. The Trustees noted that once the expenses fell below the cap set by each arrangement, the shareholders would continue to benefit from economies of scale under the Dana Funds’ arrangements with other service providers to the Dana Funds, and the Trustees attributed this benefit, in part, to the direct and indirect efforts of Dana at the inception of each of the Dana Funds to ensure that a cost structure was in place that was beneficial for the Dana Funds as they grew. In light of its ongoing consideration of the Dana Funds’ asset levels, expectations for growth in the Dana Funds, and fee levels, the Board determined that the Dana Funds’ fee arrangements, in light of all the facts and circumstances, were fair and reasonable in relation to the nature and quality of the services provided by Dana.
5. Possible conflicts of interest and benefits to Dana. The Trustees evaluated the potential for conflicts of interest and considered such matters as the experience and ability of the advisory personnel assigned to the Dana Funds; the basis of decisions to buy or sell securities for the Dana Funds and the substance and administration of Dana’s code of ethics. The Trustees also considered disclosure in the registration statement of the Trust relating to Dana’s potential conflicts of interest. The Trustees noted that Dana may utilize soft dollars and the Trustees noted Dana’s policies and processes for managing the conflicts of interest that could arise from soft dollar arrangements. The
55
| Investment Advisory Agreement Approval (Unaudited) (continued) |
Trustees noted other potential benefits to Dana, including the fact that the Dana Funds provide an attractive vehicle for smaller accounts, which may increase the total assets under management by Dana and provide marginal cost efficiency. Based on the foregoing, the Board determined that the standards and practices of Dana relating to the identification and mitigation of potential conflicts of interest and the benefits to be realized by Dana in managing the Dana Funds were satisfactory.
After additional consideration of the factors discussed by counsel and further discussion among the Board members, the Board determined to approve the continuation of the Dana Agreements.
56
| FACTS | WHAT DO THE DANA FUNDS (the “FUNDS”) DO WITH YOUR PERSONAL INFORMATION? | |
| Why? | Financial companies choose how they share your personal information. Federal law gives consumers the right to limit some but not all sharing. Federal law also requires us to tell you how we collect, share, and protect your personal information. Please read this notice carefully to understand what we do. | |
| What? | The types of personal information we collect and share depend on the product or service you have with us. This information can include:
■ Social Security number
■ account balances and account transactions
■ transaction or loss history and purchase history
■ checking account information and wire transfer instructions
When you are no longer our customer, we continue to share your information as described in this notice. | |
| How? | All financial companies need to share customers’ personal information to run their everyday business. In the section below, we list the reasons financial companies can share their customers’ personal information; the reasons the Funds choose to share; and whether you can limit this sharing. | |
| Reasons we can share your personal information | Do the Funds share? | |
For our everyday business purposes — such as to process your transactions, maintain your account(s), respond to court orders and legal investigations, or report to credit bureaus | Yes | |
For our marketing purposes — to offer our products and services to you | No | |
| For joint marketing with other financial companies | No | |
For our affiliates’ everyday business purposes – information about your transactions and experiences | No | |
For our affiliates’ everyday business purposes – information about your creditworthiness | No | |
| For nonaffiliates to market to you | No | |
| Questions? | Call (855) 280-9648 | |
57
| Who we are | |
| Who is providing this notice? | Dana Funds Ultimus Fund Distributors, LLC (Distributor) Ultimus Fund Solutions, LLC (Administrator) |
| What we do | |
| How do the Funds protect my personal information? | To protect your personal information from unauthorized access and use, we use security measures that comply with federal law. These measures include computer safeguards and secured files and buildings. Our service providers are held accountable for adhering to strict policies and procedures to prevent any misuse of your nonpublic personal information. |
| How do the Funds collect my personal information? | We collect your personal information, for example, when you
■ open an account or deposit money
■ buy securities from us or sell securities to us
■ make deposits or withdrawals from your account
■ give us your account information
■ make a wire transfer
■ tell us who receives the money
■ tell us where to send the money
■ show your government-issued ID
■ show your driver’s license |
| Why can’t I limit all sharing? | Federal law gives you the right to limit only
■ sharing for affiliates’ everyday business purposes— information about your creditworthiness
■ affiliates from using your information to market to you
■ sharing for nonaffiliates to market to you
State laws and individual companies may give you additional rights to limit sharing. |
| Definitions | |
| Affiliates | Companies related by common ownership or control. They can be financial and nonfinancial companies.
■ Dana Investment Advisors, Inc., the investment adviser to the Funds, could be deemed to be an affiliate. |
| Nonaffiliates | Companies not related by common ownership or control. They can be financial and nonfinancial companies.
■ The Dana Funds do not share your personal information with nonaffiliates so they can market to you. |
| Joint marketing | A formal agreement between nonaffiliated financial companies that together market financial products or services to you.
■ The Dana Funds do not jointly market. |
58
PROXY VOTING
A description of the policies and procedures that each Fund uses to determine how to vote proxies relating to portfolio securities and information regarding how each Fund voted those proxies during the most recent twelve month period ended June 30, are available (1) without charge upon request by calling the Funds at (855) 280-9648 and (2) in Fund documents filed with the SEC on the SEC’s website at www.sec.gov.
| TRUSTEES Andrea N. Mullins, Chairperson Ira P. Cohen Mark J. Seger | INDEPENDENT REGISTERED PUBLIC ACCOUNTING FIRM Cohen & Company, Ltd. 1350 Euclid Avenue, Suite 800 Cleveland, OH 44115 |
| OFFICERS Matthew J. Miller, Principal Executive Officer and President Zachary P. Richmond, Principal Financial Officer and Treasurer N. Lynn Bowley, Chief Compliance Officer Carol J. Highsmith, Vice President and Secretary | LEGAL COUNSEL Troutman Pepper Hamilton Sanders LLP 3000 Two Logan Square 18th and Arch Streets Philadelphia, PA 19103 |
| INVESTMENT ADVISER Dana Investment Advisors, Inc. 20700 Swenson Drive, Suite 400 Waukesha, WI 53186 | CUSTODIAN Huntington National Bank 41 South High Street Columbus, OH 43215 |
| DISTRIBUTOR Ultimus Fund Distributors, LLC 225 Pictoria Drive, Suite 450 Cincinnati, OH 45246 | ADMINISTRATOR, TRANSFER AGENT AND FUND ACCOUNTANT Ultimus Fund Solutions, LLC 225 Pictoria Drive, Suite 450 Cincinnati, OH 45246 |
This report is intended only for the information of shareholders or those who have received the Funds’ prospectus which contains information about each Fund’s management fee and expenses. Please read the prospectus carefully before investing.
Distributed by Ultimus Fund Distributors, LLC, Member FINRA/SIPC
DANA-AR-23
Foundry Partners Small Cap Value Fund
Investor Class – DRSVX
Institutional Class – DRISX
Annual Report
October 31, 2023
Foundry Funds
c/o Ultimus Fund Solutions, LLC
225 Pictoria Drive, Suite 450
Cincinnati, Ohio 45246
(800) 247-1014
Management Discussion of Fund Performance (Unaudited)
October 31, 2023
Market Review
As we reflect on the past year, it’s evident that we’ve steered through a period of significant turbulence in the financial markets. This challenging landscape was shaped by a confluence of events, including a banking sector scare, a burgeoning boom in AI technology, and geopolitical unrest.
In a landscape where inflation has been a key player, we saw it retreat to more manageable levels, with October marking a year-over-year change of 3.2% — the lowest since March 2021. The Federal Reserve, responding to these shifting tides, paused their interest rate hikes, though inflation still hovers above their 2% target. Adding to the complexity, was the eruption of conflict in Gaza. This event late in the fiscal year has cast a pall over global markets akin to a sudden, darkening eclipse.
Portfolio Review
Amidst these headwinds, the Foundry Partners Small Cap Value Fund (formerly “Foundry Partners Fundamental Small Cap Value Fund”) stood resilient and adaptable. We are proud to report a return of 0.71% (Institutional Class) for the fiscal year ended October 31, 2023, significantly outpacing the Russell 2000® Value Index’s return of -9.93%. Our journey was not without its challenges, but it was marked by several successful ventures in our opinion. We discovered prosperous opportunities in sectors such as Financials, Technology, Industrials, Health Care, Consumer Discretionary, Materials, Real Estate, and Utilities. However, our voyage also encountered headwinds, particularly in Energy, Consumer Staples, and Communications, which proved to be the more challenging sectors for us.
A pivotal decision in our voyage was the early reduction of our holdings in bank stocks. Anticipating the implications of the Federal Reserve’s move towards normalized interest rates, we foresaw potential increases in reserves for bad loans, which could dampen bank earnings. Our proactive strategy proved advantageous, enabling us to circumvent the turmoil of the March 2023 bank run. Capitalizing on this strategic exit, we reallocated resources, focusing on attractive opportunities in the Technology sector. This realignment yielded fruitful returns, contributing to our overall robust performance.
Energy, however, presented a complex challenge. Despite our substantial allocation in this sector, individual stock performance was underwhelming. Nonetheless, we recognize the ongoing potential in the energy market, especially given the global energy dynamics shaped by the conflicts in Ukraine and now Gaza. With oil prices oscillating between $67
1
Management Discussion of Fund Performance (Unaudited) (continued)
October 31, 2023
and $92 per barrel, we remain vigilant for opportunities, especially as colder weather may trigger a surge in prices.
The past year, replete with its myriad challenges, has been a testament to our Fund’s strategic acumen and proactive management. As we chart our course into the future, we are committed to navigating these ever-evolving financial waters with the same dedication and strategic foresight that we feel has served us well thus far.
The Fund’s performance quoted is past performance and does not guarantee future results. The investment return and principal value of an investment in the Fund will fluctuate so that an investor’s shares, when redeemed, may be worth more or less than their original cost. Current performance of the Fund may be lower or higher than the performance quoted. Performance data current to the most recent month end may be obtained by calling 1-800-247-1014. Information provided with respect to the Fund’s Portfolio Holdings, Sector Weightings and Number of Holdings are as of October 31, 2023 and are subject to change at any time.
Value stocks may remain undervalued for extended periods of time and the market may not recognize the intrinsic value of these securities.
Micro cap and small cap investing involves greater risk not associated with investing in more established companies, such as greater price volatility, business risk, less liquidity and increased competitive threat.
The opinions expressed are those of the investment management team and are subject to change without notice, as are statements of financial market trends, which are based on current conditions. Under no circumstances does the information contained within represent a recommendation to buy, hold or sell any security and it should not be assumed that the companies discussed were, or will prove to be, profitable. Current and future holdings are subject to risk.
2
Investment Results (Unaudited)
Average Annual Total Returns(a) as of October 31, 2023
| One Year | Three Year | Five Year | Ten Year | |
| Foundry Partners Small Cap Value Fund | ||||
| Investor Class | 0.43% | 16.10% | 6.31% | 6.35% |
| Institutional Class | 0.71% | 16.40% | 6.58% | 6.62% |
| Russell 2000® Value Index(b) | (9.93)% | 9.73% | 3.26% | 5.20% |
| Expense Ratios(c) | ||||
| Investor | Institutional | |||
| Class | Class | |||
| Gross | 1.29% | 1.04% | ||
| With Applicable Waivers | 1.25% | 1.00% | ||
The investment return and principal value of an investment will fluctuate so that an investor’s shares, when redeemed, may be worth more or less than their original cost. The returns shown do not reflect deduction of taxes that a shareholder would pay on Foundry Partners Small Cap Value Fund (the “Fund”) distributions or the redemption of Fund shares. THE FUND’S RETURNS REPRESENT PAST PERFORMANCE AND DO NOT PREDICT FUTURE RESULTS. The returns shown are net of all recurring expenses. Current performance of the Fund may be lower or higher than the performance quoted. For more information on the Fund, and to obtain performance data current to the most recent month end, or to request a prospectus, please call 1-800-247-1014.
You should carefully consider the investment objectives, potential risk, management fees, and charges and expenses of the Fund before investing. The Fund’s prospectus contains this and other information about the Fund and should be read carefully before investing.
| (a) | Average annual total returns reflect any change in price per share and assume the reinvestment of all distributions. The Fund’s returns reflect any fee reductions during the applicable periods. If such fee reductions had not occurred, the quoted performance would have been lower. |
| (b) | The Russell 2000® Value Index (“Index”) is an unmanaged benchmark that assumes reinvestment of all distributions and excludes the effect of taxes and fees. The Index is a widely recognized unmanaged index of equity prices and is representative of a broader market and range of securities than are found in the Fund’s portfolio. Individuals cannot invest directly in the Index; however, an individual can invest in exchange-traded funds or other investment vehicles that attempt to track the performance of a benchmark index. |
| (c) | The expense ratios are from the Fund’s prospectus dated February 28, 2023. Foundry Partners, LLC (the “Adviser”) has contractually agreed to waive its management fee and/or reimburse certain Fund operating expenses, but only to the extent necessary so that the Fund’s net expenses, excluding brokerage fees and commissions, borrowing costs (such as interest and dividend expenses on securities sold short), taxes, distribution and service (12b-1) fees, extraordinary expenses and indirect expenses (such as fees and expenses of acquired funds), does not exceed 0.99% of the Fund’s average daily net assets. The contractual agreement is effective through February 29, 2024. This contractual arrangement may only be terminated by mutual consent of the Adviser and the Board of Trustees, and it will automatically terminate upon the termination of the investment advisory |
3
Investment Results (Unaudited) (continued)
agreement between the Trust and the Adviser. Each waiver or reimbursement of an expense by the Adviser is subject to repayment by the Fund within the three years following the date of such waiver or reimbursement, provided that the Fund is able to make the repayment without exceeding the expense limitation in place at the time of the waiver or reimbursement, and the expense limitation in place at the time of the repayment. Information pertaining to the Fund’s expense ratios as of October 31, 2023 can be found in the financial highlights.
The Fund is distributed by Ultimus Fund Distributors, LLC, member FINRA/SIPC.
4
Investment Results (Unaudited) (continued)
Comparison of the Growth of a $100,000 Investment in the Foundry Partners Small Cap Value Fund, Institutional Class and the Russell 2000® Value Index.
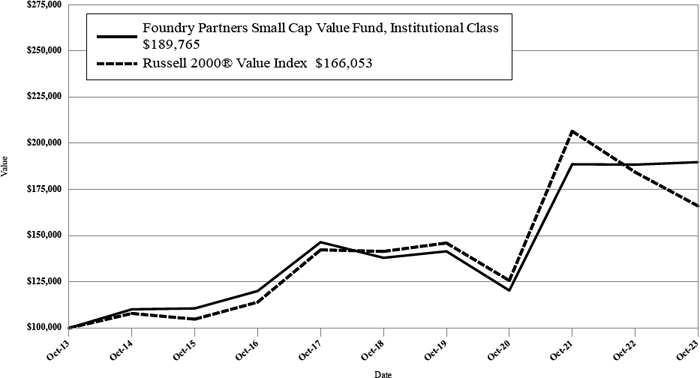
The chart above assumes an initial investment of $100,000 made on October 31, 2013 and held through October 31, 2023. THE FUND’S RETURN REPRESENTS PAST PERFORMANCE AND DOES NOT PREDICT FUTURE RESULTS. Investment returns and principal values will fluctuate so that Fund shares, when redeemed, may be worth more or less than their original purchase price. Current performance may be lower or higher than the performance data quoted.
For more information on the Fund, and to obtain performance data current to the most recent month end, or to request a prospectus, please call (800) 247-1014. You should carefully consider the investment objectives, potential risk, management fees, and charges and expenses of the Fund before investing. The Fund’s prospectus contains important information about the Fund’s investment objectives, potential risks, management fees, charges and expenses, and other information and should be read carefully before investing.
The Fund is distributed by Ultimus Fund Distributors, LLC, Member FINRA/SIPC.
5
Fund Holdings (Unaudited)
Foundry Partners Small Cap Value Fund Portfolio Analysis as of October 31, 2023(a)
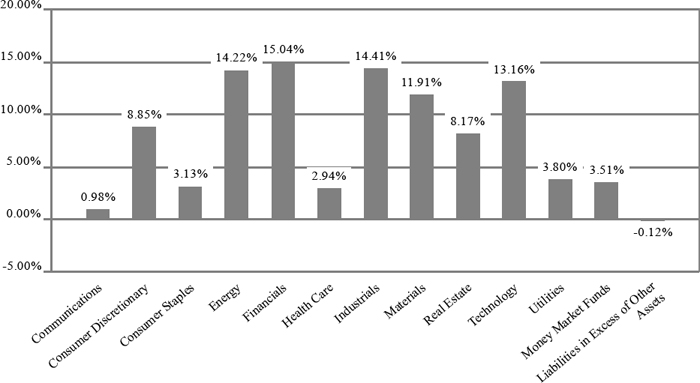
| (a) | As a percentage of net assets. |
Availability of Portfolio Schedule (Unaudited)
The Fund files its complete schedule of portfolio holdings with the Securities and Exchange Commission (“SEC”) for the first and third quarters of each fiscal year as an exhibit to its reports on Form N-PORT. The Fund’s Form N-PORT reports are available on the SEC’s website at http://www. sec.gov and on the Fund’s website at www.foundrypartnersllc.com.
6
| Foundry Partners Small Cap Value Fund |
| Schedule of Investments |
| October 31, 2023 |
| COMMON STOCKS — 96.61% | Shares | Fair Value | ||||||
| Communications — 0.98% | ||||||||
| Stagwell, Inc., Class A(a) | 552,280 | $ | 2,275,394 | |||||
| Consumer Discretionary — 8.85% | ||||||||
| Bloomin’ Brands, Inc. | 130,644 | 3,049,231 | ||||||
| Build-A-Bear Workshop, Inc. | 81,838 | 2,029,582 | ||||||
| Group 1 Automotive, Inc. | 16,248 | 4,099,858 | ||||||
| Guess?, Inc. | 174,282 | 3,747,063 | ||||||
| Hudson Technologies, Inc.(a) | 251,906 | 3,244,549 | ||||||
| KB Home | 59,388 | 2,624,950 | ||||||
| Movado Group, Inc. | 63,729 | 1,775,490 | ||||||
| 20,570,723 | ||||||||
| Consumer Staples — 3.13% | ||||||||
| Coca-Cola Consolidated, Inc. | 6,192 | 3,940,651 | ||||||
| Primo Water Corp. | 255,099 | 3,331,593 | ||||||
| 7,272,244 | ||||||||
| Energy — 14.22% | ||||||||
| Berry Corp. | 479,948 | 4,007,566 | ||||||
| Chord Energy Corp. | 33,160 | 5,482,010 | ||||||
| Comstock Resources, Inc. | 351,957 | 4,434,658 | ||||||
| Enerplus Corp. | 312,391 | 5,282,532 | ||||||
| Murphy Oil Corp. | 87,034 | 3,905,216 | ||||||
| Oil States International, Inc.(a) | 442,958 | 3,215,875 | ||||||
| Vermilion Energy, Inc. | 255,383 | 3,682,623 | ||||||
| World Fuel Services Corp. | 165,381 | 3,059,549 | ||||||
| 33,070,029 | ||||||||
| Financials — 15.04% | ||||||||
| Associated Banc-Corp | 197,237 | 3,197,212 | ||||||
| Enact Holdings, Inc. | 84,633 | 2,332,485 | ||||||
| Enova International, Inc.(a) | 92,994 | 3,708,601 | ||||||
| Genworth Financial, Inc., Class A(a) | 485,340 | 2,907,187 | ||||||
| Hancock Whitney Corp. | 140,392 | 4,833,697 | ||||||
| Hope Bancorp, Inc. | 323,719 | 2,835,778 | ||||||
| MGIC Investment Corp. | 293,680 | 4,945,571 | ||||||
| Sandy Spring Bancorp, Inc. | 162,337 | 3,319,792 | ||||||
| Valley National Bancorp | 428,568 | 3,334,259 | ||||||
| Victory Capital Holdings, Inc., Class A | 121,553 | 3,580,951 | ||||||
| 34,995,533 | ||||||||
| Health Care — 2.94% | ||||||||
| Avanos Medical, Inc.(a) | 131,356 | 2,411,696 | ||||||
| Select Medical Holdings Corp. | 194,321 | 4,416,916 | ||||||
| 6,828,612 | ||||||||
| Industrials — 14.41% | ||||||||
| Allison Transmission Holdings, Inc. | 83,388 | 4,204,423 | ||||||
| Covenant Logistics Group, Inc. | 49,598 | 1,958,377 | ||||||
| Cross Country Healthcare, Inc.(a) | 125,476 | 2,906,024 | ||||||
| Danaos, Corp. | 57,250 | 3,793,385 | ||||||
| Hillenbrand, Inc. | 114,583 | 4,357,592 | ||||||
See accompanying notes which are an integral part of these financial statements.
7
| Foundry Partners Small Cap Value Fund |
| Schedule of Investments (continued) |
| October 31, 2023 |
| COMMON STOCKS — 96.61% - continued | Shares | Fair Value | ||||||
| Industrials — 14.41% - continued | ||||||||
| Moog, Inc., Class A | 41,801 | $ | 4,851,006 | |||||
| Oshkosh Corp. | 25,314 | 2,220,797 | ||||||
| Primoris Services Corp. | 113,133 | 3,400,778 | ||||||
| SMART Global Holdings, Inc.(a) | 128,184 | 1,756,121 | ||||||
| Timken Co. (The) | 58,883 | 4,069,993 | ||||||
| 33,518,496 | ||||||||
| Materials — 11.91% | ||||||||
| AdvanSix, Inc. | 106,336 | 2,929,557 | ||||||
| Alamos Gold, Inc., Class A | 378,987 | 4,691,859 | ||||||
| Hudbay Minerals, Inc. | 709,117 | 3,091,750 | ||||||
| Minerals Technologies, Inc. | 69,416 | 3,752,629 | ||||||
| Pan American Silver Corp. | 218,919 | 3,198,407 | ||||||
| Sonoco Products Co. | 48,488 | 2,512,163 | ||||||
| UFP Industries, Inc. | 33,838 | 3,220,362 | ||||||
| Warrior Met Coal, Inc. | 88,231 | 4,299,497 | ||||||
| 27,696,224 | ||||||||
| Real Estate — 8.17% | ||||||||
| Apple Hospitality REIT, Inc. | 210,759 | 3,304,702 | ||||||
| CoreCivic, Inc.(a) | 417,661 | 5,304,294 | ||||||
| Empire State Realty Trust, Inc., Class A | 549,910 | 4,448,772 | ||||||
| Newmark Group, Inc., Class A | 483,846 | 2,743,407 | ||||||
| Whitestone REIT | 322,391 | 3,207,790 | ||||||
| 19,008,965 | ||||||||
| Technology — 13.16% | ||||||||
| Adeia, Inc. | 349,383 | 2,945,298 | ||||||
| Celestica, Inc.(a) | 64,397 | 1,503,670 | ||||||
| Cohu, Inc.(a) | 109,878 | 3,311,723 | ||||||
| Diodes, Inc.(a) | 48,944 | 3,185,276 | ||||||
| Photronics, Inc.(a) | 172,549 | 3,168,000 | ||||||
| Sanmina Corp.(a) | 87,127 | 4,432,150 | ||||||
| Sapiens International Corp. N.V. | 78,925 | 2,012,588 | ||||||
| Science Applications International Corp. | 49,346 | 5,390,557 | ||||||
| Vishay Intertechnology, Inc. | 209,327 | 4,655,432 | ||||||
| 30,604,694 | ||||||||
| Utilities — 3.80% | ||||||||
| National Fuel Gas Co. | 119,159 | 6,071,151 | ||||||
| Suburban Propane Partners, L.P. | 156,754 | 2,757,303 | ||||||
| 8,828,454 | ||||||||
| Total Common Stocks (Cost $218,460,348) | 224,669,368 | |||||||
See accompanying notes which are an integral part of these financial statements.
8
| Foundry Partners Small Cap Value Fund |
| Schedule of Investments (continued) |
| October 31, 2023 |
| MONEY MARKET FUNDS - 3.51% | Shares | Fair Value | ||||||
| Federated Hermes Government Obligations Fund, Institutional Class, 5.22%(b) | 8,170,709 | $ | 8,170,709 | |||||
| Total Money Market Funds (Cost $8,170,709) | 8,170,709 | |||||||
| Total Investments — 100.12% (Cost $226,631,057) | 232,840,077 | |||||||
| Liabilities in Excess of Other Assets — (0.12)% | (288,654 | ) | ||||||
| NET ASSETS — 100.00% | $ | 232,551,423 | ||||||
| (a) | Non-income producing security. |
| (b) | Rate disclosed is the seven day effective yield as of October 31, 2023. |
REIT- Real Estate Investment Trust
See accompanying notes which are an integral part of these financial statements.
9
| Foundry Partners Small Cap Value Fund |
| Statement of Assets and Liabilities |
| October 31, 2023 |
| Assets | ||||
| Investments in securities at fair value (cost $226,631,057) (Note 3) | $ | 232,840,077 | ||
| Receivable for fund shares sold | 132,417 | |||
| Dividends receivable | 74,606 | |||
| Prepaid expenses | 21,442 | |||
| Total Assets | 233,068,542 | |||
| Liabilities | ||||
| Payable for fund shares redeemed | 302,149 | |||
| Payable to Adviser (Note 4) | 157,255 | |||
| Accrued distribution (12b-1) fees | 2,407 | |||
| Payable to Administrator (Note 4) | 23,162 | |||
| Payable to trustees | 2,000 | |||
| Other accrued expenses | 30,146 | |||
| Total Liabilities | 517,119 | |||
| Net Assets | $ | 232,551,423 | ||
| Net Assets consist of: | ||||
| Paid-in capital | $ | 199,903,337 | ||
| Accumulated earnings | 32,648,086 | |||
| Net Assets | $ | 232,551,423 | ||
| Investor Class: | ||||
| Net Assets | $ | 11,091,608 | ||
| Shares outstanding | 544,946 | |||
| Net asset value, offering and redemption price per share (Note 2) | $ | 20.35 | ||
| Institutional Class: | ||||
| Net Assets | $ | 221,459,815 | ||
| Shares outstanding | 10,814,080 | |||
| Net asset value, offering and redemption price per share (Note 2) | $ | 20.48 |
See accompanying notes which are an integral part of these financial statements.
10
| Foundry Partners Small Cap Value Fund |
| Statement of Operations |
| For the Year Ended October 31, 2023 |
| Investment Income | ||||
| Dividend income (net of foreign taxes withheld of $42,390) | $ | 5,963,850 | ||
| Total investment income | 5,963,850 | |||
| Expenses | ||||
| Investment Adviser fees (Note 4) | 2,034,210 | |||
| Administration fees (Note 4) | 163,417 | |||
| Fund accounting fees (Note 4) | 62,404 | |||
| Registration expenses | 46,609 | |||
| Custodian fees | 30,882 | |||
| Distribution (12b-1), Investor Class | 29,789 | |||
| Transfer agent fees (Note 4) | 24,588 | |||
| Legal fees | 22,434 | |||
| Printing and postage expenses | 21,949 | |||
| Audit and tax preparation fees | 18,830 | |||
| Compliance service fees (Note 4) | 9,015 | |||
| Trustee fees | 7,753 | |||
| Insurance expenses | 6,230 | |||
| Overdraft fees | 428 | |||
| Miscellaneous expenses | 40,785 | |||
| Total expenses | 2,519,323 | |||
| Fees contractually waived by Adviser | (104,205 | ) | ||
| Net operating expenses | 2,415,118 | |||
| Net investment income | 3,548,732 | |||
| Net Realized and Change in Unrealized Gain (Loss) on Investments | ||||
| Net realized gain on investment securities transactions | 24,517,700 | |||
| Net realized loss on foreign currency transactions | (19 | ) | ||
| Net change in unrealized depreciation of investment securities and foreign currency translations | (25,792,835 | ) | ||
| Net realized and change in unrealized loss on investments | (1,275,154 | ) | ||
| Net increase in net assets resulting from operations | $ | 2,273,578 |
See accompanying notes which are an integral part of these financial statements.
11
| Foundry Partners Small Cap Value Fund |
| Statements of Changes in Net Assets |
| For the | For the | |||||||
| Year Ended | Year Ended | |||||||
| October 31, | October 31, | |||||||
| 2023 | 2022 | |||||||
| Increase (Decrease) in Net Assets due to: | ||||||||
| Operations | ||||||||
| Net investment income | $ | 3,548,732 | $ | 2,116,808 | ||||
| Net realized gain on investment securities transactions and foreign currency transactions | 24,517,681 | 22,742,813 | ||||||
| Net change in unrealized depreciation of investment securities and foreign currency translations | (25,792,835 | ) | (25,312,055 | ) | ||||
| Net increase (decrease) in net assets resulting from operations | 2,273,578 | (452,434 | ) | |||||
| Distributions to Shareholders From Earnings (Note 2) | ||||||||
| Investor Class | (1,234,139 | ) | (1,829,560 | ) | ||||
| Institutional Class | (24,191,148 | ) | (35,166,584 | ) | ||||
| Total Distributions | (25,425,287 | ) | (36,996,144 | ) | ||||
| Capital Transactions - Investor Class | ||||||||
| Proceeds from shares sold | 859,252 | 427,784 | ||||||
| Reinvestment of distributions | 1,216,320 | 1,803,645 | ||||||
| Amount paid for shares redeemed | (1,823,827 | ) | (2,121,276 | ) | ||||
| Total Capital Transactions - Investor Class | 251,745 | 110,153 | ||||||
| Capital Transactions - Institutional Class | ||||||||
| Proceeds from shares sold | 30,368,927 | 22,789,789 | ||||||
| Reinvestment of distributions | 23,535,633 | 34,018,201 | ||||||
| Amount paid for shares redeemed | (47,039,458 | ) | (53,656,851 | ) | ||||
| Total Capital Transactions - Institutional Class | 6,865,102 | 3,151,139 | ||||||
| Net increase in net assets resulting from capital transactions | 7,116,847 | 3,261,292 | ||||||
| Total Decrease in Net Assets | (16,034,862 | ) | (34,187,286 | ) | ||||
| Net Assets | ||||||||
| Beginning of year | 248,586,285 | 282,773,571 | ||||||
| End of year | $ | 232,551,423 | $ | 248,586,285 | ||||
| Share Transactions - Investor Class | ||||||||
| Shares sold | 40,338 | 18,536 | ||||||
| Shares issued in reinvestment of distributions | 60,938 | 76,491 | ||||||
| Shares redeemed | (87,142 | ) | (91,262 | ) | ||||
| Total Share Transactions - Investor Class | 14,134 | 3,765 | ||||||
| Share Transactions - Institutional Class | ||||||||
| Shares sold | 1,430,404 | 987,033 | ||||||
| Shares issued in reinvestment of distributions | 1,174,433 | 1,437,186 | ||||||
| Shares redeemed | (2,186,910 | ) | (2,257,766 | ) | ||||
| Total Share Transactions - Institutional Class | 417,927 | 166,453 | ||||||
See accompanying notes which are an integral part of these financial statements.
12
| Foundry Partners Small Cap Value Fund - Investor Class |
| Financial Highlights |
| (For a share outstanding during each year) |
| For the Years Ended October 31, | ||||||||||||||||||||
| 2023 | 2022 | 2021 | 2020 | 2019 | ||||||||||||||||
| Selected Per Share Data | ||||||||||||||||||||
| Net asset value, beginning of year | $ | 22.63 | $ | 26.16 | $ | 16.85 | $ | 20.55 | $ | 22.11 | ||||||||||
| Investment operations: | ||||||||||||||||||||
| Net investment income | 0.28 | 0.14 | 0.17 | 0.18 | 0.25 | |||||||||||||||
| Net realized and unrealized gain (loss) on investments | (0.23 | ) | (0.10 | ) | 9.30 | (3.15 | ) | (0.03 | ) | |||||||||||
| Total from investment operations | 0.05 | 0.04 | 9.47 | (2.97 | ) | 0.22 | ||||||||||||||
| Less distributions to shareholders from: | ||||||||||||||||||||
| Net investment income | (0.17 | ) | (0.13 | ) | (0.16 | ) | (0.26 | ) | (0.08 | ) | ||||||||||
| Net realized gains | (2.16 | ) | (3.44 | ) | — | (0.47 | ) | (1.70 | ) | |||||||||||
| Total distributions | (2.33 | ) | (3.57 | ) | (0.16 | ) | (0.73 | ) | (1.78 | ) | ||||||||||
| Net asset value, end of year | $ | 20.35 | $ | 22.63 | $ | 26.16 | $ | 16.85 | $ | 20.55 | ||||||||||
| Total Return(a) | 0.43 | % | (0.40 | )% | 56.45 | % | (15.17 | )% | 2.28 | % | ||||||||||
| Ratios and Supplemental Data: | ||||||||||||||||||||
| Net assets, end of year (000 omitted) | $ | 11,092 | $ | 12,010 | $ | 13,785 | $ | 12,443 | $ | 21,048 | ||||||||||
| Ratio of expenses to average net assets before waiver | 1.29 | % | 1.28 | % | 1.28 | % | 1.32 | % | 1.32 | % | ||||||||||
| Ratio of expenses to average net assets after waiver | 1.25 | % | 1.28 | % | 1.28 | % | 1.32 | % | 1.32 | % | ||||||||||
| Ratio of net investment income to average net assets | 1.26 | % | 0.59 | % | 0.56 | % | 0.90 | % | 1.15 | % | ||||||||||
| Portfolio turnover rate(b) | 115.98 | % | 54.76 | % | 72.73 | % | 60.56 | % | 47.17 | % | ||||||||||
| (a) | Total return represents the rate that the investor would have earned or lost on an investment in the Fund, assuming reinvestment of dividends. |
| (b) | Portfolio turnover is calculated on the basis of the Fund as a whole without distinguishing among the classes of shares. |
See accompanying notes which are an integral part of these financial statements.
13
| Foundry Partners Small Cap Value Fund - Institutional Class |
| Financial Highlights |
| (For a share outstanding during each year) |
| For the Years Ended October 31, | ||||||||||||||||||||
| 2023 | 2022 | 2021 | 2020 | 2019 | ||||||||||||||||
| Selected Per Share Data | ||||||||||||||||||||
| Net asset value, beginning of year | $ | 22.76 | $ | 26.29 | $ | 16.94 | $ | 20.66 | $ | 22.24 | ||||||||||
| Investment operations: | ||||||||||||||||||||
| Net investment income | 0.33 | 0.21 | 0.18 | 0.21 | 0.27 | |||||||||||||||
| Net realized and unrealized gain (loss) on investments | (0.22 | ) | (0.10 | ) | 9.38 | (3.14 | ) | — | (a) | |||||||||||
| Total from investment operations | 0.11 | 0.11 | 9.56 | (2.93 | ) | 0.27 | ||||||||||||||
| Less distributions to shareholders from: | ||||||||||||||||||||
| Net investment income | (0.23 | ) | (0.20 | ) | (0.21 | ) | (0.32 | ) | (0.15 | ) | ||||||||||
| Net realized gains | (2.16 | ) | (3.44 | ) | — | (0.47 | ) | (1.70 | ) | |||||||||||
| Total distributions | (2.39 | ) | (3.64 | ) | (0.21 | ) | (0.79 | ) | (1.85 | ) | ||||||||||
| Net asset value, end of year | $ | 20.48 | $ | 22.76 | $ | 26.29 | $ | 16.94 | $ | 20.66 | ||||||||||
| Total Return(b) | 0.71 | % | (0.11 | )% | 56.77 | % | (14.97 | )% | 2.55 | % | ||||||||||
| Ratios and Supplemental Data: | ||||||||||||||||||||
| Net assets, end of year (000 omitted) | $ | 221,460 | $ | 236,576 | $ | 268,989 | $ | 182,343 | $ | 173,600 | ||||||||||
| Ratio of expenses to average net assets before waiver | 1.04 | % | 1.03 | % | 1.03 | % | 1.07 | % | 1.07 | % | ||||||||||
| Ratio of expenses to average net assets after waiver | 1.00 | % | 1.03 | % | 1.03 | % | 1.07 | % | 1.07 | % | ||||||||||
| Ratio of net investment income to average net assets | 1.50 | % | 0.84 | % | 0.80 | % | 1.16 | % | 1.34 | % | ||||||||||
| Portfolio turnover rate(c) | 115.98 | % | 54.76 | % | 72.73 | % | 60.56 | % | 47.17 | % | ||||||||||
| (a) | Rounds to less than $0.005 per share. |
| (b) | Total return represents the rate that the investor would have earned or lost on an investment in the Fund, assuming reinvestment of dividends. |
| (c) | Portfolio turnover is calculated on the basis of the Fund as a whole without distinguishing among the classes of shares. |
See accompanying notes which are an integral part of these financial statements.
14
| Foundry Partners Small Cap Value Fund |
| Notes to the Financial Statements |
| October 31, 2023 |
NOTE 1. ORGANIZATION
The Foundry Partners Small Cap Value Fund (the “Fund”) (formerly “Foundry Partners Fundamental Small Cap Value Fund”) is registered under the Investment Company Act of 1940, as amended (“1940 Act”), as an open-end diversified series of Valued Advisers Trust (the “Trust”). The Trust is a management investment company established under the laws of Delaware by an Agreement and Declaration of Trust dated June 13, 2008 (the “Trust Agreement”). The Trust Agreement permits the Board of Trustees (the “Board”) to issue an unlimited number of shares of beneficial interest of separate series without par value. The Fund is one of a series of funds authorized by the Board. The Fund’s investment adviser is Foundry Partners, LLC (the “Adviser”). The investment objective of the Fund is long-term capital appreciation.
The Fund currently offers Investor Class shares and Institutional Class shares. Each share represents an equal proportionate interest in the assets and liabilities belonging to the applicable class of the Fund and is entitled to such dividends and distributions out of income belonging to the applicable class of the Fund as are declared by the Board. On matters that affect the Fund as a whole, each class has the same voting and other rights and preferences as any other class. On matters that affect only one class, only shareholders of that class may vote. The Fund may offer additional classes of shares in the future.
NOTE 2. SIGNIFICANT ACCOUNTING POLICIES
The Fund is an investment company and follows accounting and reporting guidance under Financial Accounting Standards Board Accounting Standards Codification (“ASC”) Topic 946, “Financial Services-Investment Companies”. The following is a summary of significant accounting policies followed by the Fund in the preparation of its financial statements. These policies are in conformity with generally accepted accounting principles in the United States of America (“GAAP”).
Regulatory Update – Tailored Shareholder Reports for Mutual Funds and Exchange-Traded Funds (“ETFs”) – Effective January 24, 2023, the SEC adopted rule and form amendments to require mutual funds and ETFs to transmit concise and visually engaging streamlined annual and semiannual reports to shareholders that highlight key information. Other information, including financial statements, will no longer appear in a streamlined shareholder report but must be available online, delivered free of charge upon request, and filed on a semiannual basis on Form N-CSR. The rule and form amendments have a compliance date of July 24, 2024. At this time, management is evaluating the impact of these amendments on the shareholder reports for the Fund.
15
| Foundry Partners Small Cap Value Fund |
| Notes to the Financial Statements (continued) |
| October 31, 2023 |
Estimates – The preparation of financial statements in conformity with GAAP requires management to make estimates and assumptions that affect the reported amounts of assets and liabilities and disclosure of contingent assets and liabilities at the date of the financial statements and the reported amounts of increases and decreases in net assets from operations during the reporting period. Actual results could differ from those estimates.
Federal Income Taxes – The Fund makes no provision for federal income or excise tax. The Fund has qualified and intends to qualify each year as a regulated investment company (“RIC”) under subchapter M of the Internal Revenue Code of 1986, as amended, by complying with the requirements applicable to RICs and by distributing substantially all of its taxable income. The Fund also intends to distribute sufficient net investment income and net realized capital gains, if any, so that it will not be subject to excise tax on undistributed income and gains. If the required amount of net investment income or gains is not distributed, the Fund could incur a tax expense.
As of and during the fiscal year ended October 31, 2023, the Fund did not have any liabilities for any unrecognized tax benefits. The Fund recognizes interest and penalties, if any, related to unrecognized tax benefits as income tax expense on the Statement of Operations when incurred. During the fiscal year ended October 31, 2023, the Fund did not incur any interest or penalties. Management of the Fund has reviewed tax positions taken in tax years that remain subject to examination by all major tax jurisdictions, including federal (i.e., the last three tax year ends and the interim tax period since then, as applicable). Management believes that there is no tax liability resulting from unrecognized tax benefits related to uncertain tax positions taken.
Expenses – Expenses incurred by the Trust that do not relate to a specific fund of the Trust are allocated to the individual funds based on each fund’s relative net assets or another appropriate basis (as determined by the Board). Expenses specifically attributable to any class are borne by that class. Income, realized gains and losses, unrealized appreciation and depreciation, and fund-wide expenses not allocated to a particular class shall be allocated to each class based on the net assets of that class in relation to the net assets of the entire fund.
Security Transactions and Related Income – The Fund follows industry practice and records security transactions on the trade date for financial reporting purposes. The specific identification method is used for determining gains or losses for financial statement and income tax purposes. Dividend income is recorded on the ex-dividend date. Non-cash income, if any, is recorded at the fair market value of the securities received. Withholding taxes on foreign dividends, if any, have been provided for in accordance with the Fund’s understanding of the applicable country’s tax rules and rates.
16
| Foundry Partners Small Cap Value Fund |
| Notes to the Financial Statements (continued) |
| October 31, 2023 |
The Fund holds Real Estate Investment Trusts (“REITs”) which pay dividends to their shareholders based upon available funds from operations. It is possible for these dividends to exceed the REIT’s underlying taxable earnings and profits resulting in the excess portion of such dividends being designated as a return of capital. Distributions received from REITs that represent a return of capital or capital gains are recorded as a reduction of the cost of the REITs or as a realized gain, respectively.
Dividends and Distributions – The Fund intends to distribute its net investment income and net realized long-term and short-term capital gains, if any, at least annually. Dividends and distributions to shareholders, which are determined in accordance with income tax regulations, are recorded on the ex-dividend date. The treatment for financial reporting purposes of distributions made to shareholders during the period from net investment income or net realized capital gains may differ from their ultimate treatment for federal income tax purposes. These differences are caused primarily by differences in the timing of the recognition of certain components of income, expense or realized capital gain for federal income tax purposes. Where such differences are permanent in nature, they are reclassified among the components of net assets based on their ultimate characterization for federal income tax purposes. Any such reclassifications will have no effect on net assets, results of operations or net asset value (“NAV”) per share of the Fund.
For the fiscal year ended October 31, 2023, the Fund made the following reclassifications to increase (decrease) the components of net assets:
| Accumulated Earnings | ||||||
| Paid-In Capital | (Deficit) | |||||
| $ | (2,478 | ) | $ | 2,478 | ||
Share Valuation – The NAV is calculated each day the New York Stock Exchange (the “NYSE”) is open by dividing the total value of the Fund’s assets, less liabilities, by the number of shares outstanding for the Fund.
Other - The Securities and Exchange Commission (“SEC”) adopted Rule 18f-4 under the 1940 Act which, effective August 19, 2022, regulates the use of derivatives for certain funds registered under the 1940 Act (“Rule 18f-4”). The Trust has adopted a Rule 18f-4 Policy which provides, among other things, that unless a Fund qualifies as a “limited derivatives user” as defined in Rule 18f-4, the Fund is required to establish and maintain a comprehensive derivatives risk management program, subject to oversight by the Board, to appoint a derivatives risk manager, to comply with certain value-at-risk based leverage limits and to provide additional disclosure both publicly and to the SEC regarding its derivatives positions. If a fund qualifies as a limited derivatives user, Rule 18f-4 requires the fund to have policies and procedures to manage its aggregate derivatives risk. The
17
| Foundry Partners Small Cap Value Fund |
| Notes to the Financial Statements (continued) |
| October 31, 2023 |
Fund has not qualified as a limited derivatives user and is currently complying with Rule 18f-4.
NOTE 3. SECURITIES VALUATION AND FAIR VALUE MEASUREMENTS
The Fund values its portfolio securities at fair value as of the close of regular trading on the NYSE (normally 4:00 p.m. Eastern time) on each business day the NYSE is open for business. Fair value is defined as the price that the Fund would receive upon selling an investment in a timely transaction to an independent buyer in the principal or most advantageous market of the investment. GAAP establishes a three-tier hierarchy to maximize the use of observable market data and minimize the use of unobservable inputs and to establish classification of fair value measurements for disclosure purposes.
Inputs refer broadly to the assumptions that market participants would use in pricing the asset or liability, including assumptions about risk (the risk inherent in a particular valuation technique used to measure fair value including a pricing model and/or the risk inherent in the inputs to the valuation technique). Inputs may be observable or unobservable. Observable inputs are inputs that reflect the assumptions market participants would use in pricing the asset or liability developed based on market data obtained and available from sources independent of the reporting entity. Unobservable inputs are inputs that reflect the reporting entity’s own assumptions about the assumptions market participants would use in pricing the asset or liability developed based on the best information available in the circumstances.
Various inputs are used in determining the value of the Fund’s investments. These inputs are summarized in the three broad levels listed below.
| ● | Level 1 – unadjusted quoted prices in active markets for identical investments and/or registered investment companies where the value per share is determined and published and is the basis for current transactions for identical assets or liabilities at the valuation date |
| ● | Level 2 – other significant observable inputs (including, but not limited to, quoted prices for an identical security in an inactive market, quoted prices for similar securities, interest rates, prepayment speeds, credit risk, etc.) |
| ● | Level 3 – significant unobservable inputs (including the Fund’s own assumptions in determining fair value of investments based on the best information available) |
The inputs used to measure fair value may fall into different levels of the fair value hierarchy. In such cases, for disclosure purposes, the level in the fair value hierarchy which
18
| Foundry Partners Small Cap Value Fund |
| Notes to the Financial Statements (continued) |
| October 31, 2023 |
is reported is determined based on the lowest level input that is significant to the fair value measurement in its entirety.
Equity securities that are traded on any stock exchange are generally valued at the last quoted sale price on the security’s primary exchange. Lacking a last sale price, an exchange-traded security is generally valued at its last bid price. Securities traded in the Nasdaq over-the-counter market are generally valued at the Nasdaq Official Closing Price. When using the market quotations and when the market is considered active, the security is classified as a Level 1 security. In the event that market quotations are not readily available or are considered unreliable due to market or other events, securities are valued in good faith by the Adviser as “Valuation Designee” under the oversight of the Board. The Adviser has adopted written policies and procedures for valuing securities and other assets in circumstances where market quotes are not readily available. In the event that market quotes are not readily available, and the security or asset cannot be valued pursuant to one of the valuation methods, the value of the security or asset will be determined in good faith by the Adviser pursuant to its policies and procedures. On a quarterly basis, the Adviser’s fair valuation determinations will be reviewed by the Board. Under these policies, the securities will be classified as Level 2 or 3 within the fair value hierarchy, depending on the inputs used.
Investments in mutual funds, including money market mutual funds, are generally priced at the ending NAV. These securities are categorized as Level 1 securities.
In accordance with the Trust’s valuation policies and fair value determinations pursuant to Rule 2a-5 under the 1940 Act, the Valuation Designee, the Investment Adviser, is required to consider all appropriate factors relevant to the value of securities for which it has determined other pricing sources are not available or reliable as described above. No single method exists for determining fair value because fair value depends upon the circumstances of each individual case. As a general principle, the current fair value of a security being valued by the Valuation Designee would be the amount that the Fund might reasonably expect to receive upon the current sale. Methods that are in accordance with this principle may, for example, be based on (i) a multiple of earnings; (ii) a discount from market prices of a similar freely traded security (including a derivative security or a basket of securities traded on other markets, exchanges or among dealers); or (iii) yield to maturity with respect to debt issues, or a combination of these and other methods. Fair-value pricing is permitted if, in the Valuation Designee’s opinion, the validity of market quotations appears to be questionable based on factors such as evidence of a thin market in the security based on a small number of quotations, a significant event occurs after the close of a market but before the Fund’s NAV calculation that may affect a security’s value, or the Valuation Designee is aware of any other data that calls into question the
19
| Foundry Partners Small Cap Value Fund |
| Notes to the Financial Statements (continued) |
| October 31, 2023 |
reliability of market quotations. The Valuation Designee may obtain assistance from others in fulfilling its duties. For example, it may seek assistance from pricing services, fund administrators, sub-advisers, accountants, or counsel; it may also consult the Trust’s Fair Value Committee. The Valuation Designee, however, remains responsible for the final fair value determination and may not designate or assign that responsibility to any third party.
The following is a summary of the inputs used to value the Fund’s investments as of October 31, 2023:
| Valuation Inputs | ||||||||||||||||
| Assets | Level 1 | Level 2 | Level 3 | Total | ||||||||||||
| Common Stocks(a) | $ | 224,669,368 | $ | — | $ | — | $ | 224,669,368 | ||||||||
| Money Market Funds | 8,170,709 | — | — | 8,170,709 | ||||||||||||
| Total | $ | 232,840,077 | $ | — | $ | — | $ | 232,840,077 | ||||||||
| (a) | Refer to Schedule of Investments for sector classifications. |
The Fund did not hold any investments at the end of the reporting period for which significant unobservable inputs (Level 3) were used in determining fair value; therefore, no reconciliation of Level 3 securities is included for this reporting period.
NOTE 4. FEES AND OTHER TRANSACTIONS WITH AFFILIATES AND OTHER SERVICE PROVIDERS
Under the terms of the management agreement between the Trust and the Adviser for the Fund, the Adviser manages the Fund’s investments subject to oversight of the Board. As compensation for its management services, the Fund is obligated to pay the Adviser a fee computed and accrued daily and paid monthly at an annual rate of 0.85% of the average daily net assets of the Fund.
The Adviser has contractually agreed to waive its management fee and/or reimburse certain operating expenses through February 29, 2024, but only to the extent necessary so that the Fund’s net expenses, excluding brokerage fees and commissions, borrowing costs (such as interest expense and dividends on securities sold short), taxes, distribution and service (12b-1) fees, extraordinary expenses, and any indirect expenses (such as fees and expenses of acquired funds), do not exceed an annual rate of 0.99% of the average daily net assets of the Fund. Prior to January 1, 2023, the Adviser contractually agreed to waive its management fee and/or reimburse certain Fund operating expenses, as described above, so that the Fund’s net expenses did not exceed an annual rate of 1.25%.
Each fee waiver or expense reimbursement by the Adviser is subject to repayment by the Fund within the three years following the date in which the fee waiver or expense reimbursement occurred, provided that the Fund is able to make the repayment without
20
| Foundry Partners Small Cap Value Fund |
| Notes to the Financial Statements (continued) |
| October 31, 2023 |
exceeding the expense limitation that is in effect at the time of the repayment, and the expense limitation that is in effect at the time of the fee waiver or expense reimbursement. The expense cap may not be terminated prior to its expiration date except by mutual consent of the Adviser and the Board. The amount subject to repayment by the Fund, pursuant to the aforementioned conditions is as follows:
| Recoverable Through | ||||
| October 31, 2026 | $ | 104,205 |
The Trust retains Ultimus Fund Solutions, LLC (“Ultimus” or the “Administrator”), to provide the Fund with administration, fund accounting and transfer agent services, including all regulatory reporting.
Northern Lights Compliance Services, LLC (“NLCS”), an affiliate of Ultimus, provides a Chief Compliance Officer and an Anti-Money Laundering Compliance Officer to the Trust, as well as related compliance services, pursuant to a consulting agreement between NLCS and the Trust. Under the terms of such agreement, NLCS receives fees from the Fund.
The officers and one trustee of the Trust are members of management and/or employees of Ultimus or of NLCS, and are not paid by the Trust for services to the Fund. Ultimus Fund Distributors, LLC (the “Distributor”) acts as the distributor of the Fund’s shares. The Distributor is a wholly-owned subsidiary of Ultimus. There were no payments made to the Distributor by the Fund for the fiscal year ended October 31, 2023.
The Fund has adopted a Distribution Plan (the “Plan”) pursuant to Rule 12b-1 under the 1940 Act. The Plan provides that the Fund will pay the Distributor or any registered securities dealer, financial institution or any other person (a “Recipient”) a fee aggregating at a rate of 0.25% of the average daily net assets of the Investor Class shares in connection with the promotion and distribution of the Fund’s shares or the provision of personal services to shareholders, including, but not necessarily limited to, advertising, compensation to underwriters, dealers and selling personnel; the printing and mailing of prospectuses to other than current Fund shareholders; the printing and mailing of sales literature; and servicing shareholder accounts. The Fund or the Adviser may pay all or a portion of these fees to any Recipient who renders assistance in distributing or promoting the sale of shares, or who provides certain shareholder services, pursuant to a written agreement. The Plan is a compensation plan, which means that compensation is paid regardless of 12b-1 expenses actually incurred. It is anticipated that the Plan will benefit shareholders because an effective sales program typically is necessary in order for the Fund to reach and maintain a sufficient size to achieve efficiently its investment objectives and to realize economies of scale.
21
| Foundry Partners Small Cap Value Fund |
| Notes to the Financial Statements (continued) |
| October 31, 2023 |
NOTE 5. PURCHASES AND SALES OF SECURITIES
For the fiscal year ended October 31, 2023, purchases and sales of investment securities, other than short-term investments, were $267,722,323 and $282,073,395, respectively.
There were no purchases or sales of long-term U.S. government obligations during the fiscal year ended October 31, 2023.
NOTE 6. FEDERAL TAX INFORMATION
At October 31, 2023, the net unrealized appreciation (depreciation) and tax cost of investments for tax purposes was as follows:
| Gross unrealized appreciation | $ | 21,225,551 | ||
| Gross unrealized depreciation | (15,306,778 | ) | ||
| Net unrealized appreciation on investments(a) | $ | 5,918,773 | ||
| Tax cost of investments | $ | 226,921,304 |
| (a) | The difference between book basis and tax basis unrealized appreciation (depreciation) is primarily attributable to the tax deferral of wash losses and return of capital adjustments. |
The tax character of distributions paid for the fiscal years ended October 31, 2023 and October 31, 2022 were as follows:
| 2023 | 2022 | |||||||
| Distributions paid from: | ||||||||
| Ordinary income | $ | 2,370,717 | $ | 30,651,097 | ||||
| Long-term capital gains | 23,054,570 | 6,345,047 | ||||||
| Total taxable distributions | $ | 25,425,287 | $ | 36,996,144 | ||||
| Total distributions paid | $ | 25,425,287 | $ | 36,996,144 | ||||
At October 31, 2023, the components of accumulated earnings (deficit) on a tax basis were as follows:
| Undistributed ordinary income | $ | 2,276,221 | ||
| Undistributed long-term capital gains | 24,453,092 | |||
| Unrealized appreciation on investments | 5,918,773 | |||
| Total accumulated earnings | $ | 32,648,086 |
22
| Foundry Partners Small Cap Value Fund |
| Notes to the Financial Statements (continued) |
| October 31, 2023 |
NOTE 7. OTHER MATTERS
In April 2014, New York based fashion company The Jones Group went private through a leveraged buyout (the “LBO”). In connection with the LBO, Jones Group paid out roughly $1.2 billion to its shareholders to buy back its outstanding stock at $15 per share. Four years later, Nine West Holdings, the company that emerged from the LBO, filed for bankruptcy under Chapter 11. After Nine West’s Chapter 11 plan was confirmed, the Trustee of a Litigation Trust formed under the plan, together with the Indenture Trustee for certain notes issued by Jones Group/ Nine West, commenced a series of lawsuits against the former Jones Group shareholders who tendered their shares in the LBO, including the Fund. The plaintiffs in these suits seek to unwind the stock repurchase transactions that were part of the LBO on the grounds that they constitute fraudulent conveyances under the Bankruptcy Code and state law and to recover the amounts paid to the former Jones Group shareholders. Plaintiffs allege that the Fund received $1,209,420 for its shares in the LBO and seek to claw back those funds as part of the lawsuit.
On August 27, 2020, the Southern District of New York dismissed all fraudulent conveyance and unjust enrichment claims with respect to the payments made to stockholders in connection with the LBO, including the payments made to the Fund, on the basis that the transaction qualified for protection under the safe harbor provided for in Section 546(e) of the Bankruptcy Code. As part of the ruling, all claims against the Fund were dismissed and judgment was entered in its favor. On November 27, 2023 the Court of Appeals for the Second Circuit affirmed the Southern District of New York’s dismissal of the fraudulent conveyance and unjust enrichment claims made to the Fund in connection with the LBO.
It is uncertain at this time whether or not the Trustee will seek to petition the United States Supreme Court for review of the decision by the Court of Appeals for the Second Circuit.
NOTE 8. COMMITMENTS AND CONTINGENCIES
The Trust indemnifies its officers and Trustees for certain liabilities that may arise from their performance of their duties to the Trust or the Fund. Additionally, in the normal course of business, the Trust enters into contracts that contain a variety of representations and warranties which provide general indemnifications. The Trust’s maximum exposure under these arrangements is unknown, as this would involve future claims that may be made against the Trust that have not yet occurred.
23
| Foundry Partners Small Cap Value Fund |
| Notes to the Financial Statements (continued) |
| October 31, 2023 |
NOTE 9. SUBSEQUENT EVENTS
Management of the Fund has evaluated the need for disclosures and/or adjustments resulting from subsequent events through the date at which these financial statements were issued. Based upon this evaluation, management has determined there were no items requiring adjustment of the financial statements or additional disclosure.
24
| Report of Independent Registered Public Accounting Firm |
To the Shareholders of Foundry Partners Small Cap Value Fund and
Board of Trustees of Valued Advisers Trust
Opinion on the Financial Statements
We have audited the accompanying statement of assets and liabilities, including the schedule of investments, of Foundry Partners Small Cap Value Fund (formerly, Foundry Partners Fundamental Small Cap Value Fund) (the “Fund”), a series of Valued Advisers Trust, as of October 31, 2023, the related statement of operations for the year then ended, the statements of changes in net assets for each of the two years in the period then ended, the related notes, and the financial highlights for each of the five years in the period then ended (collectively referred to as the “financial statements”). In our opinion, the financial statements present fairly, in all material respects, the financial position of the Fund as of October 31, 2023, the results of its operations for the year then ended, the changes in net assets for each of the two years in the period then ended, and the financial highlights for each of the five years in the period then ended, in conformity with accounting principles generally accepted in the United States of America.
Basis for Opinion
These financial statements are the responsibility of the Fund’s management. Our responsibility is to express an opinion on the Fund’s financial statements based on our audits. We are a public accounting firm registered with the Public Company Accounting Oversight Board (United States) (“PCAOB”) and are required to be independent with respect to the Fund in accordance with the U.S. federal securities laws and the applicable rules and regulations of the Securities and Exchange Commission and the PCAOB.
We conducted our audits in accordance with the standards of the PCAOB. Those standards require that we plan and perform the audit to obtain reasonable assurance about whether the financial statements are free of material misstatement whether due to error or fraud.
Our audits included performing procedures to assess the risks of material misstatement of the financial statements, whether due to error or fraud, and performing procedures that respond to those risks. Such procedures included examining, on a test basis, evidence regarding the amounts and disclosures in the financial statements. Our procedures included confirmation of securities owned as of October 31, 2023, by correspondence with the custodian. Our audits also included evaluating the accounting principles used and significant estimates made by management, as well as evaluating the overall presentation of the financial statements. We believe that our audits provide a reasonable basis for our opinion.
We have served as the Fund’s auditor since 2006.
COHEN & COMPANY, LTD.
Cleveland, Ohio
December 22, 2023
25
| Liquidity Risk Management Program (Unaudited) |
Valued Advisers Trust has adopted and implemented a written liquidity risk management program as required by Rule 22e-4 (the “Liquidity Rule”) under the Investment Company Act. The program is reasonably designed to assess and manage the Fund’s liquidity risk, taking into consideration, among other factors, the Fund’s investment strategy and the liquidity of its portfolio investments during normal and reasonably foreseeable stressed conditions; its short and long-term cash flow projections; and its cash holdings and access to other funding sources. The Board of Trustees approved the appointment of a Liquidity Administrator Committee, which includes representatives from Foundry Partners, LLC, the Fund’s investment adviser, and Ultimus Fund Solutions, LLC, the Fund’s Administrator. The Liquidity Administrator Committee is responsible for the program’s administration and oversight and for reporting to the Board on at least an annual basis regarding the program’s operation and effectiveness. The Liquidity Administrator Committee updated its assessment of the Fund’s liquidity risk profile, considering additional data gathered during the period June 1, 2022 through May 31, 2023 (the “Review Period”) and the adequacy and effectiveness of the liquidity risk management program’s operations during the Review Period in order to prepare a written report for the Board of Trustees (the “Report”) for consideration at its meeting held on September 8, 2023. The Report noted that during the Review Period the Fund did not experience unusual stress or disruption to its operations related to purchase and redemption activity. It further noted that during the Review Period the Fund held adequate levels of cash and highly liquid investments to meet shareholder redemption activities in accordance with applicable requirements. The Report concluded that (i) the Trust’s liquidity risk management program is reasonably designed to prevent violations of the Liquidity Rule and (ii) the Trust’s liquidity risk management program had been effectively implemented during the Review Period.
26
| Summary of Fund Expenses (Unaudited) |
As a shareholder of the Fund, you incur two types of costs: (1) transaction and (2) ongoing costs, including management fees and other Fund expenses. These examples are intended to help you understand your ongoing costs (in dollars) of investing in the Fund and to compare these costs with the ongoing costs of investing in other mutual funds. The example is based on an investment of $1,000 invested at the beginning of the period and held for the entire period from May 1, 2023 through October 31, 2023.
Actual Expenses
The first line of the table below provides information about actual account values and actual expenses. You may use the information in this line, together with the amount you invested, to estimate the expenses that you paid over the period. Simply divide your account value by $1,000 (for example, an $8,600 account value divided by $1,000 = 8.6), then multiply the result by the number in the first line under the heading “Expenses Paid During Period” to estimate the expenses you paid on your account during this period.
Hypothetical Example for Comparison Purposes
The second line of the table below provides information about hypothetical account values and hypothetical expenses based on the Fund’s actual expense ratio and an assumed rate of return of 5% per year before expenses, which is not the Fund’s actual return. The hypothetical account values and expenses may not be used to estimate the actual ending account balance or expenses you paid for the period. You may use this information to compare the ongoing costs of investing in the Fund and other funds. To do so, compare this 5% hypothetical example with the 5% hypothetical examples that appear in the shareholder reports of other funds.
Expenses shown in the table are meant to highlight your ongoing costs only and do not reflect any transactional costs. Therefore, the second line of the table below is useful in comparing ongoing costs only and will not help you determine the relative total costs of owning different funds. In addition, if transaction costs were included, your costs would have been higher.
| Ending | ||||||||||||||||
| Beginning | Account | Expenses | ||||||||||||||
| Account | Value | Paid | Annualized | |||||||||||||
| Value | October 31, | During | Expense | |||||||||||||
| May 1, 2023 | 2023 | Period(a) | Ratio | |||||||||||||
| Foundry Partners Small Cap Value Fund | ||||||||||||||||
| Investor Class | Actual | $ | 1,000.00 | $ | 1,030.40 | $ | 6.35 | 1.24% | ||||||||
| Hypothetical(b) | $ | 1,000.00 | $ | 1,018.95 | $ | 6.31 | 1.24% | |||||||||
| Institutional Class | Actual | $ | 1,000.00 | $ | 1,031.70 | $ | 5.07 | 0.99% | ||||||||
| Hypothetical(b) | $ | 1,000.00 | $ | 1,020.21 | $ | 5.04 | 0.99% | |||||||||
| (a) | Expenses are equal to the Fund’s annualized expense ratios, multiplied by the average account value over the period, multiplied by 184/365 (to reflect the one-half year period). |
| (b) | Hypothetical assumes 5% annual return before expenses. |
27
| Additional Federal Income Tax Information (Unaudited) |
The Form 1099-DIV you receive in January 2024 will show the tax status of all distributions paid to your account in calendar year 2023. Shareholders are advised to consult their own tax adviser with respect to the tax consequences of their investment in the Fund. As required by the Internal Revenue Code and/or regulations, shareholders must be notified regarding the status of qualified dividend income for individuals and the dividends received deduction for corporations.
Qualified Dividend Income. The Fund designates approximately 100% or up to the maximum amount of such dividends allowable pursuant to the Internal Revenue Code, as qualified dividend income eligible for a reduced tax rate.
Qualified Business Income. The Fund designates approximately 0% of its ordinary income dividends, or up to the maximum amount of such dividends allowable pursuant to the Internal Revenue Code, as qualified business income.
Dividends Received Deduction. Corporate shareholders are generally entitled to take the dividends received deduction on the portion of the Fund’s dividend distribution that qualifies under tax law. For the Fund’s calendar year 2023 ordinary income dividends, 100% qualifies for the corporate dividends received deduction.
For the year ended October 31, 2023, the Fund designated $23,054,570 as long-term capital gain distributions.
28
Trustees and Officers (Unaudited)
The Board of Trustees supervises the business activities of the Trust. Each Trustee serves as a trustee until termination of the Trust unless the Trustee dies, resigns, retires or is removed.
The following table provides information regarding each of the Independent Trustees.
| Name, Address*, (Age), Position with Trust**, Term of Position with Trust | Principal Occupation During Past 5 Years and Other Directorships | Other Directorships |
| Andrea N. Mullins, 56 Independent Trustee Since December 2013 Chairperson since March 2017 | Current: Private investor; Independent Contractor, SWM Advisors (since April 2014). | Trustee, Angel Oak Funds Trust (since February 2019) (7 portfolios); Trustee, Angel Oak Strategic Credit Fund (since February 2019); Trustee, Angel Oak Financial Strategies Income Term Trust (since May 2019); Trustee, Angel Oak Credit Opportunities Term Trust (since January 2021); Trustee and Audit Committee Chair, NXG NextGen Infrastructure Income Fund (since November 2021); Trustee and Audit Committee Chair, NXG Cushing Midstream Energy Fund (since November 2021). |
29
| Trustees and Officers (Unaudited) (continued) |
| Name, Address*, (Age), Position with Trust**, Term of Position with Trust | Principal Occupation During Past 5 Years and Other Directorships | Other Directorships |
| Ira P. Cohen, 64 Independent Trustee Since June 2010 | Current: Independent financial services consultant (since February 2005); Executive Vice President of Asset Management Services, Recognos Financial (since August 2015). | Trustee and Audit Committee Chairman, Apollo Diversified Real Estate Fund (since March 2022); Trustee, Chairman and Nominating and Governance Committee Chairman, Angel Oak Funds Trust (since October 2014) (7 portfolios); Trustee, Chairman, and Nominating and Governance Committee Chairman, Angel Oak Strategic Credit Fund (since December 2017); Trustee, Chairman, and Nominating and Governance Committee Chairman, Angel Oak Financial Strategies Income Term Trust (since May 2019); Trustee, Chairman, and Nominating and Governance Committee Chairman, Angel Oak Credit Opportunities Term Trust (since January 2021); Trustee and Nominating and Governance Committee Chairman, U.S. Fixed Income Trust (since March 2019). |
| * | The address for each Trustee is 225 Pictoria Drive, Suite 450, Cincinnati, Ohio 45246. |
| ** | As of the date of this report, the Trust consists of 15 series. |
The following table provides information regarding the Trustee who is considered an “interested person” of the Trust, as that term is defined under the 1940 Act.
| Name, Address*, (Age), Position with Trust**, Term of Position with Trust | Principal Occupation During Past 5 Years and Other Directorships | Other Directorships |
| Mark J. Seger***, 61 Trustee Since March 2017 | Current: Vice Chairman and Co-Founder, Ultimus Fund Solutions, LLC and its subsidiaries (since 1999). | None. |
| * | The address for each Trustee is 225 Pictoria Drive, Suite 450, Cincinnati, Ohio 45246. |
| ** | As of the date of this report, the Trust consists of 15 series. |
| *** | Mr. Seger is considered an “interested person” of the Trust because of his relationship with the Trust’s administrator, transfer agent, and distributor. |
30
| Trustees and Officers (Unaudited) (continued) |
The following table provides information regarding the Officers of the Trust:
| Name, Address*, (Age), Position with Trust**, Term of Position with Trust | Principal Occupation During Past 5 Years | Other Directorships |
Matthew J. Miller, 47
Vice President | Current: Vice President, Relationship Management, Ultimus Fund Solutions, LLC (since December 2015). | None. |
| N. Lynn Bowley, 65 Chief Compliance Officer Since April 2022 | Current: Senior Vice President, Senior Compliance Officer, Northern Lights Compliance Services, LLC (since January 2007). | None. |
Carol J. Highsmith, 59
Secretary Since March 2014 | Current: Vice President, Ultimus Fund Solutions, LLC (since December 2015). | None. |
| Zachary P. Richmond, 43 Principal Financial Officer and Treasurer Since September 2021 | Current:Vice President, Financial Administration, Ultimus Fund Solutions, LLC (since February 2019).
Previous:Assistant Vice President, Associate Director of Financial Administration, Ultimus Fund Solutions, LLC (December 2015 to February 2019). | None. |
31
| Trustees and Officers (Unaudited) (continued) |
| Name, Address*, (Age), Position with Trust**, Term of Position with Trust | Principal Occupation During Past 5 Years and Other Directorships | Other Directorships |
Jared D. Lahman, 37
| Current: Senior Compliance Analyst, Northern Lights Compliance Services, LLC (since January 2019).
Previous: Manager of Fund Accounting, Gemini Fund Services (September 2016 to December 2018) | None. |
| * | The address for each Officer is 225 Pictoria Drive, Suite 450, Cincinnati, Ohio 45246. |
| ** | As of the date of this report, the Trust consists of 15 series. |
| Other Information (Unaudited) |
The Fund’s Statement of Additional Information (“SAI”) includes additional information about the trustees and is available without charge, upon request. You may call toll-free at (800) 247-1014 to request a copy of the SAI or to make shareholder inquiries.
32
| Investment Advisory Agreement Approval (Unaudited) |
At a meeting held on June 1, 2023, the Board of Trustees (the “Board”) considered the renewal of the Investment Advisory Agreement (the “Foundry Agreement”) between Valued Advisers Trust (the “Trust”) and Foundry Partners, LLC (“Foundry”) with respect to the Foundry Partners Small Cap Value Fund (the “Foundry Fund”). Foundry provided written information to the Board to assist the Board in its considerations.
Counsel reminded the Trustees of their fiduciary duties and responsibilities, including the factors to be considered, and the application of those factors to Foundry. In assessing the factors and reaching its decision, the Board took into consideration information furnished by Foundry and the Trust’s other service providers for the Board’s review and consideration throughout the year at regular Board meetings, as well as information specifically prepared or presented in connection with the annual renewal process, including information presented at the meeting. The Board requested and was provided with, and reflected on, information and reports relevant to the annual renewal of the Foundry Agreement, including: (i) reports regarding the services and support provided to the Foundry Fund by Foundry; (ii) quarterly assessments of the investment performance of the Foundry Fund by personnel of Foundry; (iii) commentary on the reasons for the performance; (iv) presentations by Foundry addressing its investment philosophy, investment strategy, personnel, and operations; (v) compliance and audit reports concerning the Foundry Fund and Foundry; (vi) disclosure information contained in the Trust’s registration statement and Foundry’s Form ADV; and (vii) a memorandum from counsel, that summarized the fiduciary duties and responsibilities of the Board in considering and approving the Foundry Agreement. The Board also requested and received various informational materials including, without limitation: (a) documents containing information about Foundry, including its financial information; a description of its personnel and services it provides to the Foundry Fund; information on Foundry’s investment advice and performance; summaries of Foundry Fund expenses, compliance program, current legal matters, and other general information; (b) comparative expense and performance information for other mutual funds with strategies similar to the Foundry Fund; and (c) the benefits to be realized by Foundry from its relationship with the Foundry Fund. The Board did not identify any particular information that was most relevant to its consideration of the Foundry Agreement and each Trustee may have afforded different weight to the various Factors.
1. The nature, extent, and quality of the services to be provided by Foundry. The Board considered Foundry’s responsibilities under the Foundry Agreement. The Trustees considered the services being provided by Foundry to the Foundry Fund including, without limitation: the quality of its investment advisory services (including research and recommendations with respect to portfolio securities), its process for formulating investment recommendations and assuring compliance with the Foundry Fund’s investment objectives and limitations, its coordination of services for the Foundry Fund among the Foundry Fund’s service providers, and its efforts to promote the Foundry Fund and grow its assets. The Trustees considered Foundry’s continuity of, and commitment to retain qualified personnel, commitment to maintain and enhance its resources and systems, and options that allow the Foundry Fund to maintain its goals, and Foundry’s continued cooperation with the Board and counsel for the Foundry Fund. The Trustees considered Foundry’s personnel, including their education and experience. After considering the foregoing information and further information in the Meeting materials provided by Foundry, the Board concluded that, in light of all the facts and circumstances, the nature, extent, and quality of the services provided by Foundry were satisfactory and adequate for the Foundry Fund.
33
| Investment Advisory Agreement Approval (Unaudited) (continued) |
2. Investment Performance of the Foundry Fund and Foundry. The Trustees compared the performance of the Foundry Fund with the performance of funds in a peer group with similar objectives managed by other investment advisers, as well as with aggregated Morningstar category data, and with the performance of the Foundry Fund’s benchmark. The Trustees also considered the consistency of Foundry’s management of the Foundry Fund with its investment objectives, strategies, and limitations. The Trustees acknowledged that Foundry has served as adviser to the Foundry Fund only since June of 2016, but one portfolio manager has managed the portfolio since 2006 and the other since 2010. The Trustees noted that the Foundry Fund had outperformed as compared to its benchmark for the one-year, three-year, five-year and since inception periods ended March 31, 2023. They also noted that the Foundry Fund had outperformed as compared to the average and the median of its custom Morningstar category for the one-year period ended March 31, 2023, had performed very close to the category average and above the median for the three-year period, had underperformed as compared to both the category average and median for the five-year period, had outperformed both the category average and median for the ten-year period, and outperformed the category median for the period since inception of the Foundry Fund. In comparing the Foundry Fund’s performance to that of its custom peer group, the Board noted that the Foundry Fund performed above the median for the one-year, three-year, five-year, and since inception periods ended March 31, 2023. The Board reviewed the performance of Foundry in managing separate accounts with investment strategies similar to that of the Foundry Fund and observed that the Foundry Fund’s performance was very comparable. The Trustees took into consideration discussions with representatives of Foundry during the prior year regarding the reasons for the performance of the Foundry Fund. After further reviewing and discussing these and other relevant factors, the Board concluded, in light of all the facts and circumstances, that the investment performance of the Foundry Fund and Foundry was satisfactory.
3. The costs of the services to be provided and profits to be realized by Foundry from the relationship with the Foundry Fund. The Trustees considered: (1) Foundry’s financial condition; (2) the asset level of the Foundry Fund; (3) the overall expenses of the Foundry Fund; and (4) the nature and frequency of management fee payments. The Trustees reviewed information provided by Foundry regarding its profits associated with managing the Foundry Fund, noting that although Foundry has not been waiving any of its management fee, the Foundry Fund’s recently revised expense limitation arrangement may require such waivers going forward. The Trustees also considered potential benefits for Foundry in managing the Foundry Fund. The Trustees then compared the fees and expenses of the Foundry Fund (including the management fee) to other comparable mutual funds. The Trustees noted that the Foundry Fund’s management fee was higher than the average and the median of its peer group, and that the net expense ratio was higher than the peer group average and median. They considered the new expense limitation arrangement and that with the new arrangement the Foundry Fund’s net expense ratio is higher than the peer group average but lower than the median. They noted that the Foundry Fund’s management fee was higher than the average and median of funds in its custom Morningstar category, and that the Foundry Fund’s net expense ratio was also higher than the average and median. The Board noted that the fees that Foundry assesses for separate account clients that have strategies similar to that of the Foundry Fund could be comparable, higher, or lower and they expressed the view that the reasons for such differences were acceptable and reasonable. Based on the foregoing, the Board concluded that the fees to be paid to Foundry by the Foundry Fund and the profits to be realized by Foundry, in light of all the facts and circumstances, were fair and reasonable in relation to the nature and quality of the services provided by Foundry.
34
| Investment Advisory Agreement Approval (Unaudited) (continued) |
4. The extent to which economies of scale would be realized as the Foundry Fund grows and whether advisory fee levels reflect these economies of scale for the benefit of the Foundry Fund’s investors. The Board considered the Foundry Fund’s fee arrangements with Foundry. The Board considered that while the management fee remained the same at all asset levels, the Foundry Fund’s shareholders could experience benefits from the Foundry Fund’s expense limitation arrangement if asset levels fell and/or expenses increased. The Trustees noted that Foundry recently revised the expense limitation arrangement to lower the Foundry Fund’s expense cap. The Trustees considered the direct and indirect efforts of Foundry to ensure that a cost structure was in place that was beneficial for the Foundry Fund as it grew. In light of its ongoing consideration of the Foundry Fund’s asset and fees levels and expectations for growth, the Board determined that the Foundry Fund’s fee arrangements, in light of all the facts and circumstances, were fair and reasonable in relation to the nature and quality of the services provided by Foundry.
5. Possible conflicts of interest and benefits to Foundry. In considering Foundry’s practices regarding conflicts of interest, the Trustees evaluated the potential for conflicts of interest and considered such matters as the experience and ability of the advisory personnel assigned to the Foundry Fund; the basis of decisions to buy or sell securities for the Foundry Fund and/or Foundry’s other accounts; and the substance and administration of Foundry’s code of ethics. The Trustees also considered disclosure in the registration statement of the Trust relating to Foundry’s potential conflicts of interest. The Trustees noted that Foundry may utilize soft dollars and the Trustees noted Foundry’s policies and processes for managing the conflicts of interest that could arise from soft dollar arrangements. The Trustees noted other potential benefits to Foundry, including the fact that the Foundry Fund could provide an attractive vehicle for smaller accounts, which may increase the total assets under management by Foundry. Based on the foregoing, the Board determined that the standards and practices of Foundry relating to the identification and mitigation of potential conflicts of interest and the benefits to be realized by Foundry in managing the Foundry Fund were satisfactory.
After additional consideration of the factors discussed by counsel and further discussion among the Board members, the Board determined to approve the continuation of the Foundry Agreement.
35
Privacy Policy
| FACTS | WHAT DOES FOUNDRY PARTNERS SMALL CAP VALUE FUND (THE “FUND”) DO WITH YOUR PERSONAL INFORMATION? | |
| Why? | Financial companies choose how they share your personal information. Federal law gives consumers the right to limit some but not all sharing. Federal law also requires us to tell you how we collect, share, and protect your personal information. Please read this notice carefully to understand what we do. | |
| What? | The types of personal information we collect and share depend on the product or service you have with us. This information can include:
■ Social Security number
■ account balances and account transactions
■ transaction or loss history and purchase history
■ checking account information and wire transfer instructions
When you are no longer our customer, we continue to share your information as described in this notice. | |
| How? | All financial companies need to share customers’ personal information to run their everyday business. In the section below, we list the reasons financial companies can share their customers’ personal information; the reasons the Funds choose to share; and whether you can limit this sharing. | |
| Reasons we can share your personal information | Does the Fund share? | |
For our everyday business purposes — such as to process your transactions, maintain your account(s), respond to court orders and legal investigations, or report to credit bureaus | Yes | |
For our marketing purposes — to offer our products and services to you | No | |
| For joint marketing with other financial companies | No | |
For our affiliates’ everyday business purposes – information about your transactions and experiences | No | |
For our affiliates’ everyday business purposes – information about your creditworthiness | No | |
| For nonaffiliates to market to you | No | |
| Questions? | Call (800) 247-1014 | |
36
| Who we are | |
| Who is providing this notice? | Foundry Partners Small Cap Value Fund Ultimus Fund Distributors, LLC (Distributor) Ultimus Fund Solutions, LLC (Administrator) |
| What we do | |
| How does the Fund protect my personal information? | To protect your personal information from unauthorized access and use, we use security measures that comply with federal law. These measures include computer safeguards and secured files and buildings. Our service providers are held accountable for adhering to strict policies and procedures to prevent any misuse of your nonpublic personal information. |
| How does the Fund collect my personal information? | We collect your personal information, for example, when you
■ open an account or deposit money
■ buy securities from us or sell securities to us
■ make deposits or withdrawals from your account
■ give us your account information
■ make a wire transfer
■ tell us who receives the money
■ tell us where to send the money
■ show your government-issued ID
■ show your driver’s license |
| Why can’t I limit all sharing? | Federal law gives you the right to limit only
■ sharing for affiliates’ everyday business purposes — information about your creditworthiness
■ affiliates from using your information to market to you
■ sharing for nonaffiliates to market to you
State laws and individual companies may give you additional rights to limit sharing. |
| Definitions | |
| Affiliates | Companies related by common ownership or control. They can be financial and nonfinancial companies.
■ Foundry Partners, LLC, the investment adviser to the Fund, could be deemed to be an affiliate. |
| Nonaffiliates | Companies not related by common ownership or control. They can be financial and nonfinancial companies.
■ The Fund does not share your personal information with nonaffiliates so they can market to you |
| Joint marketing | A formal agreement between nonaffiliated financial companies that together market financial products or services to you.
■ The Fund does not jointly market. |
37
Proxy Voting
A description of the policies and procedures that the Fund uses to determine how to vote proxies relating to portfolio securities and information regarding how the Fund voted those proxies during the most recent twelve month period ended June 30, are available (1) without charge upon request by calling the Fund at (800) 247-1014 and (2) in Fund documents filed with the SEC on the SEC’s website at www.sec.gov.
| TRUSTEES Andrea N. Mullins, Chairperson Ira P. Cohen Mark J. Seger | INDEPENDENT REGISTERED PUBLIC ACCOUNTING FIRM |
| OFFICERS Matthew J. Miller, Principal Executive Officer and President Zachary P. Richmond, Principal Financial Officer and Treasurer N. Lynn Bowley, Chief Compliance Officer Carol J. Highsmith, Vice President and Secretary | LEGAL COUNSEL Troutman Pepper Hamilton Sanders LLP 3000 Two Logan Square 18th and Arch Streets Philadelphia, PA 19103 |
| INVESTMENT ADVISER Foundry Partners, LLC 323 Washington Avenue North, Suite 360 Minneapolis, MN 55401 | CUSTODIAN Huntington National Bank 41 South High Street Columbus, OH 43215 |
| DISTRIBUTOR Ultimus Fund Distributors, LLC 225 Pictoria Drive, Suite 450 Cincinnati, OH 45246 | ADMINISTRATOR, TRANSFER AGENT AND FUND ACCOUNTANT |
This report is intended only for the information of shareholders or those who have received the Fund’s prospectus which contains information about the Fund’s management fee and expenses. Please read the prospectus carefully before investing.
Distributed by Ultimus Fund Distributors, LLC Member FINRA/SIPC
Foundry-AR-23

Kovitz Core Equity ETF
Annual Report
October 31, 2023
Fund Adviser:
Kovitz Investment Group Partners, LLC
71 South Wacker Drive, Suite 1860
Chicago, IL 60606
Toll Free (877) 714-2327
Management Discussion of Fund Performance (Unaudited)
On December 9, 2022, the Green Owl Intrinsic Value Fund (Ticker: GOWLX) became the predecessor fund to the Kovitz Core Equity ETF (Ticker: EQTY) (the “Fund”). All past performance and history of GOWLX from its inception became attributable to EQTY moving forward. Specifically, from inception, 12/28/2011, up until 12/9/2022, Fund performance reflects mutual fund returns for GOWLX. Also on December 9, 2022, the assets and liabilities of Marathon Value Portfolio (MVPFX) were transferred into EQTY. From 12/12/2022 forward, EQTY performance is based on the reorganized Fund.
Kovitz Investment Group launched the the Fund with the goal of seeking long-term capital appreciation through high risk-adjusted returns. To accomplish this, Fund management implements a fundamental, research-driven process, seeking to build a diversified portfolio of equity investments through the purchase of competitively advantaged and financially strong companies at prices substantially less than our estimate of their intrinsic values.
We focus on the prudent and patient application of our investment criteria and valuation requirements. Our bottom-up research emphasizes business quality, industry structures, growth opportunities, management skill and corporate culture. It is further augmented by our assessment of the company’s ability to sustain earnings power over the long term through an understanding of its competitive advantages and management’s proficiency in the allocation of capital. We use absolute, rather than relative, methods to estimate companies’ intrinsic values and we use the movement of market prices around these intrinsic value estimates to construct and manage a portfolio of high-quality businesses that we feel have the potential to create sustained shareholder value over many years.
MARKET AND PERFORMANCE SUMMARY
For the fiscal year 2023 (November 1, 2022 through October 31, 2023), the Fund increased 9.47%. In comparison, the Fund’s benchmark, the S&P 500® Index (“S&P 500”), gained 10.14% during the same period. Since inception on December 28, 2011, the Fund has compounded at a rate of 10.35% annually, versus 12.81% annually for the S&P 500 over the same time period.
So far, 2023 has confounded economists and market forecasters alike as the U.S. economy has shown surprising resilience in the face of the Federal Reserve’s (“Fed”) engineered rate increases to combat inflation. Despite a sell-off towards the end of the fiscal year, investors have largely been rewarded for staying the course.
1
Management Discussion of Fund Performance (Unaudited) (continued)
Coming into the year, neither the strength of the economy nor the market was obvious. In 2022, the Fed raised interest rates by more than four percentage points and the S&P 500 fell by 19%. The consensus was that higher interest rates would not only slow the economy but push it into recession. Yet, what was perhaps the most “expected” economic downturn in recent memory has so far failed to materialize as the economy continues to appear to be on solid footing. Employment is strong, wages are growing, and consumer spending remains relatively robust.
In fact, some have expressed concern that the economy may actually be too strong for the stock market to continue adding to its gains for the year. That seems like a contradictory statement, yet it’s important to understand that the relationship between the economy and the stock market can be complex and nuanced. On the one hand, it is true that a strong economy in the long run is a positive force for the stock market. When businesses are doing well, they tend to earn more profits, which generally lead to higher stock prices. Additionally, a strong economy can create a more confident investing environment, which can also boost prices.
On the other hand, higher interest rates can make borrowing more expensive for businesses and consumers, potentially impacting spending and investment. Since the economy has remained quite strong despite repeated steps by the Fed to bring down inflation, the Fed may have to continue to push rates higher or at least keep them, in Wall Street parlance, “higher for longer”. As we’ve discussed before, higher interest rates are typically an anathema to stock prices as valuations tend to fall due to future cash flows being discounted at a higher rate. Higher rates also make bonds a more attractive investment opportunity compared to equities, something bonds haven’t been for many years now.
How much “longer” the benchmark rate will remain at today’s level is an open question. Fed Chair Jerome Powell strongly suggested in his speech delivered at the annual economic symposium hosted by the Federal Reserve Bank of Kansas City in Jackson Hole, Wyoming on August 25, 2023, that “…we will assess our progress based on the totality of the data and the evolving outlook and risks.” In other words, much will depend on the course of inflation, which has dropped from a 40-year high of 5.4% in February 2022 to its most current reading of 3.9%, using the Fed’s preferred metric, the Personal Consumption Expenditures (PCE) Index excluding the cost of food and energy, or so-called “core” PCE. The more widely followed Consumer Price Index (CPI) has fallen from over 9% last year to a recent 3.7%.
While Chair Powell noted that past interest rate increases had yet to fully slow the economy and that the central bank would “proceed carefully” on any further rate increases, you can
2
Management Discussion of Fund Performance (Unaudited) (continued)
be certain that the Fed Chair is loath to repeat the monetary-policy mistakes of the 1970s, when Fed officials gave up their inflation fight too quickly and price growth reaccelerated.
The most bullish case for financial markets is the so-called Goldilocks case, or “just right” conditions, which includes an orderly retreat in inflation and a steady economy that keeps consumers spending and enables continuing corporate profit growth. This soft-landing scenario, heretofore considered an unrealizable dream, is now considered a distinct possibility by [the market?].
The bearish case for financial markets also rests on a good economy—too good, that is. Recent data suggests that economic growth is accelerating, which implies inflation may prove stickier than many had hoped. As a consequence, the Fed might need to tighten monetary policy further to restore price stability, rather than loosening it (i.e. rate cuts) next year as had been widely expected.
So, what do we do with all this macroeconomic information? Other than using it to contextualize the current environment, not all that much. One of our core beliefs is that trying to time the market is a losing game. Besides, short-term market movements can be influenced by a wide range of emotional and psychological factors, making predicting market behavior based solely on economic indicators a challenging endeavor. It is also important to note that the stock market is forward-looking. This means that investors are not only looking at the current state of the economy, but they are also looking at the potential for future economic growth or contraction. The market’s preparing for the recession that never came in 2022 and missing the subsequent recovery in stocks was a prime example of the dangers for investors of this approach.
Our primary investment philosophy is that buying and holding the best companies we can find at appropriate valuations, regardless of what is happening in the economy now, is the best way to compound wealth over time. Because we have more confidence in our ability to value businesses than to predict the direction of the economy or the shifting sentiment of the crowd, we think the best way to fulfill our objective of delivering positive returns per annum over a market cycle is to own businesses that become progressively more valuable over time. Companies most likely to do that exhibit certain basic characteristics in our opinion. They’re proven market leaders in competitively stable markets. They have deep-rooted competitive advantages that allow them to constantly deliver more value to customers and gain market share. They’re consistently profitable and have proven resilient over multiple cycles. The capital structure is conservative, and management reinforces a culture of long-term thinking and durable growth.
3
Management Discussion of Fund Performance (Unaudited) (continued)
It’s more than likely that interest rates will normalize higher than the near-zero-bound levels of the last decade. In such an environment, active management, stock selection and price sensitivity should, in our view, over time be rewarded. Our portfolio has been refreshed by a significant number of new ideas over the last several years and continues to bear little resemblance to its benchmark index. We believe that a rational, independent, value-driven investment philosophy has never been more important than it is today.
PORTFOLIO ACTIVITY
As long-term shareholders, we focus our research efforts primarily around where we see business quality and structural competitive advantages. These are generally evidenced by a historic track record for the company of healthy profitability and robust capital returns. Our portfolio actions are guided simply by initiating or adding to positions whose intrinsic value growth has outpaced their stock price movement and taking money off the table in names that have moved materially closer to fair value or where a thesis change by [company management?] has lowered our fair value estimate.
We continue to utilize a valuation framework that focuses on the long-term fundamentals while minimizing the odds of a permanent loss of capital. We use market, or single stock, volatility to seek to upgrade both the quality of the portfolio and the expected return profile.
Based on these standards, we took the following portfolio actions during the Fund’s fiscal year.
| Initiated Positions |
| Diageo |
| PPG Industries |
| Exited Positions |
| Blackstone |
| Expedia |
| GoDaddy |
| Quanta Services |
| SS&C Technologies |
| Walt Disney |
4
Management Discussion of Fund Performance (Unaudited) (continued)
| Increased Positions |
| Amazon |
| American Express |
| CarMax |
| Charter Communications |
| Charles Schwab |
| Diageo |
| Hasbro |
| Jacobs |
| Keysight Technologies |
| Lowe’s |
| Phillip Morris |
| Decreased Positions |
| Alphabet |
| Apple |
| Arista Networks |
| CarMax |
| Motorola Solutions |
| JP Morgan Chase |
| Las Vegas Sands |
| Meta |
PERFORMANCE ATTRIBUTION
Sector Attribution
On a sector basis, the exhibits below detail the top 3 contributors and detractors to the Fund’s annual results.
5
Management Discussion of Fund Performance (Unaudited) (continued)
| Top Contributors to Return 1 | |||
| Portfolio Weight | Total Return (%) | Contribution to Portfolio Return (Gross) | |
| Communication Services | 14.24% | 44.62% | 5.80% |
| Information Technology | 22.24% | 13.54% | 3.18% |
| Industrials | 7.88% | 21.06% | 1.71% |
| 1 | Based on Morningstar Attribution Data of EQTY, net of fees, as of 10/31/23 |
| Top Detractors to Return 1 | |||
| Portfolio Weight | Total Return (%) | Contribution to Portfolio Return (Gross) | |
| Consumer Staples | 7.89% | -12.10% | -1.52% |
| Materials | 1.36% | 9.63% | -0.19% |
| Cash | 0.86% | 5.22% | 0.06% |
Individual Security Attribution
On an individual security basis, the exhibits below detail the top 3 contributors and detractors to the Fund’s annual results.
| Top Contributors to Return 1 | |||
| Portfolio Weight | Total Return (%) | Contribution to Portfolio Return (Gross) | |
| Meta Platforms | 3.30% | 223.39% | 3.79% |
| Alphabet ‘C” | 4.56% | 32.37% | 1.35% |
| Arista Networks | 1.80% | 65.79% | 1.18% |
| 1 | Based on Morningstar Attribution Data of EQTY, net of fees, as of 10/31/23 |
6
Management Discussion of Fund Performance (Unaudited) (continued)
| Top Detractors from Return 1 | |||
| Portfolio Weight | Total Return (%) | Contribution to Portfolio Return (Gross) | |
| Charles Schwab | 3.83% | -33.69% | -1.59% |
| Dollar Tree | 2.92% | -29.91% | -1.19% |
| Hasbro | 1.91% | -27.28% | -0.81% |
| Top 10 Largest Positions as of October 31, 2023 |
| Philip Morris International Inc |
| Alphabet Inc Class C |
| Berkshire Hathaway Inc Class B |
| Becton Dickinson & Co |
| Jacobs Solutions Inc |
| Amazon |
| Meta Platforms |
| Visa Inc Class A |
| Charles Schwab Corp |
| Dollar Tree |
| 1 | Based on Morningstar Attribution Data of EQTY, net of fees, as of 10/31/23 |
Thank you for your continued support and trust in our ability to manage your investment in the Fund.
| Annualized Performance (Net of Fees) As of October 31, 2023 | ||
| EQTY | S&P 500 | |
| Quarter * | -9.35% | -8.25% |
| YTD * | 11.07% | 10.69% |
| One Year | 9.47% | 10.14% |
| Three Year | 9.89% | 10.36% |
| Five Year | 7.98% | 11.01% |
| Since Inception (12/28/11) | 10.35% | 12.81% |
| * | Quarter and Year to Date Performance numbers are not annualized. |
7
Management Discussion of Fund Performance (Unaudited) (continued)
The performance data quoted represents past performance and does not guarantee future results. The investment return and principal value of an investment in the Fund will fluctuate so that an investor’s shares, when redeemed, may be worth more or less than their original cost. Current performance of the Fund may be lower or higher than the performance quoted. Performance data current to the most recent month end may be obtained by calling 1-888-695-3729. The total expense ratio is 0.99%. This operating expense limitation does not apply to interest, taxes, brokerage commissions, other expenditures which are capitalized in accordance with generally accepted accounting principles, other extraordinary expenses not incurred in the ordinary course of the Fund’s business, dividend expense on short sales, expenses incurred under a Rule 12b-1 plan of distribution, “acquired fund fees and expenses,” and expenses that the Fund has incurred but did not actually pay because of an expense offset arrangement.
Portfolio holdings are subject to change without notice and are not intended as recommendations of individual stocks.
The S&P 500® Index is a broad market-weighted average of U.S. blue-chip companies. This index is unmanaged, and investors cannot actually make investments in this index.
The views and opinions expressed in this material are of the author and may or may not be accurate over the long term. While we believe we have a reasonable basis for our appraisals and we have confidence in our opinions, actual results may differ materially from those we anticipate. These opinions are current as of the date of this report but are subject to change. There is no guarantee that any forecasts or opinions in this material will be realized. Information should not be construed as investment advice. The information provided in this material should not be considered a recommendation to buy, sell or hold any particular security.
Investing involves risk, including loss of principal. There is no guarantee that this, or any, investing strategy will be successful. Diversification does not ensure a profit or guarantee against loss. Investing in value stocks presents the risk that the stocks may never reach what the adviser believes are their full market values. There are no guarantees that dividend paying stocks will continue to pay dividends.
The Fund may lose money due to fluctuations within the stock market which may be unrelated to individual issuers and could not have been predicted. The price of the securities which the Fund holds may change unpredictably and due to local, regional, international, or global events. These events may include economic downturns such as recessions or depressions; natural occurrences such as natural disasters, epidemics or
8
Management Discussion of Fund Performance (Unaudited) (continued)
pandemics; acts of violence such as terrorism or war; and political and social unrest. Due to the prominence of globalization and global trade, the securities held by the Fund may be affected by international and global events. In the case of a general market downturn, multiple asset classes, or the entire market, may be negatively affected for an extended and unknown amount of time. Although all securities are subject to these risk, different securities will be affected in different manners depending on the event.
The Fund’s prospectus contains important information about the Fund’s investment objectives, potential risks, management fees, and charges and expenses and should be read carefully before investing. You may obtain a current copy of the Fund’s prospectus by calling 1-800-695-3729. Distributed by Ultimus Fund Distributors, LLC.
9
Investment Results (Unaudited)
Average Annual Total Returns(a) as of October 31, 2023
| Since | Inception | ||||
| One Year | Five Year | Ten Year | Inception | Date | |
| Kovitz Core Equity ETF – NAV | 9.47% | 7.98% | 7.82% | 10.35% | 12/27/11 |
| Kovitz Core Equity ETF – Market Price | N/A | N/A | N/A | 8.73% | 12/9/22 |
| S&P 500® Index(b) | 10.14% | 11.01% | 11.18% | 12.81% | 12/27/11 |
Total annual operating expenses, as disclosed in the Kovitz Core Equity ETF (the “Fund”) prospectus dated February 28, 2023, as supplemented on May 5, 2023, were 0.99% of average daily net assets. Kovitz Investment Group Partners, LLC (the “Adviser”) is required to pay all of the operating expenses of the Fund except portfolio transactions and other investment related costs (such as brokerage fees and commissions, and fees and expenses associated with investments in derivative instruments, including futures, option and swap fees and expenses), taxes, borrowing costs (such as interest and dividend expense on securities sold short), extraordinary expenses, and any indirect expenses (such as fees and expenses associated with investment in acquired funds and other collective investment vehicles). Additional information pertaining to the Fund’s expense ratios as of October 31, 2023 can be found in the financial highlights.
The performance quoted represents past performance, which does not guarantee future results. The investment return and principal value of an investment will fluctuate so that an investor’s shares, when redeemed, may be worth more or less than their original cost. The returns shown do not reflect deduction of taxes that a shareholder would pay on Fund distributions or the redemption of Fund shares. The Fund’s investment objective, risks, charges and expenses should be considered carefully before investing. Current performance of the Fund may be lower or higher than the performance quoted. Performance data current to the most recent month-end may be obtained by calling (877) 714-2327. The Fund’s per share net asset value (“NAV”) is the value of one share of the Fund as calculated in accordance with the standard formula for valuing shares. The NAV return is based on the NAV of the Fund and the market return is based on the market price per share of the Fund. The price used to calculate market return (“Market Price”) is determined by using the midpoint between the highest bid and the lowest offer on the primary stock exchange on which the shares of the Fund are listed for trading, as of the time that the Fund’s NAV is calculated. Market Price and NAV returns assume that dividends and capital gain distributions have been reinvested in the Fund at Market Price and NAV, respectively. Since exchange-traded funds are bought and sold at prices set by the market, which can result in a premium or discount to NAV, the returns calculated using Market Price can differ from those calculated using NAV.
The returns presented above for the Fund reflect the performance of the Green Owl Intrinsic Value Fund (the “Predecessor Fund”) for periods prior to December 9, 2022. The Fund has adopted the performance of the Predecessor Fund as the result of a reorganization consummated after the close of business on December 9, 2022, in which the Fund acquired all or substantially all of the assets and all of the stated liabilities included in the financial statements of the Predecessor Fund (the “Reorganization”). Prior to the Reorganization, the Fund was a “shell” fund with no assets and had not commenced operations.
| (a) | Return figures reflect any change in price per share and assume the reinvestment of all distributions. The Fund’s returns reflect any fee reductions during the applicable periods. If such fee reductions had not occurred, the quoted performance would have been lower. Total returns for periods less than one year are not annualized. |
10
Investment Results (Unaudited) (continued)
| (b) | The S&P 500® Index (the “Index”) is an unmanaged index generally representing the performance of the broad domestic economy through changes in the aggregate market value of 500 stocks representing all major industries. Individuals cannot invest directly in the Index; however, an individual may invest in exchange-traded funds or other investment vehicles that attempt to track the performance of a benchmark index. |
The Fund’s investment objective, strategies, risks, charges and expenses should be considered carefully before investing. The prospectus contains this and other important information about the Fund and may be obtained by calling the same number as above. Please read it carefully before investing.
Comparison of the Growth of a $10,000 Investment in the Kovitz Core Equity ETF - NAV and the S&P 500® Index (Unaudited)
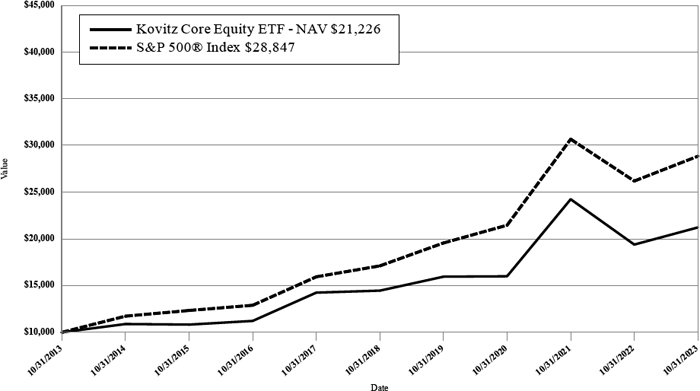
The Fund commenced operations on December 22, 2011, however the Fund did not invest in long-term securities towards its investment objective until December 27, 2011. December 27, 2011 is the performance calculation inception date. The chart above assumes an initial investment of $10,000 made on October 31, 2013 and held through October 31, 2023. THE FUND’S RETURNS REPRESENT PAST PERFORMANCE AND DO NOT GUARANTEE FUTURE RESULTS. The returns shown do not reflect deduction of taxes that a shareholder would pay on Fund distributions or the redemption of Fund shares. Investment returns and principal values will fluctuate so that your shares, when redeemed, may be worth more or less than their original purchase price.
Current performance may be lower or higher than the performance data quoted. For more information on the Fund, and to obtain performance data current to the most recent month-end or to request a prospectus, please call (877) 714-2327. You should carefully consider the investment objective, potential risks, management fees, and charges and expenses of the Fund before investing. The Fund’s prospectus contains this and other information about the Fund, and should be read carefully before investing.
The Fund is distributed by Northern Lights Distributors, LLC, Member FINRA/SIPC.
11
Fund Holdings (Unaudited)
Kovitz Core Equity ETF Holdings as of October 31, 2023*
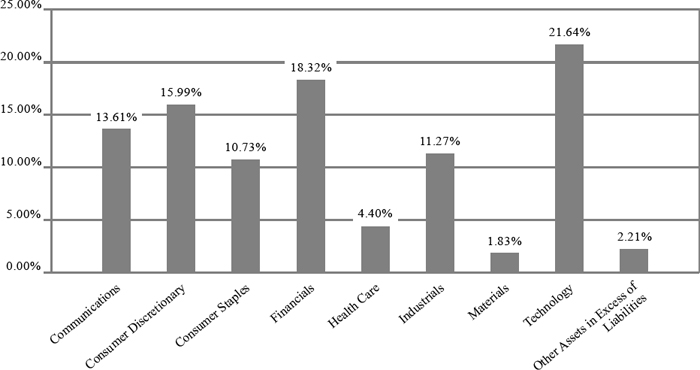
| * | As a percentage of net assets. |
The Fund’s investment objective is long-term capital appreciation.
Portfolio holdings are subject to change.
Availability of Portfolio Schedule (Unaudited)
The Fund files its complete schedule of portfolio holdings with the Securities and Exchange Commission (the “SEC”) for the first and third quarters of each fiscal year as an exhibit to its reports on Form N-PORT. The Fund’s Form N-PORT reports are available on the SEC’s website at www. sec.gov and on the Fund’s website at www.kovitzetf.com.
12
| Kovitz Core Equity ETF |
| Schedule of Investments |
| October 31, 2023 |
| COMMON STOCKS — 97.79% | Shares | Fair Value | ||||||
| Communications — 13.61% | ||||||||
| Alphabet, Inc., Class A(a) | 79,461 | $ | 9,859,521 | |||||
| Alphabet, Inc., Class C(a) | 295,641 | 37,043,817 | ||||||
| Charter Communications, Inc., Class A(a) | 58,594 | 23,601,663 | ||||||
| Meta Platforms, Inc., Class A(a) | 110,537 | 33,301,483 | ||||||
| Spotify Technology SA(a) | 57,141 | 9,414,551 | ||||||
| 113,221,035 | ||||||||
| Consumer Discretionary — 15.99% | ||||||||
| Amazon.com, Inc.(a) | 252,893 | 33,657,529 | ||||||
| CarMax, Inc.(a) | 264,967 | 16,186,834 | ||||||
| General Motors Co. | 289,386 | 8,160,685 | ||||||
| Gildan Activewear, Inc. | 627,727 | 17,833,724 | ||||||
| Hasbro, Inc. | 345,039 | 15,578,511 | ||||||
| Las Vegas Sands Corp. | 340,717 | 16,170,429 | ||||||
| Lowe’s Companies, Inc. | 133,768 | 25,492,168 | ||||||
| 133,079,880 | ||||||||
| Consumer Staples — 10.73% | ||||||||
| Diageo PLC - ADR | 159,221 | 24,440,424 | ||||||
| Dollar Tree, Inc.(a) | 242,194 | 26,905,331 | ||||||
| Philip Morris International, Inc. | 425,630 | 37,949,171 | ||||||
| 89,294,926 | ||||||||
| Financials — 18.32% | ||||||||
| American Express Co. | 179,630 | 26,231,369 | ||||||
| Aon PLC, Class A | 41,508 | 12,842,575 | ||||||
| Berkshire Hathaway, Inc., Class B(a) | 106,008 | 36,183,712 | ||||||
| Charles Schwab Corp. (The) | 572,833 | 29,810,229 | ||||||
| Intercontinental Exchange, Inc. | 201,151 | 21,611,663 | ||||||
| JPMorgan Chase & Co. | 185,171 | 25,749,879 | ||||||
| 152,429,427 | ||||||||
| Health Care — 4.40% | ||||||||
| Abbott Laboratories | 6,174 | 583,752 | ||||||
| Becton, Dickinson and Co. | 138,074 | 34,902,346 | ||||||
| Stryker Corp. | 4,237 | 1,144,922 | ||||||
| 36,631,020 | ||||||||
| Industrials — 11.27% | ||||||||
| Equifax, Inc. | 2,858 | 484,631 | ||||||
| Graco, Inc. | 13,709 | 1,019,264 | ||||||
| Hayward Holdings, Inc.(a) | 469,282 | 4,927,461 | ||||||
| Jacobs Solutions, Inc. | 257,037 | 34,263,032 | ||||||
| Johnson Controls International PLC | 10,283 | 504,073 | ||||||
| Keysight Technologies, Inc.(a) | 204,194 | 24,921,877 | ||||||
| Lincoln Electric Holdings, Inc. | 6,027 | 1,053,520 | ||||||
| PACCAR, Inc. | 313,147 | 25,844,022 | ||||||
| Verisk Analytics, Inc. | 3,442 | 782,573 | ||||||
| 93,800,453 | ||||||||
| Materials — 1.83% | ||||||||
| PPG Industries, Inc. | 124,301 | 15,260,434 | ||||||
See accompanying notes which are an integral part of these financial statements.
13
| Kovitz Core Equity ETF |
| Schedule of Investments (continued) |
| October 31, 2023 |
| COMMON STOCKS — 97.79% - continued | Shares | Fair Value | ||||||
| Technology — 21.64% | ||||||||
| Analog Devices, Inc. | 158,504 | $ | 24,937,435 | |||||
| Apple, Inc. | 121,254 | 20,706,545 | ||||||
| Arista Networks, Inc.(a) | 83,464 | 16,723,682 | ||||||
| Autodesk, Inc.(a) | 77,919 | 15,399,132 | ||||||
| Microsoft Corp. | 6,827 | 2,308,277 | ||||||
| Motorola Solutions, Inc. | 88,995 | 24,781,547 | ||||||
| Salesforce, Inc.(a) | 129,909 | 26,089,623 | ||||||
| Splunk, Inc.(a) | 109,410 | 16,100,776 | ||||||
| Texas Instruments, Inc. | 7,433 | 1,055,560 | ||||||
| Visa, Inc., Class A | 135,847 | 31,937,630 | ||||||
| 180,040,207 | ||||||||
| Total Common Stocks/Investments — 97.79% (Cost $708,247,145) | 813,757,382 | |||||||
| Other Assets in Excess of Liabilities — 2.21% | 18,411,489 | |||||||
| NET ASSETS — 100.00% | $ | 832,168,871 | ||||||
| (a) | Non-income producing security. |
ADR - American Depositary Receipt
See accompanying notes which are an integral part of these financial statements.
14
| Kovitz Core Equity ETF |
| Statement of Assets and Liabilities |
| October 31, 2023 |
| Assets | ||||
| Investments in securities at fair value (cost $708,247,145) (Note 3) | $ | 813,757,382 | ||
| Cash | 18,339,751 | |||
| Receivable for investments sold | 419,277 | |||
| Dividends and interest receivable | 678,323 | |||
| Tax reclaims receivable | 40,242 | |||
| Total Assets | 833,234,975 | |||
| Liabilities | ||||
| Payable for fund shares redeemed | 432,084 | |||
| Payable to Adviser (Note 4) | 634,020 | |||
| Total Liabilities | 1,066,104 | |||
| Net Assets | $ | 832,168,871 | ||
| Net Assets consist of: | ||||
| Paid-in capital | $ | 738,867,554 | ||
| Accumulated earnings | 93,301,317 | |||
| Net Assets | $ | 832,168,871 | ||
| Shares outstanding (unlimited number of shares authorized, no par value) | 47,648,196 | |||
| Net asset value, offering and redemption price per share (Note 2) | $ | 17.46 |
See accompanying notes which are an integral part of these financial statements.
15
| Kovitz Core Equity ETF |
| Statement of Operations |
| For the year ended October 31, 2023 |
| Investment Income | ||||
| Dividend income (net of foreign taxes withheld of $61,884) | $ | 8,691,132 | ||
| Interest income | 323,843 | |||
| Total investment income | 9,014,975 | |||
| Expenses | ||||
| Investment Adviser fees (Note 4) | 7,153,612 | |||
| Administration fees (Note 4) | 5,255 | |||
| Fund accounting fees (Note 4) | 2,628 | |||
| Custodian fees | 2,494 | |||
| Transfer agent fees (Note 4) | 2,434 | |||
| Compliance service fees (Note 4) | 1,999 | |||
| Legal fees | 1,500 | |||
| Miscellaneous expenses | 26,652 | |||
| Total expenses | 7,196,574 | |||
| Fees contractually waived by Adviser | (35,053 | ) | ||
| Net operating expenses | 7,161,521 | |||
| Net investment income | 1,853,454 | |||
| Net Realized and Change in Unrealized Gain (Loss) on Investments | ||||
| Net realized gain on: | ||||
| Investment securities | 76,985,720 | |||
| Foreign currency translations | 6 | |||
| Net change in unrealized appreciation (depreciation) on: | ||||
| Investment securities transactions | (24,691,318 | ) | ||
| Foreign currency translations | 773 | |||
| Net realized and change in unrealized gain on investments | 52,295,181 | |||
| Net increase in net assets resulting from operations | $ | 54,148,635 |
See accompanying notes which are an integral part of these financial statements.
16
| Kovitz Core Equity ETF |
| Statements of Changes in Net Assets |
| For the Year | For the Year | |||||||
| Ended October | Ended October | |||||||
| 31, 2023(a) | 31, 2022 | |||||||
| Increase (Decrease) in Net Assets due to: | ||||||||
| Operations | ||||||||
| Net investment income (loss) | $ | 1,853,454 | $ | (155,809 | ) | |||
| Net realized gain on investment securities transactions and foreign currency translations | 76,985,726 | 7,554,422 | ||||||
| Net change in unrealized depreciation of investment securities and foreign currency translations | (24,690,545 | ) | (26,915,653 | ) | ||||
| Net increase (decrease) in net assets resulting from operations | 54,148,635 | (19,517,040 | ) | |||||
| Distributions to Shareholders from Earnings (Note 2) | (8,121,134 | ) | (15,703,324 | ) | ||||
| Capital Transactions | ||||||||
| Proceeds from shares sold | 890,609,829 | 10,452,803 | ||||||
| Reinvestment of distributions | 7,301,870 | 15,022,739 | ||||||
| Amount paid for shares redeemed | (188,345,915 | ) | (13,046,563 | ) | ||||
| Net increase in net assets resulting from capital transactions | 709,565,784 | 12,428,979 | ||||||
| Total Increase (Decrease) in Net Assets | �� | 755,593,285 | (22,791,385 | ) | ||||
| Net Assets | ||||||||
| Beginning of year | 76,575,586 | 99,366,971 | ||||||
| End of year | $ | 832,168,871 | $ | 76,575,586 | ||||
| Share Transactions | ||||||||
| Shares sold | 53,895,572 | 525,123 | ||||||
| Shares issued in reinvestment of distributions | 452,689 | 684,095 | ||||||
| Shares redeemed | (11,017,397 | ) | (654,391 | ) | ||||
| Net increase in shares outstanding | 43,330,864 | 554,827 | ||||||
| (a) | See Note 1. |
See accompanying notes which are an integral part of these financial statements.
17
| Kovitz Core Equity ETF |
| Financial Highlights |
| (For a share outstanding during each year) |
| For the Years Ended October 31, | ||||||||||||||||||||
| 2023 | 2022 | 2021 | 2020 | 2019 | ||||||||||||||||
| Selected Per Share Data | ||||||||||||||||||||
| Net asset value, beginning of year | $ | 17.74 | $ | 26.41 | $ | 17.94 | $ | 18.81 | $ | 18.99 | ||||||||||
| Investment operations: | ||||||||||||||||||||
| Net investment income (loss) | 0.06 | (0.04 | ) | (0.04 | ) | 0.03 | 0.19 | |||||||||||||
| Net realized and unrealized gain (loss) on investments | 1.47 | (4.44 | ) | 9.10 | 0.05 | 1.47 | ||||||||||||||
| Total from investment operations | 1.53 | (4.48 | ) | 9.06 | 0.08 | 1.66 | ||||||||||||||
| Less distributions to shareholders from: | ||||||||||||||||||||
| Net investment income | (0.01 | ) | — | — | (a) | (0.17 | ) | (0.05 | ) | |||||||||||
| Net realized gains | (1.80 | ) | (4.19 | ) | (0.59 | ) | (0.78 | ) | (1.79 | ) | ||||||||||
| Total distributions | (1.81 | ) | (4.19 | ) | (0.59 | ) | (0.95 | ) | (1.84 | ) | ||||||||||
| Net asset value, end of year | $ | 17.46 | $ | 17.74 | $ | 26.41 | $ | 17.94 | $ | 18.81 | ||||||||||
| Market price, end of period | $ | 17.48 | $ | — | $ | — | $ | — | $ | — | ||||||||||
| Total Return(b) | 9.47 | % | (20.01 | )% | 51.56 | % | 0.23 | % | 10.34 | % | ||||||||||
| Ratios and Supplemental Data: | ||||||||||||||||||||
| Net assets, end of year (000 omitted) | $ | 832,169 | $ | 76,576 | $ | 99,367 | $ | 77,665 | $ | 83,966 | ||||||||||
| Ratio of expenses to average net assets after expense waiver | 0.99 | % | 1.10 | % | 1.10 | % | 1.10 | % | 1.10 | % | ||||||||||
| Ratio of expenses to average net assets before expense waiver | 1.00 | % | 1.30 | % | 1.28 | % | 1.34 | % | 1.32 | % | ||||||||||
| Ratio of net investment income (loss) to average net assets after expense waiver | 0.26 | % | (0.18 | )% | (0.17 | )% | 0.15 | % | 1.04 | % | ||||||||||
| Portfolio turnover rate(c) | 20 | % | 26 | % | 20 | % | 46 | % | 29 | % | ||||||||||
| (a) | Rounds to less than $0.005 per share. |
| (b) | Total return is calculated assuming a purchase of shares at net asset value on the first day and a sale at net asset value on the last day of the period. Distributions are assumed, for the purpose of this calculation, to be reinvested at the ex-dividend date net asset value per share on their respective payment dates. |
| (c) | Portfolio turnover rate excludes securities received or delivered from in-kind processing of creations or redemptions. |
See accompanying notes which are an integral part of these financial statements.
18
| Kovitz Core Equity ETF |
| Notes to the Financial Statements |
| October 31, 2023 |
NOTE 1. ORGANIZATION
The Kovitz Core Equity ETF (the “Fund”) is registered under the Investment Company Act of 1940, as amended (the “1940 Act”), as an open-end diversified series of Valued Advisers Trust (the “Trust”). The Trust is a management investment company established under the laws of Delaware by an Agreement and Declaration of Trust dated June 13, 2008 (the “Trust Agreement”). The Trust Agreement permits the Board of Trustees (the “Board”) to issue an unlimited number of shares of beneficial interest of separate series without par value. The Fund is one of a series of funds authorized by the Board. The Fund’s investment adviser is Kovitz Investment Group Partners, LLC (the “Adviser”). The investment objective of the Fund is to provide long-term capital appreciation.
The Fund is the successor in interest to the Green Owl Intrinsic Value Fund (the “Predecessor Fund”). The Predecessor Fund was previously organized as a series of the Trust, and advised by the Adviser. On June 1-2, 2022, the Board of Trustees of the Trust (the “Board”) approved the reorganization of the Predecessor Fund with and into the Fund, a “shell” series of the Trust, and effective as of the close of business on December 9, 2022, the Fund acquired all or substantially all of the assets and all of the stated liabilities included in the financial statements of the Predecessor Fund (the “Reorganization”). The Fund succeeded to the accounting and performance histories of the Predecessor Fund. Any such historical information provided in these financial statements for the Fund that relates to periods prior to December 9, 2022, is therefore that of the Predecessor Fund. The Predecessor Fund had the same investment objectives and substantially similar investment strategies to the Fund, and was managed by the same portfolio managers as the Fund. The Predecessor Fund commenced operations in 2011.
On June 1-2, 2022, the Board also approved the reorganization of The Marathon Value Portfolio, a series of Northern Lights Fund Trust III (the “Marathon Fund”), with and into the Fund, and effective as of the close of business on December 9, 2022 the assets and liabilities of the Marathon Fund were transferred to the Fund in exchange for shares of the Fund. The Marathon Fund had similar investment objectives and policies as the Fund and was managed by the same portfolio managers. The Adviser also managed the assets of multiple separately managed accounts (the “SMAs”) that were transferred to the Fund. The Predecessor Fund, Marathon Fund, and SMAs benefit from the Reorganization from additional trading flexibility due to the listing of Fund shares on an exchange, which enables investors to purchase or sell shares of the Fund throughout the trading day based on market prices. Exchange Traded Funds (“ETFs”) also benefit from improved tax efficiency due to the mechanics of the creation and redemption process for ETFs, which generally allows an ETF to minimize the realization of capital gains through the in-kind acquisition and redemption of securities. The Predecessor Fund also benefits as the lower expense
19
| Kovitz Core Equity ETF |
| Notes to the Financial Statements (continued) |
| October 31, 2023 |
structure of the Fund applies to the Predecessor Fund following the Reorganization. The Adviser paid all costs surrounding the Reorganizations. The Reorganizations were tax-free, and the cost basis of the Predecessor Fund, the Marathon Fund, and the SMAs were carried forward to the Fund for tax and financial reporting purposes. The details of the Reorganization are show below:
| Green Owl | Separately | |||||||||||||||
| Marathon | Intrinsic Value | Managed | Kovitz Core | |||||||||||||
| Value Portfolio | Fund | Accounts | Equity ETF | |||||||||||||
| Net Assets | $ | 36,450,830 | $ | 68,470,202 | $ | 537,168,777 | $ | 642,089,809 | ||||||||
| Unrealized Appreciation (Depreciation) | $ | 19,136,832 | $ | 16,996,079 | $ | 94,721,709 | $ | 130,854,620 | ||||||||
| Cost of Investments | $ | 17,270,631 | $ | 51,465,619 | $ | 442,447,069 | $ | 511,183,319 | ||||||||
| Market Value of Investments | $ | 36,407,463 | $ | 68,461,699 | $ | 537,168,777 | $ | 642,037,939 | ||||||||
| Conversion Ratio | 0.78309509 | 1 | — | — | ||||||||||||
| Shares Outstanding | 2,265,003 | 4,254,647 | 33,379,033 | 39,898,683 | ||||||||||||
| Net Asset Value Per Share | $ | 12.60 | $ | 16.09 | — | — | ||||||||||
NOTE 2. SIGNIFICANT ACCOUNTING POLICIES
The Fund is an investment company and follows accounting and reporting guidance under Financial Accounting Standards Board Accounting Standards Codification (“ASC”) Topic 946, “Financial Services-Investment Companies”. The following is a summary of significant accounting policies followed by the Fund in the preparation of its financial statements. These policies are in conformity with generally accepted accounting principles in the United States of America (“GAAP”).
Regulatory Update – Tailored Shareholder Reports for Mutual Funds and Exchange-Traded Funds (“ETFs”) – Effective January 24, 2023, the Securities and Exchange Commission adopted rule and form amendments to require mutual funds and ETFs to transmit concise and visually engaging streamlined annual and semiannual reports to shareholders that highlight key information. Other information, including financial statements, will no longer appear in a streamlined shareholder report but must be available online, delivered free of charge upon request, and filed on a semiannual basis on Form N-CSR. The rule and form amendments have a compliance date of July 24, 2024. At this time, management is evaluating the impact of these amendments on the shareholder reports for the Fund.
Estimates – The preparation of financial statements in conformity with GAAP requires management to make estimates and assumptions that affect the reported amounts of assets and liabilities and disclosure of contingent assets and liabilities at the date of the financial statements and the reported amounts of increases and decreases in net assets from operations during the reporting period. Actual results could differ from those estimates.
20
| Kovitz Core Equity ETF |
| Notes to the Financial Statements (continued) |
| October 31, 2023 |
Foreign Currency Translation – The accounting records of the Fund are maintained in U.S. dollars. Foreign currency amounts are translated into U.S. dollars at the current rate of exchange each business day to determine the value of investments, and other assets and liabilities. Purchases and sales of foreign securities, and income and expenses, are translated at the prevailing rate of exchange on the respective date of these transactions. The Fund does not isolate that portion of the results of operations resulting from changes in foreign exchange rates on investments from fluctuation arising from changes in market prices of securities held. These fluctuations are included with the unrealized gain or loss from investments. Reported net realized foreign exchange gains or losses arise from sales of foreign currencies, currency gains or losses realized between the trade and settlement dates on securities transactions, and the difference between the amounts of dividends, interest, and foreign withholding taxes recorded on the Fund’s books and the U.S. dollar equivalent of the amounts actually received or paid. Net unrealized foreign exchange gains and losses arise from changes in the fair values of assets and liabilities, other than investments in securities at period end, resulting from changes in exchange rates.
Federal Income Taxes – The Fund makes no provision for federal income or excise tax. The Fund has qualified and intends to qualify each year as a regulated investment company (“RIC”) under subchapter M of the Internal Revenue Code of 1986, as amended, by complying with the requirements applicable to RICs and by distributing substantially all of its taxable income. The Fund also intends to distribute sufficient net investment income and net realized capital gains, if any, so that it will not be subject to excise tax on undistributed income and gains. If the required amount of net investment income or gains is not distributed, the Fund could incur a tax expense.
As of and during the fiscal year ended October 31, 2023, the Fund did not have any liabilities for any unrecognized tax benefits. The Fund recognizes interest and penalties, if any, related to unrecognized tax benefits as income tax expense on the Statement of Operations when incurred. During the fiscal year ended October 31, 2023, the Fund did not incur any interest or penalties. Management of the Fund has reviewed tax positions taken in tax years that remain subject to examination by all major tax jurisdictions, including federal (i.e., the last three tax year ends and the interim tax period since then, as applicable). Management believes that there is no tax liability resulting from unrecognized tax benefits related to uncertain tax positions taken.
Expenses – Expenses incurred by the Trust that do not relate to a specific fund of the Trust are allocated to the individual funds based on each fund’s relative net assets or another appropriate basis (as determined by the Board). The Adviser has agreed to pay all regular and recurring expenses of the Fund under terms of the management agreement.
21
| Kovitz Core Equity ETF |
| Notes to the Financial Statements (continued) |
| October 31, 2023 |
Security Transactions and Related Income – The Fund follows industry practice and records security transactions on the trade date for financial reporting purposes. The specific identification method is used for determining gains or losses for financial statement and income tax purposes. Dividend income is recorded on the ex-dividend date and interest income is recorded on an accrual basis. Non-cash income, if any, is recorded at the fair market value of the securities received. Withholding taxes on foreign dividends, if any, have been provided for in accordance with the Fund’s understanding of the applicable country’s tax rules and rates.
Dividends and Distributions – The Fund intends to distribute its net investment income and net realized long-term and short-term capital gains, if any, at least annually. Dividends and distributions to shareholders, which are determined in accordance with income tax regulations, are recorded on the ex-dividend date. The treatment for financial reporting purposes of distributions made to shareholders during the period from net investment income or net realized capital gains may differ from their ultimate treatment for federal income tax purposes. These differences are caused primarily by differences in the timing of the recognition of certain components of income, expense or realized capital gain for federal income tax purposes. Where such differences are permanent in nature, they are reclassified among the components of net assets based on their ultimate characterization for federal income tax purposes. Any such reclassifications will have no effect on net assets, results of operations or net asset value (“NAV”) per share of the Fund.
For the fiscal year ended October 31, 2023, the Fund made the following reclassifications primarily due to redemptions in kind, equalization, and merger adjustments to increase (decrease) the components of net assets:
| Accumulated Earnings | ||||||
| Paid-In Capital | (Deficit) | |||||
| $ | 90,499,509 | $ | (90,499,509 | ) | ||
Share Valuation – The NAV is calculated each day the New York Stock Exchange (the “NYSE”) is open by dividing the total value of the Fund’s assets, less liabilities, by the number of shares outstanding for the Fund.
NOTE 3. SECURITIES VALUATION AND FAIR VALUE MEASUREMENTS
The Fund values its portfolio securities at fair value as of the close of regular trading on the New York Stock Exchange (“NYSE”) (normally 4:00 p.m. Eastern Time) on each business day the NYSE is open for business. Fair value is defined as the price that the Fund would receive upon selling an investment in a timely transaction to an independent buyer in the principal or most advantageous market of the investment. GAAP establishes a three-tier hierarchy to maximize the use of observable market data and minimize the
22
| Kovitz Core Equity ETF |
| Notes to the Financial Statements (continued) |
| October 31, 2023 |
use of unobservable inputs and to establish classification of fair value measurements for disclosure purposes.
Inputs refer broadly to the assumptions that market participants would use in pricing the asset or liability, including assumptions about risk (the risk inherent in a particular valuation technique used to measure fair value including a pricing model and/or the risk inherent in the inputs to the valuation technique). Inputs may be observable or unobservable. Observable inputs are inputs that reflect the assumptions market participants would use in pricing the asset or liability developed based on market data obtained and available from sources independent of the reporting entity. Unobservable inputs are inputs that reflect the reporting entity’s own assumptions about the assumptions market participants would use in pricing the asset or liability developed based on the best information available in the circumstances.
Various inputs are used in determining the value of the Fund’s investments. These inputs are summarized in the three broad levels listed below.
| • | Level 1 – unadjusted quoted prices in active markets for identical investments and/or registered investment companies where the value per share is determined and published and is the basis for current transactions for identical assets or liabilities at the valuation date |
| • | Level 2 – other significant observable inputs (including, but not limited to, quoted prices for an identical security in an inactive market, quoted prices for similar securities, interest rates, prepayment speeds, credit risk, etc.) |
| • | Level 3 – significant unobservable inputs (including the Fund’s own assumptions in determining fair value of investments based on the best information available) |
The inputs used to measure fair value may fall into different levels of the fair value hierarchy. In such cases, for disclosure purposes, the level in the fair value hierarchy which is reported is determined based on the lowest level input that is significant to the fair value measurement in its entirety.
Equity securities that are traded on any stock exchange are generally valued at the last quoted sale price on the security’s primary exchange. Lacking a last sale price, an exchange-traded security is generally valued at its last bid price. Securities traded in the Nasdaq over-the-counter market are generally valued at the Nasdaq Official Closing Price. When using the market quotations and when the market is considered active, the security is classified as a Level 1 security. In the event that market quotations are not readily available or are considered unreliable due to market or other events, securities are valued in good faith by the Adviser as “Valuation Designee” under the oversight of the Board. The
23
| Kovitz Core Equity ETF |
| Notes to the Financial Statements (continued) |
| October 31, 2023 |
Adviser has adopted written policies and procedures for valuing securities and other assets in circumstances where market quotes are not readily available. In the event that market quotes are not readily available, and the security or asset cannot be valued pursuant to one of the valuation methods, the value of the security or asset will be determined in good faith by the Adviser pursuant to its policies and procedures. On a quarterly basis, the Adviser’s fair valuation determinations will be reviewed by the Board. Under these policies, the securities will be classified as Level 2 or 3 within the fair value hierarchy, depending on the inputs used.
Investments in mutual funds, including money market mutual funds, are generally priced at the ending NAV. These securities are categorized as Level 1 securities.
The following is a summary of the inputs used to value the Fund’s investments as of October 31, 2023:
| Valuation Inputs | ||||||||||||||||
| Assets | Level 1 | Level 2 | Level 3 | Total | ||||||||||||
| Common Stocks (a) | $ | 813,757,382 | $ | — | $ | — | $ | 813,757,382 | ||||||||
| Total | $ | 813,757,382 | $ | — | $ | — | $ | 813,757,382 | ||||||||
| (a) | Refer to Schedule of Investments for sector classifications. |
The Fund did not hold any investments at the end of the reporting period for which significant unobservable inputs (Level 3) were used in determining fair value; therefore, no reconciliation of Level 3 securities is included for this reporting period.
NOTE 4. ADVISER FEES AND OTHER TRANSACTIONS
Under the terms of the management agreement, on behalf of the Fund, effective December 9, 2022, the Adviser is responsible for substantially all expenses of the Fund, including the cost of transfer agency, custody, fund administration, compensation paid to the Independent Board Members, legal, audit and other services, except for the fee payments to the Adviser under the Investment Advisory Agreement (also known as a “unitary advisory fee”), interest expense, acquired fund fees and expenses, taxes, brokerage expenses, distribution fees or expenses (if any), litigation expenses and other extraordinary expenses. The Fund pays the Adviser a unitary advisory fee at an annual rate equal to 0.99% of the Fund’s average daily net assets. Prior to the close of business on December 9, 2022 the Fund paid the Adviser a management fee, computed and accrued daily and paid monthly, at an annual rate of 1.00% of the Fund’s average daily net assets. For the fiscal year ended October 31, 2023, the Adviser earned a fee of $7,153,612 from the Fund. At October 31, 2023, the Fund owed the Adviser $634,020.
24
| Kovitz Core Equity ETF |
| Notes to the Financial Statements (continued) |
| October 31, 2023 |
On February 27, 2023, Focus Financial Partners Inc., the ultimate parent company of the Adviser, agreed to be acquired by investment vehicles affiliated with Clayton, Dubilier & Rice, LLC and Stone Point Capital LLC (the “Transaction”). In connection with the Transaction, the investment advisory agreement (the “Previous Advisory Agreement”) between the Adviser and the Trust, on behalf of the Fund, was terminated, effective August 31, 2023, and the Board approved (i) an interim investment advisory agreement (the “Interim Advisory Agreement”) between the Adviser and the Trust, on behalf of the Fund, effective August 31, 2023; and (ii) a new investment advisory agreement (the “New Advisory Agreement”) between the Adviser and the Trust on behalf of the Fund. The Interim Advisory Agreement had the same material terms and fee arrangements as the Previous Advisory Agreement, except for certain escrow provisions. The New Advisory Agreement was approved by the shareholders of the Fund at a Special Meeting of Shareholders held on September 5, 2023.
The Adviser and the Predecessor Fund entered into an expense limitation agreement in which the Adviser agreed to waive its fees and/or reimburse other expenses so that Total Annual Fund Operating Expenses did not exceed 1.10%. This operating expense limitation did not apply to interest, taxes, brokerage commissions, other expenditures which are capitalized in accordance with GAAP, other extraordinary expenses not incurred in the ordinary course of the Predecessor Fund’s business, dividend expense on short sales, expenses incurred under a Rule 12b-1 plan of distribution, “acquired fund fees and expenses,” and expenses that the Predecessor Fund had incurred but did not actually pay because of an expense offset arrangement.
For the fiscal year ended October 31, 2023, the Adviser waived fees and/or reimbursed expenses of the Predecessor Fund of $35,053.
Ultimus Fund Solutions, LLC (“Ultimus”) provides administration and fund accounting to the Fund.
Northern Lights Compliance Services, LLC (“NLCS”), an affiliate of Ultimus, provides a Chief Compliance Officer and an Anti-Money Laundering Compliance Officer to the Trust, as well as related compliance services, pursuant to a consulting agreement between NLCS and the Trust.
The officers and one trustee of the Trust are members of management and/or employees of Ultimus or of NLCS, and are not paid by the Trust for services to the Fund. Northern Lights Distributors, LLC (the “Distributor”) acts as the distributor of the Fund’s shares. The Distributor is an affiliate of Ultimus. The Distributor is compensated by the Adviser (not the Fund) for acting as principal underwriter.
25
| Kovitz Core Equity ETF |
| Notes to the Financial Statements (continued) |
| October 31, 2023 |
NOTE 5. PURCHASES AND SALES OF SECURITIES
For the fiscal year ended October 31, 2023, purchases and sales of investment securities, other than short-term investments, were $141,528,074 and $157,892,497, respectively.
For the fiscal year ended October 31, 2023, purchases and sales for in-kind transactions were $815,446,043 and $176,563,618, respectively.
For the fiscal year ended October 31, 2023, the Fund had in-kind net realized gains of $90,408,002. The Fund did not have in-kind realized gains or losses for the fiscal year October 31, 2022.
NOTE 6. CAPITAL SHARE TRANSACTIONS
Shares are not individually redeemable and may be redeemed by the Fund at NAV only in large blocks known as “Creation Units”. Only Authorized Participants or transactions done through an Authorized Participant are permitted to purchase or redeem Creation Units from the Fund. An Authorized Participant is either (i) a broker-dealer or other participant in the clearing process through the Continuous Net Settlement System of the National Securities Clearing Corporation or (ii) a Depository Trust Company participant and, in each case, must have executed a Participant Agreement with the Distributor. Such transactions are generally permitted on an in-kind basis, with a balancing cash component to equate the transaction to the NAV per share of the Fund on the transaction date. Cash may be substituted equivalent to the value of certain securities generally when they are not available in sufficient quantity for delivery, not eligible for trading by the Authorized Participant or as a result of other market circumstances. In addition, the Fund may impose transaction fees on purchases and redemptions of Fund shares to cover the custodial and other costs incurred by the Fund in effecting trades. A fixed fee payable to the Custodian may be imposed on each creation and redemption transaction regardless of the number of Creation Units involved in the transaction (“Fixed Fee”). Purchases and redemptions of Creation Units for cash or involving cash-in-lieu are required to pay an additional variable charge to compensate the Fund and its ongoing shareholders for brokerage and market impact expenses relating to Creation Unit transactions (“Variable Charge”, and together with the Fixed Fee, the “Transaction Fees”). Transactions in capital shares for the Fund are disclosed in the Statements of Changes in Net Assets. For the fiscal year ended October 31, 2023, the Fund received $27,900 and $0 in fixed fees and variable fees, respectively. The Transaction Fees for the Fund are listed in the table below:
| Fixed Fee | Variable Charge | |
| $300 | 2.00%* |
| * | The maximum Transaction Fee may be up to 2.00% of the amount invested. |
26
| Kovitz Core Equity ETF |
| Notes to the Financial Statements (continued) |
| October 31, 2023 |
NOTE 7. FEDERAL TAX INFORMATION
At October 31, 2023, the net unrealized appreciation (depreciation) and tax cost of investments for tax purposes was as follows:
| Gross unrealized appreciation | $ | 136,791,540 | ||
| Gross unrealized depreciation | (31,824,871 | ) | ||
| Net unrealized appreciation on investments | $ | 104,966,669 | ||
| Tax cost of investments | $ | 708,790,713 |
At October 31, 2023, the difference between book basis and tax basis unrealized appreciation (depreciation) is attributable to the tax deferral of losses on wash sales, organizational expense amortization and ROC basis adjustments.
The tax character of distributions paid for the fiscal years ended October 31, 2023 and October 31, 2022 were as follows:
| 2023 | 2022 | |||||||
| Distributions paid from: | ||||||||
| Ordinary income(a) | $ | 493,074 | $ | 355,616 | ||||
| Long-term capital gains | 7,628,060 | (b) | 15,347,708 | |||||
| Total distributions paid | $ | 8,121,134 | $ | 15,703,324 | ||||
| (a) | Short-term capital gain distributions are treated as ordinary income for tax purposes. |
| (b) | The Predecessor Fund distributed $7,628,060 of long-term capital gains prior to the Reorganization that took place on December 9, 2022. |
At October 31, 2023, the components of accumulated earnings (deficit) on a tax basis were as follows:
| Undistributed Ordinary Income | $ | 1,126,549 | ||
| Accumulated Capital and Other Losses | (12,791,901 | ) | ||
| Unrealized Appreciation on Investments | 104,966,669 | |||
| Total Accumulated Earnings | $ | 93,301,317 |
As of October 31, 2023, the Fund had short-term and long-term capital loss carryforwards of $4,449,726 and $8,341,396, respectively. These capital loss carryforwards, which do not expire, may be utilized in future years to offset net realized capital gains, if any, prior to distrusting such gains to shareholders.
27
| Kovitz Core Equity ETF |
| Notes to the Financial Statements (continued) |
| October 31, 2023 |
NOTE 8. COMMITMENTS AND CONTINGENCIES
The Trust indemnifies its officers and Trustees for certain liabilities that may arise from their performance of their duties to the Trust or the Fund. Additionally, in the normal course of business, the Trust enters into contracts that contain a variety of representations and warranties which provide general indemnifications. The Trust’s maximum exposure under these arrangements is unknown, as this would involve future claims that may be made against the Trust that have not yet occurred.
NOTE 9. SUBSEQUENT EVENTS
Management of the Fund has evaluated the need for disclosures and/or adjustments resulting from subsequent events through the date at which these financial statements were issued. Based upon this evaluation, management has determined there were no items requiring adjustment of the financial statements or additional disclosure.
28
| Report of Independent Registered Public Accounting Firm |
To the Shareholders of Kovitz Core Equity ETF and
Board of Trustees of Valued Advisers Trust
Opinion on the Financial Statements
We have audited the accompanying statement of assets and liabilities, including the schedule of investments, of Kovitz Core Equity ETF (the “Fund”), a series of Valued Advisers Trust, as of October 31, 2023, the related statement of operations for the year then ended, the statements of changes in net assets for each of the two years in the period then ended, the related notes, and the financial highlights for each of the five years in the period then ended (collectively referred to as the “financial statements”). In our opinion, the financial statements present fairly, in all material respects, the financial position of the Fund as of October 31, 2023, the results of its operations for the year then ended, the changes in net assets for each of the two years in the period then ended, and the financial highlights for each of the five years in the period then ended, in conformity with accounting principles generally accepted in the United States of America.
Basis for Opinion
These financial statements are the responsibility of the Fund’s management. Our responsibility is to express an opinion on the Fund’s financial statements based on our audits. We are a public accounting firm registered with the Public Company Accounting Oversight Board (United States) (“PCAOB”) and are required to be independent with respect to the Fund in accordance with the U.S. federal securities laws and the applicable rules and regulations of the Securities and Exchange Commission and the PCAOB.
We conducted our audits in accordance with the standards of the PCAOB. Those standards require that we plan and perform the audit to obtain reasonable assurance about whether the financial statements are free of material misstatement whether due to error or fraud.
Our audits included performing procedures to assess the risks of material misstatement of the financial statements, whether due to error or fraud, and performing procedures that respond to those risks. Such procedures included examining, on a test basis, evidence regarding the amounts and disclosures in the financial statements. Our procedures included confirmation of securities owned as of October 31, 2023, by correspondence with the custodian and broker. Our audits also included evaluating the accounting principles used and significant estimates made by management, as well as evaluating the overall presentation of the financial statements. We believe that our audits provide a reasonable basis for our opinion.
We have served as the Fund’s auditor since 2012.
COHEN & COMPANY, LTD.
Cleveland, Ohio
December 29, 2023
29
| Proxy Voting Results (Unaudited) |
On September 5, 2023 a Special Meeting of Shareholders of the Fund was held for the purpose of voting on the following Proposal:
Proposal 1: To approve a new investment advisory agreement between the Trust, on behalf of the Fund, and the Adviser.
Shareholders of record as of June 23, 2023 were entitled to vote on the Proposal. A total of 46,740,669 shares of the Fund were entitled to vote on the Proposal and a total of 29,157,723 shares were voted, representing 62.38% of total shares.
The votes cast with respect to the Proposal were as follows:
| For: | 29,129,431 | |||
| Against: | 22,123 | |||
| Abstain: | 6,169 |
30
| Liquidity Risk Management Program (Unaudited) |
Valued Advisers Trust has adopted and implemented a written liquidity risk management program as required by Rule 22e-4 (the “Liquidity Rule”) under the Investment Company Act. The program is reasonably designed to assess and manage the Fund’s liquidity risk, taking into consideration, among other factors, the Fund’s investment strategy and the liquidity of its portfolio investments during normal and reasonably foreseeable stressed conditions; its short and long-term cash flow projections; and its cash holdings and access to other funding sources. The Board of Trustees approved the appointment of a Liquidity Administrator Committee, which includes representatives from Kovitz Investment Group Partners, LLC, the Fund’s investment adviser, and Ultimus Fund Solutions, LLC, the Fund’s Administrator. The Liquidity Administrator Committee is responsible for the program’s administration and oversight and for reporting to the Board on at least an annual basis regarding the program’s operation and effectiveness. The Liquidity Administrator Committee updated its assessment of the Fund’s liquidity risk profile, considering additional data gathered during the period June 1, 2022 through May 31, 2023 (the “Review Period”) and the adequacy and effectiveness of the liquidity risk management program’s operations during the Review Period in order to prepare a written report for the Board of Trustees (the “Report”) for consideration at its meeting held on September 8, 2023. The Report noted that during the Review Period the Fund did not experience unusual stress or disruption to its operations related to purchase and redemption activity. It further noted that during the Review Period the Fund held adequate levels of cash and highly liquid investments to meet shareholder redemption activities in accordance with applicable requirements. The Report concluded that (i) the Trust’s liquidity risk management program is reasonably designed to prevent violations of the Liquidity Rule and (ii) the Trust’s liquidity risk management program had been effectively implemented during the Review Period.
31
| Summary of Fund Expenses (Unaudited) |
As a shareholder of the Fund, you incur two types of costs: (1) transaction costs and (2) ongoing costs, including management fees and other Fund expenses. These examples are intended to help you understand your ongoing costs (in dollars) of investing in the Fund and to compare these costs with the ongoing costs of investing in other funds. You may pay brokerage commissions on purchases and sales of exchange-traded fund shares, which are not reflected in the example. The example is based on an investment of $1,000 invested at the beginning of the period and held for the entire period from May 1, 2023 through October 31, 2023.
Actual Expenses
The first line of the table below provides information about actual account values and actual expenses. You may use the information in this line, together with the amount you invested, to estimate the expenses that you paid over the period. Simply divide your account value by $1,000 (for example, an $8,600 account value divided by $1,000 = 8.6), then multiply the result by the number in the first line under the heading “Expenses Paid During Period” to estimate the expenses you paid on your account during this period.
Hypothetical Example for Comparison Purposes
The second line of the table below provides information about hypothetical account values and hypothetical expenses based on the Fund’s actual expense ratio and an assumed rate of return of 5% per year before expenses, which is not the Fund’s actual return. The hypothetical account values and expenses may not be used to estimate the actual ending account balance or expenses you paid for the period. You may use this information to compare the ongoing costs of investing in the Fund and other funds. To do so, compare this 5% hypothetical example with the 5% hypothetical examples that appear in the shareholder reports of other funds.
Expenses shown in the table are meant to highlight your ongoing costs only and do not reflect any transactional costs. Therefore, the second line of the table below is useful in comparing ongoing costs only and will not help you determine the relative total costs of owning different funds. In addition, if transaction costs were included, your costs would have been higher.
| Ending | |||||||||||||||
| Beginning | Account | Expenses | |||||||||||||
| Account | Value | Paid | Annualized | ||||||||||||
| Value | October 31, | During | Expense | ||||||||||||
| May 1, 2023 | 2023 | Period(a) | Ratio | ||||||||||||
| Kovitz Core Equity ETF | |||||||||||||||
| Actual | $ | 1,000.00 | $ | 998.30 | $ | 4.99 | 0.99% | ||||||||
| Hypothetical(b) | $ | 1,000.00 | $ | 1,020.22 | $ | 5.04 | 0.99% | ||||||||
| (a) | Expenses are equal to the Fund’s annualized expense ratios, multiplied by the average account value over the period, multiplied by 184/365 (to reflect the one-half year period). |
| (b) | Hypothetical assumes 5% annual return before expenses. |
32
| Additional Federal Income Tax Information (Unaudited) |
The Form 1099-DIV you receive in January 2024 will show the tax status of all distributions paid to your account in calendar year 2023. Shareholders are advised to consult their own tax adviser with respect to the tax consequences of their investment in the Fund. As required by the Internal Revenue Code and/or regulations, shareholders must be notified regarding the status of qualified dividend income for individuals and the dividends received deduction for corporations.
Qualified Dividend Income. The Fund designates approximately 100% or up to the maximum amount of such dividends allowable pursuant to the Internal Revenue Code, as qualified dividend income eligible for a reduced tax rate.
Qualified Business Income. The Fund designates approximately 100% of its ordinary income dividends, or up to the maximum amount of such dividends allowable pursuant to the Internal Revenue Code, as qualified business income.
Dividends Received Deduction. Corporate shareholders are generally entitled to take the dividends received deduction on the portion of the Fund’s dividend distribution that qualifies under tax law. For the Fund’s calendar year 2023 ordinary income dividends, 0% qualifies for the corporate dividends received deduction.
33
| Investment Advisory Agreement Approval (Unaudited) |
At a meeting held on June 1, 2023, the Board of Trustees (the “Board”) considered the approval of the Investment Advisory Agreement (the “New Advisory Agreement”) between Valued Advisers Trust (the “Trust”) and Kovitz Investment Group Partners, LLC (“Kovitz”) with respect to the Kovitz Core Equity ETF (the “Kovitz Fund”). Kovitz provided written information to the Board to assist the Board in its considerations.
The Board discussed the proposed contractual arrangements between Kovitz and the Trust with respect to the Kovitz Fund. Trust counsel reminded the Trustees of their fiduciary duties and responsibilities, including the factors to be considered, and the application of those factors to Kovitz. In assessing the factors and reaching its decision, the Board considered information furnished by Kovitz and the Trust’s other service providers for the Board’s review and consideration throughout the year, as well as information specifically prepared and/or presented in connection with the approval process, including: (i) reports regarding the services and support provided to the Kovitz Fund and its shareholders by Kovitz; (ii) quarterly assessments of the investment performance of the Kovitz Fund by personnel of Kovitz; (iii) commentary on the reasons for the performance; (iv) presentations by Kovitz addressing its investment philosophy, investment strategy, personnel and operations; (v) compliance and audit reports concerning the Kovitz Fund and Kovitz; (vi) disclosure information contained in the registration statement for the Kovitz Fund and the Form ADV of Kovitz; and (vii) a memorandum from counsel, that summarized the fiduciary duties and responsibilities of the Board in reviewing and approving the New Advisory Agreement. The Board also requested and received various informational materials including, without limitation: (a) documents containing information about Kovitz, including its financial information; a description of its personnel and the services it provides to the Kovitz Fund; information on Kovitz’s investment advice and performance; summaries of Kovitz Fund expenses, compliance program, current legal matters, and other general information; (b) comparative expense and performance information for other mutual funds with strategies similar to the Kovitz Fund; and (c) the benefits to be realized by Kovitz from its relationship with the Kovitz Fund. In considering the foregoing, the Board also considered the impact, if any, that the change of control transaction would have on the ability of Kovitz to continue to provide a similar level and quality of services to the Kovitz Fund and its shareholders as had previously been provided. The Board did not identify any particular information that was most relevant to its consideration to approve the Kovitz ETF Agreement and each Trustee may have afforded different weight to the various factors.
1. The nature, extent, and quality of the services to be provided by Kovitz. The Board considered responsibilities that Kovitz would have under the New Advisory Agreement. The Trustees considered the services proposed to be provided by Kovitz to the Kovitz Fund and their experience with Kovitz in providing similar services, including without limitation: the quality of advisory services (including research and recommendations with respect to portfolio securities), the process for formulating investment recommendations and assuring compliance with the Kovitz Fund’s investment objectives and limitations, the coordination of services for the Kovitz Fund among the Kovitz Fund’s service providers, and efforts to promote the Kovitz Fund and grow its assets. The Trustees considered Kovitz’s continuity of, and commitment to retain, qualified personnel, Kovitz’s commitment to maintain its resources and systems, and Kovitz’s cooperation with the Board and counsel for the Kovitz Fund. The Trustees considered Kovitz’s personnel, including the education and experience of the personnel and Kovitz’s compliance program, policies and procedures. The Trustees specifically acknowledged the fact that the personnel associated with
34
| Investment Advisory Agreement Approval (Unaudited) (continued) |
the day-to-day management of the Kovitz Fund is not anticipated to change. After considering the foregoing information and further information in the meeting materials provided by Kovitz, the Board concluded that, in light of all the facts and circumstances, the nature, extent, and quality of the services proposed to be provided by Kovitz will be satisfactory and adequate for the Kovitz Fund.
2. Investment Performance of the Kovitz Fund and Kovitz. The Trustees compared the performance of the Kovitz Fund with the performance of funds with similar objectives managed by other investment advisers, with aggregated peer group data, as well as with the performance of the Kovitz Fund’s benchmark. The Trustees also considered the consistency of Kovitz’s management of the Kovitz Fund with its investment objectives, strategies, and limitations. The Trustees noted that the Kovitz Fund had underperformed as compared to its benchmark for the one-year, five-year, and since inception periods ended March 31, 2023, and that the Kovitz Fund outperformed the benchmark for the three-year period. They also noted that the Kovitz Fund had underperformed as compared to the median of its Morningstar custom category for the one-year period, had outperformed compared to the median for the three-year and five-year periods, and performed equal to the median for the since inception period. With regard to the custom peer group, the Trustees noted that the Kovitz Fund had underperformed as compared to the median for the one-year period, outperformed for the three-year period, and performed equal to the median for the five-year and since inception periods. The Board reviewed the performance of Kovitz in managing a composite with investment strategies similar to that of the Kovitz Fund and observed that the Kovitz Fund’s performance was comparable. The Trustees took into consideration discussions with representatives of Kovitz regarding the reasons for the performance of the Kovitz Fund. After further reviewing and discussing these and other relevant factors, the Board concluded, in light of all the facts and circumstances, that the investment performance of the Kovitz Fund and Kovitz was satisfactory.
3. The costs of the services to be provided and profits to be realized by Kovitz from the relationship with the Kovitz Fund. The Trustees considered: (1) Kovitz’s financial condition; (2) the asset level of the Kovitz Fund; (3) the overall expenses of the Kovitz Fund; and (4) the nature and frequency of advisory fee payments. The Trustees reviewed information provided by Kovitz regarding its profits associated with managing the Kovitz Fund. The Trustees also considered potential benefits for Kovitz in managing the Kovitz Fund. The Trustees then compared the fees and expenses of the Kovitz Fund (including the management fee) to other comparable mutual funds. The Board also acknowledged the proposed “unitary fee” structure, by which Kovitz would pay the majority of the Kovitz Fund’s expenses. The Trustees noted that the Kovitz Fund’s management fee was above the average and median management fees of its Morningstar custom category. The Trustees also noted that the Kovitz Fund’s net expense ratio was also above that of the average and median of its custom category. When comparing the Kovitz Fund’s fees to those of its custom peer group, the Trustees noted that the Kovitz Fund’s management fee was above the average and the median. They also noted that the Kovitz Fund’s net expense ratio was also above both the average and median of the peer group. The Trustees also noted that the Kovitz Fund’s management fee is below the fee charged by Kovitz to its separately managed accounts. Based on the foregoing, the Board concluded that the fees to be paid to Kovitz by the Kovitz Fund and the profits to be realized by Kovitz, in light of all the facts and circumstances, were fair and reasonable in relation to the nature and quality of the services provided by Kovitz.
35
| Investment Advisory Agreement Approval (Unaudited) (continued) |
4. The extent to which economies of scale would be realized as the Kovitz Fund grows and whether advisory fee levels reflect these economies of scale for the benefit of the Kovitz Fund’s investors. The Board considered the Kovitz Fund’s proposed fee arrangements with Kovitz, noting that the proposed fees are the same as the current fees paid to Kovitz. The Board considered that while the management fee remained the same at all asset levels, the Kovitz Fund’s shareholders would continue to benefit from economies of scale under the Trust’s agreements with service providers other than Kovitz. In light of its ongoing consideration of the Kovitz Fund’s asset levels, expectations for growth in the Kovitz Fund, and fee levels, the Board determined that the Kovitz Fund’s fee arrangements, in light of all the facts and circumstances, were fair and reasonable in relation to the nature and quality of the services to be provided by Kovitz.
5. Possible conflicts of interest and benefits to Kovitz. The Trustees evaluated the potential for conflicts of interest and considered such matters as the experience and ability of the advisory personnel assigned to the Kovitz Fund; the basis of decisions to buy or sell securities for the Kovitz Fund and/or Kovitz’s other accounts; and the substance and administration of Kovitz’s code of ethics. The Trustees noted that Kovitz does not utilize soft dollars. With respect to benefits to Kovitz (in addition to fees under the New Advisory Agreement), the Board noted that Kovitz would benefit from its relationship with the Kovitz Fund as the Kovitz Fund provides an investment vehicle for Kovitz’s advisory clients with small balances. Following further consideration and discussion, the Board determined that Kovitz’s standards and practices relating to the identification and mitigation of potential conflicts of interest were satisfactory and the anticipated benefits to be realized by Kovitz from managing the Kovitz Fund were acceptable.
After additional consideration of the relevant factors and further discussion among the Board members, the Board determined to approve the New Advisory Agreement.
36
| Trustees and Officers (Unaudited) |
The Board of Trustees supervises the business activities of the Trust. Each Trustee serves as a trustee until termination of the Trust unless the Trustee dies, resigns, retires or is removed.
The following table provides information regarding each of the Independent Trustees.
| Name, Address*, (Age), Position with Trust**, Term of Position with Trust | Principal Occupation During Past 5 Years and Other Directorships | Other Directorships |
| Andrea N. Mullins, 56 Independent Trustee Since December 2013 Chairperson since March 2017 | Current: Private investor; Independent Contractor, SWM Advisors (since April 2014). | Trustee, Angel Oak Funds Trust (since February 2019) (7 portfolios); Trustee, Angel Oak Strategic Credit Fund (since February 2019); Trustee, Angel Oak Financial Strategies Income Term Trust (since May 2019); Trustee, Angel Oak Credit Opportunities Term Trust (since January 2021); Trustee and Audit Committee Chair, NXG NextGen Infrastructure Income Fund (since November 2021); Trustee and Audit Committee Chair, NXG Cushing Midstream Energy Fund (since November 2021). |
37
| Trustees and Officers (Unaudited) (continued) |
| Name, Address*, (Age), Position with Trust**, Term of Position with Trust | Principal Occupation During Past 5 Years and Other Directorships | Other Directorships |
| Ira P. Cohen, 64 Independent Trustee Since June 2010 | Current: Independent financial services consultant (since February 2005); Executive Vice President of Asset Management Services, Recognos Financial (since August 2015). | Trustee and Audit Committee Chairman, Apollo Diversified Real Estate Fund (since March 2022); Trustee, Chairman and Nominating and Governance Committee Chairman, Angel Oak Funds Trust (since October 2014) (7 portfolios); Trustee, Chairman, and Nominating and Governance Committee Chairman, Angel Oak Strategic Credit Fund (since December 2017); Trustee, Chairman, and Nominating and Governance Committee Chairman, Angel Oak Financial Strategies Income Term Trust (since May 2019);Trustee, Chairman, and Nominating and Governance Committee Chairman, Angel Oak Credit Opportunities Term Trust (since January 2021); Trustee and Nominating and Governance Committee Chairman, U.S. Fixed Income Trust (since March 2019). |
| * | The address for each Trustee is 225 Pictoria Drive, Suite 450, Cincinnati, Ohio 45246. |
| ** | As of the date of this report, the Trust consists of 15 series. |
The following table provides information regarding the Trustee who is considered an “interested person” of the Trust, as that term is defined under the 1940 Act.
| Name, Address*, (Age), Position with Trust**, Term of Position with Trust | Principal Occupation During Past 5 Years and Other Directorships | Other Directorships |
| Mark J. Seger***, 61 Trustee Since March 2017 | Current: Vice Chairman and Co-Founder, Ultimus Fund Solutions, LLC and its subsidiaries (since 1999). | None. |
| * | The address for each Trustee is 225 Pictoria Drive, Suite 450, Cincinnati, Ohio 45246. |
| ** | As of the date of this report, the Trust consists of 15 series. |
| *** | Mr. Seger is considered an “interested person” of the Trust because of his relationship with the Trust’s administrator, transfer agent, and distributor. |
38
| Trustees and Officers (Unaudited) (continued) |
The following table provides information regarding the Officers of the Trust:
| Name, Address*, (Age), Position with Trust**, Term of Position with Trust | Principal Occupation During Past 5 Years | Other Directorships |
Matthew J. Miller, 47
Vice President | Current: Vice President, Relationship Management, Ultimus Fund Solutions, LLC (since December 2015). | None. |
| N. Lynn Bowley, 65 Chief Compliance Officer Since April 2022 | Current: Senior Vice President, Senior Compliance Officer, Northern Lights Compliance Services, LLC (since January 2007). | None. |
Carol J. Highsmith, 59
Secretary Since March 2014 | Current: Vice President, Ultimus Fund Solutions, LLC (since December 2015). | None. |
| Zachary P. Richmond,43 Principal Financial Officer and Treasurer Since September 2021 | Current:Vice President, Financial Administration, Ultimus Fund Solutions, LLC (since February 2019).
Previous:Assistant Vice President, Associate Director of Financial Administration, Ultimus Fund Solutions, LLC (December 2015 to February 2019). | None. |
39
| Trustees and Officers (Unaudited) (continued) |
| Name, Address*, (Age), Position with Trust**, Term of Position with Trust | Principal Occupation During Past 5 Years and Other Directorships | Other Directorships |
| Jared D. Lahman, 37 AML Officer Since March 2023 | Current: Senior Compliance Analyst, Northern Lights Compliance Services, LLC (since January 2019).
Previous: Manager of Fund Accounting, Gemini Fund Services (September 2016 to December 2018) | None. |
| * | The address for each Officer is 225 Pictoria Drive, Suite 450, Cincinnati, Ohio 45246. |
| ** | As of the date of this report, the Trust consists of 15 series. |
| Other Information (Unaudited) |
The Fund’s Statement of Additional Information (“SAI”) includes additional information about the trustees and is available without charge, upon request. You may call toll-free at (877) 714-2327 to request a copy of the SAI or to make shareholder inquiries.
40
Proxy Voting
A description of the policies and procedures that the Fund uses to determine how to vote proxies relating to portfolio securities and information regarding how the Fund voted those proxies during the most recent twelve month period ended June 30, are available (1) without charge upon request by calling the Fund at (877) 714-2327 and (2) in Fund documents filed with the SEC on the SEC’s website at www.sec.gov.
| TRUSTEES Andrea N. Mullins, Chairperson Ira P. Cohen Mark J. Seger | INDEPENDENT REGISTERED PUBLIC ACCOUNTING FIRM Cohen & Company, Ltd. 1350 Euclid Avenue, Suite 800 Cleveland, OH 44115 |
| OFFICERS Matthew J. Miller, Principal Executive Officer and President Zachary P. Richmond, Principal Financial Officer and Treasurer N. Lynn Bowley, Chief Compliance Officer Carol J. Highsmith, Vice President and Secretary | LEGAL COUNSEL Troutman Pepper Hamilton Sanders LLP 3000 Two Logan Square 18th and Arch Streets Philadelphia, PA 19103 |
| INVESTMENT ADVISER Kovitz Investment Group Partners, LLC 71 South Wacker Drive, Suite 1860 Chicago, IL 60606 | CUSTODIAN AND TRANSFER AGENT Brown Brothers Harriman & Co. 50 Post Office Square Boston, MA 02110 |
| DISTRIBUTOR Northern Lights Distributors, LLC 4221 North 203rd Street, Suite 100 Elkhorn, NE 68022 | ADMINISTRATOR AND FUND ACCOUNTANT Ultimus Fund Solutions, LLC 225 Pictoria Drive, Suite 450 Cincinnati, OH 45246 |
This report is intended only for the information of shareholders or those who have received the Fund’s prospectus which contains information about the Fund’s management fee and expenses. Please read the prospectus carefully before investing.
Distributed by Northern Lights Distributors, LLC Member FINRA/SIPC
Kovitz-AR-23

| SOUND MIND INVESTING FUND (SMIFX) |
| SMI DYNAMIC ALLOCATION FUND (SMIDX) |
| SMI MULTI-STRATEGY FUND (SMILX) |
| ANNUAL REPORT |
| October 31, 2023 |
| Funds’ Adviser: |
| SMI Advisory Services, LLC |
| 4400 Ray Boll Blvd. |
| Columbus, IN 47203 |
| (877) 764-3863 |
| (877) SMI-FUND www.smifund.com |

Dear Fellow Shareholder,
The back-and-forth nature of the stock market over the past few years has driven uneven performance across the SMI Funds. Dating back to the 2020 COVID year, the SMI Funds have alternated years of strong relative performance during “risk-off” years (2020 & 2022) with poor relative performance during the “risk-on” interim years (2021 & 2023). This isn’t because our trend-following strategies are poor risk-on performers, as trend-following tends to work in either market environment. Rather, it’s a testament to the rapid turnarounds from dire market conditions that our strategies have been slow to respond to.
This year’s report period corresponds almost exactly to the rebound from last fall’s bear market lows. While many believe the October 2022 lows ended the bear market, we remain skeptical. Our mechanical process forced us grudgingly back into stocks throughout the spring and summer of 2023, but the breakdown in markets from the July 2023 peak through the end of October is at least leaving open the possibility that this bear market isn’t over yet.
That said, the strongly defensive positioning that boosted the SMI Funds’ relative performance in 2022 caused immediate pain (relative to the broad market indexes) when markets rose rapidly during the first half of 2023. The SMI Funds’ relative performance over the past fiscal year ended October 31, 2023 has been as poor this year as it was positive a year ago.
Many have noted that the 2023 market rally has been extremely narrow, concentrated almost entirely in the seven largest tech stocks (the so-called “Magnificent Seven”). These types of concentrated rallies are the worst type of environment for actively managed strategies, particularly when those strategies are compared to market-cap weighted indexes (like the S&P 500® Index), which are dominated by these largest stocks.
Unlike the S&P 500® Index, which gained +10.14% over the year ended 10/31/2023, other measures of “the market” told a different story. The S&P 500® Equal-Weight Index lost -0.72% over the past year. The small-company focused Russell 2000® Index, which recently broke down to a new bear market low, fell -8.56% over the same period. These facts highlight the idea that the market’s rebound from 2022’s bear market was primarily driven by the impact of the largest stocks on the most visible indexes where they have an outsized influence.
1
These are some of the widest performance disparities on record and suggest the market isn’t as healthy as the bullish crowd believes. As market legend Bob Farrell once noted, “Markets are strongest when they are broad and weakest when they narrow to a handful of blue-chip names.”
Danger Ahead
A year ago in last year’s letter, we cautioned the following:
Fifty years ago, economist Milton Friedman explained there are “long and variable lags” between changes in monetary policy (rate hikes and Quantitative Tightening) and when those changes show up in the economy. While the “variable” part is hard to pin down, history suggests that lag often ranges from 12-24 months. In other words, we shouldn’t expect to see the full impact of 2022’s rate hikes and Quantitative Tightening in the real economy until mid-to-late next year (2023).
All of this helps explain why we believe there is likely a recessionary “Act Two” of the current bear market in store next year. If this proves accurate, the current defensive positioning of the SMI Funds should continue to serve shareholders well.
While we didn’t see a renewed speculative fervor developing around the theme of Artificial Intelligence driving the prices of the largest tech stocks significantly higher, what we wrote last year is largely playing out. The impact of higher interest rates and tighter monetary policy continues to gradually slow the economy. The recession we foresaw a year ago may wind up arriving a quarter or two later than we anticipated, but the managers believe its arrival has merely been delayed, not avoided.
As such, the managers believe the final act of this bear market is still ahead, with the potential of economic recession in 2024 still a distinct possibility. The SMI Funds remain exposed to the large-company stocks (including the Magnificent Seven) that have driven the bulk of 2023’s gains, while we’ve recently exited most of our small-company and foreign stock holdings. As in 2022, we believe the opportunity to make up considerable performance ground could be ahead as markets falter.
We appreciate the opportunity to serve you!
Blessings,

Mark Biller
Senior Portfolio Manager
The Sound Mind Investing Funds
2
The SMI Fund lineup, shown below, now offers investors a way to mix and match professionally managed funds to custom tailor the risk level desired for their portfolio. If you’d like assistance customizing your portfolio in this manner, please call a Stewardship Advisor at (800) 796-4975.
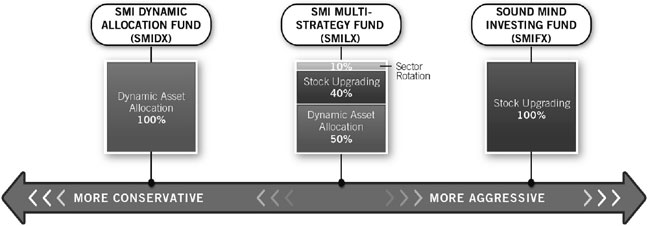
3
| PERFORMANCE RESULTS – (Unaudited) |
Average Annual Total Returns(a) (For the periods ended October 31, 2023) | ||||||||||
| Three | Six | One | Five | |||||||
| Months | Months | Year | Year | Ten Year | ||||||
| Sound Mind Investing Fund | -9.98% | -5.70% | -3.52% | 5.04% | 5.58% | |||||
| S&P 500® Index(b) | -8.25% | 1.39% | 10.14% | 11.01% | 11.18% | |||||
| SMI Custom Index(c) | -12.38% | -3.27% | 2.90% | 6.42% | 7.27% | |||||
| Wilshire 5000® Total Market Index(b)(d) | -9.11% | 1.04% | 8.38% | 10.44% | 10.71% | |||||
| Total annual operating expenses, as disclosed in the Sound Mind Investing Fund’s (“SMI Fund”) prospectus dated February 28, 2023, were 1.61% of average daily net assets, which includes acquired fund fees and expenses. All expenses are reflected in performance results. SMI Advisory Services, LLC (the “Adviser”) contractually has agreed to waive its fee and/or reimburse certain operating expenses, but only to the extent necessary so that total annual operating expenses (excluding interest, taxes, brokerage commissions, other expenses which are capitalized in accordance with generally accepted accounting principles, extraordinary expenses, dividend expense on short sales, 12b-1 fees, and acquired fund fees and expenses) do not exceed 1.45% of the SMI Fund’s average daily net assets through February 29, 2024. Prior to March 1, 2023, the expense cap for SMI Fund was 1.50%. Each waiver or reimbursement of an expense by the Adviser is subject to repayment by the SMI Fund within the three years following the date of such waiver or reimbursement, provided that the SMI Fund is able to make the repayment without exceeding the expense limitation in place at the time of the fee waiver or reimbursement and the expense limitation at the time of the repayment. This expense cap may not be terminated prior to its expiration date except by the Board of Trustees (the “Board”). |
4
| PERFORMANCE RESULTS – (Unaudited), (Continued) |
Average Annual Total Returns(a) (For the periods ended October 31, 2023) | ||||||||||
| Three | Six | One | Five | |||||||
| Months | Months | Year | Year | Ten Year | ||||||
| SMI Dynamic Allocation Fund | -8.96% | -5.61% | 3.76% | 1.53% | 2.07% | |||||
| S&P 500® Index(b) | -8.25% | 1.39% | 10.14% | 11.01% | 11.18% | |||||
| Bloomberg U.S. Aggregate Bond Index(b) | -4.69% | -6.13% | 0.36% | -0.06% | 0.88% | |||||
| Weighted Index(c) | -6.84% | -1.61% | 6.26% | 6.83% | 7.21% | |||||
| Wilshire 5000® Total Market Index(b)(d) | -9.11% | 1.04% | 8.38% | 10.44% | 10.71% | |||||
| Total annual operating expenses, as disclosed in the SMI Dynamic Allocation Fund’s prospectus dated February 28, 2023, were 1.48% of average daily net assets, which includes acquired fund fees and expenses. All expenses are reflected in performance results. The Adviser contractually has agreed to waive its fee and/or reimburse certain operating expenses, but only to the extent necessary so that total annual operating expenses (excluding interest, taxes, brokerage commissions, other expenses which are capitalized in accordance with generally accepted accounting principles, extraordinary expenses, dividend expense on short sales, 12b-1 fees, and acquired fund fees and expenses) do not exceed 1.45% of the SMI Dynamic Allocation Fund’s average daily net assets through February 29, 2024. Each waiver or reimbursement of an expense by the Adviser is subject to repayment by the SMI Dynamic Allocation Fund within the three years following the date of such waiver or reimbursement, provided that the SMI Dynamic Allocation Fund is able to make the repayment without exceeding the expense limitation in place at the time of the fee waiver or reimbursement and the expense limitation at the time of the repayment. This expense cap may not be terminated prior to its expiration date except by the Board. |
5
| PERFORMANCE RESULTS – (Unaudited), (Continued) |
Average Annual Total Returns(a) (For the periods ended October 31, 2023) | ||||||||||
| Since | ||||||||||
| Inception | ||||||||||
| Three | Six | One | Five | (April 29, | ||||||
| Months | Months | Year | Year | 2015) | ||||||
| SMI Multi-Strategy Fund | -9.68% | -4.78% | -0.09% | 3.39% | 3.18% | |||||
| S&P 500® Index(b) | -8.25% | 1.39% | 10.14% | 11.01% | 10.47% | |||||
| Bloomberg U.S. Aggregate Bond Index(b) | -4.69% | -6.13% | 0.36% | -0.06% | 0.31% | |||||
| Weighted Index(c) | -6.84% | -1.61% | 6.26% | 6.83% | 6.58% | |||||
| Wilshire 5000® Total Market Index(b)(d) | -9.11% | 1.04% | 8.38% | 10.44% | 10.01% | |||||
| Total annual operating expenses, as disclosed in the SMI Multi-Strategy Fund’s prospectus dated February 28, 2023 were 1.52% of average daily net assets, which includes acquired fund fees and expenses. All expenses are reflected in performance results. The Adviser contractually has agreed to waive its fee and/or reimburse certain operating expenses, but only to the extent necessary so that total annual operating expenses (excluding interest, taxes, brokerage commissions, other expenses which are capitalized in accordance with generally accepted accounting principles, extraordinary expenses, dividend expense on short sales, 12b-1 fees, and acquired fund fees and expenses) do not exceed 1.30% of the SMI Multi-Strategy Fund’s average daily net assets through February 29, 2024. Prior to March 1, 2023, the expense cap for SMI Multi-Strategy Fund was 1.15%. Each waiver or reimbursement of an expense by the Adviser is subject to repayment by the SMI Multi-Strategy Fund within the three years following the date of such waiver or reimbursement, provided that the SMI Multi-Strategy Fund is able to make the repayment without exceeding the expense limitation in place at the time of the fee waiver or reimbursement and the expense limitation at the time of the repayment. This expense cap may not be terminated prior to its expiration date except by the Board. |
The performance quoted represents past performance, which does not guarantee future results. The investment return and principal value of an investment will fluctuate so that an investor’s shares, when redeemed, may be worth more or less than their original cost. The returns shown do not reflect deduction of taxes that a shareholder would pay on Fund distributions or the redemption of Fund shares. Current performance of the Sound Mind Investing Fund, SMI Dynamic Allocation Fund, and SMI Multi-Strategy Fund (each a “Fund” and collectively the “Funds”) may be lower or higher than the performance quoted. Performance data current to the most recent month end may be obtained by calling (877) 764-3863.
6
| PERFORMANCE RESULTS – (Unaudited), (Continued) |
| (a) | Average annual total returns reflect any change in price per share and assume the reinvestment of all distributions. The Funds’ returns reflect any fee reductions during the applicable periods. If such fee reductions had not occurred, the quoted performance would have been lower. Total returns for periods less than one year are not annualized. |
| (b) | The Standard & Poor’s 500® Index (“S&P 500”), Wilshire 5000® Total Market Index (“Wilshire 5000”), Bloomberg U.S. Aggregate Bond Index, Russell 1000® Value Index, Russell 1000® Growth Index, Russell 2000® Value Index, Russell 2000® Growth Index and MSCI EAFE Index (collectively, the “Indices”) are unmanaged indices that assume reinvestment of all distributions and exclude the effect of taxes and fees. These Indices are widely recognized unmanaged indices and are representative of a broader market and range of securities than is found in each Fund’s portfolio. The returns of the Indices are not reduced by any fees or operating expenses. Individuals cannot invest directly in the Indices; however, an individual can invest in exchange-traded funds or other investment vehicles that attempt to track the performance of a benchmark index. |
| (c) | The SMI Custom Index for the Sound Mind Investing Fund is comprised of 20% Russell 1000® Value Index, 20% Russell 1000® Growth Index, 20% Russell 2000® Value Index, 20% Russell 2000® Growth Index and 20% MSCI EAFE Index and the Weighted Index for the SMI Dynamic Allocation Fund and the SMI Multi-Strategy Fund is comprised of 60% S&P 500 and 40% Bloomberg U.S. Aggregate Bond Index. |
| (d) | Prior to February 6, 2023, the Funds’ benchmark was the Wilshire 5000. Effective February 6, 2023, the Funds’ benchmark changed to the S&P 500. Access to Wilshire 5000 data has become cost-prohibitive for the Funds. The composition of the two indexes is substantially similar, and in the opinion of the Adviser, the S&P 500 provides an appropriate broad-based market comparison for the Funds. |
The Funds’ investment objectives, risks, charges and expenses must be considered carefully before investing. The prospectus contains this and other important information about the Funds and may be obtained by calling the same number as above. Please read it carefully before investing.
7
| PERFORMANCE RESULTS – (Unaudited), (Continued) |
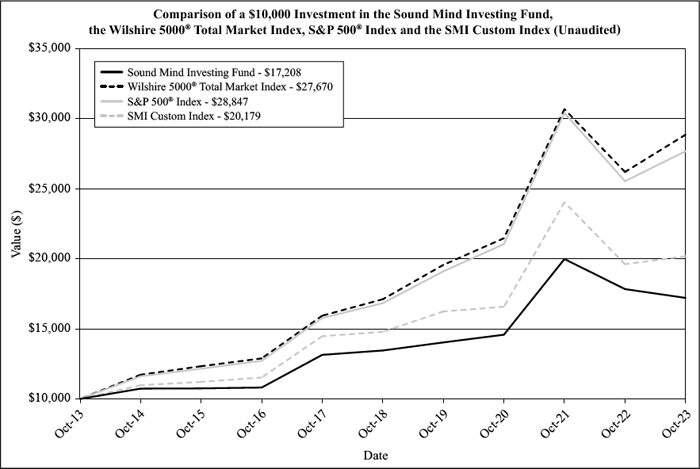
The chart above assumes an initial investment of $10,000 made on October 31, 2013 and held through October 31, 2023. THE FUND’S RETURN REPRESENTS PAST PERFORMANCE AND DOES NOT GUARANTEE FUTURE RESULTS. The returns shown do not reflect deduction of taxes that a shareholder would pay on Fund distributions or the redemption of Fund shares. Investment returns and principal values will fluctuate so that your shares, when redeemed, may be worth more or less than their original purchase price.
Current performance of the Fund may be lower or higher than the performance quoted. For more information on the Fund, and to obtain performance data current to the most recent month end or to request a prospectus, please call (877) 764-3863. You should carefully consider the investment objectives, potential risks, management fees, and charges and expenses of the Fund before investing. The Fund’s prospectus contains this and other information about the Fund, and should be read carefully before investing.
The SMI Custom Index for the Sound Mind Investing Fund is comprised of 20% Russell 1000® Value Index, 20% Russell 1000® Growth Index, 20% Russell 2000® Value Index, 20% Russell 2000® Growth Index and 20% MSCI EAFE Index.
The Fund is distributed by Ultimus Fund Distributors, LLC, member FINRA/ SIPC.
8
| PERFORMANCE RESULTS – (Unaudited), (Continued) |
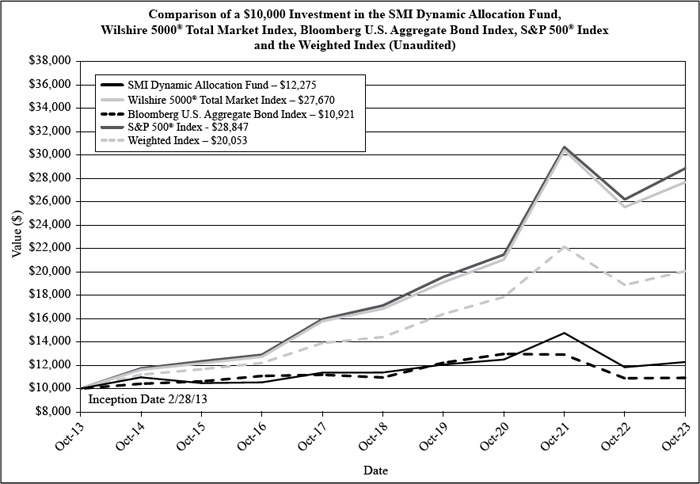
The chart above assumes an initial investment of $10,000 made on October 31, 2013 and held through October 31, 2023. THE FUND’S RETURN REPRESENTS PAST PERFORMANCE AND DOES NOT GUARANTEE FUTURE RESULTS. The returns shown do not reflect deduction of taxes that a shareholder would pay on Fund distributions or the redemption of Fund shares. Investment returns and principal values will fluctuate so that your shares, when redeemed, may be worth more or less than their original purchase price.
Current performance of the Fund may be lower or higher than the performance quoted. For more information on the Fund, and to obtain performance data current to the most recent month end or to request a prospectus, please call (877) 764-3863. You should carefully consider the investment objectives, potential risks, management fees, and charges and expenses of the Fund before investing. The Fund’s prospectus contains this and other information about the Fund, and should be read carefully before investing.
The Weighted Index is comprised of 60% S&P 500® Index and 40% Bloomberg U.S. Aggregate Bond Index.
The Fund is distributed by Ultimus Fund Distributors, LLC, member FINRA/ SIPC.
9
| PERFORMANCE RESULTS – (Unaudited), (Continued) |
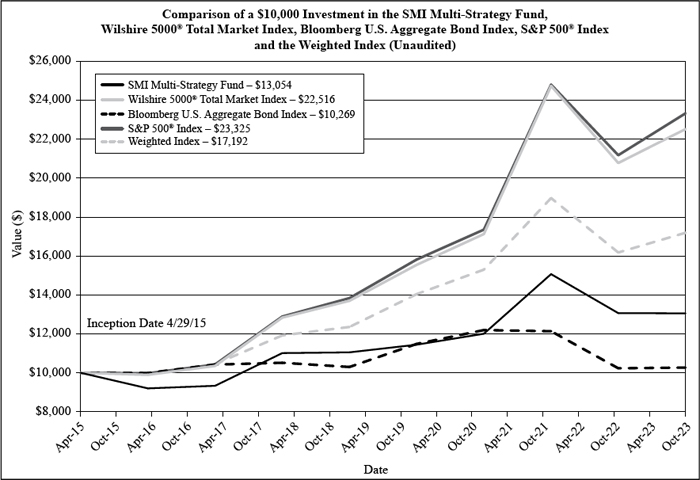
The chart above assumes an initial investment of $10,000 made on April 29, 2015 (commencement of Fund operations) and held through October 31, 2023. THE FUND’S RETURN REPRESENTS PAST PERFORMANCE AND DOES NOT GUARANTEE FUTURE RESULTS. The returns shown do not reflect deduction of taxes that a shareholder would pay on Fund distributions or the redemption of Fund shares. Investment returns and principal values will fluctuate so that your shares, when redeemed, may be worth more or less than their original purchase price. The information presented above, for the periods prior to April 28, 2018 is historical information for the Former SMI 50/40/10 Fund.
Current performance of the Fund may be lower or higher than the performance quoted. For more information on the Fund, and to obtain performance data current to the most recent month end or to request a prospectus, please call (877) 764-3863. You should carefully consider the investment objectives, potential risks, management fees, and charges and expenses of the Fund before investing. The Fund’s prospectus contains this and other information about the Fund, and should be read carefully before investing.
The Weighted Index is comprised of 60% S&P 500® Index and 40% Bloomberg U.S. Aggregate Bond Index.
The Fund is distributed by Ultimus Fund Distributors, LLC, member FINRA/ SIPC.
10
| FUND HOLDINGS – (Unaudited) |
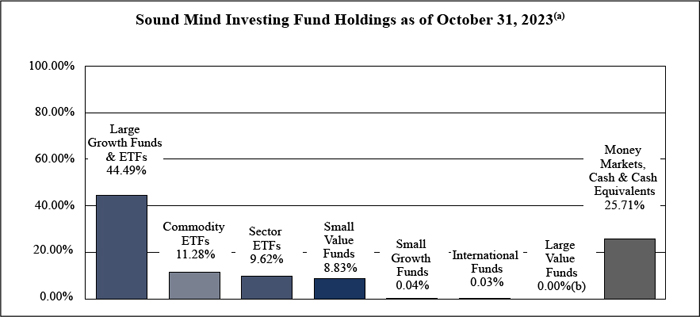
| (a) | As a percentage of net assets |
| (b) | Less than 0.005%. |
Sound Mind Investing Fund seeks long-term capital appreciation. The Fund seeks to achieve its objective by investing in a diversified portfolio of other investment companies using a “Stock Upgrading” strategy. The Stock Upgrading investment strategy is a systematic investment approach that is based on the belief of the Adviser that superior returns can be obtained by constantly monitoring the performance of a wide universe of other investment companies and standing ready to move assets into the funds deemed by the Adviser to be most attractive at the time of analysis. This upgrading process strives to keep assets invested in funds that are demonstrating superior current performance relative to their peers as determined by a combination of size and investment style criteria.
11
| FUND HOLDINGS – (Unaudited), (Continued) |
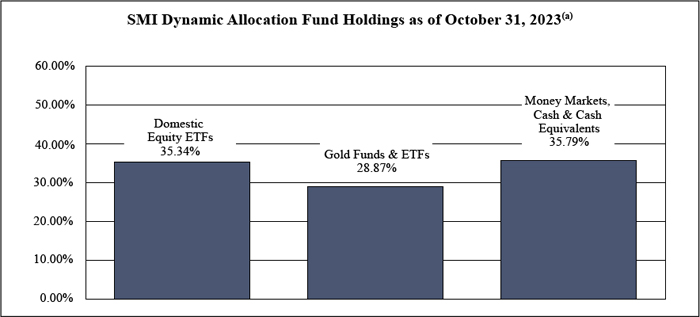
| (a) | As a percentage of net assets. |
SMI Dynamic Allocation Fund seeks total return. Total return is composed of both income and capital appreciation. The Fund uses a “Dynamic Asset Allocation” investment strategy to achieve its investment objective. This is done by investing in open-end mutual funds and exchange-traded funds (“ETFs”) that invest in securities from the following six asset classes – U.S. Equities, International Equities, Fixed Income Securities, Real Estate, Precious Metals, and Cash.
12
| FUND HOLDINGS – (Unaudited), (Continued) |
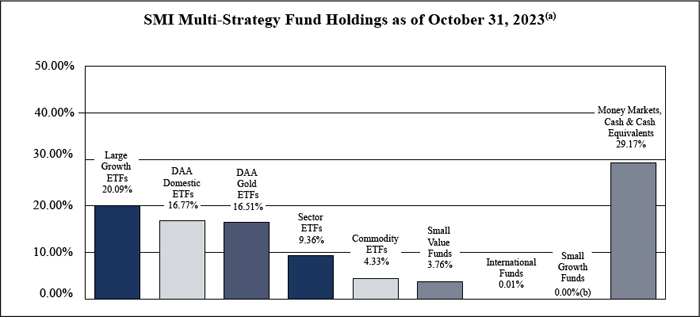
| (a) | As a percentage of net assets. |
| (b) | Less than 0.005%. |
SMI Multi-Strategy Fund seeks total return. Total return is composed of both income and capital appreciation. The Adviser typically allocates the Fund’s assets on a 50/40/10 basis among various investment strategies as follows:
| ● | 50% - Dynamic Asset Allocation Strategy (“DAA”) |
| ● | 40% - Stock Upgrading Strategy |
| ● | 10% - Sector Rotation Strategy |
The “Sector Rotation Strategy” involves the Adviser selecting from a universe of mutual funds and ETFs it has compiled using proprietary methods (“Underlying Funds”). This universe is specifically designed by the Adviser to balance exposure to a wide variety of market sectors and industries. This universe includes leveraged, non-leveraged and inverse Underlying Funds. The Adviser ranks these Underlying Funds based on their recent performance across multiple short-term performance periods, then uses an upgrading approach to invest in the top performing market sector or sectors. Once a particular sector or sectors is identified, the Adviser purchases one or more Underlying Funds to gain the desired exposure to that particular sector. This portion of the Fund may be concentrated, meaning that the Fund may be invested in as few as one or two sectors at a time and potentially as few as one Underlying Fund.
13
| FUND HOLDINGS – (Unaudited), (Continued) |
Availability of Portfolio Schedules – (Unaudited)
The Funds file their complete schedules of portfolio holdings with the Securities and Exchange Commission (“SEC”) for the first and third quarters of each fiscal year as an exhibit to its reports on Form N-PORT. The Funds’ Form N-PORT reports are available on the SEC’s website at http://www.sec.gov and on the Funds’ website at www.smifund.com.
14
| SOUND MIND INVESTING FUND |
| SCHEDULE OF INVESTMENTS |
| October 31, 2023 |
| EXCHANGE-TRADED FUNDS — 65.38% | Shares | Fair Value | ||||||
| Fidelity Blue Chip Growth ETF(a) | 244,220 | $ | 6,906,542 | |||||
| Invesco Dynamic Energy Exploration & Production ETF | 76,370 | 2,462,933 | ||||||
| Invesco Optimum Yield Diversified Commodity Strategy No K-1 ETF | 749,730 | 11,006,036 | ||||||
| Invesco QQQ Trust, Series 1 | 29,660 | 10,406,804 | ||||||
| iShares Russell 1000 Growth ETF(b) | 99,610 | 26,108,777 | ||||||
| SPDR® S&P® Oil & Gas Equipment & Services ETF | 49,640 | 4,341,514 | ||||||
| Sprott Uranium Miners ETF(a) | 55,940 | 2,590,022 | ||||||
| Total Exchange-Traded Funds (Cost $64,927,780) | 63,822,628 | |||||||
| MUTUAL FUNDS — 8.91% | ||||||||
| AllianzGI NFJ Small-Cap Value Fund | 162 | 2,179 | ||||||
| Artisan International Small Cap Fund, Investor Class(a) | 100 | 1,425 | ||||||
| Artisan International Value Fund, Investor Class | 150 | 6,330 | ||||||
| Artisan Mid Cap Value Fund, Investor Class | 279 | 4,399 | ||||||
| Champlain Small Company Fund, Institutional Class | 100 | 1,914 | ||||||
| Columbia Acorn Fund, Institutional Class(a) | 137 | 1,231 | ||||||
| Delaware Select Growth Fund, Institutional Class(a) | 100 | 2,556 | ||||||
| DFA International Small Cap Value Portfolio, Institutional Class | 100 | 1,920 | ||||||
| DFA International Small Company Portfolio, Institutional Class | 100 | 1,690 | ||||||
| DFA U.S. Small Cap Value Portfolio, Institutional Class | 100 | 3,823 | ||||||
| Franklin Small Cap Value Fund, Advisor Class | 100 | 5,118 | ||||||
| Hartford International Opportunities Fund (The), Class Y | 248 | 4,049 | ||||||
| Hennessy Cornerstone Mid Cap 30 Fund, Institutional Class | 431,689 | 8,594,921 | ||||||
| Invesco Oppenheimer International Small-Mid Company Fund, Class Y | 100 | 3,590 | ||||||
| Janus Henderson Mid Cap Value Fund, Class T | 200 | 2,874 | ||||||
| Janus Henderson Venture Fund, Class T | 100 | 6,547 | ||||||
| JOHCM International Select Fund, Institutional Class | 100 | 2,035 | ||||||
| JPMorgan Mid Cap Value Fund, Institutional Class | 100 | 3,281 | ||||||
| JPMorgan Small Cap Equity Fund, Select Class | 100 | 4,694 | ||||||
| JPMorgan Small Cap Growth Fund, Class L | 100 | 1,596 | ||||||
See accompanying notes which are an integral part of these financial statements.
15
| SOUND MIND INVESTING FUND |
| SCHEDULE OF INVESTMENTS |
| October 31, 2023 – (Continued) |
| MUTUAL FUNDS — 8.91% - continued | Shares | Fair Value | ||||||
| JPMorgan U.S. Research Enhanced Equity Fund, Institutional Class | 100 | $ | 3,254 | |||||
| Longleaf Partners Fund | 150 | 2,952 | ||||||
| Longleaf Partners Small-Cap Fund | 100 | 2,149 | ||||||
| Lord Abbett Developing Growth Fund, Inc., Institutional Class(a) | 100 | 1,989 | ||||||
| PRIMECAP Odyssey Aggressive Growth Fund(a) | 100 | 3,840 | ||||||
| Prudential Jennison International Opportunities, Class Z(a) | 185 | 4,539 | ||||||
| Royce Premier Fund, Investment Class | 300 | 3,084 | ||||||
| T. Rowe Price International Discovery Fund, Investor Class | 75 | 4,105 | ||||||
| T. Rowe Price Mid-Cap Growth Fund, Investor Class | 50 | 4,501 | ||||||
| T. Rowe Price New Horizons Fund, Investor Class | 100 | 4,756 | ||||||
| T. Rowe Price Small-Cap Value Fund, Investor Class | 100 | 4,509 | ||||||
| Wasatch International Growth Fund, Investor Class(a) | 150 | 2,966 | ||||||
| Total Mutual Funds (Cost $9,496,722) | 8,698,816 | |||||||
| MONEY MARKET FUNDS — 25.78% | ||||||||
| Fidelity Investments Money Market Government Portfolio, Institutional Class, 5.28%(b) (c) | 25,160,575 | 25,160,575 | ||||||
| Total Money Market Funds (Cost $25,160,575) | 25,160,575 | |||||||
| Total Investments — 100.07% (Cost $99,585,077) | $ | 97,682,019 | ||||||
| Liabilities in Excess of Other Assets — (0.07)% | (68,402 | ) | ||||||
| NET ASSETS — 100.00% | $ | 97,613,617 | ||||||
| (a) | Non-income producing security. |
| (b) | Represents an investment greater than 25% of the Fund’s net assets. Performance of the Fund may be adversely impacted by concentrated investments in securities. The financial statements and portfolio holdings for these securities can be found at www.sec.gov. As of October 31, 2023, the percentage of net assets invested in iShares Russell 1000 Growth ETF and Fidelity Investments Money Market Government Portfolio was 26.75% and 25.78% respectively, of the Fund. |
| (c) | Rate disclosed is the seven day effective yield as of October 31, 2023. |
ETF - Exchange-Traded Fund
SPDR - Standard & Poor’s Depositary Receipt
See accompanying notes which are an integral part of these financial statements.
16
| SMI DYNAMIC ALLOCATION FUND |
| SCHEDULE OF INVESTMENTS |
| October 31, 2023 |
| EXCHANGE-TRADED FUNDS — 35.34% | Shares | Fair Value | ||||||
| SPDR® S&P 500® ETF(a) | 63,180 | $ | 26,421,876 | |||||
| Total Exchange-Traded Funds (Cost $25,930,332) | 26,421,876 | |||||||
| CLOSED-END FUNDS — 24.75% | ||||||||
| Sprott Physical Gold Trust(b) | 1,193,850 | 18,504,675 | ||||||
| Total Closed-End Funds (Cost $18,517,627) | 18,504,675 | |||||||
| MUTUAL FUNDS — 4.12% | ||||||||
| Gold Bullion Strategy Fund (The), Investor Class | 138,517 | 3,081,993 | ||||||
| Total Mutual Funds (Cost $3,100,000) | 3,081,993 | |||||||
| MONEY MARKET FUNDS — 26.53% | ||||||||
| Fidelity Investments Money Market Government Portfolio, Institutional Class, 5.28%(a) (c) | 19,836,520 | 19,836,520 | ||||||
| Total Money Market Funds (Cost $19,836,520) | 19,836,520 | |||||||
| Total Investments — 90.74% (Cost $67,384,479) | $ | 67,845,064 | ||||||
| Other Assets in Excess of Liabilities — 9.26% | 6,925,508 | |||||||
| NET ASSETS — 100.00% | $ | 74,770,572 | ||||||
| (a) | Represents an investment greater than 25% of the Fund’s net assets. Performance of the Fund may be adversely impacted by concentrated investments in securities. The financial statements and portfolio holdings for these securities can be found at www.sec.gov. As of October 31, 2023, the percentage of net assets invested in SPDR® S&P 500® ETF and Fidelity Investments Money Market Government Portfolio was 35.34% and 26.53% respectively, of the Fund. |
| (b) | Non-income producing security. |
| (c) | Rate disclosed is the seven day effective yield as of October 31, 2023. |
ETF - Exchange-Traded Fund
SPDR - Standard & Poor’s Depositary Receipt
See accompanying notes which are an integral part of these financial statements.
17
| SMI MULTI-STRATEGY FUND |
| SCHEDULE OF INVESTMENTS |
| October 31, 2023 |
| EXCHANGE-TRADED FUNDS — 49.41% | Shares | Fair Value | ||||||
| Fidelity Blue Chip Growth ETF(a) | 69,090 | $ | 1,953,864 | |||||
| Invesco Dynamic Energy Exploration & Production ETF | 20,550 | 662,738 | ||||||
| Invesco Optimum Yield Diversified Commodity Strategy No K-1 ETF | 147,290 | 2,162,217 | ||||||
| Invesco QQQ Trust, Series 1 | 5,660 | 1,985,924 | ||||||
| Invesco S&P SmallCap Energy ETF | 11,820 | 634,025 | ||||||
| iShares Russell 1000 Growth ETF | 23,230 | 6,088,815 | ||||||
| SPDR® S&P 500® ETF | 20,010 | 8,368,183 | ||||||
| SPDR® S&P Oil & Gas Equipment & Services ETF | 19,010 | 1,662,615 | ||||||
| Sprott Uranium Miners ETF(a) | 24,710 | 1,144,073 | ||||||
| Total Exchange-Traded Funds (Cost $24,931,115) | 24,662,454 | |||||||
| CLOSED-END FUNDS — 16.51% | ||||||||
| Sprott Physical Gold Trust(a) | 531,500 | 8,238,250 | ||||||
| Total Closed-End Funds (Cost $8,255,449) | 8,238,250 | |||||||
| MUTUAL FUNDS — 4.91% | ||||||||
| Fidelity Select Semiconductors Portfolio | 27,883 | 567,704 | ||||||
| Hennessy Cornerstone Mid Cap 30 Fund, Institutional Class(a) | 94,123 | 1,873,990 | ||||||
| Invesco International Small-Mid Company Fund, Class Y | 100 | 3,590 | ||||||
| Lord Abbett Developing Growth Fund, Inc., Institutional Class(a) | 100 | 1,989 | ||||||
| Wasatch International Growth Fund, Investor Class(a) | 100 | 1,977 | ||||||
| Total Mutual Funds (Cost $2,591,034) | 2,449,250 | |||||||
| MONEY MARKET FUNDS — 29.26% | ||||||||
| Fidelity Investments Money Market Government Portfolio, Institutional Class, 5.28%(b)(c) | 14,601,859 | 14,601,859 | ||||||
| Total Money Market Funds (Cost $14,601,859) | 14,601,859 | |||||||
| Total Investments — 100.09% (Cost $50,379,457) | $ | 49,951,813 | ||||||
| Liabilities in Excess of Other Assets — (0.09)% | (45,239 | ) | ||||||
| NET ASSETS — 100.00% | $ | 49,906,574 | ||||||
| (a) | Non-income producing security. |
| (b) | Rate disclosed is the seven day effective yield as of October 31, 2023. |
See accompanying notes which are an integral part of these financial statements.
18
| SMI MULTI-STRATEGY FUND |
| SCHEDULE OF INVESTMENTS |
| October 31, 2023 – (Continued) |
| (c) | Represents an investment greater than 25% of the Fund’s net assets. Performance of the Fund may be adversely impacted by concentrated investments in securities. The financial statements and portfolio holdings for these securities can be found at www.sec.gov. As of October 31, 2023, the percentage of net assets invested in Fidelity Investments Money Market Government Portfolio was 29.26% of the Fund. |
ETF - Exchange-Traded Fund
SPDR - Standard & Poor’s Depositary Receipt
See accompanying notes which are an integral part of these financial statements.
19
| SMI FUNDS |
| STATEMENTS OF ASSETS AND LIABILITIES |
| October 31, 2023 |
| SMI | SMI | |||||||||||
| Sound Mind | Dynamic | Multi- | ||||||||||
| Investing | Allocation | Strategy | ||||||||||
| Fund | Fund | Fund | ||||||||||
| Assets | ||||||||||||
| Investments in securities at fair value (cost $99,585,077, $67,384,479 and $50,379,457) (Note 3) | $ | 97,682,019 | $ | 67,845,064 | $ | 49,951,813 | ||||||
| Receivable for fund shares sold | 1,389 | 75 | 2,575 | |||||||||
| Receivable for investments sold | — | 15,198,821 | 4,910,550 | |||||||||
| Dividends receivable | 39,914 | 98,373 | 46,865 | |||||||||
| Prepaid expenses | 18,546 | 8,967 | 8,240 | |||||||||
| Total Assets | 97,741,868 | 83,151,300 | 54,920,043 | |||||||||
| Liabilities | ||||||||||||
| Bank overdraft | 39 | — | — | |||||||||
| Payable for fund shares redeemed | 4,261 | — | 2,450 | |||||||||
| Payable for investments purchased | — | 8,279,026 | 4,936,805 | |||||||||
| Payable to Adviser (Note 4) | 84,964 | 65,674 | 38,865 | |||||||||
| Payable to Administrator (Note 4) | 8,519 | 7,972 | 7,972 | |||||||||
| Payable to trustees | 2,000 | 2,000 | 2,000 | |||||||||
| Other accrued expenses | 28,468 | 26,056 | 25,377 | |||||||||
| Total Liabilities | 128,251 | 8,380,728 | 5,013,469 | |||||||||
| Net Assets | $ | 97,613,617 | $ | 74,770,572 | $ | 49,906,574 | ||||||
| Net Assets consist of: | ||||||||||||
| Paid-in capital | 113,420,473 | 76,035,028 | 52,848,153 | |||||||||
| Accumulated deficit | (15,806,856 | ) | (1,264,456 | ) | (2,941,579 | ) | ||||||
| Net Assets | $ | 97,613,617 | $ | 74,770,572 | $ | 49,906,574 | ||||||
| Shares outstanding (unlimited number of shares authorized, no par value) | 12,287,147 | 6,942,418 | 5,567,391 | |||||||||
| Net asset value, offering and redemption price per share (Note 2) | $ | 7.94 | $ | 10.77 | $ | 8.96 | ||||||
See accompanying notes which are an integral part of these financial statements.
20
| SMI FUNDS |
| STATEMENTS OF OPERATIONS |
| For the year ended October 31, 2023 |
| SMI | SMI | |||||||||||
| Sound Mind | Dynamic | Multi- | ||||||||||
| Investing | Allocation | Strategy | ||||||||||
| Fund | Fund | Fund | ||||||||||
| Investment Income | ||||||||||||
| Dividend income | $ | 3,102,500 | $ | 1,463,279 | $ | 1,159,560 | ||||||
| Total investment income | 3,102,500 | 1,463,279 | 1,159,560 | |||||||||
| Expenses | ||||||||||||
| Investment Adviser fees (Note 4) | 1,097,465 | 852,703 | 495,881 | |||||||||
| Administration fees (Note 4) | 35,155 | 27,923 | 19,801 | |||||||||
| Registration fees | 27,886 | 27,075 | 30,679 | |||||||||
| Fund accounting fees (Note 4) | 20,638 | 17,151 | 12,845 | |||||||||
| Legal fees | 19,448 | 19,448 | 19,448 | |||||||||
| Audit and tax preparation fees | 18,830 | 18,830 | 18,830 | |||||||||
| Transfer agent fees (Note 4) | 17,964 | 9,300 | 10,001 | |||||||||
| Printing and postage expenses | 13,453 | 10,076 | 7,976 | |||||||||
| Compliance service fees (Note 4) | 9,540 | 9,403 | 9,403 | |||||||||
| Trustee fees (Note 4) | 7,753 | 7,753 | 7,753 | |||||||||
| Line of credit | 6,020 | 4,774 | 3,071 | |||||||||
| Custodian fees | 6,002 | 4,660 | 3,397 | |||||||||
| Insurance expenses | 4,846 | 4,559 | 4,021 | |||||||||
| Interest expense | 39 | 908 | — | |||||||||
| Overdraft fees | — | 16 | — | |||||||||
| Miscellaneous expenses | 39,058 | 27,334 | 27,408 | |||||||||
| Total expenses | 1,324,097 | 1,041,913 | 670,514 | |||||||||
| Fees contractually waived by Adviser | — | — | (6,245 | ) | ||||||||
| Net operating expenses | 1,324,097 | 1,041,913 | 664,269 | |||||||||
| Net investment income | 1,778,403 | 421,366 | 495,291 | |||||||||
| Net Realized and Change in Unrealized Gain (Loss) on Investments | ||||||||||||
| Long term capital gain dividends from investment companies | 11,641 | — | 2,014 | |||||||||
| Net realized gain (loss) on investment securities transactions | (3,124,611 | ) | (1,118,811 | ) | 19,839 | |||||||
| Net change in unrealized appreciation (depreciation) on investment securities | (2,071,533 | ) | 4,308,086 | (271,183 | ) | |||||||
| Net realized and change in unrealized gain (loss) on investments | (5,184,503 | ) | 3,189,275 | (249,330 | ) | |||||||
| Net increase (decrease) in net assets resulting from operations | $ | (3,406,100 | ) | $ | 3,610,641 | $ | 245,961 | |||||
See accompanying notes which are an integral part of these financial statements.
21
| SOUND MIND INVESTING FUND |
| STATEMENTS OF CHANGES IN NET ASSETS |
| For the | For the | |||||||
| Year Ended | Year Ended | |||||||
| October 31, | October 31, | |||||||
| 2023 | 2022 | |||||||
| Increase (Decrease) in Net Assets due to: | ||||||||
| Operations | ||||||||
| Net investment income | $ | 1,778,403 | $ | 6,253,824 | ||||
| Long term capital gain dividends from investment companies | 11,641 | 822,179 | ||||||
| Net realized loss on investment securities transactions | (3,124,611 | ) | (13,402,573 | ) | ||||
| Net change in unrealized depreciation of investment securities | (2,071,533 | ) | (8,751,073 | ) | ||||
| Net decrease in net assets resulting from operations | (3,406,100 | ) | (15,077,643 | ) | ||||
| Distributions to Shareholders from Earnings (Note 2) | (1,085,594 | ) | (46,567,403 | ) | ||||
| Capital Transactions | ||||||||
| Proceeds from shares sold | 3,428,179 | 3,534,921 | ||||||
| Reinvestment of distributions | 1,071,473 | 45,907,374 | ||||||
| Amount paid for shares redeemed | (16,805,939 | ) | (23,502,932 | ) | ||||
| Net increase (decrease) in net assets resulting from capital transactions | (12,306,287 | ) | 25,939,363 | |||||
| Total Decrease in Net Assets | (16,797,981 | ) | (35,705,683 | ) | ||||
| Net Assets | ||||||||
| Beginning of year | 114,411,598 | 150,117,281 | ||||||
| End of year | $ | 97,613,617 | $ | 114,411,598 | ||||
| Share Transactions | ||||||||
| Shares sold | 408,088 | 376,993 | ||||||
| Shares issued in reinvestment of distributions | 129,405 | 4,989,932 | ||||||
| Shares redeemed | (2,010,167 | ) | (2,595,854 | ) | ||||
| Net increase (decrease) in shares outstanding | (1,472,674 | ) | 2,771,071 | |||||
See accompanying notes which are an integral part of these financial statements.
22
| SMI DYNAMIC ALLOCATION FUND |
| STATEMENTS OF CHANGES IN NET ASSETS |
| For the | For the | |||||||
| Year Ended | Year Ended | |||||||
| October 31, | October 31, | |||||||
| 2023 | 2022 | |||||||
| Increase (Decrease) in Net Assets due to: | ||||||||
| Operations | ||||||||
| Net investment income (loss) | $ | 421,366 | $ | (37,045 | ) | |||
| Long term capital gain dividends from investment companies | — | 76,168 | ||||||
| Net realized loss on investment securities transactions | (1,118,811 | ) | (809,037 | ) | ||||
| Net change in unrealized appreciation (depreciation) of investment securities | 4,308,086 | (21,788,614 | ) | |||||
| Net increase (decrease) in net assets resulting from operations | 3,610,641 | (22,558,528 | ) | |||||
| Distributions to Shareholders from Earnings (Note 2) | — | (8,760,391 | ) | |||||
| Capital Transactions | ||||||||
| Proceeds from shares sold | 3,440,542 | 5,681,085 | ||||||
| Reinvestment of distributions | — | 8,579,626 | ||||||
| Amount paid for shares redeemed | (18,029,514 | ) | (17,156,548 | ) | ||||
| Net decrease in net assets resulting from capital transactions | (14,588,972 | ) | (2,895,837 | ) | ||||
| Total Decrease in Net Assets | (10,978,331 | ) | (34,214,756 | ) | ||||
| Net Assets | ||||||||
| Beginning of year | 85,748,903 | 119,963,659 | ||||||
| End of year | $ | 74,770,572 | $ | 85,748,903 | ||||
| Share Transactions | ||||||||
| Shares sold | 311,556 | 462,036 | ||||||
| Shares issued in reinvestment of distributions | — | 653,437 | ||||||
| Shares redeemed | (1,632,297 | ) | (1,442,468 | ) | ||||
| Net decrease in shares outstanding | (1,320,741 | ) | (326,995 | ) | ||||
See accompanying notes which are an integral part of these financial statements.
23
| SMI MULTI-STRATEGY FUND |
| STATEMENTS OF CHANGES IN NET ASSETS |
| For the | For the | |||||||
| Year Ended | Year Ended | |||||||
| October 31, | October 31, | |||||||
| 2023 | 2022 | |||||||
| Increase (Decrease) in Net Assets due to: | ||||||||
| Operations | ||||||||
| Net investment income | $ | 495,291 | $ | 1,346,968 | ||||
| Long term capital gain dividends from investment companies | 2,014 | 182,572 | ||||||
| Net realized gain (loss) on investment securities transactions | 19,839 | (2,985,753 | ) | |||||
| Net change in unrealized depreciation of investment securities | (271,183 | ) | (7,341,851 | ) | ||||
| Net increase (decrease) in net assets resulting from operations | 245,961 | (8,798,064 | ) | |||||
| Distributions to Shareholders from Earnings (Note 2) | (203,162 | ) | (10,781,785 | ) | ||||
| Capital Transactions | ||||||||
| Proceeds from shares sold | 6,308,900 | 5,919,742 | ||||||
| Reinvestment of distributions | 200,476 | 10,619,805 | ||||||
| Amount paid for shares redeemed | (12,555,698 | ) | (9,934,151 | ) | ||||
| Net increase (decrease) in net assets resulting from capital transactions | (6,046,322 | ) | 6,605,396 | |||||
| Total Decrease in Net Assets | (6,003,523 | ) | (12,974,453 | ) | ||||
| Net Assets | ||||||||
| Beginning of year | 55,910,097 | 68,884,550 | ||||||
| End of year | $ | 49,906,574 | $ | 55,910,097 | ||||
| Share Transactions | ||||||||
| Shares sold | 675,408 | 605,232 | ||||||
| Shares issued in reinvestment of distributions | 22,030 | 1,024,089 | ||||||
| Shares redeemed | (1,341,782 | ) | (991,783 | ) | ||||
| Net increase (decrease) in shares outstanding | (644,344 | ) | 637,538 | |||||
See accompanying notes which are an integral part of these financial statements.
24
THIS PAGE INTENTIONALLY LEFT BLANK
| SOUND MIND INVESTING FUND |
| FINANCIAL HIGHLIGHTS |
| (For a share outstanding during each year) |
| For the | ||||
| Year Ended | ||||
| October 31, | ||||
| 2023 | ||||
| Selected Per Share Data: | ||||
| Net asset value, beginning of year | $ | 8.31 | ||
| Income from investment operations: | ||||
| Net investment income (loss)(a) | 0.15 | |||
| Net realized and unrealized gain (loss) on investments | (0.44 | ) | ||
| Total from investment operations | (0.29 | ) | ||
| Less distributions to shareholders from: | ||||
| Net investment income | (0.08 | ) | ||
| Net realized gains | — | |||
| Total distributions | (0.08 | ) | ||
| Net asset value, end of year | $ | 7.94 | ||
| Total Return(b) | (3.52 | )% | ||
| Ratios and Supplemental Data: | ||||
| Net assets, end of year (000 omitted) | $ | 97,614 | ||
| Ratio of expenses to average net assets(c) | 1.21 | % | ||
| Ratio of expenses to average net assets excluding interest expenses(c) (d) | 1.20 | % | ||
| Ratio of net investment income (loss) to average net assets(a) (c) | 1.62 | % | ||
| Portfolio turnover rate | 205.91 | % | ||
| (a) | Recognition of net investment income by the Fund is affected by the timing of the declaration of dividends by the underlying funds in which the Fund invests. |
| (b) | Total return in the above table represents the rate that the investor would have earned or lost on an investment in the Fund, assuming reinvestment of distributions. |
| (c) | These ratios exclude the impact of expenses of the underlying funds in which the Fund invests as represented in the Schedule of Investments. |
| (d) | These ratios do not include the effects of line of credit interest expense and borrowing costs. |
See accompanying notes which are an integral part of these financial statements.
26
| SOUND MIND INVESTING FUND |
| FINANCIAL HIGHLIGHTS |
| (For a share outstanding during each year) – (Continued) |
| For the | For the | For the | For the | |||||||||||
| Year Ended | Year Ended | Year Ended | Year Ended | |||||||||||
| October 31, | October 31, | October 31, | October 31, | |||||||||||
| 2022 | 2021 | 2020 | 2019 | |||||||||||
| $ | 13.66 | $ | 9.97 | $ | 9.64 | $ | 11.65 | |||||||
| 0.55 | (0.02 | ) | (0.04 | ) | 0.05 | |||||||||
| (1.59 | ) | 3.71 | 0.42 | 0.14 | ||||||||||
| (1.04 | ) | 3.69 | 0.38 | 0.19 | ||||||||||
| (0.42 | ) | — | (0.05 | ) | (0.05 | ) | ||||||||
| (3.89 | ) | — | — | (2.15 | ) | |||||||||
| (4.31 | ) | — | (0.05 | ) | (2.20 | ) | ||||||||
| $ | 8.31 | $ | 13.66 | $ | 9.97 | $ | 9.64 | |||||||
| (10.72 | )% | 37.01 | % | 3.92 | % | 4.28 | % | |||||||
| $ | 114,412 | $ | 150,117 | $ | 124,775 | $ | 147,650 | |||||||
| 1.19 | % | 1.17 | % | 1.20 | % | 1.18 | % | |||||||
| 1.19 | % | 1.16 | % | 1.20 | % | 1.17 | % | |||||||
| 4.87 | % | (0.09 | )% | (0.38 | )% | 0.45 | % | |||||||
| 259.58 | % | 300.02 | % | 214.07 | % | 192.77 | % | |||||||
See accompanying notes which are an integral part of these financial statements.
27
| SMI DYNAMIC ALLOCATION FUND |
| FINANCIAL HIGHLIGHTS |
| (For a share outstanding during each year) |
| For the | ||||
| Year Ended | ||||
| October 31, | ||||
| 2023 | ||||
| Selected Per Share Data: | ||||
| Net asset value, beginning of year | $ | 10.38 | ||
| Income from investment operations: | ||||
| Net investment income (loss)(a) | 0.05 | |||
| Net realized and unrealized gain (loss) on investments | 0.34 | |||
| Total from investment operations | 0.39 | |||
| Less distributions to shareholders from: | ||||
| Net investment income | — | |||
| Net realized gains | — | |||
| Total distributions | — | |||
| Net asset value, end of year | $ | 10.77 | ||
| Total Return(c) | 3.76 | % | ||
| Ratios and Supplemental Data: | ||||
| Net assets, end of year (000 omitted) | $ | 74,771 | ||
| Ratio of expenses to average net assets(d) | 1.22 | % | ||
| Ratio of expenses to average net assets excluding interest expenses(d) (e) | 1.22 | % | ||
| Ratio of net investment income (loss) to average net assets(a) (d) | 0.49 | % | ||
| Portfolio turnover rate | 174.21 | % | ||
| (a) | Recognition of net investment income by the Fund is affected by the timing of the declaration of dividends by the underlying funds in which the Fund invests. |
| (b) | Rounds to less than $0.005 per share. |
| (c) | Total return in the above table represents the rate that the investor would have earned or lost on an investment in the Fund, assuming reinvestment of distributions. |
| (d) | These ratios exclude the impact of expenses of the underlying funds in which the Fund invests as represented in the Schedule of Investments. |
| (e) | These ratios do not include the effects of line of credit interest expense and borrowing costs. |
See accompanying notes which are an integral part of these financial statements.
28
| SMI DYNAMIC ALLOCATION FUND |
| FINANCIAL HIGHLIGHTS |
| (For a share outstanding during each year) – (Continued) |
| For the | For the | For the | For the | |||||||||||
| Year Ended | Year Ended | Year Ended | Year Ended | |||||||||||
| October 31, | October 31, | October 31, | October 31, | |||||||||||
| 2022 | 2021 | 2020 | 2019 | |||||||||||
| $ | 13.97 | $ | 12.45 | $ | 12.17 | $ | 11.66 | |||||||
| — | (b) | 0.10 | 0.06 | 0.12 | ||||||||||
| (2.55 | ) | 2.08 | 0.37 | 0.56 | ||||||||||
| (2.55 | ) | 2.18 | 0.43 | 0.68 | ||||||||||
| (0.06 | ) | (0.09 | ) | (0.15 | ) | (0.17 | ) | |||||||
| (0.98 | ) | (0.57 | ) | — | — | |||||||||
| (1.04 | ) | (0.66 | ) | (0.15 | ) | (0.17 | ) | |||||||
| $ | 10.38 | $ | 13.97 | $ | 12.45 | $ | 12.17 | |||||||
| (19.82 | )% | 18.17 | % | 3.55 | % | 5.97 | % | |||||||
| $ | 85,749 | $ | 119,964 | $ | 113,195 | $ | 119,339 | |||||||
| 1.20 | % | 1.17 | % | 1.19 | % | 1.18 | % | |||||||
| 1.19 | % | 1.16 | % | 1.19 | % | 1.17 | % | |||||||
| (0.04 | )% | 0.80 | % | 0.44 | % | 1.02 | % | |||||||
| 317.28 | % | 175.11 | % | 275.33 | % | 218.06 | % | |||||||
See accompanying notes which are an integral part of these financial statements.
29
| SMI MULTI-STRATEGY FUND |
| FINANCIAL HIGHLIGHTS |
| (For a share outstanding during each year) |
| For the | ||||
| Year Ended | ||||
| October 31, | ||||
| 2023 | ||||
| Selected Per Share Data: | ||||
| Net asset value, beginning of year | $ | 9.00 | ||
| Income from investment operations: | ||||
| Net investment income(a) | 0.08 | |||
| Net realized and unrealized gain (loss) on investments | (0.09 | ) | ||
| Total from investment operations | (0.01 | ) | ||
| Less distributions to shareholders from: | ||||
| Net investment income | (0.03 | ) | ||
| Net realized gains | — | |||
| Total distributions | (0.03 | ) | ||
| Net asset value, end of year | $ | 8.96 | ||
| Total Return(b) | (0.09 | )% | ||
| Ratios and Supplemental Data: | ||||
| Net assets, end of year (000 omitted) | $ | 49,907 | ||
| Ratio of expenses to average net assets(c) | 1.21 | % | ||
| Ratio of expenses to average net assets excluding interest expenses(c) (d) | 1.20 | % | ||
| Ratio of expenses to average net assets before waiver and reimbursement(c) | 1.22 | % | ||
| Ratio of net investment income to average net assets(a) (c) | 0.90 | % | ||
| Portfolio turnover rate | 196.14 | % | ||
| (a) | Recognition of net investment income by the Fund is affected by the timing of the declaration of dividends by the underlying funds in which the Fund invests. |
| (b) | Total return in the above table represents the rate that the investor would have earned or lost on an investment in the Fund, assuming reinvestment of distributions. |
| (c) | These ratios exclude the impact of expenses of the underlying funds in which the Fund invests as represented in the Schedule of Investments. |
| (d) | These ratios do not include the effects of line of credit interest expense and borrowing costs. |
See accompanying notes which are an integral part of these financial statements.
30
| SMI MULTI-STRATEGY FUND |
| FINANCIAL HIGHLIGHTS |
| (For a share outstanding during each period) – (Continued) |
| For the | For the | For the | For the | |||||||||||
| Year Ended | Year Ended | Year Ended | Year Ended | |||||||||||
| October 31, | October 31, | October 31, | October 31, | |||||||||||
| 2022 | 2021 | 2020 | 2019 | |||||||||||
| $ | 12.36 | $ | 9.88 | $ | 9.46 | $ | 9.46 | |||||||
| 0.25 | 0.04 | 0.01 | 0.05 | |||||||||||
| (1.63 | ) | 2.48 | 0.45 | 0.26 | ||||||||||
| (1.38 | ) | 2.52 | 0.46 | 0.31 | ||||||||||
| (0.25 | ) | (0.04 | ) | (0.04 | ) | (0.07 | ) | |||||||
| (1.73 | ) | — | — | (0.24 | ) | |||||||||
| (1.98 | ) | (0.04 | ) | (0.04 | ) | (0.31 | ) | |||||||
| $ | 9.00 | $ | 12.36 | $ | 9.88 | $ | 9.46 | |||||||
| (13.29 | )% | 25.51 | % | 4.91 | % | 3.55 | % | |||||||
| $ | 55,910 | $ | 68,885 | $ | 56,291 | $ | 62,614 | |||||||
| 1.16 | % | 1.16 | % | 1.16 | % | 1.15 | % | |||||||
| 1.15 | % | 1.15 | % | 1.15 | % | 1.15 | % | |||||||
| 1.19 | % | 1.14 | % | 1.19 | % | 1.21 | % | |||||||
| 2.20 | % | 0.35 | % | 0.09 | % | 0.53 | % | |||||||
| 292.22 | % | 231.35 | % | 252.74 | % | 225.42 | % | |||||||
See accompanying notes which are an integral part of these financial statements.
31
| SMI FUNDS |
| NOTES TO THE FINANCIAL STATEMENTS |
| October 31, 2023 |
NOTE 1. ORGANIZATION
The Sound Mind Investing Fund (“SMI Fund”), SMI Dynamic Allocation Fund and SMI Multi-Strategy Fund (each a “Fund” and collectively, the “Funds”) are each registered under the Investment Company Act of 1940, as amended (“1940 Act”), as a diversified series of Valued Advisers Trust (the “Trust”). The Trust is a management investment company established under the laws of Delaware by an Agreement and Declaration of Trust dated June 13, 2008 (the “Trust Agreement”). The Trust Agreement permits the Board of Trustees (the “Board” or the “Trustees”) to issue an unlimited number of shares of beneficial interest of separate series without par value. Each Fund is one of a series of funds currently authorized by the Trustees. The investment adviser to the Funds is SMI Advisory Services, LLC (the “Adviser”). The SMI Fund seeks to provide long-term capital appreciation. The SMI Dynamic Allocation Fund and SMI Multi-Strategy Fund seek total return. Total return is composed of both income and capital appreciation.
Each of the Funds is a “fund-of-funds” in which each Fund may invest in other investment companies, including exchange-traded and closed-end funds. For a discussion on the strategies employed by each of the Funds, please refer to pages 11-13 of this report.
NOTE 2. SIGNIFICANT ACCOUNTING POLICIES
The Funds are investment companies and follow accounting and reporting guidance under Financial Accounting Standards Board Accounting Standards Codification (“ASC”) Topic 946, “Financial Services-Investment Companies”. The following is a summary of significant accounting policies followed by the Funds in the preparation of their financial statements. These policies are in conformity with generally accepted accounting principles in the United States of America (“GAAP”).
Regulatory Update – Tailored Shareholder Reports for Mutual Funds and Exchange-Traded Funds (“ETFs”) – Effective January 24, 2023, the SEC adopted rule and form amendments to require mutual funds and ETFs to transmit concise and visually engaging streamlined annual and semiannual reports to shareholders that highlight key information. Other information, including financial statements, will no longer appear in a streamlined shareholder report but must be available online, delivered free of charge upon request, and filed on a semiannual basis on
32
| SMI FUNDS |
| NOTES TO THE FINANCIAL STATEMENTS |
| October 31, 2023 – (Continued) |
NOTE 2. SIGNIFICANT ACCOUNTING POLICIES – (Continued)
Form N-CSR. The rule and form amendments have a compliance date of July 24, 2024. At this time, management is evaluating the impact of these amendments on the shareholder reports for the Funds.
Estimates – The preparation of financial statements in conformity with GAAP requires management to make estimates and assumptions that affect the reported amounts of assets and liabilities and disclosure of contingent assets and liabilities at the date of the financial statements and the reported amounts of increases and decreases in net assets from operations during the reporting period. Actual results could differ from those estimates.
Federal Income Taxes – The Funds make no provision for federal income or excise tax. Each Fund has qualified and intends to qualify each year as a regulated investment company (“RIC”) under subchapter M of the Internal Revenue Code of 1986, as amended, by complying with the requirements applicable to RICs and by distributing substantially all of its taxable income. Each Fund also intends to distribute sufficient net investment income and net capital gains, if any, so that it will not be subject to excise tax on undistributed income and gains. If the required amount of net investment income or gains is not distributed, the Funds could incur a tax expense.
As of and during the fiscal year ended October 31, 2023, the Funds did not have any liabilities for any unrecognized tax benefits. The Funds recognize interest and penalties, if any, related to unrecognized tax benefits as income tax expense on the Statements of Operations when incurred. During the fiscal year ended October 31, 2023, the Funds did not incur any interest or penalties. Management of the Funds has reviewed tax positions taken in tax years that remain subject to examination by all major tax jurisdictions, including federal (i.e., the last three tax year ends and the interim tax period since then, as applicable). Management believes that there is no tax liability resulting from unrecognized tax benefits related to uncertain tax positions taken.
Expenses – Expenses incurred by the Trust that do not relate to a specific fund are allocated to the individual funds of the Trust based on each fund’s relative net assets or another appropriate basis (as determined by the Board).
Security Transactions and Related Income – The Funds follow industry practice and record security transactions on the trade date for financial reporting purposes. The specific identification method is used for determining gains or losses for
33
| SMI FUNDS |
| NOTES TO THE FINANCIAL STATEMENTS |
| October 31, 2023 – (Continued) |
NOTE 2. SIGNIFICANT ACCOUNTING POLICIES – (Continued)
financial statement and income tax purposes. Dividend income and long-term capital gains dividends from investment companies are recorded on the ex-dividend date and interest income is recorded on an accrual basis. Discounts and premiums on securities purchased are accreted or amortized using the effective interest method, if applicable. Withholding taxes on foreign dividends, if any, have been provided for in accordance with the Funds’ understanding of the applicable country’s tax rules and rates.
Dividends and Distributions – Each Fund intends to distribute its net investment income and net realized long-term and short-term capital gains, if any, at least annually. Dividends and distributions to shareholders, which are determined in accordance with income tax regulations, are recorded on the ex-dividend date. The treatment for financial reporting purposes of distributions made to shareholders during the period from net investment income or net realized capital gains may differ from their ultimate treatment for federal income tax purposes. These differences are caused primarily by differences in the timing of the recognition of certain components of income, expense or realized capital gain for federal income tax purposes. Where such differences are permanent in nature, they are reclassified among the components of the net assets based on their ultimate characterization for federal income tax purposes. Any such reclassifications will have no effect on net assets, results of operations or net asset value (“NAV”) per share of the Funds. For the fiscal year ended October 31, 2023, the Funds had the following classifications:
| Accumulated | ||||||||
| Paid-In | Earnings | |||||||
| Fund | Capital | (Deficit) | ||||||
| SMI Fund | $ | 11,383 | $ | (11,383 | ) | |||
| SMI Dynamic Allocation Fund | — | — | ||||||
| SMI Multi-Strategy Fund | 2,863 | (2,863 | ) | |||||
Share Valuation – The NAV is calculated each day the New York Stock Exchange (the “NYSE”) is open by dividing the total value of the Fund’s assets, less liabilities, by the number of shares outstanding for the Fund.
34
| SMI FUNDS |
| NOTES TO THE FINANCIAL STATEMENTS |
| October 31, 2023 – (Continued) |
NOTE 3. SECURITIES VALUATION AND FAIR VALUE MEASUREMENTS
Each Fund values its portfolio securities at fair value as of the close of regular trading on the NYSE (normally 4:00 p.m. Eastern time) on each business day the NYSE is open for business. Fair value is defined as the price that a Fund would receive upon selling an investment in a timely transaction to an independent buyer in the principal or most advantageous market of the investment. GAAP establishes a three-tier hierarchy to maximize the use of observable market data and minimize the use of unobservable inputs and to establish classification of fair value measurements for disclosure purposes.
Inputs refer broadly to the assumptions that market participants would use in pricing the asset or liability, including assumptions about risk (the risk inherent in a particular valuation technique used to measure fair value including a pricing model and/or the risk inherent in the inputs to the valuation technique). Inputs may be observable or unobservable. Observable inputs are inputs that reflect the assumptions market participants would use in pricing the asset or liability developed based on market data obtained and available from sources independent of the reporting entity. Unobservable inputs are inputs that reflect the reporting entity’s own assumptions about the assumptions market participants would use in pricing the asset or liability developed based on the best information available in the circumstances.
Various inputs are used in determining the value of each Fund’s investments. These inputs are summarized in the three broad levels listed below.
| ● | Level 1 – unadjusted quoted prices in active markets for identical investments and/or registered investment companies where the value per share is determined and published and is the basis for current transactions for identical assets or liabilities at the valuation date |
| ● | Level 2 – other significant observable inputs (including, but not limited to, quoted prices for an identical security in an inactive market, quoted prices for similar securities, interest rates, prepayment speeds, credit risk, etc.) |
| ● | Level 3 – significant unobservable inputs (including the Funds’ own assumptions in determining fair value of investments based on the best information available) |
35
| SMI FUNDS |
| NOTES TO THE FINANCIAL STATEMENTS |
| October 31, 2023 – (Continued) |
NOTE 3. SECURITIES VALUATION AND FAIR VALUE MEASUREMENTS – (Continued)
The inputs used to measure fair value may fall into different levels of the fair value hierarchy. In such cases, for disclosure purposes, the level in the fair value hierarchy which is reported is determined based on the lowest level input that is significant to the fair value measurement in its entirety.
Equity securities, including ETFs and closed-end funds, that are traded on any stock exchange are generally valued at the last quoted sale price on the security’s primary exchange. Lacking a last sale price, an exchange- traded security is generally valued at its last bid price. Securities traded in the NASDAQ over-the-counter market are generally valued at the NASDAQ Official Closing Price. When using the market quotations and when the market is considered active, the security is classified as a Level 1 security. In the event that market quotations are not readily available or are considered unreliable due to market or other events, securities are valued in good faith by the Adviser as “valuation designee” under the oversight of the Board. The Adviser has adopted written policies and procedures for valuing securities and other assets in circumstances where market quotes are not readily available. In the event that market quotes are not readily available, and the security or asset cannot be valued pursuant to one of the valuation methods, the value of the security or asset will be determined in good faith by the Adviser pursuant to its policies and procedures. On a quarterly basis, the Adviser’s fair valuation determinations will be reviewed by the Board. Under these policies, the securities will be classified as Level 2 or 3 within the fair value hierarchy, depending on the inputs used.
Investments in mutual funds, including money market mutual funds, are generally priced at the ending NAV. These securities are categorized as Level 1 securities. In the event that the ending NAV for a mutual fund is unavailable at the end of day pricing time, the Adviser may, in accordance with the Trust’s valuation policies, consider all appropriate factors in determining the fair value of the mutual fund. In such cases the security will generally be categorized as a Level 2 security.
In accordance with the Trust’s valuation policies, the Valuation Designee is required to consider all appropriate factors relevant to the value of securities for which it has determined other pricing sources are not available or reliable as described above. No single method exists for determining fair value, because fair value depends upon the circumstances of each individual case. As a general principle, the current fair value of a security being valued by the Valuation Designee’s would be the amount that the Fund might reasonably expect to receive upon the current sale. Methods that are in
36
| SMI FUNDS |
| NOTES TO THE FINANCIAL STATEMENTS |
| October 31, 2023 – (Continued) |
NOTE 3. SECURITIES VALUATION AND FAIR VALUE MEASUREMENTS – (Continued)
accordance with this principle may, for example, be based on (i) a multiple of earnings; (ii) a discount from market prices of a similar freely traded security (including a derivative security or a basket of securities traded on other markets, exchanges or among dealers); or (iii) yield to maturity with respect to debt issues, or a combination of these and other methods. Fair-value pricing is permitted if, in the Valuation Designee’s opinion, the validity of market quotations appears to be questionable based on factors such as evidence of a thin market in the security based on a small number of quotations, a significant event occurs after the close of a market but before a Fund’s NAV calculation that may affect a security’s value, or the Valuation Designee is aware of any other data that calls into question the reliability of market quotations.
The following is a summary of the inputs used to value the Funds’ investments as of October 31, 2023:
| Valuation Inputs | ||||||||||||||||
| SMI Fund | Level 1 | Level 2 | Level 3 | Total | ||||||||||||
| Exchange-Traded Funds | $ | 63,822,628 | $ | — | $ | — | $ | 63,822,628 | ||||||||
| Mutual Funds | 8,698,816 | — | — | 8,698,816 | ||||||||||||
| Money Market Funds | 25,160,575 | — | — | 25,160,575 | ||||||||||||
| Total | $ | 97,682,019 | $ | — | $ | — | $ | 97,682,019 | ||||||||
| Valuation Inputs | ||||||||||||||||
| SMI Dynamic Allocation Fund | Level 1 | Level 2 | Level 3 | Total | ||||||||||||
| Exchange-Traded Funds | $ | 26,421,876 | $ | — | $ | — | $ | 26,421,876 | ||||||||
| Closed-End Funds | 18,504,675 | — | — | 18,504,675 | ||||||||||||
| Mutual Funds | 3,081,993 | — | — | 3,081,993 | ||||||||||||
| Money Market Funds | 19,836,520 | — | — | 19,836,520 | ||||||||||||
| Total | $ | 67,845,064 | $ | — | $ | — | $ | 67,845,064 | ||||||||
| Valuation Inputs | ||||||||||||||||
| SMI Multi-Strategy Fund | Level 1 | Level 2 | Level 3 | Total | ||||||||||||
| Exchange-Traded Funds | $ | 24,662,454 | $ | — | $ | — | $ | 24,662,454 | ||||||||
| Closed-End Funds | 8,238,250 | — | — | 8,238,250 | ||||||||||||
| Mutual Funds | 2,449,250 | — | — | 2,449,250 | ||||||||||||
| Money Market Funds | 14,601,859 | — | — | 14,601,859 | ||||||||||||
| Total | $ | 49,951,813 | $ | — | $ | — | $ | 49,951,813 | ||||||||
37
| SMI FUNDS |
| NOTES TO THE FINANCIAL STATEMENTS |
| October 31, 2023 – (Continued) |
NOTE 3. SECURITIES VALUATION AND FAIR VALUE MEASUREMENTS – (Continued)
The Funds did not hold any investments at the end of the reporting period in which significant unobservable inputs (Level 3) were used in determining fair value; therefore, no reconciliation of Level 3 securities is included for this reporting period.
NOTE 4. FEES AND OTHER TRANSACTIONS WITH AFFILIATES
Under the terms of the investment advisory agreement with respect to each Fund (the “Advisory Agreements”), the Adviser is responsible for managing each Fund’s investments. As compensation for its management services, each Fund is obligated to pay the Adviser a fee based on the Fund’s average daily net assets as follows:
| SMI | ||||||
| SMI Dynamic | Multi-Strategy | |||||
| SMI Fund | Allocation Fund | Fund | ||||
| Fund Assets | Management Fee | Management Fee | Management Fee | |||
| $1 – $100 million | 1.00% | 1.00% | 0.90% | |||
| $100,000,001 – $250 million | 1.00% | 1.00% | 0.80% | |||
| $250,000,001 to $500 million | 0.90% | 0.90% | 0.70% | |||
| Over $500 million | 0.80% | 0.80% | 0.60% |
The Adviser contractually has agreed to waive its management fee and/or reimburse certain operating expenses, but only to the extent necessary so that each Fund’s total annual operating expenses (excluding interest, taxes, brokerage commissions, other expenses which are capitalized in accordance with GAAP, extraordinary expenses, dividend expense on short sales, 12b-1 fees, and acquired fund fees and expenses) do not exceed 1.45% of the Fund’s average daily net assets with respect to the SMI Fund, 1.45% with respect to the SMI Dynamic Allocation Fund, and 1.30% with respect to the SMI Multi-Strategy Fund. The contractual arrangement for each Fund is in place through February 29, 2024. Prior to March 1, 2023, the expense cap for the SMI Fund and the SMI Multi-Strategy Fund was 1.50% and 1.15%, respectively.
38
| SMI FUNDS |
| NOTES TO THE FINANCIAL STATEMENTS |
| October 31, 2023 – (Continued) |
NOTE 4. FEES AND OTHER TRANSACTIONS WITH AFFILIATES – (Continued)
Each fee waiver or expense reimbursement by the Adviser is subject to repayment by the applicable Fund within the three years following the date in which the fee waiver or expense reimbursement occurred, provided that the Fund is able to make the repayment without exceeding the expense limitation in effect at the time of the fee waiver or expense reimbursement and the expense limitation at the time of the repayment.
As of October 31, 2023, the Adviser may seek repayment of investment advisory fee waivers and expense reimbursements from the SMI Multi-Strategy Fund as follows:
| Recoverable through | Amount | |||
| October 31, 2025 | $ | 21,003 | ||
| October 31, 2026 | 6,245 | |||
The Trust retains Ultimus Fund Solutions, LLC (“Ultimus” or “Administrator”), to provide the Funds with administration, fund accounting, and transfer agent services, including all regulatory reporting.
Northern Lights Compliance Services, LLC (“NLCS”), an affiliate of Ultimus, provides a Chief Compliance Officer and an Anti-Money Laundering Compliance Officer to the Trust, as well as related compliance services, pursuant to a consulting agreement between NLCS and the Trust. Under the terms of such agreement, NLCS receives fees from the Funds.
The officers and one trustee of the Trust are members of management and/or employees of the Administrator or of NLCS and are not paid by the Trust for services to the Funds. Ultimus Fund Distributors, LLC (the “Distributor”), a wholly-owned subsidiary of Ultimus, acts as the distributor of the Funds’ shares. There were no payments made to the Distributor by the Funds for the fiscal year ended October 31, 2023.
39
| SMI FUNDS |
| NOTES TO THE FINANCIAL STATEMENTS |
| October 31, 2023 – (Continued) |
NOTE 5. PURCHASES AND SALES OF SECURITIES
For the fiscal year ended October 31, 2023, purchases and sales of investment securities, other than short-term investments, were as follows:
| SMI Dynamic | SMI Multi- | |||||||||||
| Allocation | Strategy | |||||||||||
| SMI Fund | Fund | Fund | ||||||||||
| Purchases | $ | 161,023,159 | $ | 125,702,593 | $ | 82,598,580 | ||||||
| Sales | $ | 123,054,502 | $ | 130,267,325 | $ | 78,598,240 | ||||||
There were no purchases or sales of long-term U.S. government obligations during the fiscal year ended October 31, 2023.
NOTE 6. LINE OF CREDIT
During the fiscal year ended October 31, 2023, the Trust, on behalf of the Funds, entered into a short-term credit agreement (“Line of Credit”) with Huntington National Bank (“Huntington”), expiring on January 19, 2024. Under the terms of the agreement, each of the Funds may borrow up to the lesser of 10% of a Fund’s daily market value or $5 million at an interest rate equal to the Secured Overnight Financing Rate (“SOFR”) plus 161.50 basis points (if SOFR is less than 0.385%, such rate shall be deemed to be 0.385%), 6.95% as of October 31, 2023. The purpose of the agreement is to meet temporary or emergency cash needs, including redemption requests that might otherwise require the untimely disposition of securities. Huntington receives an annual facility fee of 0.125% on $5 million as well as an additional annual fee of 0.125% on any unused portion of the credit facility, invoiced quarterly, for providing the Line of Credit. The Funds will not borrow money, except (a) from a bank, provided that immediately after such borrowing there is an asset coverage of 300% for all borrowings of a Fund; or (b) from a bank or other persons for temporary purposes only, provided that such temporary borrowings are in an amount not exceeding 5% of a Fund’s total assets at the time when the borrowing is made. To the extent that the line of credit is utilized, it will be collateralized by securities in the Funds’ portfolios.
40
| SMI FUNDS |
| NOTES TO THE FINANCIAL STATEMENTS |
| October 31, 2023 – (Continued) |
NOTE 6. LINE OF CREDIT – (Continued)
The borrowings by the Funds during the fiscal year ended October 31, 2023, were as follows:
| Weighted | ||||||||||||||||||||
| Average | Average | Number | Interest | Maximum | ||||||||||||||||
| Daily Loan | Interest | of Days | Expense | Loan | ||||||||||||||||
| Fund | Balance(a) | Rate(a) | Outstanding(b) | Accrued | Outstanding | |||||||||||||||
| SMI Fund | $ | 200,000 | 6.94 | % | 1 | $ | 39 | $ | 200,000 | |||||||||||
| SMI Dynamic Allocation Fund | 219,565 | 6.47 | % | 23 | 908 | 500,000 | ||||||||||||||
| (a) | Averages based on the number of days outstanding. |
| (b) | Number of Days Outstanding represents the total days during the fiscal year ended October 31, 2023, that a Fund utilized the Line of Credit. |
As of October 31, 2023, the Funds had no outstanding borrowings under this Line of Credit.
NOTE 7. FEDERAL TAX INFORMATION
At October 31, 2023, the net unrealized appreciation (depreciation) and tax cost of investments for tax purposes was as follows:
| SMI Dynamic | SMI Multi- | |||||||||||
| Allocation | Strategy | |||||||||||
| SMI Fund | Fund | Fund | ||||||||||
| Gross unrealized appreciation | $ | 355,268 | $ | 491,544 | $ | 250,530 | ||||||
| Gross unrealized depreciation | (2,259,854 | ) | (858,703 | ) | (1,086,976 | ) | ||||||
| Net unrealized appreciation/(depreciation) on investments | $ | (1,904,586 | ) | $ | (367,159 | ) | $ | (836,446 | ) | |||
| Tax cost of investments | $ | 99,586,605 | $ | 68,212,223 | $ | 50,788,259 | ||||||
41
| SMI FUNDS |
| NOTES TO THE FINANCIAL STATEMENTS |
| October 31, 2023 – (Continued) |
NOTE 7. FEDERAL TAX INFORMATION – (Continued)
The tax character of distributions for the fiscal years ended October 31, 2023 and October 31, 2022 were as follows:
| SMI Dynamic | ||||||||||||||||
| SMI Fund | Allocation Fund | |||||||||||||||
| 2023 | 2022 | 2023 | 2022 | |||||||||||||
| Distributions paid from:(a) | ||||||||||||||||
| Ordinary income | $ | 1,085,594 | $ | 27,151,153 | $ | — | $ | 5,887,026 | ||||||||
| Long-term capital gains | — | 19,416,250 | — | 2,873,365 | ||||||||||||
| Total taxable distributions paid | $ | 1,085,594 | $ | 46,567,403 | $ | — | $ | 8,760,391 | ||||||||
| SMI Multi-Strategy Fund | ||||||||||||||||
| 2023 | 2022 | |||||||||||||||
| Distributions paid from:(a) | ||||||||||||||||
| Ordinary income | $ | 203,162 | $ | 6,876,889 | ||||||||||||
| Long-term capital gains | — | 3,904,896 | ||||||||||||||
| Total taxable distributions paid | $ | 203,162 | $ | 10,781,785 | ||||||||||||
| (a) | For federal income tax purposes, distributions of short-term capital gains are treated as ordinary income distributions. |
At October 31, 2023, the components of distributable earnings (accumulated losses) on a tax basis was as follows:
| SMI Dynamic | SMI Multi- | |||||||||||
| Allocation | Strategy | |||||||||||
| SMI Fund | Fund | Fund | ||||||||||
| Undistributed ordinary income | $ | 1,778,403 | $ | 124,437 | $ | 292,129 | ||||||
| Undistributed long-term capital gains | — | — | — | |||||||||
| Accumulated capital and other losses | (15,680,673 | ) | (1,021,734 | ) | (2,397,262 | ) | ||||||
| Unrealized appreciation/(depreciation) on investments | (1,904,586 | ) | (367,159 | ) | (836,446 | ) | ||||||
| Total accumulated earnings/(deficit) | $ | (15,806,856 | ) | $ | (1,264,456 | ) | $ | (2,941,579 | ) | |||
42
| SMI FUNDS |
| NOTES TO THE FINANCIAL STATEMENTS |
| October 31, 2023 – (Continued) |
NOTE 7. FEDERAL TAX INFORMATION – (Continued)
At October 31, 2023, the difference between book basis and tax basis unrealized appreciation (depreciation) is attributable to the tax deferral of losses on wash sales.
At October 31, 2023, the following Funds had net capital loss carryforwards which are available to offset future net capital gains, if any:
| SMI Dynamic | ||||||||||||||||
| SMI Fund | Allocation Fund | |||||||||||||||
| Short-Term | Long-Term | Short-Term | Long-Term | |||||||||||||
| Non-Expiring | $ | 15,680,673 | $ | — | $ | 436,790 | $ | 584,944 | ||||||||
| SMI Multi-Strategy Fund | ||||||||||||||||
| Short-Term | Long-Term | |||||||||||||||
| Non-Expiring | $ | 2,397,262 | $ | — | ||||||||||||
Capital loss carryforwards are available to offset future realized capital gains and thereby reduce further taxable gain distributions. During the fiscal year ended October 31, 2023, the SMI Dynamic Allocation Fund and SMI Multi-Strategy Fund utilized $293,877 and $430,588, respectively of its/their capital loss carryforwards.
NOTE 8. INVESTMENT IN OTHER INVESTMENT COMPANIES
Each Fund may invest a significant portion of its assets in shares of one or more investment companies, including ETFs, open-end and closed-end mutual funds and money market mutual funds. Each Fund will incur additional indirect expenses (acquired fund fees and expenses) to the extent it invests in shares of other investment companies. As of October 31, 2023, the SMI Fund had 65.38% and 8.91% of the value of its net assets invested in ETFs and mutual funds, respectively. As of October 31, 2023, the SMI Dynamic Allocation Fund had 35.34%, 24.75% and 4.12% of the value of its net assets invested in ETFs, closed-end funds and mutual funds, respectively. As of October 31, 2023, the SMI Multi-Strategy Fund had 49.41%, 16.51% and 4.91% of the value of its net assets
43
| SMI FUNDS |
| NOTES TO THE FINANCIAL STATEMENTS |
| October 31, 2023 – (Continued) |
invested in ETFs, closed-end funds and mutual funds, respectively. The financial statements of these ETFs, open-end and closed-end mutual funds can be found at www.sec.gov.
NOTE 9. COMMITMENTS AND CONTIGENCIES
The Trust indemnifies its officers and Trustees for certain liabilities that may arise from their performance of their duties to the Trust or the Funds. Additionally, in the normal course of business, the Trust enters into contracts that contain a variety of representations and warranties which provide general indemnifications. The Trust’s maximum exposure under these arrangements is unknown, as this would involve future claims that may be made against the Trust that have not yet occurred.
NOTE 10. SUBSEQUENT EVENTS
Management of the Funds has evaluated the need for disclosures and/or adjustments resulting from subsequent events through the date at which these financial statements were issued. Based upon this evaluation, management has determined there were no items requiring adjustment of the financial statements or additional disclosure.
44
| REPORT OF INDEPENDENT REGISTERED |
| PUBLIC ACCOUNTING FIRM |
To the Shareholders of SMI Funds and
Board of Trustees of Valued Advisers Trust
Opinion on the Financial Statements
We have audited the accompanying statements of assets and liabilities, including the schedules of investments, of SMI Funds comprising Sound Mind Investing Fund, SMI Dynamic Allocation Fund, and SMI Multi-Strategy Fund (the “Funds”), each a series of Valued Advisers Trust, as of October 31, 2023, the related statements of operations for the year then ended, the statements of changes in net assets for each of the two years in the period then ended, the related notes, and the financial highlights for each of the five years in the period then ended (collectively referred to as the “financial statements”). In our opinion, the financial statements present fairly, in all material respects, the financial position of each of the Funds as of October 31, 2023, the results of their operations for the year then ended, the changes in net assets for each of the two years in the period then ended, and the financial highlights for each of the five years in the period then ended, in conformity with accounting principles generally accepted in the United States of America.
Basis for Opinion
These financial statements are the responsibility of the Funds’ management. Our responsibility is to express an opinion on the Funds’ financial statements based on our audits. We are a public accounting firm registered with the Public Company Accounting Oversight Board (United States) (“PCAOB”) and are required to be independent with respect to the Funds in accordance with the U.S. federal securities laws and the applicable rules and regulations of the Securities and Exchange Commission and the PCAOB.
We conducted our audits in accordance with the standards of the PCAOB. Those standards require that we plan and perform the audit to obtain reasonable assurance about whether the financial statements are free of material misstatement whether due to error or fraud.
Our audits included performing procedures to assess the risks of material misstatement of the financial statements, whether due to error or fraud, and performing procedures that respond to those risks. Such procedures included examining, on a test basis, evidence regarding the amounts and disclosures in the financial statements. Our procedures included confirmation of securities owned as of October 31, 2023, by correspondence with the custodian and brokers. Our audits also included evaluating the accounting principles used and significant
45
| REPORT OF INDEPENDENT REGISTERED |
| PUBLIC ACCOUNTING FIRM (Continued) |
estimates made by management, as well as evaluating the overall presentation of the financial statements. We believe that our audits provide a reasonable basis for our opinion.
We have served as the Funds’ auditor since 2006.
COHEN & COMPANY, LTD.
Cleveland, Ohio
December 22, 2023
46
| LIQUIDITY RISK MANAGEMENT PROGRAM – (Unaudited) |
Valued Advisers Trust has adopted and implemented a written liquidity risk management program as required by Rule 22e-4 (the “Liquidity Rule”) under the Investment Company Act. The program is reasonably designed to assess and manage each Fund’s liquidity risk, taking into consideration, among other factors, the Fund’s investment strategy and the liquidity of its portfolio investments during normal and reasonably foreseeable stressed conditions; its short and long-term cash flow projections; and its cash holdings and access to other funding sources. The Board of Trustees approved the appointment of a Liquidity Administrator Committee, which includes representatives from SMI Advisory Services, LLC, the Funds’ investment adviser, and Ultimus Fund Solutions, LLC, the Funds’ Administrator. The Liquidity Administrator Committee is responsible for the program’s administration and oversight and for reporting to the Board on at least an annual basis regarding the program’s operation and effectiveness. The Liquidity Administrator Committee updated its assessment of each Fund’s liquidity risk profile, considering additional data gathered during the period June 1, 2022 through May 31, 2023 (the “Review Period”) and the adequacy and effectiveness of the liquidity risk management program’s operations during the Review Period in order to prepare a written report for the Board of Trustees (the “Report”) for consideration at its meeting held on September 8, 2023. The Report noted that during the Review Period none of the Funds experienced unusual stress or disruption to its operations related to purchase and redemption activity. It further noted that during the Review Period each Fund held adequate levels of cash and highly liquid investments to meet shareholder redemption activities in accordance with applicable requirements. The Report concluded that (i) the Trust’s liquidity risk management program is reasonably designed to prevent violations of the Liquidity Rule and (ii) the Trust’s liquidity risk management program had been effectively implemented during the Review Period.
47
| SUMMARY OF FUND EXPENSES – (Unaudited) |
As a shareholder of a Fund, you incur two types of costs: (1) transaction costs and (2) ongoing costs, including management fees, distribution (12b-1) fees and other Fund expenses. These examples are intended to help you understand your ongoing costs (in dollars) of investing in each Fund and to compare these costs with the ongoing costs of investing in other funds. Each Fund’s example is based on an investment of $1,000 invested at the beginning of the period and held for the entire period from May 1, 2023 through October 31, 2023.
Actual Expenses
The first line of the table below provides information about actual account values and actual expenses. You may use the information in this line, together with the amount you invested, to estimate the expenses that you paid over the period. Simply divide your account value by $1,000 (for example, an $8,600 account value divided by $1,000 = 8.6), then multiply the result by the number in the first line under the heading “Expenses Paid During Period” to estimate the expenses you paid on your account during this period.
Hypothetical Example for Comparison Purposes
The second line of the table below provides information about hypothetical account values and hypothetical expenses based on each Fund’s actual expense ratio and an assumed rate of return of 5% per year before expenses, which is not the Fund’s actual return. The hypothetical account values and expenses may not be used to estimate the actual ending account balance or expenses you paid for the period. You may use this information to compare the ongoing costs of investing in the Funds and other funds. To do so, compare this 5% hypothetical example with the 5% hypothetical examples that appear in the shareholder reports of other funds.
Expenses shown in the table are meant to highlight your ongoing costs only and do not reflect any transactional costs. Therefore, the second line of the table below is useful in comparing ongoing costs only and will not help you determine the relative total costs of owning different funds. In addition, if transaction costs were included, your costs would have been higher.
48
| SUMMARY OF FUND EXPENSES – (Unaudited), (Continued) |
| Beginning | Ending | |||||||||||||||
| Account Value | Account Value | |||||||||||||||
| May 1, | October 31, | Expenses Paid | Annualized | |||||||||||||
| 2023 | 2023 | During Period(a) | Expense Ratio | |||||||||||||
| SMI FUND | ||||||||||||||||
| Actual | $ | 1,000.00 | $ | 943.00 | $ | 5.92 | 1.21% | |||||||||
| Hypothetical(b) | $ | 1,000.00 | $ | 1,019.11 | $ | 6.16 | 1.21% | |||||||||
| SMI DYNAMIC ALLOCATION FUND | ||||||||||||||||
| Actual | $ | 1,000.00 | $ | 943.90 | $ | 6.03 | 1.23% | |||||||||
| Hypothetical(b) | $ | 1,000.00 | $ | 1,019.00 | $ | 6.27 | 1.23% | |||||||||
| SMI MULTI-STRATEGY FUND | ||||||||||||||||
| Actual | $ | 1,000.00 | $ | 952.20 | $ | 6.10 | 1.24% | |||||||||
| Hypothetical(b) | $ | 1,000.00 | $ | 1,018.96 | $ | 6.30 | 1.24% | |||||||||
| (a) | Expenses are equal to the Fund’s annualized expense ratios, multiplied by the average account value over the period, multiplied by 184/365 (to reflect the one-half year period). |
| (b) | Hypothetical assumes 5% annual return before expenses. |
49
| ADDITIONAL FEDERAL INCOME TAX INFORMATION (Unaudited) |
The Form 1099-DIV you receive in January 2024 will show the tax status of all distributions paid to your account in calendar year 2023. Shareholders are advised to consult their own tax adviser with respect to the tax consequences of their investment in the Fund. As required by the Internal Revenue Code and/or regulations, shareholders must be notified regarding the status of qualified dividend income for individuals and the dividends received deduction for corporations.
Qualified Dividend Income. The Funds designate the following percentage or up to the maximum amount of such dividends allowable pursuant to the Internal Revenue Code, as qualified dividend income eligible for the reduced tax rate.
| SMI Dynamic | SMI Multi- | |||||
| Allocation | Strategy | |||||
| SMI Fund | Fund | Fund | ||||
| Qualified Dividend Income | 16% | 0% | 100% |
Qualified Business Income. The Funds designate the following percentage of ordinary income dividends, or up to the maximum amount of such dividends allowable pursuant to the Internal Revenue Code, as qualified business income.
| SMI Dynamic | SMI Multi- | |||||
| Allocation | Strategy | |||||
| SMI Fund | Fund | Fund | ||||
| Qualified Business Income | 0% | 0% | 0% |
Dividends Received Deduction. Corporate shareholders are generally entitled to take the dividends received deduction on the portion of the Funds’ dividend distribution that qualifies under tax law. For the Funds’ calendar year 2023 ordinary income dividends, the following percentage qualifies for the corporate dividends received deduction.
| SMI Dynamic | SMI Multi- | |||||
| Allocation | Strategy | |||||
| SMI Fund | Fund | Fund | ||||
| Dividends Received Deduction | 15% | 0% | 45% |
50
| ADDITIONAL FEDERAL INCOME TAX INFORMATION (Unaudited), (Continued) |
The Funds designate the following amounts as long-term capital gains distributions. The amounts designated may not agree with long-term capital gains in the tax character of distribution table due to utilization of earnings and profits distributed to shareholders on redemption of shares.
| SMI Dynamic | SMI Multi- | |||||||||||
| Allocation | Strategy | |||||||||||
| SMI Fund | Fund | Fund | ||||||||||
| Long-Term Capital Gains Distributions | $ | — | $ | — | $ | — | ||||||
51
| TRUSTEES AND OFFICERS (Unaudited) |
The Board of Trustees supervises the business activities of the Trust. Each Trustee serves as a trustee until termination of the Trust unless the Trustee dies, resigns, retires or is removed.
The following table provides information regarding each of the Independent Trustees.
| Name, Address*, (Age), Position with Trust**, Term of Position with Trust | Principal Occupation During Past 5 Years and Other Directorships | Other Directorships |
| Andrea N. Mullins, 56 Independent Trustee Since December 2013 Chairperson since March 2017 | Current: Private investor; Independent Contractor, SWM Advisors (since April 2014). | Trustee, Angel Oak Funds Trust (since February 2019) (7 portfolios); Trustee, Angel Oak Strategic Credit Fund (since February 2019); Trustee, Angel Oak Financial Strategies Income Term Trust (since May 2019); Trustee, Angel Oak Credit Opportunities Term Trust (since January 2021); Trustee and Audit Committee Chair, NXG NextGen Infrastructure Income Fund (since November 2021); Trustee and Audit Committee Chair, NXG Cushing Midstream Energy Fund (since November 2021). |
52
| TRUSTEES AND OFFICERS (Unaudited), (Continued) |
| Name, Address*, (Age), Position with Trust**, Term of Position with Trust | Principal Occupation During Past 5 Years and Other Directorships | Other Directorships |
| Ira P. Cohen, 64 Independent Trustee Since June 2010 | Current: Independent financial services consultant (since February 2005); Executive Vice President of Asset Management Services, Recognos Financial (since August 2015). | Trustee and Audit Committee Chairman, Apollo Diversified Real Estate Fund (since March 2022); Trustee, Chairman and Nominating and Governance Committee Chairman, Angel Oak Funds Trust (since October 2014) (7 portfolios); Trustee, Chairman, and Nominating and Governance Committee Chairman, Angel Oak Strategic Credit Fund (since December 2017); Trustee, Chairman, and Nominating and Governance Committee Chairman, Angel Oak Financial Strategies Income Term Trust (since May 2019); Trustee, Chairman, and Nominating and Governance Committee Chairman, Angel Oak Credit Opportunities Term Trust (since January 2021); Trustee and Nominating and Governance Committee Chairman, U.S. Fixed Income Trust (since March 2019). |
| * | The address for each Trustee is 225 Pictoria Drive, Suite 450, Cincinnati, Ohio 45246. |
| ** | As of the date of this report, the Trust consists of 15 series. |
The following table provides information regarding the Trustee who is considered an “interested person” of the Trust, as that term is defined under the 1940 Act.
| Name, Address*, (Age), Position with Trust**, Term of Position with Trust | Principal Occupation During Past 5 Years and Other Directorships | Other Directorships |
| Mark J. Seger***, 61 Trustee Since March 2017 | Current: Vice Chairman and Co-Founder, Ultimus Fund Solutions, LLC and its subsidiaries (since 1999). | None. |
| * | The address for each Trustee is 225 Pictoria Drive, Suite 450, Cincinnati, Ohio 45246. |
| ** | As of the date of this report, the Trust consists of 16 series. |
| *** | Mr. Seger is considered an “interested person” of the Trust because of his relationship with the Trust’s administrator, transfer agent, and distributor. |
53
| TRUSTEES AND OFFICERS (Unaudited), (Continued) |
The following table provides information regarding the Officers of the Trust:
| Name, Address*, (Age), Position with Trust**, Term of Position with Trust | Principal Occupation During Past 5 Years | Other Directorships |
Matthew J. Miller, 47
Vice President | Current: Vice President, Relationship Management, Ultimus Fund Solutions, LLC (since December 2015). | None. |
| N. Lynn Bowley, 65 Chief Compliance Officer Since April 2022 | Current: Senior Vice President, Senior Compliance Officer, Northern Lights Compliance Services, LLC (since January 2007). | None. |
Carol J. Highsmith, 59
Secretary | Current: Vice President, Ultimus Fund Solutions, LLC (since December 2015). | None. |
| Zachary P. Richmond, 43 Principal Financial Officer and Treasurer Since September 2021 | Current: Vice President, Financial Administration, Ultimus Fund Solutions, LLC (since February 2019).
Previous: Assistant Vice President, Associate Director of Financial Administration, Ultimus Fund Solutions, LLC (December 2015 to February 2019). | None. |
| Jared D. Lahman, 37 AML Officer Since March 2023 | Current: Senior Compliance Analyst, Northern Lights Compliance Services, LLC (since January 2019).
Previous: Manager of Fund Accounting, Gemini Fund Services (September 2016 to December 2018) | None. |
| * | The address for each Officer is 225 Pictoria Drive, Suite 450, Cincinnati, Ohio 45246. |
| ** | As of the date of this report, the Trust consists of 15 series. |
54
| OTHER INFORMATION – (Unaudited) |
The Funds’ Statement of Additional Information (“SAI”) includes additional information about the trustees and is available without charge, upon request. You may call toll-free at (855) 280-9648 to request a copy of the SAI or to make shareholder inquiries.
55
| FACTS | WHAT DO THE SMI FUNDS DO WITH YOUR PERSONAL INFORMATION? |
| Why? | Financial companies choose how they share your personal information. Federal law gives consumers the right to limit some but not all sharing. Federal law also requires us to tell you how we collect, share, and protect your personal information. Please read this notice carefully to understand what we do. |
| What? | The types of personal information we collect and share depend on the product or service you have with us. This information can include:
● Social Security number
● account balances and account transactions
● transaction or loss history and purchase history
● checking account information and wire transfer instructions |
| When you are no longer our customer, we continue to share your information as described in this notice. | |
| How? | All financial companies need to share customers’ personal information to run their everyday business. In the section below, we list the reasons financial companies can share their customers’ personal information; the reasons SMI Funds choose to share; and whether you can limit this sharing. |
| Reasons we can share your personal information | Do SMI Funds share? |
For our everyday business purposes— such as to process your transactions, maintain your account(s), respond to court orders and legal investigations, or report to credit bureaus | Yes |
For our marketing purposes— to offer our products and services to you | No |
| For joint marketing with other financial companies | No |
For our affiliates’ everyday business purposes— information about your transactions and experiences | No |
For our affiliates’ everyday business purposes— information about your creditworthiness | No |
| For nonaffiliates to market to you | No |
| Questions? | Call (877) 764-3863 |
56
| Who we are | |
| Who is providing this notice? | SMI Funds Ultimus Fund Distributors, LLC (Distributor) Ultimus Fund Solutions, LLC (Administrator) |
| What we do | |
| How do SMI Funds protect my personal information? | To protect your personal information from unauthorized access and use, we use security measures that comply with federal law. These measures include computer safeguards and secured files and buildings. Our service providers are held accountable for adhering to strict policies and procedures to prevent any misuse of your nonpublic personal information. |
| How do SMI Funds collect my personal information? | We collect your personal information, for example, when you
● open an account or deposit money
● buy securities from us or sell securities to us
● make deposits or withdrawals from your account or provide account information
● give us your account information
● make a wire transfer
● tell us who receives the money
● tell us where to send the money
● show your government-issued ID
● show your driver’s license |
| Why can’t I limit all sharing? | Federal law gives you the right to limit only
● sharing for affiliates’ everyday business purposes—information about your creditworthiness
● affiliates from using your information to market to you
● sharing for nonaffiliates to market to you
State laws and individual companies may give you additional rights to limit sharing. |
| Definitions | |
| Affiliates | Companies related by common ownership or control. They can be financial and nonfinancial companies.
● SMI Advisory Services, LLC, the investment adviser to the Fund, could be deemed to be an affiliate. |
| Nonaffiliates | Companies not related by common ownership or control. They can be financial and nonfinancial companies.
● The SMI Funds do not share your personal information with nonaffiliates so they can market to you. |
| Joint marketing | A formal agreement between nonaffiliated financial companies that together market financial products or services to you.
● The SMI Funds do not jointly market. |
57
| PROXY VOTING |
A description of the policies and procedures that each Fund uses to determine how to vote proxies relating to portfolio securities and information regarding how each Fund voted those proxies during the most recent twelve month period ended June 30, are available (1) without charge upon request by calling the Funds at (877) 764-3863 and (2) in Fund documents filed with the SEC on the SEC’s website at www.sec.gov.
| TRUSTEES |
| Andrea N. Mullins, Chairperson |
| Ira P. Cohen |
| Mark J. Seger |
| OFFICERS |
| Matthew J. Miller, Principal Executive Officer and President |
| Zachary P. Richmond, Principal Financial Officer and Treasurer |
| N. Lynn Bowley, Chief Compliance Officer |
| Carol J. Highsmith, Vice President and Secretary |
| INVESTMENT ADVISER |
| SMI Advisory Services, LLC |
| 4400 Ray Boll Blvd. |
| Columbus, IN 47203 |
| DISTRIBUTOR |
| Ultimus Fund Distributors, LLC |
| 225 Pictoria Drive, Suite 450 |
| Cincinnati, OH 45246 |
| INDEPENDENT REGISTERED PUBLIC ACCOUNTING FIRM |
| Cohen & Company, Ltd. |
| 1350 Euclid Avenue, Suite 800 |
| Cleveland, OH 44115 |
| LEGAL COUNSEL |
| Troutman Pepper Hamilton Sanders LLP |
| 3000 Two Logan Square |
| 18th and Arch Streets |
| Philadelphia, PA 19103 |
| CUSTODIAN |
| Huntington National Bank |
| 41 South High Street |
| Columbus, OH 43215 |
| ADMINISTRATOR, TRANSFER AGENT AND FUND ACCOUNTANT |
| Ultimus Fund Solutions, LLC |
| 225 Pictoria Drive, Suite 450 |
| Cincinnati, OH 45246 |
This report is intended only for the information of shareholders or those who have received the Funds’ prospectus which contains information about each Fund’s management fee and expenses. Please read the prospectus carefully before investing.
Distributed by Ultimus Fund Distributors, LLC, Member FINRA/SIPC
58
THIS PAGE INTENTIONALLY LEFT BLANK
THIS PAGE INTENTIONALLY LEFT BLANK
THIS PAGE INTENTIONALLY LEFT BLANK
 | |
| SOUND MIND | |
| INVESTING FUND | |
| (SMIFX) | |
| SMI DYNAMIC | |
| ALLOCATION FUND | |
| (SMIDX) | |
| SMI MULTI-STRATEGY | |
| FUND | |
| (SMILX) | |
| ANNUAL REPORT | |
| October, 2023 | |
| Funds’ Adviser: | |
| SMI Advisory Services, LLC | |
| 4400 Ray Boll Blvd. | |
| Columbus, IN 47203 | |
| (877) 764-3863 | |
| (877) SMI-FUND | |
| www.smifund.com | |
| SMI-AR-23 |
(b) Not applicable
Item 2. Code of Ethics.
As of the end of the period covered by this report, the registrant has adopted a code of ethics that applies to the registrant's principal executive officer, principal financial officer, principal accounting officer or controller, or persons performing similar functions, regardless of whether these individuals are employed by the registrant or a third party. Pursuant to Item 13(a)(1), a copy of registrant’s code of ethics is filed as an exhibit to this Form N-CSR. During the period covered by this report, the code of ethics has not been amended, and the registrant has not granted any waivers, including implicit waivers, from the provisions of the code of ethics.
Item 3. Audit Committee Financial Expert.
(a)(1) The registrant’s Board of Trustees has determined that the registrant has at least one audit committee financial expert serving on its audit committee.
(a)(2) The audit committee financial expert is Andrea N. Mullins, who is “independent” for purposes of this Item 3 of Form N-CSR.
Item 4. Principal Accountant Fees and Services.
| (a) | Audit Fees |
Sound Mind Investing Funds: FY 2023 $45,000
FY 2022 $45,000
Kovitz Core Equity ETF: FY 2023 $14,500
FY 2022 $14,500
Foundry Partners Small Cap
Value Fund: FY 2023 $15,000
FY 2022 $15,000
Dana Funds: FY 2023 $45,000
FY 2022 $45,000
| (b) | Audit-Related Fees |
Sound Mind Investing Funds: FY 2023 $0
FY 2022 $0
Kovitz Core Equity ETF: FY 2023 $0
FY 2022 $0
Foundry Partners Small Cap
Value Fund: FY 2023 $0
FY 2022 $0
Dana Funds: FY 2023 $0
FY 2022 $0
| (c) | Tax Fees |
Sound Mind Investing Funds: FY 2023 $9,000
FY 2022 $9,000
Kovitz Core Equity ETF: FY 2023 $3,000
FY 2022 $3,000
Foundry Partners Small Cap
Value Fund: FY 2023 $3,000
FY 2022 $3,000
Dana Funds: FY 2023 $9,000
FY 2022 $9,000
Nature of the fees: Preparation of the 1120 RIC and Excise review
| (d) | All Other Fees |
Sound Mind Investing Funds: FY 2023 $0
FY 2022 $0
Kovitz Core Equity ETF: FY 2023 $0
FY 2022 $0
Foundry Partners Small Cap
Value Fund: FY 2023 $0
FY 2022 $0
Dana Funds: FY 2023 $0
FY 2022 $0
| (e) | (1) Audit Committee’s Pre-Approval Policies |
The Audit Committee Charter requires the Audit Committee to be responsible for the selection, retention or termination of auditors and, in connection therewith, to (i) evaluate the proposed fees and other compensation, if any, to be paid to the auditors, (ii) evaluate the independence of the auditors, (iii) pre-approve all audit services and, when appropriate, any non-audit services provided by the independent auditors to the Trust, (iv) pre-approve, when appropriate, any non-audit services provided by the independent auditors to the Trust's investment adviser, or any entity controlling, controlled by, or under common control with the investment adviser and that provides ongoing services to the Trust if the engagement relates directly to the operations and financial reporting of the Trust, and (v) receive the auditors’ specific representations as to their independence;
| (2) | None of the services described in paragraph (b) through (d) of this Item were approved by the audit committee pursuant to paragraph (c)(7)(i)(C) of Rule 2-01 of Regulation S-X. |
(f) During audit of registrant's financial statements for the most recent fiscal year, less than 50 percent of the hours expended on the principal accountant's engagement were attributed to work performed by persons other than the principal accountant's full-time, permanent employees.
(g) The aggregate non-audit fees billed by the registrant's accountant for services rendered to the registrant, and rendered to the registrant's investment adviser (not including any sub-adviser whose role is primarily portfolio management and is subcontracted with or overseen by another investment adviser), and any entity controlling, controlled by, or under common control with the adviser that provides ongoing services to the registrant:
Registrant Adviser
FY 2023 $27,000 $ 0
FY 2022 $27,000 $ 0
(h) Not applicable. The auditor performed no services for the registrant’s investment adviser or any entity controlling, controlled by, or under common control with the investment adviser that provides ongoing services to the registrant.
(i) Not applicable.
(j) Not applicable.
Item 5. Audit Committee of Listed Companies. Not applicable – applies to listed companies only
Item 6. Schedule of Investments. Schedules filed with Item 1.
Item 7. Disclosure of Proxy Voting Policies and Procedures for Closed-End Management Investment Companies. Not applicable – applies to closed-end funds only
Item 8. Portfolio Managers of Closed-End Investment Companies. Not applicable – applies to closed-end funds only
Item 9. Purchases of Equity Securities by Closed-End Management Investment Company and Affiliated Purchasers. Not applicable – applies to closed-end funds only
Item 10. Submission of Matters to a Vote of Security Holders.
The guidelines applicable to shareholders desiring to submit recommendations for nominees to the Registrant's board of trustees are contained in the statement of additional information of the Trust with respect to the Fund(s) for which this Form N-CSR is being filed.
Item 11. Controls and Procedures.
(a) Based on their evaluation of the registrant’s disclosure controls and procedures (as defined in Rule 30a-3(c) under the Investment Company Act of 1940, as amended (the “Act”)) as of a date within 90 days of the filing date of this report, the registrant’s principal executive officer and principal financial officer have concluded that such disclosure controls and procedures are reasonably designed and are operating effectively to ensure that material information relating to the registrant is made known to them by others within those entities, particularly during the period in which this report is being prepared, and that the information required in filings on Form N-CSR is recorded, processed, summarized, and reported on a timely basis.
(b) There were no changes in the registrant’s internal control over financial reporting (as defined in Rule 30a-3(d) under the Investment Company Act of 1940) that occurred during the period covered by this report that have materially affected, or are reasonably likely to materially affect, the registrant’s internal control over financial reporting.
Item 12. Disclosure of Securities Lending Activities for Closed-End Management Investment Companies. Not applicable – applies to closed-end funds only
Item 13. Exhibits.
(a) (1) Code is filed herewith.
(3) Not Applicable
| (b) | Certification pursuant to 18 U.S.C. Section 1350, as adopted pursuant to Section 906 of the Sarbanes-Oxley Act of 2002 is filed herewith. |
Pursuant to the requirements of the Securities Exchange Act of 1934 and the Investment Company Act of 1940, the registrant has duly caused this report to be signed on its behalf by the undersigned, thereunto duly authorized.
(Registrant) Valued Advisers Trust
By /s/ Matthew J. Miller
Matthew J. Miller, President and Principal Executive Officer
Date 1/5/2024
Pursuant to the requirements of the Securities Exchange Act of 1934 and the Investment Company Act of 1940, this report has been signed below by the following persons on behalf of the registrant and in the capacities and on the dates indicated.
By /s/ Matthew J. Miller
Matthew J. Miller, President and Principal Executive Officer
Date 1/5/2024
By /s/ Zachary P. Richmond
Zachary P. Richmond, Treasurer and Principal Financial Officer
Date 1/5/2024