united states
securities and exchange commission
washington, d.c. 20549
form n-csr
certified shareholder report of registered management
investment companies
Investment Company Act file number 811-22208
Valued Advisers Trust
(Exact name of registrant as specified in charter)
Ultimus Fund Solutions, LLC 225 Pictoria Drive, Suite 450 Cincinnati, OH 45246
(Address of principal executive offices) (Zip code)
Ultimus Fund Solutions, LLC
Attn: Zachary Richmond
225 Pictoria Drive, Suite 450
Cincinnati, OH 45246
(Name and address of agent for service)
Registrant's telephone number, including area code: 513-587-3400
Date of fiscal year end: 10/31
Date of reporting period: 10/31/2022
Item 1. Reports to Stockholders.
(a)

DANA LARGE CAP EQUITY FUND
DANA EPIPHANY ESG SMALL CAP EQUITY FUND
DANA EPIPHANY ESG EQUITY FUND
Annual Report
October 31, 2022
Dana Investment Advisors, Inc.
20700 Swenson Drive, Suite 400
Waukesha, WI 53186
(855) 280-9648
www.danafunds.com
Management Discussion of Fund Performance (Unaudited)
Dear Fellow Shareholders,
Many of us are likely looking forward to putting the prior twelve months behind us, but we should take pause to remember that markets are not always positive and that the trailing two years have still been profitable for many. We have a glass half full perspective and believe bear markets create new opportunities for growth and value creation, and feel well positioned to capitalize. Looking back at the past couple of years, it’s clear that ‘free money’ often leads to irrational pricing and eventually market instability. High inflation has forced the hand of the Federal Reserve (the “Fed”) and, combined with tighter monetary policy, has put pressure on asset prices. Dealing correctly with these challenges may determine how investments perform in the next bull market. We have confidence that Dana’s investment strategy, which relies on fundamental analysis and valuation discipline, should serve us well in an environment where excess risk taking is no longer in vogue. We remain thankful for your continued trust and support of the Dana Funds. We are happy to share this discussion and analysis of the prior twelve months in the financial markets and the Dana Funds performance.
Economic and Market Recap
For virtually all of 2022, inflation, interest rates, and the Fed have dominated market psychology. Markets moved decidedly negative and exhibited wild swings in sentiment through the year, with leadership shifting frequently between value and growth, large and small companies, commodity sensitivity, and a host of other factors. November marked the start of Fed downshifting -- looking toward the conclusion of rate increases. The market has begun to rally off the October low, with the S&P 500 Index up over 10%.
All these macro tugs have led to factor tilts and violent rotations. For example, rotation out of semiconductors (which are more cyclical relative to other tech industries) and into growth software made a full round trip in 2022. Defensives and cyclicals have also played one on one. But as the Fed posture became increasingly hawkish, recession fears increased. Despite negative GDP in the first and second quarters of 2022, the economy has escaped recession thus far. Part of the explanation is strong, under-supplied labor markets with trade and inventory data also contributing. But the massive escalation in rates since June has created widespread concern about a potential economic slowdown, which is expected to manifest in 2023.
From its peak on 1/3/2022, the S&P 500 Index declined -24.5% on a total return basis through 10/12/2022 before bouncing back to end October. Fed policy and interest rate expectations were the dominant influence on the markets. Any hints of falling inflation or dovishness from the Fed drove market bounces (often led by big rebounds in growth or speculative stocks), while expressions of Fed resolve (usually from Chairman Powell) to raise rates until inflation was demonstrably moving closer to a 2% target led the markets lower.
Management Discussion of Fund Performance (Unaudited) (continued)
The challenge for the Fed has been that they are fighting inflation caused by supply constraints and exacerbated by fiscal stimulus. The only option they see is to crush demand. The Fed cannot stimulate supply with monetary policy. The market expectation is that sales and earnings will fall. As we approach the holidays, consumers are still spending, but housing has hit the brakes, and companies are draining inventory stocks and reducing discretionary spending. Big tech is even talking layoffs. Earnings estimates have declined for Q4 and have started to fall for 2023. A topping process for inflation is still not yet apparent and will continue to be a key fiscal and monetary issue in 2023.
Dana Large Cap Equity Fund (the “Large Cap Fund”) Discussion
During fiscal year 2022, the S&P 500 Index declined -14.61%, while the Large Cap Fund (Institutional Class) retreated -17.16%. Generally speaking, the Large Cap Fund performed well on a relative basis when the market was broad and favored value, but lagged during periods of recovery for growth and more speculative stocks. U.S. Equities entered the Large Cap Fund’s fiscal year with positive momentum as the S&P 500 Index extended record closing highs into the first week of November 2021. After a period of choppiness, equities finished the calendar year with a flourish. Supported by generous monetary and fiscal policies, the S&P 500 Index ended 2021 near a record high, and the Large Cap Fund was up 110% in less than two years from the March 2020 COVID-19 low.
There are many names in the portfolio that we feel have been unfairly punished; names where the fundamentals have held up and where valuation looks compelling, yet the names have significantly underperformed. One such example is Adobe (ADBE), the dominant provider of digital market software, where earnings expectations have been improving all year and yet the stock is down in excess of 50%, and the valuation is cheaper than any time in the past 10 years. Within the Large Cap Fund, there are many names that fit this general pattern—good fundamentals and discounted valuations—which have hurt relative performance, but names we are excited about going forward. Other large detractors with positive outlooks include Lam Research (LRCX), Verizon (VZ), Comcast (CMCSA), and Abbott Labs (ABT).
The worst performing sector in the S&P 500 was the Communications Sector, led by large declines in Meta Platforms (META) and Netflix (NFLX). The Large Cap Fund sold META in June, avoiding a larger loss (META subsequently declined another 40%+) while our valuation discipline kept us out of Netflix (NFLX). Netflix had been a performance drag for several years, but valuation finally mattered this year, as excessive speculation, manifested as extremely high valuations, came back to reality.
The best relative performance sector for the Large Cap Fund was Real Estate, where Large Cap Fund holdings netted a small positive return for the fiscal year in a sector that
Management Discussion of Fund Performance (Unaudited) (continued)
was significantly more negative than the overall market. Gaming and Leisure Properties (GLPI) and Prologis (PLD) were sector standouts with strong positive returns for the year.
The strongest sector in the market and the Large Cap Fund by far was Energy, where most stocks had very large positive returns. Energy prices have been in part driven by an unpredictable event—the Ukraine war—which is prompting countries to shift their energy reliance from Russia. The Large Cap Fund holdings were led by ConocoPhillips (COP), which gained 76%, an eye-popping return, especially in a down market. Sector neutrality, a hallmark of Dana’s risk control, ensured exposure to this sector, to the benefit of Large Cap Fund shareholders.
It was a dynamic year for both macro and company-specific news. Inflation was a major consideration in our positioning, as was the relative strength of different segments of consumers. We are seeing an increase in the importance of traditional fundamental factors (e.g., profitability, cash flow, leverage, etc.) as liquidity-driven growth slows. This shift should be favorable to Dana’s investment style and process, and we are optimistic about the opportunities we see in the Large Cap Fund holdings.
Dana Epiphany ESG Small Cap Equity Fund (the “Small Cap Fund”) Discussion
The Small Cap Fund returned -20.59% compared to -18.54% for the Russell 2000 Index and -11.44% for the benchmark Morningstar US Small Core Index during the fiscal year 2022. The Small Cap Fund’s strategy of sector neutral allocation to the Russell 2000 Index posed a headwind during the fiscal year as an overweight to the Heath Care and Technology sectors and underweight to Industrials and Real Estate sectors negatively impacted relative performance. The beginning of the fiscal year marked a definitive transition from the post-COVID bull market into a bear market correction. Just days into November 2021, the Russell 2000 Index hit a brief peak after months of range-bound action. Behind the wheel of the bear market bus were Jerome Powell and the Fed, who had been previously concerned that the Omicron COVID strain could create economic havoc and that any visible inflation pressure was “transitory.”
As we later learned, the Omicron wave was less lethal than feared, and economic activity remained robust with most post-2020 trends continuing – work from home, high consumer spending, the re-opening of industries like travel, a red hot home buying market, and investment in cloud computing services. On the other side of demand were persistent supply chain issues and a Chinese manufacturing base that could not figure out how to re-open.
With strong demand and limited supply, inflationary pressure was more than transitory, but the Fed had been stuck in 5th gear for too long, and now the bus was gaining too much speed. When inflation data surprised to the upside, it spooked the Fed into a series of 75
Management Discussion of Fund Performance (Unaudited) (continued)
basis point hikes (an unusual move for the Fed after the dot-com bust). As this new normal of higher rates began to set in, excess speculation began to dissipate, and a renewed focus on valuation and fundamentals took precedence.
We have longed to get out of this era of bureaucratic monetary policy driving the market, and back to where corporate margins and earnings matter more, which finally seems to be happening. The macro is very relevant to small cap stocks in several ways. First, small caps are more sensitive to upward and downward changes in economic growth. Second, this sensitivity means more beta and volatility, and investors typically react by reducing exposure. Third, small caps usually bottom in downturns ahead of large caps, and then are poised to rebound faster when the worst fears are priced in. Considerations for less currency exposure and lower international sales can be pluses in this environment. Small cap companies have tended to be more nimble in these conditions than huge mega corporations, and this cycle could magnify the extent of this.
Drilling into performance, only two index sectors were positive in the fiscal year: Utilities and Energy. Communication, Technology and Health Care led the decliners. Growth companies in Health Care and Info Tech explain much of the damage, as higher interest rates discount future cash flows to a greater degree.
The portfolio had some tremendous winners amidst the chaos. Ovintiv (OVV) and Cactus (WHD) rode higher as gas and crude prices rallied. e.l.f. Beauty (ELF) had a strong run on positive fundamentals, and uptake and sell-through of their cosmetics products gained market share. Shockwave Medical (SWAV) sold off in Q1 giving us a nice entry, and sales of their medical devices remained robust through the year. SailPoint Technologies (SAIL) was taken private by a firm building a portfolio of bolt-on security software features. Cytokinetics (CYTK) is a biotech firm with a drug nearing commercial status in the cardiac space; it rose, bucking the trend of peers that saw their valuations plummet.
Quality growth companies fared less well as valuations compressed. Some portfolio holdings had execution missteps and were punished. Rapid7 (RPD) showed slowing sales trends and concern about spending increased. Veritone (VERI) has artificial intelligence software and a lot of exposure to Amazon staffing trends, and May news from the consumer giant scared investors despite a low valuation relative to peers. Omnicell (OMCL) sells software and equipment into health care facilities, and first had supply chain challenges and then end-market challenges, including reduced budgets and understaffing.
Tension between growth and value stocks will persist. Companies with extreme valuations have been punished. However, companies with strong growth trends, clean balance sheets, and growing profitability will continue to attract flows. Many quality growth companies will grow through this downturn, and their scarcity will be valuable. As for value stocks, lower priced companies have seen brief periods of interest, but there is reason to believe the
Management Discussion of Fund Performance (Unaudited) (continued)
market will focus more on predictable cash flow and dividends as the Fed sucks liquidity out of the economy. The distinction between companies that are relatively cheap, and those that are intrinsically cheap (for a reason) may grow more relevant.
This is where our process and philosophy comes into play. We believe in constructing portfolios with considerations of risk at the forefront. Our penchant for firms that manage their balance sheets and grow their EBITDA means we will continue to lean into quality factors. Our relative value bias means we are exposed to dynamic market segments while we carefully watch valuation multiples. Today the portfolio exhibits a valuation discount, a growth premium, and superior profitability. This is always our portfolio goal.
We are in this business because we love the puzzles the market creates. We get excited finding good companies at the right price, and continue to find new stories in the small cap space that warrant our attention and curiosity. As older holdings mature, we will add new positions that we think can support the long-term success of the Small Cap Fund through a relative value discipline that focuses on fundamentally driven stock selection to reward investors over the long term.
Dana Epiphany ESG Equity Fund (the “Epiphany ESG Fund”) Discussion
The Epiphany ESG Fund posted a return of -15.76% in a challenging market, trailing the benchmark S&P 500 Index return of -14.61% during the fiscal year 2022. The Epiphany ESG Fund shares an investment philosophy that is common to all the Dana Funds, but adds a faith-based values component to security selection. The market environment discussions above for the Large Cap Equity Fund (describing the large cap U.S. equity market) and the Small Cap Fund (focusing on the small cap part of the market) give the market context in which the Epiphany ESG Fund operated. The frequent shifts in market dynamics and leadership during the year (as described earlier) yielded high volatility in the relative performance of the Epiphany ESG Fund. The periods of rebounds in growth and speculative stocks were challenging for the Epiphany ESG Fund, while value-oriented and broader performance conditions were favorable to the Epiphany ESG Fund, particularly when breadth was evident in the mid-cap and small-cap segments of the market.
On a sector level, the Epiphany ESG Fund outperformed the benchmark S&P 500 Index in 7 of 11 sectors. The two weakest sectors were Financials and Health Care. Similar to the Large Cap Fund, there are names in the portfolio where the stocks appear disconnected with the fundamentals. In the Financials sector, we would highlight Hannon Armstrong (HASI), which provides financing for renewable energy. Despite higher interest rates, the company’s outlook continues to improve and is poised to be a beneficiary of the Inflation Reduction Act, yet the stock is down in excess of 50%, resulting in the lowest valuation seen in the past 10 years. While certainly a detriment to trailing performance, the setup seems quite favorable. There is a similar story in healthcare, where very high-quality
Management Discussion of Fund Performance (Unaudited) (continued)
names with solid fundamentals are trading at multi-year low valuations, including Zoetis (ZTS) and IQVIA (IQV).
As discussed previously, the weakest sector in the S&P 500 was Communications Services. For the Epiphany ESG Fund, however, this sector provided the strongest relative performance by avoiding the large declines in Meta Platforms (META) and Netflix (NFLX).
Absolute sector leadership in the market and the Epiphany ESG Fund was Energy, where most stocks had very large positive returns. The Epiphany ESG Fund holdings were led by ConocoPhillips (COP).
We believe the portfolio is well positioned going forward. Our fundamental and value-oriented approach to stock selection appears to be slowly moving into favor as the market resets away from exceptional monetary and fiscal policies.
Investment Results (Unaudited)
Average Annual Total Returns(a) as of October 31, 2022
| | | | | Since |
| | | | | Inception |
| | One Year | Five Year | Ten Year | (10/29/13) |
| Dana Large Cap Equity Fund | | | | |
| Institutional Class | (17.16)% | 7.82% | N/A | 9.51% |
| Investor Class | (17.38)% | 7.56% | 10.79% | N/A |
| S&P 500® Index(b) | (14.61)% | 10.44% | 12.79% | 11.18% |
| | | | | |
| | | Expense Ratios(c) | |
| | | Institutional | Investor | |
| | | Class | Class | |
| Gross | | 0.86% | 1.11% | |
| With Applicable Waivers | | 0.73% | 0.98% | |
The performance quoted represents past performance, which does not guarantee future results. The investment return and principal value of an investment will fluctuate so that an investor’s shares, when redeemed, may be worth more or less than their original cost. The returns shown do not reflect deduction of taxes that a shareholder would pay on Dana Large Cap Equity Fund (the “Large Cap Fund”) distributions or the redemption of Large Cap Fund shares. Current performance of the Large Cap Fund may be lower or higher than the performance quoted. Performance data current to the most recent month end may be obtained by calling (855) 280-9648.
(a) Average annual total returns reflect any change in price per share and assume the reinvestment of all distributions. The Large Cap Fund’s returns reflect any fee reductions during the applicable period. If such reductions had not occurred, the quoted performance would have been lower.
(b) The S&P 500® Index (“S&P Index”) is a widely recognized unmanaged index of equity securities and is representative of a broader domestic equity market and range of securities than is found in the Large Cap Fund’s portfolio. Individuals cannot invest directly in the S&P Index; however, an individual can invest in exchange-traded funds (“ETFs”) or other investment vehicles that attempt to track the performance of a benchmark index.
(c) The expense ratios are from the Large Cap Fund’s prospectus dated February 28, 2022. Expense ratios with applicable waivers reflect that Dana Investment Advisors, Inc. (the “Adviser”) has contractually agreed to waive or limit its fees and to assume other expenses of the Large Cap Fund until February 28, 2023, so that total annual fund operating expenses do not exceed 0.73% of the Large Cap Fund’s average daily net assets. This operating expense limitation does not apply to brokerage fees and commissions, borrowing costs (such as interest and dividend expenses on securities sold short), taxes, extraordinary expenses, fees and expenses paid under a distribution plan adopted pursuant to Rule 12b-1, fees and expenses paid under a shareholder services plan, and indirect expenses (such as “Acquired Fund Fees and Expenses”). Each waiver or reimbursement of an expense by the Adviser is subject to repayment by the Large Cap Fund within three years following the date of such waiver or reimbursement, provided that the Large Cap Fund is able to make the repayment without exceeding the expense limitation in place at the time of the waiver or reimbursement and the expense limitation in place at the time of the repayment. This agreement may only be terminated by mutual consent of the Adviser and the Board of Trustees. Additional information pertaining to the Large Cap Fund’s expense ratios as of October 31, 2022 can be found
Investment Results (Unaudited) (continued)
in the financial highlights.
The Large Cap Fund’s investment objectives, strategies, risks, charges and expenses must be considered carefully before investing. The prospectus contains this and other important information about the Large Cap Fund and may be obtained by calling the same number as above. Please read it carefully before investing.
The Large Cap Fund is distributed by Ultimus Fund Distributors, LLC, Member FINRA/SIPC.
Investment Results (Unaudited) (continued)
Average Annual Total Returns(a) as of October 31, 2022
| | | | Since |
| | | | Inception |
| | One Year | Five Year | (11/3/15) |
| Dana Epiphany ESG Small Cap Equity Fund | | | |
| Institutional Class | (20.59)% | 3.85% | 4.76% |
| Morningstar US Small Core Index(b) | (11.44)% | 5.40% | 7.36% |
| Russell 2000® Index(c) | (18.54)% | 5.56% | 7.89% |
| | | | |
| | | Expense Ratios(d) | |
| | | Institutional | |
| | | Class | |
| Gross | | 2.05% | |
| With Applicable Waivers | | 0.95% | |
The performance quoted represents past performance, which does not guarantee future results. The investment return and principal value of an investment will fluctuate so that an investor’s shares, when redeemed, may be worth more or less than their original cost. The returns shown do not reflect deduction of taxes that a shareholder would pay on Dana Epiphany ESG Small Cap Equity Fund (the “Small Cap Fund”) distributions or the redemption of Small Cap Fund shares. Current performance of the Small Cap Fund may be lower or higher than the performance quoted. Performance data current to the most recent month end may be obtained by calling (855) 280-9648.
(a) Average annual total returns reflect any change in price per share and assume the reinvestment of all distributions. The Small Cap Fund’s returns reflect any fee reductions during the applicable period. If such reductions had not occurred, the quoted performance would have been lower.
(b) The Morningstar US Small Core Index (“Morningstar Index”) provides a comprehensive depiction of the performance and fundamental characteristics of the Small Core segment of U.S. equity markets. The Morningstar Index does not incorporate Environmental, Social, or Governance (ESG) criteria. Individuals can not invest directly in the Morningstar Index; however, an individual can invest in ETFs or other investment vehicles that attempt to track the performance of a benchmark index.
(c) The Russell 2000® Index (“Russell Index”) is a widely recognized unmanaged index of equity securities and is representative of a broader domestic equity market and range of securities than are found in the Small Cap Fund’s portfolio. Individuals can not invest directly in the Russell Index; however, an individual can invest in ETFs or other investment vehicles that attempt to track the performance of a benchmark index.
The Small Cap Fund is not sponsored, endorsed, sold or promoted by Morningstar, Inc. or any of its affiliates (all such entities, collectively, “Morningstar Entities”). The Morningstar Entities make no representation or warranty, express or implied, to individuals who invest in the Small Cap Fund or any member of the public regarding the advisability of investing in equity securities generally or in the Funds in particular or the ability of the Small Cap Fund to track the Morningstar Indices or general equity market performance. THE MORNINGSTAR ENTITIES DO NOT GUARANTEE THE ACCURACY AND/OR THE COMPLETENESS OF THE MORNINGSTAR US SMALL CORE INDEX OR ANY DATA INCLUDED THEREIN AND MORNINGSTAR ENTITIES SHALL HAVE NO LIABILITY FOR ANY ERRORS, OMISSIONS, OR INTERRUPTIONS THEREIN.
Investment Results (Unaudited) (continued)
(d) The expense ratios are from the Small Cap Fund’s prospectus dated February 28, 2022. Expense ratios with applicable waivers reflect that the Adviser has contractually agreed to waive or limit its fees and to assume other expenses of the Small Cap Fund until February 28, 2023, so that total annual fund operating expenses do not exceed 0.95% of the Small Cap Fund’s average daily net assets. This operating expense limitation does not apply to brokerage fees and commissions, borrowing costs (such as interest and dividend expenses on securities sold short), taxes, extraordinary expenses, fees and expenses paid under a distribution plan adopted pursuant to Rule 12b-1, fees and expenses paid under a shareholder services plan, and indirect expenses (such as “Acquired Fund Fees and Expenses”). Each waiver or reimbursement of an expense by the Adviser is subject to repayment by the Small Cap Fund within three years following the date of such waiver or reimbursement, provided that the Small Cap Fund is able to make the repayment without exceeding the expense limitation in place at the time of the waiver or reimbursement and the expense limitation in place at the time of the repayment. This agreement may only be terminated by mutual consent of the Adviser and the Board of Trustees. Additional information pertaining to the Small Cap Fund’s expense ratios as of October 31, 2022 can be found in the financial highlights.
The Small Cap Fund’s investment objectives, strategies, risks, charges and expenses must be considered carefully before investing. The prospectus contains this and other important information about the Small Cap Fund and may be obtained by calling the same number as above. Please read it carefully before investing.
The Small Cap Fund is distributed by Ultimus Fund Distributors, LLC, Member FINRA/SIPC.
Investment Results (Unaudited) (continued)
Average Annual Total Returns(a) as of October 31, 2022
| | One Year | Five Year | Ten Year |
| Dana Epiphany ESG Equity Fund | | | |
| Institutional Class | (15.76)% | 7.97% | 9.56% |
| S&P 500® Index(b) | (14.61)% | 10.44% | 12.79% |
| | | | |
| | | Expense Ratios(c) | |
| Gross | | 1.12% | |
| With Applicable Waivers | | 0.85% | |
The performance quoted represents past performance, which does not guarantee future results. The investment return and principal value of an investment will fluctuate so that an investor’s shares, when redeemed, may be worth more or less than their original cost. The returns shown do not reflect deduction of taxes that a shareholder would pay on Dana Epiphany ESG Equity Fund (the “Epiphany ESG Fund”) distributions or the redemption of Epiphany ESG Fund shares. Current performance of the Epiphany ESG Fund may be lower or higher than the performance quoted. Performance data current to the most recent month end may be obtained by calling (855) 280-9648.
(a) Average annual total returns reflect any change in price per share and assume the reinvestment of all distributions. The Epiphany ESG Fund’s returns reflect any fee reductions during the applicable period. If such reductions had not occurred, the quoted performance would have been lower.
(b) The S&P 500® Index (“S&P Index”) is a widely recognized unmanaged index of equity securities and is representative of a broader domestic equity market and range of securities than is found in the Epiphany ESG Fund’s portfolio. Individuals cannot invest directly in the S&P Index; however, an individual can invest in ETFs or other investment vehicles that attempt to track the performance of a benchmark index.
(c) The expense ratios are from the Epiphany ESG Fund’s prospectus dated February 28, 2022. Expense ratios with applicable waivers reflect that the Adviser has contractually agreed to waive or limit its fees and to assume other expenses of the Epiphany ESG Fund until February 28, 2023, so that total annual fund operating expenses do not exceed 0.85% of the Epiphany ESG Fund’s average net assets. This operating expense limitation does not apply to brokerage fees and commissions, borrowing costs (such as interest and dividend expenses on securities sold short), taxes, extraordinary expenses, fees and expenses paid under a distribution plan adopted pursuant to Rule 12b-1, fees and expenses paid under a shareholder services plan, and indirect expenses (such as “Acquired Fund Fees and Expenses”). Each waiver or reimbursement of an expense by the Adviser is subject to repayment by the Epiphany ESG Fund within three years following the date of such waiver or reimbursement, provided that the Epiphany ESG Fund is able to make the repayment without exceeding the expense limitation in place at the time of the waiver or reimbursement and the expense limitation in place at the time of the repayment. This agreement may only be terminated by mutual consent of the Adviser and the Board of Trustees. Additional information pertaining to the Epiphany ESG Fund’s expense ratios as of October 31, 2022 can be found in the financial highlights.
The Epiphany ESG Fund’s investment objectives, strategies, risks, charges and expenses must be considered carefully before investing. The prospectus contains this and other important information about the Epiphany ESG Fund and may be obtained by calling the same number as above. Please read it carefully before investing.
The Epiphany ESG Fund is distributed by Ultimus Fund Distributors, LLC, Member FINRA/SIPC.
Investment Results (Unaudited) (continued)
Comparison of the Growth of a $10,000 Investment in the Dana Large Cap Equity Fund, Investor Class and the S&P 500® Index (Unaudited)
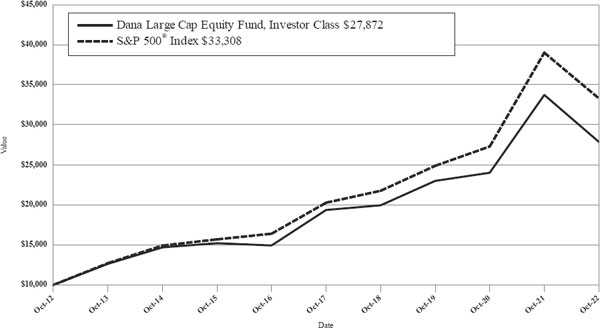
The chart above assumes an initial investment of $10,000 made on October 31, 2012 held through October 31, 2022. THE LARGE CAP FUND’S RETURN REPRESENTS PAST PERFORMANCE AND DOES NOT GUARANTEE FUTURE RESULTS. The returns shown do not reflect deduction of taxes that a shareholder would pay on Large Cap Fund distributions or the redemption of Large Cap Fund shares. Investment returns and principal values will fluctuate so that your shares, when redeemed, may be worth more or less than their original purchase price.
Current performance may be lower or higher than the performance data quoted. For more information on the Large Cap Fund, and to obtain performance data current to the most recent month end or to request a prospectus, please call (855) 280-9648. You should carefully consider the investment objectives, potential risks, management fees, and charges and expenses of the Large Cap Fund before investing. The Large Cap Fund’s prospectus contains this and other information about the Large Cap Fund, and should be read carefully before investing.
The Large Cap Fund is distributed by Ultimus Fund Distributors, LLC, member FINRA/SIPC.
Investment Results (Unaudited) (continued)
Comparison of the Growth of a $10,000 Investment in the Dana Epiphany ESG Small Cap Equity Fund, Institutional Class, Morningstar US Small Core Index and the Russell 2000® Index (Unaudited)
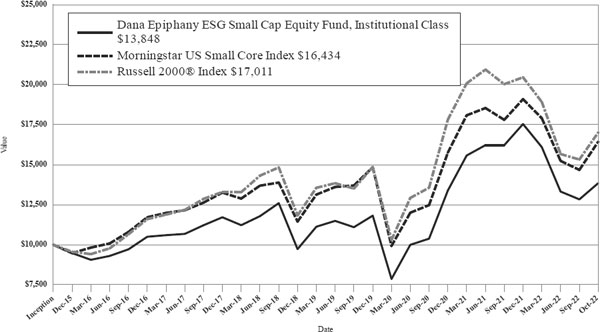
The chart above assumes an initial investment of $10,000 made on November 3, 2015 (commencement of Institutional Class operations) held through October 31, 2022. THE SMALL CAP FUND’S RETURN REPRESENTS PAST PERFORMANCE AND DOES NOT GUARANTEE FUTURE RESULTS. The returns shown do not reflect deduction of taxes that a shareholder would pay on Small Cap Fund distributions or the redemption of Small Cap Fund shares. Investment returns and principal values will fluctuate so that your shares, when redeemed, may be worth more or less than their original purchase price.
Current performance may be lower or higher than the performance data quoted. For more information on the Small Cap Fund, and to obtain performance data current to the most recent month end or to request a prospectus, please call (855) 280-9648. You should carefully consider the investment objectives, potential risks, management fees, and charges and expenses of the Small Cap Fund before investing. The Small Cap Fund’s prospectus contains this and other information about the Small Cap Fund, and should be read carefully before investing.
The Small Cap Fund is distributed by Ultimus Fund Distributors, LLC, member FINRA/SIPC.
Investment Results (Unaudited) (continued)
Comparison of the Growth of a $10,000 Investment in the Dana Epiphany ESG Equity Fund, Institutional Class and the S&P 500® Index (Unaudited)
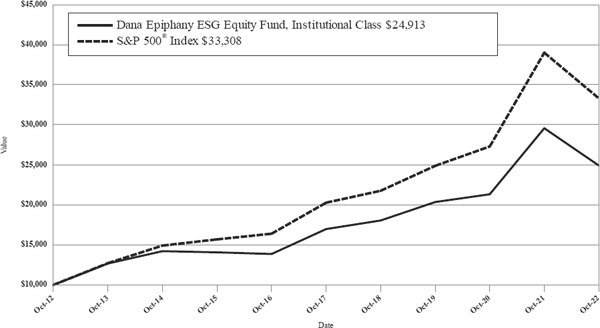
The chart above assumes an initial investment of $10,000 made on October 31, 2012 held through October 31, 2022. THE EPIPHANY ESG FUND’S RETURN REPRESENTS PAST PERFORMANCE AND DOES NOT GUARANTEE FUTURE RESULTS. The returns shown do not reflect deduction of taxes that a shareholder would pay on Epiphany ESG Fund distributions or the redemption of Epiphany ESG Fund shares. Investment returns and principal values will fluctuate so that your shares, when redeemed, may be worth more or less than their original purchase price.
Current performance may be lower or higher than the performance data quoted. For more information on the Epiphany ESG Fund, and to obtain performance data current to the most recent month end or to request a prospectus, please call (855) 280-9648. You should carefully consider the investment objectives, potential risks, management fees, and charges and expenses of the Epiphany ESG Fund before investing. The Epiphany ESG Fund’s prospectus contains this and other information about the Epiphany ESG Fund, and should be read carefully before investing.
The Epiphany ESG Fund is distributed by Ultimus Fund Distributors, LLC, member FINRA/SIPC.
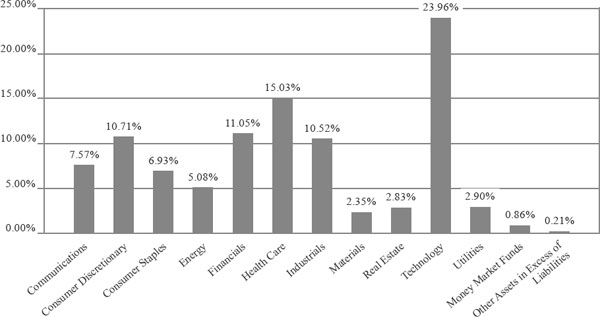
Fund Holdings (Unaudited)
The following chart gives a visual breakdown of the Large Cap Fund by sector weighting as a percentage of net assets as of October 31, 2022.
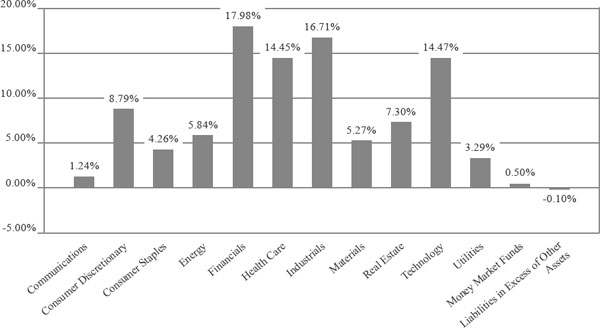
The following chart gives a visual breakdown of the Small Cap Fund by sector weighting as a percentage of net assets as of October 31, 2022.
Fund Holdings (Unaudited)
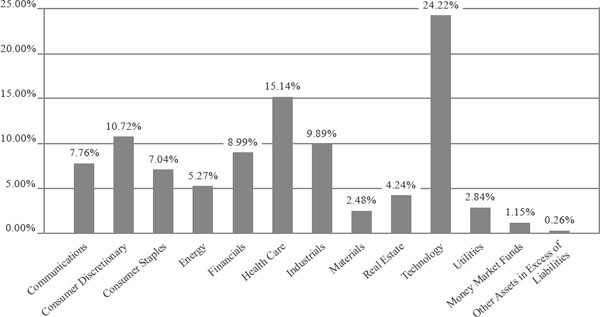
The following chart gives a visual breakdown of the Epiphany ESG Fund by sector weighting as a percentage of net assets as of October 31, 2022.
Availability of Portfolio Schedules (Unaudited)
The Large Cap Fund, the Small Cap Fund and the Epiphany ESG Fund (each a “Fund” and collectively the “Funds”) file their complete schedules of portfolio holdings with the Securities and Exchange Commission (“SEC”) for the first and third quarters of each fiscal year as an exhibit to its reports on Form N-PORT. The Funds’ Form N-PORT reports are available on the SEC’s website at http://www.sec.gov and on the Funds’ website at http://www.danafunds.com.
| Dana Large Cap Equity Fund |
| Schedule of Investments |
| October 31, 2022 |
| COMMON STOCKS — 98.93% | | Shares | | | Fair Value | |
| Communications — 7.57% | | | | | | | | |
| Alphabet, Inc., Class A(a) | | | 33,200 | | | $ | 3,137,732 | |
| AT&T, Inc. | | | 1,000 | | | | 18,230 | |
| Comcast Corp., Class A | | | 46,000 | | | | 1,460,040 | |
| Interpublic Group of Cos., Inc. | | | 60,000 | | | | 1,787,400 | |
| Verizon Communications, Inc. | | | 36,000 | | | | 1,345,320 | |
| | | | | | | | 7,748,722 | |
| Consumer Discretionary — 10.71% | | | | | | | | |
| Amazon.com, Inc.(a) | | | 28,000 | | | | 2,868,320 | |
| D.R. Horton, Inc. | | | 25,000 | | | | 1,922,000 | |
| Home Depot, Inc. (The) | | | 5,000 | | | | 1,480,650 | |
| Newell Brands, Inc. | | | 40,000 | | | | 552,400 | |
| Tapestry, Inc. | | | 51,000 | | | | 1,615,680 | |
| Ulta Beauty, Inc.(a) | | | 3,700 | | | | 1,551,669 | |
| Vail Resorts, Inc. | | | 4,400 | | | | 964,172 | |
| | | | | | | | 10,954,891 | |
| Consumer Staples — 6.93% | | | | | | | | |
| Keurig Dr Pepper, Inc. | | | 12,000 | | | | 466,080 | |
| Kimberly-Clark Corp. | | | 11,000 | | | | 1,369,060 | |
| Mondelez International, Inc., Class A | | | 33,000 | | | | 2,028,840 | |
| PepsiCo, Inc. | | | 6,500 | | | | 1,180,270 | |
| Walmart, Inc. | | | 14,400 | | | | 2,049,552 | |
| | | | | | | | 7,093,802 | |
| Energy — 5.08% | | | | | | | | |
| Cheniere Energy, Inc. | | | 1,800 | | | | 317,538 | |
| Chevron Corp. | | | 500 | | | | 90,450 | |
| ConocoPhillips | | | 13,200 | | | | 1,664,388 | |
| Exxon Mobil Corp. | | | 1,000 | | | | 110,810 | |
| Ovintiv, Inc. | | | 19,000 | | | | 962,350 | |
| Pioneer Natural Resources Co. | | | 8,000 | | | | 2,051,280 | |
| | | | | | | | 5,196,816 | |
| Financials — 11.05% | | | | | | | | |
| Allstate Corp. (The) | | | 14,000 | | | | 1,767,500 | |
| American Express Co. | | | 12,800 | | | | 1,900,160 | |
| Bank of America Corp. | | | 57,000 | | | | 2,054,280 | |
| Bank of New York Mellon Corp. (The) | | | 46,000 | | | | 1,937,060 | |
| JPMorgan Chase & Co. | | | 7,000 | | | | 881,160 | |
| Morgan Stanley | | | 23,000 | | | | 1,889,910 | |
| Wells Fargo & Co. | | | 19,000 | | | | 873,810 | |
| | | | | | | | 11,303,880 | |
| Health Care — 15.03% | | | | | | | | |
| Abbott Laboratories | | | 18,600 | | | | 1,840,284 | |
| AbbVie, Inc. | | | 15,000 | | | | 2,196,000 | |
| Bristol-Myers Squibb Co. | | | 23,000 | | | | 1,781,810 | |
| CVS Health Corp. | | | 25,000 | | | | 2,367,500 | |
| McKesson Corp. | | | 5,200 | | | | 2,024,724 | |
| Merck & Co., Inc. | | | 28,000 | | | | 2,833,600 | |
See accompanying notes which are an integral part of these financial statements.
| Dana Large Cap Equity Fund |
| Schedule of Investments (continued) |
| October 31, 2022 |
| COMMON STOCKS — 98.93% - continued | | Shares | | | Fair Value | |
| Health Care — 15.03% - continued | | | | | | | | |
| UnitedHealth Group, Inc. | | | 4,200 | | | $ | 2,331,630 | |
| | | | | | | | 15,375,548 | |
| Industrials — 10.52% | | | | | | | | |
| Boeing Co. (The)(a) | | | 200 | | | | 28,502 | |
| Deere & Co. | | | 5,000 | | | | 1,979,100 | |
| Dover Corp. | | | 12,000 | | | | 1,568,280 | |
| Norfolk Southern Corp. | | | 7,800 | | | | 1,778,946 | |
| Parker-Hannifin Corp. | | | 6,000 | | | | 1,743,720 | |
| Raytheon Technologies Corp. | | | 16,000 | | | | 1,517,120 | |
| TE Connectivity Ltd. | | | 17,600 | | | | 2,151,248 | |
| | | | | | | | 10,766,916 | |
| Materials — 2.35% | | | | | | | | |
| Albemarle Corp. | | | 1,800 | | | | 503,766 | |
| Avery Dennison Corp. | | | 6,600 | | | | 1,119,030 | |
| Packaging Corp. of America | | | 6,500 | | | | 781,365 | |
| | | | | | | | 2,404,161 | |
| Real Estate — 2.83% | | | | | | | | |
| American Tower Corp., Class A | | | 1,400 | | | | 290,066 | |
| Gaming and Leisure Properties, Inc. | | | 28,000 | | | | 1,403,360 | |
| Iron Mountain, Inc. | | | 24,000 | | | | 1,201,680 | |
| | | | | | | | 2,895,106 | |
| Technology — 23.96% | | | | | | | | |
| Accenture PLC, Class A | | | 6,600 | | | | 1,873,740 | |
| Adobe, Inc.(a) | | | 4,200 | | | | 1,337,700 | |
| Analog Devices, Inc. | | | 12,000 | | | | 1,711,440 | |
| Apple, Inc. | | | 28,000 | | | | 4,293,520 | |
| Broadcom, Inc. | | | 3,600 | | | | 1,692,432 | |
| CDW Corp. | | | 13,400 | | | | 2,315,654 | |
| Cisco Systems, Inc. | | | 28,000 | | | | 1,272,040 | |
| Fiserv, Inc.(a) | | | 17,000 | | | | 1,746,580 | |
| Lam Research Corp. | | | 3,200 | | | | 1,295,296 | |
| Microsoft Corp. | | | 15,000 | | | | 3,481,950 | |
| Visa, Inc., Class A | | | 10,800 | | | | 2,237,328 | |
| Workday, Inc., Class A(a) | | | 8,000 | | | | 1,246,560 | |
| | | | | | | | 24,504,240 | |
| Utilities — 2.90% | | | | | | | | |
| Eversource Energy | | | 18,600 | | | | 1,418,808 | |
| NextEra Energy, Inc. | | | 20,000 | | | | 1,550,000 | |
| | | | | | | | 2,968,808 | |
| Total Common Stocks (Cost $83,074,562) | | | | | | | 101,212,890 | |
| | | | | | | | | |
| MONEY MARKET FUNDS - 0.86% | | | | | | | | |
| Fidelity Investments Money Market Government Portfolio, Institutional Class, 2.91%(b) | | | 881,557 | | | | 881,557 | |
| Total Money Market Funds (Cost $881,557) | | | | | | | 881,557 | |
See accompanying notes which are an integral part of these financial statements.
| Dana Large Cap Equity Fund |
| Schedule of Investments (continued) |
| October 31, 2022 |
| Total Investments — 99.79% (Cost $83,956,119) | | $ | 102,094,447 | |
| Other Assets in Excess of Liabilities — 0.21% | | | 210,592 | |
| NET ASSETS — 100.00% | | $ | 102,305,039 | |
| (a) | Non-income producing security. |
| (b) | Rate disclosed is the seven day effective yield as of October 31, 2022. |
See accompanying notes which are an integral part of these financial statements.
| Dana Epiphany ESG Small Cap Equity Fund |
| Schedule of Investments |
| October 31, 2022 |
| COMMON STOCKS — 99.60% | | Shares | | | Fair Value | |
| Communications — 1.24% | | | | | | | | |
| TechTarget, Inc.(a) | | | 2,583 | | | $ | 166,733 | |
| Consumer Discretionary — 8.79% | | | | | | | | |
| Bloomin’ Brands, Inc. | | | 11,352 | | | | 272,562 | |
| Boot Barn Holdings, Inc.(a) | | | 3,679 | | | | 208,967 | |
| Deckers Outdoor Corp.(a) | | | 742 | | | | 259,648 | |
| Group 1 Automotive, Inc. | | | 1,334 | | | | 230,782 | |
| Malibu Boats, Inc., Class A(a) | | | 3,999 | | | | 211,547 | |
| | | | | | | | 1,183,506 | |
| Consumer Staples — 4.26% | | | | | | | | |
| e.l.f. Beauty, Inc.(a) | | | 6,196 | | | | 268,039 | |
| Simply Good Foods Co. (The)(a) | | | 7,979 | | | | 305,596 | |
| | | | | | | | 573,635 | |
| Energy — 5.84% | | | | | | | | |
| Chord Energy Corp. | | | 1,857 | | | | 284,288 | |
| EnerSys | | | 3,321 | | | | 220,149 | |
| Ovintiv, Inc. | | | 5,557 | | | | 281,462 | |
| | | | | | | | 785,899 | |
| Financials — 17.98% | | | | | | | | |
| AXIS Capital Holdings Ltd. | | | 4,798 | | | | 262,306 | |
| Evercore, Inc., Class A | | | 2,540 | | | | 266,954 | |
| Pinnacle Financial Partners, Inc. | | | 3,478 | | | | 288,639 | |
| Primerica, Inc. | | | 1,701 | | | | 246,135 | |
| SouthState Corp. | | | 2,727 | | | | 246,603 | |
| Stifel Financial Corp. | | | 4,441 | | | | 274,765 | |
| Synovus Financial Corp. | | | 6,955 | | | | 277,157 | |
| Veritex Holdings, Inc. | | | 8,457 | | | | 267,072 | |
| Wintrust Financial Corp. | | | 3,091 | | | | 289,378 | |
| | | | | | | | 2,419,009 | |
| Health Care — 14.45% | | | | | | | | |
| Aurinia Pharmaceuticals, Inc.(a) | | | 12,102 | | | | 98,389 | |
| Axsome Therapeutics, Inc.(a) | | | 3,237 | | | | 146,151 | |
| Blueprint Medicines Corp.(a) | | | 3,474 | | | | 180,092 | |
| Cytokinetics, Inc.(a) | | | 2,692 | | | | 117,533 | |
| Deciphera Pharmaceuticals, Inc.(a) | | | 5,447 | | | | 88,350 | |
| Denali Therapeutics, Inc.(a) | | | 2,901 | | | | 83,201 | |
| Ensign Group, Inc. (The) | | | 3,503 | | | | 314,499 | |
| Envista Holdings Corp.(a) | | | 7,334 | | | | 242,095 | |
| Halozyme Therapeutics, Inc.(a) | | | 2,292 | | | | 109,581 | |
| Horizon Therapeutics PLC(a) | | | 4,116 | | | | 256,509 | |
| ShockWave Medical, Inc.(a) | | | 825 | | | | 241,849 | |
| Travere Therapeutics, Inc.(a) | | | 3,077 | | | | 66,709 | |
| | | | | | | | 1,944,958 | |
| Industrials — 16.71% | | | | | | | | |
| Atkore, Inc.(a) | | | 2,555 | | | | 243,492 | |
| Cactus, Inc., Class A | | | 7,068 | | | | 365,557 | |
| Clean Harbors, Inc.(a) | | | 2,233 | | | | 273,453 | |
| FTI Consulting, Inc.(a) | | | 1,408 | | | | 219,127 | |
See accompanying notes which are an integral part of these financial statements.
| Dana Epiphany ESG Small Cap Equity Fund |
| Schedule of Investments (continued) |
| October 31, 2022 |
| COMMON STOCKS — 99.60% - continued | | Shares | | | Fair Value | |
| Industrials — 16.71% - continued | | | | | | | | |
| Hub Group, Inc., Class A(a) | | | 3,426 | | | $ | 265,858 | |
| John Bean Technologies Corp. | | | 1,950 | | | | 177,840 | |
| MasTec, Inc.(a) | | | 2,977 | | | | 229,467 | |
| Regal-Beloit Corp. | | | 1,850 | | | | 234,099 | |
| TopBuild Corp.(a) | | | 1,401 | | | | 238,366 | |
| | | | | | | | 2,247,259 | |
| Materials — 5.27% | | | | | | | | |
| Advanced Drainage Systems, Inc. | | | 1,697 | | | | 196,649 | |
| Avient Corp. | | | 4,533 | | | | 156,343 | |
| Element Solutions, Inc. | | | 9,655 | | | | 166,066 | |
| Summit Materials, Inc., Class A(a) | | | 7,241 | | | | 190,800 | |
| | | | | | | | 709,858 | |
| Real Estate — 7.30% | | | | | | | | |
| Agree Realty Corp. | | | 3,056 | | | | 209,947 | |
| Global Medical REIT, Inc. | | | 17,456 | | | | 159,548 | |
| Radius Global Infrastructure, Inc., Class A(a) | | | 12,429 | | | | 116,211 | |
| Spirit Realty Capital, Inc. | | | 6,234 | | | | 242,066 | |
| STAG Industrial, Inc. | | | 8,076 | | | | 255,121 | |
| | | | | | | | 982,893 | |
| Technology — 14.47% | | | | | | | | |
| ADTRAN Holdings, Inc. | | | 9,388 | | | | 210,854 | |
| Axcelis Technologies, Inc.(a) | | | 4,117 | | | | 238,786 | |
| Box, Inc., Class A(a) | | | 8,348 | | | | 242,509 | |
| i3 Verticals, Inc., Class A(a) | | | 9,252 | | | | 201,324 | |
| Omnicell, Inc.(a) | | | 3,433 | | | | 265,441 | |
| Perficient,Inc(a) | | | 3,106 | | | | 208,008 | |
| Rapid7, Inc.(a) | | | 3,323 | | | | 150,432 | |
| Tenable Holdings, Inc.(a) | | | 5,766 | | | | 234,330 | |
| Veeco Instruments, Inc.(a) | | | 10,769 | | | | 196,319 | |
| | | | | | | | 1,948,003 | |
| Utilities — 3.29% | | | | | | | | |
| Chesapeake Utilities Corp. | | | 1,785 | | | | 222,018 | |
| Clearway Energy, Inc., Class C | | | 6,348 | | | | 220,530 | |
| | | | | | | | 442,548 | |
| Total Common Stocks (Cost $13,495,479) | | | | | | | 13,404,301 | |
| | | | | | | | | |
| MONEY MARKET FUNDS - 0.50% | | | | | | | | |
| Fidelity Investments Money Market Government Portfolio, Institutional Class, 2.91%(b) | | | 67,550 | | | | 67,550 | |
| Total Money Market Funds (Cost $67,550) | | | | | | | 67,550 | |
| | | | | | | | | |
| Total Investments — 100.10% (Cost $13,563,029) | | | | | | | 13,471,851 | |
| Liabilities in Excess of Other Assets — (0.10)% | | | | | | | (13,792 | ) |
| NET ASSETS — 100.00% | | | | | | $ | 13,458,059 | |
| (a) | Non-income producing security. |
| (b) | Rate disclosed is the seven day effective yield as of October 31, 2022. |
REIT- Real Estate Investment Trust
See accompanying notes which are an integral part of these financial statements.
| Dana Epiphany ESG Equity Fund |
| Schedule of Investments |
| October 31, 2022 |
| COMMON STOCKS — 98.59% | | Shares | | | Fair Value | |
| Communications — 7.76% | | | | | | | | |
| Alphabet, Inc., Class A(a) | | | 18,400 | | | $ | 1,738,984 | |
| Alphabet, Inc., Class C(a) | | | 4,600 | | | | 435,436 | |
| Comcast Corp., Class A | | | 31,000 | | | | 983,940 | |
| Interpublic Group of Cos., Inc. | | | 46,400 | | | | 1,382,256 | |
| Verizon Communications, Inc. | | | 30,000 | | | | 1,121,100 | |
| | | | | | | | 5,661,716 | |
| Consumer Discretionary — 10.72% | | | | | | | | |
| Advance Auto Parts, Inc. | | | 7,400 | | | | 1,405,408 | |
| Amazon.com, Inc.(a) | | | 8,500 | | | | 870,740 | |
| D.R. Horton, Inc. | | | 17,400 | | | | 1,337,712 | |
| Home Depot, Inc. (The) | | | 3,600 | | | | 1,066,068 | |
| Tapestry, Inc. | | | 39,000 | | | | 1,235,520 | |
| Tractor Supply Co. | | | 2,400 | | | | 527,448 | |
| Ulta Beauty, Inc.(a) | | | 3,300 | | | | 1,383,921 | |
| | | | | | | | 7,826,817 | |
| Consumer Staples — 7.04% | | | | | | | | |
| Darling Ingredients, Inc.(a) | | | 20,000 | | | | 1,569,600 | |
| General Mills, Inc. | | | 20,000 | | | | 1,631,600 | |
| Kimberly-Clark Corp. | | | 6,800 | | | | 846,328 | |
| Mondelez International, Inc., Class A | | | 17,800 | | | | 1,094,344 | |
| | | | | | | | 5,141,872 | |
| Energy — 5.27% | | | | | | | | |
| Cheniere Energy, Inc. | | | 5,500 | | | | 970,255 | |
| ConocoPhillips | | | 4,600 | | | | 580,014 | |
| Ovintiv, Inc. | | | 18,000 | | | | 911,700 | |
| Pioneer Natural Resources Co. | | | 5,400 | | | | 1,384,614 | |
| | | | | | | | 3,846,583 | |
| Financials — 8.99% | | | | | | | | |
| Allstate Corp. (The) | | | 11,000 | | | | 1,388,750 | |
| American Express Co. | | | 9,200 | | | | 1,365,740 | |
| Bank of New York Mellon Corp. (The) | | | 30,400 | | | | 1,280,144 | |
| Morgan Stanley | | | 14,400 | | | | 1,183,248 | |
| Truist Financial Corp. | | | 30,000 | | | | 1,343,700 | |
| | | | | | | | 6,561,582 | |
| Health Care — 15.14% | | | | | | | | |
| Cigna Corp. | | | 5,900 | | | | 1,906,054 | |
| CVS Health Corp. | | | 15,600 | | | | 1,477,320 | |
| Envista Holdings Corp.(a) | | | 16,000 | | | | 528,160 | |
| Humana, Inc. | | | 2,900 | | | | 1,618,432 | |
| IQVIA Holdings, Inc.(a) | | | 7,600 | | | | 1,593,492 | |
| STERIS PLC | | | 8,800 | | | | 1,518,704 | |
| Syneos Health, Inc.(a) | | | 20,000 | | | | 1,007,600 | |
| Zoetis, Inc., Class A | | | 9,300 | | | | 1,402,254 | |
| | | | | | | | 11,052,016 | |
| Industrials — 9.89% | | | | | | | | |
| Deere & Co. | | | 3,900 | | | | 1,543,698 | |
| Norfolk Southern Corp. | | | 6,100 | | | | 1,391,227 | |
See accompanying notes which are an integral part of these financial statements.
| Dana Epiphany ESG Equity Fund |
| Schedule of Investments (continued) |
| October 31, 2022 |
| COMMON STOCKS — 98.59% - continued | | Shares | | | Fair Value | |
| Industrials — 9.89% - continued | | | | | | | | |
| Regal-Beloit Corp. | | | 10,200 | | | $ | 1,290,708 | |
| TE Connectivity Ltd. | | | 11,800 | | | | 1,442,314 | |
| W.W. Grainger, Inc. | | | 2,650 | | | | 1,548,528 | |
| | | | | | | | 7,216,475 | |
| Materials — 2.48% | | | | | | | | |
| Albemarle Corp. | | | 1,900 | | | | 531,753 | |
| Avery Dennison Corp. | | | 4,300 | | | | 729,065 | |
| Packaging Corp. of America | | | 4,600 | | | | 552,966 | |
| | | | | | | | 1,813,784 | |
| Real Estate — 4.24% | | | | | | | | |
| American Tower Corp., Class A | | | 1,800 | | | | 372,942 | |
| Hannon Armstrong Sustainable Infrastructure Capital, Inc. | | | 42,000 | | | | 1,141,560 | |
| Iron Mountain, Inc. | | | 23,000 | | | | 1,151,610 | |
| Spirit Realty Capital, Inc. | | | 11,000 | | | | 427,130 | |
| | | | | | | | 3,093,242 | |
| Technology — 24.22% | | | | | | | | |
| Accenture PLC, Class A | | | 4,700 | | | | 1,334,330 | |
| Advanced Micro Devices, Inc.(a) | | | 14,000 | | | | 840,840 | |
| Analog Devices, Inc. | | | 9,000 | | | | 1,283,580 | |
| Apple, Inc. | | | 17,400 | | | | 2,668,116 | |
| Cadence Design Systems, Inc.(a) | | | 7,300 | | | | 1,105,147 | |
| CDW Corp. | | | 8,000 | | | | 1,382,480 | |
| Cisco Systems, Inc. | | | 30,000 | | | | 1,362,900 | |
| Cognizant Technology Solutions Corp., Class A | | | 20,000 | | | | 1,245,000 | |
| Fiserv, Inc.(a) | | | 9,000 | | | | 924,660 | |
| Lam Research Corp. | | | 2,600 | | | | 1,052,428 | |
| Microsoft Corp. | | | 9,800 | | | | 2,274,874 | |
| Visa, Inc., Class A | | | 7,000 | | | | 1,450,119 | |
| Workday, Inc., Class A(a) | | | 4,800 | | | | 747,936 | |
| | | | | | | | 17,672,410 | |
| Utilities — 2.84% | | | | | | | | |
| Avangrid, Inc. | | | 7,400 | | | | 301,032 | |
| Eversource Energy | | | 11,000 | | | | 839,080 | |
| NextEra Energy, Inc. | | | 12,000 | | | | 930,000 | |
| | | | | | | | 2,070,112 | |
| Total Common Stocks (Cost $73,497,511) | | | | | | | 71,956,609 | |
| | | | | | | | | |
| MONEY MARKET FUNDS - 1.15% | | | | | | | | |
| Fidelity Investments Money Market Government Portfolio, Institutional Class, 2.91%(b) | | | 842,259 | | | | 842,259 | |
| Total Money Market Funds (Cost $842,259) | | | | | | | 842,259 | |
| | | | | | | | | |
| Total Investments — 99.74% (Cost $74,339,770) | | | | | | | 72,798,868 | |
| Other Assets in Excess of Liabilities — 0.26% | | | | | | | 192,269 | |
| NET ASSETS — 100.00% | | | | | | $ | 72,991,137 | |
| (a) | Non-income producing security. |
| (b) | Rate disclosed is the seven day effective yield as of October 31, 2022. |
See accompanying notes which are an integral part of these financial statements.
| Dana Funds |
| Statements of Assets and Liabilities |
| October 31, 2022 |
| | | | | | Dana | | | | |
| | | | | | Epiphany | | | Dana | |
| | | Dana Large | | | ESG Small | | | Epiphany | |
| | | Cap Equity | | | Cap Equity | | | ESG Equity | |
| | | Fund | | | Fund | | | Fund | |
| Assets | | | | | | | | | | | | |
| Investments in securities at fair value (cost $83,956,119, $13,563,029 and $74,339,770) (Note 3) | | $ | 102,094,447 | | | $ | 13,471,851 | | | $ | 72,798,868 | |
| Receivable for fund shares sold | | | 204 | | | | 60 | | | | 238,868 | |
| Receivable for investments sold | | | 1,391,946 | | | | 455,970 | | | | 592,791 | |
| Dividends receivable | | | 141,451 | | | | 2,499 | | | | 84,275 | |
| Receivable from Adviser (Note 4) | | | — | | | | 10,184 | | | | — | |
| Prepaid expenses | | | 20,865 | | | | 14,669 | | | | 14,434 | |
| Total Assets | | | 103,648,913 | | | | 13,955,233 | | | | 73,729,236 | |
| | | | | | | | | | | | | |
| Liabilities | | | | | | | | | | | | |
| Payable for fund shares redeemed | | | 54,363 | | | | — | | | | 75,943 | |
| Payable for investments purchased | | | 1,205,628 | | | | 465,807 | | | | 601,626 | |
| Payable to Adviser (Note 4) | | | 41,829 | | | | — | | | | 25,956 | |
| Accrued Distribution (12b-1) fees (Note 4) | | | 4,064 | | | | — | | | | — | |
| Payable to Administrator (Note 4) | | | 10,501 | | | | 6,516 | | | | 7,652 | |
| Payable to trustees (Note 4) | | | 1,917 | | | | 1,917 | | | | 1,917 | |
| Other accrued expenses | | | 25,572 | | | | 22,934 | | | | 25,005 | |
| Total Liabilities | | | 1,343,874 | | | | 497,174 | | | | 738,099 | |
| Net Assets | | $ | 102,305,039 | | | $ | 13,458,059 | | | $ | 72,991,137 | |
| | | | | | | | | | | | | |
| Net Assets consist of: | | | | | | | | | | | | |
| Paid-in capital | | $ | 76,399,874 | | | $ | 12,436,176 | | | $ | 75,604,695 | |
| Accumulated earnings (deficit) | | | 25,905,165 | | | | 1,021,883 | | | | (2,613,558 | ) |
| Net Assets | | $ | 102,305,039 | | | $ | 13,458,059 | | | $ | 72,991,137 | |
| Institutional Class: | | | | | | | | | | | | |
| Net Assets | | $ | 82,372,665 | | | $ | 13,458,059 | | | $ | 72,991,137 | |
| Shares outstanding (unlimited number of shares authorized, no par value) | | | 3,874,352 | | | | 1,158,409 | | | | 6,339,859 | |
| Net asset value, offering and redemption price per share (Note 2) | | $ | 21.26 | | | $ | 11.62 | | | $ | 11.51 | |
| Investor Class: | | | | | | | | | | | | |
| Net Assets | | $ | 19,932,374 | | | | | | | | | |
| Shares outstanding (unlimited number of shares authorized, no par value) | | | 937,359 | | | | | | | | | |
| Net asset value, offering and redemption price per share (Note 2) | | $ | 21.26 | | | | | | | | | |
See accompanying notes which are an integral part of these financial statements.
| Dana Funds |
| Statements of Operations |
| For the year ended October 31, 2022 |
| | | | | | Dana Epiphany | | | Dana Epiphany | |
| | | Dana Large Cap | | | ESG Small Cap | | | ESG Equity | |
| | | Equity Fund | | | Equity Fund | | | Fund | |
| Investment Income | | | | | | | | | | | | |
| Dividend income | | $ | 2,281,839 | | | $ | 154,688 | | | $ | 1,312,495 | |
| Total investment income | | | 2,281,839 | | | | 154,688 | | | | 1,312,495 | |
| | | | | | | | | | | | | |
| Expenses | | | | | | | | | | | | |
| Investment Adviser fees (Note 4) | | | 792,266 | | | | 114,992 | | | | 485,120 | |
| Administration and compliance service fees (Note 4) | | | 71,713 | | | | 33,525 | | | | 47,921 | |
| Distribution (12b-1) fees, Investor Class (Note 4) | | | 57,446 | | | | — | | | | — | |
| Fund accounting fees (Note 4) | | | 43,277 | | | | 25,437 | | | | 29,920 | |
| Registration expenses | | | 40,999 | | | | 22,136 | | | | 34,578 | |
| Transfer agent fees (Note 4) | | | 23,402 | | | | 18,315 | | | | 18,315 | |
| Legal fees | | | 18,690 | | | | 27,938 | | | | 27,900 | |
| Audit and tax preparation fees | | | 18,410 | | | | 18,411 | | | | 18,411 | |
| Custodian fees | | | 15,540 | | | | 6,142 | | | | 13,500 | |
| Trustee fees (Note 4) | | | 7,723 | | | | 6,579 | | | | 7,233 | |
| Printing and postage expenses | | | 5,205 | | | | 2,070 | | | | 7,395 | |
| Insurance expenses | | | 4,064 | | | | 2,562 | | | | 3,073 | |
| Miscellaneous expenses | | | 24,233 | | | | 20,977 | | | | 25,653 | |
| Total expenses | | | 1,122,968 | | | | 299,084 | | | | 719,019 | |
| Fees contractually waived and expenses reimbursed by Adviser (Note 4) | | | (176,583 | ) | | | (153,559 | ) | | | (84,961 | ) |
| Net operating expenses | | | 946,385 | | | | 145,525 | | | | 634,058 | |
| Net investment income | | | 1,335,454 | | | | 9,163 | | | | 678,437 | |
| | | | | | | | | | | | | |
| Net Realized and Change in Unrealized Gain (Loss) on Investments | | | | | | | | | | | | |
| Net realized gain (loss) on investment securities transactions | | | 7,882,982 | | | | 1,159,913 | | | | (1,150,639 | ) |
| Net change in unrealized depreciation on investment securities | | | (32,144,030 | ) | | | (4,828,049 | ) | | | (12,474,484 | ) |
| Net realized and change in unrealized loss on investments | | | (24,261,048 | ) | | | (3,668,136 | ) | | | (13,625,123 | ) |
| Net decrease in net assets resulting from operations | | $ | (22,925,594 | ) | | $ | (3,658,973 | ) | | $ | (12,946,686 | ) |
See accompanying notes which are an integral part of these financial statements.
| Dana Funds |
| Statements of Changes in Net Assets |
| | | Dana Large Cap Equity Fund | |
| | | For the Year | | | For the Year | |
| | | Ended October | | | Ended October | |
| | | 31, 2022 | | | 31, 2021 | |
| Increase (Decrease) in Net Assets due to: | | | | | | | | |
| Operations | | | | | | | | |
| Net investment income | | $ | 1,335,454 | | | $ | 798,820 | |
| Net realized gain on investment securities transactions | | | 7,882,982 | | | | 16,461,777 | |
| Net change in unrealized appreciation (depreciation) of investment securities | | | (32,144,030 | ) | | | 26,848,239 | |
| Net increase (decrease) in net assets resulting from operations | | | (22,925,594 | ) | | | 44,108,836 | |
| | | | | | | | | |
| Distributions to Shareholders from Earnings (Note 2) | | | | | | | | |
| Institutional Class | | | (14,198,810 | ) | | | (2,521,779 | ) |
| Investor Class | | | (3,218,987 | ) | | | (616,743 | ) |
| Total distributions | | | (17,417,797 | ) | | | (3,138,522 | ) |
| Capital Transactions – Institutional Class | | | | | | | | |
| Proceeds from shares sold | | | 14,475,937 | | | | 19,866,697 | |
| Reinvestment of distributions | | | 7,925,662 | | | | 1,261,457 | |
| Amount paid for shares redeemed | | | (22,829,242 | ) | | | (29,994,338 | ) |
| Total – Institutional Class | | | (427,643 | ) | | | (8,866,184 | ) |
| Capital Transactions – Investor Class | | | | | | | | |
| Proceeds from shares sold | | | 368,279 | | | | 955,765 | |
| Reinvestment of distributions | | | 3,041,633 | | | | 610,137 | |
| Amount paid for shares redeemed | | | (2,415,054 | ) | | | (7,582,529 | ) |
| Total – Investor Class | | | 994,858 | | | | (6,016,627 | ) |
| Net increase (decrease) in net assets resulting from capital transactions | | | 567,215 | | | | (14,882,811 | ) |
| Total Increase (Decrease) in Net Assets | | | (39,776,176 | ) | | | 26,087,503 | |
| | | | | | | | | |
| Net Assets | | | | | | | | |
| Beginning of year | | | 142,081,215 | | | | 115,993,712 | |
| End of year | | $ | 102,305,039 | | | $ | 142,081,215 | |
| | | | | | | | | |
| Share Transactions - Institutional Class | | | | | | | | |
| Shares sold | | | 577,714 | | | | 784,104 | |
| Shares issued in reinvestment of distributions | | | 299,112 | | | | 51,614 | |
| Shares redeemed | | | (959,176 | ) | | | (1,178,281 | ) |
| Total – Institutional Class | | | (82,350 | ) | | | (342,563 | ) |
| Share Transactions - Investor Class | | | | | | | | |
| Shares sold | | | 15,632 | | | | 36,024 | |
| Shares issued in reinvestment of distributions | | | 114,484 | | | | 25,319 | |
| Shares redeemed | | | (101,487 | ) | | | (310,665 | ) |
| Total – Investor Class | | | 28,629 | | | | (249,322 | ) |
See accompanying notes which are an integral part of these financial statements.
| Dana Funds |
| Statements of Changes in Net Assets (continued) |
| | | Dana Epiphany ESG Small Cap | |
| | | Equity Fund | |
| | | For the Year | | | For the Year | |
| | | Ended October | | | Ended October | |
| | | 31, 2022 | | | 31, 2021 | |
| Increase (Decrease) in Net Assets due to: | | | | | | | | |
| Operations | | | | | | | | |
| Net investment income (loss) | | $ | 9,163 | | | $ | (35,266 | ) |
| Net realized gain on investment securities transactions | | | 1,159,913 | | | | 2,817,117 | |
| Net change in unrealized appreciation (depreciation) of investment securities | | | (4,828,049 | ) | | | 3,549,853 | |
| Net increase (decrease) in net assets resulting from operations | | | (3,658,973 | ) | | | 6,331,704 | |
| | | | | | | | | |
| Distributions to Shareholders from Earnings (Note 2) | | | | | | | | |
| Institutional Class | | | (1,429,190 | ) | | | — | |
| Total distributions | | | (1,429,190 | ) | | | — | |
| Capital Transactions – Institutional Class | | | | | | | | |
| Proceeds from shares sold | | | 4,022,076 | | | | 4,001,045 | |
| Reinvestment of distributions | | | 1,400,259 | | | | — | |
| Amount paid for shares redeemed | | | (4,314,843 | ) | | | (2,755,405 | ) |
| Total – Institutional Class | | | 1,107,492 | | | | 1,245,640 | |
| Net increase in net assets resulting from capital transactions | | | 1,107,492 | | | | 1,245,640 | |
| Total Increase (Decrease) in Net Assets | | | (3,980,671 | ) | | | 7,577,344 | |
| | | | | | | | | |
| Net Assets | | | | | | | | |
| Beginning of year | | | 17,438,730 | | | | 9,861,386 | |
| End of year | | $ | 13,458,059 | | | $ | 17,438,730 | |
| | | | | | | | | |
| Share Transactions - Institutional Class | | | | | | | | |
| Shares sold | | | 291,572 | | | | 285,750 | |
| Shares issued in reinvestment of distributions | | | 95,256 | | | | — | |
| Shares redeemed | | | (324,787 | ) | | | (193,538 | ) |
| Total – Institutional Class | | | 62,041 | | | | 92,212 | |
See accompanying notes which are an integral part of these financial statements.
| Dana Funds |
| Statements of Changes in Net Assets (continued) |
| | | Dana Epiphany ESG Equity Fund | |
| | | For the Year | | | For the Year | |
| | | Ended October | | | Ended October | |
| | | 31, 2022 | | | 31, 2021 | |
| Increase (Decrease) in Net Assets due to: | | | | | | | | |
| Operations | | | | | | | | |
| Net investment income | | $ | 678,437 | | | $ | 234,908 | |
| Net realized gain (loss) on investment securities transactions | | | (1,150,639 | ) | | | 1,024,321 | |
| Net change in unrealized appreciation (depreciation) of investment securities | | | (12,474,484 | ) | | | 8,442,528 | |
| Net increase (decrease) in net assets resulting from operations | | | (12,946,686 | ) | | | 9,701,757 | |
| | | | | | | | | |
| Distributions to Shareholders from Earnings (Note 2) | | | | | | | | |
| Institutional Class | | | (1,696,546 | ) | | | (415,436 | ) |
| Total distributions | | | (1,696,546 | ) | | | (415,436 | ) |
| Capital Transactions – Institutional Class | | | | | | | | |
| Proceeds from shares sold | | | 36,072,130 | | | | 52,799,761 | |
| Reinvestment of distributions | | | 1,650,842 | | | | 412,645 | |
| Amount paid for shares redeemed | | | (17,645,598 | ) | | | (8,003,838 | ) |
| Total – Institutional Class | | | 20,077,374 | | | | 45,208,568 | |
| Net increase in net assets resulting from capital transactions | | | 20,077,374 | | | | 45,208,568 | |
| Total Increase in Net Assets | | | 5,434,142 | | | | 54,494,889 | |
| | | | | | | | | |
| Net Assets | | | | | | | | |
| Beginning of year | | | 67,556,995 | | | | 13,062,106 | |
| End of year | | $ | 72,991,137 | | | $ | 67,556,995 | |
| | | | | | | | | |
| Share Transactions - Institutional Class | | | | | | | | |
| Shares sold | | | 2,777,361 | | | | 4,143,277 | |
| Shares issued in reinvestment of distributions | | | 121,043 | | | | 34,346 | |
| Shares redeemed | | | (1,394,549 | ) | | | (615,363 | ) |
| Total – Institutional Class | | | 1,503,855 | | | | 3,562,260 | |
See accompanying notes which are an integral part of these financial statements.
| Dana Large Cap Equity Fund – Institutional Class |
| Financial Highlights |
| (For a share outstanding during each year) |
| | | For the Years Ended October 31, | |
| | | 2022 | | | 2021 | | | 2020 | | | 2019 | | | 2018 | |
| Selected Per Share Data | | | | | | | | | | | | | | | | | | | | |
| Net asset value, beginning of year | | $ | 29.20 | | | $ | 21.25 | | | $ | 22.69 | | | $ | 22.35 | | | $ | 22.64 | |
| Investment operations: | | | | | | | | | | | | | | | | | | | | |
| Net investment income | | | 0.28 | | | | 0.17 | | | | 0.23 | | | | 0.38 | | | | 0.32 | |
| Net realized and unrealized gain (loss) on investments | | | (4.60 | ) | | | 8.39 | | | | 0.86 | | | | 2.46 | | | | 0.45 | |
| Total from investment operations | | | (4.32 | ) | | | 8.56 | | | | 1.09 | | | | 2.84 | | | | 0.77 | |
| Less distributions to shareholders from: | | | | | | | | | | | | | | | | | | | | |
| Net investment income | | | (0.25 | ) | | | (0.17 | ) | | | (0.23 | ) | | | (0.36 | ) | | | (0.32 | ) |
| Net realized gains | | | (3.37 | ) | | | (0.44 | ) | | | (2.30 | ) | | | (2.14 | ) | | | (0.74 | ) |
| Total distributions | | | (3.62 | ) | | | (0.61 | ) | | | (2.53 | ) | | | (2.50 | ) | | | (1.06 | ) |
| Net asset value, end of year | | $ | 21.26 | | | $ | 29.20 | | | $ | 21.25 | | | $ | 22.69 | | | $ | 22.35 | |
| Total Return(a) | | | (17.16 | )% | | | 40.89 | % | | | 4.65 | % | | | 15.55 | % | | | 3.27 | % |
| Ratios and Supplemental Data: | | | | | | | | | | | | | | | | | | | | |
| Net assets, end of year (000 omitted) | | $ | 82,373 | | | $ | 115,544 | | | $ | 91,379 | | | $ | 107,026 | | | $ | 176,954 | |
| Before waiver | | | | | | | | | | | | | | | | | | | | |
| Ratio of expenses to average net assets | | | 0.87 | % | | | 0.86 | % | | | 0.91 | % | | | 0.85 | % | | | 0.86 | % |
| After waiver | | | | | | | | | | | | | | | | | | | | |
| Ratio of expenses to average net assets | | | 0.73 | % | | | 0.73 | % | | | 0.73 | % | | | 0.73 | % | | | 0.73 | % |
| Ratio of net investment income to average net assets | | | 1.14 | % | | | 0.65 | % | | | 1.10 | % | | | 1.68 | % | | | 1.41 | % |
| Portfolio turnover rate(b) | | | 38 | % | | | 30 | % | | | 57 | % | | | 50 | % | | | 58 | % |
| (a) | Total return in the above table represents the rate that the investor would have earned or lost on an investment in the Fund, assuming reinvestment of distributions. |
| (b) | Portfolio turnover is calculated on the basis of the Fund as a whole without distinguishing among the classes of shares. |
See accompanying notes which are an integral part of these financial statements.
| Dana Large Cap Equity Fund – Investor Class |
| Financial Highlights |
| (For a share outstanding during each year) |
| | | For the Years Ended October 31, | |
| | | 2022 | | | 2021 | | | 2020 | | | 2019 | | | 2018 | |
| Selected Per Share Data | | | | | | | | | | | | | | | | | | | | |
| Net asset value, beginning of year | | $ | 29.20 | | | $ | 21.26 | | | $ | 22.69 | | | $ | 22.35 | | | $ | 22.64 | |
| Investment operations: | | | | | | | | | | | | | | | | | | | | |
| Net investment income | | | 0.22 | | | | 0.10 | | | | 0.18 | | | | 0.30 | | | | 0.28 | |
| Net realized and unrealized gain (loss) on investments | | | (4.60 | ) | | | 8.39 | | | | 0.87 | | | | 2.50 | | | | 0.43 | |
| Total from investment operations | | | (4.38 | ) | | | 8.49 | | | | 1.05 | | | | 2.80 | | | | 0.71 | |
| Less distributions to shareholders from: | | | | | | | | | | | | | | | | | | | | |
| Net investment income | | | (0.19 | ) | | | (0.11 | ) | | | (0.18 | ) | | | (0.32 | ) | | | (0.26 | ) |
| Net realized gains | | | (3.37 | ) | | | (0.44 | ) | | | (2.30 | ) | | | (2.14 | ) | | | (0.74 | ) |
| Total distributions | | | (3.56 | ) | | | (0.55 | ) | | | (2.48 | ) | | | (2.46 | ) | | | (1.00 | ) |
| Net asset value, end of year | | $ | 21.26 | | | $ | 29.20 | | | $ | 21.26 | | | $ | 22.69 | | | $ | 22.35 | |
| Total Return(a) | | | (17.38 | )% | | | 40.48 | % | | | 4.43 | % | | | 15.29 | % | | | 3.01 | % |
| Ratios and Supplemental Data: | | | | | | | | | | | | | | | | | | | | |
| Net assets, end of year (000 omitted) | | $ | 19,932 | | | $ | 26,537 | | | $ | 24,615 | | | $ | 25,398 | | | $ | 28,870 | |
| Before waiver | | | | | | | | | | | | | | | | | | | | |
| Ratio of expenses to average net assets | | | 1.12 | % | | | 1.11 | % | | | 1.16 | % | | | 1.10 | % | | | 1.11 | % |
| After waiver | | | | | | | | | | | | | | | | | | | | |
| Ratio of expenses to average net assets | | | 0.98 | % | | | 0.98 | % | | | 0.98 | % | | | 0.98 | % | | | 0.98 | % |
| Ratio of net investment income to average net assets | | | 0.89 | % | | | 0.40 | % | | | 0.85 | % | | | 1.40 | % | | | 1.17 | % |
| Portfolio turnover rate(b) | | | 38 | % | | | 30 | % | | | 57 | % | | | 50 | % | | | 58 | % |
| (a) | Total return in the above table represents the rate that the investor would have earned or lost on an investment in the Fund, assuming reinvestment of distributions. |
| (b) | Portfolio turnover is calculated on the basis of the Fund as a whole without distinguishing among the classes of shares. |
See accompanying notes which are an integral part of these financial statements.
| Dana Epiphany ESG Small Cap Equity Fund – Institutional Class |
| Financial Highlights |
| (For a share outstanding during each year) |
| | | For the Years Ended October 31, | |
| | | 2022 | | | 2021 | | | 2020 | | | 2019 | | | 2018 | |
| Selected Per Share Data | | | | | | | | | | | | | | | | | | | | |
| Net asset value, beginning of year | | $ | 15.91 | | | $ | 9.82 | | | $ | 10.24 | | | $ | 11.09 | | | $ | 11.43 | |
| Investment operations: | | | | | | | | | | | | | | | | | | | | |
| Net investment income (loss) | | | 0.01 | | | | (0.03 | ) | | | 0.01 | | | | 0.01 | | | | (0.03 | ) |
| Net realized and unrealized gain (loss) on investments | | | (3.02 | ) | | | 6.12 | | | | (0.42 | ) | | | (0.05 | ) | | | (0.31 | ) |
| Total from investment operations | | | (3.01 | ) | | | 6.09 | | | | (0.41 | ) | | | (0.04 | ) | | | (0.34 | ) |
| Less distributions to shareholders from: | | | | | | | | | | | | | | | | | | | | |
| Net investment income | | | — | | | | — | | | | (0.01 | ) | | | — | | | | — | (a) |
| Net realized gains | | | (1.28 | ) | | | — | | | | — | | | | (0.81 | ) | | | — | |
| Total distributions | | | (1.28 | ) | | | — | | | | (0.01 | ) | | | (0.81 | ) | | | — | (a) |
| Net asset value, end of year | | $ | 11.62 | | | $ | 15.91 | | | $ | 9.82 | | | $ | 10.24 | | | $ | 11.09 | |
| Total Return(b) | | | (20.59 | )% | | | 62.02 | % | | | (4.04 | )% | | | 0.83 | % | | | (2.95 | )% |
| Ratios and Supplemental Data: | | | | | | | | | | | | | | | | | | | | |
| Net assets, end of year (000 omitted) | | $ | 13,458 | | | $ | 17,439 | | | $ | 9,861 | | | $ | 12,421 | | | $ | 16,196 | |
| Before waiver | | | | | | | | | | | | | | | | | | | | |
| Ratio of expenses to average net assets | | | 1.95 | % | | | 2.05 | % | | | 2.58 | % | | | 1.88 | % | | | 1.75 | % |
| After waiver | | | | | | | | | | | | | | | | | | | | |
| Ratio of expenses to average net assets | | | 0.95 | % | | | 0.95 | % | | | 0.95 | % | | | 0.95 | % | | | 0.95 | % |
| Ratio of net investment income (loss) to average net assets | | | 0.06 | % | | | (0.24 | )% | | | 0.02 | % | | | 0.11 | % | | | (0.24 | )% |
| Portfolio turnover rate | | | 82 | % | | | 92 | % | | | 88 | % | | | 50 | % | | | 78 | % |
| (a) | Rounds to less than $0.005 per share. |
| (b) | Total return in the above table represents the rate that the investor would have earned or lost on an investment in the Fund, assuming reinvestment of distributions. |
See accompanying notes which are an integral part of these financial statements.
| Dana Epiphany ESG Equity Fund – Institutional Class |
| Financial Highlights |
| (For a share outstanding during each year) |
| | | For the Years Ended October 31, | |
| | | 2022 | | | 2021 | | | 2020 | | | 2019 | | | 2018 | |
| Selected Per Share Data | | | | | | | | | | | | | | | | | | | | |
| Net asset value, beginning of year | | $ | 13.97 | | | $ | 10.25 | | | $ | 11.58 | | | $ | 11.80 | | | $ | 13.09 | |
| Investment operations: | | | | | | | | | | | | | | | | | | | | |
| Net investment income | | | 0.11 | | | | 0.06 | | | | 0.09 | | | | 0.14 | | | | 0.08 | (a) |
| Net realized and unrealized gain (loss) on investments | | | (2.27 | ) | | | 3.87 | | | | 0.47 | | | | 1.15 | | | | 0.74 | |
| Total from investment operations | | | (2.16 | ) | | | 3.93 | | | | 0.56 | | | | 1.29 | | | | 0.82 | |
| Less distributions to shareholders from: | | | | | | | | | | | | | | | | | | | | |
| Net investment income | | | (0.11 | ) | | | (0.06 | ) | | | (0.10 | ) | | | (0.12 | ) | | | (0.08 | ) |
| Net realized gains | | | (0.19 | ) | | | (0.15 | ) | | | (1.79 | ) | | | (1.39 | ) | | | (2.03 | ) |
| Total distributions | | | (0.30 | ) | | | (0.21 | ) | | | (1.89 | ) | | | (1.51 | ) | | | (2.11 | ) |
| Net asset value, end of year | | $ | 11.51 | | | $ | 13.97 | | | $ | 10.25 | | | $ | 11.58 | | | $ | 11.80 | |
| Total Return(b) | | | (15.76 | )% | | | 38.70 | % | | | 4.76 | % | | | 12.76 | % | | | 6.32 | % |
| Ratios and Supplemental Data: | | | | | | | | | | | | | | | | | | | | |
| Net assets, end of year (000 omitted) | | $ | 72,991 | | | $ | 67,557 | | | $ | 13,062 | | | $ | 5,079 | | | $ | 6,485 | |
| Before waiver | | | | | | | | | | | | | | | | | | | | |
| Ratio of expenses to average net assets | | | 0.96 | % | | | 1.12 | % | | | 2.00 | % | | | 2.13 | % | | | 1.63 | % |
| After waiver | | | | | | | | | | | | | | | | | | | | |
| Ratio of expenses to average net assets | | | 0.85 | % | | | 0.85 | % | | | 0.85 | % | | | 0.90 | % | | | 1.25 | % |
| Ratio of net investment income to average net assets | | | 0.91 | % | | | 0.57 | % | | | 0.89 | % | | | 1.19 | % | | | 0.62 | % |
| Portfolio turnover rate | | | 33 | % | | | 18 | % | | | 67 | % | | | 60 | % | | | 23 | % |
| (a) | Per share net investment income (loss) has been determined on the basis of average shares outstanding during the period. |
| (b) | Total return in the above table represents the rate that the investor would have earned or lost on an investment in the Fund, assuming reinvestment of distributions. |
See accompanying notes which are an integral part of these financial statements.
| Dana Funds |
| Notes to the Financial Statements |
| October 31, 2022 |
NOTE 1. ORGANIZATION
The Dana Large Cap Equity Fund (the “Large Cap Fund”), the Dana Epiphany ESG Small Cap Equity Fund (the “Small Cap Fund”), and the Dana Epiphany ESG Equity Fund (the “Epiphany ESG Fund”) (each a “Fund” and collectively, the “Funds”) are each registered under the Investment Company Act of 1940, as amended (“1940 Act”), as an open-end diversified series of Valued Advisers Trust (the “Trust”). The Trust is a management investment company established under the laws of Delaware by an Agreement and Declaration of Trust dated June 13, 2008 (the “Trust Agreement”). The Trust Agreement permits the Board of Trustees (“Board”) to issue an unlimited number of shares of beneficial interest of separate series without par value. Each Fund is one of a series of funds currently authorized by the Board. The investment adviser to the Funds is Dana Investment Advisors, Inc. (the “Adviser”). Each Fund seeks long-term growth of capital.
The Large Cap Fund currently offers Investor Class shares and Institutional Class shares. The Small Cap Fund and Epiphany ESG Fund currently offer Institutional Class shares. Each share represents an equal proportionate interest in the assets and liabilities belonging to the Fund and is entitled to such dividends and distributions out of income belonging to the Fund as declared by the Board.
NOTE 2. SIGNIFICANT ACCOUNTING POLICIES
The Funds are investment companies and follow accounting and reporting guidance under Financial Accounting Standards Board Accounting Standards Codification (“ASC”) Topic 946, “Financial Services-Investment Companies” including Accounting Standards Update 2013-08. The following is a summary of significant accounting policies followed by the Funds in the preparation of their financial statements. These policies are in conformity with generally accepted accounting principles in the United States of America (“GAAP”).
Estimates – The preparation of financial statements in conformity with GAAP requires management to make estimates and assumptions that affect the reported amounts of assets and liabilities and disclosure of contingent assets and liabilities at the date of the financial statements and the reported amounts of increases and decreases in net assets from operations during the reporting period. Actual results could differ from those estimates.
Federal Income Taxes – The Funds make no provision for federal income or excise tax. Each Fund has qualified and intends to qualify each year as a regulated investment company (“RIC”) under subchapter M of the Internal Revenue Code of 1986, as amended, by complying with the requirements applicable to RICs and by distributing substantially all of its taxable income. Each Fund also intends to distribute sufficient net investment income and net capital gains, if any, so that it will not be subject to excise tax on
| Dana Funds |
| Notes to the Financial Statements (continued) |
| October 31, 2022 |
undistributed income and gains. If the required amount of net investment income or gains is not distributed, the Funds could incur a tax expense.
As of and during the fiscal year ended October 31, 2022, the Funds did not have any liabilities for any unrecognized tax benefits. The Funds recognize interest and penalties, if any, related to unrecognized tax benefits as income tax expense on the Statements of Operations when incurred. During the fiscal year ended October 31, 2022, the Funds did not incur any interest or penalties. Management of the Funds has reviewed tax positions taken in tax years that remain subject to examination by all major tax jurisdictions, including federal (i.e., the last three tax year ends and the interim tax period since then, as applicable). Management believes that there is no tax liability resulting from unrecognized tax benefits related to uncertain tax positions taken.
Expenses – Expenses incurred by the Trust that do not relate to a specific fund of the Trust are allocated to the individual funds based on each fund’s relative net assets or another appropriate basis (as determined by the Board). Expenses specifically attributable to any class are borne by that class. Income, realized gains and losses, unrealized appreciation and depreciation, and fund-wide expenses not allocated to a particular class shall be allocated to each class based on the net assets of that class in relation to the net assets of the entire fund.
Security Transactions and Related Income – The Funds follow industry practice and record security transactions on the trade date for financial reporting purposes. The specific identification method is used for determining gains or losses for financial statement and income tax purposes. Dividend income is recorded on the ex-dividend date and interest income is recorded on an accrual basis. Withholding taxes on foreign dividends, if any, have been provided for in accordance with the Funds’ understanding of the applicable country’s tax rules and rates.
The Funds may hold Real Estate Investment Trusts (“REITs”) which pay dividends to their shareholders based upon available funds from operations. It is possible for these dividends to exceed the REIT’s underlying taxable earnings and profits resulting in the excess portion of such dividends being designated as a return of capital. Distributions received from REITs that represent a return of capital or capital gains are recorded as a reduction of the cost of the REITs or as a realized gain, respectively.
Dividends and Distributions – The Funds intend to distribute substantially all of their net investment income, if any, at least quarterly. The Funds intend to distribute their net realized long-term and short-term capital gains, if any, annually. Distributions to shareholders, which are determined in accordance with income tax regulations, are recorded on the ex-dividend date. The treatment for financial reporting purposes of distributions made to shareholders during the year from net investment income or net realized capital gains may differ from their ultimate treatment for federal income tax purposes. These differences are
| Dana Funds |
| Notes to the Financial Statements (continued) |
| October 31, 2022 |
caused primarily by differences in the timing of the recognition of certain components of income, expense or realized capital gain for federal income tax purposes. Where such differences are permanent in nature, they are reclassified in the components of the net assets based on their ultimate characterization for federal income tax purposes. Any such reclassifications will have no effect on net assets, results of operations or net asset value (“NAV”) per share of the Funds.
For the fiscal year end of October 31, 2022, the Funds made the following reclassifications to increase (decrease) the components of net assets:
| | | | | | Accumulated | |
| | | Paid-In | | | Earnings | |
| | | Capital | | | (Deficit) | |
| Large Cap Fund | | $ | (1 | ) | | $ | 1 | |
| Small Cap Fund | | | — | | | | — | |
| Epiphany ESG Fund | | | 1 | | | | (1 | ) |
Share Valuation – The NAV per share of each class of each Fund is calculated each day the New York Stock Exchange (“NYSE”) is open by dividing the total value of the assets attributable to that class, less liabilities attributable to that class, by the number of shares outstanding of that class.
NOTE 3. SECURITIES VALUATION AND FAIR VALUE MEASUREMENTS
Each Fund values its portfolio securities at fair value as of the close of regular trading on the NYSE (normally 4:00 p.m. Eastern time) on each business day the NYSE is open for business. Fair value is defined as the price that a Fund would receive upon selling an investment in a timely transaction to an independent buyer in the principal or most advantageous market of the investment. GAAP establishes a three-tier hierarchy to maximize the use of observable market data and minimize the use of unobservable inputs and to establish classification of fair value measurements for disclosure purposes.
Inputs refer broadly to the assumptions that market participants would use in pricing the asset or liability, including assumptions about risk (the risk inherent in a particular valuation technique used to measure fair value including a pricing model and/or the risk inherent in the inputs to the valuation technique). Inputs may be observable or unobservable. Observable inputs are inputs that reflect the assumptions market participants would use in pricing the asset or liability developed based on market data obtained and available from sources independent of the reporting entity. Unobservable inputs are inputs that reflect the reporting entity’s own assumptions about the assumptions market participants would use in pricing the asset or liability developed based on the best information available in the circumstances.
| Dana Funds |
| Notes to the Financial Statements (continued) |
| October 31, 2022 |
Various inputs are used in determining the value of each Fund’s investments. These inputs are summarized in the three broad levels listed below.
| ● | Level 1 – unadjusted quoted prices in active markets for identical investments and/or registered investment companies where the value per share is determined and published and is the basis for current transactions for identical assets or liabilities at the valuation date |
| ● | Level 2 – other significant observable inputs (including, but not limited to, quoted prices for an identical security in an inactive market, quoted prices for similar securities, interest rates, prepayment speeds, credit risk, etc.) |
| ● | Level 3 – significant unobservable inputs (including the Funds’ own assumptions in determining fair value of investments based on the best information available) |
The inputs used to measure fair value may fall into different levels of the fair value hierarchy. In such cases, for disclosure purposes, the level in the fair value hierarchy which is reported is determined based on the lowest level input that is significant to the fair value measurement in its entirety.
Equity securities that are traded on any stock exchange are generally valued at the last quoted sale price on the security’s primary exchange. Lacking a last sale price, an exchange-traded security is generally valued at its last bid price. Securities traded in the NASDAQ over-the-counter market are generally valued at the NASDAQ Official Closing Price. When using the market quotations and when the market is considered active, the security is classified as a Level 1 security. In the event that market quotations are not readily available or are considered unreliable due to market or other events, securities are valued in good faith by the Adviser as “valuation designee” under the oversight of the Board. The Adviser has adopted written policies and procedures for valuing securities and other assets in circumstances where market quotes are not readily available. In the event that market quotes are not readily available, and the security or asset cannot be valued pursuant to one of the valuation methods, the value of the security or asset will be determined in good faith by the Adviser pursuant to its policies and procedures. On a quarterly basis, the Adviser’s fair valuation determinations will be reviewed by the Board. Under these policies, the securities will be classified as Level 2 or 3 within the fair value hierarchy, depending on the inputs used.
Investments in mutual funds, including money market mutual funds, are generally priced at the ending NAV. These securities are categorized as Level 1 securities.
| Dana Funds |
| Notes to the Financial Statements (continued) |
| October 31, 2022 |
The following is a summary of the inputs used to value the Funds’ investments as of October 31, 2022:
| Large Cap Fund | | Valuation Inputs | |
| Assets | | Level 1 | | | Level 2 | | | Level 3 | | | Total | |
| Common Stocks(a) | | $ | 101,212,890 | | | $ | — | | | $ | — | | | $ | 101,212,890 | |
| Money Market Funds | | | 881,557 | | | | — | | | | — | | | | 881,557 | |
| Total | | $ | 102,094,447 | | | $ | — | | | $ | — | | | $ | 102,094,447 | |
| | | | | | | | | | | | | | | | | |
| Small Cap Fund | | Valuation Inputs | |
| Assets | | Level 1 | | | Level 2 | | | Level 3 | | | Total | |
| Common Stocks(a) | | $ | 13,404,301 | | | $ | — | | | $ | — | | | $ | 13,404,301 | |
| Money Market Funds | | | 67,550 | | | | — | | | | — | | | | 67,550 | |
| Total | | $ | 13,471,851 | | | $ | — | | | $ | — | | | $ | 13,471,851 | |
| | | | | | | | | | | | | | | | | |
| Epiphany ESG Fund | | Valuation Inputs | |
| Assets | | Level 1 | | | Level 2 | | | Level 3 | | | Total | |
| Common Stocks(a) | | $ | 71,956,609 | | | $ | — | | | $ | — | | | $ | 71,956,609 | |
| Money Market Funds | | | 842,259 | | | | — | | | | — | | | | 842,259 | |
| Total | | $ | 72,798,868 | | | $ | — | | | $ | — | | | $ | 72,798,868 | |
| (a) | Refer to Schedule of Investments for sector classifications. |
The Funds did not hold any investments at the end of the reporting period for which significant unobservable inputs (Level 3) were used in determining fair value; therefore, no reconciliation of Level 3 securities is included for this reporting period.
NOTE 4. FEES AND OTHER TRANSACTIONS WITH AFFILIATES AND OTHER SERVICE PROVIDERS
The Adviser, under the terms of the management agreement for each Fund, manages the Funds’ investments subject to oversight of the Board. As compensation for its management services, the Funds are obligated to pay the Adviser a fee computed and accrued daily and paid monthly at an annual rate of 0.65%, 0.75% and 0.65% of the average daily net assets of the Large Cap Fund, the Small Cap Fund and the Epiphany ESG Fund, respectively.
The Adviser has contractually agreed to waive its management fee and/or reimburse certain operating expenses through February 28, 2023, but only to the extent necessary so that the Funds’ net expenses, excluding brokerage fees and commissions, borrowing costs (such as interest and dividend expenses on securities sold short), taxes, extraordinary expenses, fees and expenses paid under a distribution plan adopted pursuant to Rule 12b-1, fees and expenses paid under a shareholder services plan, and indirect expenses (such as “acquired fund fees and expenses”) do not exceed 0.73% of the average daily net assets of the Institutional Class and the Investor Class for the Large Cap Fund, 0.95% of the average daily net assets of the Institutional Class for the Small Cap Fund, and 0.85% of the average daily net assets of the Institutional Class for the Epiphany ESG Fund.
| Dana Funds |
| Notes to the Financial Statements (continued) |
| October 31, 2022 |
Each fee waiver or expense reimbursement by the Adviser is subject to repayment by the applicable Fund within three years following the date in which the fee waiver or expense reimbursement occurred, provided that the Fund is able to make the repayment without exceeding the expense limitation that is in effect at the time of the waiver or expense reimbursement, and the expense limitation in effect at the time of the repayment. The expense limitation agreements may not be terminated except by mutual consent of the Adviser and the Board.
The amounts subject to repayment by the Funds, pursuant to the aforementioned conditions are as follows:
| | | Large Cap | | | Small Cap | | | Epiphany | |
| Recoverable Through | | Fund | | | Fund | | | ESG Fund | |
| October 31, 2023 | | $ | 227,431 | | | $ | 187,744 | | | $ | 154,164 | |
| October 31, 2024 | | | 174,396 | | | | 164,133 | | | | 108,826 | |
| October 31, 2025 | | | 176,583 | | | | 153,559 | | | | 84,961 | |
The Trust retains Ultimus Fund Solutions, LLC (“Ultimus” or “Administrator”) to provide the Funds with administration, fund accounting and transfer agent services, including all regulatory reporting. Prior to April 1, 2022, the Administrator also provided certain compliance services to the Funds.
Effective April 1, 2022, Northern Lights Compliance Services, LLC (“NLCS”), an affiliate of Ultimus, provides a Chief Compliance Officer to the Trust, as well as related compliance services, pursuant to a consulting agreement between NLCS and the Trust. Under the terms of such agreement, NLCS receives fees from the Funds.
The officers and one trustee of the Trust are members of management and/or employees of the Administrator or of NLCS and are not paid by the Trust for services to the Funds. Ultimus Fund Distributors, LLC (the “Distributor”), a wholly-owned subsidiary of Ultimus, acts as the distributor of the Funds’ shares. There were no payments made to the Distributor by the Funds for the fiscal year ended October 31, 2022.
The Trust, with respect to the Large Cap Fund, has adopted a Distribution Plan (the “Plan”) pursuant to Rule 12b-1 under the Investment Company Act of 1940, as amended (the “1940 Act”). The Plan provides that the Large Cap Fund will pay the Distributor and any registered securities dealer, financial institution or any other person (a “Recipient”) a shareholder servicing fee aggregating at a rate of 0.25% of the average daily net assets for the Investor Class shares in connection with the promotion and distribution of the Large Cap Fund’s shares or the provision of shareholder support services to shareholders, including, but not necessarily limited to, advertising, compensation to underwriters, dealers and selling personnel, the printing and mailing of prospectuses to other than current Investor Class shareholders, the printing and mailing of sales literature and servicing shareholder
| Dana Funds |
| Notes to the Financial Statements (continued) |
| October 31, 2022 |
accounts (“12b-1 Expenses”). The Large Cap Fund or Distributor may pay all or a portion of these fees to any Recipient who renders assistance in distributing or promoting the sale of shares, or who provides certain shareholder services, pursuant to a written agreement. The Plan is a compensation plan, which means that compensation is paid regardless of 12b-1 Expenses actually incurred. It is anticipated that the Plan will benefit shareholders because an effective sales program typically is necessary in order for the Large Cap Fund to reach and maintain a sufficient size to achieve efficiently its investment objectives and to realize economies of scale.
NOTE 5. PURCHASES AND SALES OF SECURITIES
For the fiscal year ended October 31, 2022, purchases and sales of investment securities, other than short-term investments, were as follows:
| | | Purchases | | | Sales | |
| Large Cap Fund | | $ | 45,922,494 | | | $ | 61,243,681 | |
| Small Cap Fund | | | 12,333,483 | | | | 12,564,529 | |
| Epiphany ESG Fund | | | 43,056,286 | | | | 23,870,787 | |
There were no purchases or sales of long-term U.S. government obligations during the fiscal year ended October 31, 2022.
NOTE 6. FEDERAL TAX INFORMATION
At October 31, 2022, the net unrealized appreciation (depreciation) and tax cost of investments for tax purposes was as follows:
| | | Large Cap | | | Small Cap | | | Epiphany | |
| | | Fund | | | Fund | | | ESG Fund | |
| Gross unrealized appreciation | | $ | 21,123,626 | | | $ | 1,171,198 | | | $ | 5,177,729 | |
| Gross unrealized depreciation | | | (3,172,169 | ) | | | (1,275,954 | ) | | | (6,960,382 | ) |
| Net unrealized appreciation/(depreciation) on investments | | | 17,951,457 | | | | (104,756 | ) | | | (1,782,653 | ) |
| Tax cost of investments | | | 84,142,990 | | | | 13,576,607 | | | | 74,581,521 | |
At October 31, 2022, the difference between book basis and tax basis unrealized appreciation for the Large Cap Fund, Small Cap Fund and Epiphany ESG Fund was attributable primarily to the tax deferral of losses on wash sales.
| Dana Funds |
| Notes to the Financial Statements (continued) |
| October 31, 2022 |
The tax character of distributions paid for the fiscal years ended October 31, 2022 and October 31, 2021 were as follows:
| | | Large Cap Fund | | | Small Cap Fund | | | Epiphany ESG Fund | |
| | | 2022 | | | 2021 | | | 2022 | | | 2021 | | | 2022 | | | 2021 | |
| Distributions paid from: | | | | | | | | | | | | | | | | | | | | | | | | |
| Ordinary income(a) | | $ | 4,378,734 | | | $ | 818,449 | | | $ | 120,827 | | | $ | — | | | $ | 862,208 | | | $ | 157,453 | |
| Long-term capital gains | | | 13,039,063 | | | | 2,320,073 | | | | 1,308,363 | | | | — | | | | 834,338 | | | | 257,983 | |
| Total | | $ | 17,417,797 | | | $ | 3,138,522 | | | $ | 1,429,190 | | | $ | — | | | $ | 1,696,546 | | | $ | 415,436 | |
| (a) | Short-term capital gain distributions are treated as ordinary income for tax purposes. |
At October 31, 2022, the components of accumulated earnings (deficit) on a tax basis were as follows:
| | | Large Cap
Fund | | | Small Cap
Fund | | | Epiphany ESG
Fund | |
| Undistributed ordinary income | | $ | 222,949 | | | $ | 1,085 | | | $ | 99,294 | |
| Undistributed long-term capital gains | | | 7,730,759 | | | | 1,125,554 | | | | — | |
| Accumulated capital and other losses | | | — | | | | — | | | | (930,199 | ) |
| Unrealized appreciation (depreciation) on investments | | | 17,951,457 | | | | (104,756 | ) | | | (1,782,653 | ) |
| Total accumulated earnings (deficit) | | $ | 25,905,165 | | | $ | 1,021,883 | | | $ | (2,613,558 | ) |
As of October 31, 2022, the Epiphany ESG Fund had short-term capital loss carryforwards of $930,199. These capital loss carryforwards, which do not expire, may be utilized in future years to offset net realized capital gains, if any, prior to distributing such gains to shareholders.
NOTE 7. COMMITMENTS AND CONTINGENCIES
The Trust indemnifies its officers and Trustees for certain liabilities that may arise from their performance of their duties to the Trust or the Funds. Additionally, in the normal course of business, the Trust enters into contracts that contain a variety of representations and warranties which provide general indemnifications. The Trust’s maximum exposure under these arrangements is unknown, as this would involve future claims that may be made against the Trust that have not yet occurred.
| Dana Funds |
| Notes to the Financial Statements (continued) |
| October 31, 2022 |
NOTE 8. SUBSEQUENT EVENTS
Management of the Funds has evaluated the need for disclosures and/or adjustments resulting from subsequent events through the date at which these financial statements were issued. Based upon this evaluation, management has determined there were no items requiring adjustment of the financial statements or additional disclosure.
| Report of Independent Registered Public Accounting Firm |
To the Shareholders of Dana Funds and Board of Trustees of Valued Advisers Trust
Opinion on the Financial Statements
We have audited the accompanying statements of assets and liabilities, including the schedules of investments, of Dana Funds comprising the funds listed below (the “Funds”), each a series of Valued Advisers Trust, as of October 31, 2022, the related statements of operations, the statements of changes in net assets, the related notes, and the financial highlights for each of the periods indicated below (collectively referred to as the “financial statements”). In our opinion, the financial statements present fairly, in all material respects, the financial position of each of the Funds as of October 31, 2022, the results of their operations, the changes in net assets, and the financial highlights for each of the periods indicated below, in conformity with accounting principles generally accepted in the United States of America.
| Fund Name | Statements of
Operations | Statements of Changes
in Net Assets | Financial Highlights |
| Dana Large Cap Equity Fund and Dana Epiphany ESG Small Cap Equity Fund | For the year ended October 31, 2022 | For the years ended October 31, 2022 and 2021 | For the years ended October 31, 2022, 2021, 2020, 2019, and 2018 |
| Dana Epiphany ESG Equity Fund | For the year ended October 31, 2022 | For the years ended October 31, 2022 and 2021 | For the years ended October 31, 2022, 2021, 2020, and 2019 |
Dana Epiphany ESG Equity Fund’s financial highlights for the year ended October 31, 2018, were audited by other auditors whose report dated December 26, 2018, expressed an unqualified opinion on those financial highlights.
Basis for Opinion
These financial statements are the responsibility of the Funds’ management. Our responsibility is to express an opinion on the Funds’ financial statements based on our audits. We are a public accounting firm registered with the Public Company Accounting Oversight Board (United States) (“PCAOB”) and are required to be independent with respect to the Funds in accordance with the U.S. federal securities laws and the applicable rules and regulations of the Securities and Exchange Commission and the PCAOB.
We conducted our audits in accordance with the standards of the PCAOB. Those standards require that we plan and perform the audit to obtain reasonable assurance about whether the financial statements are free of material misstatement whether due to error or fraud.
Our audits included performing procedures to assess the risks of material misstatement of the financial statements, whether due to error or fraud, and performing procedures that respond to those risks. Such procedures included examining, on a test basis, evidence regarding the amounts and disclosures in the financial statements. Our procedures included confirmation of securities owned as of October 31, 2022, by correspondence with the custodian and broker. Our audits also included evaluating the accounting principles used and significant estimates made by management, as well as evaluating the overall presentation of the financial statements. We believe that our audits provide a reasonable basis for our opinion.
| Report of Independent Registered Public Accounting Firm (continued) |
We have served as the auditor of one or more of the Funds within Dana Funds since 2012.

COHEN & COMPANY, LTD.
Cleveland, Ohio
December 28, 2022
| Liquidity Risk Management Program (Unaudited) |
Valued Advisers Trust has adopted and implemented a written liquidity risk management program as required by Rule 22e-4 (the “Liquidity Rule”) under the Investment Company Act. The program is reasonably designed to assess and manage each Fund’s liquidity risk, taking into consideration, among other factors, the Fund’s investment strategy and the liquidity of its portfolio investments during normal and reasonably foreseeable stressed conditions; its short and long-term cash flow projections; and its cash holdings and access to other funding sources. The Board of Trustees approved the appointment of a Liquidity Administrator Committee, which includes representatives from Dana Investment Advisors, Inc., the Funds’ investment adviser, and Ultimus Fund Solutions, LLC, the Funds’ Administrator. The Liquidity Administrator Committee is responsible for the program’s administration and oversight and for reporting to the Board on at least an annual basis regarding the program’s operation and effectiveness. The Liquidity Administrator Committee updated its assessment of each Fund’s liquidity risk profile, considering additional data gathered during the period June 1, 2021 through May 31, 2022 (the “Review Period”) and the adequacy and effectiveness of the liquidity risk management program’s operations during the Review Period in order to prepare a written report for the Board of Trustees (the “Report”) for consideration at its meeting held on September 7, 2022. The Report noted that during the Review Period none of the Funds experienced unusual stress or disruption to its operations related to purchase and redemption activity. It further noted that during the Review Period each Fund held adequate levels of cash and highly liquid investments to meet shareholder redemption activities in accordance with applicable requirements. The Report concluded that (i) the Trust’s liquidity risk management program is reasonably designed to prevent violations of the Liquidity Rule and (ii) the Trust’s liquidity risk management program had been effectively implemented during the Review Period.
| Summary of Fund Expenses (Unaudited) |
As a shareholder of a Fund, you incur two types of costs: (1) transaction costs and (2) ongoing costs, including management fees and other Fund expenses. These examples are intended to help you understand your ongoing costs (in dollars) of investing in each Fund and to compare these costs with the ongoing costs of investing in other funds. Each Fund’s example is based on an investment of $1,000 invested at the beginning of the period and held for the entire period from May 1, 2022 through October 31, 2022.
Actual Expenses
The first line of the table for each class provides information about actual account values and actual expenses. You may use the information in these lines, together with the amount you invested, to estimate the expenses that you paid over the period. Simply divide your account value by $1,000 (for example, an $8,600 account value divided by $1,000 = 8.60), then multiply the result by the number in the first line under the heading “Expenses Paid During Period” to estimate the expenses you paid on your account during this period.
Hypothetical Example for Comparison Purposes
The second line of the table for each class provides information about hypothetical account values and hypothetical expenses based on each Fund’s actual expense ratios and an assumed rate of return of 5% per year before expenses, which is not the Fund’s actual return. The hypothetical account values and expenses may not be used to estimate the actual ending account balances or expenses you paid for the period. You may use this information to compare the ongoing costs of investing in the Funds and other funds. To do so, compare this 5% hypothetical example with the 5% hypothetical examples that appear in the shareholder reports of other funds.
Expenses shown in the table are meant to highlight your ongoing costs only and do not reflect any transactional costs. Therefore, the second line of the table for each class is useful in comparing ongoing costs only and will not help you determine the relative total costs of owning different funds. In addition, if transaction costs were included, your costs would have been higher.
| Summary of Fund Expenses (Unaudited) (continued) |
| | | | | | | | Ending | | | | | | |
| | | | | Beginning | | | Account | | | Expenses | | | |
| | | | | Account | | | Value | | | Paid | | | Annualized |
| | | | | Value | | | October 31, | | | During | | | Expense |
| | | | | May 1, 2022 | | | 2022 | | | Period(a) | | | Ratio |
| Large Cap Fund | | | | | | | | | | | | | |
| Institutional Class | | Actual | | $ | 1,000.00 | | | $ | 934.00 | | | $ | 3.56 | | | 0.73% |
| | | Hypothetical(b) | | $ | 1,000.00 | | | $ | 1,021.53 | | | $ | 3.72 | | | 0.73% |
| Investor Class | | Actual | | $ | 1,000.00 | | | $ | 932.80 | | | $ | 4.77 | | | 0.98% |
| | | Hypothetical(b) | | $ | 1,000.00 | | | $ | 1,020.27 | | | $ | 4.99 | | | 0.98% |
| Small Cap Fund | | | | | | | | | | | | | | | | |
| Institutional Class | | Actual | | $ | 1,000.00 | | | $ | 959.50 | | | $ | 4.69 | | | 0.95% |
| | | Hypothetical(b) | | $ | 1,000.00 | | | $ | 1,020.42 | | | $ | 4.84 | | | 0.95% |
| Epiphany ESG Fund | | | | | | | | | | | | | | | | |
| Institutional Class | | Actual | | $ | 1,000.00 | | | $ | 933.80 | | | $ | 4.14 | | | 0.85% |
| | | Hypothetical(b) | | $ | 1,000.00 | | | $ | 1,020.92 | | | $ | 4.33 | | | 0.85% |
| (a) | Expenses are equal to the Fund’s annualized expense ratios, multiplied by the average account value over the period, multiplied by 184/365 (to reflect the one-half year period). The annualized expense ratios reflect reimbursement of expenses by the Fund’s investment adviser for the period beginning May 1, 2022 to October 31, 2022. The “Financial Highlights” tables in the Fund’s financial statements, included in this report, also show the gross expense ratios, without such reimbursements. |
| (b) | Hypothetical assumes 5% annual return before expenses. |
| Additional Federal Income Tax Information (Unaudited) |
The Form 1099-DIV you receive in January 2023 will show the tax status of all distributions paid to your account in calendar year 2022. Shareholders are advised to consult their own tax adviser with respect to the tax consequences of their investment in the Fund. As required by the Internal Revenue Code and/or regulations, shareholders must be notified regarding the status of qualified dividend income for individuals and the dividends received deduction for corporations.
Qualified Dividend Income. The Funds designate the following percentage or up to the maximum amount of such dividends allowable pursuant to the Internal Revenue Code, as qualified dividend income eligible for the reduced tax rate.
| | | Large Cap Fund | | Small Cap Fund | | Epiphany ESG Fund |
| Qualified Dividend Income | | 65% | | 67% | | 100% |
Qualified Business Income. The Funds designate the following percentage of ordinary income dividends, or up to the maximum amount of such dividends allowable pursuant to the Internal Revenue Code, as qualified business income.
| | | Large Cap Fund | | Small Cap Fund | | Epiphany ESG Fund |
| Qualified Business Income | | 1% | | 1% | | 0% |
Dividends Received Deduction. Corporate shareholders are generally entitled to take the dividends received deduction on the portion of the Funds’ dividend distribution that qualifies under tax law. For the Funds’ calendar year 2019 ordinary income dividends, the following percentage qualifies for the corporate dividends received deduction.
| | | Large Cap Fund | | Small Cap Fund | | Epiphany ESG Fund |
| Dividends Received Deduction | | 58% | | 68% | | 100% |
The Funds designate the following amounts as long-term capital gains distributions. The amounts designated may not agree with long-term capital gains in the tax character of distribution table due to utilization of earnings and profits distributed to shareholders on redemption of shares.
| | | Large Cap Fund | | | Small Cap Fund | | | Epiphany ESG Fund | |
| Long-Term Capital Gains Distributions | | $ | 13,039,063 | | | $ | 1,308,363 | | | $ | 834,338 | |
| Trustees and Officers (Unaudited) |
The Board of Trustees supervises the business activities of the Trust. Each Trustee serves as a trustee until termination of the Trust unless the Trustee dies, resigns, retires or is removed.
The following table provides information regarding each of the Independent Trustees.
Name, Address*, (Age),
Position with Trust**,
Term of Position with Trust | Principal Occupation During
Past 5 Years and Other
Directorships | Other Directorships |
Andrea N. Mullins, 55
Independent Trustee
Since December 2013
Chairperson since
March 2017 | Current: Private investor; Independent Contractor, SWM Advisors (since April 2014). | Trustee, Angel Oak Funds Trust (since February 2019) (5 portfolios); Trustee, Angel Oak Strategic Credit Fund (since February 2019); Trustee, Angel Oak Financial Strategies Income Term Trust (since May 2019); Trustee, Angel Oak Credit Opportunities Term Trust (since January 2021); Trustee and Audit Committee Chair, Cushing Mutual Funds Trust (since November 2021) (2 portfolios); Trustee and Audit Committee Chair, Cushing MLP & Infrastructure Total Return Fund (since November 2021); Trustee and Audit Committee Chair, NXG NextGen Infrastructure Income Fund (since November 2021). |
| Trustees and Officers (Unaudited) (continued) |
Name, Address*, (Age),
Position with Trust**, Term
of Position with Trust | Principal Occupation During
Past 5 Years and Other
Directorships | Other Directorships |
Ira P. Cohen, 63
Independent Trustee
Since June 2010 | Current: Independent financial services consultant (since February 2005); Executive Vice President of Asset Management Services, Recognos Financial (since August 2015). | Trustee and Audit Committee Chairman, Apollo Diversified Real Estate Fund (since March 2022); Trustee, Chairman and Nominating and Governance Committee Chairman, Angel Oak Funds Trust (since October 2014) (5 portfolios); Trustee, Chairman, and Nominating and Governance Committee Chairman, Angel Oak Strategic Credit Fund (since December 2017); Trustee, Chairman, and Nominating and Governance Committee Chairman, Angel Oak Financial Strategies Income Term Trust (since May 2019);Trustee, Chairman, and Nominating and Governance Committee Chairman, Angel Oak Credit Opportunities Term Trust (since January 2021); Trustee and Nominating and Governance Committee Chairman, U.S. Fixed Income Trust (since March 2019). |
| * | The address for each Trustee is 225 Pictoria Drive, Suite 450, Cincinnati, Ohio 45246. |
| ** | As of the date of this report, the Trust consists of 16 series. |
The following table provides information regarding the Trustee who is considered an “interested person” of the Trust, as that term is defined under the 1940 Act.
Name, Address*, (Age),
Position with Trust**,
Term of Position with Trust | Principal Occupation During
Past 5 Years and Other
Directorships | Other Directorships |
Mark J. Seger***, 60
Trustee Since March 2017 | Current: Vice Chairman and Co-Founder, Ultimus Fund Solutions, LLC and its subsidiaries (since 1999). | None. |
| Trustees and Officers (Unaudited) (continued) |
| * | The address for each Trustee is 225 Pictoria Drive, Suite 450, Cincinnati, Ohio 45246. ** As of the date of this report, the Trust consists of 16 series. |
| *** | Mr. Seger is considered an “interested person” of the Trust because of his relationship with the Trust’s administrator, transfer agent, and distributor. |
The following table provides information regarding the Officers of the Trust:
Name, Address*, (Age),
Position with Trust**,
Term of Position with Trust | Principal Occupation During
Past 5 Years | Other Directorships |
Matthew J. Miller, 46
Principal Executive Officer
and President Since March 2022 Vice President
From December 2011 to
March 2022 | Current: Vice President, Ultimus Fund Solutions, LLC (since December 2015). | None. |
N. Lynn Bowley, 64
Chief Compliance Officer
Since April 2022 | Current: Senior Vice President, Senior Compliance Officer, Northern Lights Compliance Services, LLC (since January 2007). | None. |
Carol J. Highsmith, 58
Vice President Since August
2008 Secretary Since March 2014 | Current: Vice President, Ultimus Fund Solutions, LLC (since December 2015). | None. |
Zachary P. Richmond,42
Principal Financial Officer
and Treasurer Since
September 2021 | Current:Vice President, Financial Administration, Ultimus Fund Solutions, LLC (since February 2019). Previous:Assistant Vice President, Associate Director of Financial Administration, Ultimus Fund Solutions, LLC (December 2015 to February 2019). | None. |
| Trustees and Officers (Unaudited) (continued) |
Name, Address*, (Age),
Position with Trust**,
Term of Position with Trust | Principal Occupation During
Past 5 Years and Other
Directorships | Other Directorships |
Stephen L. Preston, 56
AML Officer Since June 2017 | Current: Chief Compliance Officer of Ultimus Fund Distributors, LLC (since June 2011), Vice President, Financial Operations Principal, and Anti-Money Laundering Officer, Ultimus Fund Distributors, LLC (since April 2021), Treasurer, Financial Operations Principal, Chief Compliance Officer, and Anti-Money Laundering Officer, Northern Lights Distributors, LLC (since April 2021). Previous: Chief Compliance Officer, Ultimus Fund Solutions, LLC (June 2011 to August 2019); Chief Compliance Officer, Unified Financial Securities, LLC (April 2018 to December 2019) | None. |
| * | The address for each Officer is 225 Pictoria Drive, Suite 450, Cincinnati, Ohio 45246. |
| ** | As of the date of this report, the Trust consists of 16 series. |
| Other Information (Unaudited) |
The Funds’ Statement of Additional Information (“SAI”) includes additional information about the trustees and is available without charge, upon request. You may call toll-free at (855) 280-9648 to request a copy of the SAI or to make shareholder inquiries.
| Investment Advisory Agreement Approval (Unaudited) |
At a meeting held on June 1-2, 2022, the Board of Trustees (the “Board”) considered the renewal of the Investment Advisory Agreements (the “Dana Agreements”) between Valued Advisers Trust (the “Trust”) and Dana Investment Advisors, Inc. (“Dana”) with respect to the Dana Large Cap Equity Fund (the “Large Cap Fund”), the Dana Epiphany ESG Small Cap Equity Fund (the “Small Cap Fund”), and the Dana Epiphany ESG Equity Fund (the “ESG Fund”) (collectively, the “Dana Funds”). Dana provided written information to the Board to assist the Board in its considerations.
Counsel reminded the Trustees of their fiduciary duties and responsibilities, including the factors to be considered, and the application of those factors to Dana. In assessing the factors and reaching its decision, the Board took into consideration information furnished by Dana and the Trust’s other service providers for the Board’s review and consideration throughout the year at regular Board meetings, as well as information specifically prepared or presented in connection with the annual renewal process, including information presented at the meeting. The Board requested and was provided with, and reflected on, information and reports relevant to the annual renewal of the Dana Agreements, including: (i) reports regarding the services and support provided to the Dana Funds by Dana; (ii) quarterly assessments of the investment performance of the Dana Funds by personnel of Dana; (iii) commentary on the reasons for the performance; (iv) presentations by Dana addressing its investment philosophy, investment strategy, personnel, and operations; (v) compliance and audit reports concerning the Dana Funds and Dana; (vi) disclosure information contained in the Trust’s registration statement and Dana’s Form ADV; and (vii) a memorandum from counsel, that summarized the fiduciary duties and responsibilities of the Board in considering and approving the Dana Agreements. The Board also requested and received various informational materials including, without limitation: (a) documents containing information about Dana, including its financial information; a description of its personnel and services it provides to the Dana Funds; information on Dana’s investment advice and performance; summaries of Dana Fund expenses, compliance program, current legal matters, and other general information; (b) comparative expense and performance information for other mutual funds with strategies similar to the Dana Funds; and (c) the benefits to be realized by Dana from its relationship with the Dana Funds. The Board did not identify any particular information that was most relevant to its consideration of the Dana Agreements and each Trustee may have afforded different weight to the various Factors.
1. The nature, extent, and quality of the services to be provided by Dana. The Board considered Dana’s responsibilities under the Dana Agreements. The Trustees considered the services being provided by Dana to the Dana Funds including, without limitation: the quality of its investment advisory services (including research and recommendations with respect to portfolio securities), its process for formulating investment recommendations and assuring compliance with the Dana Funds’ investment objectives and limitations, its coordination of services for the Dana Funds among their service providers, and its efforts to promote the Dana Funds and grow their assets. The Trustees considered Dana’s continuity of, and commitment to retain, qualified personnel and Dana’s commitment to maintain and enhance its resources and systems, the commitment of Dana’s personnel to finding alternatives and options that allow the Dana Funds to maintain their goals, and Dana’s continued cooperation with the Board and counsel for the Dana Funds. The Trustees considered Dana’s personnel, including their education and experience. After considering the foregoing information and further information in the Meeting materials provided by Dana, the Board concluded that, in light of all the facts and circumstances, the nature, extent, and quality of the services provided by Dana were satisfactory and adequate for the Dana Funds.
| Investment Advisory Agreement Approval (Unaudited)(continued) |
2. Investment Performance of the Dana Funds and Dana. The Trustees compared the performance of each of the Dana Funds with the performance of funds in a peer group with similar objectives managed by other investment advisers, with aggregated Morningstar category data, and with the performance of each of the Dana Funds’ benchmark. The Trustees also considered the consistency of Dana’s management of the Dana Funds with their investment objectives, strategies, and limitations. The Trustees noted that, as of March 31, 2022, the Large Cap Fund’s performance was below its peer group median for the one-year, three-year, five-year, and since inception periods. The Trustees noted that the Large Cap Fund’s performance was below that of its benchmark for all periods presented. When compared to other funds in its custom Morningstar category, the Trustees observed that the Large Cap Fund’s performance was below the average and median for the one-year, three-year, and five-year periods, and below the median for the since inception period. The Trustees also considered the performance of Dana’s separate accounts that were managed in a manner similar to that of the Large Cap Fund and they noted that the performance of Dana’s composite was higher, and that the reasons for the difference were reasonable. The Trustees considered the performance of the Small Cap Fund, and observed that, as of March 31, 2022, the Small Cap Fund performed above the median of its peer group for the one-year period, and below the median of its peer group for the three-year, five-year, and since inception periods. As compared to its benchmark, the Trustees noted that the Small Cap Fund outperformed for the one-year, three-year, and five-year periods ended March 31, 2022, and underperformed for the since inception period. They also noted that the Small Cap Fund’s performance was above the average and median of its custom Morningstar category for the one-year period, below the average and median of the category for the three-year and five-year periods, and below the median for the since inception period. The Trustees also considered the performance of Dana’s separate accounts that were managed in a manner similar to that of the Small Cap Fund and they noted that the performance of the separate account composite was slightly higher, and that the reasons for the difference were reasonable. The Trustees then considered the performance of the ESG Fund, noting that Dana began managing the Fund in December of 2018. For this reason, the Trustees focused their attention on the one-year and three-year performance of the ESG Fund. They observed that, as of March 31, 2022, the ESG Fund performed below the average and median of its peer group for the one-year and three-year periods. As compared to its benchmark, the Trustees noted that the ESG Fund underperformed for the one-year and three-year periods. They also noted that the ESG performed below it category average and median for the one-year and three-year periods. The Trustees also considered the performance of Dana’s separate accounts that were managed in a manner similar to that of the ESG Fund and they noted that the performance of both of the separate account composites was higher, and that the reasons for the differences were reasonable. The Trustees took into consideration discussions with representatives of Dana regarding the reasons for the performance of each of the Dana Funds. After reviewing and discussing these and other relevant factors, the Board concluded, in light of all the facts and circumstances, that the investment performance of the Dana Funds and Dana was satisfactory.
3. The costs of the services to be provided and profits to be realized by Dana from the relationship with the Dana Funds. The Trustees considered: (1) Dana’s financial condition; (2) the asset level of the Dana Funds; (3) the overall expenses of each of the Dana Funds; and (4) the nature and frequency of management fee payments. The Trustees reviewed information provided by Dana regarding its profits associated with managing each of the Dana Funds, noting that Dana is currently waiving a portion of its management fee and/or reimbursing other expenses with respect to each of the Dana Funds. The Trustees also considered potential benefits for Dana in managing the
| Investment Advisory Agreement Approval (Unaudited)(continued) |
Dana Funds. The Trustees then compared the fees and expenses of the Dana Funds (including the management fee) to other comparable mutual funds. The Trustees noted that the Large Cap Fund’s management fee was equal to the median and below the average of its peer group and above the average and median of its custom Morningstar category. The Trustees also noted that the Large Cap Fund’s net expense ratio for the Institutional Class was below the average and median of its peer group and above the median and average of its custom Morningstar category. With respect to the Small Cap Fund, the Trustees noted that the management fee was below the average and the median of its peer group and below the average and median of the custom Morningstar category. They also noted that the Small Cap Fund’s net expense ratio for the Institutional Class was below the average and median of its peer group and below the average and median of its custom Morningstar category. With respect to the ESG Fund, the Board noted that the management fee was above the average and the median of its peer group and above both the average and median of its custom Morningstar category. They also noted that the ESG Fund’s net expense ratio for the Institutional Class was below the average and equal to the median of its peer group and above both the average and the median of its custom Morningstar category. The Board also considered the fact that Dana contractually lowered the management fee for the Large Cap Fund and the Small Cap Fund in the past and had contractually agreed to limit expenses of each of the Dana Funds. The Board noted that the fees that Dana assesses for separate account clients that have strategies similar to that of each of the Dana Funds, respectively, could be comparable or lower and they expressed the view that the reasons for such differences were acceptable and reasonable. Based on the foregoing, the Board concluded that the fees to be paid to Dana by each of the Dana Funds and the profits to be realized by Dana, in light of all the facts and circumstances, were fair and reasonable in relation to the nature and quality of the services provided by Dana.
4. The extent to which economies of scale would be realized as the Dana Funds grow and whether advisory fee levels reflect these economies of scale for the benefit of the Dana Funds’ investors. The Board considered the Dana Funds’ fee arrangements with Dana. The Board considered that while the management fee remained the same at all asset levels, the shareholders experienced benefits from each of the Dana Funds’ expense limitation arrangements. The Trustees noted that once the expenses fell below the cap set by each arrangement, the shareholders would continue to benefit from economies of scale under the Dana Funds’ arrangements with other service providers to the Dana Funds, and the Trustees attributed this benefit, in part, to the direct and indirect efforts of Dana at the inception of each of the Dana Funds to ensure that a cost structure was in place that was beneficial for the Dana Funds as they grew. In light of its ongoing consideration of the Dana Funds’ asset levels, expectations for growth in the Dana Funds, and fee levels, the Board determined that the Dana Funds’ fee arrangements, in light of all the facts and circumstances, were fair and reasonable in relation to the nature and quality of the services provided by Dana.
5. Possible conflicts of interest and benefits to Dana. The Trustees evaluated the potential for conflicts of interest and considered such matters as the experience and ability of the advisory personnel assigned to the Dana Funds; the basis of decisions to buy or sell securities for the Dana Funds and the substance and administration of Dana’s code of ethics. The Trustees also considered disclosure in the registration statement of the Trust relating to Dana’s potential conflicts of interest. The Trustees noted that Dana may utilize soft dollars and the Trustees noted Dana’s policies and processes for managing the conflicts of interest that could arise from soft dollar arrangements. The Trustees noted other potential benefits to Dana, including the fact that the Dana Funds provide an
| Investment Advisory Agreement Approval (Unaudited) (continued) |
attractive vehicle for smaller accounts, which may increase the total assets under management by Dana and provide marginal cost efficiency. Based on the foregoing, the Board determined that the standards and practices of Dana relating to the identification and mitigation of potential conflicts of interest and the benefits to be realized by Dana in managing the Dana Funds were satisfactory.
After additional consideration of the factors discussed by counsel and further discussion among the Board members, the Board determined to approve the continuation of the Dana Agreements.
| FACTS | WHAT DO THE DANA FUNDS (the “FUNDS”) DO WITH YOUR PERSONAL INFORMATION? |
| |
| Why? | Financial companies choose how they share your personal information. Federal law gives consumers the right to limit some but not all sharing. Federal law also requires us to tell you how we collect, share, and protect your personal information. Please read this notice carefully to understand what we do. |
| |
| What? | The types of personal information we collect and share depend on the product or service you have with us. This information can include: ■ Social Security number ■ account balances and account transactions ■ transaction or loss history and purchase history ■ checking account information and wire transfer instructions When you are no longer our customer, we continue to share your information as described in this notice. |
| |
| How? | All financial companies need to share customers’ personal information to run their everyday business. In the section below, we list the reasons financial companies can share their customers’ personal information; the reasons Dana Funds choose to share; and whether you can limit this sharing. |
| |
| Reasons we can share your personal information | Do the Funds share? |
For our everyday business purposes — such as to process your transactions, maintain your account(s), respond to court orders and legal investigations, or report to credit bureaus | Yes |
For our marketing purposes — to offer our products and services to you | No |
| For joint marketing with other financial companies | No |
For our affiliates’ everyday business purposes – information about your transactions and experiences | No |
For our affiliates’ everyday business purposes – information about your creditworthiness | No |
| For nonaffiliates to market to you | No |
| | | |
| Questions? | Call (855) 280-9648 |
| Who we are |
| Who is providing this notice? | Dana Funds Ultimus Fund Distributors, LLC (Distributor) Ultimus Fund Solutions, LLC (Administrator) |
| What we do |
How do the Funds protect my
personal information? | To protect your personal information from unauthorized access and use, we use security measures that comply with federal law. These measures include computer safeguards and secured files and buildings. Our service providers are held accountable for adhering to strict policies and procedures to prevent any misuse of your nonpublic personal information. |
How do the Funds collect my
personal information? | We collect your personal information, for example, when you ■ open an account or deposit money ■ buy securities from us or sell securities to us ■ make deposits or withdrawals from your account ■ give us your account information ■ make a wire transfer ■ tell us who receives the money ■ tell us where to send the money ■ show your government-issued ID ■ show your driver’s license |
| Why can’t I limit all sharing? | Federal law gives you the right to limit only ■ sharing for affiliates’ everyday business purposes— information about your creditworthiness ■ affiliates from using your information to market to you ■ sharing for nonaffiliates to market to you State laws and individual companies may give you additional rights to limit sharing. |
| Definitions |
| Affiliates | Companies related by common ownership or control. They can be financial and nonfinancial companies. ■ Dana Investment Advisors, Inc., the investment adviser to the Funds, could be deemed to be an affiliate. |
| Nonaffiliates | Companies not related by common ownership or control. They can be financial and nonfinancial companies. ■ The Dana Funds do not share your personal information with nonaffiliates so they can market to you. |
| Joint marketing | A formal agreement between nonaffiliated financial companies that together market financial products or services to you. ■ The Dana Funds do not jointly market. |
PROXY VOTING
A description of the policies and procedures that each Fund uses to determine how to vote proxies relating to portfolio securities and information regarding how each Fund voted those proxies during the most recent twelve month period ended June 30, are available (1) without charge upon request by calling the Funds at (855) 280-9648 and (2) in Fund documents filed with the Securities and Exchange Commission (“SEC”) on the SEC’s website at www.sec.gov.
TRUSTEES Andrea N. Mullins, Chairperson Ira P. Cohen Mark J. Seger OFFICERS Matthew J. Miller, Principal Executive Officer and President Zachary P. Richmond, Principal Financial Officer and Treasurer N. Lynn Bowley, Chief Compliance Officer Carol J. Highsmith, Vice President and Secretary INVESTMENT ADVISER Dana Investment Advisors, Inc. 20700 Swenson Drive, Suite 400 Waukesha, WI 53186 DISTRIBUTOR Ultimus Fund Distributors, LLC 225 Pictoria Drive, Suite 450 Cincinnati, OH 45246 | INDEPENDENT REGISTERED PUBLIC ACCOUNTING FIRM Cohen & Company, Ltd. 1350 Euclid Avenue, Suite 800 Cleveland, OH 44115 LEGAL COUNSEL Troutman Pepper Hamilton Sanders LLP 3000 Two Logan Square 18th and Arch Streets Philadelphia, PA 19103 CUSTODIAN Huntington National Bank 41 South High Street Columbus, OH 43215 ADMINISTRATOR, TRANSFER AGENT AND FUND ACCOUNTANT Ultimus Fund Solutions, LLC 225 Pictoria Drive, Suite 450 Cincinnati, OH 45246 |
This report is intended only for the information of shareholders or those who have received the Funds’ prospectus which contains information about each Fund’s management fee and expenses. Please read the prospectus carefully before investing.
Distributed by Ultimus Fund Distributors, LLC, Member FINRA/SIPC
DANA-AR-22
Foundry Partners Fundamental
Small Cap Value Fund
Investor Class – DRSVX
Institutional Class – DRISX
Annual Report
October 31, 2022
Foundry Funds
c/o Ultimus Fund Solutions, LLC
225 Pictoria Drive, Suite 450
Cincinnati, Ohio 45246
(800) 247-1014
Management Discussion of Fund Performance (Unaudited)
October 31, 2022
Market Review
“The Good, The Bad and the Ugly”. This 1960’s western film featuring legendary actor Clint Eastwood is a good analogy for today’s market environment. In 2022, we have witnessed the “Bad” which includes the end of an 11-year expansion from 2009 to 2021 (excluding the COVID pandemic), zero interest rate policy, and Federal Reserve (the “Fed”) induced liquidity. The “Ugly” includes two consecutive quarters of negative GDP growth, high inflation that appears to be settling in and, a Fed that remains steadfast in a hawkish posture which could lead to excessive tightening causing market disruption. But the “Good” includes the end of “meme stocks” and a normalized interest rate policy, for the time being, that provides a healthy backdrop for savers. In addition, the end of the Fed liquidity bubble appears to be creating a market where fundamentals and valuations matter. This should provide a good environment where active management can separate itself from the index. There are still plenty of risks in the market today. However, these risks, in our opinion, have led to select opportunities for long term investors.
Portfolio Review
The Foundry Partners Fundamental Small Cap Value Fund (the “Fund”) (Institutional Class) posted a return of -0.11%, outperforming the Fund’s benchmark, the Russell 2000® Value Index return of -10.73%, by 1,062 basis points over the course of the last 12 months ending October 31, 2022. Detractors to performance were Consumer Discretionary, Utilities, and Consumer Staples. Our contributors included Industrials, Health Care, Financials, Information Technology, Energy, Communication Services, Materials, and Real Estate.
Industrials was our best performing sector as stock selection and allocation were positive. Research and consulting stocks were strong as President Biden’s infrastructure bill provided a tailwind for new projects. Aerospace and defense stocks were also strong contributors as orders for weapons increased due to Russia’s invasion of Ukraine. Our building products stocks offset some of these gains as lumber prices retreated from their all-time highs.
In our April letter we discussed our thesis on energy stocks and the supply and demand imbalance facing the U.S.. This thesis has proven to be correct so far as energy continues to post strong returns. Many of our energy stocks were up double digits over the past 12 months. Offsetting some of these gains were our refiner stocks that saw rising costs. We continue to like the fundamentals in the energy sector; however, we have opportunistically taken profits over the past several months. Our materials exposure also provided strong alpha contribution. Our commodity chemicals and steel stocks were both strong as they
Management Discussion of Fund Performance (Unaudited) (continued)
October 31, 2022
were able to pass through price increases. Our gold and silver holdings detracted from our performance but still managed to outpace the index return. We continue to hold our gold and silver miners as they act as an insurance policy on a Fed misstep of raising rates to a level that breaks the markets and/or economy. Investments in the specialty chemical space as well as construction materials proved to be a drag on performance as these stocks gave back some of their gains.
In our opinion, we are in a new and exciting phase for the market where valuation and fundamentals matter. A market where companies ridden with debt and unable to make money will fall to the wayside as easy monetary policy will cease to provide liquidity for their survival. Simply put; a market where the art of stock picking and understanding companies will matter. It should be a great time to be a value investor!
The Fund’s performance quoted is past performance and does not guarantee future results. The investment return and principal value of an investment in the Fund will fluctuate so that an investor’s shares, when redeemed, may be worth more or less than their original cost. Current performance of the Fund may be lower or higher than the performance quoted. Performance data current to the most recent month end may be obtained by calling (800) 247-1014. Information provided with respect to the Fund’s Portfolio Holdings, Sector Weightings and Number of Holdings are as of October 31, 2022 and are subject to change at any time.
Value stocks may remain undervalued for extended periods of time and the market may not recognize the intrinsic value of these securities.
Micro cap and small cap investing involves greater risk not associated with investing in more established companies, such as greater price volatility, business risk, less liquidity and increased competitive threat.
The opinions expressed are those of the investment management team and are subject to change without notice, as are statements of financial market trends, which are based on current conditions. Under no circumstances does the information contained within represent a recommendation to buy, hold or sell any security and it should not be assumed that the companies discussed were, or will prove to be, profitable. Current and future holdings are subject to risk.
Investment Results (Unaudited)
Average Annual Total Returns(a) as of October 31, 2022
| | One Year | Three Year | Five Year | Ten Year |
| Foundry Partners Fundamental Small Cap Value Fund | | | | |
| Investor Class | (0.40)% | 9.75% | 4.91% | 9.57% |
| Institutional Class | (0.11)% | 10.02% | 5.17% | 9.83% |
| Russell 2000® Value Index(b) | (10.73)% | 8.08% | 5.31% | 9.37% |
| | | | | |
| | | Expense Ratios(c) | |
| | | Investor | Institutional | |
| | | Class | Class | |
| | | 1.28% | 1.03% | |
The investment return and principal value of an investment will fluctuate so that an investor’s shares, when redeemed, may be worth more or less than their original cost. The returns shown do not reflect deduction of taxes that a shareholder would pay on Foundry Partners Fundamental Small Cap Value Fund (the “Fund”) distributions or the redemption of Fund shares. THE FUND’S RETURNS REPRESENT PAST PERFORMANCE AND DO NOT PREDICT FUTURE RESULTS. The returns shown are net of all recurring expenses. Current performance of the Fund may be lower or higher than the performance quoted. For more information on the Fund, and to obtain performance data current to the most recent month end, or to request a prospectus, please call (800) 247-1014.
You should carefully consider the investment objectives, potential risk, management fees, and charges and expenses of the Fund before investing. The Fund’s prospectus contains this and other information about the Fund and should be read carefully before investing.
(a) Average annual total returns reflect any change in price per share and assume the reinvestment of all distributions. The Fund’s returns reflect any fee reductions during the applicable periods. If such fee reductions had not occurred, the quoted performance would have been lower.
(b) The Russell 2000® Value Index (“Index”) is an unmanaged benchmark that assumes reinvestment of all distributions and excludes the effect of taxes and fees. The Index is a widely recognized unmanaged index of equity prices and is representative of a broader market and range of securities than are found in the Fund’s portfolio. Individuals cannot invest directly in the Index; however, an individual can invest in exchange-traded funds or other investment vehicles that attempt to track the performance of a benchmark index.
(c) The expense ratios are from the Fund’s prospectus dated February 28, 2022. Foundry Partners, LLC (the “Adviser”) has contractually agreed to waive its management fee and/or reimburse certain Fund operating expenses, but only to the extent necessary so that the Fund’s net expenses, excluding brokerage fees and commissions, borrowing costs (such as interest and dividend expenses on securities sold short), taxes, distribution and service (12b-1) fees, extraordinary expenses and indirect expenses (such as fees and expenses of acquired funds), does not exceed 1.25% of the Fund’s average daily net assets. The contractual agreement is effective through February 28, 2023. This contractual arrangement may only be terminated by mutual consent of the Adviser and the Board of Trustees, and it will automatically terminate upon the termination of the investment advisory agreement between the Trust and the Adviser. Each waiver or reimbursement of an expense by the
Investment Results (Unaudited) (continued)
Adviser is subject to repayment by the Fund within the three years following the date of such waiver or reimbursement, provided that the Fund is able to make the repayment without exceeding the expense limitation in place at the time of the waiver or reimbursement, and the expense limitation in place at the time of the repayment. Information pertaining to the Fund’s expense ratios as of October 31, 2022 can be found in the financial highlights.
The Fund is distributed by Ultimus Fund Distributors, LLC, member FINRA/SIPC.
Investment Results (Unaudited) (continued)
Comparison of the Growth of a $100,000 Investment in the Foundry Partners Fundamental Small Cap Value Fund, Institutional Class and the Russell 2000® Value Index.
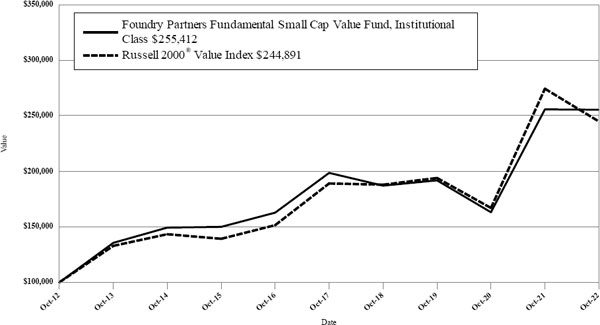
The chart above assumes an initial investment of $100,000 made on October 31, 2012 and held through October 31, 2022. THE FUND’S RETURN REPRESENTS PAST PERFORMANCE AND DOES NOT PREDICT FUTURE RESULTS. Investment returns and principal values will fluctuate so that Fund shares, when redeemed, may be worth more or less than their original purchase price. Current performance may be lower or higher than the performance data quoted.
For more information on the Fund, and to obtain performance data current to the most recent month end, or to request a prospectus, please call (800) 247-1014. You should carefully consider the investment objectives, potential risk, management fees, and charges and expenses of the Fund before investing. The Fund’s prospectus contains important information about the Fund’s investment objectives, potential risks, management fees, charges and expenses, and other information and should be read carefully before investing.
The Fund is distributed by Ultimus Fund Distributors, LLC, Member FINRA/SIPC.
Fund Holdings (Unaudited)
Foundry Partners Fundamental Small Cap Value Fund Portfolio Analysis as of October 31, 2022(a)
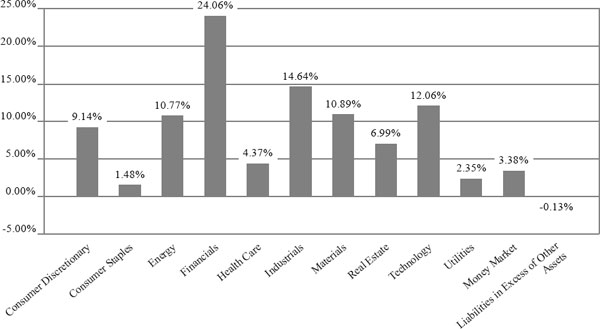
| (a) | As a percentage of net assets. |
Availability of Portfolio Schedule (Unaudited)
The Fund files its complete schedule of portfolio holdings with the Securities and Exchange Commission (“SEC”) for the first and third quarters of each fiscal year as an exhibit to its reports on Form N-PORT. The Fund’s Form N-PORT reports are available on the SEC’s website at http://www. sec.gov and on the Fund’s website at www.foundrypartnersllc.com.
| Foundry Partners Fundamental Small Cap Value Fund |
| Schedule of Investments |
| October 31, 2022 |
| COMMON STOCKS — 96.75% | | Shares | | | Fair Value | |
| Consumer Discretionary — 9.14% | | | | | | | | |
| Dana, Inc. | | | 372,742 | | | $ | 5,948,962 | |
| Group 1 Automotive, Inc. | | | 17,708 | | | | 3,063,484 | |
| Guess, Inc. | | | 200,725 | | | | 3,408,311 | |
| International Game Technology PLC | | | 208,377 | | | | 4,177,959 | |
| KB Home | | | 70,012 | | | | 2,017,746 | |
| Kontoor Brands, Inc. | | | 114,813 | | | | 4,098,824 | |
| | | | | | | | 22,715,286 | |
| Consumer Staples — 1.48% | | | | | | | | |
| United Natural Foods, Inc.(a) | | | 86,892 | | | | 3,685,090 | |
| | | | | | | | | |
| Energy — 10.77% | | | | | | | | |
| Chord Energy Corp. | | | 22,061 | | | | 3,377,318 | |
| Comstock Resources, Inc.(a) | | | 162,463 | | | | 3,051,055 | |
| Enerplus Corp. | | | 268,891 | | | | 4,654,504 | |
| EnerSys | | | 33,866 | | | | 2,244,977 | |
| Murphy Oil Corp. | | | 91,735 | | | | 4,450,065 | |
| Oil States International, Inc.(a) | | | 498,591 | | | | 3,225,884 | |
| Ranger Oil Corp., Class A | | | 65,750 | | | | 2,689,175 | |
| World Fuel Services Corp. | | | 120,919 | | | | 3,082,225 | |
| | | | | | | | 26,775,203 | |
| Financials — 24.06% | | | | | | | | |
| Affiliated Managers Group, Inc. | | | 37,479 | | | | 4,653,393 | |
| Associated Banc-Corp. | | | 244,126 | | | | 5,944,468 | |
| Axos Financial, Inc.(a) | | | 82,198 | | | | 3,202,434 | |
| CNO Financial Group, Inc. | | | 194,917 | | | | 4,299,869 | |
| F.N.B. Corp. | | | 445,421 | | | | 6,436,333 | |
| Fulton Financial Corp. | | | 285,548 | | | | 5,205,540 | |
| Hancock Whitney Corp. | | | 115,819 | | | | 6,470,808 | |
| Lazard Ltd., Class A | | | 113,649 | | | | 4,285,704 | |
| MGIC Investment Corp. | | | 350,841 | | | | 4,788,980 | |
| Old National Bancorp | | | 216,249 | | | | 4,229,830 | |
| Prosperity Bancshares, Inc. | | | 41,170 | | | | 2,946,537 | |
| Umpqua Holdings Corp. | | | 230,340 | | | | 4,579,159 | |
| Unum Group | | | 60,829 | | | | 2,773,194 | |
| | | | | | | | 59,816,249 | |
| Health Care — 4.37% | | | | | | | | |
| Ironwood Pharmaceuticals, Inc., Class A(a) | | | 276,982 | | | | 3,030,182 | |
| MEDNAX, Inc.(a) | | | 129,771 | | | | 2,517,557 | |
| Sage Therapeutics, Inc.(a) | | | 39,674 | | | | 1,494,123 | |
| Select Medical Holdings Corp. | | | 102,237 | | | | 2,625,447 | |
| Vanda Pharmaceuticals, Inc.(a) | | | 113,389 | | | | 1,187,183 | |
| | | | | | | | 10,854,492 | |
| Industrials — 14.64% | | | | | | | | |
| Advanced Energy Industries, Inc. | | | 44,469 | | | | 3,497,486 | |
| Allison Transmission Holdings, Inc. | | | 109,584 | | | | 4,629,924 | |
| AMN Healthcare Services, Inc.(a) | | | 9,350 | | | | 1,173,425 | |
| Crane Holding Co. | | | 41,443 | | | | 4,158,391 | |
| Curtiss-Wright Corp. | | | 23,550 | | | | 3,952,397 | |
See accompanying notes which are an integral part of these financial statements.
| Foundry Partners Fundamental Small Cap Value Fund |
| Schedule of Investments (continued) |
| October 31, 2022 |
| COMMON STOCKS — 96.75% - continued | | Shares | | | Fair Value | |
| Industrials — 14.64% - continued | | | | | | | | |
| DHT Holdings, Inc. | | | 338,335 | | | $ | 3,014,565 | |
| EMCOR Group, Inc. | | | 34,647 | | | | 4,888,691 | |
| Hillenbrand, Inc. | | | 74,156 | | | | 3,276,212 | |
| KBR, Inc. | | | 49,510 | | | | 2,464,113 | |
| Kennametal, Inc. | | | 79,471 | | | | 2,122,670 | |
| nVent Electric PLC | | | 88,331 | | | | 3,224,082 | |
| | | | | | | | 36,401,956 | |
| Materials — 10.89% | | | | | | | | |
| Alamos Gold, Inc., Class A | | | 595,490 | | | | 4,698,416 | |
| Eagle Materials, Inc. | | | 35,251 | | | | 4,311,550 | |
| Minerals Technologies, Inc. | | | 54,101 | | | | 2,976,096 | |
| UFP Industries, Inc. | | | 45,278 | | | | 3,225,152 | |
| Univar Solutions, Inc.(a) | | | 144,036 | | | | 3,670,037 | |
| Warrior Met Coal, Inc. | | | 124,002 | | | | 4,605,434 | |
| Worthington Industries, Inc. | | | 75,303 | | | | 3,581,411 | |
| | | | | | | | 27,068,096 | |
| Real Estate — 6.99% | | | | | | | | |
| Apple Hospitality REIT, Inc. | | | 184,740 | | | | 3,162,749 | |
| CareTrust REIT, Inc. | | | 135,299 | | | | 2,527,385 | |
| Lexington Realty Trust | | | 220,645 | | | | 2,135,844 | |
| PotlatchDeltic Corp. | | | 89,716 | | | | 3,991,464 | |
| Retail Opportunity Investments Corp. | | | 156,766 | | | | 2,269,972 | |
| Uniti Group, Inc. | | | 424,413 | | | | 3,293,445 | |
| | | | | | | | 17,380,859 | |
| Technology — 12.06% | | | | | | | | |
| Cohu, Inc.(a) | | | 112,316 | | | | 3,697,443 | |
| Diodes, Inc.(a) | | | 42,944 | | | | 3,077,796 | |
| Progress Software Corp. | | | 92,980 | | | | 4,744,769 | |
| Sanmina Corp.(a) | | | 59,154 | | | | 3,315,582 | |
| Science Applications International Corp. | | | 48,928 | | | | 5,300,860 | |
| TTM Technologies, Inc.(a) | | | 336,261 | | | | 5,148,156 | |
| Vishay Intertechnology, Inc. | | | 224,811 | | | | 4,700,798 | |
| | | | | | | | 29,985,404 | |
| Utilities — 2.35% | | | | | | | | |
| National Fuel Gas Co. | | | 86,456 | | | | 5,834,915 | |
| | | | | | | | | |
| Total Common Stocks (Cost $208,515,695) | | | | | | | 240,517,550 | |
| | | | | | | | | |
| MONEY MARKET FUNDS - 3.38% | | | | | | | | |
| Federated Hermes Government Obligations Fund, Institutional Class, 2.90%(b) | | | 8,395,206 | | | | 8,395,206 | |
| Total Money Market Funds (Cost $8,395,206) | | | | | | | 8,395,206 | |
| Total Investments — 100.13% (Cost $216,910,901) | | | | | | | 248,912,756 | |
| Liabilities in Excess of Other Assets — (0.13)% | | | | | | | (326,471 | ) |
| NET ASSETS — 100.00% | | | | | | $ | 248,586,285 | |
| (a) | Non-income producing security. |
| (b) | Rate disclosed is the seven day effective yield as of October 31, 2022. |
REIT - Real Estate Investment Trust
See accompanying notes which are an integral part of these financial statements.
| Foundry Partners Fundamental Small Cap Value Fund |
| Statement of Assets and Liabilities |
| October 31, 2022 |
| Assets | | | | |
| Investments in securities at fair value (cost $216,910,901) (Note 3) | | $ | 248,912,756 | |
| Receivable for fund shares sold | | | 27,263 | |
| Dividends receivable | | | 55,262 | |
| Prepaid expenses | | | 19,515 | |
| Total Assets | | | 249,014,796 | |
| | | | | |
| Liabilities | | | | |
| Payable for fund shares redeemed | | | 205,511 | |
| Payable to Adviser (Note 4) | | | 167,302 | |
| Accrued distribution (12b-1) fees | | | 2,365 | |
| Payable to Administrator (Note 4) | | | 20,641 | |
| Payable to trustees | | | 1,917 | |
| Other accrued expenses | | | 30,775 | |
| Total Liabilities | | | 428,511 | |
| Net Assets | | $ | 248,586,285 | |
| | | | | |
| Net Assets consist of: | | | | |
| Paid-in capital | | $ | 192,788,968 | |
| Accumulated earnings | | | 55,797,317 | |
| Net Assets | | $ | 248,586,285 | |
| | | | | |
| Investor Class: | | | | |
| Net Assets | | $ | 12,009,825 | |
| Shares outstanding | | | 530,812 | |
| Net asset value, offering and redemption price per share (Note 2) | | $ | 22.63 | |
| Institutional Class: | | | | |
| Net Assets | | $ | 236,576,460 | |
| Shares outstanding | | | 10,396,153 | |
| Net asset value, offering and redemption price per share (Note 2) | | $ | 22.76 | |
See accompanying notes which are an integral part of these financial statements.
| Foundry Partners Fundamental Small Cap Value Fund |
| Statement of Operations |
| For the Year Ended October 31, 2022 |
| Investment Income | | | | |
| Dividend income (net of foreign taxes withheld of $20,344) | | $ | 4,777,705 | |
| Total investment income | | | 4,777,705 | |
| | | | | |
| Expenses | | | | |
| Investment Adviser fees (Note 4) | | | 2,171,711 | |
| Administration and compliance service fees (Note 4) | | | 173,894 | |
| Fund accounting fees (Note 4) | | | 62,128 | |
| Registration expenses | | | 55,590 | |
| Distribution (12b-1), Investor Class | | | 30,908 | |
| Custodian fees | | | 29,133 | |
| Legal fees | | | 27,967 | |
| Transfer agent fees (Note 4) | | | 23,403 | |
| Audit and tax preparation fees | | | 18,410 | |
| Printing and postage expenses | | | 13,386 | |
| Trustee fees | | | 7,574 | |
| Insurance expenses | | | 5,048 | |
| Interest expense | | | 1,238 | |
| Miscellaneous expenses | | | 40,507 | |
| Net operating expenses | | | 2,660,897 | |
| Net investment income | | | 2,116,808 | |
| | | | | |
| Net Realized and Change in Unrealized Gain (Loss) on Investments | | | | |
| Net realized gain on investment securities transactions | | | 22,740,758 | |
| Net realized gain on foreign currency transactions | | | 2,055 | |
| Net change in unrealized depreciation of investment securities and foreign currency translations | | | (25,312,055 | ) |
| Net realized and change in unrealized loss on investments | | | (2,569,242 | ) |
| Net decrease in net assets resulting from operations | | $ | (452,434 | ) |
See accompanying notes which are an integral part of these financial statements.
| Foundry Partners Fundamental Small Cap Value Fund |
| Statements of Changes in Net Assets |
| | | For the | | | For the | |
| | | Year Ended | | | Year Ended | |
| | | October 31, | | | October 31, | |
| | | 2022 | | | 2021 | |
| Increase (Decrease) in Net Assets due to: | | | | | | | | |
| Operations | | | | | | | | |
| Net investment income | | $ | 2,116,808 | | | $ | 2,174,253 | |
| Net realized gain on investment securities transactions | | | 22,742,813 | | | | 52,831,842 | |
| Net change in unrealized appreciation (depreciation) of investment securities | | | (25,312,055 | ) | | | 59,314,433 | |
| Net increase (decrease) in net assets resulting from operations | | | (452,434 | ) | | | 114,320,528 | |
| | | | | | | | | |
| Distributions to Shareholders From Earnings (Note 2) | | | | | | | | |
| Investor Class | | | (1,829,560 | ) | | | (112,296 | ) |
| Institutional Class | | | (35,166,584 | ) | | | (2,474,194 | ) |
| Total Distributions | | | (36,996,144 | ) | | | (2,586,490 | ) |
| | | | | | | | | |
| Capital Transactions - Investor Class | | | | | | | | |
| Proceeds from shares sold | | | 427,784 | | | | 637,375 | |
| Reinvestment of distributions | | | 1,803,645 | | | | 111,081 | |
| Amount paid for shares redeemed | | | (2,121,276 | ) | | | (5,758,180 | ) |
| Total Capital Transactions - Investor Class | | | 110,153 | | | | (5,009,724 | ) |
| | | | | | | | | |
| Capital Transactions - Institutional Class | | | | | | | | |
| Proceeds from shares sold | | | 22,789,789 | | | | 53,068,256 | |
| Reinvestment of distributions | | | 34,018,201 | | | | 2,388,010 | |
| Amount paid for shares redeemed | | | (53,656,851 | ) | | | (74,192,808 | ) |
| Total Capital Transactions - Institutional Class | | | 3,151,139 | | | | (18,736,542 | ) |
| Net increase (decrease) in net assets resulting from capital transactions | | | 3,261,292 | | | | (23,746,266 | ) |
| Total Increase (Decrease) in Net Assets | | | (34,187,286 | ) | | | 87,987,772 | |
| | | | | | | | | |
| Net Assets | | | | | | | | |
| Beginning of year | | | 282,773,571 | | | | 194,785,799 | |
| End of year | | $ | 248,586,285 | | | $ | 282,773,571 | |
| | | | | | | | | |
| Share Transactions - Investor Class | | | | | | | | |
| Shares sold | | | 18,536 | | | | 27,201 | |
| Shares issued in reinvestment of distributions | | | 76,491 | | | | 5,359 | |
| Shares redeemed | | | (91,262 | ) | | | (243,745 | ) |
| Total Share Transactions - Investor Class | | | 3,765 | | | | (211,185 | ) |
| Share Transactions - Institutional Class | | | | | | | | |
| Shares sold | | | 987,033 | | | | 2,405,396 | |
| Shares issued in reinvestment of distributions | | | 1,437,186 | | | | 114,864 | |
| Shares redeemed | | | (2,257,766 | ) | | | (3,052,506 | ) |
| Total Share Transactions - Institutional Class | | | 166,453 | | | | (532,246 | ) |
See accompanying notes which are an integral part of these financial statements.
| Foundry Partners Fundamental Small Cap Value Fund - Investor Class |
| Financial Highlights |
| (For a share outstanding during each year) |
| | | For the Years Ended October 31, | |
| | | 2022 | | | 2021 | | | 2020 | | | 2019 | | | 2018 | |
| Selected Per Share Data | | | | | | | | | | | | | | | | | | | | |
| Net asset value, beginning of year | | $ | 26.16 | | | $ | 16.85 | | | $ | 20.55 | | | $ | 22.11 | | | $ | 24.32 | |
| Investment operations: | | | | | | | | | | | | | | | | | | | | |
| Net investment income | | | 0.14 | | | | 0.17 | | | | 0.18 | | | | 0.25 | | | | 0.12 | |
| Net realized and unrealized gain (loss) on investments | | | (0.10 | ) | | | 9.30 | | | | (3.15 | ) | | | (0.03 | ) | | | (1.52 | ) |
| Total from investment operations | | | 0.04 | | | | 9.47 | | | | (2.97 | ) | | | 0.22 | | | | (1.40 | ) |
| Less distributions to shareholders from: | | | | | | | | | | | | | | | | | | | | |
| Net investment income | | | (0.13 | ) | | | (0.16 | ) | | | (0.26 | ) | | | (0.08 | ) | | | (0.08 | ) |
| Net realized gains | | | (3.44 | ) | | | — | | | | (0.47 | ) | | | (1.70 | ) | | | (0.73 | ) |
| Total distributions | | | (3.57 | ) | | | (0.16 | ) | | | (0.73 | ) | | | (1.78 | ) | | | (0.81 | ) |
| Net asset value, end of year | | $ | 22.63 | | | $ | 26.16 | | | $ | 16.85 | | | $ | 20.55 | | | $ | 22.11 | |
| Total Return(a) | | | (0.40 | )% | | | 56.45 | % | | | (15.17 | )% | | | 2.28 | % | | | (6.02 | )% |
| Ratios and Supplemental Data: | | | | | | | | | | | | | | | | | | | | |
| Net assets, end of year (000 omitted) | | $ | 12,010 | | | $ | 13,785 | | | $ | 12,443 | | | $ | 21,048 | | | $ | 25,715 | |
| Ratio of expenses to average net assets | | | 1.28 | % | | | 1.28 | % | | | 1.32 | % | | | 1.32 | % | | | 1.31 | % |
| Ratio of net investment income to average net assets | | | 0.59 | % | | | 0.56 | % | | | 0.90 | % | | | 1.15 | % | | | 0.49 | % |
| Portfolio turnover rate(b) | | | 54.76 | % | | | 72.73 | % | | | 60.56 | % | | | 47.17 | % | | | 34.41 | % |
| (a) | Total return represents the rate that the investor would have earned or lost on an investment in the Fund, assuming reinvestment of dividends. |
| (b) | Portfolio turnover is calculated on the basis of the Fund as a whole without distinguishing among the classes of shares. |
See accompanying notes which are an integral part of these financial statements.
| Foundry Partners Fundamental Small Cap Value Fund - Institutional Class |
| Financial Highlights |
| (For a share outstanding during each year) |
| | | For the Years Ended October 31, | |
| | | 2022 | | | 2021 | | | 2020 | | | 2019 | | | 2018 | |
| Selected Per Share Data | | | | | | | | | | | | | | | | | | | | |
| Net asset value, beginning of year | | $ | 26.29 | | | $ | 16.94 | | | $ | 20.66 | | | $ | 22.24 | | | $ | 24.46 | |
| Investment operations: | | | | | | | | | | | | | | | | | | | | |
| Net investment income | | | 0.21 | | | | 0.18 | | | | 0.21 | | | | 0.27 | | | | 0.18 | |
| Net realized and unrealized gain (loss) on investments | | | (0.10 | ) | | | 9.38 | | | | (3.14 | ) | | | — | (a) | | | (1.53 | ) |
| Total from investment operations | | | 0.11 | | | | 9.56 | | | | (2.93 | ) | | | 0.27 | | | | (1.35 | ) |
| Less distributions to shareholders from: | | | | | | | | | | | | | | | | | | | | |
| Net investment income | | | (0.20 | ) | | | (0.21 | ) | | | (0.32 | ) | | | (0.15 | ) | | | (0.14 | ) |
| Net realized gains | | | (3.44 | ) | | | — | | | | (0.47 | ) | | | (1.70 | ) | | | (0.73 | ) |
| Total distributions | | | (3.64 | ) | | | (0.21 | ) | | | (0.79 | ) | | | (1.85 | ) | | | (0.87 | ) |
| Net asset value, end of year | | $ | 22.76 | | | $ | 26.29 | | | $ | 16.94 | | | $ | 20.66 | | | $ | 22.24 | |
| Total Return(b) | | | (0.11 | )% | | | 56.77 | % | | | (14.97 | )% | | | 2.55 | % | | | (5.78 | )% |
| Ratios and Supplemental Data: | | | | | | | | | | | | | | | | | | | | |
| Net assets, end of year (000 omitted) | | $ | 236,576 | | | $ | 268,989 | | | $ | 182,343 | | | $ | 173,600 | | | $ | 157,758 | |
| Ratio of expenses to average net assets | | | 1.03 | % | | | 1.03 | % | | | 1.07 | % | | | 1.07 | % | | | 1.06 | % |
| Ratio of net investment income to average net assets | | | 0.84 | % | | | 0.80 | % | | | 1.16 | % | | | 1.34 | % | | | 0.76 | % |
| Portfolio turnover rate(c) | | | 54.76 | % | | | 72.73 | % | | | 60.56 | % | | | 47.17 | % | | | 34.41 | % |
| (a) | Rounds to less than $0.005 per share. |
| (b) | Total return represents the rate that the investor would have earned or lost on an investment in the Fund, assuming reinvestment of dividends. |
| (c) | Portfolio turnover is calculated on the basis of the Fund as a whole without distinguishing among the classes of shares. |
See accompanying notes which are an integral part of these financial statements.
| Foundry Partners Fundamental Small Cap Value Fund |
| Notes to the Financial Statements |
| October 31, 2022 |
NOTE 1. ORGANIZATION
The Foundry Partners Fundamental Small Cap Value Fund (the “Fund”) is registered under the Investment Company Act of 1940, as amended (“1940 Act”), as an open-end diversified series of Valued Advisers Trust (the “Trust”). The Trust is a management investment company established under the laws of Delaware by an Agreement and Declaration of Trust dated June 13, 2008 (the “Trust Agreement”). The Trust Agreement permits the Board of Trustees (the “Board”) to issue an unlimited number of shares of beneficial interest of separate series without par value. The Fund is one of a series of funds authorized by the Board. The Fund’s investment adviser is Foundry Partners, LLC (the “Adviser”). The investment objective of the Fund is long-term capital appreciation.
The Fund currently offers Investor Class shares and Institutional Class shares. Each share represents an equal proportionate interest in the assets and liabilities belonging to the applicable class of the Fund and is entitled to such dividends and distributions out of income belonging to the applicable class of the Fund as are declared by the Board. On matters that affect the Fund as a whole, each class has the same voting and other rights and preferences as any other class. On matters that affect only one class, only shareholders of that class may vote. The Fund may offer additional classes of shares in the future.
NOTE 2. SIGNIFICANT ACCOUNTING POLICIES
The Fund is an investment company and follows accounting and reporting guidance under Financial Accounting Standards Board Accounting Standards Codification (“ASC”) Topic 946, “Financial Services-Investment Companies”, including Accounting Standards Update 2013-08. The following is a summary of significant accounting policies followed by the Fund in the preparation of its financial statements. These policies are in conformity with generally accepted accounting principles in the United States of America (“GAAP”).
Estimates – The preparation of financial statements in conformity with GAAP requires management to make estimates and assumptions that affect the reported amounts of assets and liabilities and disclosure of contingent assets and liabilities at the date of the financial statements and the reported amounts of increases and decreases in net assets from operations during the reporting period. Actual results could differ from those estimates.
Federal Income Taxes – The Fund makes no provision for federal income or excise tax. The Fund has qualified and intends to qualify each year as a regulated investment company (“RIC”) under subchapter M of the Internal Revenue Code of 1986, as amended, by complying with the requirements applicable to RICs and by distributing substantially all of its taxable income. The Fund also intends to distribute sufficient net investment income and net realized capital gains, if any, so that it will not be subject to excise tax on
| Foundry Partners Fundamental Small Cap Value Fund |
| Notes to the Financial Statements (continued) |
| October 31, 2022 |
undistributed income and gains. If the required amount of net investment income or gains is not distributed, the Fund could incur a tax expense.
As of and during the fiscal year ended October 31, 2022, the Fund did not have any liabilities for any unrecognized tax benefits. The Fund recognizes interest and penalties, if any, related to unrecognized tax benefits as income tax expense on the Statement of Operations when incurred. During the fiscal year ended October 31, 2022, the Fund did not incur any interest or penalties. Management of the Fund has reviewed tax positions taken in tax years that remain subject to examination by all major tax jurisdictions, including federal (i.e., the last three tax year ends and the interim tax period since then, as applicable). Management believes that there is no tax liability resulting from unrecognized tax benefits related to uncertain tax positions taken.
Expenses – Expenses incurred by the Trust that do not relate to a specific fund of the Trust are allocated to the individual funds based on each fund’s relative net assets or another appropriate basis (as determined by the Board). Expenses specifically attributable to any class are borne by that class. Income, realized gains and losses, unrealized appreciation and depreciation, and fund-wide expenses not allocated to a particular class shall be allocated to each class based on the net assets of that class in relation to the net assets of the entire fund.
Security Transactions and Related Income – The Fund follows industry practice and records security transactions on the trade date for financial reporting purposes. The specific identification method is used for determining gains or losses for financial statement and income tax purposes. Dividend income is recorded on the ex-dividend date. Non-cash income, if any, is recorded at the fair market value of the securities received. Withholding taxes on foreign dividends, if any, have been provided for in accordance with the Fund’s understanding of the applicable country’s tax rules and rates.
The Fund holds Real Estate Investment Trusts (“REITs”) which pay dividends to their shareholders based upon available funds from operations. It is possible for these dividends to exceed the REIT’s underlying taxable earnings and profits resulting in the excess portion of such dividends being designated as a return of capital. Distributions received from REITs that represent a return of capital or capital gains are recorded as a reduction of the cost of the REITs or as a realized gain, respectively.
Dividends and Distributions – The Fund intends to distribute its net investment income and net realized long-term and short-term capital gains, if any, at least annually. Dividends and distributions to shareholders, which are determined in accordance with income tax regulations, are recorded on the ex-dividend date. The treatment for financial reporting purposes of distributions made to shareholders during the period from net investment income or net realized capital gains may differ from their ultimate treatment for federal income tax purposes. These differences are caused primarily by differences in the timing
| Foundry Partners Fundamental Small Cap Value Fund |
| Notes to the Financial Statements (continued) |
| October 31, 2022 |
of the recognition of certain components of income, expense or realized capital gain for federal income tax purposes. Where such differences are permanent in nature, they are reclassified among the components of net assets based on their ultimate characterization for federal income tax purposes. Any such reclassifications will have no effect on net assets, results of operations or net asset value (“NAV”) per share of the Fund.
For the fiscal year ended October 31, 2022, the Fund made the following reclassifications to increase (decrease) the components of net assets:
| | | | Accumulated Earnings | |
| Paid-In Capital | | | (Deficit) | |
| $ | (25,919 | ) | | $ | 25,919 | |
Share Valuation – The NAV is calculated each day the New York Stock Exchange (the “NYSE”) is open by dividing the total value of the Fund’s assets, less liabilities, by the number of shares outstanding for the Fund.
Other - The Securities and Exchange Commission (“SEC”) adopted Rule 18f-4 under the 1940 Act which, effective August 19, 2022, regulates the use of derivatives for certain funds registered under the 1940 Act (“Rule 18f-4”). The Fund has adopted a Rule 18f-4 Policy which provides, among other things, that unless a Fund qualifies as a “limited derivatives user” as defined in Rule 18f-4, the Fund is subject to a comprehensive derivatives risk management program, to comply with certain value-at-risk based leverage limits and to provide additional disclosure both publicly and to the SEC regarding its derivatives positions. If a Fund qualifies as a limited derivatives user, Rule 18f-4 requires the Fund to have policies and procedures to manage its aggregate derivatives risk.
NOTE 3. SECURITIES VALUATION AND FAIR VALUE MEASUREMENTS
The Fund values its portfolio securities at fair value as of the close of regular trading on the NYSE (normally 4:00 p.m. Eastern time) on each business day the NYSE is open for business. Fair value is defined as the price that the Fund would receive upon selling an investment in a timely transaction to an independent buyer in the principal or most advantageous market of the investment. GAAP establishes a three-tier hierarchy to maximize the use of observable market data and minimize the use of unobservable inputs and to establish classification of fair value measurements for disclosure purposes.
Inputs refer broadly to the assumptions that market participants would use in pricing the asset or liability, including assumptions about risk (the risk inherent in a particular valuation technique used to measure fair value including a pricing model and/or the risk inherent in the inputs to the valuation technique). Inputs may be observable or unobservable. Observable inputs are inputs that reflect the assumptions market participants would use in pricing the asset or liability developed based on market data obtained and available from sources independent of the reporting entity. Unobservable inputs are inputs that reflect the
| Foundry Partners Fundamental Small Cap Value Fund |
| Notes to the Financial Statements (continued) |
| October 31, 2022 |
reporting entity’s own assumptions about the assumptions market participants would use in pricing the asset or liability developed based on the best information available in the circumstances.
Various inputs are used in determining the value of the Fund’s investments. These inputs are summarized in the three broad levels listed below.
| ● | Level 1 – unadjusted quoted prices in active markets for identical investments and/or registered investment companies where the value per share is determined and published and is the basis for current transactions for identical assets or liabilities at the valuation date |
| ● | Level 2 – other significant observable inputs (including, but not limited to, quoted prices for an identical security in an inactive market, quoted prices for similar securities, interest rates, prepayment speeds, credit risk, etc.) |
| ● | Level 3 – significant unobservable inputs (including the Fund’s own assumptions in determining fair value of investments based on the best information available) |
The inputs used to measure fair value may fall into different levels of the fair value hierarchy. In such cases, for disclosure purposes, the level in the fair value hierarchy which is reported is determined based on the lowest level input that is significant to the fair value measurement in its entirety.
Equity securities that are traded on any stock exchange are generally valued at the last quoted sale price on the security’s primary exchange. Lacking a last sale price, an exchange-traded security is generally valued at its last bid price. Securities traded in the NASDAQ over-the-counter market are generally valued at the NASDAQ Official Closing Price. When using the market quotations and when the market is considered active, the security is classified as a Level 1 security. In the event that market quotations are not readily available or are considered unreliable due to market or other events, securities are valued in good faith by the Adviser as “valuation designee” under the oversight of the Board. The Adviser has adopted written policies and procedures for valuing securities and other assets in circumstances where market quotes are not readily available. In the event that market quotes are not readily available, and the security or asset cannot be valued pursuant to one of the valuation methods, the value of the security or asset will be determined in good faith by the Adviser pursuant to its policies and procedures. On a quarterly basis, the Adviser’s fair valuation determinations will be reviewed by the Board. Under these policies, the securities will be classified as Level 2 or 3 within the fair value hierarchy, depending on the inputs used.
Investments in mutual funds, including money market mutual funds, are generally priced at the ending NAV. These securities are categorized as Level 1 securities.
| Foundry Partners Fundamental Small Cap Value Fund |
| Notes to the Financial Statements (continued) |
| October 31, 2022 |
The following is a summary of the inputs used to value the Fund’s investments as of October 31, 2022:
| | | Valuation Inputs | |
| Assets | | Level 1 | | | Level 2 | | | Level 3 | | | Total | |
| Common Stocks(a) | | $ | 240,517,550 | | | $ | — | | | $ | — | | | $ | 240,517,550 | |
| Money Market Funds | | | 8,395,206 | | | | — | | | | — | | | | 8,395,206 | |
| Total | | $ | 248,912,756 | | | $ | — | | | $ | — | | | $ | 248,912,756 | |
| (a) | Refer to Schedule of Investments for sector classifications. |
The Fund did not hold any investments at the end of the reporting period for which significant unobservable inputs (Level 3) were used in determining fair value; therefore, no reconciliation of Level 3 securities is included for this reporting period.
NOTE 4. FEES AND OTHER TRANSACTIONS WITH AFFILIATES AND OTHER SERVICE PROVIDERS
Under the terms of the management agreement between the Trust and the Adviser for the Fund, the Adviser manages the Fund’s investments subject to oversight of the Board. As compensation for its management services, the Fund is obligated to pay the Adviser a fee computed and accrued daily and paid monthly at an annual rate of 0.85% of the average daily net assets of the Fund.
The Adviser has contractually agreed to waive its management fee and/or reimburse certain operating expenses, but only to the extent necessary so that the Fund’s net expenses, excluding brokerage fees and commissions, borrowing costs (such as interest expense and dividends on securities sold short), taxes, distribution and service (12b-1) fees, extraordinary expenses, and any indirect expenses (such as fees and expenses of acquired funds), do not exceed an annual rate of 1.25% of the average daily net assets of the Fund.
Each fee waiver or expense reimbursement by the Adviser is subject to repayment by the Fund within the three years following the date in which the fee waiver or expense reimbursement occurred, provided that the Fund is able to make the repayment without exceeding the expense limitation that is in effect at the time of the repayment, and the expense limitation that is in effect at the time of the fee waiver or expense reimbursement. As of October 31, 2022, the Adviser has made no previous waivers that may be recouped. The contractual agreement is in effect through February 28, 2023. The expense cap may not be terminated prior to this date except by mutual consent of the Adviser and the Board. For the fiscal year ended October 31, 2022, the Adviser did not waive any fees from the Fund.
| Foundry Partners Fundamental Small Cap Value Fund |
| Notes to the Financial Statements (continued) |
| October 31, 2022 |
The Trust retains Ultimus Fund Solutions, LLC (“Ultimus” or the “Administrator”), to provide the Fund with administration, fund accounting and transfer agent services, including all regulatory reporting. Prior to April 1, 2022, the Administrator also provided certain compliance services to the Fund.
Effective April 1, 2022, Northern Lights Compliance Services, LLC (“NLCS”), an affiliate of Ultimus, provides a Chief Compliance Officer to the Trust, as well as related compliance services, pursuant to a consulting agreement between NLCS and the Trust. Under the terms of such agreement, NLCS receives fees from the Fund.
The officers and one trustee of the Trust are members of management and/or employees of the Administrator or of NLCS, and are not paid by the Trust for services to the Fund. Ultimus Fund Distributors, LLC (the “Distributor”) acts as the distributor of the Fund’s shares. The Distributor is a wholly-owned subsidiary of Ultimus. There were no payments made to the Distributor by the Fund for the fiscal year ended October 31, 2022.
The Fund has adopted a Distribution Plan (the “Plan”) pursuant to Rule 12b-1 under the 1940 Act. The Plan provides that the Fund will pay the Distributor or any registered securities dealer, financial institution or any other person (a “Recipient”) a fee aggregating at a rate of 0.25% of the average daily net assets of the Investor Class shares in connection with the promotion and distribution of the Fund’s shares or the provision of personal services to shareholders, including, but not necessarily limited to, advertising, compensation to underwriters, dealers and selling personnel; the printing and mailing of prospectuses to other than current Fund shareholders; the printing and mailing of sales literature; and servicing shareholder accounts. The Fund or the Adviser may pay all or a portion of these fees to any Recipient who renders assistance in distributing or promoting the sale of shares, or who provides certain shareholder services, pursuant to a written agreement. The Plan is a compensation plan, which means that compensation is paid regardless of 12b-1 expenses actually incurred. It is anticipated that the Plan will benefit shareholders because an effective sales program typically is necessary in order for the Fund to reach and maintain a sufficient size to achieve efficiently its investment objectives and to realize economies of scale.
NOTE 5. PURCHASES AND SALES OF SECURITIES
For the fiscal year ended October 31, 2022, purchases and sales of investment securities, other than short-term investments, were $135,437,030 and $167,117,532, respectively.
There were no purchases or sales of long-term U.S. government obligations during the fiscal year ended October 31, 2022.
| Foundry Partners Fundamental Small Cap Value Fund |
| Notes to the Financial Statements (continued) |
| October 31, 2022 |
NOTE 6. FEDERAL TAX INFORMATION
At October 31, 2022, the net unrealized appreciation (depreciation) and tax cost of investments for tax purposes was as follows:
| Gross unrealized appreciation | | $ | 39,752,702 | |
| Gross unrealized depreciation | | | (8,413,040 | ) |
| Net unrealized appreciation on investments | | $ | 31,339,662 | |
| Tax cost of investments | | $ | 217,573,094 | |
The tax character of distributions paid for the fiscal years ended October 31, 2022 and October 31, 2021 were as follows:
| | | 2022 | | | 2021 | |
| Distributions paid from: | | | | | | | | |
| Ordinary income(a) | | $ | 30,651,097 | | | $ | 2,586,490 | |
| Long-term capital gains | | | 6,345,047 | | | | — | |
| Total taxable distributions | | $ | 36,996,144 | | | $ | 2,586,490 | |
| Total distributions paid | | $ | 36,996,144 | | | $ | 2,586,490 | |
| (a) | The difference between book basis and tax basis unrealized appreciation (depreciation) is primarily attributable to the tax deferral of wash losses and return of capital adjustments. |
At October 31, 2022, the components of accumulated earnings (deficit) on a tax basis were as follows:
| Undistributed ordinary income | | $ | 1,403,803 | |
| Undistributed long-term capital gains | | | 23,053,852 | |
| Unrealized appreciation on investments | | | 31,339,662 | |
| Total accumulated earnings | | $ | 55,797,317 | |
NOTE 7. OTHER MATTERS
In April 2014, New York based fashion company The Jones Group went private through a leveraged buyout (the “LBO”). In connection with the LBO, Jones Group paid out roughly $1.2 billion to its shareholders to buy back its outstanding stock at $15 per share. Four years later, Nine West Holdings, the company that emerged from the LBO, filed for bankruptcy under Chapter 11. After Nine West’s Chapter 11 plan was confirmed, the Trustee of a Litigation Trust formed under the plan, together with the Indenture Trustee for certain notes issued by Jones Group/ Nine West, commenced a series of lawsuits against the former Jones Group shareholders who tendered their shares in the LBO, including the Fund. The plaintiffs in these suits seek to unwind the stock repurchase transactions that
| Foundry Partners Fundamental Small Cap Value Fund |
| Notes to the Financial Statements (continued) |
| October 31, 2022 |
were part of the LBO on the grounds that they constitute fraudulent conveyances under the Bankruptcy Code and state law and to recover the amounts paid to the former Jones Group shareholders. Plaintiffs allege that the Fund received $1,209,420 for its shares in the LBO and seek to claw back those funds as part of the lawsuit.
On August 27, 2020, the Southern District of New York dismissed all fraudulent conveyance and unjust enrichment claims with respect to the payments made to stockholders in connection with the LBO, including the payments made to the Fund, on the basis that the transaction qualified for protection under the safe harbor provided for in Section 546(e) of the Bankruptcy Code. As part of the ruling, all claims against the Fund were dismissed and judgment was entered in its favor. The Trustee has appealed the ruling, and the matter is now pending before the United States Court of Appeals for the Second Circuit.
NOTE 8. COMMITMENTS AND CONTINGENCIES
The Trust indemnifies its officers and Trustees for certain liabilities that may arise from their performance of their duties to the Trust or the Fund. Additionally, in the normal course of business, the Trust enters into contracts that contain a variety of representations and warranties which provide general indemnifications. The Trust’s maximum exposure under these arrangements is unknown, as this would involve future claims that may be made against the Trust that have not yet occurred.
NOTE 9. SUBSEQUENT EVENTS
Management of the Fund has evaluated the need for disclosures and/or adjustments resulting from subsequent events through the date at which these financial statements were issued. Based upon this evaluation, management has determined there were no items requiring adjustment of the financial statements or additional disclosure, other than the item below.
On December 21, 2022, the Board approved an amended and restated expense limitation agreement effective January 1, 2023. The Adviser has contractually agreed to waive its management fee and/or reimburse certain operating expenses, but only to the extent necessary so that the Fund’s net expenses, excluding brokerage fees and commissions, borrowing costs (such as interest expense and dividends on securities sold short), taxes, distribution and service (12b-1) fees, extraordinary expenses, and any indirect expenses (such as fees and expenses of acquired funds), do not exceed an annual rate of 0.99% of the average daily net assets of the Fund.
| Report of Independent Registered Public Accounting Firm |
To the Shareholders of Foundry Partners Fundamental Small Cap Value Fund and
Board of Trustees of Valued Advisers Trust
Opinion on the Financial Statements
We have audited the accompanying statement of assets and liabilities, including the schedule of investments, of Foundry Partners Fundamental Small Cap Value Fund (the “Fund”), a series of Valued Advisers Trust, as of October 31, 2022, the related statement of operations for the year then ended, the statements of changes in net assets for each of the two years in the period then ended, the related notes, and the financial highlights for each of the five years in the period then ended (collectively referred to as the “financial statements”). In our opinion, the financial statements present fairly, in all material respects, the financial position of the Fund as of October 31, 2022, the results of its operations for the year then ended, the changes in net assets for each of the two years in the period then ended, and the financial highlights for each of the five years in the period then ended, in conformity with accounting principles generally accepted in the United States of America.
Basis for Opinion
These financial statements are the responsibility of the Fund’s management. Our responsibility is to express an opinion on the Fund’s financial statements based on our audits. We are a public accounting firm registered with the Public Company Accounting Oversight Board (United States) (“PCAOB”) and are required to be independent with respect to the Fund in accordance with the U.S. federal securities laws and the applicable rules and regulations of the Securities and Exchange Commission and the PCAOB.
We conducted our audits in accordance with the standards of the PCAOB. Those standards require that we plan and perform the audit to obtain reasonable assurance about whether the financial statements are free of material misstatement whether due to error or fraud.
Our audits included performing procedures to assess the risks of material misstatement of the financial statements, whether due to error or fraud, and performing procedures that respond to those risks. Such procedures included examining, on a test basis, evidence regarding the amounts and disclosures in the financial statements. Our procedures included confirmation of securities owned as of October 31, 2022, by correspondence with the custodian. Our audits also included evaluating the accounting principles used and significant estimates made by management, as well as evaluating the overall presentation of the financial statements. We believe that our audits provide a reasonable basis for our opinion.
We have served as the Fund’s auditor since 2006.
COHEN & COMPANY, LTD.
Cleveland, Ohio
December 28, 2022
| Liquidity Risk Management Program (Unaudited) |
Valued Advisers Trust has adopted and implemented a written liquidity risk management program as required by Rule 22e-4 (the “Liquidity Rule”) under the Investment Company Act. The program is reasonably designed to assess and manage the Fund’s liquidity risk, taking into consideration, among other factors, the Fund’s investment strategy and the liquidity of its portfolio investments during normal and reasonably foreseeable stressed conditions; its short and long-term cash flow projections; and its cash holdings and access to other funding sources. The Board of Trustees approved the appointment of a Liquidity Administrator Committee, which includes representatives from Foundry Partners, LLC, the Fund’s investment adviser, and Ultimus Fund Solutions, LLC, the Fund’s Administrator. The Liquidity Administrator Committee is responsible for the program’s administration and oversight and for reporting to the Board on at least an annual basis regarding the program’s operation and effectiveness. The Liquidity Administrator Committee updated its assessment of the Fund’s liquidity risk profile, considering additional data gathered during the period June 1, 2021 through May 31, 2022 (the “Review Period”) and the adequacy and effectiveness of the liquidity risk management program’s operations during the Review Period in order to prepare a written report for the Board of Trustees (the “Report”) for consideration at its meeting held on September 7, 2022. The Report noted that during the Review Period the Fund did not experience unusual stress or disruption to its operations related to purchase and redemption activity. It further noted that during the Review Period the Fund held adequate levels of cash and highly liquid investments to meet shareholder redemption activities in accordance with applicable requirements. The Report concluded that (i) the Trust’s liquidity risk management program is reasonably designed to prevent violations of the Liquidity Rule and (ii) the Trust’s liquidity risk management program had been effectively implemented during the Review Period.
| Summary of Fund Expenses (Unaudited) |
As a shareholder of the Fund, you incur two types of costs: (1) transaction and (2) ongoing costs, including management fees and other Fund expenses. These examples are intended to help you understand your ongoing costs (in dollars) of investing in the Fund and to compare these costs with the ongoing costs of investing in other mutual funds. The example is based on an investment of $1,000 invested at the beginning of the period and held for the entire period from May 1, 2022 through October 31, 2022.
Actual Expenses
The first line of the table below provides information about actual account values and actual expenses. You may use the information in this line, together with the amount you invested, to estimate the expenses that you paid over the period. Simply divide your account value by $1,000 (for example, an $8,600 account value divided by $1,000 = 8.6), then multiply the result by the number in the first line under the heading “Expenses Paid During Period” to estimate the expenses you paid on your account during this period.
Hypothetical Example for Comparison Purposes
The second line of the table below provides information about hypothetical account values and hypothetical expenses based on the Fund’s actual expense ratio and an assumed rate of return of 5% per year before expenses, which is not the Fund’s actual return. The hypothetical account values and expenses may not be used to estimate the actual ending account balance or expenses you paid for the period. You may use this information to compare the ongoing costs of investing in the Fund and other funds. To do so, compare this 5% hypothetical example with the 5% hypothetical examples that appear in the shareholder reports of other funds.
Expenses shown in the table are meant to highlight your ongoing costs only and do not reflect any transactional costs. Therefore, the second line of the table below is useful in comparing ongoing costs only and will not help you determine the relative total costs of owning different funds. In addition, if transaction costs were included, your costs would have been higher.
| | | | | | | | Ending | | | | | | |
| | | | | Beginning | | | Account | | | Expenses | | | |
| | | | | Account | | | Value | | | Paid | | | Annualized |
| | | | | Value | | | October 31, | | | During | | | Expense |
| | | | | May 1, 2022 | | | 2022 | | | Period(a) | | | Ratio |
| Foundry Partners Fundamental Small Cap Value Fund |
| Investor Class | | Actual | | $ | 1,000.00 | | | $ | 1,047.20 | | | $ | 6.60 | | | 1.28% |
| | | Hypothetical(b) | | $ | 1,000.00 | | | $ | 1,018.75 | | | $ | 6.51 | | | 1.28% |
| | | | | | | | | | | | | | | | | |
| Institutional Class | | Actual | | $ | 1,000.00 | | | $ | 1,048.40 | | | $ | 5.32 | | | 1.03% |
| | | Hypothetical(b) | | $ | 1,000.00 | | | $ | 1,020.01 | | | $ | 5.24 | | | 1.03% |
| (a) | Expenses are equal to the Fund’s annualized expense ratios, multiplied by the average account value over the period, multiplied by 184/365 (to reflect the one-half year period). |
| (b) | Hypothetical assumes 5% annual return before expenses. |
| Additional Federal Income Tax Information (Unaudited) |
The Form 1099-DIV you receive in January 2023 will show the tax status of all distributions paid to your account in calendar year 2022. Shareholders are advised to consult their own tax adviser with respect to the tax consequences of their investment in the Fund. As required by the Internal Revenue Code and/or regulations, shareholders must be notified regarding the status of qualified dividend income for individuals and the dividends received deduction for corporations.
Qualified Dividend Income. The Fund designates approximately 15% or up to the maximum amount of such dividends allowable pursuant to the Internal Revenue Code, as qualified dividend income eligible for a reduced tax rate.
Qualified Business Income. The Fund designates approximately 0% of its ordinary income dividends, or up to the maximum amount of such dividends allowable pursuant to the Internal Revenue Code, as qualified business income.
Dividends Received Deduction. Corporate shareholders are generally entitled to take the dividends received deduction on the portion of the Fund’s dividend distribution that qualifies under tax law. For the Fund’s calendar year 2022 ordinary income dividends, 15% qualifies for the corporate dividends received deduction.
For the year ended October 31, 2022, the Fund designated $6,345,047 as long-term capital gain distributions.
| Trustees and Officers (Unaudited) |
The Board of Trustees supervises the business activities of the Trust. Each Trustee serves as a trustee until termination of the Trust unless the Trustee dies, resigns, retires or is removed.
The following table provides information regarding each of the Independent Trustees.
Name, Address*, (Age),
Position with Trust**,
Term of Position with Trust | Principal Occupation During
Past 5 Years and Other
Directorships | Other Directorships |
Andrea N. Mullins, 55
Independent Trustee
Since December 2013
Chairperson since
March 2017 | Current: Private investor; Independent Contractor, SWM Advisors (since April 2014). | Trustee, Angel Oak Funds Trust (since February 2019) (5 portfolios); Trustee, Angel Oak Strategic Credit Fund (since February 2019); Trustee, Angel Oak Financial Strategies Income Term Trust (since May 2019); Trustee, Angel Oak Credit Opportunities Term Trust (since January 2021); Trustee and Audit Committee Chair, Cushing Mutual Funds Trust (since November 2021) (2 portfolios); Trustee and Audit Committee Chair, Cushing MLP & Infrastructure Total Return Fund (since November 2021); Trustee and Audit Committee Chair, NXG NextGen Infrastructure Income Fund (since November 2021). |
| Trustees and Officers (Unaudited) (continued) |
Name, Address*, (Age),
Position with Trust**, Term
of Position with Trust | Principal Occupation During
Past 5 Years and Other
Directorships | Other Directorships |
Ira P. Cohen, 63
Independent Trustee
Since June 2010 | Current: Independent financial services consultant (since February 2005); Executive Vice President of Asset Management Services, Recognos Financial (since August 2015). | Trustee and Audit Committee Chairman, Apollo Diversified Real Estate Fund (since March 2022); Trustee, Chairman and Nominating and Governance Committee Chairman, Angel Oak Funds Trust (since October 2014) (5 portfolios); Trustee, Chairman, and Nominating and Governance Committee Chairman, Angel Oak Strategic Credit Fund (since December 2017); Trustee, Chairman, and Nominating and Governance Committee Chairman, Angel Oak Financial Strategies Income Term Trust (since May 2019); Trustee, Chairman, and Nominating and Governance Committee Chairman, Angel Oak Credit Opportunities Term Trust (since January 2021); Trustee and Nominating and Governance Committee Chairman, U.S. Fixed Income Trust (since March 2019). |
| * | The address for each Trustee is 225 Pictoria Drive, Suite 450, Cincinnati, Ohio 45246. |
| ** | As of the date of this report, the Trust consists of 16 series. |
The following table provides information regarding the Trustee who is considered an “interested person” of the Trust, as that term is defined under the 1940 Act.
Name, Address*, (Age),
Position with Trust**,
Term of Position with Trust | Principal Occupation During
Past 5 Years and Other
Directorships | Other Directorships |
Mark J. Seger***, 60
Trustee Since March 2017 | Current: Vice Chairman and Co-Founder, Ultimus Fund Solutions, LLC and its subsidiaries (since 1999). | None. |
| * | The address for each Trustee is 225 Pictoria Drive, Suite 450, Cincinnati, Ohio 45246. |
| ** | As of the date of this report, the Trust consists of 16 series. |
| *** | Mr. Seger is considered an “interested person” of the Trust because of his relationship with the Trust’s administrator, transfer agent, and distributor. |
| Trustees and Officers (Unaudited) (continued) |
The following table provides information regarding the Officers of the Trust:
Name, Address*, (Age),
Position with Trust**,
Term of Position with Trust | Principal Occupation During
Past 5 Years | Other Directorships |
Matthew J. Miller, 46
Principal Executive Officer
and President Since March
2022
Vice President
From December 2011 to
March 2022 | Current: Vice President, Ultimus Fund Solutions, LLC (since December 2015). | None. |
N. Lynn Bowley, 64
Chief Compliance Officer
Since April 2022 | Current: Senior Vice President, Senior Compliance Officer, Northern Lights Compliance Services, LLC (since January 2007). | None. |
Carol J. Highsmith, 58
Vice President Since August
2008
Secretary Since March 2014 | Current: Vice President, Ultimus Fund Solutions, LLC (since December 2015). | None. |
Zachary P. Richmond, 42
Principal Financial Officer
and Treasurer Since
September 2021 | Current: Vice President, Financial Administration, Ultimus Fund Solutions, LLC (since February 2019). Previous: Assistant Vice President, Associate Director of Financial Administration, Ultimus Fund Solutions, LLC (December 2015 to February 2019). | None. |
| Trustees and Officers (Unaudited) (continued) |
Name, Address*, (Age),
Position with Trust**, Term
of Position with Trust | Principal Occupation During
Past 5 Years and Other
Directorships | Other Directorships |
Stephen L. Preston, 56
AML Officer Since June
2017 | Current: Chief Compliance Officer of Ultimus Fund Distributors, LLC (since June 2011), Vice President, Financial Operations Principal, and Anti- Money Laundering Officer, Ultimus Fund Distributors, LLC (since April 2021), Treasurer, Financial Operations Principal, Chief Compliance Officer, and Anti-Money Laundering Officer, Northern Lights Distributors, LLC (since April 2021). Previous: Chief Compliance Officer, Ultimus Fund Solutions, LLC (June 2011 to August 2019); Chief Compliance Officer, Unified Financial Securities, LLC (April 2018 to December 2019) | None. |
| * | The address for each Officer is 225 Pictoria Drive, Suite 450, Cincinnati, Ohio 45246. |
| ** | As of the date of this report, the Trust consists of 16 series. |
| Other Information (Unaudited) |
The Fund’s Statement of Additional Information (“SAI”) includes additional information about the trustees and is available without charge, upon request. You may call toll-free at (800) 247-1014 to request a copy of the SAI or to make shareholder inquiries.
| Investment Advisory Agreement Approval (Unaudited) |
At a meeting held on June 1-2, 2022, the Board of Trustees (the “Board”) considered the renewal of the Investment Advisory Agreement (the “Foundry Agreement”) between Valued Advisers Trust (the “Trust”) and Foundry Partners, LLC (“Foundry”) with respect to the Foundry Partners Fundamental Small Cap Value Fund (the “Foundry Fund”). Foundry provided written information to the Board to assist the Board in its considerations.
Counsel reminded the Trustees of their fiduciary duties and responsibilities, including the factors to be considered, and the application of those factors to Foundry. In assessing the factors and reaching its decision, the Board took into consideration information furnished by Foundry and the Trust’s other service providers for the Board’s review and consideration throughout the year at regular Board meetings, as well as information specifically prepared or presented in connection with the annual renewal process, including information presented at the meeting. The Board requested and was provided with, and reflected on, information and reports relevant to the annual renewal of the Foundry Agreement, including: (i) reports regarding the services and support provided to the Foundry Fund by Foundry; (ii) quarterly assessments of the investment performance of the Foundry Fund by personnel of Foundry; (iii) commentary on the reasons for the performance; (iv) presentations by Foundry addressing its investment philosophy, investment strategy, personnel, and operations; (v) compliance and audit reports concerning the Foundry Fund and Foundry; (vi) disclosure information contained in the Trust’s registration statement and Foundry’s Form ADV; and (vii) a memorandum from counsel, that summarized the fiduciary duties and responsibilities of the Board in considering and approving the Foundry Agreement. The Board also requested and received various informational materials including, without limitation: (a) documents containing information about Foundry, including its financial information; a description of its personnel and services it provides to the Foundry Fund; information on Foundry’s investment advice and performance; summaries of Foundry Fund expenses, compliance program, current legal matters, and other general information; (b) comparative expense and performance information for other mutual funds with strategies similar to the Foundry Fund; and (c) the benefits to be realized by Foundry from its relationship with the Foundry Fund. The Board did not identify any particular information that was most relevant to its consideration of the Foundry Agreement and each Trustee may have afforded different weight to the various Factors.
1. The nature, extent, and quality of the services to be provided by Foundry. The Board considered Foundry’s responsibilities under the Foundry Agreement. The Trustees considered the services being provided by Foundry to the Foundry Fund including, without limitation: the quality of its investment advisory services (including research and recommendations with respect to portfolio securities), its process for formulating investment recommendations and assuring compliance with the Foundry Fund’s investment objectives and limitations, its coordination of services for the Foundry Fund among the Foundry Fund’s service providers, and its efforts to promote the Foundry Fund and grow its assets. The Trustees considered Foundry’s continuity of, and commitment to retain qualified personnel, commitment to maintain and enhance its resources and systems, and options that allow the Foundry Fund to maintain its goals, and Foundry’s continued cooperation with the Board and counsel for the Foundry Fund. The Trustees considered Foundry’s personnel, including their education and experience. After considering the foregoing information and further information in the Meeting materials provided by Foundry, the Board concluded that, in light of all the facts and circumstances, the nature, extent, and quality of the services provided by Foundry were satisfactory and adequate for the Foundry Fund.
| Investment Advisory Agreement Approval (Unaudited) (continued) |
2. Investment Performance of the Foundry Fund and Foundry. The Trustees compared the performance of the Foundry Fund with the performance of funds in a peer group with similar objectives managed by other investment advisers, as well as with aggregated Morningstar category data, and with the performance of the Foundry Fund’s benchmark. The Trustees also considered the consistency of Foundry’s management of the Foundry Fund with its investment objectives, strategies, and limitations. The Trustees acknowledged that Foundry has served as adviser to the Foundry Fund only since June of 2016, but one portfolio manager has managed the portfolio since 2006 and the other since 2010. The Trustees noted that the Foundry Fund had outperformed as compared to its benchmark for the one-year and since inception periods ended March 31, 2022 and had underperformed as compared to its benchmark for the three-year and five-year periods. They also noted that the Foundry Fund had underperformed as compared to the average and performed equal to the median of its custom Morningstar category for the one-year period ended March 31, 2022, had underperformed as compared to both the average and the median for the three-year, five-year, and ten-year periods, and performed below the median for the period since inception of the Foundry Fund. In comparing the Foundry Fund’s performance to that of its custom peer group, the Board noted that the Foundry Fund performed above the median for the one-year and since inception periods ended March 31, 2022, and below the median for the three-year and five-year periods. The Board reviewed the performance of Foundry in managing separate accounts with investment strategies similar to that of the Foundry Fund and observed that the Foundry Fund’s performance was very comparable. The Trustees took into consideration discussions with representatives of Foundry during the prior year regarding the reasons for the performance of the Foundry Fund. After further reviewing and discussing these and other relevant factors, the Board concluded, in light of all the facts and circumstances, that the investment performance of the Foundry Fund and Foundry was satisfactory.
3. The costs of the services to be provided and profits to be realized by Foundry from the relationship with the Foundry Fund. The Trustees considered: (1) Foundry’s financial condition;
(2) the asset level of the Foundry Fund; (3) the overall expenses of the Foundry Fund; and (4) the nature and frequency of management fee payments. The Trustees reviewed information provided by Foundry regarding its profits associated with managing the Foundry Fund, noting that Foundry is not currently waiving any of its management fee. The Trustees also considered potential benefits for Foundry in managing the Foundry Fund. The Trustees then compared the fees and expenses of the Foundry Fund (including the management fee) to other comparable mutual funds. The Trustees noted that the Foundry Fund’s management fee was higher than the average and equal to the median of its peer group, and that the net expense ratio was higher than the peer group average and median. They noted that the Foundry Fund’s management fee was higher than the average and median of funds in its custom Morningstar category, and that the Foundry Fund’s net expense ratio was also higher than the average and median. The Board noted that the fees that Foundry assesses for separate account clients that have strategies similar to that of the Foundry Fund could be comparable, higher, or lower and they expressed the view that the reasons for such differences were acceptable and reasonable. Based on the foregoing, the Board concluded that the fees to be paid to Foundry by the Foundry Fund and the profits to be realized by Foundry, in light of all the facts and circumstances, were fair and reasonable in relation to the nature and quality of the services provided by Foundry.
4. The extent to which economies of scale would be realized as the Foundry Fund grows and whether advisory fee levels reflect these economies of scale for the benefit of the Foundry Fund’s
| Investment Advisory Agreement Approval (Unaudited) (continued) |
investors. The Board considered the Foundry Fund’s fee arrangements with Foundry. The Board considered that while the management fee remained the same at all asset levels, the Foundry Fund’s shareholders could experience benefits from the Foundry Fund’s expense limitation arrangement if asset levels fell and/or expenses increased. The Trustees noted that although the Foundry Fund’s expenses currently fell below the cap set by the arrangement, the shareholders would continue to benefit from economies of scale under the Foundry Fund’s arrangements with other service providers to the Foundry Fund, and the Trustees attributed this benefit, in part, to the direct and indirect efforts of Foundry to ensure that a cost structure was in place that was beneficial for the Foundry Fund as it grew. In light of its ongoing consideration of the Foundry Fund’s asset and fees levels and expectations for growth, the Board determined that the Foundry Fund’s fee arrangements, in light of all the facts and circumstances, were fair and reasonable in relation to the nature and quality of the services provided by Foundry.
5. Possible conflicts of interest and benefits to Foundry. In considering Foundry’s practices regarding conflicts of interest, the Trustees evaluated the potential for conflicts of interest and considered such matters as the experience and ability of the advisory personnel assigned to the Foundry Fund; the basis of decisions to buy or sell securities for the Foundry Fund and/or Foundry’s other accounts; and the substance and administration of Foundry’s code of ethics. The Trustees also considered disclosure in the registration statement of the Trust relating to Foundry’s potential conflicts of interest. The Trustees noted that Foundry may utilize soft dollars and the Trustees noted Foundry’s policies and processes for managing the conflicts of interest that could arise from soft dollar arrangements. The Trustees noted other potential benefits to Foundry, including the fact that the Foundry Fund could provide an attractive vehicle for smaller accounts, which may increase the total assets under management by Foundry. Based on the foregoing, the Board determined that the standards and practices of Foundry relating to the identification and mitigation of potential conflicts of interest and the benefits to be realized by Foundry in managing the Foundry Fund were satisfactory.
After additional consideration of the factors discussed by counsel and further discussion among the Board members, the Board determined to approve the continuation of the Foundry Agreement.
| FACTS | WHAT DOES FOUNDRY PARTNERS FUNDAMENTAL SMALL CAP VALUE FUND (THE “FUND”) DO WITH YOUR PERSONAL INFORMATION? |
| |
| Why? | Financial companies choose how they share your personal information. Federal law gives consumers the right to limit some but not all sharing. Federal law also requires us to tell you how we collect, share, and protect your personal information. Please read this notice carefully to understand what we do. |
| |
| What? | The types of personal information we collect and share depend on the product or service you have with us. This information can include: ■ Social Security number ■ account balances and account transactions ■ transaction or loss history and purchase history ■ checking account information and wire transfer instructions When you are no longer our customer, we continue to share your information as described in this notice. |
| |
| How? | All financial companies need to share customers’ personal information to run their everyday business. In the section below, we list the reasons financial companies can share their customers’ personal information; the reasons the Funds choose to share; and whether you can limit this sharing. |
| |
| Reasons we can share your personal information | Does the Fund share? |
For our everyday business purposes — such as to process your transactions, maintain your account(s), respond to court orders and legal investigations, or report to credit bureaus | Yes |
For our marketing purposes — to offer our products and services to you | No |
| For joint marketing with other financial companies | No |
For our affiliates’ everyday business purposes – information about your transactions and experiences | No |
For our affiliates’ everyday business purposes – information about your creditworthiness | No |
| For nonaffiliates to market to you | No |
| | | |
| Questions? | Call (800) 247-1014 |
| Who we are |
| Who is providing this notice? | Foundry Partners Fundamental Small Cap Value Fund Ultimus Fund Distributors, LLC (Distributor) Ultimus Fund Solutions, LLC (Administrator) |
| What we do |
How does the Fund protect my
personal information? | To protect your personal information from unauthorized access and use, we use security measures that comply with federal law. These measures include computer safeguards and secured files and buildings. Our service providers are held accountable for adhering to strict policies and procedures to prevent any misuse of your nonpublic personal information. |
How does the Fund collect my
personal information? | We collect your personal information, for example, when you ■ open an account or deposit money ■ buy securities from us or sell securities to us ■ make deposits or withdrawals from your account ■ give us your account information ■ make a wire transfer ■ tell us who receives the money ■ tell us where to send the money ■ show your government-issued ID ■ show your driver’s license |
| Why can’t I limit all sharing? | Federal law gives you the right to limit only ■ sharing for affiliates’ everyday business purposes — information about your creditworthiness ■ affiliates from using your information to market to you ■ sharing for nonaffiliates to market to you State laws and individual companies may give you additional rights to limit sharing. |
| Definitions |
| Affiliates | Companies related by common ownership or control. They can be financial and nonfinancial companies. ■ Foundry Partners, LLC., the investment adviser to the Fund, could be deemed to be an affiliate. |
| Nonaffiliates | Companies not related by common ownership or control. They can be financial and nonfinancial companies. ■ The Fund does not share your personal information with nonaffiliates so they can market to you |
| Joint marketing | A formal agreement between nonaffiliated financial companies that together market financial products or services to you. ■ The Fund does not jointly market. |
Proxy Voting
A description of the policies and procedures that the Fund uses to determine how to vote proxies relating to portfolio securities and information regarding how the Fund voted those proxies during the most recent twelve month period ended June 30, are available (1) without charge upon request by calling the Fund at (800) 247-1014 and (2) in Fund documents filed with the SEC on the SEC’s website at www.sec.gov.
TRUSTEES
Andrea N. Mullins, Chairperson
Ira P. Cohen
Mark J. Seger | INDEPENDENT REGISTERED PUBLIC ACCOUNTING FIRM
Cohen & Company, Ltd.
1350 Euclid Avenue, Suite 800
Cleveland, OH 44115 |
| | |
| | |
OFFICERS
Matthew J. Miller, Principal Executive Officer and
President
Zachary P. Richmond, Principal Financial Officer and
Treasurer
N. Lynn Bowley, Chief Compliance Officer
Carol J. Highsmith, Vice President and Secretary | LEGAL COUNSEL
Troutman Pepper Hamilton Sanders LLP
3000 Two Logan Square
18th and Arch Streets
Philadelphia, PA 19103 |
| | |
| | |
INVESTMENT ADVISER
Foundry Partners, LLC
323 Washington Avenue North, Suite 360
Minneapolis, MN 55401 | CUSTODIAN
Huntington National Bank
41 South High Street
Columbus, OH 43215 |
| | |
| | |
DISTRIBUTOR
Ultimus Fund Distributors, LLC
225 Pictoria Drive, Suite 450
Cincinnati, OH 45246 | ADMINISTRATOR, TRANSFER AGENT AND FUND ACCOUNTANT
Ultimus Fund Solutions, LLC
225 Pictoria Drive, Suite 450
Cincinnati, OH 45246 |
This report is intended only for the information of shareholders or those who have received the Fund’s prospectus which contains information about the Fund’s management fee and expenses. Please read the prospectus carefully before investing.
Distributed by Ultimus Fund Distributors, LLC Member FINRA/SIPC
Foundry-AR-22

Annual Report
October 31, 2022
Fund Adviser:
Kovitz Investment Group Partners, LLC
71 S. Wacker Drive, Suite 1860
Chicago, IL 60606
Toll Free (888) 695-3729
Green Owl Intrinsic Value Fund
Management’s discussion of Fund performance (Unaudited)
October 31, 2022
Kovitz Investment Group launched the Green Owl Intrinsic Value Fund (the Fund) with the investment objective to seek long-term capital appreciation through high risk-adjusted returns. To accomplish this, Fund management implements a fundamental, research-driven process, to build a diversified portfolio of equity investments through the purchase of what we consider to be competitively advantaged and financially strong companies at prices substantially less than our estimate of their intrinsic values.
We remain focused on the careful and patient application of our investment criteria and valuation requirements. Our bottom-up research emphasizes business quality, industry structures, growth opportunities, management skill and corporate culture. It is further augmented by our assessment of the company’s ability to sustain earnings power over the long haul through an understanding of its competitive advantages and management’s proficiency in the allocation of capital. We use absolute, rather than relative, methods to estimate companies’ intrinsic values and we use the movement of market prices around these intrinsic value estimates to construct and manage a portfolio of high-quality businesses that have the potential to create sustained shareholder value over many years.
MARKET AND PERFORMANCE SUMMARY
For the fiscal year 2022 (November 1, 2021 through October 31, 2022), the Fund declined 20.01%. In comparison, the Fund’s benchmark, the S&P 500® Index, lost 14.61% during the same period. Since inception on December 28, 2011, the Fund has compounded at a rate of 10.42% annually, versus 13.03% annually for the S&P 500® Index over the same time period.
Clearly, Fiscal 2022 has been a highly volatile year in the capital markets. Elevated levels of global inflation have forced central banks around the world to increase benchmark interest rates at a rapid pace. The volatility has been a product of the uncertainty associated with how high central banks, particularly the Federal Reserve (the “Fed”) in the U.S., will need to increase interest rates to bring the pace of rising prices back to mandated levels. Investors detest uncertainty oftentimes more than bad news itself. One can price news while pricing uncertainty requires imagination. Imaginations have been running wild as to how far these rate increases may go and how that may negatively impact the economy and, in turn, company earnings.
In Wall Street parlance, volatility is a proxy for risk. However, your Fund’s managers believe this definition is misguided. To us volatility is nothing more than a function of how often investors change their mind. Real risk is about losing capital that can’t be earned back. For example, investing in a company with a lousy balance sheet is a risk.
Green Owl Intrinsic Value Fund
Management’s discussion of Fund performance (Unaudited) (continued)
October 31, 2022
Deteriorating fundamentals may leave the company unable to service its debt, which could lead to a bankruptcy filing, permanently impairing its equity investors’ capital. This money is permanently gone. Mark-to-market losses due to worsening sentiment are more likely to be temporary reflections of the market’s fickle relationship between price and value than permanent impairments of capital. This is particularly true if these short-term losses are in financially strong and competitively advantaged companies like the kind we tend to focus on.
As inflation readings surged during the first half of the year, equities performed dreadfully. The feeling among equity investors was that interest rates need to go much higher to fight the highest inflation in 40 years; investor sentiment was horrible.
By mid-2022, however, inflation readings appeared to be topping and investors suddenly seemed less fearful that interest rates would need to rise quite as much as previously thought. Sentiment flipped and stocks rose forcefully off the lows.
Fearing that an equity market rally could blunt the effect of its rate increases, the Fed officials pushed back on the notion of an interest rate pause any time soon. Chair Jerome Powell’s August Jackson Hole speech sent a clear message to investors doubting the Fed’s resolve to fight inflation: rates were likely to move higher and remain there for longer even if it resulted in economic pain. Stocks slumped again. However, there was another brief rally, but those gains quickly evaporated when the August Consumer Price Index data came in hotter than expected. The Fed continued its large rate increases at its next meeting and signaled a strong resolve to continue to do whatever it takes to bring inflation back to its 2% target. The market fell back to and beyond its June lows as investors feared an unrelenting global tightening cycle.
If one were trying to trade this market by predicting its ups and downs, they’re likely suffering whiplash about now. Company intrinsic values change at a glacial pace even if manic investors try to price them by the second. It’s why we believe it’s so important to ignore the vagaries of market psychology and focus almost exclusively on long-term, company-specific fundamentals. Macroeconomic and geopolitical concerns only serve to deflect attention from what’s important for long run investment success: owning businesses that possess durable competitive advantages that allow them to steadily grow intrinsic value over time and buying these businesses with a margin of safety. We have more confidence in our ability to value businesses than to predict the direction of the economy or the shifting tides of the crowd. As Warren Buffett once quipped, “Why scrap an informed decision for an uninformed one?”
Green Owl Intrinsic Value Fund
Management’s discussion of Fund performance (Unaudited) (continued)
October 31, 2022
Our general approach to investing is to seek to find extremely durable, well-capitalized, companies that can survive any storm. The goal is simply to make solid decisions based on justifiable premises and valid logic to assemble a portfolio of high-quality companies. Then we hold onto those companies so that their inherent ability to compound in value will be the primary determinant of how we perform in the long run.
While a recession is a likely outcome in the near-term, stock prices may have already discounted the worst of any economic decline. We cannot say with certainty whether the final low of this bear market has yet been seen, but we are also of the belief that the stock market is likely to be significantly higher in several years’ time. These statements may seem at odds with each other, but two opposing things can be true at the same time. It’s a matter of time and perspective.
In the world of investing, perception generally swings from ‘flawless’ to ‘hopeless.’ Currently, we are smack in the hopeless phase. Unfortunately, most humans are hard-wired to extrapolate current conditions endlessly into the future. All that market participants can see right now is the darkness in front of them. But market bottoms do not necessarily form when the light is visible, but when it’s only slightly less dark.
We, however, attempt to approach all the current doom and gloom with a sense of measured confidence borne from our investment experience. Ultimately, stock prices converge to business values, and we think it’s very unlikely that today’s prices for most securities reflect the underlying values of the businesses they represent. Volatility may linger as the Fed continues its tightening policy, but today’s markets are creating opportunities for active and thoughtful managers.
As Seth Klarman, legendary investor and CEO at the Baupost Group, once wrote; “Most investors take comfort from calm, steadily rising markets; roiling markets can drive investor panic. But these conventional reactions are inverted. When all feels calm and prices surge, the markets may feel safe; but, in fact, they are dangerous because few investors are focusing on risk. When one feels in the pit of one’s stomach the fear that accompanies plunging market prices, risk-taking becomes considerably less risky, because risk is often priced into an asset’s lower market valuation. Investment success requires standing apart from the frenzy – the short-term, relative performance game played by most investors.”
Green Owl Intrinsic Value Fund
Management’s discussion of Fund performance (Unaudited) (continued)
October 31, 2022
PORTFOLIO ACTIVITY
As long-term shareholders, we care a lot about business quality and structural competitive advantages that are evidenced by a historic track record of healthy profitability and robust capital returns. Our portfolio actions are guided simply by initiating or adding to positions whose intrinsic value growth has outpaced their stock price movement and taking money off the table in names that have moved materially closer to fair value or where a thesis change has lowered our fair value estimate.
We continue to utilize a valuation framework that focuses on the long-term fundamentals and minimizing the odds of a permanent loss of capital. We use market, or single stock, volatility to upgrade both the quality of the portfolio and the expected return profile.
Based on these standards, we took the following portfolio actions during the Fund’s fiscal year.
INITIATED POSITIONS in the following companies: Analog Devices (ADI), Hayward (HAYW), Intercontinental Exchange (ICE), Jacobs Solutions (J), PACCAR (PCAR), and Spotify (SPOT).
INCREASED POSITIONS in the following companies: Amazon (AMZN), Autodesk (ADSK), Charter (CHTR), CarMax (KMX), Dollar Tree (DLTR), JPMorgan (JPM), Motorola Solutions (MSI), and Walt Disney (DIS).
EXITED POSITIONS in the following companies: Booking Holdings (BKNG), Citigroup (C), Covetrus (CVET), Lockheed Martin (LMT), and Northern Trust (NTRS).
DECREASED POSITIONS in the following companies: American Express (AXP), Aon (AON), Arista, Berkshire Hathaway (BRK.B), Blackstone (BX), and Quanta (PWR).
THE FUND’S TEN LARGEST POSITIONS as of October 31, 2022, were Alphabet (GOOG/GOOGL), Motorola Solutions, Charles Schwab (SCHW), Apple (AAPL), Berkshire Hathaway, Visa (V), JPMorgan, Philip Morris (PM), Becton Dickinson (BDX), and Dollar Tree.
PERFORMANCE ATTRIBUTION
Key Contributors to Results
The individual positions that contributed the most to performance during the year were: Dollar Tree, Arista Networks (ANET), Lockheed Martin, PACCAR, and Philip Morris.
Green Owl Intrinsic Value Fund
Management’s discussion of Fund performance (Unaudited) (continued)
October 31, 2022
On a sector basis, the largest contributors to relative results were the Fund’s security selection in the Information Technology and Industrial sectors. Security selection in the Financial sector also contributed.
Key Detractors to Results
The individual positions that detracted the most from performance during the year were: Meta Platforms (META), Alphabet, Amazon, Salesforce (CRM), and Charter.
On a sector basis, the Fund’s largest detractors were security selection and overweight stance in Communication Services and the Fund’s lack of exposure to Energy, the year’s best performing sector.
Thank you for your continued support and trust in our ability to manage your investment in the Fund.
Investment Results (Unaudited)
Average Annual Total Returns(a)
as of October 31, 2022
| | One Year | | Five Year | | Ten Year |
| Green Owl Intrinsic Value Fund | (20.01)% | | 6.36% | | 9.65% |
| S&P 500® Index(b) | (14.61)% | | 10.44% | | 12.79% |
Total annual operating expenses, as disclosed in the Green Owl Intrinsic Value Fund (the “Fund”) prospectus dated February 28, 2022, were 1.28% of average daily net assets (1.10% after fee waivers/ expense reimbursements by Kovitz Investment Group Partners, LLC (the “Adviser”)). The Adviser has agreed to waive its fees and/or reimburse other expenses of the Fund until February 28, 2023, so that Total Annual Fund Operating Expenses do not exceed 1.10%. This operating expense limitation does not apply to interest, taxes, brokerage commissions, other expenditures which are capitalized in accordance with generally accepted accounting principles, other extraordinary expenses not incurred in the ordinary course of the Fund’s business, dividend expense on short sales, expenses incurred under a Rule 12b-1 plan of distribution, “acquired fund fees and expenses,” and expenses that the Fund has incurred but did not actually pay because of an expense offset arrangement. Each waiver and/or reimbursement of an expense is subject to repayment by the Fund within the three years following the date the particular expense payment occurred, provided that the Fund is able to make the repayment without exceeding the expense limitation in place at the time of the waiver or reimbursement and the expense limitation in place at the time of the repayment. This agreement may only be terminated by mutual consent of the Adviser and the Board of Trustees. Additional information pertaining to the Fund’s expense ratios as of October 31, 2022 can be found in the financial highlights.
The performance quoted represents past performance, which does not guarantee future results. The investment return and principal value of an investment will fluctuate so that an investor’s shares, when redeemed, may be worth more or less than their original cost. The returns shown do not reflect deduction of taxes that a shareholder would pay on Fund distributions or the redemption of Fund shares. The Fund’s investment objectives, risks, charges and expenses must be considered carefully before investing. Current performance of the Fund may be lower or higher than the performance quoted. Performance data current to the most recent month end may be obtained by calling (888) 695-3729.
(a) Return figures reflect any change in price per share and assume the reinvestment of all distributions. The Fund’s returns reflect any fee reductions during the applicable periods. If such fee reductions had not occurred, the quoted performance would have been lower. Total returns for periods less than one year are not annualized.
(b) The S&P 500® Index (the “Index”) is an unmanaged index generally representing the performance of the broad domestic economy through changes in the aggregate market value of 500 stocks representing all major industries. Individuals cannot invest directly in the Index; however, an individual may invest in exchange-traded funds or other investment vehicles that attempt to track the performance of a benchmark index.
The Fund’s investment objectives, strategies, risks, charges and expenses must be considered carefully before investing. The prospectus contains this and other important information about the Fund and may be obtained by calling the same number as above. Please read it carefully before investing.
The Fund is distributed by Ultimus Fund Distributors, LLC, Member FINRA/SIPC.
Investment Results (Unaudited) (continued)
Comparison of the Growth of a $10,000 Investment in the Green Owl Intrinsic Value Fund and the S&P 500® Index.
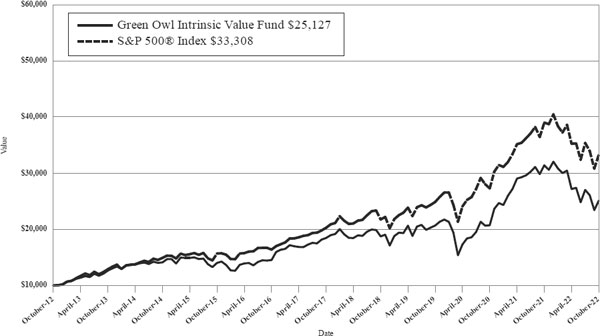
The Fund commenced operations on December 22, 2011. However, the Fund did not invest in long-term securities towards the investment objective until December 27, 2011. December 27, 2011 is the performance calculation inception date. The chart above assumes an initial investment of $10,000 made on October 31, 2012 and held through October 31, 2022. The S&P 500® Index is a widely recognized unmanaged index of equity securities and is representative of a broader domestic equity market and range of securities than is found in the Fund’s portfolio. Individuals cannot invest directly in the Index; however, an individual can invest in exchange traded funds or other investment vehicles that attempt to track the performance of a benchmark index. THE FUND’S RETURN REPRESENTS PAST PERFORMANCE AND DOES NOT GUARANTEE FUTURE RESULTS. The returns shown do not reflect deduction of taxes that a shareholder would pay on Fund distributions or the redemption of Fund shares. Investment returns and principal values will fluctuate so that your shares, when redeemed, may be worth more or less than their original purchase price.
Current performance may be lower or higher than the performance data quoted. For more information on the Fund, and to obtain performance data current to the most recent month end or to request a prospectus, please call (888) 695-3729. You should carefully consider the investment objectives, potential risks, management fees, and charges and expenses of the Fund before investing. The Fund’s prospectus contains this and other information about the Fund, and should be read carefully before investing.
The Fund is distributed by Ultimus Fund Distributors, LLC, Member FINRA/SIPC.
Fund Holdings (Unaudited)
Green Owl Intrinsic Value Fund Holdings as of October 31, 2022*
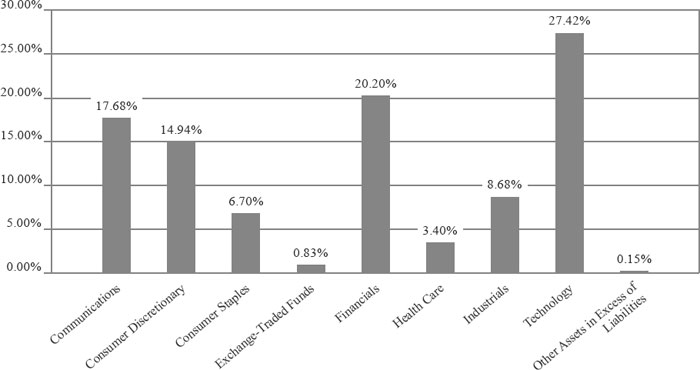
| * | As a percentage of net assets. |
The investment objective of the Green Owl Intrinsic Value Fund is long-term capital appreciation.
Availability of Portfolio Schedule (Unaudited)
The Fund files its complete schedule of portfolio holdings with the Securities and Exchange Commission (“SEC”) for the first and third quarters of each fiscal year as an exhibit to its reports on Form N-PORT. The Fund’s Form N-PORT reports are available on the SEC’s website at http://www. sec.gov and on the Fund’s website at http://greenowlfund.com.
| Green Owl Intrinsic Value |
| Fund Schedule of Investments |
| October 31, 2022 |
| COMMON STOCKS — 99.02% | | Shares | | | Fair Value | |
| Communications — 17.68% | | | | | | | | |
| Alphabet, Inc., Class A(a) | | | 5,740 | | | $ | 542,487 | |
| Alphabet, Inc., Class C(a) | | | 42,400 | | | | 4,013,584 | |
| Charter Communications, Inc., Class A(a) | | | 2,751 | | | | 1,011,323 | |
| Comcast Corp., Class A | | | 25,000 | | | | 793,500 | |
| Expedia Group, Inc.(a) | | | 7,000 | | | | 654,290 | |
| GoDaddy, Inc., Class A(a) | | | 22,610 | | | | 1,817,844 | |
| Meta Platforms, Inc., Class A(a) | | | 17,402 | | | | 1,621,170 | |
| Spotify Technology SA(a) | | | 8,027 | | | | 646,816 | |
| Walt Disney Co. (The)(a) | | | 22,880 | | | | 2,437,635 | |
| | | | | | | | 13,538,649 | |
| Consumer Discretionary — 14.94% | | | | | | | | |
| Amazon.com, Inc.(a) | | | 16,100 | | | | 1,649,284 | |
| CarMax, Inc.(a) | | | 22,543 | | | | 1,420,434 | |
| General Motors Co. | | | 50,964 | | | | 2,000,337 | |
| Gildan Activewear, Inc. | | | 61,698 | | | | 1,946,572 | |
| Hasbro, Inc. | | | 23,505 | | | | 1,533,701 | |
| Las Vegas Sands Corp.(a) | | | 41,479 | | | | 1,576,617 | |
| Lowe’s Cos, Inc. | | | 6,730 | | | | 1,312,014 | |
| | | | | | | | 11,438,959 | |
| Consumer Staples — 6.70% | | | | | | | | |
| Dollar Tree, Inc.(a) | | | 15,769 | | | | 2,499,387 | |
| Philip Morris International, Inc. | | | 28,621 | | | | 2,628,838 | |
| | | | | | | | 5,128,225 | |
| Financials — 20.20% | | | | | | | | |
| American Express Co. | | | 10,241 | | | | 1,520,276 | |
| Aon PLC, Class A | | | 5,222 | | | | 1,469,941 | |
| Berkshire Hathaway, Inc., Class B(a) | | | 9,854 | | | | 2,907,817 | |
| Blackstone Group L.P. (The), Class A(b) | | | 17,589 | | | | 1,603,061 | |
| Charles Schwab Corp. (The) | | | 42,912 | | | | 3,418,799 | |
| Intercontinental Exchange, Inc. | | | 19,980 | | | | 1,909,489 | |
| JPMorgan Chase & Co. | | | 20,993 | | | | 2,642,599 | |
| | | | | | | | 15,471,982 | |
| Health Care — 3.40% | | | | | | | | |
| Becton, Dickinson and Co. | | | 11,038 | | | | 2,604,637 | |
| | | | | | | | | |
| Industrials — 8.68% | | | | | | | | |
| Hayward Holdings, Inc.(a) | | | 41,611 | | | | 384,902 | |
| Jacobs Solutions, Inc. | | | 16,858 | | | | 1,942,379 | |
| Keysight Technologies, Inc.(a) | | | 7,050 | | | | 1,227,757 | |
| PACCAR, Inc. | | | 19,139 | | | | 1,853,229 | |
| Quanta Services, Inc. | | | 8,701 | | | | 1,235,890 | |
| | | | | | | | 6,644,157 | |
| Technology — 27.42% | | | | | | | | |
| Analog Devices, Inc. | | | 15,516 | | | | 2,212,892 | |
| Apple, Inc. | | | 21,970 | | | | 3,368,880 | |
| Arista Networks, Inc.(a) | | | 13,920 | | | | 1,682,371 | |
| Autodesk, Inc.(a) | | | 11,516 | | | | 2,467,879 | |
| Motorola Solutions, Inc. | | | 14,623 | | | | 3,651,510 | |
See accompanying notes which are an integral part of these financial statements.
| Green Owl Intrinsic Value Fund |
| Schedule of Investments (continued) |
| October 31, 2022 |
| COMMON STOCKS — 99.02% - continued | | Shares | | | Fair Value | |
| Technology — 27.42% - continued | | | | | | | | |
| Salesforce.com, Inc.(a) | | | 15,215 | | | $ | 2,473,807 | |
| Splunk, Inc.(a) | | | 11,867 | | | | 986,266 | |
| SS&C Technologies Holdings, Inc. | | | 27,275 | | | | 1,402,481 | |
| Visa, Inc., Class A | | | 13,263 | | | | 2,747,563 | |
| | | | | | | | 20,993,649 | |
| Total Common Stocks (Cost $59,477,288) | | | | | | | 75,820,258 | |
| | | | | | | | | |
| EXCHANGE-TRADED FUNDS — 0.83% | | | | | | | | |
| Exchange-Traded Funds — 0.83% | | | | | | | | |
| Invesco QQQ Trust, Series 1 | | | 2,300 | | | | 639,285 | |
| Total Exchange-Traded Funds (Cost $639,241) | | | | | | | 639,285 | |
| | | | | | | | | |
| Total Investments — 99.85% (Cost $60,116,529) | | | | | | | 76,459,543 | |
| | | | | | | | | |
| Other Assets in Excess of Liabilities — 0.15% | | | | | | | 116,043 | |
| | | | | | | | | |
| NET ASSETS — 100.00% | | | | | | $ | 76,575,586 | |
| (a) | Non-income producing security. |
| (b) | Master Limited Partnership |
See accompanying notes which are an integral part of these financial statements.
| Green Owl Intrinsic Value Fund |
| Statement of Assets and Liabilities |
| October 31, 2022 |
| Assets | | | | |
| Investments in securities at fair value (cost $60,116,529) (Note 3) | | $ | 76,459,543 | |
| Receivable for fund shares sold | | | 12,202 | |
| Receivable for investments sold | | | 1,566,816 | |
| Dividends receivable | | | 48,451 | |
| Tax reclaims receivable | | | 5,902 | |
| Prepaid expenses | | | 21,923 | |
| Total Assets | | | 78,114,837 | |
| | | | | |
| Liabilities | | | | |
| Bank overdraft | | | 14,196 | |
| Payable for fund shares redeemed | | | 730 | |
| Payable for investments purchased | | | 1,433,861 | |
| Payable to Adviser (Note 4) | | | 49,835 | |
| Payable to Administrator (Note 4) | | | 11,402 | |
| Payable to trustees | | | 2,250 | |
| Other accrued expenses | | | 26,977 | |
| Total Liabilities | | | 1,539,251 | |
| Net Assets | | $ | 76,575,586 | |
| | | | | |
| Net Assets consist of: | | | | |
| Paid-in capital | | $ | 52,769,544 | |
| Accumulated earnings | | | 23,806,042 | |
| Net Assets | | $ | 76,575,586 | |
| Shares outstanding (unlimited number of shares authorized, no par value) | | | 4,317,332 | |
| Net asset value, offering and redemption price per share (Note 2) | | $ | 17.74 | |
See accompanying notes which are an integral part of these financial statements.
| Green Owl Intrinsic Value |
| Fund Statement of Operations |
| For the year ended October 31, 2022 |
| Investment Income | | | | |
| Dividend income (net of foreign taxes withheld of $10,260) | | $ | 814,232 | |
| Total investment income | | | 814,232 | |
| | | | | |
| Expenses | | | | |
| Investment Adviser fees (Note 4) | | | 882,341 | |
| Administration fees (Note 4) | | | 72,355 | |
| Fund accounting fees (Note 4) | | | 36,054 | |
| Registration expenses | | | 26,659 | |
| Transfer agent fees (Note 4) | | | 22,993 | |
| Legal fees | | | 20,530 | |
| Audit and tax preparation fees | | | 17,910 | |
| Custodian fees | | | 13,982 | |
| Trustee fees | | | 7,735 | |
| Printing and postage expenses | | | 6,441 | |
| Insurance expenses | | | 3,358 | |
| Compliance service fees (Note 4) | | | 3,000 | |
| Pricing | | | 788 | |
| Interest expense | | | 136 | |
| Miscellaneous expenses | | | 29,654 | |
| Total expenses | | | 1,143,936 | |
| Fees contractually waived by Adviser | | | (173,895 | ) |
| Net operating expenses | | | 970,041 | |
| Net investment loss | | | (155,809 | ) |
| | | | | |
| Net Realized and Change in Unrealized Gain (Loss) on Investments | | | | |
| Net realized gain on: | | | | |
| Investment securities | | | 7,554,422 | |
| Net change in unrealized depreciation on: | | | | |
| Investment securities transactions | | | (26,914,685 | ) |
| Foreign currency translations | | | (968 | ) |
| Net realized and change in unrealized loss on investments | | | (19,361,231 | ) |
| Net decrease in net assets resulting from operations | | $ | (19,517,040 | ) |
See accompanying notes which are an integral part of these financial statements.
| Green Owl Intrinsic Value Fund |
| Statements of Changes in Net Assets |
| October 31, 2022 |
| | | For the | | | For the | |
| | | Year Ended | | | Year Ended | |
| | | October 31, | | | October 31, | |
| | | 2022 | | | 2021 | |
| Increase (Decrease) in Net Assets due to: | | | | | | | | |
| Operations | | | | | | | | |
| Net investment loss | | $ | (155,809 | ) | | $ | (156,800 | ) |
| Net realized gain on investment securities transactions | | | 7,554,422 | | | | 15,891,612 | |
| Net change in unrealized appreciation (depreciation) of investment securities and foreign currency translations | | | (26,915,653 | ) | | | 21,150,339 | |
| Net increase (decrease) in net assets resulting from operations | | | (19,517,040 | ) | | | 36,885,151 | |
| | | | | | | | | |
| Distributions to Shareholders from Earnings (Note 2) | | | (15,703,324 | ) | | | (2,423,786 | ) |
| | | | | | | | | |
| Capital Transactions | | | | | | | | |
| Proceeds from shares sold | | | 10,452,803 | | | | 8,289,840 | |
| Reinvestment of distributions | | | 15,022,739 | | | | 2,315,890 | |
| Amount paid for shares redeemed | | | (13,046,563 | ) | | | (23,364,904 | ) |
| Net increase (decrease) in net assets resulting from capital transactions | | | 12,428,979 | | | | (12,759,174 | ) |
| | | | | | | | | |
| Total Increase (Decrease) in Net Assets | | | (22,791,385 | ) | | | 21,702,191 | |
| | | | | | | | | |
| Net Assets | | | | | | | | |
| Beginning of year | | | 99,366,971 | | | | 77,664,780 | |
| End of year | | $ | 76,575,586 | | | $ | 99,366,971 | |
| | | | | | | | | |
| Share Transactions | | | | | | | | |
| Shares sold | | | 525,123 | | | | 353,135 | |
| Shares issued in reinvestment of distributions | | | 684,095 | | | | 115,047 | |
| Shares redeemed | | | (654,391 | ) | | | (1,034,060 | ) |
| Net increase (decrease) in shares outstanding | | | 554,827 | | | | (565,878 | ) |
See accompanying notes which are an integral part of these financial statements.
| Green Owl Intrinsic Value Fund |
| Financial Highlights |
| (For a share outstanding during each year) |
| | | For the Years Ended October 31, | |
| | | 2022 | | | 2021 | | | 2020 | | | 2019 | | | 2018 | |
| Selected Per Share Data | | | | | | | | | | | | | | | | | | | | |
| Net asset value, beginning of year | | $ | 26.41 | | | $ | 17.94 | | | $ | 18.81 | | | $ | 18.99 | | | $ | 19.09 | |
| Investment operations: | | | | | | | | | | | | | | | | | | | | |
| Net investment income (loss) | | | (0.04 | ) | | | (0.04 | ) | | | 0.03 | | | | 0.19 | | | | 0.05 | |
| Net realized and unrealized gain (loss) on investments | | | (4.44 | ) | | | 9.10 | | | | 0.05 | | | | 1.47 | | | | 0.24 | |
| Total from investment operations | | | (4.48 | ) | | | 9.06 | | | | 0.08 | | | | 1.66 | | | | 0.29 | |
| Less distributions to shareholders from: | | | | | | | | | | | | | | | | | | | | |
| Net investment income | | | — | | | | — | (a) | | | (0.17 | ) | | | (0.05 | ) | | | (0.04 | ) |
| Net realized gains | | | (4.19 | ) | | | (0.59 | ) | | | (0.78 | ) | | | (1.79 | ) | | | (0.35 | ) |
| Total distributions | | | (4.19 | ) | | | (0.59 | ) | | | (0.95 | ) | | | (1.84 | ) | | | (0.39 | ) |
| Net asset value, end of year | | $ | 17.74 | | | $ | 26.41 | | | $ | 17.94 | | | $ | 18.81 | | | $ | 18.99 | |
| Total Return(b) | | | (20.01 | )% | | | 51.56 | % | | | 0.23 | % | | | 10.34 | % | | | 1.50 | % |
| Ratios and Supplemental Data: | | | | | | | | | | | | | | | | | | | | |
| Net assets, end of year (000 omitted) | | $ | 76,576 | | | $ | 99,367 | | | $ | 77,665 | | | $ | 83,966 | | | $ | 78,417 | |
| Ratio of expenses to average net assets after expense waiver | | | 1.10 | % | | | 1.10 | % | | | 1.10 | % | | | 1.10 | % | | | 1.10 | % |
| Ratio of expenses to average net assets before expense waiver | | | 1.30 | % | | | 1.28 | % | | | 1.34 | % | | | 1.32 | % | | | 1.32 | % |
| Ratio of net investment income (loss) to average net assets after expense waiver | | | (0.18 | )% | | | (0.17 | )% | | | 0.15 | % | | | 1.04 | % | | | 0.26 | % |
| Portfolio turnover rate | | | 26 | % | | | 20 | % | | | 46 | % | | | 29 | % | | | 33 | % |
| (a) | Rounds to less than $0.005 per share. |
| (b) | Total return represents the rate that the investor would have earned or lost on an investment in the Fund, assuming reinvestment of distributions. |
See accompanying notes which are an integral part of these financial statements.
Green Owl Intrinsic Value Fund Notes to the Financial Statements |
| October 31, 2022 |
NOTE 1. ORGANIZATION
The Green Owl Intrinsic Value Fund (the “Fund”) is registered under the Investment Company Act of 1940, as amended (“1940 Act”), as an open-end diversified series of Valued Advisers Trust (the “Trust”). The Trust is a management investment company established under the laws of Delaware by an Agreement and Declaration of Trust dated June 13, 2008 (the “Trust Agreement”). The Trust Agreement permits the Board of Trustees (the “Board”) to issue an unlimited number of shares of beneficial interest of separate series without par value. The Fund is one of a series of funds authorized by the Board. The Fund commenced operations on December 22, 2011. The Fund’s investment adviser is Kovitz Investment Group Partners, LLC (the “Adviser”). The investment objective of the Fund is to provide long-term capital appreciation.
NOTE 2. SIGNIFICANT ACCOUNTING POLICIES
The Fund is an investment company and follows accounting and reporting guidance under Financial Accounting Standards Board Accounting Standards Codification (“ASC”) Topic 946, “Financial Services-Investment Companies”. The following is a summary of significant accounting policies followed by the Fund in the preparation of its financial statements. These policies are in conformity with generally accepted accounting principles in the United States of America (“GAAP”).
Estimates – The preparation of financial statements in conformity with GAAP requires management to make estimates and assumptions that affect the reported amounts of assets and liabilities and disclosure of contingent assets and liabilities at the date of the financial statements and the reported amounts of increases and decreases in net assets from operations during the reporting period. Actual results could differ from those estimates.
Foreign Currency Translation – The accounting records of the Fund are maintained in U.S. dollars. Foreign currency amounts are translated into U.S. dollars at the current rate of exchange each business day to determine the value of investments, and other assets and liabilities. Purchases and sales of foreign securities, and income and expenses, are translated at the prevailing rate of exchange on the respective date of these transactions. The Fund does not isolate that portion of the results of operations resulting from changes in foreign exchange rates on investments from fluctuation arising from changes in market prices of securities held. These fluctuations are included with the unrealized gain or loss from investments. Reported net realized foreign exchange gains or losses arise from sales of foreign currencies, currency gains or losses realized between the trade and settlement dates on securities transactions, and the difference between the amounts of dividends, interest, and foreign withholding taxes recorded on the Fund’s books and the U.S. dollar equivalent of the amounts actually received or paid. Net unrealized foreign exchange
| Green Owl Intrinsic Value Fund |
| Notes to the Financial Statements (continued) |
| October 31, 2022 |
gains and losses arise from changes in the fair values of assets and liabilities, other than investments in securities at period end, resulting from changes in exchange rates.
Federal Income Taxes – The Fund makes no provision for federal income or excise tax. The Fund has qualified and intends to qualify each year as a regulated investment company (“RIC”) under subchapter M of the Internal Revenue Code of 1986, as amended, by complying with the requirements applicable to RICs and by distributing substantially all of its taxable income. The Fund also intends to distribute sufficient net investment income and net realized capital gains, if any, so that it will not be subject to excise tax on undistributed income and gains. If the required amount of net investment income or gains is not distributed, the Fund could incur a tax expense.
As of and during the fiscal year ended October 31, 2022, the Fund did not have any liabilities for any unrecognized tax benefits. The Fund recognizes interest and penalties, if any, related to unrecognized tax benefits as income tax expense on the Statement of Operations when incurred. During the fiscal year ended October 31, 2022, the Fund did not incur any interest or penalties. Management of the Fund has reviewed tax positions taken in tax years that remain subject to examination by all major tax jurisdictions, including federal (i.e., the last three tax year ends and the interim tax period since then, as applicable). Management believes that there is no tax liability resulting from unrecognized tax benefits related to uncertain tax positions taken.
Expenses – Expenses incurred by the Trust that do not relate to a specific fund of the Trust are allocated to the individual funds based on each fund’s relative net assets or another appropriate basis (as determined by the Board).
Security Transactions and Related Income – The Fund follows industry practice and records security transactions on the trade date for financial reporting purposes. The specific identification method is used for determining gains or losses for financial statement and income tax purposes. Dividend income is recorded on the ex-dividend date and interest income is recorded on an accrual basis. Non-cash income, if any, is recorded at the fair market value of the securities received. Withholding taxes on foreign dividends, if any, have been provided for in accordance with the Fund’s understanding of the applicable country’s tax rules and rates.
Dividends and Distributions – The Fund intends to distribute its net investment income and net realized long-term and short-term capital gains, if any, at least annually. Dividends and distributions to shareholders, which are determined in accordance with income tax regulations, are recorded on the ex-dividend date. The treatment for financial reporting purposes of distributions made to shareholders during the period from net investment income or net realized capital gains may differ from their ultimate treatment for federal income tax purposes. These differences are caused primarily by differences in the timing
| Green Owl Intrinsic Value Fund |
| Notes to the Financial Statements (continued) |
| October 31, 2022 |
of the recognition of certain components of income, expense or realized capital gain for federal income tax purposes. Where such differences are permanent in nature, they are reclassified among the components of net assets based on their ultimate characterization for federal income tax purposes. Any such reclassifications will have no effect on net assets, results of operations or net asset value (“NAV”) per share of the Fund.
For the fiscal year ended October 31, 2022, the Fund made the following reclassifications to increase (decrease) the components of net assets:
| | | | Accumulated Earnings | |
| Paid-In Capital | | | (Deficit) | |
| $ | (7,076 | ) | | $ | 7,076 | |
Share Valuation – The NAV is calculated each day the New York Stock Exchange (the “NYSE”) is open by dividing the total value of the Fund’s assets, less liabilities, by the number of shares outstanding for the Fund.
NOTE 3. SECURITIES VALUATION AND FAIR VALUE MEASUREMENTS
The Fund values its portfolio securities at fair value as of the close of regular trading on the New York Stock Exchange (“NYSE”) (normally 4:00 p.m. Eastern time) on each business day the NYSE is open for business. Fair value is defined as the price that the Fund would receive upon selling an investment in a timely transaction to an independent buyer in the principal or most advantageous market of the investment. GAAP establishes a three-tier hierarchy to maximize the use of observable market data and minimize the use of unobservable inputs and to establish classification of fair value measurements for disclosure purposes.
Inputs refer broadly to the assumptions that market participants would use in pricing the asset or liability, including assumptions about risk (the risk inherent in a particular valuation technique used to measure fair value including a pricing model and/or the risk inherent in the inputs to the valuation technique). Inputs may be observable or unobservable. Observable inputs are inputs that reflect the assumptions market participants would use in pricing the asset or liability developed based on market data obtained and available from sources independent of the reporting entity. Unobservable inputs are inputs that reflect the reporting entity’s own assumptions about the assumptions market participants would use in pricing the asset or liability developed based on the best information available in the circumstances.
Various inputs are used in determining the value of the Fund’s investments. These inputs are summarized in the three broad levels listed below.
| ● | Level 1 – unadjusted quoted prices in active markets for identical investments and/or registered investment companies where the value per share is determined and published |
| Green Owl Intrinsic Value Fund |
| Notes to the Financial Statements (continued) |
| October 31, 2022 |
and is the basis for current transactions for identical assets or liabilities at the valuation date
| ● | Level 2 – other significant observable inputs (including, but not limited to, quoted prices for an identical security in an inactive market, quoted prices for similar securities, interest rates, prepayment speeds, credit risk, etc.) |
| ● | Level 3 – significant unobservable inputs (including the Fund’s own assumptions in determining fair value of investments based on the best information available) |
The inputs used to measure fair value may fall into different levels of the fair value hierarchy. In such cases, for disclosure purposes, the level in the fair value hierarchy which is reported is determined based on the lowest level input that is significant to the fair value measurement in its entirety.
Equity securities that are traded on any stock exchange are generally valued at the last quoted sale price on the security’s primary exchange. Lacking a last sale price, an exchange-traded security is generally valued at its last bid price. Securities traded in the NASDAQ over-the-counter market are generally valued at the NASDAQ Official Closing Price. When using the market quotations and when the market is considered active, the security is classified as a Level 1 security. In the event that market quotations are not readily available or are considered unreliable due to market or other events, securities are valued in good faith by the Adviser as “valuation designee” under the oversight of the Board. The Adviser has adopted written policies and procedures for valuing securities and other assets in circumstances where market quotes are not readily available. In the event that market quotes are not readily available, and the security or asset cannot be valued pursuant to one of the valuation methods, the value of the security or asset will be determined in good faith by the Adviser pursuant to its policies and procedures. On a quarterly basis, the Adviser’s fair valuation determinations will be reviewed by the Board. Under these policies, the securities will be classified as Level 2 or 3 within the fair value hierarchy, depending on the inputs used.
Investments in mutual funds, including money market mutual funds, are generally priced at the ending NAV. These securities are categorized as Level 1 securities.
Call and put options purchased or sold by the Fund are valued at the mean of the last bid and ask prices as provided by a pricing service. If there is no such reported ask price on the valuation date, options are valued at the most recent bid price. If there is no such reported bid price on the valuation date, options are valued at the most recent ask price. Options will generally be categorized as Level 2 securities.
In accordance with the Trust’s valuation policies, the Board or Adviser as Valuation Designee is required to consider all appropriate factors relevant to the value of securities
| Green Owl Intrinsic Value Fund |
| Notes to the Financial Statements (continued) |
| October 31, 2022 |
for which it has determined other pricing sources are not available or reliable as described above. No single method exists for determining fair value, because fair value depends upon the circumstances of each individual case. As a general principle, the current fair value of a security being valued by the Valuation Designee would be the amount that the Fund might reasonably expect to receive upon the current sale. Methods that are in accordance with this principle may, for example, be based on (i) a multiple of earnings; (ii) a discount from market prices of a similar freely traded security (including a derivative security or a basket of securities traded on other markets, exchanges or among dealers); or (iii) yield to maturity with respect to debt issues, or a combination of these and other methods. Fair-value pricing is permitted if, in the Valuation Designee’s opinion, the validity of market quotations appears to be questionable based on factors such as evidence of a thin market in the security based on a small number of quotations, a significant event occurs after the close of a market but before the Fund’s NAV calculation that may affect a security’s value, or the Valuation Designee is aware of any other data that calls into question the reliability of market quotations.
The following is a summary of the inputs used to value the Fund’s investments as of October 31, 2022:
| | | Valuation Inputs | | | | |
| Assets | | Level 1 | | | Level 2 | | | Level 3 | | | Total | |
| Common Stocks (a) | | $ | 75,820,258 | | | $ | — | | | $ | — | | | $ | 75,820,258 | |
| Exchange-Traded Funds | | | 639,285 | | | | — | | | | — | | | | 639,285 | |
| Total | | $ | 76,459,543 | | | $ | — | | | $ | — | | | $ | 76,459,543 | |
| (a) | Refer to Schedule of Investments for sector classifications. |
The Fund did not hold any investments at the end of the reporting period for which significant unobservable inputs (Level 3) were used in determining fair value; therefore, no reconciliation of Level 3 securities is included for this reporting period.
NOTE 4. ADVISER FEES AND OTHER TRANSACTIONS
Under the terms of the management agreement, on behalf of the Fund, the Adviser manages the Fund’s investments subject to approval by the Board. As compensation for its management services, the Fund is obligated to pay the Adviser a fee computed and accrued daily and paid monthly at an annual rate of 1.00% of the average daily net assets of the Fund. For the fiscal year ended October 31, 2022, the Adviser earned a fee of $882,341 from the Fund before the reimbursement described below. At October 31, 2022, the Fund owed the Adviser $49,835.
The Adviser has agreed to waive its fees and/or reimburse other expenses of the Fund until February 28, 2023, so that Total Annual Fund Operating Expenses do not exceed 1.10%. This operating expense limitation does not apply to interest, taxes, brokerage commissions,
| Green Owl Intrinsic Value Fund |
| Notes to the Financial Statements (continued) |
| October 31, 2022 |
other expenditures which are capitalized in accordance with GAAP, other extraordinary expenses not incurred in the ordinary course of the Fund’s business, dividend expense on short sales, expenses incurred under a Rule 12b-1 plan of distribution, “acquired fund fees and expenses,” and expenses that the Fund has incurred but did not actually pay because of an expense offset arrangement.
Each waiver and/or reimbursement of an expense is subject to repayment by the Fund within the three years following the date the particular expense payment occurred, provided that the Fund is able to make the repayment without exceeding the expense limitation in place at the time of the waiver or reimbursement and the expense limitation in place at the time of the repayment. This agreement may only be terminated by mutual consent of the Adviser and the Board of Trustees. For the fiscal year ended October 31, 2022, the Adviser waived fees and/or reimbursed expenses of $173,895.
The amounts subject to repayment by the Funds, pursuant to the aforementioned conditions are as follows:
| Recoverable Through | | | | |
| October 31, 2023 | | $ | 184,529 | |
| October 31, 2024 | | | 168,110 | |
| October 31, 2025 | | | 173,895 | |
The Trust retains Ultimus Fund Solutions, LLC (“the Administrator” or “Ultimus”) to provide the Fund with administration, compliance (including a chief compliance officer), fund accounting and transfer agent services, including all regulatory reporting. For the fiscal year ended October 31, 2022, the Administrator earned fees of $72,355, $3,000, $36,054 and $22,993 for administrative, compliance, accounting and transfer agent services, respectively. At October 31, 2022, the Administrator was owed $11,402 from the Fund for these services.
Effective April 1, 2022, Northern Lights Compliance Services, LLC (“NLCS”), an affiliate of Ultimus, provides a Chief Compliance Officer to the Trust, as well as related compliance services, pursuant to a consulting agreement between NLCS and the Trust. Under the terms of such agreement, NLCS receives fees from the Fund.
The officers and one trustee of the Trust are members of management and/or employees of the Administrator or of NLCS, and are not paid by the Trust for services to the Fund. Ultimus Fund Distributors, LLC (the “Distributor”) acts as the distributor of the Fund’s shares. The Distributor is a wholly-owned subsidiary of Ultimus. There were no payments made to the Distributor by the Fund for the fiscal year ended October 31, 2022.
| Green Owl Intrinsic Value Fund |
| Notes to the Financial Statements (continued) |
| October 31, 2022 |
NOTE 5. PURCHASES AND SALES OF SECURITIES
For the fiscal year ended October 31, 2022, purchases and sales of investment securities, other than short-term investments, were $23,033,257 and $26,319,048, respectively.
There were no purchases or sales of long-term U.S. government obligations during the fiscal year ended October 31, 2022.
NOTE 6. FEDERAL TAX INFORMATION
At October 31, 2022, the net unrealized appreciation (depreciation) and tax cost of investments for tax purposes were as follows:
| Gross unrealized appreciation | | $ | 21,358,661 | |
| Gross unrealized depreciation | | | (4,963,587 | ) |
| Net unrealized appreciation on investments | | $ | 16,395,074 | |
| Tax cost of investments | | $ | 60,064,469 | |
At October 31, 2022, the difference between book basis and tax basis unrealized appreciation (depreciation) is attributable to the tax deferral of losses on organizational expense amortization and ROC basis adjustments.
On December 7, 2022, the Fund paid a long-term capital gain distribution of $1.7959 per share to shareholders of record on December 5, 2022.
The tax character of distributions paid for the fiscal years ended October 31, 2022 and October 31, 2021 were as follows:
| | | 2022 | | | 2021 | |
| Distributions paid from: | | | | | | | | |
| Ordinary income(a) | | $ | 355,616 | | | $ | 14,233 | |
| Long-term capital gains | | | 15,347,708 | | | | 2,409,553 | |
| Total distributions paid | | $ | 15,703,324 | | | $ | 2,423,786 | |
| (a) | Short-term capital gain distributions are treated as ordinary income for tax purposes. |
At October 31, 2022, the components of accumulated earnings (deficit) on a tax basis were as follows:
| Undistributed Long-Term Capital Gains | | $ | 7,544,498 | |
| Accumulated Capital and Other Losses | | | (132,757 | ) |
| Unrealized Appreciation on Investments | | | 16,394,301 | |
| Total Accumulated Earnings | | $ | 23,806,042 | |
Green Owl Intrinsic Value Fund |
| Notes to the Financial Statements (continued) |
| October 31, 2022 |
Capital losses and specified gains realized after October 31, and net investment losses realized after December 31 of a Fund’s fiscal year may be deferred and treated as occurring on the first business day of the flowing fiscal year for tax purposes. For the year ended October 31, 2022, the Fund deferred $131,729 of late year ordinary losses.
NOTE 7. SECTOR RISK
If the Fund has significant investments in the securities of issuers within a particular sector, any development affecting that sector will have a greater impact on the value of the net assets of the Fund than would be the case if the Fund did not have significant investments in that sector. In addition, this may increase the risk of loss in the Fund and increase the volatility of the Fund’s NAV per share. For instance, economic or market factors, regulatory changes or other developments may negatively impact all companies in a particular sector, and therefore the value of the Fund’s portfolio will be adversely affected. As of October 31, 2022, the Fund had 27.42% of the value of its net assets invested in stocks within the Technology sector.
NOTE 8. COMMITMENTS AND CONTINGENCIES
The Trust indemnifies its officers and Trustees for certain liabilities that may arise from their performance of their duties to the Trust or the Fund. Additionally, in the normal course of business, the Trust enters into contracts that contain a variety of representations and warranties which provide general indemnifications. The Trust’s maximum exposure under these arrangements is unknown, as this would involve future claims that may be made against the Trust that have not yet occurred.
NOTE 9. SUBSEQUENT EVENTS
At a meeting held on June 1 and June 2, 2022, the Board approved the reorganization of the Fund into the Kovitz Core Equity ETF (the “Kovitz Fund”). Effective close of business on December 9, 2022, the Kovitz Fund acquired all of the assets and liabilities of the Fund. Also, during the meeting held on June 1 and June 2, 2022, the Board approved the reorganization of the Marathon Value Portfolio (the “Marathon Fund”), a series of Northern Lights Fund Trust III, into the Kovitz Fund. On December 9, 2022, the assets and liabilities of the Marathon Fund were transferred to the Kovitz Fund in exchange for shares of the Kovitz Fund. The Marathon Fund had similar investment objectives and policies as the Fund and was managed by the same portfolio managers. The Adviser also managed the assets of multiple separately managed accounts that were transferred to the Kovitz Fund.
Management of the Fund has evaluated the need for disclosures and/or adjustments resulting from subsequent events through the date at which these financial statements were issued. Based upon this evaluation, management has determined there were no additional items requiring adjustment of the financial statements or additional disclosure.
| Report of Independent Registered Public Accounting Firm |
To the Shareholders of Green Owl Intrinsic Value Fund and
Board of Trustees of Valued Advisers Trust
Opinion on the Financial Statements
We have audited the accompanying statement of assets and liabilities, including the schedule of investments, of Green Owl Intrinsic Value Fund (the “Fund”), a series of Valued Advisers Trust, as of October 31, 2022, the related statement of operations for the year then ended, the statements of changes in net assets for each of the two years in the period then ended, the related notes, and the financial highlights for each of the five years in the period then ended (collectively referred to as the “financial statements”). In our opinion, the financial statements present fairly, in all material respects, the financial position of the Fund as of October 31, 2022, the results of its operations for the year then ended, the changes in net assets for each of the two years in the period then ended, and the financial highlights for each of the five years in the period then ended, in conformity with accounting principles generally accepted in the United States of America.
Basis for Opinion
These financial statements are the responsibility of the Fund’s management. Our responsibility is to express an opinion on the Fund’s financial statements based on our audits. We are a public accounting firm registered with the Public Company Accounting Oversight Board (United States) (“PCAOB”) and are required to be independent with respect to the Fund in accordance with the U.S. federal securities laws and the applicable rules and regulations of the Securities and Exchange Commission and the PCAOB.
We conducted our audits in accordance with the standards of the PCAOB. Those standards require that we plan and perform the audit to obtain reasonable assurance about whether the financial statements are free of material misstatement whether due to error or fraud.
Our audits included performing procedures to assess the risks of material misstatement of the financial statements, whether due to error or fraud, and performing procedures that respond to those risks. Such procedures included examining, on a test basis, evidence regarding the amounts and disclosures in the financial statements. Our procedures included confirmation of securities owned as of October 31, 2022, by correspondence with the custodian and brokers; when replies were not received from brokers, we performed other auditing procedures. Our audits also included evaluating the accounting principles used and significant estimates made by management, as well as evaluating the overall presentation of the financial statements. We believe that our audits provide a reasonable basis for our opinion.
We have served as the Fund’s auditor since 2012.

COHEN & COMPANY, LTD.
Cleveland, Ohio
December 28, 2022
| Liquidity Risk Management Program (Unaudited) |
Valued Advisers Trust has adopted and implemented a written liquidity risk management program as required by Rule 22e-4 (the “Liquidity Rule”) under the Investment Company Act. The program is reasonably designed to assess and manage the Fund’s liquidity risk, taking into consideration, among other factors, the Fund’s investment strategy and the liquidity of its portfolio investments during normal and reasonably foreseeable stressed conditions; its short and long-term cash flow projections; and its cash holdings and access to other funding sources. The Board of Trustees approved the appointment of a Liquidity Administrator Committee, which includes representatives from Kovitz Investment Group Partners, LLC, the Fund’s investment adviser, and Ultimus Fund Solutions, LLC, the Fund’s Administrator. The Liquidity Administrator Committee is responsible for the program’s administration and oversight and for reporting to the Board on at least an annual basis regarding the program’s operation and effectiveness. The Liquidity Administrator Committee updated its assessment of the Fund’s liquidity risk profile, considering additional data gathered during the period June 1, 2021 through May 31, 2022 (the “Review Period”) and the adequacy and effectiveness of the liquidity risk management program’s operations during the Review Period in order to prepare a written report for the Board of Trustees (the “Report”) for consideration at its meeting held on September 7, 2022. The Report noted that during the Review Period the Fund did not experience unusual stress or disruption to its operations related to purchase and redemption activity. It further noted that during the Review Period the Fund held adequate levels of cash and highly liquid investments to meet shareholder redemption activities in accordance with applicable requirements. The Report concluded that (i) the Trust’s liquidity risk management program is reasonably designed to prevent violations of the Liquidity Rule and (ii) the Trust’s liquidity risk management program had been effectively implemented during the Review Period.
| Summary of Fund Expenses (Unaudited) |
As a shareholder of the Fund, you incur two types of costs: (1) transaction and (2) ongoing costs, including management fees and other Fund expenses. These examples are intended to help you understand your ongoing costs (in dollars) of investing in the Fund and to compare these costs with the ongoing costs of investing in other funds. You may pay brokerage commissions on purchases and sales of exchange-traded fund shares, which are not reflected in the example. The example is based on an investment of $1,000 invested at the beginning of the period and held for the entire period from May 1, 2022 through October 31, 2022.
Actual Expenses
The first line of the table below provides information about actual account values and actual expenses. You may use the information in this line, together with the amount you invested, to estimate the expenses that you paid over the period. Simply divide your account value by $1,000 (for example, an $8,600 account value divided by $1,000 = 8.6), then multiply the result by the number in the first line under the heading “Expenses Paid During Period” to estimate the expenses you paid on your account during this period.
Hypothetical Example for Comparison Purposes
The second line of the table below provides information about hypothetical account values and hypothetical expenses based on the Fund’s actual expense ratio and an assumed rate of return of 5% per year before expenses, which is not the Fund’s actual return. The hypothetical account values and expenses may not be used to estimate the actual ending account balance or expenses you paid for the period. You may use this information to compare the ongoing costs of investing in the Fund and other funds. To do so, compare this 5% hypothetical example with the 5% hypothetical examples that appear in the shareholder reports of other funds.
Expenses shown in the table are meant to highlight your ongoing costs only and do not reflect any transactional costs. Therefore, the second line of the table below is useful in comparing ongoing costs only and will not help you determine the relative total costs of owning different funds. In addition, if transaction costs were included, your costs would have been higher.
| | | Ending | | | | | | | | | |
| | | Beginning | | | Account | | | Expenses | | | |
| | | Account | | | Value | | | Paid | | | Annualized |
| | | Value | | | October 31, | | | During | | | Expense |
| | | May 1, 2022 | | | 2022 | | | Period(a) | | | Ratio |
| Green Owl Intrinsic Value Fund |
| Actual | | $ | 1,000.00 | | | $ | 924.40 | | | $ | 5.34 | | | 1.10% |
| Hypothetical(b) | | $ | 1,000.00 | | | $ | 1,019.66 | | | $ | 5.60 | | | 1.10% |
| (a) | Expenses are equal to the Fund’s annualized expense ratios, multiplied by the average account value over the period, multiplied by 184/365 (to reflect the one year period). |
| (b) | Hypothetical assumes 5% annual return before expenses. |
| Additional Federal Income Tax Information (Unaudited) |
The Form 1099-DIV you receive in January 2023 will show the tax status of all distributions paid to your account in calendar year 2022. Shareholders are advised to consult their own tax adviser with respect to the tax consequences of their investment in the Fund. As required by the Internal Revenue Code and/or regulations, shareholders must be notified regarding the status of qualified dividend income for individuals and the dividends received deduction for corporations.
Qualified Dividend Income. The Fund designates approximately 100% or up to the maximum amount of such dividends allowable pursuant to the Internal Revenue Code, as qualified dividend income eligible for a reduced tax rate.
Qualified Business Income. The Fund designates approximately 0% of its ordinary income dividends, or up to the maximum amount of such dividends allowable pursuant to the Internal Revenue Code, as qualified business income.
Dividends Received Deduction. Corporate shareholders are generally entitled to take the dividends received deduction on the portion of the Fund’s dividend distribution that qualifies under tax law. For the Fund’s calendar year 2022 ordinary income dividends, 100% qualifies for the corporate dividends received deduction.
For the year ended October 31, 2022, the Fund designated $15,347,708 as long-term capital gain distributions.
| Trustees and Officers (Unaudited) |
The Board of Trustees supervises the business activities of the Trust. Each Trustee serves as a trustee until termination of the Trust unless the Trustee dies, resigns, retires or is removed.
The following table provides information regarding each of the Independent Trustees.
Name, Address*, (Age),
Position with Trust**,
Term of Position with Trust | Principal Occupation During
Past 5 Years and Other
Directorships | Other Directorships |
Andrea N. Mullins, 55
Independent Trustee
Since December 2013
Chairperson since
March 2017 | Current: Private investor; Independent Contractor, SWM Advisors (since April 2014). | Trustee, Angel Oak Funds Trust (since February 2019) (5 portfolios); Trustee, Angel Oak Strategic Credit Fund (since February 2019); Trustee, Angel Oak Financial Strategies Income Term Trust (since May 2019); Trustee, Angel Oak Credit Opportunities Term Trust (since January 2021); Trustee and Audit Committee Chair, Cushing Mutual Funds Trust (since November 2021) (2 portfolios); Trustee and Audit Committee Chair, Cushing MLP & Infrastructure Total Return Fund (since November 2021); Trustee and Audit Committee Chair, NXG NextGen Infrastructure Income Fund (since November 2021). |
Trustees and Officers (Unaudited) (continued)
Name, Address*, (Age),
Position with Trust**, Term
of Position with Trust | Principal Occupation During
Past 5 Years and Other
Directorships | Other Directorships |
Ira P. Cohen, 63
Independent Trustee
Since June 2010 | Current: Independent financial services consultant (since February 2005); Executive Vice President of Asset Management Services, Recognos Financial (since August 2015). | Trustee and Audit Committee Chairman, Apollo Diversified Real Estate Fund (since March 2022); Trustee, Chairman and Nominating and Governance Committee Chairman, Angel Oak Funds Trust (since October 2014) (5 portfolios); Trustee, Chairman, and Nominating and Governance Committee Chairman, Angel Oak Strategic Credit Fund (since December 2017); Trustee, Chairman, and Nominating and Governance Committee Chairman, Angel Oak Financial Strategies Income Term Trust (since May 2019); Trustee, Chairman, and Nominating and Governance Committee Chairman, Angel Oak Credit Opportunities Term Trust (since January 2021); Trustee and Nominating and Governance Committee Chairman, U.S. Fixed Income Trust (since March 2019). |
| * | The address for each Trustee is 225 Pictoria Drive, Suite 450, Cincinnati, Ohio 45246. |
| ** | As of the date of this report, the Trust consists of 16 series. |
The following table provides information regarding the Trustee who is considered an “interested person” of the Trust, as that term is defined under the 1940 Act.
Name, Address*, (Age),
Position with Trust**,
Term of Position with Trust | Principal Occupation During
Past 5 Years and Other
Directorships | Other Directorships |
Mark J. Seger***, 60
Trustee Since March 2017 | Current: Vice Chairman and Co- Founder, Ultimus Fund Solutions, LLC and its subsidiaries (since 1999). | None. |
| * | The address for each Trustee is 225 Pictoria Drive, Suite 450, Cincinnati, Ohio 45246. |
| ** | As of the date of this report, the Trust consists of 16 series. |
| *** | Mr. Seger is considered an “interested person” of the Trust because of his relationship with the Trust’s administrator, transfer agent, and distributor. |
Trustees and Officers (Unaudited) (continued)
The following table provides information regarding the Officers of the Trust:
Name, Address*, (Age),
Position with Trust**,
Term of Position with Trust | Principal Occupation During
Past 5 Years | Other Directorships |
Matthew J. Miller, 46
Principal Executive Officer
and President Since March
2022
Vice President
From December 2011 to
March 2022 | Current: Vice President, Ultimus Fund Solutions, LLC (since December 2015). | None. |
N. Lynn Bowley, 64
Chief Compliance Officer
Since April 2022 | Current: Senior Vice President, Senior Compliance Officer, Northern Lights Compliance Services, LLC (since January 2007). | None. |
Carol J. Highsmith, 58
Vice President Since August
2008
Secretary Since March 2014 | Current: Vice President, Ultimus Fund Solutions, LLC (since December 2015). | None. |
Zachary P. Richmond, 42
Principal Financial Officer
and Treasurer Since
September 2021 | Current: Vice President, Financial Administration, Ultimus Fund Solutions, LLC (since February 2019). Previous: Assistant Vice President, Associate Director of Financial Administration, Ultimus Fund Solutions, LLC (December 2015 to February 2019). | None. |
Trustees and Officers (Unaudited) (continued)
Name, Address*, (Age),
Position with Trust**, Term
of Position with Trust | Principal Occupation During
Past 5 Years and Other
Directorships | Other Directorships |
Stephen L. Preston, 56
AML Officer Since June
2017 | Current: Chief Compliance Officer of Ultimus Fund Distributors, LLC (since June 2011), Vice President, Financial Operations Principal, and Anti- Money Laundering Officer, Ultimus Fund Distributors, LLC (since April 2021), Treasurer, Financial Operations Principal, Chief Compliance Officer, and Anti-Money Laundering Officer, Northern Lights Distributors, LLC (since April 2021). Previous: Chief Compliance Officer, Ultimus Fund Solutions, LLC (June 2011 to August 2019); Chief Compliance Officer, Unified Financial Securities, LLC (April 2018 to December 2019) | None. |
| * | The address for each Officer is 225 Pictoria Drive, Suite 450, Cincinnati, Ohio 45246. |
| ** | As of the date of this report, the Trust consists of 16 series. |
Other Information (Unaudited)
The Fund’s Statement of Additional Information (“SAI”) includes additional information about the trustees and is available without charge, upon request. You may call toll-free at (888) 695-3729 to request a copy of the SAI or to make shareholder inquiries.
| FACTS | WHAT DOES GREEN OWL INTRINSIC VALUE FUND (THE “FUND”) DO WITH YOUR PERSONAL INFORMATION? |
| |
| Why? | Financial companies choose how they share your personal information. Federal law gives consumers the right to limit some but not all sharing. Federal law also requires us to tell you how we collect, share, and protect your personal information. Please read this notice carefully to understand what we do. |
| |
| What? | The types of personal information we collect and share depend on the product or service you have with us. This information can include: ■ Social Security number ■ account balances and account transactions ■ transaction or loss history and purchase history ■ checking account information and wire transfer instructions When you are no longer our customer, we continue to share your information as described in this notice. |
| |
| How? | All financial companies need to share customers’ personal information to run their everyday business. In the section below, we list the reasons financial companies can share their customers’ personal information; the reasons the Funds choose to share; and whether you can limit this sharing. |
| Reasons we can share your personal information | Do the Funds share? |
For our everyday business purposes—
such as to process your transactions, maintain your account(s), respond to court orders and legal investigations, or report to credit bureaus | Yes |
For our marketing purposes—
to offer our products and services to you | No |
| For joint marketing with other financial companies | No |
For our affiliates’ everyday business purposes—
information about your transactions and experiences | No |
For our affiliates’ everyday business purposes—
information about your creditworthiness | No |
| For nonaffiliates to market to you | No |
| Questions? | Call (888) 695-3729 |
| Who we are |
| Who is providing this notice? | Green Owl Intrinsic Value Fund
Ultimus Fund Distributors, LLC (Distributor)
Ultimus Fund Solutions, LLC (Administrator) |
| What we do |
| How does the Fund protect my personal information? | To protect your personal information from unauthorized access and use, we use security measures that comply with federal law. These measures include computer safeguards and secured files and buildings. Our service providers are held accountable for adhering to strict policies and procedures to prevent any misuse of your nonpublic personal information. |
| How does the Fund collect my personal information? | We collect your personal information, for example, when you ■ open an account or deposit money ■ buy securities from us or sell securities to us ■ make deposits or withdrawals from your account ■ give us your account information ■ make a wire transfer ■ tell us who receives the money ■ tell us where to send the money ■ show your government-issued ID ■ show your driver’s license |
| Why can’t I limit all sharing? | Federal law gives you the right to limit only ■ sharing for affiliates’ everyday business purposes—information about your creditworthiness ■ affiliates from using your information to market to you ■ sharing for nonaffiliates to market to you State laws and individual companies may give you additional rights to limit sharing. |
| Definitions |
| Affiliates | Companies related by common ownership or control. They can be financial and nonfinancial companies. |
| | ■ Kovitz Investment Group Partners, LLC, the investment adviser to the Fund, could be deemed to be an affiliate. |
| Nonaffiliates | Companies not related by common ownership or control. They can be financial and nonfinancial companies. |
| | ■ The Fund does not share your personal information with nonaffiliates so they can market to you |
| Joint marketing | A formal agreement between nonaffiliated financial companies that together market financial products or services to you. |
| | ■ The Fund does not jointly market. |
Proxy Voting
A description of the policies and procedures that the Fund uses to determine how to vote proxies relating to portfolio securities and information regarding how the Fund voted those proxies during the most recent twelve month period ended June 30, are available (1) without charge upon request by calling the Fund at (888) 695-3729 and (2) in Fund documents filed with the SEC on the SEC’s website at www.sec.gov.
TRUSTEES Andrea N. Mullins, Chairperson Ira P. Cohen Mark J. Seger OFFICERS Matthew J. Miller, Principal Executive Officer and President Zachary P. Richmond, Principal Financial Officer and Treasurer N. Lynn Bowley, Chief Compliance Officer Carol J. Highsmith, Vice President and Secretary INVESTMENT ADVISER Kovitz Investment Group Partners, LLC 71 S. Wacker Dr., Suite 1860 Chicago, IL 60606 DISTRIBUTOR Ultimus Fund Distributors, LLC 225 Pictoria Drive, Suite 450 Cincinnati, OH 45246 | INDEPENDENT REGISTERED PUBLIC ACCOUNTING FIRM Cohen & Company, Ltd. 1350 Euclid Avenue, Suite 800 Cleveland, OH 44115 LEGAL COUNSEL Troutman Pepper Hamilton Sanders LLP 3000 Two Logan Square 18th and Arch Streets Philadelphia, PA 19103 CUSTODIAN Huntington National Bank 41 South High Street Columbus, OH 43215 ADMINISTRATOR, TRANSFER AGENT AND FUND ACCOUNTANT Ultimus Fund Solutions, LLC 225 Pictoria Drive, Suite 450 Cincinnati, OH 45246 |
This report is intended only for the information of shareholders or those who have received the Fund’s prospectus which contains information about the Fund’s management fee and expenses. Please read the prospectus carefully before investing.
Distributed by Ultimus Fund Distributors, LLC Member FINRA/SIPC
Green Owl-AR-22

SOUND MIND INVESTING FUND (SMIFX) |
SMI DYNAMIC ALLOCATION FUND (SMIDX) |
SMI MULTI-STRATEGY FUND (SMILX) |
| ANNUAL REPORT |
| October 31, 2022 |
Funds’ Adviser:
SMI Advisory Services, LLC
4400 Ray Boll Blvd.
Columbus, IN 47203
(877) 764-3863
(877) SMI-FUND
www.smifund.com
Dear Fellow Shareholder,
The dozen-year experiment with Quantitative Easing and near-zero interest rates ran into the kryptonite of inflation in 2022, resulting in the first prolonged bear market for financial assets since the Global Financial Crisis in 2008. With CPI inflation peaking at over 9% this summer, the Federal Reserve (and other global central banks) was forced to respond with significant rate hikes and Quantitative Tightening.
SMI’s trend-following strategies responded quickly to the turn in market direction. The S&P 500® Index was still rising into early-January, but within just a few weeks SMI’s strategies were beginning to pivot to a more defensive posture. While that meant the SMI Funds declined along with the market during the early days of 2022’s bear market, their performance relative to the market has improved as the year has gone on.
The SMI Fund managers believe that bear markets present an opportunity for active managers to add significant value for investors. Consider that over a full bull/bear market investing cycle, doubling the market’s gain during the bull portion of the cycle has the same impact on an investor’s total return as halving the market’s loss during the bear portion of the cycle. The difference, of course, is that attempting to significantly increase returns during a bull market normally means increasing risk within the portfolio, whereas limiting loss during a bear market can potentially be achieved by reducing the portfolio’s risk.
This is the path the SMI Funds have taken in 2022, reducing stock exposure while temporarily shifting to higher allocations in defensive assets such as cash and short-term bonds. These types of defensive adjustments have largely gone out of favor after four decades of largely rising markets, but were normal tools active managers used during the inflationary period from 1967-1982.
It is our belief that 2022’s bear market has primarily been a repricing of stock valuations due to the rapid increase in interest rates. With peak inflation potentially behind us, we expect the market’s focus to continue to shift from inflation fears to recession fears in the months ahead. Given the degree of financial tightening already experienced in 2022, we think it’s unlikely that the economy can avoid a recession in 2023.
Fifty years ago, economist Milton Friedman explained there are “long and variable lags” between changes in monetary policy (this year’s rate hikes and Quantitative Tightening) and when those changes show up in the economy. While the “variable” part is hard to pin down, history suggests that lag often ranges from 12-24 months. In other words, we shouldn’t expect to see the full impact of this year’s rate hikes and Quantitative Tightening in the real economy until mid-to-late next year.
All of this helps explain why we believe there is likely a recessionary “Act Two” of the current bear market in store next year. If this proves accurate, the current defensive positioning of the SMI Funds should continue to serve shareholders well. The SMI strategies aren’t “broken clocks” and have done a good job of pivoting back to invest aggressively at the conclusion of past bear markets. Our mechanical processes will guide us as to when we believe it’s time to do so again.
Performance Review
SMI’s Stock Upgrading strategy (the sole strategy used in SMIFX and 40% of SMILX) fell -10.72% from November 1, 2021 through October 31, 2022. This compared favorably to the Wilshire 5000 Index loss of -16.02% during the same period and placed the fund in the top 6% of its Morningstar peer group for the year.
This outperformance wasn’t uniform across the entire period. As alluded to in the market recap above, during the first three months of the period (November 2021-January 2022), SMIFX was invested aggressively as the market was still ascending into early-January. The Fund’s superior performance was heavily concentrated later in the year, after its defensive protocols were triggered and portfolio risk was substantially reduced. For example, over the final three months of the period (August-October 2022), SMIFX’s return was flat +0.0% while the Wilshire 5000 Index fell -5.61%. This leads us to believe that the Fund should continue to outperform the market and its peers should the bear market continue.
A substantial portion of SMIFX’s strong performance was attributable to its incremental shift to cash throughout the first half of 2022, but that wasn’t the whole story. The Fund’s allocation to commodities contributed significant positive returns over the course of the period (+24.7%). And as the portfolio de-risked by shifting into cash this year, it also pivoted its remaining stock holdings out of growth stocks and into large/ value holdings, which further reduced risk as value funds outperformed growth-oriented funds by a wide margin in 2022.
SMI’s Dynamic Asset Allocation (DAA) strategy (the sole strategy used in SMIDX and 50% of SMILX) ended the 12-month period with a disappointing overall loss of -19.82%. This was worse than the Wilshire 5000 index’s loss of -16.02%.
DAA is designed to respond to market trends by pivoting among six broad asset classes, each selected for its specific performance attributes during varying economic environments. This year’s unusually steep rise in interest rates hurt DAA’s ability to get into a “max conservative” posture as early as we would normally expect during a bear market, as bonds failed to provide the usual safe haven. 2022 was the worst year for bonds in decades, as the Bloomberg U.S. Aggregate Bond Index fell -15.68%, almost as much as stocks!
The dramatic weakness in bonds meant that not only did DAA fail to benefit from the positive returns bonds often provide when stocks fall, but DAA was also exposed to a riskier asset class (Real Estate) for longer than we would normally expect as the bear market unfolded.
Adjustments finally came over the summer and DAA’s performance improved late in the period. But given that SMIDX is normally the most conservative of the SMI Funds, the fact that it was the worst performer of the three during this first stage of the bear market was disappointing.
SMI’s Multi-Strategy portfolio (used in SMILX) consists of 50% DAA, 40% Stock Upgrading, and 10% in a strategy called Sector Rotation. From November 1, 2021 through October 31, 2022, the SMI Multi-Strategy Fund returned -13.29%. This compared favorably to the Wilshire 5000 Index loss of -16.02%.
Having already covered Stock Upgrading and DAA, which make up 90% of the Fund’s weighting, the final component to discuss is the 10% Sector Rotation allocation. This portion of the Fund was outstanding, gaining +20.3% while both stocks and bonds were falling substantially.
Nearly all of this superior performance was attributable to Sector Rotation shifting into Energy stocks at the end of January. Energy was the lone standout sector in 2022 and Sector Rotation was able to harness this narrow pocket of positive performance within the broadly declining market.
Conclusion
Investors have had to become reacquainted with some old foes over the past year. Inflation reversed a nearly 40-year trend, while this year’s bear market was the first time in a dozen years when stocks fell for an extended period. Indexing and buying the dip have served investors well over the past dozen years, but neither was effective this year.
In such an environment, the flexibility and willingness to adapt our holdings to changing market conditions we feel served the SMI Funds and their shareholders well. Limiting losses during bear markets is as valuable as amplifying gains during bulls, but can be pursued by reducing risk rather than boosting it. That’s the focus of the SMI Fund management team as we head toward what we believe is likely to be a recessionary 2023.
Importantly, all of the SMI Funds utilize quantitative strategies supported by extensive testing and long performance histories. Over just the past few years, we’ve seen these strategies adapt to the extremes of the fastest bear market in history (2020), pivot back the other direction in the face of a raging bull market (2021), and finally reposition for the extended bear market we’ve witnessed in 2022. It has been an exceptionally challenging environment for investors to navigate, but our rules-based systems have handled it well.
We appreciate the opportunity to serve you!
Blessings,

Mark Biller
Senior Portfolio Manager
The Sound Mind Investing Funds
The SMI Fund lineup, shown below, now offers investors a way to mix and match professionally managed funds to custom tailor the risk level desired for their portfolio. If you’d like assistance customizing your portfolio in this manner, please call a Stewardship Advisor at (800) 796-4975.
| PERFORMANCE RESULTS – (Unaudited) |
Average Annual Total Returns(a)
(For the periods ended October 31, 2022)
| | | Three | | | | | | | | |
| | | Months | | Six Months | | One Year | | Five Year | | Ten Year |
| Sound Mind Investing Fund | | 0.00% | | -4.04% | | -10.72% | | 6.29% | | 9.02% |
| Wilshire 5000® Total Market Index(b) | | -5.61% | | -5.39% | | -16.02% | | 10.11% | | 12.61% |
| S&P 500® Index(b) | | -5.86% | | -5.50% | | -14.61% | | 10.44% | | 12.79% |
| SMI Custom Index(c) | | -4.76% | | -4.92% | | -18.39% | | 6.26% | | 9.92% |
Total annual operating expenses, as disclosed in the Sound Mind Investing Fund’s (“SMI Fund”) prospectus dated February 28, 2022, were 1.73% of average daily net assets, which includes acquired fund fees and expenses. All expenses are reflected in performance results. SMI Advisory Services, LLC (the “Adviser”) contractually has agreed to waive its fee and/or reimburse certain operating expenses, but only to the extent necessary so that total annual operating expenses (excluding interest, taxes, brokerage commissions, other expenses which are capitalized in accordance with generally accepted accounting principles, extraordinary expenses, dividend expense on short sales, 12b-1 fees, and acquired fund fees and expenses) do not exceed 1.50% of the SMI Fund’s average daily net assets through February 28, 2023. Each waiver or reimbursement of an expense by the Adviser is subject to repayment by the SMI Fund within the three years following the date of such waiver or reimbursement, provided that the SMI Fund is able to make the repayment without exceeding the expense limitation in place at the time of the fee waiver or reimbursement and the expense limitation at the time of the repayment. This expense cap may not be terminated prior to this date except by the Board of Trustees (the “Board”).
Average Annual Total Returns(a)
(For the periods ended October 31, 2022)
| | | Three | | | | | | | | Since Inception |
| | | Months | | Six Months | | One Year | | Five Year | | (February 28, 2013) |
| SMI Dynamic Allocation Fund | | -5.81% | | -12.99% | | -19.82% | | 0.81% | | 2.71% |
| Wilshire 5000® Total Market Index(b) | | -5.61% | | -5.39% | | -16.02% | | 10.11% | | 12.06% |
| Bloomberg U.S. Aggregate Bond Index(b) | | -8.23% | | -6.86% | | -15.68% | | -0.54% | | 0.78% |
| Weighted Index (c) | | -6.54% | | -5.74% | | -15.57% | | 6.13% | | 7.69% |
Total annual operating expenses, as disclosed in the SMI Dynamic Allocation Fund’s prospectus dated February 28, 2022, were 1.41% of average daily net assets, which includes acquired fund fees and expenses. All expenses are reflected in performance results. The Adviser contractually has agreed to waive its fee and/or reimburse certain operating expenses, but only to the extent necessary so that total annual operating expenses (excluding interest, taxes, brokerage commissions, other expenses which are capitalized in accordance with generally accepted accounting principles, extraordinary expenses, dividend expense on short sales, 12b-1 fees, and acquired fund fees and expenses) do not exceed 1.45% of the SMI Dynamic Allocation Fund’s average daily net assets through February 28, 2023. Each waiver or reimbursement of an expense by the Adviser is subject to repayment by the SMI Dynamic Allocation Fund within the three years following the date of such waiver or reimbursement, provided that the SMI Dynamic Allocation Fund is able to make the repayment without exceeding the expense limitation in place at the time of the fee waiver or reimbursement and the expense limitation at the time of the repayment. This expense cap may not be terminated prior to this date except by the Board.
| PERFORMANCE RESULTS – (Unaudited), (Continued) |
Average Annual Total Returns(a)
(For the periods ended October 31, 2022)
| | | Three | | | | | | | | Since Inception |
| | | Months | | Six Months | | One Year | | Five Year | | (April 29, 2015) |
| SMI Multi-Strategy Fund | | -1.96% | | -6.83% | | -13.29% | | 3.48% | | 3.63% |
| Wilshire 5000® Total Market Index(b) | | -5.61% | | -5.39% | | -16.02% | | 10.11% | | 10.23% |
| Bloomberg U.S. Aggregate Bond Index(b) | | -8.23% | | -6.86% | | -15.68% | | -0.54% | | 0.31% |
| Weighted Index(c) | | -6.54% | | -5.74% | | -15.57% | | 6.13% | | 6.47% |
Total annual operating expenses, as disclosed in the SMI Multi-Strategy Fund’s prospectus dated February 28, 2022 were 1.57% of average daily net assets (1.55% before fee waivers recouped by the Adviser), which includes acquired fund fees and expenses. All expenses are reflected in performance results. The Adviser contractually has agreed to waive its fee and/ or reimburse certain operating expenses, but only to the extent necessary so that total annual operating expenses (excluding interest, taxes, brokerage commissions, other expenses which are capitalized in accordance with generally accepted accounting principles, extraordinary expenses, dividend expense on short sales, 12b-1 fees, and acquired fund fees and expenses) do not exceed 1.15% of the SMI Multi-Strategy Fund’s average daily net assets through February 28, 2023. Each waiver or reimbursement of an expense by the Adviser is subject to repayment by the SMI Multi-Strategy Fund within the three years following the date of such waiver or reimbursement, provided that the SMI Multi-Strategy Fund is able to make the repayment without exceeding the expense limitation in place at the time of the fee waiver or reimbursement and the expense limitation at the time of the repayment. This expense cap may not be terminated prior to this date except by the Board.
The performance quoted represents past performance, which does not guarantee future results. The investment return and principal value of an investment will fluctuate so that an investor’s shares, when redeemed, may be worth more or less than their original cost. The returns shown do not reflect deduction of taxes that a shareholder would pay on Fund distributions or the redemption of Fund shares. Current performance of the Sound Mind Investing Fund, SMI Dynamic Allocation Fund, and SMI Multi-Strategy Fund (each a “Fund” and collectively the “Funds”) may be lower or higher than the performance quoted. Performance data current to the most recent month end may be obtained by calling (877) 764-3863.
| (a) | Average annual total returns reflect any change in price per share and assume the reinvestment of all distributions. The Funds’ returns reflect any fee reductions during the applicable periods. If such fee reductions had not occurred, the quoted performance would have been lower. Total returns for periods less than one year are not annualized. |
| (b) | The Standard & Poor’s 500® Index (“S&P 500”), Wilshire 5000® Total Market Index (“Wilshire 5000”), Bloomberg U.S. Aggregate Bond Index, Russell 1000® Value Index, Russell 1000® Growth Index, Russell 2000® Value Index, Russell 2000® Growth Index and MSCI EAFE Index (collectively, the “Indices”) are unmanaged indices that assume reinvestment of all distributions and exclude the effect of taxes and fees. These Indices are widely recognized unmanaged indices and are representative of a broader market and range of securities than is found in each Fund’s portfolio. The returns of the Indices are not reduced by any fees or operating expenses. Individuals cannot invest directly in the Indices; however, an individual can invest in exchange-traded funds or other investment vehicles that attempt to track the performance of a benchmark index. |
| (c) | The SMI Custom Index for the Sound Mind Investing Fund is comprised of 20% Russell 1000® Value Index, 20% Russell 1000® Growth Index, 20% Russell 2000® Value Index, 20% Russell 2000® Growth Index and 20% MSCI EAFE Index and the Weighted Index for the SMI Dynamic Allocation Fund and the SMI Multi-Strategy Fund is comprised of 60% Wilshire 5000 and 40% Bloomberg U.S. Aggregate Bond Index. |
The Funds’ investment objectives, risks, charges and expenses must be considered carefully before investing. The prospectus contains this and other important information about the Funds and may be obtained by calling the same number as above. Please read it carefully before investing.
| PERFORMANCE RESULTS – (Unaudited), (Continued) |
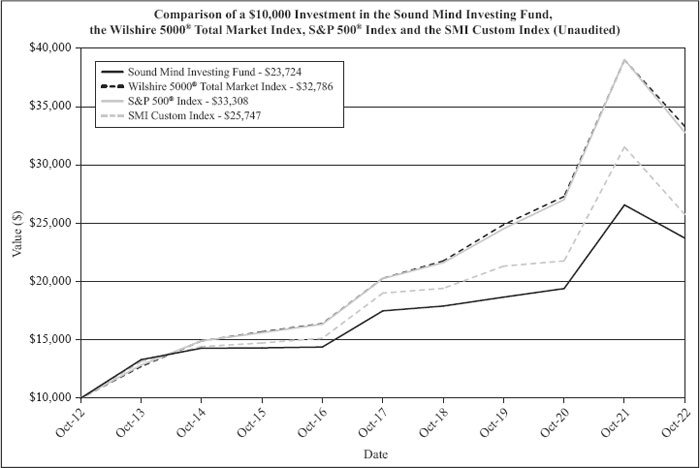
The chart above assumes an initial investment of $10,000 made on October 31, 2012 and held through October 31, 2022. THE FUND’S RETURN REPRESENTS PAST PERFORMANCE AND DOES NOT GUARANTEE FUTURE RESULTS. The returns shown do not reflect deduction of taxes that a shareholder would pay on Fund distributions or the redemption of Fund shares. Investment returns and principal values will fluctuate so that your shares, when redeemed, may be worth more or less than their original purchase price.
Current performance of the Fund may be lower or higher than the performance quoted. For more information on the Fund, and to obtain performance data current to the most recent month end or to request a prospectus, please call (877) 764-3863. You should carefully consider the investment objectives, potential risks, management fees, and charges and expenses of the Fund before investing. The Fund’s prospectus contains this and other information about the Fund, and should be read carefully before investing.
The SMI Custom Index for the Sound Mind Investing Fund is comprised of 20% Russell 1000® Value Index, 20% Russell 1000® Growth Index, 20% Russell 2000® Value Index, 20% Russell 2000® Growth Index and 20% MSCI EAFE Index.
The Fund is distributed by Ultimus Fund Distributors, LLC, member FINRA/SIPC.
| PERFORMANCE RESULTS – (Unaudited), (Continued) |
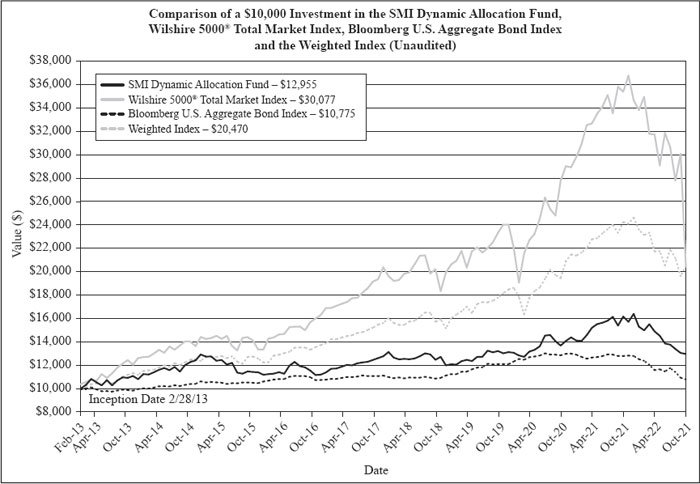
The chart above assumes an initial investment of $10,000 made on February 28, 2013 (commencement of Fund operations) and held through October 31, 2022. THE FUND’S RETURN REPRESENTS PAST PERFORMANCE AND DOES NOT GUARANTEE FUTURE RESULTS. The returns shown do not reflect deduction of taxes that a shareholder would pay on Fund distributions or the redemption of Fund shares. Investment returns and principal values will fluctuate so that your shares, when redeemed, may be worth more or less than their original purchase price.
Current performance of the Fund may be lower or higher than the performance quoted. For more information on the Fund, and to obtain performance data current to the most recent month end or to request a prospectus, please call (877) 764-3863. You should carefully consider the investment objectives, potential risks, management fees, and charges and expenses of the Fund before investing. The Fund’s prospectus contains this and other information about the Fund, and should be read carefully before investing.
The Weighted Index is comprised of 60% Wilshire 5000® Total Market Index and 40% Bloomberg U.S. Aggregate Bond Index.
The Fund is distributed by Ultimus Fund Distributors, LLC, member FINRA/SIPC.
| PERFORMANCE RESULTS – (Unaudited), (Continued) |
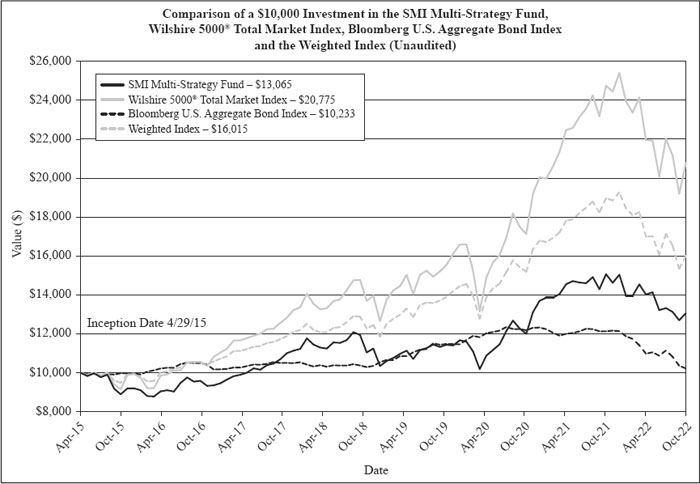
The chart above assumes an initial investment of $10,000 made on April 29, 2015 (commencement of Fund operations) and held through October 31, 2022. THE FUND’S RETURN REPRESENTS PAST PERFORMANCE AND DOES NOT GUARANTEE FUTURE RESULTS. The returns shown do not reflect deduction of taxes that a shareholder would pay on Fund distributions or the redemption of Fund shares. Investment returns and principal values will fluctuate so that your shares, when redeemed, may be worth more or less than their original purchase price. The information presented above, for the periods prior to April 28, 2018 is historical information for the Former SMI 50/40/10 Fund.
Current performance of the Fund may be lower or higher than the performance quoted. For more information on the Fund, and to obtain performance data current to the most recent month end or to request a prospectus, please call (877) 764-3863. You should carefully consider the investment objectives, potential risks, management fees, and charges and expenses of the Fund before investing. The Fund’s prospectus contains this and other information about the Fund, and should be read carefully before investing.
The Weighted Index is comprised of 60% Wilshire 5000® Total Market Index and 40% Bloomberg U.S. Aggregate Bond Index.
The Fund is distributed by Ultimus Fund Distributors, LLC, member FINRA/SIPC.
| FUND HOLDINGS – (Unaudited) |
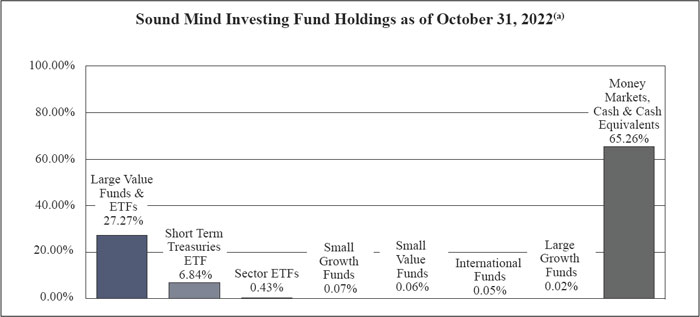
| (a) | As a percentage of net assets. |
Sound Mind Investing Fund seeks long-term capital appreciation. The Fund seeks to achieve its objective by investing in a diversified portfolio of other investment companies using a “Stock Upgrading” strategy. The Stock Upgrading investment strategy is a systematic investment approach that is based on the belief of the Adviser that superior returns can be obtained by constantly monitoring the performance of a wide universe of other investment companies and standing ready to move assets into the funds deemed by the Adviser to be most attractive at the time of analysis. This upgrading process strives to keep assets invested in funds that are demonstrating superior current performance relative to their peers as determined by a combination of size and investment style criteria.
| FUND HOLDINGS – (Unaudited), (Continued) |
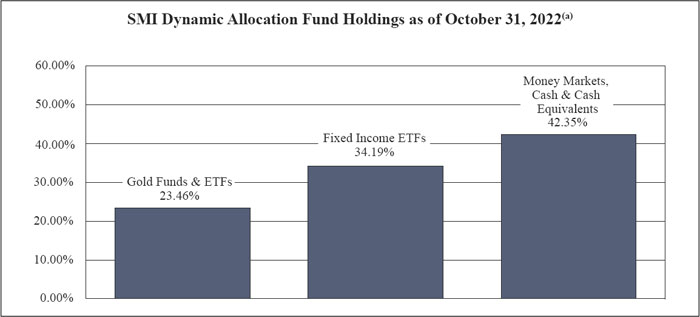
| (a) | As a percentage of net assets. |
SMI Dynamic Allocation Fund seeks total return. Total return is composed of both income and capital appreciation. The Fund uses a “Dynamic Asset Allocation” investment strategy to achieve its investment objective. This is done by investing in open-end mutual funds and exchange-traded funds (“ETFs”) that invest in securities from the following six asset classes – U.S. Equities, International Equities, Fixed Income Securities, Real Estate, Precious Metals, and Cash.
| FUND HOLDINGS – (Unaudited), (Continued) |
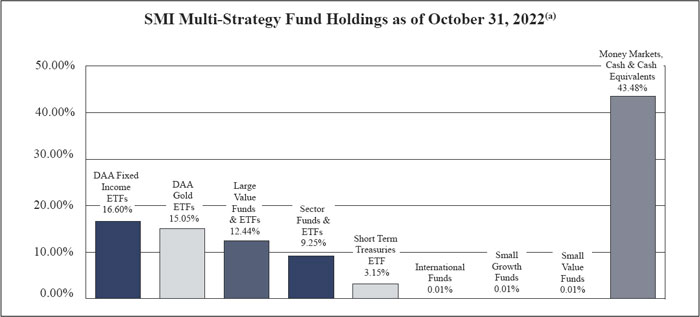
| (a) | As a percentage of net assets. |
SMI Multi-Strategy Fund seeks total return. Total return is composed of both income and capital appreciation. The Adviser allocates the Fund’s assets on a 50/40/10 basis among various investment strategies as follows:
| ● | 50% - Dynamic Asset Allocation Strategy (“DAA”) |
| ● | 40% - Stock Upgrading Strategy |
| ● | 10% - Sector Rotation Strategy |
The “Sector Rotation Strategy” involves the Adviser selecting from a universe of mutual funds and ETFs it has compiled using proprietary methods (“Underlying Funds”). This universe is specifically designed by the Adviser to balance exposure to a wide variety of market sectors and industries. This universe includes leveraged, non-leveraged and inverse Underlying Funds. The Adviser ranks these Underlying Funds based on their recent performance across multiple short-term performance periods, then uses an upgrading approach to invest in the top performing market sector or sectors. Once a particular sector or sectors is identified, the Adviser purchases one or more Underlying Funds to gain the desired exposure to that particular sector. This portion of the Fund may be concentrated, meaning that the Fund may be invested in as few as one or two sectors at a time and potentially as few as one Underlying Fund.
Availability of Portfolio Schedules – (Unaudited)
The Funds file their complete schedules of portfolio holdings with the Securities and Exchange Commission (“SEC”) for the first and third quarters of each fiscal year as an exhibit to its reports on Form N-PORT. The Funds’ Form N-PORT reports are available on the SEC’s website at http://www.sec.gov and on the Funds’ website at www.smifund.com.
| SOUND MIND INVESTING FUND |
| SCHEDULE OF INVESTMENTS |
| October 31, 2022 |
| EXCHANGE-TRADED FUNDS — 34.52% | | Shares | | | Fair Value | |
| First Trust Natural Gas ETF | | | 18,070 | | | $ | 493,311 | |
| Invesco S&P Ultra Dividend Revenue ETF | | | 76,500 | | | | 3,261,195 | |
| iShares Russell 1000 Value ETF | | | 140,110 | | | | 20,980,071 | |
| SPDR® Bloomberg 1-3 Month T-Bill ETF | | | 85,430 | | | | 7,824,534 | |
| WisdomTree U.S. High Dividend Fund | | | 81,490 | | | | 6,934,799 | |
| Total Exchange-Traded Funds (Cost $39,353,281) | | | | | | | 39,493,910 | |
| | | | | | | | | |
| MUTUAL FUNDS — 0.22% | | | | | | | | |
| Akre Focus Fund, Institutional Class | | | 101 | | | | 5,152 | |
| AllianzGI Dividend Value Fund | | | 200 | | | | 2,240 | |
| AllianzGI NFJ Small-Cap Value Fund | | | 162 | | | | 2,523 | |
| American Century Equity Income Fund, Investor Class | | | 100 | | | | 918 | |
| American Century International Opportunities Fund, Institutional Class | | | 360 | | | | 2,917 | |
| AMG Yacktman Focused Fund, Institutional Class | | | 100 | | | | 1,884 | |
| AMG Yacktman Fund, Institutional Class | | | 100 | | | | 2,234 | |
| Artisan International Small Cap Fund, Investor Class | | | 100 | | | | 1,474 | |
| Artisan International Value Fund, Investor Class | | | 150 | | | | 5,270 | |
| Artisan Mid Cap Value Fund, Investor Class | | | 279 | | | | 5,275 | |
| Artisan Small Cap Fund, Investor Class | | | 125 | | | | 3,673 | |
| BlackRock International Opportunities Portfolio, Institutional Class | | | 100 | | | | 2,759 | |
| BNY Mellon Opportunistic Small Cap Fund, Investor Class | | | 100 | | | | 2,972 | |
| Bridgeway Ultra-Small Company Market Fund, Class N | | | 100 | | | | 1,070 | |
| Buffalo Small Cap Fund, Inc. | | | 150 | | | | 2,190 | |
| Champlain Small Company Fund, Institutional Class | | | 100 | | | | 2,010 | |
| Chartwell Small Cap Value Fund | | | 118 | | | | 2,190 | |
| Columbia Acorn Fund, Class Z | | | 137 | | | | 1,263 | |
| Columbia Acorn International, Class Z | | | 100 | | | | 1,936 | |
| Columbia Contrarian Core Fund, Class Z | | | 91 | | | | 2,517 | |
| Columbia Small Cap Growth Fund I, Class Z | | | 100 | | | | 1,866 | |
| Davis Opportunity Fund, Class Y | | | 100 | | | | 3,706 | |
| Delaware Select Growth Fund, Institutional Class | | | 100 | | | | 2,320 | |
| Delaware Small Cap Value Fund, Institutional Class | | | 100 | | | | 7,236 | |
| Delaware Value Fund, Institutional Class | | | 144 | | | | 2,858 | |
| DFA International Small Cap Value Portfolio, Institutional Class | | | 100 | | | | 1,681 | |
| DFA International Small Company Portfolio, Institutional Class | | | 100 | | | | 1,593 | |
| DFA U.S. Small Cap Value Portfolio, Institutional Class | | | 100 | | | | 4,201 | |
| Fidelity Mid-Cap Stock Fund | | | 150 | | | | 5,659 | |
| Fidelity Small Cap Discovery Fund | | | 100 | | | | 2,329 | |
| Fidelity Small Cap Stock Fund | | | 150 | | | | 2,222 | |
See accompanying notes which are an integral part of these financial statements.
| SOUND MIND INVESTING FUND |
| SCHEDULE OF INVESTMENTS |
| October 31, 2022 – (Continued) |
| MUTUAL FUNDS — 0.22% - continued | | Shares | | | Fair Value | |
| Fidelity Small Cap Value Fund | | | 150 | | | $ | 2,657 | |
| Franklin Small Cap Value Fund, Advisor Class | | | 100 | | | | 5,498 | |
| Hartford International Opportunities Fund (The), Class Y | | | 248 | | | | 3,668 | |
| Heartland Value Fund | | | 100 | | | | 4,203 | |
| Hennessy Cornerstone Mid Cap 30 Fund, Institutional Class | | | 100 | | | | 2,184 | |
| Hennessy Focus Fund, Investor Class | | | 50 | | | | 2,556 | |
| Invesco American Value Fund, Class Y | | | 141 | | | | 5,243 | |
| Invesco Oppenheimer International Small-Mid Company Fund, Class Y | | | 100 | | | | 3,605 | |
| Janus Henderson Contrarian Fund, Class T | | | 100 | | | | 2,245 | |
| Janus Henderson Mid Cap Value Fund, Class T | | | 200 | | | | 3,134 | |
| Janus Henderson Overseas Fund, Class T | | | 100 | | | | 3,528 | |
| Janus Henderson Venture Fund, Class T | | | 100 | | | | 7,448 | |
| JOHCM International Select Fund, Institutional Class | | | 100 | | | | 1,850 | |
| JPMorgan Mid Cap Value Fund, Institutional Class | | | 100 | | | | 3,791 | |
| JPMorgan Small Cap Equity Fund, Select Class | | | 100 | | | | 5,682 | |
| JPMorgan Small Cap Growth Fund, Class L | | | 100 | | | | 1,825 | |
| JPMorgan U.S. Research Enhanced Equity Fund, Institutional Class | | | 100 | | | | 2,985 | |
| Longleaf Partners Fund | | | 150 | | | | 2,843 | |
| Longleaf Partners International Fund | | | 150 | | | | 1,772 | |
| Longleaf Partners Small-Cap Fund | | | 100 | | | | 2,177 | |
| Lord Abbett Developing Growth Fund, Inc., Institutional Class | | | 100 | | | | 2,370 | |
| Miller Opportunity Trust, Institutional Class | | | 100 | | | | 2,910 | |
| Morgan Stanley Discovery Portfolio, Institutional Class | | | 100 | | | | 1,215 | |
| Morgan Stanley Growth Portfolio, Institutional Class | | | 100 | | | | 3,392 | |
| Neuberger Berman Genesis Fund, Institutional Class | | | 100 | | | | 6,136 | |
| Nicholas Fund, Inc. | | | 50 | | | | 3,452 | |
| Oakmark International Fund, Investor Class | | | 150 | | | | 3,105 | |
| Oakmark International Small Cap Fund, Institutional Class | | | 150 | | | | 2,165 | |
| Oakmark Select Fund, Institutional Class | | | 150 | | | | 7,765 | |
| PRIMECAP Odyssey Aggressive Growth Fund | | | 100 | | | | 3,892 | |
| Principal SmallCap Growth Fund I, Institutional Class | | | 200 | | | | 2,510 | |
| Prudential Jennison International Opportunities, Class Z | | | 185 | | | | 4,160 | |
| Royce Micro-Cap Fund, Investment Class | | | 106 | | | | 1,085 | |
| Royce Opportunity Fund, Investment Class | | | 318 | | | | 4,421 | |
| Royce Premier Fund, Investment Class | | | 300 | | | | 3,273 | |
| Royce Special Equity Fund, Institutional Class | | | 150 | | | | 2,621 | |
| T. Rowe Price International Discovery Fund, Investor Class | | | 75 | | | | 4,025 | |
| T. Rowe Price Mid-Cap Growth Fund, Investor Class | | | 50 | | | | 4,462 | |
| T. Rowe Price New Horizons Fund, Investor Class | | | 100 | | | | 5,103 | |
See accompanying notes which are an integral part of these financial statements.
| SOUND MIND INVESTING FUND |
| SCHEDULE OF INVESTMENTS |
| October 31, 2022 – (Continued) |
| MUTUAL FUNDS — 0.22% - continued | | Shares | | | Fair Value | |
| T. Rowe Price Small-Cap Value Fund, Investor Class | | | 100 | | | $ | 5,248 | |
| Thornburg Value Fund, Institutional Class | | | 100 | | | | 6,258 | |
| TIAA-CREF International Equity Fund, Institutional Class | | | 100 | | | | 1,063 | |
| Touchstone Sands Capital Select Growth Fund, Class Y | | | 100 | | | | 997 | |
| Tweedy Browne International Value Fund | | | 150 | | | | 3,816 | |
| Vanguard Strategic Equity Fund, Investor Class | | | 100 | | | | 3,426 | |
| Victory RS Small Cap Growth Fund, Class Y | | | 100 | | | | 5,384 | |
| Wasatch International Growth Fund, Investor Class | | | 150 | | | | 3,129 | |
| Wasatch Micro Cap Fund, Investor Class | | | 100 | | | | 605 | |
| Total Mutual Funds (Cost $227,174) | | | | | | | 255,020 | |
| | | | | | | | | |
| MONEY MARKET FUNDS — 65.18% | | | | | | | | |
| Fidelity Investments Money Market Government Portfolio, Institutional Class, 2.91%(a) (b) | | | 74,577,649 | | | | 74,577,649 | |
| Total Money Market Funds (Cost $74,577,649) | | | | | | | 74,577,649 | |
| Total Investments — 99.93% (Cost $114,158,104) | | | | | | $ | 114,326,579 | |
| Other Assets in Excess of Liabilities — 0.07% | | | | | | | 85,019 | |
| NET ASSETS — 100.00% | | | | | | $ | 114,411,598 | |
| (a) | Rate disclosed is the seven day effective yield as of October 31, 2022. |
| (b) | Represents an investment greater than 25% of the Fund’s net assets. Performance of the Fund may be adversely impacted by concentrated investments in securities. The financial statements and portfolio holdings for these securities can be found at www.sec.gov. As of October 31, 2022, the percentage of net assets invested in Fidelity Investments Money Market Government Portfolio were 65.18% of the Fund. |
ETF - Exchange-Traded Fund
SPDR - Standard & Poor’s Depositary Receipt
See accompanying notes which are an integral part of these financial statements.
| SMI DYNAMIC ALLOCATION FUND |
| SCHEDULE OF INVESTMENTS |
| October 31, 2022 |
| EXCHANGE-TRADED FUNDS — 34.19% | | Shares | | | Fair Value | |
| Vanguard Short-Term Inflation-Protected Securities ETF(a) | | | 613,940 | | | $ | 29,315,635 | |
| Total Exchange-Traded Funds (Cost $29,314,479) | | | | | | | 29,315,635 | |
| | | | | | | | | |
| CLOSED END FUNDS — 19.40% | | | | | | | | |
| Sprott Physical Gold Trust(b) | | | 1,318,990 | | | | 16,632,464 | |
| Total Closed End Funds (Cost $19,669,592) | | | | | | | 16,632,464 | |
| | | | | | | | | |
| MUTUAL FUNDS — 4.06% | | | | | | | | |
| Gold Bullion Strategy Fund (The), Investor Class(b) | | | 183,604 | | | | 3,488,471 | |
| Total Mutual Funds (Cost $4,300,000) | | | | | | | 3,488,471 | |
| | | | | | | | | |
| MONEY MARKET FUNDS — 0.03% | | | | | | | | |
| Fidelity Investments Money Market Government Portfolio, Institutional Class, 2.91%(c) | | | 22,556 | | | | 22,556 | |
| Total Money Market Funds (Cost $22,556) | | | | | | | 22,556 | |
| Total Investments — 57.68% (Cost $53,306,627) | | | | | | $ | 49,459,126 | |
| Other Assets in Excess of Liabilities — 42.32% | | | | | | | 36,289,777 | |
| NET ASSETS — 100.00% | | | | | | $ | 85,748,903 | |
| (a) | Represents an investment greater than 25% of the Fund’s net assets. Performance of the Fund may be adversely impacted by concentrated investments in securities. The financial statements and portfolio holdings for these securities can be found at www.sec.gov. As of October 31, 2022, the percentage of net assets invested in Vanguard Short-Term Inflation-Protected Securities ETF was 34.19% of the Fund. |
| (b) | Non-income producing security. |
| (c) | Rate disclosed is the seven day effective yield as of October 31, 2022. |
ETF - Exchange-Traded Fund
See accompanying notes which are an integral part of these financial statements.
| SMI MULTI-STRATEGY FUND |
| SCHEDULE OF INVESTMENTS |
| October 31, 2022 |
| EXCHANGE-TRADED FUNDS — 40.08% | | Shares | | | Fair Value | |
| Energy Select Sector SPDR® Fund | | | 24,750 | | | $ | 2,227,500 | |
| First Trust Natural Gas ETF | | | 25,690 | | | | 701,337 | |
| Invesco Dynamic Energy Exploration & Production ETF | | | 23,060 | | | | 769,512 | |
| Invesco S&P Ultra Dividend Revenue ETF | | | 14,380 | | | | 613,019 | |
| iShares Russell 1000 Value ETF | | | 30,720 | | | | 4,600,014 | |
| SPDR® Bloomberg 1-3 Month T-Bill ETF | | | 19,210 | | | | 1,759,444 | |
| SPDR® S&P Oil & Gas Exploration & Production ETF | | | 4,720 | | | | 714,089 | |
| Vanguard Short-Term Inflation-Protected Securities ETF | | | 194,310 | | | | 9,278,301 | |
| WisdomTree U.S. High Dividend Fund | | | 20,470 | | | | 1,741,997 | |
| Total Exchange-Traded Funds (Cost $21,224,951) | | | | | | | 22,405,213 | |
| | | | | | | | | |
| CLOSED END FUNDS — 15.05% | | | | | | | | |
| Sprott Physical Gold Trust(a) | | | 667,452 | | | | 8,416,570 | |
| Total Closed End Funds (Cost $9,972,044) | | | | | | | 8,416,570 | |
| | | | | | | | | |
| MUTUAL FUNDS — 1.39% | | | | | | | | |
| AMG Yacktman Focused Fund, Institutional Class | | | 100 | | | | 1,884 | |
| Fidelity Select Energy Portfolio | | | 12,853 | | | | 762,297 | |
| Invesco International Small-Mid Company Fund, Class Y | | | 100 | | | | 3,605 | |
| Longleaf Partners International Fund | | | 150 | | | | 1,772 | |
| Lord Abbett Developing Growth Fund, Inc., Institutional Class | | | 100 | | | | 2,370 | |
| Miller Opportunity Trust, Institutional Class | | | 100 | | | | 2,910 | |
| Morgan Stanley Discovery Portfolio, Institutional Class | | | 100 | | | | 1,215 | |
| Oakmark International Fund, Investor Class | | | 50 | | | | 1,035 | |
| Wasatch International Growth Fund, Investor Class | | | 100 | | | | 2,086 | |
| Total Mutual Funds (Cost $560,423) | | | | | | | 779,174 | |
See accompanying notes which are an integral part of these financial statements.
| SMI MULTI-STRATEGY FUND |
| SCHEDULE OF INVESTMENTS |
| October 31, 2022 – (Continued) |
| MONEY MARKET FUNDS — 25.59% | | Shares | | | Fair Value | |
| Fidelity Investments Money Market Government Portfolio, Institutional Class, 2.91%(b)(c) | | | 14,305,201 | | | $ | 14,305,201 | |
| Total Money Market Funds (Cost $14,305,201) | | | | | | | 14,305,201 | |
| Total Investments — 82.11% (Cost $46,062,619) | | | | | | $ | 45,906,158 | |
| Other Assets in Excess of Liabilities — 17.89% | | | | | | | 10,003,939 | |
| NET ASSETS — 100.00% | | | | | | $ | 55,910,097 | |
| (a) | Non-income producing security. |
| (b) | Represents an investment greater than 25% of the Fund’s net assets. Performance of the Fund may be adversely impacted by concentrated investments in securities. The financial statements and portfolio holdings for these securities can be found at www.sec.gov. As of October 31, 2022, the percentage of net assets invested in Fidelity Investments Money Market Government Portfolio was 25.59% of the Fund. |
| (c) | Rate disclosed is the seven day effective yield as of October 31, 2022. |
ETF - Exchange-Traded Fund
SPDR - Standard & Poor’s Depositary Receipt
See accompanying notes which are an integral part of these financial statements.
| SMI FUNDS |
| STATEMENTS OF ASSETS AND LIABILITIES |
| October 31, 2022 |
| | | | | | | | | SMI | |
| | | Sound Mind | | | SMI Dynamic | | | Multi-Strategy | |
| | | Investing Fund | | | Allocation Fund | | | Fund | |
| Assets | | | | | | | | | | | | |
| Investments in securities at fair value (cost $114,158,104, $53,306,627 and $46,062,619) (Note 3) | | $ | 114,326,579 | | | $ | 49,459,126 | | | $ | 45,906,158 | |
| Receivable for fund shares sold | | | 36,320 | | | | 310 | | | | 12,912 | |
| Receivable for investments sold | | | 27,544,461 | | | | 66,240,499 | | | | 25,132,737 | |
| Dividends receivable | | | 206,828 | | | | 1,272 | | | | 39,760 | |
| Prepaid expenses | | | 21,060 | | | | 12,231 | | | | 15,371 | |
| Total Assets | | | 142,135,248 | | | | 115,713,438 | | | | 71,106,938 | |
| Liabilities | | | | | | | | | | | | |
| Payable for fund shares redeemed | | | 22,008 | | | | 541,392 | | | | 1,500 | |
| Payable for investments purchased | | | 27,565,949 | | | | 29,314,479 | | | | 15,117,369 | |
| Payable to Adviser (Note 4) | | | 96,316 | | | | 74,425 | | | | 46,010 | |
| Payable to Administrator (Note 4) | | | 7,074 | | | | 4,966 | | | | 3,706 | |
| Payable to trustees | | | 1,917 | | | | 1,917 | | | | 1,917 | |
| Other accrued expenses | | | 30,386 | | | | 27,356 | | | | 26,339 | |
| Total Liabilities | | | 27,723,650 | | | | 29,964,535 | | | | 15,196,841 | |
| Net Assets | | $ | 114,411,598 | | | $ | 85,748,903 | | | $ | 55,910,097 | |
| Net Assets consist of: | | | | | | | | | | | | |
| Paid-in capital | | | 125,715,377 | | | | 90,624,000 | | | | 58,891,612 | |
| Accumulated deficit | | | (11,303,779 | ) | | | (4,875,097 | ) | | | (2,981,515 | ) |
| Net Assets | | $ | 114,411,598 | | | $ | 85,748,903 | | | $ | 55,910,097 | |
| Shares outstanding (unlimited number of shares authorized, no par value) | | | 13,759,821 | | | | 8,263,159 | | | | 6,211,735 | |
| Net asset value, offering and redemption price per share (Note 2) | | $ | 8.31 | | | $ | 10.38 | | | $ | 9.00 | |
See accompanying notes which are an integral part of these financial statements.
| SMI FUNDS |
| STATEMENTS OF OPERATIONS |
| For the year ended October 31, 2022 |
| | | | | | | | | SMI | |
| | | Sound Mind | | | SMI Dynamic | | | Multi-Strategy | |
| | | Investing Fund | | | Allocation Fund | | | Fund | |
| Investment Income | | | | | | | | | | | | |
| Dividend income | | $ | 7,785,161 | | | $ | 1,205,724 | | | $ | 2,053,030 | |
| Total investment income | | | 7,785,161 | | | | 1,205,724 | | | | 2,053,030 | |
| | | | | | | | | | | | | |
| Expenses | | | | | | | | | | | | |
| Investment Adviser fees (Note 4) | | | 1,284,544 | | | | 1,039,264 | | | | 550,303 | |
| Administration fees (Note 4) | | | 38,394 | | | | 31,048 | | | | 18,314 | |
| Legal fees | | | 31,628 | | | | 30,354 | | | | 27,528 | |
| Registration fees | | | 30,636 | | | | 32,570 | | | | 34,747 | |
| Transfer agent fees (Note 4) | | | 22,730 | | | | 9,758 | | | | 10,079 | |
| Fund accounting fees (Note 4) | | | 20,134 | | | | 16,279 | | | | 9,605 | |
| Audit and tax preparation fees | | | 18,411 | | | | 18,411 | | | | 18,411 | |
| Printing and postage expenses | | | 13,052 | | | | 8,720 | | | | 6,388 | |
| Custodian fees | | | 9,708 | | | | 5,662 | | | | 5,066 | |
| Compliance service fees (Note 4) | | | 8,100 | | | | 8,100 | | | | 8,100 | |
| Trustee fees (Note 4) | | | 7,425 | | | | 7,387 | | | | 7,363 | |
| Line of credit | | | 6,788 | | | | 5,674 | | | | 3,226 | |
| Insurance expenses | | | 3,762 | | | | 3,447 | | | | 3,017 | |
| Interest expense | | | 251 | | | | 320 | | | | 37 | |
| Miscellaneous expenses | | | 35,774 | | | | 25,775 | | | | 24,881 | |
| Total expenses | | | 1,531,337 | | | | 1,242,769 | | | | 727,065 | |
| Fees contractually waived by Adviser | | | — | | | | — | | | | (21,003 | ) |
| Net operating expenses | | | 1,531,337 | | | | 1,242,769 | | | | 706,062 | |
| Net investment income (loss) | | | 6,253,824 | | | | (37,045 | ) | | | 1,346,968 | |
| Net Realized and Change in Unrealized Gain (Loss) on Investments | | | | | | | | | | | | |
| Long term capital gain dividends from investment companies | | | 822,179 | | | | 76,168 | | | | 182,572 | |
| Net realized loss on investment securities transactions | | | (13,402,573 | ) | | | (809,037 | ) | | | (2,985,753 | ) |
| Net change in unrealized depreciation on investment securities | | | (8,751,073 | ) | | | (21,788,614 | ) | | | (7,341,851 | ) |
| Net realized and change in unrealized loss on investments | | | (21,331,467 | ) | | | (22,521,483 | ) | | | (10,145,032 | ) |
| Net decrease in net assets resulting from operations | | $ | (15,077,643 | ) | | $ | (22,558,528 | ) | | $ | (8,798,064 | ) |
See accompanying notes which are an integral part of these financial statements.
| SOUND MIND INVESTING FUND |
| STATEMENTS OF CHANGES IN NET ASSETS |
| | | For the Year | | | For the Year | |
| | | Ended | | | Ended | |
| | | October 31, 2022 | | | October 31, 2021 | |
| Increase (Decrease) in Net Assets due to: | | | | | | | | |
| Operations | | | | | | | | |
| Net investment income (loss) | | $ | 6,253,824 | | | $ | (134,517 | ) |
| Long term capital gain dividends from investment companies | | | 822,179 | | | | 4,680,807 | |
| Net realized gain (loss) on investment securities transactions | | | (13,402,573 | ) | | | 49,217,835 | |
| Net change in unrealized depreciation of investment securities | | | (8,751,073 | ) | | | (8,908,040 | ) |
| Net increase (decrease) in net assets resulting from operations | | | (15,077,643 | ) | | | 44,856,085 | |
| | | | | | | | | |
| Distributions to Shareholders from Earnings (Note 2) | | | (46,567,403 | ) | | | — | |
| | | | | | | | | |
| Capital Transactions | | | | | | | | |
| Proceeds from shares sold | | | 3,534,921 | | | | 9,454,512 | |
| Reinvestment of distributions | | | 45,907,374 | | | | — | |
| Amount paid for shares redeemed | | | (23,502,932 | ) | | | (28,968,665 | ) |
| Net increase (decrease) in net assets resulting from capital transactions | | | 25,939,363 | | | | (19,514,153 | ) |
| Total Increase (Decrease) in Net Assets | | | (35,705,683 | ) | | | 25,341,932 | |
| | | | | | | | | |
| Net Assets | | | | | | | | |
| Beginning of year | | | 150,117,281 | | | | 124,775,349 | |
| End of year | | $ | 114,411,598 | | | $ | 150,117,281 | |
| | | | | | | | | |
| Share Transactions | | | | | | | | |
| Shares sold | | | 376,993 | | | | 746,447 | |
| Shares issued in reinvestment of distributions | | | 4,989,932 | | | | — | |
| Shares redeemed | | | (2,595,854 | ) | | | (2,268,368 | ) |
| Net increase (decrease) in shares outstanding | | | 2,771,071 | | | | (1,521,921 | ) |
See accompanying notes which are an integral part of these financial statements.
| SMI DYNAMIC ALLOCATION FUND |
| STATEMENTS OF CHANGES IN NET ASSETS |
| | | For the Year | | | For the Year | |
| | | Ended | | | Ended | |
| | | October 31, 2022 | | | October 31, 2021 | |
| Increase (Decrease) in Net Assets due to: | | | | | | | | |
| Operations | | | | | | | | |
| Net investment income (loss) | | $ | (37,045 | ) | | $ | 928,910 | |
| Long term capital gain dividends from investment companies | | | 76,168 | | | | 847,386 | |
| Net realized gain (loss) on investment securities transactions | | | (809,037 | ) | | | 7,158,116 | |
| Net increase from payments by Adviser for investment losses | | | — | | | | 225,012 | |
| Net change in unrealized appreciation (depreciation) of investment securities | | | (21,788,614 | ) | | | 10,095,688 | |
| Net increase (decrease) in net assets resulting from operations | | | (22,558,528 | ) | | | 19,255,112 | |
| | | | | | | | | |
| Distributions to Shareholders from Earnings (Note 2) | | | (8,760,391 | ) | | | (5,973,351 | ) |
| | | | | | | | | |
| Capital Transactions | | | | | | | | |
| Proceeds from shares sold | | | 5,681,085 | | | | 11,324,062 | |
| Reinvestment of distributions | | | 8,579,626 | | | | 5,901,945 | |
| Amount paid for shares redeemed | | | (17,156,548 | ) | | | (23,738,841 | ) |
| Net decrease in net assets resulting from capital transactions | | | (2,895,837 | ) | | | (6,512,834 | ) |
| Total Increase (Decrease) in Net Assets | | | (34,214,756 | ) | | | 6,768,927 | |
| | | | | | | | | |
| Net Assets | | | | | | | | |
| Beginning of year | | | 119,963,659 | | | | 113,194,732 | |
| End of year | | $ | 85,748,903 | | | $ | 119,963,659 | |
| | | | | | | | | |
| Share Transactions | | | | | | | | |
| Shares sold | | | 462,036 | | | | 871,261 | |
| Shares issued in reinvestment of distributions | | | 653,437 | | | | 474,433 | |
| Shares redeemed | | | (1,442,468 | ) | | | (1,845,584 | ) |
| Net decrease in shares outstanding | | | (326,995 | ) | | | (499,890 | ) |
See accompanying notes which are an integral part of these financial statements.
| SMI MULTI-STRATEGY FUND |
| STATEMENTS OF CHANGES IN NET ASSETS |
| | | For the Year | | | For the Year | |
| | | Ended | | | Ended | |
| | | October 31, 2022 | | | October 31, 2021 | |
| Increase (Decrease) in Net Assets due to: | | | | | | | | |
| Operations | | | | | | | | |
| Net investment income | | $ | 1,346,968 | | | $ | 236,754 | |
| Long term capital gain dividends from investment companies | | | 182,572 | | | | 786,807 | |
| Net realized gain (loss) on investment securities transactions | | | (2,985,753 | ) | | | 11,770,129 | |
| Net change in unrealized appreciation (depreciation) of investment securities | | | (7,341,851 | ) | | | 1,694,676 | |
| Net increase (decrease) in net assets resulting from operations | | | (8,798,064 | ) | | | 14,488,366 | |
| | | | | | | | | |
| Distributions to Shareholders from Earnings (Note 2) | | | (10,781,785 | ) | | | (210,442 | ) |
| | | | | | | | | |
| Capital Transactions | | | | | | | | |
| Proceeds from shares sold | | | 5,919,742 | | | | 12,438,096 | |
| Reinvestment of distributions | | | 10,619,805 | | | | 206,341 | |
| Amount paid for shares redeemed | | | (9,934,151 | ) | | | (14,329,246 | ) |
| Net increase (decrease) in net assets resulting from capital transactions | | | 6,605,396 | | | | (1,684,809 | ) |
| Total Increase (Decrease) in Net Assets | | | (12,974,453 | ) | | | 12,593,115 | |
| | | | | | | | | |
| Net Assets | | | | | | | | |
| Beginning of year | | | 68,884,550 | | | | 56,291,435 | |
| End of year | | $ | 55,910,097 | | | $ | 68,884,550 | |
| | | | | | | | | |
| Share Transactions | | | | | | | | |
| Shares sold | | | 605,232 | | | | 1,065,535 | |
| Shares issued in reinvestment of distributions | | | 1,024,089 | | | | 18,293 | |
| Shares redeemed | | | (991,783 | ) | | | (1,208,402 | ) |
| Net increase (decrease) in shares outstanding | | | 637,538 | | | | (124,574 | ) |
See accompanying notes which are an integral part of these financial statements.
THIS PAGE INTENTIONALLY LEFT BLANK
| SOUND MIND INVESTING FUND |
| FINANCIAL HIGHLIGHTS |
| (For a share outstanding during each year) |
| | | For the Year | |
| | | Ended | |
| | | October 31, | |
| | | 2022 | |
| Selected Per Share Data: | | | | |
| Net asset value, beginning of year | | $ | 13.66 | |
| Income from investment operations: | | | | |
| Net investment income (loss)(a) | | | 0.55 | |
| Net realized and unrealized gain (loss) on investments | | | (1.59 | ) |
| Total from investment operations | | | (1.04 | ) |
| Less distributions to shareholders from: | | | | |
| Net investment income | | | (0.42 | ) |
| Net realized gains | | | (3.89 | ) |
| Total distributions | | | (4.31 | ) |
| Net asset value, end of year | | $ | 8.31 | |
| Total Return(b) | | | (10.72 | )% |
| Ratios and Supplemental Data: | | | | |
| Net assets, end of year (000 omitted) | | $ | 114,412 | |
| Ratio of expenses to average net assets(c) | | | 1.19 | % |
| Ratio of expenses to average net assets excluding interest expenses(c) (d) | | | 1.19 | % |
| Ratio of net investment income (loss) to average net assets(a) (c) | | | 4.87 | % |
| Portfolio turnover rate | | | 259.58 | % |
| (a) | Recognition of net investment income by the Fund is affected by the timing of the declaration of dividends by the underlying funds in which the Fund invests. |
| (b) | Total return in the above table represents the rate that the investor would have earned or lost on an investment in the Fund, assuming reinvestment of distributions. |
| (c) | These ratios exclude the impact of expenses of the underlying funds in which the Fund invests as represented in the Schedule of Investments. |
| (d) | These ratios do not include the effects of line of credit interest expense and borrowing costs. |
See accompanying notes which are an integral part of these financial statements.
| SOUND MIND INVESTING FUND |
| FINANCIAL HIGHLIGHTS |
| (For a share outstanding during each year) – (Continued) |
| For the Year | | | For the Year | | | For the Year | | | For the Year | |
| Ended | | | Ended | | | Ended | | | Ended | |
| October 31, | | | October 31, | | | October 31, | | | October 31, | |
| 2021 | | | 2020 | | | 2019 | | | 2018 | |
| | | | | | | | | | | |
| $ | 9.97 | | | $ | 9.64 | | | $ | 11.65 | | | $ | 12.52 | |
| | | | | | | | | | | | | | | |
| | (0.02 | ) | | | (0.04 | ) | | | 0.05 | | | | 0.04 | |
| | 3.71 | | | | 0.42 | | | | 0.14 | | | | 0.26 | |
| | 3.69 | | | | 0.38 | | | | 0.19 | | | | 0.30 | |
| | | | | | | | | | | | | | | |
| | — | | | | (0.05 | ) | | | (0.05 | ) | | | — | |
| | — | | | | — | | | | (2.15 | ) | | | (1.17 | ) |
| | — | | | | (0.05 | ) | | | (2.20 | ) | | | (1.17 | ) |
| | | | | | | | | | | | | | | |
| $ | 13.66 | | | $ | 9.97 | | | $ | 9.64 | | | $ | 11.65 | |
| | 37.01 | % | | | 3.92 | % | | | 4.28 | % | | | 2.36 | % |
| | | | | | | | | | | | | | | |
| $ | 150,117 | | | $ | 124,775 | | | $ | 147,650 | | | $ | 174,473 | |
| | 1.17 | % | | | 1.20 | % | | | 1.18 | % | | | 1.16 | % |
| | 1.16 | % | | | 1.20 | % | | | 1.17 | % | | | 1.16 | % |
| | (0.09 | )% | | | (0.38 | )% | | | 0.45 | % | | | 0.34 | % |
| | 300.02 | % | | | 214.07 | % | | | 192.77 | % | | | 163.54 | % |
See accompanying notes which are an integral part of these financial statements.
| SMI DYNAMIC ALLOCATION FUND |
| FINANCIAL HIGHLIGHTS |
| (For a share outstanding during each year) |
| | | For the Year | |
| | | Ended | |
| | | October 31, | |
| | | 2022 | |
| Selected Per Share Data: | | | | |
| Net asset value, beginning of year | | $ | 13.97 | |
| Income from investment operations: | | | | |
| Net investment income(a) | | | — | (b) |
| Net realized and unrealized gain (loss) on investments | | | (2.55 | ) |
| Total from investment operations | | | (2.55 | ) |
| Less distributions to shareholders from: | | | | |
| Net investment income | | | (0.06 | ) |
| Net realized gains | | | (0.98 | ) |
| Total distributions | | | (1.04 | ) |
| Net asset value, end of year | | $ | 10.38 | |
| Total Return(c) | | | (19.82 | )% |
| Ratios and Supplemental Data: | | | | |
| Net assets, end of year (000 omitted) | | $ | 85,749 | |
| Ratio of expenses to average net assets(d) | | | 1.20 | % |
| Ratio of expenses to average net assets excluding interest expenses(d) (e) | | | 1.19 | % |
| Ratio of net investment income (loss) to average net assets(a) (d) | | | (0.04 | )% |
| Portfolio turnover rate | | | 317.28 | % |
| (a) | Recognition of net investment income by the Fund is affected by the timing of the declaration of dividends by the underlying funds in which the Fund invests. |
| (c) | Total return in the above table represents the rate that the investor would have earned or lost on an investment in the Fund, assuming reinvestment of distributions. |
| (d) | These ratios exclude the impact of expenses of the underlying funds in which the Fund invests as represented in the Schedule of Investments. |
| (e) | These ratios do not include the effects of line of credit interest expense and borrowing costs. |
See accompanying notes which are an integral part of these financial statements.
| SMI DYNAMIC ALLOCATION FUND |
| FINANCIAL HIGHLIGHTS |
| (For a share outstanding during each year) – (Continued) |
| For the Year | | | For the Year | | | For the Year | | | For the Year | |
| Ended | | | Ended | | | Ended | | | Ended | |
| October 31, | | | October 31, | | | October 31, | | | October 31, | |
| 2021 | | | 2020 | | | 2019 | | | 2018 | |
| | | | | | | | | | | |
| $ | 12.45 | | | $ | 12.17 | | | $ | 11.66 | | | $ | 11.75 | |
| | | | | | | | | | | | | | | |
| | 0.10 | | | | 0.06 | | | | 0.12 | | | | 0.18 | |
| | 2.08 | | | | 0.37 | | | | 0.56 | | | | (0.16 | ) |
| | 2.18 | | | | 0.43 | | | | 0.68 | | | | 0.02 | |
| | | | | | | | | | | | | | | |
| | (0.09 | ) | | | (0.15 | ) | | | (0.17 | ) | | | (0.11 | ) |
| | (0.57 | ) | | | — | | | | — | | | | — | |
| | (0.66 | ) | | | (0.15 | ) | | | (0.17 | ) | | | (0.11 | ) |
| | | | | | | | | | | | | | | |
| $ | 13.97 | | | $ | 12.45 | | | $ | 12.17 | | | $ | 11.66 | |
| | 18.17 | % | | | 3.55 | % | | | 5.97 | % | | | 0.15 | % |
| | | | | | | | | | | | | | | |
| $ | 119,964 | | | $ | 113,195 | | | $ | 119,339 | | | $ | 132,999 | |
| | 1.17 | % | | | 1.19 | % | | | 1.18 | % | | | 1.16 | % |
| | 1.16 | % | | | 1.19 | % | | | 1.17 | % | | | 1.16 | % |
| | 0.80 | % | | | 0.44 | % | | | 1.02 | % | | | 1.45 | % |
| | 175.11 | % | | | 275.33 | % | | | 218.06 | % | | | 61.28 | % |
See accompanying notes which are an integral part of these financial statements.
| SMI MULTI-STRATEGY FUND |
| FINANCIAL HIGHLIGHTS |
| (For a share outstanding during each year) |
| | | For the Year | |
| | | Ended | |
| | | October 31, | |
| | | 2022 | |
| Selected Per Share Data: | | | | |
| Net asset value, beginning of year | | $ | 12.36 | |
| Income from investment operations: | | | | |
| Net investment income(b) | | | 0.25 | |
| Net realized and unrealized gain (loss) on investments | | | (1.63 | ) |
| Total from investment operations | | | (1.38 | ) |
| Less distributions to shareholders from: | | | | |
| Net investment income | | | (0.25 | ) |
| Net realized gains | | | (1.73 | ) |
| Total distributions | | | (1.98 | ) |
| Net asset value, end of year | | $ | 9.00 | |
| Total Return(d) | | | (13.29 | )% |
| Ratios and Supplemental Data: | | | | |
| Net assets, end of year (000 omitted) | | $ | 55,910 | |
| Ratio of expenses to average net assets(e) | | | 1.16 | % |
| Ratio of expenses to average net assets excluding interest expenses(e) (f) | | | 1.15 | % |
| Ratio of expenses to average net assets before waiver and reimbursement(e) | | | 1.19 | % |
| Ratio of net investment income to average net assets(b) (e) | | | 2.20 | % |
| Portfolio turnover rate | | | 292.22 | % |
| (a) | As described in Note 1 of the Notes to the Financial Statements, the Former 50/40/10 Fund was reorganized into the SMI Conservative Allocation Fund as of the close of business, April 27, 2018 and subsequently renamed. The Fund is the successor to the Former 50/40/10 Fund. The performance and financial information presented incorporates the operations of the Former 50/40/10 Fund, which, is a result of the reorganization, are the Fund’s operations. The per share amounts have been adjusted for a stock split that occurred on April 27, 2018. On February 28, 2022, the SMI 50/40/10 Fund was renamed SMI Multi-Strategy Fund. |
| (b) | Recognition of net investment income by the Fund is affected by the timing of the declaration of dividends by the underlying funds in which the Fund invests. |
| (c) | Per share net investment income has been determined on the basis of average shares outstanding during the year. |
| (d) | Total return in the above table represents the rate that the investor would have earned or lost on an investment in the Fund, assuming reinvestment of distributions. |
| (e) | These ratios exclude the impact of expenses of the underlying funds in which the Fund invests as represented in the Schedule of Investments. |
| (f) | These ratios do not include the effects of line of credit interest expense and borrowing costs. |
See accompanying notes which are an integral part of these financial statements.
| SMI MULTI-STRATEGY FUND |
| FINANCIAL HIGHLIGHTS |
| (For a share outstanding during each year) – (Continued) |
| For the Year | | | For the Year | | | For the Year | | | For the Year | |
| Ended | | | Ended | | | Ended | | | Ended | |
| October 31, | | | October 31, | | | October 31, | | | October 31, | |
| 2021 | | | 2020 | | | 2019 | | | 2018(a) | |
| | | | | | | | | | | | | | | |
| $ | 9.88 | | | $ | 9.46 | | | $ | 9.46 | | | $ | 9.65 | |
| | | | | | | | | | | | | | | |
| | 0.04 | | | | 0.01 | | | | 0.05 | | | | 0.10 | (c) |
| | 2.48 | | | | 0.45 | | | | 0.26 | | | | (0.04 | ) |
| | 2.52 | | | | 0.46 | | | | 0.31 | | | | 0.06 | |
| | | | | | | | | | | | | | | |
| | (0.04 | ) | | | (0.04 | ) | | | (0.07 | ) | | | (0.11 | ) |
| | — | | | | — | | | | (0.24 | ) | | | (0.14 | ) |
| | (0.04 | ) | | | (0.04 | ) | | | (0.31 | ) | | | (0.25 | ) |
| | | | | | | | | | | | | | | |
| $ | 12.36 | | | $ | 9.88 | | | $ | 9.46 | | | $ | 9.46 | |
| | 25.51 | % | | | 4.91 | % | | | 3.55 | % | | | 0.36 | % |
| | | | | | | | | | | | | | | |
| $ | 68,885 | | | $ | 56,291 | | | $ | 62,614 | | | $ | 66,305 | |
| | 1.16 | % | | | 1.16 | % | | | 1.15 | % | | | 1.24 | % |
| | 1.15 | % | | | 1.15 | % | | | 1.15 | % | | | 1.23 | % |
| | 1.14 | % | | | 1.19 | % | | | 1.21 | % | | | 1.39 | % |
| | 0.35 | % | | | 0.09 | % | | | 0.53 | % | | | 1.03 | % |
| | 231.35 | % | | | 252.74 | % | | | 225.42 | % | | | 155.28 | % |
See accompanying notes which are an integral part of these financial statements.
| SMI FUNDS |
| NOTES TO THE FINANCIAL STATEMENTS |
| October 31, 2022 |
NOTE 1. ORGANIZATION
The Sound Mind Investing Fund (“SMI Fund”), SMI Dynamic Allocation Fund and SMI Multi-Strategy Fund (each a “Fund” and collectively, the “Funds”) are each registered under the Investment Company Act of 1940, as amended (“1940 Act”), as a diversified series of Valued Advisers Trust (the “Trust”). The Trust is a management investment company established under the laws of Delaware by an Agreement and Declaration of Trust dated June 13, 2008 (the “Trust Agreement”). The Trust Agreement permits the Board of Trustees (the “Board” or the “Trustees”) to issue an unlimited number of shares of beneficial interest of separate series without par value. Each Fund is one of a series of funds currently authorized by the Trustees. The investment adviser to the Funds is SMI Advisory Services, LLC (the “Adviser”). The SMI Fund seeks to provide long-term capital appreciation. The SMI Dynamic Allocation Fund and SMI Multi-Strategy Fund seek total return. Total return is composed of both income and capital appreciation.
Each of the Funds is a “fund-of-funds” in which each Fund may invest in other investment companies, including exchange-traded and closed-end funds. For a discussion on the strategies employed by each of the Funds, please refer to pages 9-11 of this report.
On February 28, 2022, the SMI 50/40/10 Fund was renamed the SMI Multi-Strategy Fund. At the close of business on April 27, 2018, the SMI Conservative Allocation Fund was renamed the SMI 50/40/10 Fund and acquired all of the assets and assumed all of the liabilities of the previous SMI 50/40/10 Fund (the “Former 50/40/10 Fund”), pursuant to an agreement and plan of reorganization approved by the Board on December 12, 2017. The reorganization qualified as a tax-free reorganization for federal income tax purposes with no gain or loss recognized to the Funds or their shareholders. The SMI 50/40/10 Fund is considered the surviving entity for tax purposes.
Due to the reorganization on April 27, 2018, the number of outstanding shares of the Former 50/40/10 Fund increased by a factor of 1.132099; and since the Former 50/40/10 Fund’s total number of shares outstanding increased, the net asset value decreased. The reorganization did not affect the value of the Former 50/40/10 Fund’s net assets or each shareholder’s proportional ownership interest in those assets. The per share data presented in the Financial Highlights have been adjusted for periods prior to April 27, 2018 as a result.
NOTE 2. SIGNIFICANT ACCOUNTING POLICIES
The Funds are investment companies and follow accounting and reporting guidance under Financial Accounting Standards Board Accounting Standards Codification (“ASC”) Topic 946, “Financial Services-Investment Companies” including Accounting Standards Update 2013-08. The following is a summary of significant accounting policies followed by the Funds in the preparation of their financial statements. These policies are in conformity with generally accepted accounting principles in the United States of America (“GAAP”).
| SMI FUNDS |
| NOTES TO THE FINANCIAL STATEMENTS |
| October 31, 2022 – (Continued) |
NOTE 2. SIGNIFICANT ACCOUNTING POLICIES – (Continued)
Estimates – The preparation of financial statements in conformity with GAAP requires management to make estimates and assumptions that affect the reported amounts of assets and liabilities and disclosure of contingent assets and liabilities at the date of the financial statements and the reported amounts of increases and decreases in net assets from operations during the reporting period. Actual results could differ from those estimates.
Federal Income Taxes – The Funds make no provision for federal income or excise tax. Each Fund has qualified and intends to qualify each year as a regulated investment company (“RIC”) under subchapter M of the Internal Revenue Code of 1986, as amended, by complying with the requirements applicable to RICs and by distributing substantially all of its taxable income. Each Fund also intends to distribute sufficient net investment income and net capital gains, if any, so that it will not be subject to excise tax on undistributed income and gains. If the required amount of net investment income or gains is not distributed, the Funds could incur a tax expense.
As of and during the fiscal year ended October 31, 2022, the Funds did not have any liabilities for any unrecognized tax benefits. The Funds recognize interest and penalties, if any, related to unrecognized tax benefits as income tax expense on the Statements of Operations when incurred. During the fiscal year ended October 31, 2022, the Funds did not incur any interest or penalties. Management of the Funds has reviewed tax positions taken in tax years that remain subject to examination by all major tax jurisdictions, including federal (i.e., the last three tax year ends and the interim tax period since then, as applicable). Management believes that there is no tax liability resulting from unrecognized tax benefits related to uncertain tax positions taken.
Expenses – Expenses incurred by the Trust that do not relate to a specific fund of the Trust are allocated to the individual funds based on each fund’s relative net assets or another appropriate basis (as determined by the Board).
Security Transactions and Related Income – The Funds follow industry practice and record security transactions on the trade date for financial reporting purposes. The specific identification method is used for determining gains or losses for financial statement and income tax purposes. Dividend income and long-term capital gains dividends from investment companies are recorded on the ex-dividend date and interest income is recorded on an accrual basis. Discounts and premiums on securities purchased are accreted or amortized using the effective interest method, if applicable. Withholding taxes on foreign dividends, if any, have been provided for in accordance with the Funds’ understanding of the applicable country’s tax rules and rates.
Dividends and Distributions – Each Fund intends to distribute its net investment income and net realized long-term and short-term capital gains, if any, at least annually. Dividends and distributions to shareholders, which are determined in accordance with income tax regulations, are recorded on the ex-dividend date. The treatment for financial reporting purposes of distributions made to shareholders during the period from net investment income or net realized capital gains may differ from their ultimate treatment for federal income tax purposes. These differences are caused primarily by differences in the timing of the recognition of certain components of income, expense or realized capital gain for federal income tax purposes. Where such differences are permanent in nature, they are reclassified among the components of the net assets based on their ultimate characterization
| SMI FUNDS |
| NOTES TO THE FINANCIAL STATEMENTS |
| October 31, 2022 – (Continued) |
NOTE 2. SIGNIFICANT ACCOUNTING POLICIES – (Continued)
for federal income tax purposes. Any such reclassifications will have no effect on net assets, results of operations or net asset value (“NAV”) per share of the Funds. For the fiscal year October 31, 2022, the Funds had the following classifications:
| | | | | | Accumulated | |
| Fund | | Paid-In Capital | | | Earnings (Deficit) | |
| SMI Fund | | $ | — | | | $ | — | |
| SMI Dynamic Allocation Fund | | | (58,653 | ) | | | 58,653 | |
| SMI Multi-Strategy Fund | | | (11,560 | ) | | | 11,560 | |
Share Valuation – The NAV is calculated each day the New York Stock Exchange (the “NYSE”) is open by dividing the total value of the Fund’s assets, less liabilities, by the number of shares outstanding for the Fund.
NOTE 3. SECURITIES VALUATION AND FAIR VALUE MEASUREMENTS
Each Fund values its portfolio securities at fair value as of the close of regular trading on the NYSE (normally 4:00 p.m. Eastern time) on each business day the NYSE is open for business. Fair value is defined as the price that a Fund would receive upon selling an investment in a timely transaction to an independent buyer in the principal or most advantageous market of the investment. GAAP establishes a three-tier hierarchy to maximize the use of observable market data and minimize the use of unobservable inputs and to establish classification of fair value measurements for disclosure purposes.
Inputs refer broadly to the assumptions that market participants would use in pricing the asset or liability, including assumptions about risk (the risk inherent in a particular valuation technique used to measure fair value including a pricing model and/or the risk inherent in the inputs to the valuation technique). Inputs may be observable or unobservable. Observable inputs are inputs that reflect the assumptions market participants would use in pricing the asset or liability developed based on market data obtained and available from sources independent of the reporting entity. Unobservable inputs are inputs that reflect the reporting entity’s own assumptions about the assumptions market participants would use in pricing the asset or liability developed based on the best information available in the circumstances.
Various inputs are used in determining the value of each Fund’s investments. These inputs are summarized in the three broad levels listed below.
| ● | Level 1 – unadjusted quoted prices in active markets for identical investments and/or registered investment companies where the value per share is determined and published and is the basis for current transactions for identical assets or liabilities at the valuation date |
| SMI FUNDS |
| NOTES TO THE FINANCIAL STATEMENTS |
| October 31, 2022 – (Continued) |
NOTE 3. SECURITIES VALUATION AND FAIR VALUE MEASUREMENTS – (Continued)
| ● | Level 2 – other significant observable inputs (including, but not limited to, quoted prices for an identical security in an inactive market, quoted prices for similar securities, interest rates, prepayment speeds, credit risk, etc.) |
| ● | Level 3 – significant unobservable inputs (including the Funds’ own assumptions in determining fair value of investments based on the best information available) |
The inputs used to measure fair value may fall into different levels of the fair value hierarchy. In such cases, for disclosure purposes, the level in the fair value hierarchy which is reported is determined based on the lowest level input that is significant to the fair value measurement in its entirety.
Equity securities, including ETFs and closed-end funds, that are traded on any stock exchange are generally valued at the last quoted sale price on the security’s primary exchange. Lacking a last sale price, an exchange-traded security is generally valued at its last bid price. Securities traded in the NASDAQ over-the-counter market are generally valued at the NASDAQ Official Closing Price. When using the market quotations and when the market is considered active, the security is classified as a Level 1 security. In the event that market quotations are not readily available or are considered unreliable due to market or other events, securities are valued in good faith by the Adviser as “valuation designee” under the oversight of the Board. The Adviser has adopted written policies and procedures for valuing securities and other assets in circumstances where market quotes are not readily available. In the event that market quotes are not readily available, and the security or asset cannot be valued pursuant to one of the valuation methods, the value of the security or asset will be determined in good faith by the Adviser pursuant to its policies and procedures. On a quarterly basis, the Adviser’s fair valuation determinations will be reviewed by the Board. Under these policies, the securities will be classified as Level 2 or 3 within the fair value hierarchy, depending on the inputs used.
Investments in mutual funds, including money market mutual funds, are generally priced at the ending NAV. These securities are categorized as Level 1 securities. In the event that the ending NAV for a mutual fund is unavailable at the end of day pricing time, the Adviser may, in accordance with the Trust’s valuation policies, consider all appropriate factors in determining the fair value of the mutual fund. In such cases the security will generally be categorized as a Level 2 security.
The following is a summary of the inputs used to value the Funds’ investments as of October 31, 2022:
| | | Valuation Inputs | |
| SMI Fund | | Level 1 | | | Level 2 | | | Level 3 | | | Total | |
| Exchange-Traded Funds | | $ | 39,493,910 | | | $ | — | | | $ | — | | | $ | 39,493,910 | |
| Mutual Funds | | | 255,020 | | | | — | | | | — | | | | 255,020 | |
| Money Market Funds | | | 74,577,649 | | | | — | | | | — | | | | 74,577,649 | |
| Total | | $ | 114,326,579 | | | $ | — | | | $ | — | | | $ | 114,326,579 | |
| SMI FUNDS |
| NOTES TO THE FINANCIAL STATEMENTS |
| October 31, 2022 – (Continued) |
NOTE 3. SECURITIES VALUATION AND FAIR VALUE MEASUREMENTS – (Continued)
| | | Valuation Inputs | |
| SMI Dynamic Allocation Fund | | Level 1 | | | Level 2 | | | Level 3 | | | Total | |
| Exchange-Traded Funds | | $ | 29,315,635 | | | $ | — | | | $ | — | | | $ | 29,315,635 | |
| Closed End Funds | | | 16,632,464 | | | | — | | | | — | | | | 16,632,464 | |
| Mutual Funds | | | 3,488,471 | | | | — | | | | — | | | | 3,488,471 | |
| Money Market Funds | | | 22,556 | | | | — | | | | — | | | | 22,556 | |
| Total | | $ | 49,459,126 | | | $ | — | | | $ | — | | | $ | 49,459,126 | |
| | | | | | | | | | | | | | | | | |
| | | Valuation Inputs | |
| SMI Multi-Strategy Fund | | Level 1 | | | Level 2 | | | Level 3 | | | Total | |
| Exchange-Traded Funds | | $ | 22,405,213 | | | $ | — | | | $ | — | | | $ | 22,405,213 | |
| Closed End Funds | | | 8,416,570 | | | | — | | | | — | | | | 8,416,570 | |
| Mutual Funds | | | 779,174 | | | | — | | | | — | | | | 779,174 | |
| Money Market Funds | | | 14,305,201 | | | | — | | | | — | | | | 14,305,201 | |
| Total | | $ | 45,906,158 | | | $ | — | | | $ | — | | | $ | 45,906,158 | |
The Funds did not hold any investments at the end of the reporting period for which significant unobservable inputs (Level 3) were used in determining fair value; therefore, no reconciliation of Level 3 securities is included for this reporting period.
NOTE 4. FEES AND OTHER TRANSACTIONS WITH AFFILIATES
Under the terms of the investment advisory agreement with respect to each Fund (the “Advisory Agreements”), the Adviser is responsible for managing each Fund’s investments. As compensation for its management services, each Fund is obligated to pay the Adviser a fee based on the Fund’s average daily net assets as follows:
| | | | | | | SMI |
| | | | | SMI Dynamic | | Multi-Strategy |
| | | SMI Fund | | Allocation Fund | | Fund |
| Fund Assets | | Management Fee | | Management Fee | | Management Fee |
| $1 – $100 million | | 1.00% | | 1.00% | | 0.90% |
| $100,000,001 – $250 million | | 1.00% | | 1.00% | | 0.80% |
| $250,000,001 to $500 million | | 0.90% | | 0.90% | | 0.70% |
| Over $500 million | | 0.80% | | 0.80% | | 0.60% |
| SMI FUNDS |
| NOTES TO THE FINANCIAL STATEMENTS |
| October 31, 2022 – (Continued) |
NOTE 4. FEES AND OTHER TRANSACTIONS WITH AFFILIATES – (Continued)
The Adviser contractually has agreed to waive its management fee and/or reimburse certain operating expenses, but only to the extent necessary so that each Fund’s total annual operating expenses (excluding interest, taxes, brokerage commissions, other expenses which are capitalized in accordance with GAAP, extraordinary expenses, dividend expense on short sales, 12b-1 fees, and acquired fund fees and expenses) do not exceed 1.50% of the Fund’s average daily net assets with respect to the SMI Fund, 1.45% with respect to the SMI Dynamic Allocation Fund, and 1.15% with respect to the SMI Multi-Strategy Fund. The contractual arrangement for each Fund is in place through February 28, 2023.
Each fee waiver or expense reimbursement by the Adviser is subject to repayment by the applicable Fund within the three years following the date in which the fee waiver or expense reimbursement occurred, provided that the Fund is able to make the repayment without exceeding the expense limitation in effect at the time of the fee waiver or expense reimbursement and the expense limitation at the time of the repayment.
As of October 31, 2022, the Adviser may seek repayment of investment advisory fee waivers and expense reimbursements from the SMI Multi-Strategy Fund as follows:
| Recoverable through | | Amount | |
| October 31, 2023 | | $ | 18,349 | |
| October 31, 2025 | | | 21,003 | |
The Trust retains Ultimus Fund Solutions, LLC (“Ultimus” or “Administrator”), to provide the Funds with administration, fund accounting, and transfer agent services, including all regulatory reporting. Prior to April 1, 2022, the Administrator also provided certain compliance services to the Fund. Expenses incurred by the Funds for these services are allocated to the individual Funds based on each Fund’s relative net assets.
Effective April 1, 2022, Northern Lights Compliance Services, LLC (“NLCS”), an affiliate of Ultimus, provides a Chief Compliance Officer to the Trust, as well as related compliance services, pursuant to a consulting agreement between NLCS and the Trust. Under the terms of such agreement, NLCS receives fees from the Funds.
The officers and one trustee of the Trust are members of management and/or employees of the Administrator or of NLCS and are not paid by the Trust for services to the Funds. Ultimus Fund Distributors, LLC (the “Distributor”), a wholly-owned subsidiary of Ultimus, acts as the distributor of the Funds’ shares. There were no payments made to the Distributor by the Funds for the fiscal year ended October 31, 2022.
| SMI FUNDS |
| NOTES TO THE FINANCIAL STATEMENTS |
| October 31, 2022 – (Continued) |
NOTE 5. PURCHASES AND SALES OF SECURITIES
For the fiscal year ended October 31, 2022, purchases and sales of investment securities, other than short-term investments, were as follows:
| | | | | | | | | SMI | |
| | | | | | SMI Dynamic | | | Multi-Strategy | |
| | | SMI Fund | | | Allocation Fund | | | Fund | |
| Purchases | | $ | 246,332,382 | | | $ | 307,039,010 | | | $ | 151,431,195 | |
| Sales | | $ | 333,254,626 | | | $ | 354,327,031 | | | $ | 177,875,723 | |
There were no purchases or sales of long-term U.S. government obligations during the fiscal year ended October 31, 2022.
NOTE 6. LINE OF CREDIT
During the fiscal year ended October 31, 2022, the Trust, on behalf of the Funds, entered into a short-term credit agreement (“Line of Credit”) with Huntington National Bank (“Huntington”), expiring on January 20, 2023. Under the terms of the agreement, each of the Funds may borrow up to the lesser of 10% of a Fund’s daily market value or $5 million at an interest rate equal to the Secured Overnight Financing Rate (“SOFR”) plus 161.50 basis points (if SOFR is less than 0.385%, such rate shall be deemed to be 0.385%), 5.11% as of October 31, 2022. Prior to January 21, 2022, the interest rate was equal to the London Interbank Offered Rate plus 150 basis points. The purpose of the agreement is to meet temporary or emergency cash needs, including redemption requests that might otherwise require the untimely disposition of securities. Huntington receives an annual facility fee of 0.125% on $5 million as well as an additional annual fee of 0.125% on any unused portion of the credit facility, invoiced quarterly, for providing the Line of Credit. The Funds will not borrow money, except (a) from a bank, provided that immediately after such borrowing there is an asset coverage of 300% for all borrowings of a Fund; or (b) from a bank or other persons for temporary purposes only, provided that such temporary borrowings are in an amount not exceeding 5% of a Fund’s total assets at the time when the borrowing is made. To the extent that the line of credit is utilized, it will be collateralized by securities in the Funds’ portfolios.
| SMI FUNDS |
| NOTES TO THE FINANCIAL STATEMENTS |
| October 31, 2022 – (Continued) |
NOTE 6. LINE OF CREDIT – (Continued)
As of October 31, 2022, the Funds had no outstanding borrowings under this Line of Credit.
| | | | | | Weighted | | | | | | | | | | |
| | | Average | | | Average | | | | | | Interest | | | Maximum | |
| | | Daily Loan | | | Interest | | | Number of Days | | | Expense | | | Loan | |
| Fund | | Balance(a) | | | Rate(a) | | | Outstanding(b) | | | Accrued | | | Outstanding | |
| SMI Fund | | $ | 255,495 | | | 2.00% | | | 10 | | | $ | 142 | | | $ | 350,000 | |
| SMI Dynamic Allocation Fund | | | 361,997 | | | 2.04% | | | 15 | | | | 308 | | | | 3,400,000 | |
| SMI Multi-Strategy Fund | | | 132,000 | | | 2.00% | | | 5 | | | | 37 | | | | 310,000 | |
| (a) | Averages based on the number of days outstanding. |
| (b) | Number of Days Outstanding represents the total days during the fiscal year ended October 31, 2022, that a Fund utilized the Line of Credit. |
NOTE 7. FEDERAL TAX INFORMATION
At October 31, 2022, the net unrealized appreciation (depreciation) and tax cost of investments for tax purposes was as follows:
| | | | | | | | | SMI | |
| | | | | | SMI Dynamic | | | Multi-Strategy | |
| | | SMI Fund | | | Allocation Fund | | | Fund | |
| Gross unrealized appreciation | | $ | 244,121 | | | $ | 1,156 | | | $ | 1,416,054 | |
| Gross unrealized depreciation | | | (77,507 | ) | | | (3,848,657 | ) | | | (1,572,582 | ) |
| Net unrealized appreciation/(depreciation) on investments | | $ | 166,614 | | | $ | (3,847,501 | ) | | $ | (156,528 | ) |
| Tax cost of investments | | $ | 114,159,965 | | | $ | 53,306,627 | | | $ | 46,062,686 | |
| SMI FUNDS |
| NOTES TO THE FINANCIAL STATEMENTS |
| October 31, 2022 – (Continued) |
NOTE 7. FEDERAL TAX INFORMATION – (Continued)
The tax character of distributions for the fiscal years ended October 31, 2022 and October 31, 2021 were as follows:
| | | SMI Fund | | | SMI Dynamic Allocation Fund | |
| | | 2022 | | | 2021 | | | 2022 | | | 2021 | |
| Distributions paid from:(a) | | | | | | | | | | | | | | | | |
| Ordinary income | | $ | 27,151,153 | | | $ | — | | | $ | 5,887,026 | | | $ | 2,123,182 | |
| Long-term capital gains | | | 19,416,250 | | | | — | | | | 2,873,365 | | | | 3,850,169 | |
| Total taxable distributions paid | | $ | 46,567,403 | | | $ | — | | | $ | 8,760,391 | | | $ | 5,973,351 | |
| | | | | | | | | | | | | | | | | |
| | | | | | | | | SMI Multi-Strategy Fund | |
| | | | | | | | | 2022 | | | 2021 | |
| Distributions paid from:(a) | | | | | | | | | | | | | | | | |
| Ordinary income | | | | | | | | | | $ | 6,876,889 | | | $ | 210,442 | |
| Long-term capital gains | | | | | | | | | | | 3,904,896 | | | | — | |
| Total taxable distributions paid | | | | | | | | | | $ | 10,781,785 | | | $ | 210,442 | |
| (a) | For federal income tax purposes, distributions of short-term capital gains are treated as ordinary income distributions. |
At October 31, 2022, the components of distributable earnings (accumulated losses) on a tax basis was as follows:
| | | | | | | | | SMI | |
| | | | | | SMI Dynamic | | | Multi-Strategy | |
| | | SMI Fund | | | Allocation Fund | | | Fund | |
| Undistributed ordinary income | | $ | 1,084,984 | | | $ | — | | | $ | — | |
| Undistributed long-term capital gains | | | — | | | | — | | | | — | |
| Accumulated capital and other losses | | | (12,555,377 | ) | | | (1,027,596 | ) | | | (2,824,987 | ) |
| Unrealized appreciation on investments | | | 166,614 | | | | (3,847,501 | ) | | | (156,528 | ) |
| Total accumulated earnings | | $ | (11,303,779 | ) | | $ | (4,875,097 | ) | | $ | (2,981,515 | ) |
At October 31, 2022, the difference between book basis and tax basis unrealized appreciation (depreciation) is attributable to the tax deferral of losses on wash sales.
| SMI FUNDS |
| NOTES TO THE FINANCIAL STATEMENTS |
| October 31, 2022 – (Continued) |
NOTE 7. FEDERAL TAX INFORMATION – (Continued)
At October 31, 2022, the following Funds had net capital loss carryforwards which are available to offset future net capital gains, if any:
| | | SMI Fund | | | SMI Dynamic Allocation Fund | |
| | | Short-Term | | | Long-Term | | | Short-Term | | | Long-Term | |
| Non-Expiring | | $ | 12,555,377 | | | $ | — | | | $ | 729,602 | | | $ | — | |
| | | | | | | | | | | | | | | | | |
| | | | | | SMI Multi-Strategy Fund | |
| | | | | | | | | Short-Term | | | Long-Term | |
| Non-Expiring | | | | | | | | | | $ | 2,824,987 | | | $ | — | |
Certain qualified late year ordinary losses incurred after December 31, and within the current taxable year, are deemed to arise on the first business day of the Fund’s following taxable year. For the tax year ended October 31, 2022, the SMI Dynamic Allocation Fund deferred Qualified Late Year Ordinary Losses in the amount of $297,994.
NOTE 8. INVESTMENT IN OTHER INVESTMENT COMPANIES
Each Fund may invest a significant portion of its assets in shares of one or more investment companies, including ETFs, open-end and closed-end mutual funds and money market mutual funds. Each Fund will incur additional indirect expenses (acquired fund fees and expenses) to the extent it invests in shares of other investment companies. As of October 31, 2022, the SMI Fund had 34.52% and 0.22% of the value of its net assets invested in ETFs and mutual funds, respectively. As of October 31, 2022, the SMI Dynamic Allocation Fund had 34.19%, 19.40% and 4.06% of the value of its net assets invested in ETFs, closed end funds and mutual funds, respectively. As of October 31, 2022, the SMI Multi-Strategy Fund had 40.08%, 15.05% and 1.39% of the value of its net assets invested in ETFs, closed end funds and mutual funds, respectively. The financial statements of these ETFs, mutual funds and closed-end funds can be found at www.sec.gov.
NOTE 9. COMMITMENTS AND CONTIGENCIES
The Trust indemnifies its officers and Trustees for certain liabilities that may arise from their performance of their duties to the Trust or the Funds. Additionally, in the normal course of business, the Trust enters into contracts that contain a variety of representations and warranties which provide general indemnifications. The Trust’s maximum exposure under these arrangements is unknown, as this would involve future claims that may be made against the Trust that have not yet occurred.
| SMI FUNDS |
| NOTES TO THE FINANCIAL STATEMENTS |
| October 31, 2022 – (Continued) |
NOTE 10. SUBSEQUENT EVENTS
Management of the Funds has evaluated the need for disclosures and/or adjustments resulting from subsequent events through the date at which these financial statements were issued. Based upon this evaluation, management has determined there were no items requiring adjustment of the financial statements or additional disclosure.
| REPORT OF INDEPENDENT REGISTERED |
| PUBLIC ACCOUNTING FIRM |
To the Shareholders of SMI Funds and
Board of Trustees of Valued Advisers Trust
Opinion on the Financial Statements
We have audited the accompanying statements of assets and liabilities, including the schedules of investments, of SMI Funds comprising Sound Mind Investing Fund, SMI Dynamic Allocation Fund, and SMI Multi-Strategy Fund (formerly, SMI 50/40/10 Fund) (the “Funds”), each a series of Valued Advisers Trust, as of October 31, 2022, the related statements of operations for the year then ended, the statements of changes in net assets for each of the two years in the period then ended, the related notes, and the financial highlights for each of the five years in the period then ended (collectively referred to as the “financial statements”). In our opinion, the financial statements present fairly, in all material respects, the financial position of each of the Funds as of October 31, 2022, the results of their operations for the year then ended, the changes in net assets for each of the two years in the period then ended, and the financial highlights for each of the five years in the period then ended, in conformity with accounting principles generally accepted in the United States of America.
Basis for Opinion
These financial statements are the responsibility of the Funds’ management. Our responsibility is to express an opinion on the Funds’ financial statements based on our audits. We are a public accounting firm registered with the Public Company Accounting Oversight Board (United States) (“PCAOB”) and are required to be independent with respect to the Funds in accordance with the U.S. federal securities laws and the applicable rules and regulations of the Securities and Exchange Commission and the PCAOB.
We conducted our audits in accordance with the standards of the PCAOB. Those standards require that we plan and perform the audit to obtain reasonable assurance about whether the financial statements are free of material misstatement whether due to error or fraud.
Our audits included performing procedures to assess the risks of material misstatement of the financial statements, whether due to error or fraud, and performing procedures that respond to those risks. Such procedures included examining, on a test basis, evidence regarding the amounts and disclosures in the financial statements. Our procedures included confirmation of securities owned as of October 31, 2022, by correspondence with the custodian and brokers. Our audits also included evaluating the accounting principles used and significant estimates made by management, as well as evaluating the overall presentation of the financial statements. We believe that our audits provide a reasonable basis for our opinion.
We have served as the auditor of one or more of the Funds since 2006.
COHEN & COMPANY, LTD.
Cleveland, Ohio
December 28, 2022
| LIQUIDITY RISK MANAGEMENT PROGRAM – (Unaudited) |
Valued Advisers Trust has adopted and implemented a written liquidity risk management program as required by Rule 22e-4 (the “Liquidity Rule”) under the Investment Company Act. The program is reasonably designed to assess and manage each Fund’s liquidity risk, taking into consideration, among other factors, the Fund’s investment strategy and the liquidity of its portfolio investments during normal and reasonably foreseeable stressed conditions; its short and long-term cash flow projections; and its cash holdings and access to other funding sources. The Board of Trustees approved the appointment of a Liquidity Administrator Committee, which includes representatives from SMI Advisory Services, LLC, the Funds’ investment adviser, and Ultimus Fund Solutions, LLC, the Funds’ Administrator. The Liquidity Administrator Committee is responsible for the program’s administration and oversight and for reporting to the Board on at least an annual basis regarding the program’s operation and effectiveness. The Liquidity Administrator Committee updated its assessment of each Fund’s liquidity risk profile, considering additional data gathered during the period June 1, 2021 through May 31, 2022 (the “Review Period”) and the adequacy and effectiveness of the liquidity risk management program’s operations during the Review Period in order to prepare a written report for the Board of Trustees (the “Report”) for consideration at its meeting held on September 7, 2022. The Report noted that during the Review Period none of the Funds experienced unusual stress or disruption to its operations related to purchase and redemption activity. It further noted that during the Review Period each Fund held adequate levels of cash and highly liquid investments to meet shareholder redemption activities in accordance with applicable requirements. The Report concluded that (i) the Trust’s liquidity risk management program is reasonably designed to prevent violations of the Liquidity Rule and (ii) the Trust’s liquidity risk management program had been effectively implemented during the Review Period.
| SUMMARY OF FUND EXPENSES – (Unaudited) |
As a shareholder of a Fund, you incur two types of costs: (1) transaction costs and (2) ongoing costs, including management fees and other Fund expenses. These examples are intended to help you understand your ongoing costs (in dollars) of investing in each Fund and to compare these costs with the ongoing costs of investing in other funds. Each Fund’s example is based on an investment of $1,000 invested at the beginning of the period and held for the entire period from May 1, 2022 through October 31, 2022.
Actual Expenses
The first line of the table below provides information about actual account values and actual expenses. You may use the information in this line, together with the amount you invested, to estimate the expenses that you paid over the period. Simply divide your account value by $1,000 (for example, an $8,600 account value divided by $1,000 = 8.6), then multiply the result by the number in the first line under the heading “Expenses Paid During Period” to estimate the expenses you paid on your account during this period.
Hypothetical Example for Comparison Purposes
The second line of the table below provides information about hypothetical account values and hypothetical expenses based on the Fund’s actual expense ratio and an assumed rate of return of 5% per year before expenses, which is not the Fund’s actual return. The hypothetical account values and expenses may not be used to estimate the actual ending account balance or expenses you paid for the period. You may use this information to compare the ongoing costs of investing in the Fund and other funds. To do so, compare this 5% hypothetical example with the 5% hypothetical examples that appear in the shareholder reports of other funds.
Expenses shown in the table are meant to highlight your ongoing costs only and do not reflect any transactional costs. Therefore, the second line of the table below is useful in comparing ongoing costs only and will not help you determine the relative total costs of owning different funds. In addition, if transaction costs were included, your costs would have been higher.
| SUMMARY OF FUND EXPENSES – (Unaudited), (Continued) |
| | | Beginning | | Ending | | | | |
| | | Account Value | | Account Value | | Expenses Paid | | Annualized |
| | | May 1, 2022 | | October 31, 2022 | | During Period(a) | | Expense Ratio |
| SMI FUND |
| Actual | | $1,000.00 | | $959.60 | | $5.93 | | 1.20% |
| Hypothetical(b) | | $1,000.00 | | $1,019.16 | | $6.11 | | 1.20% |
| | | | | | | | | |
| SMI DYNAMIC ALLOCATION FUND |
| Actual | | $1,000.00 | | $870.10 | | $5.70 | | 1.21% |
| Hypothetical(b) | | $1,000.00 | | $1,019.11 | | $6.16 | | 1.21% |
| | | | | | | | | |
| SMI MULTI-STRATEGY FUND |
| Actual | | $1,000.00 | | $931.70 | | $5.65 | | 1.16% |
| Hypothetical(b) | | $1,000.00 | | $1,019.36 | | $5.90 | | 1.16% |
| (a) | Expenses are equal to the Fund’s annualized expense ratios, multiplied by the average account value over the period, multiplied by 184/365 (to reflect the one-half year period). |
| (b) | Hypothetical assumes 5% annual return before expenses. |
| ADDITIONAL FEDERAL INCOME TAX INFORMATION (Unaudited) |
The Form 1099-DIV you receive in January 2023 will show the tax status of all distributions paid to your account in calendar year 2022. Shareholders are advised to consult their own tax adviser with respect to the tax consequences of their investment in the Fund. As required by the Internal Revenue Code and/or regulations, shareholders must be notified regarding the status of qualified dividend income for individuals and the dividends received deduction for corporations.
Qualified Dividend Income. The Funds designate the following percentage or up to the maximum amount of such dividends allowable pursuant to the Internal Revenue Code, as qualified dividend income eligible for the reduced tax rate.
| | | | | SMI Dynamic | | SMI Multi- |
| | | SMI Fund | | Allocation Fund | | Strategy Fund |
| Qualified Dividend Income | | 6% | | 19% | | 12% |
Qualified Business Income. The Funds designate the following percentage of ordinary income dividends, or up to the maximum amount of such dividends allowable pursuant to the Internal Revenue Code, as qualified business income.
| | | | | SMI Dynamic | | SMI Multi- |
| | | SMI Fund | | Allocation Fund | | Strategy Fund |
| Qualified Business Income | | 0% | | 0% | | 0% |
Dividends Received Deduction. Corporate shareholders are generally entitled to take the dividends received deduction on the portion of the Funds’ dividend distribution that qualifies under tax law. For the Funds’ calendar year 2022 ordinary income dividends, the following percentage qualifies for the corporate dividends received deduction.
| | | | | SMI Dynamic | | SMI Multi- |
| | | SMI Fund | | Allocation Fund | | Strategy Fund |
| Dividends Received Deduction | | 5% | | 8% | | 8% |
The Funds designate the following amounts as long-term capital gains distributions. The amounts designated may not agree with long-term capital gains in the tax character of distribution table due to utilization of earnings and profits distributed to shareholders on redemption of shares.
| | | | | | SMI Dynamic | | | SMI Multi- | |
| | | SMI Fund | | | Allocation Fund | | | Strategy Fund | |
| Long-Term Capital Gains Distributions | | $ | 19,416,250 | | | $ | 2,868,182 | | | $ | 3,904,390 | |
| Trustees and Officers – (Unaudited) |
The Board of Trustees supervises the business activities of the Trust. Each Trustee serves as a trustee until termination of the Trust unless the Trustee dies, resigns, retires or is removed.
The following table provides information regarding each of the Independent Trustees.
Name, Address*, (Age),
Position with Trust**,
Term of Position with Trust | Principal Occupation During
Past 5 Years and Other Directorships | Other Directorships |
Andrea N. Mullins, 55
Independent Trustee Since
December 2013 Chairperson Since March 2017 | Current: Private investor; Independent Contractor, SWM Advisors (since April 2014). | Trustee, Angel Oak Funds Trust (since February 2019) (5 portfolios); Trustee, Angel Oak Strategic Credit Fund (since February 2019); Trustee, Angel Oak Financial Strategies Income Term Trust (since May 2019); Trustee, Angel Oak Credit Opportunities Term Trust (since January 2021); Trustee and Audit Committee Chair, Cushing Mutual Funds Trust (since November 2021) (2 portfolios); Trustee and Audit Committee Chair, Cushing MLP & Infrastructure Total Return Fund (since November 2021); Trustee and Audit Committee Chair, NXG NextGen Infrastructure Income Fund (since November 2021). |
| Trustees and Officers – (Unaudited), (Continued) |
Name, Address*, (Age),
Position with Trust**,
Term of Position with Trust | Principal Occupation During
Past 5 Years and Other Directorships | Other Directorships |
Ira P. Cohen, 63
Independent Trustee Since June
2010 | Current: Independent financial services consultant (since February 2005); Executive Vice President of Asset Management Services, Recognos Financial (since August 2015). | Trustee and Audit Committee Chairman, Apollo Diversified Real Estate Fund (since March 2022); Trustee, Chairman and Nominating and Governance Committee Chairman, Angel Oak Funds Trust (since October 2014) (5 portfolios); Trustee, Chairman, and Nominating and Governance Committee Chairman, Angel Oak Strategic Credit Fund (since December 2017); Trustee, Chairman, and Nominating and Governance Committee Chairman, Angel Oak Financial Strategies Income Term Trust (since May 2019); Trustee, Chairman, and Nominating and Governance Committee Chairman, Angel Oak Credit Opportunities Term Trust (since January 2021); Trustee and Nominating and Governance Committee Chairman, U.S. Fixed Income Trust (since March 2019). |
| * | The address for each Trustee is 225 Pictoria Drive, Suite 450, Cincinnati, Ohio 45246. |
| ** | As of the date of this report, the Trust consists of 16 series. |
The following table provides information regarding the Trustee who is considered an “interested person” of the Trust, as that term is defined under the 1940 Act.
Name, Address*, (Age),
Position with Trust**,
Term of Position with Trust | Principal Occupation During
Past 5 Years and Other Directorships | Other Directorships |
Mark J. Seger***, 60
Trustee Since March 2017
President Since December
2021 | Current: Vice Chairman and Co-Founder, Ultimus Fund Solutions, LLC and its subsidiaries (since 1999). | None. |
| * | The address for each Trustee is 225 Pictoria Drive, Suite 450, Cincinnati, Ohio 45246. |
| ** | As of the date of this report, the Trust consists of 16 series. |
| *** | Mr. Seger is considered an “interested person” of the Trust because of his relationship with the Trust’s administrator, transfer agent, and distributor. |
| Trustees and Officers – (Unaudited), (Continued) |
The following table provides information regarding the Officers of the Trust:
Name, Address*, (Age),
Position with Trust**,
Term of Position with Trust | Principal Occupation During
Past 5 Years | Other Directorships |
Matt J. Miller, 46
Principal Executive Officer and
President Since March 2022 Vice President From December
2011 to March 2022 | Current: Vice President, Relationship Management, Ultimus Fund Solutions, LLC (since December 2015). | None. |
N. Lynn Bowley, 64
Chief Compliance Officer
Since April 2022 | Current: Senior Vice President, Senior Compliance Officer, Northern Lights Compliance Services, LLC (since January 2007). | None. |
Carol J. Highsmith, 58
Vice President Since August
2008 Secretary Since March 2014 | Current: Vice President, Ultimus Fund Solutions, LLC (since December 2015). | None. |
Zachary P. Richmond,42
Principal Financial Officer and
Treasurer Since September
2021 | Current: Vice President, Financial Administration, Ultimus Fund Solutions, LLC (since February 2019). Previous: Assistant Vice President, Associate Director of Financial Administration, Ultimus Fund Solutions, LLC (December 2015 to February 2019). | None. |
| Trustees and Officers – (Unaudited), (Continued) |
Name, Address*, (Age),
Position with Trust**,
Term of Position with Trust | Principal Occupation During
Past 5 Years | Other Directorships |
Stephen L. Preston, 56
AML Officer Since June 2017 | Current: Chief Compliance Officer, Ultimus Fund Distributors, LLC (since June 2011), Vice President, Financial Operations Principal, and Anti-Money Laundering Officer, Ultimus Fund Distributors, LLC (since April 2021), Treasurer, Financial Operations Principal, Chief Compliance Officer, and Anti- Money Laundering Officer, Northern Lights Distributors, LLC (since April 2021). Previous: Chief Compliance Officer, Ultimus Fund Solutions, LLC (June 2011 to August 2019); Chief Compliance Officer, Unified Financial Securities, LLC (April 2018 to December 2019) | None. |
| * | The address for each Officer is 225 Pictoria Drive, Suite 450, Cincinnati, Ohio 45246. |
| ** | As of the date of this report, the Trust consists of 16 series. |
| OTHER INFORMATION – (Unaudited) |
The Funds’ Statement of Additional Information (“SAI”) includes additional information about the Trustees and is available without charge, upon request. You may call toll-free at (877) 764-3863 to request a copy of the SAI or to make shareholder inquiries.
| FACTS | WHAT DO THE SMI FUNDS DO WITH YOUR PERSONAL INFORMATION? |
| |
| Why? | Financial companies choose how they share your personal information. Federal law gives consumers the right to limit some but not all sharing. Federal law also requires us to tell you how we collect, share, and protect your personal information. Please read this notice carefully to understand what we do. |
| |
| What? | The types of personal information we collect and share depend on the product or service you have with us. This information can include: ● Social Security number ● account balances and account transactions ● transaction or loss history and purchase history ● checking account information and wire transfer instructions |
| | When you are no longer our customer, we continue to share your information as described in this notice. |
| | |
| How? | All financial companies need to share customers’ personal information to run their everyday business. In the section below, we list the reasons financial companies can share their customers’ personal information; the reasons SMI Funds choose to share; and whether you can limit this sharing. |
| Reasons we can share your personal information | Do SMI Funds
share? |
For our everyday business purposes— such as to process your transactions, maintain your account(s), respond to court orders and legal investigations, or report to credit bureaus | Yes |
For our marketing purposes— to offer our products and services to you | No |
| For joint marketing with other financial companies | No |
For our affiliates’ everyday business purposes— information about your transactions and experiences | No |
For our affiliates’ everyday business purposes— information about your creditworthiness | No |
| For nonaffiliates to market to you | No |
| Questions? | Call (877) 764-3863 |
| Who we are |
| Who is providing this notice? | SMI Funds
Ultimus Fund Distributors, LLC (Distributor)
Ultimus Fund Solutions, LLC (Administrator) |
| |
| What we do |
| How do SMI Funds protect my personal information? | To protect your personal information from unauthorized access and use, we use security measures that comply with federal law. These measures include computer safeguards and secured files and buildings. Our service providers are held accountable for adhering to strict policies and procedures to prevent any misuse of your nonpublic personal information. |
| How do SMI Funds collect my personal information? | We collect your personal information, for example, when you ● open an account or deposit money ● buy securities from us or sell securities to us ● make deposits or withdrawals from your account or provide account information ● give us your account information ● make a wire transfer ● tell us who receives the money ● tell us where to send the money ● show your government-issued ID ● show your driver’s license |
| Why can’t I limit all sharing? | Federal law gives you the right to limit only ● sharing for affiliates’ everyday business purposes—information about your creditworthiness ● affiliates from using your information to market to you ● sharing for nonaffiliates to market to you State laws and individual companies may give you additional rights to limit sharing. |
| Definitions |
| Affiliates | Companies related by common ownership or control. They can be financial and nonfinancial companies. ● SMI Advisory Services, LLC, the investment adviser to the Fund, could be deemed to be an affiliate. |
| Nonaffiliates | Companies not related by common ownership or control. They can be financial and nonfinancial companies. ● The SMI Funds do not share your personal information with nonaffiliates so they can market to you, |
| Joint marketing | A formal agreement between nonaffiliated financial companies that together market financial products or services to you. ● The SMI Funds do not jointly market. |
A description of the policies and procedures that each Fund uses to determine how to vote proxies relating to portfolio securities and information regarding how each Fund voted those proxies during the most recent twelve month period ended June 30, are available (1) without charge upon request by calling the Funds at (877) 764-3863 and (2) in Fund documents filed with the Securities and Exchange Commission (“SEC”) on the SEC’s website at www.sec.gov.
| TRUSTEES |
| Andrea N. Mullins, Chairperson |
| Ira P. Cohen |
| Mark J. Seger |
| |
| OFFICERS |
| Matthew J. Miller, Principal Executive Officer and President |
| Zachary P. Richmond, Principal Financial Officer and Treasurer |
| N. Lynn Bowley, Chief Compliance Officer |
| Carol J. Highsmith, Vice President and Secretary |
| |
| INVESTMENT ADVISER |
| SMI Advisory Services, LLC |
| 4400 Ray Boll Blvd. |
| Columbus, IN 47203 |
| |
| DISTRIBUTOR |
| Ultimus Fund Distributors, LLC |
| 225 Pictoria Drive, Suite 450 |
| Cincinnati, OH 45246 |
| INDEPENDENT REGISTERED PUBLIC ACCOUNTING FIRM |
| Cohen & Company, Ltd. |
| 1350 Euclid Avenue, Suite 800 |
| Cleveland, OH 44115 |
| |
| LEGAL COUNSEL |
| Troutman Pepper Hamilton Sanders LLP |
| 3000 Two Logan Square |
| 18th and Arch Streets |
| Philadelphia, PA 19103 |
| |
| CUSTODIAN |
| Huntington National Bank |
| 41 South High Street |
| Columbus, OH 43215 |
| |
| ADMINISTRATOR, TRANSFER AGENT AND FUND ACCOUNTANT |
| Ultimus Fund Solutions, LLC |
| 225 Pictoria Drive, Suite 450 |
| Cincinnati, OH 45246 |
This report is intended only for the information of shareholders or those who have received the Funds’ prospectus which contains information about each Fund’s management fee and expenses. Please read the prospectus carefully before investing.
Distributed by Ultimus Fund Distributors LLC, Member FINRA/SIPC
THIS PAGE INTENTIONALLY LEFT BLANK
| | |
| |  |
| | |
| | |
| | |
| | SOUND MIND |
| | INVESTING FUND |
| | (SMIFX) |
| | |
| | SMI DYNAMIC |
| | ALLOCATION FUND |
| | (SMIDX) |
| | |
| | SMI MULTI-STRATEGY |
| | FUND |
| | (SMILX) |
| | |
| | |
| | ANNUAL REPORT |
| | October 31, 2022 |
| | |
| | |
| | Funds’ Adviser: |
| | SMI Advisory Services, LLC |
| | 4400 Ray Boll Blvd. |
| | Columbus, IN 47203 |
| | |
| | (877) 764-3863 |
| | (877) SMI-FUND |
| | www.smifund.com |
| SMI-AR-22 | |

Genuine Investors ETF (GCIG)
NYSE Arca, Inc.
Annual Report
October 31, 2022
Fund Adviser:
GCI Investors
7880 San Felipe Street, Suite 240
Houston, TX 77063
713-401-9048
Management Discussion of Fund Performance – (Unaudited)
Dear Investors,
As an annual letter this is somewhat an exercise in futility given that we began proceedings to wind up and close GCIG as of the end of November, almost exactly one year after launch.
For us as a small firm, the ETF launch was a big step. For many years we have run a successful long- only, concentrated equity strategy that we wanted to be able to offer to a wider audience. The ETF as a vehicle is an excellent way to do this- it provides liquidity, access and all within a tax efficient structure. In almost every respect the ETF is a far superior vehicle to the traditional US mutual fund- which now by comparison looks archaic and horribly complicated. I remain confident that few people will choose to launch US domestic funds any longer and more and more of those existing will convert to ETFs.
Our fund closure is the result of a series of unfortunate events, and bears no reflection on the underlying investment strategy, which I firmly believe will still deliver excellent risk adjusted returns for investors over the next few years. Unfortunately that will now only be through our SMA portfolios rather than the ETF itself. For those of you who don’t have access to our SMA strategy, please reach out and we will be happy to assist you where we can.
Despite the short term disappointment of closing, our daily task and focus as a team remains the same. We continue to spend our days trying to find truly wonderful businesses and buying their stock at attractive prices. That remains the mark of a Genuine Investor, and it remains an approach that will far outlast the short sightedness of this industry.
I would like to thank those of you who have supported and worked with us over the past few years, and I hope that we can maintain a close relationship with many of our investors, through other means.
Yours sincerely

Guy Davis, CFA
Portfolio Manager
Management Discussion of Fund Performance – (Unaudited) (continued)
Investors should carefully consider the investment objective, risks, charges and expenses of the fund before investing. This and other information are contained in the prospectus and should be read carefully before investing. For a prospectus, please call 713-401-9048 or visit our website at: www.genuineinvestorsetf.com. Genuine Investors ETF is distributed by Northern Lights Distributors, LLC, member FINRA/SIPC. Northern Lights Distributors, LLC and GCI Investors are not affiliated, nor is either party affiliated with any companies mentioned in this letter.
IMPORTANT RISK INFORMATION
Investing involves risk, including loss of principal. Value investing involves the risk that an investment made in undervalued securities may not appreciate in value as anticipated or remain undervalued for long periods of time.
Non-Diversification Risk. The Fund is a non-diversified portfolio, which means that it has the ability to take larger positions in a smaller number of securities than a portfolio that is “diversified”. Non-diversification increases the risk that the value of the Fund could go down because of the poor performance of a single investment.
Active Management Risk. The Fund is actively managed and is thus subject to management risk. The Advisor will apply its investment techniques and strategies in making investment decisions for the Fund, but there is no guarantee that its techniques will produce the intended results.
New Fund Risk. The Fund is newly formed and has no operating history as of the date of this Report. Accordingly, investors in the Fund bear the risk that the Fund may not be successful in implementing its investment strategy or growing to an economically viable size.
Lack of Experience of the Advisor. The adviser has no prior experience as an investment advisor to a mutual fund registered under the Investment Company Act of 1940, as amended (the “1940 Act”).
All references and views offered including but not exclusive to any overall market commentary, asset class, attribution, outlook, valuation, potential returns, are the opinions and views of GCI Investors.
All references and views offered including but not exclusive to any specific investment strategies, approaches, adherence, opportunities, execution or potential success are the opinions and views of GCI Investors.
Management Discussion of Fund Performance – (Unaudited) (continued)
All references and views offered including but not exclusive to any specific companies including but not exclusive to business model, quality, outlook, management, valuation, execution, potential returns are the opinions and views of GCI Investors.
Investment Results (Unaudited)
Average Annual Total Returns* as of October 31, 2022
| | Since |
| | Inception |
| | 11/30/21 |
| Genuine Investors ETF - NAV | (27.58)% |
| Genuine Investors ETF - Market Price | (27.50)% |
| S&P 500® Index(a) | (14.02)% |
Total annual operating expenses based on estimated amounts for the current fiscal period, as disclosed in the Genuine Investors ETF’s (the “Fund”) prospectus dated November 17, 2021, and supplemented October 31, 2022, were 1.40% of average daily net assets (1.00% after fee waivers/expense reimbursements by GCI Investors (the “Adviser”)). The Adviser contractually has agreed to waive its management fee and/or reimburse expenses so that total annual Fund operating expenses do not exceed 1.00% through February 29, 2024. This operating expense limitation does not apply to: (i) interest, (ii) taxes, (iii) brokerage commissions, (iv) other expenditures which are capitalized in accordance with generally accepted accounting principles, (v) other extraordinary expenses not incurred in the ordinary course of the Fund’s business, (vi) dividend expense on short sales, (vii) expenses incurred under a plan of distribution under Rule 12b-1, and (viii) expenses that the Fund has incurred but did not actually pay because of an expense offset arrangement, if applicable, incurred by the Fund in any fiscal year. The operating expense limitation also excludes any “Acquired Fund Fees and Expenses,” which are the expenses indirectly incurred by the Fund as a result of investing in money market funds or other investment companies, including ETFs, that have their own expenses. This expense cap may only be terminated by mutual consent of the Adviser and the Board of Trustees. Each waiver/ expense reimbursement by the Adviser is subject to recoupment by the Adviser from the Fund in the three years following the date the particular waiver/expense reimbursement occurred, but only if such recoupment can be achieved without exceeding the annual expense limitation in effect at the time of the waiver/expense reimbursement and any expense limitation in effect at the time of the recoupment. Additional information pertaining to the Fund’s expense ratios as of October 31, 2022 can be found in the financial highlights.
The performance quoted represents past performance, which does not guarantee future results. The investment return and principal value of an investment will fluctuate so that an investor’s shares, when redeemed, may be worth more or less than their original cost. The returns shown do not reflect deduction of taxes that a shareholder would pay on Fund distributions or the redemption of Fund shares. Current performance of the Fund may be lower or higher than the performance quoted. The Fund’s investment objectives, risks, charges and expenses must be considered carefully before investing. Performance data current to the most recent month end may be obtained by calling (713) 401-9048. The Fund’s per share net asset value (“NAV”) is the value of one share of the Fund as calculated in accordance with the standard formula for valuing shares. The NAV return is based on the NAV of the Fund and the market return is based on the market price per share of the Fund. The price used to calculate market return (“Market Price”) is determined by using the midpoint between the highest bid and the lowest offer on the primary stock exchange on which the shares of the Fund are listed for trading, as of the time that the Fund’s NAV is calculated. Market Price and NAV returns assume that dividends and capital gain distributions have been reinvested in the Fund at Market Price and NAV, respectively. Since exchange-traded funds are bought and sold at prices set by the market, which can result in a premium or discount to NAV, the returns calculated using Market Price can differ from those calculated using NAV.
| * | Return figures reflect any change in price per share and assume the reinvestment of all distributions. The Fund’s returns reflect any fee reductions during the applicable period. If such fee reductions had not occurred, the quoted performances would have been lower. |
| (a) | The S&P 500® Total Return Index (“Index”) is a widely recognized unmanaged index of equity securities and is representative of a broader domestic equity market and range of securities than is found in the Fund’s portfolio. Individuals cannot invest directly in the Index; however, an individual can invest in exchange-traded funds or other investment vehicles that attempt to track the performance of a benchmark index. |
Investment Results (Unaudited) (continued)
The Fund’s investment objectives, strategies, risks, charges and expenses must be considered carefully before investing. The prospectus contains this and other important information about the Fund and may be obtained by calling (713) 401-9048. Please read it carefully before investing.
The Fund is distributed by Northern Lights Distributors, LLC, member FINRA/SIPC
Investment Results (Unaudited) (continued)
Comparison of the Growth of a $10,000 Investment in the Genuine Investors ETF and the S&P 500® Total Return Index (Unaudited)
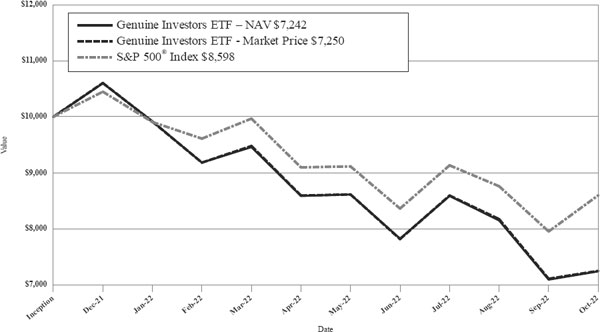
The chart above assumes an initial investment of $10,000 made on November 30, 2021 (commencement of operations) and held through October 31, 2022. The S&P 500® Total Return Index is a widely recognized unmanaged index of equity prices and is representative of a broader market and range of securities than is found in the Fund’s portfolio. Individuals cannot invest directly in an index; however, an individual may invest in exchange-traded funds or other investment vehicles that attempt to track the performance of a benchmark index. GENUINE INVESTERS ETF RETURNS REPRESENT PAST PERFORMANCE AND DO NOT GUARANTEE FUTURE RESULTS. The returns shown do not reflect deduction of taxes that a shareholder would pay on Fund distributions or the redemption of Fund shares. Investment returns and principal values will fluctuate so that your shares, when redeemed, may be worth more or less than their original purchase price.
The Fund is distributed by Northern Lights Distributors, LLC, Member FINRA/SIPC.
Fund Holdings (Unaudited)
October 31, 2022
Genuine Investor ETF Holdings as of October 31, 2022.*
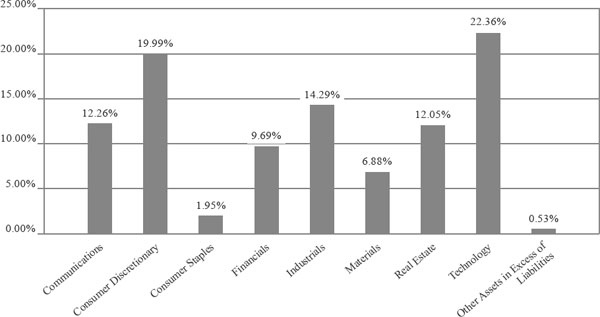
| * | As a percentage of net assets. |
The Genuine Investors ETF (the “Fund”) seeks to provide investors with attractive long-term risk-adjusted returns by investing in an equity portfolio of U.S. listed securities.
Availability of Portfolio Schedule (Unaudited)
The Fund files a complete schedule of portfolio holdings with the Securities and Exchange Commission (the “SEC”) for the first and third quarters of each fiscal year as an exhibit to its reports on Form N-PORT. The Fund’s Form N-PORT reports are available on the SEC’s website at http:// www.sec.gov or on the Fund’s website at https://genuineinvestorsetf.com.
| Genuine Investors ETF |
| Schedule of Investments |
| October 31, 2022 |
| Common Stocks — 99.47% | | Shares | | | Fair Value | |
| Canada — 8.31% | | | | | | | | |
| Industrials — 8.31% | | | | | | | | |
| GFL Environmental, Inc. | | | 30,121 | | | $ | 812,965 | |
| Total Canada | | | | | | | 812,965 | |
| | | | | | | | | |
| United Kingdom — 1.95% | | | | | | | | |
| Consumer Staples — 1.95% | | | | | | | | |
| Ocado Group PLC - ADR(a) | | | 17,315 | | | | 190,465 | |
| Total United Kingdom | | | | | | | 190,465 | |
| | | | | | | | | |
| United States — 89.21% | | | | | | | | |
| Communications — 12.26% | | | | | | | | |
| Alphabet, Inc., Class A(a) | | | 5,440 | | | | 514,134 | |
| Booking Holdings, Inc.(a) | | | 252 | | | | 471,109 | |
| Meta Platforms, Inc., Class A(a) | | | 2,285 | | | | 212,871 | |
| | | | | | | | 1,198,114 | |
| Consumer Discretionary — 19.99% | | | | | | | | |
| Amazon.com, Inc.(a) | | | 6,219 | | | | 637,075 | |
| CarMax, Inc.(a) | | | 7,893 | | | | 497,338 | |
| Copart, Inc.(a) | | | 4,316 | | | | 496,426 | |
| Wyndham Hotels & Resorts, Inc. | | | 4,241 | | | | 322,019 | |
| | | | | | | | 1,952,858 | |
| Financials — 9.69% | | | | | | | | |
| Charles Schwab Corp. (The) | | | 5,853 | | | | 466,309 | |
| First American Financial Corp. | | | 9,532 | | | | 480,412 | |
| | | | | | | | 946,721 | |
| Industrials — 5.98% | | | | | | | | |
| United Parcel Service, Inc., Class B | | | 3,480 | | | | 583,840 | |
| | | | | | | | | |
| Materials — 6.88% | | | | | | | | |
| Air Products & Chemicals, Inc. | | | 2,685 | | | | 672,324 | |
| | | | | | | | | |
| Real Estate — 12.05% | | | | | | | | |
| American Tower Corp. | | | 1,989 | | | | 412,101 | |
| Crown Castle International Corp. | | | 2,958 | | | | 394,183 | |
| Equinix, Inc. | | | 655 | | | | 371,018 | |
| | | | | | | | 1,177,302 | |
| Technology — 22.36% | | | | | | | | |
| MasterCard, Inc., Class A | | | 1,372 | | | | 450,263 | |
| Microsoft Corp. | | | 2,545 | | | | 590,771 | |
| S&P Global, Inc. | | | 1,329 | | | | 426,941 | |
| Texas Instruments, Inc. | | | 2,133 | | | | 342,624 | |
See accompanying notes which are an integral part of these financial statements.
| Genuine Investors ETF |
| Schedule of Investments (continued) |
| October 31, 2022 |
| Common Stocks — 99.47% (continued) | | Shares | | | Fair Value | |
| United States — 89.21% (continued) | | | | | | | | |
| Technology — 22.36% (continued) | | | | | | | | |
| Tyler Technologies, Inc.(a) | | | 1,157 | | | $ | 374,093 | |
| | | | | | | | 2,184,692 | |
| Total United States | | | | | | | 8,715,851 | |
| | | | | | | | | |
| Total Common Stocks/Investments — 99.47% | | | | | | | | |
| (Cost $12,601,087) | | | | | | | 9,719,281 | |
| Other Assets in Excess of Liabilities — 0.53% | | | | | | | 52,083 | |
| Net Assets — 100.00% | | | | | | $ | 9,771,364 | |
| (a) | Non-income producing security. |
ADR - American Depositary Receipt.
See accompanying notes which are an integral part of these financial statements.
| Genuine Investors ETF |
| Statement of Assets and Liabilities |
| October 31, 2022 |
| Assets | | | | |
| Investments in securities, at fair value (cost $12,601,087) (Note 3) | | $ | 9,719,281 | |
| Cash | | | 66,150 | |
| Receivable for investments sold | | | 48,791 | |
| Receivable from Adviser | | | 21,581 | |
| Dividends receivable | | | 7,293 | |
| Tax reclaims receivable | | | 33 | |
| Prepaid expenses | | | 2,235 | |
| Total Assets | | | 9,865,364 | |
| Liabilities | | | | |
| Payable for investments purchased | | | 48,557 | |
| Payable to affiliates (Note 4) | | | 12,647 | |
| Other accrued expenses | | | 32,796 | |
| Total Liabilities | | | 94,000 | |
| Net Assets | | $ | 9,771,364 | |
| Net Assets consist of: | | | | |
| Paid-in capital | | $ | 12,979,580 | |
| Accumulated deficit | | | (3,208,216 | ) |
| Net Assets | | $ | 9,771,364 | |
| Shares outstanding (unlimited number of shares authorized, no par value) | | | 540,000 | |
| Net asset value per share | | $ | 18.10 | |
See accompanying notes which are an integral part of these financial statements.
| Genuine Investors ETF |
| Statement of Operations |
| For the period ended October 31, 2022 |
| Investment Income | | | | |
| Dividend income (net of foreign taxes withheld of $225) | | $ | 91,903 | |
| Total investment income | | | 91,903 | |
| Expenses | | | | |
| Adviser (Note 4) | | | 63,870 | |
| Administration (Note 4) | | | 54,767 | |
| Legal | | | 23,162 | |
| Custodian | | | 19,092 | |
| Compliance services (Note 4) | | | 19,047 | |
| Audit and tax | | | 18,000 | |
| Transfer agent | | | 9,678 | |
| Report printing | | | 9,255 | |
| Trustee | | | 6,199 | |
| Insurance | | | 882 | |
| Pricing | | | 333 | |
| Miscellaneous | | | 32,962 | |
| Total expenses | | | 257,247 | |
| Fees waived and expenses reimbursed by Adviser | | | (171,817 | ) |
| Net operating expenses | | | 85,430 | |
| Net investment income | | | 6,473 | |
| Net Realized and Change in Unrealized Gain (Loss) on Investments | | | | |
| Net realized gain (loss) on: | | | | |
| Investment securities transactions | | | (331,417 | ) |
| Change in unrealized depreciation on: | | | | |
| Investment securities | | | (2,881,806 | ) |
| Net realized and change in unrealized gain (loss) on investment securities | | | (3,213,223 | ) |
| Net decrease in net assets resulting from operations | | $ | (3,206,750 | ) |
See accompanying notes which are an integral part of these financial statements.
| Genuine Investors ETF |
| Statement of Changes in Net Assets |
| | | For the Period | |
| | | Ended October | |
| | | 31, 2022(a) | |
| Increase (Decrease) in Net Assets due to: | | | | |
| Operations | | | | |
| Net investment income | | $ | 6,473 | |
| Net realized loss on investment securities | | | (331,417 | ) |
| Change in unrealized depreciation on investment securities | | | (2,881,806 | ) |
| Net decrease in net assets resulting from operations | | | (3,206,750 | ) |
| Distributions to Shareholders From: (Note 2) | | | | |
| Earnings | | | (1,482 | ) |
| Total distributions | | | (1,482 | ) |
| Capital Transactions | | | | |
| Proceeds from shares sold | | | 12,979,596 | |
| Net increase in net assets resulting from capital transactions | | | 12,979,596 | |
| Total Increase in Net Assets | | | 9,771,364 | |
| Net Assets | | | | |
| Beginning of year | | | — | |
| End of year | | $ | 9,771,364 | |
| Share Transactions | | | | |
| Shares sold | | | 540,000 | |
| Net increase in shares outstanding | | | 540,000 | |
| (a) | For the period November 30, 2021 (commencement of operations) to October 31, 2022. |
See accompanying notes which are an integral part of these financial statements.
| Genuine Investors ETF |
| Financial Highlights |
(For a share outstanding during the period)
| | | For the | |
| | | Period | |
| | | Ended | |
| | | October | |
| | | 31, 2022(a) | |
| | | | |
| Selected Per Share Data: | | | | |
| Net asset value, beginning of period | | $ | 25.00 | |
| Investment operations: | | | | |
| Net investment gain | | | 0.02 | |
| Net realized and unrealized loss on investments | | | (6.91 | ) |
| Total from investment operations | | | (6.89 | ) |
| Less distributions to shareholders from: | | | | |
| Net investment income | | | (0.01 | ) |
| Total distributions | | | (0.01 | ) |
| Net asset value, end of period | | $ | 18.10 | |
| Market price, end of period | | $ | 18.12 | |
| Total Return(b) | | | (27.58 | )% (c) |
| Ratios and Supplemental Data: | | | | |
| Net assets, end of period (000 omitted) | | $ | 9,771 | |
| Ratio of net expenses to average net assets | | | 1.00 | % (d) |
| Ratio of expenses to average net assets before waiver and reimbursement | | | 3.02 | % (d) |
| Ratio of net investment income to average net assets | | | 0.08 | % (d) |
| Portfolio turnover rate(e) | | | 24 | % (c) |
| (a) | For the period November 30, 2021 (commencement of operations) to October 31, 2022. |
| (b) | Total return is calculated assuming a purchase of shares at net asset value on the first day and a sale at net asset value on the last day of the period. Distributions are assumed, for the purpose of this calculation, to be reinvested at the ex-dividend date net asset value per share on their respective payment dates. |
| (e) | Portfolio turnover rate excludes securities received or delivered from in-kind processing of creations or redemptions. |
See accompanying notes which are an integral part of these financial statements.
| Genuine Investors ETF |
| Notes to the Financial Statements |
| October 31, 2022 |
NOTE 1. ORGANIZATION
The Genuine Investors ETF (the “Fund”) is registered under the Investment Company Act of 1940, as amended (“1940 Act”), as an open-end non-diversified series of Valued Advisers Trust (the “Trust”), and commenced operations on November 30, 2021. The Trust is a management investment company established under the laws of Delaware by an Agreement and Declaration of Trust dated June 13, 2008 (the “Trust Agreement”). The Trust Agreement permits the Board of Trustees (the “Board” or “Trustees”) to issue an unlimited number of shares of beneficial interest of separate series without par value. The Fund is one of a series of funds authorized by the Board. The Fund’s investment adviser is Globescan Capital, Inc. dba GCI Investors (the “Adviser”). The Fund seeks to provide investors with attractive long-term risk-adjusted returns by investing in an equity portfolio of U.S. listed securities.
Non-Diversification Risk – The Fund is a non-diversified portfolio, which means that it has the ability to take larger positions in a smaller number of securities than a portfolio that is “diversified.” Non-diversification increases the risk that the value of the Fund could go down because of the poor performance of a single investment.
NOTE 2. SIGNIFICANT ACCOUNTING POLICIES
The Fund is an investment company and follows accounting and reporting guidance under Financial Accounting Standards Board Accounting Standards Codification (“ASC”) Topic 946, “Financial Services-Investment Companies”. The following is a summary of significant accounting policies followed by the Fund in the preparation of its financial statements. These policies are in conformity with generally accepted accounting principles in the United States of America (“GAAP”).
Estimates – The preparation of financial statements in conformity with GAAP requires management to make estimates and assumptions that affect the reported amounts of assets and liabilities and disclosure of contingent assets and liabilities at the date of the financial statements and the reported amounts of increases and decreases in net assets from operations during the reporting period. Actual results could differ from those estimates.
Foreign Currency Translation – The accounting records of the Fund are maintained in U.S. dollars. Foreign currency amounts are translated into U.S. dollars at the current rate of exchange each business day to determine the value of investments, and other assets and liabilities. Purchases and sales of foreign securities, and income and expenses, are translated at the prevailing rate of exchange on the respective date of these transactions. The Fund does not isolate that portion of the results of operations resulting from changes in foreign exchange rates on investments from fluctuation arising from changes in market prices of securities held. These fluctuations are included with the unrealized gain or loss
| Genuine Investors ETF |
| Notes to the Financial Statements (continued) |
| October 31, 2022 |
from investments. Reported net realized foreign exchange gains or losses arise from sales of foreign currencies, currency gains or losses realized between the trade and settlement dates on securities transactions, and the difference between the amounts of dividends, interest, and foreign withholding taxes recorded on the Fund’s books and the U.S. dollar equivalent of the amounts actually received or paid. Net unrealized foreign exchange gains and losses arise from changes in the fair values of assets and liabilities, other than investments in securities at period end, resulting from changes in exchange rates.
Federal Income Taxes – The Fund makes no provision for federal income or excise tax. The Fund has qualified and intends to qualify each year as a regulated investment company (“RIC”) under subchapter M of the Internal Revenue Code of 1986, as amended, by complying with the requirements applicable to RICs and by distributing substantially all of its taxable income. The Fund also intends to distribute sufficient net investment income and net realized capital gains, if any, so that it will not be subject to excise tax on undistributed income and gains. If the required amount of net investment income or gains is not distributed, the Fund could incur a tax expense.
As of and during the period ended October 31, 2022, the Fund did not have any liabilities for any unrecognized tax benefits. The Fund recognizes interest and penalties, if any, related to unrecognized tax benefits as income tax expense in the Statement of Operations when incurred. During the period, the Fund did not incur any interest or penalties. Management of the Fund has reviewed tax positions taken in tax years that remain subject to examination by all major tax jurisdictions, including federal (i.e., the previous three years tax year ends and the interim tax period since then, as applicable) and has concluded that no provision for unrecognized tax benefits or expenses is required in these financial statements and does not expect this to change over the next twelve months.
Expenses – Expenses incurred by the Trust that do not relate to a specific fund of the Trust are allocated to the individual funds based on each fund’s relative net assets or another appropriate basis (as determined by the Board).
Security Transactions and Related Income – The Fund follows industry practice and records security transactions on the trade date for financial reporting purposes. The specific identification method is used for determining gains or losses for financial statements and income tax purposes. Dividend income is recorded on the ex-dividend date and interest income is recorded on an accrual basis. Distributions received from investments in real estate investment trusts (“REITs”) that represent a return of capital or capital gain are recorded as a reduction of the cost of investment or as a realized gain, respectively. The calendar year-end amounts of ordinary income, capital gains, and return of capital included in distributions received from the Fund’s investments in REITs are reported to the Fund after the end of the calendar year; accordingly, the Fund estimates these amounts for
| Genuine Investors ETF |
| Notes to the Financial Statements (continued) |
| October 31, 2022 |
accounting purposes until the characterization of REIT distributions is reported. Estimates are based on the most recent REIT distributions information available. Withholding taxes on foreign dividends and related reclaims have been provided for in accordance with the Fund’s understanding of the applicable country’s tax rules and rates.
Dividends and Distributions – The Fund intends to distribute its net investment income and net realized long-term and short-term capital gains, if any, at least annually. Dividends and distributions to shareholders, which are determined in accordance with income tax regulations, are recorded on the ex-dividend date. The treatment for financial reporting purposes of distributions made to shareholders during the period from net investment income or net realized capital gains may differ from their ultimate treatment for federal income tax purposes. These differences are caused primarily by differences in the timing of the recognition of certain components of income, expense or realized capital gain for federal income tax purposes. Where such differences are permanent in nature, they are reclassified among the components of net assets based on their ultimate characterization for federal income tax purposes. Any such reclassifications will have no effect on net assets, results of operations or net asset value (“NAV”) per share of the Fund.
For the fiscal period ended October 31, 2022, the Fund made the following reclassifications to increase (decrease) the components of net assets:
| | | | Accumulated Earnings | |
| Paid-In Capital | | | (Deficit) | |
| $ | (16 | ) | | $ | 16 | |
Share Valuation – The NAV is calculated each day the New York Stock Exchange (the “NYSE”) is open by dividing the total value of the Fund’s assets, less liabilities, by the number of shares outstanding for the Fund.
NOTE 3. SECURITIES VALUATION AND FAIR VALUE MEASUREMENTS
The Fund values its portfolio securities at fair value as of the close of regular trading on the New York Stock Exchange (“NYSE”) (normally 4:00 p.m. Eastern time) on each business day the NYSE is open for business. Fair value is defined as the price that the Fund would receive upon selling an investment in a timely transaction to an independent buyer in the principal or most advantageous market of the investment. GAAP establishes a three-tier hierarchy to maximize the use of observable market data and minimize the use of unobservable inputs and to establish classification of fair value measurements for disclosure purposes.
Inputs refer broadly to the assumptions that market participants would use in pricing the asset or liability, including assumptions about risk (the risk inherent in a particular valuation technique used to measure fair value including a pricing model and/or the risk inherent
| Genuine Investors ETF |
| Notes to the Financial Statements (continued) |
| October 31, 2022 |
in the inputs to the valuation technique). Inputs may be observable or unobservable. Observable inputs are inputs that reflect the assumptions market participants would use in pricing the asset or liability developed based on market data obtained and available from sources independent of the reporting entity. Unobservable inputs are inputs that reflect the reporting entity’s own assumptions about the assumptions market participants would use in pricing the asset or liability developed based on the best information available in the circumstances.
Various inputs are used in determining the value of the Fund’s investments. These inputs are summarized in the three broad levels listed below.
| ● | Level 1 – unadjusted quoted prices in active markets for identical investments and/or registered investment companies where the value per share is determined and published and is the basis for current transactions for identical assets or liabilities at the valuation date |
| ● | Level 2 – other significant observable inputs (including, but not limited to, quoted prices for an identical security in an inactive market, quoted prices for similar securities, interest rates, prepayment speeds, credit risk, etc.) |
| ● | Level 3 – significant unobservable inputs (including the Fund’s own assumptions in determining fair value of investments based on the best information available) |
The inputs used to measure fair value may fall into different levels of the fair value hierarchy. In such cases, for disclosure purposes, the level in the fair value hierarchy which is reported is determined based on the lowest level input that is significant to the fair value measurement in its entirety.
Equity securities that are traded on any stock exchange are generally valued at the last quoted sale price on the security’s primary exchange. Lacking a last sale price, an exchange-traded security is generally valued at its last bid price. Securities traded in the NASDAQ over-the-counter market are generally valued at the NASDAQ Official Closing Price. When using the market quotations and when the market is considered active, the security is classified as a Level 1 security. In the event that market quotations are not readily available or are considered unreliable due to market or other events, securities are valued in good faith by the Adviser as “valuation designee” under the oversight of the Board. The Adviser has adopted written policies and procedures for valuing securities and other assets in circumstances where market quotes are not readily available. In the event that market quotes are not readily available, and the security or asset cannot be valued pursuant to one of the valuation methods, the value of the security or asset will be determined in good faith by the Adviser pursuant to its policies and procedures. On a quarterly basis, the Adviser’s fair valuation determinations will be reviewed by the Board.
| Genuine Investors ETF |
| Notes to the Financial Statements (continued) |
| October 31, 2022 |
Under these policies, the securities will be classified as Level 2 or 3 within the fair value hierarchy, depending on the inputs used.
In accordance with the Trust’s valuation policies, the Board or Adviser as Valuation Designee is required to consider all appropriate factors relevant to the value of securities for which it has determined other pricing sources are not available or reliable as described above. No single method exists for determining fair value, because fair value depends upon the circumstances of each individual case. As a general principle, the current fair value of a security being valued by the Valuation Designee would be the amount that the Fund might reasonably expect to receive upon the current sale. Methods that are in accordance with this principle may, for example, be based on (i) a multiple of earnings; (ii) a discount from market prices of a similar freely traded security (including a derivative security or a basket of securities traded on other markets, exchanges or among dealers); or (iii) yield to maturity with respect to debt issues, or a combination of these and other methods. Fair-value pricing is permitted if, in the Valuation Designee’s opinion, the validity of market quotations appears to be questionable based on factors such as evidence of a thin market in the security based on a small number of quotations, a significant event occurs after the close of a market but before the Fund’s NAV calculation that may affect a security’s value, or the Valuation Designee is aware of any other data that calls into question the reliability of market quotations.
The following is a summary of the inputs used to value the Fund’s investments as of October 31, 2022:
| | | Valuation Inputs | |
| Assets | | Level 1 | | | Level 2 | | | Level 3 | | | Total | |
| Common Stocks (a) | | $ | 9,719,281 | | | $ | — | | | $ | — | | | $ | 9,719,281 | |
| Total | | $ | 9,719,281 | | | $ | — | | | $ | — | | | $ | 9,719,281 | |
| (a) | Refer to Schedule of Investments for sector classifications. |
The Fund did not hold any investments at the end of the reporting period for which significant unobservable inputs (Level 3) were used in determining fair value; therefore, no reconciliation of Level 3 securities is included for this reporting period.
NOTE 4. FEES AND OTHER TRANSACTIONS WITH AFFILIATES AND OTHER SERVICE PROVIDERS
The Adviser, under the terms of the management agreement with the Trust with respect to the Fund (the “Agreement”), manages the Fund’s investments. As compensation for its management services, the Fund is obligated to pay the Adviser a fee computed and accrued daily and paid monthly at an annual rate of 0.75% of the Fund’s average daily net
| Genuine Investors ETF |
| Notes to the Financial Statements (continued) |
| October 31, 2022 |
assets. For the fiscal period ended October 31, 2022, before the waiver described below, the Adviser earned a fee of $63,870 from the Fund.
The Adviser has contractually agreed to waive its management fee and/or reimburse expenses so that total annual operating expenses (excluding interest, taxes, brokerage commissions, other expenditures which are capitalized in accordance with generally accepted accounting principles, other extraordinary expenses not incurred in the ordinary course of the Fund’s business, dividend expense on short sales, expenses incurred under a plan of distribution under Rule 12b-1, and expenses that the Fund has incurred but did not actually pay because of an expense offset arrangement, if applicable, incurred by the Fund in any fiscal year) do not exceed 1.00% of the Fund’s average daily net assets through February 29, 2024. The operating expense limitation also excludes any “Acquired Fund Fees and Expenses,” which are the expenses indirectly incurred by the Fund as a result of investing in money market funds or other investment companies, including Exchange Traded Funds (“ETFs”), that have their own expenses. For the fiscal period ended October 31, 2022, the Adviser waived fees and reimbursed expenses of $171,817. At October 31, 2022, the Adviser owed the Fund $21,581.
Each fee waiver/expense reimbursement by the Adviser is subject to recoupment by the Adviser from the Fund in the three years following the date in which that particular waiver/expense reimbursement occurred, but only if such recoupment can be achieved without exceeding the annual expense limitation in effect at the time of the waiver/expense reimbursement and any expense limitation in effect at the time of the recoupment. As of October 31, 2022 the Adviser may seek repayment of investment advisory fees waived and expense reimbursements pursuant to the aforementioned conditions, from the Fund no later than the dates stated below:
| Recoverable Through | | | | |
| October 31, 2025 | | $ | 171,817 | |
Ultimus Fund Solutions, LLC (“Ultimus”) provides administration and fund accounting services to the Fund. The Fund pays Ultimus fees in accordance with the agreements for such services.
Northern Lights Compliance Services, LLC (“NLCS”), an affiliate of Ultimus, provides a Chief Compliance Officer to the Trust, as well as related compliance services, pursuant to a consulting agreement between NLCS and the Trust. Under the terms of such agreement, NLCS receives fees from the Fund, which are approved annually by the Board.
Under the terms of a Distribution Agreement with the Trust, Northern Lights Distributors, LLC (the “Distributor”) serves as principal underwriter to the Fund. The Distributor is
| Genuine Investors ETF |
| Notes to the Financial Statements (continued) |
| October 31, 2022 |
an affiliate of Ultimus. The Distributor is compensated by the Adviser (not the Fund) for acting as principal underwriter.
The officers and one trustee of the Trust are members of management and/or employees of Ultimus or one of its affiliates and are not paid by the Trust for services to the Fund.
NOTE 5. INVESTMENT TRANSACTIONS
For the period ended October 31, 2022, purchases and sales of investment securities, other than in-kind transactions and short-term investments, were $2,565,471 and $2,281,794, respectively.
For the period ended October 31, 2022, purchases for in-kind transactions were $12,655,281.
For the period ended October 31, 2022, the Fund had in-kind net realized gains of $0.
There were no purchases or sales of long-term U.S. government obligations during the period ended October 31, 2022.
NOTE 6. CAPITAL SHARE TRANSACTIONS
Shares are not individually redeemable and may be redeemed by the Fund at NAV only in large blocks known as “Creation Units.” Only Authorized Participants or transactions done through an Authorized Participant are permitted to purchase or redeem Creation Units from the Fund. An Authorized Participant is either (i) a broker-dealer or other participant in the clearing process through the Continuous Net Settlement System of the National Securities Clearing Corporation or (ii) a Depository Trust Company participant and, in each case, must have executed a Participant Agreement with the Distributor. Such transactions are generally permitted on an in-kind basis, with a balancing cash component to equate the transaction to the NAV per share of the Fund on the transaction date. Cash may be substituted equivalent to the value of certain securities generally when they are not available in sufficient quantity for delivery, not eligible for trading by the Authorized Participant or as a result of other market circumstances. In addition, the Fund may impose transaction fees on purchases and redemptions of Fund shares to cover the custodial and other costs incurred by the Fund in effecting trades. A fixed fee payable to the Custodian may be imposed on each creation and redemption transaction regardless of the number of Creation Units involved in the transaction (“Fixed Fee”). Purchases and redemptions of Creation Units for cash or involving cash-in-lieu are required to pay an additional variable charge to compensate the Fund and its ongoing shareholders for brokerage and market impact expenses relating to Creation Unit transactions (“Variable Charge,” and together with the Fixed Fee, the “Transaction Fees”). Transactions in capital shares for the Fund are disclosed in the Statement of Changes in Net Assets. For the period ended October 31,
| Genuine Investors ETF |
| Notes to the Financial Statements (continued) |
| October 31, 2022 |
2022, the Fund received $3,600 and $0 in fixed fees and variable fees, respectively. The Transaction Fees for the Fund are listed in the table below:
| Fixed Fee | | Variable Charge |
| $200 | | 2.00%* |
| * | The maximum Transaction Fee may be up to 2.00% of the amount invested. |
| Genuine Investors ETF |
| Notes to the Financial Statements (continued) |
| October 31, 2022 |
NOTE 7. FEDERAL TAX INFORMATION
At October 31, 2022, the net unrealized appreciation (depreciation) and tax cost of investments for tax purposes were as follows:
| Gross unrealized appreciation | | $ | 33,576 | |
| Gross unrealized depreciation | | | (2,976,777 | ) |
| Net unrealized depreciation on investments | | $ | (2,943,201 | ) |
| Tax cost of investments | | $ | 12,662,482 | |
The tax character of distributions paid for the fiscal period ended October 31, 2022 was as follows:
| | | 2022 | |
| Distributions paid from: | | | | |
| Ordinary income(a) | | $ | 1,482 | |
| Total distributions paid | | $ | 1,482 | |
| (a) | Short-term capital gain distributions are treated as ordinary income for tax purposes. |
At October 31, 2022, the components of accumulated earnings (deficit) on a tax basis were as follows:
| Undistributed ordinary income | | $ | 5,007 | |
| Accumulated capital and other losses | | | (270,022 | ) |
| Unrealized depreciation on investments | | | (2,943,201 | ) |
| Total accumulated deficits | | $ | (3,208,216 | ) |
As of October 31, 2022, the Fund had Short-Term capital loss carryforwards of $270,022. These capital loss carryforwards, which do not expire, may be utilized in future years to offset net realized capital gains, if any, prior to distributing such gains to shareholders.
NOTE 8. COMMITMENTS AND CONTINGENCIES
The Trust indemnifies its officers and Trustees for certain liabilities that may arise from their performance of their duties to the Trust or the Fund. Additionally, in the normal course of business, the Trust enters into contracts that contain a variety of representations and warranties which provide general indemnifications. The Trust’s maximum exposure under these arrangements is unknown, as this would involve future claims that may be made against the Trust that have not yet occurred.
| Genuine Investors ETF |
| Notes to the Financial Statements (continued) |
| October 31, 2022 |
NOTE 9. SUBSEQUENT EVENTS
On October 28, 2022, the Board of Trustees of Valued Advisers Trust approved the termination and liquidation of Genuine Investors ETF pursuant to the terms of a Plan of Liquidation. The Fund ceased the purchase of Creation Units and suspended trading on the NYSE Arca on November 21, 2022 and liquidated on November 30, 2022.
Management of the Fund has evaluated the need for disclosures and/or adjustments resulting from subsequent events through the date at which these financial statements were issued. Based upon this evaluation, management has determined there were no other items requiring adjustment of the financial statements or additional disclosure.
| Report of Independent Registered Public Accounting Firm |
To the Shareholders of Genuine Investors ETF and
Board of Trustees of Valued Advisers Trust
Opinion on the Financial Statements
We have audited the accompanying statement of assets and liabilities, including the schedule of investments, of Genuine Investors ETF (the “Fund”), a series of Valued Advisers Trust, as of October 31, 2022, the related statements of operations and changes in net assets, the related notes, and the financial highlights for the period November 30, 2021 (commencement of operations) through October 31, 2022 (collectively referred to as the “financial statements”). In our opinion, the financial statements present fairly, in all material respects, the financial position of the Fund as of October 31, 2022, the results of its operations, changes in net assets, and the financial highlights for the period indicated above, in conformity with accounting principles generally accepted in the United States of America.
Basis for Opinion
These financial statements are the responsibility of the Fund’s management. Our responsibility is to express an opinion on the Fund’s financial statements based on our audit. We are a public accounting firm registered with the Public Company Accounting Oversight Board (United States) (“PCAOB”) and are required to be independent with respect to the Fund in accordance with the U.S. federal securities laws and the applicable rules and regulations of the Securities and Exchange Commission and the PCAOB.
We conducted our audit in accordance with the standards of the PCAOB. Those standards require that we plan and perform the audit to obtain reasonable assurance about whether the financial statements are free of material misstatement whether due to error or fraud.
Our audit included performing procedures to assess the risks of material misstatement of the financial statements, whether due to error or fraud, and performing procedures that respond to those risks. Such procedures included examining, on a test basis, evidence regarding the amounts and disclosures in the financial statements. Our procedures included confirmation of securities owned as of October 31, 2022, by correspondence with the custodian and broker. Our audit also included evaluating the accounting principles used and significant estimates made by management, as well as evaluating the overall presentation of the financial statements. We believe that our audit provides a reasonable basis for our opinion.
We have served as the Fund’s auditor since 2021.
COHEN & COMPANY, LTD.
Cleveland, Ohio
December 28, 2022
| Liquidity Risk Management Program (Unaudited) |
Valued Advisers Trust has adopted and implemented a written liquidity risk management program as required by Rule 22e-4 (the “Liquidity Rule”) under the Investment Company Act. The program is reasonably designed to assess and manage the Fund’s liquidity risk, taking into consideration, among other factors, the Fund’s investment strategy and the liquidity of its portfolio investments during normal and reasonably foreseeable stressed conditions; its short and long-term cash flow projections; and its cash holdings and access to other funding sources. The Board of Trustees approved the appointment of a Liquidity Administrator Committee, which includes representatives from GCI Investors, the Fund’s investment adviser, and Ultimus Fund Solutions, LLC, the Fund’s Administrator. The Liquidity Administrator Committee is responsible for the program’s administration and oversight and for reporting to the Board on at least an annual basis regarding the program’s operation and effectiveness. The Liquidity Administrator Committee updated its assessment of the Fund’s liquidity risk profile, considering additional data gathered during the period from the Fund’s inception on November 30, 2021 through May 31, 2022 (the “Review Period”) and the adequacy and effectiveness of the liquidity risk management program’s operations during the Review Period in order to prepare a written report for the Board of Trustees (the “Report”) for consideration at its meeting held on September 7, 2022. The Report noted that during the Review Period the Fund did not experience unusual stress or disruption to its operations related to purchase and redemption activity. It further noted that during the Review Period the Fund held adequate levels of cash and highly liquid investments to meet shareholder redemption activities in accordance with applicable requirements. The Report concluded that (i) the Trust’s liquidity risk management program is reasonably designed to prevent violations of the Liquidity Rule and (ii) the Trust’s liquidity risk management program had been effectively implemented during the Review Period.
| Summary of Fund Expenses (Unaudited) |
As a shareholder of the Fund, you incur two types of costs: (1) transaction and (2) ongoing costs, including management fees, distribution (12b-1) fees and other Fund expenses. These examples are intended to help you understand your ongoing costs (in dollars) of investing in the Fund and to compare these costs with the ongoing costs of investing in other funds. The example is based on an investment of $1,000 invested at the beginning of the period and held for the entire period from May 1, 2022 through October 31, 2022.
Actual Expenses
The first line of the table below provides information about actual account values and actual expenses. You may use the information in this line, together with the amount you invested, to estimate the expenses that you paid over the period. Simply divide your account value by $1,000 (for example, an $8,600 account value divided by $1,000 = 8.6), then multiply the result by the number in the first line under the heading “Expenses Paid During Period” to estimate the expenses you paid on your account during this period.
Hypothetical Example for Comparison Purposes
The second line of the table below provides information about hypothetical account values and hypothetical expenses based on the Fund’s actual expense ratio and an assumed rate of return of 5% per year before expenses, which is not the Fund’s actual return. The hypothetical account values and expenses may not be used to estimate the actual ending account balance or expenses you paid for the period. You may use this information to compare the ongoing costs of investing in the Fund and other funds. To do so, compare this 5% hypothetical example with the 5% hypothetical examples that appear in the shareholder reports of other funds.
Expenses shown in the table are meant to highlight your ongoing costs only and do not reflect any transactional costs. Therefore, the second line of the table below is useful in comparing ongoing costs only and will not help you determine the relative total costs of owning different funds. In addition, if transaction costs were included, your costs would have been higher.
| | | | | | Ending | | | | | | |
| | | Beginning | | | Account | | | Expenses | | | |
| | | Account | | | Value | | | Paid | | | Annualized |
| | | Value | | | October 31, | | | During | | | Expense |
| | | May 1, 2022 | | | 2022 | | | Period (a) | | | Ratio |
| Actual | | $ | 1,000.00 | | | $ | 843.40 | | | $ | 4.65 | | | 1.00% |
| Hypothetical(b) | | $ | 1,000.00 | | | $ | 1,020.16 | | | $ | 5.01 | | | 1.00% |
| (a) | Expenses are equal to the Fund’s annualized expense ratios, multiplied by the average account value over the period, multiplied by 184/365 (to reflect the one-half year period). |
| (b) | Hypothetical assumes 5% annual return before expenses. |
| Additional Federal Income Tax Information (Unaudited) |
The Form 1099-DIV you receive in January 2023 will show the tax status of all distributions paid to your account in calendar year 2022. Shareholders are advised to consult their own tax adviser with respect to the tax consequences of their investment in the Fund. As required by the Internal Revenue Code and/or regulations, shareholders must be notified regarding the status of qualified dividend income for individuals and the dividends received deduction for corporations.
Qualified Dividend Income. The Fund designates approximately 100% or up to the maximum amount of such dividends allowable pursuant to the Internal Revenue Code, as qualified dividend income eligible for a reduced tax rate.
Qualified Business Income. The Fund designates approximately 0% of its ordinary income dividends, or up to the maximum amount of such dividends allowable pursuant to the Internal Revenue Code, as qualified business income.
Dividends Received Deduction. Corporate shareholders are generally entitled to take the dividends received deduction on the portion of the Fund’s dividend distribution that qualifies under tax law. For the Fund’s calendar year 2022 ordinary income dividends, 100% qualifies for the corporate dividends received deduction.
Proxy Voting
A description of the policies and procedures that the Fund uses to determine how to vote proxies relating to portfolio securities and information regarding how the Fund voted those proxies during the most recent twelve month period ended June 30, are available (1) without charge upon request by calling the Fund at (713) 401-9048 and (2) in Fund documents filed with the SEC on the SEC’s website at www.sec.gov.
TRUSTEES
Andrea N. Mullins, Chairperson
Ira P. Cohen
Mark J. Seger | INDEPENDENT REGISTERED
PUBLIC ACCOUNTING FIRM
Cohen & Company, Ltd.
1350 Euclid Avenue, Suite 800
Cleveland, OH 44115 |
| | |
| | |
OFFICERS
Matthew J. Miller, Principal Executive Officer and
President
Zachary P. Richmond, Principal Financial Officer and
Treasurer
N. Lynn Bowley, Chief Compliance Officer
Carol J. Highsmith, Vice President and Secretary | LEGAL COUNSEL
Troutman Pepper Hamilton Sanders LLP
3000 Two Logan Square
18th and Arch Streets
Philadelphia, PA 19103 |
| | |
| | |
INVESTMENT ADVISER
GCI Investors
7880 San Felipe Street, Suite 240
Houston, TX 77063 | CUSTODIAN AND TRANSFER AGENT
Brown Brothers Harriman & Co.
50 Post Office Square
Boston, MA 02110 |
| | |
| | |
DISTRIBUTOR
Northern Lights Distributors, LLC
17605 Wright Street
Omaha, Nebraska 68130 | ADMINISTRATOR AND FUND
ACCOUNTANT
Ultimus Fund Solutions, LLC
225 Pictoria Drive, Suite 450
Cincinnati, OH 45246 |
This report is intended only for the information of shareholders or those who have received the Fund’s prospectus which contains information about the Fund’s management fee and expenses. Please read the prospectus carefully before investing.
Distributed by Northern Lights Distributors, LLC Member FINRA/SIPC
GENUINE-AR-22
(b) Not applicable
Item 2. Code of Ethics.
As of the end of the period covered by this report, the registrant has adopted a code of ethics that applies to the registrant's principal executive officer, principal financial officer, principal accounting officer or controller, or persons performing similar functions, regardless of whether these individuals are employed by the registrant or a third party. Pursuant to Item 13(a)(1), a copy of registrant’s code of ethics is filed as an exhibit to this Form N-CSR. During the period covered by this report, the code of ethics has not been
amended, and the registrant has not granted any waivers, including implicit waivers, from the provisions of the code of ethics.
Item 3. Audit Committee Financial Expert.
(a)(1) The registrant’s Board of Trustees has determined that the registrant has at least one audit committee financial expert serving on its audit committee.
(a)(2) The audit committee financial expert is Andrea N. Mullins, who is “independent” for purposes of this Item 3 of Form N-CSR.
Item 4. Principal Accountant Fees and Services.
Sound Mind Investing Funds: FY 2022 $45,000
FY 2021 $40,500
Green Owl Intrinsic Value Fund: FY 2022 $14,500
FY 2021 $13,500
Foundry Partners Fundamental
Small Cap Value Fund: FY 2022 $15,000
FY 2021 $14,000
Dana Funds: FY 2022 $45,000
FY 2021 $42,000
Genuine Investors ETF: FY 2022 $14,000
Sound Mind Investing Funds: FY 2022 $0
FY 2021 $0
Green Owl Intrinsic Value Fund: FY 2022 $0
FY 2021 $0
Foundry Partners Fundamental
Small Cap Value Fund: FY 2022 $0
FY 2021 $0
Dana Funds: FY 2022 $0
FY 2021 $0
Genuine Investors ETF: FY 2022 $0
FY 2021 $0
Sound Mind Investing Funds: FY 2022 $9,000
FY 2021 $9,000
Green Owl Intrinsic Value Fund: FY 2022 $3,000
FY 2021 $3,000
Foundry Partners Fundamental
Small Cap Value Fund: FY 2022 $3,000
FY 2021 $3,000
Dana Funds: FY 2022 $9,000
FY 2021 $9,000
Genuine Investors ETF: FY 2022 $3,000
Nature of the fees: Preparation of the 1120 RIC and Excise review
Sound Mind Investing Funds: FY 2022 $0
FY 2021 $0
Green Owl Intrinsic Value Fund: FY 2022 $0
FY 2021 $0
Foundry Partners Fundamental
Small Cap Value Fund: FY 2022 $0
FY 2021 $0
Dana Funds: FY 2022 $0
FY 2021 $0
Genuine Investors ETF: FY 2022 $0
| (e) | (1) Audit Committee’s Pre-Approval Policies |
The Audit Committee Charter requires the Audit Committee to be responsible for the selection, retention or termination of auditors and, in connection therewith, to (i) evaluate the proposed fees and other compensation, if any, to be paid to the auditors, (ii) evaluate the independence of the auditors, (iii) pre-approve all audit services and, when appropriate, any non-audit services provided by the independent auditors to the Trust, (iv) pre-approve, when appropriate, any non-audit services provided by the independent auditors to the Trust's investment adviser, or any entity controlling, controlled by, or under common control with the investment adviser and that provides ongoing services to
the Trust if the engagement relates directly to the operations and financial reporting of the Trust, and (v) receive the auditors’ specific representations as to their independence;
| (2) | None of the services described in paragraph (b) through (d) of this Item were approved by the audit committee pursuant to paragraph (c)(7)(i)(C) of Rule 2-01 of Regulation S-X. |
(f) During audit of registrant's financial statements for the most recent fiscal year, less than 50 percent of the hours expended on the principal accountant's engagement were attributed to work performed by persons other than the principal accountant's full-time, permanent employees.
(g) The aggregate non-audit fees billed by the registrant's accountant for services rendered to the registrant, and rendered to the registrant's investment adviser (not including any sub-adviser whose role is primarily portfolio management and is subcontracted with or overseen by another investment adviser), and any entity controlling, controlled by, or under common control with the adviser that provides ongoing services to the registrant:
Registrant Adviser
FY 2022 $27,000 $ 0
FY 2021 $24,000 $ 0
(h) Not applicable. The auditor performed no services for the registrant’s investment adviser or any entity controlling, controlled by, or under common control with the investment adviser that provides ongoing services to the registrant.
(i) Not applicable.
(j) Not applicable.
Item 5. Audit Committee of Listed Companies. Not applicable – applies to listed companies only
Item 6. Schedule of Investments. Schedules filed with Item 1.
Item 7. Disclosure of Proxy Voting Policies and Procedures for Closed-End Management Investment Companies. Not applicable – applies to closed-end funds only
Item 8. Portfolio Managers of Closed-End Investment Companies. Not applicable – applies to closed-end funds only
Item 9. Purchases of Equity Securities by Closed-End Management Investment Company and Affiliated Purchasers. Not applicable – applies to closed-end funds only
Item 10. Submission of Matters to a Vote of Security Holders.
The guidelines applicable to shareholders desiring to submit recommendations for nominees to the Registrant's board of trustees are contained in the statement of additional information of the Trust with respect to the Fund(s) for which this Form N-CSR is being filed.
Item 11. Controls and Procedures.
(a) Based on their evaluation of the registrant’s disclosure controls and procedures (as defined in Rule 30a-3(c) under the Investment Company Act of 1940, as amended (the “Act”)) as of a date within 90 days
of the filing date of this report, the registrant’s principal executive officer and principal financial officer have concluded that such disclosure controls and procedures are reasonably designed and are operating effectively to ensure that material information relating to the registrant is made known to them by others within those entities, particularly during the period in which this report is being prepared, and that the information required in filings on Form N-CSR is recorded, processed, summarized, and reported on a timely basis.
(b) There were no changes in the registrant’s internal control over financial reporting (as defined in Rule 30a-3(d) under the Investment Company Act of 1940) that occurred during the period covered by this report that have materially affected, or are reasonably likely to materially affect, the registrant’s internal control over financial reporting.
Item 12. Disclosure of Securities Lending Activities for Closed-End Management Investment Companies. Not applicable – applies to closed-end funds only
Item 13. Exhibits.
(a) (1) Code is filed herewith.
(3) Not Applicable
Pursuant to the requirements of the Securities Exchange Act of 1934 and the Investment Company Act of 1940, the registrant has duly caused this report to be signed on its behalf by the undersigned, thereunto duly authorized.
(Registrant) Valued Advisers Trust
By /s/ Matthew J. Miller
Matthew J. Miller, President and Principal Executive Officer
Date 1/6/2023
Pursuant to the requirements of the Securities Exchange Act of 1934 and the Investment Company Act of 1940, this report has been signed below by the following persons on behalf of the registrant and in the capacities and on the dates indicated.
By /s/ Matthew J. Miller
Matthew J. Miller, President and Principal Executive Officer
Date 1/6/2023
By /s/ Zachary P. Richmond
Zachary P. Richmond, Treasurer and Principal Financial Officer
Date 1/6/2023