united states
securities and exchange commission
washington, d.c. 20549
form n-csr
certified shareholder report of registered management
investment companies
| Investment Company Act file number | 811-22208 | |
Valued Advisers Trust |
| (Exact name of registrant as specified in charter) |
| Ultimus Fund Solutions, LLC 225 Pictoria Drive, Suite 450 | Cincinnati, OH 45246 |
| (Address of principal executive offices) | (Zip code) |
Ultimus Fund Solutions, LLC
Attn: Zachary Richmond
225 Pictoria Drive, Suite 450
Cincinnati, OH 45246
(Name and address of agent for service)
| Registrant's telephone number, including area code: | 513-587-3400 | |
| Date of fiscal year end: | 10/31 | |
| Date of reporting period: | 10/31/2021 | |
Item 1. Reports to Stockholders.
(a)

DANA LARGE CAP EQUITY FUND
DANA EPIPHANY ESG SMALL CAP EQUITY FUND
DANA EPIPHANY ESG EQUITY FUND
Annual Report
October 31, 2021
Dana Investment Advisors, Inc.
20700 Swenson Drive, Suite 400
Waukesha, WI 53186
(855) 280-9648
www.danafunds.com
Dear Fellow Shareholders,
Many of us were happy to see the calendar flip from 2020 to 2021 with hopes of returning to a sense of normalcy in both our professional and personal lives. While road bumps were experienced along the way, we certainly feel progress was made towards pre-pandemic interactions with the return to more in-person activities. As investors, we continue to watch the ever-changing global economic and geopolitical environment with an eye out for opportunities. We remain thankful for your continued trust and support of the Dana Funds. We are happy to share this discussion and analysis of the prior twelve months in the financial markets and the Dana Funds’ performance.
Economic and Market Recap
Most of 2021 has been a year dominated by news surrounding COVID-19 and its effect on the economy and expected growth. GDP grew at a rate of over 6% annualized through the first six months of the year before slowing to 2.1% in the third quarter. Large fiscal spending plans targeted at supporting the economy were passed in December of 2020 and March of 2021. The Federal Reserve did its part by maintaining a zero interest-rate policy and continuing to purchase both Treasuries and mortgage-backed securities in the open market. Longer market interest rates rose significantly in the first quarter of the year before plateauing and falling slightly in the second and third quarters.
Following a spike in COVID-19 cases at the end of 2020, cases and deaths began to fall in 2021 while the percentage of the population that had been vaccinated continued to rise. Market sectors that stood to gain the most from a decline in the severity of COVID-19 were the best performers in the first half of the year. These sectors included Energy, Industrials, and Financials. The S&P 500 rose over 6% in the first quarter and over 8% in the second quarter as confidence grew that COVID-19 was on the decline as a serious threat. This sector performance reversed somewhat in the third quarter as growth slowed and the Delta variant became prevalent and cases rose.
Inflation has continued to run at a high level through most of 2021. Home prices, automobiles, and energy were areas that have shown significant price increases over the past year. Manufacturing and supply chain disruptions due to COVID-19 have been blamed for the widespread increase in price levels. Fiscal and monetary stimulus may also have played a role, but these same factors failed to produce inflation in the decade prior to COVID-19. The Federal Reserve has taken notice, and has done its best to try and control rates through tough talk and an incremental reduction in their bond purchases. A topping process for inflation is not yet apparent and will be a key fiscal and monetary issue in 2022.
Dana Large Cap Fund (the “Large Cap Fund”) Discussion
The Dana Large Cap Equity Fund (Institutional Class) returned 40.89%, slightly trailing the S&P 500® Index return of 42.91% in a very strong equity market during the fiscal year 2021. Just a week into the Dana Funds’ fiscal year, Pfizer announced a COVID-19 vaccine (followed by Moderna a week later), which started a strong and sustained COVID-19 recovery rally. Equity indexes began setting new record highs at the end of 2020. The market broadened, but much of the initial leadership came from lower-quality stocks that had been severely beaten down in the first 10 months of calendar 2020. As 2021 kicked off, excess liquidity and speculative fervor created an atmosphere where “meme stocks” and SPACs juiced market returns. Corporate earnings were strong, driving equities higher, and the Large Cap Fund participated in the upward move. But in the final two months of the fiscal year ended October 31, 2021, fear over rising interest rates, inflation, labor, politics, COVID variants, and other global concerns led to a 5% market correction (deeper for mid-cap, small-cap, and foreign stock indexes) and a return to a narrow market led by mega-cap growth companies.
1
Rising fuel prices drove the Energy sector to lead the market and the Large Cap Fund in terms of absolute returns during the fiscal year, with the Large Cap Fund’s Energy holdings outperforming the S&P 500 sector. Relative performance contribution was strongest for the Large Cap Fund’s in the Financials sector, generally rewarding our patience with bank stocks. Conversely, the weakest (though still well-positive) absolute sector return came in the Utilities sector for both the Large Cap Fund and the S&P 500® Index, with the Large Cap Fund’s Utilities holdings slightly lagging the S&P 500 sector return. The largest relative contribution deficit to the benchmark was in the Health Care sector despite generally strong performance from new positions in Avantor, Inc. (AVTR), CVS Health Corporation (CVS), and longer-term holding Horizon Therapeutics PLC (HZNP). Health Care stock Zimmer Biomet Holdings, Inc. (ZBH) was the Large Cap Fund’s weakest performer for the fiscal year. As the world’s leading manufacturer of replacement hips and knees, combined with an attractive valuation, it had appeared well positioned as a reopening play with more elective surgical procedures on the horizon. Walt Disney Company (DIS), purchased just prior to the market weakness in September and October, was the Large Cap Fund’s second worst detractor, yet we continue to see good value as parks reopen and they monetize their extensive content catalog for streaming. Alphabet Inc. (GOOGL) was the largest positive contributor to Fund performance, thanks in part to its relatively high portfolio weight, followed by Morgan Stanley (MS). The biggest absolute returns came from Energy holdings ConocoPhillips (COP) and Pioneer Natural Resources Company (PXD).
Late in the fiscal year, the Large Cap Fund sold a few of our higher-valuation stocks that had performed very well in the COVID-19-dominated market that played out during the fiscal year. Our focus has recently been on identifying quality companies that we feel are likely to fare well as new macro factors (e.g., inflation, tight labor) become more significant and GDP and corporate earnings growth revert to long-term trend. We believe fundamentals will become more important to stock performance, which should provide a tailwind to our portfolio.
Dana Epiphany ESG Small Cap Fund (the “Small Cap Fund”) Discussion
The Small Cap Fund (Institutional class) returned 62.02% versus 45.84% for its benchmark Morningstar U.S. Small Core Index and 50.80% for the Russell 2000® Index during the fiscal year 2021. The fiscal year erupted with a bang as news in early November 2020 about viable COVID-19 vaccines snapped the spell cast upon the equity markets. Similar to the dynamics around the Spring 2009 market lows, the rebound was initially led by more distressed companies, especially those whose fortunes hung in the balance with continued lockdowns and other stifling virus mitigation tactics. A quick tip of our hat to last year’s commentary where we reminded investors that small caps were facing a positive set-up:
“The good news is that small cap stocks have historically outperformed large cap stocks coming off market bottoms, a pattern that repeated in the second quarter, as well as off the market lows this fall.”
Indeed, small caps outperformed larger market caps during the closing of 2020 and for much of the next quarter. The Small Cap Fund benefitted from strong returns in this period, but didn’t really start to gain on the benchmark index until fourth quarter 2020 earnings season ramped up in February. Fundamental news flow dominated earnings season though July. The set-up of weak expectations, re-opening activity, and supply chain replenishment provided a fertile background for stocks to appreciate if they exceeded expectations on earnings, margins, and especially revenues.
While distressed names bounced highest from their lows, January and May also featured interesting trading dynamics that showed the retail investor was alive and clicking. Meme stocks and the so-called Reddit stocks had positive returns that in some cases defied gravity, but they also caught
2
lazy institutions napping on stale short positions, as evidenced by AMC Entertainment (AMC) where short interest as a percentage of float declined from over 40% to nearly 10% from December to February as the stock surged. Symbolic of the improving economic background post-vaccines, tactically alert management capitalized on the share shortage and issued new shares to bolster the balance sheet and feed an acquisition budget. AMC helped the Communication Services sector earn the second highest sector return for the period (second to the resurgent Energy sector, home to the great majority of domestic exploration and production companies).
Fund attribution reflects these periods of tension between retail interest, reopening optimism, and improving fundamentals. November, December, and January were months where the Small Cap Fund accrued negative alpha despite strong performance, while from February to mid-May, the Fund earned positive alpha due to its positioning in quality growing companies. After another retail rally in late May, the Small Cap Fund continued to outperform with a degree of consistency through the end of October.
Most sectors were alpha-positive for the year, but the greatest strength came from Financials and Health Care. Western Alliance Bancorp (WAL) and Pinnacle Financial Partners (PNFP) continued to execute on growth plans and benefitted from expanding multiples for banks, as the economic recovery helps the Federal Reserve calculate a path to a steeper yield curve. In the Health Care sector, strength was dispersed as holdings in Equipment, Biotechnology, and Health Care Technology outpaced peer averages. In total, fourteen holdings from six different sectors had triple-digit performance returns in the fiscal year. Atkore Inc. (ATKR), an industrial company, paced all gainers. Atkore is followed by only four research firms, yet it reached a market cap over $4 billion. Atkore makes commercial electrical construction products and, in addition to strong demand in their end markets, has exhibited very strong pricing power from product innovations that have exceeded estimates. As of November 18, management has raised their initial guidance of $400 mm EBITDA for 2022 four times and now expects EBITA in the range of $650-700mm. Management has plans to deploy capital in 2022 on capital expenditures, accretive M&A, and a $400mm share buyback authorization.
Due to the dramatic rebound in share prices, there were few opportunities to tax harvest into the fiscal year end. We feel a benefit to our process is culling weaker names at losses on a quarterly basis, but, more often than not, those swaps were at gains this year. Some of the portfolio trading was done with an eye on tax efficiency, and the result should help as much as possible to minimize the taxable gains.
The dynamic environment of the last 12 months has been a very exciting time to search for investments. We continue to find new stories in the small cap space that warrant our attention and curiosity. As older holdings mature, we will continue to add new positions that we think can support the long-term success of the Dana Small Cap Fund through a relative value discipline that focuses on fundamentally driven stock selection to reward investors over the long term.
Dana Epiphany ESG Equity Fund (the “Epiphany ESG Fund”) Discussion
The Dana Epiphany ESG Fund (Institutional Class) posted a positive return of 38.70%, trailing the benchmark S&P 500® Index returns of 42.91% during the fiscal year 2021. The Epiphany ESG Fund shares an investment philosophy that is common to all the Dana Funds, but adds a faith-based values component to security selection. While we use the S&P 500® Index as the benchmark for the strategy, values considerations lead the portfolio to have higher exposure to mid-cap stocks, and occasionally stocks that qualify as small cap. The market environment discussions above for the Large Cap Equity Fund (describing the large cap U.S. equity market) and the Small Cap Fund (describing the small cap market) give the market context in which the Epiphany ESG Fund operated.
3
Similar to the Large Cap Equity Fund, the market-leading Energy sector also led the Epiphany ESG Fund in terms of absolute returns during the fiscal year. Relative performance contribution was strongest for the Epiphany ESG Fund in the Financials sector, rewarding our patience with bank stocks. The highest absolute returns in the Epiphany ESG Fund were posted by Energy holdings ConocoPhillips (COP) and Pioneer Natural Resources Company (PXD), with both names outperforming the very strong sector average. The biggest individual contributions to the Epiphany ESG Fund’s total return (thanks to larger portfolio weights) came from Microsoft Corporation (MSFT) and Morgan Stanley (MS). Conversely, the weakest absolute sector return came in the Utilities sector for both the Epiphany ESG Fund and the S&P 500® Index, with the Epiphany ESG Fund Utilities holdings slightly lagging the S&P 500 sector return. The largest sector detractor versus the benchmark came in Health Care. The values mandate for the Epiphany ESG Fund can create specific challenges in the Health Care sector, and elevated dispersion among Health Care stocks magnified tracking error over the past year. Emergent BioSolutions Inc. (EBS) was the weakest performer in the Epiphany ESG Fund following manufacturing problems on the company’s part of the Johnson & Johnson COVID-19 vaccine. These manufacturing problems were cause for concerns with management, and the position was eliminated from the Epiphany ESG Fund. The Information Technology sector also produced meaningful relative weakness, with IT holdings Fidelity National Information Services (FIS) and Micron Technology, Inc. (MU) being the biggest relative detractors in the Epiphany ESG Fund. We believe Fidelity National Information Services earnings and revenue show reasonable growth and Micron is still well positioned to improve pricing, margins, and cash flow in the face of significant supply constraints.
The Epiphany ESG Fund delivered generally good relative performance during the first half of the fiscal year as breadth in the market improved (even though much of the leadership in that period came from lower-quality stocks). Mega-cap stocks drove the return of the S&P 500® Index during the second half of the fiscal year, resulting in lagging performance for the Epiphany ESG Fund despite reasonable performance in many sectors (particularly those not dominated by mega-cap names). Consistent with the other Dana Funds, late in the year, the Epiphany ESG Fund sold a few higher-valuation stocks that had performed very well in the COVID-19-dominated market that played out during the fiscal year. As discussed earlier, we believe fundamentals will become more important to stock performance, and our focus has recently been on identifying quality companies that we feel are likely to fare well as new macro factors (e.g., inflation, tight labor) become more significant, and GDP and corporate earnings growth revert to long-term trend. We see good opportunities in the market for selective stocks and are optimistic that the market-cap flexibility of the Epiphany ESG Fund combined with a broader, more fundamentally-driven market will have a positive influence on the Epiphany ESG Fund in the coming year (and beyond).
Respectfully submitted,

Mark R. Mirsberger, CPA
Chief Executive Officer – Dana Investment Advisors, Inc.

Duane Roberts, CFA
Portfolio Manager and Director of Equities – Dana Investment Advisors, Inc.
4
Investment Results (Unaudited) | |
Average Annual Total Returns(a) as of October 31, 2021
| One
Year | Five
Year | Ten
Year | Since
Inception
(10/29/13) |
Dana Large Cap Equity Fund | | |
Institutional Class | 40.89% | 18.01% | N/A | 13.39% |
Investor Class | 40.48% | 17.71% | 14.36% | N/A |
S&P 500® Index(b) | 42.91% | 18.93% | 16.21% | 14.90% |
| | Expense Ratios(c) |
| Institutional
Class | Investor
Class |
Gross | 0.91% | 1.16% |
With Applicable Waivers | 0.73% | 0.98% |
The performance quoted represents past performance, which does not guarantee future results. The investment return and principal value of an investment will fluctuate so that an investor’s shares, when redeemed, may be worth more or less than their original cost. The returns shown do not reflect deduction of taxes that a shareholder would pay on Dana Large Cap Equity Fund (the “Large Cap Fund”) distributions or the redemption of Large Cap Fund shares. Current performance of the Large Cap Fund may be lower or higher than the performance quoted. Performance data current to the most recent month end may be obtained by calling 1-855-280-9648.
(a) | Average annual total returns reflect any change in price per share and assume the reinvestment of all distributions. The Large Cap Fund’s returns reflect any fee reductions during the applicable period. If such reductions had not occurred, the quoted performance would have been lower. |
(b) | The S&P 500® Index (“S&P Index”) is a widely recognized unmanaged index of equity securities and is representative of a broader domestic equity market and range of securities than is found in the Large Cap Fund’s portfolio. Individuals cannot invest directly in the S&P Index; however, an individual can invest in exchange-traded funds (“ETFs”) or other investment vehicles that attempt to track the performance of a benchmark index. |
(c) | The expense ratios are from the Large Cap Fund’s prospectus dated February 26, 2021. Expense ratios with applicable waivers reflect that Dana Investment Advisors, Inc. (the “Adviser”) has contractually agreed to waive or limit its fees and to assume other expenses of the Large Cap Fund until February 28, 2022, so that total annual fund operating expenses do not exceed 0.73% of the Large Cap Fund’s average daily net assets. This operating expense limitation does not apply to brokerage fees and commissions, borrowing costs (such as interest and dividend expenses on securities sold short), taxes, extraordinary expenses, fees and expenses paid under a distribution plan adopted pursuant to Rule 12b-1, fees and expenses paid under a shareholder services plan, and indirect expenses (such as “Acquired Fund Fees and Expenses”). Each waiver or reimbursement of an expense by the Adviser is subject to repayment by the Large Cap Fund within three years following the date of such waiver or reimbursement, provided that the Large Cap Fund is able to make the repayment without exceeding the expense limitation in place at the time of the waiver or reimbursement and the expense limitation in place at the time of the repayment. This agreement may only be terminated by mutual consent of the Adviser and the Board of Trustees. Additional information pertaining to the Large Cap Fund’s expense ratios as of October 31, 2021 can be found in the financial highlights. |
The Large Cap Fund’s investment objectives, strategies, risks, charges and expenses must be considered carefully before investing. The prospectus contains this and other important information about the Large Cap Fund and may be obtained by calling the same number as above. Please read it carefully before investing.
The Large Cap Fund is distributed by Ultimus Fund Distributors, LLC, member FINRA/SIPC.
5
Investment Results (Unaudited) | |
Average Annual Total Returns(a) as of October 31, 2021
| One
Year | Five
Year | Since
Inception
(11/3/15) |
Dana Epiphany ESG Small Cap Equity Fund |
Institutional Class | 62.02% | 13.37% | 9.72% |
Morningstar US Small Core Index(b) | 45.84% | 12.24% | 10.86% |
Russell 2000® Index(c) | 50.80% | 15.52% | 13.07% |
| | Expense
Ratios(d) |
| Institutional
Class |
Gross | 2.58% |
With Applicable Waivers | 0.95% |
The performance quoted represents past performance, which does not guarantee future results. The investment return and principal value of an investment will fluctuate so that an investor’s shares, when redeemed, may be worth more or less than their original cost. The returns shown do not reflect deduction of taxes that a shareholder would pay on Dana Epiphany ESG Small Cap Equity Fund (the “Small Cap Fund”) distributions or the redemption of Small Cap Fund shares. Current performance of the Small Cap Fund may be lower or higher than the performance quoted. Performance data current to the most recent month end may be obtained by calling 1-855-280-9648.
(a) | Average annual total returns reflect any change in price per share and assume the reinvestment of all distributions. The Small Cap Fund’s returns reflect any fee reductions during the applicable period. If such reductions had not occurred, the quoted performance would have been lower. Effective at the close of business on June 4, 2020, Investor Class shares of the Small Cap Fund were exchanged for Institutional Class shares, resulting in the closing of the Investor Class. The Small Cap Fund has changed its primary benchmark from the Russell 2000® Index to the Morningstar US Small Core Index. The composition of the two indexes is substantially similar, and in the opinion of Dana Investment Advisors, Inc., (the “Adviser”), the Morningstar US Small Core Index provides an appropriate broad-based market comparison for the Small Cap Fund. |
(b) | The Morningstar US Small Core Index (“Morningstar Index”) provides a comprehensive depiction of the performance and fundamental characteristics of the Small Core segment of U.S. equity markets. The Morningstar Index does not incorporate Environmental, Social, Or Governance (ESG) criteria. Individuals can not invest directly in the Morningstar Index; however, an individual can invest in ETFs or other investment vehicles that attempt to track the performance of a benchmark index. |
(c) | The Russell 2000® Index (“Russell Index”) is a widely recognized unmanaged index of equity securities and is representative of a broader domestic equity market and range of securities than are found in the Small Cap Fund’s portfolio. Individuals can not invest directly in the Russell Index; however, an individual can invest in ETFs or other investment vehicles that attempt to track the performance of a benchmark index. |
(d) | The expense ratios are from the Small Cap Fund’s prospectus dated February 26, 2021. Expense ratios with applicable waivers reflect that the Adviser has contractually agreed to waive or limit its fees and to assume other expenses of the Small Cap Fund until February 28, 2022, so that total annual fund operating expenses do not exceed 0.95% of the Small Cap Fund’s average daily net assets. This operating expense limitation does not apply to brokerage fees and commissions, borrowing costs (such as interest and dividend expenses on securities sold short), taxes, extraordinary expenses, fees and expenses paid under a distribution plan adopted pursuant to Rule 12b-1, fees and expenses paid under a shareholder services plan, and indirect expenses (such as “Acquired Fund Fees and Expenses”). Each waiver or reimbursement of an expense by the Adviser is subject to repayment by the Small Cap Fund within three years following the date of such waiver or reimbursement, provided that the Small Cap Fund is able to make the repayment without exceeding the expense limitation in place at the time of the waiver or reimbursement and the expense limitation in place at the time of the repayment. This agreement may only be terminated by mutual consent of the Adviser and the Board of Trustees. Additional information pertaining to the Small Cap Fund’s expense ratios as of October 31, 2021 can be found in the financial highlights. |
The Small Cap Fund’s investment objectives, strategies, risks, charges and expenses must be considered carefully before investing. The prospectus contains this and other important information about the Small Cap Fund and may be obtained by calling the same number as above. Please read it carefully before investing.
The Small Cap Fund is distributed by Ultimus Fund Distributors, LLC, member FINRA/SIPC.
6
Investment Results (Unaudited) | |
Average Annual Total Returns(a) as of October 31, 2021
| One
Year | Five
Year | Ten
Year |
Dana Epiphany ESG Equity Fund | | | |
Institutional Class | 38.70% | 16.36% | 12.62% |
S&P 500® Index(b) | 42.91% | 18.93% | 16.21% |
| | Expense
Ratios(c) |
| Institutional
Class |
Gross | 2.00% |
With Applicable Waivers | 0.85% |
The performance quoted represents past performance, which does not guarantee future results. The investment return and principal value of an investment will fluctuate so that an investor’s shares, when redeemed, may be worth more or less than their original cost. The returns shown do not reflect deduction of taxes that a shareholder would pay on Dana Epiphany ESG Equity Fund (the “Epiphany ESG Fund”) distributions or the redemption of Epiphany ESG Fund shares. Current performance of the Epiphany ESG Fund may be lower or higher than the performance quoted. Performance data current to the most recent month end may be obtained by calling 1-855-280-9648.
(a) | Average annual total returns reflect any change in price per share and assume the reinvestment of all distributions. The Epiphany ESG Fund’s returns reflect any fee reductions during the applicable period. If such reductions had not occurred, the quoted performance would have been lower. Effective at the close of business on June 4, 2020, Investor Class shares of the Epiphany ESG Fund were exchanged for Institutional Class Shares, resulting in the closing of the Investor Class. |
(b) | The S&P 500® Index (“S&P Index”) is a widely recognized unmanaged index of equity securities and is representative of a broader domestic equity market and range of securities than is found in the Epiphany ESG Fund’s portfolio. Individuals cannot invest directly in the S&P Index; however, an individual can invest in ETFs or other investment vehicles that attempt to track the performance of a benchmark index. |
(c) | The expense ratios are from the Epiphany ESG Fund’s prospectus dated February 26, 2021. Expense ratios with applicable waivers reflect that Dana Investment Advisors, Inc. (the “Adviser”) has contractually agreed to waive or limit its fees and to assume other expenses of the Epiphany ESG Fund until February 28, 2022, so that total annual fund operating expenses do not exceed 0.85% of the Epiphany ESG Fund’s average net assets. This operating expense limitation does not apply to brokerage fees and commissions, borrowing costs (such as interest and dividend expenses on securities sold short), taxes, extraordinary expenses, fees and expenses paid under a distribution plan adopted pursuant to Rule 12b-1, fees and expenses paid under a shareholder services plan, and indirect expenses (such as “Acquired Fund Fees and Expenses”). Each waiver or reimbursement of an expense by the Adviser is subject to repayment by the Epiphany ESG Fund within three years following the date of such waiver or reimbursement, provided that the Epiphany ESG Fund is able to make the repayment without exceeding the expense limitation in place at the time of the waiver or reimbursement and the expense limitation in place at the time of the repayment. This agreement may only be terminated by mutual consent of the Adviser and the Board of Trustees. Additional information pertaining to the Epiphany ESG Fund’s expense ratios as of October 31, 2021 can be found in the financial highlights. |
The Epiphany ESG Fund’s investment objectives, strategies, risks, charges and expenses must be considered carefully before investing. The prospectus contains this and other important information about the Epiphany ESG Fund and may be obtained by calling the same number as above. Please read it carefully before investing.
The Epiphany ESG Fund is distributed by Ultimus Fund Distributors, LLC, member FINRA/SIPC.
7
Comparison of Growth of $10,000 Investment in the
Dana Large Cap Equity Fund, Investor Class and
the S&P 500® Index (Unaudited)
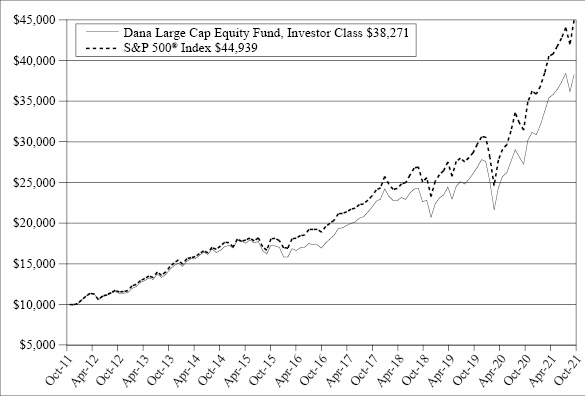
The chart above assumes an initial investment of $10,000 made on October 31, 2011 held through October 31, 2021. THE LARGE CAP FUND’S RETURN REPRESENTS PAST PERFORMANCE AND DOES NOT GUARANTEE FUTURE RESULTS. The returns shown do not reflect deduction of taxes that a shareholder would pay on Large Cap Fund distributions or the redemption of Large Cap Fund shares. Investment returns and principal values will fluctuate so that your shares, when redeemed, may be worth more or less than their original purchase price.
Current performance may be lower or higher than the performance data quoted. For more information on the Large Cap Fund, and to obtain performance data current to the most recent month end or to request a prospectus, please call 1-855-280-9648. You should carefully consider the investment objectives, potential risks, management fees, and charges and expenses of the Large Cap Fund before investing. The Large Cap Fund’s prospectus contains this and other information about the Large Cap Fund, and should be read carefully before investing.
The Large Cap Fund is distributed by Ultimus Fund Distributors, LLC, member FINRA/SIPC.
8
Comparison of Growth of $10,000 Investment in the
Dana Epiphany ESG Small Cap Equity Fund, Institutional Class, the Russell 2000® Index, and the Morningstar US Small Core Index (Unaudited)
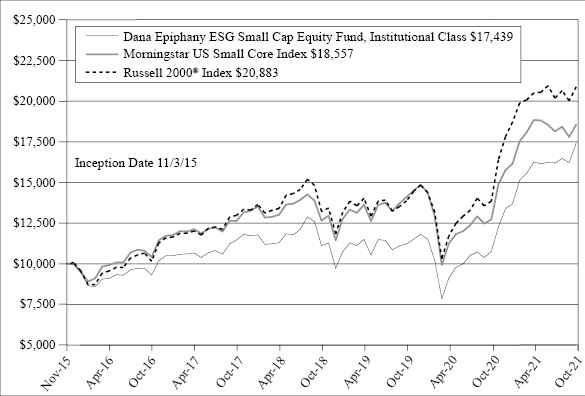
The chart above assumes an initial investment of $10,000 made on November 3, 2015 (commencement of Institutional Class operations) held through October 31, 2021. THE SMALL CAP FUND’S RETURN REPRESENTS PAST PERFORMANCE AND DOES NOT GUARANTEE FUTURE RESULTS. The returns shown do not reflect deduction of taxes that a shareholder would pay on Small Cap Fund distributions or the redemption of Small Cap Fund shares. Investment returns and principal values will fluctuate so that your shares, when redeemed, may be worth more or less than their original purchase price.
Current performance may be lower or higher than the performance data quoted. For more information on the Small Cap Fund, and to obtain performance data current to the most recent month end or to request a prospectus, please call 1-855-280-9648. You should carefully consider the investment objectives, potential risks, management fees, and charges and expenses of the Small Cap Fund before investing. The Small Cap Fund’s prospectus contains this and other information about the Small Cap Fund, and should be read carefully before investing.
The Small Cap Fund is distributed by Ultimus Fund Distributors, LLC, member FINRA/SIPC.
9
Comparison of Growth of $10,000 Investment in the
Dana Epiphany ESG Equity Fund, Institutional Class and
the S&P 500® Index (Unaudited)
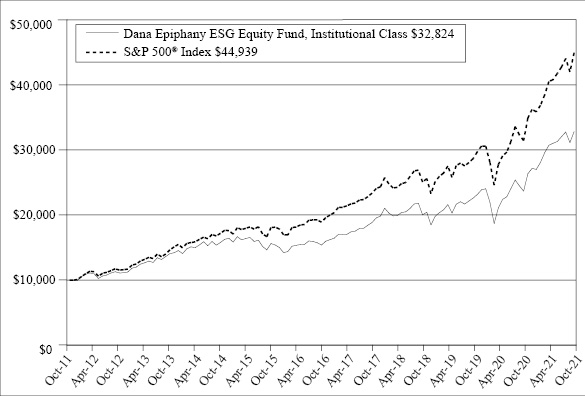
The chart above assumes an initial investment of $10,000 made on October 31, 2011 held through October 31, 2021. THE EPIPHANY ESG FUND’S RETURN REPRESENTS PAST PERFORMANCE AND DOES NOT GUARANTEE FUTURE RESULTS. The returns shown do not reflect deduction of taxes that a shareholder would pay on Epiphany ESG Fund distributions or the redemption of Epiphany ESG Fund shares. Investment returns and principal values will fluctuate so that your shares, when redeemed, may be worth more or less than their original purchase price.
Current performance may be lower or higher than the performance data quoted. For more information on the Epiphany ESG Fund, and to obtain performance data current to the most recent month end or to request a prospectus, please call 1-855-280-9648. You should carefully consider the investment objectives, potential risks, management fees, and charges and expenses of the Epiphany ESG Fund before investing. The Epiphany ESG Fund’s prospectus contains this and other information about the Epiphany ESG Fund, and should be read carefully before investing.
The Epiphany ESG Fund is distributed by Ultimus Fund Distributors, LLC, member FINRA/SIPC.
10
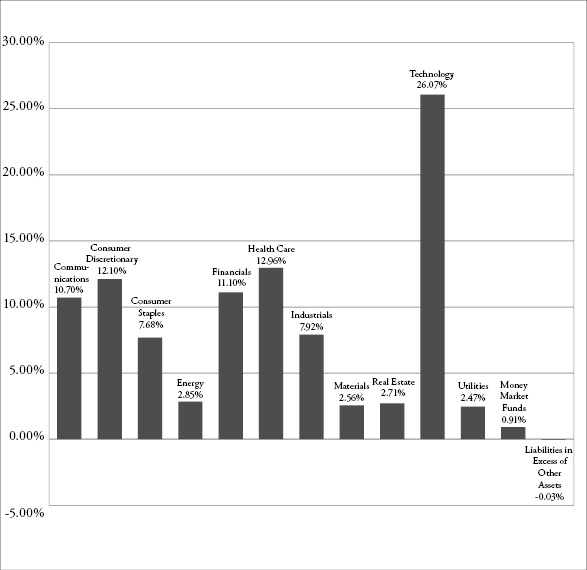
Portfolio Illustration (Unaudited)
October 31, 2021
The following chart gives a visual breakdown of the Large Cap Fund by sector weighting as a percentage of net assets as of October 31, 2021.
11
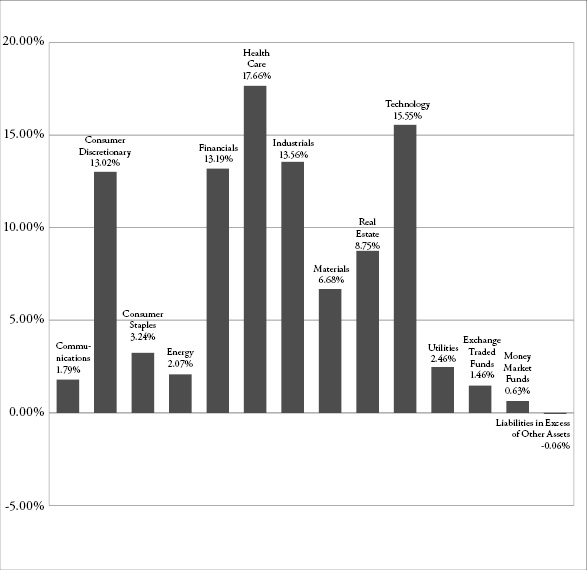
Portfolio Illustration (Unaudited)
October 31, 2021
The following chart gives a visual breakdown of the Small Cap Fund by sector weighting as a percentage of net assets as of October 31, 2021.
12
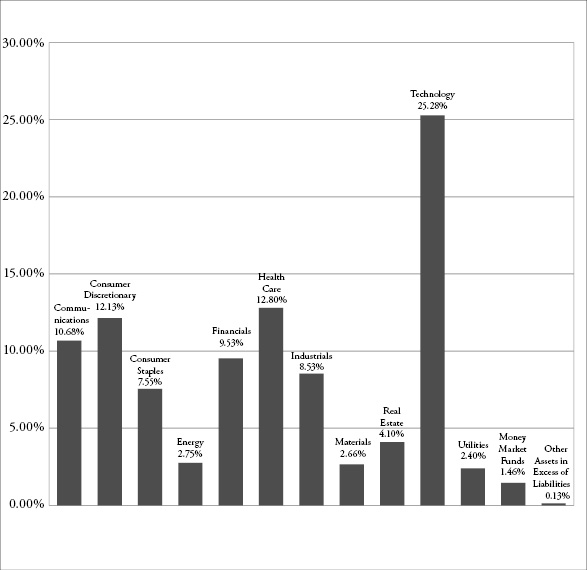
Portfolio Illustration (Unaudited)
October 31, 2021
The following chart gives a visual breakdown of the Epiphany ESG Fund by sector weighting as a percentage of net assets as of October 31, 2021.
Availability of Portfolio Schedules (Unaudited)
The Large Cap Fund, the Small Cap Fund and the Epiphany ESG Fund (each a “Fund” and collectively the “Funds”) file their complete schedules of portfolio holdings with the Securities and Exchange Commission (“SEC”) for the first and third quarters of each fiscal year as an exhibit to its reports on Form N-PORT. The Funds’ Form N-PORT reports are available on the SEC’s website at http://www.sec.gov and on the Funds’ website at http://www.danafunds.com.
13
Dana Large Cap Equity Fund
Schedule of Investments
October 31, 2021
| | Shares | | | Fair Value | |
COMMON STOCKS — 99.12% | | | | | | | | |
Communications — 10.70% | | | | | | | | |
Alphabet, Inc., Class A(a) | | | 1,850 | | | $ | 5,477,702 | |
AT&T, Inc. | | | 1,000 | | | | 25,260 | |
Comcast Corp., Class A | | | 51,600 | | | | 2,653,788 | |
Facebook, Inc., Class A(a) | | | 7,000 | | | | 2,264,990 | |
Interpublic Group of Cos., Inc. | | | 74,600 | | | | 2,728,122 | |
Verizon Communications, Inc. | | | 500 | | | | 26,495 | |
Walt Disney Co. (The)(a) | | | 12,000 | | | | 2,028,840 | |
| | | | | | | | 15,205,197 | |
Consumer Discretionary — 12.10% | | | | | | | | |
Amazon.com, Inc.(a) | | | 1,280 | | | | 4,316,710 | |
Best Buy Co., Inc. | | | 8,000 | | | | 977,920 | |
D.R. Horton, Inc. | | | 28,000 | | | | 2,499,560 | |
Deckers Outdoor Corp.(a) | | | 6,600 | | | | 2,609,046 | |
Fortune Brands Home & Security, Inc. | | | 21,000 | | | | 2,129,400 | |
General Motors Co.(a) | | | 33,000 | | | | 1,796,190 | |
Home Depot, Inc. (The) | | | 7,700 | | | | 2,862,398 | |
| | | | | | | | 17,191,224 | |
Consumer Staples — 7.68% | | | | | | | | |
Keurig Dr Pepper, Inc. | | | 5,000 | | | | 180,450 | |
Kimberly-Clark Corp. | | | 15,200 | | | | 1,968,248 | |
Mondelez International, Inc., Class A | | | 37,000 | | | | 2,247,380 | |
PepsiCo, Inc. | | | 9,400 | | | | 1,519,040 | |
Target Corp. | | | 10,600 | | | | 2,751,972 | |
Walmart, Inc. | | | 15,000 | | | | 2,241,300 | |
| | | | | | | | 10,908,390 | |
Energy — 2.85% | | | | | | | | |
Chevron Corp. | | | 500 | | | | 57,245 | |
ConocoPhillips | | | 20,000 | | | | 1,489,800 | |
Exxon Mobil Corp. | | | 1,000 | | | | 64,470 | |
Pioneer Natural Resources Co. | | | 11,400 | | | | 2,131,572 | |
Williams Cos., Inc. (The) | | | 11,000 | | | | 308,990 | |
| | | | | | | | 4,052,077 | |
Financials — 11.10% | | | | | | | | |
American Express Co. | | | 10,000 | | | | 1,737,800 | |
Bank of America Corp. | | | 62,000 | | | | 2,962,360 | |
Bank of New York Mellon Corp. (The) | | | 49,000 | | | | 2,900,800 | |
Discover Financial Services | | | 21,000 | | | | 2,379,720 | |
JPMorgan Chase & Co. | | | 16,500 | | | | 2,803,185 | |
14 | See accompanying notes which are an integral part of these financial statements. | |
Dana Large Cap Equity Fund
Schedule of Investments (continued)
October 31, 2021
| | Shares | | | Fair Value | |
COMMON STOCKS — 99.12% — (continued) |
Financials — 11.10% — (continued) | | | | | | | | |
Morgan Stanley | | | 29,000 | | | $ | 2,980,620 | |
| | | | | | | | 15,764,485 | |
Health Care — 12.96% | | | | | | | | |
Abbott Laboratories | | | 19,000 | | | | 2,448,910 | |
AbbVie, Inc. | | | 23,600 | | | | 2,706,212 | |
Avantor, Inc.(a) | | | 72,000 | | | | 2,907,360 | |
CVS Health Corp. | | | 33,000 | | | | 2,946,240 | |
Horizon Therapeutics PLC(a) | | | 26,000 | | | | 3,117,660 | |
Syneos Health, Inc.(a) | | | 26,000 | | | | 2,426,840 | |
Zimmer Biomet Holdings, Inc. | | | 13,000 | | | | 1,860,560 | |
| | | | | | | | 18,413,782 | |
Industrials — 7.92% | | | | | | | | |
Boeing Co. (The)(a) | | | 200 | | | | 41,406 | |
Deere & Co. | | | 6,000 | | | | 2,053,860 | |
Delta Air Lines, Inc.(a) | | | 1,000 | | | | 39,130 | |
Dover Corp. | | | 16,000 | | | | 2,705,280 | |
Norfolk Southern Corp. | | | 8,400 | | | | 2,461,620 | |
Parker-Hannifin Corp. | | | 7,400 | | | | 2,194,766 | |
TE Connectivity Ltd. | | | 12,000 | | | | 1,752,000 | |
| | | | | | | | 11,248,062 | |
Materials — 2.56% | | | | | | | | |
Avery Dennison Corp. | | | 8,000 | | | | 1,741,760 | |
Nucor Corp. | | | 17,000 | | | | 1,898,050 | |
| | | | | | | | 3,639,810 | |
Real Estate — 2.71% | | | | | | | | |
American Tower Corp., Class A | | | 4,500 | | | | 1,268,865 | |
Gaming and Leisure Properties, Inc. | | | 24,400 | | | | 1,183,156 | |
Prologis, Inc. | | | 9,600 | | | | 1,391,616 | |
| | | | | | | | 3,843,637 | |
Technology — 26.07% | | | | | | | | |
Adobe Systems, Inc.(a) | | | 4,800 | | | | 3,121,728 | |
Apple, Inc. | | | 36,000 | | | | 5,392,800 | |
Cadence Design Systems, Inc.(a) | | | 16,200 | | | | 2,804,382 | |
CDW Corp. | | | 15,000 | | | | 2,799,750 | |
Cisco Systems, Inc. | | | 1,000 | | | | 55,970 | |
Cognizant Technology Solutions Corp., Class A | | | 31,000 | | | | 2,420,790 | |
Intel Corp. | | | 700 | | | | 34,300 | |
Lam Research Corp. | | | 4,400 | | | | 2,479,708 | |
| | See accompanying notes which are an integral part of these financial statements. | 15 |
Dana Large Cap Equity Fund
Schedule of Investments (continued)
October 31, 2021
| | Shares | | | Fair Value | |
COMMON STOCKS — 99.12% — (continued) |
Technology — 26.07% — (continued) | | | | | | | | |
Microchip Technology, Inc. | | | 34,000 | | | $ | 2,519,060 | |
Microsoft Corp. | | | 16,000 | | | | 5,305,920 | |
Qorvo, Inc.(a) | | | 14,600 | | | | 2,456,158 | |
Texas Instruments, Inc. | | | 14,000 | | | | 2,624,720 | |
Visa, Inc., Class A | | | 11,200 | | | | 2,371,824 | |
Zebra Technologies Corp., Class A(a) | | | 5,000 | | | | 2,669,750 | |
| | | | | | | | 37,056,860 | |
Utilities — 2.47% | | | | | | | | |
Eversource Energy | | | 20,200 | | | | 1,714,980 | |
NextEra Energy, Inc. | | | 21,000 | | | | 1,791,930 | |
| | | | | | | | 3,506,910 | |
Total Common Stocks (Cost $90,548,076) | | | | | | | 140,830,434 | |
| | | | | | | | | |
MONEY MARKET FUNDS — 0.91% | | | | | | | | |
| | | | | | | | | |
Fidelity Investments Money Market Government Portfolio, Institutional Class, 0.01%(b) | | | 1,289,908 | | | | 1,289,908 | |
Total Money Market Funds (Cost $1,289,908) | | | | | | | 1,289,908 | |
| | | | | | | | | |
Total Investments — 100.03% (Cost $91,837,984) | | | | | | | 142,120,342 | |
| | | | | | | | | |
Liabilities in Excess of Other Assets — (0.03)% | | | | | | | (39,127 | ) |
| | | | | | | | | |
NET ASSETS — 100.00% | | | | | | $ | 142,081,215 | |
(a) | Non-income producing security. |
(b) | Rate disclosed is the seven day effective yield as of October 31, 2021. |
16 | See accompanying notes which are an integral part of these financial statements. | |
Dana Epiphany ESG Small Cap Equity Fund
Schedule of Investments
October 31, 2021
| | Shares | | | Fair Value | |
COMMON STOCKS — 99.43% | | | | | | | | |
Communications — 1.79% | | | | | | | | |
TechTarget, Inc.(a) | | | 3,304 | | | $ | 311,600 | |
| | | | | | | | | |
Consumer Discretionary — 13.02% | | | | | | | | |
Bloomin’ Brands, Inc.(a) | | | 13,870 | | | | 299,869 | |
Boot Barn Holdings, Inc.(a) | | | 3,601 | | | | 376,268 | |
Deckers Outdoor Corp.(a) | | | 929 | | | | 367,243 | |
Group 1 Automotive, Inc. | | | 1,741 | | | | 313,032 | |
Jack in the Box, Inc. | | | 3,365 | | | | 332,967 | |
Malibu Boats, Inc., Class A(a) | | | 4,006 | | | | 282,864 | |
Masonite International Corp.(a) | | | 2,481 | | | | 297,745 | |
| | | | | | | | 2,269,988 | |
Consumer Staples — 3.24% | | | | | | | | |
e.l.f. Beauty, Inc.(a) | | | 9,030 | | | | 291,760 | |
Simply Good Foods Co. (The)(a) | | | 6,879 | | | | 272,752 | |
| | | | | | | | 564,512 | |
Energy — 2.07% | | | | | | | | |
Ovintiv, Inc. | | | 9,630 | | | | 361,318 | |
| | | | | | | | | |
Financials — 13.19% | | | | | | | | |
Ameris Bancorp | | | 5,364 | | | | 281,020 | |
Cowen Group, Inc., Class A | | | 7,119 | | | | 268,600 | |
Hanover Insurance Group, Inc. | | | 1,934 | | | | 243,684 | |
Home BancShares, Inc. | | | 12,653 | | | | 300,636 | |
Investors Bancorp, Inc. | | | 18,837 | | | | 288,206 | |
Jefferies Financial Group, Inc. | | | 7,648 | | | | 328,864 | |
Pinnacle Financial Partners, Inc. | | | 3,085 | | | | 297,918 | |
Primerica, Inc. | | | 1,730 | | | | 291,055 | |
| | | | | | | | 2,299,983 | |
Health Care — 17.66% | | | | | | | | |
Acceleron Pharma, Inc.(a) | | | 805 | | | | 140,215 | |
Aurinia Pharmaceuticals, Inc.(a) | | | 10,392 | | | | 343,767 | |
Axsome Therapeutics, Inc.(a) | | | 4,628 | | | | 178,178 | |
Blueprint Medicines Corp.(a) | | | 3,168 | | | | 356,368 | |
CONMED Corp. | | | 2,620 | | | | 383,254 | |
Cytokinetics, Inc.(a) | | | 4,234 | | | | 147,809 | |
Denali Therapeutics, Inc.(a) | | | 1,564 | | | | 75,619 | |
DYNAVAX TECHNOLOGIES CORPORATION(a) | | | 7,046 | | | | 140,709 | |
Ensign Group, Inc. (The) | | | 3,957 | | | | 308,686 | |
Envista Holdings Corp.(a) | | | 8,230 | | | | 321,793 | |
| | See accompanying notes which are an integral part of these financial statements. | 17 |
Dana Epiphany ESG Small Cap Equity Fund
Schedule of Investments (continued)
October 31, 2021
| | Shares | | | Fair Value | |
COMMON STOCKS — 99.43% — (continued) |
Health Care — 17.66% — (continued) | | | | | | | | |
Exelixis, Inc.(a) | | | 6,015 | | | $ | 129,383 | |
Horizon Therapeutics PLC(a) | | | 3,524 | | | | 422,562 | |
Travere Therapeutics, Inc.(a) | | | 4,594 | | | | 132,353 | |
| | | | | | | | 3,080,696 | |
Industrials — 13.56% | | | | | | | | |
Atkore, Inc.(a) | | | 3,780 | | | | 357,323 | |
Cactus, Inc., Class A | | | 7,686 | | | | 334,340 | |
Gates Industrial Corp. PLC(a) | | | 17,023 | | | | 279,858 | |
Hub Group, Inc., Class A(a) | | | 4,572 | | | | 359,222 | |
MasTec, Inc.(a) | | | 2,824 | | | | 251,703 | |
Regal-Beloit Corp. | | | 1,186 | | | | 180,619 | |
SkyWest, Inc.(a) | | | 6,751 | | | | 290,496 | |
Zurn Water Solutions, Inc. | | | 8,584 | | | | 311,428 | |
| | | | | | | | 2,364,989 | |
Materials — 6.68% | | | | | | | | |
Advanced Drainage Systems, Inc. | | | 2,706 | | | | 305,237 | |
Avient Corp. | | | 4,409 | | | | 237,557 | |
Codexis, Inc.(a) | | | 5,399 | | | | 187,723 | |
Element Solutions, Inc. | | | 9,924 | | | | 225,374 | |
Summit Materials, Inc., Class A(a) | | | 5,878 | | | | 209,551 | |
| | | | | | | | 1,165,442 | |
Real Estate — 8.75% | | | | | | | | |
Agree Realty Corp. | | | 4,315 | | | | 306,624 | |
Global Medical REIT, Inc. | | | 18,878 | | | | 312,998 | |
Hannon Armstrong Sustainable Infrastructure Capital, Inc. | | | 4,743 | | | | 286,477 | |
Spirit Realty Capital, Inc. | | | 6,288 | | | | 307,672 | |
STAG Industrial, Inc. | | | 7,174 | | | | 312,284 | |
| | | | | | | | 1,526,055 | |
Technology — 15.55% | | | | | | | | |
Cohu, Inc.(a) | | | 9,629 | | | | 308,513 | |
Kulicke & Soffa Industries, Inc. | | | 5,258 | | | | 299,706 | |
Omnicell, Inc.(a) | | | 2,403 | | | | 428,095 | |
Perficient, Inc.(a) | | | 2,988 | | | | 369,317 | |
Rapid7, Inc.(a) | | | 2,497 | | | | 321,489 | |
Sailpoint Technologies Holdings, Inc.(a) | | | 6,126 | | | | 293,925 | |
Semtech Corp.(a) | | | 4,229 | | | | 359,592 | |
Ultra Clean Holdings, Inc.(a) | | | 6,669 | | | | 330,582 | |
| | | | | | | | 2,711,219 | |
18 | See accompanying notes which are an integral part of these financial statements. | |
Dana Epiphany ESG Small Cap Equity Fund
Schedule of Investments (continued)
October 31, 2021
| | Shares | | | Fair Value | |
COMMON STOCKS — 99.43% — (continued) |
Utilities — 2.46% | | | | | | | | |
Chesapeake Utilities Corp. | | | 1,703 | | | $ | 223,212 | |
Southwest Gas Holdings, Inc. | | | 2,964 | | | | 205,257 | |
| | | | | | | | 428,469 | |
Total Common Stocks (Cost $12,348,412) | | | | | | | 17,084,271 | |
| | | | | | | | | |
EXCHANGE-TRADED FUNDS — 1.46% | | | | | | | | |
| | | | | | | | | |
iShares Russell 2000 ETF | | | 1,118 | | | | 254,960 | |
Total Exchange-Traded Funds (Cost $253,948) | | | | | | | 254,960 | |
| | | | | | | | | |
MONEY MARKET FUNDS — 0.63% | | | | | | | | |
| | | | | | | | | |
Fidelity Investments Money Market Government Portfolio, Institutional Class, 0.01%(b) | | | 110,441 | | | | 110,441 | |
Total Money Market Funds (Cost $110,441) | | | | | | | 110,441 | |
| | | | | | | | | |
Total Investments — 100.06% (Cost $12,712,801) | | | | | | | 17,449,672 | |
| | | | | | | | | |
Liabilities in Excess of Other Assets — (0.06)% | | | | | | | (10,942 | ) |
| | | | | | | | | |
NET ASSETS — 100.00% | | | | | | $ | 17,438,730 | |
(a) | Non-income producing security. |
(b) | Rate disclosed is the seven day effective yield as of October 31, 2021. |
ETF - Exchange-Traded Fund
REIT - Real Estate Investment Trust
| | See accompanying notes which are an integral part of these financial statements. | 19 |
Dana Epiphany ESG Equity Fund
Schedule of Investments
October 31, 2021
| | Shares | | | Fair Value | |
COMMON STOCKS — 98.41% | | | | | | | | |
Communications — 10.68% | | | | | | | | |
Alphabet, Inc., Class A(a) | | | 570 | | | $ | 1,687,725 | |
Alphabet, Inc., Class C(a) | | | 230 | | | | 682,044 | |
AT&T, Inc. | | | 1,000 | | | | 25,260 | |
Comcast Corp., Class A | | | 24,400 | | | | 1,254,892 | |
Interpublic Group of Cos., Inc. | | | 37,000 | | | | 1,353,090 | |
Verizon Communications, Inc. | | | 22,000 | | | | 1,165,780 | |
Walt Disney Co. (The)(a) | | | 6,200 | | | | 1,048,234 | |
| | | | | | | | 7,217,025 | |
Consumer Discretionary — 12.13% | | | | | | | | |
Amazon.com, Inc.(a) | | | 300 | | | | 1,011,729 | |
Best Buy Co., Inc. | | | 10,800 | | | | 1,320,192 | |
D.R. Horton, Inc. | | | 14,200 | | | | 1,267,634 | |
Deckers Outdoor Corp.(a) | | | 3,600 | | | | 1,423,116 | |
Fortune Brands Home & Security, Inc. | | | 10,600 | | | | 1,074,840 | |
Home Depot, Inc. (The) | | | 2,200 | | | | 817,828 | |
McDonald’s Corp. | | | 2,200 | | | | 540,210 | |
Tractor Supply Co. | | | 3,400 | | | | 738,378 | |
| | | | | | | | 8,193,927 | |
Consumer Staples — 7.55% | | | | | | | | |
Darling Ingredients, Inc.(a) | | | 12,400 | | | | 1,048,048 | |
General Mills, Inc. | | | 16,000 | | | | 988,800 | |
Kimberly-Clark Corp. | | | 6,200 | | | | 802,838 | |
Mondelez International, Inc., Class A | | | 15,000 | | | | 911,100 | |
Target Corp. | | | 5,200 | | | | 1,350,024 | |
| | | | | | | | 5,100,810 | |
Energy — 2.75% | | | | | | | | |
ConocoPhillips | | | 6,000 | | | | 446,940 | |
Pioneer Natural Resources Co. | | | 4,400 | | | | 822,712 | |
Williams Cos., Inc. (The) | | | 21,000 | | | | 589,890 | |
| | | | | | | | 1,859,542 | |
Financials — 9.53% | | | | | | | | |
American Express Co. | | | 4,800 | | | | 834,144 | |
Bank of New York Mellon Corp. (The) | | | 20,000 | | | | 1,184,000 | |
Discover Financial Services | | | 9,200 | | | | 1,042,544 | |
JPMorgan Chase & Co. | | | 6,000 | | | | 1,019,340 | |
Morgan Stanley | | | 11,200 | | | | 1,151,136 | |
Truist Financial Corp. | | | 19,000 | | | | 1,205,930 | |
| | | | | | | | 6,437,094 | |
20 | See accompanying notes which are an integral part of these financial statements. | |
Dana Epiphany ESG Equity Fund
Schedule of Investments (continued)
October 31, 2021
| | Shares | | | Fair Value | |
COMMON STOCKS — 98.41% — (continued) |
Health Care — 12.80% | | | | | | | | |
Cigna Corp. | | | 5,800 | | | $ | 1,238,938 | |
CVS Health Corp. | | | 14,000 | | | | 1,249,920 | |
Emergent BioSolutions, Inc.(a) | | | 400 | | | | 19,068 | |
Encompass Health Corp. | | | 15,300 | | | | 972,468 | |
Envista Holdings Corp.(a) | | | 28,000 | | | | 1,094,800 | |
Horizon Therapeutics PLC(a) | | | 10,600 | | | | 1,271,046 | |
IQVIA Holdings, Inc.(a) | | | 4,500 | | | | 1,176,390 | |
Syneos Health, Inc.(a) | | | 4,000 | | | | 373,360 | |
Zoetis, Inc. | | | 5,800 | | | | 1,253,960 | |
| | | | | | | | 8,649,950 | |
Industrials — 8.53% | | | | | | | | |
Deere & Co. | | | 3,100 | | | | 1,061,161 | |
Norfolk Southern Corp. | | | 3,400 | | | | 996,370 | |
Regal-Beloit Corp. | | | 9,600 | | | | 1,462,368 | |
TE Connectivity Ltd. | | | 9,000 | | | | 1,314,000 | |
W.W. Grainger, Inc. | | | 2,000 | | | | 926,220 | |
| | | | | | | | 5,760,119 | |
Materials — 2.66% | | | | | | | | |
Avery Dennison Corp. | | | 2,700 | | | | 587,844 | |
Nucor Corp. | | | 7,400 | | | | 826,210 | |
Sherwin-Williams Co. (The) | | | 1,200 | | | | 379,932 | |
| | | | | | | | 1,793,986 | |
Real Estate — 4.10% | | | | | | | | |
Alexandria Real Estate Equities, Inc. | | | 3,300 | | | | 673,662 | |
American Tower Corp., Class A | | | 1,800 | | | | 507,546 | |
Hannon Armstrong Sustainable Infrastructure Capital, Inc. | | | 17,400 | | | | 1,050,960 | |
Iron Mountain, Inc. | | | 4,200 | | | | 191,688 | |
Prologis, Inc. | | | 2,400 | | | | 347,904 | |
| | | | | | | | 2,771,760 | |
Technology — 25.28% | | | | | | | | |
Accenture PLC, Class A | | | 3,800 | | | | 1,363,402 | |
Apple, Inc. | | | 14,000 | | | | 2,097,200 | |
Cadence Design Systems, Inc.(a) | | | 6,800 | | | | 1,177,148 | |
CDW Corp. | | | 7,200 | | | | 1,343,880 | |
Cisco Systems, Inc. | | | 5,000 | | | | 279,850 | |
Cognizant Technology Solutions Corp., Class A | | | 16,400 | | | | 1,280,676 | |
Fidelity National Information Services, Inc. | | | 10,400 | | | | 1,151,696 | |
Intel Corp. | | | 2,600 | | | | 127,400 | |
Lam Research Corp. | | | 2,300 | | | | 1,296,211 | |
| | See accompanying notes which are an integral part of these financial statements. | 21 |
Dana Epiphany ESG Equity Fund
Schedule of Investments (continued)
October 31, 2021
| | Shares | | | Fair Value | |
COMMON STOCKS — 98.41% — (continued) |
Technology — 25.28% — (continued) | | | | | | | | |
Microchip Technology, Inc. | | | 17,800 | | | $ | 1,318,802 | |
Micron Technology, Inc. | | | 15,000 | | | | 1,036,500 | |
Microsoft Corp. | | | 6,700 | | | | 2,221,854 | |
Texas Instruments, Inc. | | | 6,600 | | | | 1,237,368 | |
Visa, Inc., Class A | | | 5,400 | | | | 1,143,558 | |
| | | | | | | | 17,075,545 | |
Utilities — 2.40% | | | | | | | | |
Avangrid, Inc. | | | 7,400 | | | | 389,980 | |
Eversource Energy | | | 8,000 | | | | 679,200 | |
NextEra Energy, Inc. | | | 6,500 | | | | 554,645 | |
| | | | | | | | 1,623,825 | |
Total Common Stocks (Cost $55,550,001) | | | | | | | 66,483,583 | |
| | | | | | | | | |
MONEY MARKET FUNDS — 1.46% | | | | | | | | |
| | | | | | | | | |
Fidelity Investments Money Market Government Portfolio, Institutional Class, 0.01%(b) | | | 985,936 | | | | 985,936 | |
Total Money Market Funds (Cost $985,936) | | | | | | | 985,936 | |
| | | | | | | | | |
Total Investments — 99.87% (Cost $56,535,937) | | | | | | | 67,469,519 | |
| | | | | | | | | |
Other Assets in Excess of Liabilities — 0.13% | | | | | | | 87,476 | |
| | | | | | | | | |
NET ASSETS — 100.00% | | | | | | $ | 67,556,995 | |
(a) | Non-income producing security. |
(b) | Rate disclosed is the seven day effective yield as of October 31, 2021. |
22 | See accompanying notes which are an integral part of these financial statements. | |
Dana Funds
Statements of Assets and Liabilities
October 31, 2021
| | | Dana Large Cap
Equity Fund | | | Dana Epiphany
ESG Small Cap
Equity Fund | | | Dana Epiphany
ESG Equity Fund | |
Assets | | | | | | | | |
Investments in securities at fair value (cost $91,837,984, $12,712,801 and $56,535,937) (Note 3) | | $ | 142,120,342 | | | $ | 17,449,672 | | | $ | 67,469,519 | |
Cash | | | 16,500 | | | | 208 | | | | 6,000 | |
Receivable for fund shares sold | | | 24,487 | | | | — | | | | 57,197 | |
Dividends receivable | | | 136,730 | | | | 1,848 | | | | 67,411 | |
Receivable from Adviser (Note 4) | | | — | | | | 4,255 | | | | — | |
Prepaid expenses | | | 24,634 | | | | 16,006 | | | | 21,488 | |
Total Assets | | | 142,322,693 | | | | 17,471,989 | | | | 67,621,615 | |
Liabilities | | | | | | | | |
Payable for fund shares redeemed | | | 126,201 | | | | — | | | | 1,402 | |
Payable to Adviser (Note 4) | | | 61,524 | | | | — | | | | 26,250 | |
Accrued Distribution (12b-1) fees (Note 4) | | | 5,513 | | | | — | | | | — | |
Payable to Administrator (Note 4) | | | 12,252 | | | | 6,333 | | | | 6,913 | |
Payable to trustees (Note 4) | | | 1,599 | | | | 2,058 | | | | 1,632 | |
Other accrued expenses | | | 34,389 | | | | 24,868 | | | | 28,423 | |
Total Liabilities | | | 241,478 | | | | 33,259 | | | | 64,620 | |
Net Assets | | $ | 142,081,215 | | | $ | 17,438,730 | | | $ | 67,556,995 | |
Net Assets consist of: | | | | | | | | | | | | |
Paid-in capital | | | 75,832,660 | | | | 11,328,684 | | | | 55,527,320 | |
Accumulated earnings | | | 66,248,555 | | | | 6,110,046 | | | | 12,029,675 | |
Net Assets | | $ | 142,081,215 | | | $ | 17,438,730 | | | $ | 67,556,995 | |
Institutional Class: | | | | | | | | | | | | |
Net Assets | | $ | 115,544,440 | | | $ | 17,438,730 | | | $ | 67,556,995 | |
Shares outstanding (unlimited number of shares authorized, no par value) | | | 3,956,702 | | | | 1,096,368 | | | | 4,836,004 | |
Net asset value, offering and redemption price per share (Note 2) | | $ | 29.20 | | | $ | 15.91 | | | $ | 13.97 | |
Investor Class: | | | | | | | | | | | | |
Net Assets | | $ | 26,536,775 | | | | | | | | | |
Shares outstanding (unlimited number of shares authorized, no par value) | | | 908,730 | | | | | | | | | |
Net asset value, offering and redemption price per share (Note 2) | | $ | 29.20 | | | | | | | | | |
| | See accompanying notes which are an integral part of these financial statements. | 23 |
Dana Funds
Statements of Operations
For the year ended October 31, 2021
| | | Dana Large Cap
Equity Fund | | | Dana Epiphany
ESG Small Cap
Equity Fund | | | Dana Epiphany
ESG Equity Fund | |
Investment Income | | | | | | | | | | | | |
Dividend income | | $ | 1,836,873 | | | $ | 106,016 | | | $ | 582,919 | |
Total investment income | | | 1,836,873 | | | | 106,016 | | | | 582,919 | |
Expenses | | | | | | | | | | | | |
Investment Adviser fees (Note 4) | | | 866,362 | | | | 111,370 | | | | 265,910 | |
Administration and compliance services fees (Note 4) | | | 76,453 | | | | 33,000 | | | | 34,333 | |
Distribution (12b-1) fees, Investor Class (Note 4) | | | 63,778 | | | | — | | | | — | |
Fund accounting fees (Note 4) | | | 45,045 | | | | 24,999 | | | | 24,583 | |
Registration expenses | | | 40,624 | | | | 26,455 | | | | 29,016 | |
Transfer agent fees (Note 4) | | | 23,000 | | | | 18,000 | | | | 17,700 | |
Audit and tax preparation fees | | | 17,960 | | | | 17,960 | | | | 17,960 | |
Custodian fees | | | 17,294 | | | | 5,434 | | | | 16,556 | |
Legal fees | | | 15,289 | | | | 37,037 | | | | 15,283 | |
Printing and postage expenses | | | 12,368 | | | | 5,292 | | | | 6,760 | |
Trustee fees (Note 4) | | | 6,671 | | | | 5,296 | | | | 5,141 | |
Insurance expenses | | | 1,693 | | | | 2,238 | | | | 2,086 | |
Interest | | | — | | | | — | | | | — | |
Miscellaneous expenses | | | 25,912 | | | | 18,334 | | | | 21,509 | |
Total expenses | | | 1,212,450 | | | | 305,415 | | | | 456,837 | |
Fees contractually waived and expenses reimbursed by Adviser (Note 4) | | | (174,396 | ) | | | (164,133 | ) | | | (108,826 | ) |
Net operating expenses | | | 1,038,053 | | | | 141,282 | | | | 348,011 | |
Net investment income (loss) | | | 798,820 | | | | (35,266 | ) | | | 234,908 | |
Net Realized and Change in Unrealized Gain (Loss) on Investments |
Net realized gain on investment securities transactions | | | 16,461,777 | | | | 2,817,117 | | | | 1,024,321 | |
Net change in unrealized appreciation on investment securities | | | 26,848,239 | | | | 3,549,853 | | | | 8,442,528 | |
Net realized and change in unrealized gain on investments | | | 43,310,016 | | | | 6,366,970 | | | | 9,466,849 | |
Net increase in net assets resulting from operations | | $ | 44,108,836 | | | $ | 6,331,704 | | | $ | 9,701,757 | |
24 | See accompanying notes which are an integral part of these financial statements. | |
Dana Funds
Statements of Changes in Net Assets
| | | Dana Large Cap Equity Fund | | | Dana Epiphany ESG
Small Cap Equity Fund | |
| | | For the
Year Ended
October 31, 2021 | | | For the
Year Ended
October 31, 2020 | | | For the
Year Ended
October 31, 2021 | | | For the
Year Ended
October 31, 2020 | |
Increase (Decrease) in Net Assets due to: | | | | | | | | | | | | |
Operations | | | | | | | | | | | | |
Net investment income (loss) | | $ | 798,820 | | | $ | 1,340,026 | | | $ | (35,266 | ) | | $ | (791 | ) |
Net realized gain (loss) on investment securities transactions | | | 16,461,777 | | | | 2,299,800 | | | | 2,817,117 | | | | (1,256,551 | ) |
Net change in unrealized appreciation (depreciation) of investment securities | | | 26,848,239 | | | | 2,714,687 | | | | 3,549,853 | | | | (80,215 | ) |
Net increase (decrease) in net assets resulting from operations | | | 44,108,836 | | | | 6,354,513 | | | | 6,331,704 | | | | (1,337,557 | ) |
Distributions to Shareholders from Earnings (Note 2) | | | | | | | | |
Institutional Class | | | (2,521,779 | ) | | | (12,130,253 | ) | | | — | | | | (5,901 | ) |
Investor Class | | | (616,743 | ) | | | (2,798,272 | ) | | | — | | | | — | |
Total distributions | | | (3,138,522 | ) | | | (14,928,525 | ) | | | — | | | | (5,901 | ) |
Capital Transactions – Institutional Class(a) | | | | | | | | |
Proceeds from shares sold | | | 19,866,697 | | | | 31,507,881 | | | | 4,001,045 | | | | 1,008,397 | |
Shares issued in connection with class consolidation | | | — | | | | — | | | | — | | | | 1,513,471 | |
Reinvestment of distributions | | | 1,261,457 | | | | 5,707,638 | | | | — | | | | 5,764 | |
Amount paid for shares redeemed | | | (29,994,338 | ) | | | (46,107,580 | ) | | | (2,755,405 | ) | | | (3,966,219 | ) |
Total – Institutional Class | | | (8,866,184 | ) | | | (8,892,061 | ) | | | 1,245,640 | | | | (1,438,587 | ) |
Capital Transactions – Investor Class(a) | | | | | | | | | | | | |
Proceeds from shares sold | | | 955,765 | | | | 1,784,299 | | | | — | | | | 94,173 | |
Shares issued in connection with class consolidation | | | — | | | | — | | | | — | | | | (1,513,471 | ) |
Reinvestment of distributions | | | 610,137 | | | | 2,782,815 | | | | — | | | | — | |
Amount paid for shares redeemed | | | (7,582,529 | ) | | | (3,531,248 | ) | | | — | | | | (555,014 | ) |
Total – Investor Class | | | (6,016,627 | ) | | | 1,035,866 | | | | — | | | | (1,974,312 | ) |
Net increase (decrease) in net assets resulting from capital transactions | | | (14,882,811 | ) | | | (7,856,195 | ) | | | 1,245,640 | | | | (3,412,899 | ) |
Total Increase (Decrease) in Net Assets | | | 26,087,503 | | | | (16,430,207 | ) | | | 7,577,344 | | | | (4,756,357 | ) |
| | See accompanying notes which are an integral part of these financial statements. | 25 |
Dana Funds
Statements of Changes in Net Assets (continued)
| | | Dana Large Cap Equity Fund | | | Dana Epiphany ESG
Small Cap Equity Fund | |
| | | For the
Year Ended
October 31, 2021 | | | For the
Year Ended
October 31, 2020 | | | For the
Year Ended
October 31, 2021 | | | For the
Year Ended
October 31, 2020 | |
Net Assets | | | | | | | | | | | | | | | | |
Beginning of year | | $ | 115,993,712 | | | $ | 132,423,919 | | | $ | 9,861,386 | | | $ | 14,617,743 | |
End of year | | $ | 142,081,215 | | | $ | 115,993,712 | | | $ | 17,438,730 | | | $ | 9,861,386 | |
Share Transactions – Institutional Class(a) | | | | | | | | |
Shares sold | | | 784,104 | | | | 1,538,470 | | | | 285,750 | | | | 98,505 | |
Shares issued in connection with class consolidation | | | — | | | | — | | | | — | | | | 161,172 | |
Shares issued in reinvestment of distributions | | | 51,614 | | | | 262,762 | | | | — | | | | 657 | |
Shares redeemed | | | (1,178,281 | ) | | | (2,218,189 | ) | | | (193,538 | ) | | | (469,527 | ) |
Total – Institutional Class | | | (342,563 | ) | | | (416,957 | ) | | | 92,212 | | | | (209,193 | ) |
Share Transactions - Investor Class(a) | | | | | | | | | | | | |
Shares sold | | | 36,024 | | | | 85,588 | | | | — | | | | 11,511 | |
Shares redeemed in connection with class consolidation | | | — | | | | — | | | | — | | | | (163,036 | ) |
Shares issued in reinvestment of distributions | | | 25,319 | | | | 127,884 | | | | — | | | | — | |
Shares redeemed | | | (310,665 | ) | | | (174,728 | ) | | | — | | | | (65,194 | ) |
Total – Investor Class | | | (249,322 | ) | | | 38,744 | | | | — | | | | (216,719 | ) |
(a) | Effective at the close of business on June 4, 2020, Investor Class Shares of the Dana Epiphany ESG Small Cap Fund were consolidated into the Institutional Class shares. |
26 | See accompanying notes which are an integral part of these financial statements. | |
Dana Funds
Statements of Changes in Net Assets (continued)
| | | Dana Epiphany ESG Equity Fund | |
| | | For the
Year Ended
October 31, 2021 | | | For the
Year Ended
October 31, 2020 | |
Increase (Decrease) in Net Assets due to: | | | | | | | | |
Operations | | | | | | | | |
Net investment income | | $ | 234,908 | | | $ | 115,632 | |
Net realized gain on investment securities transactions | | | 1,024,321 | | | | 234,203 | |
Net change in unrealized appreciation of investment securities | | | 8,442,528 | | | | 362,862 | |
Net increase in net assets resulting from operations | | | 9,701,757 | | | | 712,697 | |
Distributions to Shareholders from Earnings (Note 2) | | | | | | | | |
Institutional Class | | | (415,436 | ) | | | (862,512 | ) |
Investor Class | | | — | | | | (1,182,772 | ) |
Total distributions | | | (415,436 | ) | | | (2,045,284 | ) |
Capital Transactions – Institutional Class(a) | | | | | | | | |
Proceeds from shares sold | | | 52,799,761 | | | | 2,228,653 | |
Shares issued in connection with class consolidation | | | — | | | | 7,410,006 | |
Reinvestment of distributions | | | 412,645 | | | | 856,169 | |
Amount paid for shares redeemed | | | (8,003,838 | ) | | | (2,402,606 | ) |
Total – Institutional Class | | | 45,208,568 | | | | 8,092,222 | |
Capital Transactions – Investor Class(a) | | | | | | | | |
Proceeds from shares sold | | | — | | | | 963,569 | |
Shares issued in connection with class consolidation | | | — | | | | (7,410,006 | ) |
Reinvestment of distributions | | | — | | | | 1,167,223 | |
Amount paid for shares redeemed | | | — | | | | (1,238,947 | ) |
Total – Investor Class | | | — | | | | (6,518,161 | ) |
Net increase in net assets resulting from capital transactions | | | 45,208,568 | | | | 1,574,061 | |
Total Increase in Net Assets | | | 54,494,889 | | | | 241,474 | |
Net Assets | | | | | | | | |
Beginning of year | | | 13,062,106 | | | | 12,820,632 | |
End of year | | $ | 67,556,995 | | | $ | 13,062,106 | |
| | See accompanying notes which are an integral part of these financial statements. | 27 |
Dana Funds
Statements of Changes in Net Assets (continued)
| | | Dana Epiphany ESG Equity Fund | |
| | | For the
Year Ended
October 31, 2021 | | | For the
Year Ended
October 31, 2020 | |
Share Transactions – Institutional Class(a) | | | | |
Shares sold | | | 4,143,277 | | | | 242,216 | |
Shares issued in connection with class consolidation | | | — | | | | 747,410 | |
Shares issued in reinvestment of distributions | | | 34,346 | | | | 82,565 | |
Shares redeemed | | | (615,363 | ) | | | (237,169 | ) |
Total – Institutional Class | | | 3,562,260 | | | | 835,022 | |
Share Transactions - Investor Class(a) | | | | |
Shares sold | | | — | | | | 87,988 | |
Shares redeemed in connection with class consolidation | | | — | | | | (722,853 | ) |
Shares issued in reinvestment of distributions | | | — | | | | 108,459 | |
Shares redeemed | | | — | | | | (123,629 | ) |
Total – Investor Class | | | — | | | | (650,035 | ) |
(a) | Effective at the close of business on June 4, 2020, Investor Class Shares of the Dana Epiphany ESG Fund were consolidated into the Institutional Class shares. |
28 | See accompanying notes which are an integral part of these financial statements. | |
Dana Large Cap Equity Fund – Institutional Class
Financial Highlights
(For a share outstanding during each year)
| | | Years Ended October 31, | |
| | | 2021 | | | 2020 | | | 2019 | | | 2018 | | | 2017 | |
Selected Per Share Data | | | | | | | | | | | | | | | | | | | | |
Net asset value, beginning of year | | $ | 21.25 | | | $ | 22.69 | | | $ | 22.35 | | | $ | 22.64 | | | $ | 17.67 | |
| | | | | | | | | | | | | | | | | | | | | |
Investment operations: | | | | | | | | | | | | | | | | | | | | |
Net investment income | | | 0.17 | | | | 0.23 | | | | 0.38 | | | | 0.32 | | | | 0.32 | |
Net realized and unrealized gain (loss) on investments | | | 8.39 | | | | 0.86 | | | | 2.46 | | | | 0.45 | | | | 4.96 | |
Total from investment operations | | | 8.56 | | | | 1.09 | | | | 2.84 | | | | 0.77 | | | | 5.28 | |
| | | | | | | | | | | | | | | | | | | | | |
Less distributions to shareholders from: | | | | | | | | | | | | | | | | | | | | |
Net investment income | | | (0.17 | ) | | | (0.23 | ) | | | (0.36 | ) | | | (0.32 | ) | | | (0.31 | ) |
Net realized gains | | | (0.44 | ) | | | (2.30 | ) | | | (2.14 | ) | | | (0.74 | ) | | | — | |
Total distributions | | | (0.61 | ) | | | (2.53 | ) | | | (2.50 | ) | | | (1.06 | ) | | | (0.31 | ) |
| | | | | | | | | | | | | | | | | | | | | |
Redemption fees | | | — | | | | — | | | | — | | | | — | | | | — | (a) |
| | | | | | | | | | | | | | | | | | | | | |
Net asset value, end of year | | $ | 29.20 | | | $ | 21.25 | | | $ | 22.69 | | | $ | 22.35 | | | $ | 22.64 | |
| | | | | | | | | | | | | | | | | | | | | |
Total Return(b) | | | 40.89 | % | | | 4.65 | % | | | 15.55 | % | | | 3.27 | % | | | 30.11 | % |
| | | | | | | | | | | | | | | | | | | | | |
Ratios and Supplemental Data: | | | | | | | | | | | | | | | | | | | | |
| | | | | | | | | | | | | | | | | | | | | |
Net assets, end of year (000 omitted) | | $ | 115,544 | | | $ | 91,379 | | | $ | 107,026 | | | $ | 176,954 | | | $ | 134,291 | |
Before waiver | | | | | | | | | | | | | | | | | | | | |
Ratio of expenses to average net assets | | | 0.86 | % | | | 0.91 | % | | | 0.85 | % | | | 0.86 | % | | | 0.92 | % |
After waiver | | | | | | | | | | | | | | | | | | | | |
Ratio of expenses to average net assets | | | 0.73 | % | | | 0.73 | % | | | 0.73 | % | | | 0.73 | % | | | 0.74 | %(c) |
Ratio of net investment income to average net assets | | | 0.65 | % | �� | | 1.10 | % | | | 1.68 | % | | | 1.41 | % | | | 1.48 | % |
Portfolio turnover rate(d) | | | 30 | % | | | 57 | % | | | 50 | % | | | 58 | % | | | 50 | % |
| | | | | | | | | | | | | | | | | | | | | |
(a) | Rounds to less than $0.005 per share. |
(b) | Total return in the above table represents the rate that the investor would have earned or lost on an investment in the Fund, assuming reinvestment of distributions. |
(c) | This ratio includes the impact of overdraft fees. If this cost had been excluded, the ratio of expenses to average net assets would have been 0.73% for the fiscal year ended October 31, 2017. |
(d) | Portfolio turnover is calculated on the basis of the Fund as a whole without distinguishing among the classes of shares. |
| | See accompanying notes which are an integral part of these financial statements. | 29 |
Dana Large Cap Equity Fund – Investor Class
Financial Highlights
(For a share outstanding during each year)
| | | Years Ended October 31, | |
| | | 2021 | | | 2020 | | | 2019 | | | 2018 | | | 2017 | |
Selected Per Share Data | | | | | | | | | | | | | | | | | | | | |
Net asset value, beginning of year | | $ | 21.26 | | | $ | 22.69 | | | $ | 22.35 | | | $ | 22.64 | | | $ | 17.68 | |
| | | | | | | | | | | | | | | | | | | | | |
Investment operations: | | | | | | | | | | | | | | | | | | | | |
Net investment income | | | 0.10 | | | | 0.18 | | | | 0.30 | | | | 0.28 | | | | 0.24 | |
Net realized and unrealized gain (loss) on investments | | | 8.39 | | | | 0.87 | | | | 2.50 | | | | 0.43 | | | | 4.98 | |
Total from investment operations | | | 8.49 | | | | 1.05 | | | | 2.80 | | | | 0.71 | | | | 5.22 | |
| | | | | | | | | | | | | | | | | | | | | |
Less distributions to shareholders from: | | | | | | | | | | | | | | | | | | | | |
Net investment income | | | (0.11 | ) | | | (0.18 | ) | | | (0.32 | ) | | | (0.26 | ) | | | (0.26 | ) |
Net realized gains | | | (0.44 | ) | | | (2.30 | ) | | | (2.14 | ) | | | (0.74 | ) | | | — | |
Total distributions | | | (0.55 | ) | | | (2.48 | ) | | | (2.46 | ) | | | (1.00 | ) | | | (0.26 | ) |
| | | | | | | | | | | | | | | | | | | | | |
Redemption fees | | | — | | | | — | | | | — | | | | — | | | | — | |
| | | | | | | | | | | | | | | | | | | | | |
Net asset value, end of year | | $ | 29.20 | | | $ | 21.26 | | | $ | 22.69 | | | $ | 22.35 | | | $ | 22.64 | |
| | | | | | | | | | | | | | | | | | | | | |
Total Return(a) | | | 40.48 | % | | | 4.43 | % | | | 15.29 | % | | | 3.01 | % | | | 29.72 | % |
| | | | | | | | | | | | | | | | | | | | | |
Ratios and Supplemental Data: | | | | | | | | | | | | | | | | | | | | |
| | | | | | | | | | | | | | | | | | | | | |
Net assets, end of year (000 omitted) | | $ | 26,537 | | | $ | 24,615 | | | $ | 25,398 | | | $ | 28,870 | | | $ | 40,957 | |
Before waiver | | | | | | | | | | | | | | | | | | | | |
Ratio of expenses to average net assets | | | 1.11 | % | | | 1.16 | % | | | 1.10 | % | | | 1.11 | % | | | 1.17 | % |
After waiver | | | | | | | | | | | | | | | | | | | | |
Ratio of expenses to average net assets | | | 0.98 | % | | | 0.98 | % | | | 0.98 | % | | | 0.98 | % | | | 0.99 | %(b) |
Ratio of net investment income to average net assets | | | 0.40 | % | | | 0.85 | % | | | 1.40 | % | | | 1.17 | % | | | 1.20 | % |
Portfolio turnover rate(c) | | | 30 | % | | | 57 | % | | | 50 | % | | | 58 | % | | | 50 | % |
| | | | | | | | | | | | | | | | | | | | | |
(a) | Total return in the above table represents the rate that the investor would have earned or lost on an investment in the Fund, assuming reinvestment of distributions. |
(b) | This ratio includes the impact of overdraft fees. If this cost had been excluded, the ratio of expenses to average net assets would have been 0.98% for the fiscal year ended October 31, 2017. |
(c) | Portfolio turnover is calculated on the basis of the Fund as a whole without distinguishing among the classes of shares. |
30 | See accompanying notes which are an integral part of these financial statements. | |
Dana Epiphany ESG Small Cap Equity Fund – Institutional Class
Financial Highlights
(For a share outstanding during each year)
| | | Years Ended October 31, | |
| | | 2021 | | | 2020 | | | 2019 | | | 2018 | | | 2017 | |
Selected Per Share Data | | | | | | | | | | | | | | | | | | | | |
Net asset value, beginning of year | | $ | 9.82 | | | $ | 10.24 | | | $ | 11.09 | | | $ | 11.43 | | | $ | 9.30 | |
| | | | | | | | | | | | | | | | | | | | | |
Investment operations: | | | | | | | | | | | | | | | | | | | | |
Net investment income (loss) | | | (0.03 | ) | | | 0.01 | | | | 0.01 | | | | (0.03 | ) | | | — | (a) |
Net realized and unrealized gain (loss) on investments | | | 6.12 | | | | (0.42 | ) | | | (0.05 | ) | | | (0.31 | ) | | | 2.14 | |
Total from investment operations | | | 6.09 | | | | (0.41 | ) | | | (0.04 | ) | | | (0.34 | ) | | | 2.14 | |
| | | | | | | | | | | | | | | | | | | | | |
Less distributions to shareholders from: | | | | | | | | | | | | | | | | | | | | |
Net investment income | | | — | | | | (0.01 | ) | | | — | | | | — | (a) | | | (0.01 | ) |
Net realized gains | | | — | | | | — | | | | (0.81 | ) | | | — | | | | — | |
Total distributions | | | — | | | | (0.01 | ) | | | (0.81 | ) | | | — | (a) | | | (0.01 | ) |
| | | | | | | | | | | | | | | | | | | | | |
Redemption fees | | | — | | | | — | | | | — | | | | — | | | | — | |
| | | | | | | | | | | | | | | | | | | | | |
Net asset value, end of year | | $ | 15.91 | | | $ | 9.82 | | | $ | 10.24 | | | $ | 11.09 | | | $ | 11.43 | |
| | | | | | | | | | | | | | | | | | | | | |
Total Return(b) | | | 62.02 | % | | | (4.04 | )% | | | 0.83 | % | | | (2.95 | )% | | | 23.08 | % |
| | | | | | | | | | | | | | | | | | | | | |
Ratios and Supplemental Data: | | | | | | | | | | | | | | | | | | | | |
| | | | | | | | | | | | | | | | | | | | | |
Net assets, end of year (000 omitted) | | $ | 17,439 | | | $ | 9,861 | | | $ | 12,421 | | | $ | 16,196 | | | $ | 14,011 | |
Before waiver | | | | | | | | | | | | | | | | | | | | |
Ratio of expenses to average net assets | | | 2.05 | % | | | 2.58 | % | | | 1.88 | % | | | 1.75 | % | | | 2.02 | % |
After waiver | | | | | | | | | | | | | | | | | | | | |
Ratio of expenses to average net assets | | | 0.95 | % | | | 0.95 | % | | | 0.95 | % | | | 0.95 | % | | | 0.95 | % |
Ratio of net investment income (loss) to average net assets | | | (0.24 | )% | | | 0.02 | % | | | 0.11 | % | | | (0.24 | )% | | | — | % |
Portfolio turnover rate | | | 92 | % | | | 88 | % | | | 50 | % | | | 78 | % | | | 58 | % |
| | | | | | | | | | | | | | | | | | | | | |
(a) | Rounds to less than $0.005 per share. |
(b) | Total return in the above table represents the rate that the investor would have earned or lost on an investment in the Fund, assuming reinvestment of distributions. |
| | See accompanying notes which are an integral part of these financial statements. | 31 |
Dana Epiphany ESG Equity Fund – Institutional Class
Financial Highlights
(For a share outstanding during each year)
| | | Years Ended October 31, | |
| | | 2021 | | | 2020 | | | 2019 | | | 2018 | | | 2017(a) | |
Selected Per Share Data | | | | | | | | | | | | | | | | | | | | |
Net asset value, beginning of year | | $ | 10.25 | | | $ | 11.58 | | | $ | 11.80 | | | $ | 13.09 | | | $ | 10.86 | |
| | | | | | | | | | | | | | | | | | | | | |
Investment operations: | | | | | | | | | | | | | | | | | | | | |
Net investment income | | | 0.06 | | | | 0.09 | | | | 0.14 | | | | 0.08 | (b) | | | 0.04 | (b) |
Net realized and unrealized gain (loss) on investments | | | 3.87 | | | | 0.47 | | | | 1.15 | | | | 0.74 | | | | 2.37 | |
Total from investment operations | | | 3.93 | | | | 0.56 | | | | 1.29 | | | | 0.82 | | | | 2.41 | |
| | | | | | | | | | | | | | | | | | | | | |
Less distributions to shareholders from: | | | | | | | | | | | | | | | | | | | | |
Net investment income | | | (0.06 | ) | | | (0.10 | ) | | | (0.12 | ) | | | (0.08 | ) | | | (0.01 | ) |
Net realized gains | | | (0.15 | ) | | | (1.79 | ) | | | (1.39 | ) | | | (2.03 | ) | | | (0.17 | ) |
Total distributions | | | (0.21 | ) | | | (1.89 | ) | | | (1.51 | ) | | | (2.11 | ) | | | (0.18 | ) |
| | | | | | | | | | | | | | | | | | | | | |
Redemption fees | | | — | | | | — | | | | — | | | | — | | | | — | (c) |
| | | | | | | | | | | | | | | | | | | | | |
Net asset value, end of year | | $ | 13.97 | | | $ | 10.25 | | | $ | 11.58 | | | $ | 11.80 | | | $ | 13.09 | |
| | | | | | | | | | | | | | | | | | | | | |
Total Return(d) | | | 38.70 | % | | | 4.76 | % | | | 12.76 | % | | | 6.32 | % | | | 22.46 | % |
| | | | | | | | | | | | | | | | | | | | | |
Ratios and Supplemental Data: | | | | | | | | | | | | | | | | | | | | |
| | | | | | | | | | | | | | | | | | | | | |
Net assets, end of year (000 omitted) | | $ | 67,557 | | | $ | 13,062 | | | $ | 5,079 | | | $ | 6,485 | | | $ | 7,429 | |
Before waiver | | | | | | | | | | | | | | | | | | | | |
Ratio of expenses to average net assets | | | 1.12 | % | | | 2.00 | % | | | 2.13 | % | | | 1.63 | % | | | 2.15 | % |
After waiver | | | | | | | | | | | | | | | | | | | | |
Ratio of expenses to average net assets | | | 0.85 | % | | | 0.85 | % | | | 0.90 | % | | | 1.25 | % | | | 1.82 | % |
Ratio of net investment income to average net assets | | | 0.57 | % | | | 0.89 | % | | | 1.19 | % | | | 0.62 | % | | | 0.36 | % |
Portfolio turnover rate | | | 18 | % | | | 67 | % | | | 60 | % | | | 23 | % | | | 97 | % |
| | | | | | | | | | | | | | | | | | | | | |
(a) | Effective May 30, 2017, Class C shares were renamed Class I Shares. Effective December 19, 2018, Class I shares were renamed Institutional Class Shares. |
(b) | Per share net investment income (loss) has been determined on the basis of average shares outstanding during the period. |
(c) | Rounds to less than $0.005 per share. |
(d) | Total return in the above table represents the rate that the investor would have earned or lost on an investment in the Fund, assuming reinvestment of distributions. |
32 | See accompanying notes which are an integral part of these financial statements. | |
Dana Funds
Notes to the Financial Statements
October 31, 2021
NOTE 1. ORGANIZATION
The Dana Large Cap Equity Fund (the “Large Cap Fund”), the Dana Epiphany ESG Small Cap Equity Fund (the “Small Cap Fund”), and the Dana Epiphany ESG Equity Fund (the “Epiphany ESG Fund”) (each a “Fund” and collectively, the “Funds”) are each registered under the Investment Company Act of 1940, as amended (“1940 Act”), as an open-end diversified series of Valued Advisers Trust (the “Trust”). The Trust is a management investment company established under the laws of Delaware by an Agreement and Declaration of Trust dated June 13, 2008 (the “Trust Agreement”). The Trust Agreement permits the Board of Trustees (“Board”) to issue an unlimited number of shares of beneficial interest of separate series without par value. Each Fund is one of a series of funds currently authorized by the Board. The investment adviser to the Funds is Dana Investment Advisors, Inc. (the “Adviser”). Each Fund seeks long-term growth of capital.
The Large Cap Fund currently offers Investor Class shares and Institutional Class shares. The Small Cap Fund and Epiphany ESG Fund currently offer Institutional Class shares. Effective on the close of business on October 13, 2017, Class A shares were consolidated into Class N shares of the Large Cap Fund which were subsequently re-designated Investor Class shares. Each share represents an equal proportionate interest in the assets and liabilities belonging to the Fund and is entitled to such dividends and distributions out of income belonging to the Fund as declared by the Board. Effective at the close of business on June 4, 2020, Investor Class shares of the Small Cap Fund and Epiphany ESG Fund were consolidated into the Institutional Class shares of the Small Cap Fund and Epiphany ESG Fund. Prior to February 28, 2017, all share classes of the Large Cap Fund and the Small Cap Fund imposed a 2.00% redemption fee on shares redeemed within 60 days of purchase.
NOTE 2. SIGNIFICANT ACCOUNTING POLICIES
The Funds are investment companies and follow accounting and reporting guidance under Financial Accounting Standards Board Accounting Standards Codification (“ASC”) Topic 946, “Financial Services-Investment Companies.” The following is a summary of significant accounting policies followed by the Funds in the preparation of their financial statements. These policies are in conformity with generally accepted accounting principles in the United States of America (“GAAP”).
Estimates – The preparation of financial statements in conformity with GAAP requires management to make estimates and assumptions that affect the reported amounts of assets and liabilities and disclosure of contingent assets and liabilities at the date of the financial statements and the reported amounts of increases and decreases in net assets from operations during the reporting period. Actual results could differ from those estimates.
Federal Income Taxes – The Funds make no provision for federal income or excise tax. Each Fund has qualified and intends to qualify each year as a regulated investment company (“RIC”) under subchapter M of the Internal Revenue Code of 1986, as amended, by complying with the requirements applicable to RICs and by distributing substantially all of its taxable income. Each Fund also intends to distribute sufficient net investment income and net capital gains, if any, so that it will not be subject to excise tax on undistributed income and gains. If the required amount of net investment income or gains is not distributed, the Funds could incur a tax expense.
33
Dana Funds
Notes to the Financial Statements (continued)
October 31, 2021
As of and during the fiscal year ended October 31, 2021, the Funds did not have any liabilities for any unrecognized tax benefits. The Funds recognize interest and penalties, if any, related to unrecognized tax benefits as income tax expense on the Statements of Operations when incurred. During the fiscal year ended October 31, 2021, the Funds did not incur any interest or penalties. Management of the Funds has reviewed tax positions taken in tax years that remain subject to examination by all major tax jurisdictions, including federal (i.e., the last three tax year ends and the interim tax period since then, as applicable). Management believes that there is no tax liability resulting from unrecognized tax benefits related to uncertain tax positions taken.
Expenses – Expenses incurred by the Trust that do not relate to a specific fund of the Trust are allocated to the individual funds based on each fund’s relative net assets or another appropriate basis (as determined by the Board). Expenses specifically attributable to any class are borne by that class. Income, realized gains and losses, unrealized appreciation and depreciation, and fund-wide expenses not allocated to a particular class shall be allocated to each class based on the net assets of that class in relation to the net assets of the entire fund.
Security Transactions and Related Income – The Funds follow industry practice and record security transactions on the trade date for financial reporting purposes. The specific identification method is used for determining gains or losses for financial statement and income tax purposes. Dividend income is recorded on the ex-dividend date and interest income is recorded on an accrual basis. Withholding taxes on foreign dividends, if any, have been provided for in accordance with the Funds’ understanding of the applicable country’s tax rules and rates.
The Funds may hold Real Estate Investment Trusts (“REITs”) which pay dividends to their shareholders based upon available funds from operations. It is possible for these dividends to exceed the REIT’s underlying taxable earnings and profits resulting in the excess portion of such dividends being designated as a return of capital. Distributions received from REITs that represent a return of capital or capital gains are recorded as a reduction of the cost of the REITs or as a realized gain, respectively.
Dividends and Distributions – The Funds intend to distribute substantially all of their net investment income, if any, at least quarterly. The Funds intend to distribute their net realized long-term and short-term capital gains, if any, annually. Distributions to shareholders, which are determined in accordance with income tax regulations, are recorded on the ex-dividend date. The treatment for financial reporting purposes of distributions made to shareholders during the year from net investment income or net realized capital gains may differ from their ultimate treatment for federal income tax purposes. These differences are caused primarily by differences in the timing of the recognition of certain components of income, expense or realized capital gain for federal income tax purposes. Where such differences are permanent in nature, they are reclassified in the components of the net assets based on their ultimate characterization for federal income tax purposes. Any such reclassifications will have no effect on net assets, results of operations or net asset value (“NAV”) per share of the Funds. For the fiscal year October 31, 2021, the Funds did not make any reclassifications.
Share Valuation – The NAV per share of each class of each Fund is calculated each day the New York Stock Exchange (the “NYSE”) is open by dividing the total value of the assets attributable to that class, less liabilities attributable to that class, by the number of shares outstanding of that class.
34
Dana Funds
Notes to the Financial Statements (continued)
October 31, 2021
NOTE 3. SECURITIES VALUATION AND FAIR VALUE MEASUREMENTS
Each Fund values its portfolio securities at fair value as of the close of regular trading on the NYSE (normally 4:00 p.m. Eastern time) on each business day the NYSE is open for business. Fair value is defined as the price that a Fund would receive upon selling an investment in a timely transaction to an independent buyer in the principal or most advantageous market of the investment. GAAP establishes a three-tier hierarchy to maximize the use of observable market data and minimize the use of unobservable inputs and to establish classification of fair value measurements for disclosure purposes.
Inputs refer broadly to the assumptions that market participants would use in pricing the asset or liability, including assumptions about risk (the risk inherent in a particular valuation technique used to measure fair value including a pricing model and/or the risk inherent in the inputs to the valuation technique). Inputs may be observable or unobservable. Observable inputs are inputs that reflect the assumptions market participants would use in pricing the asset or liability developed based on market data obtained and available from sources independent of the reporting entity. Unobservable inputs are inputs that reflect the reporting entity’s own assumptions about the assumptions market participants would use in pricing the asset or liability developed based on the best information available in the circumstances.
Various inputs are used in determining the value of each Fund’s investments. These inputs are summarized in the three broad levels listed below.
| | ● | Level 1 – unadjusted quoted prices in active markets for identical investments and/or registered investment companies where the value per share is determined and published and is the basis for current transactions for identical assets or liabilities at the valuation date |
| | ● | Level 2 – other significant observable inputs (including, but not limited to, quoted prices for an identical security in an inactive market, quoted prices for similar securities, interest rates, prepayment speeds, credit risk, etc.) |
| | ● | Level 3 – significant unobservable inputs (including the Funds’ own assumptions in determining fair value of investments based on the best information available) |
The inputs used to measure fair value may fall into different levels of the fair value hierarchy. In such cases, for disclosure purposes, the level in the fair value hierarchy which is reported is determined based on the lowest level input that is significant to the fair value measurement in its entirety.
Equity securities that are traded on any stock exchange are generally valued at the last quoted sale price on the security’s primary exchange. Lacking a last sale price, an exchange-traded security is generally valued at its last bid price. Securities traded in the NASDAQ over-the-counter market are generally valued at the NASDAQ Official Closing Price. When using market quotations and when the market is considered active, the security is classified as a Level 1 security. In the event that market quotations are not readily available or are considered unreliable due to market or other events, a Fund values its securities and other assets at fair value in accordance with policies established by and under the general supervision of the Board. Under these policies, the securities will be classified as Level 2 or 3 within the fair value hierarchy, depending on the inputs used.
35
Dana Funds
Notes to the Financial Statements (continued)
October 31, 2021
Investments in mutual funds, including money market mutual funds, are generally priced at the ending NAV. These securities are categorized as Level 1 securities.
In accordance with the Trust’s valuation policies, the Adviser is required to consider all appropriate factors relevant to the value of securities for which it has determined other pricing sources are not available or reliable as described above. No single method exists for determining fair value, because fair value depends upon the circumstances of each individual case. As a general principle, the current fair value of a security being valued by the Adviser would be the amount that the Funds might reasonably expect to receive upon the current sale. Methods that are in accordance with this principle may, for example, be based on (i) a multiple of earnings; (ii) a discount from market prices of a similar freely traded security (including a derivative security or a basket of securities traded on other markets, exchanges or among dealers); or (iii) yield to maturity with respect to debt issues, or a combination of these and other methods. Fair-value pricing is permitted if, in the Adviser’s opinion, the validity of market quotations appears to be questionable based on factors such as evidence of a thin market in the security based on a small number of quotations, a significant event occurs after the close of a market but before a Fund’s NAV calculation that may affect a security’s value, or the Adviser is aware of any other data that calls into question the reliability of market quotations.
The following is a summary of the inputs used to value the Funds’ investments as of October 31, 2021:
Large Cap Fund | | Valuation Inputs | | | | | |
Assets | | Level 1 | | | Level 2 | | | Level 3 | | | Total | |
Common Stocks(a) | | $ | 140,830,434 | | | $ | — | | | $ | — | | | $ | 140,830,434 | |
Money Market Funds | | | 1,289,908 | | | | — | | | | — | | | | 1,289,908 | |
Total | | $ | 142,120,342 | | | $ | — | | | $ | — | | | $ | 142,120,342 | |
Small Cap Fund | | Valuation Inputs | | | | | |
Assets | | Level 1 | | | Level 2 | | | Level 3 | | | Total | |
Common Stocks(a) | | $ | 17,084,271 | | | $ | — | | | $ | — | | | $ | 17,084,271 | |
Exchange Traded Funds | | | 254,960 | | | | — | | | | — | | | | 254,960 | |
Money Market Funds | | | 110,441 | | | | — | | | | — | | | | 110,441 | |
Total | | $ | 17,449,672 | | | $ | — | | | $ | — | | | $ | 17,449,672 | |
Epiphany ESG Fund | | Valuation Inputs | | | | | |
Assets | | Level 1 | | | Level 2 | | | Level 3 | | | Total | |
Common Stocks(a) | | $ | 66,483,583 | | | $ | — | | | $ | — | | | $ | 66,483,583 | |
Money Market Funds | | | 985,936 | | | | — | | | | — | | | | 985,936 | |
Total | | $ | 67,469,519 | | | $ | — | | | $ | — | | | $ | 67,469,519 | |
(a) | Refer to Schedule of Investments for sector classifications. |
36
Dana Funds
Notes to the Financial Statements (continued)
October 31, 2021
The Funds did not hold any investments at the end of the reporting period for which significant unobservable inputs (Level 3) were used in determining fair value; therefore, no reconciliation of Level 3 securities is included for this reporting period.
NOTE 4. FEES AND OTHER TRANSACTIONS WITH AFFILIATES
The Adviser, under the terms of the management agreement for each Fund, manages the Funds’ investments subject to oversight of the Board. As compensation for its management services, the Funds are obligated to pay the Adviser a fee computed and accrued daily and paid monthly at an annual rate of 0.65%, 0.75% and 0.65% of the average daily net assets of the Large Cap Fund, the Small Cap Fund and the Epiphany ESG Fund, respectively. For the fiscal year ended October 31, 2021, the Adviser earned fees of $866,362 from the Large Cap Fund, $111,370 from the Small Cap Fund and $265,910 from the Epiphany ESG Fund before the waivers described below. At October 31, 2021, the Large Cap Fund and the Epiphany ESG Fund owed the Adviser $61,524 and $26,250, respectively. The Adviser owed the Small Cap Fund $4,255.
The Adviser has contractually agreed to waive its management fee and/or reimburse certain operating expenses through February 28, 2022, but only to the extent necessary so that the Funds’ net expenses, excluding brokerage fees and commissions, borrowing costs (such as interest and dividend expenses on securities sold short), taxes, extraordinary expenses, fees and expenses paid under a distribution plan adopted pursuant to Rule 12b-1, fees and expenses paid under a shareholder services plan, and indirect expenses (such as “acquired fund fees and expenses”) do not exceed 0.73% of the average daily net assets of the Institutional Class and the Investor Class for the Large Cap Fund, 0.95% of the average daily net assets of the Institutional Class for the Small Cap Fund, and 0.85% of the average daily net assets of the Institutional Class for the Epiphany ESG Fund.
Each fee waiver or expense reimbursement by the Adviser is subject to repayment by the applicable Fund within three years following the date in which the fee waiver or expense reimbursement occurred, provided that the Fund is able to make the repayment without exceeding the expense limitation that is in effect at the time of the waiver or expense reimbursement, and the expense limitation in effect at the time of the repayment. The expense limitation agreements may not be terminated except by mutual consent of the Adviser and the Board. For the fiscal year ended October 31, 2021, the Adviser waived fees of $174,396 from the Large Cap Fund, $164,133 from the Small Cap Fund and $108,826 from the Epiphany ESG Fund.
The amounts subject to repayment by the Funds, pursuant to the aforementioned conditions are as follows:
Recoverable through | | Large Cap
Fund | | | Small Cap
Fund | | | Epiphany ESG
Fund | |
October 31, 2022 | | $ | 169,051 | | | $ | 153,464 | | | $ | 137,305 | |
October 31, 2023 | | | 227,431 | | | | 187,744 | | | | 154,164 | |
October 31, 2024 | | | 174,396 | | | | 164,133 | | | | 108,826 | |
37
Dana Funds
Notes to the Financial Statements (continued)
October 31, 2021
The Trust retains Ultimus Fund Solutions, LLC (“Ultimus” or “Administrator”) to provide the Funds with administration and compliance (including a chief compliance officer), fund accounting and transfer agent services, including all regulatory reporting. For the fiscal year ended October 31, 2021, fees for administration, compliance, fund accounting, and transfer agent services, and amounts due to the Administrator at October 31, 2021 were as follows:
| | Large Cap
Fund | | | Small Cap
Fund | | | Epiphany ESG
Fund | |
Administration | | $ | 73,453 | | | $ | 30,000 | | | $ | 31,333 | |
Compliance | | | 3,000 | | | | 3,000 | | | | 3,000 | |
Fund accounting | | | 45,045 | | | | 24,999 | | | | 24,583 | |
Transfer agent | | | 23,000 | | | | 18,000 | | | | 17,700 | |
Payable to Administrator | | | 12,252 | | | | 6,333 | | | | 6,913 | |
The officers and one trustee of the Trust are members of management and/or employees of the Administrator and are not paid by the Trust for services to the Funds. Ultimus Fund Distributors, LLC (the “Distributor”), a wholly-owned subsidiary of Ultimus, acts as the distributor of the Funds’ shares. There were no payments made to the Distributor by the Funds for the fiscal year ended October 31, 2021.
The Trust, with respect to the Large Cap Fund, has adopted a Distribution Plan (the “Plan”) pursuant to Rule 12b-1 under the Investment Company Act of 1940, as amended (the “1940 Act”). The Plan provides that the Large Cap Fund will pay the Distributor and any registered securities dealer, financial institution or any other person (a “Recipient”) a shareholder servicing fee aggregating at a rate of 0.25% of the average daily net assets for the Investor Class shares in connection with the promotion and distribution of the Large Cap Fund’s shares or the provision of shareholder support services to shareholders, including, but not necessarily limited to, advertising, compensation to underwriters, dealers and selling personnel, the printing and mailing of prospectuses to other than current Investor Class shareholders, the printing and mailing of sales literature and servicing shareholder accounts (“12b-1 Expenses”). The Large Cap Fund or Distributor may pay all or a portion of these fees to any Recipient who renders assistance in distributing or promoting the sale of shares, or who provides certain shareholder services, pursuant to a written agreement. The Plan is a compensation plan, which means that compensation is paid regardless of 12b-1 Expenses actually incurred. It is anticipated that the Plan will benefit shareholders because an effective sales program typically is necessary in order for the Large Cap Fund to reach and maintain a sufficient size to achieve efficiently its investment objectives and to realize economies of scale. For the fiscal year ended October 31, 2021, the Investor Class shares 12b-1 expense incurred by the Large Cap Fund was $63,778. As of October 31, 2021, the Large Cap Fund owed the Distributor $5,513.
38
Dana Funds
Notes to the Financial Statements (continued)
October 31, 2021
NOTE 5. PURCHASES AND SALES OF SECURITIES
For the fiscal year ended October 31, 2021, purchases and sales of investment securities, other than short-term investments were as follows:
| | Large Cap
Fund | | | Small Cap
Fund | | | Epiphany ESG
Fund | |
Purchases | | $ | 39,669,634 | | | $ | 14,544,331 | | | $ | 51,715,447 | |
| | | | | | | | | | | | | |
Sales | | | 57,241,796 | | | | 13,308,912 | | | | 7,328,783 | |
There were no purchases or sales of long-term U.S. government obligations during the fiscal year ended October 31, 2021.
NOTE 6. FEDERAL TAX INFORMATION
At October 31, 2021, the net unrealized appreciation (depreciation) and tax cost of investments for tax purposes was as follows:
| | Large Cap
Fund | | | Small Cap
Fund | | | Epiphany ESG
Fund | |
Gross unrealized appreciation | | $ | 50,467,007 | | | $ | 4,752,694 | | | $ | 11,921,682 | |
Gross unrealized depreciation | | | (524,065 | ) | | | (63,903 | ) | | | (1,008,341 | ) |
Net unrealized appreciation/(depreciation) on investments | | | 49,942,942 | | | | 4,688,791 | | | | 10,913,341 | |
Tax cost of investments | | | 92,177,400 | | | | 12,760,881 | | | | 56,556,178 | |
At October 31, 2021, the difference between book basis and tax basis unrealized appreciation for the Large Cap Fund, Small Cap Fund and Epiphany ESG Fund was attributable primarily to the tax deferral of losses on wash sales.
At October 31, 2021, the components of accumulated earnings (deficit) on a tax basis were as follows:
| | Large Cap
Fund | | | Small Cap
Fund | | | Epiphany
ESG Fund | |
Undistributed ordinary income | | $ | 3,266,725 | | | $ | 112,914 | | | $ | 282,753 | |
Undistributed long-term capital gains | | | 13,038,888 | | | | 1,308,341 | | | | 833,581 | |
Unrealized appreciation on investments | | | 49,942,942 | | | | 4,688,791 | | | | 10,913,341 | |
Total accumulated earnings | | $ | 66,248,555 | | | $ | 6,110,046 | | | $ | 12,029,675 | |
39
Dana Funds
Notes to the Financial Statements (continued)
October 31, 2021
The tax character of distributions paid for the fiscal years ended October 31, 2021 and October 31, 2020 were as follows:
| | | Large Cap Fund | | | Small Cap Fund | | | Epiphany ESG Fund | |
| | 2021 | | | 2020 | | | 2021 | | | 2020 | | | 2021 | | | 2020 | |
Distributions paid from: | | | | | | | | | | | | | | | | | | | | | | | | |
Ordinary income(a) | | $ | 818,449 | | | $ | 1,329,710 | | | $ | — | | | $ | 5,901 | | | $ | 157,453 | | | $ | 112,014 | |
Long-term capital gains | | | 2,320,073 | | | | 13,598,815 | | | | — | | | | — | | | | 257,983 | | | | 1,933,270 | |
Total distributions paid | | $ | 3,138,522 | | | $ | 14,928,525 | | | $ | — | | | $ | 5,901 | | | $ | 415,436 | | | $ | 2,045,284 | |
(a) | For federal income tax purposes, distributions of short-term capital gains are treated as ordinary income distributions. |
Capital loss carryforwards are available to offset future realized capital gains and thereby reduce further taxable gain distributions. During the fiscal year ended October 31, 2021, the Small Cap Fund utilized $1,358,864 of their capital loss carryforwards.
NOTE 7. SECTOR RISK
If a Fund has significant investments in the securities of issuers within a particular sector, any development affecting that sector will have a greater impact on the value of the net assets of the Fund than would be the case if the Fund did not have significant investments in that sector. In addition, this may increase the risk of loss in the Fund and increase the volatility of the Fund’s NAV per share. For instance, economic or market factors, regulatory changes or other developments may negatively impact all companies in a particular sector, and therefore the value of the Fund’s portfolio will be adversely affected. As of October 31, 2021, the Epiphany ESG Fund and the Large Cap Fund had 25.28% and 26.07% of the value of their net assets invested in stocks within the Technology sector, respectively.
NOTE 8. COMMITMENTS AND CONTIGENCIES
The Trust indemnifies its officers and Trustees for certain liabilities that may arise from their performance of their duties to the Trust or the Funds. Additionally, in the normal course of business, the Trust enters into contracts that contain a variety of representations and warranties which provide general indemnifications. The Trust’s maximum exposure under these arrangements is unknown, as this would involve future claims that may be made against the Trust that have not yet occurred.
NOTE 9. SUBSEQUENT EVENTS
Management of the Funds has evaluated the need for disclosures and/or adjustments resulting from subsequent events through the date at which these financial statements were issued. Based upon this evaluation, management has determined there were no items requiring adjustment of the financial statements or additional disclosure.
40
Report of Independent Registered Public Accounting Firm
To the Shareholders of Dana Funds and
Board of Trustees of Valued Advisers Trust
Opinion on the Financial Statements
We have audited the accompanying statements of assets and liabilities, including the schedules of investments, of Dana Funds comprising the funds listed below (the “Funds”) as of October 31, 2021, the related statements of operations, the statements of changes in net assets, the related notes, and the financial highlights for each of the periods indicated below (collectively referred to as the “financial statements”). In our opinion, the financial statements present fairly, in all material respects, the financial position of each of the Funds as of October 31, 2021, the results of their operations, the changes in net assets, and the financial highlights for each of the periods indicated below in conformity with accounting principles generally accepted in the United States of America.
Fund Name | Statements of
Operations | Statements of
Changes in Net Assets | Financial
Highlights |
Dana Large Cap Equity Fund and Dana Epiphany ESG Small Cap Equity Fund | For the year ended October 31, 2021 | For the years ended October 31, 2021 and 2020 | For the years ended October 31, 2021, 2020, 2019, 2018, and 2017 |
Dana Epiphany ESG Equity Fund | For the year ended October 31, 2021 | For the years ended October 31, 2021 and 2020 | For the years ended October 31, 2021, 2020, and 2019 |
Dana Epiphany ESG Equity Fund’s financial highlights for the years ended October 31, 2018, and prior, were audited by other auditors whose report dated December 26, 2018, expressed an unqualified opinion on those financial highlights.
Basis for Opinion
These financial statements are the responsibility of the Funds’ management. Our responsibility is to express an opinion on the Funds’ financial statements based on our audits. We are a public accounting firm registered with the Public Company Accounting Oversight Board (United States) (“PCAOB”) and are required to be independent with respect to the Funds in accordance with the U.S. federal securities laws and the applicable rules and regulations of the Securities and Exchange Commission and the PCAOB.
We conducted our audits in accordance with the standards of the PCAOB. Those standards require that we plan and perform the audit to obtain reasonable assurance about whether the financial statements are free of material misstatement whether due to error or fraud.
Our audits included performing procedures to assess the risks of material misstatement of the financial statements, whether due to error or fraud, and performing procedures that respond to those risks. Such procedures included examining, on a test basis, evidence regarding the amounts and disclosures in the financial statements. Our procedures included confirmation of securities owned as of October
41
Report of Independent Registered Public Accounting Firm (continued)
31, 2021, by correspondence with the custodian. Our audits also included evaluating the accounting principles used and significant estimates made by management, as well as evaluating the overall presentation of the financial statements. We believe that our audits provide a reasonable basis for our opinion.
We have served as the auditor of one or more of the Funds within Dana Funds since 2012.
COHEN & COMPANY, LTD.
Cleveland, Ohio
December 28, 2021
42
Summary of Fund Expenses (Unaudited)
As a shareholder of a Fund, you incur two types of costs: (1) transaction costs and (2) ongoing costs, including management fees and other Fund expenses. These examples are intended to help you understand your ongoing costs (in dollars) of investing in each Fund and to compare these costs with the ongoing costs of investing in other mutual funds. Each Fund’s example is based on an investment of $1,000 invested at the beginning of the period and held for the entire period from May 1, 2021 through October 31, 2021.
Actual Expenses
The first line of the table for each class provides information about actual account values and actual expenses. You may use the information in these lines, together with the amount you invested, to estimate the expenses that you paid over the period. Simply divide your account value by $1,000 (for example, an $8,600 account value divided by $1,000 = 8.60), then multiply the result by the number in the first line under the heading “Expenses Paid During Period” to estimate the expenses you paid on your account during this period.
Hypothetical Example for Comparison Purposes
The second line of the table for each class provides information about hypothetical account values and hypothetical expenses based on each Fund’s actual expense ratios and an assumed rate of return of 5% per year before expenses, which is not the Fund’s actual return. The hypothetical account values and expenses may not be used to estimate the actual ending account balances or expenses you paid for the period. You may use this information to compare the ongoing costs of investing in the Funds and other funds. To do so, compare this 5% hypothetical example with the 5% hypothetical examples that appear in the shareholder reports of other funds.
Expenses shown in the table are meant to highlight your ongoing costs only and do not reflect any transactional costs. Therefore, the second line of the table for each class is useful in comparing ongoing costs only and will not help you determine the relative total costs of owning different funds. In addition, if transaction costs were included, your costs would have been higher.
43
Summary of Fund Expenses (Unaudited) (continued)
| | Beginning
Account
Value
May 1, 2021 | Ending
Account
Value
October 31, 2021 | Expenses
Paid
During
Period(a) | Annualized
Expense
Ratio |
Large Cap Fund |
Institutional Class | Actual | $ 1,000.00 | $ 1,082.40 | $3.83 | 0.73% |
| | | | | | |
| | Hypothetical (b) | $ 1,000.00 | $ 1,021.53 | $3.72 | 0.73% |
| | | | | | |
Investor Class | Actual | $ 1,000.00 | $ 1,081.10 | $5.14 | 0.98% |
| | | | | | |
| | Hypothetical (b) | $ 1,000.00 | $ 1,020.27 | $4.99 | 0.98% |
Small Cap Fund |
Institutional Class | Actual | $ 1,000.00 | $ 1,073.50 | $4.96 | 0.95% |
| | | | | | |
| | Hypothetical (b) | $ 1,000.00 | $ 1,020.42 | $4.84 | 0.95% |
Epiphany ESG Fund |
Institutional Class | Actual | $ 1,000.00 | $ 1,068.40 | $4.43 | 0.85% |
| | | | | | |
| | Hypothetical (b) | $ 1,000.00 | $ 1,020.92 | $4.33 | 0.85% |
(a) | Expenses are equal to the Funds’ annualized expense ratios, multiplied by the average account value over the period, multiplied by 184/365 (to reflect the one-half year period). The annualized expense ratios reflect reimbursement of expenses by the Funds’ investment adviser for the period beginning May 1, 2021 to October 31, 2021. The “Financial Highlights” tables in the Funds’ financial statements, included in this report, also show the gross expense ratios, without such reimbursements. |
(b) | Hypothetical assumes 5% annual return before expenses. |
44
Additional Federal Income Tax Information (Unaudited)
The Form 1099-DIV you receive in January 2022 will show the tax status of all distributions paid to your account in calendar year 2021. Shareholders are advised to consult their own tax adviser with respect to the tax consequences of their investment in the Fund. As required by the Internal Revenue Code and/or regulations, shareholders must be notified regarding the status of qualified dividend income for individuals and the dividends received deduction for corporations.
Qualified Dividend Income. The Funds designate the following percentage or up to the maximum amount of such dividends allowable pursuant to the Internal Revenue Code, as qualified dividend income eligible for the reduced tax rate.
| Large Cap
Fund | Small Cap
Fund | Epiphany ESG
Fund |
Qualified Dividend Income | 52% | 0% | 100% |
Qualified Business Income. The Funds designate the following percentage of ordinary income dividends, or up to the maximum amount of such dividends allowable pursuant to the Internal Revenue Code, as qualified business income.
| Large Cap
Fund | Small Cap
Fund | Epiphany ESG
Fund |
Qualified Business Income | 1% | 0% | 0% |
Dividends Received Deduction. Corporate shareholders are generally entitled to take the dividends received deduction on the portion of the Funds’ dividend distribution that qualifies under tax law. For the Funds’ calendar year 2021 ordinary income dividends, the following percentage qualifies for the corporate dividends received deduction.
| Large Cap
Fund | Small Cap
Fund | Epiphany ESG
Fund |
Dividends Received Deduction | 53% | 0% | 100% |
The Funds designate the following amounts as long-term capital gains distributions. The amounts designated may not agree with long-term capital gains in the tax character of distribution table due to utilization of earnings and profits distributed to shareholders on redemption of shares.
| | Large Cap
Fund | | | Small Cap
Fund | | | Epiphany ESG
Fund | |
Long-Term Capital Gains Distributions | | $ | 2,320,073 | | | $ | — | | | $ | 257,983 | |
45
Liquidity Risk Management Program (Unaudited)
Valued Advisers Trust has adopted and implemented a written liquidity risk management program as required by Rule 22e-4 (the “Liquidity Rule”) under the Investment Company Act. The program is reasonably designed to assess and manage each Fund’s liquidity risk, taking into consideration, among other factors, the Fund’s investment strategy and the liquidity of its portfolio investments during normal and reasonably foreseeable stressed conditions; its short and long-term cash flow projections; and its cash holdings and access to other funding sources. The Board of Trustees approved the appointment of a Liquidity Administrator Committee, which includes representatives from Dana Investment Advisors, Inc., the Funds’ investment adviser, and Ultimus Fund Solutions, LLC, the Funds’ Administrator. The Liquidity Administrator Committee is responsible for the program’s administration and oversight and for reporting to the Board on at least an annual basis regarding the program’s operation and effectiveness. The Liquidity Administrator Committee updated its assessment of each Fund’s liquidity risk profile, considering additional data gathered during the period June 1, 2020 through May 31, 2021 (the “Review Period”) and the adequacy and effectiveness of the liquidity risk management program’s operations during the Review Period in order to prepare a written report for the Board of Trustees (the “Report”) for consideration at its meeting held on September 1, 2021. The Report noted that during the Review Period none of the Funds experienced unusual stress or disruption to its operations related to purchase and redemption activity. It further noted that during the Review Period each Fund held adequate levels of cash and highly liquid investments to meet shareholder redemption activities in accordance with applicable requirements. The Report concluded that (i) the Trust’s liquidity risk management program is reasonably designed to prevent violations of the Liquidity Rule and (ii) the Trust’s liquidity risk management program had been effectively implemented during the Review Period.
46
Trustees and Officers (Unaudited)
The Board of Trustees supervises the business activities of the Trust. Each Trustee serves as a trustee until termination of the Trust unless the Trustee dies, resigns, retires or is removed.
The following table provides information regarding each of the Independent Trustees.
Name, Address*, (Age),
Position with Trust**,
Term of Position with Trust | Principal Occupation
During Past 5 Years
and Other Directorships | Other Directorships |
Andrea N. Mullins, (54) Independent Trustee
Since December 2013 Chairperson since March 2017 | Current: Private investor; Independent Contractor, SWM Advisors (since April 2014). | Trustee, Angel Oak Funds Trust (since February 2019) (5 portfolios); Trustee, Angel Oak Strategic Credit Fund (since December 2019); Trustee, Angel Oak Financial Strategies Income Term Trust (since May 2019); Trustee, Angel Oak Dynamic Financial Strategies Income Term Trust (since June 2020); Trustee, Angel Oak Credit Opportunities Term Trust (since January 2021); Trustee and Audit Committee Chair, Cushing Mutual Funds Trust (since November 2021) (2 portfolios); Trustee and Audit Committee Chair, Cushing NextGen Infrastructure Income Fund (since November 2021); Trustee and Audit Committee Chair, Cushing MLP & Infrastructure Fund (Since November 2021). |
47
Trustees and Officers (Unaudited) (continued)
Name, Address*, (Age),
Position with Trust**,
Term of Position with Trust | Principal Occupation
During Past 5 Years
and Other Directorships | Other Directorships |
Ira P. Cohen, (62) Independent Trustee Since June 2010 | Current: Independent financial services consultant (since February 2005); Executive Vice President of Asset Management Services, Recognos Financial (since August 2015). | Trustee and Audit Committee Chairman, Griffin Institutional Access Credit Fund (since January 2017); Trustee and Audit Committee Chairman, Griffin Institutional Access Real Estate Fund (since May 2014); Trustee, Angel Oak Funds Trust (since October 2014) (5 portfolios); Trustee, Chairman, and Nominating and Governance Committee Chairman, Angel Oak Strategic Credit Fund (since December 2017); Trustee, U.S. Fixed Income Trust (since March 2019); Trustee and Chairman, Angel Oak Financial Strategies Income Term Trust (since May 2019); Trustee, Angel Oak Dynamic Financial Strategies Income Term Trust (since June 2020); Trustee, Angel Oak Credit Opportunities Term Trust (since January 2021). |
* | The address for each Trustee is 225 Pictoria Drive, Suite 450, Cincinnati, Ohio 45246. |
** | As of the date of this report, the Trust consists of 13 series. |
The following table provides information regarding the Trustee who is considered an “interested person” of the Trust, as that term is defined under the 1940 Act. Based on the experience of the Trustee, the Trust concluded that the individual described below should serve as a Trustee.
Name, Address*, (Age),
Position with Trust**,
Term of Position with Trust | Principal Occupation
During Past 5 Years
and Other Directorships | Other Directorships |
Mark J. Seger***, (59) Trustee Since March 2017 | Current: Vice Chairman and Co-Founder, Ultimus Fund Solutions, LLC and its subsidiaries (since 1999). | None. |
* | The address for each Trustee is 225 Pictoria Drive, Suite 450, Cincinnati, Ohio 45246. |
** | As of the date of this report, the Trust consists of 13 series. |
*** | Mr. Seger is considered an “interested person” of the Trust because of his relationship with the Trust’s administrator, transfer agent, and distributor. |
48
Trustees and Officers (Unaudited) (continued)
The following table provides information regarding the Officers of the Trust:
Name, Address*, (Age),
Position with Trust**,
Term of Position with Trust | Principal Occupation
During Past 5 Years | Other Directorships |
Adam T. Kornegay, (36) Principal Executive Officer and President Since April 2018 | Current: Vice President, Business Development Director, Ultimus Fund Solutions, LLC (since March 2015). | None. |
Zachary P. Richmond, (41) Chief Financial Officer and Treasurer Since September 2021 | Current: Vice President, Director of Financial Administration for Ultimus Fund Solutions, LLC (September 2021 to present). | None. |
Kevin J. Patton, (51) Chief Compliance Officer Since March 2020 | Current: Assistant Vice President, Compliance Officer, Ultimus Fund Solutions, LLC (since January 2020). Previous: Partner and Chief Compliance Officer, Renaissance Investment Management (August 2005 to January 2020). | None. |
Carol J. Highsmith, (57) Vice President Since August 2008 Secretary Since March 2014 | Current: Vice President, Ultimus Fund Solutions, LLC (since December 2015). | None. |
Matt J. Miller, (45) Vice President Since December 2011 | Current: Assistant Vice President, Relationship Management, Ultimus Fund Solutions, LLC (since December 2015). | None. |
Stephen L. Preston, (55) AML Officer Since June 2017 | Current: Chief Compliance Officer, Ultimus Fund Distributors, LLC (since June 2011). Previous: Chief Compliance Officer, Ultimus Fund Solutions, LLC (June 2011 to August 2019); Chief Compliance Officer, Unified Financial Securities, LLC (April 2018 to December 2019). | None. |
* | The address for each Officer is 225 Pictoria Drive, Suite 450, Cincinnati, Ohio 45246. |
** | As of the date of this report, the Trust consists of 13 series. |
49
Investment Advisory Agreement Approval (Unaudited)
At a meeting held on June 2-3, 2021, the Board of Trustees (the “Board”) considered the renewal of the Investment Advisory Agreements (the “Dana Agreements”) between Valued Advisers Trust (the “Trust”) and Dana Investment Advisors, Inc. (“Dana”) with respect to the Dana Large Cap Equity Fund (the “Large Cap Fund”), the Dana Small Cap Equity Fund (the “Small Cap Fund”), and the Dana Epiphany ESG Equity Fund (the “ESG Fund”) (collectively, the “Dana Funds”). Dana provided written information to the Board to assist the Board in its considerations.
Counsel reminded the Trustees of their fiduciary duties and responsibilities, including the factors to be considered, and the application of those factors to Dana. In assessing the factors and reaching its decision, the Board took into consideration information furnished by Dana and the Trust’s other service providers for the Board’s review and consideration throughout the year at regular Board meetings, as well as information specifically prepared or presented in connection with the annual renewal process, including information presented at the meeting. The Board requested and was provided with, and reflected on, information and reports relevant to the annual renewal of the Dana Agreements, including: (i) reports regarding the services and support provided to the Dana Funds by Dana; (ii) quarterly assessments of the investment performance of the Dana Funds by personnel of Dana; (iii) commentary on the reasons for the performance; (iv) presentations by Dana addressing its investment philosophy, investment strategy, personnel, and operations; (v) compliance and audit reports concerning the Dana Funds and Dana; (vi) disclosure information contained in the Trust’s registration statement and Dana’s Form ADV; and (vii) a memorandum from counsel, that summarized the fiduciary duties and responsibilities of the Board in considering and approving the Dana Agreements. The Board also requested and received various informational materials including, without limitation: (a) documents containing information about Dana, including its financial information; a description of its personnel and services it provides to the Dana Funds; information on Dana’s investment advice and performance; summaries of Dana Fund expenses, compliance program, current legal matters, and other general information; (b) comparative expense and performance information for other mutual funds with strategies similar to the Dana Funds; and (c) the benefits to be realized by Dana from its relationship with the Dana Funds. The Board did not identify any particular information that was most relevant to its consideration of the Dana Agreements and each Trustee may have afforded different weight to the various Factors.
1. | The nature, extent, and quality of the services to be provided by Dana. The Board considered Dana’s responsibilities under the Dana Agreements. The Trustees considered the services being provided by Dana to the Dana Funds including, without limitation: the quality of its investment advisory services (including research and recommendations with respect to portfolio securities), its process for formulating investment recommendations and assuring compliance with the Dana Funds’ investment objectives and limitations, its coordination of services for the Dana Funds among their service providers, and its efforts to promote the Dana Funds and grow their assets. The Trustees considered Dana’s continuity of, and commitment to retain, qualified personnel and Dana’s commitment to maintain and enhance its resources and systems, the commitment of Dana’s personnel to finding alternatives and options that allow the Dana Funds to maintain their goals, and Dana’s continued cooperation with the Board and counsel for the Dana Funds. The Trustees considered Dana’s personnel, including their education and experience. After considering the foregoing information and further information in the Meeting materials provided by Dana, the Board concluded that, in light of all the facts and circumstances, the nature, extent, and quality of the services provided by Dana were satisfactory and adequate for the Dana Funds. |
50
Investment Advisory Agreement Approval (Unaudited) (continued)
2. | Investment Performance of the Dana Funds and Dana. The Trustees compared the performance of each of the Dana Funds with the performance of funds in a peer group with similar objectives managed by other investment advisers, with aggregated Morningstar category data, and with the performance of each of the Dana Funds’ benchmark. The Trustees also considered the consistency of Dana’s management of the Dana Funds with their investment objectives, strategies, and limitations. The Trustees noted that, as of March 31, 2021, the Large Cap Fund’s performance was above its peer group median for the one-year, five-year, and since inception periods, and below the peer group median for the three-year period. The Trustees noted that the Large Cap Fund’s performance was below that of its benchmark for all periods presented. When compared to other funds in its custom Morningstar category, the Trustees observed that the Large Cap Fund’s performance was below the average and median for the one-year and three-year periods, above the average but below the median for the five-year period, and above the median for the since inception period. The Trustees also considered the performance of Dana’s separate accounts that were managed in a manner similar to that of the Large Cap Fund and they noted that the performance of Dana’s composite was lower, and that the reasons for the difference were reasonable. The Trustees considered the performance of the Small Cap Fund, and observed that, as of March 31, 2021, the Small Cap Fund performed above the median of its peer group for the one-year period, and below the median of its peer group for the three-year, five-year, and since inception periods. As compared to its benchmark, the Trustees noted that the Small Cap Fund outperformed for the one-year period ended March 31, 2021, and underperformed for the three-year, five-year, and since inception periods. They also noted that the Small Cap Fund’s performance was above the average and median of its custom Morningstar category for the one-year period, and below the average and median of the category for all other periods presented. The Trustees also considered the performance of Dana’s separate accounts that were managed in a manner similar to that of the Small Cap Fund and they noted that the performance of the separate account composite was slightly lower, and that the reasons for the difference were reasonable. The Trustees then considered the performance of the ESG Fund, noting that Dana began managing the Fund in December of 2018. For this reason, the Trustees focused their attention on the one-year performance of the ESG Fund. They observed that for the one-year period ended March 31, 2021, the ESG Fund outperformed as compared to its benchmark, the median of its peer group, and the median and average of its custom Morningstar category. The Trustees also considered the performance of Dana’s separate accounts that were managed in a manner similar to that of the ESG Fund and they noted that the performance of one of the separate account composites was higher, and that one was lower, and that the reasons for the differences were reasonable. The Trustees took into consideration discussions with representatives of Dana regarding the reasons for the performance of each of the Dana Funds. After reviewing and discussing these and other relevant factors, the Board concluded, in light of all the facts and circumstances, that the investment performance of the Dana Funds and Dana was satisfactory. |
3. | The costs of the services to be provided and profits to be realized by Dana from the relationship with the Dana Funds. The Trustees considered: (1) Dana’s financial condition; (2) the asset level of the Dana Funds; (3) the overall expenses of each of the Dana Funds; and (4) the nature and frequency of management fee payments. The Trustees reviewed information provided by Dana regarding its profits associated with managing each of the Dana Funds, noting that Dana is currently waiving a portion of its management fee and/or reimbursing other expenses with |
51
Investment Advisory Agreement Approval (Unaudited) (continued)
respect to each of the Dana Funds. The Trustees also considered potential benefits for Dana in managing the Dana Funds. The Trustees then compared the fees and expenses of the Dana Funds (including the management fee) to other comparable mutual funds. The Trustees noted that the Large Cap Fund’s management fee was equal to the median and below the average of its peer group and above the average and median of its custom Morningstar category. The Trustees also noted that the Large Cap Fund’s net expense ratio for the Institutional Class was below the average and median of its peer group and above the median and average of its custom Morningstar category. With respect to the Small Cap Fund, the Trustees noted that the management fee was below the average and equal to the median of its peer group and below the average and median of the custom Morningstar category. They also noted that the Small Cap Fund’s net expense ratio for the Institutional Class was below the average and median of its peer group and below the average and median of its custom Morningstar category. With respect to the ESG Fund, the Board noted that the management fee was above the average and equal to the median of its peer group and above both the average and median of its custom Morningstar category. They also noted that the ESG Fund’s net expense ratio for the Institutional Class was below the average and equal to the median of its peer group and above both the average and median of its custom Morningstar category. The Board also considered the fact that Dana contractually lowered the management fee for the Large Cap Fund and the Small Cap Fund in the past and had contractually agreed to limit expenses of each of the Dana Funds. The Board noted that the fees that Dana assesses for separate account clients that have strategies similar to that of each of the Dana Funds, respectively, could be comparable or lower and they expressed the view that the reasons for such differences were acceptable and reasonable. Based on the foregoing, the Board concluded that the fees to be paid to Dana by each of the Dana Funds and the profits to be realized by Dana, in light of all the facts and circumstances, were fair and reasonable in relation to the nature and quality of the services provided by Dana.
4. | The extent to which economies of scale would be realized as the Dana Funds grow and whether advisory fee levels reflect these economies of scale for the benefit of the Dana Funds’ investors. The Board considered the Dana Funds’ fee arrangements with Dana. The Board considered that while the management fee remained the same at all asset levels, the shareholders experienced benefits from each of the Dana Funds’ expense limitation arrangements. The Trustees noted that once the expenses fell below the cap set by each arrangement, the shareholders would continue to benefit from economies of scale under the Dana Funds’ arrangements with other service providers to the Dana Funds, and the Trustees attributed this benefit, in part, to the direct and indirect efforts of Dana at the inception of each of the Dana Funds to ensure that a cost structure was in place that was beneficial for the Dana Funds as they grew. In light of its ongoing consideration of the Dana Funds’ asset levels, expectations for growth in the Dana Funds, and fee levels, the Board determined that the Dana Funds’ fee arrangements, in light of all the facts and circumstances, were fair and reasonable in relation to the nature and quality of the services provided by Dana. |
5. | Possible conflicts of interest and benefits to Dana. The Trustees evaluated the potential for conflicts of interest and considered such matters as the experience and ability of the advisory personnel assigned to the Dana Funds; the basis of decisions to buy or sell securities for the Dana Funds and the substance and administration of Dana’s code of ethics. The Trustees also considered disclosure in the registration statement of the Trust relating to Dana’s potential conflicts of interest. The Trustees noted that Dana may utilize soft dollars and the Trustees noted |
52
Investment Advisory Agreement Approval (Unaudited) (continued)
Dana’s policies and processes for managing the conflicts of interest that could arise from soft dollar arrangements. The Trustees noted other potential benefits to Dana, including the fact that the Dana Funds provide an attractive vehicle for smaller accounts, which may increase the total assets under management by Dana and provide marginal cost efficiency. Based on the foregoing, the Board determined that the standards and practices of Dana relating to the identification and mitigation of potential conflicts of interest and the benefits to be realized by Dana in managing the Dana Funds were satisfactory.
After additional consideration of the factors discussed by counsel and further discussion among the Board members, the Board determined to approve the continuation of the Dana Agreements.
53
FACTS | WHAT DO THE DANA FUNDS DO WITH YOUR PERSONAL INFORMATION? |
| | |
Why? | Financial companies choose how they share your personal information. Federal law gives consumers the right to limit some but not all sharing. Federal law also requires us to tell you how we collect, share, and protect your personal information. Please read this notice carefully to understand what we do. |
| | |
What? | The types of personal information we collect and share depend on the product or service you have with us. This information can include: ■ Social Security number ■ account balances and account transactions ■ transaction or loss history and purchase history ■ checking account information and wire transfer instructions When you are no longer our customer, we continue to share your information as described in this notice. |
| | |
How? | All financial companies need to share customers’ personal information to run their everyday business. In the section below, we list the reasons financial companies can share their customers’ personal information; the reasons Dana Funds choose to share; and whether you can limit this sharing. |
Reasons we can share your personal information | Do Dana Funds share? |
For our everyday business purposes —
such as to process your transactions, maintain your account(s), respond to court orders and legal investigations, or report to credit bureaus | Yes |
For our marketing purposes —
to offer our products and services to you | No |
For joint marketing with other financial companies | No |
For our affiliates’ everyday business purposes –
information about your transactions and experiences | No |
For our affiliates’ everyday business purposes –
information about your creditworthiness | No |
For nonaffiliates to market to you | No |
Questions? | Call (855) 280-9648 |
54
Who we are |
Who is providing this notice? | Dana Funds
Ultimus Fund Distributors, LLC (Distributor)
Ultimus Fund Solutions, LLC (Administrator) |
What we do |
How do Dana Funds protect my personal information? | To protect your personal information from unauthorized access and use, we use security measures that comply with federal law. These measures include computer safeguards and secured files and buildings. Our service providers are held accountable for adhering to strict policies and procedures to prevent any misuse of your nonpublic personal information. |
How do Dana Funds collect my personal information? | We collect your personal information, for example, when you ■ open an account or deposit money ■ buy securities from us or sell securities to us ■ make deposits or withdrawals from your account ■ give us your account information ■ make a wire transfer ■ tell us who receives the money ■ tell us where to send the money ■ show your government-issued ID ■ show your driver’s license |
Why can’t I limit all sharing? | Federal law gives you the right to limit only ■ sharing for affiliates’ everyday business purposes—information about your creditworthiness ■ affiliates from using your information to market to you ■ sharing for nonaffiliates to market to you State laws and individual companies may give you additional rights to limit sharing. |
Definitions |
Affiliates | Companies related by common ownership or control. They can be financial and nonfinancial companies. ■ Dana Investment Advisors, Inc., the investment adviser to the Funds, could be deemed to be an affiliate. |
Nonaffiliates | Companies not related by common ownership or control. They can be financial and nonfinancial companies. ■ The Dana Funds do not share your personal information with nonaffiliates so they can market to you. |
Joint marketing | A formal agreement between nonaffiliated financial companies that together market financial products or services to you. ■ The Dana Funds do not jointly market. |
55
This page is intentionally left blank.
This page is intentionally left blank.
Other Information (Unaudited)
The Funds’ Statement of Additional Information (“SAI”) includes additional information about the trustees and is available without charge, upon request. You may call toll-free at (855) 280-9648 to request a copy of the SAI or to make shareholder inquiries.
PROXY VOTING
A description of the policies and procedures that each Fund uses to determine how to vote proxies relating to portfolio securities and information regarding how each Fund voted those proxies during the most recent twelve month period ended June 30, are available (1) without charge upon request by calling the Funds at (855) 280-9648 and (2) in Fund documents filed with the Securities and Exchange Commission (“SEC”) on the SEC’s website at www.sec.gov.
TRUSTEES
Andrea N. Mullins, Chairperson
Ira P. Cohen
Mark J. Seger
OFFICERS
Adam T. Kornegay,
Principal Executive Officer and President
Zachary P. Richmond,
Principal Financial Officer and Treasurer
Kevin J. Patton, Chief Compliance Officer
Carol J. Highsmith, Vice President and Secretary
INVESTMENT ADVISER
Dana Investment Advisors, Inc.
20700 Swenson Drive, Suite 400
Waukesha, WI 53186
DISTRIBUTOR
Ultimus Fund Distributors, LLC
225 Pictoria Drive, Suite 450
Cincinnati, OH 45246
INDEPENDENT REGISTERED PUBLIC ACCOUNTING FIRM
Cohen & Company, Ltd.
1350 Euclid Avenue, Suite 800
Cleveland, OH 44115
LEGAL COUNSEL
Troutman Pepper Hamilton Sanders LLP
3000 Two Logan Square
18th and Arch Streets
Philadelphia, PA 19103
CUSTODIAN
Huntington National Bank
41 South High Street
Columbus, OH 43215
ADMINISTRATOR, TRANSFER AGENT AND FUND ACCOUNTANT
Ultimus Fund Solutions, LLC
225 Pictoria Drive, Suite 450
Cincinnati, OH 45246
This report is intended only for the information of shareholders or those who have received the Funds’ prospectus which contains information about each Fund’s management fee and expenses. Please read the prospectus carefully before investing.
Distributed by Ultimus Fund Distributors, LLC
Member FINRA/SIPC
Dana-AR-21
Annual Report October 31, 2021 |
Foundry Partners Fundamental Small Cap
Value Fund
Investor Class – DRSVX
Institutional Class – DRISX
Foundry Funds
c/o Ultimus Fund Solutions, LLC
225 Pictoria Drive, Suite 450
Cincinnati, Ohio 45246
(800) 247-1014
Market Overview and Fund Performance |
Market Review
Rising inflation levels, supply chain issues, worker shortages, and the Delta variant of COVID all played a part in slowing the economic recovery over the past 6 months. Supply chain issues are wreaking havoc on suppliers and manufacturers as inventory levels are low, forcing manufacturers to halt production. Port delays and truck driver shortages are also compounding the problems. Unfortunately, these delays will likely continue to hinder deliveries through the holiday season. On the COVID front, the Delta variant slowed global growth in the third quarter as several Emerging Markets closed manufacturing facilities. Most of the facilities are now up and running, however, it will take time to work through the backlog. Compounding the problem is rising inflation. While the Federal Reserve had hoped inflation was “transitory” it is appearing to be a lot stickier than they believed earlier in the year. Despite all of these fears the small cap market remained robust over the past 6 and 12 months ended October 2021 as the Russell 2000® Value Index gained 3.22% and 64.30%, respectively.
Portfolio Review
The Foundry Partners Fundamental Small Cap Value Fund (the “Fund”) (Institutional Class) underperformed the Fund’s benchmark, the Russell 2000® Value Index, by 753 basis points over the course of the last twelve months ended October 31, 2021. Detractors to performance were Information Technology, Energy, Consumer Discretionary, Materials, Industrials, and Real Estate. Our contributors included Health Care, Consumer Staples, Utilities, Communication Services, and Financials.
Information technology stocks were our worst performers as investors fled due to concerns over supply chain issues. We found the volatility to be filled with opportunity and have built positions in semiconductor equipment stocks as semiconductor companies continue to revise capex (capital expenditure) higher over the next 2 years. Energy was also weak in the portfolio as stock selection hurt performance. CNX Resources, a natural gas E&P company hedged their natural gas exposure and consequently, limiting their upside as commodities rallied. However, as one of the lowest cost producers we remain bullish on their prospects as they continue to produce at higher levels than their hedges. In addition, as we enter 2022 a greater portion of their natural gas production will not be hedged, potentially allowing them to generate higher free cash flow.
Health Care was our strongest relative performer. Over the past 6 months, nurse staffing company, AMN Healthcare, was a strong performer as demand from hospitals remained robust. In addition, the biotech and pharma space were weak performers. Many of these companies have no earnings and most are in drug developmental stage and have no revenue. These stocks are akin to playing the lottery and our disciplined fundamental process is intended to weed these stocks out of consideration for the portfolio. Our Consumer Staples stocks were also strong performers over the past 6 months. Pilgrims Pride performed well as its majority owner, JBS S.A., offered to purchase the remaining minority interest at $26.50.
Annual Report
1
Market Overview and Fund Performance (Continued) |
In our opinion, we are entering a new and exciting phase for the market where valuation and fundamentals matter. A market where companies ridden with debt and unable to make money will fall to the wayside as easy monetary policy will cease to provide liquidity for their survival. Simply put a market where the art of stock picking and understanding companies will matter - It should be a great time to be a value investor!
The Fund’s performance quoted is past performance and does not guarantee future results. The investment return and principal value of an investment in the Fund will fluctuate so that an investor’s shares, when redeemed, may be worth more or less than their original cost. Current performance of the Fund may be lower or higher than the performance quoted. Performance data current to the most recent month end may be obtained by calling 1-800-247-1014. Information provided with respect to the Fund’s Portfolio Holdings, Sector Weightings and Number of Holdings are as of October 31, 2021 and are subject to change at any time.
Value stocks may remain undervalued for extended periods of time and the market may not recognize the intrinsic value of these securities.
Micro cap and small cap investing involves greater risk not associated with investing in more established companies, such as greater price volatility, business risk, less liquidity and increased competitive threat.
The opinions expressed are those of the investment management team and are subject to change without notice, as are statements of financial market trends, which are based on current conditions. Under no circumstances does the information contained within represent a recommendation to buy, hold or sell any security and it should not be assumed that the companies discussed were, or will prove to be, profitable. Current and future holdings are subject to risk.
Annual Report
2
Investment Results (Unaudited) |
Average Annual Total Returns(a)
As of October 31, 2021 |
| | Investor
Class | Institutional
Class | Russell 2000®
Value Index(b) |
One Year | 56.45% | 56.77% | 64.30% |
Three Year | 10.72% | 10.99% | 13.44% |
Five Year | 9.19% | 9.46% | 12.61% |
Ten Year | 10.66% | 10.91% | 12.12% |
Since Inception (8/22/07) | N/A | 7.75% | 7.74% |
Since Inception (12/31/03) | 9.73% | N/A | 8.74% |
| | Expense Ratios(c) | |
| | Investor
Class | Institutional
Class | |
| | 1.33% | 1.08% | |
The investment return and principal value of an investment will fluctuate so that an investor’s shares, when redeemed, may be worth more or less than their original cost. The returns shown do not reflect deduction of taxes that a shareholder would pay on Foundry Partners Fundamental Small Cap Value Fund (the “Fund”) distributions or the redemption of Fund shares. THE FUND’S RETURNS REPRESENT PAST PERFORMANCE AND DO NOT PREDICT FUTURE RESULTS. The returns shown are net of all recurring expenses. Current performance of the Fund may be lower or higher than the performance quoted. For more information on the Fund, and to obtain performance data current to the most recent month end, or to request a prospectus, please call 1-800-247-1014.
You should carefully consider the investment objectives, potential risk, management fees, and charges and expenses of the Fund before investing. The Fund’s prospectus contains this and other information about the Fund and should be read carefully before investing.
(a) | Average annual total returns reflect any change in price per share and assume the reinvestment of all distributions. The Fund’s returns reflect any fee reductions during the applicable periods. If such fee reductions had not occurred, the quoted performance would have been lower. |
(b) | The Russell 2000® Value Index (“Index”) is an unmanaged benchmark that assumes reinvestment of all distributions and excludes the effect of taxes and fees. The Index is a widely recognized unmanaged index of equity prices and is representative of a broader market and range of securities than are found in the Fund’s portfolio. Individuals cannot invest directly in the Index; however, an individual can invest in Exchange-Traded Funds or other investment vehicles that attempt to track the performance of a benchmark index. |
(c) | The expense ratios are from the Fund’s prospectus dated February 26, 2021. Foundry Partners, LLC (the “Adviser”) has contractually agreed to waive its management fee and/or reimburse certain Fund operating expenses, but only to the extent necessary so that the Fund’s net expenses, excluding brokerage fees and commissions, borrowing costs (such as interest and dividend expenses on securities sold short), taxes, distribution and service (12b-1) fees, extraordinary expenses and indirect expenses (such as fees and expenses of acquired funds), does not exceed 1.25% of the Fund’s average daily net assets. The contractual agreement is effective through February 28, 2022. This contractual arrangement may only be terminated by mutual consent of the Adviser and the Board of Trustees, and it will automatically terminate upon the termination of the investment advisory agreement between the Trust and the Adviser. Each waiver or reimbursement of an expense by the Adviser is subject to repayment by the Fund within the three years following the date of such waiver or reimbursement, provided that the Fund is able to make the repayment without exceeding the expense limitation in place at the time of the waiver or reimbursement, and the expense limitation in place at the time of the repayment. Information pertaining to the Fund’s expense ratios as of October 31, 2021 can be found in the financial highlights. |
The Fund is distributed by Ultimus Fund Distributors, LLC, member FINRA/SIPC.
Annual Report
3
Investment Results (Unaudited) (Continued) |
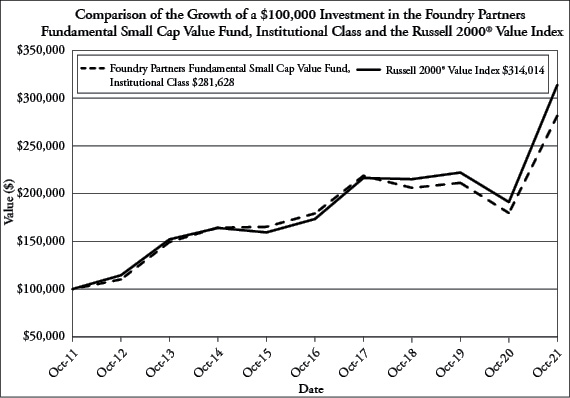
The chart above assumes an initial investment of $100,000 made on October 31, 2011 and held through October 31, 2021. THE FUND’S RETURN REPRESENTS PAST PERFORMANCE AND DOES NOT PREDICT FUTURE RESULTS. Investment returns and principal values will fluctuate so that Fund shares, when redeemed, may be worth more or less than their original purchase price. Current performance may be lower or higher than the performance data quoted.
For more information on the Fund, and to obtain performance data current to the most recent month end, or to request a prospectus, please call 1-800-247-1014. You should carefully consider the investment objectives, potential risk, management fees, and charges and expenses of the Fund before investing. The Fund’s prospectus contains important information about the Fund’s investment objectives, potential risks, management fees, charges and expenses, and other information and should be read carefully before investing.
The Fund is distributed by Ultimus Fund Distributors, LLC, member FINRA/SIPC.
Annual Report
4
Fund Holdings (Unaudited) |
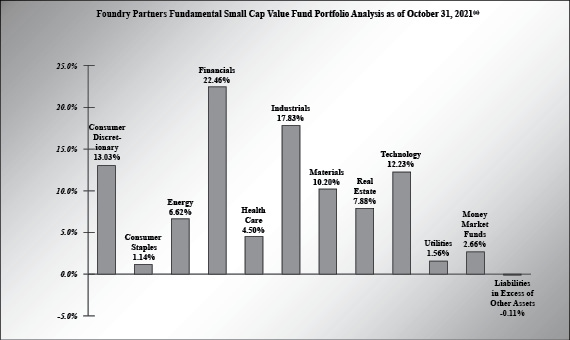
(a) | As a percent of net assets. |
Availability of Portfolio Schedules (Unaudited)
The Fund files its complete schedule of portfolio holdings with the Securities and Exchange Commission (“SEC”) for the first and third quarters of each fiscal year as an exhibit to its reports on Form N-PORT. The Fund’s Form N-PORT reports are available on the SEC’s website at http://www.sec.gov and on the Fund’s website at www.foundrypartnersllc.com.
Annual Report
5
Foundry Partners Fundamental Small Cap Value Fund |
Schedule of Investments
October 31, 2021
| | Shares | | | Fair Value | |
COMMON STOCKS — 97.45% | | | | |
Consumer Discretionary — 13.03% | | | | |
Beacon Roofing Supply, Inc.(a) | | | 62,908 | | | $ | 3,325,946 | |
Caleres, Inc. | | | 102,456 | | | | 2,362,635 | |
Camping World Holdings, Inc., Class A | | | 84,639 | | | | 3,152,803 | |
Dana, Inc. | | | 176,312 | | | | 3,912,363 | |
Group 1 Automotive, Inc. | | | 28,010 | | | | 5,036,198 | |
International Game Technology PLC(a) | | | 117,216 | | | | 3,456,700 | |
KB Home | | | 59,691 | | | | 2,396,594 | |
Kontoor Brands, Inc. | | | 75,842 | | | | 4,019,626 | |
M/I Homes, Inc.(a) | | | 45,943 | | | | 2,630,696 | |
Sally Beauty Holdings, Inc.(a) | | | 128,576 | | | | 1,962,070 | |
Vista Outdoor, Inc.(a) | | | 46,809 | | | | 1,958,489 | |
Winnebago Industries, Inc. | | | 38,960 | | | | 2,637,202 | |
| | | | | | | | 36,851,322 | |
Consumer Staples — 1.14% | | | | |
SpartanNash Co. | | | 63,963 | | | | 1,480,104 | |
Spectrum Brands Holdings, Inc. | | | 18,577 | | | | 1,741,594 | |
| | | | | | | | 3,221,698 | |
Energy — 6.62% | | | | | | | | |
CNX Resources Corp.(a) | | | 399,054 | | | | 5,830,180 | |
Enerplus Corp. | | | 403,541 | | | | 3,821,533 | |
EnerSys | | | 29,965 | | | | 2,398,399 | |
Murphy Oil Corp. | | | 94,145 | | | | 2,620,055 | |
Oil States International, Inc.(a) | | | 385,157 | | | | 2,334,051 | |
Whiting Petroleum Corp.(a) | | | 26,132 | | | | 1,701,977 | |
| | | | | | | | 18,706,195 | |
Financials — 22.46% | | | | | | | | |
Affiliated Managers Group, Inc. | | | 24,945 | | | | 4,187,767 | |
AllianceBernstein Holding LP | | | 57,780 | | | | 3,258,214 | |
Associated Banc-Corp. | | | 206,787 | | | | 4,607,214 | |
Axos Financial, Inc.(a) | | | 60,017 | | | | 3,180,901 | |
CNO Financial Group, Inc. | | | 187,328 | | | | 4,522,098 | |
F.N.B. Corp. | | | 307,671 | | | | 3,584,367 | |
COMMON STOCKS — (continued) | | | | |
Financials — (continued) | | | | |
Fulton Financial Corp. | | | 230,028 | | | $ | 3,703,451 | |
Hancock Whitney Corp. | | | 110,272 | | | | 5,456,258 | |
Lazard Ltd., Class A | | | 82,776 | | | | 4,055,196 | |
MGIC Investment Corp. | | | 316,860 | | | | 5,120,458 | |
New Residential Investment Corp. | | | 214,818 | | | | 2,440,332 | |
Old National Bancorp | | | 143,098 | | | | 2,444,114 | |
Radian Group, Inc. | | | 86,700 | | | | 2,069,529 | |
Umpqua Holdings Corp. | | | 180,497 | | | | 3,691,164 | |
Unum Group | | | 155,435 | | | | 3,958,929 | |
Washington Federal, Inc. | | | 72,374 | | | | 2,559,145 | |
WesBanco, Inc. | | | 66,720 | | �� | | 2,319,854 | |
Wintrust Financial Corp. | | | 26,891 | | | | 2,379,854 | |
| | | | | | | | 63,538,845 | |
Health Care — 4.50% | | | | | | | | |
Ironwood Pharmaceuticals, Inc., Class A(a) | | | 206,921 | | | | 2,642,381 | |
MEDNAX, Inc.(a) | | | 115,097 | | | | 3,134,091 | |
Prestige Consumer Healthcare, Inc.(a) | | | 38,725 | | | | 2,323,113 | |
Select Medical Holdings Corp. | | | 94,254 | | | | 3,131,118 | |
Varex Imaging Corp.(a) | | | 55,471 | | | | 1,489,396 | |
| | | | | | | | 12,720,099 | |
Industrials — 17.83% | | | | | | | | |
Advanced Energy Industries, Inc. | | | 35,914 | | | | 3,297,623 | |
AMN Healthcare Services, Inc.(a) | | | 40,752 | | | | 4,022,222 | |
ArcBest Corp. | | | 21,829 | | | | 1,961,336 | |
Crane Co. | | | 43,711 | | | | 4,514,471 | |
Curtiss-Wright Corp. | | | 22,904 | | | | 2,924,383 | |
DHT Holdings, Inc. | | | 297,631 | | | | 1,937,578 | |
EMCOR Group, Inc. | | | 47,101 | | | | 5,722,300 | |
GrafTech International Ltd. | | | 245,060 | | | | 2,622,142 | |
Hillenbrand, Inc. | | | 65,824 | | | | 2,992,359 | |
KBR, Inc. | | | 146,155 | | | | 6,202,819 | |
Kennametal, Inc. | | | 69,001 | | | | 2,742,790 | |
MasTec, Inc.(a) | | | 18,479 | | | | 1,647,033 | |
nVent Electric PLC | | | 79,679 | | | | 2,824,621 | |
Oshkosh Corp. | | | 17,540 | | | | 1,876,780 | |
See accompanying notes which are an integral part of these financial statements.
Annual Report
6
Foundry Partners Fundamental Small Cap Value Fund |
Schedule of Investments (Continued)
October 31, 2021
| | Shares | | | Fair Value | |
COMMON STOCKS — (continued) | | | | |
Industrials — (continued) | | | | |
Primoris Services Corp. | | | 87,378 | | | $ | 2,354,837 | |
Timken Co. (The) | | | 14,609 | | | | 1,036,509 | |
Werner Enterprises, Inc. | | | 38,057 | | | | 1,724,743 | |
| | | | | | | | 50,404,546 | |
Materials — 10.20% | | | | | | | | |
Alamos Gold, Inc., Class A | | | 421,755 | | | | 3,137,857 | |
Boise Cascade Co. | | | 18,484 | | | | 1,046,564 | |
Cabot Corp. | | | 45,950 | | | | 2,451,433 | |
Commercial Metals Co. | | | 81,108 | | | | 2,610,055 | |
Eagle Materials, Inc. | | | 35,607 | | | | 5,282,655 | |
Minerals Technologies, Inc. | | | 38,884 | | | | 2,758,431 | |
UFP Industries, Inc. | | | 59,533 | | | | 4,871,585 | |
Univar Solutions, Inc.(a) | | | 154,991 | | | | 3,964,669 | |
Worthington Industries, Inc. | | | 50,313 | | | | 2,733,003 | |
| | | | | | | | 28,856,252 | |
Real Estate — 7.88% | | | | | | | | |
Apple Hospitality REIT, Inc. | | | 110,356 | | | | 1,733,693 | |
CareTrust REIT, Inc. | | | 91,218 | | | | 1,892,774 | |
Highwoods Properties, Inc. | | | 51,897 | | | | 2,327,061 | |
Industrial Logistics Properties Trust | | | 53,341 | | | | 1,498,349 | |
Kite Realty Group Trust | | | 96,922 | | | | 1,967,517 | |
Lexington Realty Trust | | | 308,389 | | | | 4,493,227 | |
Piedmont Office Realty Trust, Inc., Class A | | | 130,340 | | | | 2,314,838 | |
PotlatchDeltic Corp. | | | 76,768 | | | | 4,012,663 | |
Retail Opportunity Investments Corp. | | | 114,757 | | | | 2,039,232 | |
| | | | | | | | 22,279,354 | |
Technology — 12.23% | | | | | | | | |
Avnet, Inc. | | | 82,372 | | | | 3,139,197 | |
CSG Systems International, Inc. | | | 52,766 | | | | 2,640,938 | |
Kulicke & Soffa Industries, Inc. | | | 54,085 | | | | 3,082,845 | |
Progress Software Corp. | | | 54,535 | | | | 2,803,644 | |
Sanmina Corp.(a) | | | 63,268 | | | | 2,388,367 | |
COMMON STOCKS — (continued) | | | | |
Technology — (continued) | | | | |
Science Applications International Corp. | | | 47,585 | | | $ | 4,272,182 | |
Tower Semiconductor Ltd.(a) | | | 105,797 | | | | 3,371,750 | |
TTM Technologies, Inc.(a) | | | 233,767 | | | | 3,095,075 | |
Ultra Clean Holdings, Inc.(a) | | | 86,477 | | | | 4,286,665 | |
Vishay Intertechnology, Inc. | | | 196,064 | | | | 3,768,350 | |
Xperi Holding Corp. | | | 96,602 | | | | 1,731,108 | |
| | | | | | | | 34,580,121 | |
Utilities — 1.56% | | | | | | | | |
National Fuel Gas Co. | | | 76,657 | | | | 4,402,412 | |
Total Common Stocks (Cost $218,246,934) | | | | | | | 275,560,844 | |
MONEY MARKET FUNDS — 2.66% | | | | |
Federated Hermes Government Obligations Fund, Institutional Class, 0.03%(b) | | | 7,523,681 | | | | 7,523,681 | |
Total Money Market Funds (Cost $7,523,681) | | | 7,523,681 | |
Total Investments — 100.11% (Cost $225,770,615) | | | 283,084,525 | |
Liabilities in Excess of Other Assets — (0.11)% | | | (310,954 | ) |
NET ASSETS — 100.00% | | $ | 282,773,571 | |
(a) | Non-income producing security. |
(b) | Rate disclosed is the seven day effective yield as of October 31, 2021. |
REIT | — Real Estate Investment Trust |
See accompanying notes which are an integral part of these financial statements.
Annual Report
7
Foundry Partners Fundamental Small Cap Value Fund |
Statement of Assets and Liabilities
October 31, 2021
Assets | | | | |
Investments in securities at fair value (cost $225,770,615) (Note 3) | | $ | 283,084,525 | |
Receivable for fund shares sold | | | 97,671 | |
Receivable for investments sold | | | 903,830 | |
Dividends receivable | | | 96,900 | |
Prepaid expenses | | | 21,050 | |
Total Assets | | | 284,203,976 | |
Liabilities | | | | |
Payable for fund shares redeemed | | | 63,047 | |
Payable for investments purchased | | | 1,099,480 | |
Payable to Adviser (Note 4) | | | 203,368 | |
Accrued distribution (12b-1) fees | | | 2,915 | |
Payable to Administrator (Note 4) | | | 23,151 | |
Payable to Trustees | | | 2,449 | |
Other accrued expenses | | | 35,995 | |
Total Liabilities | | | 1,430,405 | |
Net Assets | | $ | 282,773,571 | |
Net Assets consist of: | | | | |
Paid-in capital | | | 189,553,595 | |
Accumulated earnings | | | 93,219,976 | |
Net Assets | | $ | 282,773,571 | |
Investor Class: | | | | |
Net Assets | | $ | 13,785,066 | |
Shares outstanding | | | 527,047 | |
Net asset value, offering and redemption price per share (Note 2) | | $ | 26.16 | |
Institutional Class: | | | | |
Net Assets | | $ | 268,988,505 | |
Shares outstanding | | | 10,229,700 | |
Net asset value, offering and redemption price per share (Note 2) | | $ | 26.29 | |
See accompanying notes which are an integral part of these financial statements.
Annual Report
8
Foundry Partners Fundamental Small Cap Value Fund |
Statement of Operations
For the Year Ended October 31, 2021
Investment Income | | | | |
Dividend income (net of foreign taxes withheld of $9,250) | | $ | 5,048,145 | |
Total investment income | | | 5,048,145 | |
Expenses | | | | |
Investment Adviser fees (Note 4) | | | 2,348,141 | |
Administration and compliance services fees (Note 4) | | | 183,807 | |
Fund accounting fees (Note 4) | | | 63,754 | |
Registration expenses | | | 51,566 | |
Legal fees | | | 38,034 | |
Distribution (12b-1) fees, Investor Class | | | 36,725 | |
Custodian fees | | | 36,352 | |
Transfer agent fees (Note 4) | | | 23,000 | |
Audit and tax preparation fees | | | 17,960 | |
Printing and postage expenses | | | 15,631 | |
Trustee fees | | | 10,764 | |
Insurance expenses | | | 4,541 | |
Interest expense | | | 3,593 | |
Miscellaneous expenses | | | 40,024 | |
Net operating expenses | | | 2,873,892 | |
Net investment income | | | 2,174,253 | |
Net Realized and Change in Unrealized Gain (Loss) on Investments | | | | |
Net realized gain on investment securities transactions | | | 52,831,859 | |
Net realized loss on foreign currency transactions | | | | (17) |
Net change in unrealized appreciation of investment securities and foreign currency translations | | | 59,314,433 | |
Net realized and change in unrealized gain on investments | | | 112,146,258 | |
Net increase in net assets resulting from operations | | $ | 114,320,528 | |
See accompanying notes which are an integral part of these financial statements.
Annual Report
9
Foundry Partners Fundamental Small Cap Value Fund |
Statements of Changes in Net Assets
| | For the
Year Ended
October 31,
2021 | | | For the
Year Ended
October 31,
2020 | |
Increase (Decrease) in Net Assets due to: | | | | | | | | |
Operations | | | | | | | | |
Net investment income | | $ | 2,174,253 | | | $ | 2,155,399 | |
Net realized gain (loss) on investment securities transactions | | | 52,831,842 | | | | (17,339,383 | ) |
Net change in unrealized appreciation (depreciation) of investment securities | | | 59,314,433 | | | | (7,570,186 | ) |
Net increase (decrease) in net assets resulting from operations | | | 114,320,528 | | | | (22,754,170 | ) |
Distributions to Shareholders From Earnings (Note 2) | | | | | | | | |
Investor Class | | | (112,296 | ) | | | (729,182 | ) |
Institutional Class | | | (2,474,194 | ) | | | (6,664,011 | ) |
Total Distributions | | | (2,586,490 | ) | | | (7,393,193 | ) |
Capital Transactions - Investor Class | | | | | | | | |
Proceeds from shares sold | | | 637,375 | | | | 1,282,613 | |
Reinvestment of distributions | | | 111,081 | | | | 713,576 | |
Amount paid for shares redeemed | | | (5,758,180 | ) | | | (6,557,518 | ) |
Total Capital Transactions - Investor Class | | | (5,009,724 | ) | | | (4,561,329 | ) |
Capital Transactions - Institutional Class | | | | | | | | |
Proceeds from shares sold | | | 53,068,256 | | | | 65,160,727 | |
Reinvestment of distributions | | | 2,388,010 | | | | 6,436,461 | |
Amount paid for shares redeemed | | | (74,192,808 | ) | | | (36,751,011 | ) |
Total Capital Transactions - Institutional Class | | | (18,736,542 | ) | | | 34,846,177 | |
Net increase (decrease) in net assets resulting from capital transactions | | | (23,746,266 | ) | | | 30,284,848 | |
Total Increase in Net Assets | | | 87,987,772 | | | | 137,485 | |
Net Assets | | | | | | | | |
Beginning of year | | | 194,785,799 | | | | 194,648,314 | |
End of year | | $ | 282,773,571 | | | $ | 194,785,799 | |
See accompanying notes which are an integral part of these financial statements.
Annual Report
10
Foundry Partners Fundamental Small Cap Value Fund |
Statements of Changes in Net Assets (Continued)
| | For the
Year Ended
October 31,
2021 | | | For the
Year Ended
October 31,
2020 | |
Share Transactions - Investor Class | | | | | | | | |
Shares sold | | | 27,201 | | | | 75,419 | |
Shares issued in reinvestment of distributions | | | 5,359 | | | | 33,548 | |
Shares redeemed | | | (243,745 | ) | | | (395,063 | ) |
Total Share Transactions - Investor Class | | | (211,185 | ) | | | (286,096 | ) |
Share Transactions - Institutional Class | | | | | | | | |
Shares sold | | | 2,405,396 | | | | 4,355,311 | |
Shares issued in reinvestment of distributions | | | 114,864 | | | | 301,756 | |
Shares redeemed | | | (3,052,506 | ) | | | (2,299,683 | ) |
Total Share Transactions - Institutional Class | | | (532,246 | ) | | | 2,357,384 | |
See accompanying notes which are an integral part of these financial statements.
Annual Report
11
Foundry Partners Fundamental Small Cap Value Fund |
Investor Class Financial Highlights
(For a share outstanding during each year)
| | For the
Year Ended
October 31,
2021 | | | For the
Year Ended
October 31,
2020 | | | For the
Year Ended
October 31,
2019 | | | For the
Year Ended
October 31,
2018 | | | For the
Year Ended
October 31,
2017 | |
Selected Per Share Data | | | | | | | | | | | | | | | | | | | | |
Net asset value, beginning of year | | $ | 16.85 | | | $ | 20.55 | | | $ | 22.11 | | | $ | 24.32 | | | $ | 20.49 | |
| | | | | | | | | | | | | | | | | | | | | |
Investment operations: | | | | | | | | | | | | | | | | | | | | |
Net investment income | | | 0.17 | | | | 0.18 | | | | 0.25 | | | | 0.12 | | | | 0.05 | |
Net realized and unrealized gain (loss) on investments | | | 9.30 | | | | (3.15 | ) | | | (0.03 | ) | | | (1.52 | ) | | | 4.37 | |
Total from investment operations | | | 9.47 | | | | (2.97 | ) | | | 0.22 | | | | (1.40 | ) | | | 4.42 | |
| | | | | | | | | | | | | | | | | | | | | |
Less distributions to shareholders from: | | | | | | | | | | | | | | | | | | | | |
Net investment income | | | (0.16 | ) | | | (0.26 | ) | | | (0.08 | ) | | | (0.08 | ) | | | (0.13 | ) |
Net realized gains | | | — | | | | (0.47 | ) | | | (1.70 | ) | | | (0.73 | ) | | | (0.46 | ) |
Total distributions | | | (0.16 | ) | | | (0.73 | ) | | | (1.78 | ) | | | (0.81 | ) | | | (0.59 | ) |
| | | | | | | | | | | | | | | | | | | | | |
Net asset value, end of year | | $ | 26.16 | | | $ | 16.85 | | | $ | 20.55 | | | $ | 22.11 | | | $ | 24.32 | |
| | | | | | | | | | | | | | | | | | | | | |
Total Return(a) | | | 56.45% | | | | (15.17 | )% | | | 2.28% | | | | (6.02 | )% | | | 21.68% | |
| | | | | | | | | | | | | | | | | | | | | |
Ratios and Supplemental Data: | | | | | | | | | | | | | | | | | | | | |
Net assets, end of year (000 omitted) | | $ | 13,785 | | | $ | 12,443 | | | $ | 21,048 | | | $ | 25,715 | | | $ | 41,786 | |
Ratio of expenses to average net assets | | | 1.28% | | | | 1.32% | | | | 1.32% | | | | 1.31% | | | | 1.36% | |
Ratio of net investment income to average net assets | | | 0.56% | | | | 0.90% | | | | 1.15% | | | | 0.49% | | | | 0.22% | |
Portfolio turnover rate(b) | | | 72.73% | | | | 60.56% | | | | 47.17% | | | | 34.41% | | | | 28.16% | |
(a) | Total return represents the rate that the investor would have earned or lost on an investment in the Fund, assuming reinvestment of dividends. |
(b) | Portfolio turnover is calculated on the basis of the Fund as a whole without distinguishing among the classes of shares. |
See accompanying notes which are an integral part of these financial statements.
Annual Report
12
Foundry Partners Fundamental Small Cap Value Fund |
Institutional Class Financial Highlights
(For a share outstanding during each year)
| | For the
Year Ended
October 31,
2021 | | | For the
Year Ended
October 31,
2020 | | | For the
Year Ended
October 31,
2019 | | | For the
Year Ended
October 31,
2018 | | | For the
Year Ended
October 31,
2017 | |
Selected Per Share Data | | | | | | | | | | | | | | | | | | | | |
Net asset value, beginning of year | | $ | 16.94 | | | $ | 20.66 | | | $ | 22.24 | | | $ | 24.46 | | | $ | 20.60 | |
| | | | | | | | | | | | | | | | | | | | | |
Investment operations: | | | | | | | | | | | | | | | | | | | | |
Net investment income | | | 0.18 | | | | 0.21 | | | | 0.27 | | | | 0.18 | | | | 0.11 | |
Net realized and unrealized gain (loss) on investments | | | 9.38 | | | | (3.14 | ) | | | — | (a) | | | (1.53 | ) | | | 4.39 | |
Total from investment operations | | | 9.56 | | | | (2.93 | ) | | | 0.27 | | | | (1.35 | ) | | | 4.50 | |
| | | | | | | | | | | | | | | | | | | | | |
Less distributions to shareholders from: | | | | | | | | | | | | | | | | | | | | |
Net investment income | | | (0.21 | ) | | | (0.32 | ) | | | (0.15 | ) | | | (0.14 | ) | | | (0.18 | ) |
Net realized gains | | | — | | | | (0.47 | ) | | | (1.70 | ) | | | (0.73 | ) | | | (0.46 | ) |
Total distributions | | | (0.21 | ) | | | (0.79 | ) | | | (1.85 | ) | | | (0.87 | ) | | | (0.64 | ) |
| | | | | | | | | | | | | | | | | | | | | |
Net asset value, end of year | | $ | 26.29 | | | $ | 16.94 | | | $ | 20.66 | | | $ | 22.24 | | | $ | 24.46 | |
| | | | | | | | | | | | | | | | | | | | | |
Total Return(b) | | | 56.77% | | | | (14.97 | )% | | | 2.55% | | | | (5.78 | )% | | | 22.01% | |
| | | | | | | | | | | | | | | | | | | | | |
Ratios and Supplemental Data: | | | | | | | | | | | | | | | | | | | | |
Net assets, end of year (000 omitted) | | $ | 268,989 | | | $ | 182,343 | | | $ | 173,600 | | | $ | 157,758 | | | $ | 151,757 | |
Ratio of expenses to average net assets | | | 1.03% | | | | 1.07% | | | | 1.07% | | | | 1.06% | | | | 1.11% | |
Ratio of net investment income to average net assets | | | 0.80% | | | | 1.16% | | | | 1.34% | | | | 0.76% | | | | 0.45% | |
Portfolio turnover rate(c) | | | 72.73% | | | | 60.56% | | | | 47.17% | | | | 34.41% | | | | 28.16% | |
(a) | Rounds to less than $0.005 per share. |
(b) | Total return represents the rate that the investor would have earned or lost on an investment in the Fund, assuming reinvestment of dividends. |
(c) | Portfolio turnover is calculated on the basis of the Fund as a whole without distinguishing among the classes of shares. |
See accompanying notes which are an integral part of these financial statements.
Annual Report
13
Foundry Partners Fundamental Small Cap Value Fund |
Notes to the Financial Statements
October 31, 2021
NOTE 1. ORGANIZATION
The Foundry Partners Fundamental Small Cap Value Fund (the “Fund”) is registered under the Investment Company Act of 1940, as amended (“1940 Act”), as an open-end diversified series of Valued Advisers Trust (the “Trust”). The Trust is a management investment company established under the laws of Delaware by an Agreement and Declaration of Trust dated June 13, 2008 (the “Trust Agreement”). The Trust Agreement permits the Board of Trustees (the “Board”) to issue an unlimited number of shares of beneficial interest of separate series without par value. The Fund is one of a series of funds authorized by the Board. The Fund’s investment adviser is Foundry Partners, LLC (the “Adviser”). The investment objective of the Fund is long-term capital appreciation.
The Fund currently offers Investor Class shares and Institutional Class shares. Each share represents an equal proportionate interest in the assets and liabilities belonging to the applicable class of the Fund and is entitled to such dividends and distributions out of income belonging to the applicable class of the Fund as are declared by the Board. On matters that affect the Fund as a whole, each class has the same voting and other rights and preferences as any other class. On matters that affect only one class, only shareholders of that class may vote. The Fund may offer additional classes of shares in the future.
NOTE 2. SIGNIFICANT ACCOUNTING POLICIES
The Fund is an investment company and follows accounting and reporting guidance under Financial Accounting Standards Board Accounting Standards Codification (“ASC”) Topic 946, “Financial Services-Investment Companies.” The following is a summary of significant accounting policies followed by the Fund in the preparation of its financial statements. These policies are in conformity with generally accepted accounting principles in the United States of America (“GAAP”).
Estimates – The preparation of financial statements in conformity with GAAP requires management to make estimates and assumptions that affect the reported amounts of assets and liabilities and disclosure of contingent assets and liabilities at the date of the financial statements and the reported amounts of increases and decreases in net assets from operations during the reporting period. Actual results could differ from those estimates.
Federal Income Taxes – The Fund makes no provision for federal income or excise tax. The Fund has qualified and intends to qualify each year as a regulated investment company (“RIC”) under subchapter M of the Internal Revenue Code of 1986, as amended, by complying with the requirements applicable to RICs and by distributing substantially all of its taxable income. The Fund also intends to distribute sufficient net investment income and net realized capital gains, if any, so that it will not be subject to excise tax on undistributed income and gains. If the required amount of net investment income or gains is not distributed, the Fund could incur a tax expense.
Annual Report
14
As of and during the fiscal year ended October 31, 2021, the Fund did not have any liabilities for any unrecognized tax benefits. The Fund recognizes interest and penalties, if any, related to unrecognized tax benefits as income tax expense on the Statement of Operations when incurred. During the fiscal year ended October 31, 2021, the Fund did not incur any interest or penalties. Management of the Fund has reviewed tax positions taken in tax years that remain subject to examination by all major tax jurisdictions, including federal (i.e., the last three tax year ends and the interim tax period since then, as applicable). Management believes that there is no tax liability resulting from unrecognized tax benefits related to uncertain tax positions taken.
Expenses – Expenses incurred by the Trust that do not relate to a specific fund of the Trust are allocated to the individual funds based on each fund’s relative net assets or another appropriate basis (as determined by the Board). Expenses specifically attributable to any class are borne by that class. Income, realized gains and losses, unrealized appreciation and depreciation, and fund-wide expenses not allocated to a particular class shall be allocated to each class based on the net assets of that class in relation to the net assets of the entire fund.
Security Transactions and Related Income – The Fund follows industry practice and records security transactions on the trade date for financial reporting purposes. The specific identification method is used for determining gains or losses for financial statement and income tax purposes. Dividend income is recorded on the ex-dividend date. Non-cash income, if any, is recorded at the fair market value of the securities received. Withholding taxes on foreign dividends, if any, have been provided for in accordance with the Fund’s understanding of the applicable country’s tax rules and rates.
The Fund holds Real Estate Investment Trusts (“REITs”) which pay dividends to their shareholders based upon available funds from operations. It is possible for these dividends to exceed the REIT’s underlying taxable earnings and profits resulting in the excess portion of such dividends being designated as a return of capital. Distributions received from REITs that represent a return of capital or capital gains are recorded as a reduction of the cost of the REITs or as a realized gain, respectively.
Dividends and Distributions – The Fund intends to distribute its net investment income and net realized long-term and short-term capital gains, if any, at least annually. Dividends and distributions to shareholders, which are determined in accordance with income tax regulations, are recorded on the ex-dividend date. The treatment for financial reporting purposes of distributions made to shareholders during the period from net investment income or net realized capital gains may differ from their ultimate treatment for federal income tax purposes. These differences are caused primarily by differences in the timing of the recognition of certain components of income, expense or realized capital gain for federal income tax purposes. Where such differences are permanent in nature, they are reclassified among the components of net assets based on their ultimate characterization for federal income tax purposes. Any such reclassifications will have no effect on net assets, results of operations or net asset value (“NAV”) per share of the Fund.
Annual Report
15
Foundry Partners Fundamental Small Cap Value Fund |
Notes to the Financial Statements
October 31, 2021 (Continued)
For the fiscal year ended October 31, 2021, the Fund made the following reclassifications to increase (decrease) the components of net assets:
Paid-In
Capital | Accumulated
Earnings
(Deficit) |
$ (43,609) | $ 43,609 |
Share Valuation – The NAV is calculated each day the New York Stock Exchange (the “NYSE”) is open by dividing the total value of the Fund’s assets, less liabilities, by the number of shares outstanding for the Fund.
NOTE 3. SECURITIES VALUATION AND FAIR VALUE MEASUREMENTS
The Fund values its portfolio securities at fair value as of the close of regular trading on the NYSE (normally 4:00 p.m. Eastern time) on each business day the NYSE is open for business. Fair value is defined as the price that the Fund would receive upon selling an investment in a timely transaction to an independent buyer in the principal or most advantageous market of the investment. GAAP establishes a three-tier hierarchy to maximize the use of observable market data and minimize the use of unobservable inputs and to establish classification of fair value measurements for disclosure purposes.
Inputs refer broadly to the assumptions that market participants would use in pricing the asset or liability, including assumptions about risk (the risk inherent in a particular valuation technique used to measure fair value including a pricing model and/or the risk inherent in the inputs to the valuation technique). Inputs may be observable or unobservable. Observable inputs are inputs that reflect the assumptions market participants would use in pricing the asset or liability developed based on market data obtained and available from sources independent of the reporting entity. Unobservable inputs are inputs that reflect the reporting entity’s own assumptions about the assumptions market participants would use in pricing the asset or liability developed based on the best information available in the circumstances.
Various inputs are used in determining the value of the Fund’s investments. These inputs are summarized in the three broad levels listed below.
● | Level 1 – unadjusted quoted prices in active markets for identical investments and/or registered investment companies where the value per share is determined and published and is the basis for current transactions for identical assets or liabilities at the valuation date |
● | Level 2 – other significant observable inputs (including, but not limited to, quoted prices for an identical security in an inactive market, quoted prices for similar securities, interest rates, prepayment speeds, credit risk, etc.) |
Annual Report
16
● | Level 3 – significant unobservable inputs (including the Fund’s own assumptions in determining fair value of investments based on the best information available) |
The inputs used to measure fair value may fall into different levels of the fair value hierarchy. In such cases, for disclosure purposes, the level in the fair value hierarchy which is reported is determined based on the lowest level input that is significant to the fair value measurement in its entirety.
Equity securities that are traded on any stock exchange are generally valued at the last quoted sale price on the security’s primary exchange. Lacking a last sale price, an exchange-traded security is generally valued at its last bid price. Securities traded in the NASDAQ over-the-counter market are generally valued at the NASDAQ Official Closing Price. When using market quotations and when the market is considered active, the security is classified as a Level 1 security. In the event that market quotations are not readily available or are considered unreliable due to market or other events, the Fund values its securities and other assets at fair value in accordance with policies established by and under the general supervision of the Board. Under these policies, the securities will be classified as Level 2 or 3 within the fair value hierarchy, depending on the inputs used.
Investments in mutual funds, including money market mutual funds, are generally priced at the ending NAV. These securities are categorized as Level 1 securities.
In accordance with the Trust’s valuation policies, the Adviser is required to consider all appropriate factors relevant to the value of securities for which it has determined other pricing sources are not available or reliable as described above. No single method exists for determining fair value, because fair value depends upon the circumstances of each individual case. As a general principle, the current fair value of a security being valued by the Adviser would be the amount that the Fund might reasonably expect to receive upon the current sale. Methods that are in accordance with this principle may, for example, be based on (i) a multiple of earnings; (ii) a discount from market prices of a similar freely traded security (including a derivative security or a basket of securities traded on other markets, exchanges or among dealers); or (iii) yield to maturity with respect to debt issues, or a combination of these and other methods. Fair-value pricing is permitted if, in the Adviser’s opinion, the validity of market quotations appears to be questionable based on factors such as evidence of a thin market in the security based on a small number of quotations, a significant event occurs after the close of a market but before the Fund’s NAV calculation that may affect a security’s value, or the Adviser is aware of any other data that calls into question the reliability of market quotations.
Annual Report
17
Foundry Partners Fundamental Small Cap Value Fund |
Notes to the Financial Statements
October 31, 2021 (Continued)
The following is a summary of the inputs used to value the Fund’s investments as of October 31, 2021:
Valuation Inputs |
Assets | | Level 1 | | | Level 2 | | | Level 3 | | | Total | |
Common Stocks (a) | | $ | 275,560,844 | | | $ | — | | | $ | — | | | $ | 275,560,844 | |
Money Market Funds | | | 7,523,681 | | | | — | | | | — | | | | 7,523,681 | |
Total | | $ | 283,084,525 | | | $ | — | | | $ | — | | | $ | 283,084,525 | |
(a) | Refer to Schedule of Investments for sector classifications. |
The Fund did not hold any investments at the end of the reporting period for which significant unobservable inputs (Level 3) were used in determining fair value; therefore, no reconciliation of Level 3 securities is included for this reporting period.
NOTE 4. FEES AND OTHER TRANSACTIONS WITH AFFILIATES
Under the terms of the management agreement between the Trust and the Adviser for the Fund, the Adviser manages the Fund’s investments subject to oversight of the Board. As compensation for its management services, the Fund is obligated to pay the Adviser a fee computed and accrued daily and paid monthly at an annual rate of 0.85% of the average daily net assets of the Fund. For the fiscal year ended October 31, 2021, the Adviser earned a fee of $2,348,141 from the Fund. At October 31, 2021, the Fund owed the Adviser $203,368.
The Adviser has contractually agreed to waive its management fee and/or reimburse certain operating expenses, but only to the extent necessary so that the Fund’s net expenses, excluding brokerage fees and commissions, borrowing costs (such as interest expense and dividends on securities sold short), taxes, distribution and service (12b-1) fees, extraordinary expenses, and any indirect expenses (such as fees and expenses of acquired funds), do not exceed an annual rate of 1.25% of the average daily net assets of the Fund. The contractual agreement is effective through February 28, 2022. This contractual arrangement may only be terminated by mutual consent of the Adviser and the Board, and it will automatically terminate upon the termination of the investment advisory agreement between the Trust and the Adviser. Each waiver or reimbursement of an expense by the Adviser is subject to repayment by the Fund within the three years following the date of such waiver or reimbursement, provided that the Fund is able to make the repayment without exceeding the expense limitation in place at the time of the waiver or reimbursement, and the expense limitation in place at the time of the repayment. For the year ended October 31, 2021, the Adviser did not waive any fees from the Fund.
The Trust retains Ultimus Fund Solutions, LLC (“Ultimus” or the “Administrator”), to provide the Fund with administration and compliance, including a chief compliance officer, fund accounting and transfer agent services, including all regulatory reporting. For the fiscal year ended October
Annual Report
18
31, 2021, the Administrator earned fees of $183,807 for administrative and compliance services, $63,754 for fund accounting services, and $23,000 for transfer agent services. At October 31, 2021, the Administrator was owed $23,151 for administrative services.
The officers and one trustee of the Trust are members of management and/or employees of the Administrator and are not paid by the Trust for services to the Fund. Ultimus Fund Distributors, LLC (the “Distributor”), a wholly-owned subsidiary of Ultimus, acts as the distributor of the Fund’s shares. There were no payments made to the Distributor by the Fund for the fiscal year ended October 31, 2021.
The Fund has adopted a Distribution Plan (the “Plan”) pursuant to Rule 12b-1 under the 1940 Act. The Plan provides that the Fund will pay the Distributor or any registered securities dealer, financial institution or any other person (a “Recipient”) a fee aggregating at a rate of 0.25% of the average daily net assets of the Investor Class shares in connection with the promotion and distribution of the Fund’s shares or the provision of personal services to shareholders, including, but not necessarily limited to, advertising, compensation to underwriters, dealers and selling personnel; the printing and mailing of prospectuses to other than current Fund shareholders; the printing and mailing of sales literature; and servicing shareholder accounts. The Fund or the Adviser may pay all or a portion of these fees to any Recipient who renders assistance in distributing or promoting the sale of shares, or who provides certain shareholder services, pursuant to a written agreement. The Plan is a compensation plan, which means that compensation is paid regardless of 12b-1 expenses actually incurred. It is anticipated that the Plan will benefit shareholders because an effective sales program typically is necessary in order for the Fund to reach and maintain a sufficient size to achieve efficiently its investment objectives and to realize economies of scale. For the fiscal year ended October 31, 2021, the Investor Class shares 12b-1 expense incurred by the Fund was $36,725. The Fund owed $2,915 for Investor Class shares 12b-1 fees as of October 31, 2021.
NOTE 5. PURCHASES AND SALES OF SECURITIES
For the fiscal year ended October 31, 2021, purchases and sales of investment securities, other than short-term investments, were $194,332,714 and $220,907,310, respectively.
There were no purchases or sales of long-term U.S. government obligations during the fiscal year ended October 31, 2021.
Annual Report
19
Foundry Partners Fundamental Small Cap Value Fund |
Notes to the Financial Statements
October 31, 2021 (Continued)
NOTE 6. FEDERAL TAX INFORMATION
At October 31, 2021, the net unrealized appreciation (depreciation) and tax cost of investments for tax purposes was as follows:
Gross unrealized appreciation | | $ | 61,156,125 | |
Gross unrealized depreciation | | | (4,126,119 | ) |
Net unrealized appreciation on investments | | $ | 57,030,006 | |
Tax cost of investments | | $ | 226,054,519 | |
At October 31, 2021, the difference between book basis and tax basis unrealized appreciation (depreciation) is attributable to the tax deferral of losses on wash sales and partnership basis adjustments.
At October 31, 2021, the components of accumulated earnings (deficit) on a tax basis were as follows:
Undistributed ordinary income | | $ | 29,856,092 | |
Undistributed long-term capital gains | | | 6,333,878 | |
Unrealized appreciation on investments | | | 57,030,006 | |
Total accumulated earnings | | $ | 93,219,976 | |
The tax character of distributions paid for the fiscal years ended October 31, 2021 and October 31, 2020 were as follows:
| | 2021 | | | 2020 | |
Distributions paid from: | | | | | | | | |
Ordinary income(a) | | $ | 2,586,490 | | | $ | 3,057,636 | |
Long-term capital gains | | | — | | | | 4,335,557 | |
Total taxable distributions | | $ | 2,586,490 | | | $ | 7,393,193 | |
Total distributions paid | | $ | 2,586,490 | | | $ | 7,393,193 | |
(a) | For federal income tax purposes, distributions of short-term capital gains are treated as ordinary income distributions. |
Capital loss carryforwards are available to offset future realized capital gains and thereby reduce further taxable gain distributions. During the fiscal year ended October 31, 2021, the Fund utilized $17,193,806 of their capital loss carryforwards.
Annual Report
20
NOTE 7. OTHER MATTERS
In April 2014, New York based fashion company The Jones Group went private through a leveraged buyout (the “LBO”). In connection with the LBO, Jones Group paid out roughly $1.2 billion to its shareholders to buy back its outstanding stock at $15 per share. Four years later, Nine West Holdings, the company that emerged from the LBO, filed for bankruptcy under Chapter 11. After Nine West’s Chapter 11 plan was confirmed, the Trustee of a Litigation Trust formed under the plan, together with the Indenture Trustee for certain notes issued by Jones Group/Nine West, commenced a series of lawsuits against the former Jones Group shareholders who tendered their shares in the LBO, including the Fund. The plaintiffs in these suits seek to unwind the stock repurchase transactions that were part of the LBO on the grounds that they constitute fraudulent conveyances under the Bankruptcy Code and state law and to recover the amounts paid to the former Jones Group shareholders. Plaintiffs allege that the Fund received $1,209,420 for its shares in the LBO and seek to claw back those funds as part of the lawsuit.
On August 27, 2020, the Southern District of New York dismissed all fraudulent conveyance and unjust enrichment claims with respect to the payments made to stockholders in connection with the LBO, including the payments made to the Fund, on the basis that the transaction qualified for protection under the safe harbor provided for in Section 546(e) of the Bankruptcy Code. As part of the ruling, all claims against the Fund were dismissed and judgment was entered in its favor. The Trustee has appealed the ruling, and the matter is now pending before the United States Court of Appeals for the Second Circuit.
NOTE 8. COMMITMENTS AND CONTINGENCIES
The Trust indemnifies its officers and Trustees for certain liabilities that may arise from their performance of their duties to the Trust or the Fund. Additionally, in the normal course of business, the Trust enters into contracts that contain a variety of representations and warranties which provide general indemnifications. The Trust’s maximum exposure under these arrangements is unknown, as this would involve future claims that may be made against the Trust that have not yet occurred.
NOTE 9. SUBSEQUENT EVENTS
Management of the Fund has evaluated the need for disclosures and/or adjustments resulting from subsequent events through the date at which these financial statements were issued. Based upon this evaluation, management has determined there were no items requiring adjustment of the financial statements or additional disclosure.
Annual Report
21
Report of Independent Registered Public Accounting Firm |
To the Shareholders of Foundry Partners Fundamental Small Cap Value Fund and
Board of Trustees of Valued Advisers Trust
Opinion on the Financial Statements
We have audited the accompanying statement of assets and liabilities, including the schedule of investments, of Foundry Partners Fundamental Small Cap Value Fund (the “Fund”), a series of Valued Advisers Trust, as of October 31, 2021, the related statement of operations for the year then ended, the statements of changes in net assets for each of the two years in the period then ended, the related notes, and the financial highlights for each of the five years in the period then ended (collectively referred to as the “financial statements”). In our opinion, the financial statements present fairly, in all material respects, the financial position of the Fund as of October 31, 2021, the results of its operations for the year then ended, the changes in net assets for each of the two years in the period then ended, and the financial highlights for each of the five years in the period then ended, in conformity with accounting principles generally accepted in the United States of America.
Basis for Opinion
These financial statements are the responsibility of the Fund’s management. Our responsibility is to express an opinion on the Fund’s financial statements based on our audits. We are a public accounting firm registered with the Public Company Accounting Oversight Board (United States) (“PCAOB”) and are required to be independent with respect to the Fund in accordance with the U.S. federal securities laws and the applicable rules and regulations of the Securities and Exchange Commission and the PCAOB.
We conducted our audits in accordance with the standards of the PCAOB. Those standards require that we plan and perform the audit to obtain reasonable assurance about whether the financial statements are free of material misstatement, whether due to error or fraud.
Our audits included performing procedures to assess the risks of material misstatement of the financial statements, whether due to error or fraud, and performing procedures that respond to those risks. Such procedures included examining, on a test basis, evidence regarding the amounts and disclosures in the financial statements. Our procedures included confirmation of securities owned as of October 31, 2021, by correspondence with the custodian and brokers; when replies were not received from brokers, we performed other auditing procedures. Our audits also included evaluating the accounting principles used and significant estimates made by management, as well as evaluating the overall presentation of the financial statements. We believe that our audits provide a reasonable basis for our opinion.
We have served as the Fund’s auditor since 2006.
COHEN & COMPANY, LTD.
Cleveland, Ohio
December 28, 2021
Annual Report
22
Summary of Fund Expenses (Unaudited) |
As a shareholder of the Fund, you incur two types of costs: (1) transaction and (2) ongoing costs, including management fees and other Fund expenses. These examples are intended to help you understand your ongoing costs (in dollars) of investing in the Fund and to compare these costs with the ongoing costs of investing in other mutual funds. The example is based on an investment of $1,000 invested at the beginning of the period and held for the entire period from May 1, 2021 through October 31, 2021.
Actual Expenses
The first line of the table for each class provides information about actual account values and actual expenses. You may use the information in these lines, together with the amount you invested, to estimate the expenses that you paid over the period. Simply divide your account value by $1,000 (for example, an $8,600 account value divided by $1,000 = 8.60), then multiply the result by the number in the first line under the heading “Expenses Paid During Period” to estimate the expenses you paid on your account during this period.
Hypothetical Example for Comparison Purposes
The second line of the table for each class provides information about hypothetical account values and hypothetical expenses based on the Fund’s actual expense ratios and an assumed rate of return of 5% per year before expenses, which is not the Fund’s actual return. The hypothetical account values and expenses may not be used to estimate the actual ending account balances or expenses you paid for the period. You may use this information to compare the ongoing costs of investing in the Fund and other funds. To do so, compare this 5% hypothetical example with the 5% hypothetical examples that appear in the shareholder reports of other funds.
Expenses shown in the table are meant to highlight your ongoing costs only and do not reflect any transactional costs. Therefore, the second line of the table for each class is useful in comparing ongoing costs only and will not help you determine the relative total costs of owning different funds. In addition, if transaction costs were included, your costs would have been higher.
|
| Beginning
Account
Value
May 1, 2021 | Ending
Account
Value
October 31, 2021 | Expenses
Paid
During
Period(a) | Annualized
Expense
Ratio |
Foundry Partners Fundamental Small Cap Value Fund |
Investor Class | Actual | $1,000.00 | $1,005.80 | $6.47 | 1.28% |
| | Hypothetical (b) | $1,000.00 | $1,018.75 | $6.51 | 1.28% |
Institutional Class | Actual | $1,000.00 | $1,006.90 | $5.22 | 1.03% |
| | Hypothetical (b) | $1,000.00 | $1,020.00 | $5.26 | 1.03% |
(a) | Expenses are equal to the Fund’s annualized expense ratios, multiplied by the average account value over the period, multiplied by 184/365 (to reflect the one-half year period). |
(b) | Hypothetical assumes 5% annual return before expenses. |
Annual Report
23
Additional Federal Income Tax Information (Unaudited) |
The Form 1099-DIV you receive in January 2022 will show the tax status of all distributions paid to your account in calendar year 2021. Shareholders are advised to consult their own tax adviser with respect to the tax consequences of their investment in the Fund. As required by the Internal Revenue Code and/or regulations, shareholders must be notified regarding the status of qualified dividend income for individuals and the dividends received deduction for corporations.
Qualified Dividend Income. The Fund designates approximately 70.4% or up to the maximum amount of such dividends allowable pursuant to the Internal Revenue Code, as qualified dividend income eligible for a reduced tax rate.
Qualified Business Income. The Fund designates approximately 0.3% of its ordinary income dividends, or up to the maximum amount of such dividends allowable pursuant to the Internal Revenue Code, as qualified business income.
Dividends Received Deduction. Corporate shareholders are generally entitled to take the dividends received deduction on the portion of the Fund’s dividend distribution that qualifies under tax law. For the Fund’s calendar year 2021 ordinary income dividends, 70.5% qualifies for the corporate dividends received deduction.
For the year ended October 31, 2021, the Fund designated $— as long-term capital gain distributions.
Liquidity Risk Management Program (Unaudited) |
Valued Advisers Trust has adopted and implemented a written liquidity risk management program as required by Rule 22e-4 (the “Liquidity Rule”) under the Investment Company Act. The program is reasonably designed to assess and manage the Fund’s liquidity risk, taking into consideration, among other factors, the Fund’s investment strategy and the liquidity of its portfolio investments during normal and reasonably foreseeable stressed conditions; its short and long-term cash flow projections; and its cash holdings and access to other funding sources. The Board of Trustees approved the appointment of a Liquidity Administrator Committee, which includes representatives from Foundry Partners, LLC, the Fund’s investment adviser, and Ultimus Fund Solutions, LLC, the Fund’s Administrator. The Liquidity Administrator Committee is responsible for the program’s administration and oversight and for reporting to the Board on at least an annual basis regarding the program’s operation and effectiveness. The Liquidity Administrator Committee updated its assessment of the Fund’s liquidity risk profile, considering additional data gathered during the period June 1, 2020 through May 31, 2021 (the “Review Period”) and the adequacy and effectiveness of the liquidity risk management program’s operations during the Review Period in order to prepare a written report for the Board of Trustees (the “Report”) for consideration at its meeting held on September 1, 2021. The Report noted that during the Review Period the Fund did not experience unusual stress or disruption to its operations related to purchase and redemption activity. It further noted that during the Review Period the Fund held adequate levels of cash and highly liquid investments to meet shareholder redemption activities in accordance with applicable requirements. The Report concluded that (i) the Trust’s liquidity risk management program is reasonably designed to prevent violations of the Liquidity Rule and (ii) the Trust’s liquidity risk management program had been effectively implemented during the Review Period.
Annual Report
24
Trustees and Officers (Unaudited) |
The Board of Trustees supervises the business activities of the Trust. Each Trustee serves as a trustee until termination of the Trust unless the Trustee dies, resigns, retires or is removed.
The following table provides information regarding each of the Independent Trustees.
Name, Address*, (Age), Position with Trust**,
Term of Position with Trust | Principal Occupation During
Past 5 Years and Other Directorships | Other Directorships |
Andrea N. Mullins, (54)
Independent Trustee Since December 2013 Chairperson since March 2017 | Current: Private investor; Independent Contractor, SWM Advisors (since April 2014). | Trustee, Angel Oak Funds Trust (since February 2019) (5 portfolios); Trustee, Angel Oak Strategic Credit Fund (since December 2019); Trustee, Angel Oak Financial Strategies Income Term Trust (since May 2019); Trustee, Angel Oak Dynamic Financial Strategies Income Term Trust (since June 2020); Trustee, Angel Oak Credit Opportunities Term Trust (since January 2021); Trustee and Audit Committee Chair, Cushing Mutual Funds Trust (since November 2021) (2 portfolios); Trustee and Audit Committee Chair, Cushing NextGen Infrastructure Income Fund (since November 2021); Trustee and Audit Committee Chair, Cushing MLP & Infrastructure Fund (Since November 2021). |
Annual Report
25
Trustees and Officers (Unaudited) (Continued) |
Name, Address*, (Age), Position with Trust**,
Term of Position with Trust | Principal Occupation During
Past 5 Years and Other Directorships | Other Directorships |
Ira P. Cohen, (62)
Independent Trustee Since June 2010 | Current: Independent financial services consultant (since February 2005); Executive Vice President of Asset Management Services, Recognos Financial (since August 2015). | Trustee and Audit Committee Chairman, Griffin Institutional Access Credit Fund (since January 2017); Trustee and Audit Committee Chairman, Griffin Institutional Access Real Estate Fund (since May 2014); Trustee, Angel Oak Funds Trust (since October 2014) (5 portfolios); Trustee, Chairman, and Nominating and Governance Committee Chairman, Angel Oak Strategic Credit Fund (since December 2017); Trustee, U.S. Fixed Income Trust (since March 2019); Trustee and Chairman, Angel Oak Financial Strategies Income Term Trust (since May 2019); Trustee, Angel Oak Dynamic Financial Strategies Income Term Trust (since June 2020); Trustee, Angel Oak Credit Opportunities Term Trust (since January 2021). |
* | The address for each Trustee is 225 Pictoria Drive, Suite 450, Cincinnati, Ohio 45246. |
** | As of the date of this report, the Trust consists of 13 series. |
Annual Report
26
The following table provides information regarding the Trustee who is considered an “interested person” of the Trust, as that term is defined under the 1940 Act. Based on the experience of the Trustee, the Trust concluded that the individual described below should serve as a Trustee.
Name, Address*, (Age),
Position with Trust**,
Term of Position with Trust | Principal Occupation During
Past 5 Years and Other Directorships | Other Directorships |
Mark J. Seger***, (59)
Trustee Since March 2017 | Current: Vice Chairman and Co-Founder, Ultimus Fund Solutions, LLC and its subsidiaries (since 1999). | None. |
* | The address for each Trustee is 225 Pictoria Drive, Suite 450, Cincinnati, Ohio 45246. |
** | As of the date of this report, the Trust consists of 13 series. |
*** | Mr. Seger is considered an “interested person” of the Trust because of his relationship with the Trust’s administrator, transfer agent, and distributor. |
The following table provides information regarding the Officers of the Trust:
Name, Address*, (Age), Position with Trust**,
Term of Position with Trust | Principal Occupation During
Past 5 Years | Other Directorships |
Adam T. Kornegay, (36)
Principal Executive Officer and President Since April 2018 | Current: Vice President, Business Development Director, Ultimus Fund Solutions, LLC (since March 2015). | None. |
Zachary P. Richmond, (41)
Chief Financial Officer and Treasurer Since September 2021 | Current: Vice President, Financial Administration, Ultimus Fund Solutions, LLC (February 2019 to present). Previous: Assistant Vice President, Associate Director of Financial Administration, Ultimus Fund Solutions, LLC (December 2015 to February 2019). | None. |
Kevin J. Patton, (51)
Chief Compliance Officer Since March 2020 | Current: Assistant Vice President, Compliance Officer, Ultimus Fund Solutions, LLC (since January 2020). Previous: Partner and Chief Compliance Officer, Renaissance Investment Management (August 2005 to January 2020). | None. |
Annual Report
27
Trustees and Officers (Unaudited) (Continued) |
Name, Address*, (Age), Position with Trust**,
Term of Position with Trust | Principal Occupation During
Past 5 Years | Other Directorships |
Carol J. Highsmith, (57)
Vice President Since August 2008 Secretary Since March 2014 | Current: Vice President, Ultimus Fund Solutions, LLC (since December 2015). | None. |
Matt J. Miller, (45)
Vice President Since December 2011 | Current: Assistant Vice President, Relationship Management, Ultimus Fund Solutions, LLC (since December 2015). | None. |
Stephen L. Preston, (55)
AML Officer Since June 2017 | Current: Chief Compliance Officer, Ultimus Fund Distributors, LLC (since June 2011). Previous: Chief Compliance Officer, Ultimus Fund Solutions, LLC (June 2011 to August 2019); Chief Compliance Officer, Unified Financial Securities, LLC (April 2018 to December 2019). | None. |
* | The address for each Officer is 225 Pictoria Drive, Suite 450, Cincinnati, Ohio 45246. |
** | As of the date of this report, the Trust consists of 13 series. |
Other Information (Unaudited)
The Fund’s Statement of Additional Information (“SAI”) includes additional information about the trustees and is available without charge, upon request. You may call toll-free at (800) 247-1014 to request a copy of the SAI or to make shareholder inquiries.
Annual Report
28
Investment Advisory Agreement Approval (Unaudited) |
At a meeting held on June 2-3, 2021, the Board of Trustees (the “Board”) considered the renewal of the Investment Advisory Agreement (the “Foundry Agreement”) between Valued Advisers Trust (the “Trust”) and Foundry Partners, LLC (“Foundry”) with respect to the Foundry Partners Fundamental Small Cap Value Fund (the “Foundry Fund”). Foundry provided written information to the Board to assist the Board in its considerations.
Counsel reminded the Trustees of their fiduciary duties and responsibilities, including the factors to be considered, and the application of those factors to Foundry. In assessing the factors and reaching its decision, the Board took into consideration information furnished by Foundry and the Trust’s other service providers for the Board’s review and consideration throughout the year at regular Board meetings, as well as information specifically prepared or presented in connection with the annual renewal process, including information presented at the meeting. The Board requested and was provided with, and reflected on, information and reports relevant to the annual renewal of the Foundry Agreement, including: (i) reports regarding the services and support provided to the Foundry Fund by Foundry; (ii) quarterly assessments of the investment performance of the Foundry Fund by personnel of Foundry; (iii) commentary on the reasons for the performance; (iv) presentations by Foundry addressing its investment philosophy, investment strategy, personnel, and operations; (v) compliance and audit reports concerning the Foundry Fund and Foundry; (vi) disclosure information contained in the Trust’s registration statement and Foundry’s Form ADV; and (vii) a memorandum from counsel, that summarized the fiduciary duties and responsibilities of the Board in considering and approving the Foundry Agreement. The Board also requested and received various informational materials including, without limitation: (a) documents containing information about Foundry, including its financial information; a description of its personnel and services it provides to the Foundry Fund; information on Foundry’s investment advice and performance; summaries of Foundry Fund expenses, compliance program, current legal matters, and other general information; (b) comparative expense and performance information for other mutual funds with strategies similar to the Foundry Fund; and (c) the benefits to be realized by Foundry from its relationship with the Foundry Fund. The Board did not identify any particular information that was most relevant to its consideration of the Foundry Agreement and each Trustee may have afforded different weight to the various Factors.
| | 1. | The nature, extent, and quality of the services to be provided by Foundry. The Board considered Foundry’s responsibilities under the Foundry Agreement. The Trustees considered the services being provided by Foundry to the Foundry Fund including, without limitation: the quality of its investment advisory services (including research and recommendations with respect to portfolio securities), its process for formulating investment recommendations and assuring compliance with the Foundry Fund’s investment objectives and limitations, its coordination of services for the Foundry Fund among the Foundry Fund’s service providers, and its efforts to promote the Foundry Fund and grow its assets. The Trustees considered Foundry’s continuity of, and commitment to retain qualified personnel, commitment to maintain and enhance its resources and systems, and options that allow the Foundry Fund to maintain its goals, and Foundry’s continued cooperation with the Board and counsel for the Foundry Fund. The Trustees |
Annual Report
29
Investment Advisory Agreement Approval (Unaudited) (Continued) |
considered Foundry’s personnel, including their education and experience. After considering the foregoing information and further information in the Meeting materials provided by Foundry, the Board concluded that, in light of all the facts and circumstances, the nature, extent, and quality of the services provided by Foundry were satisfactory and adequate for the Foundry Fund.
| | 2. | Investment Performance of the Foundry Fund and Foundry. The Trustees compared the performance of the Foundry Fund with the performance of funds in a peer group with similar objectives managed by other investment advisers, as well as with aggregated Morningstar category data, and with the performance of the Foundry Fund’s benchmark. The Trustees also considered the consistency of Foundry’s management of the Foundry Fund with its investment objectives, strategies, and limitations. The Trustees acknowledged that Foundry has served as adviser to the Foundry Fund only since June of 2016, but one portfolio manager has managed the portfolio since 2006 and the other since 2010. The Trustees noted that the Foundry Fund had underperformed as compared to its benchmark for the one-year, three-year and five-year periods ended March 31, 2021, and performed almost the same as the benchmark for the period since inception of the Foundry Fund. They also noted that the Foundry Fund had underperformed as compared to the average and median of its custom Morningstar category for the one-year, three-year, five-year, and ten-year periods ended March 31, 2021. In comparing the Foundry Fund’s performance to that of its custom peer group, the Board noted that the Foundry Fund performed below the median for the one-year and three-year periods ended March 31, 2021, and above the median for the five-year and since inception periods. The Board reviewed the performance of Foundry in managing separate accounts with investment strategies similar to that of the Foundry Fund and observed that the Foundry Fund’s performance was very comparable. The Trustees took into consideration discussions with representatives of Foundry regarding the reasons for the performance of the Foundry Fund. After further reviewing and discussing these and other relevant factors, the Board concluded, in light of all the facts and circumstances, that the investment performance of the Foundry Fund and Foundry was satisfactory. |
| | 3. | The costs of the services to be provided and profits to be realized by Foundry from the relationship with the Foundry Fund. The Trustees considered: (1) Foundry’s financial condition; (2) the asset level of the Foundry Fund; (3) the overall expenses of the Foundry Fund; and (4) the nature and frequency of management fee payments. The Trustees reviewed information provided by Foundry regarding its profits associated with managing the Foundry Fund, noting that Foundry is not currently waiving any of its management fee. The Trustees also considered potential benefits for Foundry in managing the Foundry Fund. The Trustees then compared the fees and expenses of the Foundry Fund (including the management fee) to other comparable mutual funds. The Trustees noted that the Foundry Fund’s management fee was higher than the average and median of its peer group, and that the net expense ratio was higher than the peer group average and median. They noted that the Foundry Fund’s management fee was higher than the average and median of funds in its custom Morningstar category, and that the Foundry Fund’s net |
Annual Report
30
expense ratio was also higher than the average and median. The Board noted that the fees that Foundry assesses for separate account clients that have strategies similar to that of the Foundry Fund could be comparable or lower and they expressed the view that the reasons for such differences were acceptable and reasonable. Based on the foregoing, the Board concluded that the fees to be paid to Foundry by the Foundry Fund and the profits to be realized by Foundry, in light of all the facts and circumstances, were fair and reasonable in relation to the nature and quality of the services provided by Foundry.
| | 4. | The extent to which economies of scale would be realized as the Foundry Fund grows and whether advisory fee levels reflect these economies of scale for the benefit of the Foundry Fund’s investors. The Board considered the Foundry Fund’s fee arrangements with Foundry. The Board considered that while the management fee remained the same at all asset levels, the Foundry Fund’s shareholders could experience benefits from the Foundry Fund’s expense limitation arrangement if asset levels fell and/or expenses increased. The Trustees noted that although the Foundry Fund’s expenses currently fell below the cap set by the arrangement, the shareholders would continue to benefit from economies of scale under the Foundry Fund’s arrangements with other service providers to the Foundry Fund, and the Trustees attributed this benefit, in part, to the direct and indirect efforts of Foundry to ensure that a cost structure was in place that was beneficial for the Foundry Fund as it grew. In light of its ongoing consideration of the Foundry Fund’s asset and fees levels and expectations for growth, the Board determined that the Foundry Fund’s fee arrangements, in light of all the facts and circumstances, were fair and reasonable in relation to the nature and quality of the services provided by Foundry. |
| | 5. | Possible conflicts of interest and benefits to Foundry. In considering Foundry’s practices regarding conflicts of interest, the Trustees evaluated the potential for conflicts of interest and considered such matters as the experience and ability of the advisory personnel assigned to the Foundry Fund; the basis of decisions to buy or sell securities for the Foundry Fund and/or Foundry’s other accounts; and the substance and administration of Foundry’s code of ethics. The Trustees also considered disclosure in the registration statement of the Trust relating to Foundry’s potential conflicts of interest. The Trustees noted that Foundry may utilize soft dollars and the Trustees noted Foundry’s policies and processes for managing the conflicts of interest that could arise from soft dollar arrangements. The Trustees noted other potential benefits to Foundry, including the fact that the Foundry Fund could provide an attractive vehicle for smaller accounts, which may increase the total assets under management by Foundry. Based on the foregoing, the Board determined that the standards and practices of Foundry relating to the identification and mitigation of potential conflicts of interest and the benefits to be realized by Foundry in managing the Foundry Fund were satisfactory. |
After additional consideration of the factors discussed by counsel and further discussion among the Board members, the Board determined to approve the continuation of the Foundry Agreement.
Annual Report
31
Valued Advisers Trust Privacy Policy |
FACTS | WHAT DOES Foundry Partners Fundamental Small Cap Value Fund (the “Fund”) DO WITH YOUR PERSONAL INFORMATION? |
| | |
Why? | Financial companies choose how they share your personal information. Federal law gives consumers the right to limit some but not all sharing. Federal law also requires us to tell you how we collect, share, and protect your personal information. Please read this notice carefully to understand what we do. |
| | |
What? | The types of personal information we collect and share depend on the product or service you have with us. This information can include: ■ Social Security number ■ account balances and account transactions ■ transaction or loss history and purchase history ■ checking account information and wire transfer instructions When you are no longer our customer, we continue to share your information as described in this notice. |
| | |
How? | All financial companies need to share customers’ personal information to run their everyday business. In the section below, we list the reasons financial companies can share their customers’ personal information; the reasons the Fund chooses to share; and whether you can limit this sharing. |
Reasons we can share your personal information | Does the Fund share? |
For our everyday business purposes—
such as to process your transactions, maintain your account(s), respond to court orders and legal investigations, or report to credit bureaus | Yes |
For our marketing purposes—
to offer our products and services to you | No |
For joint marketing with other financial companies | No |
For our affiliates’ everyday business purposes—
information about your transactions and experiences | No |
For our affiliates’ everyday business purposes—
information about your creditworthiness | No |
For nonaffiliates to market to you | No |
Questions? | Call (800) 247-1014 |
Who we are |
Who is providing this notice? | Foundry Partners Fundamental Small Cap Value Fund
Ultimus Fund Distributors, LLC (Distributor)
Ultimus Fund Solutions, LLC (Administrator) |
| | |
What we do |
How does the Fund protect my personal information? | To protect your personal information from unauthorized access and use, we use security measures that comply with federal law. These measures include computer safeguards and secured files and buildings. Our service providers are held accountable for adhering to strict policies and procedures to prevent any misuse of your nonpublic personal information. |
How does the Fund collect my personal information? | We collect your personal information, for example, when you ■ open an account or deposit money ■ buy securities from us or sell securities to us ■ make deposits or withdrawals from your account ■ give us your account information ■ make a wire transfer ■ tell us who receives the money ■ tell us where to send the money ■ show your government-issued ID ■ show your driver’s license |
Why can’t I limit all sharing? | Federal law gives you the right to limit only ■ sharing for affiliates’ everyday business purposes—information about your creditworthiness ■ affiliates from using your information to market to you ■ sharing for nonaffiliates to market to you State laws and individual companies may give you additional rights to limit sharing. |
Definitions |
Affiliates | Companies related by common ownership or control. They can be financial and nonfinancial companies. ■ Foundry Partners, LLC, the investment adviser to the Fund, could be deemed to be an affiliate. |
Nonaffiliates | Companies not related by common ownership or control. They can be financial and nonfinancial companies. ■ The Fund does not share your personal information with nonaffiliates so they can market to you. |
Joint marketing | A formal agreement between nonaffiliated financial companies that together market financial products or services to you. ■ The Fund doesn’t jointly market. |
PROXY VOTING
A description of the policies and procedures that the Fund uses to determine how to vote proxies relating to portfolio securities and information regarding how the Fund voted those proxies during the most recent twelve month period ended June 30, are available (1) without charge upon request by calling the Fund at (800) 247-1014 and (2) in Fund documents filed with the Securities and Exchange Commission (“SEC”) on the SEC’s website at www.sec.gov.
TRUSTEES
Andrea N. Mullins, Chairperson
Ira P. Cohen
Mark J. Seger
OFFICERS
Adam T. Kornegay, Principal Executive Officer and President
Zachary P. Richmond, Principal Financial Officer and Treasurer
Kevin J. Patton, Chief Compliance Officer
Carol J. Highsmith, Vice President and Secretary
INVESTMENT ADVISER
Foundry Partners, LLC
323 Washington Avenue North, Suite 360
Minneapolis, MN 55401
DISTRIBUTOR
Ultimus Fund Distributors, LLC
225 Pictoria Drive, Suite 450
Cincinnati, OH 45246
INDEPENDENT REGISTERED PUBLIC ACCOUNTING FIRM
Cohen & Company, Ltd.
1350 Euclid Avenue, Suite 800
Cleveland, OH 44115
LEGAL COUNSEL
Troutman Pepper Hamilton Sanders LLP
3000 Two Logan Square
18th and Arch Streets
Philadelphia, PA 19103
CUSTODIAN
Huntington National Bank
41 South High Street
Columbus, OH 43215
ADMINISTRATOR, TRANSFER AGENT AND FUND ACCOUNTANT
Ultimus Fund Solutions, LLC
225 Pictoria Drive, Suite 450
Cincinnati, OH 45246
This report is intended only for the information of shareholders or those who have received the Fund’s prospectus which contains information about the Fund’s management fee and expenses. Please read the prospectus carefully before investing.
Distributed by Ultimus Fund Distributors, LLC
Member FINRA/SIPC
Foundry-AR-21

Annual Report
October 31, 2021
Fund Adviser:
Kovitz Investment Group Partners, LLC
71 S. Wacker Drive, Suite 1860
Chicago, IL 60606
Toll Free (888) 695-3729
MANAGEMENT DISCUSSION & ANALYSIS – (UNAUDITED)
Kovitz Investment Group launched the Green Owl Intrinsic Value Fund (the Fund) with the goal of seeking long-term capital appreciation through high risk-adjusted returns. To accomplish this, Fund management implements a fundamental, research-driven process, in order to build a diversified portfolio of equity investments through the purchase of competitively advantaged and financially strong companies at prices substantially less than our estimate of their intrinsic values.
We remain focused on the careful and patient application of our investment criteria and valuation requirements. Our bottom-up research emphasizes business quality, industry structures, growth opportunities, management skill and corporate culture. It is further augmented by our assessment of the company’s ability to sustain earnings power over the long haul through an understanding of its competitive advantages and management’s proficiency in the allocation of capital. We use absolute, rather than relative, methods to estimate companies’ intrinsic values and we use the movement of market prices around these intrinsic value estimates to construct and manage a portfolio of high-quality businesses that we believe have the potential to create sustained shareholder value over many years.
MARKET AND PERFORMANCE SUMMARY
For the fiscal year 2021 (November 1, 2020 through October 31, 2021), the Fund returned 51.56%. In comparison, our benchmark, the S&P 500 Index, gained 42.91% during the same period. Since inception on December 27, 2011, the Fund has compounded at a rate of 14.10% annually, versus 16.32% annually for the S&P 500 over the same time period.
The speed and magnitude of the equity market’s recovery from the pandemic-induced lows of March 2020 has been nothing short of remarkable. Since that time, the S&P 500 has almost doubled– the fastest such gain since World War II. So far in 2021, the S&P 500 has closed at a record-high 60 times- the most by this point in the year since 1964.
Despite these impressive statistics (or, maybe because of them), much of the conventional thinking about the equity markets remains solidly bullish. Among the optimistic beliefs underlying this thinking are: 1) A thriving U.S. economy, which is turbocharging corporate profits, will continue for the foreseeable future. For instance, during the second-quarter earnings season, nearly 90% of companies exceeded analyst forecasts – the highest such level of “beats” since 1994. 2) The U.S. Federal Reserve will keep interest rates at rock-bottom levels, possibly for years to come. 3) The U.S Government will continue spending heavily to keep the recovery going. 4) Investors continue to exhibit the “buy the dip” mentality and to adhere to the mantra, “there is no alternative” (TINA) to equities because bond yields are so low.
However, the market’s buoyancy has been ebbing of late. On the last day of September, the S&P 500 benchmark notched its first 5% decline in almost a year, one of the longest such stretches without such a pullback on record. Less bullish, or outright bearish investors, are beginning to become more vocal. These more pessimistic views include: 1) The Delta variant’s spread is lengthening the time for complete economic normalization. Companies are increasingly taking down current growth forecasts due to lingering supply chain constraints and input price pressures. 2) Fears that the Federal Reserve’s strategy of tapering its bond buying program may be ill-timed. 3) Concerns that many of the economic tailwinds may be reversing and that company earnings have hit peak growth. 4) China’s crackdown on technology, real estate developers, and other private industries could lead to slower global growth.
What does Green Owl Fund management think about these various issues? The reality is we generally don’t have strong opinions on matters such as these. We readily admit we don’t know how the market is going to react to new data one quarter to the next, let alone one or two years hence. We’ve written extensively on market timing and are still of the opinion that it is a futile exercise. Excuse us if we’ve used this Peter Lynch quote before but nothing encapsulates our sentiment so well.
1
“Far more money has been lost by investors preparing for corrections, or trying to anticipate corrections, than has been lost in corrections themselves.” - Peter Lynch
We are convinced that the most reliable way to capture the long-term return of equities is to ride out their frequent, but ultimately temporary, declines. Considering, that historically, the equity market averages roughly a 15% drawdown on an annual basis, the real key to making money in stocks is not to get scared out of them.
Besides, generating satisfactory investment returns is a probabilistic process, not a predictive one. Basing our company value estimates on whether a bullish or bearish economic prediction proves out would leave us vulnerable to alternative scenarios playing out. Instead, our analysis contemplates the idea that many different outcomes are possible and applies certain probabilities to each. One of our favorite descriptions of risk is that more things can happen than will happen. We know of no other way to account for this risk than to sensibly assess multiple potential outcomes.
Any strong opinions we do have are reserved for company-specific insights developed through our research process, where we focus on identifying a small number of companies with sustainable competitive advantages, are exceptionally well-managed, and have attractive reinvestment opportunities. When we find all of those things available at valuations that we feel will enable us to benefit fully from the growth in the intrinsic value of the companies, the events in the broader economy don’t matter all that much.
The essence of lastingly successful equity investing is the ability to allow capital to compound over the long-term. This ability is not just about possessing superior intellectual capability and analytical aptitude; it’s also overwhelmingly temperamental in nature. It’s about patience, discipline, faith that your process works over time, and most importantly, because the compounding of returns is such a powerful force, make sure to never unnecessarily interrupt it. Because although we never know what the stock market is going to do next, we believe we know what it’s likely to do ultimately.
PORTFOLIO ACTIVITY
As long-term shareholders, we care a lot about business quality and structural competitive advantages that are evidenced by a historic track record of healthy profitability and robust capital returns. And our value orientation causes us to care as much about business valuation. Our portfolio actions are guided simply by initiating or adding to positions whose intrinsic value growth we feel has outpaced their stock price movement and taking money off the table in names that have moved materially closer to fair value or where a thesis change has lowered our fair value estimate.
We are utilizing the same approach we have always used – a valuation framework that focuses on the long-term fundamentals and endeavors to minimize the odds of a permanent loss of capital. We use market, or single stock volatility, to upgrade both the quality of the portfolio and the expected return profile.
Based on these standards, we took the following portfolio actions during the Fund’s fiscal year.
INITIATED POSITIONS in the following companies: Dollar Tree (DLTR), Las Vegas Sands (LVS), Salesforce.com (CRM), and Splunk (SPLK).
EXITED POSITIONS in the following companies: CBRE Group (CBRE), Jacobs Engineering, Mohawk (MHK), NVR (NVR), Robert Half (RHI), and ViacomCBS (VIAC).
THE FUND’S TEN LARGEST POSITIONS as of October 31, 2021, were Alphabet (GOOG/GOOGL), Philip Morris (PM), Berkshire Hathaway (BRKB), Facebook (FB), Becton Dickinson (BDX), Motorola Solutions (MSI), General Motors (GM), Apple (AAPL), Autodesk (ADSK), and Charles Schwab (SCHW).
2
PERFORMANCE ATTRIBUTION
Key Contributors to Results
The individual positions that contributed the most to performance, on a dollar basis, during the year were: Alphabet (GOOG/GOOGL), Quanta Services (PWR), Blackstone (BX), American Express (AXP), and Aon (AON).
On a percentage total return basis, the top performers for the year were: Blackstone (+188%), CBRE (+107%), Charles Schwab (+102%), Arista (+96%), and Quanta Services (+95%).
On a sector basis, the largest contributor to relative results was the Fund’s security selection and overweight position in the Financial sector. Security selection in the Industrial and Consumer Discretionary sectors also contributed.
Key Detractors to Results
The individual positions that detracted the most from performance, on a dollar basis, during the year were: Las Vegas Sands (LVS), Lockheed Martin (LMT), Covetrus (CVET), GoDaddy (GDDY) , and Cash (n/a).
On a percentage basis, the worst performers for the year were: Las Vegas Sands (-28%), Covetrus (-18%), Lockheed Martin (-2%), GoDaddy (-2%), and Becton Dickinson (+5%).
On a sector basis, the Fund’s lack of exposure to the Energy sector along with being underweight and security selection in Health Care detracted from results.
Thank you for your continued support and trust in our ability to manage your investment in the Fund.
3
INVESTMENT RESULTS – (Unaudited)
| | Average Annual Total Returns* (For the periods ended October 31, 2021) | |
| | | One Year | Five Year | Since Inception
(December 22, 2011)(a) | |
| | Green Owl Intrinsic Value Fund | 51.56% | 16.66% | 14.10% | |
| | S&P 500® Index** | 42.91% | 18.93% | 16.32% | |
Total annual operating expenses, as disclosed in the Green Owl Intrinsic Value Fund (the “Fund”) prospectus dated February 26, 2021, were 1.35% of average daily net assets (1.11% after fee waivers/expense reimbursements by Kovitz Investment Group Partners, LLC (the “Adviser”)). The Adviser has agreed to waive its fees and/or reimburse other expenses of the Fund until February 28, 2022, so that Total Annual Fund Operating Expenses do not exceed 1.10%. This operating expense limitation does not apply to interest, taxes, brokerage commissions, other expenditures which are capitalized in accordance with generally accepted accounting principles, other extraordinary expenses not incurred in the ordinary course of the Fund’s business, dividend expense on short sales, expenses incurred under a Rule 12b-1 plan of distribution, “acquired fund fees and expenses,” and expenses that the Fund has incurred but did not actually pay because of an expense offset arrangement. Each waiver and/or reimbursement of an expense is subject to repayment by the Fund within the three years following the date the particular expense payment occurred, provided that the Fund is able to make the repayment without exceeding the expense limitation in place at the time of the waiver or reimbursement and the expense limitation in place at the time of the repayment. This agreement may only be terminated by mutual consent of the Adviser and the Board of Trustees. Additional information pertaining to the Fund’s expense ratios as of October 31, 2021 can be found in the financial highlights. |
The performance quoted represents past performance, which does not guarantee future results. The investment return and principal value of an investment will fluctuate so that an investor’s shares, when redeemed, may be worth more or less than their original cost. The returns shown do not reflect deduction of taxes that a shareholder would pay on Fund distributions or the redemption of Fund shares. The Fund’s investment objectives, risks, charges and expenses must be considered carefully before investing. Current performance of the Fund may be lower or higher than the performance quoted. Performance data current to the most recent month end may be obtained by calling (888) 695-3729.
(a) | The Fund commenced operations on December 22, 2011. However, the Fund did not invest in long-term securities towards the investment objective until December 27, 2011. December 27, 2011 is the performance calculation inception date. |
* | Return figures reflect any change in price per share and assume the reinvestment of all distributions. The Fund’s returns reflect any fee reductions during the applicable periods. If such fee reductions had not occurred, the quoted performance would have been lower. Total returns for periods less than one year are not annualized. |
** | The S&P 500® Index is a widely recognized unmanaged index of equity securities and is representative of a broader domestic equity market and range of securities than is found in the Fund’s portfolio. Individuals cannot invest directly in the Index; however, an individual can invest in exchange traded funds or other investment vehicles that attempt to track the performance of a benchmark index. |
The Fund’s investment objectives, strategies, risks, charges and expenses must be considered carefully before investing. The prospectus contains this and other important information about the Fund and may be obtained by calling the same number as above. Please read it carefully before investing.
The Fund is distributed by Ultimus Fund Distributors, LLC, member FINRA/SIPC.
4
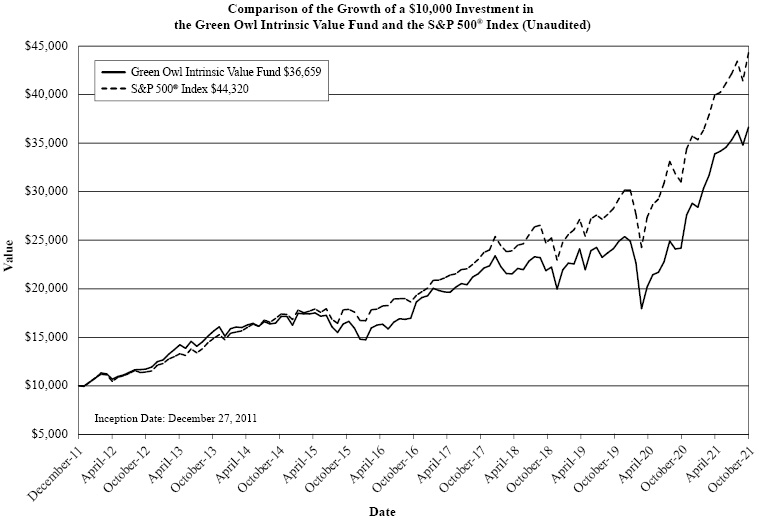
The Fund commenced operations on December 22, 2011. However, the Fund did not invest in long-term securities towards the investment objective until December 27, 2011. December 27, 2011 is the performance calculation inception date. The chart above assumes an initial investment of $10,000 made on December 28, 2011 and held through October 31, 2021. The S&P 500® Index is a widely recognized unmanaged index of equity securities and is representative of a broader domestic equity market and range of securities than is found in the Fund’s portfolio. Individuals cannot invest directly in the Index; however, an individual can invest in exchange traded funds or other investment vehicles that attempt to track the performance of a benchmark index. THE FUND’S RETURN REPRESENTS PAST PERFORMANCE AND DOES NOT GUARANTEE FUTURE RESULTS. The returns shown do not reflect deduction of taxes that a shareholder would pay on Fund distributions or the redemption of Fund shares. Investment returns and principal values will fluctuate so that your shares, when redeemed, may be worth more or less than their original purchase price.
Current performance may be lower or higher than the performance data quoted. For more information on the Fund, and to obtain performance data current to the most recent month end or to request a prospectus, please call (888) 695-3729. You should carefully consider the investment objectives, potential risks, management fees, and charges and expenses of the Fund before investing. The Fund’s prospectus contains this and other information about the Fund, and should be read carefully before investing.
The Fund is distributed by Ultimus Fund Distributors, LLC, member FINRA.
5
FUND HOLDINGS – (Unaudited)
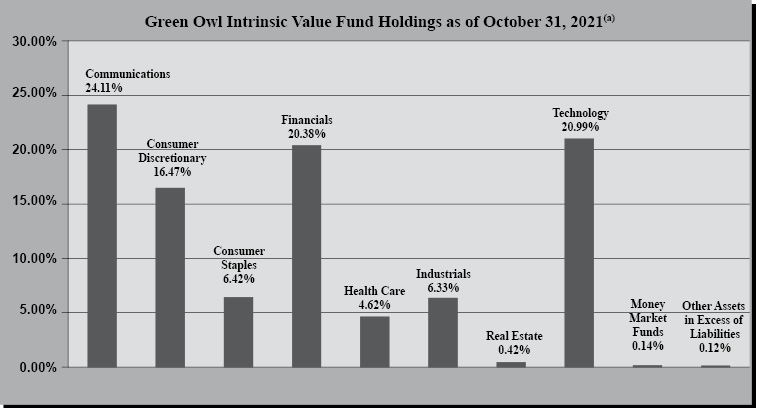
(a) | As a percentage of net assets. |
The investment objective of the Green Owl Intrinsic Value Fund is long-term capital appreciation.
Availability of Portfolio Schedule – (Unaudited)
The Fund files its complete schedule of portfolio holdings with the Securities and Exchange Commission (“SEC”) for the first and third quarters of each fiscal year as an exhibit to its reports on Form N-PORT. The Fund’s Form N-PORT reports are available on the SEC’s website at http://www.sec.gov and on the Fund’s website at http://greenowlfund.com.
6
GREEN OWL INTRINSIC VALUE FUND
SCHEDULE OF INVESTMENTS
October 31, 2021
COMMON STOCKS — 99.74% | | Shares | | | Fair Value | |
Communications — 24.11% | | | | | | | | |
Alphabet, Inc., Class C(a) | | | 2,452 | | | $ | 7,271,185 | |
Alphabet, Inc., Class A(a) | | | 373 | | | | 1,104,423 | |
Booking Holdings, Inc.(a) | | | 1,161 | | | | 2,810,526 | |
Charter Communications, Inc., Class A(a) | | | 4,064 | | | | 2,742,753 | |
Expedia Group, Inc.(a) | | | 8,660 | | | | 1,423,791 | |
Facebook, Inc., Class A(a) | | | 13,360 | | | | 4,322,895 | |
GoDaddy, Inc., Class A(a) | | | 26,010 | | | | 1,799,112 | |
Walt Disney Co. (The)(a) | | | 14,710 | | | | 2,487,020 | |
| | | | | | | | 23,961,705 | |
Consumer Discretionary — 16.47% | | | | | | | | |
Amazon.com, Inc.(a) | | | 865 | | | | 2,917,152 | |
CarMax, Inc.(a) | | | 13,768 | | | | 1,885,114 | |
General Motors Co.(a) | | | 62,140 | | | | 3,382,280 | |
Gildan Activewear, Inc. | | | 68,235 | | | | 2,505,589 | |
Hasbro, Inc. | | | 22,505 | | | | 2,155,079 | |
Las Vegas Sands Corp.(a) | | | 50,196 | | | | 1,948,107 | |
Lowe’s Cos., Inc. | | | 6,730 | | | | 1,573,609 | |
| | | | | | | | 16,366,930 | |
Consumer Staples — 6.42% | | | | | | | | |
Dollar Tree, Inc.(a) | | | 14,748 | | | | 1,589,244 | |
Philip Morris International, Inc. | | | 50,675 | | | | 4,790,815 | |
| | | | | | | | 6,380,059 | |
Financials — 20.38% | | | | | | | | |
American Express Co. | | | 13,924 | | | | 2,419,713 | |
Aon PLC, Class A | | | 6,622 | | | | 2,118,510 | |
Berkshire Hathaway, Inc., Class B(a) | | | 15,300 | | | | 4,391,252 | |
Blackstone Group L.P. (The), Class A(b) | | | 20,112 | | | | 2,783,903 | |
Charles Schwab Corp. (The) | | | 38,665 | | | | 3,171,690 | |
Citigroup, Inc. | | | 17,105 | | | | 1,182,982 | |
JPMorgan Chase & Co. | | | 12,745 | | | | 2,165,248 | |
Northern Trust Corp. | | | 16,392 | | | | 2,016,872 | |
| | | | | | | | 20,250,170 | |
Health Care — 4.62% | | | | | | | | |
Becton, Dickinson and Co. | | | 16,720 | | | | 4,005,944 | |
Covetrus, Inc.(a) | | | 28,735 | | | | 580,160 | |
| | | | | | | | 4,586,104 | |
See accompanying notes which are an integral part of these financial statements.
7
GREEN OWL INTRINSIC VALUE FUND
SCHEDULE OF INVESTMENTS – continued
October 31, 2021
COMMON STOCKS — 99.74% - continued | | Shares | | | Fair Value | |
Industrials — 6.33% | | | | | | | | |
Keysight Technologies, Inc.(a) | | | 8,050 | | | $ | 1,449,161 | |
Lockheed Martin Corp. | | | 5,021 | | | | 1,668,579 | |
Quanta Services, Inc. | | | 26,130 | | | | 3,169,046 | |
| | | | | | | | 6,286,786 | |
Real Estate — 0.42% | | | | | | | | |
CBRE Group, Inc., Class A(a) | | | 4,000 | | | | 416,320 | |
| | | | | | | | | |
Technology — 20.99% | | | | | | | | |
Apple, Inc. | | | 21,970 | | | | 3,291,106 | |
Arista Networks, Inc.(a) | | | 5,030 | | | | 2,060,741 | |
Autodesk, Inc.(a) | | | 10,066 | | | | 3,197,063 | |
Motorola Solutions, Inc. | | | 15,530 | | | | 3,860,602 | |
salesforce.com, Inc.(a) | | | 8,480 | | | | 2,541,371 | |
Splunk, Inc.(a) | | | 11,867 | | | | 1,955,919 | |
SS&C Technologies Holdings, Inc. | | | 26,775 | | | | 2,127,809 | |
Visa, Inc., Class A | | | 8,615 | | | | 1,824,399 | |
| | | | | | | | 20,859,010 | |
Total Common Stocks (Cost $55,849,385) | | | | | | | 99,107,084 | |
| | | | | | | | | |
MONEY MARKET FUNDS - 0.14% | | | | | | | | |
Federated Hermes Treasury Obligations Fund, Institutional Class, 0.01%(c) | | | 141,091 | | | | 141,091 | |
Total Money Market Funds (Cost $141,091) | | | | | | | 141,091 | |
Total Investments — 99.88% (Cost $55,990,476) | | | | | | | 99,248,175 | |
Other Assets in Excess of Liabilities — 0.12% | | | | | | | 118,796 | |
NET ASSETS — 100.00% | | | | | | $ | 99,366,971 | |
(a) | Non-income producing security. |
(b) | Master Limited Partnership |
(c) | Rate disclosed is the seven day effective yield as of October 31, 2021. |
See accompanying notes which are an integral part of these financial statements.
8
GREEN OWL INTRINSIC VALUE FUND
STATEMENT OF ASSETS AND LIABILITIES
October 31, 2021
Assets | | | | |
Investments in securities at fair value (cost $55,990,476) (Note 3) | | $ | 99,248,175 | |
Cash | | | 12,745 | |
Receivable for fund shares sold | | | 11,786 | |
Receivable for investments sold | | | 194,353 | |
Dividends receivable | | | 60,701 | |
Tax reclaims receivable | | | 10,955 | |
Prepaid expenses | | | 16,572 | |
Total Assets | | | 99,555,287 | |
| | | | | |
Liabilities | | | | |
Payable for fund shares redeemed | | | 74,606 | |
Payable to Adviser (Note 4) | | | 69,845 | |
Payable to Administrator (Note 4) | | | 11,076 | |
Payable to trustees | | | 1,638 | |
Other accrued expenses | | | 31,151 | |
Total Liabilities | | | 188,316 | |
Net Assets | | $ | 99,366,971 | |
| | | | | |
Net Assets consist of: | | | | |
Paid-in capital | | | 40,347,641 | |
Accumulated earnings | | | 59,019,330 | |
Net Assets | | $ | 99,366,971 | |
| | | | | |
Shares outstanding (unlimited number of shares authorized, no par value) | | | 3,762,505 | |
Net asset value, offering and redemption price per share (Note 2) | | $ | 26.41 | |
See accompanying notes which are an integral part of these financial statements.
9
GREEN OWL INTRINSIC VALUE FUND
STATEMENT OF OPERATIONS
For the year ended October 31, 2021
Investment Income | | | | |
Dividend income (net of foreign taxes withheld of $6,841) | | $ | 871,894 | |
Total investment income | | | 871,894 | |
| | | | | |
Expenses | | | | |
Investment Adviser fees (Note 4) | | | 933,039 | |
Administration fees (Note 4) | | | 74,650 | |
Fund accounting fees (Note 4) | | | 37,518 | |
Registration expenses | | | 27,028 | |
Transfer agent fees (Note 4) | | | 22,635 | |
Legal fees | | | 18,735 | |
Audit and tax preparation fees | | | 17,460 | |
Custodian fees | | | 14,531 | |
Printing and postage expenses | | | 6,695 | |
Trustee fees | | | 6,518 | |
Compliance service fees (Note 4) | | | 3,008 | |
Insurance expenses | | | 2,805 | |
Interest expense | | | 1,270 | |
Pricing | | | 1,194 | |
Miscellaneous expenses | | | 29,718 | |
Total expenses | | | 1,196,804 | |
Fees contractually waived by Adviser | | | (168,110 | ) |
Net operating expenses | | | 1,028,694 | |
Net investment loss | | | (156,800 | ) |
| | | | | |
Net Realized and Change in Unrealized Gain (Loss) on Investments | | | | |
Net realized gain (loss) on: | | | | |
Investment securities transactions | | | 15,891,622 | |
Foreign currency translations | | | (10 | ) |
Net change in unrealized appreciation (depreciation) on: | | | | |
Investment securities transactions | | | 21,150,660 | |
Foreign currency translations | | | (321 | ) |
Net realized and change in unrealized gain (loss) on investments | | | 37,041,951 | |
Net increase in net assets resulting from operations | | $ | 36,885,151 | |
See accompanying notes which are an integral part of these financial statements.
10
GREEN OWL INTRINSIC VALUE FUND
STATEMENTS OF CHANGES IN NET ASSETS
| | | For the
Year Ended
October 31, 2021 | | | For the
Year Ended
October 31, 2020 | |
Increase (Decrease) in Net Assets due to: | | | | | | | | |
Operations | | | | | | | | |
Net investment income (loss) | | $ | (156,800 | ) | | $ | 117,809 | |
Net realized gain on investment securities transactions and foreign currency translations | | | 15,891,612 | | | | 2,374,519 | |
Net change in unrealized appreciation (depreciation) of investment securities transactions, written options and foreign currency translations | | | 21,150,339 | | | | (1,749,521 | ) |
Net increase in net assets resulting from operations | | | 36,885,151 | | | | 742,807 | |
| | | | | | | | | |
Distributions to Shareholders from Earnings (Note 2) | | | (2,423,786 | ) | | | (4,242,749 | ) |
| | | | | | | | | |
Capital Transactions | | | | | | | | |
Proceeds from shares sold | | | 8,289,840 | | | | 13,118,828 | |
Reinvestment of distributions | | | 2,315,890 | | | | 4,026,812 | |
Amount paid for shares redeemed | | | (23,364,904 | ) | | | (19,946,651 | ) |
Net decrease in net assets resulting from capital transactions | | | (12,759,174 | ) | | | (2,801,011 | ) |
Total Increase (Decrease) in Net Assets | | | 21,702,191 | | | | (6,300,953 | ) |
| | | | | | | | | |
Net Assets | | | | | | | | |
Beginning of year | | | 77,664,780 | | | | 83,965,733 | |
End of year | | $ | 99,366,971 | | | $ | 77,664,780 | |
| | | | | | | | | |
Share Transactions | | | | | | | | |
Shares sold | | | 353,135 | | | | 845,509 | |
Shares issued in reinvestment of distributions | | | 115,047 | | | | 216,031 | |
Shares redeemed | | | (1,034,060 | ) | | | (1,198,050 | ) |
Net decrease in shares outstanding | | | (565,878 | ) | | | (136,510 | ) |
See accompanying notes which are an integral part of these financial statements.
11
GREEN OWL INTRINSIC VALUE FUND
FINANCIAL HIGHLIGHTS
(For a share outstanding during each year)
| | | For the
Year Ended
October 31,
2021 | | | For the
Year Ended
October 31,
2020 | | | For the
Year Ended
October 31,
2019 | | | For the
Year Ended
October 31,
2018 | | | For the
Year Ended
October 31,
2017 | |
Selected Per Share Data | | | | | | | | | | | | | | | | | | | | |
Net asset value, beginning of year | | $ | 17.94 | | | $ | 18.81 | | | $ | 18.99 | | | $ | 19.09 | | | $ | 15.08 | |
Investment operations: | | | | | | | | | | | | | | | | | | | | |
Net investment income (loss) | | | (0.04 | ) | | | 0.03 | | | | 0.19 | | | | 0.05 | | | | 0.04 | |
Net realized and unrealized gain on investments | | | 9.10 | | | | 0.05 | | | | 1.47 | | | | 0.24 | | | | 4.03 | |
Total from investment operations | | | 9.06 | | | | 0.08 | | | | 1.66 | | | | 0.29 | | | | 4.07 | |
| | | | | | | | | | | | | | | | | | | | | |
Less distributions to shareholders from: | | | | | | | | | | | | | | | | | | | | |
Net investment income | | | — | (a) | | | (0.17 | ) | | | (0.05 | ) | | | (0.04 | ) | | | (0.06 | ) |
Net realized gains | | | (0.59 | ) | | | (0.78 | ) | | | (1.79 | ) | | | (0.35 | ) | | | — | |
Total distributions | | | (0.59 | ) | | | (0.95 | ) | | | (1.84 | ) | | | (0.39 | ) | | | (0.06 | ) |
Net asset value, end of year | | $ | 26.41 | | | $ | 17.94 | | | $ | 18.81 | | | $ | 18.99 | | | $ | 19.09 | |
| | | | | | | | | | | | | | | | | | | | | |
Total Return(b) | | | 51.56 | % | | | 0.23 | % | | | 10.34 | % | | | 1.50 | % | | | 27.02 | % |
Ratios and Supplemental Data: | | | | | | | | | | | | | | | | | | | | |
Net assets, end of year (000 omitted) | | $ | 99,367 | | | $ | 77,665 | | | $ | 83,966 | | | $ | 78,417 | | | $ | 82,068 | |
Ratio of expenses to average net assets after expense waiver | | | 1.10 | % | | | 1.10 | % | | | 1.10 | % | | | 1.10 | % | | | 1.10 | % |
Ratio of expenses to average net assets before expense waiver | | | 1.28 | % | | | 1.34 | % | | | 1.32 | % | | | 1.32 | % | | | 1.32 | % |
Ratio of net investment income (loss) to average net assets after expense waiver | | | (0.17 | )% | | | 0.15 | % | | | 1.04 | % | | | 0.26 | % | | | 0.22 | % |
Portfolio turnover rate | | | 20 | % | | | 46 | % | | | 29 | % | | | 33 | % | | | 17 | % |
(a) | Rounds to less than $0.005 per share. |
(b) | Total return represents the rate that the investor would have earned or lost on an investment in the Fund, assuming reinvestment of distributions. |
See accompanying notes which are an integral part of these financial statements.
12
GREEN OWL INTRINSIC VALUE FUND
NOTES TO THE FINANCIAL STATEMENTS
October 31, 2021
NOTE 1. ORGANIZATION
The Green Owl Intrinsic Value Fund (the “Fund”) is registered under the Investment Company Act of 1940, as amended (“1940 Act”), as an open-end diversified series of Valued Advisers Trust (the “Trust”). The Trust is a management investment company established under the laws of Delaware by an Agreement and Declaration of Trust dated June 13, 2008 (the “Trust Agreement”). The Trust Agreement permits the Board of Trustees (the “Board”) to issue an unlimited number of shares of beneficial interest of separate series without par value. The Fund is one of a series of funds authorized by the Board. The Fund commenced operations on December 22, 2011. The Fund’s investment adviser is Kovitz Investment Group Partners, LLC (the “Adviser”). The investment objective of the Fund is to provide long-term capital appreciation.
NOTE 2. SIGNIFICANT ACCOUNTING POLICIES
The Fund is an investment company and follows accounting and reporting guidance under Financial Accounting Standards Board Accounting Standards Codification (“ASC”) Topic 946, “Financial Services-Investment Companies.” The following is a summary of significant accounting policies followed by the Fund in the preparation of its financial statements. These policies are in conformity with generally accepted accounting principles in the United States of America (“GAAP”).
Estimates – The preparation of financial statements in conformity with GAAP requires management to make estimates and assumptions that affect the reported amounts of assets and liabilities and disclosure of contingent assets and liabilities at the date of the financial statements and the reported amounts of increases and decreases in net assets from operations during the reporting period. Actual results could differ from those estimates.
Foreign Currency Translation – The accounting records of the Fund are maintained in U.S. dollars. Foreign currency amounts are translated into U.S. dollars at the current rate of exchange each business day to determine the value of investments, and other assets and liabilities. Purchases and sales of foreign securities, and income and expenses, are translated at the prevailing rate of exchange on the respective date of these transactions. The Fund does not isolate that portion of the results of operations resulting from changes in foreign exchange rates on investments from fluctuation arising from changes in market prices of securities held. These fluctuations are included with the unrealized gain or loss from investments. Reported net realized foreign exchange gains or losses arise from sales of foreign currencies, currency gains or losses realized between the trade and settlement dates on securities transactions, and the difference between the amounts of dividends, interest, and foreign withholding taxes recorded on the Fund’s books and the U.S. dollar equivalent of the amounts actually received or paid. Net unrealized foreign exchange gains and losses arise from changes in the fair values of assets and liabilities, other than investments in securities at period end, resulting from changes in exchange rates.
Federal Income Taxes – The Fund makes no provision for federal income or excise tax. The Fund has qualified and intends to qualify each year as a regulated investment company (“RIC”) under subchapter M of the Internal Revenue Code of 1986, as amended, by complying with the requirements applicable to RICs and by distributing substantially all of its taxable income. The Fund also intends to distribute sufficient net investment income and net realized capital gains, if any, so that it will not be subject to excise tax on undistributed income and gains. If the required amount of net investment income or gains is not distributed, the Fund could incur a tax expense.
As of and during the fiscal year ended October 31, 2021, the Fund did not have any liabilities for any unrecognized tax benefits. The Fund recognizes interest and penalties, if any, related to unrecognized tax benefits as income tax expense on the Statement of Operations when incurred. During the fiscal year ended October 31, 2021, the Fund did not incur any interest or penalties. Management of the Fund has reviewed tax positions taken in tax years that
13
GREEN OWL INTRINSIC VALUE FUND
NOTES TO THE FINANCIAL STATEMENTS – (continued)
October 31, 2021
NOTE 2. SIGNIFICANT ACCOUNTING POLICIES – continued
remain subject to examination by all major tax jurisdictions, including federal (i.e., the last three tax year ends and the interim tax period since then, as applicable). Management believes that there is no tax liability resulting from unrecognized tax benefits related to uncertain tax positions taken.
Expenses – Expenses incurred by the Trust that do not relate to a specific fund of the Trust are allocated to the individual funds based on each fund’s relative net assets or another appropriate basis (as determined by the Board).
Security Transactions and Related Income – The Fund follows industry practice and records security transactions on the trade date for financial reporting purposes. The specific identification method is used for determining gains or losses for financial statement and income tax purposes. Dividend income is recorded on the ex-dividend date and interest income is recorded on an accrual basis. Discounts and premiums on securities purchased are accreted or amortized using the effective interest method, if applicable. Withholding taxes on foreign dividends, if any, have been provided for in accordance with the Fund’s understanding of the applicable country’s tax rules and rates.
Dividends and Distributions – The Fund intends to distribute its net investment income and net realized long-term and short-term capital gains, if any, at least annually. Dividends and distributions to shareholders, which are determined in accordance with income tax regulations, are recorded on the ex-dividend date. The treatment for financial reporting purposes of distributions made to shareholders during the period from net investment income or net realized capital gains may differ from their ultimate treatment for federal income tax purposes. These differences are caused primarily by differences in the timing of the recognition of certain components of income, expense or realized capital gain for federal income tax purposes. Where such differences are permanent in nature, they are reclassified among the components of net assets based on their ultimate characterization for federal income tax purposes. Any such reclassifications will have no effect on net assets, results of operations or net asset value (“NAV”) per share of the Fund.
Writing Options – The Fund may write covered call options on equity securities or futures contracts that the Fund is eligible to purchase to extend a holding period to obtain long-term capital gain treatment, to earn premium income, to assure a definite price for a security it has considered selling, or to close out options previously purchased. The Fund may write covered call options if, immediately thereafter, not more than 30% of its net assets would be committed to such transactions. A call option gives the holder (buyer) the right to purchase a security or futures contract at a specified price (the exercise price) at any time until a certain date (the expiration date). A call option is “covered” if the Fund owns the underlying security subject to the call option at all times during the option period. When the Fund writes a covered call option, it maintains a segregated account with its Custodian or as otherwise required by the rules of the exchange the underlying security, cash or liquid portfolio securities in an amount not less than the exercise price at all times while the option is outstanding.
The Fund may write put options on equity securities and futures contracts that the Fund is eligible to purchase to earn premium income or to assure a definite price for a security if it is considering acquiring the security at a lower price than the current market price or to close out options previously purchased. The Fund may not write a put option if, immediately thereafter, more than 25% of its net assets would be committed to such transactions. A put option gives the holder of the option the right to sell, and the writer has the obligation to buy, the underlying security at the exercise price at any time during the option period. The operation of put options in other respects is substantially identical to that of call options. When the Fund writes a put option, it maintains in a segregated account with its Custodian cash or liquid portfolio securities in an amount not less than the exercise price at all times while the put option is outstanding.
14
GREEN OWL INTRINSIC VALUE FUND
NOTES TO THE FINANCIAL STATEMENTS – (continued)
October 31, 2021
NOTE 2. SIGNIFICANT ACCOUNTING POLICIES – continued
For the fiscal year ended October 31, 2021, the Fund made the following reclassifications to increase (decrease) the components of net assets:
| | Paid-In
Capital | | | Accumulated
earnings (deficit) | |
| | | $1,257 | | | | $(1,257) | |
Derivative Transactions – The following summarizes the average ending monthly fair value of derivatives outstanding during the fiscal year ended October 31, 2021:
| | | Average
Market Value | |
Written options | | $ | 10,840 | (a) |
(a) | Average based on the three months during the period that had activity. |
NOTE 3. SECURITIES VALUATION AND FAIR VALUE MEASUREMENTS
The Fund values its portfolio securities at fair value as of the close of regular trading on the New York Stock Exchange (“NYSE”) (normally 4:00 p.m. Eastern time) on each business day the NYSE is open for business. Fair value is defined as the price that the Fund would receive upon selling an investment in a timely transaction to an independent buyer in the principal or most advantageous market of the investment. GAAP establishes a three-tier hierarchy to maximize the use of observable market data and minimize the use of unobservable inputs and to establish classification of fair value measurements for disclosure purposes.
Inputs refer broadly to the assumptions that market participants would use in pricing the asset or liability, including assumptions about risk (the risk inherent in a particular valuation technique used to measure fair value including a pricing model and/or the risk inherent in the inputs to the valuation technique). Inputs may be observable or unobservable. Observable inputs are inputs that reflect the assumptions market participants would use in pricing the asset or liability developed based on market data obtained and available from sources independent of the reporting entity. Unobservable inputs are inputs that reflect the reporting entity’s own assumptions about the assumptions market participants would use in pricing the asset or liability developed based on the best information available in the circumstances.
Various inputs are used in determining the value of the Fund’s investments. These inputs are summarized in the three broad levels listed below.
| | ● | Level 1 – unadjusted quoted prices in active markets for identical investments and/or registered investment companies where the value per share is determined and published and is the basis for current transactions for identical assets or liabilities at the valuation date |
| | ● | Level 2 – other significant observable inputs (including, but not limited to, quoted prices for an identical security in an inactive market, quoted prices for similar securities, interest rates, prepayment speeds, credit risk, etc.) |
| | ● | Level 3 – significant unobservable inputs (including the Fund’s own assumptions in determining fair value of investments based on the best information available) |
15
GREEN OWL INTRINSIC VALUE FUND
NOTES TO THE FINANCIAL STATEMENTS – (continued)
October 31, 2021
NOTE 3. SECURITIES VALUATION AND FAIR VALUE MEASUREMENTS – continued
The inputs used to measure fair value may fall into different levels of the fair value hierarchy. In such cases, for disclosure purposes, the level in the fair value hierarchy which is reported is determined based on the lowest level input that is significant to the fair value measurement in its entirety.
Equity securities that are traded on any stock exchange are generally valued at the last quoted sale price on the security’s primary exchange. Lacking a last sale price, an exchange-traded security is generally valued at its last bid price. Securities traded in the NASDAQ over-the-counter market are generally valued at the NASDAQ Official Closing Price. When using market quotations and when the market is considered active, the security is classified as a Level 1 security. In the event that market quotations are not readily available or are considered unreliable due to market or other events, the Fund values its securities and other assets at fair value in accordance with policies established by and under the general supervision of the Board. Under these policies, the securities will be classified as Level 2 or 3 within the fair value hierarchy, depending on the inputs used.
Investments in mutual funds, including money market mutual funds, are generally priced at the ending NAV. These securities are categorized as Level 1 securities.
Call and put options purchased or sold by the Fund are valued at the mean of the last bid and ask prices as provided by a pricing service. If there is no such reported ask price on the valuation date, options are valued at the most recent bid price. If there is no such reported bid price on the valuation date, options are valued at the most recent ask price. Options will generally be categorized as Level 2 securities.
In accordance with the Trust’s valuation policies, the Adviser is required to consider all appropriate factors relevant to the value of securities for which it has determined other pricing sources are not available or reliable as described above. No single method exists for determining fair value, because fair value depends upon the circumstances of each individual case. As a general principle, the current fair value of a security being valued by the Adviser would be the amount that the Fund might reasonably expect to receive upon the current sale. Methods that are in accordance with this principle may, for example, be based on (i) a multiple of earnings; (ii) a discount from market prices of a similar freely traded security (including a derivative security or a basket of securities traded on other markets, exchanges or among dealers); or (iii) yield to maturity with respect to debt issues, or a combination of these and other methods. Fair-value pricing is permitted if, in the Adviser’s opinion, the validity of market quotations appears to be questionable based on factors such as evidence of a thin market in the security based on a small number of quotations, a significant event occurs after the close of a market but before the Fund’s NAV calculation that may affect a security’s value, or the Adviser is aware of any other data that calls into question the reliability of market quotations.
The following is a summary of the inputs used to value the Fund’s investments as of October 31, 2021:
| | | Valuation Inputs | |
Assets | | Level 1 | | | Level 2 | | | Level 3 | | | Total | |
Common Stocks(a) | | $ | 99,107,084 | | | $ | — | | | $ | — | | | $ | 99,107,084 | |
Money Market Funds | | | 141,091 | | | | — | | | | — | | | | 141,091 | |
Total | | $ | 99,248,175 | | | $ | — | | | $ | — | | | $ | 99,248,175 | |
(a) | Refer to Schedule of Investments for sector classifications. |
16
GREEN OWL INTRINSIC VALUE FUND
NOTES TO THE FINANCIAL STATEMENTS – (continued)
October 31, 2021
NOTE 3. SECURITIES VALUATION AND FAIR VALUE MEASUREMENTS – continued
The Fund did not hold any investments at the end of the reporting period for which significant unobservable inputs (Level 3) were used in determining fair value; therefore, no reconciliation of Level 3 securities is included for this reporting period.
NOTE 4. ADVISER FEES AND OTHER TRANSACTIONS
Under the terms of the management agreement, on behalf of the Fund, the Adviser manages the Fund’s investments subject to approval by the Board. As compensation for its management services, the Fund is obligated to pay the Adviser a fee computed and accrued daily and paid monthly at an annual rate of 1.00% of the average daily net assets of the Fund. For the fiscal year ended October 31, 2021, the Adviser earned a fee of $933,039 from the Fund before the reimbursement described below. At October 31, 2021, the Fund owed the Adviser $69,845.
The Adviser has agreed to waive its fees and/or reimburse other expenses of the Fund until February 28, 2022, so that Total Annual Fund Operating Expenses do not exceed 1.10%. This operating expense limitation does not apply to interest, taxes, brokerage commissions, other expenditures which are capitalized in accordance with GAAP, other extraordinary expenses not incurred in the ordinary course of the Fund’s business, dividend expense on short sales, expenses incurred under a Rule 12b-1 plan of distribution, “acquired fund fees and expenses,” and expenses that the Fund has incurred but did not actually pay because of an expense offset arrangement.
Each waiver and/or reimbursement of an expense is subject to repayment by the Fund within the three years following the date the particular expense payment occurred, provided that the Fund is able to make the repayment without exceeding the expense limitation in place at the time of the waiver or reimbursement and the expense limitation in place at the time of the repayment. This agreement may only be terminated by mutual consent of the Adviser and the Board of Trustees. For the fiscal year ended October 31, 2021, the Adviser waived fees and/or reimbursed expenses of $168,110.
The amounts subject to repayment by the Fund, pursuant to the aforementioned conditions are as follows:
Recoverable through | | | | |
October 31, 2022 | | $ | 175,543 | |
October 31, 2023 | | | 184,529 | |
October 31, 2024 | | | 168,110 | |
The Trust retains Ultimus Fund Solutions, LLC (the “Administrator” or “Ultimus”) to provide the Fund with administration, compliance (including a chief compliance officer), fund accounting and transfer agent services, including all regulatory reporting. For the fiscal year ended October 31, 2021, the Administrator earned fees of $74,650, $3,008, $37,518 and $22,635 for administrative, compliance, accounting and transfer agent services, respectively. At October 31, 2021, the Administrator was owed $11,076 from the Fund for these services.
The officers and one trustee of the Trust are members of management and/or employees of the Administrator. Ultimus Fund Distributors, LLC (the “Distributor”) acts as the distributor of the Fund’s shares. The Distributor is a wholly-owned subsidiary of Ultimus.
There were no payments made by the Fund to the Distributor during the fiscal year ended October 31, 2021.
17
GREEN OWL INTRINSIC VALUE FUND
NOTES TO THE FINANCIAL STATEMENTS – (continued)
October 31, 2021
NOTE 5. PURCHASES AND SALES
For the fiscal year ended October 31, 2021, purchases and sales of investment securities, other than short-term investments, were $17,900,528 and $33,183,650, respectively.
There were no purchases or sales of long-term U.S. government obligations during the fiscal year ended October 31, 2021.
NOTE 6. FEDERAL TAX INFORMATION
At October 31, 2021, the net unrealized appreciation (depreciation) and tax cost of investments for tax purposes was as follows:
Gross unrealized appreciation | | $ | 43,701,741 | |
Gross unrealized depreciation | | | (384,464 | ) |
Net unrealized appreciation on investments | | $ | 43,317,277 | |
| | | | | |
Tax cost of investments | | $ | 55,930,898 | |
At October 31, 2021, the difference between book basis and tax basis unrealized appreciation (depreciation) is attributable to the tax deferral of losses on organizational expense amortization and ROC basis adjustments.
On December 14, 2021, the Fund paid a short-term and long-term capital gain distribution of $0.0949 and $4.0957 per share, respectively, to shareholders of record on December 13, 2021.
The tax character of distributions paid for the fiscal years ended October 31, 2021 and October 31, 2020 were as follows:
Distributions paid from: | | 2021 | | | 2020 | |
Ordinary income(a) | | $ | 14,233 | | | $ | 743,955 | |
Long-term capital gains | | | 2,409,553 | | | | 3,498,794 | |
Total distributions paid | | $ | 2,423,786 | | | $ | 4,242,749 | |
(a) For federal income tax purposes, distributions of short-term capital gains are treated as ordinary income distributions.
At October 31, 2021, the components of accumulated earnings (deficit) on a tax basis were as follows:
Undistributed Ordinary Income | | $ | 355,579 | |
Undistributed Long-Term Capital Gains | | | 15,347,555 | |
Accumulated Capital and Other Losses | | | (1,276 | ) |
Unrealized Appreciation on Investments | | | 43,317,472 | |
Total Accumulated Earnings | | $ | 59,019,330 | |
18
GREEN OWL INTRINSIC VALUE FUND
NOTES TO THE FINANCIAL STATEMENTS – (continued)
October 31, 2021
NOTE 7. COMMITMENTS AND CONTINGENCIES
The Trust indemnifies its officers and Trustees for certain liabilities that may arise from their performance of their duties to the Trust or the Fund. Additionally, in the normal course of business, the Trust enters into contracts that contain a variety of representations and warranties which provide general indemnifications. The Trust’s maximum exposure under these arrangements is unknown, as this would involve future claims that may be made against the Trust that have not yet occurred.
NOTE 8. SUBSEQUENT EVENTS
Management of the Fund has evaluated the need for disclosures and/or adjustments resulting from subsequent events through the date at which these financial statements were issued. Based upon this evaluation, management has determined there were no items requiring adjustment of the financial statements or additional disclosure.
19
REPORT OF INDEPENDENT REGISTERED PUBLIC ACCOUNTING FIRM
To the Shareholders of Green Owl Intrinsic Value Fund and
Board of Trustees of Valued Advisers Trust
Opinion on the Financial Statements
We have audited the accompanying statement of assets and liabilities, including the schedule of investments, of Green Owl Intrinsic Value Fund (the “Fund”), a series of Valued Advisers Trust, as of October 31, 2021, the related statement of operations for the year then ended, the statements of changes in net assets for each of the two years in the period then ended, the related notes, and the financial highlights for each of the five years in the period then ended (collectively referred to as the “financial statements”). In our opinion, the financial statements present fairly, in all material respects, the financial position of the Fund as of October 31, 2021, the results of its operations for the year then ended, the changes in net assets for each of the two years in the period then ended, and the financial highlights for each of the five years in the period then ended, in conformity with accounting principles generally accepted in the United States of America.
Basis for Opinion
These financial statements are the responsibility of the Fund’s management. Our responsibility is to express an opinion on the Fund’s financial statements based on our audits. We are a public accounting firm registered with the Public Company Accounting Oversight Board (United States) (“PCAOB”) and are required to be independent with respect to the Fund in accordance with the U.S. federal securities laws and the applicable rules and regulations of the Securities and Exchange Commission and the PCAOB.
We conducted our audits in accordance with the standards of the PCAOB. Those standards require that we plan and perform the audit to obtain reasonable assurance about whether the financial statements are free of material misstatement, whether due to error or fraud.
Our audits included performing procedures to assess the risks of material misstatement of the financial statements, whether due to error or fraud, and performing procedures that respond to those risks. Such procedures included examining, on a test basis, evidence regarding the amounts and disclosures in the financial statements. Our procedures included confirmation of securities owned as of October 31, 2021, by correspondence with the custodian and brokers; when replies were not received from brokers, we performed other auditing procedures. Our audits also included evaluating the accounting principles used and significant estimates made by management, as well as evaluating the overall presentation of the financial statements. We believe that our audits provide a reasonable basis for our opinion.
We have served as the Fund’s auditor since 2012.
COHEN & COMPANY, LTD.
Cleveland, Ohio
December 28, 2021
20
SUMMARY OF FUND EXPENSES – (Unaudited)
As a shareholder of the Fund, you incur two types of costs: (1) transaction and (2) ongoing costs, including management fees and other Fund expenses. These examples are intended to help you understand your ongoing costs (in dollars) of investing in the Fund and to compare these costs with the ongoing costs of investing in other mutual funds. The example is based on an investment of $1,000 invested at the beginning of the period and held for the entire period from May 1, 2021 through October 31, 2021.
Actual Expenses
The first line of the table below provides information about actual account values and actual expenses. You may use the information in this line, together with the amount you invested, to estimate the expenses that you paid over the period. Simply divide your account value by $1,000 (for example, an $8,600 account value divided by $1,000 = 8.6), then multiply the result by the number in the first line under the heading entitled “Expenses Paid During Period” to estimate the expenses you paid on your account during this period.
Hypothetical Example for Comparison Purposes
The second line of the table below provides information about hypothetical account values and hypothetical expenses based on the Fund’s actual expense ratio and an assumed rate of return of 5% per year before expenses, which is not the Fund’s actual return. The hypothetical account values and expenses may not be used to estimate the actual ending account balance or expenses you paid for the period. You may use this information to compare the ongoing costs of investing in the Fund and other funds. To do so, compare this 5% hypothetical example with the 5% hypothetical examples that appear in the shareholder reports of other funds.
Expenses shown in the table are meant to highlight your ongoing costs only and do not reflect any transactional costs. Therefore, the second line of the table below is useful in comparing ongoing costs only and will not help you determine the relative costs of owning different funds. In addition, if transaction costs were included, your costs would have been higher.
Green Owl
Intrinsic Value Fund | Beginning
Account Value
May 1, 2021 | Ending
Account Value
October 31, 2021 | Expenses Paid
During Period(a) | Annualized
Expense Ratio |
Actual | $ 1,000.00 | $ 1,081.50 | $ 5.77 | 1.10% |
Hypothetical(b) | $ 1,000.00 | $ 1,019.66 | $ 5.60 | 1.10% |
(a) | Expenses are equal to the Fund’s annualized expense ratios, multiplied by the average account value over the period, multiplied by 184/365 (to reflect the one-half year period). |
(b) | Hypothetical assumes 5% annual return before expenses. |
21
ADDITIONAL FEDERAL INCOME TAX INFORMATION – (Unaudited)
The Form 1099-DIV you receive in January 2022 will show the tax status of all distributions paid to your account in calendar year 2021. Shareholders are advised to consult their own tax adviser with respect to the tax consequences of their investment in the Fund. As required by the Internal Revenue Code and/or regulations, shareholders must be notified regarding the status of qualified dividend income for individuals and the dividends received deduction for corporations.
Qualified Dividend Income. The Fund designates approximately 100% or up to the maximum amount of such dividends allowable pursuant to the Internal Revenue Code, as qualified dividend income eligible for a reduced tax rate.
Qualified Business Income. The Fund designates approximately 100% of its ordinary income dividends, or up to the maximum amount of such dividends allowable pursuant to the Internal Revenue Code, as qualified business income.
Dividends Received Deduction. Corporate shareholders are generally entitled to take the dividends received deduction on the portion of the Fund’s dividend distribution that qualifies under tax law. For the Fund’s calendar year 2021 ordinary income dividends, 0% qualifies for the corporate dividends received deduction.
For the year ended October 31, 2021, the Fund designated $2,409,553 as long-term capital gain distributions.
22
TRUSTEES AND OFFICERS – (Unaudited)
The Board of Trustees supervises the business activities of the Trust. Each Trustee serves as a trustee until termination of the Trust unless the Trustee dies, resigns, retires or is removed.
The following table provides information regarding each of the Independent Trustees.
Name, Address*, (Age),
Position with Trust**,
Term of Position with Trust | Principal Occupation During
Past 5 Years and Other Directorships | Other Directorships |
Andrea N. Mullins, (54)
Independent Trustee
Since December 2013
Chairperson since
March 2017 | Current: Private investor; Independent Contractor, SWM Advisors (since April 2014). | Trustee, Angel Oak Funds Trust (since February 2019) (5 portfolios); Trustee, Angel Oak Strategic Credit Fund (since February 2019); Trustee, Angel Oak Financial Strategies Income Term Trust (since May 2019); Trustee, Angel Oak Dynamic Financial Strategies Income Term Trust (since June 2020); Trustee, Angel Oak Credit Opportunities Term Trust (since January 2021); Trustee and Audit Committee Chair, Cushing Mutual Funds Trust (since November 2021) (2 portfolios); Trustee and Audit Committee Chair, Cushing NextGen Infrastructure Income Fund (since November 2021); Trustee and Audit Committee Chair, Cushing MLP & Infrastructure Fund (Since November 2021). |
Ira P. Cohen, (62)
Independent Trustee
Since June 2010 | Current: Independent financial services consultant (since February 2005); Executive Vice President of Asset Management Services, Recognos Financial (since August 2015). | Trustee and Audit Committee Chairman, Griffin Institutional Access Credit Fund (since January 2017); Trustee and Audit Committee Chairman, Griffin Institutional Real Estate Access Fund (since May 2014); Trustee, Angel Oak Funds Trust (since October 2014) (5 portfolios); Trustee, Chairman, and Nominating and Governance Committee Chairman, Angel Oak Strategic Credit Fund (since December 2017); Trustee, U.S. Fixed Income Trust (since March 2019); Trustee and Chairman, Angel Oak Financial Strategies Income Term Trust (since May 2019); Trustee, Angel Oak Dynamic Financial Strategies Income Term Trust (since June 2020); Trustee, Angel Oak Credit Opportunities Term Trust (since January 2021). |
* The address for each Trustee is 225 Pictoria Drive, Suite 450, Cincinnati, Ohio 45246.
** As of the date of this report, the Trust consists of 14 series.
23
The following table provides information regarding the Trustee who is considered an “interested person” of the Trust, as that term is defined under the 1940 Act. Based on the experience of the Trustee, the Trust concluded that the individual described below should serve as a Trustee.
Name, Address*, (Age),
Position with Trust**,
Term of Position with Trust | Principal Occupation During
Past 5 Years and Other Directorships | Other Directorships |
Mark J. Seger***, (59)
Trustee Since March 2017 | Current: Vice Chairman and Co-Founder, Ultimus Fund Solutions, LLC and its subsidiaries (since 1999). | None. |
* The address for each Trustee is 225 Pictoria Drive, Suite 450, Cincinnati, Ohio 45246.
** As of the date of this report, the Trust consists of 14 series.
*** Mr. Seger is considered an “interested person” of the Trust because of his relationship with the Trust’s administrator, transfer agent, and distributor.
24
The following table provides information regarding the Officers of the Trust:
Name, Address*, (Age),
Position with Trust**,
Term of Position with Trust | Principal Occupation During
Past 5 Years | Other Directorships |
Adam T. Kornegay, (36)
Principal Executive Officer and President Since April 2018 | Current: Vice President, Business Development Director, Ultimus Fund Solutions, LLC (since March 2015). | None. |
Zachary P. Richmond (41)
Principal Financial Officer and Treasurer Since September 2021 | Current: Vice President, Financial Administration, Ultimus Fund Solutions, LLC (since February 2019)
Previous: Assistant Vice President, Associate Director of Financial Administration, Ultimus Fund Solutions, LLC (December 2015 to February 2019). | None. |
Kevin J. Patton, (51)
Chief Compliance Officer Since March 2020 | Current: Assistant Vice President, Compliance Officer, Ultimus Fund Solutions, LLC (since January 2020). Previous: Partner and Chief Compliance Officer, Renaissance Investment Management (August 2005 to January 2020). | None. |
Carol J. Highsmith, (57)
Vice President Since August 2008 Secretary Since March 2014 | Current: Vice President, Ultimus Fund Solutions, LLC (since December 2015). | None. |
Matt J. Miller, (45)
Vice President Since December 2011 | Current: Assistant Vice President, Relationship Management, Ultimus Fund Solutions, LLC (since December 2015). | None. |
Stephen L. Preston, (55)
AML Officer Since June 2017 | Current: Chief Compliance Officer, Ultimus Fund Distributors, LLC (since June 2011).
Previous: Chief Compliance Officer, Ultimus Fund Solutions, LLC (June 2011 to August 2019); Chief Compliance Officer, Unified Financial Securities, LLC (April 2018 to December 2019). | None. |
* The address for each Officer is 225 Pictoria Drive, Suite 450, Cincinnati, Ohio 45246.
** As of the date of this report, the Trust consists of 14 series.
25
LIQUIDITY RISK MANAGEMENT PROGRAM
Valued Advisers Trust has adopted and implemented a written liquidity risk management program as required by Rule 22e-4 (the “Liquidity Rule”) under the Investment Company Act. The program is reasonably designed to assess and manage the Fund’s liquidity risk, taking into consideration, among other factors, the Fund’s investment strategy and the liquidity of its portfolio investments during normal and reasonably foreseeable stressed conditions; its short and long-term cash flow projections; and its cash holdings and access to other funding sources. The Board of Trustees approved the appointment of a Liquidity Administrator Committee, which includes representatives from Kovitz Investment Group Partners, LLC, the Fund’s investment adviser, and Ultimus Fund Solutions, LLC, the Fund’s Administrator. The Liquidity Administrator Committee is responsible for the program’s administration and oversight and for reporting to the Board on at least an annual basis regarding the program’s operation and effectiveness. The Liquidity Administrator Committee updated its assessment of the Fund’s liquidity risk profile, considering additional data gathered during the period June 1, 2020 through May 31, 2021 (the “Review Period”) and the adequacy and effectiveness of the liquidity risk management program’s operations during the Review Period in order to prepare a written report for the Board of Trustees (the “Report”) for consideration at its meeting held on September 1, 2021. The Report noted that during the Review Period the Fund did not experience unusual stress or disruption to its operations related to purchase and redemption activity. It further noted that during the Review Period the Fund held adequate levels of cash and highly liquid investments to meet shareholder redemption activities in accordance with applicable requirements. The Report concluded that (i) the Trust’s liquidity risk management program is reasonably designed to prevent violations of the Liquidity Rule and (ii) the Trust’s liquidity risk management program had been effectively implemented during the Review Period.
26
FACTS | WHAT DOES GREEN OWL INTRINSIC VALUE FUND (THE “FUND”) DO WITH YOUR PERSONAL INFORMATION? |
| | |
Why? | Financial companies choose how they share your personal information. Federal law gives consumers the right to limit some but not all sharing. Federal law also requires us to tell you how we collect, share, and protect your personal information. Please read this notice carefully to understand what we do. |
| | |
What? | The types of personal information we collect and share depend on the product or service you have with us. This information can include: ■ Social Security number ■ account balances and account transactions ■ transaction or loss history and purchase history ■ checking account information and wire transfer instructions When you are no longer our customer, we continue to share your information as described in this notice. |
| | |
How? | All financial companies need to share customers’ personal information to run their everyday business. In the section below, we list the reasons financial companies can share their customers’ personal information; the reasons the Fund chooses to share; and whether you can limit this sharing. |
Reasons we can share your personal information | Does the Fund share? |
For our everyday business purposes—
such as to process your transactions, maintain your account(s), respond to court orders and legal investigations, or report to credit bureaus | Yes |
For our marketing purposes—
to offer our products and services to you | No |
For joint marketing with other financial companies | No |
For our affiliates’ everyday business purposes—
information about your transactions and experiences | No |
For our affiliates’ everyday business purposes—
information about your creditworthiness | No |
For nonaffiliates to market to you | No |
Questions? | Call (888) 695-3729 |
27
Who we are |
Who is providing this notice? | Green Owl Intrinsic Value Fund Ultimus Fund Distributors, LLC (Distributor) Ultimus Fund Solutions, LLC (Administrator) |
What we do |
How does the Fund
protect my personal information? | To protect your personal information from unauthorized access and use, we use security measures that comply with federal law. These measures include computer safeguards and secured files and buildings. Our service providers are held accountable for adhering to strict policies and procedures to prevent any misuse of your nonpublic personal information. |
How does the Fund
collect my personal information? | We collect your personal information, for example, when you ■ open an account or deposit money ■ buy securities from us or sell securities to us ■ make deposits or withdrawals from your account or provide account information ■ give us your account information ■ make a wire transfer ■ tell us who receives the money ■ tell us where to send the money ■ show your government-issued ID ■ show your driver’s license |
Why can’t I limit all sharing? | Federal law gives you the right to limit only ■ sharing for affiliates’ everyday business purposes—information about your creditworthiness ■ affiliates from using your information to market to you ■ sharing for nonaffiliates to market to you State laws and individual companies may give you additional rights to limit sharing. |
Definitions |
Affiliates | Companies related by common ownership or control. They can be financial and nonfinancial companies. ■ Kovitz Investment Group Partners, LLC, the investment adviser to the Fund, could be deemed to be an affiliate. |
Nonaffiliates | Companies not related by common ownership or control. They can be financial and nonfinancial companies. ■ The Fund does not share your personal information with nonaffiliates so they can market to you |
Joint marketing | A formal agreement between nonaffiliated financial companies that together market financial products or services to you. ■ The Fund doesn’t jointly market. |
28
This page intentionally left blank.
OTHER INFORMATION (Unaudited)
The Fund’s Statement of Additional Information (“SAI”) includes additional information about the trustees and is available without charge, upon request. You may call toll-free at (888) 695-3729 to request a copy of the SAI or to make shareholder inquiries.
PROXY VOTING
A description of the policies and procedures that the Fund uses to determine how to vote proxies relating to portfolio securities and information regarding how the Fund voted those proxies during the most recent twelve month period ended June 30, are available (1) without charge upon request by calling the Fund at (888) 695-3729 and (2) in Fund documents filed with the Securities and Exchange Commission (“SEC”) on the SEC’s website at www.sec.gov.
TRUSTEES Andrea N. Mullins, Chairperson Ira P. Cohen Mark J. Seger OFFICERS Adam T. Kornegay, Principal Executive Officer and President Zachary P. Richmond, Principal Financial Officer and Treasurer Kevin J. Patton, Chief Compliance Officer Carol J. Highsmith, Vice President and Secretary INVESTMENT ADVISER Kovitz Investment Group Partners, LLC 71 South Wacker Drive, Suite 1860 Chicago, IL 60606 DISTRIBUTOR Ultimus Fund Distributors, LLC 225 Pictoria Drive, Suite 450 Cincinnati, OH 45246 | INDEPENDENT REGISTERED PUBLIC ACCOUNTING FIRM Cohen & Company, Ltd. 1350 Euclid Avenue, Suite 800 Cleveland, OH 44115 LEGAL COUNSEL Troutman Pepper Hamilton Sanders LLP 3000 Two Logan Square 18th and Arch Streets Philadelphia, PA 19103 CUSTODIAN Huntington National Bank 41 South High Street Columbus, OH 43215 ADMINISTRATOR, TRANSFER AGENT AND FUND ACCOUNTANT Ultimus Fund Solutions, LLC 225 Pictoria Drive, Suite 450 Cincinnati, OH 45246 |
This report is intended only for the information of shareholders or those who have received the Fund’s prospectus which contains information about the Fund’s management fee and expenses. Please read the prospectus carefully before investing.
Distributed by Ultimus Fund Distributors, LLC
Member FINRA/SIPC

SOUND MIND INVESTING FUND (SMIFX)
SMI DYNAMIC ALLOCATION FUND (SMIDX)
SMI 50/40/10 FUND (SMILX)
ANNUAL REPORT |
October 31, 2021 |
Funds’ Adviser:
SMI Advisory Services, LLC
4400 Ray Boll Blvd.
Columbus, IN 47203
(877) 764-3863
(877) SMI-FUND
www.smifund.com

Dear Fellow Shareholder,
The past two years have been a remarkable period for both the economy and markets. The COVID-19 pandemic prompted the first ever globally coordinated economic shutdowns and prompted massive government and central bank responses. The whole period is without precedent in modern financial history and the after-effects continue to ripple through economies and markets.
When the first positive vaccine announcements came in November 2020, financial markets immediately ripped higher. Pricing in an eventual widespread economic reopening, many of the stocks that had suffered the most during 2020’s lockdowns sprang back to life.
The twelve months since then (November 2020 – October 2021) have been incredibly strong for stocks overall. However, the ripple effects of COVID — specifically the follow-on wave of the Delta variant which caused another round of rolling restrictions in 2021 — meant that stocks didn’t advance uniformly over the past year. Stock market performance was instead characterized by fits and starts as various groups of stocks took turns racing ahead then pausing (or falling back), in large part based on investors’ changing views of the future as the virus optimism/pessimism ebbed and flowed.
Taken as a whole, performance over the past twelve months was characterized by strong absolute returns, but less impressive relative returns for the trend-following strategies used by the SMI Funds. Whenever the market would favor a particular group of stocks long enough for their momentum to pick up and signal a trend change, the COVID/economic picture would shift and the market would pivot back the other way.
These short-lived bursts of a few months favoring small stocks and value names (when reopening optimism was high), then a few months pivoting back toward large stocks and growth (when pessimism would creep back in), make sense given the stop-start-stop-start economic environment of the past 12-15 months. But it made life difficult for trend-following strategies like ours that are based on the more normal economic patterns that exist most of the time outside of a pandemic!
The good news is that while these abrupt economic shifts (and the changes in market trends that accompanied them) kept us from adding relative value beyond the market’s return this year, SMI Fund investors still experienced strong absolute portfolio growth. For example, SMIFX’s +37.01% gain over the past 12 months was the fifth-strongest 12-month period in the Fund’s sixteen year history, exceeded only by the period immediately following the much deeper 2007-2009 bear market.
1
Performance Review - (Unaudited)
SMI’s Stock Upgrading strategy (the sole strategy used in SMIFX and 40% of SMILX) gained +37.01% from November 1, 2020 through October 31, 2021. In many respects, this was the mirror image from the year prior. Our letter a year ago reported how SMIFX had beat its fund peer group (strong relative performance), yet its one-year return was just +3.92% (weak absolute performance). This year, our absolute return was nearly 10 times stronger, yet the Fund trailed its peer group and benchmarks!
As noted earlier, the biggest reason for the Fund’s relative underperformance was the market’s unusually rapid pivots from favoring large/growth stocks to smaller/value stocks, and vice versa. It’s important to note how unusual it is for these types of swings to happen abruptly and repeatedly within a single 12-month period. As the intensity of the economic response to future COVID variants and waves diminishes, so too should the severity of these market pivots.
The decision to allocate a portion of the Fund to commodities through the first half of 2021 helped performance, as that position generated a strong return of nearly +30% in just six months. We’re excited about the new framework we’ve developed for investing within the commodities sector to help us deal with what we believe will be a more inflationary environment ahead.
SMI’s Dynamic Asset Allocation strategy (the sole strategy used in SMIDX and 50% of SMILX) ended the 12-month period with a strong absolute return of +18.17%.
Normally when the stock market rises rapidly, the DAA strategy lags because its maximum allocation to U.S. Stocks is limited. This was the case over the past year, but thankfully DAA’s allocations to Foreign Stocks and Real Estate through much of 2021 also experienced solid gains (though not as strong as U.S. stocks).
Digging deeper, SMIDX performed in the top 25% of its Morningstar peer group over the last six months of the report period. Not surprisingly, then, the challenges came primarily during the first half of the period. Market weakness in September - October 2020 was strong enough to cause DAA to remove its allocation to Foreign Stocks, just as the global stock market was about to soar higher in November following the vaccine announcements. SMIDX’s position in gold also hurt performance during January-February of 2021. But since clearing that position, the portfolio has been in the very strong combination of U.S. & Foreign Stocks plus Real Estate, which we feel has performed quite well.
Most importantly, while 2020 illustrated how well DAA can protect our portfolios during bear markets in stocks, 2021 showed that the strategy is still capable of participating to a significant degree in the market’s upside gains. It won’t ever capture all of the upside in a raging bull market rally such as we’ve had over the last year. But it’s not limited to bond-like returns either (which lost money as a whole over this period). DAA’s +18.2% gain over the past 12 months demonstrates solid upside participation from this strategy that is primarily focused on limiting downside risk.
SMI’s 50/40/10 portfolio (used in SMILX) consists of 50% DAA, 40% Stock Upgrading, and 10% in a strategy called Sector Rotation. From November 1, 2020 through October 31, 2021, the SMI 50/40/10 Fund returned +25.51%.
Having already covered Stock Upgrading and DAA, which make up 90% of the Fund’s weighting, the final component to discuss is the 10% Sector Rotation allocation. This portion of the Fund was disappointing, gaining just +10.9%. When the broader stock market is as strong as it was over the past year, Sector Rotation is normally an exceptional performer. But after soaring through the middle of February, Sector Rotation
2
ended up giving back the bulk of those gains as more speculative stocks were hit hard in the second quarter of 2021. This prompted a full review of the Sector Rotation process, which culminated in some adjustments to this approach that the managers believe will make the strategy less susceptible to such large performance swings in the future.
Conclusion
The past year has been marked by incredible growth in financial assets. The extremes of the past two years illustrate the need for strategies that can adapt to any market environment. Ultimately, having that type of confidence in one’s investing approach is what enables an investor to stay invested so as to reap the benefits of a strong year like 2021 after the frightening experience of a 2020. Investors in the SMI Funds have been rewarded by generally strong growth in their portfolios over the past 12 months.
Importantly, all of the SMI Funds utilize quantitative strategies supported by extensive testing and, with the exception of DAA, long performance histories. We’ve seen these strategies adapt to the extremes of the fastest bear market in history (2020) and then pivot strongly back the other direction in the face of a raging bull market (2021). While recent returns have been rewarding, it has been an exceptionally challenging environment to navigate.
We appreciate the opportunity to serve you!
Blessings,

Mark Biller
Senior Portfolio Manager
The Sound Mind Investing Funds
The SMI Fund lineup, shown below, now offers investors a way to mix and match professionally managed funds to custom tailor the risk level desired for their portfolio. If you’d like assistance customizing your portfolio in this manner, please call a Stewardship Advisor at (800) 796-4975.
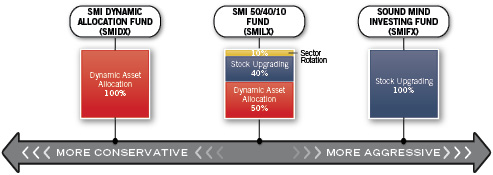
3
PERFORMANCE RESULTS – (Unaudited)
Average Annual Total Returns(a)
(For the periods ended October 31, 2021) |
| | Three
Months | Six Months | One Year | Five Year | Ten Year |
Sound Mind Investing Fund | 4.20% | 4.51% | 37.01% | 13.06% | 10.89% |
Wilshire 5000® Total Market Index(b) | 5.00% | 10.07% | 44.44% | 19.03% | 16.16% |
S&P 500® Index(b) | 5.13% | 10.91% | 42.91% | 18.93% | 16.21% |
SMI Custom Index(c) | 3.62% | 5.74% | 44.95% | 15.82% | 13.43% |
Total annual operating expenses, as disclosed in the Sound Mind Investing Fund’s (“SMI Fund”) prospectus dated June 8, 2021, were 1.98% of average daily net assets, which includes acquired fund fees and expenses. All expenses are reflected in performance results. SMI Advisory Services, LLC (the “Adviser”) contractually has agreed to waive its fee and/or reimburse certain operating expenses, but only to the extent necessary so that total annual operating expenses (excluding interest, taxes, brokerage commissions, other expenses which are capitalized in accordance with generally accepted accounting principles, extraordinary expenses, dividend expense on short sales, 12b-1 fees, and acquired fund fees and expenses) do not exceed 1.50% of the SMI Fund’s average daily net assets through February 28, 2022. Each waiver or reimbursement of an expense by the Adviser is subject to repayment by the SMI Fund within the three years following the date of such waiver or reimbursement, provided that the SMI Fund is able to make the repayment without exceeding the expense limitation in place at the time of the fee waiver or reimbursement and the expense limitation at the time of the repayment. This expense cap may not be terminated prior to this date except by the Board of Trustees (the “Board”). |
Average Annual Total Returns(a)
(For the periods ended October 31, 2021) |
| | Three
Months | Six Months | One Year | Five Year | Since Inception
(February 28, 2013) |
SMI Dynamic Allocation Fund | 2.27% | 6.32% | 18.17% | 6.97% | 5.69% |
Wilshire 5000® Total Market Index(b) | 5.00% | 10.07% | 44.44% | 19.03% | 15.86% |
Bloomberg U.S. Aggregate Bond Index(b) | -1.08% | 1.06% | -0.48% | 3.10% | 2.87% |
Weighted Index(c) | 2.60% | 6.46% | 24.83% | 12.75% | 10.76% |
Total annual operating expenses, as disclosed in the SMI Dynamic Allocation Fund’s prospectus dated June 8, 2021, were 1.52% of average daily net assets, which includes acquired fund fees and expenses. All expenses are reflected in performance results. The Adviser contractually has agreed to waive its fee and/or reimburse certain operating expenses, but only to the extent necessary so that total annual operating expenses (excluding interest, taxes, brokerage commissions, other expenses which are capitalized in accordance with generally accepted accounting principles, extraordinary expenses, dividend expense on short sales, 12b-1 fees, and acquired fund fees and expenses) do not exceed 1.45% of the SMI Dynamic Allocation Fund’s average daily net assets through February 28, 2022. Each waiver or reimbursement of an expense by the Adviser is subject to repayment by the SMI Dynamic Allocation Fund within the three years following the date of such waiver or reimbursement, provided that the SMI Dynamic Allocation Fund is able to make the repayment without exceeding the expense limitation in place at the time of the fee waiver or reimbursement and the expense limitation at the time of the repayment. This expense cap may not be terminated prior to this date except by the Board. |
4
PERFORMANCE RESULTS – (Unaudited), (Continued)
Average Annual Total Returns(a)
(For the periods ended October 31, 2021) |
| | Three
Months | Six Months | One Year | Five Year | Since Inception
(April 29, 2015) |
SMI 50/40/10 Fund | 3.17% | 3.52% | 25.51% | 10.05% | 6.50% |
Wilshire 5000® Total Market Index(b) | 5.00% | 10.07% | 44.44% | 19.03% | 14.94% |
Bloomberg U.S. Aggregate Bond Index(b) | -1.08% | 1.06% | -0.48% | 3.10% | 3.02% |
Weighted Index(c) | 2.60% | 6.46% | 24.83% | 12.75% | 10.34% |
Total annual operating expenses, as disclosed in the SMI 50/40/10 Fund’s prospectus dated June 8, 2021, were 1.72% of average daily net assets (1.75% before fee waivers/expense reimbursements by the Adviser), which includes acquired fund fees and expenses. All expenses are reflected in performance results. The Adviser contractually has agreed to waive its fee and/or reimburse certain operating expenses, but only to the extent necessary so that total annual operating expenses (excluding interest, taxes, brokerage commissions, other expenses which are capitalized in accordance with generally accepted accounting principles, extraordinary expenses, dividend expense on short sales, 12b-1 fees, and acquired fund fees and expenses) do not exceed 1.15% of the SMI 50/40/10 Fund’s average daily net assets through February 28, 2022. Each waiver or reimbursement of an expense by the Adviser is subject to repayment by the SMI 50/40/10 Fund within the three years following the date of such waiver or reimbursement, provided that the SMI 50/40/10 Fund is able to make the repayment without exceeding the expense limitation in place at the time of the fee waiver or reimbursement and the expense limitation at the time of the repayment. This expense cap may not be terminated prior to this date except by the Board. |
The performance quoted represents past performance, which does not guarantee future results. The investment return and principal value of an investment will fluctuate so that an investor’s shares, when redeemed, may be worth more or less than their original cost. The returns shown do not reflect deduction of taxes that a shareholder would pay on Fund distributions or the redemption of Fund shares. Current performance of the Sound Mind Investing Fund, SMI Dynamic Allocation Fund, and SMI 50/40/10 Fund (each a “Fund” and collectively the “Funds”) may be lower or higher than the performance quoted. Performance data current to the most recent month end may be obtained by calling (877) 764-3863.
(a) | Average annual total returns reflect any change in price per share and assume the reinvestment of all distributions. The Funds’ returns reflect any fee reductions during the applicable periods. If such fee reductions had not occurred, the quoted performance would have been lower. Total returns for periods less than one year are not annualized. |
(b) | The Standard & Poor’s 500® Index (“S&P 500”), Wilshire 5000® Total Market Index (“Wilshire 5000”), Bloomberg U.S. Aggregate Bond Index, Russell 1000® Value Index, Russell 1000® Growth Index, Russell 2000® Value Index, Russell 2000® Growth Index and MSCI EAFE Index (collectively, the “Indices”) are unmanaged indices that assume reinvestment of all distributions and exclude the effect of taxes and fees. These Indices are widely recognized unmanaged indices and are representative of a broader market and range of securities than is found in each Fund’s portfolio. The returns of the Indices are not reduced by any fees or operating expenses. Individuals cannot invest directly in the Indices; however, an individual can invest in exchange-traded funds or other investment vehicles that attempt to track the performance of a benchmark index. |
(c) | The SMI Custom Index for the Sound Mind Investing Fund is comprised of 20% Russell 1000® Value Index, 20% Russell 1000® Growth Index, 20% Russell 2000® Value Index, 20% Russell 2000® Growth Index and 20% MSCI EAFE Index and the Weighted Index for the SMI Dynamic Allocation Fund and the SMI 50/40/10 Fund is comprised of 60% Wilshire 5000 and 40% Bloomberg U.S. Aggregate Bond Index. |
The Funds’ investment objectives, risks, charges and expenses must be considered carefully before investing. The prospectus contains this and other important information about the Funds and may be obtained by calling the same number as above. Please read it carefully before investing.
5
PERFORMANCE RESULTS – (Unaudited), (Continued)
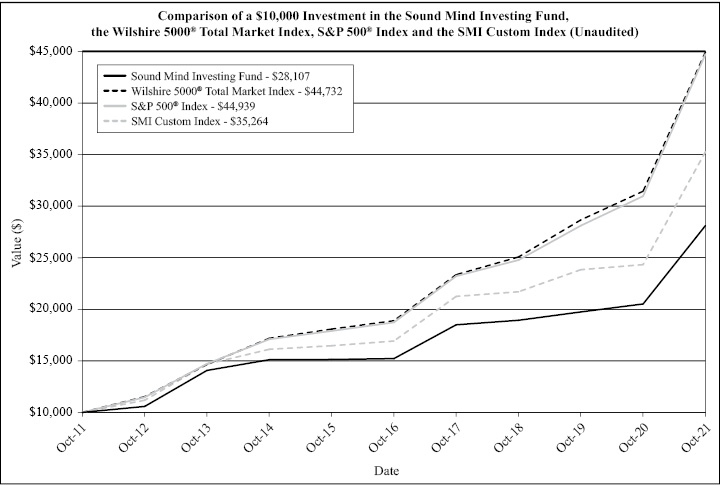
The chart above assumes an initial investment of $10,000 made on October 31, 2011 and held through October 31, 2021. THE FUND’S RETURN REPRESENTS PAST PERFORMANCE AND DOES NOT GUARANTEE FUTURE RESULTS. The returns shown do not reflect deduction of taxes that a shareholder would pay on Fund distributions or the redemption of Fund shares. Investment returns and principal values will fluctuate so that your shares, when redeemed, may be worth more or less than their original purchase price.
Current performance of the Fund may be lower or higher than the performance quoted. For more information on the Fund, and to obtain performance data current to the most recent month end or to request a prospectus, please call (877) 764-3863. You should carefully consider the investment objectives, potential risks, management fees, and charges and expenses of the Fund before investing. The Fund’s prospectus contains this and other information about the Fund, and should be read carefully before investing.
The SMI Custom Index for the Sound Mind Investing Fund is comprised of 20% Russell 1000® Value Index, 20% Russell 1000® Growth Index, 20% Russell 2000® Value Index, 20% Russell 2000® Growth Index and 20% MSCI EAFE Index.
The Fund is distributed by Ultimus Fund Distributors, LLC, member FINRA/SIPC.
6
PERFORMANCE RESULTS – (Unaudited), (Continued)
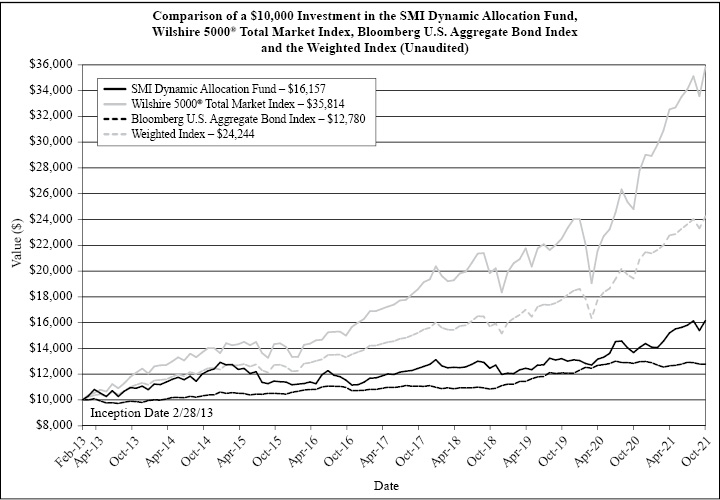
The chart above assumes an initial investment of $10,000 made on February 28, 2013 (commencement of Fund operations) and held through October 31, 2021. THE FUND’S RETURN REPRESENTS PAST PERFORMANCE AND DOES NOT GUARANTEE FUTURE RESULTS. The returns shown do not reflect deduction of taxes that a shareholder would pay on Fund distributions or the redemption of Fund shares. Investment returns and principal values will fluctuate so that your shares, when redeemed, may be worth more or less than their original purchase price.
Current performance of the Fund may be lower or higher than the performance quoted. For more information on the Fund, and to obtain performance data current to the most recent month end or to request a prospectus, please call (877) 764-3863. You should carefully consider the investment objectives, potential risks, management fees, and charges and expenses of the Fund before investing. The Fund’s prospectus contains this and other information about the Fund, and should be read carefully before investing.
The Weighted Index is comprised of 60% Wilshire 5000® Total Market Index and 40% Bloomberg U.S. Aggregate Bond Index.
The Fund is distributed by Ultimus Fund Distributors, LLC, member FINRA/SIPC.
7
PERFORMANCE RESULTS – (Unaudited), (Continued)
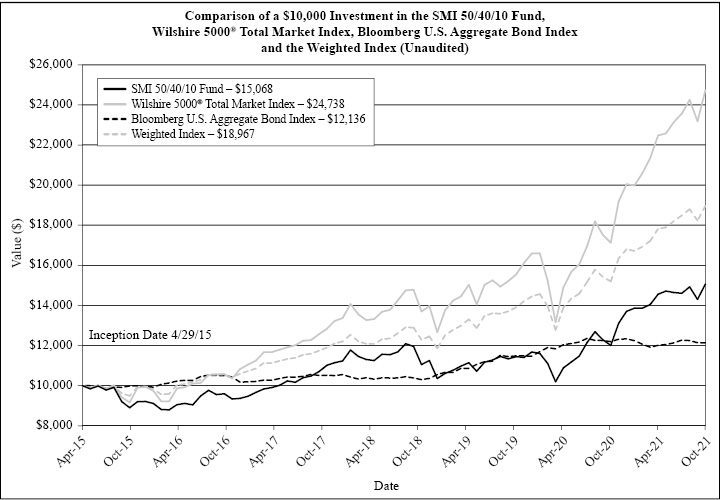
The chart above assumes an initial investment of $10,000 made on April 29, 2015 (commencement of Fund operations) and held through October 31, 2021. THE FUND’S RETURN REPRESENTS PAST PERFORMANCE AND DOES NOT GUARANTEE FUTURE RESULTS. The returns shown do not reflect deduction of taxes that a shareholder would pay on Fund distributions or the redemption of Fund shares. Investment returns and principal values will fluctuate so that your shares, when redeemed, may be worth more or less than their original purchase price. The information presented above, for the periods prior to April 28, 2018 is historical information for the Former SMI 50/40/10 Fund.
Current performance of the Fund may be lower or higher than the performance quoted. For more information on the Fund, and to obtain performance data current to the most recent month end or to request a prospectus, please call (877) 764-3863. You should carefully consider the investment objectives, potential risks, management fees, and charges and expenses of the Fund before investing. The Fund’s prospectus contains this and other information about the Fund, and should be read carefully before investing.
The Weighted Index is comprised of 60% Wilshire 5000® Total Market Index and 40% Bloomberg U.S. Aggregate Bond Index.
The Fund is distributed by Ultimus Fund Distributors, LLC, member FINRA/SIPC.
8
FUND HOLDINGS – (Unaudited)
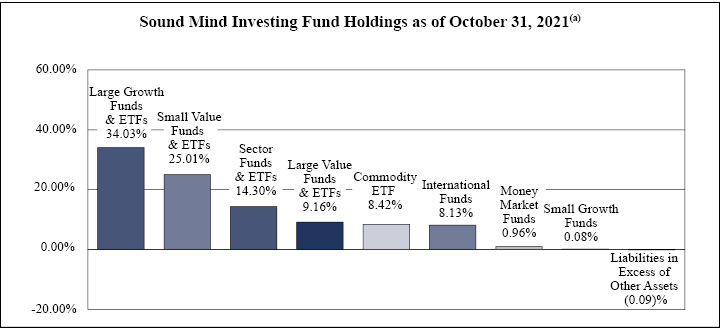
(a) | As a percentage of net assets. |
Sound Mind Investing Fund seeks long-term capital appreciation. The Fund seeks to achieve its objective by investing in a diversified portfolio of other investment companies using a “Stock Upgrading” strategy. The Stock Upgrading investment strategy is a systematic investment approach that is based on the belief of the Adviser that superior returns can be obtained by constantly monitoring the performance of a wide universe of other investment companies and standing ready to move assets into the funds deemed by the Adviser to be most attractive at the time of analysis. This upgrading process strives to keep assets invested in funds that are demonstrating superior current performance relative to their peers as determined by a combination of size and investment style criteria.
9
FUND HOLDINGS – (Unaudited), (Continued)
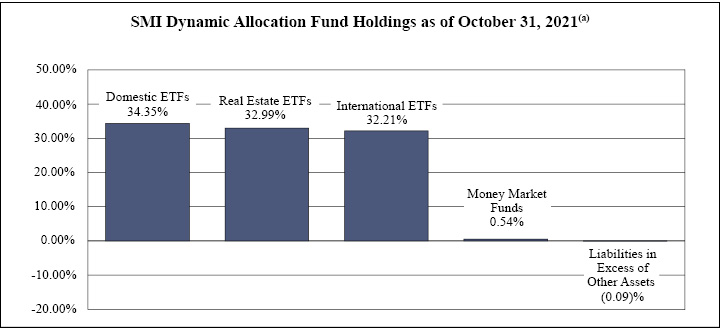
(a) | As a percentage of net assets. |
SMI Dynamic Allocation Fund seeks total return. Total return is composed of both income and capital appreciation. The Fund uses a “Dynamic Asset Allocation” investment strategy to achieve its investment objective. This is done by investing in open-end mutual funds and exchange-traded funds (“ETFs”) that invest in securities from the following six asset classes – U.S. Equities, International Equities, Fixed Income Securities, Real Estate, Precious Metals, and Cash.
10
FUND HOLDINGS – (Unaudited), (Continued)
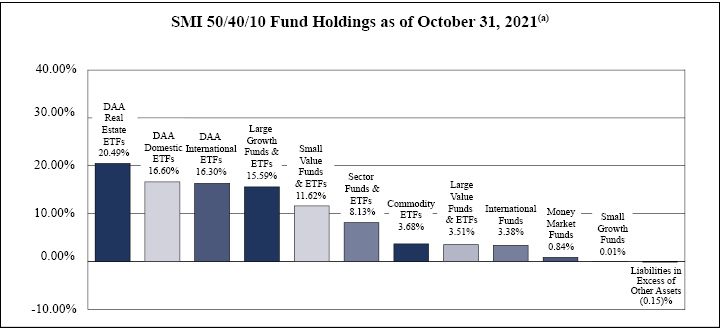
(a) | As a percentage of net assets. |
SMI 50/40/10 Fund seeks total return. Total return is composed of both income and capital appreciation. The Adviser allocates the Fund’s assets on a 50/40/10 basis among various investment strategies as follows:
| | ● | 50% - Dynamic Asset Allocation Strategy (“DAA”) |
| | ● | 40% - Stock Upgrading Strategy |
| | ● | 10% - Sector Rotation Strategy |
The “Sector Rotation Strategy” involves the Adviser selecting from a universe of mutual funds and ETFs it has compiled using proprietary methods (“Underlying Funds”). This universe is specifically designed by the Adviser to balance exposure to a wide variety of market sectors and industries. This universe includes leveraged, non-leveraged and inverse Underlying Funds. The Adviser ranks these Underlying Funds based on their recent performance across multiple short-term performance periods, then uses an upgrading approach to invest in the top performing market sector or sectors. Once a particular sector or sectors is identified, the Adviser purchases one or more Underlying Funds to gain the desired exposure to that particular sector. This portion of the Fund may be concentrated, meaning that the Fund may be invested in as few as one or two sectors at a time and potentially as few as one Underlying Fund.
Availability of Portfolio Schedules – (Unaudited)
The Funds file their complete schedules of portfolio holdings with the Securities and Exchange Commission (“SEC”) for the first and third quarters of each fiscal year as an exhibit to its reports on Form N-PORT. The Funds’ Form N-PORT reports are available on the SEC’s website at http://www.sec.gov and on the Funds’ website at www.smifund.com.
11
SOUND MIND INVESTING FUND
SCHEDULE OF INVESTMENTS
October 31, 2021
EXCHANGE-TRADED FUNDS – 66.32% | | Shares | | | Fair Value | |
First Trust Natural Gas ETF | | | 197,020 | | | $ | 3,615,317 | |
Invesco KBW Regional Banking ETF | | | 27,690 | | | | 1,745,544 | |
Invesco Optimum Yield Diversified Commodity Strategy No K-1 ETF | | | 571,060 | | | | 12,637,558 | |
Invesco S&P 500® GARP ETF | | | 64,750 | | | | 6,012,038 | |
Invesco S&P 500® High Beta ETF | | | 174,470 | | | | 13,711,597 | |
Invesco S&P SmallCap 600 Pure Value ETF | | | 48,880 | | | | 4,725,997 | |
iShares Russell 1000 Growth ETF(a) | | | 130,590 | | | | 38,915,819 | |
iShares Russell 2000 Value ETF | | | 76,920 | | | | 12,797,950 | |
SPDR S&P Oil & Gas Exploration & Production ETF | | | 34,340 | | | | 3,652,402 | |
SPDR S&P Regional Banking ETF | | | 24,690 | | | | 1,750,768 | |
Total Exchange-Traded Funds (Cost $92,840,413) | | | | | | | 99,564,990 | |
| | | | | | | | | |
MUTUAL FUNDS – 32.81% | | | | | | | | |
Akre Focus Fund, Institutional Class | | | 101 | | | | 6,957 | |
AllianzGI Dividend Value Fund | | | 200 | | | | 2,748 | |
AllianzGI NFJ Small-Cap Value Fund | | | 162 | | | | 3,119 | |
American Century Equity Income Fund, Investor Class | | | 100 | | | | 1,014 | |
American Century International Opportunities Fund, Institutional Class | | | 360 | | | | 5,390 | |
AMG Yacktman Focused Fund, Institutional Class | | | 100 | | | | 2,185 | |
AMG Yacktman Fund, Institutional Class | | | 100 | | | | 2,510 | |
Artisan International Small Cap Fund, Investor Class | | | 100 | | | | 2,152 | |
Artisan International Value Fund, Investor Class | | | 150 | | | | 6,866 | |
Artisan Mid Cap Value Fund, Investor Class | | | 279 | | | | 6,677 | |
Artisan Small Cap Fund, Investor Class | | | 125 | | | | 6,528 | |
BlackRock International Opportunities Portfolio, Institutional Class | | | 100 | | | | 3,531 | |
BNY Mellon Opportunistic Small Cap Fund, Investor Class | | | 100 | | | | 3,864 | |
Bridgeway Small-Cap Value Fund, Class N | | | 231,896 | | | | 8,995,239 | |
Bridgeway Ultra-Small Company Market Fund, Class N | | | 100 | | | | 1,849 | |
Brown Advisory Sustainable Growth Fund, Institutional Class (b) | | | 20,412 | | | | 1,042,866 | |
Buffalo Small Cap Fund, Inc. | | | 150 | | | | 3,560 | |
Champlain Small Company Fund, Institutional Class | | | 100 | | | | 2,624 | |
Chartwell Small Cap Value Fund | | | 118 | | | | 2,549 | |
Columbia Acorn Fund, Class Z | | | 137 | | | | 2,497 | |
Columbia Acorn International, Class Z | | | 100 | | | | 3,765 | |
Columbia Contrarian Core Fund, Class Z | | | 91 | | | | 3,366 | |
Columbia Small Cap Growth Fund I, Class Z | | | 100 | | | | 3,522 | |
Davis Opportunity Fund, Class Y | | | 100 | | | | 4,839 | |
Delaware Select Growth Fund, Institutional Class | | | 100 | | | | 4,874 | |
Delaware Small Cap Value Fund, Institutional Class | | | 100 | | | | 8,103 | |
See accompanying notes which are an integral part of these financial statements.
12
SOUND MIND INVESTING FUND
SCHEDULE OF INVESTMENTS
October 31, 2021 – (Continued)
MUTUAL FUNDS – 32.81% - continued | | Shares | | | Fair Value | |
Delaware Value Fund, Institutional Class | | | 144 | | | $ | 3,634 | |
Deutsche Small Cap Core Fund, Institutional Class | | | 52 | | | | 2,505 | |
DFA International Small Cap Value Portfolio, Institutional Class | | | 100 | | | | 2,214 | |
DFA International Small Company Portfolio, Institutional Class | | | 100 | | | | 2,329 | |
DFA U.S. Small Cap Value Portfolio, Institutional Class | | | 100 | | | | 4,633 | |
Fairholme Fund | | | 100 | | | | 2,891 | |
Fidelity Mid-Cap Stock Fund | | | 150 | | | | 6,470 | |
Fidelity Select Energy Portfolio | | | 98,481 | | | | 3,636,892 | |
Fidelity Select Energy Service Portfolio | | | 166,745 | | | | 3,464,966 | |
Fidelity Small Cap Discovery Fund | | | 100 | | | | 3,064 | |
Fidelity Small Cap Stock Fund | | | 150 | | | | 3,423 | |
Fidelity Small Cap Value Fund | | | 150 | | | | 3,303 | |
Franklin Small Cap Value Fund, Advisor Class | | | 100 | | | | 6,539 | |
Hartford International Opportunities Fund (The), Class Y | | | 248 | | | | 5,539 | |
Heartland Value Fund | | | 100 | | | | 5,201 | |
Hennessy Cornerstone Mid Cap 30 Fund, Institutional Class | | | 100 | | | | 2,066 | |
Hennessy Focus Fund, Investor Class | | | 50 | | | | 4,024 | |
Hennessy Small Cap Financial Fund, Investor Class | | | 114,402 | | | | 3,605,951 | |
Invesco American Value Fund, Class Y | | | 141 | | | | 6,165 | |
Invesco Oppenheimer International Small-Mid Company Fund, Class Y | | | 100 | | | | 6,300 | |
Janus Henderson Contrarian Fund, Class T | | | 100 | | | | 3,247 | |
Janus Henderson Mid Cap Value Fund, Class T | | | 200 | | | | 3,628 | |
Janus Henderson Overseas Fund, Class T | | | 100 | | | | 4,481 | |
Janus Henderson Venture Fund, Class T | | | 100 | | | | 11,296 | |
JOHCM International Select Fund, Institutional Class | | | 100 | | | | 3,242 | |
JPMorgan Mid Cap Value Fund, Institutional Class | | | 100 | | | | 4,695 | |
JPMorgan Small Cap Equity Fund, Select Class | | | 100 | | | | 7,895 | |
JPMorgan Small Cap Growth Fund, Class L | | | 100 | | | | 3,038 | |
JPMorgan U.S. Research Enhanced Equity Fund, Institutional Class | | | 100 | | | | 3,948 | |
Kinetics Internet Fund (The), No Load Class | | | 43,009 | | | | 3,027,401 | |
Longleaf Partners Fund | | | 150 | | | | 3,965 | |
Longleaf Partners International Fund | | | 150 | | | | 2,642 | |
Longleaf Partners Small-Cap Fund | | | 100 | | | | 2,664 | |
Lord Abbett Developing Growth Fund, Inc., Institutional Class | | | 100 | | | | 4,154 | |
MainStay WMC Enduring Capital Fund, Institutional Class | | | 18 | | | | 659 | |
Miller Opportunity Trust, Institutional Class | | | 100 | | | | 4,662 | |
Morgan Stanley Discovery Portfolio, Institutional Class | | | 100 | | | | 4,672 | |
Morgan Stanley Growth Portfolio, Institutional Class | | | 100 | | | | 10,652 | |
Neuberger Berman Genesis Fund, Institutional Class | | | 100 | | | | 8,168 | |
See accompanying notes which are an integral part of these financial statements.
13
SOUND MIND INVESTING FUND
SCHEDULE OF INVESTMENTS
October 31, 2021 – (Continued)
MUTUAL FUNDS – 32.81% - continued | | Shares | | | Fair Value | |
Nicholas Fund, Inc. | | | 50 | | | $ | 4,435 | |
Oakmark International Fund, Investor Class | | | 150 | | | | 4,370 | |
Oakmark International Small Cap Fund, Institutional Class | | | 150 | | | | 3,053 | |
Oakmark Select Fund, Institutional Class | | | 150 | | | | 9,723 | |
Polen Growth Fund, Institutional Class | | | 35,818 | | | | 2,053,781 | |
PRIMECAP Odyssey Aggressive Growth Fund | | | 100 | | | | 6,037 | |
Principal SmallCap Growth Fund I, Institutional Class | | | 200 | | | | 4,110 | |
Prudential Jennison International Opportunities, Class Z | | | 185 | | | | 7,257 | |
Royce Micro-Cap Fund, Investment Class | | | 106 | | | | 1,737 | |
Royce Opportunity Fund, Investment Class | | | 318 | | | | 6,459 | |
Royce Premier Fund, Investment Class | | | 300 | | | | 4,605 | |
Royce Special Equity Fund, Institutional Class | | | 150 | | | | 3,195 | |
T. Rowe Price International Discovery Fund, Investor Class | | | 75 | | | | 7,406 | |
T. Rowe Price Mid-Cap Growth Fund, Investor Class | | | 50 | | | | 6,491 | |
T. Rowe Price New Horizons Fund, Investor Class | | | 100 | | | | 9,860 | |
T. Rowe Price Small-Cap Value Fund, Investor Class | | | 100 | | | | 6,654 | |
Thornburg Value Fund, Institutional Class | | | 100 | | | | 10,480 | |
TIAA-CREF International Equity Fund, Institutional Class | | | 100 | | | | 1,461 | |
Touchstone Sands Capital Select Growth Fund, Class Y | | | 100 | | | | 2,400 | |
Tweedy Browne International Value Fund | | | 150 | | | | 4,725 | |
Vanguard Strategic Equity Fund, Investor Class | | | 100 | | | | 4,625 | |
Victory RS Small Cap Growth Fund, Class Y | | | 100 | | | | 9,684 | |
Vulcan Value Partners Small Cap Fund, Institutional Class | | | 394,933 | | | | 10,923,849 | |
Wasatch Emerging Markets Small Cap Fund, Investor Class | | | 1,386,620 | | | | 6,073,394 | |
Wasatch International Growth Fund, Investor Class | | | 150 | | | | 5,933 | |
Wasatch Micro Cap Fund, Investor Class | | | 100 | | | | 1,304 | |
Wastach Emerging Markets Select Fund, Institutional Class(b) | | | 256,302 | | | | 6,043,604 | |
Total Mutual Funds (Cost $47,052,073) | | | | | | | 49,247,044 | |
| | | | | | | | | |
See accompanying notes which are an integral part of these financial statements.
14
SOUND MIND INVESTING FUND
SCHEDULE OF INVESTMENTS
October 31, 2021 – (Continued)
MONEY MARKET FUNDS – 0.96% | | Shares | | | Fair Value | |
Fidelity Investments Money Market Government Portfolio, Institutional Class, 0.01%(c) | | | 1,445,094 | | | $ | 1,445,094 | |
Total Money Market Funds (Cost $1,445,094) | | | | | | | 1,445,094 | |
Total Investments — 100.09% (Cost $141,337,580) | | | | | | $ | 150,257,128 | |
Liabilities in Excess of Other Assets — (0.09)% | | | | | | | (139,847 | ) |
NET ASSETS — 100.00% | | | | | | $ | 150,117,281 | |
(a) | Represents an investment greater than 25% of the Fund’s net assets. Performance of the Fund may be adversely impacted by concentrated investments in securities. The financial statements and portfolio holdings for these securities can be found at www.sec.gov. As of October 31, 2021, the percentage of net assets invested in iShares Russell 1000 Growth ETF was 25.92% of the Fund. |
(b) | Non-income producing security. |
(c) | Rate disclosed is the seven day effective yield as of October 31, 2021. |
ETF - Exchange-Traded Fund
SPDR - Standard & Poor’s Depositary Receipt
See accompanying notes which are an integral part of these financial statements.
15
SMI DYNAMIC ALLOCATION FUND
SCHEDULE OF INVESTMENTS
October 31, 2021
EXCHANGE-TRADED FUNDS – 99.55% | | Shares | | | Fair Value | |
iShares MSCI EAFE ETF(a) | | | 480,040 | | | $ | 38,638,419 | |
iShares S&P Small-Cap 600 Value ETF | | | 194,830 | | | | 20,174,647 | |
Real Estate Select Sector SPDR Fund | | | 174,040 | | | | 8,322,593 | |
SPDR S&P 500® ETF | | | 45,800 | | | | 21,033,650 | |
Vanguard Real Estate ETF(a) | | | 286,670 | | | | 31,258,497 | |
Total Exchange-Traded Funds (Cost $101,486,693) | | | | | | | 119,427,806 | |
MONEY MARKET FUNDS – 0.54% | | | | | | | | |
Fidelity Investments Money Market Government Portfolio, Institutional Class, 0.01%(b) | | | 645,947 | | | | 645,947 | |
Total Money Market Funds (Cost $645,947) | | | | | | | 645,947 | |
Total Investments — 100.09% (Cost $102,132,640) | | | | | | $ | 120,073,753 | |
Liabilities in Excess of Other Assets — (0.09)% | | | | | | | (110,094 | ) |
NET ASSETS — 100.00% | | | | | | $ | 119,963,659 | |
(a) | Represents an investment greater than 25% of the Fund’s net assets. Performance of the Fund may be adversely impacted by concentrated investments in securities. The financial statements and portfolio holdings for these securities can be found at www.sec.gov. As of October 31, 2021, the percentage of net assets invested in iShares MSCI EAFE ETF and Vanguard Real Estate ETF was 32.21% and 26.06%,respectively. |
(b) | Rate disclosed is the seven day effective yield as of October 31, 2021. |
ETF - Exchange-Traded Fund
SPDR - Standard & Poor’s Depositary Receipt
See accompanying notes which are an integral part of these financial statements.
16
SMI 50/40/10 FUND
SCHEDULE OF INVESTMENTS
October 31, 2021
EXCHANGE-TRADED FUNDS – 81.92% | | Shares | | | Fair Value | |
First Trust Natural Gas ETF | | | 44,030 | | | $ | 807,951 | |
Invesco KBW Regional Banking ETF | | | 4,840 | | | | 305,108 | |
Invesco Optimum Yield Diversified Commodity Strategy No K-1 ETF | | | 114,600 | | | | 2,536,098 | |
Invesco S&P 500® GARP ETF | | | 12,830 | | | | 1,191,266 | |
Invesco S&P 500® High Beta ETF | | | 30,790 | | | | 2,419,786 | |
Invesco S&P SmallCap 600 Pure Value ETF | | | 5,160 | | | | 498,898 | |
iShares MSCI EAFE ETF | | | 139,490 | | | | 11,227,550 | |
iShares Russell 1000 Growth ETF | | | 27,250 | | | | 8,120,500 | |
iShares Russell 2000 Value ETF | | | 15,990 | | | | 2,660,416 | |
iShares S&P Small-Cap 600 Value ETF | | | 51,680 | | | | 5,351,464 | |
Real Estate Select Sector SPDR Fund | | | 53,800 | | | | 2,572,716 | |
SPDR S&P 500® ETF | | | 13,240 | | | | 6,080,470 | |
SPDR S&P Oil & Gas Exploration & Production ETF | | | 7,670 | | | | 815,781 | |
SPDR S&P Regional Banking ETF | | | 4,310 | | | | 305,622 | |
Vanguard Real Estate ETF | | | 105,840 | | | | 11,540,793 | |
Total Exchange-Traded Funds (Cost $49,771,290) | | | | | | | 56,434,419 | |
MUTUAL FUNDS – 17.39% | | | | | | | | |
AMG Yacktman Focused Fund, Institutional Class | | | 100 | | | | 2,185 | |
Bridgeway Small-Cap Value Fund, Class N | | | 62,447 | | | | 2,422,299 | |
Brown Advisory Sustainable Growth Fund, Institutional Class(a) | | | 5,103 | | | | 260,716 | |
Fidelity Select Energy Portfolio | | | 22,006 | | | | 812,696 | |
Fidelity Select Energy Service Portfolio | | | 29,131 | | | | 605,344 | |
Hennessy Small Cap Financial Fund, Investor Class | | | 28,705 | | | | 904,789 | |
Invesco Oppenheimer International Small-Mid Company Fund, Class Y | | | 100 | | | | 6,300 | |
Kinetics Internet Fund (The), No Load Class | | | 11,469 | | | | 807,307 | |
Longleaf Partners International Fund | | | 150 | | | | 2,642 | |
Lord Abbett Developing Growth Fund, Inc., Institutional Class | | | 100 | | | | 4,154 | |
Miller Opportunity Trust, Institutional Class | | | 100 | | | | 4,662 | |
Morgan Stanley Discovery Portfolio, Institutional Class | | | 100 | | | | 4,672 | |
Oakmark International Fund, Investor Class | | | 50 | | | | 1,457 | |
Polen Growth Fund, Institutional Class | | | 6,224 | | | | 356,878 | |
ProFunds Real Estate UltraSector ProFund, Investor Class(a) | | | 15,913 | | | | 1,043,921 | |
Vulcan Value Partners Small Cap Fund, Investor Class | | | 87,351 | | | | 2,416,116 | |
Wasatch Emerging Markets Small Cap Fund, Investor Class | | | 265,177 | | | | 1,161,477 | |
Wasatch International Growth Fund, Investor Class | | | 100 | | | | 3,955 | |
Wastach Emerging Markets Select Fund, Institutional Class(a) | | | 49,003 | | | | 1,155,491 | |
Total Mutual Funds (Cost $11,454,800) | | | | | | | 11,977,061 | |
See accompanying notes which are an integral part of these financial statements.
17
SMI 50/40/10 FUND
SCHEDULE OF INVESTMENTS
October 31, 2021 – (Continued)
MONEY MARKET FUNDS – 0.84% | | Shares | | | Fair Value | |
Fidelity Investments Money Market Government Portfolio, Institutional Class, 0.01%(b) | | | 578,307 | | | $ | 578,307 | |
Total Money Market Funds (Cost $578,307) | | | | | | | 578,307 | |
Total Investments — 100.15% (Cost $61,804,397) | | | | | | $ | 68,989,787 | |
Liabilities in Excess of Other Assets — (0.15)% | | | | | | | (105,237 | ) |
NET ASSETS — 100.00% | | | | | | $ | 68,884,550 | |
(a) | Non-income producing security. |
(b) | Rate disclosed is the seven day effective yield as of October 31, 2021. |
ETF - Exchange-Traded Fund
SPDR - Standard & Poor’s Depositary Receipt
See accompanying notes which are an integral part of these financial statements.
18
SMI FUNDS
STATEMENTS OF ASSETS AND LIABILITIES
October 31, 2021
| | | Sound Mind
Investing Fund | | | SMI Dynamic
Allocation Fund | | | SMI
50/40/10 Fund | |
Assets | | | | | | | | | | | | |
Investments in securities at fair value (cost $141,337,580, $102,132,640 and $61,804,397) (Note 3) | | $ | 150,257,128 | | | $ | 120,073,753 | | | $ | 68,989,787 | |
Receivable for fund shares sold | | | 11,625 | | | | 19,441 | | | | 1,692 | |
Receivable for investments sold | | | 750,000 | | | | — | | | | 200,000 | |
Dividends receivable | | | 12 | | | | 5 | | | | 4 | |
Prepaid expenses | | | 19,941 | | | | 12,616 | | | | 19,751 | |
Total Assets | | | 151,038,706 | | | | 120,105,815 | | | | 69,211,234 | |
| | | | | | | | | | | | | |
Liabilities | | | | | | | | | | | | |
Payable for fund shares redeemed | | | 998 | | | | 4,333 | | | | 38,000 | |
Payable for investments purchased | | | 750,000 | | | | — | | | | 200,000 | |
Payable to Adviser (Note 4) | | | 125,276 | | | | 99,893 | | | | 53,240 | |
Payable to Administrator (Note 4) | | | 7,845 | | | | 5,660 | | | | 3,900 | |
Payable to trustees | | | 1,860 | | | | 1,750 | | | | 1,525 | |
Other accrued expenses | | | 35,446 | | | | 30,520 | | | | 30,019 | |
Total Liabilities | | | 921,425 | | | | 142,156 | | | | 326,684 | |
Net Assets | | $ | 150,117,281 | | | $ | 119,963,659 | | | $ | 68,884,550 | |
| | | | | | | | | | | | | |
Net Assets consist of: | | | | | | | | | | | | |
Paid-in capital | | | 99,776,014 | | | | 93,578,490 | | | | 52,297,776 | |
Accumulated earnings | | | 50,341,267 | | | | 26,385,169 | | | | 16,586,774 | |
Net Assets | | $ | 150,117,281 | | | $ | 119,963,659 | | | $ | 68,884,550 | |
Shares outstanding (unlimited number of shares authorized, no par value) | | | 10,988,750 | | | | 8,590,154 | | | | 5,574,197 | |
Net asset value, offering and redemption price per share (Note 2) | | $ | 13.66 | | | $ | 13.97 | | | $ | 12.36 | |
See accompanying notes which are an integral part of these financial statements.
19
SMI FUNDS
STATEMENTS OF OPERATIONS
For the year ended October 31, 2021
| | | Sound Mind
Investing Fund | | | SMI Dynamic
Allocation Fund | | | SMI
50/40/10 Fund | |
Investment Income | | | | | | | | | | | | |
Dividend income | | $ | 1,605,305 | | | $ | 2,288,351 | | | $ | 1,022,084 | |
Total investment income | | | 1,605,305 | | | | 2,288,351 | | | | 1,022,084 | |
| | | | | | | | | | | | | |
Expenses | | | | | | | | | | | | |
Investment Adviser fees (Note 4) | | | 1,491,429 | | | | 1,164,615 | | | | 611,102 | |
Administration fees (Note 4) | | | 41,608 | | | | 32,319 | | | | 19,208 | |
Registration fees | | | 26,652 | | | | 28,747 | | | | 23,979 | |
Transfer agent fees (Note 4) | | | 24,690 | | | | 10,486 | | | | 10,778 | |
Fund accounting fees (Note 4) | | | 22,067 | | | | 17,141 | | | | 9,998 | |
Printing and postage expenses | | | 19,003 | | | | 13,821 | | | | 9,003 | |
Audit and tax preparation fees | | | 17,460 | | | | 17,460 | | | | 17,460 | |
Legal fees | | | 16,570 | | | | 15,064 | | | | 16,570 | |
Custodian fees | | | 12,134 | | | | 6,460 | | | | 6,984 | |
Compliance service fees (Note 4) | | | 8,100 | | | | 8,100 | | | | 8,100 | |
Trustee fees (Note 4) | | | 7,387 | | | | 6,689 | | | | 5,626 | |
Line of credit fees | | | 6,760 | | | | 5,075 | | | | 2,963 | |
Insurance expenses | | | 2,199 | | | | 2,499 | | | | 2,452 | |
Interest expense | | | 589 | | | | 708 | | | | 689 | |
Miscellaneous expenses | | | 43,174 | | | | 30,257 | | | | 28,800 | |
Total expenses | | | 1,739,822 | | | | 1,359,441 | | | | 773,712 | |
Fees recouped by Adviser | | | — | | | | — | | | | 11,618 | |
Net operating expenses | | | 1,739,822 | | | | 1,359,441 | | | | 785,330 | |
Net investment income (loss) | | | (134,517 | ) | | | 928,910 | | | | 236,754 | |
| | | | | | | | | | | | | |
Net Realized and Change in Unrealized Gain (Loss) on Investments | | | | | | | | | | | | |
Long term capital gain dividends from investment companies | | | 4,680,807 | | | | 847,386 | | | | 786,807 | |
Net realized gain on investment securities transactions | | | 49,217,835 | | | | 7,158,116 | | | | 11,770,129 | |
Net increase from payments by Adviser for investment losses (Note 4) | | | — | | | | 225,012 | | | | — | |
Net change in unrealized appreciation (depreciation) on investment securities | | | (8,908,040 | ) | | | 10,095,688 | | | | 1,694,676 | |
Net realized and change in unrealized gain on investments | | | 44,990,602 | | | | 18,326,202 | | | | 14,251,612 | |
Net increase in net assets resulting from operations | | $ | 44,856,085 | | | $ | 19,255,112 | | | $ | 14,488,366 | |
See accompanying notes which are an integral part of these financial statements.
20
SOUND MIND INVESTING FUND
STATEMENTS OF CHANGES IN NET ASSETS
| | | For the Year
Ended
October 31, 2021 | | | For the Year
Ended
October 31, 2020 | |
Increase (Decrease) in Net Assets due to: | | | | | | | | |
Operations | | | | | | | | |
Net investment loss | | $ | (134,517 | ) | | $ | (503,216 | ) |
Long term capital gain dividends from investment companies | | | 4,680,807 | | | | 3,011,228 | |
Net realized gain (loss) on investment securities transactions | | | 49,217,835 | | | | (4,819,482 | ) |
Net change in unrealized appreciation (depreciation) of investment securities | | | (8,908,040 | ) | | | 7,174,100 | |
Net increase in net assets resulting from operations | | | 44,856,085 | | | | 4,862,630 | |
| | | | | | | | | |
Distributions to Shareholders from Earnings (Note 2) | | | — | | | | (706,878 | ) |
| | | | | | | | | |
Capital Transactions | | | | | | | | |
Proceeds from shares sold | | | 9,454,512 | | | | 6,831,421 | |
Reinvestment of distributions | | | — | | | | 693,203 | |
Amount paid for shares redeemed | | | (28,968,665 | ) | | | (34,554,822 | ) |
Net decrease in net assets resulting from capital transactions | | | (19,514,153 | ) | | | (27,030,198 | ) |
Total Increase (Decrease) in Net Assets | | | 25,341,932 | | | | (22,874,446 | ) |
| | | | | | | | | |
Net Assets | | | | | | | | |
Beginning of year | | | 124,775,349 | | | | 147,649,795 | |
End of year | | $ | 150,117,281 | | | $ | 124,775,349 | |
| | | | | | | | | |
Share Transactions | | | | | | | | |
Shares sold | | | 746,447 | | | | 744,801 | |
Shares issued in reinvestment of distributions | | | — | | | | 69,320 | |
Shares redeemed | | | (2,268,368 | ) | | | (3,614,487 | ) |
Net decrease in shares outstanding | | | (1,521,921 | ) | | | (2,800,366 | ) |
See accompanying notes which are an integral part of these financial statements.
21
SMI DYNAMIC ALLOCATION FUND
STATEMENTS OF CHANGES IN NET ASSETS
| | | For the Year
Ended
October 31, 2021 | | | For the Year
Ended
October 31, 2020 | |
Increase (Decrease) in Net Assets due to: | | | | | | | | |
Operations | | | | | | | | |
Net investment income | | $ | 928,910 | | | $ | 507,499 | |
Long term capital gain dividends from investment companies | | | 847,386 | | | | 65,462 | |
Net realized gain on investment securities transactions | | | 7,158,116 | | | | 6,164,434 | |
Net increase from payments by Adviser for investment losses | | | 225,012 | | | | — | |
Net change in unrealized appreciation (depreciation) of investment securities | | | 10,095,688 | | | | (2,860,800 | ) |
Net increase in net assets resulting from operations | | | 19,255,112 | | | | 3,876,595 | |
| | | | | | | | | |
Distributions to Shareholders from Earnings (Note 2) | | | (5,973,351 | ) | | | (1,402,469 | ) |
| | | | | | | | | |
Capital Transactions | | | | | | | | |
Proceeds from shares sold | | | 11,324,062 | | | | 14,919,092 | |
Reinvestment of distributions | | | 5,901,945 | | | | 1,379,020 | |
Amount paid for shares redeemed | | | (23,738,841 | ) | | | (24,916,503 | ) |
Net decrease in net assets resulting from capital transactions | | | (6,512,834 | ) | | | (8,618,391 | ) |
Total Increase (Decrease) in Net Assets | | | 6,768,927 | | | | (6,144,265 | ) |
| | | | | | | | | |
Net Assets | | | | | | | | |
Beginning of year | | | 113,194,732 | | | | 119,338,997 | |
End of year | | $ | 119,963,659 | | | $ | 113,194,732 | |
| | | | | | | | | |
Share Transactions | | | | | | | | |
Shares sold | | | 871,261 | | | | 1,215,642 | |
Shares issued in reinvestment of distributions | | | 474,433 | | | | 115,592 | |
Shares redeemed | | | (1,845,584 | ) | | | (2,043,773 | ) |
Net decrease in shares outstanding | | | (499,890 | ) | | | (712,539 | ) |
See accompanying notes which are an integral part of these financial statements.
22
SMI 50/40/10 FUND
STATEMENTS OF CHANGES IN NET ASSETS
| | | For the Year
Ended
October 31, 2021 | | | For the Year
Ended
October 31, 2020 | |
Increase (Decrease) in Net Assets due to: | | | | | | | | |
Operations | | | | | | | | |
Net investment income | | $ | 236,754 | | | $ | 54,091 | |
Long term capital gain dividends from investment companies | | | 786,807 | | | | 465,258 | |
Net realized gain on investment securities transactions | | | 11,770,129 | | | | 958,023 | |
Net change in unrealized appreciation of investment securities | | | 1,694,676 | | | | 1,024,760 | |
Net increase in net assets resulting from operations | | | 14,488,366 | | | | 2,502,132 | |
| | | | | | | | | |
Distributions to Shareholders from Earnings (Note 2) | | | (210,442 | ) | | | (279,593 | ) |
| | | | | | | | | |
Capital Transactions | | | | | | | | |
Proceeds from shares sold | | | 12,438,096 | | | | 4,779,527 | |
Reinvestment of distributions | | | 206,341 | | | | 274,667 | |
Amount paid for shares redeemed | | | (14,329,246 | ) | | | (13,599,005 | ) |
Net decrease in net assets resulting from capital transactions | | | (1,684,809 | ) | | | (8,544,811 | ) |
Total Increase (Decrease) in Net Assets | | | 12,593,115 | | | | (6,322,272 | ) |
| | | | | | | | | |
Net Assets | | | | | | | | |
Beginning of year | | | 56,291,435 | | | | 62,613,707 | |
End of year | | $ | 68,884,550 | | | $ | 56,291,435 | |
| | | | | | | | | |
Share Transactions | | | | | | | | |
Shares sold | | | 1,065,535 | | | | 506,503 | |
Shares issued in reinvestment of distributions | | | 18,293 | | | | 28,641 | |
Shares redeemed | | | (1,208,402 | ) | | | (1,455,132 | ) |
Net decrease in shares outstanding | | | (124,574 | ) | | | (919,988 | ) |
See accompanying notes which are an integral part of these financial statements.
23
SOUND MIND INVESTING FUND
FINANCIAL HIGHLIGHTS
(For a share outstanding during each year)
| | |
For the Year
Ended
October 31,
2021
| |
Selected Per Share Data: | | | | |
Net asset value, beginning of year | | $ | 9.97 | |
| | | | | |
Income from investment operations: | | | | |
Net investment income (loss)(a) | | | (0.02 | ) |
Net realized and unrealized gain on investments | | | 3.71 | |
Total from investment operations | | | 3.69 | |
| | | | | |
Less distributions to shareholders from: | | | | |
Net investment income | | | — | |
Net realized gains | | | — | |
Total distributions | | | — | |
Paid in capital from redemption fees | | | — | |
Net asset value, end of year | | $ | 13.66 | |
| | | | | |
Total Return(c) | | | 37.01 | % |
| | | | | |
Ratios and Supplemental Data: | | | | |
Net assets, end of year (000 omitted) | | $ | 150,117 | |
Ratio of expenses to average net assets(d) | | | 1.17 | % |
Ratio of expenses to average net assets excluding interest expenses(d) (e) | | | 1.16 | % |
Ratio of net investment income (loss) to average net assets(a) (d) | | | (0.09 | )% |
Portfolio turnover rate | | | 300.02 | % |
(a) | Recognition of net investment income by the Fund is affected by the timing of the declaration of dividends by the underlying funds in which the Fund invests. |
(b) | Rounds to less than $0.005 per share. |
(c) | Total return in the above table represents the rate that the investor would have earned or lost on an investment in the Fund, assuming reinvestment of distributions. |
(d) | These ratios exclude the impact of expenses of the underlying funds in which the Fund invests as represented in the Schedule of Investments. |
(e) | These ratios do not include the effects of line of credit interest expense and borrowing costs. |
See accompanying notes which are an integral part of these financial statements.
24
SOUND MIND INVESTING FUND
FINANCIAL HIGHLIGHTS
(For a share outstanding during each year) – (Continued)
| |
For the Year
Ended
October 31,
2020
| | |
For the Year
Ended
October 31,
2019
| | |
For the Year
Ended
October 31,
2018
| | |
For the Year
Ended
October 31,
2017
| |
| | | | | | | | | | | | | | | | |
| | $ | 9.64 | | | $ | 11.65 | | | $ | 12.52 | | | $ | 10.30 | |
| | | | | | | | | | | | | | | | |
| | | | | | | | | | | | | | | | |
| | | (0.04 | ) | | | 0.05 | | | | 0.04 | | | | (0.05 | ) |
| | | 0.42 | | | | 0.14 | | | | 0.26 | | | | 2.27 | |
| | | 0.38 | | | | 0.19 | | | | 0.30 | | | | 2.22 | |
| | | | | | | | | | | | | | | | |
| | | | | | | | | | | | | | | | |
| | | (0.05 | ) | | | (0.05 | ) | | | — | | | | — | |
| | | — | | | | (2.15 | ) | | | (1.17 | ) | | | — | |
| | | (0.05 | ) | | | (2.20 | ) | | | (1.17 | ) | | | — | |
| | | — | | | | — | | | | — | | | | — | (b) |
| | $ | 9.97 | | | $ | 9.64 | | | $ | 11.65 | | | $ | 12.52 | |
| | | | | | | | | | | | | | | | |
| | | 3.92 | % | | | 4.28 | % | | | 2.36 | % | | | 21.55 | % |
| | | | | | | | | | | | | | | | |
| | | | | | | | | | | | | | | | |
| | $ | 124,775 | | | $ | 147,650 | | | $ | 174,473 | | | $ | 196,564 | |
| | | 1.20 | % | | | 1.18 | % | | | 1.16 | % | | | 1.15 | % |
| | | 1.20 | % | | | 1.17 | % | | | 1.16 | % | | | 1.15 | % |
| | | (0.38 | )% | | | 0.45 | % | | | 0.34 | % | | | (0.41 | )% |
| | | 214.07 | % | | | 192.77 | % | | | 163.54 | % | | | 176.40 | % |
See accompanying notes which are an integral part of these financial statements.
25
SMI DYNAMIC ALLOCATION FUND
FINANCIAL HIGHLIGHTS
(For a share outstanding during each year)
| | |
For the Year
Ended
October 31,
2021
| |
Selected Per Share Data: | | | | |
Net asset value, beginning of year | | $ | 12.45 | |
| | | | | |
Income from investment operations: | | | | |
Net investment income(a) | | | 0.10 | |
Net realized and unrealized gain (loss) on investments | | | 2.08 | |
Total from investment operations | | | 2.18 | |
| | | | | |
Less distributions to shareholders from: | | | | |
Net investment income | | | (0.09 | ) |
Net realized gains | | | (0.57 | ) |
Total distributions | | | (0.66 | ) |
Paid in capital from redemption fees | | | — | |
Net asset value, end of year | | $ | 13.97 | |
| | | | | |
Total Return(c) | | | 18.17 | % |
| | | | | |
Ratios and Supplemental Data: | | | | |
Net assets, end of year (000 omitted) | | $ | 119,964 | |
Ratio of expenses to average net assets(d) | | | 1.17 | % |
Ratio of expenses to average net assets excluding interest expenses(d) (e) | | | 1.16 | % |
Ratio of net investment income to average net assets(a) (d) | | | 0.80 | % |
Portfolio turnover rate | | | 175.11 | % |
(a) | Recognition of net investment income by the Fund is affected by the timing of the declaration of dividends by the underlying funds in which the Fund invests. |
(b) | Rounds to less than $0.005 per share. |
(c) | Total return in the above table represents the rate that the investor would have earned or lost on an investment in the Fund, assuming reinvestment of distributions. |
(d) | These ratios exclude the impact of expenses of the underlying funds in which the Fund invests as represented in the Schedule of Investments. |
(e) | These ratios do not include the effects of line of credit interest expense and borrowing costs. |
See accompanying notes which are an integral part of these financial statements.
26
SMI DYNAMIC ALLOCATION FUND
FINANCIAL HIGHLIGHTS
(For a share outstanding during each year) – (Continued)
| |
For the Year
Ended
October 31,
2020
| | |
For the Year
Ended
October 31,
2019
| | |
For the Year
Ended
October 31,
2018
| | |
For the Year
Ended
October 31,
2017
| |
| | | | | | | | | | | | | | | | |
| | $ | 12.17 | | | $ | 11.66 | | | $ | 11.75 | | | $ | 10.92 | |
| | | | | | | | | | | | | | | | |
| | | | | | | | | | | | | | | | |
| | | 0.06 | | | | 0.12 | | | | 0.18 | | | | 0.07 | |
| | | 0.37 | | | | 0.56 | | | | (0.16 | ) | | | 0.79 | |
| | | 0.43 | | | | 0.68 | | | | 0.02 | | | | 0.86 | |
| | | | | | | | | | | | | | | | |
| | | | | | | | | | | | | | | | |
| | | (0.15 | ) | | | (0.17 | ) | | | (0.11 | ) | | | (0.03 | ) |
| | | — | | | | — | | | | — | | | | — | |
| | | (0.15 | ) | | | (0.17 | ) | | | (0.11 | ) | | | (0.03 | ) |
| | | — | | | | — | | | | — | | | | — | (b) |
| | $ | 12.45 | | | $ | 12.17 | | | $ | 11.66 | | | $ | 11.75 | |
| | | | | | | | | | | | | | | | |
| | | 3.55 | % | | | 5.97 | % | | | 0.15 | % | | | 7.87 | % |
| | | | | | | | | | | | | | | | |
| | | | | | | | | | | | | | | | |
| | $ | 113,195 | | | $ | 119,339 | | | $ | 132,999 | | | $ | 162,002 | |
| | | 1.19 | % | | | 1.18 | % | | | 1.16 | % | | | 1.16 | % |
| | | 1.19 | % | | | 1.17 | % | | | 1.16 | % | | | 1.15 | % |
| | | 0.44 | % | | | 1.02 | % | | | 1.45 | % | | | 0.57 | % |
| | | 275.33 | % | | | 218.06 | % | | | 61.28 | % | | | 247.10 | % |
See accompanying notes which are an integral part of these financial statements.
27
SMI 50/40/10 FUND
FINANCIAL HIGHLIGHTS
(For a share outstanding during each year)
| | |
For the Year
Ended
October 31,
2021
| |
Selected Per Share Data: | | | | |
Net asset value, beginning of year | | $ | 9.88 | |
| | | | | |
Income from investment operations: | | | | |
Net investment income (loss)(b) | | | 0.04 | |
Net realized and unrealized gain (loss) on investments | | | 2.48 | |
Total from investment operations | | | 2.52 | |
| | | | | |
Less distributions to shareholders from: | | | | |
Net investment income | | | (0.04 | ) |
Net realized gains | | | — | |
Total distributions | | | (0.04 | ) |
Paid in capital from redemption fees | | | — | |
Net asset value, end of year | | $ | 12.36 | |
| | | | | |
Total Return(e) | | | 25.51 | % |
| | | | | |
Ratios and Supplemental Data: | | | | |
Net assets, end of year (000 omitted) | | $ | 68,885 | |
Ratio of expenses to average net assets(f) | | | 1.16 | % |
Ratio of expenses to average net assets excluding interest expenses(f) (g) | | | 1.15 | % |
Ratio of expenses to average net assets before waiver and reimbursement(f) | | | 1.14 | % |
Ratio of net investment income (loss) to average net assets(b) (f) | | | 0.35 | % |
Portfolio turnover rate | | | 231.35 | % |
(a) | As described in Note 1 of the Notes to the Financial Statements, the Former 50/40/10 Fund was reorganized into the SMI Conservative Allocation Fund as of the close of business, April 27, 2018 and subsequently renamed the SMI 50/40/10 Fund (the “Fund”). The Fund is the successor to the Former 50/40/10 Fund. The performance and financial information presented incorporates the operations of the Former 50/40/10 Fund, which, is a result of the reorganization, are the Fund’s operations. The per share amounts have been adjusted for a stock split that occurred on April 27, 2018. |
(b) | Recognition of net investment income by the Fund is affected by the timing of the declaration of dividends by the underlying funds in which the Fund invests. |
(c) | Per share net investment income has been determined on the basis of average shares outstanding during the year. |
(d) | Rounds to less than $0.005 per share. |
(e) | Total return in the above table represents the rate that the investor would have earned or lost on an investment in the Fund, assuming reinvestment of distributions. |
(f) | These ratios exclude the impact of expenses of the underlying funds in which the Fund invests as represented in the Schedule of Investments. |
(g) | These ratios do not include the effects of line of credit interest expense and borrowing costs. |
See accompanying notes which are an integral part of these financial statements.
28
SMI 50/40/10 FUND
FINANCIAL HIGHLIGHTS
(For a share outstanding during each year) – (Continued)
| |
For the Year
Ended
October 31,
2020
| | |
For the Year
Ended
October 31,
2019
| | |
For the Year
Ended
October 31,
2018(a)
| | |
For the Year
Ended
October 31,
2017(a)
| |
| | | | | | | | | | | | | | | | |
| | $ | 9.46 | | | $ | 9.46 | | | $ | 9.65 | | | $ | 8.20 | |
| | | | | | | | | | | | | | | | |
| | | | | | | | | | | | | | | | |
| | | 0.01 | | | | 0.05 | | | | 0.10 | (c) | | | (0.01 | ) |
| | | 0.45 | | | | 0.26 | | | | (0.04 | ) | | | 1.49 | |
| | | 0.46 | | | | 0.31 | | | | 0.06 | | | | 1.48 | |
| | | | | | | | | | | | | | | | |
| | | | | | | | | | | | | | | | |
| | | (0.04 | ) | | | (0.07 | ) | | | (0.11 | ) | | | (0.03 | ) |
| | | — | | | | (0.24 | ) | | | (0.14 | ) | | | — | |
| | | (0.04 | ) | | | (0.31 | ) | | | (0.25 | ) | | | (0.03 | ) |
| | | — | | | | — | | | | — | | | | — | (d) |
| | $ | 9.88 | | | $ | 9.46 | | | $ | 9.46 | | | $ | 9.65 | |
| | | | | | | | | | | | | | | | |
| | | 4.91 | % | | | 3.55 | % | | | 0.36 | % | | | 17.99 | % |
| | | | | | | | | | | | | | | | |
| | | | | | | | | | | | | | | | |
| | $ | 56,291 | | | $ | 62,614 | | | $ | 66,305 | | | $ | 22,007 | |
| | | 1.16 | % | | | 1.15 | % | | | 1.24 | % | | | 1.46 | % |
| | | 1.15 | % | | | 1.15 | % | | | 1.23 | % | | | 1.45 | % |
| | | 1.19 | % | | | 1.21 | % | | | 1.39 | % | | | 1.56 | % |
| | | 0.09 | % | | | 0.53 | % | | | 1.03 | % | | | (0.17 | )% |
| | | 252.74 | % | | | 225.42 | % | | | 155.28 | % | | | 212.36 | % |
See accompanying notes which are an integral part of these financial statements.
29
SMI FUNDS
NOTES TO THE FINANCIAL STATEMENTS
October 31, 2021
NOTE 1. ORGANIZATION
The Sound Mind Investing Fund (“SMI Fund”), SMI Dynamic Allocation Fund and SMI 50/40/10 Fund (formerly, the SMI Conservative Allocation Fund) (each a “Fund” and collectively, the “Funds”) are each registered under the Investment Company Act of 1940, as amended (“1940 Act”), as a diversified series of Valued Advisers Trust (the “Trust”). The Trust is a management investment company established under the laws of Delaware by an Agreement and Declaration of Trust dated June 13, 2008 (the “Trust Agreement”). The Trust Agreement permits the Board of Trustees (the “Board” or the “Trustees”) to issue an unlimited number of shares of beneficial interest of separate series without par value. Each Fund is one of a series of funds currently authorized by the Trustees. The investment adviser to the Funds is SMI Advisory Services, LLC (the “Adviser”). The SMI Fund seeks to provide long-term capital appreciation. The SMI Dynamic Allocation Fund and SMI 50/40/10 Fund seek total return.
Each of the Funds is a “fund-of-funds” in which each Fund may invest in other investment companies, including exchange-traded and closed-end funds. For a discussion on the strategies employed by each of the Funds, please refer to pages 9-11 of this report.
At the close of business on April 27, 2018, the SMI Conservative Allocation Fund was renamed the SMI 50/40/10 Fund and acquired all of the assets and assumed all of the liabilities of the previous SMI 50/40/10 Fund (the “Former 50/40/10 Fund”), pursuant to an agreement and plan of reorganization approved by the Board on December 12, 2017. The reorganization qualified as a tax-free reorganization for federal income tax purposes with no gain or loss recognized to the Funds or their shareholders. The SMI 50/40/10 Fund is considered the surviving entity for tax purposes.
Due to the reorganization on April 27, 2018, the number of outstanding shares of the Former 50/40/10 Fund increased by a factor of 1.132099; and since the Former 50/40/10 Fund’s total number of shares outstanding increased, the net asset value decreased. The reorganization did not affect the value of the Former 50/40/10 Fund’s net assets or each shareholder’s proportional ownership interest in those assets. The per share data presented in the Financial Highlights have been adjusted for periods prior to April 27, 2018 as a result.
NOTE 2. SIGNIFICANT ACCOUNTING POLICIES
The Funds are investment companies and follow accounting and reporting guidance under Financial Accounting Standards Board Accounting Standards Codification (“ASC”) Topic 946, “Financial Services-Investment Companies.” The following is a summary of significant accounting policies followed by the Funds in the preparation of their financial statements. These policies are in conformity with the generally accepted accounting principles in the United States of America (“GAAP”).
Estimates – The preparation of financial statements in conformity with GAAP requires management to make estimates and assumptions that affect the reported amounts of assets and liabilities and disclosure of contingent assets and liabilities at the date of the financial statements and the reported amounts of increases and decreases in net assets from operations during the reporting period. Actual results could differ from those estimates.
30
SMI FUNDS
NOTES TO THE FINANCIAL STATEMENTS
October 31, 2021 – (Continued)
NOTE 2. SIGNIFICANT ACCOUNTING POLICIES – (Continued)
Federal Income Taxes – The Funds make no provision for federal income or excise tax. Each Fund has qualified and intends to qualify each year as a regulated investment company (“RIC”) under subchapter M of the Internal Revenue Code of 1986, as amended, by complying with the requirements applicable to RICs and by distributing substantially all of its taxable income. Each Fund also intends to distribute sufficient net investment income and net capital gains, if any, so that it will not be subject to excise tax on undistributed income and gains. If the required amount of net investment income or gains is not distributed, the Funds could incur a tax expense.
As of and during the fiscal year ended October 31, 2021, the Funds did not have any liabilities for any unrecognized tax benefits. The Funds recognize interest and penalties, if any, related to unrecognized tax benefits as income tax expense on the Statements of Operations when incurred. During the fiscal year ended October 31, 2021, the Funds did not incur any interest or penalties. Management of the Funds has reviewed tax positions taken in tax years that remain subject to examination by all major tax jurisdictions, including federal (i.e., the last three tax year ends and the interim tax period since then, as applicable). Management believes that there is no tax liability resulting from unrecognized tax benefits related to uncertain tax positions taken.
Expenses – Expenses incurred by the Trust that do not relate to a specific fund of the Trust are allocated to the individual funds based on each fund’s relative net assets or another appropriate basis (as determined by the Board).
Security Transactions and Related Income – The Funds follow industry practice and record security transactions on the trade date for financial reporting purposes. The specific identification method is used for determining gains or losses for financial statement and income tax purposes. Dividend income and long-term capital gains dividends from investment companies are recorded on the ex-dividend date. Withholding taxes on foreign dividends, if any, have been provided for in accordance with the Funds’ understanding of the applicable country’s tax rules and rates.
Dividends and Distributions – Each Fund intends to distribute its net investment income and net realized long-term and short-term capital gains, if any, at least annually. Dividends and distributions to shareholders, which are determined in accordance with income tax regulations, are recorded on the ex-dividend date. The treatment for financial reporting purposes of distributions made to shareholders during the period from net investment income or net realized capital gains may differ from their ultimate treatment for federal income tax purposes. These differences are caused primarily by differences in the timing of the recognition of certain components of income, expense or realized capital gain for federal income tax purposes. Where such differences are permanent in nature, they are reclassified among the components of the net assets based on their ultimate characterization for federal income tax purposes. Any such reclassifications will have no effect on net assets, results of operations or net asset value (“NAV”) per share of the Funds. For the fiscal year October 31, 2021, the Funds did not make any reclassifications.
31
SMI FUNDS
NOTES TO THE FINANCIAL STATEMENTS
October 31, 2021 – (Continued)
NOTE 2. SIGNIFICANT ACCOUNTING POLICIES – (Continued)
Share Valuation – The NAV of each Fund is calculated each day the New York Stock Exchange (the “NYSE”) is open by dividing the total value of each Fund’s assets, less liabilities, by the number of shares outstanding for each Fund
NOTE 3. SECURITIES VALUATION AND FAIR VALUE MEASUREMENTS
Each Fund values its portfolio securities at fair value as of the close of regular trading on the NYSE (normally 4:00 p.m. Eastern time) on each business day the NYSE is open for business. Fair value is defined as the price that a Fund would receive upon selling an investment in a timely transaction to an independent buyer in the principal or most advantageous market of the investment. GAAP establishes a three-tier hierarchy to maximize the use of observable market data and minimize the use of unobservable inputs and to establish classification of fair value measurements for disclosure purposes.
Inputs refer broadly to the assumptions that market participants would use in pricing the asset or liability, including assumptions about risk (the risk inherent in a particular valuation technique used to measure fair value including a pricing model and/or the risk inherent in the inputs to the valuation technique). Inputs may be observable or unobservable. Observable inputs are inputs that reflect the assumptions market participants would use in pricing the asset or liability developed based on market data obtained and available from sources independent of the reporting entity. Unobservable inputs are inputs that reflect the reporting entity’s own assumptions about the assumptions market participants would use in pricing the asset or liability developed based on the best information available in the circumstances.
Various inputs are used in determining the value of each Fund’s investments. These inputs are summarized in the three broad levels listed below.
| | ● | Level 1 – unadjusted quoted prices in active markets for identical investments and/or registered investment companies where the value per share is determined and published and is the basis for current transactions for identical assets or liabilities at the valuation date |
| | ● | Level 2 – other significant observable inputs (including, but not limited to, quoted prices for an identical security in an inactive market, quoted prices for similar securities, interest rates, prepayment speeds, credit risk, etc.) |
| | ● | Level 3 – significant unobservable inputs (including the Funds’ own assumptions in determining fair value of investments based on the best information available) |
The inputs used to measure fair value may fall into different levels of the fair value hierarchy. In such cases, for disclosure purposes, the level in the fair value hierarchy which is reported is determined based on the lowest level input that is significant to the fair value measurement in its entirety.
32
SMI FUNDS
NOTES TO THE FINANCIAL STATEMENTS
October 31, 2021 – (Continued)
NOTE 3. SECURITIES VALUATION AND FAIR VALUE MEASUREMENTS – (Continued)
Equity securities, including ETFs and closed-end funds, that are traded on any stock exchange are generally valued at the last quoted sale price on the security’s primary exchange. Lacking a last sale price, an exchange-traded security is generally valued at its last bid price. Securities traded in the NASDAQ over-the-counter market are generally valued at the NASDAQ Official Closing Price. When using the market quotations and when the market is considered active, the security is classified as a Level 1 security. In the event that market quotations are not readily available or are considered unreliable due to market or other events, a Fund values its securities and other assets at fair value in accordance with policies established by and under the general supervision of the Board. Under these policies, the securities will be classified as Level 2 or 3 within the fair value hierarchy, depending on the inputs used.
Investments in mutual funds, including money market mutual funds, are generally priced at the ending NAV. These securities are categorized as Level 1 securities. In the event that the ending NAV for a mutual fund is unavailable at the end of day pricing time, the Adviser may, in accordance with the Trust’s valuation policies, consider all appropriate factors in determining the fair value of the mutual fund. In such cases the security will generally be categorized as a Level 2 security.
In accordance with the Trust’s valuation policies, the Adviser is required to consider all appropriate factors relevant to the value of securities for which it has determined other pricing sources are not available or reliable as described above. No single method exists for determining fair value, because fair value depends upon the circumstances of each individual case. As a general principle, the current fair value of a security being valued by the Adviser would be the amount that the Funds might reasonably expect to receive upon the current sale. Methods that are in accordance with this principle may, for example, be based on (i) a multiple of earnings; (ii) a discount from market prices of a similar freely traded security (including a derivative security or a basket of securities traded on other markets, exchanges or among dealers); or (iii) yield to maturity with respect to debt issues, or a combination of these and other methods. Fair-value pricing is permitted if, in the Adviser’s opinion, the validity of market quotations appears to be questionable based on factors such as evidence of a thin market in the security based on a small number of quotations, a significant event occurs after the close of a market but before a Fund’s NAV calculation that may affect a security’s value, or the Adviser is aware of any other data that calls into question the reliability of market quotations.
The following is a summary of the inputs used to value the Funds’ investments as of October 31, 2021:
| | | Valuation Inputs | |
SMI Fund | | Level 1 | | | Level 2 | | | Level 3 | | | Total | |
Exchange-Traded Funds | | $ | 99,564,990 | | | $ | — | | | $ | — | | | $ | 99,564,990 | |
Mutual Funds | | | 49,227,468 | | | | 19,576 | | | | — | | | | 49,247,044 | |
Money Market Funds | | | 1,445,094 | | | | — | | | | — | | | | 1,445,094 | |
Total | | $ | 150,237,552 | | | $ | 19,576 | | | $ | — | | | $ | 150,257,128 | |
33
SMI FUNDS
NOTES TO THE FINANCIAL STATEMENTS
October 31, 2021 – (Continued)
NOTE 3. SECURITIES VALUATION AND FAIR VALUE MEASUREMENTS – (Continued)
| | | Valuation Inputs | |
SMI Dynamic Allocation Fund | | Level 1 | | | Level 2 | | | Level 3 | | | Total | |
Exchange-Traded Funds | | $ | 119,427,806 | | | $ | — | | | $ | — | | | $ | 119,427,806 | |
Money Market Funds | | | 645,947 | | | | — | | | | — | | | | 645,947 | |
Total | | $ | 120,073,753 | | | $ | — | | | $ | — | | | $ | 120,073,753 | |
| | | Valuation Inputs | |
SMI 50/40/10 Fund | | Level 1 | | | Level 2 | | | Level 3 | | | Total | |
Exchange-Traded Funds | | $ | 56,434,419 | | | $ | — | | | $ | — | | | $ | 56,434,419 | |
Mutual Funds | | | 11,977,061 | | | | — | | | | — | | | | 11,977,061 | |
Money Market Funds | | | 578,307 | | | | — | | | | — | | | | 578,307 | |
Total | | $ | 68,989,787 | | | $ | — | | | $ | — | | | $ | 68,989,787 | |
The Funds did not hold any investments at the end of the reporting period for which significant unobservable inputs (Level 3) were used in determining fair value; therefore, no reconciliation of Level 3 securities is included for this reporting period.
NOTE 4. FEES AND OTHER TRANSACTIONS WITH AFFILIATES
Under the terms of the investment advisory agreement with respect to each Fund (the “Advisory Agreements”), the Adviser is responsible for managing each Fund’s investments. As compensation for its management services, each Fund is obligated to pay the Adviser a fee based on the Fund’s average daily net assets as follows:
Fund Assets | | SMI Fund
Management Fee | | | SMI Dynamic
Allocation Fund
Management Fee | | | SMI 50/40/10 Fund
Management Fee | |
$1 – $100 million | | | 1.00 | % | | | 1.00 | % | | | 0.90 | % |
$100,000,001 – $250 million | | | 1.00 | % | | | 1.00 | % | | | 0.80 | % |
$250,000,001 to $500 million | | | 0.90 | % | | | 0.90 | % | | | 0.70 | % |
Over $500 million | | | 0.80 | % | | | 0.80 | % | | | 0.60 | % |
34
SMI FUNDS
NOTES TO THE FINANCIAL STATEMENTS
October 31, 2021 – (Continued)
NOTE 4. FEES AND OTHER TRANSACTIONS WITH AFFILIATES – (Continued)
For the fiscal year ended October 31, 2021, fees earned and recouped by the Adviser at October 31, 2021 were as follows:
| | | SMI Fund
Management Fee | | | SMI Dynamic
Allocation Fund
Management Fee | | | SMI 50/40/10 Fund
Management Fee | |
Management fees earned | | $ | 1,491,429 | | | $ | 1,164,615 | | | $ | 611,102 | |
Fees recouped by Adviser | | | — | | | | — | | | | 11,618 | |
Payable to Adviser | | | 125,276 | | | | 99,893 | | | | 53,240 | |
The Adviser contractually has agreed to waive its management fee and/or reimburse certain operating expenses, but only to the extent necessary so that each Fund’s total annual operating expenses (excluding interest, taxes, brokerage commissions, other expenses which are capitalized in accordance with GAAP, extraordinary expenses, dividend expense on short sales, 12b-1 fees, and acquired fund fees and expenses) do not exceed 1.50% of the Fund’s average daily net assets with respect to the SMI Fund, 1.45% with respect to the SMI Dynamic Allocation Fund, and 1.15% with respect to the SMI 50/40/10 Fund. The contractual arrangement for each Fund is in place through February 28, 2022.
Each fee waiver or expense reimbursement by the Adviser is subject to repayment by the applicable Fund within the three years following the date in which the fee waiver or expense reimbursement occurred, provided that the Fund is able to make the repayment without exceeding the expense limitation in effect at the time of the fee waiver or expense reimbursement and the expense limitation at the time of the repayment.
As of October 31, 2021, the Adviser may seek repayment of investment advisory fee waivers and expense reimbursements from the SMI 50/40/10 Fund as follows:
Recoverable through | | Amount | |
October 31, 2022 | | $ | 33,330 | |
October 31, 2023 | | | 18,349 | |
On December 31, 2020, the Adviser purchased shares in the Invesco DB Gold Fund and the Sprott Physical Gold Trust (the “Securities”) for the SMI Dynamic Allocation Fund. Because the Fund’s positions in those Securities each represented more than 5% of Fund’s total assets, and together exceeded 25% of the Fund’s total assets, the Fund breached the SEC diversification limit set forth in Section 5(b)(1) of the 1940 Act. Consequently, the purchases of the Securities caused the Fund to become “non-diversified,” contrary to the representation in Fund’s prospectus. In order to correct the compliance violation, the Fund sold sufficient Securities to bring the aggregate of issuers representing greater than 5% of the Fund’s total assets to below the 25% threshold. This caused a realized shareholder loss of $225,012, which was subsequently reimbursed to the Fund by the Adviser and reflected on the Statements of Operations. This impacted the Fund’s total return for the year by 0.22%.
35
SMI FUNDS
NOTES TO THE FINANCIAL STATEMENTS
October 31, 2021 – (Continued)
NOTE 4. FEES AND OTHER TRANSACTIONS WITH AFFILIATES – (Continued)
The Trust retains Ultimus Fund Solutions, LLC (“Ultimus” or “Administrator”), to provide the Funds with administration, compliance (including a chief compliance officer), fund accounting, and transfer agent services, including all regulatory reporting. Expenses incurred by the Funds for these services are allocated to the individual Funds based on each Fund’s relative net assets.
The officers and one Trustee of the Trust are members of management and/or employees of the Administrator and are not paid by the Trust for services to the Funds. Ultimus Fund Distributors, LLC (the “Distributor”), a wholly-owned subsidiary of Ultimus, acts as the distributor of the Funds’ shares. There were no payments made to the Distributor by the Funds for the fiscal year ended October 31, 2021.
For the fiscal year ended October 31, 2021, fees for administration, compliance, fund accounting, and transfer agent services, and amounts due to the Administrator at October 31, 2021 were as follows:
| | | SMI Fund | | | SMI Dynamic
Allocation Fund | | | SMI
50/40/10 Fund | |
Administration | | $ | 41,608 | | | $ | 32,319 | | | $ | 19,208 | |
Compliance expenses | | | 8,100 | | | | 8,100 | | | | 8,100 | |
Fund accounting | | | 22,067 | | | | 17,141 | | | | 9,998 | |
Transfer agent | | | 24,690 | | | | 10,486 | | | | 10,778 | |
Payable to Administrator | | | 7,845 | | | | 5,660 | | | | 3,900 | |
NOTE 5. PURCHASES AND SALES OF SECURITIES
For the fiscal year ended October 31, 2021, purchases and sales of investment securities, other than short-term investments were as follows:
| | | SMI Fund | | | SMI Dynamic
Allocation Fund | | | SMI
50/40/10 Fund | |
Purchases | | $ | 438,129,244 | | | $ | 201,462,156 | | | $ | 153,625,536 | |
Sales | | $ | 454,189,565 | | | $ | 212,036,603 | | | $ | 154,854,443 | |
There were no purchases or sales of long-term U.S. government obligations during the fiscal year ended October 31, 2021.
NOTE 6. LINE OF CREDIT
During the fiscal year ended October 31, 2021, the Trust, on behalf of the Funds, entered into in a short-term credit agreement (“Line of Credit”) with Huntington National Bank (“Huntington”), expiring on January 21, 2022. Under the terms of the agreement, each of the Funds may borrow up to the lesser of 10% of a Fund’s
36
SMI FUNDS
NOTES TO THE FINANCIAL STATEMENTS
October 31, 2021 – (Continued)
NOTE 6. LINE OF CREDIT – (Continued)
daily market value or $5 million at an interest rate equal to the London Interbank Offered Rate (“LIBOR”) plus 150 basis points (if LIBOR is less than 0.50%, such rate shall be deemed to be 0.50%), 2.00% as of October 31, 2021. The purpose of the agreement is to meet temporary or emergency cash needs, including redemption requests that might otherwise require the untimely disposition of securities. Huntington receives an annual facility fee of 0.125% on $5 million as well as an additional annual fee of 0.125% on any unused portion of the credit facility, invoiced quarterly, for providing the Line of Credit. The Funds will not borrow money, except (a) from a bank, provided that immediately after such borrowing there is an asset coverage of 300% for all borrowings of a Fund; or (b) from a bank or other persons for temporary purposes only, provided that such temporary borrowings are in an amount not exceeding 5% of a Fund’s total assets at the time when the borrowing is made. To the extent that the line of credit is utilized, it will be collateralized by securities in the Funds’ portfolios.
As of October 31, 2021, the Funds had no outstanding borrowings under this Line of Credit.
Fund | | Average
Daily Loan
Balance(a) | | | Weighted
Average
Interest
Rate(a) | | | Number of Days
Outstanding(b) | | | Interest
Expense
Accrued | | | Maximum
Loan
Outstanding | |
SMI Fund | | $ | 546,547 | | | | 2.00% | | | | 23 | | | $ | 698 | | | $ | 1,200,000 | |
SMI Dynamic Allocation Fund | | | 483,394 | | | | 1.88% | | | | 28 | | | | 708 | | | | 1,725,000 | |
SMI 50/40/10 Fund | | | 446,250 | | | | 2.00% | | | | 28 | | | | 694 | | | | 1,625,000 | |
(a) | Averages based on the number of days outstanding. |
(b) | Number of Days Outstanding represents the total days during the fiscal year ended October 31, 2021, that a Fund utilized the Line of Credit. |
NOTE 7. FEDERAL TAX INFORMATION
At October 31, 2021, the net unrealized appreciation (depreciation) and tax cost of investments for tax purposes was as follows:
| | | SMI Fund | | | SMI Dynamic
Allocation Fund | | | SMI
50/40/10 Fund | |
Gross unrealized appreciation | | $ | 9,126,797 | | | $ | 17,941,113 | | | $ | 7,191,670 | |
Gross unrealized depreciation | | | (208,777 | ) | | | — | | | | (34,592 | ) |
Net unrealized appreciation/(depreciation) on investments | | $ | 8,918,020 | | | | 17,941,113 | | | $ | 7,157,078 | |
Tax cost of investments | | $ | 141,339,108 | | | $ | 102,132,640 | | | $ | 61,832,709 | |
37
SMI FUNDS
NOTES TO THE FINANCIAL STATEMENTS
October 31, 2021 – (Continued)
NOTE 7. FEDERAL TAX INFORMATION – (Continued)
The tax character of distributions for the fiscal years ended October 31, 2021 and October 31, 2020 were as follows:
| | | SMI Fund | | | SMI Dynamic Allocation Fund | |
| | | 2021 | | | 2020 | | | 2021 | | | 2020 | |
Distributions paid from: (a) | | | | | | | | | | | | | | | | |
Ordinary income | | $ | — | | | $ | 706,878 | | | $ | 2,123,182 | | | $ | 1,402,469 | |
Long-term capital gains | | | — | | | | — | | | | 3,850,169 | | | | — | |
Total taxable distributions paid | | $ | — | | | $ | 706,878 | | | $ | 5,973,351 | | | $ | 1,402,469 | |
| | | SMI 50/40/10 Fund | |
| | | 2021 | | | 2020 | |
Distributions paid from: (a) | | | | | | | | |
Ordinary income | | $ | 210,442 | | | $ | 279,593 | |
Long-term capital gains | | | — | | | | — | |
Total taxable distributions paid | | $ | 210,442 | | | $ | 279,593 | |
(a) | For federal income tax purposes, distributions of short-term capital gains are treated as ordinary income distributions. |
At October 31, 2021, the components of distributable earnings (accumulated losses) on a tax basis was as follows:
| | | SMI Fund | | | SMI Dynamic
Allocation Fund | | | SMI 50/40/10
Fund | |
Undistributed ordinary income | | $ | 22,006,997 | | | $ | 5,419,264 | | | $ | 5,525,306 | |
Undistributed long-term capital gains | | | 19,416,250 | | | | 3,024,792 | | | | 3,904,390 | |
Accumulated capital and other losses | | | — | | | | — | | | | — | |
Unrealized appreciation on investments | | | 8,918,020 | | | | 17,941,113 | | | | 7,157,078 | |
Total accumulated earnings | | $ | 50,341,267 | | | $ | 26,385,169 | | | $ | 16,586,774 | |
At October 31, 2021, the difference between book basis and tax basis unrealized appreciation (depreciation) is attributable to the tax deferral of losses on wash sales.
38
SMI FUNDS
NOTES TO THE FINANCIAL STATEMENTS
October 31, 2021 – (Continued)
NOTE 7. FEDERAL TAX INFORMATION – (Continued)
Capital loss carryforwards are available to offset future realized capital gains and thereby reduce further taxable gain distributions. During the fiscal year ended October 31, 2021, the SMI Fund and SMI 50/40/10 Fund utilized $11,557,011 and $2,939,547, respectively of their capital loss carryforwards.
NOTE 8. INVESTMENT IN OTHER INVESTMENT COMPANIES
Each Fund may invest a significant portion of its assets in shares of one or more investment companies, including ETFs, open-end and closed-end mutual funds and money market mutual funds. Each Fund will incur additional indirect expenses (acquired fund fees and expenses) to the extent it invests in shares of other investment companies. As of October 31, 2021, the SMI Fund had 66.32% of the value of its net assets invested in ETFs and had 32.81% of the value of its net assets invested in open-end mutual funds. As of October 31, 2021, the SMI Dynamic Allocation Fund had 99.55% of the value of its net assets invested in ETFs. As of October 31, 2021, the SMI 50/40/10 Fund had 81.92% of the value of its net assets invested in ETFs and had 17.39% of the value of its net assets invested in open-end mutual funds. The financial statements of these ETFs and open-end and closed-end mutual funds can be found at www.sec.gov.
NOTE 9. COMMITMENTS AND CONTIGENCIES
The Trust indemnifies its officers and Trustees for certain liabilities that may arise from their performance of their duties to the Trust or the Funds. Additionally, in the normal course of business, the Trust enters into contracts that contain a variety of representations and warranties which provide general indemnifications. The Trust’s maximum exposure under these arrangements is unknown, as this would involve future claims that may be made against the Trust that have not yet occurred.
NOTE 10. SUBSEQUENT EVENTS
Management of the Funds has evaluated the need for disclosures and/or adjustments resulting from subsequent events through the date at which these financial statements were issued. Based upon this evaluation, management has determined there were no items requiring adjustment of the financial statements or additional disclosure.
39
REPORT OF INDEPENDENT REGISTERED
PUBLIC ACCOUNTING FIRM
To the Shareholders of SMI Funds and
Board of Trustees of Valued Advisers Trust
Opinion on the Financial Statements
We have audited the accompanying statements of assets and liabilities, including the schedules of investments, of SMI Funds comprising Sound Mind Investing Fund, SMI Dynamic Allocation Fund, and SMI 50/40/10 Fund (the “Funds”), each a series of Valued Advisers Trust, as of October 31, 2021, the related statements of operations for the year then ended, the statements of changes in net assets for each of the two years in the period then ended, the related notes, and the financial highlights for each of the five years in the period then ended (collectively referred to as the “financial statements”). In our opinion, the financial statements present fairly, in all material respects, the financial position of each of the Funds as of October 31, 2021, the results of their operations for the year then ended, the changes in net assets for each of the two years in the period then ended, and the financial highlights for each of the five years in the period then ended, in conformity with accounting principles generally accepted in the United States of America.
Basis for Opinion
These financial statements are the responsibility of the Funds’ management. Our responsibility is to express an opinion on the Funds’ financial statements based on our audits. We are a public accounting firm registered with the Public Company Accounting Oversight Board (United States) (“PCAOB”) and are required to be independent with respect to the Funds in accordance with the U.S. federal securities laws and the applicable rules and regulations of the Securities and Exchange Commission and the PCAOB.
We conducted our audits in accordance with the standards of the PCAOB. Those standards require that we plan and perform the audit to obtain reasonable assurance about whether the financial statements are free of material misstatement, whether due to error or fraud.
Our audits included performing procedures to assess the risks of material misstatement of the financial statements, whether due to error or fraud, and performing procedures that respond to those risks. Such procedures included examining, on a test basis, evidence regarding the amounts and disclosures in the financial statements. Our procedures included confirmation of securities owned as of October 31, 2021, by correspondence with the custodian and brokers; when replies were not received from brokers, we performed other auditing procedures. Our audits also included evaluating the accounting principles used and significant estimates made by management, as well as evaluating the overall presentation of the financial statements. We believe that our audits provide a reasonable basis for our opinion.
We have served as the auditor of one or more of the Funds since 2006.
COHEN & COMPANY, LTD.
Cleveland, Ohio
December 28, 2021
40
SUMMARY OF FUND EXPENSES – (Unaudited)
As a shareholder of a Fund, you incur two types of costs: (1) transaction costs and (2) ongoing costs, including management fees and other Fund expenses. These examples are intended to help you understand your ongoing costs (in dollars) of investing in each Fund and to compare these costs with the ongoing costs of investing in other mutual funds. Each Fund’s example is based on an investment of $1,000 invested at the beginning of the period and held for the entire period from May 1, 2021 through October 31, 2021.
Actual Expenses
The first line of the table below provides information about actual account values and actual expenses. You may use the information in this line, together with the amount you invested, to estimate the expenses that you paid over the period. Simply divide your account value by $1,000 (for example, an $8,600 account value divided by $1,000 = 8.6), then multiply the result by the number in the first line under the heading entitled “Expenses Paid During Period” to estimate the expenses you paid on your account during this period.
Hypothetical Example for Comparison Purposes
The second line of the table below provides information about hypothetical account values and hypothetical expenses based on the Fund’s actual expense ratio and an assumed rate of return of 5% per year before expenses, which is not the Fund’s actual return. The hypothetical account values and expenses may not be used to estimate the actual ending account balance or expenses you paid for the period. You may use this information to compare the ongoing costs of investing in the Fund and other funds. To do so, compare this 5% hypothetical example with the 5% hypothetical examples that appear in the shareholder reports of other funds.
Expenses shown in the table are meant to highlight your ongoing costs only and do not reflect any transactional costs. Therefore, the second line of the table below is useful in comparing ongoing costs only and will not help you determine the relative costs of owning different funds. In addition, if transaction costs were included, your costs would have been higher.
41
SUMMARY OF FUND EXPENSES – (Unaudited), (Continued)
| | | Beginning
Account Value
May 1, 2021 | | | Ending
Account Value
October 31, 2021 | | | Expenses Paid
During Period(a) | | | Annualized
Expense Ratio | |
SMI FUND | | | | | | | | | | | | | | | | |
Actual | | $ | 1,000.00 | | | $ | 1,045.10 | | | $ | 6.03 | | | | 1.17 | % |
Hypothetical(b) | | $ | 1,000.00 | | | $ | 1,019.31 | | | $ | 5.96 | | | | 1.17 | % |
| | | | | | | | | | | | | | | | | |
SMI DYNAMIC ALLOCATION FUND | | | | | | | | |
Actual | | $ | 1,000.00 | | | $ | 1,063.20 | | | $ | 6.03 | | | | 1.16 | % |
Hypothetical(b) | | $ | 1,000.00 | | | $ | 1,019.36 | | | $ | 5.90 | | | | 1.16 | % |
| | | | | | | | | | | | | | | | | |
SMI 50/40/10 FUND | | | | | | | | | | | | | | | | |
Actual | | $ | 1,000.00 | | | $ | 1,035.20 | | | $ | 5.95 | | | | 1.16 | % |
Hypothetical(b) | | $ | 1,000.00 | | | $ | 1,019.36 | | | $ | 5.90 | | | | 1.16 | % |
(a) | Expenses are equal to the Fund’s annualized expense ratios, multiplied by the average account value over the period, multiplied by 184/365 (to reflect the one-half year period). |
(b) | Hypothetical assumes 5% annual return before expenses. |
42
ADDITIONAL FEDERAL INCOME TAX INFORMATION (Unaudited)
The Form 1099-DIV you receive in January 2022 will show the tax status of all distributions paid to your account in calendar year 2021. Shareholders are advised to consult their own tax adviser with respect to the tax consequences of their investment in a Fund. As required by the Internal Revenue Code and/or regulations, shareholders must be notified regarding the status of qualified dividend income for individuals and the dividends received deduction for corporations.
Qualified Dividend Income. The Funds designate the following percentage or up to the maximum amount of such dividends allowable pursuant to the Internal Revenue Code, as qualified dividend income eligible for the reduced tax rate.
| | | SMI Fund | | | SMI Dynamic
Allocation Fund | | | SMI 50/40/10
Fund | |
Qualified Dividend Income | | | 0 | % | | | 17 | % | | | 9 | % |
Qualified Business Income. The Funds designate the following percentage of ordinary income dividends, or up to the maximum amount of such dividends allowable pursuant to the Internal Revenue Code, as qualified business income.
| | | SMI Fund | | | SMI Dynamic
Allocation Fund | | | SMI 50/40/10
Fund | |
Qualified Business Income | | | 0 | % | | | 16 | % | | | 0 | % |
Dividends Received Deduction. Corporate shareholders are generally entitled to take the dividends received deduction on the portion of the Funds’ dividend distribution that qualifies under tax law. For the Funds’ calendar year 2021 ordinary income dividends, the following percentage qualifies for the corporate dividends received deduction.
| | | SMI Fund | | | SMI Dynamic
Allocation Fund | | | SMI 50/40/10
Fund | |
Dividends Received Deduction | | | 0 | % | | | 12 | % | | | 4 | % |
The Funds designate the following amounts as long-term capital gains distributions. The amounts designated may not agree with long-term capital gains in the tax character of distribution table due to utilization of earnings and profits distributed to shareholders on redemption of shares.
| | | SMI Fund | | | SMI Dynamic
Allocation Fund | | | SMI 50/40/10
Fund | |
Long-Term Capital Gains Distributions | | $ | — | | | $ | 3,850,169 | | | $ | — | |
43
TRUSTEES AND OFFICERS – (Unaudited)
The Board of Trustees supervises the business activities of the Trust. Each Trustee serves as a trustee until termination of the Trust unless the Trustee dies, resigns, retires or is removed.
The following table provides information regarding each of the Independent Trustees.
Name, Address*, (Age), Position with Trust**,
Term of Position with Trust | Principal Occupation During
Past 5 Years and Other Directorships | Other Directorships |
Andrea N. Mullins, (54)
Independent Trustee Since December 2013 Chairperson since March 2017 | Current: Private investor; Independent Contractor, SWM Advisors (since April 2014). | Trustee, Angel Oak Funds Trust (since February 2019) (5 portfolios); Trustee, Angel Oak Funds Trust (since October 2019) (5 portfolios); Trustee, Angel Oak Strategic Credit Fund (since December 2019); Trustee, Angel Oak Financial Strategies Income Term Trust (since May 2019); Trustee, Angel Oak Dynamic Financial Strategies Income Term Trust (since June 2020); Trustee, Angel Oak Credit Opportunities Term Trust (since January 2021); Trustee and Audit Committee Chair, Cushing Mutual Funds Trust (since November 2021) (2 portfolios); Trustee and Audit Committee Chair, Cushing NextGen Infrastructure Income Fund (since November 2021); Trustee and Audit Committee Chair, Cushing MLP & Infrastructure Fund (Since November 2021). |
44
TRUSTEES AND OFFICERS – (Unaudited), (Continued)
Name, Address*, (Age), Position with Trust**,
Term of Position with Trust | Principal Occupation During
Past 5 Years and Other Directorships | Other Directorships |
Ira P. Cohen, (62)
Independent Trustee Since June 2010 | Current: Independent financial services consultant (since February 2005); Executive Vice President of Asset Management Services, Recognos Financial (since August 2015). | Trustee and Audit Committee Chairman, Griffin Institutional Access Credit Fund (since January 2017); Trustee and Audit Committee Chairman, Griffin Institutional Access Real Estate Fund (since May 2014); Trustee, Angel Oak Funds Trust (since October 2014) (5 portfolios); Trustee, Chairman, and Nominating and Governance Committee Chairman, Angel Oak Strategic Credit Fund (since December 2017); Trustee, U.S. Fixed Income Trust (since March 2019); Trustee and Chairman, Angel Oak Financial Strategies Income Term Trust (since May 2019); Trustee, Angel Oak Dynamic Financial Strategies Income Term Trust (since June 2020); Trustee, Angel Oak Credit Opportunities Term Trust (since January 2021). |
* | The address for each Trustee is 225 Pictoria Drive, Suite 450, Cincinnati, Ohio 45246. |
** | As of the date of this report, the Trust consists of 13 series. |
The following table provides information regarding the Trustee who is considered an “interested person” of the Trust, as that term is defined under the 1940 Act. Based on the experience of the Trustee, the Trust concluded that the individual described below should serve as a Trustee.
Name, Address*, (Age),
Position with Trust**,
Term of Position with Trust | Principal Occupation During
Past 5 Years and Other Directorships | Other Directorships |
Mark J. Seger***, (59)
Trustee Since March 2017 | Current: Vice Chairman and Co-Founder, Ultimus Fund Solutions, LLC and its subsidiaries (since 1999). | None. |
* | The address for each Trustee is 225 Pictoria Drive, Suite 450, Cincinnati, Ohio 45246. |
** | As of the date of this report, the Trust consists of 13 series. |
*** | Mr. Seger is considered an “interested person” of the Trust because of his relationship with the Trust’s administrator, transfer agent, and distributor. |
45
TRUSTEES AND OFFICERS – (Unaudited), (Continued)
The following table provides information regarding the Officers of the Trust:
Name, Address*, (Age),
Position with Trust**,
Term of Position with Trust | Principal Occupation During
Past 5 Years | Other Directorships |
Adam T. Kornegay, (36) Principal Executive Officer and President Since April 2018 | Current: Vice President, Business Development Director, Ultimus Fund Solutions, LLC (since March 2015). | None. |
Zachary P. Richmond, (41) Chief Financial Officer and Treasurer Since September 2021 | Current: Vice President, Financial Administration, Ultimus Fund Solutions, LLC (February 2019 to present). Previous: Assistant Vice President, Associate Director of Financial Administration, Ultimus Fund Solutions, LLC (December 2015 to February 2019). | None. |
Kevin J. Patton, (51)
Chief Compliance Officer Since March 2020 | Current: Assistant Vice President, Compliance Officer, Ultimus Fund Solutions, LLC (since January 2020). Previous: Partner and Chief Compliance Officer, Renaissance Investment Management (August 2005 to January 2020). | None. |
Carol J. Highsmith, (57)
Vice President Since August 2008 Secretary Since March 2014 | Current: Vice President, Ultimus Fund Solutions, LLC (since December 2015). | None. |
46
TRUSTEES AND OFFICERS – (Unaudited), (Continued)
Name, Address*, (Age),
Position with Trust**,
Term of Position with Trust | Principal Occupation During
Past 5 Years | Other Directorships |
Matt J. Miller, (45)
Vice President Since December 2011 | Current: Assistant Vice President, Relationship Management, Ultimus Fund Solutions, LLC (since December 2015). | None. |
Stephen L. Preston, (55)
AML Officer Since June 2017 | Current: Chief Compliance Officer; Ultimus Fund Distributors, LLC (since June 2011). Previous: Chief Compliance Officer, Ultimus Fund Solutions, LLC (June 2011 to August 2019); Chief Compliance Officer, Unified Financial Securities, LLC (April 2018 to December 2019). | None. |
* | The address for each Officer is 225 Pictoria Drive, Suite 450, Cincinnati, Ohio 45246. |
** | As of the date of this report, the Trust consists of 13 series. |
47
LIQUIDITY RISK MANAGEMENT PROGRAM – (Unaudited)
Valued Advisers Trust has adopted and implemented a written liquidity risk management program as required by Rule 22e-4 (the “Liquidity Rule”) under the Investment Company Act. The program is reasonably designed to assess and manage each Fund’s liquidity risk, taking into consideration, among other factors, the Fund’s investment strategy and the liquidity of its portfolio investments during normal and reasonably foreseeable stressed conditions; its short and long-term cash flow projections; and its cash holdings and access to other funding sources. The Board of Trustees approved the appointment of a Liquidity Administrator Committee, which includes representatives from SMI Advisory Services, LLC, the Funds’ investment adviser, and Ultimus Fund Solutions, LLC, the Funds’ Administrator. The Liquidity Administrator Committee is responsible for the program’s administration and oversight and for reporting to the Board on at least an annual basis regarding the program’s operation and effectiveness. The Liquidity Administrator Committee updated its assessment of each Fund’s liquidity risk profile, considering additional data gathered during the period June 1, 2020 through May 31, 2021 (the “Review Period”) and the adequacy and effectiveness of the liquidity risk management program’s operations during the Review Period in order to prepare a written report for the Board of Trustees (the “Report”) for consideration at its meeting held on September 1, 2021. The Report noted that during the Review Period none of the Funds experienced unusual stress or disruption to its operations related to purchase and redemption activity. It further noted that during the Review Period each Fund held adequate levels of cash and highly liquid investments to meet shareholder redemption activities in accordance with applicable requirements. The Report concluded that (i) the Trust’s liquidity risk management program is reasonably designed to prevent violations of the Liquidity Rule and (ii) the Trust’s liquidity risk management program had been effectively implemented during the Review Period.
48
FACTS | WHAT DO THE SMI FUNDS DO WITH YOUR PERSONAL INFORMATION? |
| | |
Why? | Financial companies choose how they share your personal information. Federal law gives consumers the right to limit some but not all sharing. Federal law also requires us to tell you how we collect, share, and protect your personal information. Please read this notice carefully to understand what we do. |
| | |
What? | The types of personal information we collect and share depend on the product or service you have with us. This information can include: ● Social Security number ● account balances and account transactions ● transaction or loss history and purchase history ● checking account information and wire transfer instructions |
| | When you are no longer our customer, we continue to share your information as described in this notice. |
| | |
How? | All financial companies need to share customers’ personal information to run their everyday business. In the section below, we list the reasons financial companies can share their customers’ personal information; the reasons SMI Funds choose to share; and whether you can limit this sharing. |
Reasons we can share your personal information | Do SMI Funds share? |
For our everyday business purposes—
such as to process your transactions, maintain your account(s), respond to court orders and legal investigations, or report to credit bureaus | Yes |
For our marketing purposes—
to offer our products and services to you | No |
For joint marketing with other financial companies | No |
For our affiliates’ everyday business purposes—
information about your transactions and experiences | No |
For our affiliates’ everyday business purposes—
information about your creditworthiness | No |
For nonaffiliates to market to you | No |
Questions? | Call (877) 764-3863 |
49
Who we are |
Who is providing this notice? | SMI Funds
Ultimus Fund Distributors, LLC (Distributor)
Ultimus Fund Solutions, LLC (Administrator) |
| | |
What we do |
How do SMI Funds protect my personal information? | To protect your personal information from unauthorized access and use, we use security measures that comply with federal law. These measures include computer safeguards and secured files and buildings. Our service providers are held accountable for adhering to strict policies and procedures to prevent any misuse of your nonpublic personal information. |
How do SMI Funds collect my personal information? | We collect your personal information, for example, when you ● open an account or deposit money ● buy securities from us or sell securities to us ● make deposits or withdrawals from your account ● give us your account information ● make a wire transfer ● tell us who receives the money ● tell us where to send the money ● show your government-issued ID ● show your driver’s license |
Why can’t I limit all sharing? | Federal law gives you the right to limit only ● sharing for affiliates’ everyday business purposes—information about your creditworthiness ● affiliates from using your information to market to you ● sharing for nonaffiliates to market to you State laws and individual companies may give you additional rights to limit sharing. |
Definitions |
Affiliates | Companies related by common ownership or control. They can be financial and nonfinancial companies. ● SMI Advisory Services, LLC, the investment adviser to the Fund, could be deemed to be an affiliate. |
Nonaffiliates | Companies not related by common ownership or control. They can be financial and nonfinancial companies. ● The SMI Funds do not share your personal information with nonaffiliates so they can market to you |
Joint marketing | A formal agreement between nonaffiliated financial companies that together market financial products or services to you. ● The SMI Funds do not jointly market. |
50
OTHER INFORMATION
The Funds’ Statement of Additional Information (“SAI”) includes additional information about the trustees and is available without charge, upon request. You may call toll-free at (877) 764-3863 to request a copy of the SAI or to make shareholder inquiries.
PROXY VOTING
A description of the policies and procedures that each Fund uses to determine how to vote proxies relating to portfolio securities and information regarding how each Fund voted those proxies during the most recent twelve month period ended June 30, are available (1) without charge upon request by calling the Funds at (877) 764-3863 and (2) in Fund documents filed with the Securities and Exchange Commission (“SEC”) on the SEC’s website at www.sec.gov.
TRUSTEES Andrea N. Mullins, Chairperson Ira P. Cohen Mark J. Seger OFFICERS Adam T. Kornegay, Principal Executive Officer and President Zachary P. Richmond, Principal Financial Officer and Treasurer Kevin J. Patton, Chief Compliance Officer Carol J. Highsmith, Vice President and Secretary INVESTMENT ADVISER SMI Advisory Services, LLC 4400 Ray Boll Blvd. Columbus, IN 47203 DISTRIBUTOR Ultimus Fund Distributors, LLC 225 Pictoria Drive, Suite 450 Cincinnati, OH 45246 | INDEPENDENT REGISTERED PUBLIC ACCOUNTING FIRM Cohen & Company, Ltd. 1350 Euclid Avenue, Suite 800 Cleveland, OH 44115 LEGAL COUNSEL Troutman Pepper Hamilton Sanders LLP 3000 Two Logan Square 18th and Arch Streets Philadelphia, PA 19103 CUSTODIAN Huntington National Bank 41 South High Street Columbus, OH 43215 ADMINISTRATOR, TRANSFER AGENT AND FUND ACCOUNTANT Ultimus Fund Solutions, LLC 225 Pictoria Drive, Suite 450 Cincinnati, OH 45246 |
This report is intended only for the information of shareholders or those who have received the Funds’ prospectus which contains information about each Fund’s management fee and expenses. Please read the prospectus carefully before investing.
Distributed by Ultimus Fund Distributors, LLC
Member FINRA/SIPC
51
THIS PAGE INTENTIONALLY LEFT BLANK
THIS PAGE INTENTIONALLY LEFT BLANK

SOUND MIND
INVESTING FUND
(SMIFX)
SMI DYNAMIC
ALLOCATION FUND
(SMIDX)
SMI 50/40/10 FUND
(SMILX)
ANNUAL REPORT |
October 31, 2021 |
Funds’ Adviser:
SMI Advisory Services, LLC
4400 Ray Boll Blvd.
Columbus, IN 47203
(877) 764-3863
(877) SMI-FUND
www.smifund.com
SMI-AR-21
(b) Not applicable
Item 2. Code of Ethics.
As of the end of the period covered by this report, the registrant has adopted a code of ethics that applies to the registrant's principal executive officer, principal financial officer, principal accounting officer or controller, or persons performing similar functions, regardless of whether these individuals are employed by the registrant or a third party. Pursuant to Item 13(a)(1), a copy of registrant's code of ethics is filed as an exhibit to this Form N-CSR. During the period covered by this report, the code of ethics has not been amended, and the registrant has not granted any waivers, including implicit waivers, from the provisions of the code of ethics.
Item 3. Audit Committee Financial Expert.
(a)(1) The registrant's Board of Trustees has determined that the registrant has at least one audit committee financial expert serving on its audit committee.
(a)(2) The audit committee financial expert is Andrea N. Mullins, who is "independent" for purposes of this Item 3 of Form N-CSR.
Item 4. Principal Accountant Fees and Services.
| | Sound Mind Investing Funds: | FY 2021 | $40,500 | |
| | | FY 2020 | $40,500 | |
| | | | | |
| | Green Owl Intrinsic Value Fund: | FY 2021 | $13,500 | |
| | | FY 2020 | $13,500 | |
| | | | | |
| | Foundry Partners Fundamental | | | |
| | Small Cap Value Fund: | FY 2021 | $14,000 | |
| | | FY 2020 | $14,000 | |
| | | | | |
| | Dana Funds: | FY 2021 | $42,000 | |
| | | FY 2020 | $42,000 | |
| | Sound Mind Investing Funds: | FY 2021 | $0 | |
| | | FY 2020 | $0 | |
| | | | | |
| | Green Owl Intrinsic Value Fund: | FY 2021 | $0 | |
| | | FY 2020 | $0 | |
| | | | | |
| | Foundry Partners Fundamental | | | |
| | Small Cap Value Fund: | FY 2021 | $0 | |
| | | FY 2020 | $0 | |
| | | | | |
| | Dana Funds: | FY 2021 | $0 | |
| | | FY 2020 | $0 | |
| | Sound Mind Investing Funds: | FY 2021 | $9,000 | |
| | | FY 2020 | $9,000 | |
| | | | | |
| | Green Owl Intrinsic Value Fund: | FY 2021 | $3,000 | |
| | | FY 2020 | $3,000 | |
| | | | | |
| | Foundry Partners Fundamental | | | |
| | Small Cap Value Fund: | FY 2021 | $3,000 | |
| | | FY 2020 | $3,000 | |
| | | | | |
| | Dana Funds: | FY 2021 | $9,000 | |
| | | FY 2020 | $9,000 | |
Nature of the fees: Preparation of the 1120 RIC and Excise review
| | Sound Mind Investing Funds: | FY 2021 | $0 | |
| | | FY 2020 | $0 | |
| | | | | |
| | Green Owl Intrinsic Value Fund: | FY 2021 | $0 | |
| | | FY 2020 | $0 | |
| | | | | |
| | Foundry Partners Fundamental | | | |
| | Small Cap Value Fund: | FY 2021 | $0 | |
| | | FY 2020 | $0 | |
| | | | | |
| | Dana Funds: | FY 2021 | $0 | |
| | | FY 2020 | $0 | |
| (e) | (1) | Audit Committee's Pre-Approval Policies |
The Audit Committee Charter requires the Audit Committee to be responsible for the selection, retention or termination of auditors and, in connection therewith, to (i) evaluate the proposed fees and other compensation, if any, to be paid to the auditors, (ii) evaluate the independence of the auditors, (iii) pre-approve all audit services and, when appropriate, any non-audit services provided by the independent auditors to the Trust, (iv) pre-approve, when appropriate, any non-audit services provided by the independent auditors to the Trust's investment adviser, or any entity controlling, controlled by, or under common control with the investment adviser and that provides ongoing services to the Trust if the engagement relates directly to the operations and financial reporting of the Trust, and (v) receive the auditors' specific representations as to their independence;
| (2) | All of the services described in paragraphs (b) through (d) of Item 4 were pre-approved by the Audit Committee. |
(f) During audit of registrant's financial statements for the most recent fiscal year, less than 50 percent of the hours expended on the principal accountant's engagement were attributed to work performed by persons other than the principal accountant's full-time, permanent employees.
(g) The aggregate non-audit fees billed by the registrant's accountant for services rendered to the registrant, and rendered to the registrant's investment adviser (not including any sub-adviser whose role is primarily portfolio management and is subcontracted with or overseen by another investment adviser), and any entity controlling, controlled by, or under common control with the adviser that provides ongoing services to the registrant:
| | Registrant | Adviser | |
| FY 2021 | $24,000 | $0 | |
| FY 2020 | $24,000 | $0 | |
(h) Not applicable. The auditor performed no services for the registrant's investment adviser or any entity controlling, controlled by, or under common control with the investment adviser that provides ongoing services to the registrant
Item 5. Audit Committee of Listed Companies. Not applicable – applies to listed companies only
Item 6. Schedule of Investments. Schedules filed with Item 1.
Item 7. Disclosure of Proxy Voting Policies and Procedures for Closed-End Management Investment Companies. Not applicable – applies to closed-end funds only
Item 8. Portfolio Managers of Closed-End Investment Companies. Not applicable – applies to closed-end funds only
Item 9. Purchases of Equity Securities by Closed-End Management Investment Company and Affiliated Purchasers. Not applicable – applies to closed-end funds only
Item 10. Submission of Matters to a Vote of Security Holders.
The guidelines applicable to shareholders desiring to submit recommendations for nominees to the Registrant's board of trustees are contained in the statement of additional information of the Trust with respect to the Fund(s) for which this Form N-CSR is being filed.
Item 11. Controls and Procedures.
(a) Based on their evaluation of the registrant's disclosure controls and procedures (as defined in Rule 30a-3(c) under the Investment Company Act of 1940, as amended (the "Act")) as of a date within 90 days of the filing date of this report, the registrant's principal executive officer and principal financial officer have concluded that such disclosure controls and procedures are reasonably designed and are operating effectively to ensure that material information relating to the registrant is made known to them by others within those entities, particularly during the period in which this report is being prepared, and that the information required in filings on Form N-CSR is recorded, processed, summarized, and reported on a timely basis.
(b) There were no changes in the registrant's internal control over financial reporting (as defined in Rule 30a-3(d) under the Investment Company Act of 1940) that occurred during the period covered by this report that have materially affected, or are reasonably likely to materially affect, the registrant's internal control over financial reporting.
Item 12. Disclosure of Securities Lending Activities for Closed-End Management Investment Companies. Not applicable – applies to closed-end funds only
Item 13. Exhibits.
| | (2) | Certifications by the registrant's principal executive officer and principal financial officer, pursuant to Section 302 of the Sarbanes- Oxley Act of 2002 and required by Rule 30a-2 under the Investment Company Act of 1940 are filed herewith. |
| (b) | Certification pursuant to 18 U.S.C. Section 1350, as adopted pursuant to Section 906 of the Sarbanes-Oxley Act of 2002 is filed herewith. |
Pursuant to the requirements of the Securities Exchange Act of 1934 and the Investment Company Act of 1940, the registrant has duly caused this report to be signed on its behalf by the undersigned, thereunto duly authorized.
| (Registrant) | Valued Advisers Trust | | | |
| | | | | |
| By | /s/ Mark J. Seger | | | |
| | Mark J. Seger, Interim President and Principal Executive Officer | | | |
| | | | | |
| Date | 1/04/2022 | | | |
Pursuant to the requirements of the Securities Exchange Act of 1934 and the Investment Company Act of 1940, this report has been signed below by the following persons on behalf of the registrant and in the capacities and on the dates indicated.
| By | /s/ Mark J. Seger | | | |
| | Mark J. Seger, Interim President and Principal Executive Officer | | | |
| | | | | |
| Date | 1/04/2022 | | |
| | | | |
| By | /s/ Zachary P. Richmond | | |
| | Zachary P. Richmond, Treasurer and Principal Financial Officer | | |
| | | | |
| Date | 1/04/2022 | | |