united states
securities and exchange commission
washington, d.c. 20549
form n-csr
certified shareholder report of registered management
investment companies
| Investment Company Act file number | 811-22208 | |
| Valued Advisers Trust |
(Exact name of registrant as specified in charter) |
| Ultimus Fund Solutions, LLC 225 Pictoria Drive, Suite 450 Cincinnati, OH | 45246 |
(Address of principal executive offices) | (Zip code) |
Ultimus Fund Solutions, LLC
Attn: Gregory Knoth
225 Pictoria Drive, Suite 450
Cincinnati, OH 45246
(Name and address of agent for service)
| Registrant's telephone number, including area code: | 513-587-3400 | |
| Date of fiscal year end: | 10/31 | |
| | | |
| Date of reporting period: | 10/31/2020 | |
Item 1. Reports to Stockholders.

DANA LARGE CAP EQUITY FUND
DANA EPIPHANY ESG SMALL CAP EQUITY FUND
(formerly, the Dana Small Cap Equity Fund)
DANA EPIPHANY ESG EQUITY FUND
Annual Report
October 31, 2020
Beginning on January 1, 2021, as permitted by regulations adopted by the Securities and Exchange Commission, paper copies of the Funds’ shareholder reports like this one will no longer be sent by mail, unless you specifically request paper copies of the reports from the Funds or from your financial intermediary such as a broker-dealer or bank. Instead, the reports will be made available on a website, and you will be notified by mail each time a report is posted and provided with a website link to access the report.
If you already elected to receive shareholder reports electronically, you will not be affected by this change and you need not take any action. You may elect to receive shareholder reports and other communications from the Funds electronically by contacting the Funds at (855) 280-9648 or, if you own these shares through a financial intermediary, you may contact your financial intermediary.
You may elect to receive all future reports in paper free of charge. You can inform the Funds that you wish to continue receiving paper copies of your shareholder reports by contacting the Funds at (855) 280-9648. If you own shares through a financial intermediary, you may contact your financial intermediary or follow instructions included with this document to elect to continue to receive paper copies of your shareholder reports. Your election to receive reports in paper will apply to all funds held with the fund complex or at your financial intermediary.
Dana Investment Advisors, Inc.
20700 Swenson Drive, Suite 400
Waukesha, WI 53186
(855) 280-9648
www.danafunds.com
Dear Fellow Shareholders,
The year 2020 has been a challenging year on so many levels. The challenge of a persistent pandemic that has affected our society deeply has been the key event, and the pandemic has been the lens through which we will view all that has taken place this year. As investors, we have to continue to look forward for opportunities, and we have done that this year. We have experienced both a full bear market and a full market recovery over the last twelve months, and our portfolio management team has had to adapt to a rapidly changing landscape while looking forward at the same time. We look forward to both the challenges and opportunities that we will face in the future, and we will strive to be good stewards of the capital you have entrusted to our care.
Economic and Market Recap
From October 31, 2019 through the beginning of February 2020, markets continued to push higher, with the S&P 500® Index reaching a new high on February 19th. Economic growth was aided by low inflation and an accommodative Federal Reserve, which cut rates three times in the second half of 2019. Longer term interest rates drifted lower through this period, and market appreciation reflected the belief that the expansion would continue. On the political front, the race for the Democratic presidential nomination was wide open, and President Trump was acquitted by the Senate in his impeachment trial.
In January, our portfolio management team began to monitor a virus outbreak in a city named Wuhan in central China. Wuhan has a population larger than New York City. Reports of sickness and death, and images of entire new hospitals built in weeks, appeared on news feeds. By late February and into early March, it was clear that the virus was spreading around the world. Stocks fell over 30% in a five-week period, and the U.S. government and the Federal Reserve realized the threat to our economy and our markets. The Federal Reserve cut interest rates 150 basis points in a two-week period in early March while also coming out with a list of programs dedicated to supporting the markets. Emergency aid was passed by Congress, and the Treasury added its own emergency lending and asset purchase programs. Markets bottomed in late March and began to rebound, even as the virus spread. The S&P 500® Index briefly reached positive territory for the year in early June and moved up significantly through July and August.
Different market sectors were either rewarded or severely punished based on their economic prospects under an economy where many were either not working or working from home. Growth generally outperformed value by a significant margin through the market peak in early September, when the market began to broaden, and consolidate through the end of October. All of our strategies had to navigate this rotation into growth and tech companies early in the year, as well as a broadening and a move back to what had been weaker areas of the market towards the end of the year.
The presidential election provided yet another interesting backdrop to a tumultuous year. The widespread implementation of voting by mail delayed the results and increased the level of uncertainty surrounding the outcome. It appears that divided government will be the result, and the markets have continued to move higher on that news.
Looking forward, we are hopeful that the recent advances towards a workable vaccine can continue through production and distribution phases. Sectors of the economy that would benefit from more mobility and a more open economy are already beginning to rebound in the market. We continue to pursue opportunities in the market that offer attractive valuations and future prospects for expansion.
1
Dana Large Cap Fund (the “Large Cap Fund”) Discussion
Despite having to deal with the unique challenges we have all faced this year, our team continued to focus their efforts on finding high-quality companies and managing the Large Cap Fund with a longer-term investment horizon. The Large Cap Fund’s (Institutional Class) absolute performance of +4.65% was favorable in light of all that has transpired, and it was above the equal-weighted S&P 500® Index return of 0.58%. Yet, with a select few mega-cap growth companies dominating the cap-weighted S&P 500® Index, the Large Cap Fund trailed the benchmark S&P 500® Index return of +9.71%. The impacts of COVID-19 have extended the market’s preference for growth versus value-orientated stocks based on style indices to historic extremes. This dynamic is creating wonderful opportunities despite COVID-19 impacts still lingering over many industries. The Large Cap Fund was able to take advantage of the market’s pullback in early 2020, positioning itself in attractively valued securities that were driven down with the overall market swoon. This proved advantageous to performance when the market started bouncing back in April. Relative performance strengthened during the late spring and early summer.
For the full fiscal year, the performance of the Large Cap Fund’s holdings in Consumer Discretionary and Technology sectors helped deliver the strongest absolute returns. Energy was the weakest sector on an absolute basis, followed by Financials in the S&P 500® Index. Top performing contributors to the Large Cap Fund for the year included Consumer Discretionary holdings, Best Buy Co., Inc. (BBY), the consumer electronics retailer stalwart, and D.R. Horton, Inc. (DHI), the largest homebuilder in the United States. Other top performers were Thermo Fisher Scientific, Inc. (TMO), a key supplier in the health care and biotechnology industries, and Lam Research Corporation (LRCX), a key enabler of memory solutions for 5G and artificial intelligence. Holdings that detracted most from performance included companies that were negatively impacted by coronavirus shut downs, such as Starwood Property Trust, Inc., a REIT with exposure to hotels, and Sysco Corporation (SYY), a foodservice distributor to restaurants, hotels, and office buildings. Both companies were eventually sold from the Large Cap Fund. Marathon Petroleum Corporation (MPC), American Express Company (AXP), and Citizens Financial Group, Inc. (CFG) also lagged the market and were replaced with new alternatives.
Our analysis shows that the Dana Large Cap Equity Fund is trading at attractive relative valuations versus its benchmark and is performing well in terms of actual earnings and cash flow generation. We remain committed to our investment discipline as investors sort out expectations for the coming year.
Dana Epiphany ESG Small Cap Equity Fund (the “Small Cap Fund”) Discussion
The Small Cap Fund (Institutional Class) returned -4.04% versus the Russell 2000® Index return of -0.14% for the fiscal year. The numbers do little justice in telling the complete story of the underlying market environment in the prior twelve months. The Russell 2000® Index made 52-week highs throughout January and February then entered a bear market in the record time of 19 days, dropping further in the middle of March. The good news is that small cap stocks have historically outperformed large cap stocks coming off market bottoms, a pattern that repeated in the second quarter, as well as off the market lows this fall. The Small Cap Fund rode the same wave as the Index through much of the 1st quarter of 2020 and saw a strong rebound from April through July. August proved to be a difficult month for relative performance as there appeared to be a shift into deep value from many growthier names in an apparent profit-taking phase. The year finished in strong form in September and October, despite elevated uncertainty with a second round of stimulus and an undetermined and stressful political backdrop.
2
During the fiscal year, the Small Cap Fund realized strong returns from Technology, Consumer Discretionary, and Real Estate sectors, while Consumer Staples, Industrials, and Health Care detracted from relative performance. Two of the Small Cap Fund’s top contributing holdings were Horizon Therapeutics, PLC (HZNP) and Five9, Inc. (FIVN). Horizon is a pharmaceutical company with a legacy product line in rheumatoid arthritis and osteoarthritis, as well as newer offerings of treatment for gout and recently FDA approved product treatment for thyroid eye disease. Five9 is a leading contact center as a service software provider in the cloud that was in high demand before the pandemic, but their tailwind increased as a result of the work-from-home trend. Two of the larger detractors were Performance Food Group Company (PFGC) and CONMED Corporation (CNMD). Performance Food Group is a nationwide food supplier and distribution company whose customers in the restaurant, college, and theater industries were all greatly impacted by shutdowns related to COVID-19. The position was sold due to leverage and seriously impaired end markets. CONMED is a global medical technology company that specializes in the development and sale of surgical and patient-monitoring products and services utilized in specialized medicine fields. The line of products is sensitive to demand for elective procedures that were impacted heavily by hospital and clinic shutdowns.
Portfolio turnover is generally higher during periods of accelerating economic uncertainty, which almost always correlate with market volatility. Volatility can be both a threat and an opportunity, and the Small Cap Fund took advantage of opportunities to add excellent businesses at discounted prices in the first half of 2020. Some of the portfolio trading was done with an eye on tax efficiency, and the result should equal an advantageous position for Small Cap Fund owners when the accounting dust settles.
There are tremendous stories being written in small cap America. Exciting developments in various technologies and end markets are visible in many industries in our universe. The strength of the security selection in the Small Cap Fund is not always easy to see, especially with an increasingly complicated benchmark that has a rising sum of low-quality companies. One measure of our success is the maturation of Small Cap Fund holdings like Chegg, Inc. (CHGG), Horizon, and Five9 into midcap market winners. The Small Cap Fund continues to seek opportunities to add value through a relative value discipline that focuses on fundamentally driven stock selection and believes the Small Cap Fund will reward investors over the long term.
Dana Epiphany ESG Equity Fund (the “Epiphany ESG Fund”) Discussion
The Epiphany ESG Fund was exposed to the same challenges and news flow as it holds companies across the market capitalization spectrum. While it was rewarding for the Epiphany ESG Fund (Institutional Class) to return +4.76% during such a volatile fiscal year, the Epiphany ESG Fund did trail the cap-weighted S&P 500® Index return of +9.71%. While the relative performance headwind caused by concentrated growth stocks in the Index is disappointing, we continue to adhere to strong Environmental, Social, and Governance (ESG) pillars that are integrated into our relative value investment philosophy. Many of the underlying ESG themes in the portfolio point to longer-term sustainable trends; therefore, we remain focused on long-term prospects of these companies in lieu of short-term hurdles. ESG investing has been a boon for the industry during the last 12 months, and while we certainly appreciate the attention it has received, we pause to remind you that not all ESG offerings are created equal. We encourage you as shareholders to understand the comprehensive process we utilize and the active company engagement we undertake as shareholder advocates.
3
During the fiscal year, the Epiphany ESG Fund realized strong returns from the Consumer Discretionary and Utilities sectors, while Technology and Consumer Staples detracted from relative performance. Two of the top contributing holdings were Emergent BioSolutions, Inc. (EBS) and Best Buy Co., Inc. (BBY). Emergent is a specialty life sciences company focused on vaccines and anti-infectives sold primarily to government entities; their strong free cash flow and net cash position stand out in the biotech industry. Best Buy Co., Inc. (BBY), the consumer electronics retailer stalwart, showed strong performance in light of the work-from-home transition as many scrambled to update their home office capabilities. Marathon Petroleum Corporation (MPC) and Starwood Property Trust, Inc. (STWD) were two of the larger detractors in the fiscal year. In addition, the Epiphany ESG Fund’s relative performance in the Information Technology sector was primarily a result of lower weightings than what was held in the Index – a pillar risk control in Dana’s investment process.
The Dana Epiphany ESG Equity Fund continues to invest in companies that meet our ESG criteria and provide growth at attractive valuations relative to peers.
Respectfully submitted,

Mark R. Mirsberger, CPA
Chief Executive Officer – Dana Investment Advisors, Inc.

Duane Roberts, CFA
Portfolio Manager and Director of Equities – Dana Investment Advisors, Inc.
4
Investment Results (Unaudited) | |
Average Annual Total Returns(a) as of October 31, 2020
| One
Year | Five
Year | Ten
Year | Since
Inception
(10/29/13) |
Dana Large Cap Equity Fund | | |
Institutional Class | 4.65% | 9.83% | N/A | 9.93% |
Investor Class | 4.43% | 9.56% | 11.23% | N/A |
S&P 500® Index(b) | 9.71% | 11.71% | 13.01% | 11.38% |
| | Expense Ratios(c) |
| Institutional
Class | Investor
Class |
Gross | 0.85% | 1.10% |
With Applicable Waivers | 0.73% | 0.98% |
The performance quoted represents past performance, which does not guarantee future results. The investment return and principal value of an investment will fluctuate so that an investor’s shares, when redeemed, may be worth more or less than their original cost. The returns shown do not reflect deduction of taxes that a shareholder would pay on Dana Large Cap Equity Fund (the “Large Cap Fund”) distributions or the redemption of Large Cap Fund shares. Current performance of the Large Cap Fund may be lower or higher than the performance quoted. Performance data current to the most recent month end may be obtained by calling 1-855-280-9648.
(a) | Average annual total returns reflect any change in price per share and assume the reinvestment of all distributions. The Large Cap Fund’s returns reflect any fee reductions during the applicable period. If such reductions had not occurred, the quoted performance would have been lower. |
(b) | The S&P 500® Index (“S&P Index”) is a widely recognized unmanaged index of equity securities and is representative of a broader domestic equity market and range of securities than is found in the Large Cap Fund’s portfolio. Individuals cannot invest directly in the S&P Index; however, an individual can invest in exchange-traded funds (“ETFs”) or other investment vehicles that attempt to track the performance of a benchmark index. |
(c) | The expense ratios are from the Large Cap Fund’s prospectus dated February 28, 2020. Expense ratios with applicable waivers reflect that Dana Investment Advisors, Inc. (the “Adviser”) has contractually agreed to waive or limit its fees and to assume other expenses of the Large Cap Fund until February 28, 2021, so that total annual fund operating expenses do not exceed 0.73% of the Large Cap Fund’s average daily net assets. This operating expense limitation does not apply to brokerage fees and commissions, borrowing costs (such as interest and dividend expenses on securities sold short), taxes, extraordinary expenses, fees and expenses paid under a distribution plan adopted pursuant to Rule 12b-1, fees and expenses paid under a shareholder services plan, and indirect expenses (such as “Acquired Fund Fees and Expenses”). Each waiver or reimbursement of an expense by the Adviser is subject to repayment by the Fund within three years following the date of such waiver or reimbursement, provided that the Large Cap Fund is able to make the repayment without exceeding the expense limitation in place at the time of the waiver or reimbursement and the expense limitation in place at the time of the repayment. This agreement may only be terminated by mutual consent of the Adviser and the Board of Trustees. Additional information pertaining to the Large Cap Fund’s expense ratios as of October 31, 2020 can be found in the financial highlights. |
The Large Cap Fund’s investment objectives, strategies, risks, charges and expenses must be considered carefully before investing. The prospectus contains this and other important information about the Large Cap Fund and may be obtained by calling the same number as above. Please read it carefully before investing.
The Large Cap Fund is distributed by Ultimus Fund Distributors, LLC, member FINRA/SIPC.
5
Investment Results (Unaudited) | |
Average Annual Total Returns(a) as of October 31, 2020
| One
Year | Since
Inception
(11/3/15) |
Dana Epiphany ESG Small Cap Equity Fund |
Institutional Class | (4.04)% | 1.48% |
Russell 2000® Index(b) | (0.14)% | 6.73% |
| | Expense
Ratios(c) |
| Institutional
Class |
Gross | 1.88% |
With Applicable Waivers | 0.95% |
The performance quoted represents past performance, which does not guarantee future results. The investment return and principal value of an investment will fluctuate so that an investor’s shares, when redeemed, may be worth more or less than their original cost. The returns shown do not reflect deduction of taxes that a shareholder would pay on Dana Epiphany ESG Small Cap Equity Fund (the “Small Cap Fund”) distributions or the redemption of Small Cap Fund shares. Current performance of the Small Cap Fund may be lower or higher than the performance quoted. Performance data current to the most recent month end may be obtained by calling 1-855-280-9648.
(a) | Average annual total returns reflect any change in price per share and assume the reinvestment of all distributions. The Small Cap Fund’s returns reflect any fee reductions during the applicable period. If such reductions had not occurred, the quoted performance would have been lower. Effective at the close of business on June 4, 2020, Investor Class shares of the Small Cap Fund were exchanged for Institutional Class shares, resulting in the closing of the Investor Class. |
(b) | The Russell 2000® Index (“Russell Index”) is a widely recognized unmanaged index of equity securities and is representative of a broader domestic equity market and range of securities than are found in the Small Cap Fund’s portfolio. Individuals can not invest directly in the Russell Index; however, an individual can invest in ETFs or other investment vehicles that attempt to track the performance of a benchmark index. |
(c) | The expense ratios are from the Small Cap Fund’s prospectus dated February 28, 2020 (as amended October 1, 2020). Expense ratios with applicable waivers reflect that the Adviser has contractually agreed to waive or limit its fees and to assume other expenses of the Small Cap Fund until February 28, 2021, so that total annual fund operating expenses do not exceed 0.95% of the Small Cap Fund’s average daily net assets. This operating expense limitation does not apply to brokerage fees and commissions, borrowing costs (such as interest and dividend expenses on securities sold short), taxes, extraordinary expenses, fees and expenses paid under a distribution plan adopted pursuant to Rule 12b-1, fees and expenses paid under a shareholder services plan, and indirect expenses (such as “Acquired Fund Fees and Expenses”). Each waiver or reimbursement of an expense by the Adviser is subject to repayment by the Small Cap Fund within three years following the date of such waiver or reimbursement, provided that the Small Cap Fund is able to make the repayment without exceeding the expense limitation in place at the time of the waiver or reimbursement and the expense limitation in place at the time of the repayment. This agreement may only be terminated by mutual consent of the Adviser and the Board of Trustees. Additional information pertaining to the Small Cap Fund’s expense ratios as of October 31, 2020 can be found in the financial highlights. |
The Small Cap Fund’s investment objectives, strategies, risks, charges and expenses must be considered carefully before investing. The prospectus contains this and other important information about the Small Cap Fund and may be obtained by calling the same number as above. Please read it carefully before investing.
The Small Cap Fund is distributed by Ultimus Fund Distributors, LLC, member FINRA/SIPC.
6
Investment Results (Unaudited) | |
Average Annual Total Returns(a) as of October 31, 2020
| One
Year | Five
Year | Ten
Year |
Dana Epiphany ESG Equity Fund | | | |
Institutional Class | 4.76% | 8.67% | 9.48% |
S&P 500® Index(b) | 9.71% | 11.71% | 13.01% |
| | Expense
Ratios(c) |
| Institutional
Class |
Gross | 2.13% |
With Applicable Waivers | 0.85% |
The performance quoted represents past performance, which does not guarantee future results. The investment return and principal value of an investment will fluctuate so that an investor’s shares, when redeemed, may be worth more or less than their original cost. The returns shown do not reflect deduction of taxes that a shareholder would pay on Dana Epiphany ESG Equity Fund (the “Epiphany ESG Fund”) distributions or the redemption of Epiphany ESG Fund shares. Current performance of the Epiphany ESG Fund may be lower or higher than the performance quoted. Performance data current to the most recent month end may be obtained by calling 1-855-280-9648.
(a) | Average annual total returns reflect any change in price per share and assume the reinvestment of all distributions. The Epiphany ESG Fund’s returns reflect any fee reductions during the applicable period. If such reductions had not occurred, the quoted performance would have been lower. Effective at the close of business on June 4, 2020, Investor Class shares of the Epiphany ESG Fund were exchanged for Institutional Class shares, resulting in the closing of the Investor Class. |
(b) | The S&P 500® Index (“S&P Index”) is a widely recognized unmanaged index of equity securities and is representative of a broader domestic equity market and range of securities than is found in the Epiphany ESG Fund’s portfolio. Individuals cannot invest directly in the S&P Index; however, an individual can invest in ETFs or other investment vehicles that attempt to track the performance of a benchmark index. |
(c) | The expense ratios are from the Epiphany ESG Fund’s prospectus dated February 28, 2020. Expense ratios with applicable waivers reflect that the Adviser has contractually agreed to waive or limit its fees and to assume other expenses of the Epiphany ESG Fund until February 28, 2021, so that total annual fund operating expenses do not exceed 0.85% of the Epiphany ESG Fund’s average net assets. This operating expense limitation does not apply to brokerage fees and commissions, borrowing costs (such as interest and dividend expenses on securities sold short), taxes, extraordinary expenses, fees and expenses paid under a distribution plan adopted pursuant to Rule 12b-1, fees and expenses paid under a shareholder services plan, and indirect expenses (such as “Acquired Fund Fees and Expenses”). Each waiver or reimbursement of an expense by the Adviser is subject to repayment by the Epiphany ESG Fund within three years following the date of such waiver or reimbursement, provided that the Epiphany ESG Fund is able to make the repayment without exceeding the expense limitation in place at the time of the waiver or reimbursement and the expense limitation in place at the time of the repayment. This agreement may only be terminated by mutual consent of the Adviser and the Board of Trustees. Additional information pertaining to the Epiphany ESG Fund’s expense ratios as of October 31, 2020 can be found on the financial highlights. |
The Epiphany ESG Fund’s investment objectives, strategies, risks, charges and expenses must be considered carefully before investing. The prospectus contains this and other important information about the Epiphany ESG Fund and may be obtained by calling the same number as above. Please read it carefully before investing.
The Epiphany ESG Fund is distributed by Ultimus Fund Distributors, LLC, member FINRA/SIPC.
7
Comparison of Growth of $10,000 Investment in the
Dana Large Cap Equity Fund, Investor Class and
the S&P 500® Index (Unaudited)
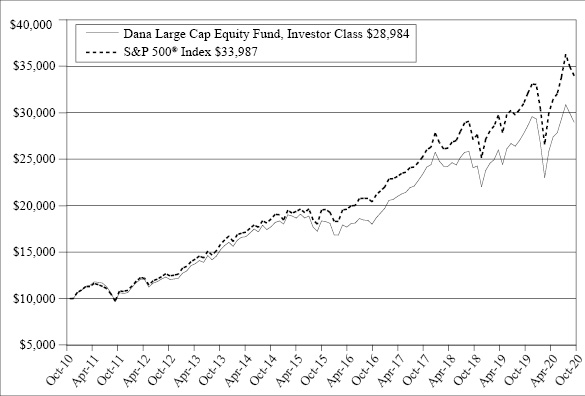
The chart above assumes an initial investment of $10,000 made on October 31, 2010 held through October 31, 2020. THE LARGE CAP FUND’S RETURN REPRESENTS PAST PERFORMANCE AND DOES NOT GUARANTEE FUTURE RESULTS. The returns shown do not reflect deduction of taxes that a shareholder would pay on Large Cap Fund distributions or the redemption of Large Cap Fund shares. Investment returns and principal values will fluctuate so that your shares, when redeemed, may be worth more or less than their original purchase price.
Current performance may be lower or higher than the performance data quoted. For more information on the Large Cap Fund, and to obtain performance data current to the most recent month end or to request a prospectus, please call 1-855-280-9648. You should carefully consider the investment objectives, potential risks, management fees, and charges and expenses of the Large Cap Fund before investing. The Large Cap Fund’s prospectus contains this and other information about the Large Cap Fund, and should be read carefully before investing.
The Large Cap Fund is distributed by Ultimus Fund Distributors, LLC, member FINRA/SIPC.
8
Comparison of Growth of $10,000 Investment in the
Dana Epiphany ESG Small Cap Equity Fund,
Institutional Class and the Russell 2000® Index (Unaudited)
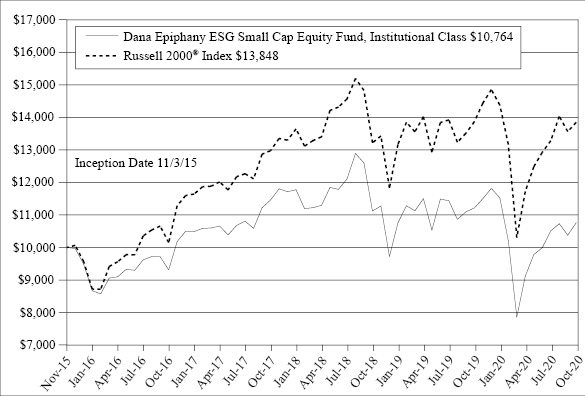
The chart above assumes an initial investment of $10,000 made on November 3, 2015 (commencement of Institutional Class operations) held through October 31, 2020. THE SMALL CAP FUND’S RETURN REPRESENTS PAST PERFORMANCE AND DOES NOT GUARANTEE FUTURE RESULTS. The returns shown do not reflect deduction of taxes that a shareholder would pay on Small Cap Fund distributions or the redemption of Small Cap Fund shares. Investment returns and principal values will fluctuate so that your shares, when redeemed, may be worth more or less than their original purchase price.
Current performance may be lower or higher than the performance data quoted. For more information on the Small Cap Fund, and to obtain performance data current to the most recent month end or to request a prospectus, please call 1-855-280-9648. You should carefully consider the investment objectives, potential risks, management fees, and charges and expenses of the Small Cap Fund before investing. The Small Cap Fund’s prospectus contains this and other information about the Small Cap Fund, and should be read carefully before investing.
The Small Cap Fund is distributed by Ultimus Fund Distributors, LLC, member FINRA/SIPC.
9
Comparison of Growth of $10,000 Investment in the
Dana Epiphany ESG Equity Fund, Institutional Class and
the S&P 500® Index (Unaudited)
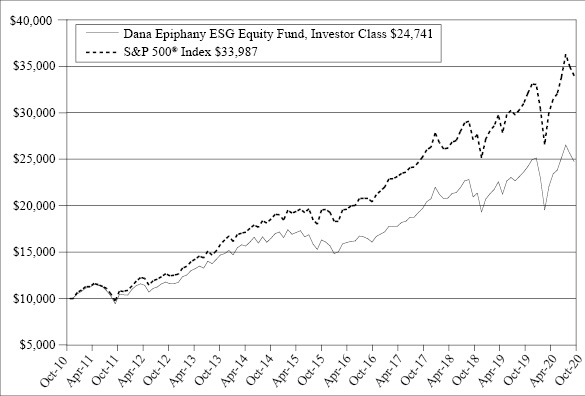
The chart above assumes an initial investment of $10,000 made on October 31, 2010 held through October 31, 2020. THE EPIPHANY ESG FUND’S RETURN REPRESENTS PAST PERFORMANCE AND DOES NOT GUARANTEE FUTURE RESULTS. The returns shown do not reflect deduction of taxes that a shareholder would pay on Epiphany ESG Fund distributions or the redemption of Epiphany ESG Fund shares. Investment returns and principal values will fluctuate so that your shares, when redeemed, may be worth more or less than their original purchase price.
Current performance may be lower or higher than the performance data quoted. For more information on the Epiphany ESG Fund, and to obtain performance data current to the most recent month end or to request a prospectus, please call 1-855-280-9648. You should carefully consider the investment objectives, potential risks, management fees, and charges and expenses of the Epiphany ESG Fund before investing. The Epiphany ESG Fund’s prospectus contains this and other information about the Epiphany ESG Fund, and should be read carefully before investing.
The Epiphany ESG Fund is distributed by Ultimus Fund Distributors, LLC, member FINRA/SIPC.
10
Portfolio Illustration (Unaudited)
October 31, 2020
The following chart gives a visual breakdown of the Large Cap Fund by sector weighting as a percentage of net assets as of October 31, 2020.

11
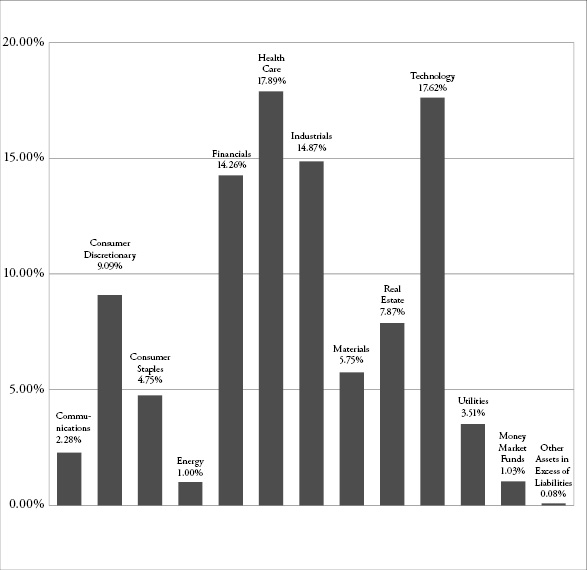
Portfolio Illustration (Unaudited)
October 31, 2020
The following chart gives a visual breakdown of the Small Cap Fund by sector weighting as a percentage of net assets as of October 31, 2020.
12
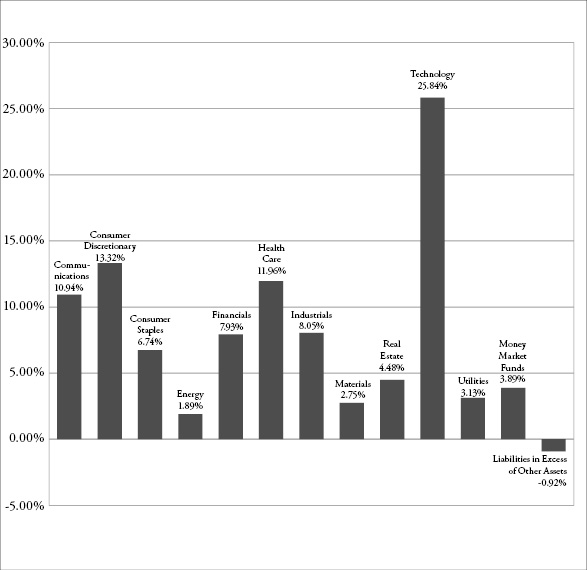
Portfolio Illustration (Unaudited)
October 31, 2020
The following chart gives a visual breakdown of the Epiphany ESG Fund by sector weighting as a percentage of net assets as of October 31, 2020.
Availability of Portfolio Schedules (Unaudited)
The Large Cap Fund, the Small Cap Fund and the Epiphany ESG Fund (each a “Fund” and collectively the “Funds”) file their complete schedules of portfolio holdings with the Securities and Exchange Commission (“SEC”) for the first and third quarters of each fiscal year as an exhibit to its reports on Form N-PORT. The Funds’ Form N-PORT reports are available on the SEC’s website at http://www.sec.gov.
13
Dana Large Cap Equity Fund
Schedule of Investments
October 31, 2020
| | Shares | | | Fair Value | |
COMMON STOCKS — 99.22% | | | | | | | | |
Communications — 10.99% | | | | | | | | |
Activision Blizzard, Inc. | | | 18,400 | | | $ | 1,393,432 | |
Alphabet, Inc., Class A(a) | | | 2,100 | | | | 3,393,831 | |
AT&T, Inc. | | | 1,000 | | | | 27,020 | |
Comcast Corp., Class A | | | 36,000 | | | | 1,520,640 | |
Facebook, Inc., Class A(a) | | | 8,400 | | | | 2,210,124 | |
T-Mobile US, Inc.(a) | | | 19,600 | | | | 2,147,572 | |
Verizon Communications, Inc. | | | 36,000 | | | | 2,051,640 | |
| | | | | | | | 12,744,259 | |
Consumer Discretionary — 13.05% | | | | | | | | |
Amazon.com, Inc.(a) | | | 1,280 | | | | 3,886,272 | |
AutoZone, Inc.(a) | | | 1,200 | | | | 1,354,776 | |
Best Buy Co, Inc. | | | 20,500 | | | | 2,286,775 | |
BorgWarner, Inc. | | | 50,000 | | | | 1,749,000 | |
D.R. Horton, Inc. | | | 30,000 | | | | 2,004,300 | |
Fortune Brands Home & Security, Inc. | | | 22,000 | | | | 1,779,140 | |
Home Depot, Inc. (The) | | | 7,800 | | | | 2,080,338 | |
| | | | | | | | 15,140,601 | |
Consumer Staples — 6.90% | | | | | | | | |
Keurig Dr Pepper, Inc. | | | 1,000 | | | | 26,900 | |
Kimberly-Clark Corp. | | | 15,200 | | | | 2,015,368 | |
Mondelez International, Inc., Class A | | | 38,000 | | | | 2,018,560 | |
PepsiCo, Inc. | | | 14,000 | | | | 1,866,060 | |
Walmart, Inc. | | | 15,000 | | | | 2,081,250 | |
| | | | | | | | 8,008,138 | |
Energy — 1.88% | | | | | | | | |
Chevron Corp. | | | 500 | | | | 34,750 | |
ConocoPhillips | | | 32,000 | | | | 915,840 | |
Exxon Mobil Corp. | | | 1,000 | | | | 32,620 | |
Pioneer Natural Resources Co. | | | 15,000 | | | | 1,193,400 | |
| | | | | | | | 2,176,610 | |
Financials — 9.70% | | | | | | | | |
American Express Co. | | | 400 | | | | 36,496 | |
Aon PLC, Class A | | | 9,000 | | | | 1,656,090 | |
Bank of America Corp. | | | 80,000 | | | | 1,896,000 | |
Bank of New York Mellon Corp. (The) | | | 55,000 | | | | 1,889,800 | |
Discover Financial Services | | | 28,000 | | | | 1,820,280 | |
JPMorgan Chase & Co. | | | 20,200 | | | | 1,980,408 | |
Morgan Stanley | | | 41,000 | | | | 1,974,150 | |
| | | | | | | | 11,253,224 | |
14 | See accompanying notes which are an integral part of these financial statements. | |
Dana Large Cap Equity Fund
Schedule of Investments (continued)
October 31, 2020
| | Shares | | | Fair Value | |
COMMON STOCKS — 99.22% — (continued) |
Health Care — 14.01% | | | | | | | | |
Abbott Laboratories | | | 20,000 | | | $ | 2,102,200 | |
AbbVie, Inc. | | | 1,000 | | | | 85,100 | |
Amgen, Inc. | | | 9,400 | | | | 2,039,236 | |
Bristol-Myers Squibb Co. | | | 20,000 | | | | 1,169,000 | |
Horizon Therapeutics PLC(a) | | | 26,000 | | | | 1,948,180 | |
Merck & Co., Inc. | | | 27,000 | | | | 2,030,670 | |
STERIS PLC | | | 12,000 | | | | 2,126,280 | |
Thermo Fisher Scientific, Inc. | | | 5,200 | | | | 2,460,224 | |
UnitedHealth Group, Inc. | | | 7,500 | | | | 2,288,550 | |
| | | | | | | | 16,249,440 | |
Industrials — 6.84% | | | | | | | | |
Boeing Co. (The) | | | 200 | | | | 28,878 | |
Delta Air Lines, Inc. | | | 1,000 | | | | 30,640 | |
Dover Corp. | | | 17,700 | | | | 1,959,567 | |
Lockheed Martin Corp. | | | 5,500 | | | | 1,925,715 | |
Norfolk Southern Corp. | | | 9,600 | | | | 2,007,552 | |
Parker-Hannifin Corp. | | | 9,500 | | | | 1,979,420 | |
| | | | | | | | 7,931,772 | |
Materials — 2.91% | | | | | | | | |
Avery Dennison Corp. | | | 12,000 | | | | 1,660,680 | |
Packaging Corp. of America | | | 15,000 | | | | 1,717,350 | |
| | | | | | | | 3,378,030 | |
Real Estate — 2.64% | | | | | | | | |
Alexandria Real Estate Equities, Inc. | | | 4,800 | | | | 727,296 | |
American Tower Corp., Class A | | | 5,000 | | | | 1,148,250 | |
Prologis, Inc. | | | 12,000 | | | | 1,190,400 | |
| | | | | | | | 3,065,946 | |
Technology — 27.16% | | | | | | | | |
Adobe Systems, Inc.(a) | | | 4,800 | | | | 2,146,080 | |
Akamai Technologies, Inc.(a) | | | 22,000 | | | | 2,092,640 | |
Apple, Inc. | | | 38,000 | | | | 4,136,680 | |
Cadence Design Systems, Inc.(a) | | | 20,600 | | | | 2,253,022 | |
CDW Corp. | | | 18,000 | | | | 2,206,800 | |
Cisco Systems, Inc. | | | 1,000 | | | | 35,900 | |
Fidelity National Information Services, Inc. | | | 13,000 | | | | 1,619,670 | |
Intel Corp. | | | 700 | | | | 30,996 | |
Lam Research Corp. | | | 6,700 | | | | 2,291,936 | |
Leidos Holdings, Inc. | | | 1,000 | | | | 83,000 | |
MasterCard, Inc., Class A | | | 4,500 | | | | 1,298,880 | |
| | See accompanying notes which are an integral part of these financial statements. | 15 |
Dana Large Cap Equity Fund
Schedule of Investments (continued)
October 31, 2020
| | Shares | | | Fair Value | |
COMMON STOCKS — 99.22% — (continued) |
Technology — 27.16% — (continued) | | | | | | | | |
Microchip Technology, Inc. | | | 20,000 | | | $ | 2,101,600 | |
Microsoft Corp. | | | 18,000 | | | | 3,644,460 | |
PayPal Holdings, Inc.(a) | | | 10,000 | | | | 1,861,300 | |
Qorvo, Inc.(a) | | | 17,000 | | | | 2,165,120 | |
Visa, Inc., Class A | | | 7,600 | | | | 1,380,996 | |
Zebra Technologies Corp., Class A(a) | | | 7,600 | | | | 2,155,664 | |
| | | | | | | | 31,504,744 | |
Utilities — 3.14% | | | | | | | | |
Eversource Energy | | | 18,200 | | | | 1,588,314 | |
NextEra Energy, Inc. | | | 28,000 | | | | 2,049,880 | |
| | | | | | | | 3,638,194 | |
Total Common Stocks (Cost $91,656,839) | | | | | | | 115,090,958 | |
| | | | | | | | | |
MONEY MARKET FUNDS — 0.43% | | | | | | | | |
| | | | | | | | | |
Fidelity Investments Money Market Government Portfolio, Institutional Class, 0.02%(b) | | | 501,732 | | | | 501,732 | |
Total Money Market Funds (Cost $501,732) | | | | | | | 501,732 | |
| | | | | | | | | |
Total Investments — 99.65% (Cost $92,158,571) | | | | | | | 115,592,690 | |
| | | | | | | | | |
Other Assets in Excess of Liabilities — 0.35% | | | | | | | 401,022 | |
| | | | | | | | | |
NET ASSETS — 100.00% | | | | | | $ | 115,993,712 | |
(a) | Non-income producing security. |
(b) | Rate disclosed is the seven day effective yield as of October 31, 2020. |
16 | See accompanying notes which are an integral part of these financial statements. | |
Dana Epiphany ESG Small Cap Equity Fund
Schedule of Investments
October 31, 2020
| | Shares | | | Fair Value | |
COMMON STOCKS — 98.89% | | | | | | | | |
Communications — 2.28% | | | | | | | | |
Glu Mobile, Inc.(a) | | | 15,550 | | | $ | 111,338 | |
Vonage Holdings Corp.(a) | | | 10,701 | | | | 113,217 | |
| | | | | | | | 224,555 | |
Consumer Discretionary — 9.09% | | | | | | | | |
Boot Barn Holdings, Inc.(a) | | | 6,392 | | | | 204,672 | |
Chegg, Inc.(a) | | | 2,254 | | | | 165,534 | |
Deckers Outdoor Corp.(a) | | | 840 | | | | 212,830 | |
Malibu Boats, Inc., Class A(a) | | | 2,995 | | | | 152,236 | |
Marriott Vacations Worldwide Corp. | | | 1,668 | | | | 161,129 | |
| | | | | | | | 896,401 | |
Consumer Staples — 4.75% | | | | | | | | |
e.l.f. Beauty, Inc.(a) | | | 9,265 | | | | 187,801 | |
Helen of Troy Ltd.(a) | | | 902 | | | | 171,019 | |
Sprouts Farmers Market, Inc.(a) | | | 5,773 | | | | 109,976 | |
| | | | | | | | 468,796 | |
Energy — 1.00% | | | | | | | | |
WPX Energy, Inc.(a) | | | 21,376 | | | | 98,543 | |
| | | | | | | | | |
Financials — 14.26% | | | | | | | | |
Encore Capital Group, Inc.(a) | | | 4,666 | | | | 148,985 | |
Hanover Insurance Group, Inc. | | | 1,649 | | | | 157,744 | |
Home BancShares, Inc. | | | 9,942 | | | | 165,037 | |
Houlihan Lokey, Inc., Class A | | | 2,526 | | | | 158,380 | |
Jefferies Financial Group, Inc. | | | 7,750 | | | | 151,203 | |
LPL Financial Holdings, Inc. | | | 1,786 | | | | 142,755 | |
Pinnacle Financial Partners, Inc. | | | 3,915 | | | | 179,268 | |
Primerica, Inc. | | | 1,231 | | | | 135,705 | |
Western Alliance Bancorp | | | 4,061 | | | | 167,313 | |
| | | | | | | | 1,406,390 | |
Health Care — 17.89% | | | | | | | | |
Blueprint Medicines Corp.(a) | | | 2,350 | | | | 240,357 | |
CONMED Corp. | | | 1,271 | | | | 99,100 | |
Emergent BioSolutions, Inc.(a) | | | 2,235 | | | | 201,083 | |
Ensign Group, Inc. (The) | | | 3,383 | | | | 199,055 | |
HMS Holdings Corp.(a) | | | 6,011 | | | | 160,013 | |
Horizon Therapeutics PLC(a) | | | 2,619 | | | | 196,242 | |
Ligand Pharmaceuticals, Inc., Class B(a) | | | 2,176 | | | | 179,411 | |
| | See accompanying notes which are an integral part of these financial statements. | 17 |
Dana Epiphany ESG Small Cap Equity Fund
Schedule of Investments (continued)
October 31, 2020
| | Shares | | | Fair Value | |
COMMON STOCKS — 98.89% — (continued) |
Health Care — 17.89% — (continued) |
Medpace Holdings, Inc.(a) | | | 1,558 | | | $ | 172,845 | |
NuVasive, Inc.(a) | | | 3,791 | | | | 168,434 | |
uniQure N.V.(a) | | | 3,644 | | | | 147,327 | |
| | | | | | | | 1,763,867 | |
Industrials — 14.87% | | | | | | | | |
Cactus, Inc., Class A | | | 5,471 | | | | 93,007 | |
Comfort Systems USA, Inc. | | | 3,372 | | | | 154,438 | |
Federal Signal Corp. | | | 6,077 | | | | 174,288 | |
Gibraltar Industries, Inc.(a) | | | 2,674 | | | | 153,621 | |
MasTec, Inc.(a) | | | 3,685 | | | | 182,923 | |
Regal-Beloit Corp. | | | 1,550 | | | | 152,908 | |
Rexnord Corp. | | | 5,803 | | | | 186,160 | |
TopBuild Corp.(a) | | | 1,383 | | | | 211,889 | |
TriNet Group, Inc.(a) | | | 2,280 | | | | 157,138 | |
| | | | | | | | 1,466,372 | |
Materials — 5.75% | | | | | | | | |
Advanced Drainage Systems, Inc. | | | 2,430 | | | | 154,135 | |
Avient Corp. | | | 5,607 | | | | 174,210 | |
Boise Cascade Co. | | | 3,245 | | | | 124,543 | |
W.R. Grace & Co. | | | 2,629 | | | | 114,335 | |
| | | | | | | | 567,223 | |
Real Estate — 7.87% | | | | | | | | |
EastGroup Properties, Inc. | | | 1,236 | | | | 164,487 | |
Global Medical REIT, Inc. | | | 14,311 | | | | 177,886 | |
Hannon Armstrong Sustainable Infrastructure | | | 3,483 | | | | 145,764 | |
QTS Realty Trust, Inc., Class A | | | 2,333 | | | | 143,503 | |
STAG Industrial, Inc. | | | 4,643 | | | | 144,490 | |
| | | | | | | | 776,130 | |
Technology — 17.62% | | | | | | | | |
Cohu, Inc. | | | 9,114 | | | | 198,047 | |
Cubic Corp. | | | 3,069 | | | | 181,409 | |
DXC Technology Co. | | | 8,976 | | | | 165,338 | |
Five9, Inc.(a) | | | 1,212 | | | | 183,885 | |
Omnicell, Inc.(a) | | | 2,529 | | | | 218,884 | |
Perficient, Inc.(a) | | | 3,748 | | | | 146,772 | |
Rapid7, Inc.(a) | | | 2,591 | | | | 160,461 | |
18 | See accompanying notes which are an integral part of these financial statements. | |
Dana Epiphany ESG Small Cap Equity Fund
Schedule of Investments (continued)
October 31, 2020
| | Shares | | | Fair Value | |
COMMON STOCKS — 98.89% — (continued) |
Technology — 17.62% — (continued) |
Sailpoint Technologies Holdings, Inc.(a) | | | 3,790 | | | $ | 157,323 | |
Ultra Clean Holdings, Inc.(a) | | | 7,748 | | | | 164,955 | |
Upland Software, Inc.(a) | | | 3,838 | | | | 160,121 | |
| | | | | | | | 1,737,195 | |
Utilities — 3.51% | | | | | | | | |
Chesapeake Utilities Corp. | | | 1,892 | | | | 183,922 | |
Southwest Gas Holdings, Inc. | | | 2,470 | | | | 162,328 | |
| | | | | | | | 346,250 | |
Total Common Stocks (Cost $8,564,704) | | | | | | | 9,751,722 | |
| | | | | | | | | |
MONEY MARKET FUNDS — 1.03% | | | | | | | | |
| | | | | | | | | |
Fidelity Investments Money Market Government Portfolio, Institutional Class, 0.02%(b) | | | 101,402 | | | | 101,402 | |
Total Money Market Funds (Cost $101,402) | | | | | | | 101,402 | |
| | | | | | | | | |
Total Investments — 99.92% (Cost $8,666,106) | | | | | | | 9,853,124 | |
| | | | | | | | | |
Other Assets in Excess of Liabilities — 0.08% | | | | | | | 8,262 | |
| | | | | | | | | |
NET ASSETS — 100.00% | | | | | | $ | 9,861,386 | |
(a) | Non-income producing security. |
(b) | Rate disclosed is the seven day effective yield as of October 31, 2020. |
REIT - Real Estate Investment Trust
| | See accompanying notes which are an integral part of these financial statements. | 19 |
Dana Epiphany ESG Equity Fund
Schedule of Investments
October 31, 2020
| | Shares | | | Fair Value | |
COMMON STOCKS — 97.03% | | | | | | | | |
Communications — 10.94% | | | | | | | | |
Alphabet, Inc., Class A(a) | | | 30 | | | $ | 48,483 | |
Alphabet, Inc., Class C(a) | | | 230 | | | | 372,833 | |
Comcast Corp., Class A | | | 5,700 | | | | 240,768 | |
Facebook, Inc., Class A(a) | | | 1,000 | | | | 263,110 | |
T-Mobile US, Inc.(a) | | | 2,200 | | | | 241,054 | |
Verizon Communications, Inc. | | | 4,600 | | | | 262,154 | |
| | | | | | | | 1,428,402 | |
Consumer Discretionary — 13.32% | | | | | | | | |
Amazon.com, Inc.(a) | | | 120 | | | | 364,338 | |
Best Buy Co, Inc. | | | 2,200 | | | | 245,410 | |
BorgWarner, Inc. | | | 6,300 | | | | 220,374 | |
D.R. Horton, Inc. | | | 3,600 | | | | 240,516 | |
Fortune Brands Home & Security, Inc. | | | 3,100 | | | | 250,697 | |
Home Depot, Inc. (The) | | | 820 | | | | 218,702 | |
Tractor Supply Co. | | | 1,500 | | | | 199,815 | |
| | | | | | | | 1,739,852 | |
Consumer Staples — 6.74% | | | | | | | | |
General Mills, Inc. | | | 3,800 | | | | 224,656 | |
Keurig Dr Pepper, Inc. | | | 7,700 | | | | 207,130 | |
Kimberly-Clark Corp. | | | 1,700 | | | | 225,403 | |
Mondelez International, Inc., Class A | | | 4,200 | | | | 223,104 | |
| | | | | | | | 880,293 | |
Energy — 1.89% | | | | | | | | |
ConocoPhillips | | | 4,200 | | | | 120,204 | |
Pioneer Natural Resources Co. | | | 1,600 | | | | 127,296 | |
| | | | | | | | 247,500 | |
Financials — 7.93% | | | | | | | | |
American Express Co. | | | 1,100 | | | | 100,364 | |
Bank of New York Mellon Corp. (The) | | | 4,800 | | | | 164,928 | |
Discover Financial Services | | | 2,400 | | | | 156,024 | |
JPMorgan Chase & Co. | | | 2,100 | | | | 205,884 | |
Morgan Stanley | | | 4,100 | | | | 197,415 | |
Truist Financial Corp. | | | 5,000 | | | | 210,600 | |
| | | | | | | | 1,035,215 | |
20 | See accompanying notes which are an integral part of these financial statements. | |
Dana Epiphany ESG Equity Fund
Schedule of Investments (continued)
October 31, 2020
| | Shares | | | Fair Value | |
COMMON STOCKS — 97.03% — (continued) |
Health Care — 11.96% | | | | | | | | |
CVS Health Corp. | | | 4,700 | | | $ | 263,623 | |
Emergent BioSolutions, Inc.(a) | | | 2,900 | | | | 260,913 | |
Encompass Health Corp. | | | 4,100 | | | | 251,371 | |
Horizon Therapeutics PLC(a) | | | 3,700 | | | | 277,241 | |
Humana, Inc. | | | 640 | | | | 255,539 | |
Zoetis, Inc. | | | 1,600 | | | | 253,680 | |
| | | | | | | | 1,562,367 | |
Industrials — 8.05% | | | | | | | | |
Norfolk Southern Corp. | | | 1,270 | | | | 265,582 | |
Regal-Beloit Corp. | | | 2,900 | | | | 286,085 | |
TE Connectivity Ltd. | | | 2,200 | | | | 213,136 | |
W.W. Grainger, Inc. | | | 820 | | | | 287,017 | |
| | | | | | | | 1,051,820 | |
Materials — 2.75% | | | | | | | | |
Air Products & Chemicals, Inc. | | | 600 | | | | 165,744 | |
Avery Dennison Corp. | | | 1,400 | | | | 193,746 | |
| | | | | | | | 359,490 | |
Real Estate — 4.48% | | | | | | | | |
Alexandria Real Estate Equities, Inc. | | | 720 | | | | 109,094 | |
American Tower Corp., Class A | | | 500 | | | | 114,825 | |
Hannon Armstrong Sustainable Infrastructure, Inc. | | | 5,800 | | | | 242,730 | |
Prologis, Inc. | | | 1,200 | | | | 119,040 | |
| | | | | | | | 585,689 | |
Technology — 25.84% | | | | | | | | |
Accenture PLC, Class A | | | 1,100 | | | | 238,601 | |
Akamai Technologies, Inc.(a) | | | 2,300 | | | | 218,776 | |
Apple, Inc. | | | 4,000 | | | | 435,440 | |
Cadence Design Systems, Inc.(a) | | | 2,400 | | | | 262,488 | |
CDW Corp. | | | 2,100 | | | | 257,460 | |
Cisco Systems, Inc. | | | 5,900 | | | | 211,810 | |
Dropbox, Inc., Class A(a) | | | 9,000 | | | | 164,340 | |
Intel Corp. | | | 2,600 | | | | 115,128 | |
Lam Research Corp. | | | 740 | | | | 253,139 | |
MasterCard, Inc., Class A | | | 660 | | | | 190,502 | |
Microchip Technology, Inc. | | | 2,460 | | | | 258,497 | |
Microsoft Corp. | | | 1,700 | | | | 344,199 | |
PayPal Holdings, Inc.(a) | | | 1,300 | | | | 241,969 | |
Visa, Inc., Class A | | | 1,010 | | | | 183,527 | |
| | | | | | | | 3,375,876 | |
| | See accompanying notes which are an integral part of these financial statements. | 21 |
Dana Epiphany ESG Equity Fund
Schedule of Investments (continued)
October 31, 2020
| | Shares | | | Fair Value | |
COMMON STOCKS — 97.03% — (continued) |
Utilities — 3.13% | | | | | | | | |
Eversource Energy | | | 2,200 | | | $ | 191,994 | |
NextEra Energy, Inc. | | | 2,960 | | | | 216,702 | |
| | | | | | | | 408,696 | |
Total Common Stocks (Cost $10,184,146) | | | | | | | 12,675,200 | |
| | | | | | | | | |
MONEY MARKET FUNDS — 3.89% | | | | | | | | |
| | | | | | | | | |
Fidelity Investments Money Market Government Portfolio, Institutional Class, 0.02%(b) | | | 507,720 | | | | 507,720 | |
Total Money Market Funds (Cost $507,720) | | | | | | | 507,720 | |
| | | | | | | | | |
Total Investments — 100.92% (Cost $10,691,866) | | | | | | | 13,182,920 | |
| | | | | | | | | |
Liabilities in Excess of Other Assets — (0.92)% | | | | | | | (120,814 | ) |
| | | | | | | | | |
NET ASSETS — 100.00% | | | | | | $ | 13,062,106 | |
(a) | Non-income producing security. |
(b) | Rate disclosed is the seven day effective yield as of October 31, 2020. |
22 | See accompanying notes which are an integral part of these financial statements. | |
Dana Funds
Statements of Assets and Liabilities
October 31, 2020
| | | Dana Large Cap
Equity Fund | | | Dana Epiphany
ESG Small Cap
Equity Fund | | | Dana Epiphany
ESG Equity Fund | |
Assets | | | | | | | | |
Investments in securities at fair value (cost $92,158,571, $8,666,106 and $10,691,866) (Note 3) | | $ | 115,592,690 | | | $ | 9,853,124 | | | $ | 13,182,920 | |
Receivable for fund shares sold | | | 640,036 | | | | — | | | | 54,896 | |
Receivable for investments sold | | | — | | | | 49,060 | | | | 188,712 | |
Dividends receivable | | | 139,134 | | | | 5,920 | | | | 18,985 | |
Receivable from Adviser (Note 4) | | | — | | | | 8,695 | | | | 5,901 | |
Prepaid expenses | | | 23,240 | | | | 19,259 | | | | 12,214 | |
Total Assets | | | 116,395,100 | | | | 9,936,058 | | | | 13,463,628 | |
Liabilities | | | | | | | | |
Payable for fund shares redeemed | | | 290,135 | | | | — | | | | 2,452 | |
Payable for investments purchased | | | — | | | | 35,317 | | | | 361,420 | |
Payable to Adviser (Note 4) | | | 50,148 | | | | — | | | | — | |
Accrued Distribution (12b-1) fees (Note 4) | | | 5,523 | | | | — | | | | — | |
Payable to Administrator (Note 4) | | | 22,851 | | | | 12,667 | | | | 11,450 | |
Payable to trustees | | | 2,155 | | | | 1,424 | | | | 1,513 | |
Other accrued expenses | | | 30,576 | | | | 25,264 | | | | 24,687 | |
Total Liabilities | | | 401,388 | | | | 74,672 | | | | 401,522 | |
Net Assets | | $ | 115,993,712 | | | $ | 9,861,386 | | | $ | 13,062,106 | |
Net Assets consist of: | | | | | | | | | | | | |
Paid-in capital | | | 90,715,471 | | | | 10,083,044 | | | | 10,318,752 | |
Accumulated earnings (deficit) | | | 25,278,241 | | | | (221,658 | ) | | | 2,743,354 | |
Net Assets | | $ | 115,993,712 | | | $ | 9,861,386 | | | $ | 13,062,106 | |
Institutional Class: | | | | | | | | | | | | |
Net Assets | | $ | 91,379,130 | | | $ | 9,861,386 | | | $ | 13,062,106 | |
Shares outstanding (unlimited number of shares authorized, no par value) | | | 4,299,265 | | | | 1,004,156 | | | | 1,273,744 | |
Net asset value, offering and redemption price per share (Note 2) | | $ | 21.25 | | | $ | 9.82 | | | $ | 10.25 | |
Investor Class: | | | | | | | | | | | | |
Net Assets | | $ | 24,614,582 | | | | | | | | | |
Shares outstanding (unlimited number of shares authorized, no par value) | | | 1,158,052 | | | | | | | | | |
Net asset value, offering and redemption price per share (Note 2) | | $ | 21.26 | | | | | | | | | |
| | See accompanying notes which are an integral part of these financial statements. | 23 |
Dana Funds
Statements of Operations
For the year ended October 31, 2020
| | | Dana Large Cap
Equity Fund | | | Dana Epiphany
ESG Small Cap
Equity Fund | | | Dana Epiphany
ESG Equity Fund | |
Investment Income | | | | | | | | | | | | |
Dividend income | | $ | 2,332,417 | | | $ | 112,243 | | | $ | 237,506 | |
Total investment income | | | 2,332,417 | | | | 112,243 | | | | 237,506 | |
Expenses | | | | | | | | | | | | |
Investment Adviser fees (Note 4) | | | 828,212 | | | | 87,190 | | | | 84,680 | |
Administration and compliance services fees (Note 4) | | | 78,889 | | | | 37,917 | | | | 32,133 | |
Distribution (12b-1) fees, Investor Class (Note 4) | | | 62,911 | | | | 2,694 | (a) | | | 11,229 | (a) |
Fund accounting fees (Note 4) | | | 48,168 | | | | 29,917 | | | | 24,625 | |
Registration expenses | | | 40,308 | | | | 36,512 | | | | 30,493 | |
Legal fees | | | 25,992 | | | | 25,645 | | | | 23,539 | |
Transfer agent fees (Note 4) | | | 25,433 | | | | 23,217 | | | | 18,441 | |
Custodian fees | | | 19,967 | | | | 5,647 | | | | 5,339 | |
Audit and tax preparation fees | | | 18,800 | | | | 18,800 | | | | 18,500 | |
Printing and postage expenses | | | 17,617 | | | | 2,689 | | | | 3,149 | |
Insurance expenses | | | 11,660 | | | | 3,234 | | | | 2,159 | |
Trustee fees | | | 9,726 | | | | 6,215 | | | | 5,146 | |
Interest | | | — | | | | 16 | | | | 19 | |
Miscellaneous expenses | | | 32,139 | | | | 21,085 | | | | 16,586 | |
Total expenses | | | 1,219,822 | | | | 300,778 | | | | 276,038 | |
Fees contractually waived and expenses reimbursed by Adviser (Note 4) | | | (227,431 | ) | | | (187,744 | ) | | | (154,164 | ) |
Net operating expenses | | | 992,391 | | | | 113,034 | | | | 121,874 | |
Net investment income (loss) | | | 1,340,026 | | | | (791 | ) | | | 115,632 | |
Net Realized and Change in Unrealized Gain (Loss) on Investments |
Net realized gain (loss) on investment securities transactions | | | 2,299,800 | | | | (1,256,551 | ) | | | 234,203 | |
Net change in unrealized appreciation (depreciation) on investment securities | | | 2,714,687 | | | | (80,215 | ) | | | 362,862 | |
Net realized and change in unrealized gain (loss) on investments | | | 5,014,487 | | | | (1,336,766 | ) | | | 597,065 | |
Net increase (decrease) in net assets resulting from operations | | $ | 6,354,513 | | | $ | (1,337,557 | ) | | $ | 712,697 | |
(a) | Effective at the close of business on June 4, 2020, Investor Class shares of the Dana Epiphany ESG Small Cap Fund and Dana Epiphany ESG Fund were consolidated into the Institutional Class shares of the Small Cap Fund and Epiphany ESG Fund. |
24 | See accompanying notes which are an integral part of these financial statements. | |
Dana Funds
Statements of Changes in Net Assets
| | | Dana Large Cap Equity Fund | | | Dana Epiphany ESG
Small Cap Equity Fund | |
| | | For the
Year Ended
October 31, 2020 | | | For the
Year Ended
October 31, 2019 | | | For the
Year Ended
October 31, 2020 | | | For the
Year Ended
October 31, 2019 | |
Increase (Decrease) in Net Assets due to: | | | | | | | | | | | | |
Operations | | | | | | | | | | | | |
Net investment income (loss) | | $ | 1,340,026 | | | $ | 2,398,203 | | | $ | (791 | ) | | $ | 11,830 | |
Net realized gain (loss) on investment securities transactions | | | 2,299,800 | | | | 12,973,907 | | | | (1,256,551 | ) | | | (111,430 | ) |
Net change in unrealized appreciation (depreciation) of investment securities | | | 2,714,687 | | | | 2,070,388 | | | | (80,215 | ) | | | 73,430 | |
Net increase (decrease) in net assets resulting from operations | | | 6,354,513 | | | | 17,442,498 | | | | (1,337,557 | ) | | | (26,170 | ) |
Distributions to Shareholders from Earnings (Note 2) | | | | | | | | |
Institutional Class | | | (12,130,253 | ) | | | (15,403,587 | ) | | | (5,901 | ) | | | (1,098,363 | ) |
Investor Class | | | (2,798,272 | ) | | | (3,132,699 | ) | | | — | | | | (245,803 | ) |
Total distributions | | | (14,928,525 | ) | | | (18,536,286 | ) | | | (5,901 | ) | | | (1,344,166 | ) |
Capital Transactions – Institutional Class (a) | | | | | | | | |
Proceeds from shares sold | | | 31,507,881 | | | | 48,852,531 | | | | 1,008,397 | | | | 1,528,842 | |
Shares issued in connection with class consolidation | | | — | | | | — | | | | 1,513,471 | | | | — | |
Reinvestment of distributions | | | 5,707,638 | | | | 11,841,958 | | | | 5,764 | | | | 1,065,846 | |
Amount paid for shares redeemed | | | (46,107,580 | ) | | | (129,198,946 | ) | | | (3,966,219 | ) | | | (5,237,003 | ) |
Total – Institutional Class | | | (8,892,061 | ) | | | (68,504,457 | ) | | | (1,438,587 | ) | | | (2,642,315 | ) |
Capital Transactions – Investor Class (a) | | | | | | | | | | | | |
Proceeds from shares sold | | | 1,784,299 | | | | 604,696 | | | | 94,173 | | | | 152,674 | |
Reinvestment of distributions | | | 2,782,815 | | | | 3,128,798 | | | | — | | | | 245,803 | |
Amount paid for shares redeemed | | | (3,531,248 | ) | | | (7,535,002 | ) | | | (555,014 | ) | | | (1,436,942 | ) |
Shares redeemed in connection with class consolidation | | | — | | | | — | | | | (1,513,471 | ) | | | — | |
Total – Investor Class | | | 1,035,866 | | | | (3,801,508 | ) | | | (1,974,312 | ) | | | (1,038,465 | ) |
Net decrease in net assets resulting from capital transactions | | | (7,856,195 | ) | | | (72,305,965 | ) | | | (3,412,899 | ) | | | (3,680,780 | ) |
Total Decrease in Net Assets | | | (16,430,207 | ) | | | (73,399,753 | ) | | | (4,756,357 | ) | | | (5,051,116 | ) |
| | See accompanying notes which are an integral part of these financial statements. | 25 |
Dana Funds
Statements of Changes in Net Assets (continued)
| | | Dana Large Cap Equity Fund | | | Dana Epiphany ESG
Small Cap Equity Fund | |
| | | For the
Year Ended
October 31, 2020 | | | For the
Year Ended
October 31, 2019 | | | For the
Year Ended
October 31, 2020 | | | For the
Year Ended
October 31, 2019 | |
Net Assets | | | | | | | | | | | | | | | | |
Beginning of year | | $ | 132,423,919 | | | $ | 205,823,672 | | | $ | 14,617,743 | | | $ | 19,668,859 | |
End of year | | $ | 115,993,712 | | | $ | 132,423,919 | | | $ | 9,861,386 | | | $ | 14,617,743 | |
Share Transactions – Institutional Class (a) | | | | | | | | |
Shares sold | | | 1,538,470 | | | | 2,457,771 | | | | 98,505 | | | | 155,114 | |
Shares issued in connection with class consolidation | | | — | | | | — | | | | 161,172 | | | | — | |
Shares issued in reinvestment of distributions | | | 262,762 | | | | 651,067 | | | | 657 | | | | 121,257 | |
Shares redeemed | | | (2,218,189 | ) | | | (6,308,605 | ) | | | (469,527 | ) | | | (523,215 | ) |
Total – Institutional Class | | | (416,957 | ) | | | (3,199,767 | ) | | | (209,193 | ) | | | (246,844 | ) |
Share Transactions – Investor Class (a) | | | | | | | | | | | | |
Shares sold | | | 85,588 | | | | 28,606 | | | | 11,511 | | | | 15,249 | |
Shares issued in reinvestment of distributions | | | 127,884 | | | | 171,527 | | | | — | | | | 28,188 | |
Shares redeemed | | | (174,728 | ) | | | (372,375 | ) | | | (65,194 | ) | | | (141,956 | ) |
Shares redeemed in connection with class consolidation | | | — | | | | — | | | | (163,036 | ) | | | — | |
Total – Investor Class | | | 38,744 | | | | (172,242 | ) | | | (216,719 | ) | | | (98,519 | ) |
(a) | Effective at the close of business on June 4, 2020, Investor Class shares of the Dana Epiphany ESG Small Cap Fund were consolidated into the Institutional Class shares. |
26 | See accompanying notes which are an integral part of these financial statements. | |
Dana Funds
Statements of Changes in Net Assets (continued)
| | | Dana Epiphany ESG Equity Fund | |
| | | For the
Year Ended
October 31, 2020 | | | For the
Year Ended
October 31, 2019 | |
Increase (Decrease) in Net Assets due to: | | | | | | | | |
Operations | | | | | | | | |
Net investment income | | $ | 115,632 | | | $ | 134,153 | |
Net realized gain on investment securities transactions | | | 234,203 | | | | 1,947,772 | |
Net change in unrealized appreciation (depreciation) of investment securities | | | 362,862 | | | | (578,233 | ) |
Net increase in net assets resulting from operations | | | 712,697 | | | | 1,503,692 | |
Distributions to Shareholders from Earnings (Note 2) | | | | | | | | |
Institutional Class | | | (862,512 | ) | | | (746,819 | ) |
Investor Class | | | (1,182,772 | ) | | | (1,014,147 | ) |
Total distributions | | | (2,045,284 | ) | | | (1,760,966 | ) |
Capital Transactions – Institutional Class (a) | | | | | | | | |
Proceeds from shares sold | | | 2,228,653 | | | | 282,765 | |
Shares issued in connection with class consolidation | | | 7,410,006 | | | | — | |
Reinvestment of distributions | | | 856,169 | | | | 734,812 | |
Amount paid for shares redeemed | | | (2,402,606 | ) | | | (2,277,604 | ) |
Total – Institutional Class | | | 8,092,222 | | | | (1,260,027 | ) |
Capital Transactions – Investor Class (a) | | | | | | | | |
Proceeds from shares sold | | | 963,569 | | | | 394,428 | |
Reinvestment of distributions | | | 1,167,223 | | | | 993,640 | |
Amount paid for shares redeemed | | | (1,238,947 | ) | | | (2,571,196 | ) |
Shares redeemed in connection with class consolidation | | | (7,410,006 | ) | | | — | |
Total – Investor Class | | | (6,518,161 | ) | | | (1,183,128 | ) |
Net increase (decrease) in net assets resulting from capital transactions | | | 1,574,061 | | | | (2,443,155 | ) |
Total Increase (Decrease) in Net Assets | | | 241,474 | | | | (2,700,429 | ) |
Net Assets | | | | | | | | |
Beginning of year | | | 12,820,632 | | | | 15,521,061 | |
End of year | | $ | 13,062,106 | | | $ | 12,820,632 | |
| | See accompanying notes which are an integral part of these financial statements. | 27 |
Dana Funds
Statements of Changes in Net Assets (continued)
| | | Dana Epiphany ESG Equity Fund | |
| | | For the
Year Ended
October 31, 2020 | | | For the
Year Ended
October 31, 2019 | |
Share Transactions – Institutional Class (a) | | | | |
Shares sold | | | 242,216 | | | | 25,958 | |
Shares issued in connection with class consolidation | | | 747,410 | | | | — | |
Shares issued in reinvestment of distributions | | | 82,565 | | | | 72,259 | |
Shares redeemed | | | (237,169 | ) | | | (208,847 | ) |
Total – Institutional Class | | | 835,022 | | | | (110,630 | ) |
Share Transactions – Investor Class (a) | | | | |
Shares sold | | | 87,988 | | | | 34,862 | |
Shares issued in reinvestment of distributions | | | 108,459 | | | | 95,050 | |
Shares redeemed | | | (123,629 | ) | | | (226,525 | ) |
Shares redeemed in connection with class consolidation | | | (722,853 | ) | | | — | |
Total – Investor Class | | | (650,035 | ) | | | (96,613 | ) |
(a) | Effective at the close of business on June 4, 2020, Investor Class shares of the Dana Epiphany ESG Fund were consolidated into the Institutional Class shares. |
28 | See accompanying notes which are an integral part of these financial statements. | |
Dana Large Cap Equity Fund – Institutional Class
Financial Highlights
(For a share outstanding during each year)
| | | Years Ended October 31, | |
| | | 2020 | | | 2019 | | | 2018 | | | 2017 | | | 2016 | |
Selected Per Share Data | | | | | | | | | | | | | | | | | | | | |
Net asset value, beginning of year | | $ | 22.69 | | | $ | 22.35 | | | $ | 22.64 | | | $ | 17.67 | | | $ | 18.22 | |
| | | | | | | | | | | | | | | | | | | | | |
Investment operations: | | | | | | | | | | | | | | | | | | | | |
Net investment income | | | 0.23 | | | | 0.38 | | | | 0.32 | | | | 0.32 | | | | 0.26 | (a) |
Net realized and unrealized gain (loss) on investments | | | 0.86 | | | | 2.46 | | | | 0.45 | | | | 4.96 | | | | (0.56 | ) |
Total from investment operations | | | 1.09 | | | | 2.84 | | | | 0.77 | | | | 5.28 | | | | (0.30 | ) |
| | | | | | | | | | | | | | | | | | | | | |
Less distributions to shareholders from: | | | | | | | | | | | | | | | | | | | | |
Net investment income | | | (0.23 | ) | | | (0.36 | ) | | | (0.32 | ) | | | (0.31 | ) | | | (0.25 | ) |
Net realized gains | | | (2.30 | ) | | | (2.14 | ) | | | (0.74 | ) | | | — | | | | — | |
Total distributions | | | (2.53 | ) | | | (2.50 | ) | | | (1.06 | ) | | | (0.31 | ) | | | (0.25 | ) |
| | | | | | | | | | | | | | | | | | | | | |
Redemption fees | | | — | | | | — | | | | — | | | | — | (b) | | | — | (b) |
| | | | | | | | | | | | | | | | | | | | | |
Net asset value, end of year | | $ | 21.25 | | | $ | 22.69 | | | $ | 22.35 | | | $ | 22.64 | | | $ | 17.67 | |
| | | | | | | | | | | | | | | | | | | | | |
Total Return(c) | | | 4.65 | % | | | 15.55 | % | | | 3.27 | % | | | 30.11 | % | | | (1.66 | )% |
| | | | | | | | | | | | | | | | | | | | | |
Ratios and Supplemental Data: | | | | | | | | | | | | | | | | | | | | |
| | | | | | | | | | | | | | | | | | | | | |
Net assets, end of year (000 omitted) | | $ | 91,379 | | | $ | 107,026 | | | $ | 176,954 | | | $ | 134,291 | | | $ | 138,540 | |
Before waiver | | | | | | | | | | | | | | | | | | | | |
Ratio of expenses to average net assets | | | 0.91 | % | | | 0.85 | % | | | 0.86 | % | | | 0.92 | % | | | 0.91 | % |
After waiver | | | | | | | | | | | | | | | | | | | | |
Ratio of expenses to average net assets | | | 0.73 | % | | | 0.73 | % | | | 0.73 | % | | | 0.74 | %(d) | | | 0.73 | % |
Ratio of net investment income to average net assets | | | 1.10 | % | | | 1.68 | % | | | 1.41 | % | | | 1.48 | % | | | 1.45 | % |
Portfolio turnover rate(e) | | | 57 | % | | | 50 | % | | | 58 | % | | | 50 | % | | | 69 | % |
| | | | | | | | | | | | | | | | | | | | | |
(a) | Per share net investment income has been determined on the basis of average shares outstanding during the year. |
(b) | Rounds to less than $0.005 per share. |
(c) | Total return in the above table represents the rate that the investor would have earned or lost on an investment in the Fund, assuming reinvestment of distributions. |
(d) | This ratio includes the impact of overdraft fees. If this cost had been excluded, the ratio of expenses to average net assets would have been 0.73% for the fiscal year ended October 31, 2017. |
(e) | Portfolio turnover is calculated on the basis of the Fund as a whole without distinguishing among the classes of shares. |
| | See accompanying notes which are an integral part of these financial statements. | 29 |
Dana Large Cap Equity Fund – Investor Class
Financial Highlights
(For a share outstanding during each year)
| | | Years Ended October 31, | |
| | | 2020 | | | 2019 | | | 2018 | | | 2017 | | | 2016 | |
Selected Per Share Data | | | | | | | | | | | | | | | | | | | | |
Net asset value, beginning of year | | $ | 22.69 | | | $ | 22.35 | | | $ | 22.64 | | | $ | 17.68 | | | $ | 18.23 | |
| | | | | | | | | | | | | | | | | | | | | |
Investment operations: | | | | | | | | | | | | | | | | | | | | |
Net investment income | | | 0.18 | | | | 0.30 | | | | 0.28 | | | | 0.24 | | | | 0.22 | (a) |
Net realized and unrealized gain (loss) on investments | | | 0.87 | | | | 2.50 | | | | 0.43 | | | | 4.98 | | | | (0.57 | ) |
Total from investment operations | | | 1.05 | | | | 2.80 | | | | 0.71 | | | | 5.22 | | | | (0.35 | ) |
| | | | | | | | | | | | | | | | | | | | | |
Less distributions to shareholders from: | | | | | | | | | | | | | | | | | | | | |
Net investment income | | | (0.18 | ) | | | (0.32 | ) | | | (0.26 | ) | | | (0.26 | ) | | | (0.20 | ) |
Net realized gains | | | (2.30 | ) | | | (2.14 | ) | | | (0.74 | ) | | | — | | | | — | |
Total distributions | | | (2.48 | ) | | | (2.46 | ) | | | (1.00 | ) | | | (0.26 | ) | | | (0.20 | ) |
| | | | | | | | | | | | | | | | | | | | | |
Redemption fees | | | — | | | | — | | | | — | | | | — | | | | — | (b) |
| | | | | | | | | | | | | | | | | | | | | |
Net asset value, end of year | | $ | 21.26 | | | $ | 22.69 | | | $ | 22.35 | | | $ | 22.64 | | | $ | 17.68 | |
| | | | | | | | | | | | | | | | | | | | | |
Total Return(c) | | | 4.43 | % | | | 15.29 | % | | | 3.01 | % | | | 29.72 | % | | | (1.91 | )% |
| | | | | | | | | | | | | | | | | | | | | |
Ratios and Supplemental Data: | | | | | | | | | | | | | | | | | | | | |
| | | | | | | | | | | | | | | | | | | | | |
Net assets, end of year (000 omitted) | | $ | 24,615 | | | $ | 25,398 | | | $ | 28,870 | | | $ | 40,957 | | | $ | 32,514 | |
Before waiver | | | | | | | | | | | | | | | | | | | | |
Ratio of expenses to average net assets | | | 1.16 | % | | | 1.10 | % | | | 1.11 | % | | | 1.17 | % | | | 1.16 | % |
After waiver | | | | | | | | | | | | | | | | | | | | |
Ratio of expenses to average net assets | | | 0.98 | % | | | 0.98 | % | | | 0.98 | % | | | 0.99 | %(d) | | | 0.98 | % |
Ratio of net investment income to average net assets | | | 0.85 | % | | | 1.40 | % | | | 1.17 | % | | | 1.20 | % | | | 1.22 | % |
Portfolio turnover rate(e) | | | 57 | % | | | 50 | % | | | 58 | % | | | 50 | % | | | 69 | % |
| | | | | | | | | | | | | | | | | | | | | |
(a) | Per share net investment income has been determined on the basis of average shares outstanding during the year. |
(b) | Rounds to less than $0.005 per share. |
(c) | Total return in the above table represents the rate that the investor would have earned or lost on an investment in the Fund, assuming reinvestment of distributions. |
(d) | This ratio includes the impact of overdraft fees. If this cost had been excluded, the ratio of expenses to average net assets would have been 0.98% for the fiscal year ended October 31, 2017. |
(e) | Portfolio turnover is calculated on the basis of the Fund as a whole without distinguishing among the classes of shares. |
30 | See accompanying notes which are an integral part of these financial statements. | |
Dana Epiphany ESG Small Cap Equity Fund – Institutional Class
Financial Highlights
(For a share outstanding during each period)
| | | Years Ended October 31, | | | For the
Period
Ended
October 31, | |
| | | 2020 | | | 2019 | | | 2018 | | | 2017 | | | 2016(a) | |
Selected Per Share Data | | | | | | | | | | | | | | | | | | | | |
Net asset value, beginning of period | | $ | 10.24 | | | $ | 11.09 | | | $ | 11.43 | | | $ | 9.30 | | | $ | 10.00 | |
| | | | | | | | | | | | | | | | | | | | | |
Investment operations: | | | | | | | | | | | | | | | | | | | | |
Net investment income (loss) | | | 0.01 | | | | 0.01 | | | | (0.03 | ) | | | — | (b) | | | 0.01 | |
Net realized and unrealized gain (loss) on investments | | | (0.42 | ) | | | (0.05 | ) | | | (0.31 | ) | | | 2.14 | | | | (0.70 | )(c) |
Total from investment operations | | | (0.41 | ) | | | (0.04 | ) | | | (0.34 | ) | | | 2.14 | | | | (0.69 | ) |
| | | | | | | | | | | | | | | | | | | | | |
Less distributions to shareholders from: | | | | | | | | | | | | | | | | | | | | |
Net investment income | | | (0.01 | ) | | | — | | | | — | (b) | | | (0.01 | ) | | | (0.01 | ) |
Net realized gains | | | — | | | | (0.81 | ) | | | — | | | | — | | | | — | |
Total distributions | | | (0.01 | ) | | | (0.81 | ) | | | — | (b) | | | (0.01 | ) | | | (0.01 | ) |
| | | | | | | | | | | | | | | | | | | | | |
Redemption fees | | | — | | | | — | | | | — | | | | — | | | | — | (b) |
| | | | | | | | | | | | | | | | | | | | | |
Net asset value, end of period | | $ | 9.82 | | | $ | 10.24 | | | $ | 11.09 | | | $ | 11.43 | | | $ | 9.30 | |
| | | | | | | | | | | | | | | | | | | | | |
Total Return(d) | | | (4.04 | )% | | | 0.83 | % | | | (2.95 | )% | | | 23.08 | % | | | (6.87 | )%(e) |
| | | | | | | | | | | | | | | | | | | | | |
Ratios and Supplemental Data: | | | | | | | | | | | | | | | | | | | | |
| | | | | | | | | | | | | | | | | | | | | |
Net assets, end of period (000 omitted) | | $ | 9,861 | | | $ | 12,421 | | | $ | 16,196 | | | $ | 14,011 | | | $ | 6,575 | |
Before waiver | | | | | | | | | | | | | | | | | | | | |
Ratio of expenses to average net assets | | | 2.58 | % | | | 1.88 | % | | | 1.75 | % | | | 2.02 | % | | | 4.11 | %(f) |
After waiver | | | | | | | | | | | | | | | | | | | | |
Ratio of expenses to average net assets | | | 0.95 | % | | | 0.95 | % | | | 0.95 | % | | | 0.95 | % | | | 0.95 | %(f) |
Ratio of net investment income (loss) to average net assets | | | 0.02 | % | | | 0.11 | % | | | (0.24 | )% | | | — | % | | | 0.12 | %(f) |
Portfolio turnover rate(g) | | | 88 | % | | | 50 | % | | | 78 | % | | | 58 | % | | | 54 | %(e) |
| | | | | | | | | | | | | | | | | | | | | |
(a) | For the period November 3, 2015 (commencement of operations) to October 31, 2016. |
(b) | Rounds to less than $0.005 per share. |
(c) | The amount shown for a share outstanding throughout the year does not accord with the change in aggregate gains and losses in the portfolio of securities during the year because of the timing of sales and purchases of fund shares in relation to fluctuating values during the year. |
(d) | Total return in the above table represents the rate that the investor would have earned or lost on an investment in the Fund, assuming reinvestment of distributions. |
(g) | Portfolio turnover is calculated on the basis of the Fund as a whole without distinguishing among the classes of shares. |
| | See accompanying notes which are an integral part of these financial statements. | 31 |
Dana Epiphany ESG Equity Fund – Institutional Class
Financial Highlights
(For a share outstanding during each year)
| | | Years Ended October 31, | |
| | | 2020 | | | 2019 | | | 2018 | | | 2017(a) | | | 2016 | |
Selected Per Share Data | | | | | | | | | | | | | | | | | | | | |
Net asset value, beginning of year | | $ | 11.58 | | | $ | 11.80 | | | $ | 13.09 | | | $ | 10.86 | | | $ | 11.64 | |
| | | | | | | | | | | | | | | | | | | | | |
Investment operations: | | | | | | | | | | | | | | | | | | | | |
Net investment income (loss) | | | 0.09 | | | | 0.14 | | | | 0.08 | (b) | | | 0.04 | (b) | | | (0.03 | )(b) |
Net realized and unrealized gain (loss) on investments | | | 0.47 | | | | 1.15 | | | | 0.74 | | | | 2.37 | | | | (0.15 | ) |
Total from investment operations | | | 0.56 | | | | 1.29 | | | | 0.82 | | | | 2.41 | | | | (0.18 | ) |
| | | | | | | | | | | | | | | | | | | | | |
Less distributions to shareholders from: | | | | | | | | | | | | | | | | | | | | |
Net investment income | | | (0.10 | ) | | | (0.12 | ) | | | (0.08 | ) | | | (0.01 | ) | | | — | (c) |
Net realized gains | | | (1.79 | ) | | | (1.39 | ) | | | (2.03 | ) | | | (0.17 | ) | | | (0.60 | ) |
Total distributions | | | (1.89 | ) | | | (1.51 | ) | | | (2.11 | ) | | | (0.18 | ) | | | (0.60 | ) |
| | | | | | | | | | | | | | | | | | | | | |
Redemption fees | | | — | | | | — | | | | — | | | | — | (c) | | | — | (c) |
| | | | | | | | | | | | | | | | | | | | | |
Net asset value, end of year | | $ | 10.25 | | | $ | 11.58 | | | $ | 11.80 | | | $ | 13.09 | | | $ | 10.86 | |
| | | | | | | | | | | | | | | | | | | | | |
Total Return(d) | | | 4.76 | % | | | 12.76 | % | | | 6.32 | % | | | 22.46 | % | | | (1.46 | )% |
| | | | | | | | | | | | | | | | | | | | | |
Ratios and Supplemental Data: | | | | | | | | | | | | | | | | | | | | |
| | | | | | | | | | | | | | | | | | | | | |
Net assets, end of year (000 omitted) | | $ | 13,062 | | | $ | 5,079 | | | $ | 6,485 | | | $ | 7,429 | | | $ | 6,748 | |
Before waiver | | | | | | | | | | | | | | | | | | | | |
Ratio of expenses to average net assets | | | 2.00 | % | | | 2.13 | % | | | 1.63 | % | | | 2.15 | % | | | 2.43 | % |
After waiver | | | | | | | | | | | | | | | | | | | | |
Ratio of expenses to average net assets | | | 0.85 | % | | | 0.90 | % | | | 1.25 | % | | | 1.82 | % | | | 2.25 | % |
Ratio of net investment income (loss) to average net assets | | | 0.89 | % | | | 1.19 | % | | | 0.62 | % | | | 0.36 | % | | | (0.27 | )% |
Portfolio turnover rate(e) | | | 67 | % | | | 60 | % | | | 23 | % | | | 97 | % | | | 63 | % |
| | | | | | | | | | | | | | | | | | | | | |
(a) | Effective May 30, 2017, Class C shares were renamed Class I shares. Effective December 19, 2018, Class I shares were renamed Institutional Class shares. |
(b) | Per share net investment income (loss) has been determined on the basis of average shares outstanding during the period. |
(c) | Rounds to less than $0.005 per share. |
(d) | Total return in the above table represents the rate that the investor would have earned or lost on an investment in the Fund, assuming reinvestment of distributions. |
(e) | Portfolio turnover is calculated on the basis of the Fund as a whole without distinguishing among the classes of shares. |
32 | See accompanying notes which are an integral part of these financial statements. | |
Dana Funds
Notes to the Financial Statements
October 31, 2020
NOTE 1. ORGANIZATION
The Dana Large Cap Equity Fund (the “Large Cap Fund”), the Dana Epiphany ESG Small Cap Equity Fund (formerly, the Dana Small Cap Equity Fund) (the “Small Cap Fund”), and the Dana Epiphany ESG Equity Fund (the “Epiphany ESG Fund”) (each a “Fund” and collectively, the “Funds”) are each an open-end diversified series of Valued Advisers Trust (the “Trust”). The Trust is a management investment company established under the laws of Delaware by an Agreement and Declaration of Trust dated June 13, 2008 (the “Trust Agreement”). The Trust Agreement permits the Board of Trustees (“Board”) to issue an unlimited number of shares of beneficial interest of separate series without par value. Each Fund is one of a series of funds currently authorized by the Board. The investment adviser to the Funds is Dana Investment Advisors, Inc. (the “Adviser”). Each Fund seeks long-term growth of capital.
The Large Cap Fund currently offers Investor shares and Institutional shares. The Small Cap Fund and Epiphany ESG Fund currently offer Institutional Class shares. Effective on the close of business on October 13, 2017, Class A shares were consolidated into Class N shares of the Large Cap Fund which was subsequently re-designated Investor Class shares. Each share represents an equal proportionate interest in the assets and liabilities belonging to the Fund and is entitled to such dividends and distributions out of income belonging to the Fund as declared by the Board. Effective at the close of business on June 4, 2020, Investor Class shares of the Small Cap Fund and Epiphany ESG Fund were consolidated into the Institutional Class shares of the Small Cap Fund and Epiphany ESG Fund. Prior to this consolidation each share represented an equal proportionate interest in the assets and liabilities belonging to each Fund and were entitled to such dividends and distributions out of income belonging to each Fund as declared by the Board. Prior to February 28, 2017, all share classes of the Large Cap Fund and the Small Cap Fund imposed a 2.00% redemption fee on shares redeemed within 60 days of purchase.
NOTE 2. SIGNIFICANT ACCOUNTING POLICIES
The Funds are investment companies and follow accounting and reporting guidance under Financial Accounting Standards Board Accounting Standards Codification (“ASC”) Topic 946, “Financial Services-Investment Companies.” The following is a summary of significant accounting policies followed by the Funds in the preparation of their financial statements. These policies are in conformity with the generally accepted accounting principles in the United States of America (“GAAP”).
Estimates – The preparation of financial statements in conformity with GAAP requires management to make estimates and assumptions that affect the reported amounts of assets and liabilities and disclosure of contingent assets and liabilities at the date of the financial statements and the reported amounts of increases and decreases in net assets from operations during the reporting period. Actual results could differ from those estimates.
Federal Income Taxes – The Funds make no provision for federal income or excise tax. Each Fund has qualified and intends to qualify each year as a regulated investment company (“RIC”) under subchapter M of the Internal Revenue Code of 1986, as amended, by complying with the requirements applicable to RICs and by distributing substantially all of its taxable income. Each
33
Dana Funds
Notes to the Financial Statements (continued)
October 31, 2020
Fund also intends to distribute sufficient net investment income and net capital gains, if any, so that it will not be subject to excise tax on undistributed income and gains. If the required amount of net investment income or gains is not distributed, the Fund could incur a tax expense.
As of and during the fiscal year ended October 31, 2020, the Funds did not have any liabilities for any unrecognized tax benefits. The Funds recognize interest and penalties, if any, related to unrecognized tax benefits as income tax expense on the Statements of Operations when incurred. During the fiscal year ended October 31, 2020, the Funds did not incur any interest or penalties. Management of the Funds has reviewed tax positions taken in tax years that remain subject to examination by all major tax jurisdictions, including federal (i.e., the last three tax year ends and the interim tax period since then, as applicable). Management believes that there is no tax liability resulting from unrecognized tax benefits related to uncertain tax positions taken.
Expenses – Expenses incurred by the Trust that do not relate to a specific fund of the Trust are allocated to the individual funds based on each fund’s relative net assets or another appropriate basis (as determined by the Board). Expenses specifically attributable to any class are borne by that class. Income, realized gains and losses, unrealized appreciation and depreciation, and fund-wide expenses not allocated to a particular class shall be allocated to each class based on the net assets of that class in relation to the net assets of the entire fund.
Security Transactions and Related Income – The Funds follow industry practice and record security transactions on the trade date for financial reporting purposes. The specific identification method is used for determining gains or losses for financial statement and income tax purposes. Dividend income is recorded on the ex-dividend date and interest income is recorded on an accrual basis. Withholding taxes on foreign dividends, if any, have been provided for in accordance with the Funds’ understanding of the applicable country’s tax rules and rates.
The Funds may hold Real Estate Investment Trusts (“REITs”) which pay dividends to their shareholders based upon available funds from operations. It is possible for these dividends to exceed the REIT’s underlying taxable earnings and profits resulting in the excess portion of such dividends being designated as a return of capital. Distributions received from REITs that represent a return of capital or capital gains are recorded as a reduction of the cost of the REITs or as a realized gain, respectively.
Dividends and Distributions – The Funds intend to distribute substantially all of their net investment income, if any, at least quarterly. The Funds intend to distribute their net realized long-term and short-term capital gains, if any, annually. Distributions to shareholders, which are determined in accordance with income tax regulations, are recorded on the ex-dividend date. The treatment for financial reporting purposes of distributions made to shareholders during the year from net investment income or net realized capital gains may differ from their ultimate treatment for federal income tax purposes. These differences are caused primarily by differences in the timing of the recognition of certain components of income, expense or realized capital gain for federal income tax purposes. Where such differences are permanent in nature, they are reclassified in the components of the net assets based on their ultimate characterization for federal income tax purposes. Any such reclassifications will have no effect on net assets, results of operations or net asset value (“NAV”) per share of the Funds.
34
Dana Funds
Notes to the Financial Statements (continued)
October 31, 2020
For the fiscal year ended October 31, 2020, the Funds made the following reclassifications to increase (decrease) the components of net assets:
| | Paid-In
Capital | | | Accumulated
Earnings
(Deficit) | |
Large Cap Fund | | $ | 1 | | | $ | (1 | ) |
Small Cap Fund | | | — | | | | — | |
Epiphany ESG Fund | | | (1 | ) | | | 1 | |
Share Valuation – The NAV per share of each class of each Fund is calculated each day the New York Stock Exchange is open by dividing the total value of the assets attributable to that class, less liabilities attributable to that class, by the number of shares outstanding of that class.
NOTE 3. SECURITIES VALUATION AND FAIR VALUE MEASUREMENTS
Each Fund values its portfolio securities at fair value as of the close of regular trading on the New York Stock Exchange (the “NYSE”) (normally 4:00 p.m. Eastern time) on each business day the NYSE is open for business. Fair value is defined as the price that a Fund would receive upon selling an investment in a timely transaction to an independent buyer in the principal or most advantageous market of the investment. GAAP establishes a three-tier hierarchy to maximize the use of observable market data and minimize the use of unobservable inputs and to establish classification of fair value measurements for disclosure purposes.
Inputs refer broadly to the assumptions that market participants would use in pricing the asset or liability, including assumptions about risk (the risk inherent in a particular valuation technique used to measure fair value including a pricing model and/or the risk inherent in the inputs to the valuation technique). Inputs may be observable or unobservable. Observable inputs are inputs that reflect the assumptions market participants would use in pricing the asset or liability developed based on market data obtained and available from sources independent of the reporting entity. Unobservable inputs are inputs that reflect the reporting entity’s own assumptions about the assumptions market participants would use in pricing the asset or liability developed based on the best information available in the circumstances.
Various inputs are used in determining the value of each Fund’s investments. These inputs are summarized in the three broad levels listed below.
| | ● | Level 1 – unadjusted quoted prices in active markets for identical investments and/or registered investment companies where the value per share is determined and published and is the basis for current transactions for identical assets or liabilities at the valuation date |
| | ● | Level 2 – other significant observable inputs (including, but not limited to, quoted prices for an identical security in an inactive market, quoted prices for similar securities, interest rates, prepayment speeds, credit risk, etc.) |
| | ● | Level 3 – significant unobservable inputs (including the Funds’ own assumptions in determining fair value of investments based on the best information available) |
35
Dana Funds
Notes to the Financial Statements (continued)
October 31, 2020
The inputs used to measure fair value may fall into different levels of the fair value hierarchy. In such cases, for disclosure purposes, the level in the fair value hierarchy which is reported is determined based on the lowest level input that is significant to the fair value measurement in its entirety.
Equity securities that are traded on any stock exchange are generally valued at the last quoted sale price on the security’s primary exchange. Lacking a last sale price, an exchange-traded security is generally valued at its last bid price. Securities traded in the NASDAQ over-the-counter market are generally valued at the NASDAQ Official Closing Price. When using the market quotations and when the market is considered active, the security is classified as a Level 1 security. In the event that market quotations are not readily available or are considered unreliable due to market or other events, a Fund values its securities and other assets at fair value in accordance with policies established by and under the general supervision of the Board. Under these policies, the securities will be classified as Level 2 or 3 within the fair value hierarchy, depending on the inputs used.
Investments in mutual funds, including money market mutual funds, are generally priced at the ending NAV. These securities are categorized as Level 1 securities.
In accordance with the Trust’s valuation policies, the Adviser is required to consider all appropriate factors relevant to the value of securities for which it has determined other pricing sources are not available or reliable as described above. No single method exists for determining fair value, because fair value depends upon the circumstances of each individual case. As a general principle, the current fair value of a security being valued by the Adviser would be the amount that the Fund might reasonably expect to receive upon the current sale. Methods that are in accordance with this principle may, for example, be based on (i) a multiple of earnings; (ii) a discount from market prices of a similar freely traded security (including a derivative security or a basket of securities traded on other markets, exchanges or among dealers); or (iii) yield to maturity with respect to debt issues, or a combination of these and other methods. Fair-value pricing is permitted if, in the Adviser’s opinion, the validity of market quotations appears to be questionable based on factors such as evidence of a thin market in the security based on a small number of quotations, a significant event occurs after the close of a market but before a Fund’s NAV calculation that may affect a security’s value, or the Adviser is aware of any other data that calls into question the reliability of market quotations.
The following is a summary of the inputs used to value the Funds’ investments as of October 31, 2020:
Large Cap Fund | | Valuation Inputs | | | | | |
Assets | | Level 1 | | | Level 2 | | | Level 3 | | | Total | |
Common Stocks(a) | | $ | 115,090,958 | | | $ | — | | | $ | — | | | $ | 115,090,958 | |
Money Market Funds | | | 501,732 | | | | — | | | | — | | | | 501,732 | |
Total | | $ | 115,592,690 | | | $ | — | | | $ | — | | | $ | 115,592,690 | |
36
Dana Funds
Notes to the Financial Statements (continued)
October 31, 2020
Small Cap Fund | | Valuation Inputs | | | | | |
Assets | | Level 1 | | | Level 2 | | | Level 3 | | | Total | |
Common Stocks(a) | | $ | 9,751,722 | | | $ | — | | | $ | — | | | $ | 9,751,722 | |
Money Market Funds | | | 101,402 | | | | — | | | | — | | | | 101,402 | |
Total | | $ | 9,853,124 | | | $ | — | | | $ | — | | | $ | 9,853,124 | |
Epiphany ESG Fund | | Valuation Inputs | | | | | |
Assets | | Level 1 | | | Level 2 | | | Level 3 | | | Total | |
Common Stocks(a) | | $ | 12,675,200 | | | $ | — | | | $ | — | | | $ | 12,675,200 | |
Money Market Funds | | | 507,720 | | | | — | | | | — | | | | 507,720 | |
Total | | $ | 13,182,920 | | | $ | — | | | $ | — | | | $ | 13,182,920 | |
(a) | Refer to Schedule of Investments for sector classifications. |
The Funds did not hold any investments at the end of the reporting period for which significant unobservable inputs (Level 3) were used in determining fair value; therefore, no reconciliation of Level 3 securities is included for this reporting period.
NOTE 4. FEES AND OTHER TRANSACTIONS WITH AFFILIATES
The Adviser, under the terms of the management agreement for each Fund, manages the Funds’ investments subject to oversight of the Board. As compensation for its management services, the Funds are obligated to pay the Adviser a fee computed and accrued daily and paid monthly at an annual rate of 0.65%, 0.75% and 0.65% of the average daily net assets of the Large Cap Fund, the Small Cap Fund and the Epiphany ESG Fund, respectively. For the fiscal year ended October 31, 2020, the Adviser earned fees of $828,212 from the Large Cap Fund, $87,190 from the Small Cap Fund and $84,680 from the Epiphany ESG Fund before the waivers described below. At October 31, 2020, the Large Cap Fund owed the Adviser $50,148 and the Adviser owed the Small Cap Fund and Epiphany ESG Fund $8,695 and $5,901, respectively.
The Adviser has contractually agreed to waive its management fee and/or reimburse certain operating expenses through February 28, 2021, but only to the extent necessary so that the Funds’ net expenses, excluding brokerage fees and commissions, borrowing costs (such as interest and dividend expenses on securities sold short), taxes, extraordinary expenses, fees and expenses paid under a distribution plan adopted pursuant to Rule 12b-1, fees and expenses paid under a shareholder services plan, and indirect expenses (such as “acquired fund fees and expenses”) do not exceed 0.73% of the average daily net assets of the Institutional Class and the Investor Class for the Large Cap Fund, 0.95% of the average daily net assets of the Institutional Class for the Small Cap Fund, and 0.85% of the average daily net assets of the Institutional Class for the Epiphany ESG Fund.
Each fee waiver or expense reimbursement by the Adviser is subject to repayment by the applicable Fund within three years following the date in which the fee waiver or expense reimbursement occurred, provided that the Fund is able to make the repayment without exceeding the expense limitation that is in effect at the time of the waiver or expense reimbursement, and the expense limitation in effect at the time of the repayment. The expense limitation agreements may not be terminated except by
37
Dana Funds
Notes to the Financial Statements (continued)
October 31, 2020
mutual consent of the Adviser and the Board. For the fiscal year ended October 31, 2020, the Adviser waived fees of $227,431 from the Large Cap Fund, $187,744 from the Small Cap Fund and $154,164 from the Epiphany ESG Fund.
The amounts subject to repayment by the Funds, pursuant to the aforementioned conditions are as follows:
Recoverable through | | Large Cap
Fund | | | Small Cap
Fund | | | Epiphany ESG
Fund | |
October 31, 2021 | | $ | 267,323 | | | $ | 170,979 | | | $ | — | |
October 31, 2022 | | | 169,051 | | | | 153,464 | | | | 137,305 | |
October 31, 2023 | | | 227,431 | | | | 187,744 | | | | 154,164 | |
The Trust retains Ultimus Fund Solutions, LLC (“Ultimus” or “Administrator”) to provide the Funds with administration and compliance (including a chief compliance officer), fund accounting and transfer agent services, including all regulatory reporting. For the fiscal year ended October 31, 2020, fees for administration, compliance, fund accounting, and transfer agent services, and amounts due to the Administrator at October 31, 2020 were as follows:
| | Large Cap
Fund | | | Small Cap
Fund | | | Epiphany ESG
Fund | |
Administration and compliance | | $ | 78,889 | | | $ | 37,917 | | | $ | 32,133 | |
Fund accounting | | | 48,168 | | | | 29,917 | | | | 24,625 | |
Transfer agent | | | 25,433 | | | | 23,217 | | | | 18,441 | |
Payable to Administrator | | | 22,851 | | | | 12,667 | | | | 11,450 | |
The officers and one trustee of the Trust are members of management and/or employees of the Administrator and are not paid by the Trust for services to the Funds. Ultimus Fund Distributors, LLC (the “Distributor”) acts as the distributor of the Funds’ shares. The Distributor is a wholly-owned subsidiary of Ultimus.
The Trust, with respect to each Fund, has adopted a Distribution Plan (the “Plan”) pursuant to Rule 12b-1 under the Investment Company Act of 1940, as amended (the “1940 Act”). The Plan provides that the Funds will pay the Distributor and any registered securities dealer, financial institution or any other person (a “Recipient”) a shareholder servicing fee aggregating at a rate of 0.25% of the average daily net assets for the Investor Class shares in connection with the promotion and distribution of the Funds’ shares or the provision of shareholder support services to shareholders, including, but not necessarily limited to, advertising, compensation to underwriters, dealers and selling personnel, the printing and mailing of prospectuses to other than current Investor Class shareholders, the printing and mailing of sales literature and servicing shareholder accounts (“12b-1 Expenses”). The Funds or Distributor may pay all or a portion of these fees to any Recipient who renders assistance in distributing or promoting the sale of shares, or who provides certain shareholder services, pursuant to a written agreement. The Plan is a compensation plan, which means that compensation is paid regardless of 12b-1 Expenses actually incurred. It is anticipated that the Plan will benefit shareholders
38
Dana Funds
Notes to the Financial Statements (continued)
October 31, 2020
because an effective sales program typically is necessary in order for the Funds to reach and maintain a sufficient size to achieve efficiently their investment objectives and to realize economies of scale. For the fiscal year ended October 31, 2020, the Investor Class shares 12b-1 expense incurred by the Large Cap Fund, Small Cap Fund and Epiphany ESG Fund were $62,911, $2,694 and $11,229, respectively. As of October 31, 2020, the Large Cap Fund owed the Distributor $5,523 for Investor Class 12b-1 fees.
NOTE 5. PURCHASES AND SALES OF SECURITIES
For the fiscal year ended October 31, 2020, purchases and sales of investment securities, other than short-term investments were as follows:
| | Large Cap
Fund | | | Small Cap
Fund | | | Epiphany ESG
Fund | |
Purchases | | $ | 71,164,624 | | | $ | 10,113,733 | | | $ | 8,581,025 | |
| | | | | | | | | | | | | |
Sales | | | 91,481,584 | | | | 13,339,119 | | | | 9,182,762 | |
There were no purchases or sales of long-term U.S. government obligations during the fiscal year ended October 31, 2020.
NOTE 6. FEDERAL TAX INFORMATION
At October 31, 2020, the net unrealized appreciation (depreciation) and tax cost of investments for tax purposes was as follows:
| | | Large Cap
Fund | | | Small Cap
Fund | | | Epiphany ESG
Fund | |
Gross unrealized appreciation | | $ | 23,648,831 | | | $ | 1,692,576 | | | $ | 2,666,772 | |
Gross unrealized depreciation | | | (778,540 | ) | | | (543,782 | ) | | | (197,577 | ) |
Net unrealized appreciation on investments | | $ | 22,870,291 | | | $ | 1,148,794 | | | $ | 2,469,195 | |
Tax cost of investments | | $ | 92,722,399 | | | $ | 8,704,330 | | | $ | 10,713,722 | |
At October 31, 2020, the difference between book basis and tax basis unrealized appreciation for the Large Cap Fund, Small Cap Fund and Epiphany ESG Fund was attributable primarily to the tax deferral of losses on wash sales.
39
Dana Funds
Notes to the Financial Statements (continued)
October 31, 2020
At October 31, 2020, the components of accumulated earnings (deficit) on a tax basis were as follows:
| | Large Cap
Fund | | | Small Cap
Fund | | | Epiphany
ESG Fund | |
Undistributed ordinary income | | $ | 87,881 | | | $ | — | | | $ | 18,398 | |
Undistributed long-term capital gains | | | 2,320,069 | | | | — | | | | 255,761 | |
Accumulated capital and other losses | | | — | | | | (1,370,452 | ) | | | — | |
Unrealized appreciation (depreciation) | | | 22,870,291 | | | | 1,148,794 | | | | 2,469,195 | |
Total accumulated earnings (deficit) | | $ | 25,278,241 | | | $ | (221,658 | ) | | $ | 2,743,354 | |
The tax character of distributions paid for the fiscal years ended October 31, 2020 and October 31, 2019 were as follows:
| | | Large Cap Fund | | | Small Cap Fund | | | Epiphany ESG Fund | |
| | 2020 | | | 2019 | | | 2020 | | | 2019 | | | 2020 | | | 2019 | |
Distributions paid from: | | | | | | | | | | | | | | | | | | | | | | | | |
Ordinary income (a) | | $ | 1,329,710 | | | $ | 2,385,415 | | | $ | 5,901 | | | $ | — | | | $ | 112,014 | | | $ | 118,259 | |
Long-term capital gains | | | 13,598,815 | | | | 16,150,871 | | | | — | | | | 1,344,166 | | | | 1,933,270 | | | | 1,642,707 | |
Total distributions paid | | $ | 14,928,525 | | | $ | 18,536,286 | | | $ | 5,901 | | | $ | 1,344,166 | | | $ | 2,045,284 | | | $ | 1,760,966 | |
(a) | For federal income tax purposes, distributions of short-term capital gains are treated as ordinary income distributions. |
As of October 31, 2020, the Small Cap Fund had available for tax purposes unused capital loss carryforwards of $953,863 of short-term and $405,471 of long-term capital losses with no expiration, which are available to offset against future taxable net capital gains. To the extent that these carryforwards are used to offset future gains, it is probable that the amount offset will not be distributed to shareholders.
For the tax year ended October 31, 2020, the Small Cap Fund deferred Qualified Late Year Ordinary losses of $11,118.
NOTE 7. SECTOR RISK
If a Fund has significant investments in the securities of issuers within a particular sector, any development affecting that sector will have a greater impact on the value of the net assets of the Fund than would be the case if the Fund did not have significant investments in that sector. In addition, this may increase the risk of loss in the Fund and increase the volatility of the Fund’s NAV per share. For instance, economic or market factors, regulatory changes or other developments may negatively impact all companies in a particular sector, and therefore the value of the Fund’s portfolio will be adversely affected. As of October 31, 2020, the Large Cap Fund and the Epiphany ESG Fund had 27.16% and 25.84% of the value of its net assets invested in stocks within the Technology sector.
40
Dana Funds
Notes to the Financial Statements (continued)
October 31, 2020
NOTE 8. COMMITMENTS AND CONTIGENCIES
The Trust indemnifies its officers and Trustees for certain liabilities that may arise from their performance of their duties to the Trust or the Funds. Additionally, in the normal course of business, the Trust enters into contracts that contain a variety of representations and warranties which provide general indemnifications. The Trust’s maximum exposure under these arrangements is unknown, as this would involve future claims that may be made against the Trust that have not yet occurred.
NOTE 9. SUBSEQUENT EVENTS
Management of the Funds has evaluated the need for disclosures and/or adjustments resulting from subsequent events through the date at which these financial statements were issued. Based upon this evaluation, management has determined there were no items requiring adjustment of the financial statements or additional disclosure.
NOTE 10. LIQUIDITY RISK MANAGEMENT PROGRAM (UNAUDITED)
Valued Advisers Trust has adopted and implemented a written liquidity risk management program as required by Rule 22e-4 (the “Liquidity Rule”) under the 1940 Act. The program is reasonably designed to assess and manage each Fund’s liquidity risk, taking into consideration, among other factors, the Fund’s investment strategy and the liquidity of its portfolio investments during normal and reasonably foreseeable stressed conditions; its short and long-term cash flow projections; and its cash holdings and access to other funding sources. The Board approved the appointment of a Liquidity Administrator Committee, which includes representatives from Dana Investment Advisors, Inc., the Funds’ investment adviser, and Ultimus Fund Solutions, LLC, the Funds’ Administrator. The Liquidity Administrator Committee is responsible for the program’s administration and oversight and for reporting to the Board on at least an annual basis regarding the program’s operation and effectiveness. The Liquidity Administrator Committee updated its assessment of each Fund’s liquidity risk profile, considering additional data gathered in the 12 months ended May 31, 2020 and the adequacy and effectiveness of the liquidity risk management program’s operations since its inception on June 1, 2019 (the “Review Period”) in order to prepare a written report for the Board (the “Report”) for consideration at its meeting held on September 9, 2020. The Report noted that during the Review Period none of the Funds experienced unusual stress or disruption to its operations related to purchase and redemption activity. It further noted that during the Review Period each Fund held adequate levels of cash and highly liquid investments to meet shareholder redemption activities in accordance with applicable requirements. The Report concluded that (i) the Trust’s liquidity risk management program is reasonably designed to prevent violations of the Liquidity Rule and (ii) the Trust’s liquidity risk management program had been effectively implemented during the Review Period.
41
Report of Independent Registered Public Accounting Firm
To the Shareholders of Dana Large Cap Equity Fund, Dana Epiphany ESG Small Cap Equity Fund (formerly Dana Small Cap Equity Fund), and Dana Epiphany ESG Equity Fund and
Board of Trustees of Valued Advisers Trust
Opinion on the Financial Statements
We have audited the accompanying statements of assets and liabilities, including the schedules of investments, of Dana Large Cap Equity Fund, Dana Epiphany ESG Small Cap Equity Fund (formerly Dana Small Cap Equity Fund), and Dana Epiphany ESG Equity Fund (the “Funds”), each a series of Valued Advisers Trust, as of October 31, 2020, the related statements of operations for the year then ended, the statements of changes in net assets for each of the two years in the period then ended, including the related notes, and the financial highlights for each of the five periods in the period then ended for Dana Large Cap Equity Fund and Dana Epiphany ESG Small Cap Equity Fund, and the related statement of operations for the year then ended, and the statements of changes in net assets and the financial highlights for each of the two years in the period then ended, including the related notes, for Dana Epiphany ESG Equity Fund (collectively referred to as the “financial statements”). In our opinion, the financial statements present fairly, in all material respects, the financial position of each of the Funds as of October 31, 2020, the results of their operations, the changes in their net assets, and the financial highlights for each of the periods indicated above, in conformity with accounting principles generally accepted in the United States of America.
Dana Epiphany ESG Equity Fund’s financial highlights for the years ended October 31, 2018, and prior, were audited by other auditors whose report dated December 26, 2018, expressed an unqualified opinion on those financial highlights.
Basis for Opinion
These financial statements are the responsibility of the Funds’ management. Our responsibility is to express an opinion on the Funds’ financial statements based on our audits. We are a public accounting firm registered with the Public Company Accounting Oversight Board (United States) (“PCAOB”) and are required to be independent with respect to the Funds in accordance with the U.S. federal securities laws and the applicable rules and regulations of the Securities and Exchange Commission and the PCAOB.
We conducted our audits in accordance with the standards of the PCAOB. Those standards require that we plan and perform the audit to obtain reasonable assurance about whether the financial statements are free of material misstatement, whether due to error or fraud.
Our audits included performing procedures to assess the risks of material misstatement of the financial statements, whether due to error or fraud, and performing procedures that respond to those risks. Such procedures included examining, on a test basis, evidence regarding the amounts and disclosures in the financial statements. Our procedures included confirmation of securities owned as of October 31, 2020, by correspondence with the custodian and brokers, or by other appropriate auditing procedures where replies from brokers were not received. Our audits also included evaluating the
42
Report of Independent Registered Public Accounting Firm (continued)
accounting principles used and significant estimates made by management, as well as evaluating the overall presentation of the financial statements. We believe that our audits provide a reasonable basis for our opinion.
We have served as the auditor of one or more investment companies within Dana Funds since 2012.
COHEN & COMPANY, LTD.
Cleveland, Ohio
December 23, 2020
43
Summary of Fund Expenses (Unaudited)
As a shareholder of a Fund, you incur two types of costs: (1) transaction costs and (2) ongoing costs, including management fees and other Fund expenses. These examples are intended to help you understand your ongoing costs (in dollars) of investing in each Fund and to compare these costs with the ongoing costs of investing in other mutual funds. Each Fund’s example is based on an investment of $1,000 invested at the beginning of the period and held for the entire period from May 1, 2020 through October 31, 2020.
Actual Expenses
The first line of the table for each class provides information about actual account values and actual expenses. You may use the information in these lines, together with the amount you invested, to estimate the expenses that you paid over the period. Simply divide your account value by $1,000 (for example, an $8,600 account value divided by $1,000 = 8.60), then multiply the result by the number in the first line under the heading “Expenses Paid During Period” to estimate the expenses you paid on your account during this period.
Hypothetical Example for Comparison Purposes
The second line of the table for each class provides information about hypothetical account values and hypothetical expenses based on each Fund’s actual expense ratios and an assumed rate of return of 5% per year before expenses, which is not the Fund’s actual return. The hypothetical account values and expenses may not be used to estimate the actual ending account balances or expenses you paid for the period. You may use this information to compare the ongoing costs of investing in the Funds and other funds. To do so, compare this 5% hypothetical example with the 5% hypothetical examples that appear in the shareholder reports of other funds.
Expenses shown in the table are meant to highlight your ongoing costs only and do not reflect any transactional costs. Therefore, the second line of the table for each class is useful in comparing ongoing costs only and will not help you determine the relative total costs of owning different funds. In addition, if transaction costs were included, your costs would have been higher.
44
Summary of Fund Expenses (Unaudited) (continued)
| | Beginning
Account
Value
May 1, 2020 | Ending
Account
Value,
October 31, 2020 | Expenses
Paid
During
Period(a) | Annualized
Expense
Ratio |
Large Cap Fund |
Institutional Class | Actual | $ 1,000.00 | $ 1,120.60 | $3.89 | 0.73% |
| | | | | | |
| | Hypothetical (b) | $ 1,000.00 | $ 1,021.47 | $3.71 | 0.73% |
| | | | | | |
Investor Class | Actual | $ 1,000.00 | $ 1,119.70 | $5.22 | 0.98% |
| | | | | | |
| | Hypothetical (b) | $ 1,000.00 | $ 1,020.21 | $4.98 | 0.98% |
Small Cap Fund |
Institutional Class | Actual | $ 1,000.00 | $ 1,179.60 | $5.20 | 0.95% |
| | | | | | |
| | Hypothetical (b) | $ 1,000.00 | $ 1,020.36 | $4.82 | 0.95% |
Epiphany ESG Fund |
Institutional Class | Actual | $ 1,000.00 | $ 1,122.30 | $4.54 | 0.85% |
| | | | | | |
| | Hypothetical (b) | $ 1,000.00 | $ 1,020.86 | $4.32 | 0.85% |
(a) | Expenses are equal to the Fund’s annualized expense ratios, multiplied by the average account value over the period, multiplied by 184/366 (to reflect the one-half year period). The annualized expense ratios reflect reimbursement of expenses by the Fund’s investment adviser for the period beginning May 1, 2020 to October 31, 2020. The “Financial Highlights” tables in the Fund’s financial statements, included in this report, also show the gross expense ratios, without such reimbursements. |
(b) | Hypothetical assumes 5% annual return before expenses. |
45
Additional Federal Income Tax Information (Unaudited)
The Form 1099-DIV you receive in January 2021 will show the tax status of all distributions paid to your account in calendar year 2020. Shareholders are advised to consult their own tax adviser with respect to the tax consequences of their investment in the Fund. As required by the Internal Revenue Code and/or regulations, shareholders must be notified regarding the status of qualified dividend income for individuals and the dividends received deduction for corporations.
Qualified Dividend Income. The Funds designate the following percentage or up to the maximum amount of such dividends allowable pursuant to the Internal Revenue Code, as qualified dividend income eligible for the reduced tax rate.
| Large Cap
Fund | Small Cap
Fund | Epiphany ESG
Fund |
Qualified Dividend Income | 100% | 100% | 100% |
Qualified Business Income. The Funds designate the following percentage of ordinary income dividends, or up to the maximum amount of such dividends allowable pursuant to the Internal Revenue Code, as qualified business income.
| Large Cap
Fund | Small Cap
Fund | Epiphany ESG
Fund |
Qualified Business Income | 0% | 0% | 0% |
Dividends Received Deduction. Corporate shareholders are generally entitled to take the dividends received deduction on the portion of the Funds’ dividend distribution that qualifies under tax law. For the Funds’ calendar year 2020 ordinary income dividends, the following percentage qualifies for the corporate dividends received deduction.
| Large Cap
Fund | Small Cap
Fund | Epiphany ESG
Fund |
Dividends Received Deduction | 100% | 100% | 100% |
The Funds designate the following amounts as long-term capital gains distributions. The amounts designated may not agree with long-term capital gains in the tax character of distribution table due to utilization of earnings and profits distributed to shareholders on redemption of shares.
| | Large Cap
Fund | | | Small Cap
Fund | | | Epiphany ESG
Fund | |
Long-Term Capital Gains Distributions | | $ | 13,598,815 | | | $ | — | | | $ | 1,933,270 | |
46
Trustees and Officers (Unaudited)
The Board of Trustees supervises the business activities of the Trust. Each Trustee serves as a trustee until termination of the Trust unless the Trustee dies, resigns, retires or is removed.
The following table provides information regarding each of the Independent Trustees.
Name, Address*, Age,
Position with Trust**,
Term of Position with Trust | Principal Occupation
During Past 5 Years
and Other Directorships | Other Directorships |
Ira P. Cohen, 61 Independent Trustee Since June 2010 | Current: Independent financial services consultant (since February 2005); Executive Vice President of Asset Management Services, Recognos Financial (since August 2015). | Trustee and Audit Committee Chairman, Griffin Institutional Access Credit Fund (since January 2017); Trustee and Audit Committee Chairman, Griffin Institutional Real Estate Access Fund (since May 2014); Trustee, Angel Oak Funds Trust (since October 2014) (4 portfolios); Trustee, Chairman, and Nominating and Governance Committee Chairman, Angel Oak Strategic Credit Fund (since December 2017), Trustee and Chairman, Angel Oak Financial Strategies Income Term Trust (since May 2019). |
Andrea N. Mullins, 53 Independent Trustee
Since December 2013 Chairperson since March 2017 | Current: Private investor; Independent Contractor, SWM Advisors (since April 2014). | Trustee, Angel Oak Funds Trust (since February 2019) (4 portfolios); Trustee, Angel Oak Strategic Credit Fund (since February 2019), Trustee, Angel Oak Financial Strategies Income Term Trust (since May 2019). |
* | The address for each Trustee and officer is 225 Pictoria Drive, Suite 450, Cincinnati, Ohio 45246. |
** | As of the date of this report, the Trust consists of 12 series. |
The following table provides information regarding the Trustee who is considered an “interested person” of the Trust, as that term is defined under the 1940 Act. Based on the experience of the Trustee, the Trust concluded that the individual described below should serve as a Trustee.
Name, Address*, Age,
Position with Trust**,
Term of Position with Trust | Principal Occupation
During Past 5 Years | Other Directorships |
Mark J. Seger***, 58 Trustee Since March 2017 | Current: Vice Chairman and Co-Founder, Ultimus Fund Solutions, LLC and its subsidiaries (since 1999). | None. |
* | The address for each Trustee and officer is 225 Pictoria Drive, Suite 450, Cincinnati, Ohio 45246. |
** | As of the date of this report, the Trust consists of 12 series. |
*** | Mr. Seger is considered an “interested person” of the Trust because of his relationship with the Trust’s administrator, transfer agent, and distributor. |
47
Trustees and Officers (Unaudited) (continued)
The following table provides information regarding the Officers of the Trust:
Name, Address*, Age,
Position with Trust**,
Term of Position with Trust | Principal Occupation
During Past 5 Years | Other Directorships |
Adam T. Kornegay, 35 Principal Executive Officer and President Since April 2018 | Current: Vice President, Business Development Director, Ultimus Fund Solutions, LLC (since June 2018). | None. |
Kevin J. Patton, 50 Chief Compliance Officer Since March 2020 | Current: Assistant Vice President, Compliance Officer, Ultimus Fund Solutions, LLC (since January 2020). Previous: Partner and Chief Compliance Officer, Renaissance Investment Management (August 2005 to January 2020). | None. |
Carol J. Highsmith, 56 Vice President Since August 2008 Secretary Since March 2014 | Current: Vice President, Ultimus Fund Solutions, LLC (since December 2015). Previous: Employed in various positions with Huntington Asset Services, Inc. (n/k/a Ultimus Asset Services, LLC) (November 1994 to December 2015), most recently Vice President of Legal Administration (2005 to December 2015). | None. |
Matthew J. Miller, 44 Vice President Since December 2011 | Current: Assistant Vice President, Relationship Management, Ultimus Fund Solutions, LLC (since December 2015). Previous: Employed in various positions with Huntington Asset Services, Inc. (n/k/a Ultimus Asset Services, LLC) (July 1998 to December 2015), most recently Vice President of Relationship Management (2005 to December 2015). | None. |
48
Trustees and Officers (Unaudited) (continued)
Name, Address*, Age,
Position with Trust**,
Term of Position with Trust | Principal Occupation
During Past 5 Years | Other Directorships |
Gregory T. Knoth, 50 Principal Financial Officer and Treasurer Since April 2019 | Current: Vice President, Mutual Fund Controller, Ultimus Fund Solutions, LLC (since December 2015). Previous: Vice President and Manager of Fund Accounting, Huntington Asset Services, Inc. (n/k/a Ultimus Asset Services, LLC) (June 2013 to December 2015) | None. |
Stephen L. Preston, 54 AML Officer since June 2017 | Current: Chief Compliance Officer of Ultimus Fund Distributors, LLC (since June 2011). Previous: Chief Compliance Officer, Ultimus Fund Solutions, LLC (June 2011 to August 2019); Chief Compliance Officer, Unified Financial Securities, LLC (April 2018 to December 2019) | None. |
* | The address for each Trustee and officer is 225 Pictoria Drive, Suite 450, Cincinnati, Ohio 45246. |
** | As of the date of this report, the Trust consists of 12 series. |
49
Investment Advisory Agreement Approval (Unaudited)
At a meeting held on June 2, 2020, the Board of Trustees (the “Board”) considered the renewal of the Investment Advisory Agreements (the “Dana Agreements”) between Valued Advisers Trust (the “Trust”) and Dana Investment Advisors, Inc. (“Dana”) with respect to the Dana Large Cap Equity Fund (the “Large Cap Fund”), the Dana Small Cap Equity Fund (the “Small Cap Fund”), and the Dana Epiphany ESG Equity Fund (the “ESG Fund”) (collectively, the “Dana Funds”). Dana provided written information to the Board to assist the Board in its considerations.
The Board discussed the contractual arrangements between Dana and the Trust for the Dana Funds. They reflected upon the Board’s prior experience with Dana in managing the Dana Funds, as well as their earlier discussions with Dana.
Counsel then directed the Trustees to a memorandum from his firm that summarized, among other things, the fiduciary duties and responsibilities of the Board in reviewing and approving the Dana Agreements. In assessing the factors and reaching its decision, the Board took into consideration information furnished by Dana and the Trust’s other service providers for the Board’s review and consideration throughout the year, as well as information specifically prepared or presented in connection with the renewal process, including: (i) reports regarding the services and support provided to the Dana Funds by Dana; (ii) quarterly assessments of the investment performance of the Dana Funds; (iii) commentary on the reasons for the performance; (iv) presentations by Dana addressing its investment philosophy, investment strategy, personnel, and operations of Dana; (v) compliance and audit reports concerning the Dana Funds and Dana; (vi) disclosure information contained in the registration statement of the Trust for the Dana Funds and Dana’s Form ADV; and (vii) a memorandum from counsel, that summarized the fiduciary duties and responsibilities of the Board in reviewing and approving the Dana Agreements. The Board also requested and received materials including, without limitation: (a) documents containing information about Dana, including its financial information; a description of its personnel and the services it provides to the Dana Funds; information on Dana’s investment advice and performance; summaries of the Dana Funds’ expenses, compliance program, current legal matters, and other general information; (b) comparative expense and performance information for other mutual funds with strategies similar to the Dana Funds; and (c) the benefits to be realized by Dana from its relationship with the Dana Funds. The Board did not identify any particular information that was most relevant to its consideration to approve the Dana Agreements and each Trustee may have afforded different weight to the various factors.
1. | The nature, extent, and quality of the services to be provided by Dana. The Board considered Dana’s responsibilities under the Dana Agreements. The Trustees considered the services being provided by Dana to the Dana Funds including, without limitation: the quality of its investment advisory services (including research and recommendations with respect to portfolio securities), its process for formulating investment recommendations and assuring compliance with the Dana Funds’ investment objectives and limitations, its coordination of services for the Dana Funds among their service providers, and its efforts to promote the Dana Funds and grow their assets. The Trustees considered Dana’s continuity of, and commitment to retain, qualified personnel and Dana’s commitment to maintain and enhance its resources and systems, the commitment of Dana’s personnel to finding alternatives and options that allow the Dana Funds to maintain their goals, and Dana’s continued cooperation with the Board and counsel for the Dana Funds. The Trustees considered Dana’s personnel, including their education and experience. After considering |
50
Investment Advisory Agreement Approval (Unaudited) (continued)
the foregoing information and further information in the Meeting materials provided by Dana, the Board concluded that, in light of all the facts and circumstances, the nature, extent, and quality of the services provided by Dana were satisfactory and adequate for the Dana Funds.
2. | Investment Performance of the Dana Funds and Dana. The Trustees compared the performance of each of the Dana Funds with the performance of funds with similar objectives managed by other investment advisers, with aggregated peer group data, as well as with the performance of each of the Dana Funds’ benchmark. The Trustees also considered the consistency of Dana’s management of the Dana Funds with their investment objectives, strategies, and limitations. The Trustees noted that, as of March 31, 2020, the Large Cap Fund’s performance was above its peer group median for the one-year, three-year, and since inception periods, and below the peer group median for the five-year period. The Trustees noted that the Large Cap Fund’s performance was below that of its benchmark for all periods presented. When compared to other funds in its custom Morningstar category, the Trustees observed that the Large Cap Fund’s performance was above the average and median for the one-year and three-year periods, below the average and median for the five-year period, and above the median for the since inception period. The Trustees also considered the performance of Dana’s separate accounts that were managed in a manner similar to that of the Large Cap Fund and they noted that the performance of Dana’s composite was higher, and that the reasons for the difference were reasonable. The Trustees considered the performance of the Small Cap Fund, and observed that, as of March 31, 2020, the Small Cap Fund performed below the median of its peer group for the one-year, three-year and since inception periods. As compared to its benchmark, the Trustees noted that the Small Cap Fund also underperformed for the periods presented. They also noted that the Small Cap Fund’s performance was below the average and median of its custom Morningstar category for all periods presented. The Trustees also considered the performance of Dana’s separate accounts that were managed in a manner similar to that of the Small Cap Fund and they noted that the performance of the separate account composite was higher, and that the reasons for the difference were reasonable. The Trustees then considered the performance of the ESG Fund, noting that Dana began managing the Fund in December of 2018. For this reason, the Trustees focused their attention on the one-year performance of the ESG Fund. They observed that for the one-year period ended March 31, 2020, the ESG Fund underperformed as compared to its benchmark, the median of its peer group, and the median and average of its custom Morningstar category. The Trustees also considered the performance of Dana’s separate accounts that were managed in a manner similar to that of the ESG Fund and they noted that the performance of the separate account composites were higher, and that the reasons for the differences were reasonable. The Trustees took into consideration discussions with representatives of Dana regarding the reasons for the performance of each of the Dana Funds. After reviewing and discussing these and other relevant factors, the Board concluded, in light of all the facts and circumstances, that the investment performance of the Dana Funds and Dana was satisfactory. |
3. | The costs of the services to be provided and profits to be realized by Dana from the relationship with the Dana Funds. The Trustees considered: (1) Dana’s financial condition; (2) the asset level of the Dana Funds; (3) the overall expenses of each of the Dana Funds; and (4) the nature and frequency of management fee payments. The Trustees reviewed information provided by Dana regarding its profits associated with managing each of the Dana Funds, noting that Dana is currently waiving a portion of its management fee and/or reimbursing other expenses with respect to each of the Dana Funds. The Trustees also considered potential benefits for Dana |
51
Investment Advisory Agreement Approval (Unaudited) (continued)
in managing the Dana Funds. The Trustees then compared the fees and expenses of the Dana Funds (including the management fee) to other comparable mutual funds. The Trustees noted that the Large Cap Fund’s management fee was equal to the average and above the median of its peer group and above the average and median of its custom Morningstar category. The Trustees also noted that the Large Cap Fund’s net expense ratio for the Institutional Class was below the average and equal to the median of its peer group and above the median but equal to the average of its custom Morningstar category. With respect to the Small Cap Fund, the Trustees noted that the management fee was below the average and median of its peer group and custom Morningstar category. They also noted that the Small Cap Fund’s net expense ratio for the Institutional Class was below the average and median of its peer group and below the average and median of its custom Morningstar category. With respect to the ESG Fund, the Board noted that the management fee was below the average and equal to the median of its peer group and above both the average and median of its custom Morningstar category. They also noted that the ESG Fund’s net expense ratio for the Institutional Class was below the average and equal to the median of its peer group and above both the average and median of its custom Morningstar category. The Board also considered the fact that Dana contractually lowered the management fee for the Large Cap Fund and the Small Cap Fund in the past, and had contractually agreed to limit expenses of each of the Dana Funds. The Board noted that the fees that Dana assesses for separate account clients that have strategies similar to that of each of the Dana Funds, respectively, could be comparable or lower and they expressed the view that the reasons for such differences were acceptable and reasonable. Based on the foregoing, the Board concluded that the fees to be paid to Dana by each of the Dana Funds and the profits to be realized by Dana, in light of all the facts and circumstances, were fair and reasonable in relation to the nature and quality of the services provided by Dana.
4. | The extent to which economies of scale would be realized as the Dana Funds grow and whether advisory fee levels reflect these economies of scale for the benefit of the Dana Funds’ investors. The Board considered the Dana Funds’ fee arrangements with Dana. The Board considered that while the management fee remained the same at all asset levels, the shareholders experienced benefits from each of the Dana Funds’ expense limitation arrangements. The Trustees noted that once the expenses fell below the cap set by each arrangement, the shareholders would continue to benefit from economies of scale under the Dana Funds’ arrangements with other service providers to the Dana Funds, and the Trustees attributed this benefit, in part, to the direct and indirect efforts of Dana at the inception of each of the Dana Funds to ensure that a cost structure was in place that was beneficial for the Dana Funds as they grew. In light of its ongoing consideration of the Dana Funds’ asset levels, expectations for growth in the Dana Funds, and fee levels, the Board determined that the Dana Funds’ fee arrangements, in light of all the facts and circumstances, were fair and reasonable in relation to the nature and quality of the services provided by Dana. |
5. | Possible conflicts of interest and benefits to Dana. The Trustees evaluated the potential for conflicts of interest and considered such matters as the experience and ability of the advisory personnel assigned to the Dana Funds; the basis of decisions to buy or sell securities for the Dana Funds and the substance and administration of Dana’s code of ethics. The Trustees also considered disclosure in the registration statement of the Trust relating to Dana’s potential conflicts of interest. The Trustees noted that Dana may utilize soft dollars and the Trustees noted Dana’s policies and processes for managing the conflicts of interest that could arise from soft |
52
Investment Advisory Agreement Approval (Unaudited) (continued)
dollar arrangements. The Trustees noted other potential benefits to Dana, including the fact that the Dana Funds provide an attractive vehicle for smaller accounts, which may increase the total assets under management by Dana and provide marginal cost efficiency. Based on the foregoing, the Board determined that the standards and practices of Dana relating to the identification and mitigation of potential conflicts of interest and the benefits to be realized by Dana in managing the Dana Funds were satisfactory.
After additional consideration of the factors delineated in the memorandum provided by counsel and further discussion among the Board members, the Board determined to approve the continuation of the Dana Agreements between the Trust and Dana.
53
FACTS | WHAT DO THE DANA FUNDS DO WITH YOUR PERSONAL INFORMATION? |
| | |
Why? | Financial companies choose how they share your personal information. Federal law gives consumers the right to limit some but not all sharing. Federal law also requires us to tell you how we collect, share, and protect your personal information. Please read this notice carefully to understand what we do. |
| | |
What? | The types of personal information we collect and share depend on the product or service you have with us. This information can include: ■ Social Security number ■ account balances and account transactions ■ transaction or loss history and purchase history ■ checking account information and wire transfer instructions When you are no longer our customer, we continue to share your information as described in this notice. |
| | |
How? | All financial companies need to share customers’ personal information to run their everyday business. In the section below, we list the reasons financial companies can share their customers’ personal information; the reasons Dana Funds choose to share; and whether you can limit this sharing. |
| | |
Reasons we can share your personal information | Do Dana Funds share? |
For our everyday business purposes —
such as to process your transactions, maintain your account(s), respond to court orders and legal investigations, or report to credit bureaus | Yes |
For our marketing purposes —
to offer our products and services to you | No |
For joint marketing with other financial companies | No |
For our affiliates’ everyday business purposes –
information about your transactions and experiences | No |
For our affiliates’ everyday business purposes –
information about your creditworthiness | No |
For nonaffiliates to market to you | No |
| | |
Questions? | Call (855) 280-9648 |
54
Who we are |
Who is providing this notice? | Dana Funds
Ultimus Fund Distributors, LLC (Distributor)
Ultimus Fund Solutions, LLC (Administrator) |
What we do |
How do Dana Funds protect my personal information? | To protect your personal information from unauthorized access and use, we use security measures that comply with federal law. These measures include computer safeguards and secured files and buildings. Our service providers are held accountable for adhering to strict policies and procedures to prevent any misuse of your nonpublic personal information. |
How do Dana Funds collect my personal information? | We collect your personal information, for example, when you ■ open an account or deposit money ■ buy securities from us or sell securities to us ■ make deposits or withdrawals from your account ■ give us your account information ■ make a wire transfer ■ tell us who receives the money ■ tell us where to send the money ■ show your government-issued ID ■ show your driver’s license |
Why can’t I limit all sharing? | Federal law gives you the right to limit only ■ sharing for affiliates’ everyday business purposes—information about your creditworthiness ■ affiliates from using your information to market to you ■ sharing for nonaffiliates to market to you State laws and individual companies may give you additional rights to limit sharing. |
Definitions |
Affiliates | Companies related by common ownership or control. They can be financial and nonfinancial companies. ■ Dana Investment Advisors, Inc., the investment adviser to the Fund, could be deemed to be an affiliate. |
Nonaffiliates | Companies not related by common ownership or control. They can be financial and nonfinancial companies. ■ The Dana Funds do not share your personal information with nonaffiliates so they can market to you. |
Joint marketing | A formal agreement between nonaffiliated financial companies that together market financial products or services to you. ■ The Dana Funds do not jointly market. |
55
This page is intentionally left blank.
This page is intentionally left blank.
OTHER INFORMATION
The Funds’ Statement of Additional Information (“SAI”) includes additional information about the trustees and is available without charge, upon request. You may call toll-free at (855) 280-9648 to request a copy of the SAI or to make shareholder inquiries.
PROXY VOTING
A description of the policies and procedures that each Fund uses to determine how to vote proxies relating to portfolio securities and information regarding how each Fund voted those proxies during the most recent twelve month period ended June 30, are available (1) without charge upon request by calling the Funds at (855) 280-9648 and (2) in Fund documents filed with the Securities and Exchange Commission (“SEC”) on the SEC’s website at www.sec.gov.
TRUSTEES
Andrea N. Mullins, Chairperson
Ira P. Cohen
Mark J. Seger
OFFICERS
Adam T. Kornegay, Principal Executive Officer and President
Gregory T. Knoth, Principal Financial Officer and Treasurer
Kevin J. Patton, Chief Compliance Officer
Carol J. Highsmith, Vice President and Secretary
INVESTMENT ADVISER
Dana Investment Advisors, Inc.
20700 Swenson Drive, Suite 400
Waukesha, WI 53186
DISTRIBUTOR
Ultimus Fund Distributors, LLC
225 Pictoria Drive, Suite 450
Cincinnati, OH 45246
INDEPENDENT REGISTERED PUBLIC ACCOUNTING FIRM
Cohen & Company, Ltd.
1350 Euclid Avenue, Suite 800
Cleveland, OH 44115
LEGAL COUNSEL
Troutman Pepper Hamilton Sanders LLP
3000 Two Logan Square
18th and Arch Streets
Philadelphia, PA 19103
CUSTODIAN
Huntington National Bank
41 South High Street
Columbus, OH 43215
ADMINISTRATOR, TRANSFER AGENT AND FUND ACCOUNTANT
Ultimus Fund Solutions, LLC
225 Pictoria Drive, Suite 450
Cincinnati, OH 45246
This report is intended only for the information of shareholders or those who have received the Funds’ prospectus which contains information about each Fund’s management fee and expenses. Please read the prospectus carefully before investing.
Distributed by Ultimus Fund Distributors, LLC
Member FINRA/SIPC
Annual Report October 31, 2020 |
Foundry Partners Fundamental Small Cap
Value Fund
Investor Class – DRSVX
Institutional Class – DRISX
Beginning on January 1, 2021, as permitted by regulations adopted by the Securities and Exchange Commission, paper copies of the Fund’s shareholder reports like this one will no longer be sent by mail, unless you specifically request paper copies of the reports from the Fund or from your financial intermediary such as a broker-dealer or bank. Instead, the reports will be made available on a website, and you will be notified by mail each time a report is posted and provided with a website link to access the report.
If you already elected to receive shareholder reports electronically, you will not be affected by this change and you need not take any action. You may elect to receive shareholder reports and other communications from the Fund electronically by contacting the Fund at (800) 247-1014 or, if you own these shares through a financial intermediary, you may contact your financial intermediary.
You may elect to receive all future reports in paper free of charge. You can inform the Fund that you wish to continue receiving paper copies of your shareholder reports by contacting the Fund at (800) 247-1014. If you own shares through a financial intermediary, you may contact your financial intermediary or follow instructions included with this document to elect to continue to receive paper copies of your shareholder reports. Your election to receive reports in paper will apply to all funds held with the fund complex or at your financial intermediary.
Foundry Funds
c/o Ultimus Fund Solutions, LLC
225 Pictoria Drive, Suite 450
Cincinnati, Ohio 45246
(800) 247-1014
Market Overview and Fund Performance |
Market Review
The year of the COVID-19 pandemic is almost at a close! However, the destruction to the economy due to the economic shut down coupled with the psychological impact of the shelter in place will leave a tremendous impact on every business and human on earth. How we work, where we live, consumer behavior and consumption, and supply chain management are just a few of the many opportunities the pandemic has brought to the forefront of 2020. The work from home mandates forced companies to reimagine their workspace and proved that employees can be just as productive at home as they are in the office. The ability to work from home, whether full-time or part-time, may lead to a suburban migration, increasing demand for homes, a trend we have already seen. Consumer behavior and consumption is constantly evolving, and online shopping has accelerated its dominance over physical stores. The supply chain is already being reimagined as parts for manufacturing and drugs manufactured in China were delayed due to COVID-19. With these challenges are many questions: How do you build a hybrid workforce and create a culture? How do you empower teams to quickly move with the fast-changing consumer behaviors and consumption trends? What inventory levels are necessary and how geographically close do I need suppliers? As investors, we see opportunity!
Portfolio Review
Amidst the volatility the Foundry Partners Fundamental Small Cap Value Fund (the “Fund”) (Institutional Class) underperformed the Fund’s benchmark, the Russell 2000® Value Index, by 105 basis points over the course of the last twelve months ended October 31, 2020. Detractors to performance were Technology, Utilities, Consumer Staples, Health Care, Financials, Industrials, Communications, Consumer Discretionary, and Energy. Our contributors included Real Estate and Materials.
Technology was the worst performer for the fiscal year due to poor stock selection. Several contract manufacturers fell during the period due to the COVID shutdown. ScanSource and Celestica were down -45.60% and -28.02%, respectively. Offsetting some of the weakness were our semiconductor companies such as Canadian Solar and Diodes, posting positive returns of 64.48% and 2.59%, respectively.
Stock selection within Financials was also weak. Banks were under pressure most of the year as the pandemic brought fresh fears of a credit crisis. The pull back in banks was swift and painful with TCF Financial, down -39.77%; Associated Bancorp, losing -35.57%; and Fulton Financial, dropping -34.54%. We took advantage of the volatility in the banks to add to our positions. Many of these banks were trading near the levels of the 2008 financial crisis. However, this time the banks balance sheets were in much better shape than in 2008. In addition, the banks have maintained strong reserve balances and received fees from the implementation of the Payroll Protection Program, PPP, from the government.
Within the Materials sector, our precious metal stocks were worth their weight in gold! Alamos Gold rose 52.99% over the past twelve months as it moves to begin mining operations at several locations. Pan American Silver was also strong, jumping 35.04%. Both stocks benefitted from the flight to safety amid the pandemic.
Annual Report
1
Market Overview and Fund Performance (Continued) |
Stock selection and an underweight helped to add value within the Real Estate Investment Trusts (“REITs”). Many of our names posted poor returns but outperformed the index holdings. In addition, we added to our hotel and retail REITs at the height of the pandemic. Those trades proved to be timely and produced good returns.
Volatility has increased, and we believe so has opportunity! We are excited about the valuations and stocks that we are seeing come through the small cap space. The market movements have been violent and severe, an unprecedented drop, followed by a “V” shaped recovery. Without a doubt the world has changed and will continue to evolve. However, these changes and new trends, we believe, will lead to a resurgence of value investing over the coming years. A market where valuation and fundamentals matter, a market where companies ridden with debt and unable to make money will fall to the wayside as easy monetary policy will cease to provide liquidity for their survival. Simply put, a market where the art of stock picking and understanding companies will matter - It should be a great time to be a value investor!
The Fund’s performance quoted is past performance and does not guarantee future results. The investment return and principal value of an investment in the Fund will fluctuate so that an investor’s shares, when redeemed, may be worth more or less than their original cost. Current performance of the Fund may be lower or higher than the performance quoted. Performance data current to the most recent month end may be obtained by calling 1-800-247-1014. Information provided with respect to the Fund’s Portfolio Holdings, Sector Weightings and Number of Holdings are as of October 31, 2020 and are subject to change at any time.
Value stocks may remain undervalued for extended periods of time and the market may not recognize the intrinsic value of these securities.
Micro-cap and small-cap investing involves greater risk not associated with investing in more established companies, such as greater price volatility, business risk, less liquidity and increased competitive threat.
The opinions expressed are those of the investment management team and are subject to change without notice, as are statements of financial market trends, which are based on current conditions. Under no circumstances does the information contained within represent a recommendation to buy, hold or sell any security and it should not be assumed that the companies discussed were, or will prove to be, profitable. Current and future holdings are subject to risk.
Annual Report
2
Investment Results (Unaudited) |
Average Annual Total Returns(a)
As of October 31, 2020 |
| | Investor
Class | Institutional
Class | Russell 2000®
Value Index(b) |
One Year | -15.17% | -14.97% | -13.92% |
Three Year | -6.58% | -6.34% | -4.05% |
Five Year | 1.44% | 1.70% | 3.71% |
Ten Year | 5.75% | 5.99% | 7.06% |
Since Inception (8/22/07) | N/A | 4.18% | 4.35% |
Since Inception (12/31/03) | 7.45% | 4.73% | 6.10% |
| | Expense Ratios(c) | |
| | Investor
Class | Institutional
Class | |
| | 1.33% | 1.08% | |
The investment return and principal value of an investment will fluctuate so that an investor’s shares, when redeemed, may be worth more or less than their original cost. The returns shown do not reflect deduction of taxes that a shareholder would pay on Foundry Partners Fundamental Small Cap Value Fund (the “Fund”) distributions or the redemption of Fund shares. THE FUND’S RETURNS REPRESENT PAST PERFORMANCE AND DO NOT PREDICT FUTURE RESULTS. The returns shown are net of all recurring expenses. Current performance of the Fund may be lower or higher than the performance quoted. For more information on the Fund, and to obtain performance data current to the most recent month end, or to request a prospectus, please call 1-800-247-1014.
You should carefully consider the investment objectives, potential risk, management fees, and charges and expenses of the Fund before investing. The Fund’s prospectus contains this and other information about the Fund and should be read carefully before investing.
(a) | Average annual total returns reflect any change in price per share and assume the reinvestment of all distributions. The Fund’s returns reflect any fee reductions during the applicable periods. If such fee reductions had not occurred, the quoted performance would have been lower. |
(b) | The Russell 2000® Value Index (“Index”) is an unmanaged benchmark that assumes reinvestment of all distributions and excludes the effect of taxes and fees. The Index is a widely recognized unmanaged index of equity prices and is representative of a broader market and range of securities than are found in the Fund’s portfolio. Individuals cannot invest directly in the Index; however, an individual can invest in Exchange-Traded Funds or other investment vehicles that attempt to track the performance of a benchmark index. |
(c) | The expense ratios are from the Fund’s prospectus dated February 28, 2020. Foundry Partners, LLC (the “Adviser”) has contractually agreed to waive its management fee and/or reimburse certain Fund operating expenses, but only to the extent necessary so that the Fund’s net expenses, excluding brokerage fees and commissions, borrowing costs (such as interest and dividend expenses on securities sold short), taxes, distribution and service (12b-1) fees, extraordinary expenses and indirect expenses (such as fees and expenses of acquired funds), does not exceed 1.25% of the Fund’s average daily net assets. The contractual agreement is effective through February 28, 2021. This contractual arrangement may only be terminated by mutual consent of the Adviser and the Board of Trustees, and it will automatically terminate upon the termination of the investment advisory agreement between the Trust and the Adviser. Each waiver or reimbursement of an expense by the Adviser is subject to repayment by the Fund within the three years following the date of such waiver or reimbursement, provided that the Fund is able to make the repayment without exceeding the expense limitation in place at the time of the waiver or reimbursement, and the expense limitation in place at the time of the repayment. Information pertaining to the Fund’s expense ratios as of October 31, 2020 can be found in the financial highlights. |
The Fund is distributed by Ultimus Fund Distributors, LLC, member FINRA/SIPC.
Annual Report
3
Investment Results (Unaudited) (Continued) |
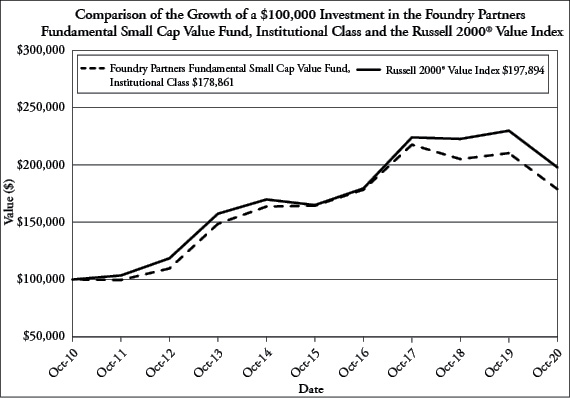
The chart above assumes an initial investment of $100,000 made on October 31, 2010 and held through October 31, 2020. THE FUND’S RETURN REPRESENTS PAST PERFORMANCE AND DOES NOT PREDICT FUTURE RESULTS. Investment returns and principal values will fluctuate so that Fund shares, when redeemed, may be worth more or less than their original purchase price. Current performance may be lower or higher than the performance data quoted.
For more information on the Fund, and to obtain performance data current to the most recent month end, or to request a prospectus, please call 1-800-247-1014. You should carefully consider the investment objectives, potential risk, management fees, and charges and expenses of the Fund before investing. The Fund’s prospectus contains important information about the Fund’s investment objectives, potential risks, management fees, charges and expenses, and other information and should be read carefully before investing.
The Fund is distributed by Ultimus Fund Distributors, LLC, member FINRA/SIPC.
Annual Report
4
Fund Holdings (Unaudited) |
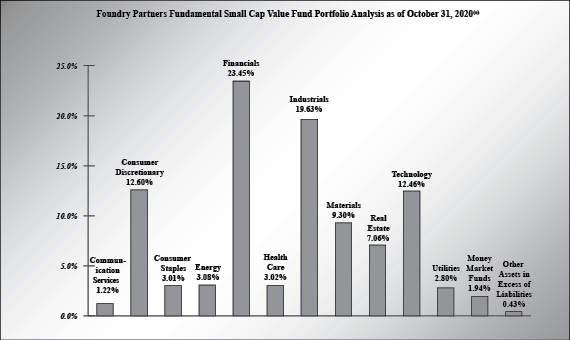
(a) | As a percent of net assets. |
Availability of Portfolio Schedules (Unaudited)
The Fund files its complete schedule of portfolio holdings with the Securities and Exchange Commission (“SEC”) for the first and third quarters of each fiscal year as an exhibit to its reports on Form N-PORT. The Fund’s Form N-PORT reports are available on the SEC’s website at http://www.sec.gov.
Annual Report
5
Foundry Partners Fundamental Small Cap Value Fund |
Schedule of Investments
October 31, 2020
| | Shares | | | Fair Value | |
COMMON STOCKS — 97.43% | | | | |
Communications — 1.22% | | | | |
TEGNA, Inc. | | | 196,954 | | | $ | 2,369,357 | |
Consumer Discretionary — 12.40% | | | | |
Beacon Roofing Supply, Inc.(a) | | | 30,954 | | | | 950,288 | |
Bloomin’ Brands, Inc. | | | 146,993 | | | | 2,054,962 | |
Brunswick Corp. | | | 30,345 | | | | 1,933,280 | |
Cooper Tire & Rubber Co. | | | 64,418 | | | | 2,215,335 | |
Group 1 Automotive, Inc. | | | 31,355 | | | | 3,326,138 | |
Herman Miller, Inc. | | | 59,767 | | | | 1,821,100 | |
KB Home | | | 103,129 | | | | 3,325,910 | |
M/I Homes, Inc.(a) | | | 67,543 | | | | 2,763,860 | |
Qurate Retail Group, Inc. - Series A | | | 131,400 | | | | 889,578 | |
ScanSource, Inc.(a) | | | 43,587 | | | | 876,099 | |
Winnebago Industries, Inc. | | | 32,301 | | | | 1,516,532 | |
Wolverine World Wide, Inc. | | | 92,768 | | | | 2,474,123 | |
| | | | | | | | 24,147,205 | |
Consumer Staples — 3.01% | | | | |
Central Garden & Pet Co., Class A(a) | | | 27,874 | | | | 986,461 | |
Pilgrim’s Pride Corp.(a) | | | 123,369 | | | | 2,065,197 | |
SpartanNash Co. | | | 62,520 | | | | 1,150,993 | |
Spectrum Brands Holdings, Inc. | | | 29,296 | | | | 1,666,064 | |
| | | | | | | | 5,868,715 | |
Energy — 3.08% | | | | |
Canadian Solar, Inc.(a) | | | 22,629 | | | | 822,564 | |
Cimarex Energy Co. | | | 20,613 | | | | 522,952 | |
CVR Energy, Inc. | | | 37,181 | | | | 409,363 | |
Devon Energy Corp. | | | 44,467 | | | | 397,090 | |
Enerplus Corp. | | | 217,771 | | | | 398,521 | |
EnerSys | | | 27,535 | | | | 1,971,506 | |
EQT Corp. | | | 59,736 | | | | 904,403 | |
Hess Midstream LP, Class A | | | 33,287 | | | | 568,542 | |
| | | | | | | | 5,994,941 | |
Financials — 23.45% | | | | |
AllianceBernstein Holding LP | | | 101,148 | | | | 2,939,361 | |
COMMON STOCKS — (continued) | | | | |
Financials — (continued) | | | | |
Associated Banc-Corp | | | 220,556 | | | $ | 3,019,412 | |
Axos Financial, Inc.(a) | | | 56,019 | | | | 1,527,078 | |
CNO Financial Group, Inc. | | | 238,577 | | | | 4,234,742 | |
F.N.B. Corp. | | | 307,674 | | | | 2,326,015 | |
First Midwest Bancorp, Inc. | | | 272,259 | | | | 3,416,849 | |
Fulton Financial Corp. | | | 212,960 | | | | 2,340,430 | |
Hancock Whitney Corp. | | | 117,479 | | | | 2,686,745 | |
International Bancshares Corp. | | | 14,960 | | | | 414,093 | |
Lazard Ltd., Class A | | | 56,906 | | | | 1,916,025 | |
MGIC Investment Corp. | | | 328,164 | | | | 3,301,330 | |
Old National Bancorp | | | 154,053 | | | | 2,153,661 | |
PennyMac Financial Services, Inc. | | | 21,081 | | | | 1,071,336 | |
Pinnacle Financial Partners, Inc. | | | 46,337 | | | | 2,121,771 | |
TCF Financial Corp. | | | 71,475 | | | | 1,944,835 | |
Umpqua Holdings Corp. | | | 148,557 | | | | 1,865,876 | |
Unum Group | | | 142,586 | | | | 2,518,069 | |
Washington Federal, Inc. | | | 78,845 | | | | 1,678,610 | |
WesBanco, Inc. | | | 75,030 | | | | 1,822,479 | |
Wintrust Financial Corp. | | | 48,378 | | | | 2,381,649 | |
| | | | | | | | 45,680,366 | |
Health Care — 3.02% | | | | |
Halozyme Therapeutics, Inc.(a) | | | 40,962 | | | | 1,146,936 | |
Meridian Bioscience, Inc.(a) | | | 62,676 | | | | 1,074,893 | |
Pacira BioSciences, Inc.(a) | | | 20,052 | | | | 1,048,720 | |
Select Medical Holdings Corp.(a) | | | 124,363 | | | | 2,609,136 | |
| | | | | | | | 5,879,685 | |
Industrials — 19.63% | | | | |
Advanced Energy Industries, Inc.(a) | | | 38,534 | | | | 2,599,889 | |
Aegion Corp.(a) | | | 62,528 | | | | 882,270 | |
AMN Healthcare Services, Inc.(a) | | | 37,173 | | | | 2,426,654 | |
ArcBest Corp. | | | 39,139 | | | | 1,194,522 | |
Crane Co. | | | 18,683 | | | | 948,162 | |
Curtiss-Wright Corp. | | | 23,386 | | | | 1,972,843 | |
DHT Holdings, Inc. | | | 252,279 | | | | 1,213,463 | |
See accompanying notes which are an integral part of these financial statements.
Annual Report
6
Foundry Partners Fundamental Small Cap Value Fund |
Schedule of Investments (Continued)
October 31, 2020
| | Shares | | | Fair Value | |
COMMON STOCKS — (continued) | | | | |
Industrials — (continued) | | | | |
EMCOR Group, Inc. | | | 68,008 | | | $ | 4,637,465 | |
Frontdoor, Inc.(a) | | | 38,911 | | | | 1,541,654 | |
H&R Block, Inc. | | | 92,197 | | | | 1,591,320 | |
Hillenbrand, Inc. | | | 66,146 | | | | 1,934,771 | |
Hub Group, Inc., Class A(a) | | | 22,764 | | | | 1,141,159 | |
Itron, Inc.(a) | | | 24,807 | | | | 1,685,636 | |
KBR, Inc. | | | 186,414 | | | | 4,155,168 | |
Kennametal, Inc. | | | 72,583 | | | | 2,250,072 | |
Korn Ferry International | | | 40,774 | | | | 1,230,967 | |
Oshkosh Corp. | | | 30,538 | | | | 2,057,040 | |
Regal-Beloit Corp. | | | 38,492 | | | | 3,797,235 | |
Timken Co. (The) | | | 16,307 | | | | 973,528 | |
| | | | | | | | 38,233,818 | |
Materials — 9.30% | | | | |
Alamos Gold, Inc., Class A | | | 284,465 | | | | 2,602,855 | |
Boise Cascade Co. | | | 13,167 | | | | 505,349 | |
Cabot Corp. | | | 76,696 | | | | 2,915,214 | |
Commercial Metals Co. | | | 87,717 | | | | 1,811,356 | |
Eagle Materials, Inc. | | | 24,214 | | | | 2,064,244 | |
Kraton Corp.(a) | | | 41,864 | | | | 1,184,751 | |
Minerals Technologies, Inc. | | | 37,482 | | | | 2,049,891 | |
Pan American Silver Corp. | | | 66,330 | | | | 2,109,294 | |
UFP Industries, Inc. | | | 57,429 | | | | 2,866,282 | |
| | | | | | | | 18,109,236 | |
Real Estate — 7.06% | | | | |
Apple Hospitality REIT, Inc. | | | 82,990 | | | | 821,601 | |
Brandywine Realty Trust | | | 86,846 | | | | 760,771 | |
CareTrust REIT, Inc. | | | 100,727 | | | | 1,722,432 | |
DiamondRock Hospitality Co. | | | 266,337 | | | | 1,315,705 | |
Industrial Logistics Properties Trust | | | 58,390 | | | | 1,119,920 | |
Kite Realty Group Trust | | | 97,334 | | | | 1,008,380 | |
Lexington Realty Trust | | | 334,184 | | | | 3,318,447 | |
Piedmont Office Realty Trust, Inc., Class A | | | 75,725 | | | | 864,780 | |
COMMON STOCKS — (continued) | | | | |
Real Estate — (continued) | | | | |
PotlatchDeltic Corp. | | | 42,277 | | | $ | 1,756,609 | |
Retail Opportunity Investments Corp. | | | 110,034 | | | | 1,070,631 | |
| | | | | | | | 13,759,276 | |
Technology — 12.46% | | | | |
Arrow Electronics, Inc.(a) | | | 6,523 | | | | 508,076 | |
ChipMOS Technology, Inc. - ADR | | | 45,524 | | | | 885,442 | |
CSG Systems International, Inc. | | | 65,526 | | | | 2,482,124 | |
Diodes, Inc.(a) | | | 49,097 | | | | 2,839,280 | |
FLIR Systems, Inc. | | | 28,091 | | | | 974,477 | |
j2 Global, Inc.(a) | | | 15,800 | | | | 1,072,504 | |
Jabil, Inc. | | | 59,508 | | | | 1,972,095 | |
NextGen Healthcare, Inc.(a) | | | 79,241 | | | | 1,077,678 | |
Omnicell, Inc.(a) | | | 19,406 | | | | 1,679,589 | |
Onto Innovation, Inc.(a) | | | 54,247 | | | | 1,739,701 | |
Sanmina Corp.(a) | | | 69,158 | | | | 1,690,222 | |
Science Applications International Corp. | | | 23,480 | | | | 1,793,168 | |
Sykes Enterprises, Inc.(a) | | | 34,323 | | | | 1,175,220 | |
Verint Systems, Inc.(a) | | | 18,777 | | | | 911,060 | |
Vishay Intertechnology, Inc. | | | 214,871 | | | | 3,485,207 | |
| | | | | | | | 24,285,843 | |
Utilities — 2.80% | | | | |
ALLETE, Inc. | | | 54,230 | | | | 2,797,184 | |
IDACORP, Inc. | | | 20,170 | | | | 1,769,514 | |
NorthWestern Corp. | | | 16,886 | | | | 880,267 | |
| | | | | | | | 5,446,965 | |
Total Common Stocks (Cost $191,736,431) | | | | | | | 189,775,407 | |
PREFERRED STOCKS — 0.20% | | | | |
Consumer Discretionary — 0.20% | | | | |
Qurate Retail, Inc., 8.00%, 3/15/2031 | | | 3,942 | | | | 385,606 | |
Total Preferred Stocks (Cost $425,105) | | | | | | | 385,606 | |
See accompanying notes which are an integral part of these financial statements.
Annual Report
7
Foundry Partners Fundamental Small Cap Value Fund |
Schedule of Investments (Continued)
October 31, 2020
| | Shares | | | Fair Value | |
MONEY MARKET FUNDS — 1.94% | | | | |
Federated Hermes Government Obligations Fund, Institutional Class, 0.01%(b) | | | 3,782,327 | | | $ | 3,782,327 | |
Total Money Market Funds (Cost $3,782,327) | | | 3,782,327 | |
Total Investments — 99.57% (Cost $195,943,863) | | | 193,943,340 | |
Other Assets in Excess of Liabilities — 0.43% | | | 842,459 | |
NET ASSETS — 100.00% | | $ | 194,785,799 | |
(a) | Non-income producing security. |
(b) | Rate disclosed is the seven day effective yield as of October 31, 2020. |
ADR | — American Depositary Receipt |
REIT | — Real Estate Investment Trust |
See accompanying notes which are an integral part of these financial statements.
Annual Report
8
Foundry Partners Fundamental Small Cap Value Fund |
Statement of Assets and Liabilities
October 31, 2020
Assets | | | | |
Investments in securities at fair value (cost $195,943,863) (Note 3) | | $ | 193,943,340 | |
Receivable for fund shares sold | | | 52,578 | |
Receivable for investments sold | | | 966,761 | |
Dividends receivable | | | 152,804 | |
Prepaid expenses | | | 23,898 | |
Total Assets | | | 195,139,381 | |
Liabilities | | | | |
Payable for fund shares redeemed | | | 149,527 | |
Payable to Adviser (Note 4) | | | 146,219 | |
Accrued distribution (12b-1) fees | | | 2,775 | |
Payable to Administrator (Note 4) | | | 18,383 | |
Payable to trustees | | | 1,609 | |
Other accrued expenses | | | 35,069 | |
Total Liabilities | | | 353,582 | |
Net Assets | | $ | 194,785,799 | |
Net Assets consist of: | | | | |
Paid-in capital | | | 213,343,470 | |
Accumulated deficit | | | (18,557,671 | ) |
Net Assets | | $ | 194,785,799 | |
Investor Class: | | | | |
Net Assets | | $ | 12,442,904 | |
Shares outstanding | | | 738,232 | |
Net asset value, offering and redemption price per share (Note 2) | | $ | 16.85 | |
Institutional Class: | | | | |
Net Assets | | $ | 182,342,895 | |
Shares outstanding | | | 10,761,946 | |
Net asset value, offering and redemption price per share (Note 2) | | $ | 16.94 | |
See accompanying notes which are an integral part of these financial statements.
Annual Report
9
Foundry Partners Fundamental Small Cap Value Fund |
Statement of Operations
For the Year Ended October 31, 2020
Investment Income | | | | |
Dividend income (net of foreign taxes withheld of $20,785) | | $ | 4,225,886 | |
Total investment income | | | 4,225,886 | |
Expenses | | | | |
Investment Adviser fees (Note 4) | | | 1,611,578 | |
Administration and compliance services fees (Note 4) | | | 136,061 | |
Fund accounting fees (Note 4) | | | 54,423 | |
Registration expenses | | | 47,382 | |
Distribution (12b-1) fees, Investor Class | | | 38,851 | |
Custodian fees | | | 28,752 | |
Legal fees | | | 26,513 | |
Transfer agent fees (Note 4) | | | 23,000 | |
Audit and tax preparation fees | | | 17,500 | |
Printing and postage expenses | | | 14,857 | |
Insurance expenses | | | 13,057 | |
Trustee fees | | | 10,652 | |
Miscellaneous expenses | | | 47,861 | |
Net operating expenses | | | 2,070,487 | |
Net investment income | | | 2,155,399 | |
Net Realized and Change in Unrealized Gain (Loss) on Investments | | | | |
Net realized loss on investment securities transactions | | | (17,339,377 | ) |
Net realized loss on foreign currency translations | | | (6 | ) |
Net change in unrealized depreciation of investment securities and foreign currency translations | | | (7,570,186 | ) |
Net realized and change in unrealized loss on investments | | | (24,909,569 | ) |
Net decrease in net assets resulting from operations | | $ | (22,754,170 | ) |
See accompanying notes which are an integral part of these financial statements.
Annual Report
10
Foundry Partners Fundamental Small Cap Value Fund |
Statements of Changes in Net Assets
| | For the
Year Ended
October 31,
2020 | | | For the
Year Ended
October 31,
2019 | |
Increase (Decrease) in Net Assets due to: | | | | | | | | |
Operations | | | | | | | | |
Net investment income | | $ | 2,155,399 | | | $ | 2,451,852 | |
Net realized gain (loss) on investment securities transactions | | | (17,339,383 | ) | | | 4,194,487 | |
Net change in unrealized depreciation of investment securities | | | (7,570,186 | ) | | | (2,245,041 | ) |
Net increase (decrease) in net assets resulting from operations | | | (22,754,170 | ) | | | 4,401,298 | |
Distributions to Shareholders From Earnings (Note 2) | | | | | | | | |
Investor Class | | | (729,182 | ) | | | (2,046,739 | ) |
Institutional Class | | | (6,664,011 | ) | | | (13,206,296 | ) |
Total Distributions | | | (7,393,193 | ) | | | (15,253,035 | ) |
Capital Transactions - Investor Class | | | | | | | | |
Proceeds from shares sold | | | 1,282,613 | | | | 1,795,212 | |
Reinvestment of distributions | | | 713,576 | | | | 1,992,112 | |
Amount paid for shares redeemed | | | (6,557,518 | ) | | | (6,777,093 | ) |
Total Capital Transactions - Investor Class | | | (4,561,329 | ) | | | (2,989,769 | ) |
Capital Transactions - Institutional Class | | | | | | | | |
Proceeds from shares sold | | | 65,160,727 | | | | 34,498,680 | |
Reinvestment of distributions | | | 6,436,461 | | | | 12,712,182 | |
Amount paid for shares redeemed | | | (36,751,011 | ) | | | (22,193,984 | ) |
Total Capital Transactions - Institutional Class | | | 34,846,177 | | | | 25,016,878 | |
Net increase in net assets resulting from capital transactions | | | 30,284,848 | | | | 22,027,109 | |
Total Increase in Net Assets | | | 137,485 | | | | 11,175,372 | |
Net Assets | | | | | | | | |
Beginning of year | | | 194,648,314 | | | | 183,472,942 | |
End of year | | $ | 194,785,799 | | | $ | 194,648,314 | |
See accompanying notes which are an integral part of these financial statements.
Annual Report
11
Foundry Partners Fundamental Small Cap Value Fund |
Statements of Changes in Net Assets (Continued)
| | For the
Year Ended
October 31,
2020 | | | For the
Year Ended
October 31,
2019 | |
Share Transactions - Investor Class | | | | | | | | |
Shares sold | | | 75,419 | | | | 88,608 | |
Shares issued in reinvestment of distributions | | | 33,548 | | | | 112,231 | |
Shares redeemed | | | (395,063 | ) | | | (339,496 | ) |
Total Share Transactions - Investor Class | | | (286,096 | ) | | | (138,657 | ) |
Share Transactions - Institutional Class | | | | | | | | |
Shares sold | | | 4,355,311 | | | | 1,708,345 | |
Shares issued in reinvestment of distributions | | | 301,756 | | | | 714,167 | |
Shares redeemed | | | (2,299,683 | ) | | | (1,111,865 | ) |
Total Share Transactions - Institutional Class | | | 2,357,384 | | | | 1,310,647 | |
See accompanying notes which are an integral part of these financial statements.
Annual Report
12
Foundry Partners Fundamental Small Cap Value Fund |
Investor Class Financial Highlights
(For a share outstanding during each year)
| | For the
Year Ended
October 31,
2020 | | | For the
Year Ended
October 31,
2019 | | | For the
Year Ended
October 31,
2018 | | | For the
Year Ended
October 31,
2017 | | | For the
Year Ended
October 31,
2016 | |
Selected Per Share Data | | | | | | | | | | | | | | | | | | | | |
Net asset value, beginning of year | | $ | 20.55 | | | $ | 22.11 | | | $ | 24.32 | | | $ | 20.49 | | | $ | 21.41 | |
| | | | | | | | | | | | | | | | | | | | | |
Investment operations: | | | | | | | | | | | | | | | | | | | | |
Net investment income | | | 0.18 | | | | 0.25 | | | | 0.12 | | | | 0.05 | | | | 0.16 | |
Net realized and unrealized gain (loss) on investments | | | (3.15 | ) | | | (0.03 | ) | | | (1.52 | ) | | | 4.37 | | | | 1.32 | |
Total from investment operations | | | (2.97 | ) | | | 0.22 | | | | (1.40 | ) | | | 4.42 | | | | 1.48 | |
| | | | | | | | | | | | | | | | | | | | | |
Less distributions to shareholders from: | | | | | | | | | | | | | | | | | | | | |
Net investment income | | | (0.26 | ) | | | (0.08 | ) | | | (0.08 | ) | | | (0.13 | ) | | | (0.26 | ) |
Net realized gains | | | (0.47 | ) | | | (1.70 | ) | | | (0.73 | ) | | | (0.46 | ) | | | (2.14 | ) |
Total distributions | | | (0.73 | ) | | | (1.78 | ) | | | (0.81 | ) | | | (0.59 | ) | | | (2.40 | ) |
| | | | | | | | | | | | | | | | | | | | | |
Paid in capital from redemption fees | | | — | | | | — | | | | — | | | | — | | | | — | (a) |
| | | | | | | | | | | | | | | | | | | | | |
Net asset value, end of year | | $ | 16.85 | | | $ | 20.55 | | | $ | 22.11 | | | $ | 24.32 | | | $ | 20.49 | |
| | | | | | | | | | | | | | | | | | | | | |
Total Return (b) | | | (15.17 | )% | | | 2.28% | | | | (6.02 | )% | | | 21.68% | | | | 8.23% | |
| | | | | | | | | | | | | | | | | | | | | |
Ratios and Supplemental Data: | | | | | | | | | | | | | | | | | | | | |
Net assets, end of year (000 omitted) | | $ | 12,443 | | | $ | 21,048 | | | $ | 25,715 | | | $ | 41,786 | | | $ | 38,864 | |
Ratio of expenses to average net assets | | | 1.32% | | | | 1.32% | | | | 1.31% | | | | 1.36% | | | | 1.43% | |
Ratio of net investment income to average net assets | | | 0.90% | | | | 1.15% | | | | 0.49% | | | | 0.22% | | | | 0.84% | |
Portfolio turnover rate (c) | | | 60.56% | | | | 47.17% | | | | 34.41% | | | | 28.16% | | | | 12.85% | |
(a) | Rounds to less than $0.005 per share. |
(b) | Total return represents the rate that the investor would have earned or lost on an investment in the Fund, assuming reinvestment of dividends, and excludes any sales charges and redemption fees that were charged by the Fund prior to August 30, 2016. |
(c) | Portfolio turnover is calculated on the basis of the Fund as a whole without distinguishing among the classes of shares. |
See accompanying notes which are an integral part of these financial statements.
Annual Report
13
Foundry Partners Fundamental Small Cap Value Fund |
Institutional Class Financial Highlights
(For a share outstanding during each year)
| | For the
Year Ended
October 31,
2020 | | | For the
Year Ended
October 31,
2019 | | | For the
Year Ended
October 31,
2018 | | | For the
Year Ended
October 31,
2017 | | | For the
Year Ended
October 31,
2016 | |
Selected Per Share Data | | | | | | | | | | | | | | | | | | | | |
Net asset value, beginning of year | | $ | 20.66 | | | $ | 22.24 | | | $ | 24.46 | | | $ | 20.60 | | | $ | 21.52 | |
| | | | | | | | | | | | | | | | | | | | | |
Investment operations: | | | | | | | | | | | | | | | | | | | | |
Net investment income | | | 0.21 | | | | 0.27 | | | | 0.18 | | | | 0.11 | | | | 0.25 | |
Net realized and unrealized gain (loss) on investments | | | (3.14 | ) | | | — | (a) | | | (1.53 | ) | | | 4.39 | | | | 1.29 | |
Total from investment operations | | | (2.93 | ) | | | 0.27 | | | | (1.35 | ) | | | 4.50 | | | | 1.54 | |
| | | | | | | | | | | | | | | | | | | | | |
Less distributions to shareholders from: | | | | | | | | | | | | | | | | | | | | |
Net investment income | | | (0.32 | ) | | | (0.15 | ) | | | (0.14 | ) | | | (0.18 | ) | | | (0.32 | ) |
Net realized gains | | | (0.47 | ) | | | (1.70 | ) | | | (0.73 | ) | | | (0.46 | ) | | | (2.14 | ) |
Total distributions | | | (0.79 | ) | | | (1.85 | ) | | | (0.87 | ) | | | (0.64 | ) | | | (2.46 | ) |
| | | | | | | | | | | | | | | | | | | | | |
Net asset value, end of year | | $ | 16.94 | | | $ | 20.66 | | | $ | 22.24 | | | $ | 24.46 | | | $ | 20.60 | |
| | | | | | | | | | | | | | | | | | | | | |
Total Return (b) | | | (14.97 | )% | | | 2.55% | | | | (5.78 | )% | | | 22.01% | | | | 8.50% | |
| | | | | | | | | | | | | | | | | | | | | |
Ratios and Supplemental Data: | | | | | | | | | | | | | | | | | | | | |
Net assets, end of year (000 omitted) | | $ | 182,343 | | | $ | 173,600 | | | $ | 157,758 | | | $ | 151,757 | | | $ | 97,987 | |
Ratio of expenses to average net assets | | | 1.07% | | | | 1.07% | | | | 1.06% | | | | 1.11% | | | | 1.18% | |
Ratio of net investment income to average net assets | | | 1.16% | | | | 1.34% | | | | 0.76% | | | | 0.45% | | | | 1.05% | |
Portfolio turnover rate (c) | | | 60.56% | | | | 47.17% | | | | 34.41% | | | | 28.16% | | | | 12.85% | |
(a) | Rounds to less than $0.005 per share. |
(b) | Total return represents the rate that the investor would have earned or lost on an investment in the Fund, assuming reinvestment of dividends, and excludes any sales charges that were charged by the Fund prior to August 30, 2016. |
(c) | Portfolio turnover is calculated on the basis of the Fund as a whole without distinguishing among the classes of shares. |
See accompanying notes which are an integral part of these financial statements.
Annual Report
14
Foundry Partners Fundamental Small Cap Value Fund |
Notes to the Financial Statements
October 31, 2020
NOTE 1. ORGANIZATION
The Foundry Partners Fundamental Small Cap Value Fund (the “Fund”) is an open-end diversified series of Valued Advisers Trust (the “Trust”). The Trust is a management investment company established under the laws of Delaware by an Agreement and Declaration of Trust dated June 13, 2008 (the “Trust Agreement”). The Trust Agreement permits the Board of Trustees (the “Board”) to issue an unlimited number of shares of beneficial interest of separate series without par value. The Fund is one of a series of funds authorized by the Board. The Fund’s investment adviser is Foundry Partners, LLC (the “Adviser”). The investment objective of the Fund is long-term capital appreciation.
The Fund currently offers Investor Class shares and Institutional Class shares. Each share represents an equal proportionate interest in the assets and liabilities belonging to the applicable class of the Fund and is entitled to such dividends and distributions out of income belonging to the applicable class of the Fund as are declared by the Board. On matters that affect the Fund as a whole, each class has the same voting and other rights and preferences as any other class. On matters that affect only one class, only shareholders of that class may vote. The Fund may offer additional classes of shares in the future.
NOTE 2. SIGNIFICANT ACCOUNTING POLICIES
The Fund is an investment company and follows accounting and reporting guidance under Financial Accounting Standards Board Accounting Standards Codification (“ASC”) Topic 946, “Financial Services-Investment Companies.” The following is a summary of significant accounting policies followed by the Fund in the preparation of its financial statements. These policies are in conformity with generally accepted accounting principles in the United States of America (“GAAP”).
Estimates – The preparation of financial statements in conformity with GAAP requires management to make estimates and assumptions that affect the reported amounts of assets and liabilities and disclosure of contingent assets and liabilities at the date of the financial statements and the reported amounts of increases and decreases in net assets from operations during the reporting period. Actual results could differ from those estimates.
Federal Income Taxes – The Fund makes no provision for federal income or excise tax. The Fund has qualified and intends to qualify each year as a regulated investment company (“RIC”) under subchapter M of the Internal Revenue Code of 1986, as amended, by complying with the requirements applicable to RICs and by distributing substantially all of its taxable income. The Fund also intends to distribute sufficient net investment income and net realized capital gains, if any, so that it will not be subject to excise tax on undistributed income and gains. If the required amount of net investment income or gains is not distributed, the Fund could incur a tax expense.
Annual Report
15
Foundry Partners Fundamental Small Cap Value Fund |
Notes to the Financial Statements
October 31, 2020 (Continued)
As of and during the fiscal year ended October 31, 2020, the Fund did not have any liabilities for any unrecognized tax benefits. The Fund recognizes interest and penalties, if any, related to unrecognized tax benefits as income tax expense on the Statement of Operations when incurred. During the fiscal year ended October 31, 2020, the Fund did not incur any interest or penalties. Management of the Fund has reviewed tax positions taken in tax years that remain subject to examination by all major tax jurisdictions, including federal (i.e., the last three tax year ends and the interim tax period since then, as applicable). Management believes that there is no tax liability resulting from unrecognized tax benefits related to uncertain tax positions taken.
Expenses – Expenses incurred by the Trust that do not relate to a specific fund of the Trust are allocated to the individual funds based on each fund’s relative net assets or another appropriate basis (as determined by the Board). Expenses specifically attributable to any class are borne by that class. Income, realized gains and losses, unrealized appreciation and depreciation, and fund-wide expenses not allocated to a particular class shall be allocated to each class based on the net assets of that class in relation to the net assets of the entire fund.
Security Transactions and Related Income – The Fund follows industry practice and records security transactions on the trade date for financial reporting purposes. The specific identification method is used for determining gains or losses for financial statement and income tax purposes. Dividend income is recorded on the ex-dividend date. Non-cash income, if any, is recorded at the fair market value of the securities received. Withholding taxes on foreign dividends, if any, have been provided for in accordance with the Fund’s understanding of the applicable country’s tax rules and rates.
The Fund holds Real Estate Investment Trusts (“REITs”) which pay dividends to their shareholders based upon available funds from operations. It is possible for these dividends to exceed the REIT’s underlying taxable earnings and profits resulting in the excess portion of such dividends being designated as a return of capital. Distributions received from REITs that represent a return of capital or capital gains are recorded as a reduction of the cost of the REITs or as a realized gain, respectively.
Dividends and Distributions – The Fund intends to distribute its net investment income and net realized long-term and short-term capital gains, if any, at least annually. Dividends and distributions to shareholders, which are determined in accordance with income tax regulations, are recorded on the ex-dividend date. The treatment for financial reporting purposes of distributions made to shareholders during the period from net investment income or net realized capital gains may differ from their ultimate treatment for federal income tax purposes. These differences are caused primarily by differences in the timing of the recognition of certain components of income, expense or realized capital gain for federal income tax purposes. Where such differences are permanent in nature, they are reclassified among the components of net assets based on their ultimate characterization for federal income tax purposes. Any such reclassifications will have no effect on net assets, results of operations or net asset value (“NAV”) per share of the Fund.
Annual Report
16
For the fiscal year ended October 31, 2020, the Fund made the following reclassifications to increase (decrease) the components of net assets:
Paid-In
Capital | Accumulated
Earnings
(Deficit) |
$ (49,131) | $ 49,131 |
Share Valuation – The NAV is calculated each day the New York Stock Exchange is open by dividing the total value of the Fund’s assets, less liabilities, by the number of shares outstanding for the Fund.
NOTE 3. SECURITIES VALUATION AND FAIR VALUE MEASUREMENTS
The Fund values its portfolio securities at fair value as of the close of regular trading on the New York Stock Exchange (the “NYSE”) (normally 4:00 p.m. Eastern time) on each business day the NYSE is open for business. Fair value is defined as the price that the Fund would receive upon selling an investment in a timely transaction to an independent buyer in the principal or most advantageous market of the investment. GAAP establishes a three-tier hierarchy to maximize the use of observable market data and minimize the use of unobservable inputs and to establish classification of fair value measurements for disclosure purposes.
Inputs refer broadly to the assumptions that market participants would use in pricing the asset or liability, including assumptions about risk (the risk inherent in a particular valuation technique used to measure fair value including a pricing model and/or the risk inherent in the inputs to the valuation technique). Inputs may be observable or unobservable. Observable inputs are inputs that reflect the assumptions market participants would use in pricing the asset or liability developed based on market data obtained and available from sources independent of the reporting entity. Unobservable inputs are inputs that reflect the reporting entity’s own assumptions about the assumptions market participants would use in pricing the asset or liability developed based on the best information available in the circumstances.
Various inputs are used in determining the value of the Fund’s investments. These inputs are summarized in the three broad levels listed below.
● | Level 1 – unadjusted quoted prices in active markets for identical investments and/or registered investment companies where the value per share is determined and published and is the basis for current transactions for identical assets or liabilities at the valuation date |
● | Level 2 – other significant observable inputs (including, but not limited to, quoted prices for an identical security in an inactive market, quoted prices for similar securities, interest rates, prepayment speeds, credit risk, etc.) |
Annual Report
17
Foundry Partners Fundamental Small Cap Value Fund |
Notes to the Financial Statements
October 31, 2020 (Continued)
● | Level 3 – significant unobservable inputs (including the Fund’s own assumptions in determining fair value of investments based on the best information available) |
The inputs used to measure fair value may fall into different levels of the fair value hierarchy. In such cases, for disclosure purposes, the level in the fair value hierarchy which is reported is determined based on the lowest level input that is significant to the fair value measurement in its entirety.
Equity securities that are traded on any stock exchange are generally valued at the last quoted sale price on the security’s primary exchange. Lacking a last sale price, an exchange-traded security is generally valued at its last bid price. Securities traded in the NASDAQ over-the-counter market are generally valued at the NASDAQ Official Closing Price. When using the market quotations and when the market is considered active, the security is classified as a Level 1 security. In the event that market quotations are not readily available or are considered unreliable due to market or other events, the Fund values its securities and other assets at fair value in accordance with policies established by and under the general supervision of the Board. Under these policies, the securities will be classified as Level 2 or 3 within the fair value hierarchy, depending on the inputs used.
Investments in mutual funds, including money market mutual funds, are generally priced at the ending NAV. These securities are categorized as Level 1 securities.
In accordance with the Trust’s valuation policies, the Adviser is required to consider all appropriate factors relevant to the value of securities for which it has determined other pricing sources are not available or reliable as described above. No single method exists for determining fair value, because fair value depends upon the circumstances of each individual case. As a general principle, the current fair value of a security being valued by the Adviser would be the amount that the Fund might reasonably expect to receive upon the current sale. Methods that are in accordance with this principle may, for example, be based on (i) a multiple of earnings; (ii) a discount from market prices of a similar freely traded security (including a derivative security or a basket of securities traded on other markets, exchanges or among dealers); or (iii) yield to maturity with respect to debt issues, or a combination of these and other methods. Fair-value pricing is permitted if, in the Adviser’s opinion, the validity of market quotations appears to be questionable based on factors such as evidence of a thin market in the security based on a small number of quotations, a significant event occurs after the close of a market but before the Fund’s NAV calculation that may affect a security’s value, or the Adviser is aware of any other data that calls into question the reliability of market quotations.
Annual Report
18
The following is a summary of the inputs used to value the Fund’s investments as of October 31, 2020:
Valuation Inputs |
Assets | | Level 1 | | | Level 2 | | | Level 3 | | | Total | |
Common Stocks (a) | | $ | 189,775,407 | | | $ | — | | | $ | — | | | $ | 189,775,407 | |
Preferred Stocks (a) | | | 385,606 | | | | — | | | | — | | | | 385,606 | |
Money Market Funds | | | 3,782,327 | | | | — | | | | — | | | | 3,782,327 | |
Total | | $ | 193,943,340 | | | $ | — | | | $ | — | | | $ | 193,943,340 | |
(a) | Refer to Schedule of Investments for sector classifications. |
The Fund did not hold any investments at the end of the reporting period for which significant unobservable inputs (Level 3) were used in determining fair value; therefore, no reconciliation of Level 3 securities is included for this reporting period.
NOTE 4. FEES AND OTHER TRANSACTIONS WITH AFFILIATES
Under the terms of the management agreement between the Trust and the Adviser for the Fund, the Adviser manages the Fund’s investments subject to oversight of the Board. As compensation for its management services, the Fund is obligated to pay the Adviser a fee computed and accrued daily and paid monthly at an annual rate of 0.85% of the average daily net assets of the Fund. For the fiscal year ended October 31, 2020, the Adviser earned a fee of $1,611,578 from the Fund. At October 31, 2020, the Fund owed the Adviser $146,219.
The Adviser has contractually agreed to waive its management fee and/or reimburse certain operating expenses, but only to the extent necessary so that the Fund’s net expenses, excluding brokerage fees and commissions, borrowing costs (such as interest expense and dividends on securities sold short), taxes, distribution and service (12b-1) fees, extraordinary expenses, and any indirect expenses (such as fees and expenses of acquired funds), do not exceed an annual rate of 1.25% of the average daily net assets of the Fund.
Each fee waiver or expense reimbursement by the Adviser is subject to repayment by the Fund within the three years following the date in which the fee waiver or expense reimbursement occurred, provided that the Fund is able to make the repayment without exceeding the expense limitation that is in effect at the time of the repayment, and the expense limitation that is in effect at the time of the fee waiver or expense reimbursement. As of October 31, 2020, the Adviser has made no previous waivers that may be recouped. The contractual agreement is in effect through February 28, 2021. The expense cap may not be terminated prior to this date except by mutual consent of the Adviser and the Board. For the fiscal year ended October 31, 2020, the Adviser did not waive any fees from the Fund.
Annual Report
19
Foundry Partners Fundamental Small Cap Value Fund |
Notes to the Financial Statements
October 31, 2020 (Continued)
The Trust retains Ultimus Fund Solutions, LLC (“Ultimus” or the “Administrator”), to provide the Fund with administration and compliance, including a chief compliance officer, fund accounting and transfer agent services, including all regulatory reporting. For the fiscal year ended October 31, 2020, the Administrator earned fees of $136,061 for administrative and compliance services, $54,423 for fund accounting services, and $23,000 for transfer agent services. At October 31, 2020, the Administrator was owed $18,383 for administrative services.
The officers and one trustee of the Trust are members of management and/or employees of the Administrator and are not paid by the Trust for services to the Fund. Ultimus Fund Distributors, LLC (the “Distributor”) acts as the distributor of the Fund’s shares. The Distributor is a wholly-owned subsidiary of Ultimus.
The Fund has adopted a Distribution Plan (the “Plan”) pursuant to Rule 12b-1 under the Investment Company Act of 1940, as amended (the “1940 Act”). The Plan provides that the Fund will pay the Distributor or any registered securities dealer, financial institution or any other person (a “Recipient”) a fee aggregating at a rate of 0.25% of the average daily net assets of the Investor Class shares in connection with the promotion and distribution of the Fund’s shares or the provision of personal services to shareholders, including, but not necessarily limited to, advertising, compensation to underwriters, dealers and selling personnel; the printing and mailing of prospectuses to other than current Fund shareholders; the printing and mailing of sales literature; and servicing shareholder accounts. The Fund or the Adviser may pay all or a portion of these fees to any Recipient who renders assistance in distributing or promoting the sale of shares, or who provides certain shareholder services, pursuant to a written agreement. The Plan is a compensation plan, which means that compensation is paid regardless of 12b-1 expenses actually incurred. It is anticipated that the Plan will benefit shareholders because an effective sales program typically is necessary in order for the Fund to reach and maintain a sufficient size to achieve efficiently its investment objectives and to realize economies of scale. For the fiscal year ended October 31, 2020, the Investor Class shares 12b-1 expense incurred by the Fund was $38,851. The Fund owed $2,775 for Investor Class shares 12b-1 fees as of October 31, 2020.
NOTE 5. PURCHASES AND SALES OF SECURITIES
For the fiscal year ended October 31, 2020, purchases and sales of investment securities, other than short-term investments, were $144,244,155 and $111,112,762, respectively.
There were no purchases or sales of long-term U.S. government obligations during the fiscal year ended October 31, 2020.
Annual Report
20
NOTE 6. FEDERAL TAX INFORMATION
At October 31, 2020, the net unrealized appreciation (depreciation) and tax cost of investments for tax purposes was as follows:
Gross unrealized appreciation | | $ | 16,943,832 | |
Gross unrealized depreciation | | | (19,973,337 | ) |
Net unrealized depreciation on investments | | $ | (3,029,505 | ) |
Tax cost of investments | | $ | 196,972,845 | |
At October 31, 2020, the difference between book basis and tax basis unrealized appreciation (depreciation) is attributable to the tax deferral of losses on wash sales and partnership basis adjustments.
At October 31, 2020, the components of accumulated earnings (deficit) on a tax basis were as follows:
Undistributed ordinary income | | $ | 1,653,485 | |
Accumulated capital and other losses | | | (17,181,651 | ) |
Unrealized depreciation on investments | | | (3,029,505 | ) |
Total accumulated earnings (deficit) | | $ | (18,557,671 | ) |
The tax character of distributions paid for the fiscal years ended October 31, 2020 and October 31, 2019 were as follows:
| | 2020 | | | 2019 | |
Distributions paid from: | | | | | | | | |
Ordinary income(a) | | $ | 3,057,636 | | | $ | 1,151,123 | |
Long-term capital gains | | | 4,335,557 | | | | 14,101,912 | |
Total taxable distributions | | $ | 7,393,193 | | | $ | 15,253,035 | |
Total distributions paid | | $ | 7,393,193 | | | $ | 15,253,035 | |
(a) Short-term capital gain distributions are treated as ordinary income for tax purposes.
As of October 31, 2020, the Fund had available for tax purposes unused capital loss carryforwards of $2,174,936 and $15,006,715 of short-term and long-term capital losses with no expiration, which is available to offset against future taxable net capital gains. To the extent that these carryforwards are used to offset future gains, it is probable that the amount offset will not be distributed to shareholders.
Annual Report
21
Foundry Partners Fundamental Small Cap Value Fund |
Notes to the Financial Statements
October 31, 2020 (Continued)
NOTE 7. COMMITMENTS AND CONTINGENCIES
The Trust indemnifies its officers and Trustees for certain liabilities that may arise from their performance of their duties to the Trust or the Fund. Additionally, in the normal course of business, the Trust enters into contracts that contain a variety of representations and warranties which provide general indemnifications. The Trust’s maximum exposure under these arrangements is unknown, as this would involve future claims that may be made against the Trust that have not yet occurred.
NOTE 8. OTHER MATTERS
In April 2014, New York based fashion company The Jones Group went private through a leveraged buyout (the “LBO”). In connection with the LBO, Jones Group paid out roughly $1.2 billion to its shareholders to buy back its outstanding stock at $15 per share. Four years later, Nine West Holdings, the company that emerged from the LBO, filed for bankruptcy under Chapter 11. After Nine West’s Chapter 11 plan was confirmed, the Trustee of a Litigation Trust formed under the plan, together with the Indenture Trustee for certain notes issued by Jones Group/Nine West, commenced a series of lawsuits against the former Jones Group shareholders who tendered their shares in the LBO, including the Fund. The plaintiffs in these suits seek to unwind the stock repurchase transactions that were part of the LBO on the grounds that they constitute fraudulent conveyances under the Bankruptcy Code and state law and to recover the amounts paid to the former Jones Group shareholders. Plaintiffs allege that the Fund received $1,209,420 for its shares in the LBO and seek to claw back those funds as part of the lawsuit.
On August 27, 2020, the Southern District of New York dismissed all fraudulent conveyance and unjust enrichment claims with respect to the payments made to stockholders in connection with the LBO, including the payments made to the Fund, on the basis that the transaction qualified for protection under the safe harbor provided for in Section 546(e) of the Bankruptcy Code. As part of the ruling, all claims against the Fund were dismissed and judgment was entered in its favor. The Trustee has appealed the ruling, and the matter is now pending before the United States Court of Appeals for the Second Circuit.
NOTE 9. SUBSEQUENT EVENTS
Management of the Fund has evaluated the need for disclosures and/or adjustments resulting from subsequent events through the date at which these financial statements were issued. Based upon this evaluation, management has determined there were no items requiring adjustment of the financial statements or additional disclosure.
Annual Report
22
NOTE 10. LIQUIDITY RISK MANAGEMENT PROGRAM (UNAUDITED)
Valued Advisers Trust has adopted and implemented a written liquidity risk management program as required by Rule 22e-4 (the “Liquidity Rule”) under the 1940 Act. The program is reasonably designed to assess and manage the Fund’s liquidity risk, taking into consideration, among other factors, the Fund’s investment strategy and the liquidity of its portfolio investments during normal and reasonably foreseeable stressed conditions; its short and long-term cash flow projections; and its cash holdings and access to other funding sources. The Board of Trustees approved the appointment of a Liquidity Administrator Committee, which includes representatives from Foundry Partners, LLC, the Fund’s investment adviser, and Ultimus Fund Solutions, LLC, the Fund’s Administrator. The Liquidity Administrator Committee is responsible for the program’s administration and oversight and for reporting to the Board on at least an annual basis regarding the program’s operation and effectiveness. The Liquidity Administrator Committee updated its assessment of the Fund’s liquidity risk profile, considering additional data gathered in the 12 months ended May 31, 2020 and the adequacy and effectiveness of the liquidity risk management program’s operations since its inception on June 1, 2019 (the “Review Period”) in order to prepare a written report for the Board of Trustees (the “Report”) for consideration at its meeting held on September 9, 2020. The Report noted that during the Review Period the Fund did not experience unusual stress or disruption to its operations related to purchase and redemption activity. It further noted that during the Review Period the Fund held adequate levels of cash and highly liquid investments to meet shareholder redemption activities in accordance with applicable requirements. The Report concluded that (i) the Trust’s liquidity risk management program is reasonably designed to prevent violations of the Liquidity Rule and (ii) the Trust’s liquidity risk management program had been effectively implemented during the Review Period.
Annual Report
23
Report of Independent Registered Public Accounting Firm |
To the Shareholders of Foundry Partners Fundamental Small Cap Value Fund and
Board of Trustees of Valued Advisers Trust
Opinion on the Financial Statements
We have audited the accompanying statement of assets and liabilities, including the schedule of investments, of Foundry Partners Fundamental Small Cap Value Fund (the “Fund”), a series of Valued Advisers Trust, as of October 31, 2020, the related statement of operations for the year then ended, the statements of changes in net assets for each of the two years in the period then ended, including the related notes, and the financial highlights for each of the five years in the period then ended (collectively referred to as the “financial statements”). In our opinion, the financial statements present fairly, in all material respects, the financial position of the Fund as of October 31, 2020, the results of its operations for the year then ended, the changes in its net assets for each of the two years in the period then ended, and the financial highlights for each of the five years in the period then ended, in conformity with accounting principles generally accepted in the United States of America.
Basis for Opinion
These financial statements are the responsibility of the Fund’s management. Our responsibility is to express an opinion on the Fund’s financial statements based on our audits. We are a public accounting firm registered with the Public Company Accounting Oversight Board (United States) (“PCAOB”) and are required to be independent with respect to the Fund in accordance with the U.S. federal securities laws and the applicable rules and regulations of the Securities and Exchange Commission and the PCAOB.
We conducted our audits in accordance with the standards of the PCAOB. Those standards require that we plan and perform the audit to obtain reasonable assurance about whether the financial statements are free of material misstatement, whether due to error or fraud.
Our audits included performing procedures to assess the risks of material misstatement of the financial statements, whether due to error or fraud, and performing procedures that respond to those risks. Such procedures included examining, on a test basis, evidence regarding the amounts and disclosures in the financial statements. Our procedures included confirmation of securities owned as of October 31, 2020, by correspondence with the custodian and brokers. Our audits also included evaluating the accounting principles used and significant estimates made by management, as well as evaluating the overall presentation of the financial statements. We believe that our audits provide a reasonable basis for our opinion.
We have served as the Fund’s auditor since 2006.
COHEN & COMPANY, LTD.
Cleveland, Ohio
December 23, 2020
Annual Report
24
Summary of Fund Expenses (Unaudited) |
As a shareholder of the Fund, you incur two types of costs: (1) transaction and (2) ongoing costs, including management fees and other Fund expenses. These examples are intended to help you understand your ongoing costs (in dollars) of investing in the Fund and to compare these costs with the ongoing costs of investing in other mutual funds. The example is based on an investment of $1,000 invested at the beginning of the period and held for the entire period from May 1, 2020 through October 31, 2020.
Actual Expenses
The first line of the table for each class provides information about actual account values and actual expenses. You may use the information in these lines, together with the amount you invested, to estimate the expenses that you paid over the period. Simply divide your account value by $1,000 (for example, an $8,600 account value divided by $1,000 = 8.60), then multiply the result by the number in the first line under the heading “Expenses Paid During Period” to estimate the expenses you paid on your account during this period.
Hypothetical Example for Comparison Purposes
The second line of the table for each class provides information about hypothetical account values and hypothetical expenses based on the Fund’s actual expense ratios and an assumed rate of return of 5% per year before expenses, which is not the Fund’s actual return. The hypothetical account values and expenses may not be used to estimate the actual ending account balances or expenses you paid for the period. You may use this information to compare the ongoing costs of investing in the Fund and other funds. To do so, compare this 5% hypothetical example with the 5% hypothetical examples that appear in the shareholder reports of other funds.
Expenses shown in the table are meant to highlight your ongoing costs only and do not reflect any transactional costs. Therefore, the second line of the table for each class is useful in comparing ongoing costs only and will not help you determine the relative total costs of owning different funds. In addition, if transaction costs were included, your costs would have been higher.
|
| Beginning
Account
Value
May 1, 2020 | Ending
Account
Value
October 31, 2020 | Expenses
Paid
During
Period(a) | Annualized
Expense
Ratio |
Foundry Partners Fundamental Small Cap Value Fund |
Investor Class | Actual | $1,000.00 | $1,092.70 | $6.95 | 1.32% |
| | Hypothetical (b) | $1,000.00 | $1,018.50 | $6.70 | 1.32% |
Institutional Class | Actual | $1,000.00 | $1,094.30 | $5.63 | 1.07% |
| | Hypothetical (b) | $1,000.00 | $1,019.76 | $5.43 | 1.07% |
(a) | Expenses are equal to the Fund’s annualized expense ratios, multiplied by the average account value over the period, multiplied by 184/366 (to reflect the one-half year period). |
(b) | Hypothetical assumes 5% annual return before expenses. |
Annual Report
25
Additional Federal Income Tax Information (Unaudited) |
The Form 1099-DIV you receive in January 2021 will show the tax status of all distributions paid to your account in calendar year 2020. Shareholders are advised to consult their own tax adviser with respect to the tax consequences of their investment in the Fund. As required by the Internal Revenue Code and/or regulations, shareholders must be notified regarding the status of qualified dividend income for individuals and the dividends received deduction for corporations.
Qualified Dividend Income. The Fund designates approximately 100% or up to the maximum amount of such dividends allowable pursuant to the Internal Revenue Code, as qualified dividend income eligible for a reduced tax rate.
Qualified Business Income. The Fund designates approximately 0% of its ordinary income dividends, or up to the maximum amount of such dividends allowable pursuant to the Internal Revenue Code, as qualified business income.
Dividends Received Deduction. Corporate shareholders are generally entitled to take the dividends received deduction on the portion of the Fund’s dividend distribution that qualifies under tax law. For the Fund’s calendar year 2020 ordinary income dividends, 100% qualifies for the corporate dividends received deduction.
For the year ended October 31, 2020, the Fund designated $4,335,557 as long-term capital gain distributions.
Annual Report
26
Trustees and Officers (Unaudited) |
The Board of Trustees supervises the business activities of the Trust. Each Trustee serves as a trustee until termination of the Trust unless the Trustee dies, resigns, retires or is removed.
The following table provides information regarding each of the Independent Trustees.
Name, Address*, Age,
Position with Trust**,
Term of Position with Trust | Principal Occupation During
Past 5 Years and Other Directorships | Other Directorships |
Ira P. Cohen, 61
Independent Trustee Since June 2010 | Current: Independent financial services consultant (since February 2005); Executive Vice President of Asset Management Services, Recognos Financial (since August 2015). | Trustee and Audit Committee Chairman, Griffin Institutional Access Credit Fund (since January 2017); Trustee and Audit Committee Chairman, Griffin Institutional Real Estate Access Fund (since May 2014); Trustee, Angel Oak Funds Trust (since October 2014) (4 portfolios); Trustee, Chairman, and Nominating and Governance Committee Chairman, Angel Oak Strategic Credit Fund (since December 2017), Trustee and Chairman, Angel Oak Financial Strategies Income Term Trust (since May 2019). |
Andrea N. Mullins, 53
Independent Trustee Since December 2013 Chairperson since March 2017 | Current: Private investor; Independent Contractor, SWM Advisors (since April 2014). | Trustee, Angel Oak Funds Trust (since February 2019) (4 portfolios); Trustee, Angel Oak Strategic Credit Fund (since February 2019), Trustee, Angel Oak Financial Strategies Income Term Trust (since May 2019). |
* | The address for each Trustee and officer is 225 Pictoria Drive, Suite 450, Cincinnati, Ohio 45246. |
** | As of the date of this report, the Trust consists of 12 series. |
Annual Report
27
Trustees and Officers (Unaudited) (Continued) |
The following table provides information regarding the Trustee who is considered an “interested person” of the Trust, as that term is defined under the 1940 Act. Based on the experience of the Trustee, the Trust concluded that the individual described below should serve as a Trustee.
Name, Address*, Age,
Position with Trust**,
Term of Position with Trust | Principal Occupation During
Past 5 Years | Other Directorships |
Mark J. Seger***, 58
Trustee Since March 2017 | Current: Vice Chairman and Co-Founder, Ultimus Fund Solutions, LLC and its subsidiaries (since 1999). | None. |
* | The address for each Trustee and officer is 225 Pictoria Drive, Suite 450, Cincinnati, Ohio 45246. |
** | As of the date of this report, the Trust consists of 12 series. |
*** | Mr. Seger is considered an “interested person” of the Trust because of his relationship with the Trust’s administrator, transfer agent, and distributor. |
The following table provides information regarding the Officers of the Trust:
Name, Address*, Age, Position with Trust**,
Term of Position with Trust | Principal Occupation During
Past 5 Years | Other Directorships |
Adam T. Kornegay, 35
Principal Executive Officer and President Since April 2018 | Current: Vice President, Business Development Director, Ultimus Fund Solutions, LLC (since June 2018). | None. |
Kevin J. Patton, 50
Chief Compliance Officer Since March 2020 | Current: Assistant Vice President, Compliance Officer, Ultimus Fund Solutions, LLC (since January 2020). Previous: Partner and Chief Compliance Officer, Renaissance Investment Management (August 2005 to January 2020). | None. |
Carol J. Highsmith, 56
Vice President Since August 2008 Secretary Since March 2014 | Current: Vice President, Ultimus Fund Solutions, LLC (since December 2015). Previous: Employed in various positions with Huntington Asset Services, Inc. (n/k/a Ultimus Asset Services, LLC) (November 1994 to December 2015), most recently Vice President of Legal Administration (2005 to December 2015). | None. |
Annual Report
28
Name, Address*, Age, Position with Trust**,
Term of Position with Trust | Principal Occupation During
Past 5 Years | Other Directorships |
Matthew J. Miller, 44
Vice President Since December 2011 | Current: Assistant Vice President, Relationship Management, Ultimus Fund Solutions, LLC (since December 2015). Previous: Employed in various positions with Huntington Asset Services, Inc. (n/k/a Ultimus Asset Services, LLC) (July 1998 to December 2015), most recently Vice President of Relationship Management (2005 to December 2015). | None. |
Gregory T. Knoth, 50
Principal Financial Officer and Treasurer Since April 2019 | Current: Vice President, Mutual Fund Controller, Ultimus Fund Solutions, LLC (since December 2015). Previous: Vice President and Manager of Fund Accounting, Huntington Asset Services, Inc. (n/k/a Ultimus Asset Services, LLC) (June 2013 to December 2015). | None. |
Stephen L. Preston, 54
AML Officer since June 2017 | Current: Chief Compliance Officer of Ultimus Fund Distributors, LLC (since June 2011). Previous: Chief Compliance Officer, Ultimus Fund Solutions, LLC (June 2011 to August 2019); Chief Compliance Officer, Unified Financial Securities, LLC (April 2018 to December 2019). | None. |
* | The address for each Trustee and officer is 225 Pictoria Drive, Suite 450, Cincinnati, Ohio 45246. |
** | As of the date of this report, the Trust consists of 12 series. |
Other Information (Unaudited)
The Fund’s Statement of Additional Information (“SAI”) includes additional information about the trustees and is available without charge, upon request. You may call toll-free at (800) 247-1014 to request a copy of the SAI or to make shareholder inquiries.
Annual Report
29
Investment Advisory Agreement Approval (Unaudited) |
At a meeting held on June 2, 2020, the Board of Trustees (the “Board”) considered the renewal of the Investment Advisory Agreement (the “Foundry Agreement”) between Valued Advisers Trust (the “Trust”) and Foundry Partners, LLC (“Foundry”) with respect to the Foundry Partners Fundamental Small Cap Value Fund (the “Foundry Fund”). Foundry provided written information to the Board to assist the Board in its considerations.
The Board discussed the contractual arrangements between Foundry and the Trust for the Foundry Fund. They reflected upon the Board’s prior experience with Foundry in managing the Foundry Fund, as well as their earlier discussions with Foundry.
Counsel then directed the Trustees to a memorandum from his firm that summarized, among other things, the fiduciary duties and responsibilities of the Board in reviewing and approving the Foundry Agreement. In assessing the factors and reaching its decision, the Board took into consideration information furnished by Foundry and the Trust’s other service providers for the Board’s review and consideration throughout the year, as well as information specifically prepared or presented in connection with the renewal process, including: (i) reports regarding the services and support provided to the Foundry Fund by Foundry; (ii) quarterly assessments of the investment performance of the Foundry Fund; (iii) commentary on the reasons for the performance; (iv) presentations by Foundry addressing its investment philosophy, investment strategy, personnel, and operations of Foundry; (v) compliance and audit reports concerning the Foundry Fund and Foundry; (vi) disclosure information contained in the registration statement of the Trust for the Foundry Fund and Foundry’s Form ADV; and (vii) a memorandum from counsel, that summarized the fiduciary duties and responsibilities of the Board in reviewing and approving the Foundry Agreement. The Board also requested and received materials including, without limitation: (a) documents containing information about Foundry, including its financial information; a description of its personnel and the services it provides to the Foundry Fund; information on Foundry’s investment advice and performance; summaries of the Foundry Fund’s expenses, compliance program, current legal matters, and other general information; (b) comparative expense and performance information for other mutual funds with strategies similar to the Foundry Fund; and (c) the benefits to be realized by Foundry from its relationship with the Foundry Fund. The Board did not identify any particular information that was most relevant to its consideration to approve the Foundry Agreement and each Trustee may have afforded different weight to the various factors.
| | 1. | The nature, extent, and quality of the services to be provided by Foundry. The Board considered Foundry’s responsibilities under the Foundry Agreement. The Trustees considered the services being provided by Foundry to the Foundry Fund including, without limitation: the quality of its investment advisory services (including research and recommendations with respect to portfolio securities), its process for formulating investment recommendations and assuring compliance with the Foundry Fund’s investment objectives and limitations, its coordination of services for the Foundry Fund among the Foundry Fund’s service providers, and its efforts to promote the Foundry Fund and grow its assets. The Trustees considered Foundry’s continuity of, and commitment to retain qualified personnel, commitment to maintain and enhance its resources and systems, and options that allow the Foundry Fund to maintain its goals, and Foundry’s continued cooperation with the Board and counsel for the Foundry Fund. The Trustees |
Annual Report
30
considered Foundry’s personnel, including their education and experience. After considering the foregoing information and further information in the Meeting materials provided by Foundry, the Board concluded that, in light of all the facts and circumstances, the nature, extent, and quality of the services provided by Foundry were satisfactory and adequate for the Foundry Fund.
| | 2. | Investment Performance of the Foundry Fund and Foundry. The Trustees compared the performance of the Foundry Fund with the performance of funds with similar objectives managed by other investment advisers, with aggregated peer group data, as well as with the performance of the Foundry Fund’s benchmark. The Trustees also considered the consistency of Foundry’s management of the Foundry Fund with its investment objectives, strategies, and limitations. The Trustees acknowledged that Foundry has served as adviser to the Foundry Fund only since June of 2016, but one portfolio manager has managed the portfolio since 2006 and the other since 2010. The Trustees noted that the Foundry Fund had underperformed as compared to its benchmark for the one-year, three-year and five-year periods ended March 31, 2020, and outperformed the benchmark for the period since inception of the Foundry Fund. They also noted that the Foundry Fund had performed better than the average and median of its custom Morningstar category for the one-year period ended March 31, 2020, but below the average and median for the three-year, five-year, and ten-year periods ended March 31, 2020. In comparing the Foundry Fund’s performance to that of its custom peer group, the Board noted that the Foundry Fund performed above the median for the one-year period ended March 31, 2020, and below the median for the three-year, five-year, and since inception periods. The Board reviewed the performance of Foundry in managing separate accounts with investment strategies similar to that of the Foundry Fund and observed that the Foundry Fund’s performance was very comparable. The Trustees took into consideration discussions with representatives of Foundry during the prior year regarding the reasons for the performance of the Foundry Fund. After further reviewing and discussing these and other relevant factors, the Board concluded, in light of all the facts and circumstances, that the investment performance of the Foundry Fund and Foundry was satisfactory. |
| | 3. | The costs of the services to be provided and profits to be realized by Foundry from the relationship with the Foundry Fund. The Trustees considered: (1) Foundry’s financial condition; (2) the asset level of the Foundry Fund; (3) the overall expenses of the Foundry Fund; and (4) the nature and frequency of management fee payments. The Trustees reviewed information provided by Foundry regarding its profits associated with managing the Foundry Fund, noting that Foundry is not currently waiving any of its management fee. The Trustees also considered potential benefits for Foundry in managing the Foundry Fund. The Trustees then compared the fees and expenses of the Foundry Fund (including the management fee) to other comparable mutual funds. The Trustees noted that the Foundry Fund’s management fee was higher than the average and median of its peer group, and that the net expense ratio was higher than the peer group average and median. They noted that the Foundry Fund’s management fee was higher than the average and median of funds in its custom Morningstar category, and that the Foundry Fund’s net |
Annual Report
31
Investment Advisory Agreement Approval (Unaudited) (Continued) |
expense ratio was also higher than the average and median. The Board noted that the fees that Foundry assesses for separate account clients that have strategies similar to that of the Foundry Fund could be comparable or lower and they expressed the view that the reasons for such differences were acceptable and reasonable. Based on the foregoing, the Board concluded that the fees to be paid to Foundry by the Foundry Fund and the profits to be realized by Foundry, in light of all the facts and circumstances, were fair and reasonable in relation to the nature and quality of the services provided by Foundry.
| | 4. | The extent to which economies of scale would be realized as the Foundry Fund grows and whether advisory fee levels reflect these economies of scale for the benefit of the Foundry Fund’s investors. The Board considered the Foundry Fund’s fee arrangements with Foundry. The Board considered that while the management fee remained the same at all asset levels, the Foundry Fund’s shareholders could experience benefits from the Foundry Fund’s expense limitation arrangement if asset levels fell and/or expenses increased. The Trustees noted that although the Foundry Fund’s expenses currently fell below the cap set by the arrangement, the shareholders would continue to benefit from economies of scale under the Foundry Fund’s arrangements with other service providers to the Foundry Fund, and the Trustees attributed this benefit, in part, to the direct and indirect efforts of Foundry to ensure that a cost structure was in place that was beneficial for the Foundry Fund as it grew. In light of its ongoing consideration of the Foundry Fund’s asset and fees levels and expectations for growth, the Board determined that the Foundry Fund’s fee arrangements, in light of all the facts and circumstances, were fair and reasonable in relation to the nature and quality of the services provided by Foundry. |
| | 5. | Possible conflicts of interest and benefits to Foundry. In considering Foundry’s practices regarding conflicts of interest, the Trustees evaluated the potential for conflicts of interest and considered such matters as the experience and ability of the advisory personnel assigned to the Foundry Fund; the basis of decisions to buy or sell securities for the Foundry Fund and/or Foundry’s other accounts; and the substance and administration of Foundry’s code of ethics. The Trustees also considered disclosure in the registration statement of the Trust relating to Foundry’s potential conflicts of interest. The Trustees noted that Foundry may utilize soft dollars and the Trustees noted Foundry’s policies and processes for managing the conflicts of interest that could arise from soft dollar arrangements. The Trustees noted other potential benefits to Foundry, including the fact that the Foundry Fund could provide an attractive vehicle for smaller accounts, which may increase the total assets under management by Foundry. Based on the foregoing, the Board determined that the standards and practices of Foundry relating to the identification and mitigation of potential conflicts of interest and the benefits to be realized by Foundry in managing the Foundry Fund were satisfactory. |
After additional consideration of the factors delineated in the memorandum provided by counsel and further discussion among the Board members, the Board determined to approve the continuation of the Foundry Agreement between the Trust and Foundry.
Annual Report
32
Valued Advisers Trust Privacy Policy |
FACTS | WHAT DOES Foundry Partners Fundamental Small Cap Value Fund (the “Fund”) DO WITH YOUR PERSONAL INFORMATION? |
| | |
Why? | Financial companies choose how they share your personal information. Federal law gives consumers the right to limit some but not all sharing. Federal law also requires us to tell you how we collect, share, and protect your personal information. Please read this notice carefully to understand what we do. |
| | |
What? | The types of personal information we collect and share depend on the product or service you have with us. This information can include: ■ Social Security number ■ account balances and account transactions ■ transaction or loss history and purchase history ■ checking account information and wire transfer instructions When you are no longer our customer, we continue to share your information as described in this notice. |
| | |
How? | All financial companies need to share customers’ personal information to run their everyday business. In the section below, we list the reasons financial companies can share their customers’ personal information; the reasons the Fund chooses to share; and whether you can limit this sharing. |
| | |
Reasons we can share your personal information | Does the Fund share? |
For our everyday business purposes—
such as to process your transactions, maintain your account(s), respond to court orders and legal investigations, or report to credit bureaus | Yes |
For our marketing purposes—
to offer our products and services to you | No |
For joint marketing with other financial companies | No |
For our affiliates’ everyday business purposes—
information about your transactions and experiences | No |
For our affiliates’ everyday business purposes—
information about your creditworthiness | No |
For nonaffiliates to market to you | No |
| | |
Questions? | Call (800) 247-1014 |
Who we are |
Who is providing this notice? | Foundry Partners Fundamental Small Cap Value Fund
Ultimus Fund Distributors, LLC (Distributor)
Ultimus Fund Solutions, LLC (Administrator) |
| | |
What we do |
How does the Fund protect my personal information? | To protect your personal information from unauthorized access and use, we use security measures that comply with federal law. These measures include computer safeguards and secured files and buildings. Our service providers are held accountable for adhering to strict policies and procedures to prevent any misuse of your nonpublic personal information. |
How does the Fund collect my personal information? | We collect your personal information, for example, when you ■ open an account or deposit money ■ buy securities from us or sell securities to us ■ make deposits or withdrawals from your account ■ give us your account information ■ make a wire transfer ■ tell us who receives the money ■ tell us where to send the money ■ show your government-issued ID ■ show your driver’s license |
Why can’t I limit all sharing? | Federal law gives you the right to limit only ■ sharing for affiliates’ everyday business purposes—information about your creditworthiness ■ affiliates from using your information to market to you ■ sharing for nonaffiliates to market to you State laws and individual companies may give you additional rights to limit sharing. |
Definitions |
Affiliates | Companies related by common ownership or control. They can be financial and nonfinancial companies. ■ Foundry Partners, LLC, the investment adviser to the Fund, could be deemed to be an affiliate. |
Nonaffiliates | Companies not related by common ownership or control. They can be financial and nonfinancial companies. ■ The Fund does not share your personal information with nonaffiliates so they can market to you. |
Joint marketing | A formal agreement between nonaffiliated financial companies that together market financial products or services to you. ■ The Fund doesn’t jointly market. |
This page intentionally left blank.
This page intentionally left blank.
This page intentionally left blank.
PROXY VOTING
A description of the policies and procedures that the Fund uses to determine how to vote proxies relating to portfolio securities and information regarding how the Fund voted those proxies during the most recent twelve month period ended June 30, are available (1) without charge upon request by calling the Fund at (800) 247-1014 and (2) in Fund documents filed with the Securities and Exchange Commission (“SEC”) on the SEC’s website at www.sec.gov.
TRUSTEES
Andrea N. Mullins, Chairperson
Ira P. Cohen
Mark J. Seger
OFFICERS
Adam T. Kornegay, Principal Executive Officer and President
Gregory T. Knoth, Principal Financial Officer and Treasurer
Kevin J. Patton, Chief Compliance Officer
Carol J. Highsmith, Vice President and Secretary
INVESTMENT ADVISER
Foundry Partners, LLC
323 Washington Avenue North, Suite 360
Minneapolis, MN 55401
DISTRIBUTOR
Ultimus Fund Distributors, LLC
225 Pictoria Drive, Suite 450
Cincinnati, OH 45246
INDEPENDENT REGISTERED PUBLIC ACCOUNTING FIRM
Cohen & Company, Ltd.
1350 Euclid Avenue, Suite 800
Cleveland, OH 44115
LEGAL COUNSEL
Troutman Pepper Hamilton Sanders LLP
3000 Two Logan Square
18th and Arch Streets
Philadelphia, PA 19103
CUSTODIAN
Huntington National Bank
41 South High Street
Columbus, OH 43215
ADMINISTRATOR, TRANSFER AGENT AND FUND ACCOUNTANT
Ultimus Fund Solutions, LLC
225 Pictoria Drive, Suite 450
Cincinnati, OH 45246
This report is intended only for the information of shareholders or those who have received the Fund’s prospectus which contains information about the Fund’s management fee and expenses. Please read the prospectus carefully before investing.
Distributed by Ultimus Fund Distributors, LLC
Member FINRA/SIPC

Annual Report
October 31, 2020
Beginning on January 1, 2021, as permitted by regulations adopted by the U.S. Securities and Exchange Commission, paper copies of the Fund’s shareholder reports like this one will no longer be sent by mail, unless you specifically request paper copies of the reports from the Fund or from your financial intermediary such as a broker-dealer or bank. Instead, the reports will be made available on a website, and you will be notified by mail each time a report is posted and provided with a website link to access the report.
If you already elected to receive shareholder reports electronically, you will not be affected by this change and you need not take any action. You may elect to receive shareholder reports and other communications from the Fund electronically by contacting the Fund at (888) 695-3729 or, if you own these shares through a financial intermediary, you may contact your financial intermediary.
You may elect to receive all future reports in paper free of charge. You can inform the Fund that you wish to continue receiving paper copies of your shareholder reports by contacting the Fund at (888) 695-3729. If you own shares through a financial intermediary, you may contact your financial intermediary or follow instructions included with this document to elect to continue to receive paper copies of your shareholder reports. Your election to receive reports in paper will apply to all funds held with the fund complex or at your financial intermediary.
Fund Adviser:
Kovitz Investment Group Partners, LLC
115 South LaSalle Street, 27th Floor
Chicago, IL 60603
Toll Free (888) 695-3729
MANAGEMENT DISCUSSION & ANALYSIS – (UNAUDITED)
Kovitz Investment Group launched the Green Owl Intrinsic Value Fund (the Fund) with the goal of seeking long-term capital appreciation through high risk-adjusted returns. To accomplish this, Fund management implements a fundamental, research-driven process, in order to build a diversified portfolio of equity investments through the purchase of competitively advantaged and financially strong companies at prices substantially less than our estimate of their intrinsic values.
We remain focused on the careful and patient application of our investment criteria and valuation requirements. Our bottom-up research emphasizes business quality, industry structures, growth opportunities, management skill and corporate culture. It is further augmented by our assessment of the company’s ability to sustain earnings power over the long haul through an understanding of its competitive advantages and management’s proficiency in the allocation of capital. We use absolute, rather than relative, methods to estimate companies’ intrinsic values and we use the movement of market prices around these intrinsic value estimates to construct and manage a portfolio of high-quality businesses that have the potential to create sustained shareholder value over many years.
MARKET AND PERFORMANCE SUMMARY
During the second half of the fiscal year (May 1, 2020 through October 31, 2020), the Fund returned 19.76%. In comparison, our benchmark, the S&P 500 Index, gained 13.29% during the same period. For the full fiscal year ending October 31, 2020, the Fund returned 0.23%, while the S&P 500 gained 9.71%. Since inception on December 28, 2011, the Fund has compounded at a rate of 10.50% annually, versus 13.65% annually for the S&P 500 over the same time period.
On August 10th, after eking out a modest 0.28% gain on the day, the stock market recovered the last bit of the ground it lost during the pandemic-induced sell-off earlier this year. All told, it took 33 days for the market to lose nearly 34% and 140 days to gain it all back. Not even six months elapsed from start to finish.
Since 1929, there have been nine instances of the stock market declining 25% or more following an all-time high. As you can see in the table below, the 2020 drawdown (highlighted below) is notable for both the speed of the decline, but even more so for the rapidity of the recovery.
| | | | Dates | | | | Days | | | |
| | Rank | Drawdown | Peak | Trough | New Peak | | Drawdown | Recovery | Total | |
| | 1 | -86.19% | 9/16/1929 | 6/1/1932 | 1/28/1946 | | 989 | 4,989 | 5,978 | |
| | 2 | -55.22% | 10/9/2007 | 3/9/2009 | 4/2/2012 | | 517 | 1,120 | 1,637 | |
| | 3 | -47.42% | 9/1/2000 | 10/9/2002 | 10/23/2006 | | 768 | 1,475 | 2,243 | |
| | 4 | -44.80% | 1/11/1973 | 10/3/1974 | 7/9/1976 | | 630 | 645 | 1,275 | |
| | 5 | -33.79% | 2/19/2020 | 3/23/2020 | 8/10/2020 | | 33 | 140 | 173 | |
| | 6 | -32.93% | 8/25/1987 | 10/19/1987 | 5/15/1989 | | 55 | 574 | 629 | |
| | 7 | -32.58% | 11/29/1968 | 5/26/1970 | 3/15/1971 | | 543 | 293 | 836 | |
| | 8 | -26.88% | 12/12/1961 | 6/26/1962 | 4/15/1963 | | 196 | 293 | 489 | |
| | 9 | -25.22% | 5/29/1946 | 5/19/1947 | 9/30/1949 | | 355 | 865 | 1,220 | |
“But, is it real?” This is a question we often receive. It might seem odd that the stock market is oscillating around its all-time high while unemployment remains around 7%, over 230,000 deaths in the U.S. have been attributed to COVID-19, and the country continues to lose almost 1000 more people per day to the pandemic. In addition, many feel detached from the world from being cooped up in our houses and practicing social distancing for the past six months.
1
Yet, there are two main factors that are strongly supportive of current stock market valuations. First, the accommodative monetary policy enacted by the Federal Reserve – exemplified by near-zero interest rates – is making all forms of credit, from home mortgages to commercial loans, easier to attain by businesses and individuals. Recently, Jerome Powell, Chairman of the Federal Reserve, declared that the fed funds target rate will likely remain in its current 0%-0.25% range until at least 2023. In such an environment, stocks become relatively more attractive purely for a lack of alternative means of generating returns.
Second, and perhaps more important from a mathematical perspective, the effects of COVID on various industries are not evenly distributed and those companies least impacted happen to already make up the lion’s share of the stock market’s total capitalization.
It is often said in some circles that the stock market does not equal the economy. It would be inaccurate to believe the two are completely unrelated, but a more apt phrasing would be that the stock market roughly approximates future expectations for the economy, while neither the stock market nor the overall economy necessarily reflects the experience of the median person in the economy.
In some ways, the recession is essentially over for a certain subset of the population – mainly those with college degrees and higher incomes. These two factors are strongly correlated with the ability to work from home. On the other end of the spectrum are those with only a high school diploma or who never completed high school. These individuals – who tend to have lower incomes, jobs disproportionately located in the hospitality, food service, and retail sectors that have been decimated by COVID, and no ability to work from home – continue to experience what feels to many of them like a deep recession.
To be sure, there is some diversity of experience among these groups. Not everyone in the former group is unaffected by the pandemic, just as not everyone in the latter group is struggling. However, on the whole, the fortunes of these two groups continue to diverge.
Nevertheless, current stock market valuations express the long-term view that better days are ahead for the overall economy and that hypothetical median person. At the Fund, we are generally supportive of this view. The United States and the world are not faced with an intractable credit crisis coupled with a loss of confidence such as that faced during the Great Depression, or even the 2008 Global Financial Crisis. There is a singular problem faced by humanity: COVID-19. There is merit in the idea that a combination of continuously improving treatments for COVID-19 and the scientific community inching closer to a vaccine will eventually lead to an end to the pandemic. At the very least, these developments will result in a dramatic decrease in the risk of contracting the disease.
In the long run, human progress through technological innovation, rising living standards, increasing life expectancy, and virtually every other metric moves forward. Always forward. We would not bet against that changing.
However, as we know too well, there are always many unknowns in the short run that could upset this bullish tilt to the market. London Business School Professor Elroy Dimson once said, “Risk means more things can happen than will happen.” This simple statement encapsulates why uncertainty and risk are inescapable, particularly in the field of investing. Understanding that this is just a natural and ordinary part of the investment landscape is why we remain singularly focused on ascertaining the difference between what we think a business is worth and its current stock price. This emphasis on business value, as opposed to share price action, empowers us to act when others may be fleeing the markets. Through experience, we know that business values are far less volatile than stock prices and with patience, share price ultimately converges with business value.
We believe there are certain stocks of great businesses, with durable balance sheets and reasonably predictable cash flow streams, that are undervalued relative to their future earning power. For those focused on long-term horizons, it’s a good time to be investing in such opportunities.
2
PORTFOLIO ACTIVITY
Given the volatility caused by the coronavirus, we were active market participants. We’ve consistently driven home the message that we typically use market dislocations as opportunities to upgrade the overall quality of our portfolio. This time was no different. When the dust settled after two of the most unforgettable and unpredictable quarters in market history, we were fortunate to have been able to initiate numerous new positions, add to several existing positions, and generally upgrade the quality of the portfolio. As such, we entered the second half of the fiscal year with a well-balanced portfolio of businesses we believe are positioned to generate solid returns amidst a variety of market conditions. Despite the myriad risks, the expected forward returns of the portfolio today look substantially better than it did even a year ago, and we would argue the quality is also higher.
We are utilizing the same approach we have always used – a valuation framework that focuses on the long-term fundamentals and minimizing the odds of a permanent loss of capital. We have been using the volatility to upgrade both the quality of the portfolio and the expected return profile. One of the identifiable themes to our recent activity is maintaining or initiating positions in exceptional businesses that we believe will weather any coronavirus-related macroeconomic downturn quite well and emerge stronger on the other side due to the possession of one or more competitive advantages. We have also maintained or increased several current positions in quality businesses that may experience near-term cash flow constraints due to the coronavirus, but we believe will endure and offer significant upside as the current challenges abate.
The following portfolio actions were taken during the Fund’s fiscal year period:
INITIATED POSITIONS in the following companies: Amazon (AMZN), Arista Networks (ANET), Autodesk (ADSK), Becton Dickinson (BDX), Charter Communications (CHTR), Hasbro (HAS), Keysight Technologies (KEYS), Lockheed Martin (LMT), Lowes (LOW), Motorola Solutions (MSI), Northern Trust (NTRS), NVR (NVR), Visa (V).
EXITED POSITIONS in the following companies: Amerco (UHAL), Analog Devices (ADI), Bank of America (BAC), Boeing (BA), Delta, eBay (EBAY), FedEx (FDX), Goldman Sachs (GS), PPG, Tencent (TCEHY), US Foods (USFD), United Parcel Service (UPS), and Valmont (VMI).
THE FUND’S FIVE LARGEST POSITIONS as of October 31, 2020 were Alphabet, Quanta, Facebook, Berkshire Hathaway (BRKB), and Philip Morris (PM).
PERFORMANCE ATTRIBUTION
Key Contributors to Relative Results
The individual positions that contributed the most to performance, on a dollar basis, during the year were: Apple (AAPL), Quanta Services (PWR), Covetrus (CVET), Alphabet (GOOG/GOOGL), and Facebook (FB).
On a percentage total return basis, the top performers for the year were: Covetrus (+149%), Lowes (LOW, +93%), Apple (77%), NVR (NVR,+74%), and Amazon (AMZN,+69%).
On a sector basis, the largest contributor to relative results was the Fund’s underweight position Energy sector. Security selection in the Health Care and Communication Services sectors also contributed.
Key Detractors to Relative Results
The individual positions that detracted the most from performance, on a dollar basis, during the year were: Delta (DAL), Mohawk (MHK), Boeing (BA), Viacom CBS (VIAC), and Expedia (EXPE).
On a percentage basis, the worst performers for the year were: Boeing (-56%), Delta (-48%), Citigroup (C,-40%), PPG (PPG,-33%), and Expedia (-31)%.
3
On a sector basis, security selection in Consumer Discretionary along with an underweight position in Information Technology detracted from the Fund’s from results.
GREEN OWL’S RESPONSE TO COVID-19
Given the current circumstances surrounding the COVID-19 pandemic, the majority of the Fund’s employees continue to work remotely. Business operations and client service have not been disrupted. The Fund’s management team is in the business of risk management and typically, focus on and assess market-related risks very well. Over the past several months the Fund has been implementing various business continuity plans to ensure we protect the health and safety of our employees, while also continuing to be able to manage the portfolio and serve its clients. We have robust business continuity programs in place that we can call on as needed to manage the situation in the safest, most effective way possible.
Thank you for your continued support and trust in our ability to manage your investment in the Fund.
Your Kovitz Team
4
INVESTMENT RESULTS – (Unaudited)
| | Average Annual Total Returns* (For the periods ended October 31, 2020) | |
| | | One Year | Five Year | Since Inception
(December 22, 2011) (a) | |
| | Green Owl Intrinsic Value Fund | 0.23% | 8.13% | 10.50% | |
| | S&P 500® Index** | 9.71% | 11.71% | 13.65% | |
Total annual operating expenses, as disclosed in the Green Owl Intrinsic Value Fund (the “Fund”) prospectus dated February 28, 2020, were 1.33% of average daily net assets (1.11% after fee waivers/expense reimbursements by Kovitz Investment Group Partners, LLC (the “Adviser”)). The Adviser has agreed to waive its fees and/or reimburse other expenses of the Fund until February 28, 2022, so that Total Annual Fund Operating Expenses do not exceed 1.10%. This operating expense limitation does not apply to interest, taxes, brokerage commissions, other expenditures which are capitalized in accordance with generally accepted accounting principles, other extraordinary expenses not incurred in the ordinary course of the Fund’s business, dividend expense on short sales, expenses incurred under a Rule 12b-1 plan of distribution, “acquired fund fees and expenses,” and expenses that the Fund has incurred but did not actually pay because of an expense offset arrangement. Each waiver and/or reimbursement of an expense is subject to repayment by the Fund within the three years following the date the particular expense payment occurred, provided that the Fund is able to make the repayment without exceeding the expense limitation in place at the time of the waiver or reimbursement and the expense limitation in place at the time of the repayment. This agreement may only be terminated by mutual consent of the Adviser and the Board of Trustees. Additional information pertaining to the Fund’s expense ratios as of October 31, 2020 can be found in the financial highlights. |
The performance quoted represents past performance, which does not guarantee future results. The investment return and principal value of an investment will fluctuate so that an investor’s shares, when redeemed, may be worth more or less than their original cost. The returns shown do not reflect deduction of taxes that a shareholder would pay on Fund distributions or the redemption of Fund shares. The Fund’s investment objectives, risks, charges and expenses must be considered carefully before investing. Current performance of the Fund may be lower or higher than the performance quoted. Performance data current to the most recent month end may be obtained by calling (888) 695-3729.
(a) | The Fund commenced operations on December 22, 2011. However, the Fund did not invest in long-term securities towards the investment objective until December 27, 2011. December 27, 2011 is the performance calculation inception date. |
* | Return figures reflect any change in price per share and assume the reinvestment of all distributions. The Fund’s returns reflect any fee reductions during the applicable periods. If such fee reductions had not occurred, the quoted performance would have been lower. |
** | The S&P 500® Index is a widely recognized unmanaged index of equity securities and is representative of a broader domestic equity market and range of securities than is found in the Fund’s portfolio. Individuals cannot invest directly in the Index; however, an individual can invest in exchange traded funds or other investment vehicles that attempt to track the performance of a benchmark index. |
The Fund’s investment objectives, strategies, risks, charges and expenses must be considered carefully before investing. The prospectus contains this and other important information about the Fund and may be obtained by calling the same number as above. Please read it carefully before investing.
The Fund is distributed by Ultimus Fund Distributors, LLC, member FINRA/SIPC.
5
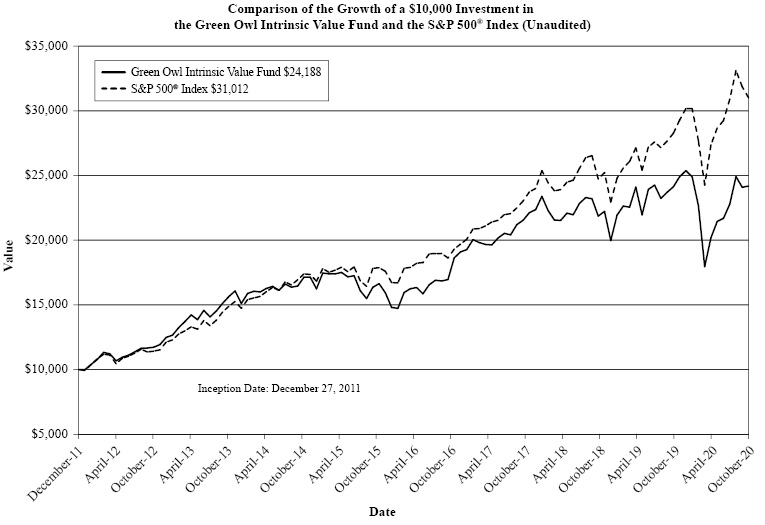
The Fund commenced operations on December 22, 2011. However, the Fund did not invest in long-term securities towards the investment objective until December 27, 2011. December 27, 2011 is the performance calculation inception date. The chart above assumes an initial investment of $10,000 made on December 28, 2011 and held through October 31, 2020. The S&P 500® Index is a widely recognized unmanaged index of equity securities and is representative of a broader domestic equity market and range of securities than is found in the Fund’s portfolio. Individuals cannot invest directly in the Index; however, an individual can invest in exchange traded funds or other investment vehicles that attempt to track the performance of a benchmark index. THE FUND’S RETURN REPRESENTS PAST PERFORMANCE AND DOES NOT GUARANTEE FUTURE RESULTS. The returns shown do not reflect deduction of taxes that a shareholder would pay on Fund distributions or the redemption of Fund shares. Investment returns and principal values will fluctuate so that your shares, when redeemed, may be worth more or less than their original purchase price.
Current performance may be lower or higher than the performance data quoted. For more information on the Fund, and to obtain performance data current to the most recent month end or to request a prospectus, please call (888) 695-3729. You should carefully consider the investment objectives, potential risks, management fees, and charges and expenses of the Fund before investing. The Fund’s prospectus contains this and other information about the Fund, and should be read carefully before investing.
The Fund is distributed by Ultimus Fund Distributors, LLC, member FINRA.
6
FUND HOLDINGS – (Unaudited)
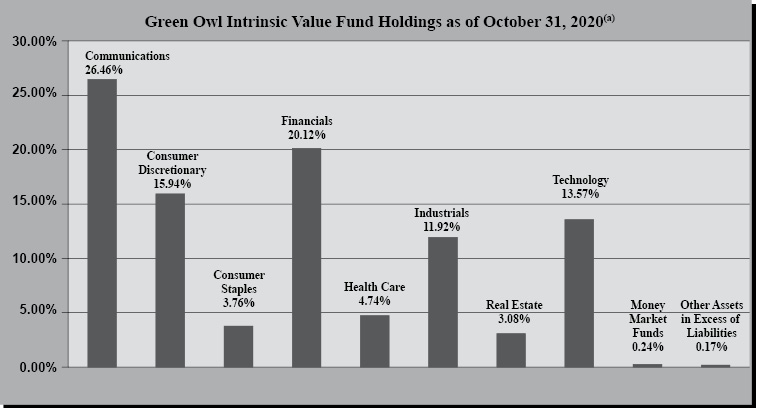
(a) | As a percentage of net assets. |
The investment objective of the Green Owl Intrinsic Value Fund is long-term capital appreciation.
Availability of Portfolio Schedule – (Unaudited)
The Fund files its complete schedule of portfolio holdings with the Securities and Exchange Commission (“SEC”) for the first and third quarters of each fiscal year as an exhibit to its reports on Form N-PORT. The Fund’s Form N-PORT reports are available on the SEC’s website at http://www.sec.gov.
7
GREEN OWL INTRINSIC VALUE FUND
SCHEDULE OF INVESTMENTS
October 31, 2020
COMMON STOCKS — 99.59% | | Shares | | | Fair Value | |
Communications — 26.46% | | | | | | | | |
Alphabet, Inc., Class A(a) | | | 373 | | | $ | 602,809 | |
Alphabet, Inc., Class C(a) | | | 2,948 | | | | 4,778,738 | |
Booking Holdings, Inc.(a) | | | 862 | | | | 1,398,595 | |
Charter Communications, Inc., Class A(a) | | | 4,184 | | | | 2,526,383 | |
Expedia Group, Inc. | | | 10,360 | | | | 975,394 | |
Facebook, Inc., Class A(a) | | | 15,135 | | | | 3,982,170 | |
GoDaddy, Inc., Class A(a) | | | 30,223 | | | | 2,137,975 | |
ViacomCBS, Inc., Class B | | | 54,430 | | | | 1,555,065 | |
Walt Disney Co. (The) | | | 21,425 | | | | 2,597,781 | |
| | | | | | | | 20,554,910 | |
Consumer Discretionary — 15.94% | | | | | | | | |
Amazon.com, Inc.(a) | | | 570 | | | | 1,730,606 | |
CarMax, Inc.(a) | | | 16,578 | | | | 1,433,002 | |
General Motors Co. | | | 74,055 | | | | 2,557,119 | |
Gildan Activewear, Inc. | | | 98,170 | | | | 2,038,991 | |
Hasbro, Inc. | | | 23,385 | | | | 1,934,407 | |
Lowe’s Companies, Inc. | | | 6,130 | | | | 969,153 | |
Mohawk Industries, Inc.(a) | | | 8,102 | | | | 836,045 | |
NVR, Inc.(a) | | | 222 | | | | 877,586 | |
| | | | | | | | 12,376,909 | |
Consumer Staples — 3.76% | | | | | | | | |
Philip Morris International, Inc. | | | 41,090 | | | | 2,918,212 | |
| | | | | | | | | |
Financials — 20.12% | | | | | | | | |
American Express Co. | | | 25,647 | | | | 2,340,032 | |
Aon PLC, Class A | | | 12,860 | | | | 2,366,369 | |
Berkshire Hathaway, Inc., Class B(a) | | | 17,210 | | | | 3,474,699 | |
Blackstone Group L.P. (The), Class A(b) | | | 29,460 | | | | 1,485,373 | |
Charles Schwab Corp. (The) | | | 41,220 | | | | 1,694,554 | |
Citigroup, Inc. | | | 19,605 | | | | 812,039 | |
JPMorgan Chase & Co. | | | 13,020 | | | | 1,276,481 | |
Northern Trust Corp. | | | 27,840 | | | | 2,179,037 | |
| | | | | | | | 15,628,584 | |
Health Care — 4.74% | | | | | | | | |
Becton, Dickinson and Co. | | | 10,490 | | | | 2,424,553 | |
Covetrus, Inc.(a) | | | 51,037 | | | | 1,260,104 | |
| | | | | | | | 3,684,657 | |
See accompanying notes which are an integral part of these financial statements.
8
GREEN OWL INTRINSIC VALUE FUND
SCHEDULE OF INVESTMENTS – continued
October 31, 2020
COMMON STOCKS — 99.59% – continued | | Shares | | | Fair Value | |
Industrials — 11.92% | | | | | | | | |
Jacobs Engineering Group, Inc. | | | 25,688 | | | $ | 2,440,360 | |
Keysight Technologies, Inc.(a) | | | 8,050 | | | | 844,204 | |
Lockheed Martin Corp. | | | 3,576 | | | | 1,252,065 | |
Quanta Services, Inc. | | | 69,445 | | | | 4,335,451 | |
Robert Half International, Inc. | | | 7,665 | | | | 388,539 | |
| | | | | | | | 9,260,619 | |
Real Estate — 3.08% | | | | | | | | |
CBRE Group, Inc., Class A(a) | | | 47,395 | | | | 2,388,708 | |
| | | | | | | | | |
Technology — 13.57% | | | | | | | | |
Apple, Inc. | | | 24,780 | | | | 2,697,550 | |
Arista Networks, Inc.(a) | | | 5,930 | | | | 1,238,777 | |
Autodesk, Inc.(a) | | | 7,210 | | | | 1,698,243 | |
Motorola Solutions, Inc. | | | 12,925 | | | | 2,042,926 | |
SS&C Technologies Holdings, Inc. | | | 31,075 | | | | 1,840,262 | |
Visa, Inc., Class A | | | 5,615 | | | | 1,020,302 | |
| | | | | | | | 10,538,060 | |
Total Common Stocks (Cost $55,243,620) | | | | | | | 77,350,659 | |
| | | | | | | | | |
MONEY MARKET FUNDS — 0.24% | | | | | | | | |
Federated Hermes Treasury Obligations Fund, Institutional Class, 0.01%(c) | | | 184,640 | | | | 184,640 | |
Total Money Market Funds (Cost $184,640) | | | | | | | 184,640 | |
Total Investments — 99.83% (Cost $55,428,260) | | | | | | | 77,535,299 | |
Other Assets in Excess of Liabilities — 0.17% | | | | | | | 129,481 | |
NET ASSETS — 100.00% | | | | | | $ | 77,664,780 | |
(a) | Non-income producing security. |
(b) | Master Limited Partnership |
(c) | Rate disclosed is the seven day effective yield as of October 31, 2020. |
See accompanying notes which are an integral part of these financial statements.
9
GREEN OWL INTRINSIC VALUE FUND
STATEMENT OF ASSETS AND LIABILITIES
October 31, 2020
Assets | | | | |
Investments in securities at fair value (cost $55,428,260) (Note 3) | | $ | 77,535,299 | |
Cash | | | 11,718 | |
Receivable for fund shares sold | | | 131,191 | |
Dividends receivable | | | 46,523 | |
Tax reclaims receivable | | | 14,975 | |
Prepaid expenses | | | 18,109 | |
Total Assets | | | 77,757,815 | |
| | | | | |
Liabilities | | | | |
Payable to Adviser (Note 4) | | | 51,120 | |
Payable to Administrator (Note 4) | | | 9,201 | |
Payable to trustees | | | 1,459 | |
Other accrued expenses | | | 31,255 | |
Total Liabilities | | | 93,035 | |
Net Assets | | $ | 77,664,780 | |
| | | | | |
Net Assets consist of: | | | | |
Paid-in capital | | | 53,105,558 | |
Accumulated earnings | | | 24,559,222 | |
Net Assets | | $ | 77,664,780 | |
| | | | | |
Shares outstanding (unlimited number of shares authorized, no par value) | | | 4,328,383 | |
Net asset value, offering and redemption price per share (Note 2) | | $ | 17.94 | |
See accompanying notes which are an integral part of these financial statements.
10
GREEN OWL INTRINSIC VALUE FUND
STATEMENT OF OPERATIONS
For the year ended October 31, 2020
Investment Income | | | | |
Dividend income (net of foreign taxes withheld of $3,231) | | $ | 981,694 | |
Total investment income | | | 981,694 | |
| | | | | |
Expenses | | | | |
Investment Adviser fees (Note 4) | | | 782,543 | |
Administration fees (Note 4) | | | 62,072 | |
Fund accounting fees (Note 4) | | | 31,179 | |
Registration expenses | | | 29,988 | |
Legal fees | | | 24,357 | |
Transfer agent fees (Note 4) | | | 22,633 | |
Audit and tax preparation fees | | | 17,500 | |
Printing and postage expenses | | | 14,269 | |
Custodian fees | | | 14,205 | |
Trustee fees | | | 6,551 | |
Insurance expenses | | | 6,492 | |
Line of credit (Note 5) | | | 3,523 | |
Compliance service fees (Note 4) | | | 3,000 | |
Pricing | | | 267 | |
Interest expense | | | 194 | |
Miscellaneous expenses | | | 29,641 | |
Total expenses | | | 1,048,414 | |
Fees contractually waived by Adviser | | | (184,529 | ) |
Net operating expenses | | | 863,885 | |
Net investment income | | | 117,809 | |
| | | | | |
Net Realized and Change in Unrealized Gain (Loss) on Investments | | | | |
Net realized gain on: | | | | |
Investment securities transactions | | | 2,374,519 | |
Net change in unrealized appreciation (depreciation) on: | | | | |
Investment securities transactions | | | (1,745,560 | ) |
Written options | | | (4,597 | ) |
Foreign currency translations | | | 636 | |
Net realized and change in unrealized gain on investments | | | 624,998 | |
Net increase in net assets resulting from operations | | $ | 742,807 | |
See accompanying notes which are an integral part of these financial statements.
11
GREEN OWL INTRINSIC VALUE FUND
STATEMENTS OF CHANGES IN NET ASSETS
| | | For the
Year Ended
October 31, 2020 | | | For the
Year Ended
October 31, 2019 | |
Increase (Decrease) in Net Assets due to: | | | | | | | | |
Operations | | | | | | | | |
Net investment income | | $ | 117,809 | | | $ | 833,911 | |
Net realized gain on investment securities transactions and foreign currency translations | | | 2,374,519 | | | | 3,445,186 | |
Net change in unrealized appreciation (depreciation)of investment securities transactions, written options and foreign currency translations | | | (1,749,521 | ) | | | 3,712,451 | |
Net increase in net assets resulting from operations | | | 742,807 | | | | 7,991,548 | |
| | | | | | | | | |
Distributions to Shareholders from Earnings (Note 2) | | | (4,242,749 | ) | | | (7,548,220 | ) |
| | | | | | | | | |
Capital Transactions | | | | | | | | |
Proceeds from shares sold | | | 13,118,828 | | | | 13,521,730 | |
Reinvestment of distributions | | | 4,026,812 | | | | 7,250,182 | |
Amount paid for shares redeemed | | | (19,946,651 | ) | | | (15,666,914 | ) |
Net increase (decrease) in net assets resulting from capital transactions | | | (2,801,011 | ) | | | 5,104,998 | |
Total Increase (Decrease) in Net Assets | | | (6,300,953 | ) | | | 5,548,326 | |
| | | | | | | | | |
Net Assets | | | | | | | | |
Beginning of year | | | 83,965,733 | | | | 78,417,407 | |
End of year | | $ | 77,664,780 | | | $ | 83,965,733 | |
| | | | | | | | | |
Share Transactions | | | | | | | | |
Shares sold | | | 845,509 | | | | 772,039 | |
Shares issued in reinvestment of distributions | | | 216,031 | | | | 448,650 | |
Shares redeemed | | | (1,198,050 | ) | | | (885,378 | ) |
Net increase (decrease) in shares outstanding | | | (136,510 | ) | | | 335,311 | |
See accompanying notes which are an integral part of these financial statements.
12
GREEN OWL INTRINSIC VALUE FUND
FINANCIAL HIGHLIGHTS
(For a share outstanding during each year)
| | | For the
Year Ended
October 31,
2020 | | | For the
Year Ended
October 31,
2019 | | | For the
Year Ended
October 31,
2018 | | | For the
Year Ended
October 31,
2017 | | | For the
Year Ended
October 31,
2016 | |
Selected Per Share Data | | | | | | | | | | | | | | | | | | | | |
Net asset value, beginning of year | | $ | 18.81 | | | $ | 18.99 | | | $ | 19.09 | | | $ | 15.08 | | | $ | 14.84 | |
Investment operations: | | | | | | | | | | | | | | | | | | | | |
Net investment income | | | 0.03 | | | | 0.19 | | | | 0.05 | | | | 0.04 | | | | 0.06 | |
Net realized and unrealized gain (loss) on investments | | | 0.05 | | | | 1.47 | | | | 0.24 | | | | 4.03 | | | | 0.47 | |
Total from investment operations | | | 0.08 | | | | 1.66 | | | | 0.29 | | | | 4.07 | | | | 0.53 | |
| | | | | | | | | | | | | | | | | | | | | |
Less distributions to shareholders from: | | | | | | | | | | | | | | | | | | | | |
Net investment income | | | (0.17 | ) | | | (0.05 | ) | | | (0.04 | ) | | | (0.06 | ) | | | (0.06 | ) |
Net realized gains | | | (0.78 | ) | | | (1.79 | ) | | | (0.35 | ) | | | — | | | | (0.23 | ) |
Total distributions | | | (0.95 | ) | | | (1.84 | ) | | | (0.39 | ) | | | (0.06 | ) | | | (0.29 | ) |
Net asset value, end of year | | $ | 17.94 | | | $ | 18.81 | | | $ | 18.99 | | | $ | 19.09 | | | $ | 15.08 | |
| | | | | | | | | | | | | | | | | | | | | |
Total Return(a) | | | 0.23 | % | | | 10.34 | % | | | 1.50 | % | | | 27.02 | % | | | 3.65 | % |
Ratios and Supplemental Data: | | | | | | | | | | | | | | | | | | | | |
Net assets, end of year (000 omitted) | | $ | 77,665 | | | $ | 83,966 | | | $ | 78,417 | | | $ | 82,068 | | | $ | 61,267 | |
Ratio of expenses to average net assets after expense waiver | | | 1.10 | % | | | 1.10 | % | | | 1.10 | % | | | 1.10 | % | | | 1.10 | % |
Ratio of expenses to average net assets before expense waiver | | | 1.34 | % | | | 1.32 | % | | | 1.32 | % | | | 1.32 | % | | | 1.40 | % |
Ratio of net investment income to average net assets after expense waiver | | | 0.15 | % | | | 1.04 | % | | | 0.26 | % | | | 0.22 | % | | | 0.41 | % |
Portfolio turnover rate | | | 46 | % | | | 29 | % | | | 33 | % | | | 17 | % | | | 21 | % |
(a) | Total return represents the rate that the investor would have earned or lost on an investment in the Fund, assuming reinvestment of distributions. |
See accompanying notes which are an integral part of these financial statements.
13
GREEN OWL INTRINSIC VALUE FUND
NOTES TO THE FINANCIAL STATEMENTS
October 31, 2020
NOTE 1. ORGANIZATION
The Green Owl Intrinsic Value Fund (the “Fund”) is an open-end diversified series of Valued Advisers Trust (the “Trust”). The Trust is a management investment company established under the laws of Delaware by an Agreement and Declaration of Trust dated June 13, 2008 (the “Trust Agreement”). The Trust Agreement permits the Board of Trustees (the “Board”) to issue an unlimited number of shares of beneficial interest of separate series without par value. The Fund is one of a series of funds authorized by the Board. The Fund commenced operations on December 22, 2011. The Fund’s investment adviser is Kovitz Investment Group Partners, LLC (the “Adviser”). The investment objective of the Fund is to provide long-term capital appreciation.
NOTE 2. SIGNIFICANT ACCOUNTING POLICIES
The Fund is an investment company and follows accounting and reporting guidance under Financial Accounting Standards Board Accounting Standards Codification (“ASC”) Topic 946, “Financial Services-Investment Companies.” The following is a summary of significant accounting policies followed by the Fund in the preparation of its financial statements. These policies are in conformity with generally accepted accounting principles in the United States of America (“GAAP”).
Estimates – The preparation of financial statements in conformity with GAAP requires management to make estimates and assumptions that affect the reported amounts of assets and liabilities and disclosure of contingent assets and liabilities at the date of the financial statements and the reported amounts of increases and decreases in net assets from operations during the reporting period. Actual results could differ from those estimates.
Foreign Currency Translation – The accounting records of the Fund are maintained in U.S. dollars. Foreign currency amounts are translated into U.S. dollars at the current rate of exchange each business day to determine the value of investments, and other assets and liabilities. Purchases and sales of foreign securities, and income and expenses, are translated at the prevailing rate of exchange on the respective date of these transactions. The Fund does not isolate that portion of the results of operations resulting from changes in foreign exchange rates on investments from fluctuation arising from changes in market prices of securities held. These fluctuations are included with the unrealized gain or loss from investments. Reported net realized foreign exchange gains or losses arise from sales of foreign currencies, currency gains or losses realized between the trade and settlement dates on securities transactions, and the difference between the amounts of dividends, interest, and foreign withholding taxes recorded on the Fund’s books and the U.S. dollar equivalent of the amounts actually received or paid. Net unrealized foreign exchange gains and losses arise from changes in the fair values of assets and liabilities, other than investments in securities at period end, resulting from changes in exchange rates.
Federal Income Taxes – The Fund makes no provision for federal income or excise tax. The Fund has qualified and intends to qualify each year as a regulated investment company (“RIC”) under subchapter M of the Internal Revenue Code of 1986, as amended, by complying with the requirements applicable to RICs and by distributing substantially all of its taxable income. The Fund also intends to distribute sufficient net investment income and net realized capital gains, if any, so that it will not be subject to excise tax on undistributed income and gains. If the required amount of net investment income or gains is not distributed, the Fund could incur a tax expense.
As of and during the fiscal year ended October 31, 2020, the Fund did not have any liabilities for any unrecognized tax benefits. The Fund recognizes interest and penalties, if any, related to unrecognized tax benefits as income tax expense on the Statement of Operations when incurred. During the fiscal year ended October 31, 2020, the Fund did not incur any interest or penalties. Management of the Fund has reviewed tax positions taken in tax years that
14
GREEN OWL INTRINSIC VALUE FUND
NOTES TO THE FINANCIAL STATEMENTS – (continued)
October 31, 2020
NOTE 2. SIGNIFICANT ACCOUNTING POLICIES – continued
remain subject to examination by all major tax jurisdictions, including federal (i.e., the last three tax year ends and the interim tax period since then, as applicable). Management believes that there is no tax liability resulting from unrecognized tax benefits related to uncertain tax positions taken.
Expenses – Expenses incurred by the Trust that do not relate to a specific fund of the Trust are allocated to the individual funds based on each fund’s relative net assets or another appropriate basis (as determined by the Board).
Security Transactions and Related Income – The Fund follows industry practice and records security transactions on the trade date for financial reporting purposes. The specific identification method is used for determining gains or losses for financial statement and income tax purposes. Dividend income is recorded on the ex-dividend date and interest income is recorded on an accrual basis. Discounts and premiums on securities purchased are accreted or amortized using the effective interest method, if applicable. Withholding taxes on foreign dividends, if any, have been provided for in accordance with the Fund’s understanding of the applicable country’s tax rules and rates.
Dividends and Distributions – The Fund intends to distribute its net investment income and net realized long-term and short-term capital gains, if any, at least annually. Dividends and distributions to shareholders, which are determined in accordance with income tax regulations, are recorded on the ex-dividend date. The treatment for financial reporting purposes of distributions made to shareholders during the period from net investment income or net realized capital gains may differ from their ultimate treatment for federal income tax purposes. These differences are caused primarily by differences in the timing of the recognition of certain components of income, expense or realized capital gain for federal income tax purposes. Where such differences are permanent in nature, they are reclassified among the components of net assets based on their ultimate characterization for federal income tax purposes. Any such reclassifications will have no effect on net assets, results of operations or net asset value (“NAV”) per share of the Fund.
For the fiscal year ended October 31, 2020, the Fund made the following reclassifications to increase (decrease) the components of net assets:
| | Paid-In
Capital | | | Accumulated
earnings (deficit) | |
| | | $(10) | | | | $10 | |
Derivative Transactions – The following tables identify the location and fair value of derivative instruments on the Statement of Assets and Liabilities as of October 31, 2020 and the effect of derivative instruments on the Statement of Operations for the fiscal year ended October 31, 2020.
For the fiscal year ended October 31, 2020:
Derivatives | | Location of Gain
(Loss) on Derivatives
on Statement of
Operations | | | Realized
Gain
(Loss) on
Derivatives | | | Change in
Unrealized
Appreciation
(Depreciation)
on Derivatives | |
Equity Price Risk: | | | | | | | | | | | | |
Written Call Options | | | Net realized gain and change in unrealized appreciation (depreciation) on written options | | | $ | — | | | $ | (4,597 | ) |
15
GREEN OWL INTRINSIC VALUE FUND
NOTES TO THE FINANCIAL STATEMENTS – (continued)
October 31, 2020
NOTE 2. SIGNIFICANT ACCOUNTING POLICIES – continued
The following summarizes the average ending monthly fair value of derivatives outstanding during the fiscal year ended October 31, 2020:
| | | Average
Ending
Monthly
Fair Value | |
Written options | | $ | 60,915 | (a) |
(a) | Average based on the two months during the period that had activity. |
NOTE 3. SECURITIES VALUATION AND FAIR VALUE MEASUREMENTS
The Fund values its portfolio securities at fair value as of the close of regular trading on the New York Stock Exchange (the “NYSE”) (normally 4:00 p.m. Eastern time) on each business day the NYSE is open for business. Fair value is defined as the price that the Fund would receive upon selling an investment in a timely transaction to an independent buyer in the principal or most advantageous market of the investment. GAAP establishes a three-tier hierarchy to maximize the use of observable market data and minimize the use of unobservable inputs and to establish classification of fair value measurements for disclosure purposes.
Inputs refer broadly to the assumptions that market participants would use in pricing the asset or liability, including assumptions about risk (the risk inherent in a particular valuation technique used to measure fair value including a pricing model and/or the risk inherent in the inputs to the valuation technique). Inputs may be observable or unobservable. Observable inputs are inputs that reflect the assumptions market participants would use in pricing the asset or liability developed based on market data obtained and available from sources independent of the reporting entity. Unobservable inputs are inputs that reflect the reporting entity’s own assumptions about the assumptions market participants would use in pricing the asset or liability developed based on the best information available in the circumstances.
Various inputs are used in determining the value of the Fund’s investments. These inputs are summarized in the three broad levels listed below.
| | ● | Level 1 – unadjusted quoted prices in active markets for identical investments and/or registered investment companies where the value per share is determined and published and is the basis for current transactions for identical assets or liabilities at the valuation date |
| | ● | Level 2 – other significant observable inputs (including, but not limited to, quoted prices for an identical security in an inactive market, quoted prices for similar securities, interest rates, prepayment speeds, credit risk, etc.) |
| | ● | Level 3 – significant unobservable inputs (including the Fund’s own assumptions in determining fair value of investments based on the best information available) |
The inputs used to measure fair value may fall into different levels of the fair value hierarchy. In such cases, for disclosure purposes, the level in the fair value hierarchy which is reported is determined based on the lowest level input that is significant to the fair value measurement in its entirety.
16
GREEN OWL INTRINSIC VALUE FUND
NOTES TO THE FINANCIAL STATEMENTS – (continued)
October 31, 2020
NOTE 3. SECURITIES VALUATION AND FAIR VALUE MEASUREMENTS – continued
Equity securities that are traded on any stock exchange are generally valued at the last quoted sale price on the security’s primary exchange. Lacking a last sale price, an exchange-traded security is generally valued at its last bid price. Securities traded in the NASDAQ over-the-counter market are generally valued at the NASDAQ Official Closing Price. When using the market quotations and when the market is considered active, the security is classified as a Level 1 security. In the event that market quotations are not readily available or are considered unreliable due to market or other events, the Fund values its securities and other assets at fair value in accordance with policies established by and under the general supervision of the Board. Under these policies, the securities will be classified as Level 2 or 3 within the fair value hierarchy, depending on the inputs used.
Investments in mutual funds, including money market mutual funds, are generally priced at the ending NAV. These securities are categorized as Level 1 securities.
Call and put options purchased or sold by the Fund are valued at the mean of the last bid and ask prices as provided by a pricing service. If there is no such reported ask price on the valuation date, options are valued at the most recent bid price. If there is no such reported bid price on the valuation date, options are valued at the most recent ask price. Options will generally be categorized as Level 2 securities.
In accordance with the Trust’s valuation policies, the Adviser is required to consider all appropriate factors relevant to the value of securities for which it has determined other pricing sources are not available or reliable as described above. No single method exists for determining fair value, because fair value depends upon the circumstances of each individual case. As a general principle, the current fair value of a security being valued by the Adviser would be the amount that the Fund might reasonably expect to receive upon the current sale. Methods that are in accordance with this principle may, for example, be based on (i) a multiple of earnings; (ii) a discount from market prices of a similar freely traded security (including a derivative security or a basket of securities traded on other markets, exchanges or among dealers); or (iii) yield to maturity with respect to debt issues, or a combination of these and other methods. Fair-value pricing is permitted if, in the Adviser’s opinion, the validity of market quotations appears to be questionable based on factors such as evidence of a thin market in the security based on a small number of quotations, a significant event occurs after the close of a market but before the Fund’s NAV calculation that may affect a security’s value, or the Adviser is aware of any other data that calls into question the reliability of market quotations.
The following is a summary of the inputs used to value the Fund’s investments as of October 31, 2020:
| | | Valuation Inputs | |
Assets | | Level 1 | | | Level 2 | | | Level 3 | | | Total | |
Common Stocks(a) | | $ | 77,350,659 | | | $ | — | | | $ | — | | | $ | 77,350,659 | |
Money Market Funds | | | 184,640 | | | | — | | | | — | | | | 184,640 | |
Total | | $ | 77,535,299 | | | $ | — | | | $ | — | | | $ | 77,535,299 | |
(a) | Refer to Schedule of Investments for sector classifications. |
The Fund did not hold any investments at the end of the reporting period for which significant unobservable inputs (Level 3) were used in determining fair value; therefore, no reconciliation of Level 3 securities is included for this reporting period.
17
GREEN OWL INTRINSIC VALUE FUND
NOTES TO THE FINANCIAL STATEMENTS – (continued)
October 31, 2020
NOTE 4. ADVISER FEES AND OTHER TRANSACTIONS
Under the terms of the management agreement, on behalf of the Fund, the Adviser manages the Fund’s investments subject to approval by the Board. As compensation for its management services, the Fund is obligated to pay the Adviser a fee computed and accrued daily and paid monthly at an annual rate of 1.00% of the average daily net assets of the Fund. For the fiscal year ended October 31, 2020, the Adviser earned a fee of $782,543 from the Fund before the reimbursement described below. At October 31, 2020, the Fund owed the Adviser $51,120.
The Adviser has agreed to waive its fees and/or reimburse other expenses of the Fund until February 28, 2022, so that Total Annual Fund Operating Expenses do not exceed 1.10%. This operating expense limitation does not apply to interest, taxes, brokerage commissions, other expenditures which are capitalized in accordance with GAAP, other extraordinary expenses not incurred in the ordinary course of the Fund’s business, dividend expense on short sales, expenses incurred under a Rule 12b-1 plan of distribution, “acquired fund fees and expenses,” and expenses that the Fund has incurred but did not actually pay because of an expense offset arrangement.
Each waiver and/or reimbursement of an expense is subject to repayment by the Fund within the three years following the date the particular expense payment occurred, provided that the Fund is able to make the repayment without exceeding the expense limitation in place at the time of the waiver or reimbursement and the expense limitation in place at the time of the repayment. This agreement may only be terminated by mutual consent of the Adviser and the Board of Trustees. For the fiscal year ended October 31, 2020, the Adviser waived fees and/or reimbursed expenses of $184,529.
The amounts subject to repayment by the Fund, pursuant to the aforementioned conditions are as follows:
Recoverable through | | | | |
October 31, 2021 | | $ | 179,666 | |
October 31, 2022 | | | 175,543 | |
October 31, 2023 | | | 184,529 | |
The Trust retains Ultimus Fund Solutions, LLC (“the Administrator”) to provide the Fund with administration, compliance (including a chief compliance officer), fund accounting and transfer agent services, including all regulatory reporting. For the fiscal year ended October 31, 2020, the Administrator earned fees of $62,072, $3,000, $31,179 and $22,633 for administrative, compliance, accounting and transfer agent services, respectively. At October 31, 2020, the Administrator was owed $9,201 from the Fund for these services.
The officers and one trustee of the Trust are members of management and/or employees of the Administrator and are not paid by the Trust for services to the Fund. Ultimus Fund Distributors, LLC (the “Distributor”) acts as the distributor of the Fund’s shares. The Distributor is a wholly-owned subsidiary of the Administrator.
There were no payments made by the Fund to the Distributor during the fiscal year ended October 31, 2020.
During the fiscal year ended October 31, 2020, the Fund paid $11,853 to Kovitz Securities, LLC, an affiliate of the Adviser, for the execution of purchases and sales of the Fund’s portfolio investments.
18
GREEN OWL INTRINSIC VALUE FUND
NOTES TO THE FINANCIAL STATEMENTS – (continued)
October 31, 2020
NOTE 5. LINE OF CREDIT
The Fund participated in a short-term credit agreement (“Line of Credit”) with Huntington National Bank (“HNB”) that was terminated on January 6, 2020. Under the terms of the agreement, the Fund was able to borrow the lesser of $1,000,000 or 5% of the Fund’s daily market value at an interest rate of LIBOR plus 150 basis points. The purpose of the agreement was to meet temporary or emergency cash needs, including redemption requests that might otherwise require the untimely disposition of securities. HNB received an annual facility fee of 0.125% on $1 million, subject to a minimum fee of $1,250, as well as an additional annual fee of 0.125% on any unused portion of the credit facility, invoiced quarterly, for providing the Line of Credit. As of and during the fiscal year ended October 31, 2020, the Fund had no outstanding borrowings under this Line of Credit.
NOTE 6. PURCHASES AND SALES
For the fiscal year ended October 31, 2020, purchases and sales of investment securities, other than short-term investments, were $35,146,908 and $36,842,363, respectively.
There were no purchases or sales of long-term U.S. government obligations during the fiscal year ended October 31, 2020.
NOTE 7. FEDERAL TAX INFORMATION
At October 31, 2020, the net unrealized appreciation (depreciation) and tax cost of investments for tax purposes was as follows:
Gross unrealized appreciation | | $ | 23,370,224 | |
Gross unrealized depreciation | | | (1,233,261 | ) |
Net unrealized appreciation on investments | | $ | 22,136,963 | |
| | | | | |
Tax cost of investments | | $ | 55,398,852 | |
At October 31, 2020, the difference between book basis and tax basis unrealized appreciation (depreciation) is attributable to the tax deferral of losses on organizational expense amortization and partnership basis adjustments.
On December 14, 2020, the Fund paid an income distribution of $0.003489 per share and a long-term capital gain distribution of $0.590662 per share to shareholders of record on December 11, 2020.
The tax character of distributions paid for the fiscal years ended October 31, 2020 and October 31, 2019 were as follows:
| | | 2020 | | | 2019 | |
Distributions paid from: | | | | | | | | |
Ordinary income(a) | | $ | 743,955 | | | $ | 727,840 | |
Long-term capital gains | | | 3,498,794 | | | | 6,820,380 | |
Total distributions paid | | $ | 4,242,749 | | | $ | 7,548,220 | |
(a) | For federal income tax purposes, distributions of short-term capital gains are treated as ordinary income distributions. |
19
GREEN OWL INTRINSIC VALUE FUND
NOTES TO THE FINANCIAL STATEMENTS – (continued)
October 31, 2020
NOTE 7. FEDERAL TAX INFORMATION – continued
At October 31, 2020, the components of accumulated earnings (deficit) on a tax basis were as follows:
Undistributed Ordinary Income | | $ | 14,230 | |
Undistributed Long-Term Capital Gains | | | 2,409,553 | |
Accumulated Capital and Other Losses | | | (1,524 | ) |
Unrealized Appreciation on Investments | | | 22,136,963 | |
Total Accumulated Earnings | | $ | 24,559,222 | |
NOTE 8. COMMITMENTS AND CONTINGENCIES
The Trust indemnifies its officers and Trustees for certain liabilities that may arise from their performance of their duties to the Trust or the Fund. Additionally, in the normal course of business, the Trust enters into contracts that contain a variety of representations and warranties which provide general indemnifications. The Trust’s maximum exposure under these arrangements is unknown, as this would involve future claims that may be made against the Trust that have not yet occurred.
NOTE 9. SUBSEQUENT EVENTS
Management of the Fund has evaluated the need for disclosures and/or adjustments resulting from subsequent events through the date at which these financial statements were issued. Based upon this evaluation, management has determined there were no items requiring adjustment of the financial statements or additional disclosure.
NOTE 10. LIQUIDITY RISK MANAGEMENT PROGRAM (UNAUDITED)
Valued Advisers Trust has adopted and implemented a written liquidity risk management program as required by Rule 22e-4 (the “Liquidity Rule”) under the Investment Company Act. The program is reasonably designed to assess and manage the Fund’s liquidity risk, taking into consideration, among other factors, the Fund’s investment strategy and the liquidity of its portfolio investments during normal and reasonably foreseeable stressed conditions; its short and long-term cash flow projections; and its cash holdings and access to other funding sources. The Board of Trustees approved the appointment of a Liquidity Administrator Committee, which includes representatives from Kovitz Investment Group Partners, LLC, the Fund’s investment adviser, and Ultimus Fund Solutions, LLC, the Fund’s Administrator. The Liquidity Administrator Committee is responsible for the program’s administration and oversight and for reporting to the Board on at least an annual basis regarding the program’s operation and effectiveness. The Liquidity Administrator Committee updated its assessment of the Fund’s liquidity risk profile, considering additional data gathered in the 12 months ended May 31, 2020 and the adequacy and effectiveness of the liquidity risk management program’s operations since its inception on June 1, 2019 (the “Review Period”) in order to prepare a written report for the Board of Trustees (the “Report”) for consideration at its meeting held on September 9, 2020. The Report noted that during the Review Period the Fund did not experience unusual stress or disruption to its operations related to purchase and redemption activity. It further noted that during the Review Period the Fund held adequate levels of cash and highly liquid investments to meet shareholder redemption activities in accordance with applicable requirements. The Report concluded that (i) the Trust’s liquidity risk management program is reasonably designed to prevent violations of the Liquidity Rule and (ii) the Trust’s liquidity risk management program had been effectively implemented during the Review Period.
20
REPORT OF INDEPENDENT REGISTERED PUBLIC ACCOUNTING FIRM
To the Shareholders of Green Owl Intrinsic Value Fund and
Board of Trustees of Valued Advisers Trust
Opinion on the Financial Statements
We have audited the accompanying statement of assets and liabilities, including the schedule of investments, of Green Owl Intrinsic Value Fund (the “Fund”), a series of Valued Advisers Trust, as of October 31, 2020, the related statement of operations for the year then ended, the statements of changes in net assets for each of the two years in the period then ended, including the related notes, and the financial highlights for each of the five years in the period then ended (collectively referred to as the “financial statements”). In our opinion, the financial statements present fairly, in all material respects, the financial position of the Fund as of October 31, 2020, the results of its operations for the year then ended, the changes in its net assets for each of the two years in the period then ended, and the financial highlights for each of the five years in the period then ended, in conformity with accounting principles generally accepted in the United States of America.
Basis for Opinion
These financial statements are the responsibility of the Fund’s management. Our responsibility is to express an opinion on the Fund’s financial statements based on our audits. We are a public accounting firm registered with the Public Company Accounting Oversight Board (United States) (“PCAOB”) and are required to be independent with respect to the Fund in accordance with the U.S. federal securities laws and the applicable rules and regulations of the Securities and Exchange Commission and the PCAOB.
We conducted our audits in accordance with the standards of the PCAOB. Those standards require that we plan and perform the audit to obtain reasonable assurance about whether the financial statements are free of material misstatement, whether due to error or fraud.
Our audits included performing procedures to assess the risks of material misstatement of the financial statements, whether due to error or fraud, and performing procedures that respond to those risks. Such procedures included examining, on a test basis, evidence regarding the amounts and disclosures in the financial statements. Our procedures included confirmation of securities owned as of October 31, 2020, by correspondence with the custodian. Our audits also included evaluating the accounting principles used and significant estimates made by management, as well as evaluating the overall presentation of the financial statements. We believe that our audits provide a reasonable basis for our opinion.
We have served as the Fund’s auditor since 2012.
COHEN & COMPANY, LTD.
Cleveland, Ohio
December 23, 2020
21
SUMMARY OF FUND EXPENSES – (Unaudited)
As a shareholder of the Fund, you incur two types of costs: (1) transaction and (2) ongoing costs, including management fees and other Fund expenses. These examples are intended to help you understand your ongoing costs (in dollars) of investing in the Fund and to compare these costs with the ongoing costs of investing in other mutual funds. The example is based on an investment of $1,000 invested at the beginning of the period and held for the entire period from May 1, 2020 through October 31, 2020.
Actual Expenses
The first line of the table below provides information about actual account values and actual expenses. You may use the information in this line, together with the amount you invested, to estimate the expenses that you paid over the period. Simply divide your account value by $1,000 (for example, an $8,600 account value divided by $1,000 = 8.6), then multiply the result by the number in the first line under the heading entitled “Expenses Paid During Period” to estimate the expenses you paid on your account during this period.
Hypothetical Example for Comparison Purposes
The second line of the table below provides information about hypothetical account values and hypothetical expenses based on the Fund’s actual expense ratio and an assumed rate of return of 5% per year before expenses, which is not the Fund’s actual return. The hypothetical account values and expenses may not be used to estimate the actual ending account balance or expenses you paid for the period. You may use this information to compare the ongoing costs of investing in the Fund and other funds. To do so, compare this 5% hypothetical example with the 5% hypothetical examples that appear in the shareholder reports of other funds.
Expenses shown in the table are meant to highlight your ongoing costs only and do not reflect any transactional costs. Therefore, the second line of the table below is useful in comparing ongoing costs only and will not help you determine the relative costs of owning different funds. In addition, if transaction costs were included, your costs would have been higher.
Green Owl
Intrinsic Value Fund | Beginning
Account Value
May 1, 2020 | Ending
Account Value
October 31, 2020 | Expenses Paid
During Period(a) | Annualized
Expense Ratio |
Actual | $ 1,000.00 | $ 1,197.60 | $ 6.10 | 1.10% |
Hypothetical(b) | $ 1,000.00 | $ 1,019.59 | $ 5.61 | 1.10% |
(a) | Expenses are equal to the Fund’s annualized expense ratio, multiplied by the average account value over the period, multiplied by 184/366 (to reflect the one-half year period). |
(b) | Hypothetical assumes 5% annual return before expenses. |
22
ADDITIONAL FEDERAL INCOME TAX INFORMATION – (Unaudited)
The Form 1099-DIV you receive in January 2021 will show the tax status of all distributions paid to your account in calendar year 2020. Shareholders are advised to consult their own tax adviser with respect to the tax consequences of their investment in the Fund. As required by the Internal Revenue Code and/or regulations, shareholders must be notified regarding the status of qualified dividend income for individuals and the dividends received deduction for corporations.
Qualified Dividend Income. The Fund designates approximately 100% or up to the maximum amount of such dividends allowable pursuant to the Internal Revenue Code, as qualified dividend income eligible for a reduced tax rate.
Qualified Business Income. The Fund designates approximately 0% of its ordinary income dividends, or up to the maximum amount of such dividends allowable pursuant to the Internal Revenue Code, as qualified business income.
Dividends Received Deduction. Corporate shareholders are generally entitled to take the dividends received deduction on the portion of the Fund’s dividend distribution that qualifies under tax law. For the Fund’s calendar year 2020 ordinary income dividends, 100% qualifies for the corporate dividends received deduction.
For the year ended October 31, 2020, the Fund designated $3,498,794 as long-term capital gain distributions.
23
TRUSTEES AND OFFICERS – (Unaudited)
The Board of Trustees supervises the business activities of the Trust. Each Trustee serves as a trustee until termination of the Trust unless the Trustee dies, resigns, retires or is removed.
The following table provides information regarding each of the Independent Trustees.
Name, Address*, Age,
Position with Trust**,
Term of Position with Trust | Principal Occupation During
Past 5 Years and Other Directorships | Other Directorships |
Ira P. Cohen, 61
Independent Trustee Since June 2010 | Current: Independent financial services consultant (since February 2005); Executive Vice President of Asset Management Services, Recognos Financial (since August 2015). | Trustee and Audit Committee Chairman, Griffin Institutional Access Credit Fund (since January 2017); Trustee and Audit Committee Chairman, Griffin Institutional Real Estate Access Fund (since May 2014); Trustee, Angel Oak Funds Trust (since October 2014) (4 portfolios); Trustee, Chairman, and Nominating and Governance Committee Chairman, Angel Oak Strategic Credit Fund (since December 2017), Trustee and Chairman, Angel Oak Financial Strategies Income Term Trust (since May 2019). |
Andrea N. Mullins, 53
Independent Trustee Since December 2013 Chairperson since March 2017 | Current: Private investor; Independent Contractor, SWM Advisors (since April 2014). | Trustee, Angel Oak Funds Trust (since February 2019) (4 portfolios); Trustee, Angel Oak Strategic Credit Fund (since February 2019), Trustee, Angel Oak Financial Strategies Income Term Trust (since May 2019). |
* The address for each Trustee and officer is 225 Pictoria Drive, Suite 450, Cincinnati, Ohio 45246.
** As of the date of this report, the Trust consists of 12 series.
The following table provides information regarding the Trustee who is considered an “interested person” of the Trust, as that term is defined under the 1940 Act. Based on the experience of the Trustee, the Trust concluded that the individual described below should serve as a Trustee.
Name, Address*, Age,
Position with Trust**,
Term of Position with Trust | Principal Occupation During
Past 5 Years | Other Directorships |
Mark J. Seger***, 58
Trustee Since March 2017 | Current: Vice Chairman and Co-Founder, Ultimus Fund Solutions, LLC and its subsidiaries (since 1999). | None. |
* The address for each Trustee and officer is 225 Pictoria Drive, Suite 450, Cincinnati, Ohio 45246.
** As of the date of this report, the Trust consists of 12 series.
*** Mr. Seger is considered an “interested person” of the Trust because of his relationship with the Trust’s administrator, transfer agent, and distributor.
24
The following table provides information regarding the Officers of the Trust:
Name, Address*, Age,
Position with Trust**,
Term of Position with Trust | Principal Occupation During
Past 5 Years | Other Directorships |
Adam T. Kornegay, 35
Principal Executive Officer and President Since April 2018 | Current: Vice President, Business Development Director, Ultimus Fund Solutions, LLC (since June 2018).
Previous: Assistant Vice President, Business Development Director, Ultimus Fund Solutions, LLC (March 2015 to June 2018). | None. |
Kevin J. Patton, 50
Chief Compliance Officer Since March 2020 | Current: AVP, Compliance Officer, Ultimus Fund Solutions, LLC (since January 2020).
Previous: Partner and Chief Compliance Officer, Renaissance Investment Management (August 2005 to January 2020). | None. |
Carol J. Highsmith, 56
Vice President Since August 2008 Secretary Since March 2014 | Current: Vice President, Ultimus Fund Solutions, LLC (since December 2015).
Previous: Employed in various positions with Huntington Asset Services, Inc. (n/k/a Ultimus Asset Services, LLC) (November 1994 to December 2015), most recently Vice President of Legal Administration (2005 to December 2015). | None. |
Matthew J. Miller, 44
Vice President Since December 2011 | Current: Assistant Vice President, Relationship Management, Ultimus Fund Solutions, LLC (since December 2015).
Previous: Employed in various positions with Huntington Asset Services, Inc. (n/k/a Ultimus Asset Services, LLC) (July 1998 to December 2015), most recently Vice President of Relationship Management (2005 to December 2015). | None. |
25
Name, Address*, Age,
Position with Trust**,
Term of Position with Trust | Principal Occupation During
Past 5 Years | Other Directorships |
Gregory T. Knoth, 50
Principal Financial Officer and Treasurer Since April 2019 | Current: Vice President, Mutual Fund Controller, Ultimus Fund Solutions, LLC (since December 2015).
Previous: Vice President and Manager of Fund Accounting, Huntington Asset Services, Inc. (n/k/a Ultimus Asset Services, LLC) (June 2013 to December 2015) | None. |
Stephen L. Preston, 54
AML Officer since June 2017 | Current: Chief Compliance Officer of Ultimus Fund Distributors, LLC (since June 2011).
Previous: Chief Compliance Officer, Ultimus Fund Solutions, LLC (June 2011 to August 2019); Chief Compliance Officer, Unified Financial Securities, LLC (April 2018 to December 2019) | None. |
26
FACTS | WHAT DOES GREEN OWL INTRINSIC VALUE FUND (THE “Fund”) DO WITH YOUR PERSONAL INFORMATION? |
| | |
Why? | Financial companies choose how they share your personal information. Federal law gives consumers the right to limit some but not all sharing. Federal law also requires us to tell you how we collect, share, and protect your personal information. Please read this notice carefully to understand what we do. |
| | |
What? | The types of personal information we collect and share depend on the product or service you have with us. This information can include: ■ Social Security number ■ account balances and account transactions ■ transaction or loss history and purchase history ■ checking account information and wire transfer instructions When you are no longer our customer, we continue to share your information as described in this notice. |
| | |
How? | All financial companies need to share customers’ personal information to run their everyday business. In the section below, we list the reasons financial companies can share their customers’ personal information; the reasons the Fund chooses to share; and whether you can limit this sharing. |
| | |
Reasons we can share your personal information | Does the Fund share? |
For our everyday business purposes—
such as to process your transactions, maintain your account(s), respond to court orders and legal investigations, or report to credit bureaus | Yes |
For our marketing purposes—
to offer our products and services to you | No |
For joint marketing with other financial companies | No |
For our affiliates’ everyday business purposes—
information about your transactions and experiences | No |
For our affiliates’ everyday business purposes—
information about your creditworthiness | No |
For nonaffiliates to market to you | No |
| | |
Questions? | Call (888) 695-3729 |
27
Who we are |
Who is providing this notice? | Green Owl Intrinsic Value Fund Ultimus Fund Distributors, LLC (Distributor) Ultimus Fund Solutions, LLC (Administrator) |
What we do |
How does the Fund
protect my personal information? | To protect your personal information from unauthorized access and use, we use security measures that comply with federal law. These measures include computer safeguards and secured files and buildings. Our service providers are held accountable for adhering to strict policies and procedures to prevent any misuse of your nonpublic personal information. |
How does the Fund
collect my personal information? | We collect your personal information, for example, when you ■ open an account or deposit money ■ buy securities from us or sell securities to us ■ make deposits or withdrawals from your account or provide account information ■ give us your account information ■ make a wire transfer ■ tell us who receives the money ■ tell us where to send the money ■ show your government-issued ID ■ show your driver’s license |
Why can’t I limit all sharing? | Federal law gives you the right to limit only ■ sharing for affiliates’ everyday business purposes—information about your creditworthiness ■ affiliates from using your information to market to you ■ sharing for nonaffiliates to market to you State laws and individual companies may give you additional rights to limit sharing. |
Definitions |
Affiliates | Companies related by common ownership or control. They can be financial and nonfinancial companies. ■ Kovitz Investment Group Partners, LLC, the investment adviser to the Fund, could be deemed to be an affiliate. |
Nonaffiliates | Companies not related by common ownership or control. They can be financial and nonfinancial companies. ■ The Fund does not share your personal information with nonaffiliates so they can market to you |
Joint marketing | A formal agreement between nonaffiliated financial companies that together market financial products or services to you. ■ The Fund doesn’t jointly market. |
28
This page intentionally left blank.
OTHER INFORMATION
The Fund’s Statement of Additional Information (“SAI”) includes additional information about the trustees and is available without charge, upon request. You may call toll-free at (888) 695-3729 to request a copy of the SAI or to make shareholder inquiries.
PROXY VOTING
A description of the policies and procedures that the Fund uses to determine how to vote proxies relating to portfolio securities and information regarding how the Fund voted those proxies during the most recent twelve month period ended June 30, are available (1) without charge upon request by calling the Fund at (888) 695-3729 and (2) in Fund documents filed with the Securities and Exchange Commission (“SEC”) on the SEC’s website at www.sec.gov.
TRUSTEES Andrea N. Mullins, Chairperson Ira P. Cohen Mark J. Seger OFFICERS Adam T. Kornegay, Principal Executive Officer and President Gregory T. Knoth, Principal Financial Officer and Treasurer Kevin J. Patton, Chief Compliance Officer Carol J. Highsmith, Vice President and Secretary INVESTMENT ADVISER Kovitz Investment Group Partners, LLC 115 South LaSalle Street, 27th Floor Chicago, IL 60603 DISTRIBUTOR Ultimus Fund Distributors, LLC 225 Pictoria Drive, Suite 450 Cincinnati, OH 45246 | INDEPENDENT REGISTERED PUBLIC ACCOUNTING FIRM Cohen & Company, Ltd. 1350 Euclid Avenue, Suite 800 Cleveland, OH 44115 LEGAL COUNSEL Troutman Pepper Hamilton Sanders LLP 3000 Two Logan Square 18th and Arch Streets Philadelphia, PA 19103 CUSTODIAN Huntington National Bank 41 South High Street Columbus, OH 43215 ADMINISTRATOR, TRANSFER AGENT AND FUND ACCOUNTANT Ultimus Fund Solutions, LLC 225 Pictoria Drive, Suite 450 Cincinnati, OH 45246 |
This report is intended only for the information of shareholders or those who have received the Fund’s prospectus which contains information about the Fund’s management fee and expenses. Please read the prospectus carefully before investing.
Distributed by Ultimus Fund Distributors, LLC
Member FINRA/SIPC

SOUND MIND INVESTING FUND (SMIFX)
SMI DYNAMIC ALLOCATION FUND (SMIDX)
SMI 50/40/10 FUND (SMILX)
ANNUAL REPORT |
OCTOBER 31, 2020 |
Beginning on January 1, 2021, as permitted by regulations adopted by the Securities and Exchange Commission, paper copies of the Funds’ shareholder reports like this one will no longer be sent by mail, unless you specifically request paper copies of the reports from the Funds or from your financial intermediary such as a broker-dealer or bank. Instead, the reports will be made available on a website, and you will be notified by mail each time a report is posted and provided with a website link to access the report.
If you already elected to receive shareholder reports electronically, you will not be affected by this change and you need not take any action. You may elect to receive shareholder reports and other communications from the Funds electronically by contacting the Funds at (877) 764-3863 or, if you own these shares through a financial intermediary, you may contact your financial intermediary.
You may elect to receive all future reports in paper free of charge. You can inform the Funds that you wish to continue receiving paper copies of your shareholder reports by contacting the Funds at (877) 764-3863. If you own shares through a financial intermediary, you may contact your financial intermediary or follow instructions included with this document to elect to continue to receive paper copies of your shareholder reports. Your election to receive reports in paper will apply to all funds held with the fund complex or at your financial intermediary.
Funds’ Adviser:
SMI Advisory Services, LLC
4400 Ray Boll Blvd.
Columbus, IN 47203
(877) 764-3863
(877) SMI-FUND
www.smifund.com

Dear Fellow Shareholder,
It’s no exaggeration to suggest the past year was unlike anything today’s investors have ever seen before. The COVID-19 pandemic had a brutal impact that extended well beyond the economy and financial markets. But the virus — and the monetary/fiscal response to the economic shutdowns it caused — drove the market action as well.
While past bear markets have been deeper than 2020’s, none has ever unfolded with the speed of this decline. From the all-time high established on February 19, 2020, the S&P 500® Index (“S&P 500”) fell -20% in just 16 trading sessions. That’s warp speed in terms of reaching the traditional -20% bear market threshold: historically bear markets have averaged eight months to cover that amount of ground. Just seven days later, on March 23, 2020, the market would hit its low point, down -35% intraday.
And then, just as quickly, the market reversed course and blasted higher. By April 9, 2020, the S&P 500 had recovered half of its losses and by mid-August was back to an all-time high.
Governments and Central Banks around the world threw everything but the kitchen sink at the crisis, acting with incredible speed and scale. The Fed’s massive interventions helped turn a rapidly deteriorating crisis into a strong rebound for both credit and equity markets.
Performance Review
SMI’s Stock Upgrading strategy (the sole strategy used in SMIFX and 40% of SMILX) gained +3.92% from November 1st, 2019 through October 31st, 2020. This beat SMIFX’s Morningstar Fund Category (Allocation – 85%+ Equity) average, which came in at just +2.47%. But it was considerably less than SMIFX’s benchmark, the Wilshire 5000® Total Market Index (“Wilshire 5000”) (+10.18%), which reflects the difficulty active funds had navigating the unprecedented speed of the 2020 bear market and subsequent recovery.
The reason for Stock Upgrading’s underperformance relative to the benchmark is clear. The Upgrading strategy is designed with the flexibility to move at least partially into cash during extreme market conditions. These defensive protocols triggered during the 2020 bear market. But given how quickly the bear market ended and then recovered, this shift of a portion of the portfolio’s assets to cash was counterproductive.
SMIFX performed extremely well after returning to its fully-invested posture. From May 1st, 2020 to October 31st, 2020 SMIFX gained +16.74%, considerably better than the Wilshire 5000’s gain of +14.93% or the Morningstar Category average of +13.03%. (The Fund ranked in the top 7% of its category over those final six months of the period, and the top 1% of its category over the final three months, while placing
1
in the middle of the pack (55%) for the 12 months overall.) However, being less than 100% invested in stocks during the early weeks of the market recovery left a performance gap too large for the Fund’s late performance surge to overcome.
SMI’s Dynamic Asset Allocation (“DAA”) strategy (the sole strategy used in SMIDX and 50% of SMILX) ended the 12-month period with a return similar to Stock Upgrading’s, gaining +3.55%, but arrived there in the exact opposite fashion.
When the stock market is rising rapidly, the DAA strategy will normally lag because it is limited to a maximum one-third allocation to U.S. Stocks. This was the case in the November-January pre-bear market period, as well as the April-August recovery period. However, during the actual bear market, DAA played the situation extraordinarily well. It shifted out of Foreign Stocks and Real Estate at the end of January in favor of Long-Term Bonds and Gold, then sold its U.S. stock exposure at the end of February, moving into cash. DAA was almost perfectly positioned, having just one-third of its portfolio exposed to the stock market decline for roughly one week of the bear market!
Of course, this bear market turned with unprecedented speed and this defensive positioning was soon punished rather than rewarded. While SMIDX lagged its blended benchmark (60% Wilshire 5000 / 40% Bloomberg Barclay’s U.S. Aggregate Bond Index) during the rebound, it has performed well in 2020, trailing the blended benchmark only slightly through the first ten months of 2020. Relative to its Morningstar Tactical Allocation peer group, SMIDX ranks in the 33rd percentile over the 12-month period (outperforming its average peer +3.55% vs. +1.54%) and in the 18th percentile for the ten months ended October 31, 2020 (+4.27% vs. -1.74%). As these category returns illustrate, the past year has been a tough environment for most active managers.
SMI’s 50/40/10 portfolio (used in SMILX) consists of 50% DAA, 40% Stock Upgrading, and 10% in a strategy called Sector Rotation. From November 1st, 2019 through October 31st, 2020, the SMI 50/40/10 Fund returned +4.91%. This lagged the pure market benchmarks but compared favorably to its Morningstar peer group (Allocation 70%-85% Equity), where it outperformed by a +4.91% vs. +1.83% margin and finished in the 35th percentile for the 12-month period. Its year-to-date performance through October 31, 2020 has been even stronger, landing in the 17th percentile of its peer group with a return advantage of +2.81% vs. -2.67%.
Having already covered Stock Upgrading and DAA, which make up 90% of the Fund’s weighting, the final component to discuss is the 10% Sector Rotation allocation. This portion of the 50/40/10 Fund outperformed the other two strategies, gaining +4.6% for the 12-month period. Sector Rotation is the polar opposite of the DAA strategy, typically excelling during market rallies and lagging during declines.
Conclusion
Importantly, all of the SMI Funds utilize quantitative strategies supported by extensive testing and, with the exception of DAA, long performance histories. In 2020, the strategies executed as they were designed to, rapidly positioning our portfolios for a bear market as richly valued stocks ran headlong into a deep economic recession. The unprecedented speed and force of the market rebound caught virtually all active managers off guard.
2
While the house was successfully rescued before burning to the ground this time, we don’t feel it is inappropriate to have “fire insurance” built into our strategies. Opportunity costs of the type we experienced in 2020 can be disappointing, but they pale beside the actual financial losses suffered by investors in past bear markets.
We appreciate the opportunity to serve you!
Blessings,

Mark Biller
Senior Portfolio Manager
The Sound Mind Investing Funds
The SMI Fund lineup, shown below, now offers investors a way to mix and match professionally managed funds to custom tailor the risk level desired for their portfolio. If you’d like assistance customizing your portfolio in this manner, please call a Stewardship Advisor at (800) 796-4975.
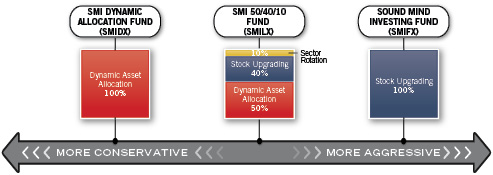
3
PERFORMANCE RESULTS – (Unaudited)
Average Annual Total Returns(a)
(For the periods ended October 31, 2020) |
| | Three
Months | Six Months | One Year | Five Year | Ten Year |
Sound Mind Investing Fund | 4.40% | 16.74% | 3.92% | 6.28% | 7.50% |
Wilshire 5000® Total Market Index(b) | 1.02% | 14.93% | 10.18% | 11.59% | 12.82% |
S&P 500® Index(b) | 0.37% | 13.29% | 9.71% | 11.71% | 13.01% |
SMI Custom Index(c) | 1.76% | 14.47% | 2.07% | 8.12% | 9.84% |
Total annual operating expenses, as disclosed in the Sound Mind Investing Fund’s (“SMI Fund”) prospectus dated February 28, 2020, were 1.94% of average daily net assets, which includes acquired fund fees and expenses. All expenses are reflected in performance results. SMI Advisory Services, LLC (the “Adviser”) contractually has agreed to waive its fee and/or reimburse certain operating expenses, but only to the extent necessary so that total annual operating expenses (excluding interest, taxes, brokerage commissions, other expenses which are capitalized in accordance with generally accepted accounting principles, extraordinary expenses, dividend expense on short sales, 12b-1 fees, and acquired fund fees and expenses) do not exceed 1.50% of the SMI Fund’s average daily net assets through February 28, 2021. Each waiver or reimbursement of an expense by the Adviser is subject to repayment by the SMI Fund within the three years following the date of such waiver or reimbursement, provided that the SMI Fund is able to make the repayment without exceeding the expense limitation in place at the time of the fee waiver or reimbursement and the expense limitation at the time of the repayment. This expense cap may not be terminated prior to this date except by the Board of Trustees (the “Board”). |
Average Annual Total Returns(a)
(For the periods ended October 31, 2020) |
| | Three
Months | Six Months | One Year | Five Year | Since Inception
(February 28, 2013) |
SMI Dynamic Allocation Fund | -5.90% | 3.92% | 3.55% | 3.59% | 4.16% |
Wilshire 5000® Total Market Index(b) | 1.02% | 14.93% | 10.18% | 11.59% | 12.57% |
Bloomberg Barclays U.S. Aggregate Bond Index(b) | -1.30% | 1.27% | 6.19% | 4.08% | 3.31% |
Weighted Index(c) | 0.18% | 9.41% | 9.30% | 8.85% | 9.04% |
Total annual operating expenses, as disclosed in the SMI Dynamic Allocation Fund’s prospectus dated February 28, 2020, were 1.45% of average daily net assets, which includes acquired fund fees and expenses. All expenses are reflected in performance results. The Adviser contractually has agreed to waive its fee and/or reimburse certain operating expenses, but only to the extent necessary so that total annual operating expenses (excluding interest, taxes, brokerage commissions, other expenses which are capitalized in accordance with generally accepted accounting principles, extraordinary expenses, dividend expense on short sales, 12b-1 fees, and acquired fund fees and expenses) do not exceed 1.45% of the SMI Dynamic Allocation Fund’s average daily net assets through February 28, 2021. Each waiver or reimbursement of an expense by the Adviser is subject to repayment by the SMI Dynamic Allocation Fund within the three years following the date of such waiver or reimbursement, provided that the SMI Dynamic Allocation Fund is able to make the repayment without exceeding the expense limitation in place at the time of the fee waiver or reimbursement and the expense limitation at the time of the repayment. This expense cap may not be terminated prior to this date except by the Board. |
4
PERFORMANCE RESULTS – (Unaudited), (Continued)
Average Annual Total Returns(a)
(For the periods ended October 31, 2020) |
| | Three
Months | Six Months | One Year | Five Year | Since Inception
(April 29, 2015) |
SMI 50/40/10 Fund | -1.20% | 10.27% | 4.91% | 5.47% | 3.37% |
Wilshire 5000® Total Market Index(b) | 1.02% | 14.93% | 10.18% | 11.59% | 10.26% |
Bloomberg Barclays U.S. Aggregate Bond Index(b) | -1.30% | 1.27% | 6.19% | 4.08% | 3.67% |
Weighted Index(c) | 0.18% | 9.41% | 9.30% | 8.85% | 7.89% |
Total annual operating expenses, as disclosed in the SMI 50/40/10 Fund’s prospectus dated February 28, 2020, were 1.71% of average daily net assets (1.76% before fee waivers/expense reimbursements by the Adviser), which includes acquired fund fees and expenses. All expenses are reflected in performance results. The Adviser contractually has agreed to waive its fee and/or reimburse certain operating expenses, but only to the extent necessary so that total annual operating expenses (excluding interest, taxes, brokerage commissions, other expenses which are capitalized in accordance with generally accepted accounting principles, extraordinary expenses, dividend expense on short sales, 12b-1 fees, and acquired fund fees and expenses) do not exceed 1.15% of the SMI 50/40/10 Fund’s average daily net assets through February 28, 2021. Each waiver or reimbursement of an expense by the Adviser is subject to repayment by the SMI 50/40/10 Fund within the three years following the date of such waiver or reimbursement, provided that the SMI 50/40/10 Fund is able to make the repayment without exceeding the expense limitation in place at the time of the fee waiver or reimbursement and the expense limitation at the time of the repayment. This expense cap may not be terminated prior to this date except by the Board. |
The performance quoted represents past performance, which does not guarantee future results. The investment return and principal value of an investment will fluctuate so that an investor’s shares, when redeemed, may be worth more or less than their original cost. The returns shown do not reflect deduction of taxes that a shareholder would pay on Fund distributions or the redemption of Fund shares. Current performance of the Sound Mind Investing Fund, SMI Dynamic Allocation Fund, and SMI 50/40/10 Fund (each a “Fund” and collectively the “Funds”) may be lower or higher than the performance quoted. Performance data current to the most recent month end may be obtained by calling (877) 764-3863.
(a) | Average annual total returns reflect any change in price per share and assume the reinvestment of all distributions. The Funds’ returns reflect any fee reductions during the applicable periods. If such fee reductions had not occurred, the quoted performance would have been lower. Total returns for periods less than one year are not annualized. |
(b) | The Standard & Poor’s 500® Index (“S&P 500”), Wilshire 5000® Total Market Index (“Wilshire 5000”), Bloomberg Barclays U.S. Aggregate Bond Index, Russell 1000® Value Index, Russell 1000® Growth Index, Russell 2000® Value Index, Russell 2000® Growth Index and MSCI EAFE Index (collectively, the “Indices”) are unmanaged indices that assume reinvestment of all distributions and exclude the effect of taxes and fees. These Indices are widely recognized unmanaged indices and are representative of a broader market and range of securities than is found in each Fund’s portfolio. The returns of the Indices are not reduced by any fees or operating expenses. Individuals cannot invest directly in the Indices; however, an individual can invest in exchange-traded funds or other investment vehicles that attempt to track the performance of a benchmark index. |
(c) | The SMI Custom Index for the Sound Mind Investing Fund is comprised of 20% Russell 1000® Value Index, 20% Russell 1000® Growth Index, 20% Russell 2000® Value Index, 20% Russell 2000® Growth Index and 20% MSCI EAFE Index and the Weighted Index for the SMI Dynamic Allocation Fund and the SMI 50/40/10 Fund is comprised of 60% Wilshire 5000 and 40% Bloomberg Barclays U.S. Aggregate Bond Index. |
The Funds’ investment objectives, risks, charges and expenses must be considered carefully before investing. The prospectus contains this and other important information about the Funds and may be obtained by calling the same number as above. Please read it carefully before investing.
5
PERFORMANCE RESULTS – (Unaudited), (Continued)
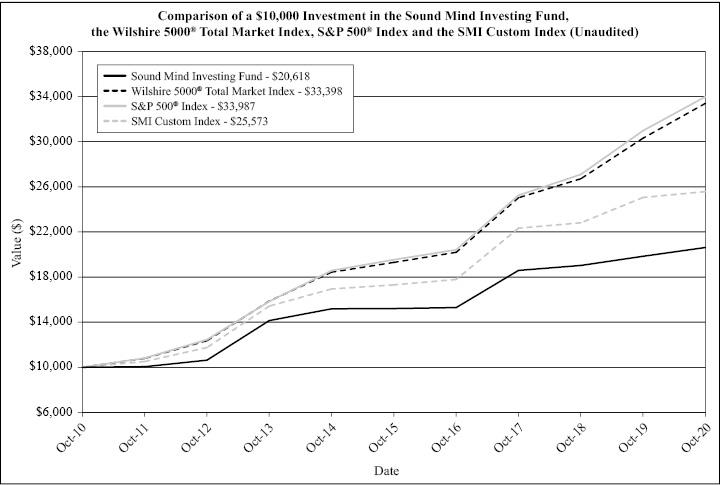
The chart above assumes an initial investment of $10,000 made on October 31, 2010 and held through October 31, 2020. THE FUND’S RETURN REPRESENTS PAST PERFORMANCE AND DOES NOT GUARANTEE FUTURE RESULTS. The returns shown do not reflect deduction of taxes that a shareholder would pay on Fund distributions or the redemption of Fund shares. Investment returns and principal values will fluctuate so that your shares, when redeemed, may be worth more or less than their original purchase price.
Current performance of the Fund may be lower or higher than the performance quoted. For more information on the Fund, and to obtain performance data current to the most recent month end or to request a prospectus, please call (877) 764-3863. You should carefully consider the investment objectives, potential risks, management fees, and charges and expenses of the Fund before investing. The Fund’s prospectus contains this and other information about the Fund, and should be read carefully before investing.
The SMI Custom Index for the Sound Mind Investing Fund is comprised of 20% Russell 1000® Value Index, 20% Russell 1000® Growth Index, 20% Russell 2000® Value Index, 20% Russell 2000® Growth Index and 20% MSCI EAFE Index.
The Fund is distributed by Ultimus Fund Distributors, LLC, member FINRA/SIPC.
6
PERFORMANCE RESULTS – (Unaudited), (Continued)
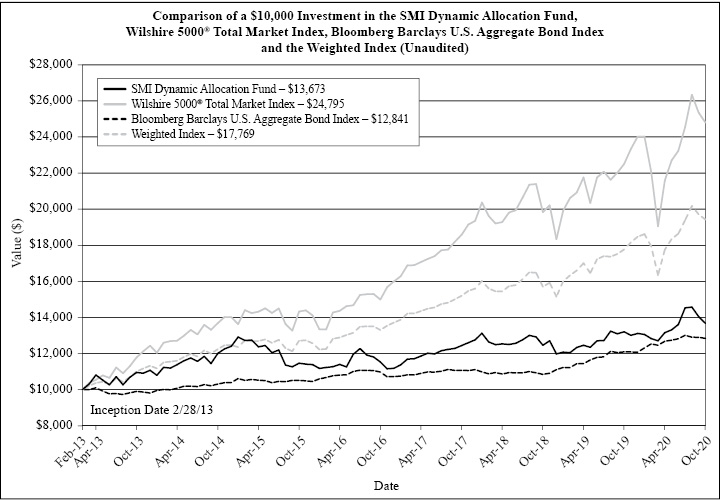
The chart above assumes an initial investment of $10,000 made on February 28, 2013 (commencement of Fund operations) and held through October 31, 2020. THE FUND’S RETURN REPRESENTS PAST PERFORMANCE AND DOES NOT GUARANTEE FUTURE RESULTS. The returns shown do not reflect deduction of taxes that a shareholder would pay on Fund distributions or the redemption of Fund shares. Investment returns and principal values will fluctuate so that your shares, when redeemed, may be worth more or less than their original purchase price.
Current performance of the Fund may be lower or higher than the performance quoted. For more information on the Fund, and to obtain performance data current to the most recent month end or to request a prospectus, please call (877) 764-3863. You should carefully consider the investment objectives, potential risks, management fees, and charges and expenses of the Fund before investing. The Fund’s prospectus contains this and other information about the Fund, and should be read carefully before investing.
The Weighted Index is comprised of 60% Wilshire 5000® Total Market Index and 40% Bloomberg Barclays U.S. Aggregate Bond Index.
The Fund is distributed by Ultimus Fund Distributors, LLC, member FINRA/SIPC.
7
PERFORMANCE RESULTS – (Unaudited), (Continued)
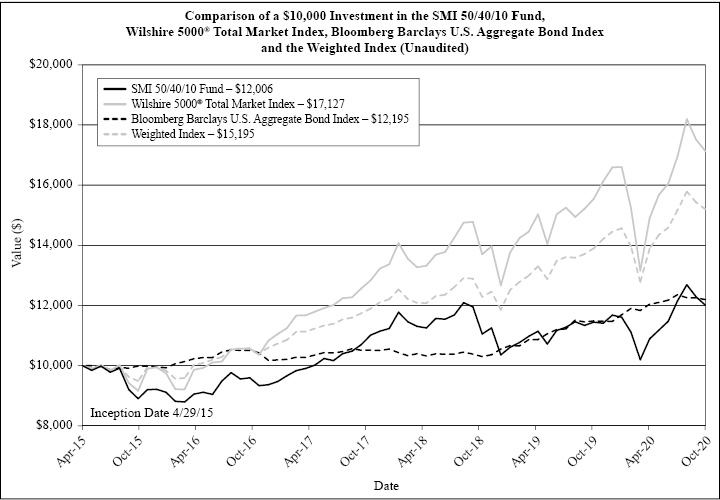
The chart above assumes an initial investment of $10,000 made on April 29, 2015 (commencement of Fund operations) and held through October 31, 2020. THE FUND’S RETURN REPRESENTS PAST PERFORMANCE AND DOES NOT GUARANTEE FUTURE RESULTS. The returns shown do not reflect deduction of taxes that a shareholder would pay on Fund distributions or the redemption of Fund shares. Investment returns and principal values will fluctuate so that your shares, when redeemed, may be worth more or less than their original purchase price. The information presented above, for the periods prior to April 28, 2018 is historical information for the Former SMI 50/40/10 Fund.
Current performance of the Fund may be lower or higher than the performance quoted. For more information on the Fund, and to obtain performance data current to the most recent month end or to request a prospectus, please call (877) 764-3863. You should carefully consider the investment objectives, potential risks, management fees, and charges and expenses of the Fund before investing. The Fund’s prospectus contains this and other information about the Fund, and should be read carefully before investing.
The Weighted Index is comprised of 60% Wilshire 5000® Total Market Index and 40% Bloomberg Barclays U.S. Aggregate Bond Index.
The Fund is distributed by Ultimus Fund Distributors, LLC, member FINRA/SIPC.
8
FUND HOLDINGS – (Unaudited)

(a) | As a percentage of net assets. |
Sound Mind Investing Fund seeks long-term capital appreciation. The Fund seeks to achieve its objective by investing in a diversified portfolio of other investment companies using a “Stock Upgrading” strategy. The Stock Upgrading investment strategy is a systematic investment approach that is based on the belief of the Adviser that superior returns can be obtained by constantly monitoring the performance of a wide universe of other investment companies, and standing ready to move assets into the funds deemed by the Adviser to be most attractive at the time of analysis.
9
FUND HOLDINGS – (Unaudited), (Continued)

(a) | As a percentage of net assets. |
SMI Dynamic Allocation Fund seeks total return. Total return is composed of both income and capital appreciation. The Fund uses a “Dynamic Asset Allocation” investment strategy to achieve its investment objective. This is done by investing in open-end mutual funds and exchange-traded funds (“ETFs”) that invest in securities from the following six asset classes – U.S. Equities, International Equities, Fixed Income Securities, Real Estate, Precious Metals, and Cash.
10
FUND HOLDINGS – (Unaudited), (Continued)
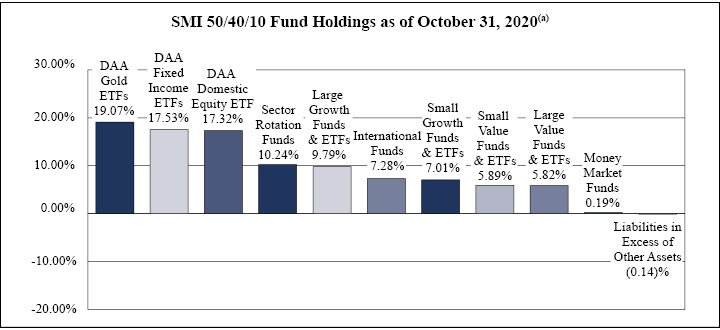
(a) | As a percentage of net assets. |
SMI 50/40/10 Fund seeks total return. Total return is composed of both income and capital appreciation. The Adviser allocates the Fund’s assets on a 50/40/10 basis among various investment strategies as follows:
| | ● | 50% - Dynamic Asset Allocation Strategy (“DAA”) |
| | ● | 40% - Stock Upgrading Strategy |
| | ● | 10% - Sector Rotation Strategy |
The “Sector Rotation Strategy” involves the Adviser selecting from a universe of mutual funds and ETFs it has compiled using proprietary methods (“Underlying Funds”). This universe is specifically designed by the Adviser to balance exposure to a wide variety of market sectors and industries. This universe includes leveraged, non-leveraged and inverse Underlying Funds. The Adviser ranks these Underlying Funds based on their recent performance across multiple short-term performance periods, then uses an upgrading approach to invest in the top performing market sector or sectors. Once a particular sector or sectors is identified, the Adviser purchases one or more Underlying Funds to gain the desired exposure to that particular sector. This portion of the Fund may be concentrated, meaning that the Fund may be invested in as few as one or two sectors at a time and potentially as few as one Underlying Fund.
Availability of Portfolio Schedules – (Unaudited)
Each Fund files their complete schedules of portfolio holdings with the Securities and Exchange Commission (“SEC”) for the first and third quarters of each fiscal year as an exhibit to its reports on Form N-PORT. The Funds’ Form N-PORT reports are available on the SEC’s website at http://www.sec.gov.
11
SOUND MIND INVESTING FUND
SCHEDULE OF INVESTMENTS
October 31, 2020
EXCHANGE-TRADED FUNDS – 18.05% | | Shares | | | Fair Value | |
Invesco QQQ Trust Series 1 | | | 19,800 | | | $ | 5,333,724 | |
Invesco S&P 500® Top 50 ETF | | | 37,720 | | | | 9,529,204 | |
Renaissance IPO ETF | | | 36,760 | | | | 1,862,997 | |
Vanguard Mid-Cap ETF | | | 32,880 | | | | 5,791,483 | |
Total Exchange-Traded Funds (Cost $21,129,231) | | | | | | | 22,517,408 | |
MUTUAL FUNDS – 81.78% | | | | | | | | |
Akre Focus Fund, Institutional Class | | | 101 | | | | 4,935 | |
Allianz NFJ Dividend Value Fund, Institutional Class | | | 200 | | | | 1,986 | |
Allianz NFJ Small-Cap Value Fund, Institutional Class | | | 162 | | | | 2,207 | |
American Century Equity Income Fund, Investor Class | | | 100 | | | | 813 | |
American Century International Opportunities Fund, Institutional Class | | | 360 | | | | 4,274 | |
AMG Yacktman Focused Fund, Institutional Class | | | 100 | | | | 1,745 | |
AMG Yacktman Fund, Institutional Class | | | 100 | | | | 1,942 | |
Artisan International Small Cap Fund, Investor Class | | | 100 | | | | 1,685 | |
Artisan International Value Fund, Investor Class | | | 150 | | | | 4,818 | |
Artisan Mid Cap Value Fund, Investor Class | | | 279 | | | | 4,530 | |
Artisan Small Cap Fund, Investor Class | | | 125 | | | | 5,454 | |
Baron Focused Growth Fund, Institutional Class | | | 300,715 | | | | 9,683,030 | |
BlackRock International Opportunities Portfolio, Institutional Class | | | 100 | | | | 2,857 | |
BNY Mellon Opportunistic Small Cap Fund, Investor Class | | | 100 | | | | 2,630 | |
Bridgeway Small-Cap Growth Fund, Class N | | | 205 | | | | 4,632 | |
Bridgeway Ultra-Small Company Market Fund, Class N | | | 100 | | | | 1,060 | |
Buffalo Small Cap Fund, Inc. | | | 150 | | | | 2,639 | |
Centre American Select Equity Fund, Institutional Class | | | 317,220 | | | | 3,793,951 | |
Champlain Small Company Fund, Institutional Class | | | 100 | | | | 1,988 | |
Chartwell Small Cap Value Fund | | | 118 | | | | 1,745 | |
Columbia Acorn Fund, Class Z | | | 137 | | | | 2,125 | |
Columbia Acorn International, Class Z | | | 100 | | | | 3,185 | |
Columbia Contrarian Core Fund, Class Z | | | 91 | | | | 2,551 | |
Columbia Small Cap Growth Fund I, Class Z | | | 100 | | | | 2,747 | |
Davis Opportunity Fund, Class Y | | | 100 | | | | 3,445 | |
Delaware Select Growth Fund, Institutional Class | | | 100 | | | | 3,640 | |
Delaware Small Cap Value Fund, Institutional Class | | | 100 | | | | 5,043 | |
Delaware Value Fund, Institutional Class | | | 144 | | | | 2,685 | |
Deutsche Small Cap Core Fund, Institutional Class | | | 52 | | | | 1,450 | |
DFA International Small Cap Value Portfolio, Institutional Class | | | 100 | | | | 1,565 | |
DFA International Small Company Portfolio, Institutional Class | | | 100 | | | | 1,684 | |
DFA U.S. Small Cap Value Portfolio, Institutional Class | | | 100 | | | | 2,734 | |
See accompanying notes which are an integral part of these financial statements.
12
SOUND MIND INVESTING FUND
SCHEDULE OF INVESTMENTS
October 31, 2020 – (Continued)
MUTUAL FUNDS – 81.78% – continued | | Shares | | | Fair Value | |
Fairholme Fund | | | 100 | | | $ | 2,175 | |
Fidelity Advisor Growth Opportunities Fund, Institutional Class | | | 94,076 | | | | 12,640,040 | |
Fidelity Mid-Cap Stock Fund | | | 150 | | | | 4,866 | |
Fidelity Small Cap Discovery Fund | | | 100 | | | | 2,008 | |
Fidelity Small Cap Stock Fund | | | 150 | | | | 2,541 | |
Fidelity Small Cap Value Fund | | | 150 | | | | 1,971 | |
Franklin Small Cap Value Fund, Advisor Class | | | 100 | | | | 4,462 | |
Hartford International Opportunities Fund (The), Class Y | | | 248 | | | | 4,344 | |
Heartland Value Fund | | | 100 | | | | 3,500 | |
Hennessy Cornerstone Mid Cap 30 Fund, Institutional Class | | | 201,230 | | | | 2,778,979 | |
Hennessy Focus Fund, Investor Class | | | 50 | | | | 3,584 | |
Invesco American Value Fund, Class Y | | | 141 | | | | 4,134 | |
Invesco Oppenheimer International Small-Mid Company Fund, Class Y | | | 100 | | | | 5,129 | |
Janus Henderson Contrarian Fund, Class T | | | 282,089 | | | | 6,496,520 | |
Janus Henderson Mid Cap Value Fund, Class T | | | 200 | | | | 2,740 | |
Janus Henderson Overseas Fund, Class T | | | 100 | | | | 3,246 | |
Janus Henderson Venture Fund, Class T | | | 100 | | | | 8,527 | |
JOHCM International Select Fund, Institutional Class | | | 100 | | | | 2,680 | |
JPMorgan Mid Cap Value Fund, Institutional Class | | | 100 | | | | 3,374 | |
JPMorgan Small Cap Equity Fund, Select Class | | | 100 | | | | 5,817 | |
JPMorgan Small Cap Growth Fund, Class L | | | 100 | | | | 2,550 | |
JPMorgan U.S. Large Cap Core Plus Fund, Institutional Class | | | 251,794 | | | | 6,788,370 | |
JPMorgan U.S. Large Cap Core Plus Fund, Class A | | | 95,639 | | | | 2,528,692 | |
JPMorgan U.S. Research Enhanced Equity Fund, Institutional Class | | | 100 | | | | 2,832 | |
Longleaf Partners Fund | | | 150 | | | | 2,741 | |
Longleaf Partners International Fund | | | 150 | | | | 2,067 | |
Longleaf Partners Small-Cap Fund | | | 100 | | | | 2,135 | |
Lord Abbett Developing Growth Fund, Inc., Institutional Class | | | 100 | | | | 3,397 | |
MainStay Mackay U.S. Equity Opportunities Fund, Institutional Class | | | 100 | | | | 770 | |
Miller Opportunity Trust, Institutional Class | | | 194,333 | | | | 6,228,386 | |
Morgan Stanley International Opportunity Portfolio, Institutional Class | | | 272,835 | | | | 9,666,557 | |
Morgan Stanley Discovery Portfolio, Institutional Class | | | 241,856 | | | | 9,115,543 | |
Morgan Stanley Growth Portfolio, Institutional Class | | | 100 | | | | 8,236 | |
Morgan Stanley Multi-Cap Growth Trust, Institutional Class | | | 128,536 | | | | 10,604,230 | |
Needham Small Cap Growth Fund, Institutional Class | | | 157,940 | | | | 3,591,557 | |
Neuberger Berman Genesis Fund, Institutional Class | | | 100 | | | | 6,208 | |
Nicholas Fund, Inc. | | | 50 | | | | 3,539 | |
Oakmark International Fund, Investor Class | | | 150 | | | | 2,903 | |
Oakmark International Small Cap Fund, Institutional Class | | | 150 | | | | 2,024 | |
See accompanying notes which are an integral part of these financial statements.
13
SOUND MIND INVESTING FUND
SCHEDULE OF INVESTMENTS
October 31, 2020 – (Continued)
MUTUAL FUNDS – 81.78% – continued | | Shares | | | Fair Value | |
Oakmark Select Fund, Institutional Class | | | 150 | | | $ | 5,799 | |
Polen Growth Fund, Institutional Class | | | 100 | | | | 4,139 | |
PRIMECAP Odyssey Aggressive Growth Fund | | | 100 | | | | 4,807 | |
Principal SmallCap Growth Fund I, Institutional Class | | | 200 | | | | 3,112 | |
Prudential Jennison International Opportunities, Class Z | | | 246,106 | | | | 7,028,795 | |
Royce Micro-Cap Fund, Investment Class | | | 106 | | | | 1,085 | |
Royce Opportunity Fund, Investment Class | | | 100 | | | | 1,176 | |
Royce Premier Fund, Investment Class | | | 300 | | | | 3,507 | |
Royce Special Equity Fund, Institutional Class | | | 150 | | | | 2,487 | |
T. Rowe Price International Discovery Fund, Investor Class | | | 75 | | | | 5,972 | |
T. Rowe Price Mid-Cap Growth Fund, Investor Class | | | 50 | | | | 5,046 | |
T. Rowe Price New Horizons Fund, Investor Class | | | 100 | | | | 8,068 | |
T. Rowe Price Small-Cap Value Fund, Investor Class | | | 100 | | | | 4,368 | |
Thornburg Value Fund, Institutional Class | | | 100 | | | | 7,855 | |
TIAA-CREF International Equity Fund, Institutional Class | | | 100 | | | | 1,091 | |
Touchstone Sands Capital Select Growth Fund, Class Y | | | 100 | | | | 1,865 | |
Tweedy Browne Global Value Fund | | | 150 | | | | 3,497 | |
Vanguard International Growth Fund, Admiral Shares | | | 66,446 | | | | 8,883,168 | |
Vanguard Strategic Equity Fund, Investor Class | | | 100 | | | | 3,054 | |
Victory RS Small Cap Growth Fund, Class Y | | | 100 | | | | 9,215 | |
Wasatch Emerging Markets Small Cap Fund, Investor Class | | | 1,000 | | | | 3,090 | |
Wasatch International Growth Fund, Investor Class | | | 150 | | | | 5,123 | |
Wasatch Micro Cap Fund, Investor Class | | | 201,832 | | | | 1,945,663 | |
Total Mutual Funds (Cost $85,607,720) | | | | | | | 102,047,131 | |
MONEY MARKET FUNDS – 0.34% | | | | | | | | |
Fidelity Investments Money Market Government Portfolio, Institutional Class, 0.02%(a) | | | 423,589 | | | | 423,589 | |
Total Money Market Funds (Cost $423,589) | | | | | | | 423,589 | |
Total Investments — 100.17% (Cost $107,160,540) | | | | | | $ | 124,988,128 | |
Liabilities in Excess of Other Assets — (0.17)% | | | | | | | (212,779 | ) |
NET ASSETS — 100.00% | | | | | | $ | 124,775,349 | |
(a) | Rate disclosed is the seven day effective yield as of October 31, 2020. |
ETF - Exchange-Traded Fund
See accompanying notes which are an integral part of these financial statements.
14
SMI DYNAMIC ALLOCATION FUND
SCHEDULE OF INVESTMENTS
October 31, 2020
CLOSED-END FUNDS – 3.11% | | Shares | | | Fair Value | |
Sprott Physical Gold Trust | | | 234,840 | | | $ | 3,524,948 | |
Total Closed End Funds (Cost $3,287,145) | | | | | | | 3,524,948 | |
EXCHANGE-TRADED FUNDS — 96.72% | | | | | | | | |
Invesco DB Gold Fund(a) | | | 588,590 | | | | 32,320,183 | |
SPDR S&P 500® ETF(a) | | | 114,210 | | | | 37,294,134 | |
VanEck Vectors Gold Miners ETF | | | 45,600 | | | | 1,709,544 | |
VanEck Vectors Junior Gold Miners ETF | | | 8,300 | | | | 441,643 | |
Vanguard Long-Term Bond ETF(a) | | | 344,360 | | | | 37,703,976 | |
Total Exchange-Traded Funds (Cost $101,861,858) | | | | | | | 109,469,480 | |
MONEY MARKET FUNDS – 0.24% | | | | | | | | |
Fidelity Investments Money Market Government Portfolio, Institutional Class, 0.02%(b) | | | 275,716 | | | | 275,716 | |
Total Money Market Funds (Cost $275,716) | | | | | | | 275,716 | |
Total Investments — 100.07% (Cost $105,424,719) | | | | | | $ | 113,270,144 | |
Liabilities in Excess of Other Assets — (0.07)% | | | | | | | (75,412 | ) |
NET ASSETS — 100.00% | | | | | | $ | 113,194,732 | |
(a) | Represents an investment greater than 25% of the Fund’s net assets. Performance of the Fund may be adversely impacted by concentrated investments in securities. The financial statements and portfolio holdings for these securities can be found at www.sec.gov. As of October 31, 2020, the percentage of net assets invested in Invesco DB Gold Fund, SPDR S&P 500 ETF and Vanguard Long-Term Bond ETF were 28.55%, 32.95% and 33.31%, respectively, of the Fund. |
(b) | Rate disclosed is the seven day effective yield as of October 31, 2020. |
ETF - Exchange-Traded Fund
SPDR - Standard & Poor’s Depositary Receipt
See accompanying notes which are an integral part of these financial statements.
15
SMI 50/40/10 FUND
SCHEDULE OF INVESTMENTS
October 31, 2020
EXCHANGE-TRADED FUNDS – 72.81% | | Shares | | | Fair Value | |
ARK Innovation ETF | | | 63,500 | | | $ | 5,765,165 | |
Invesco DB Gold Fund | | | 171,980 | | | | 9,443,628 | |
Invesco QQQ Trust Series 1 | | | 4,970 | | | | 1,338,819 | |
Invesco S&P 500® Top 50 ETF | | | 7,360 | | | | 1,859,357 | |
Renaissance IPO ETF | | | 18,270 | | | | 925,924 | |
SPDR S&P 500® ETF | | | 29,860 | | | | 9,750,483 | |
VanEck Vectors Gold Miners ETF | | | 17,210 | | | | 645,203 | |
VanEck Vectors Junior Gold Miners ETF | | | 12,120 | | | | 644,905 | |
Vanguard Long-Term Bond ETF | | | 90,150 | | | | 9,870,524 | |
Vanguard Mid-Cap ETF | | | 4,240 | | | | 746,834 | |
Total Exchange-Traded Funds (Cost $38,027,863) | | | | | | | 40,990,842 | |
MUTUAL FUNDS – 27.14% | | | | | | | | |
AMG Yacktman Focused Fund, Institutional Class | | | 100 | | | | 1,745 | |
Baron Focused Growth Fund, Institutional Class | | | 31,009 | | | | 998,480 | |
Centre American Select Equity Fund, Institutional Class | | | 59,172 | | | | 707,692 | |
Fidelity Advisor Growth Opportunities Fund, Institutional Class | | | 20,181 | | | | 2,711,485 | |
Hennessy Cornerstone Mid Cap 30 Fund, Institutional Class | | | 53,850 | | | | 743,675 | |
Invesco Oppenheimer International Small-Mid Company Fund, Class Y | | | 100 | | | | 5,129 | |
Janus Henderson Contrarian Fund, Class T | | | 40,345 | | | | 929,139 | |
JPMorgan U.S. Large Cap Core Plus Fund, Class A | | | 26,779 | | | | 708,034 | |
Longleaf Partners International Fund | | | 150 | | | | 2,067 | |
Lord Abbett Developing Growth Fund, Inc., Institutional Class | | | 100 | | | | 3,397 | |
Miller Opportunity Trust, Institutional Class | | | 27,837 | | | | 892,184 | |
Morgan Stanley International Opportunity Portfolio, Institutional Class | | | 38,913 | | | | 1,378,698 | |
Morgan Stanley Discovery Portfolio, Institutional Class | | | 42,840 | | | | 1,614,627 | |
Morgan Stanley Multi-Cap Growth Trust, Institutional Class | | | 17,735 | | | | 1,463,161 | |
Needham Small Cap Growth Fund, Institutional Class | | | 17,699 | | | | 402,475 | |
Oakmark International Fund, Investor Class | | | 50 | | | | 968 | |
Prudential Jennison International Opportunities, Class Z | | | 47,760 | | | | 1,364,034 | |
Royce Opportunity Fund, Investment Class | | | 100 | | | | 1,176 | |
Vanguard International Growth Fund, Admiral Shares | | | 10,060 | | | | 1,344,873 | |
Wasatch International Growth Fund, Investor Class | | | 100 | | | | 3,415 | |
Total Mutual Funds (Cost $12,748,719) | | | | | | | 15,276,454 | |
See accompanying notes which are an integral part of these financial statements.
16
SMI 50/40/10 FUND
SCHEDULE OF INVESTMENTS
October 31, 2020 – (Continued)
MONEY MARKET FUNDS – 0.19% | | Shares | | | Fair Value | |
Fidelity Investments Money Market Government Portfolio, Institutional Class, 0.02%(a) | | | 105,119 | | | $ | 105,119 | |
Total Money Market Funds (Cost $105,119) | | | | | | | 105,119 | |
Total Investments — 100.14% (Cost $50,881,701) | | | | | | $ | 56,372,415 | |
Liabilities in Excess of Other Assets — (0.14)% | | | | | | | (80,980 | ) |
NET ASSETS — 100.00% | | | | | | $ | 56,291,435 | |
(a) | Rate disclosed is the seven day effective yield as of October 31, 2020. |
ETF - Exchange-Traded Fund
SPDR - Standard & Poor’s Depositary Receipt
See accompanying notes which are an integral part of these financial statements.
17
SMI FUNDS
STATEMENTS OF ASSETS AND LIABILITIES
October 31, 2020
| | | Sound Mind
Investing Fund | | | SMI Dynamic
Allocation Fund | | | SMI
50/40/10 Fund | |
Assets | | | | | | | | | | | | |
Investments in securities at fair value (cost $107,160,540, $105,424,719 and $50,881,701) (Note 3) | | $ | 124,988,128 | | | $ | 113,270,144 | | | $ | 56,372,415 | |
Receivable for fund shares sold | | | 6,758 | | | | 32,568 | | | | 14,184 | |
Receivable for investments sold | | | 956,217 | | | | 37,842,022 | | | | 10,436,897 | |
Dividends receivable | | | 22 | | | | 9 | | | | 7 | |
Prepaid expenses | | | 18,191 | | | | 11,185 | | | | 8,355 | |
Total Assets | | | 125,969,316 | | | | 151,155,928 | | | | 66,831,858 | |
| | | | | | | | | | | | | |
Liabilities | | | | | | | | | | | | |
Payable for fund shares redeemed | | | 91,773 | | | | 3,333 | | | | 20,963 | |
Payable for investments purchased | | | 945,689 | | | | 37,820,344 | | | | 10,440,729 | |
Payable to Adviser (Note 4) | | | 112,742 | | | | 100,196 | | | | 45,141 | |
Payable to Administrator (Note 4) | | | 7,515 | | | | 6,014 | | | | 3,357 | |
Payable to trustees | | | 2,034 | | | | 2,013 | | | | 1,720 | |
Other accrued expenses | | | 34,214 | | | | 29,296 | | | | 28,513 | |
Total Liabilities | | | 1,193,967 | | | | 37,961,196 | | | | 10,540,423 | |
Net Assets | | $ | 124,775,349 | | | $ | 113,194,732 | | | $ | 56,291,435 | |
| | | | | | | | | | | | | |
Net Assets consist of: | | | | | | | | | | | | |
Paid-in capital | | | 119,290,167 | | | | 100,091,324 | | | | 53,982,585 | |
Accumulated earnings | | | 5,485,182 | | | | 13,103,408 | | | | 2,308,850 | |
Net Assets | | $ | 124,775,349 | | | $ | 113,194,732 | | | $ | 56,291,435 | |
Shares outstanding (unlimited number of shares authorized, no par value) | | | 12,510,671 | | | | 9,090,044 | | | | 5,698,771 | |
Net asset value, offering and redemption price per share (Note 2) | | $ | 9.97 | | | $ | 12.45 | | | $ | 9.88 | |
See accompanying notes which are an integral part of these financial statements.
18
SMI FUNDS
STATEMENTS OF OPERATIONS
For the year ended October 31, 2020
| | | Sound Mind
Investing Fund | | | SMI Dynamic
Allocation Fund | | | SMI
50/40/10 Fund | |
Investment Income | | | | | | | | | | | | |
Dividend income | | $ | 1,083,733 | | | $ | 1,875,203 | | | $ | 732,313 | |
Total investment income | | | 1,083,733 | | | | 1,875,203 | | | | 732,313 | |
| | | | | | | | | | | | | |
Expenses | | | | | | | | | | | | |
Investment Adviser fees (Note 4) | | | 1,320,930 | | | | 1,149,768 | | | | 527,679 | |
Administration fees (Note 4) | | | 38,796 | | | | 34,093 | | | | 17,319 | |
Registration fees | | | 32,037 | | | | 28,120 | | | | 25,965 | |
Transfer agent fees (Note 4) | | | 25,291 | | | | 10,380 | | | | 10,056 | |
Legal fees | | | 22,404 | | | | 22,403 | | | | 22,403 | |
Fund accounting fees (Note 4) | | | 20,242 | | | | 17,776 | | | | 9,033 | |
Audit and tax preparation fees | | | 17,500 | | | | 17,500 | | | | 14,500 | |
Printing and postage expenses | | | 17,033 | | | | 14,668 | | | | 8,432 | |
Insurance expenses | | | 10,860 | | | | 9,356 | | | | 5,832 | |
Custodian fees | | | 10,763 | | | | 6,226 | | | | 5,765 | |
Compliance service fees (Note 4) | | | 8,100 | | | | 8,100 | | | | 8,100 | |
Trustee fees | | | 7,981 | | | | 7,672 | | | | 6,265 | |
Line of credit fees | | | 6,024 | | | | 5,064 | | | | 2,647 | |
Interest expense | | | 1,236 | | | | 265 | | | | 1,716 | |
Miscellaneous expenses | | | 47,752 | | | | 36,313 | | | | 30,859 | |
Total expenses | | | 1,586,949 | | | | 1,367,704 | | | | 696,571 | |
Fees contractually waived by Adviser | | | — | | | | — | | | | (18,349 | ) |
Net operating expenses | | | 1,586,949 | | | | 1,367,704 | | | | 678,222 | |
Net investment income (loss) | | | (503,216 | ) | | | 507,499 | | | | 54,091 | |
| | | | | | | | | | | | | |
Net Realized and Change in Unrealized Gain (Loss) on Investments | | | | | | | | | | | | |
Long term capital gain dividends from investment companies | | | 3,011,228 | | | | 65,462 | | | | 465,258 | |
Net realized gain (loss) on investment securities transactions | | | (4,819,482 | ) | | | 6,164,434 | | | | 958,023 | |
Net change in unrealized appreciation (depreciation) on investment securities | | | 7,174,100 | | | | (2,860,800 | ) | | | 1,024,760 | |
Net realized and change in unrealized gain on investments | | | 5,365,846 | | | | 3,369,096 | | | | 2,448,041 | |
Net increase in net assets resulting from operations | | $ | 4,862,630 | | | $ | 3,876,595 | | | $ | 2,502,132 | |
See accompanying notes which are an integral part of these financial statements.
19
SOUND MIND INVESTING FUND
STATEMENTS OF CHANGES IN NET ASSETS
| | | For the Year
Ended
October 31, 2020 | | | For the Year
Ended
October 31, 2019 | |
Increase (Decrease) in Net Assets due to: | | | | | | | | |
Operations | | | | | | | | |
Net investment income (loss) | | $ | (503,216 | ) | | $ | 709,947 | |
Long term capital gain dividends from investment companies | | | 3,011,228 | | | | 6,889,793 | |
Net realized loss on investment securities transactions | | | (4,819,482 | ) | | | (16,922,243 | ) |
Net change in unrealized appreciation of investment securities | | | 7,174,100 | | | | 15,285,250 | |
Net increase in net assets resulting from operations | | | 4,862,630 | | | | 5,962,747 | |
| | | | | | | | | |
Distributions to Shareholders from Earnings (Note 2) | | | (706,878 | ) | | | (31,686,762 | ) |
| | | | | | | | | |
Capital Transactions | | | | | | | | |
Proceeds from shares sold | | | 6,831,421 | | | | 9,534,328 | |
Reinvestment of distributions | | | 693,203 | | | | 31,137,671 | |
Amount paid for shares redeemed | | | (34,554,822 | ) | | | (41,770,932 | ) |
Net decrease in net assets resulting from capital transactions | | | (27,030,198 | ) | | | (1,098,933 | ) |
Total Decrease in Net Assets | | | (22,874,446 | ) | | | (26,822,948 | ) |
| | | | | | | | | |
Net Assets | | | | | | | | |
Beginning of year | | | 147,649,795 | | | | 174,472,743 | |
End of year | | $ | 124,775,349 | | | $ | 147,649,795 | |
| | | | | | | | | |
Share Transactions | | | | | | | | |
Shares sold | | | 744,801 | | | | 1,016,592 | |
Shares issued in reinvestment of distributions | | | 69,320 | | | | 3,689,298 | |
Shares redeemed | | | (3,614,487 | ) | | | (4,368,826 | ) |
Net increase (decrease) in shares outstanding | | | (2,800,366 | ) | | | 337,064 | |
See accompanying notes which are an integral part of these financial statements.
20
SMI DYNAMIC ALLOCATION FUND
STATEMENTS OF CHANGES IN NET ASSETS
| | | For the Year
Ended
October 31, 2020 | | | For the Year
Ended
October 31, 2019 | |
Increase (Decrease) in Net Assets due to: | | | | | | | | |
Operations | | | | | | | | |
Net investment income | | $ | 507,499 | | | $ | 1,246,765 | |
Long term capital gain dividends from investment companies | | | 65,462 | | | | — | |
Net realized gain on investment securities transactions | | | 6,164,434 | | | | 4,523,670 | |
Net change in unrealized appreciation (depreciation) of investment securities | | | (2,860,800 | ) | | | 890,142 | |
Net increase in net assets resulting from operations | | | 3,876,595 | | | | 6,660,577 | |
| | | | | | | | | |
Distributions to Shareholders from Earnings (Note 2) | | | (1,402,469 | ) | | | (1,904,317 | ) |
| | | | | | | | | |
Capital Transactions | | | | | | | | |
Proceeds from shares sold | | | 14,919,092 | | | | 10,593,607 | |
Reinvestment of distributions | | | 1,379,020 | | | | 1,855,382 | |
Amount paid for shares redeemed | | | (24,916,503 | ) | | | (30,864,920 | ) |
Net decrease in net assets resulting from capital transactions | | | (8,618,391 | ) | | | (18,415,931 | ) |
Total Decrease in Net Assets | | | (6,144,265 | ) | | | (13,659,671 | ) |
| | | | | | | | | |
Net Assets | | | | | | | | |
Beginning of year | | | 119,338,997 | | | | 132,998,668 | |
End of year | | $ | 113,194,732 | | | $ | 119,338,997 | |
| | | | | | | | | |
Share Transactions | | | | | | | | |
Shares sold | | | 1,215,642 | | | | 923,300 | |
Shares issued in reinvestment of distributions | | | 115,592 | | | | 168,060 | |
Shares redeemed | | | (2,043,773 | ) | | | (2,699,471 | ) |
Net decrease in shares outstanding | | | (712,539 | ) | | | (1,608,111 | ) |
See accompanying notes which are an integral part of these financial statements.
21
SMI 50/40/10 FUND
STATEMENTS OF CHANGES IN NET ASSETS
| | | For the Year
Ended
October 31, 2020 | | | For the Year
Ended
October 31, 2019 | |
Increase (Decrease) in Net Assets due to: | | | | | | | | |
Operations | | | | | | | | |
Net investment income | | $ | 54,091 | | | $ | 334,016 | |
Long term capital gain dividends from investment companies | | | 465,258 | | | | 1,095,968 | |
Net realized gain (loss) on investment securities transactions | | | 958,023 | | | | (4,904,653 | ) |
Net change in unrealized appreciation of investment securities | | | 1,024,760 | | | | 5,538,418 | |
Net increase in net assets resulting from operations | | | 2,502,132 | | | | 2,063,749 | |
| | | | | | | | | |
Distributions to Shareholders from Earnings (Note 2) | | | (279,593 | ) | | | (2,086,727 | ) |
| | | | | | | | | |
Capital Transactions | | | | | | | | |
Proceeds from shares sold | | | 4,779,527 | | | | 12,088,587 | |
Reinvestment of distributions | | | 274,667 | | | | 2,049,221 | |
Amount paid for shares redeemed | | | (13,599,005 | ) | | | (17,805,897 | ) |
Net decrease in net assets resulting from capital transactions | | | (8,544,811 | ) | | | (3,668,089 | ) |
Total Decrease in Net Assets | | | (6,322,272 | ) | | | (3,691,067 | ) |
| | | | | | | | | |
Net Assets | | | | | | | | |
Beginning of year | | | 62,613,707 | | | | 66,304,774 | |
End of year | | $ | 56,291,435 | | | $ | 62,613,707 | |
| | | | | | | | | |
Share Transactions | | | | | | | | |
Shares sold | | | 506,503 | | | | 1,336,143 | |
Shares issued in reinvestment of distributions | | | 28,641 | | | | 239,395 | |
Shares redeemed | | | (1,455,132 | ) | | | (1,964,177 | ) |
Net decrease in shares outstanding | | | (919,988 | ) | | | (388,639 | ) |
See accompanying notes which are an integral part of these financial statements.
22
THIS PAGE INTENTIONALLY LEFT BLANK
SOUND MIND INVESTING FUND
FINANCIAL HIGHLIGHTS
(For a share outstanding during each year)
| | | For the Year
Ended
October 31,
2020 | |
Selected Per Share Data: | | | | |
Net asset value, beginning of year | | $ | 9.64 | |
| | | | | |
Income from investment operations: | | | | |
Net investment income (loss)(a) | | | (0.04 | ) |
Net realized and unrealized gain on investments | | | 0.42 | |
Total from investment operations | | | 0.38 | |
| | | | | |
Less distributions to shareholders from: | | | | |
Net investment income | | | (0.05 | ) |
Net realized gains | | | — | |
Total distributions | | | (0.05 | ) |
Paid in capital from redemption fees | | | — | |
Net asset value, end of year | | $ | 9.97 | |
| | | | | |
Total Return(d) | | | 3.92 | % |
| | | | | |
Ratios and Supplemental Data: | | | | |
Net assets, end of year (000 omitted) | | $ | 124,775 | |
Ratio of expenses to average net assets(e) | | | 1.20 | % |
Ratio of expenses to average net assets excluding interest expenses(e) (f) | | | 1.20 | % |
Ratio of net investment income (loss) to average net assets(a) (e) | | | (0.38 | )% |
Portfolio turnover rate | | | 214.07 | % |
(a) | Recognition of net investment income by the Fund is affected by the timing of the declaration of dividends by the underlying funds in which the Fund invests. |
(b) | The amount shown for a share outstanding throughout the year does not correspond with the change in aggregate gains and losses in the portfolio of securities during the year because of the timing of sales and purchases of fund shares in relation to fluctuating values during the year. |
(c) | Rounds to less than $0.005 per share. |
(d) | Total return in the above table represents the rate that the investor would have earned or lost on an investment in the Fund, assuming reinvestment of distributions. |
(e) | These ratios exclude the impact of expenses of the underlying funds in which the Fund invests as represented in the Schedule of Investments. |
(f) | These ratios do not include the effects of line of credit interest expense and borrowing costs. |
See accompanying notes which are an integral part of these financial statements.
24
SOUND MIND INVESTING FUND
FINANCIAL HIGHLIGHTS
(For a share outstanding during each year) – (Continued)
| | For the Year
Ended
October 31,
2019 | | | For the Year
Ended
October 31,
2018 | | | For the Year
Ended
October 31,
2017 | | | For the Year
Ended
October 31,
2016 | |
| | | | | | | | | | | | | | | | |
| | $ | 11.65 | | | $ | 12.52 | | | $ | 10.30 | | | $ | 11.76 | |
| | | | | | | | | | | | | | | | |
| | | | | | | | | | | | | | | | |
| | | 0.05 | | | | 0.04 | | | | (0.05 | ) | | | 0.01 | |
| | | 0.14 | | | | 0.26 | | | | 2.27 | | | | 0.04 | (b) |
| | | 0.19 | | | | 0.30 | | | | 2.22 | | | | 0.05 | |
| | | | | | | | | | | | | | | | |
| | | | | | | | | | | | | | | | |
| | | (0.05 | ) | | | — | | | | — | | | | — | |
| | | (2.15 | ) | | | (1.17 | ) | | | — | | | | (1.51 | ) |
| | | (2.20 | ) | | | (1.17 | ) | | | — | | | | (1.51 | ) |
| | | — | | | | — | | | | — | (c) | | | — | (c) |
| | $ | 9.64 | | | $ | 11.65 | | | $ | 12.52 | | | $ | 10.30 | |
| | | | | | | | | | | | | | | | |
| | | 4.28 | % | | | 2.36 | % | | | 21.55 | % | | | 0.55 | % |
| | | | | | | | | | | | | | | | |
| | | | | | | | | | | | | | | | |
| | $ | 147,650 | | | $ | 174,473 | | | $ | 196,564 | | | $ | 194,678 | |
| | | 1.18 | % | | | 1.16 | % | | | 1.15 | % | | | 1.16 | % |
| | | 1.17 | % | | | 1.16 | % | | | 1.15 | % | | | 1.15 | % |
| | | 0.45 | % | | | 0.34 | % | | | (0.41 | )% | | | 0.15 | % |
| | | 192.77 | % | | | 163.54 | % | | | 176.40 | % | | | 131.40 | % |
See accompanying notes which are an integral part of these financial statements.
25
SMI DYNAMIC ALLOCATION FUND
FINANCIAL HIGHLIGHTS
(For a share outstanding during each year)
| | | For the Year
Ended
October 31,
2020 | |
Selected Per Share Data: | | | | |
Net asset value, beginning of year | | $ | 12.17 | |
| | | | | |
Income from investment operations: | | | | |
Net investment income(a) | | | 0.06 | |
Net realized and unrealized gain (loss) on investments | | | 0.37 | |
Total from investment operations | | | 0.43 | |
| | | | | |
Less distributions to shareholders from: | | | | |
Net investment income | | | (0.15 | ) |
Net realized gains | | | — | |
Total distributions | | | (0.15 | ) |
Paid in capital from redemption fees | | | — | |
Net asset value, end of year | | $ | 12.45 | |
| | | | | |
Total Return(c) | | | 3.55 | % |
| | | | | |
Ratios and Supplemental Data: | | | | |
Net assets, end of year (000 omitted) | | $ | 113,195 | |
Ratio of expenses to average net assets(d) | | | 1.19 | % |
Ratio of expenses to average net assets excluding interest expenses(d) (e) | | | 1.19 | % |
Ratio of net investment income to average net assets(a) (d) | | | 0.44 | % |
Portfolio turnover rate | | | 275.33 | % |
(a) | Recognition of net investment income by the Fund is affected by the timing of the declaration of dividends by the underlying funds in which the Fund invests. |
(b) | Rounds to less than $0.005 per share. |
(c) | Total return in the above table represents the rate that the investor would have earned or lost on an investment in the Fund, assuming reinvestment of distributions. |
(d) | These ratios exclude the impact of expenses of the underlying funds in which the Fund invests as represented in the Schedule of Investments. |
(e) | These ratios do not include the effects of line of credit interest expense and borrowing costs. |
See accompanying notes which are an integral part of these financial statements.
26
SMI DYNAMIC ALLOCATION FUND
FINANCIAL HIGHLIGHTS
(For a share outstanding during each year) – (Continued)
| | For the Year
Ended
October 31,
2019 | | | For the Year
Ended
October 31,
2018 | | | For the Year
Ended
October 31,
2017 | | | For the Year
Ended
October 31,
2016 | |
| | | | | | | | | | | | | | | | |
| | $ | 11.66 | | | $ | 11.75 | | | $ | 10.92 | | | $ | 10.99 | |
| | | | | | | | | | | | | | | | |
| | | | | | | | | | | | | | | | |
| | | 0.12 | | | | 0.18 | | | | 0.07 | | | | 0.09 | |
| | | 0.56 | | | | (0.16 | ) | | | 0.79 | | | | (0.02 | ) |
| | | 0.68 | | | | 0.02 | | | | 0.86 | | | | 0.07 | |
| | | | | | | | | | | | | | | | |
| | | | | | | | | | | | | | | | |
| | | (0.17 | ) | | | (0.11 | ) | | | (0.03 | ) | | | (0.14 | ) |
| | | — | | | | — | | | | — | | | | — | |
| | | (0.17 | ) | | | (0.11 | ) | | | (0.03 | ) | | | (0.14 | ) |
| | | — | | | | — | | | | — | (b) | | | — | (b) |
| | $ | 12.17 | | | $ | 11.66 | | | $ | 11.75 | | | $ | 10.92 | |
| | | | | | | | | | | | | | | | |
| | | 5.97 | % | | | 0.15 | % | | | 7.87 | % | | | 0.62 | % |
| | | | | | | | | | | | | | | | |
| | | | | | | | | | | | | | | | |
| | $ | 119,339 | | | $ | 132,999 | | | $ | 162,002 | | | $ | 180,404 | |
| | | 1.18 | % | | | 1.16 | % | | | 1.16 | % | | | 1.15 | % |
| | | 1.17 | % | | | 1.16 | % | | | 1.15 | % | | | 1.15 | % |
| | | 1.02 | % | | | 1.45 | % | | | 0.57 | % | | | 0.80 | % |
| | | 218.06 | % | | | 61.28 | % | | | 247.10 | % | | | 151.88 | % |
See accompanying notes which are an integral part of these financial statements.
27
SMI 50/40/10 FUND
FINANCIAL HIGHLIGHTS
(For a share outstanding during each year)
| | | For the Year
Ended
October 31,
2020 | |
Selected Per Share Data: | | | | |
Net asset value, beginning of year | | $ | 9.46 | |
| | | | | |
Income from investment operations: | | | | |
Net investment income (loss)(b) | | | 0.01 | |
Net realized and unrealized gain (loss) on investments | | | 0.45 | |
Total from investment operations | | | 0.46 | |
| | | | | |
Less distributions to shareholders from: | | | | |
Net investment income | | | (0.04 | ) |
Net realized gains | | | — | |
Total distributions | | | (0.04 | ) |
Paid in capital from redemption fees | | | — | |
Net asset value, end of year | | $ | 9.88 | |
| | | | | |
Total Return(e) | | | 4.91 | % |
| | | | | |
Ratios and Supplemental Data: | | | | |
Net assets, end of year (000 omitted) | | $ | 56,291 | |
Ratio of expenses to average net assets(f) | | | 1.16 | % |
Ratio of expenses to average net assets excluding interest expenses(f) (g) | | | 1.15 | % |
Ratio of expenses to average net assets before waiver and reimbursement(f) | | | 1.19 | % |
Ratio of net investment income (loss) to average net assets(b) (f) | | | 0.09 | % |
Portfolio turnover rate | | | 252.74 | % |
(a) | As described in Note 1 of the Notes to the Financial Statements, the Former 50/40/10 Fund was reorganized into the SMI Conservative Allocation Fund as of the close of business, April 27, 2018 and subsequently renamed the SMI 50/40/10 Fund (the “Fund”). The Fund is the successor to the Former 50/40/10 Fund. The performance and financial information presented incorporates the operations of the Former 50/40/10 Fund, which, is a result of the reorganization, are the Fund’s operations. The per share amounts have been adjusted for a stock split that occurred on April 27, 2018. |
(b) | Recognition of net investment income by the Fund is affected by the timing of the declaration of dividends by the underlying funds in which the Fund invests. |
(c) | Per share net investment income has been determined on the basis of average shares outstanding during the year. |
(d) | Rounds to less than $0.005 per share. |
(e) | Total return in the above table represents the rate that the investor would have earned or lost on an investment in the Fund, assuming reinvestment of distributions. |
(f) | These ratios exclude the impact of expenses of the underlying funds in which the Fund invests as represented in the Schedule of Investments. |
(g) | These ratios do not include the effects of line of credit interest expense and borrowing costs. |
See accompanying notes which are an integral part of these financial statements.
28
SMI 50/40/10 FUND
FINANCIAL HIGHLIGHTS
(For a share outstanding during each year) – (Continued)
| | For the Year
Ended
October 31,
2019 | | | For the Year
Ended
October 31,
2018(a) | | | For the Year
Ended
October 31,
2017(a) | | | For the Year
Ended
October 31,
2016(a) | |
| | | | | | | | | | | | | | | | |
| | $ | 9.46 | | | $ | 9.65 | | | $ | 8.20 | | | $ | 8.13 | |
| | | | | | | | | | | | | | | | |
| | | | | | | | | | | | | | | | |
| | | 0.04 | | | | 0.10 | (c) | | | (0.01 | ) | | | 0.03 | |
| | | 0.26 | | | | (0.04 | ) | | | 1.49 | | | | 0.08 | |
| | | 0.30 | | | | 0.06 | | | | 1.48 | | | | 0.11 | |
| | | | | | | | | | | | | | | | |
| | | | | | | | | | | | | | | | |
| | | (0.06 | ) | | | (0.11 | ) | | | (0.03 | ) | | | (0.04 | ) |
| | | (0.24 | ) | | | (0.14 | ) | | | — | | | | — | |
| | | (0.30 | ) | | | (0.25 | ) | | | (0.03 | ) | | | (0.04 | ) |
| | | — | | | | — | | | | — | (d) | | | — | (d) |
| | $ | 9.46 | | | $ | 9.46 | | | $ | 9.65 | | | $ | 8.20 | |
| | | | | | | | | | | | | | | | |
| | | 3.55 | % | | | 0.36 | % | | | 17.99 | % | | | 1.44 | % |
| | | | | | | | | | | | | | | | |
| | | | | | | | | | | | | | | | |
| | $ | 62,614 | | | $ | 66,305 | | | $ | 22,007 | | | $ | 18,363 | |
| | | 1.16 | % | | | 1.24 | % | | | 1.46 | % | | | 1.45 | % |
| | | 1.15 | % | | | 1.23 | % | | | 1.45 | % | | | 1.45 | % |
| | | 1.21 | % | | | 1.39 | % | | | 1.56 | % | | | 1.76 | % |
| | | 0.53 | % | | | 1.03 | % | | | (0.17 | )% | | | 0.30 | % |
| | | 225.42 | % | | | 155.28 | % | | | 212.36 | % | | | 146.24 | % |
See accompanying notes which are an integral part of these financial statements.
29
SMI FUNDS
NOTES TO THE FINANCIAL STATEMENTS
October 31, 2020
NOTE 1. ORGANIZATION
The Sound Mind Investing Fund (“SMI Fund”), SMI Dynamic Allocation Fund and SMI 50/40/10 Fund (formerly, the SMI Conservative Allocation Fund) (each a “Fund” and collectively, the “Funds”) are each a diversified series of Valued Advisers Trust (the “Trust”). The Trust is a management investment company established under the laws of Delaware by an Agreement and Declaration of Trust dated June 13, 2008 (the “Trust Agreement”). The Trust Agreement permits the Board of Trustees (the “Board” or the “Trustees”) to issue an unlimited number of shares of beneficial interest of separate series without par value. Each Fund is one of a series of funds currently authorized by the Trustees. The investment adviser to the Funds is SMI Advisory Services, LLC (the “Adviser”). The SMI Fund seeks to provide long-term capital appreciation. The SMI Dynamic Allocation Fund and SMI 50/40/10 Fund seek total return.
Each of the Funds is a “fund-of-funds” in which each Fund may invest in other investment companies, including exchange-traded and closed-end funds. For a discussion on the strategies employed by each of the Funds, please refer to pages 1-2 of this report.
At the close of business on April 27, 2018, the SMI Conservative Allocation Fund was renamed the SMI 50/40/10 Fund and acquired all of the assets and assumed all of the liabilities of the previous SMI 50/40/10 Fund (the “Former 50/40/10 Fund”), pursuant to an agreement and plan of reorganization approved by the Board on December 12, 2017. The reorganization qualified as a tax-free reorganization for federal income tax purposes with no gain or loss recognized to the Funds or their shareholders. The SMI 50/40/10 Fund is considered the surviving entity for tax purposes.
Due to the reorganization on April 27, 2018, the number of outstanding shares of the Former 50/40/10 Fund increased by a factor of 1.132099; and since the Former 50/40/10 Fund’s total number of shares outstanding increased, the net asset value decreased. The reorganization did not affect the value of the Former 50/40/10 Fund’s net assets or each shareholder’s proportional ownership interest in those assets. The per share data presented in the Financial Highlights have been adjusted for periods prior to April 27, 2018 as a result.
NOTE 2. SIGNIFICANT ACCOUNTING POLICIES
The Funds are investment companies and follow accounting and reporting guidance under Financial Accounting Standards Board Accounting Standards Codification (“ASC”) Topic 946, “Financial Services-Investment Companies.” The following is a summary of significant accounting policies followed by the Funds in the preparation of their financial statements. These policies are in conformity with the generally accepted accounting principles in the United States of America (“GAAP”).
Estimates – The preparation of financial statements in conformity with GAAP requires management to make estimates and assumptions that affect the reported amounts of assets and liabilities and disclosure of contingent assets and liabilities at the date of the financial statements and the reported amounts of increases and decreases in net assets from operations during the reporting period. Actual results could differ from those estimates.
30
SMI FUNDS
NOTES TO THE FINANCIAL STATEMENTS
October 31, 2020 – (Continued)
NOTE 2. SIGNIFICANT ACCOUNTING POLICIES – (Continued)
Federal Income Taxes – The Funds make no provision for federal income or excise tax. Each Fund has qualified and intends to qualify each year as a regulated investment company (“RIC”) under subchapter M of the Internal Revenue Code of 1986, as amended, by complying with the requirements applicable to RICs and by distributing substantially all of its taxable income. Each Fund also intends to distribute sufficient net investment income and net capital gains, if any, so that it will not be subject to excise tax on undistributed income and gains. If the required amount of net investment income or gains is not distributed, the Fund could incur a tax expense.
As of and during the fiscal year ended October 31, 2020, the Funds did not have any liabilities for any unrecognized tax benefits. The Funds recognize interest and penalties, if any, related to unrecognized tax benefits as income tax expense on the Statements of Operations when incurred. During the fiscal year ended October 31, 2020, the Funds did not incur any interest or penalties. Management of the Funds has reviewed tax positions taken in tax years that remain subject to examination by all major tax jurisdictions, including federal (i.e., the last three tax year ends and the interim tax period since then, as applicable). Management believes that there is no tax liability resulting from unrecognized tax benefits related to uncertain tax positions taken.
Expenses – Expenses incurred by the Trust that do not relate to a specific fund of the Trust are allocated to the individual funds based on each fund’s relative net assets or another appropriate basis (as determined by the Board).
Security Transactions and Related Income – The Funds follow industry practice and record security transactions on the trade date for financial reporting purposes. The specific identification method is used for determining gains or losses for financial statement and income tax purposes. Dividend income and long-term capital gains dividends from investment companies are recorded on the ex-dividend date and interest income is recorded on an accrual basis. Discounts and premiums on securities purchased are accreted or amortized using the effective interest method, if applicable. Withholding taxes on foreign dividends, if any, have been provided for in accordance with the Funds’ understanding of the applicable country’s tax rules and rates.
Dividends and Distributions – Each Fund intends to distribute its net investment income and net realized long-term and short-term capital gains, if any, at least annually. Dividends and distributions to shareholders, which are determined in accordance with income tax regulations, are recorded on the ex-dividend date. The treatment for financial reporting purposes of distributions made to shareholders during the period from net investment income or net realized capital gains may differ from their ultimate treatment for federal income tax purposes. These differences are caused primarily by differences in the timing of the recognition of certain components of income, expense or realized capital gain for federal income tax purposes. Where such differences are permanent in nature, they are reclassified among the components of the net assets based on their ultimate characterization for federal income tax purposes. Any such reclassifications will have no effect on net assets, results of operations or net asset value (“NAV”) per share of the Funds.
31
SMI FUNDS
NOTES TO THE FINANCIAL STATEMENTS
October 31, 2020 – (Continued)
NOTE 2. SIGNIFICANT ACCOUNTING POLICIES – (Continued)
For the fiscal year ended October 31, 2020, the Funds made the following reclassifications to increase (decrease) the component of net assets:
Fund | | Paid-In Capital | | | Accumulated
Earnings
(Deficit) | |
SMI Dynamic Allocation Fund | | $ | (7,626 | ) | | $ | 7,626 | |
SMI 50/40/10 Fund | | | 39,399 | | | | (39,399 | ) |
NOTE 3. SECURITIES VALUATION AND FAIR VALUE MEASUREMENTS
Each Fund values its portfolio securities at fair value as of the close of regular trading on the New York Stock Exchange (the “NYSE”) (normally 4:00 p.m. Eastern time) on each business day the NYSE is open for business. Fair value is defined as the price that a Fund would receive upon selling an investment in a timely transaction to an independent buyer in the principal or most advantageous market of the investment. GAAP establishes a three-tier hierarchy to maximize the use of observable market data and minimize the use of unobservable inputs and to establish classification of fair value measurements for disclosure purposes.
Inputs refer broadly to the assumptions that market participants would use in pricing the asset or liability, including assumptions about risk (the risk inherent in a particular valuation technique used to measure fair value including a pricing model and/or the risk inherent in the inputs to the valuation technique). Inputs may be observable or unobservable. Observable inputs are inputs that reflect the assumptions market participants would use in pricing the asset or liability developed based on market data obtained and available from sources independent of the reporting entity. Unobservable inputs are inputs that reflect the reporting entity’s own assumptions about the assumptions market participants would use in pricing the asset or liability developed based on the best information available in the circumstances.
Various inputs are used in determining the value of each Fund’s investments. These inputs are summarized in the three broad levels listed below.
| | ● | Level 1 – unadjusted quoted prices in active markets for identical investments and/or registered investment companies where the value per share is determined and published and is the basis for current transactions for identical assets or liabilities at the valuation date |
| | ● | Level 2 – other significant observable inputs (including, but not limited to, quoted prices for an identical security in an inactive market, quoted prices for similar securities, interest rates, prepayment speeds, credit risk, etc.) |
| | ● | Level 3 – significant unobservable inputs (including the Funds’ own assumptions in determining fair value of investments based on the best information available) |
32
SMI FUNDS
NOTES TO THE FINANCIAL STATEMENTS
October 31, 2020 – (Continued)
NOTE 3. SECURITIES VALUATION AND FAIR VALUE MEASUREMENTS – (Continued)
The inputs used to measure fair value may fall into different levels of the fair value hierarchy. In such cases, for disclosure purposes, the level in the fair value hierarchy which is reported is determined based on the lowest level input that is significant to the fair value measurement in its entirety.
Equity securities, including ETFs and closed-end funds, that are traded on any stock exchange are generally valued at the last quoted sale price on the security’s primary exchange. Lacking a last sale price, an exchange-traded security is generally valued at its last bid price. Securities traded in the NASDAQ over-the-counter market are generally valued at the NASDAQ Official Closing Price. When using the market quotations and when the market is considered active, the security is classified as a Level 1 security. In the event that market quotations are not readily available or are considered unreliable due to market or other events, a Fund values its securities and other assets at fair value in accordance with policies established by and under the general supervision of the Board. Under these policies, the securities will be classified as Level 2 or 3 within the fair value hierarchy, depending on the inputs used.
Investments in mutual funds, including money market mutual funds, are generally priced at the ending NAV. These securities are categorized as Level 1 securities. In the event that the ending NAV for a mutual fund is unavailable at the end of day pricing time, the Adviser may, in accordance with the Trust’s valuation policies, consider all appropriate factors in determining the fair value of the mutual fund. In such cases the security will generally be categorized as a Level 2 security.
In accordance with the Trust’s valuation policies, the Adviser is required to consider all appropriate factors relevant to the value of securities for which it has determined other pricing sources are not available or reliable as described above. No single method exists for determining fair value, because fair value depends upon the circumstances of each individual case. As a general principle, the current fair value of a security being valued by the Adviser would be the amount that the Fund might reasonably expect to receive upon the current sale. Methods that are in accordance with this principle may, for example, be based on (i) a multiple of earnings; (ii) a discount from market prices of a similar freely traded security (including a derivative security or a basket of securities traded on other markets, exchanges or among dealers); or (iii) yield to maturity with respect to debt issues, or a combination of these and other methods. Fair-value pricing is permitted if, in the Adviser’s opinion, the validity of market quotations appears to be questionable based on factors such as evidence of a thin market in the security based on a small number of quotations, a significant event occurs after the close of a market but before a Fund’s NAV calculation that may affect a security’s value, or the Adviser is aware of any other data that calls into question the reliability of market quotations.
| | | Valuation Inputs | |
SMI Fund | | Level 1 | | | Level 2 | | | Level 3 | | | Total | |
Exchange-Traded Funds | | $ | 22,517,408 | | | $ | — | | | $ | — | | | $ | 22,517,408 | |
Mutual Funds | | | 102,044,501 | | | | 2,630 | | | | — | | | | 102,047,131 | |
Money Market Funds | | | 423,589 | | | | — | | | | — | | | | 423,589 | |
Total | | $ | 124,985,498 | | | $ | 2,630 | | | $ | — | | | $ | 124,988,128 | |
33
SMI FUNDS
NOTES TO THE FINANCIAL STATEMENTS
October 31, 2020 – (Continued)
NOTE 3. SECURITIES VALUATION AND FAIR VALUE MEASUREMENTS – (Continued)
| | | Valuation Inputs | |
SMI Dynamic Allocation Fund | | Level 1 | | | Level 2 | | | Level 3 | | | Total | |
Closed-End Funds | | $ | 3,524,948 | | | $ | — | | | $ | — | | | $ | 3,524,948 | |
Exchange-Traded Funds | | | 109,469,480 | | | | — | | | | — | | | | 109,469,480 | |
Money Market Funds | | | 275,716 | | | | — | | | | — | | | | 275,716 | |
Total | | $ | 113,270,144 | | | $ | — | | | $ | — | | | $ | 113,270,144 | |
| | | Valuation Inputs | |
SMI 50/40/10 Fund | | Level 1 | | | Level 2 | | | Level 3 | | | Total | |
Exchange-Traded Funds | | $ | 40,990,842 | | | $ | — | | | $ | — | | | $ | 40,990,842 | |
Mutual Funds | | | 15,276,454 | | | | — | | | | — | | | | 15,276,454 | |
Money Market Funds | | | 105,119 | | | | — | | | | — | | | | 105,119 | |
Total | | $ | 56,372,415 | | | $ | — | | | $ | — | | | $ | 56,372,415 | |
The Funds did not hold any investments at the end of the reporting period for which significant unobservable inputs (Level 3) were used in determining fair value; therefore, no reconciliation of Level 3 securities is included for this reporting period.
NOTE 4. FEES AND OTHER TRANSACTIONS WITH AFFILIATES
Under the terms of the investment advisory agreement with respect to each Fund (the “Advisory Agreements”), the Adviser is responsible for managing each Fund’s investments. As compensation for its management services, each Fund is obligated to pay the Adviser a fee based on the Fund’s average daily net assets as follows:
Fund Assets | | SMI Fund
Management Fee | | | SMI Dynamic
Allocation Fund
Management Fee | | | SMI 50/40/10 Fund
Management Fee | |
$1 – $100 million | | | 1.00 | % | | | 1.00 | % | | | 0.90 | % |
$100,000,001 – $250 million | | | 1.00 | % | | | 1.00 | % | | | 0.80 | % |
$250,000,001 to $500 million | | | 0.90 | % | | | 0.90 | % | | | 0.70 | % |
Over $500 million | | | 0.80 | % | | | 0.80 | % | | | 0.60 | % |
34
SMI FUNDS
NOTES TO THE FINANCIAL STATEMENTS
October 31, 2020 – (Continued)
NOTE 4. FEES AND OTHER TRANSACTIONS WITH AFFILIATES – (Continued)
For the fiscal year ended October 31, 2020, fees earned and waived by the Adviser and amounts due to the Adviser at October 31, 2020 were as follows:
| | | SMI Fund
Management Fee | | | SMI Dynamic
Allocation Fund
Management Fee | | | SMI 50/40/10 Fund
Management Fee | |
Management fees earned | | $ | 1,320,930 | | | $ | 1,149,768 | | | $ | 527,679 | |
Fees waived by Adviser | | | — | | | | — | | | | (18,349 | ) |
Payable to Adviser | | | 112,742 | | | | 100,196 | | | | 45,141 | |
The Adviser contractually has agreed to waive its management fee and/or reimburse certain operating expenses, but only to the extent necessary so that each Fund’s total annual operating expenses (excluding interest, taxes, brokerage commissions, other expenses which are capitalized in accordance with GAAP, extraordinary expenses, dividend expense on short sales, 12b-1 fees, and acquired fund fees and expenses) do not exceed 1.50% of the Fund’s average daily net assets with respect to the SMI Fund, 1.45% with respect to the SMI Dynamic Allocation Fund, and 1.15% with respect to the SMI 50/40/10 Fund. The contractual arrangement for each Fund is in place through February 28, 2021.
Each fee waiver or expense reimbursement by the Adviser is subject to repayment by the applicable Fund within the three years following the date in which the fee waiver or expense reimbursement occurred, provided that the Fund is able to make the repayment without exceeding the expense limitation in effect at the time of the fee waiver or expense reimbursement and the expense limitation at the time of the repayment.
As of October 31, 2020, the Adviser may seek repayment of investment advisory fee waivers and expense reimbursements from the SMI 50/40/10 Fund as follows:
Recoverable through | | Amount | |
October 31, 2021 | | $ | 88,833 | |
October 31, 2022 | | | 33,330 | |
October 31, 2023 | | | 18,349 | |
The Trust retains Ultimus Fund Solutions, LLC (“Ultimus” or “Administrator”), to provide the Funds with administration, compliance (including a chief compliance officer), fund accounting, and transfer agent services, including all regulatory reporting. Expenses incurred by the Funds for these services are allocated to the individual Funds based on each Fund’s relative net assets.
The officers and one trustee of the Trust are members of management and/or employees of the Administrator and are not paid by the Trust for services to the Funds. Ultimus Fund Distributors, LLC (the “Distributor”) acts as the distributor of the Funds’ shares. The Distributor is a wholly-owned subsidiary of Ultimus.
35
SMI FUNDS
NOTES TO THE FINANCIAL STATEMENTS
October 31, 2020 – (Continued)
NOTE 4. FEES AND OTHER TRANSACTIONS WITH AFFILIATES – (Continued)
For the fiscal year ended October 31, 2020, fees for administration, compliance, fund accounting, and transfer agent services, and amounts due to the Administrator at October 31, 2020 were as follows:
| | | SMI Fund | | | SMI Dynamic
Allocation Fund | | | SMI
50/40/10 Fund | |
Administration | | $ | 38,796 | | | $ | 34,093 | | | $ | 17,319 | |
Compliance services | | | 8,100 | | | | 8,100 | | | | 8,100 | |
Fund accounting | | | 20,242 | | | | 17,776 | | | | 9,033 | |
Transfer agent | | | 25,291 | | | | 10,380 | | | | 10,056 | |
Payable to Administrator | | | 7,515 | | | | 6,014 | | | | 3,357 | |
There were no payments made to the Distributor by the Funds for the fiscal year ended October 31, 2020.
NOTE 5. PURCHASES AND SALES OF SECURITIES
For the fiscal year ended October 31, 2020, purchases and sales of investment securities, other than short-term investments were as follows:
| | | SMI Fund | | | SMI Dynamic
Allocation Fund | | | SMI
50/40/10 Fund | |
Purchases | | $ | 278,080,159 | | | $ | 310,949,269 | | | $ | 147,242,070 | |
Sales | | $ | 303,055,189 | | | $ | 319,545,425 | | | $ | 155,400,671 | |
There were no purchases or sales of long-term U.S. government obligations during the fiscal year ended October 31, 2020.
NOTE 6. LINE OF CREDIT
During the fiscal year ended October 31, 2020, the Trust, on behalf of the Funds, entered into in a short-term credit agreement (“Line of Credit”) with Huntington National Bank (“Huntington”), expiring on January 22, 2021. Under the terms of the agreement, each of the Funds may borrow up to the lesser of 10% of a Fund’s daily market value or $5 million at an interest rate equal to the London Interbank Offered Rate (“LIBOR”) plus 150 basis points, 1.65% as of October 31, 2020. The purpose of the agreement is to meet temporary or emergency cash needs, including redemption requests that might otherwise require the untimely disposition of securities. Huntington receives an annual facility fee of 0.125% on $5 million as well as an additional annual fee of 0.125% on any unused portion of the credit facility, invoiced quarterly, for providing the Line of Credit. The Funds will not borrow money, except (a) from a bank, provided that immediately after such borrowing there is an asset coverage of 300% for all borrowings of a Fund; or (b) from a bank or other persons
36
SMI FUNDS
NOTES TO THE FINANCIAL STATEMENTS
October 31, 2020 – (Continued)
NOTE 6. LINE OF CREDIT – (Continued)
for temporary purposes only, provided that such temporary borrowings are in an amount not exceeding 5% of a Fund’s total assets at the time when the borrowing is made. To the extent that the line of credit is utilized, it will be collateralized by securities in the Funds’ portfolios.
As of October 31, 2020, the Funds had no outstanding borrowings under this Line of Credit.
Fund | | Average
Daily Loan
Balance(a) | | | Weighted
Average
Interest
Rate(a) | | | Number of Days
Outstanding(b) | | | Interest
Expense
Accrued | | | Maximum
Loan
Outstanding | |
SMI Fund | | $ | 550,985 | | | | 2.98% | | | | 33 | | | $ | 1,508 | | | $ | 2,500,000 | |
SMI Dynamic Allocation Fund | | | 180,000 | | | | 2.94% | | | | 18 | | | | 265 | | | | 825,000 | |
SMI 50/40/10 Fund | | | 528,289 | | | | 2.78% | | | | 35 | | | | 1,429 | | | | 1,850,000 | |
(a) Averages based on the number of days outstanding.
(b) Number of Days Outstanding represents the total days during the fiscal year ended October 31, 2020, that a Fund utilized the Line of Credit.
NOTE 7. FEDERAL TAX INFORMATION
At October 31, 2020, the net unrealized appreciation (depreciation) and tax cost of investments for tax purposes was as follows:
| | | SMI Fund | | | SMI Dynamic
Allocation Fund | | | SMI
50/40/10 Fund | |
Gross unrealized appreciation | | $ | 17,673,270 | | | $ | 7,983,112 | | | $ | 5,546,251 | |
Gross unrealized depreciation | | | (127,860 | ) | | | (137,687 | ) | | | (156,106 | ) |
Net unrealized appreciation on investments | | $ | 17,545,410 | | | $ | 7,845,425 | | | $ | 5,390,145 | |
Tax cost of investments | | $ | 107,442,718 | | | $ | 105,424,719 | | | $ | 50,982,270 | |
37
SMI FUNDS
NOTES TO THE FINANCIAL STATEMENTS
October 31, 2020 – (Continued)
NOTE 7. FEDERAL TAX INFORMATION – (Continued)
The tax character of distributions for the fiscal years ended October 31, 2020 and October 31, 2019 were as follows:
| | | SMI Fund | | | SMI Dynamic Allocation Fund | |
| | | 2020 | | | 2019 | | | 2020 | | | 2019 | |
Distributions paid from: (a) | | | | | | | | | | | | | | | | |
Ordinary income | | $ | 706,878 | | | $ | 8,111,023 | | | $ | 1,402,469 | | | $ | 1,904,317 | |
Long-term capital gains | | | — | | | | 23,575,739 | | | | — | | | | — | |
Total taxable distributions paid | | $ | 706,878 | | | $ | 31,686,762 | | | $ | 1,402,469 | | | $ | 1,904,317 | |
| | | SMI 50/40/10 Fund | |
| | | 2020 | | | 2019 | |
Distributions paid from:(a) | | | | | | | | |
Ordinary income | | $ | 279,593 | | | $ | 473,367 | |
Long-term capital gains | | | — | | | | 1,613,360 | |
Total distributions paid | | $ | 279,593 | | | $ | 2,086,727 | |
(a) | For federal income tax purposes, distributions of short-term capital gains are treated as ordinary income distributions. |
At October 31, 2020, the components of distributable earnings (accumulated losses) on a tax basis was as follows:
| | | SMI Fund | | | SMI Dynamic
Al-location Fund | | | SMI 50/40/10
Fund | |
Undistributed ordinary income | | $ | — | | | $ | 1,407,821 | | | $ | — | |
Undistributed long-term capital gains | | | — | | | | 3,850,162 | | | | — | |
Accumulated capital and other losses | | | (12,060,228 | ) | | | — | | | | (3,081,295 | ) |
Unrealized apprecation on investments | | | 17,545,410 | | | | 7,845,425 | | | | 5,390,145 | |
Total accumulated earnings | | $ | 5,485,182 | | | $ | 13,103,408 | | | $ | 2,308,850 | |
At October 31, 2020, the difference between book basis and tax basis unrealized appreciation (depreciation) is attributable to the tax deferral of losses on wash sales.
38
SMI FUNDS
NOTES TO THE FINANCIAL STATEMENTS
October 31, 2020 – (Continued)
NOTE 7. FEDERAL TAX INFORMATION – (Continued)
At October 31, 2020, the following Funds had net capital loss carryforwards which are available to offset future net capital gains, if any:
| | | | SMI Fund | | | SMI 50/40/10 Fund | |
| | | | Short-Term | | | Long-Term | | | Short-Term | | | Long-Term | |
Non-Expiring | | | $ | 11,557,011 | | | $ | — | | | $ | 2,956,975 | | | $ | — | |
Capital loss carryforwards are available to offset future realized capital gains and thereby reduce further taxable gain distributions. During the fiscal year ended October 31, 2020, the SMI Dynamic Allocation Fund and SMI 50/40/10 Fund utilized $828,030 and $1,522,486, respectively of their capital loss carryforwards.
For the tax year ended October 31, 2020, the SMI Fund and the SMI 50/40/10 Fund deferred late year ordinary losses of $503,217 and $124,320, respectively.
NOTE 8. INVESTMENT IN OTHER INVESTMENT COMPANIES
Each Fund may invest a significant portion of its assets in shares of one or more investment companies, including ETFs, open-end and closed-end mutual funds and money market mutual funds. The Funds will incur additional indirect expenses (acquired fund fees and expenses) to the extent it invests in shares of other investment companies. As of October 31, 2020, the SMI Fund had 18.05% of the value of its net assets invested in ETFs and had 81.78% of the value of its net assets invested in open-end mutual funds. As of October 31, 2020, the SMI Dynamic Allocation Fund had 96.72% of the value of its net assets invested in ETFs and had 3.11% of the value of its net assets invested in closed-end mutual funds. As of October 31, 2020, the SMI 50/40/10 Fund had 72.81% of the value of its net assets invested in ETFs and had 27.14% of the value of its net assets invested in open-end and closed-end mutual funds. The financial statements of these ETFs and open-end mutual funds can be found at www.sec.gov.
NOTE 9. COMMITMENTS AND CONTIGENCIES
The Trust indemnifies its officers and Trustees for certain liabilities that may arise from their performance of their duties to the Trust or the Funds. Additionally, in the normal course of business, the Trust enters into contracts that contain a variety of representations and warranties which provide general indemnifications. The Trust’s maximum exposure under these arrangements is unknown, as this would involve future claims that may be made against the Trust that have not yet occurred.
39
SMI FUNDS
NOTES TO THE FINANCIAL STATEMENTS
October 31, 2020 – (Continued)
NOTE 10. SUBSEQUENT EVENTS
Management of the Funds has evaluated the need for disclosures and/or adjustments resulting from subsequent events through the date at which these financial statements were issued. Based upon this evaluation, management has determined there were no items requiring adjustment of the financial statements or additional disclosure.
NOTE 11. LIQUIDITY RISK MANAGEMENT PROGRAM (UNAUDITED)
Valued Advisers Trust has adopted and implemented a written liquidity risk management program as required by Rule 22e-4 (the “Liquidity Rule”) under the Investment Company Act of 1940, as amended (the “1940 Act”). The program is reasonably designed to assess and manage each Fund’s liquidity risk, taking into consideration, among other factors, the Fund’s investment strategy and the liquidity of its portfolio investments during normal and reasonably foreseeable stressed conditions; its short and long-term cash flow projections; and its cash holdings and access to other funding sources. The Board of Trustees approved the appointment of a Liquidity Administrator Committee, which includes representatives from SMI Advisory Services, LLC, the Funds’ investment adviser, and Ultimus Fund Solutions, LLC, the Funds’ Administrator. The Liquidity Administrator Committee is responsible for the program’s administration and oversight and for reporting to the Board on at least an annual basis regarding the program’s operation and effectiveness. The Liquidity Administrator Committee updated its assessment of each Fund’s liquidity risk profile, considering additional data gathered in the 12 months ended May 31, 2020 and the adequacy and effectiveness of the liquidity risk management program’s operations since its inception on June 1, 2019 (the “Review Period”) in order to prepare a written report for the Board of Trustees (the “Report”) for consideration at its meeting held on September 9, 2020. The Report noted that during the Review Period none of the Funds experienced unusual stress or disruption to its operations related to purchase and redemption activity. It further noted that during the Review Period each Fund held adequate levels of cash and highly liquid investments to meet shareholder redemption activities in accordance with applicable requirements. The Report concluded that (i) the Trust’s liquidity risk management program is reasonably designed to prevent violations of the Liquidity Rule and (ii) the Trust’s liquidity risk management program had been effectively implemented during the Review Period.
40
REPORT OF INDEPENDENT REGISTERED
PUBLIC ACCOUNTING FIRM
To the Shareholders of Sound Mind Investing Fund, SMI Dynamic Allocation Fund, and
SMI 50/40/10 Fund and
Board of Trustees of Valued Advisers Trust
Opinion on the Financial Statements
We have audited the accompanying statements of assets and liabilities, including the schedules of investments, of Sound Mind Investing Fund, SMI Dynamic Allocation Fund, and SMI 50/40/10 Fund (the “Funds”), each a series of Valued Advisers Trust, as of October 31, 2020, the related statements of operations for the year then ended, the statements of changes in net assets for each of the two years in the period then ended, including the related notes, and the financial highlights for each of the five years in the period then ended (collectively referred to as the “financial statements”). In our opinion, the financial statements present fairly, in all material respects, the financial position of each of the Funds as of October 31, 2020, the results of their operations for the year then ended, the changes in their net assets for each of the two years in the period then ended, and the financial highlights for each of the five years in the period then ended, in conformity with accounting principles generally accepted in the United States of America.
Basis for Opinion
These financial statements are the responsibility of the Funds’ management. Our responsibility is to express an opinion on the Funds’ financial statements based on our audits. We are a public accounting firm registered with the Public Company Accounting Oversight Board (United States) (“PCAOB”) and are required to be independent with respect to the Funds in accordance with the U.S. federal securities laws and the applicable rules and regulations of the Securities and Exchange Commission and the PCAOB.
We conducted our audits in accordance with the standards of the PCAOB. Those standards require that we plan and perform the audit to obtain reasonable assurance about whether the financial statements are free of material misstatement, whether due to error or fraud.
Our audits included performing procedures to assess the risks of material misstatement of the financial statements, whether due to error or fraud, and performing procedures that respond to those risks. Such procedures included examining, on a test basis, evidence regarding the amounts and disclosures in the financial statements. Our procedures included confirmation of securities owned as of October 31, 2020, by correspondence with the custodian and brokers. Our audits also included evaluating the accounting principles used and significant estimates made by management, as well as evaluating the overall presentation of the financial statements. We believe that our audits provide a reasonable basis for our opinion.
We have served as the auditor of one or more investment companies within SMI Funds since 2006.
COHEN & COMPANY, LTD.
Cleveland, Ohio
December 23, 2020
41
SUMMARY OF FUND EXPENSES – (Unaudited)
As a shareholder of a Fund, you incur two types of costs: (1) transaction costs and (2) ongoing costs, including management fees and other Fund expenses. These examples are intended to help you understand your ongoing costs (in dollars) of investing in each Fund and to compare these costs with the ongoing costs of investing in other mutual funds. Each Fund’s example is based on an investment of $1,000 invested at the beginning of the period and held for the entire period from May 1, 2020 through October 31, 2020.
Actual Expenses
The first line of the table below provides information about actual account values and actual expenses. You may use the information in this line, together with the amount you invested, to estimate the expenses that you paid over the period. Simply divide your account value by $1,000 (for example, an $8,600 account value divided by $1,000 = 8.6), then multiply the result by the number in the first line under the heading entitled “Expenses Paid During Period” to estimate the expenses you paid on your account during this period.
Hypothetical Example for Comparison Purposes
The second line of the table below provides information about hypothetical account values and hypothetical expenses based on the Fund’s actual expense ratio and an assumed rate of return of 5% per year before expenses, which is not the Fund’s actual return. The hypothetical account values and expenses may not be used to estimate the actual ending account balance or expenses you paid for the period. You may use this information to compare the ongoing costs of investing in the Fund and other funds. To do so, compare this 5% hypothetical example with the 5% hypothetical examples that appear in the shareholder reports of other funds.
Expenses shown in the table are meant to highlight your ongoing costs only and do not reflect any transactional costs. Therefore, the second line of the table below is useful in comparing ongoing costs only and will not help you determine the relative costs of owning different funds. In addition, if transaction costs were included, your costs would have been higher.
42
SUMMARY OF FUND EXPENSES – (Unaudited), (Continued)
| | | Beginning
Account Value
May 1, 2020 | | | Ending
Account Value
October 31, 2020 | | | Expenses Paid
During Period(a) | | | Annualized
Expense Ratio | |
SMI FUND | | | | | | | | | | | | | | | | |
Actual | | $ | 1,000.00 | | | $ | 1,167.40 | | | $ | 6.54 | | | | 1.20 | % |
Hypothetical(b) | | $ | 1,000.00 | | | $ | 1,019.10 | | | $ | 6.09 | | | | 1.20 | % |
| | | | | | | | | | | | | | | | | |
SMI DYNAMIC ALLOCATION FUND | | | | | | | | |
Actual | | $ | 1,000.00 | | | $ | 1,039.20 | | | $ | 6.10 | | | | 1.19 | % |
Hypothetical(b) | | $ | 1,000.00 | | | $ | 1,019.15 | | | $ | 6.04 | | | | 1.19 | % |
| | | | | | | | | | | | | | | | | |
SMI 50/40/10 FUND | | | | | | | | | | | | | | | | |
Actual | | $ | 1,000.00 | | | $ | 1,102.70 | | | $ | 6.13 | | | | 1.16 | % |
Hypothetical(b) | | $ | 1,000.00 | | | $ | 1,019.30 | | | $ | 5.89 | | | | 1.16 | % |
(a) | Expenses are equal to the Fund’s annualized expense ratios, multiplied by the average account value over the period, multiplied by 184/366 (to reflect the one-half year period). |
(b) | Hypothetical assumes 5% annual return before expenses. |
ADDITIONAL FEDERAL INCOME TAX INFORMATION
(Unaudited)
The Form 1099-DIV you receive in January 2021 will show the tax status of all distributions paid to your account in calendar year 2020. Shareholders are advised to consult their own tax adviser with respect to the tax consequences of their investment in the Fund. As required by the Internal Revenue Code and/or regulations, shareholders must be notified regarding the status of qualified dividend income for individuals and the dividends received deduction for corporations.
Qualified Dividend Income. The Funds designate the following percentage or up to the maximum amount of such dividends allowable pursuant to the Internal Revenue Code, as qualified dividend income eligible for the reduced tax rate.
| | | SMI Fund | | | SMI Dynamic
Allocation Fund | | | SMI 50/40/10
Fund | |
Qualified Dividend Income | | | 100 | % | | | 23 | % | | | 86 | % |
43
ADDITIONAL FEDERAL INCOME TAX INFORMATION
(Unaudited), (Continued)
Qualified Business Income. The Funds designate the following percentage of ordinary income dividends, or up to the maximum amount of such dividends allowable pursuant to the Internal Revenue Code, as qualified business income.
| | | SMI Fund | | | SMI Dynamic
Allocation Fund | | | SMI 50/40/10
Fund | |
Qualified Business Income | | | 0 | % | | | 34 | % | | | 14 | % |
Dividends Received Deduction. Corporate shareholders are generally entitled to take the dividends received deduction on the portion of the Funds’ dividend distribution that qualifies under tax law. For the Funds’ calendar year 2020 ordinary income dividends, the following percentage qualifies for the corporate dividends received deduction.
| | | SMI Fund | | | SMI Dynamic
Allocation Fund | | | SMI 50/40/10
Fund | |
Dividends Received Deduction | | | 100 | % | | | 12 | % | | | 85 | % |
The Funds designate the following amounts as long-term capital gains distributions. The amounts designated may not agree with long-term capital gains in the tax character of distribution table due to utilization of earnings and profits distributed to shareholders on redemption of shares.
| | | SMI Fund | | | SMI Dynamic
Allocation Fund | | | SMI 50/40/10
Fund | |
Long-Term Capital Gains Distributions | | $ | — | | | $ | — | | | $ | — | |
44
TRUSTEES AND OFFICERS – (Unaudited)
The Board of Trustees supervises the business activities of the Trust. Each Trustee serves as a trustee until termination of the Trust unless the Trustee dies, resigns, retires or is removed.
The following table provides information regarding each of the Independent Trustees.
Name, Address*, Age,
Position with Trust**,
Term of Position with Trust | Principal Occupation During
Past 5 Years and Other Directorships | Other Directorships |
Ira P. Cohen, 61
Independent Trustee Since June 2010 | Current: Independent financial services consultant (since February 2005); Executive Vice President of Asset Management Services, Recognos Financial (since August 2015). | Trustee and Audit Committee Chairman, Griffin Institutional Access Credit Fund (since January 2017); Trustee and Audit Committee Chairman, Griffin Institutional Real Estate Access Fund (since May 2014); Trustee, Angel Oak Funds Trust (since October 2014) (4 portfolios); Trustee, Chairman, and Nominating and Governance Committee Chairman, Angel Oak Strategic Credit Fund (since December 2017), Trustee and Chairman, Angel Oak Financial Strategies Income Term Trust (since May 2019). |
Andrea N. Mullins, 53
Independent Trustee Since December 2013 Chairperson since March 2017 | Current: Private investor; Independent Contractor, SWM Advisors (since April 2014). | Trustee, Angel Oak Funds Trust (since February 2019) (4 portfolios); Trustee, Angel Oak Strategic Credit Fund (since February 2019), Trustee, Angel Oak Financial Strategies Income Term Trust (since May 2019). |
* | The address for each Trustee and officer is 225 Pictoria Drive, Suite 450, Cincinnati, Ohio 45246. |
** | As of the date of this report, the Trust consists of 12 series. |
The following table provides information regarding the Trustee who is considered an “interested person” of the Trust, as that term is defined under the 1940 Act. Based on the experience of the Trustee, the Trust concluded that the individual described below should serve as a Trustee.
Name, Address*, Age,
Position with Trust**,
Term of Position with Trust | Principal Occupation During
Past 5 Years | Other Directorships |
Mark J. Seger***, 58
Trustee Since March 2017 | Current: Vice Chairman and Co-Founder, Ultimus Fund Solutions, LLC and its subsidiaries (since 1999). | None. |
* | The address for each Trustee and officer is 225 Pictoria Drive, Suite 450, Cincinnati, Ohio 45246. |
** | As of the date of this report, the Trust consists of 12 series. |
*** | Mr. Seger is considered an “interested person” of the Trust because of his relationship with the Trust’s administrator, transfer agent, and distributor. |
45
TRUSTEES AND OFFICERS – (Unaudited), (Continued)
The following table provides information regarding the Officers of the Trust:
Name, Address*, Age,
Position with Trust**,
Term of Position with Trust | Principal Occupation During
Past 5 Years | Other Directorships |
Adam T. Kornegay, 35 Principal Executive Officer and President Since April 2018 | Current: Vice President, Business Development Director, Ultimus Fund Solutions, LLC (since June 2018). | None. |
Kevin J. Patton, 50
Chief Compliance Officer Since March 2020 | Current: Assistant Vice President, Compliance Officer, Ultimus Fund Solutions, LLC (since January 2020). Previous: Partner and Chief Compliance Officer, Renaissance Investment Management (August 2005 to January 2020). | None. |
Carol J. Highsmith, 56
Vice President Since August 2008 Secretary Since March 2014 | Current: Vice President, Ultimus Fund Solutions, LLC (since December 2015). Previous: Employed in various positions with Huntington Asset Services, Inc. (n/k/a Ultimus Asset Services, LLC) (November 1994 to December 2015), most recently Vice President of Legal Administration (2005 to December 2015). | None. |
Matthew J. Miller, 44
Vice President Since December 2011 | Current: Assistant Vice President, Relationship Management, Ultimus Fund Solutions, LLC (since December 2015). Previous: Employed in various positions with Huntington Asset Services, Inc. (n/k/a Ultimus Asset Services, LLC) (July 1998 to December 2015), most recently Vice President of Relationship Management (2005 to December 2015). | None. |
46
TRUSTEES AND OFFICERS – (Unaudited), (Continued)
Name, Address*, Age,
Position with Trust**,
Term of Position with Trust | Principal Occupation During
Past 5 Years | Other Directorships |
Gregory T. Knoth, 50
Principal Financial Officer and Treasurer Since April 2019 | Current: Vice President, Mutual Fund Controller, Ultimus Fund Solutions, LLC (since December 2015). Previous: Vice President and Manager of Fund Accounting, Huntington Asset Services, Inc. (n/k/a Ultimus Asset Services, LLC) (June 2013 to December 2015). | None. |
Stephen L. Preston, 54
AML Officer since June 2017 | Current: Chief Compliance Officer of Ultimus Fund Distributors, LLC (since June 2011). Previous: Chief Compliance Officer, Ultimus Fund Solutions, LLC (June 2011 to August 2019); Chief Compliance Officer, Unified Financial Securities, LLC (April 2018 to December 2019). | None. |
* | The address for each Trustee and officer is 225 Pictoria Drive, Suite 450, Cincinnati, Ohio 45246. |
** | As of the date of this report, the Trust consists of 12 series. |
47
FACTS | WHAT DO THE SMI FUNDS DO WITH YOUR PERSONAL INFORMATION? |
| | |
Why? | Financial companies choose how they share your personal information. Federal law gives consumers the right to limit some but not all sharing. Federal law also requires us to tell you how we collect, share, and protect your personal information. Please read this notice carefully to understand what we do. |
| | |
What? | The types of personal information we collect and share depend on the product or service you have with us. This information can include: ● Social Security number ● account balances and account transactions ● transaction or loss history and purchase history ● checking account information and wire transfer instructions |
| | When you are no longer our customer, we continue to share your information as described in this notice. |
| | |
How? | All financial companies need to share customers’ personal information to run their everyday business. In the section below, we list the reasons financial companies can share their customers’ personal information; the reasons SMI Funds choose to share; and whether you can limit this sharing. |
| | |
Reasons we can share your personal information | Do SMI Funds share? |
For our everyday business purposes—
such as to process your transactions, maintain your account(s), respond to court orders and legal investigations, or report to credit bureaus | Yes |
For our marketing purposes—
to offer our products and services to you | No |
For joint marketing with other financial companies | No |
For our affiliates’ everyday business purposes—
information about your transactions and experiences | No |
For our affiliates’ everyday business purposes—
information about your creditworthiness | No |
For nonaffiliates to market to you | No |
| | |
Questions? | Call (877) 764-3863 |
48
Who we are |
Who is providing this notice? | SMI Funds
Ultimus Fund Distributors, LLC (Distributor)
Ultimus Fund Solutions, LLC (Administrator) |
| | |
What we do |
How do SMI Funds protect my personal information? | To protect your personal information from unauthorized access and use, we use security measures that comply with federal law. These measures include computer safeguards and secured files and buildings. Our service providers are held accountable for adhering to strict policies and procedures to prevent any misuse of your nonpublic personal information. |
How do SMI Funds collect my personal information? | We collect your personal information, for example, when you ● open an account or deposit money ● buy securities from us or sell securities to us ● make deposits or withdrawals from your account ● give us your account information ● make a wire transfer ● tell us who receives the money ● tell us where to send the money ● show your government-issued ID ● show your driver’s license |
Why can’t I limit all sharing? | Federal law gives you the right to limit only ● sharing for affiliates’ everyday business purposes—information about your creditworthiness ● affiliates from using your information to market to you ● sharing for nonaffiliates to market to you State laws and individual companies may give you additional rights to limit sharing. |
Definitions |
Affiliates | Companies related by common ownership or control. They can be financial and nonfinancial companies. ● SMI Advisory Services, LLC, the investment adviser to the Fund, could be deemed to be an affiliate. |
Nonaffiliates | Companies not related by common ownership or control. They can be financial and nonfinancial companies. ● The SMI Funds do not share your personal information with nonaffiliates so they can market to you |
Joint marketing | A formal agreement between nonaffiliated financial companies that together market financial products or services to you. ● The SMI Funds do not jointly market. |
49
OTHER INFORMATION
The Funds’ Statement of Additional Information (“SAI”) includes additional information about the trustees and is available without charge, upon request. You may call toll-free at (877) 764-3863 to request a copy of the SAI or to make shareholder inquiries.
PROXY VOTING
A description of the policies and procedures that each Fund uses to determine how to vote proxies relating to portfolio securities and information regarding how each Fund voted those proxies during the most recent twelve month period ended June 30, are available (1) without charge upon request by calling the Funds at (877) 764-3863 and (2) in Fund documents filed with the Securities and Exchange Commission (“SEC”) on the SEC’s website at www.sec.gov.
TRUSTEES Andrea N. Mullins, Chairperson Ira P. Cohen Mark J. Seger OFFICERS Adam T. Kornegay, Principal Executive Officer and President Gregory T. Knoth, Principal Financial Officer and Treasurer Kevin J. Patton, Chief Compliance Officer Carol J. Highsmith, Vice President and Secretary INVESTMENT ADVISER SMI Advisory Services, LLC 4400 Ray Boll Blvd. Columbus, IN 47203 DISTRIBUTOR Ultimus Fund Distributors, LLC 225 Pictoria Drive, Suite 450 Cincinnati, OH 45246 | INDEPENDENT REGISTERED PUBLIC ACCOUNTING FIRM Cohen & Company, Ltd. 1350 Euclid Avenue, Suite 800 Cleveland, OH 44115 LEGAL COUNSEL Troutman Pepper Hamilton Sanders LLP 3000 Two Logan Square 18th and Arch Streets Philadelphia, PA 19103 CUSTODIAN Huntington National Bank 41 South High Street Columbus, OH 43215 ADMINISTRATOR, TRANSFER AGENT AND FUND ACCOUNTANT Ultimus Fund Solutions, LLC 225 Pictoria Drive, Suite 450 Cincinnati, OH 45246 |
This report is intended only for the information of shareholders or those who have received the Funds’ prospectus which contains information about each Fund’s management fee and expenses. Please read the prospectus carefully before investing.
Distributed by Ultimus Fund Distributors, LLC
Member FINRA/SIPC
50
THIS PAGE INTENTIONALLY LEFT BLANK
THIS PAGE INTENTIONALLY LEFT BLANK
THIS PAGE INTENTIONALLY LEFT BLANK

SOUND MIND
INVESTING FUND
(SMIFX)
SMI DYNAMIC
ALLOCATION FUND
(SMIDX)
SMI 50/40/10 FUND
(SMILX)
ANNUAL REPORT |
OCTOBER 31, 2020 |
Funds’ Adviser:
SMI Advisory Services, LLC
4400 Ray Boll Blvd.
Columbus, IN 47203
(877) 764-3863
(877) SMI-FUND
www.smifund.com
Item 2. Code of Ethics.
As of the end of the period covered by this report, the registrant has adopted a code of ethics that applies to the registrant's principal executive officer, principal financial officer, principal accounting officer or controller, or persons performing similar functions, regardless of whether these individuals are employed by the registrant or a third party. Pursuant to Item 13(a)(1), a copy of registrant’s code of ethics is filed as an exhibit to this Form N-CSR. During the period covered by this report, the code of ethics has not been amended, and the registrant has not granted any waivers, including implicit waivers, from the provisions of the code of ethics.
Item 3. Audit Committee Financial Expert.
(a)(1) The registrant’s Board of Trustees has determined that the registrant has at least one audit committee financial expert serving on its audit committee.
(a)(2) The audit committee financial expert is Andrea N. Mullins, who is “independent” for purposes of this Item 3 of Form N-CSR.
Item 4. Principal Accountant Fees and Services.
| Sound Mind Investing Funds: | FY 2020 | $40,500 |
| | FY 2019 | $40,500 |
| Green Owl Intrinsic Value Fund: | FY 2020 | $13,500 |
| | FY 2019 | $13,500 |
| Foundry Partners Fundamental Small Cap Value Fund: | FY 2020 | $14,000 |
| | FY 2019 | $14,000 |
| Dana Funds: | FY 2020 | $42,000 |
| | FY 2019 | $42,000 |
| Sound Mind Investing Funds: | FY 2020 | $0 |
| | FY 2019 | $0 |
| Green Owl Intrinsic Value Fund: | FY 2020 | $0 |
| | FY 2019 | $0 |
| Foundry Partners Fundamental Small Cap Value Fund: | FY 2020 | $0 |
| | FY 2019 | $0 |
| Dana Funds: | FY 2020 | $0 |
| | FY 2019 | $0 |
| Sound Mind Investing Funds: | FY 2020 | $9,000 |
| | FY 2019 | $9,000 |
| Green Owl Intrinsic Value Fund: | FY 2020 | $3,000 |
| | FY 2019 | $3,000 |
| Foundry Partners Fundamental Small Cap Value Fund: | FY 2020 | $3,000 |
| | FY 2019 | $3,000 |
| Dana Funds: | FY 2020 | $9,000 |
| | FY 2019 | $9,000 |
Nature of the fees: Preparation of the 1120 RIC and Excise review
| Sound Mind Investing Funds: | FY 2020 | $0 |
| | FY 2019 | $0 |
| Green Owl Intrinsic Value Fund: | FY 2020 | $0 |
| | FY 2019 | $0 |
| Foundry Partners Fundamental Small Cap Value Fund: | FY 2020 | $0 |
| | FY 2019 | $0 |
| Dana Funds: | FY 2020 | $0 |
| | FY 2019 | $0 |
| (e) | (1) | Audit Committee’s Pre-Approval Policies |
The Audit Committee Charter requires the Audit Committee to be responsible for the selection, retention or termination of auditors and, in connection therewith, to (i) evaluate the proposed fees and other compensation, if any, to be paid to the auditors, (ii) evaluate the independence of the auditors, (iii) pre-approve all audit services and, when appropriate, any non-audit services provided by the independent auditors to the Trust, (iv) pre-approve, when appropriate, any non-audit services provided by the independent auditors to the Trust's investment adviser, or any entity controlling, controlled by, or under common control with the investment adviser and that provides ongoing services to the Trust if the engagement relates directly to the operations and financial reporting of the Trust, and (v) receive the auditors’ specific representations as to their independence;
| (2) | All of the services described in paragraphs (b) through (d) of Item 4 were pre-approved by the Audit Committee. |
(f) During audit of registrant's financial statements for the most recent fiscal year, less than 50 percent of the hours expended on the principal accountant's engagement were attributed to work performed by persons other than the principal accountant's full-time, permanent employees.
(g) The aggregate non-audit fees billed by the registrant's accountant for services rendered to the registrant, and rendered to the registrant's investment adviser (not including any sub-adviser whose role is primarily portfolio management and is subcontracted with or overseen by another investment adviser), and any entity controlling, controlled by, or under common control with the adviser that provides ongoing services to the registrant:
| | Registrant | Adviser |
| FY 2020 | $24,000 | $0 |
| FY 2019 | $24,000 | $0 |
(h) Not applicable. The auditor performed no services for the registrant’s investment adviser or any entity controlling, controlled by, or under common control with the investment adviser that provides ongoing services to the registrant
Item 5. Audit Committee of Listed Companies. NOT APPLICABLE – applies to listed companies only
Item 6. Schedule of Investments. Schedules filed with Item 1.
Item 7. Disclosure of Proxy Voting Policies and Procedures for Closed-End Management Investment Companies. NOT APPLICABLE – applies to closed-end funds only
Item 8. Portfolio Managers of Closed-End Investment Companies. NOT APPLICABLE – applies to closed-end funds only
Item 9. Purchases of Equity Securities by Closed-End Management Investment Company and Affiliated Purchasers. NOT APPLICABLE – applies to closed-end funds only
Item 10. Submission of Matters to a Vote of Security Holders.
The guidelines applicable to shareholders desiring to submit recommendations for nominees to the Registrant's board of trustees are contained in the statement of additional information of the Trust with respect to the Fund(s) for which this Form N-CSR is being filed.
Item 11. Controls and Procedures.
(a) Based on their evaluation of the registrant’s disclosure controls and procedures (as defined in Rule 30a-3(c) under the Investment Company Act of 1940, as amended (the “Act”)) as of a date within 90 days of the filing date of this report, the registrant’s principal executive officer and principal financial officer have concluded that such disclosure controls and procedures are reasonably designed and are operating effectively to ensure that material information relating to the registrant is made known to them by others within those entities, particularly during the period in which this report is being prepared, and that the information required in filings on Form N-CSR is recorded, processed, summarized, and reported on a timely basis.
(b) There were no changes in the registrant’s internal control over financial reporting (as defined in Rule 30a-3(d) under the Investment Company Act of 1940) that occurred during the second fiscal quarter of the period covered by this report that have materially affected, or are reasonably likely to materially affect, the registrant’s internal control over financial reporting.
Item 12. Disclosure of Securities Lending Activities for Closed-End Management Investment Companies. NOT APPLICABLE – applies to closed-end funds only
Item 13. Exhibits.
Pursuant to the requirements of the Securities Exchange Act of 1934 and the Investment Company Act of 1940, the registrant has duly caused this report to be signed on its behalf by the undersigned, thereunto duly authorized.
| (Registrant) | Valued Advisers Trust | |
| | | |
| By | /s/ Adam T. Kornegay | |
| | Adam T. Kornegay, President and Principal Executive Officer | |
| | | |
| Date | 1/5/2021 | |
Pursuant to the requirements of the Securities Exchange Act of 1934 and the Investment Company Act of 1940, this report has been signed below by the following persons on behalf of the registrant and in the capacities and on the dates indicated.
| By | /s/ Adam T. Kornegay | |
| | Adam T. Kornegay, President and Principal Executive Officer | |
| | | |
| Date | 1/5/2021 | |
| | | |
| By | /s/ Gregory Knoth | |
| | Gregory Knoth, Treasurer and Principal Financial Officer | |
| | | |
| Date | 1/5/2021 | |