united states
securities and exchange commission
washington, d.c. 20549
form n-csr
certified shareholder report of registered management
investment companies
| Investment Company Act file number | 811-22208 | |
| Valued Advisers Trust |
| (Exact name of registrant as specified in charter) |
| Ultimus Fund Solutions, LLC 225 Pictoria Drive, Suite 450 Cincinnati, OH | 45246 |
| (Address of principal executive offices) | (Zip code) |
Ultimus Fund Solutions, LLC
Attn: Gregory Knoth
225 Pictoria Drive, Suite 450
Cincinnati, OH 45246
(Name and address of agent for service)
| Registrant's telephone number, including area code: | 513-587-3400 | |
| Date of fiscal year end: | 10/31 | |
| | | |
| Date of reporting period: | 10/31/2019 | |
Item 1. Reports to Stockholders.
Dana
Foundry
Green Owl
SMI

DANA LARGE CAP EQUITY FUND
DANA SMALL CAP EQUITY FUND
DANA EPIPHANY ESG EQUITY FUND
Annual Report
October 31, 2019
Beginning on January 1, 2021, as permitted by regulations adopted by the Securities and Exchange Commission, paper copies of the Funds’ shareholder reports like this one will no longer be sent by mail, unless you specifically request paper copies of the reports from the Funds or from your financial intermediary such as a broker-dealer or bank. Instead, the reports will be made available on a website, and you will be notified by mail each time a report is posted and provided with a website link to access the report.
If you already elected to receive shareholder reports electronically, you will not be affected by this change and you need not take any action. You may elect to receive shareholder reports and other communications from the Funds electronically by contacting the Funds at (855) 280-9648 or, if you own these shares through a financial intermediary, you may contact your financial intermediary.
You may elect to receive all future reports in paper free of charge. You can inform the Funds that you wish to continue receiving paper copies of your shareholder reports by contacting the Funds at (855) 280-9648. If you own shares through a financial intermediary, you may contact your financial intermediary or follow instructions included with this document to elect to continue to receive paper copies of your shareholder reports. Your election to receive reports in paper will apply to all funds held with the fund complex or at your financial intermediary.
Dana Investment Advisors, Inc.
20700 Swenson Drive, Suite 400
Waukesha, WI 53186
(855) 280-9648
www.danafunds.com
Dear Fellow Shareholders,
We are thankful to be able to offer you this annual report for the Dana Funds for the 12-month period ended October 31, 2019. Our Fund family grew by one in the 12-month period as we reorganized an existing mutual fund into the Dana Epiphany ESG Equity Fund in December 2018. We are extremely excited to offer this opportunity to investors, and with our history of 19 years managing ESG strategies for institutional clients, believe it is a great fit. It seems you can’t read a financial publication these days without some mention of ESG Investing, and at Dana we’ve been wondering when the rest of the Investment Universe would catch on. All the Funds had positive performance for the period with the Dana Large Cap Equity Fund (the “Large Cap Fund”) leading the way at +15.55% (Institutional Class), the Dana Epiphany ESG Equity Fund (the “Epiphany ESG Fund”) following at +12.76% (Institutional Class) and the Dana Small Cap Equity Fund (the “Small Cap Fund”) generating +0.83% (Institutional Class).
As we look forward to the next 12 months, we know there will be pressures on the markets from the upcoming election cycle, Fed policy, valuations and daily rhetoric from market pundits predicting the next economic slowdown, all likely to result in volatility. Although dealing with this shorter-term volatility can be frustrating for us, a longer-term fundamental investor, we are not changing our discipline, which is designed to seek out companies that are trading at a discount to peers and exhibit sustainable growth projections, competitive business operations and quality management teams. Our belief is that these events provide opportunities for our team to find the types of companies we desire to own in our Funds for the long-term. We know you have many investment options to choose from, and we thank you for your continued trust and support of the Dana Funds.
Economic and Market Recap
With the exception of Q4 calendar year 2018 and brief pockets in Q3 calendar year 2019, momentum has continued to be the driving force behind much of the equity market’s performance. During the last 12-month period, the market has digested uncertainty surrounding a trade deal with China and tempered earnings growth expectations, a tumultuous political environment and an inverted yield curve. Nevertheless, the S&P 500® Index, similar to the Energizer Bunny, keeps going and going, posting a strong return of +14.33% while the Russell 2000® Index posted a +4.90% return during the last 12 months.
The first two months of the fiscal year were in the midst of a broad-based market sell-off as the S&P 500® Index was down -12.98% and the Russell 2000® Index was down -15.96% from October 31st through December 25th. Much of this was predicated on fears of a recession or a significant slowdown in the U.S. economy following a series of rate hikes. However, fortunes changed drastically the day after Christmas with the S&P 500® Index generating its largest one-day gain since March of 2009, and with that, the V-shape recovery was on! From December 26th through the first quarter of calendar year 2019, both indices were up in excess of +20%. The primary catalyst, aside from easing of recessionary fears, was the Federal Reserve’s ‘pause’ from raising short-term interest rates. Later in the year, we saw a direct pivot from the Fed to cut short-term rates, which provided another catalyst to the equity markets in the second half of 2019. Trade wars continued to dampen the economic growth outlook, but equity markets were resilient in moving forward, providing the best calendar year first half since 1997.
The Fed played a big role in the trailing 12-month returns by aiding in the recovery and continuation of the rally from 2 rate cuts, one in July and one in September 2019, taking short-term rates back to 2.0%. These efforts were well received by the markets, but returns slowed in the second half with
1
trade war fears weighing heavily on the investing landscape. Overall, there were signs that the market breadth was continuing to improve and that investors were paying attention to valuation. If those trends continue, it should be beneficial to active management.
Large Cap Fund Discussion
This was an excellent year with good absolute and relative performance for the Large Cap Fund (Institutional Class) with a return of +15.55% versus the S&P 500® Index return of +14.33%. Despite growth style indices outperforming value style indices, often a headwind for Dana’s relative value approach, the Large Cap Fund’s favorable stock selection across many sectors drove returns upwards and ahead of the benchmark. The Large Cap Fund was able to take advantage of the market’s pullback in late 2018, positioning itself in attractively valued securities that were driven down with the overall market swoon. This proved advantageous to performance when the market bounced back early in 2019. Relative performance strengthened during the summer and fall months of 2019.
For the full fiscal year, the performance of the Large Cap Fund’s holdings in Real Estate (REITs) and Consumer Staples delivered the strongest absolute returns. Holdings in the Materials sector delivered the only negative return and that was slight. For the S&P 500® Index, Energy was the weakest sector, down over -10%, yet favorable stock selection for the Large Cap Fund in the Energy sector contributed to positive relative return. Top performing contributors to the Large Cap Fund for the year included several Information Technology holdings such as Zebra Technologies Corp. (ZBRA), a marking, tracking and computer printing company, CDW Corp. (CDW), which provides hardware and software IT solutions including security, data center and cloud services, and stalwart, Microsoft Corp. (MSFT). Consumer Discretionary holdings, Lululemon Athletica, Inc. (LULU) and homebuilder, D.R. Horton, Inc. (DHI), rounded out the top 5 contributors to performance. Holdings that detracted most from performance included NetApp, Inc. (NTAP), a storage and data management company that revised earnings estimates downward on slowing global growth, DXC Technology Co. (DXC), a B2B services company, and Broadridge Financial Solutions, Inc. (BR). Target Corp. (TGT) and KeyCorp (KEY) also lagged the market.
Our analysis shows that the Dana Large Cap Equity Fund is trading at attractive relative valuations versus its benchmark and is performing well in terms of actual earnings and cash flow generation. We remain committed to our investment discipline as investors sort out expectations for the coming year.
Small Cap Fund Discussion
The Small Cap Fund (Institutional Class) returned +0.83% for the fiscal year versus the Russell 2000® Index return of +4.90%. Underlying market currents over the year are not reflected in the Small Cap Fund’s or benchmark index’s absolute returns. Beginning on October 31, 2018, the fiscal year started out with a strong market sell-off, and through December 25th the Russell 2000® Index dropped nearly -16%. Investors’ angst regarding Fed action and possible recession led to weakness inside some of the most cyclical sectors. The Small Cap Fund’s holdings within the Consumer Discretionary, Financials, and Industrials sectors were not immune. Relative value did not provide downside protection against benchmark holdings in these sectors as investors assumed that earnings estimates were too high and likely to fall. The following months included a strong market rebound, and by February 2019, Russell 2000® Index returns were back into positive territory for the fiscal year. The dramatic volatility and V-shaped nature of market returns during this period was a challenge for our Small Cap Fund that focuses on relative value and quality. The remainder of the fiscal year, spanning March through October, exhibited a range of returns from +5% to -5% for the Russell 2000® Index as investors digested headlines surrounding tariffs, Brexit, Middle East tensions, and threats of impeachment.
2
During the fiscal year, the Small Cap Fund realized strong returns from the Information Technology, Utilities and Real Estate sectors, while Communications Services, Energy, and Consumer Discretionary detracted from relative performance. Two of the Small Cap Fund’s top contributing holdings were Cabot Microelectronics Corp. (CCMP) and Boot Barn Holdings, Inc. (BOOT). CCMP is a market leader selling chemical polishing solutions used in microchip and wafer production. This market is important and growing as microchips become more complex. The company’s recent acquisition of KMG Chemicals adds to CCMP’s lineup of consumable products while synergies and cost reductions have led to improving profitability. We anticipate a two to three-year window of significant growth opportunities as this industry shifts to 3D NAND memory chip production. BOOT continues to execute well, and the company boasts industry-leading growth with a dominant competitive position. Exclusive brands are increasing as a percentage of BOOT’s total sales, helping to boost margins. Two of the larger detractors for the fiscal year were Weight Watchers International, Inc. (WW) and Matador Resources Co. (MTDR). WW experienced pressure in membership trends as the brand went through a marketing and digital transformation. Management credibility eroded over the Fund’s holding period and guidance appeared aggressive. For these reasons, along with a balance sheet that appeared highly levered, the Fund was led to sell its WW position. The Energy sector has been plagued by low oil prices and was the worst performing Russell 2000® Index sector for the fiscal year. Small Cap Fund holding MTDR has attractive oil and natural gas assets within the Permian Basin in West Texas; however, investors were disappointed with management’s cash flow outspend and acquisitions.
The Small Cap Fund continues to seek opportunities to add value through a relative value discipline that focuses on fundamentally driven stock selection and we believe the strategy will reward investors over the long-term.
Epiphany ESG Fund Discussion
As mentioned early on, we took on the Epiphany ESG Fund in December 2018, and the first order of business was to reduce the overall expenses to the shareholder. We saw this as a positive for our current shareholders and believe it will help in the future as we look to remain competitive with other active managers offering ESG mutual funds. The Epiphany ESG Fund (Institutional Class) returned a healthy +12.76% for the most recent fiscal year. Despite lagging the S&P 500® Index return of +14.33%, we are pleased with the solid performance given the repositioning necessary to transition from legacy fund holdings. Investor preference for growth style securities compared to value was also a headwind to Dana’s relative value approach. Throughout the year, the Epiphany ESG Fund adhered to its strong Environmental, Social and Governance (ESG) pillars that are integrated with our disciplined relative value approach. Relative performance improved as the year progressed, with the most recent four months outperforming the benchmark.
For the full fiscal year, the performance of the Epiphany ESG Fund’s holdings in Utilities and Real Estate (REITs) delivered the strongest absolute returns, while Energy and Industrials had the lowest returns. The Energy sector was the only negative returning sector for the year. Top performing contributors included Microsoft Corp. (MSFT), NextEra Energy, Inc. (NEE), Mastercard, Inc. (MA), and Stryker Corp. (SYK). NextEra is the world’s largest producer of wind and solar energy, providing much needed renewable energy at the expense of fossil fuels. Stryker continues to make advancements in medical technology products and services within orthopedics, neurotechnology and spine segments. The Fund’s Health Care sector was up double-digits, yet a few health-related holdings declined. These included Cigna Holding Co. (CI), Insperity, Inc. (NSP), Celgene Corp. (CNC), and Gilead Sciences, Inc. (GILD). Human resource and professional services company Insperity experienced health insurance costs from its clients that were higher than expected and the stock declined. We remain concerned about this trend and sold the position.
3
The Dana Epiphany ESG Equity Fund continues to invest in companies that meet our ESG criteria and provide growth at attractive valuations relative to peers.
Respectfully submitted,

Mark R. Mirsberger, CPA
Chief Executive Officer – Dana Investment Advisors, Inc.

Duane Roberts, CFA
Portfolio Manager and Director of Equities – Dana Investment Advisors, Inc.
4
Investment Results (Unaudited) | |
Average Annual Total Returns(a) as of October 31, 2019
| One
Year | Three
Year | Five
Year | Since
Inception
(3/1/10) | Since
Inception
(10/29/13) |
Dana Large Cap Equity Fund | | | | | |
Institutional Class | 15.55% | 15.79% | 9.67% | N/A | 10.84% |
Investor Class | 15.29% | 15.50% | 9.38% | 13.13% | N/A |
S&P 500® Index(b) | 14.33% | 14.91% | 10.78% | 13.24% | 11.66% |
| | Expense Ratios(c) |
| Institutional
Class | Investor
Class |
Gross | 0.83% | 1.08% |
With Applicable Waivers | 0.73% | 0.98% |
The performance quoted represents past performance, which does not guarantee future results. The investment return and principal value of an investment will fluctuate so that an investor’s shares, when redeemed, may be worth more or less than their original cost. The returns shown do not reflect deduction of taxes that a shareholder would pay on Dana Large Cap Equity Fund (the “Large Cap Fund”) distributions or the redemption of Large Cap Fund shares. Current performance of the Large Cap Fund may be lower or higher than the performance quoted. Performance data current to the most recent month end may be obtained by calling 1-855-280-9648.
(a) | Average annual total returns reflect any change in price per share and assume the reinvestment of all distributions. The Large Cap Fund’s returns reflect any fee reductions during the applicable period. If such reductions had not occurred, the quoted performance would have been lower. |
(b) | The S&P 500® Index (“S&P Index”) is a widely recognized unmanaged index of equity securities and is representative of a broader domestic equity market and range of securities than is found in the Large Cap Fund’s portfolio. Individuals cannot invest directly in the S&P Index; however, an individual can invest in exchange-traded funds (“ETFs”) or other investment vehicles that attempt to track the performance of a benchmark index. |
(c) | The expense ratios are from the Large Cap Fund’s prospectus dated February 28, 2019. Expense ratios with applicable waivers reflect that Dana Investment Advisors, Inc. (the “Adviser”) has contractually agreed to waive or limit its fees and to assume other expenses of the Large Cap Fund until February 29, 2020, so that total annual fund operating expenses do not exceed 0.73% of the Large Cap Fund’s average daily net assets. This operating expense limitation does not apply to brokerage fees and commissions, borrowing costs (such as interest and dividend expenses on securities sold short), taxes, extraordinary expenses, fees and expenses paid under a distribution plan adopted pursuant to Rule 12b-1, fees and expenses paid under a shareholder services plan, and indirect expenses (such as “Acquired Funds Fees and Expenses”). Each waiver or reimbursement of an expense by the Adviser is subject to repayment by the Fund within three years following the date of such waiver or reimbursement, provided that the Large Cap Fund is able to make the repayment without exceeding the expense limitation in place at the time of waiver or reimbursement and the expense limitation in place at the time of the repayment. This agreement may only be terminated by mutual consent of the Adviser and the Board of Trustees. Additional information pertaining to the Large Cap Fund’s expense ratios as of October 31, 2019 can be found in the financial highlights. |
The Large Cap Fund’s investment objectives, strategies, risks, charges and expenses must be considered carefully before investing. The prospectus contains this and other important information about the Large Cap Fund and may be obtained by calling the same number as above. Please read it carefully before investing.
The Large Cap Fund is distributed by Unified Financial Securities, LLC, member FINRA/SIPC.
5
Investment Results (Unaudited) | |
Average Annual Total Returns(a) as of October 31, 2019
| One
Year | Three
Year | Since
Inception
(11/3/15) |
Dana Small Cap Equity Fund | | | |
Institutional Class | 0.83% | 6.40% | 2.92% |
Investor Class | 0.55% | 6.12% | 2.64% |
Russell 2000® Index(b) | 4.90% | 10.96% | 8.53% |
| | Expense Ratios(c) |
| Institutional
Class | Investor
Class |
Gross | 1.72% | 1.97% |
With Applicable Waivers | 0.95% | 1.20% |
The performance quoted represents past performance, which does not guarantee future results. The investment return and principal value of an investment will fluctuate so that an investor’s shares, when redeemed, may be worth more or less than their original cost. The returns shown do not reflect deduction of taxes that a shareholder would pay on Dana Small Cap Equity Fund (the “Small Cap Fund”) distributions or the redemption of Small Cap Fund shares. Current performance of the Small Cap Fund may be lower or higher than the performance quoted. Performance data current to the most recent month end may be obtained by calling 1-855-280-9648.
(a) | Average annual returns reflect any change in price per share and assume the reinvestment of all distributions. The Small Cap Fund’s returns reflect any fee reductions during the applicable period. If such reductions had not occurred, the quoted performance would have been lower. |
(b) | The Russell 2000® Index (“Russell Index”) is a widely recognized unmanaged index of equity securities and is representative of a broader domestic equity market and range of securities than are found in the Small Cap Fund’s portfolio. Individuals can not invest directly in the Russell Index; however, an individual can invest in ETFs or other investment vehicles that attempt to track the performance of a benchmark index. |
(c) | The expense ratios are from the Small Cap Fund’s prospectus dated February 28, 2019. Expense ratios with applicable waivers reflect that the Adviser has contractually agreed to waive or limit its fees and to assume other expenses of the Small Cap Fund until February 29, 2020, so that total annual fund operating expenses do not exceed 0.95% of the Small Cap Fund’s average daily net assets. This operating expense limitation does not apply to brokerage fees and commissions, borrowing costs (such as interest and dividend expenses on securities sold short), taxes, extraordinary expenses, fees and expenses paid under a distribution plan adopted pursuant to Rule 12b-1, fees and expenses paid under a shareholder services plan, and indirect expenses (such as “Acquired Funds Fees and Expenses”). Each waiver or reimbursement of an expense by the Adviser is subject to repayment by the Small Cap Fund within three years following the date of such waiver or reimbursement, provided that the Small Cap Fund is able to make the repayment without exceeding the expense limitation in place at the time of waiver or reimbursement and the expense limitation in place at the time of the repayment. This agreement may only be terminated by mutual consent of the Adviser and the Board of Trustees. Additional information pertaining to the Small Cap Fund’s expense ratios as of October 31, 2019 can be found in the financial highlights. |
The Small Cap Fund’s investment objectives, strategies, risks, charges and expenses must be considered carefully before investing. The prospectus contains this and other important information about the Small Cap Fund and may be obtained by calling the same number as above. Please read it carefully before investing.
The Small Cap Fund is distributed by Unified Financial Securities, LLC, member FINRA/SIPC.
6
Investment Results (Unaudited) | |
Average Annual Total Returns(a) as of October 31, 2019
| One
Year | Three
Year | Five
Year | Ten
Year |
Dana Epiphany ESG Equity Fund | | | | |
Institutional Class | 12.76% | 13.66% | 7.44% | 10.56% |
Investor Class | 12.45% | 13.57% | 7.83% | 11.21% |
S&P 500® Index(b) | 14.33% | 14.91% | 10.78% | 13.70% |
| | Expense Ratios(c) |
| Institutional
Class | Investor
Class |
Gross | 1.87% | 2.12% |
With Applicable Waivers | 0.85% | 1.10% |
The performance quoted represents past performance, which does not guarantee future results. The investment return and principal value of an investment will fluctuate so that an investor’s shares, when redeemed, may be worth more or less than their original cost. The returns shown do not reflect deduction of taxes that a shareholder would pay on Dana Epiphany ESG Equity Fund (the “Epiphany ESG Fund”) distributions or the redemption of Epiphany ESG Fund shares. Current performance of the Epiphany ESG Fund may be lower or higher than the performance quoted. The Epiphany ESG Fund’s investment objectives, risks, charges and expenses must be considered carefully before investing. Performance data current to the most recent month end may be obtained by calling 1-855-280-9648.
(a) | Average annual total returns reflect any change in price per share and assume the reinvestment of all distributions. The Epiphany ESG Fund’s returns reflect any fee reductions during the applicable period. If such reductions had not occurred, the quoted performance would have been lower. Investor Class returns shown for periods prior to December 19, 2018 are for Class A shares of the Epiphany FFV Fund, the Epiphany ESG Fund’s predecessor fund, and exclude the sales load. Institutional Class returns shown for periods prior to December 19, 2018 are for Class I shares of the Epiphany FFV Fund. |
(b) | The S&P 500® Index (“S&P Index”) is a widely recognized unmanaged index of equity securities and is representative of a broader domestic equity market and range of securities than is found in the Epiphany ESG Fund’s portfolio. Individuals cannot invest directly in the S&P Index; however, an individual can invest in ETFs or other investment vehicles that attempt to track the performance of a benchmark index. |
(c) | The expense ratios are from the Epiphany ESG Fund’s prospectus dated February 28, 2019. Expense ratios with applicable waivers reflect that the Adviser has contractually agreed to waive or limit its fees and to assume other expenses of the Epiphany ESG Fund until February 28, 2021, so that total annual fund operating expenses do not exceed 0.85% of the Epiphany ESG Fund’s average net assets. This operating expense limitation does not apply to brokerage fees and commissions, borrowing costs (such as interest and dividend expenses on securities sold short), taxes, extraordinary expenses, fees and expenses paid under a distribution plan adopted pursuant to Rule 12b-1, fees and expenses paid under a shareholder services plan, and indirect expenses (such as “Acquired Funds Fees and Expenses”). Each waiver or reimbursement of an expense by the Adviser is subject to repayment by the Epiphany ESG Fund within three years following the date of such waiver or reimbursement, provided that the Epiphany ESG Fund is able to make the repayment without exceeding the expense limitation in place at the time of waiver or reimbursement and the expense limitation in place at the time of the repayment. This agreement may only be terminated by mutual consent of the Adviser and the Board of Trustees. Additional information pertaining to the Epiphany ESG Fund’s expense ratios as of October 31, 2019 can be found in the financial highlights. |
The Epiphany ESG Fund’s investment objectives, strategies, risks, charges and expenses must be considered carefully before investing. The prospectus contains this and other important information about the Epiphany ESG Fund and may be obtained by calling the same number as above. Please read it carefully before investing.
The Epiphany ESG Fund is distributed by Unified Financial Securities, LLC, member FINRA/SIPC.
7
Comparison of Growth of $10,000 Investment in the
Dana Large Cap Equity Fund, Investor Class and
the S&P 500® Index (Unaudited)

The chart above assumes an initial investment of $10,000 made on March 1, 2010 (commencement of Investor Class operations) held through October 31, 2019. THE LARGE CAP FUND’S RETURN REPRESENTS PAST PERFORMANCE AND DOES NOT GUARANTEE FUTURE RESULTS. The returns shown do not reflect deduction of taxes that a shareholder would pay on Large Cap Fund distributions or the redemption of Large Cap Fund shares. Investment returns and principal values will fluctuate so that your shares, when redeemed, may be worth more or less than their original purchase price.
Current performance may be lower or higher than the performance data quoted. For more information on the Large Cap Fund, and to obtain performance data current to the most recent month end or to request a prospectus, please call 1-855-280-9648. You should carefully consider the investment objectives, potential risks, management fees, and charges and expenses of the Large Cap Fund before investing. The Large Cap Fund’s prospectus contains this and other information about the Large Cap Fund, and should be read carefully before investing.
The Large Cap Fund is distributed by Unified Financial Securities, LLC, member FINRA/SIPC.
8
Comparison of Growth of $10,000 Investment in the
Dana Small Cap Equity Fund, Investor Class and
the Russell 2000® Index (Unaudited)

The chart above assumes an initial investment of $10,000 made on November 3, 2015 (commencement of Investor Class operations) held through October 31, 2019. THE SMALL CAP FUND’S RETURN REPRESENTS PAST PERFORMANCE AND DOES NOT GUARANTEE FUTURE RESULTS. The returns shown do not reflect deduction of taxes that a shareholder would pay on Small Cap Fund distributions or the redemption of Small Cap Fund shares. Investment returns and principal values will fluctuate so that your shares, when redeemed, may be worth more or less than their original purchase price.
Current performance may be lower or higher than the performance data quoted. For more information on the Small Cap Fund, and to obtain performance data current to the most recent month end or to request a prospectus, please call 1-855-280-9648. You should carefully consider the investment objectives, potential risks, management fees, and charges and expenses of the Small Cap Fund before investing. The Small Cap Fund’s prospectus contains this and other information about the Small Cap Fund, and should be read carefully before investing.
The Small Cap Fund is distributed by Unified Financial Securities, LLC, member FINRA/SIPC.
9
Comparison of Growth of $10,000 Investment in the
Dana Epiphany ESG Equity Fund, Investor Class and
the S&P 500® Index (Unaudited)

The chart above assumes an initial investment of $10,000 made on October 31, 2009 held through October 31, 2019. THE EPIPHANY ESG FUND’S RETURN REPRESENTS PAST PERFORMANCE AND DOES NOT GUARANTEE FUTURE RESULTS. The returns shown do not reflect deduction of taxes that a shareholder would pay on Epiphany ESG Fund distributions or the redemption of Epiphany ESG Fund shares. Investment returns and principal values will fluctuate so that your shares, when redeemed, may be worth more or less than their original purchase price.
Current performance may be lower or higher than the performance data quoted. For more information on the Epiphany ESG Fund, and to obtain performance data current to the most recent month end or to request a prospectus, please call 1-855-280-9648. You should carefully consider the investment objectives, potential risks, management fees, and charges and expenses of the Epiphany ESG Fund before investing. The Epiphany ESG Fund’s prospectus contains this and other information about the Epiphany ESG Fund, and should be read carefully before investing.
The Epiphany ESG Fund is distributed by Unified Financial Securities, LLC, member FINRA/SIPC.
10
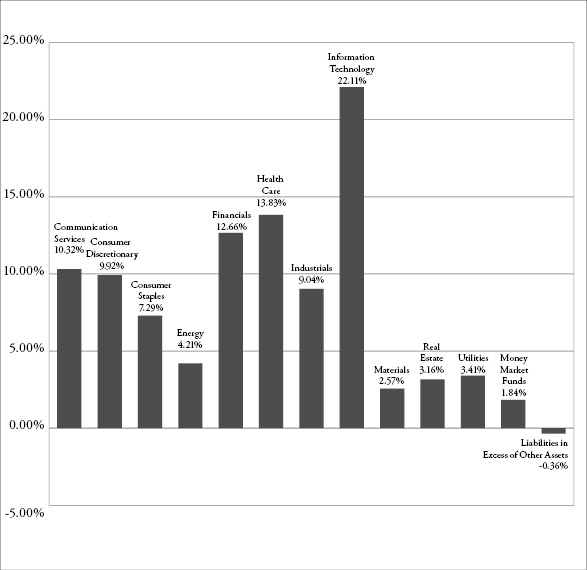
Portfolio Illustration (Unaudited)
October 31, 2019
The following chart gives a visual breakdown of the Large Cap Fund by sector weighting as a percentage of net assets as of October 31, 2019.
11
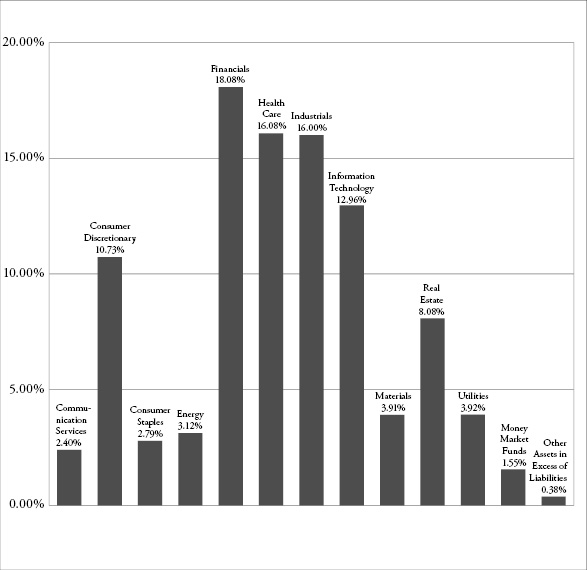
Portfolio Illustration (Unaudited)
October 31, 2019
The following chart gives a visual breakdown of the Small Cap Fund by sector weighting as a percentage of net assets as of October 31, 2019.
12
Portfolio Illustration (Unaudited)
October 31, 2019
The following chart gives a visual breakdown of the Epiphany ESG Fund by sector weighting as a percentage of net assets as of October 31, 2019.

Availability of Portfolio Schedules (Unaudited)
The Large Cap Fund, the Small Cap Fund, and the Epiphany ESG Fund (each a “Fund” and collectively the “Funds”) file their complete schedule of portfolio holdings with the Securities and Exchange Commission (“SEC”) for the first and third quarters of each fiscal year within sixty days after the end of the period. The Funds’ portfolio holdings are available at the SEC’s website at www.sec.gov.
13
Dana Large Cap Equity Fund
Schedule of Investments
October 31, 2019
| | Shares | | | Fair Value | |
COMMON STOCKS — 98.52% | | | | | | | | |
Communication Services — 10.32% | | | | | | | | |
Alphabet, Inc., Class A(a) | | | 2,300 | | | $ | 2,895,240 | |
AT&T, Inc. | | | 34,400 | | | | 1,324,056 | |
Comcast Corporation, Class A | | | 58,000 | | | | 2,599,560 | |
Facebook, Inc., Class A(a) | | | 13,500 | | | | 2,587,275 | |
T-Mobile US, Inc.(a) | | | 32,000 | | | | 2,645,120 | |
Walt Disney Company (The) | | | 12,400 | | | | 1,611,008 | |
| | | | | | | | 13,662,259 | |
Consumer Discretionary — 9.92% | | | | | | | | |
Amazon.com, Inc.(a) | | | 500 | | | | 888,330 | |
AutoZone, Inc.(a) | | | 2,000 | | | | 2,288,760 | |
Best Buy Company, Inc. | | | 35,600 | | | | 2,557,148 | |
D.R. Horton, Inc. | | | 52,000 | | | | 2,723,240 | |
Home Depot, Inc. (The) | | | 10,000 | | | | 2,345,800 | |
Royal Caribbean Cruises Ltd. | | | 21,400 | | | | 2,328,962 | |
| | | | | | | | 13,132,240 | |
Consumer Staples — 7.29% | | | | | | | | |
Ingredion, Inc. | | | 300 | | | | 23,700 | |
Kimberly-Clark Corporation | | | 17,800 | | | | 2,365,264 | |
Mondelez International, Inc., Class A | | | 45,200 | | | | 2,370,740 | |
Sysco Corporation | | | 30,400 | | | | 2,428,048 | |
Walmart, Inc. | | | 21,000 | | | | 2,462,460 | |
| | | | | | | | 9,650,212 | |
Energy — 4.21% | | | | | | | | |
Chevron Corporation | | | 15,000 | | | | 1,742,100 | |
Exxon Mobil Corporation | | | 25,000 | | | | 1,689,250 | |
Marathon Petroleum Corporation | | | 28,000 | | | | 1,790,600 | |
ONEOK, Inc. | | | 5,000 | | | | 349,150 | |
| | | | | | | | 5,571,100 | |
Financials — 12.66% | | | | | | | | |
American Express Company | | | 20,200 | | | | 2,369,056 | |
Bank of America Corporation | | | 75,000 | | | | 2,345,250 | |
Citizens Financial Group, Inc. | | | 68,000 | | | | 2,390,880 | |
JPMorgan Chase & Company | | | 19,400 | | | | 2,423,448 | |
MetLife, Inc. | | | 52,000 | | | | 2,433,080 | |
Morgan Stanley | | | 51,000 | | | | 2,348,550 | |
Starwood Property Trust, Inc. | | | 100,000 | | | | 2,460,000 | |
| | | | | | | | 16,770,264 | |
14 | See accompanying notes which are an integral part of these financial statements. | |
Dana Large Cap Equity Fund
Schedule of Investments (continued)
October 31, 2019
| | Shares | | | Fair Value | |
COMMON STOCKS — 98.52% — (continued) |
Health Care — 13.83% | | | | | | | | |
AbbVie, Inc. | | | 400 | | | $ | 31,820 | |
Amgen, Inc. | | | 12,400 | | | | 2,644,300 | |
Bristol-Myers Squibb Company | | | 46,400 | | | | 2,661,968 | |
Hill-Rom Holdings, Inc. | | | 24,800 | | | | 2,596,312 | |
Merck & Company, Inc. | | | 30,400 | | | | 2,634,464 | |
Stryker Corporation | | | 12,000 | | | | 2,595,240 | |
Thermo Fisher Scientific, Inc. | | | 8,500 | | | | 2,566,830 | |
UnitedHealth Group, Inc. | | | 10,200 | | | | 2,577,540 | |
| | | | | | | | 18,308,474 | |
Industrials — 9.04% | | | | | | | | |
Boeing Company (The) | | | 200 | | | | 67,982 | |
Delta Air Lines, Inc. | | | 44,000 | | | | 2,423,520 | |
Eaton Corporation plc | | | 28,400 | | | | 2,473,924 | |
Norfolk Southern Corporation | | | 12,800 | | | | 2,329,600 | |
Raytheon Company | | | 12,000 | | | | 2,546,520 | |
Waste Management, Inc. | | | 19,000 | | | | 2,131,990 | |
| | | | | | | | 11,973,536 | |
Information Technology — 22.11% | | | | | | | | |
Accenture plc, Class A | | | 12,300 | | | | 2,280,666 | |
Adobe, Inc.(a) | | | 2,800 | | | | 778,204 | |
Apple, Inc. | | | 12,600 | | | | 3,134,376 | |
CDW Corporation | | | 21,000 | | | | 2,686,110 | |
Cisco Systems, Inc. | | | 45,000 | | | | 2,137,950 | |
Fidelity National Information Services, Inc. | | | 19,000 | | | | 2,503,440 | |
Intel Corporation | | | 48,000 | | | | 2,713,440 | |
Lam Research Corporation | | | 10,000 | | | | 2,710,400 | |
Mastercard, Inc., Class A | | | 8,700 | | | | 2,408,247 | |
Microsoft Corporation | | | 19,600 | | | | 2,810,052 | |
Visa, Inc., Class A | | | 14,000 | | | | 2,504,040 | |
Zebra Technologies Corporation, Class A(a) | | | 11,000 | | | | 2,616,570 | |
| | | | | | | | 29,283,495 | |
Materials — 2.57% | | | | | | | | |
Albemarle Corporation | | | 300 | | | | 18,222 | |
Avery Dennison Corporation | | | 13,000 | | | | 1,662,180 | |
Packaging Corporation of America | | | 15,800 | | | | 1,729,468 | |
| | | | | | | | 3,409,870 | |
| | See accompanying notes which are an integral part of these financial statements. | 15 |
Dana Large Cap Equity Fund
Schedule of Investments (continued)
October 31, 2019
| | Shares | | | Fair Value | |
COMMON STOCKS — 98.52% — (continued) |
Real Estate — 3.16% | | | | | | | | |
American Tower Corporation, Class A | | | 8,000 | | | $ | 1,744,640 | |
Prologis, Inc. | | | 20,000 | | | | 1,755,200 | |
STORE Capital Corporation | | | 17,000 | | | | 688,500 | |
| | | | | | | | 4,188,340 | |
Utilities — 3.41% | | | | | | | | |
CenterPoint Energy, Inc. | | | 75,000 | | | | 2,180,250 | |
NextEra Energy, Inc. | | | 9,800 | | | | 2,335,732 | |
| | | | | | | | 4,515,982 | |
Total Common Stocks (Cost $109,746,340) | | | | | | | 130,465,772 | |
| | | | | | | | | |
MONEY MARKET FUNDS — 1.84% | | | | | | | | |
| | | | | | | | | |
Federated Government Obligations Fund, Institutional Class, 1.71%(b) | | | 2,437,400 | | | | 2,437,400 | |
Total Money Market Funds (Cost $2,437,400) | | | | | | | 2,437,400 | |
| | | | | | | | | |
Total Investments — 100.36% (Cost $112,183,740) | | | | | | | 132,903,172 | |
| | | | | | | | | |
Liabilities in Excess of Other Assets — (0.36)% | | | | | | | (479,253 | ) |
| | | | | | | | | |
NET ASSETS — 100.00% | | | | | | $ | 132,423,919 | |
(a) | Non-income producing security. |
(b) | Rate disclosed is the seven day effective yield as of October 31, 2019. |
16 | See accompanying notes which are an integral part of these financial statements. | |
Dana Small Cap Equity Fund
Schedule of Investments
October 31, 2019
| | Shares | | | Fair Value | |
COMMON STOCKS — 98.07% | | | | | | | | |
Communication Services — 2.40% | | | | | | | | |
Marcus Corporation (The) | | | 5,236 | | | $ | 189,019 | |
QuinStreet, Inc.(a) | | | 12,631 | | | | 162,056 | |
| | | | | | | | 351,075 | |
Consumer Discretionary — 10.73% | | | | | | | | |
Boot Barn Holdings, Inc.(a) | | | 6,098 | | | | 213,735 | |
Boyd Gaming Corporation | | | 9,634 | | | | 262,527 | |
Chegg, Inc.(a) | | | 5,639 | | | | 172,892 | |
Fox Factory Holding Corporation(a) | | | 2,916 | | | | 177,701 | |
Marriott Vacations Worldwide Corporation | | | 2,510 | | | | 275,923 | |
Ruth’s Hospitality Group, Inc. | | | 10,375 | | | | 213,518 | |
YETI Holdings, Inc.(a) | | | 7,551 | | | | 251,524 | |
| | | | | | | | 1,567,820 | |
Consumer Staples — 2.79% | | | | | | | | |
Chefs’ Warehouse, Inc. (The)(a) | | | 5,462 | | | | 180,929 | |
Performance Food Group Company(a) | | | 5,326 | | | | 226,941 | |
| | | | | | | | 407,870 | |
Energy — 3.12% | | | | | | | | |
Delek US Holdings, Inc. | | | 4,161 | | | | 166,232 | |
Matador Resources Company(a) | | | 10,576 | | | | 147,112 | |
ProPetro Holding Corporation(a) | | | 18,372 | | | | 142,383 | |
| | | | | | | | 455,727 | |
Financials — 18.08% | | | | | | | | |
Argo Group International Holdings Ltd. | | | 3,730 | | | | 230,775 | |
Banner Corporation | | | 5,319 | | | | 287,120 | |
Blackstone Mortgage Trust, Inc., Class A | | | 7,927 | | | | 287,750 | |
CenterState Banks Corporation | | | 10,074 | | | | 255,477 | |
First Bancorp | | | 7,279 | | | | 274,782 | |
Independent Bank Corporation | | | 3,410 | | | | 279,893 | |
Primerica, Inc. | | | 2,306 | | | | 290,971 | |
United Community Banks, Inc. | | | 8,101 | | | | 244,731 | |
Western Alliance Bancorporation | | | 5,071 | | | | 250,152 | |
Wintrust Financial Corporation | | | 3,761 | | | | 240,027 | |
| | | | | | | | 2,641,678 | |
Health Care — 16.08% | | | | | | | | |
ANI Pharmaceuticals, Inc.(a) | | | 3,212 | | | | 250,889 | |
BioTelemetry, Inc.(a) | | | 5,278 | | | | 207,742 | |
Coherus BioSciences, Inc.(a) | | | 10,564 | | | | 183,497 | |
CONMED Corporation | | | 2,383 | | | | 262,178 | |
| | See accompanying notes which are an integral part of these financial statements. | 17 |
Dana Small Cap Equity Fund
Schedule of Investments (continued)
October 31, 2019
| | Shares | | | Fair Value | |
COMMON STOCKS — 98.07% — (continued) |
Health Care — (continued) | | | | | | | | |
Emergent BioSolutions, Inc.(a) | | | 4,198 | | | $ | 239,958 | |
HMS Holdings Corporation(a) | | | 7,689 | | | | 251,354 | |
Horizon Therapeutics plc(a) | | | 8,127 | | | | 234,952 | |
Ligand Pharmaceuticals, Inc., Class B(a) | | | 2,283 | | | | 248,413 | |
Repligen Corporation(a) | | | 3,454 | | | | 274,557 | |
Tabula Rasa HealthCare, Inc.(a) | | | 3,864 | | | | 196,832 | |
| | | | | | | | 2,350,372 | |
Industrials — 16.00% | | | | | | | | |
Albany International Corporation, Class A | | | 3,100 | | | | 260,338 | |
ASGN, Inc.(a) | | | 3,655 | | | | 232,421 | |
Comfort Systems USA, Inc. | | | 4,467 | | | | 225,181 | |
Cubic Corporation | | | 3,419 | | | | 252,117 | |
Curtiss-Wright Corporation | | | 1,806 | | | | 244,262 | |
Harsco Corporation(a) | | | 12,521 | | | | 253,801 | |
MasTec, Inc.(a) | | | 3,601 | | | | 226,647 | |
Moog, Inc., Class A | | | 2,668 | | | | 223,338 | |
SkyWest, Inc. | | | 4,124 | | | | 245,584 | |
TriNet Group, Inc.(a) | | | 3,316 | | | | 175,715 | |
| | | | | | | | 2,339,404 | |
Information Technology — 12.96% | | | | | | | | |
Cabot Microelectronics Corporation | | | 1,670 | | | | 252,370 | |
Five9, Inc.(a) | | | 4,701 | | | | 260,953 | |
Onto Innovation, Inc.(a) | | | 6,870 | | | | 221,223 | |
Perficient, Inc.(a) | | | 6,853 | | | | 268,638 | |
Rapid7, Inc.(a) | | | 3,994 | | | | 200,059 | |
RealPage, Inc.(a) | | | 4,395 | | | | 266,118 | |
SYNNEX Corporation | | | 1,972 | | | | 232,183 | |
Upland Software, Inc.(a) | | | 5,161 | | | | 193,434 | |
| | | | | | | | 1,894,978 | |
Materials — 3.91% | | | | | | | | |
Ingevity Corporation(a) | | | 1,942 | | | | 163,536 | |
PolyOne Corporation | | | 6,504 | | | | 208,453 | |
W.R. Grace & Company | | | 3,004 | | | | 199,616 | |
| | | | | | | | 571,605 | |
Real Estate — 8.08% | | | | | | | | |
CoreSite Realty Corporation | | | 2,554 | | | | 300,095 | |
EastGroup Properties, Inc. | | | 2,192 | | | | 293,618 | |
OUTFRONT Media, Inc. | | | 10,463 | | | | 275,282 | |
18 | See accompanying notes which are an integral part of these financial statements. | |
Dana Small Cap Equity Fund
Schedule of Investments (continued)
October 31, 2019
| | Shares | | | Fair Value | |
COMMON STOCKS — 98.07% — (continued) |
Real Estate — (continued) | | | | | | | | |
STAG Industrial, Inc. | | | 10,048 | | | $ | 311,890 | |
| | | | | | | | 1,180,885 | |
Utilities — 3.92% | | | | | | | | |
Chesapeake Utilities Corporation | | | 2,990 | | | | 283,452 | |
Southwest Gas Holdings, Inc. | | | 3,325 | | | | 290,273 | |
| | | | | | | | 573,725 | |
Total Common Stocks (Cost $13,067,906) | | | | | | | 14,335,139 | |
| | | | | | | | | |
MONEY MARKET FUNDS — 1.55% | | | | | | | | |
| | | | | | | | | |
Federated Government Obligations Fund, Institutional Class, 1.71%(b) | | | 227,053 | | | | 227,053 | |
Total Money Market Funds (Cost $227,053) | | | | | | | 227,053 | |
| | | | | | | | | |
Total Investments — 99.62% (Cost $13,294,959) | | | | | | | 14,562,192 | |
| | | | | | | | | |
Other Assets in Excess of Liabilities — 0.38% | | | | | | | 55,551 | |
| | | | | | | | | |
NET ASSETS — 100.00% | | | | | | $ | 14,617,743 | |
(a) | Non-income producing security. |
(b) | Rate disclosed is the seven day effective yield as of October 31, 2019. |
| | See accompanying notes which are an integral part of these financial statements. | 19 |
Dana Epiphany ESG Equity Fund
Schedule of Investments
October 31, 2019
| | Shares | | | Fair Value | |
COMMON STOCKS — 99.01% | | | | | | | | |
Communication Services — 10.34% | | | | | | | | |
Alphabet, Inc., Class C(a) | | | 250 | | | $ | 315,028 | |
AT&T, Inc. | | | 3,800 | | | | 146,262 | |
Comcast Corporation, Class A | | | 5,500 | | | | 246,510 | |
Facebook, Inc., Class A(a) | | | 740 | | | | 141,821 | |
T-Mobile US, Inc.(a) | | | 1,200 | | | | 99,192 | |
Verizon Communications, Inc. | | | 2,160 | | | | 130,615 | |
Walt Disney Company (The) | | | 1,900 | | | | 246,848 | |
| | | | | | | | 1,326,276 | |
Consumer Discretionary — 9.97% | | | | | | | | |
Amazon.com, Inc.(a) | | | 180 | | | | 319,799 | |
Best Buy Company, Inc. | | | 3,300 | | | | 237,039 | |
D.R. Horton, Inc. | | | 4,500 | | | | 235,665 | |
Home Depot, Inc. (The) | | | 1,100 | | | | 258,037 | |
Royal Caribbean Cruises Ltd. | | | 350 | | | | 38,091 | |
Tractor Supply Company | | | 2,000 | | | | 190,040 | |
| | | | | | | | 1,278,671 | |
Consumer Staples — 7.33% | | | | | | | | |
General Mills, Inc. | | | 4,200 | | | | 213,612 | |
Kimberly-Clark Corporation | | | 1,600 | | | | 212,608 | |
PepsiCo, Inc. | | | 2,000 | | | | 274,340 | |
Sysco Corporation | | | 3,000 | | | | 239,610 | |
| | | | | | | | 940,170 | |
Energy — 4.22% | | | | | | | | |
ConocoPhillips | | | 3,300 | | | | 182,160 | |
Marathon Petroleum Corporation | | | 3,000 | | | | 191,850 | |
Schlumberger Ltd. | | | 5,100 | | | | 166,719 | |
| | | | | | | | 540,729 | |
Financials — 12.68% | | | | | | | | |
American Express Company | | | 2,100 | | | | 246,288 | |
Bank of America Corporation | | | 5,000 | | | | 156,350 | |
BB&T Corporation | | | 4,000 | | | | 212,200 | |
JPMorgan Chase & Company | | | 1,400 | | | | 174,888 | |
MetLife, Inc. | | | 4,800 | | | | 224,592 | |
Morgan Stanley | | | 5,000 | | | | 230,250 | |
Starwood Property Trust, Inc. | | | 9,000 | | | | 221,400 | |
Wintrust Financial Corporation | | | 2,500 | | | | 159,550 | |
| | | | | | | | 1,625,518 | |
20 | See accompanying notes which are an integral part of these financial statements. | |
Dana Epiphany ESG Equity Fund
Schedule of Investments (continued)
October 31, 2019
| | Shares | | | Fair Value | |
COMMON STOCKS — 99.01% — (continued) |
Health Care — 13.97% | | | | | | | | |
Becton, Dickinson and Company | | | 920 | | | $ | 235,520 | |
Bristol-Myers Squibb Company | | | 4,500 | | | | 258,165 | |
CVS Health Corporation | | | 2,000 | | | | 132,780 | |
Emergent BioSolutions, Inc.(a) | | | 3,500 | | | | 200,060 | |
Encompass Health Corporation | | | 3,200 | | | | 204,864 | |
Hill-Rom Holdings, Inc. | | | 2,100 | | | | 219,849 | |
Medtronic plc | | | 1,820 | | | | 198,198 | |
Stryker Corporation | | | 1,100 | | | | 237,897 | |
Zoetis, Inc. | | | 800 | | | | 102,336 | |
| | | | | | | | 1,789,669 | |
Industrials — 8.68% | | | | | | | | |
Allison Transmission Holdings, Inc. | | | 5,000 | | | | 218,050 | |
Delta Air Lines, Inc. | | | 4,200 | | | | 231,336 | |
Insperity, Inc. | | | 2,200 | | | | 232,386 | |
Norfolk Southern Corporation | | | 1,200 | | | | 218,400 | |
Waste Management, Inc. | | | 1,900 | | | | 213,199 | |
| | | | | | | | 1,113,371 | |
Information Technology — 22.29% | | | | | | | | |
Accenture plc, Class A | | | 1,300 | | | | 241,046 | |
ANSYS, Inc.(a) | | | 400 | | | | 88,060 | |
Apple, Inc. | | | 1,300 | | | | 323,388 | |
Automatic Data Processing, Inc. | | | 1,400 | | | | 227,122 | |
CDW Corporation | | | 1,800 | | | | 230,238 | |
Cisco Systems, Inc. | | | 5,000 | | | | 237,550 | |
Fidelity National Information Services, Inc. | | | 1,600 | | | | 210,816 | |
Intel Corporation | | | 4,500 | | | | 254,385 | |
Lam Research Corporation | | | 940 | | | | 254,778 | |
Mastercard, Inc., Class A | | | 860 | | | | 238,057 | |
Microsoft Corporation | | | 2,100 | | | | 301,077 | |
Visa, Inc., Class A | | | 1,400 | | | | 250,404 | |
| | | | | | | | 2,856,921 | |
Materials — 2.69% | | | | | | | | |
Air Products & Chemicals, Inc. | | | 780 | | | | 166,343 | |
Avery Dennison Corporation | | | 1,400 | | | | 179,004 | |
| | | | | | | | 345,347 | |
| | See accompanying notes which are an integral part of these financial statements. | 21 |
Dana Epiphany ESG Equity Fund
Schedule of Investments (continued)
October 31, 2019
| | Shares | | | Fair Value | |
COMMON STOCKS — 99.01% — (continued) |
Real Estate — 3.28% | | | | | | | | |
American Tower Corporation, Class A | | | 480 | | | $ | 104,678 | |
Hannon Armstrong Sustainable Infrastructure Capital, Inc. | | | 6,900 | | | | 206,034 | |
STORE Capital Corporation | | | 2,700 | | | | 109,350 | |
| | | | | | | | 420,062 | |
Utilities — 3.56% | | | | | | | | |
Entergy Corporation | | | 1,800 | | | | 218,664 | |
NextEra Energy, Inc. | | | 1,000 | | | | 238,340 | |
| | | | | | | | 457,004 | |
Total Common Stocks (Cost $10,565,546) | | | | | | | 12,693,738 | |
| | | | | | | | | |
MONEY MARKET FUNDS — 0.57% | | | | | | | | |
| | | | | | | | | |
Fidelity Investments Money Market Government Portfolio, Institutional Class, 1.76%(b) | | | 72,696 | | | | 72,696 | |
Total Money Market Funds (Cost $72,696) | | | | | | | 72,696 | |
| | | | | | | | | |
Total Investments — 99.58% (Cost $10,638,242) | | | | | | | 12,766,434 | |
| | | | | | | | | |
Other Assets in Excess of Liabilities — 0.42% | | | | | | | 54,198 | |
| | | | | | | | | |
NET ASSETS — 100.00% | | | | | | $ | 12,820,632 | |
(a) | Non-income producing security. |
(b) | Rate disclosed is the seven day effective yield as of October 31, 2019. |
The sectors shown on the schedules of investments are based on the Global Industry Classification Standard, or GICS® (“GICS”). The GICS was developed by and/or is the exclusive property of MSCI, Inc. and Standard & Poor’s Financial Services LLC (“S&P”). GICS is a service mark of MSCI, Inc. and S&P and has been licensed for use by Ultimus Fund Solutions, LLC.
22 | See accompanying notes which are an integral part of these financial statements. | |
Dana Funds
Statements of Assets and Liabilities
October 31, 2019
| | | Dana Large Cap
Equity Fund | | | Dana Small Cap
Equity Fund | | | Dana Epiphany
ESG Equity Fund | |
Assets | | | | | | | | |
Investments in securities at fair value (cost $112,183,740, $13,294,959 and $10,638,242) (Note 3) | | $ | 132,903,172 | | | $ | 14,562,192 | | | $ | 12,766,434 | |
Cash | | | 17,460 | | | | — | | | | 1,170 | |
Receivable for fund shares sold | | | 387,942 | | | | 48,000 | | | | 16 | |
Receivable for investments sold | | | 366,174 | | | | — | | | | 58,466 | |
Dividends receivable | | | 162,573 | | | | 1,313 | | | | 16,480 | |
Receivable from Adviser (Note 4) | | | — | | | | 8,636 | | | | 5,632 | |
Prepaid expenses | | | 31,121 | | | | 28,930 | | | | 18,561 | |
Total Assets | | | 133,868,442 | | | | 14,649,071 | | | | 12,866,759 | |
Liabilities | | | | | | | | |
Payable for fund shares redeemed | | | 175,899 | | | | — | | | | — | |
Payable for investments purchased | | | 1,186,638 | | | | — | | | | — | |
Payable to Adviser (Note 4) | | | 41,926 | | | | — | | | | — | |
Accrued Distribution (12b-1) fees (Note 4) | | | 5,279 | | | | 463 | | | | 1,623 | |
Payable to Administrator (Note 4) | | | 11,796 | | | | 8,866 | | | | 12,142 | |
Payable to trustees | | | 270 | | | | 315 | | | | 1,479 | |
Other accrued expenses | | | 22,715 | | | | 21,684 | | | | 30,883 | |
Total Liabilities | | | 1,444,523 | | | | 31,328 | | | | 46,127 | |
Net Assets | | $ | 132,423,919 | | | $ | 14,617,743 | | | $ | 12,820,632 | |
Net Assets consist of: | | | | | | | | | | | | |
Paid-in capital | | | 98,571,665 | | | | 13,495,943 | | | | 8,744,692 | |
Accumulated earnings | | | 33,852,254 | | | | 1,121,800 | | | | 4,075,940 | |
Net Assets | | $ | 132,423,919 | | | $ | 14,617,743 | | | $ | 12,820,632 | |
Institutional Class: | | | | | | | | | | | | |
Net Assets | | $ | 107,025,945 | | | $ | 12,421,202 | | | $ | 5,079,055 | |
Shares outstanding (unlimited number of shares authorized, no par value) | | | 4,716,222 | | | | 1,213,349 | | | | 438,722 | |
Net asset value, offering and redemption price per share (Note 2) | | $ | 22.69 | | | $ | 10.24 | | | $ | 11.58 | |
Investor Class: | | | | | | | | | | | | |
Net Assets | | $ | 25,397,974 | | | $ | 2,196,541 | | | $ | 7,741,577 | |
Shares outstanding (unlimited number of shares authorized, no par value) | | | 1,119,308 | | | | 216,719 | | | | 650,035 | |
Net asset value, offering and redemption price per share (Note 2) | | $ | 22.69 | | | $ | 10.14 | | | $ | 11.91 | |
| | See accompanying notes which are an integral part of these financial statements. | 23 |
Dana Funds
Statements of Operations
For the year ended October 31, 2019
| | | Dana Large Cap
Equity Fund | | | Dana Small Cap
Equity Fund | | | Dana Epiphany
ESG Equity Fund | |
Investment Income | | | | | | | | | | | | |
Dividend income | | $ | 3,533,851 | | | $ | 176,426 | | | $ | 272,111 | |
Total investment income | | | 3,533,851 | | | | 176,426 | | | | 272,111 | |
Expenses | | | | | | | | | | | | |
Investment Adviser fees (Note 4) | | | 953,872 | | | | 124,427 | | | | 85,603 | |
Administration fees (Note 4) | | | 76,228 | | | | 36,000 | | | | 28,295 | |
Distribution (12b-1) fees, Investor Class (Note 4) | | | 64,353 | | | | 6,721 | | | | 19,420 | |
Fund accounting fees (Note 4) | | | 42,749 | | | | 28,000 | | | | 20,774 | |
Registration expenses | | | 39,201 | | | | 34,561 | | | | 34,473 | |
Transfer agent fees (Note 4) | | | 20,392 | | | | 20,700 | | | | 21,824 | |
Custodian fees | | | 20,387 | | | | 4,047 | | | | 5,215 | |
Legal fees | | | 19,923 | | | | 20,351 | | | | 31,392 | |
Audit and tax preparation fees | | | 17,000 | | | | 17,000 | | | | 20,000 | |
Insurance expenses | | | 12,087 | | | | 2,834 | | | | 1,217 | |
Printing and postage expenses | | | 9,155 | | | | 3,233 | | | | 4,726 | |
Trustee fees | | | 6,549 | | | | 5,345 | | | | 8,751 | |
Interest | | | 62 | | | | 307 | | | | 4 | |
Miscellaneous expenses | | | 22,741 | | | | 14,534 | | | | 16,146 | |
Total expenses | | | 1,304,699 | | | | 318,060 | | | | 297,840 | |
Fees contractually waived and expenses reimbursed by Adviser (Note 4) | | | (169,051 | ) | | | (153,464 | ) | | | (159,882 | ) |
Net operating expenses | | | 1,135,648 | | | | 164,596 | | | | 137,958 | |
Net investment income | | | 2,398,203 | | | | 11,830 | | | | 134,153 | |
Net Realized and Change in Unrealized Gain (Loss) on Investments |
Net realized gain (loss) on investment securities transactions | | | 12,973,907 | | | | (111,430 | ) | | | 1,947,772 | |
Net change in unrealized appreciation (depreciation) on investment securities | | | 2,070,388 | | | | 73,430 | | | | (578,233 | ) |
Net realized and change in unrealized gain (loss) on investments | | | 15,044,295 | | | | (38,000 | ) | | | 1,369,539 | |
Net increase (decrease) in net assets resulting from operations | | $ | 17,442,498 | | | $ | (26,170 | ) | | $ | 1,503,692 | |
24 | See accompanying notes which are an integral part of these financial statements. | |
Dana Funds
Statements of Changes in Net Assets
| | | Dana Large Cap Equity Fund | | | Dana Small Cap Equity Fund | |
| | | For the
Year Ended
October 31, 2019 | | | For the
Year Ended
October 31, 2018 | | | For the
Year Ended
October 31, 2019 | | | For the
Year Ended
October 31, 2018 | |
Increase (Decrease) in Net Assets due to: | | | | | | | | | | | | |
Operations | | | | | | | | | | | | |
Net investment income (loss) | | $ | 2,398,203 | | | $ | 2,899,378 | | | $ | 11,830 | | | $ | (61,414 | ) |
Net realized gain (loss) on investment securities transactions | | | 12,973,907 | | | | 16,014,437 | | | | (111,430 | ) | | | 1,549,728 | |
Net change in unrealized appreciation (depreciation) of investment securities | | | 2,070,388 | | | | (13,223,401 | ) | | | 73,430 | | | | (2,109,601 | ) |
Net increase (decrease) in net assets resulting from operations | | | 17,442,498 | | | | 5,690,414 | | | | (26,170 | ) | | | (621,287 | ) |
Distributions to Shareholders from Earnings (Note 2) | | | | | | | | |
Institutional Class | | | (15,403,587 | ) | | | (7,459,066 | ) | | | (1,098,363 | ) | | | (4,138 | ) |
Investor Class | | | (3,132,699 | ) | | | (1,701,334 | ) | | | (245,803 | ) | | | — | |
Total distributions | | | (18,536,286 | ) | | | (9,160,400 | ) | | | (1,344,166 | ) | | | (4,138 | ) |
Capital Transactions – Institutional Class | | | | | | | | |
Proceeds from shares sold | | | 48,852,531 | | | | 111,001,907 | | | | 1,528,842 | | | | 5,280,124 | |
Reinvestment of distributions | | | 11,841,958 | | | | 5,913,368 | | | | 1,065,846 | | | | 3,493 | |
Amount paid for shares redeemed | | | (129,198,946 | ) | | | (70,457,043 | ) | | | (5,237,003 | ) | | | (2,548,354 | ) |
Total – Institutional Class | | | (68,504,457 | ) | | | 46,458,232 | | | | (2,642,315 | ) | | | 2,735,263 | |
Capital Transactions – Investor Class | | | | | | | | | | | | |
Proceeds from shares sold | | | 604,696 | | | | 1,935,954 | | | | 152,674 | | | | 320,769 | |
Reinvestment of distributions | | | 3,128,798 | | | | 1,700,677 | | | | 245,803 | | | | — | |
Amount paid for shares redeemed | | | (7,535,002 | ) | | | (16,049,342 | ) | | | (1,436,942 | ) | | | (3,548,803 | ) |
Total – Investor Class | | | (3,801,508 | ) | | | (12,412,711 | ) | | | (1,038,465 | ) | | | (3,228,034 | ) |
Net increase (decrease) in net assets resulting from capital transactions | | | (72,305,965 | ) | | | 34,045,521 | | | | (3,680,780 | ) | | | (492,771 | ) |
Total Increase (Decrease) in Net Assets | | | (73,399,753 | ) | | | 30,575,535 | | | | (5,051,116 | ) | | | (1,118,196 | ) |
Net Assets | | | | | | | | | | | | | | | | |
Beginning of year | | | 205,823,672 | | | | 175,248,137 | | | | 19,668,859 | | | | 20,787,055 | |
End of year | | $ | 132,423,919 | | | $ | 205,823,672 | | | $ | 14,617,743 | | | $ | 19,668,859 | |
| | See accompanying notes which are an integral part of these financial statements. | 25 |
Dana Funds
Statements of Changes in Net Assets (continued)
| | | Dana Large Cap Equity Fund | | | Dana Small Cap Equity Fund | |
| | | For the
Year Ended
October 31, 2019 | | | For the
Year Ended
October 31, 2018 | | | For the
Year Ended
October 31, 2019 | | | For the
Year Ended
October 31, 2018 | |
Share Transactions – Institutional Class | | | | | | | | | | | | |
Shares sold | | | 2,457,771 | | | | 4,762,130 | | | | 155,114 | | | | 451,665 | |
Shares issued in reinvestment of distributions | | | 651,067 | | | | 256,328 | | | | 121,257 | | | | 298 | |
Shares redeemed | | | (6,308,605 | ) | | | (3,032,827 | ) | | | (523,215 | ) | | | (217,413 | ) |
Total – Institutional Class | | | (3,199,767 | ) | | | 1,985,631 | | | | (246,844 | ) | | | 234,550 | |
Share Transactions – Investor Class | | | | | | | | | | | | |
Shares sold | | | 28,606 | | | | 83,654 | | | | 15,249 | | | | 27,535 | |
Shares issued in reinvestment of distributions | | | 171,527 | | | | 73,934 | | | | 28,188 | | | | — | |
Shares redeemed | | | (372,375 | ) | | | (674,880 | ) | | | (141,956 | ) | | | (307,754 | ) |
Total – Investor Class | | | (172,242 | ) | | | (517,292 | ) | | | (98,519 | ) | | | (280,219 | ) |
26 | See accompanying notes which are an integral part of these financial statements. | |
Dana Funds
Statements of Changes in Net Assets (continued)
| | | Dana Epiphany ESG Equity Fund | |
| | | For the
Year Ended
October 31, 2019 | | | For the
Year Ended
October 31, 2018 | |
Increase (Decrease) in Net Assets due to: | | | | | | | | |
Operations | | | | | | | | |
Net investment income | | $ | 134,153 | | | $ | 88,672 | |
Net realized gain on investment securities transactions | | | 1,947,772 | | | | 1,642,707 | |
Net change in unrealized appreciation (depreciation) of investment securities | | | (578,233 | ) | | | (375,549 | ) |
Net increase in net assets resulting from operations | | | 1,503,692 | | | | 1,355,830 | |
Distributions to Shareholders from Earnings (Note 2) | | | | | | | | |
Institutional Class | | | (746,819 | ) | | | (1,192,255 | ) |
Investor Class | | | (1,014,147 | ) | | | (1,895,929 | ) |
Total distributions | | | (1,760,966 | ) | | | (3,088,184 | ) |
Capital Transactions – Institutional Class | | | | | | | | |
Proceeds from shares sold | | | 282,765 | | | | 790,410 | |
Reinvestment of distributions | | | 734,812 | | | | 1,191,071 | |
Amount paid for shares redeemed | | | (2,277,604 | ) | | | (2,245,859 | ) |
Total – Institutional Class | | | (1,260,027 | ) | | | (264,378 | ) |
Capital Transactions – Investor Class | | | | | | | | |
Proceeds from shares sold | | | 394,428 | | | | 594,407 | |
Reinvestment of distributions | | | 993,640 | | | | 1,843,847 | |
Amount paid for shares redeemed | | | (2,571,196 | ) | | | (5,958,253 | ) |
Total – Investor Class | | | (1,183,128 | ) | | | (3,519,999 | ) |
Net decrease in net assets resulting from capital transactions | | | (2,443,155 | ) | | | (3,784,377 | ) |
Total Decrease in Net Assets | | | (2,700,429 | ) | | | (5,516,731 | ) |
Net Assets | | | | | | | | |
Beginning of year | | | 15,521,061 | | | | 21,037,792 | |
End of year | | $ | 12,820,632 | | | $ | 15,521,061 | |
| | See accompanying notes which are an integral part of these financial statements. | 27 |
Dana Funds
Statements of Changes in Net Assets (continued)
| | | Dana Epiphany ESG Equity Fund | |
| | | For the
Year Ended
October 31, 2019 | | | For the
Year Ended
October 31, 2018 | |
Share Transactions – Institutional Class | | | | |
Shares sold | | | 25,958 | | | | 64,220 | |
Shares issued in reinvestment of distributions | | | 72,259 | | | | 100,783 | |
Shares redeemed | | | (208,847 | ) | | | (183,044 | ) |
Total – Institutional Class | | | (110,630 | ) | | | (18,041 | ) |
Share Transactions – Investor Class | | | | |
Shares sold | | | 34,862 | | | | 47,246 | |
Shares issued in reinvestment of distributions | | | 95,050 | | | | 152,260 | |
Shares redeemed | | | (226,525 | ) | | | (470,149 | ) |
Total – Investor Class | | | (96,613 | ) | | | (270,643 | ) |
28 | See accompanying notes which are an integral part of these financial statements. | |
Dana Large Cap Equity Fund – Institutional Class
Financial Highlights
(For a share outstanding during each year)
| | | Years Ended October 31, | |
| | | 2019 | | | 2018 | | | 2017 | | | 2016 | | | 2015 | |
Selected Per Share Data: | | | | | | | | | | | | | | | | | | | | |
Net asset value, beginning of year | | $ | 22.35 | | | $ | 22.64 | | | $ | 17.67 | | | $ | 18.22 | | | $ | 18.52 | |
| | | | | | | | | | | | | | | | | | | | | |
Investment operations: | | | | | | | | | | | | | | | | | | | | |
Net investment income | | | 0.38 | | | | 0.32 | | | | 0.32 | | | | 0.26 | (a) | | | 0.19 | |
Net realized and unrealized gain (loss) on investments | | | 2.46 | | | | 0.45 | | | | 4.96 | | | | (0.56 | ) | | | 0.52 | (b) |
Total from investment operations | | | 2.84 | | | | 0.77 | | | | 5.28 | | | | (0.30 | ) | | | 0.71 | |
| | | | | | | | | | | | | | | | | | | | | |
Less distributions to shareholders from: | | | | | | | | | | | | | | | | | | | | |
Net investment income | | | (0.36 | ) | | | (0.32 | ) | | | (0.31 | ) | | | (0.25 | ) | | | (0.19 | ) |
Net realized gains | | | (2.14 | ) | | | (0.74 | ) | | | — | | | | — | | | | (0.83 | ) |
Total distributions | | | (2.50 | ) | | | (1.06 | ) | | | (0.31 | ) | | | (0.25 | ) | | | (1.02 | ) |
| | | | | | | | | | | | | | | | | | | | | |
Redemption fees | | | — | | | | — | | | | — | (c) | | | — | (c) | | | 0.01 | |
| | | | | | | | | | | | | | | | | | | | | |
Net asset value, end of year | | $ | 22.69 | | | $ | 22.35 | | | $ | 22.64 | | | $ | 17.67 | | | $ | 18.22 | |
| | | | | | | | | | | | | | | | | | | | | |
Total Return(d) | | | 15.55 | % | | | 3.27 | % | | | 30.11 | % | | | (1.66 | )% | | | 3.89 | % |
| | | | | | | | | | | | | | | | | | | | | |
Ratios and Supplemental Data: | | | | | | | | | | | | | | | | | | | | |
| | | | | | | | | | | | | | | | | | | | | |
Net assets, end of year (000 omitted) | | $ | 107,026 | | | $ | 176,954 | | | $ | 134,291 | | | $ | 138,540 | | | $ | 117,663 | |
Before waiver | | | | | | | | | | | | | | | | | | | | |
Ratio of expenses to average net assets | | | 0.85 | % | | | 0.86 | % | | | 0.92 | % | | | 0.91 | % | | | 1.00 | % |
After waiver | | | | | | | | | | | | | | | | | | | | |
Ratio of expenses to average net assets | | | 0.73 | % | | | 0.73 | % | | | 0.74 | %(e) | | | 0.73 | % | | | 0.73 | % |
Ratio of net investment income to average net assets | | | 1.68 | % | | | 1.41 | % | | | 1.48 | % | | | 1.45 | % | | | 1.25 | % |
Portfolio turnover rate(f) | | | 50 | % | | | 58 | % | | | 50 | % | | | 69 | % | | | 45 | % |
| | | | | | | | | | | | | | | | | | | | | |
(a) | Per share net investment income has been determined on the basis of average shares outstanding during the year. |
(b) | The amount shown for a share outstanding throughout the period does not accord with the change in aggregate gains and losses in the portfolio of securities during the period because of the timing of sales and purchases of fund shares in relation to fluctuating market values during the period. |
(c) | Rounds to less than $0.005 per share. |
(d) | Total return in the above table represents the rate that the investor would have earned or lost on an investment in the Fund, assuming reinvestment of distributions. |
(e) | This ratio includes the impact of overdraft fees. If this cost had been excluded, the ratio of expenses to average net assets would have been 0.73% for the fiscal year ended October 31, 2017. |
(f) | Portfolio turnover is calculated on the basis of the Fund as a whole without distinguishing among the classes of shares. |
| | See accompanying notes which are an integral part of these financial statements. | 29 |
Dana Large Cap Equity Fund – Investor Class
Financial Highlights
(For a share outstanding during each year)
| | | Years Ended October 31, | |
| | | 2019 | | | 2018 | | | 2017 | | | 2016 | | | 2015 | |
Selected Per Share Data: | | | | | | | | | | | | | | | | | | | | |
Net asset value, beginning of year | | $ | 22.35 | | | $ | 22.64 | | | $ | 17.68 | | | $ | 18.23 | | | $ | 18.54 | |
| | | | | | | | | | | | | | | | | | | | | |
Investment operations: | | | | | | | | | | | | | | | | | | | | |
Net investment income | | | 0.30 | | | | 0.28 | | | | 0.24 | | | | 0.22 | (a) | | | 0.18 | |
Net realized and unrealized gain (loss) on investments | | | 2.50 | | | | 0.43 | | | | 4.98 | | | | (0.57 | ) | | | 0.49 | (b) |
Total from investment operations | | | 2.80 | | | | 0.71 | | | | 5.22 | | | | (0.35 | ) | | | 0.67 | |
| | | | | | | | | | | | | | | | | | | | | |
Less distributions to shareholders from: | | | | | | | | | | | | | | | | | | | | |
Net investment income | | | (0.32 | ) | | | (0.26 | ) | | | (0.26 | ) | | | (0.20 | ) | | | (0.15 | ) |
Net realized gains | | | (2.14 | ) | | | (0.74 | ) | | | — | | | | — | | | | (0.83 | ) |
Total distributions | | | (2.46 | ) | | | (1.00 | ) | | | (0.26 | ) | | | (0.20 | ) | | | (0.98 | ) |
| | | | | | | | | | | | | | | | | | | | | |
Redemption fees | | | — | | | | — | | | | — | | | | — | (c) | | | — | (c) |
| | | | | | | | | | | | | | | | | | | | | |
Net asset value, end of year | | $ | 22.69 | | | $ | 22.35 | | | $ | 22.64 | | | $ | 17.68 | | | $ | 18.23 | |
| | | | | | | | | | | | | | | | | | | | | |
Total Return(d) | | | 15.29 | % | | | 3.01 | % | | | 29.72 | % | | | (1.91 | )% | | | 3.61 | % |
| | | | | | | | | | | | | | | | | | | | | |
Ratios and Supplemental Data: | | | | | | | | | | | | | | | | | | | | |
| | | | | | | | | | | | | | | | | | | | | |
Net assets, end of year (000 omitted) | | $ | 25,398 | | | $ | 28,870 | | | $ | 40,957 | | | $ | 32,514 | | | $ | 36,909 | |
Before waiver | | | | | | | | | | | | | | | | | | | | |
Ratio of expenses to average net assets | | | 1.10 | % | | | 1.11 | % | | | 1.17 | % | | | 1.16 | % | | | 1.25 | % |
After waiver | | | | | | | | | | | | | | | | | | | | |
Ratio of expenses to average net assets | | | 0.98 | % | | | 0.98 | % | | | 0.99 | %(e) | | | 0.98 | % | | | 0.98 | % |
Ratio of net investment income to average net assets | | | 1.40 | % | | | 1.17 | % | | | 1.20 | % | | | 1.22 | % | | | 1.00 | % |
Portfolio turnover rate(f) | | | 50 | % | | | 58 | % | | | 50 | % | | | 69 | % | | | 45 | % |
| | | | | | | | | | | | | | | | | | | | | |
(a) | Per share net investment income has been determined on the basis of average shares outstanding during the year. |
(b) | The amount shown for a share outstanding throughout the year does not accord with the change in aggregate gains and losses in the portfolio of securities during the year because of the timing of sales and purchases of fund shares in relation to fluctuating market values during the year. |
(c) | Rounds to less than $0.005 per share. |
(d) | Total return in the above table represents the rate that the investor would have earned or lost on an investment in the Fund, assuming reinvestment of distributions. |
(e) | This ratio includes the impact of overdraft fees. If this cost had been excluded, the ratio of expenses to average net assets would have been 0.98% for the fiscal year ended October 31, 2017. |
(f) | Portfolio turnover is calculated on the basis of the Fund as a whole without distinguishing among the classes of shares. |
30 | See accompanying notes which are an integral part of these financial statements. | |
Dana Small Cap Equity Fund – Institutional Class
Financial Highlights
(For a share outstanding during each period)
| | | Years Ended
October 31, | | | For the
Period
Ended
October 31, | |
| | | 2019 | | | 2018 | | | 2017 | | | 2016(a) | |
Selected Per Share Data: | | | | | | | | | | | | | | | | |
Net asset value, beginning of period | | $ | 11.09 | | | $ | 11.43 | | | $ | 9.30 | | | $ | 10.00 | |
| | | | | | | | | | | | | | | | | |
Investment operations: | | | | | | | | | | | | | | | | |
Net investment income (loss) | | | 0.01 | | | | (0.03 | ) | | | — | (b) | | | 0.01 | |
Net realized and unrealized gain (loss) on investments | | | (0.05 | ) | | | (0.31 | ) | | | 2.14 | | | | (0.70 | )(c) |
Total from investment operations | | | (0.04 | ) | | | (0.34 | ) | | | 2.14 | | | | (0.69 | ) |
| | | | | | | | | | | | | | | | | |
Less distributions to shareholders from: | | | | | | | | | | | | | | | | |
Net investment income | | | — | | | | — | (b) | | | (0.01 | ) | | | (0.01 | ) |
Net realized gains | | | (0.81 | ) | | | — | | | | — | | | | — | |
Total distributions | | | (0.81 | ) | | | — | (b) | | | (0.01 | ) | | | (0.01 | ) |
| | | | | | | | | | | | | | | | | |
Redemption fees | | | — | | | | — | | | | — | | | | — | (b) |
| | | | | | | | | | | | | | | | | |
Net asset value, end of period | | $ | 10.24 | | | $ | 11.09 | | | $ | 11.43 | | | $ | 9.30 | |
| | | | | | | | | | | | | | | | | |
Total Return(d) | | | 0.83 | % | | | (2.95 | )% | | | 23.08 | % | | | (6.87 | )%(e) |
| | | | | | | | | | | | | | | | | |
Ratios and Supplemental Data: | | | | | | | | | | | | | | | | |
| | | | | | | | | | | | | | | | | |
Net assets, end of period (000 omitted) | | $ | 12,421 | | | $ | 16,196 | | | $ | 14,011 | | | $ | 6,575 | |
Before waiver | | | | | | | | | | | | | | | | |
Ratio of expenses to average net assets | | | 1.88 | % | | | 1.75 | % | | | 2.02 | % | | | 4.11 | %(f) |
After waiver | | | | | | | | | | | | | | | | |
Ratio of expenses to average net assets | | | 0.95 | % | | | 0.95 | % | | | 0.95 | % | | | 0.95 | %(f) |
Ratio of net investment income (loss) to average net assets | | | 0.11 | % | | | (0.24 | )% | | | — | % | | | 0.12 | %(f) |
Portfolio turnover rate(g) | | | 50 | % | | | 78 | % | | | 58 | % | | | 54 | %(e) |
| | | | | | | | | | | | | | | | | |
(a) | For the period November 3, 2015 (commencement of operations) to October 31, 2016. |
(b) | Rounds to less than $0.005 per share. |
(c) | The amount shown for a share outstanding throughout the year does not accord with the change in aggregate gains and losses in the portfolio of securities during the year because of the timing of sales and purchases of fund shares in relation to fluctuating market values during the year. |
(d) | Total return in the above table represents the rate that the investor would have earned or lost on an investment in the Fund, assuming reinvestment of distributions. |
(g) | Portfolio turnover is calculated on the basis of the Fund as a whole without distinguishing among the classes of shares. |
| | See accompanying notes which are an integral part of these financial statements. | 31 |
Dana Small Cap Equity Fund – Investor Class
Financial Highlights
(For a share outstanding during each period)
| | | Years Ended
October 31, | | | For the
Period
Ended
October 31, | |
| | | 2019 | | | 2018 | | | 2017 | | | 2016(a) | |
Selected Per Share Data: | | | | | | | | | | | | | | | | |
Net asset value, beginning of period | | $ | 11.02 | | | $ | 11.38 | | | $ | 9.28 | | | $ | 10.00 | |
| | | | | | | | | | | | | | | | | |
Investment operations: | | | | | | | | | | | | | | | | |
Net investment loss | | | (0.03 | ) | | | (0.08 | ) | | | (0.02 | ) | | | — | (b) |
Net realized and unrealized gain (loss) on investments | | | (0.04 | ) | | | (0.28 | ) | | | 2.13 | | | | (0.71 | )(c) |
Total from investment operations | | | (0.07 | ) | | | (0.36 | ) | | | 2.11 | | | | (0.71 | ) |
| | | | | | | | | | | | | | | | | |
Less distributions to shareholders from: | | | | | | | | | | | | | | | | |
Net investment income | | | — | | | | — | | | | (0.01 | ) | | | (0.01 | ) |
Net realized gains | | | (0.81 | ) | | | — | | | | — | | | | — | |
Total distributions | | | (0.81 | ) | | | — | | | | (0.01 | ) | | | (0.01 | ) |
| | | | | | | | | | | | | | | | | |
Redemption fees | | | — | | | | — | | | | — | | | | — | (b) |
| | | | | | | | | | | | | | | | | |
Net asset value, end of period | | $ | 10.14 | | | $ | 11.02 | | | $ | 11.38 | | | $ | 9.28 | |
| | | | | | | | | | | | | | | | | |
Total Return(d) | | | 0.55 | % | | | (3.16 | )% | | | 22.73 | % | | | (7.13 | )%(e) |
| | | | | | | | | | | | | | | | | |
Ratios and Supplemental Data: | | | | | | | | | | | | | | | | |
| | | | | | | | | | | | | | | | | |
Net assets, end of period (000 omitted) | | $ | 2,197 | | | $ | 3,473 | | | $ | 6,776 | | | $ | 3,604 | |
Before waiver | | | | | | | | | | | | | | | | |
Ratio of expenses to average net assets | | | 2.13 | % | | | 2.00 | % | | | 2.27 | % | | | 4.53 | %(f) |
After waiver | | | | | | | | | | | | | | | | |
Ratio of expenses to average net assets | | | 1.20 | % | | | 1.20 | % | | | 1.20 | % | | | 1.20 | %(f) |
Ratio of net investment loss to average net assets | | | (0.13 | )% | | | (0.46 | )% | | | (0.25 | )% | | | (0.10 | )%(f) |
Portfolio turnover rate(g) | | | 50 | % | | | 78 | % | | | 58 | % | | | 54 | %(e) |
| | | | | | | | | | | | | | | | | |
(a) | For the period November 3, 2015 (commencement of operations) to October 31, 2016. |
(b) | Rounds to less than $0.005 per share. |
(c) | The amount shown for a share outstanding throughout the year does not accord with the change in aggregate gains and losses in the portfolio of securities during the year because of the timing of sales and purchases of fund shares in relation to fluctuating market values during the year. |
(d) | Total return in the above table represents the rate that the investor would have earned or lost on an investment in the Fund, assuming reinvestment of distributions. |
(g) | Portfolio turnover is calculated on the basis of the Fund as a whole without distinguishing among the classes of shares. |
32 | See accompanying notes which are an integral part of these financial statements. | |
Dana Epiphany ESG Equity Fund – Institutional Class
Financial Highlights
(For a share outstanding during each year)
| | | Years Ended October 31, | |
| | | 2019 | | | 2018 | | | 2017(a) | | | 2016 | | | 2015 | |
Selected Per Share Data: | | | | | | | | | | | | | | | | | | | | |
Net asset value, beginning of year | | $ | 11.80 | | | $ | 13.09 | | | $ | 10.86 | | | $ | 11.64 | | | $ | 12.68 | |
| | | | | | | | | | | | | | | | | | | | | |
Investment operations: | | | | | | | | | | | | | | | | | | | | |
Net investment income (loss) | | | 0.14 | | | | 0.08 | (b) | | | 0.04 | (b) | | | (0.03 | )(b) | | | (0.05 | )(b) |
Net realized and unrealized gain (loss) on investments | | | 1.15 | | | | 0.74 | | | | 2.37 | | | | (0.15 | ) | | | (0.03 | ) |
Total from investment operations | | | 1.29 | | | | 0.82 | | | | 2.41 | | | | (0.18 | ) | | | (0.08 | ) |
| | | | | | | | | | | | | | | | | | | | | |
Less distributions to shareholders from: | | | | | | | | | | | | | | | | | | | | |
Net investment income | | | (0.12 | ) | | | (0.08 | ) | | | (0.01 | ) | | | — | (c) | | | — | |
Net realized gains | | | (1.39 | ) | | | (2.03 | ) | | | (0.17 | ) | | | (0.60 | ) | | | (0.96 | ) |
Total distributions | | | (1.51 | ) | | | (2.11 | ) | | | (0.18 | ) | | | (0.60 | ) | | | (0.96 | ) |
| | | | | | | | | | | | | | | | | | | | | |
Redemption fees | | | — | | | | — | | | | — | (c) | | | — | (c) | | | — | (c) |
| | | | | | | | | | | | | | | | | | | | | |
Net asset value, end of year | | $ | 11.58 | | | $ | 11.80 | | | $ | 13.09 | | | $ | 10.86 | | | $ | 11.64 | |
| | | | | | | | | | | | | | | | | | | | | |
Total Return(d) | | | 12.76 | % | | | 6.32 | % | | | 22.46 | % | | | (1.46 | )% | | | (1.03 | )% |
| | | | | | | | | | | | | | | | | | | | | |
Ratios and Supplemental Data: | | | | | | | | | | | | | | | | | | | | |
| | | | | | | | | | | | | | | | | | | | | |
Net assets, end of year (000 omitted) | | $ | 5,079 | | | $ | 6,485 | | | $ | 7,429 | | | $ | 6,748 | | | $ | 7,175 | |
Before waiver | | | | | | | | | | | | | | | | | | | | |
Ratio of expenses to average net assets | | | 2.13 | % | | | 1.63 | % | | | 2.15 | % | | | 2.43 | % | | | 2.42 | % |
After waiver | | | | | | | | | | | | | | | | | | | | |
Ratio of expenses to average net assets | | | 0.90 | % | | | 1.25 | % | | | 1.82 | % | | | 2.25 | % | | | 2.25 | % |
Ratio of net investment income (loss) to average net assets | | | 1.19 | % | | | 0.62 | % | | | 0.36 | % | | | (0.27 | )% | | | (0.39 | )% |
Portfolio turnover rate(e) | | | 60 | % | | | 23 | % | | | 97 | % | | | 63 | % | | | 81 | % |
| | | | | | | | | | | | | | | | | | | | | |
(a) | Effective May 30, 2017, Class C shares were renamed Class I shares. Effective December 19, 2018, Class I shares were renamed Institutional Class shares. |
(b) | Per share net investment income (loss) has been determined on the basis of average shares outstanding during the period. |
(c) | Rounds to less than $0.005 per share. |
(d) | Total return in the above table represents the rate that the investor would have earned or lost on an investment in the Fund, assuming reinvestment of distributions. |
(e) | Portfolio turnover is calculated on the basis of the Fund as a whole without distinguishing among the classes of shares. |
| | See accompanying notes which are an integral part of these financial statements. | 33 |
Dana Epiphany ESG Equity Fund – Investor Class
Financial Highlights
(For a share outstanding during each year)
| | | Years Ended October 31, | |
| | | 2019 | | | 2018 | | | 2017 | | | 2016 | | | 2015(a) | |
Selected Per Share Data: | | | | | | | | | | | | | | | | | | | | |
Net asset value, beginning of year | | $ | 12.10 | | | $ | 13.38 | | | $ | 11.12 | | | $ | 11.88 | | | $ | 12.85 | |
| | | | | | | | | | | | | | | | | | | | | |
Investment operations: | | | | | | | | | | | | | | | | | | | | |
Net investment income | | | 0.10 | | | | 0.05 | (b) | | | 0.08 | (b) | | | 0.05 | (b) | | | 0.04 | (b) |
Net realized and unrealized gain (loss) on investments | | | 1.19 | | | | 0.75 | | | | 2.43 | | | | (0.15 | ) | | | 0.03 | |
Total from investment operations | | | 1.29 | | | | 0.80 | | | | 2.51 | | | | (0.10 | ) | | | 0.07 | |
| | | | | | | | | | | | | | | | | | | | | |
Less distributions to shareholders from: | | | | | | | | | | | | | | | | | | | | |
Net investment income | | | (0.09 | ) | | | (0.05 | ) | | | (0.08 | ) | | | (0.04 | ) | | | (0.08 | ) |
Net realized gains | | | (1.39 | ) | | | (2.03 | ) | | | (0.17 | ) | | | (0.60 | ) | | | (0.96 | ) |
Return of capital | | | — | | | | — | | | | — | | | | (0.02 | ) | | | — | |
Total distributions | | | (1.48 | ) | | | (2.08 | ) | | | (0.25 | ) | | | (0.66 | ) | | | (1.04 | ) |
| | | | | | | | | | | | | | | | | | | | | |
Redemption fees | | | — | | | | — | | | | — | (c) | | | — | (c) | | | — | (c) |
| | | | | | | | | | | | | | | | | | | | | |
Net asset value, end of year | | $ | 11.91 | | | $ | 12.10 | | | $ | 13.38 | | | $ | 11.12 | | | $ | 11.88 | |
| | | | | | | | | | | | | | | | | | | | | |
Total Return(d) | | | 12.45 | % | | | 6.03 | % | | | 22.86 | % | | | (0.72 | )% | | | 0.25 | % |
| | | | | | | | | | | | | | | | | | | | | |
Ratios and Supplemental Data: | | | | | | | | | | | | | | | | | | | | |
| | | | | | | | | | | | | | | | | | | | | |
Net assets, end of year (000 omitted) | | $ | 7,742 | | | $ | 9,036 | | | $ | 13,609 | | | $ | 19,657 | | | $ | 22,619 | |
Before waiver | | | | | | | | | | | | | | | | | | | | |
Ratio of expenses to average net assets | | | 2.38 | % | | | 1.87 | % | | | 1.82 | % | | | 1.68 | % | | | 1.68 | % |
After waiver | | | | | | | | | | | | | | | | | | | | |
Ratio of expenses to average net assets | | | 1.15 | % | | | 1.50 | % | | | 1.50 | % | | | 1.50 | % | | | 1.50 | % |
Ratio of net investment income to average net assets | | | 0.93 | % | | | 0.38 | % | | | 0.69 | % | | | 0.48 | % | | | 0.36 | % |
Portfolio turnover rate(e) | | | 60 | % | | | 23 | % | | | 97 | % | | | 63 | % | | | 81 | % |
| | | | | | | | | | | | | | | | | | | | | |
(a) | Effective June 1, 2015, Class N shares were renamed Class A shares. Effective December 19, 2018, Class A shares were renamed Investor Class shares. |
(b) | Per share net investment income (loss) has been determined on the basis of average shares outstanding during the period. |
(c) | Rounds to less than $0.005 per share. |
(d) | Total return in the above table represents the rate that the investor would have earned or lost on an investment in the Fund, assuming reinvestment of distributions. |
(e) | Portfolio turnover is calculated on the basis of the Fund as a whole without distinguishing among the classes of shares. |
34 | See accompanying notes which are an integral part of these financial statements. | |
Dana Funds
Notes to the Financial Statements
October 31, 2019
NOTE 1. ORGANIZATION
The Dana Large Cap Equity Fund (the “Large Cap Fund”), the Dana Small Cap Equity Fund (the “Small Cap Fund”), and the Dana Epiphany ESG Equity Fund (the “Epiphany ESG Fund”) (each a “Fund” and collectively, the “Funds”) are each an open-end diversified series of Valued Advisers Trust (the “Trust”). The Trust is a management investment company established under the laws of Delaware by an Agreement and Declaration of Trust dated June 13, 2008 (the “Trust Agreement”). The Trust Agreement permits the Board of Trustees (“Board”) to issue an unlimited number of shares of beneficial interest of separate series without par value. Each Fund is one of a series of funds currently authorized by the Board. The investment adviser to the Funds is Dana Investment Advisors, Inc. (the “Adviser”). Each Fund seeks long-term growth of capital.
The Large Cap Fund, Small Cap Fund, and Epiphany ESG Fund currently offer Investor Class shares and Institutional Class shares. Effective on the close of business on October 13, 2017, Class A shares were consolidated into Class N shares of the Large Cap Fund which was subsequently re-designated Investor Class shares. Each share represents an equal proportionate interest in the assets and liabilities belonging to the Fund and is entitled to such dividends and distributions out of income belonging to the Fund as declared by the Board. Prior to February 28, 2017, all share classes of the Large Cap Fund and the Small Cap Fund imposed a 2.00% redemption fee on shares redeemed within 60 days of purchase.
The Epiphany ESG Fund is the legal successor to the Epiphany FFV Fund (the “Predecessor Fund”), a series of Epiphany Funds, an unaffiliated registered investment company. On December 19, 2018, the Epiphany ESG Fund (which had no prior activity or net assets) acquired all the net assets of the Predecessor Fund pursuant to a plan of reorganization (the “Reorganization”).
The Reorganization was accomplished by a tax-free exchange of 560,893 shares of the Predecessor Fund’s Class I shares, valued at $5,367,433 for the exact same shares and value of the Epiphany ESG Fund’s Institutional Class shares; and 762,821 shares of the Predecessor Fund’s Class A shares, valued at $7,509,512 for the exact same shares and value of the Epiphany ESG Fund’s Investor Class shares. For financial reporting purposes, assets received and shares issued by the Epiphany ESG Fund were recorded at fair value; however, the cost basis of the investments received from the Predecessor Fund was carried forward to align ongoing reporting of the Epiphany ESG Fund’s realized and unrealized gains and losses with amounts distributable to shareholders for tax purposes. Immediately prior to the merger, the net assets of the Predecessor Fund were $12,876,945, including $1,171,383 of unrealized appreciation, $3,989 of undistributed net investment income, and $419,289 of accumulated realized gain.
The Predecessor Fund commenced operations on January 8, 2007. The accounting and performance history of the Class I shares and Class A shares of the Predecessor Fund were re-designated as that of the Institutional Class shares and Investor Class shares of the Epiphany ESG Fund, respectively.
35
Dana Funds
Notes to the Financial Statements (continued)
October 31, 2019
NOTE 2. SIGNIFICANT ACCOUNTING POLICIES
The Funds are investment companies and follow accounting and reporting guidance under Financial Accounting Standards Board Accounting Standards Codification (“ASC”) Topic 946, “Financial Services-Investment Companies”. The following is a summary of significant accounting policies followed by the Funds in the preparation of their financial statements. These policies are in conformity with the generally accepted accounting principles in the United States of America (“GAAP”).
Estimates – The preparation of financial statements in conformity with GAAP requires management to make estimates and assumptions that affect the reported amounts of assets and liabilities and disclosure of contingent assets and liabilities at the date of the financial statements and the reported amounts of increases and decreases in net assets from operations during the reporting period. Actual results could differ from those estimates.
Federal Income Taxes – The Funds make no provision for federal income or excise tax. Each Fund has qualified and intends to qualify each year as a regulated investment company (“RIC”) under subchapter M of the Internal Revenue Code of 1986, as amended, by complying with the requirements applicable to RICs and by distributing substantially all of its taxable income. Each Fund also intends to distribute sufficient net investment income and net capital gains, if any, so that it will not be subject to excise tax on undistributed income and gains. If the required amount of net investment income or gains is not distributed, the Fund could incur a tax expense.
As of and during the fiscal year ended October 31, 2019, the Funds did not have any liabilities for any unrecognized tax benefits. The Funds recognize interest and penalties, if any, related to unrecognized tax benefits as income tax expense on the statements of operations when incurred. During the fiscal year ended October 31, 2019, the Funds did not incur any interest or penalties. Management of the Funds has reviewed tax positions taken in tax years that remain subject to examination by all major tax jurisdictions, including federal (i.e., the last three tax year ends and the interim tax period since then, as applicable). Management believes that there is no tax liability resulting from unrecognized tax benefits related to uncertain tax positions taken.
Expenses – Expenses incurred by the Trust that do not relate to a specific fund of the Trust are allocated to the individual funds based on each fund’s relative net assets or another appropriate basis (as determined by the Board). Expenses specifically attributable to any class are borne by that class. Income, realized gains and losses, unrealized appreciation and depreciation, and fund-wide expenses not allocated to a particular class shall be allocated to each class based on the net assets of that class in relation to the net assets of the entire fund.
Security Transactions and Related Income – The Funds follow industry practice and record security transactions on the trade date for financial reporting purposes. The specific identification method is used for determining gains or losses for financial statement and income tax purposes. Dividend income is recorded on the ex-dividend date and interest income is recorded on an accrual basis. Discounts and premiums on securities purchased are accreted or amortized using the effective interest method, if applicable. Withholding taxes on foreign dividends have been provided for in accordance with the Funds’ understanding of the applicable country’s tax rules and rates.
36
Dana Funds
Notes to the Financial Statements (continued)
October 31, 2019
The Funds may hold Real Estate Investment Trusts (“REITs”), which pay dividends to their shareholders based upon available funds from operations. It is possible for these dividends to exceed the REIT’s underlying taxable earnings and profits resulting in the excess portion of such dividends being designated as a return of capital. Distributions received from REITs that represent a return of capital or capital gains are recorded as a reduction of the cost of the REITs or as a realized gain, respectively.
Dividends and Distributions – The Funds intend to distribute substantially all of their net investment income, if any, at least quarterly. The Funds intend to distribute their net realized long-term and short-term capital gains, if any, annually. Distributions to shareholders, which are determined in accordance with income tax regulations, are recorded on the ex-dividend date. The treatment for financial reporting purposes of distributions made to shareholders during the year from net investment income or net realized capital gains may differ from their ultimate treatment for federal income tax purposes. These differences are caused primarily by differences in the timing of the recognition of certain components of income, expense or realized capital gain for federal income tax purposes. Where such differences are permanent in nature, they are reclassified in the components of the net assets based on their ultimate characterization for federal income tax purposes. Any such reclassifications will have no effect on net assets, results of operations or net asset value (“NAV”) per share of the Funds.
For the fiscal year ended October 31, 2019, the Funds made the following reclassifications to increase (decrease) the components of net assets:
| | Paid-In
Capital | | | Accumulated
Earnings | |
Small Cap Fund | | $ | (43,536 | ) | | $ | 43,536 | |
Epiphany ESG Fund | | | (1 | ) | | | 1 | |
Share Valuation – The NAV per share of each class of the Fund is calculated each day the New York Stock Exchange is open by dividing the total value of the assets attributable to that class, less liabilities attributable to that class, by the number of shares outstanding of that class.
NOTE 3. SECURITIES VALUATION AND FAIR VALUE MEASUREMENTS
Fair value is defined as the price that a Fund would receive upon selling an investment in a timely transaction to an independent buyer in the principal or most advantageous market of the investment. GAAP establishes a three-tier hierarchy to maximize the use of observable market data and minimize the use of unobservable inputs and to establish classification of fair value measurements for disclosure purposes.
Inputs refer broadly to the assumptions that market participants would use in pricing the asset or liability, including assumptions about risk (the risk inherent in a particular valuation technique used to measure fair value including a pricing model and/or the risk inherent in the inputs to the valuation technique). Inputs may be observable or unobservable. Observable inputs are inputs that reflect the assumptions market participants would use in pricing the asset or liability developed based on market
37
Dana Funds
Notes to the Financial Statements (continued)
October 31, 2019
data obtained and available from sources independent of the reporting entity. Unobservable inputs are inputs that reflect the reporting entity’s own assumptions about the assumptions market participants would use in pricing the asset or liability developed based on the best information available in the circumstances.
Various inputs are used in determining the value of each Fund’s investments. These inputs are summarized in the three broad levels listed below.
| | ● | Level 1 – unadjusted quoted prices in active markets for identical investments and/or registered investment companies where the value per share is determined and published and is the basis for current transactions for identical assets or liabilities at the valuation date |
| | ● | Level 2 – other significant observable inputs (including, but not limited to, quoted prices for an identical security in an inactive market, quoted prices for similar securities, interest rates, prepayment speeds, credit risk, etc.) |
| | ● | Level 3 – significant unobservable inputs (including the Funds’ own assumptions in determining fair value of investments based on the best information available) |
The inputs used to measure fair value may fall into different levels of the fair value hierarchy. In such cases, for disclosure purposes, the level in the fair value hierarchy which is reported, is determined based on the lowest level input that is significant to the fair value measurement in its entirety.
Equity securities that are traded on any stock exchange are generally valued at the last quoted sale price on the security’s primary exchange. Lacking a last sale price, an exchange-traded security is generally valued at its last bid price. Securities traded in the NASDAQ over-the-counter market are generally valued at the NASDAQ Official Closing Price. When using the market quotations and when the market is considered active, the security is classified as a Level 1 security. In the event that market quotations are not readily available or are considered unreliable due to market or other events, a Fund values its securities and other assets at fair value in accordance with policies established by and under the general supervision of the Board. Under these policies, the securities will be classified as Level 2 or 3 within the fair value hierarchy, depending on the inputs used.
Investments in mutual funds, including money market mutual funds, are generally priced at the ending NAV. These securities are categorized as Level 1 securities.
In accordance with the Trust’s valuation policies, the Adviser is required to consider all appropriate factors relevant to the value of securities for which it has determined other pricing sources are not available or reliable as described above. No single method exists for determining fair value, because fair value depends upon the circumstances of each individual case. As a general principle, the current fair value of a security being valued by the Adviser would be the amount that the Fund might reasonably expect to receive upon the current sale. Methods that are in accordance with this principle may, for example, be based on (i) a multiple of earnings; (ii) a discount from market prices of a similar freely traded security (including a derivative security or a basket of securities traded on other markets, exchanges or among dealers); or (iii) yield to maturity with respect to debt issues, or a combination of these and other methods. Fair-value pricing is permitted if, in the Adviser’s opinion, the validity of market quotations appears to be questionable based on factors such as evidence of a thin market in the
38
Dana Funds
Notes to the Financial Statements (continued)
October 31, 2019
security based on a small number of quotations, a significant event occurs after the close of a market but before a Fund’s NAV calculation that may affect a security’s value, or the Adviser is aware of any other data that calls into question the reliability of market quotations.
The following is a summary of the inputs used to value the Funds’ investments as of October 31, 2019:
Large Cap Fund | | Valuation Inputs | | | | | |
Assets | | Level 1 | | | Level 2 | | | Level 3 | | | Total | |
Common Stocks(a) | | $ | 130,465,772 | | | $ | — | | | $ | — | | | $ | 130,465,772 | |
Money Market Funds | | | 2,437,400 | | | | — | | | | — | | | | 2,437,400 | |
Total | | $ | 132,903,172 | | | $ | — | | | $ | — | | | $ | 132,903,172 | |
Small Cap Fund | | Valuation Inputs | | | | | |
Assets | | Level 1 | | | Level 2 | | | Level 3 | | | Total | |
Common Stocks(a) | | $ | 14,335,139 | | | $ | — | | | $ | — | | | $ | 14,335,139 | |
Money Market Funds | | | 227,053 | | | | — | | | | — | | | | 227,053 | |
Total | | $ | 14,562,192 | | | $ | — | | | $ | — | | | $ | 14,562,192 | |
Epiphany ESG Fund | | Valuation Inputs | | | | | |
Assets | | Level 1 | | | Level 2 | | | Level 3 | | | Total | |
Common Stocks(a) | | $ | 12,693,738 | | | $ | — | | | $ | — | | | $ | 12,693,738 | |
Money Market Funds | | | 72,696 | | | | — | | | | — | | | | 72,696 | |
Total | | $ | 12,766,434 | | | $ | — | | | $ | — | | | $ | 12,766,434 | |
(a) | Refer to Schedule of Investments for sector classifications. |
The Funds did not hold any investments at the end of the reporting period for which significant unobservable inputs (Level 3) were used in determining fair value; therefore, no reconciliation of Level 3 securities is included for this reporting period.
NOTE 4. FEES AND OTHER TRANSACTIONS WITH AFFILIATES
The Adviser, under the terms of the management agreement for each Fund, manages the Funds’ investments subject to oversight of the Board. As compensation for its management services, the Funds are obligated to pay the Adviser a fee computed and accrued daily and paid monthly at an annual rate of 0.65%, 0.75% and 0.65% of the average daily net assets of the Large Cap Fund, the Small Cap Fund and the Epiphany ESG Fund, respectively. For the fiscal year ended October 31, 2019, the Adviser earned fees of $953,872 from the Large Cap Fund and $124,427 from the Small Cap Fund before the waivers described below. For the period from November 1, 2018 to December 19, 2018, the investment adviser for the Epiphany ESG Fund was Trinity Fiduciary Partners, LLC (“Trinity”). For the period from November 1, 2018 to December 19, 2018, the Epiphany ESG Fund was obligated to pay Trinity a fee computed and accrued daily and paid monthly at an annual rate of 0.70% of the average daily net assets of the Epiphany ESG Fund. For the period from November 1,
39
Dana Funds
Notes to the Financial Statements (continued)
October 31, 2019
2018 to December 19, 2018, Trinity earned fees of $13,645 from the Epiphany ESG Fund and for the period from December 20, 2018 to October 31, 2019, the Adviser earned fees of $71,958 from the Epiphany ESG Fund. At October 31, 2019, the Large Cap Fund owed the Adviser $41,926 and the Adviser owed the Small Cap Fund and Epiphany ESG Fund $8,636 and $5,632, respectively.
The Adviser has contractually agreed to waive its management fee and/or reimburse certain operating expenses through February 29, 2020, for the Large Cap Fund and the Small Cap Fund and through February 28, 2021 for the Epiphany ESG Fund, but only to the extent necessary so that the Funds’ net expenses, excluding brokerage fees and commissions, borrowing costs (such as interest and dividend expenses on securities sold short), taxes, extraordinary expenses, fees and expenses paid under a distribution plan adopted pursuant to Rule 12b-1, fees and expenses paid under a shareholder services plan, and indirect expenses (such as “acquired funds fees and expenses”) do not exceed 0.73% of the average daily net assets of the Institutional Class and the Investor Class for the Large Cap Fund, 0.95% of the average daily net assets of the Institutional Class and the Investor Class for the Small Cap Fund, and 0.85% of the average daily net assets of the Institutional Class and the Investor Class for the Epiphany ESG Fund. Prior to December 20, 2018, Trinity contractually agreed to waive its management fee and/or reimburse certain operating expenses, but only to the extent necessary so that the Epiphany FFV Fund’s net expenses, excluding brokerage fees and commissions, borrowing costs (such as interest and dividend expenses on securities sold short), taxes, extraordinary expenses and indirect expenses (such as “acquired funds fees and expenses”) did not exceed 1.50% of the average daily net assets of the Class A shares and 1.25% for the Class I shares.
Each fee waiver or expense reimbursement by the Adviser is subject to repayment by the applicable Fund within three years following the date in which the fee waiver or expense reimbursement occurred, provided that the Fund is able to make the repayment without exceeding the expense limitation that is in effect at the time of the waiver or expense reimbursement, and the expense limitation in effect at the time of the repayment. The expense cap may not be terminated prior to these dates except by mutual consent of the Adviser and the Board. For the fiscal year ended October 31, 2019, the Adviser waived fees of $169,051 from the Large Cap Fund and $153,464 from the Small Cap Fund. For the period from November 1, 2018 to December 19, 2018, Trinity waived fees or reimbursed expenses of $22,577 in the Epiphany FFV Fund. Fees waived by Trinity are not subject to repayment. For the period from December 20, 2018 to October 31, 2019, the Adviser waived fees or reimbursed expenses of $137,305 in the Epiphany ESG Fund.
The amounts subject to repayment by the Funds, pursuant to the aforementioned conditions are as follows:
Recoverable through | | Large Cap
Fund | | | Small Cap
Fund | | | Epiphany ESG
Fund | |
October 31, 2020 | | $ | 277,301 | | | $ | 170,116 | | | $ | — | |
October 31, 2021 | | | 267,323 | | | | 170,979 | | | | — | |
October 31, 2022 | | | 169,051 | | | | 153,464 | | | | 137,305 | |
40
Dana Funds
Notes to the Financial Statements (continued)
October 31, 2019
The Trust retains Ultimus Fund Solutions, LLC (the “Administrator”) to provide the Funds with administration and compliance (including a chief compliance officer), fund accounting and transfer agent services, including all regulatory reporting. Prior to December 20, 2018, Mutual Shareholder Services, LLC (“MSS”) provided these services for the Epiphany FFV Fund. For the fiscal year ended October 31, 2019, fees for administration, compliance, fund accounting, and transfer agent services, and amounts due to the Administrator at October 31, 2019 were as follows:
| | Large Cap
Fund | | | Small Cap
Fund | | | Epiphany ESG
Fund | |
Administration and compliance | | $ | 76,228 | | | $ | 36,000 | | | $ | 28,295 | |
Fund accounting | | | 42,749 | | | | 28,000 | | | | 20,774 | |
Transfer agent | | | 20,392 | | | | 20,700 | | | | 21,824 | |
Payable to Administrator | | | 11,796 | | | | 8,866 | | | | 12,142 | |
The officers and one trustee of the Trust are members of management and/or employees of the Administrator. Unified Financial Securities, LLC (the “Distributor”), a wholly owned subsidiary of Ultimus, acts as the distributor of the Funds’ shares.
The Trust, with respect to each Fund, has adopted a Distribution Plan (the “Plan”) pursuant to Rule 12b-1 under the Investment Company Act of 1940 (the “1940 Act”). The Plan provides that the Funds will pay the Distributor and any registered securities dealer, financial institution or any other person (a “Recipient”) a shareholder servicing fee aggregating at a rate of 0.25% of the average daily net assets for the Investor Class shares in connection with the promotion and distribution of the Funds’ shares or the provision of shareholder support services to shareholders, including, but not necessarily limited to, advertising, compensation to underwriters, dealers and selling personnel, the printing and mailing of prospectuses to other than current Investor Class shareholders, the printing and mailing of sales literature and servicing shareholder accounts (“12b-1 Expenses”). The Funds or Distributor may pay all or a portion of these fees to any Recipient who renders assistance in distributing or promoting the sale of shares, or who provides certain shareholder services, pursuant to a written agreement. The Plan is a compensation plan, which means that compensation is paid regardless of 12b-1 Expenses actually incurred. It is anticipated that the Plan will benefit shareholders because an effective sales program typically is necessary in order for the Funds to reach and maintain a sufficient size to achieve efficiently its investment objectives and to realize economies of scale. For the fiscal year ended October 31, 2019, Investor Class shares 12b-1 expense incurred by the Large Cap Fund, Small Cap Fund and Epiphany ESG Fund were $64,353, $6,721 and $19,420, respectively. As of October 31, 2019, the Large Cap Fund, Small Cap Fund and Epiphany ESG Fund owed the Distributor $5,279, $463 and $1,623, respectively, for Investor Class 12b-1 fees.
41
Dana Funds
Notes to the Financial Statements (continued)
October 31, 2019
NOTE 5. PURCHASES AND SALES OF SECURITIES
For the fiscal year ended October 31, 2019, purchases and sales of investment securities, other than short-term investments were as follows:
| | Large Cap
Fund | | | Small Cap
Fund | | | Epiphany ESG
Fund | |
Purchases | | $ | 73,293,892 | | | $ | 8,266,335 | | | $ | 7,786,825 | |
| | | | | | | | | | | | | |
Sales | | | 161,899,029 | | | | 13,391,888 | | | | 11,617,826 | |
There were no purchases or sales of long-term U.S. government obligations during the fiscal year ended October 31, 2019.
NOTE 6. FEDERAL TAX INFORMATION
At October 31, 2019, the net unrealized appreciation (depreciation) of investments for tax purposes was as follows:
| | Large Cap
Fund | | | Small Cap
Fund | | | Epiphany ESG
Fund | |
Gross unrealized appreciation | | $ | 20,654,740 | | | $ | 2,058,216 | | | $ | 2,255,354 | |
Gross unrealized depreciation | | | (597,791 | ) | | | (824,366 | ) | | | (127,162 | ) |
Net unrealized appreciation on investments | | $ | 20,056,949 | | | $ | 1,233,850 | | | $ | 2,128,192 | |
Tax cost of investments | | $ | 112,846,223 | | | $ | 13,328,342 | | | $ | 10,638,242 | |
At October 31, 2019, the difference between book basis and tax basis unrealized appreciation for the Large Cap Fund, Small Cap Fund and Epiphany ESG Fund was attributable primarily to the tax deferral of losses on wash sales and the return of capital adjustments from real estate investment trusts.
At October 31, 2019, the components of accumulated earnings (accumulated losses) on a tax basis were as follows:
| | Large Cap
Fund | | | Small Cap
Fund | | | Epiphany ESG
Fund | |
Undristibuted ordinary income | | $ | 218,069 | | | $ | — | | | $ | 16,454 | |
Undristibuted long-term capital gains | | | 13,577,236 | | | | — | | | | 1,931,294 | |
Accumulated capital and other losses | | | — | | | | (112,050 | ) | | | — | |
Unrealized appreciation (depreciation) | | | 20,056,949 | | | | 1,233,850 | | | | 2,128,192 | |
Total accumulated earnings | | $ | 33,852,254 | | | $ | 1,121,800 | | | $ | 4,075,940 | |
42
Dana Funds
Notes to the Financial Statements (continued)
October 31, 2019
The tax character of distributions paid for the fiscal years ended October 31, 2019 and October 31, 2018 were as follows:
| | | Large Cap Fund | | | Small Cap Fund | | | Epiphany ESG Fund | |
| | 2019 | | | 2018 | | | 2019 | | | 2018 | | | 2019 | | | 2018 | |
Distributions paid from: | | | | | | | | | | | | | | | | | | | | | | | | |
Ordinary income(a) | | $ | 2,385,415 | | | $ | 2,795,130 | | | $ | — | | | $ | — | | | $ | 118,259 | | | $ | 1,549,554 | |
Long-term capital gains | | | 16,150,871 | | | | 6,365,270 | | | | 1,344,166 | | | | 4,138 | | | | 1,642,707 | | | | 1,538,630 | |
Total distributions paid | | $ | 18,536,286 | | | $ | 9,160,400 | | | $ | 1,344,166 | | | $ | 4,138 | | | $ | 1,760,966 | | | $ | 3,088,184 | |
(a) | For federal income tax purposes, distributions of short-term capital gains are treated as ordinary income distributions. |
As of October 31, 2019, the Small Cap Fund had available for tax purposes unused capital loss carryforwards of $107,624 of short-term capital losses with no expiration, which is available to offset against future taxable net capital gains. To the extent that these carryforwards are used to offset future gains, it is probable that the amount offset will not be distributed to shareholders.
For the tax year ended October 31, 2019, the Small Cap Fund deferred qualified late year ordinary losses of $4,426.
NOTE 7. COMMITMENTS AND CONTINGENCIES
The Trust indemnifies its officers and Trustees for certain liabilities that may arise from their performance of their duties to the Trust or the Funds. Additionally, in the normal course of business, the Trust enters into contracts that contain a variety of representations and warranties which provide general indemnifications. The Trust’s maximum exposure under these arrangements is unknown, as this would involve future claims that may be made against the Trust that have not yet occurred.
NOTE 8. SUBSEQUENT EVENTS
Management of the Funds has evaluated the need for disclosures and/or adjustments resulting from subsequent events through the date at which these financial statements were issued. Based upon this evaluation, management has determined there were no items requiring adjustment of the financial statements or additional disclosure.
43
Report of Independent Registered Public Accounting Firm
To the Shareholders of Dana Large Cap Equity Fund, Dana Small Cap Equity Fund, and
Dana Epiphany ESG Equity Fund and
Board of Trustees of Valued Advisers Trust
Opinion on the Financial Statements
We have audited the accompanying statements of assets and liabilities, including the schedules of investments, of Dana Large Cap Equity Fund, Dana Small Cap Equity Fund, and Dana Epiphany ESG Equity Fund (the “Funds”), each a series of Valued Advisers Trust, as of October 31, 2019, the related statement of operations for the year then ended, the statements of changes in net assets for each of the two years in the period then ended, including the related notes, and the financial highlights for each of the five years in the period then ended for Dana Large Cap Equity Fund, the related statement of operations for the year then ended, the statements of changes in net assets for each of the two years in the period then ended, including the related notes, and the financial highlights for each of the four periods in the period then ended for Dana Small Cap Equity Fund, and the related statements of operations and changes in net assets, including the related notes, and the financial highlights for the year then ended for Dana Epiphany ESG Equity Fund (collectively referred to as the “financial statements”). In our opinion, the financial statements present fairly, in all material respects, the financial position of each of the Funds as of October 31, 2019, the results of their operations, the changes in their net assets, and the financial highlights for each of the periods indicated above, in conformity with accounting principles generally accepted in the United States of America.
Dana Epiphany ESG Equity Fund’s financial statements and financial highlights for the years ended October 31, 2018, and prior, were audited by other auditors whose report dated December 26, 2018, expressed an unqualified opinion on those financial statements and financial highlights.
Basis for Opinion
These financial statements are the responsibility of the Funds’ management. Our responsibility is to express an opinion on the Funds’ financial statements based on our audits. We are a public accounting firm registered with the Public Company Accounting Oversight Board (United States) (“PCAOB”) and are required to be independent with respect to the Funds in accordance with the U.S. federal securities laws and the applicable rules and regulations of the Securities and Exchange Commission and the PCAOB.
We conducted our audits in accordance with the standards of the PCAOB. Those standards require that we plan and perform the audit to obtain reasonable assurance about whether the financial statements are free of material misstatement, whether due to error or fraud.
Our audits included performing procedures to assess the risks of material misstatement of the financial statements, whether due to error or fraud, and performing procedures that respond to those risks. Such procedures included examining, on a test basis, evidence regarding the amounts and disclosures in the financial statements. Our procedures included confirmation of securities owned as of October 31, 2019, by correspondence with the custodian and brokers or by other appropriate auditing procedures where replies from brokers were not received. Our audits also included evaluating the
44
Report of Independent Registered Public Accounting Firm (continued)
accounting principles used and significant estimates made by management, as well as evaluating the overall presentation of the financial statements. We believe that our audits provide a reasonable basis for our opinion.
We have served as the auditor of one or more investment companies within Dana Funds since 2012.
COHEN & COMPANY, LTD.
Cleveland, Ohio
December 20, 2019
45
Summary of Fund Expenses (Unaudited)
As a shareholder of a Fund, you incur two types of costs: (1) transaction costs and (2) ongoing costs, including management fees and other Fund expenses. These examples are intended to help you understand your ongoing costs (in dollars) of investing in each Fund and to compare these costs with the ongoing costs of investing in other mutual funds. Each Fund’s example is based on an investment of $1,000 invested at the beginning of the period and held for the entire period from May 1, 2019 through October 31, 2019.
Actual Expenses
The first line of the table for each class provides information about actual account values and actual expenses. You may use the information in these lines, together with the amount you invested, to estimate the expenses that you paid over the period. Simply divide your account value by $1,000 (for example, an $8,600 account value divided by $1,000 = 8.60), then multiply the result by the number in the first line under the heading “Expenses Paid During Period” to estimate the expenses you paid on your account during this period.
Hypothetical Example for Comparison Purposes
The second line of the table for each class provides information about hypothetical account values and hypothetical expenses based on each Fund’s actual expense ratios and an assumed rate of return of 5% per year before expenses, which is not the Fund’s actual return. The hypothetical account values and expenses may not be used to estimate the actual ending account balances or expenses you paid for the period. You may use this information to compare the ongoing costs of investing in the Funds and other funds. To do so, compare this 5% hypothetical example with the 5% hypothetical examples that appear in the shareholder reports of the other funds.
Expenses shown in the table are meant to highlight your ongoing costs only and do not reflect any transactional costs. Therefore, the second line of the table for each class is useful in comparing ongoing costs only and will not help you determine the relative total costs of owning different funds. In addition, if transaction costs were included, your costs would have been higher.
46
Summary of Fund Expenses (Unaudited) (continued)
| | Beginning
Account
Value
May 1, 2019 | Ending
Account
Value
October 31, 2019 | Expenses
Paid
During
Period(a) | Annualized
Expense
Ratio |
Large Cap Fund |
Institutional Class | Actual | $ 1,000.00 | $ 1,068.80 | $3.81 | 0.73% |
| | | | | | |
| | Hypothetical (b) | $ 1,000.00 | $ 1,021.53 | $3.72 | 0.73% |
| | | | | | |
Investor Class | Actual | $ 1,000.00 | $ 1,067.40 | $5.11 | 0.98% |
| | | | | | |
| | Hypothetical (b) | $ 1,000.00 | $ 1,020.27 | $4.99 | 0.98% |
Small Cap Fund |
Institutional Class | Actual | $ 1,000.00 | $ 975.20 | $4.75 | 0.95% |
| | | | | | |
| | Hypothetical (b) | $ 1,000.00 | $ 1,020.40 | $4.86 | 0.95% |
| | | | | | |
Investor Class | Actual | $ 1,000.00 | $ 974.10 | $5.99 | 1.20% |
| | | | | | |
| | Hypothetical (b) | $ 1,000.00 | $ 1,019.14 | $6.13 | 1.20% |
Epiphany ESG Fund |
Institutional Class | Actual | $ 1,000.00 | $ 1,046.00 | $4.38 | 0.85% |
| | | | | | |
| | Hypothetical (b) | $ 1,000.00 | $ 1,020.92 | $4.33 | 0.85% |
| | | | | | |
Investor Class | Actual | $ 1,000.00 | $ 1,045.20 | $5.67 | 1.10% |
| | | | | | |
| | Hypothetical (b) | $ 1,000.00 | $ 1,019.66 | $5.60 | 1.10% |
(a) | Expenses are equal to the Fund’s annualized expense ratios, multiplied by the average account value over the period, multiplied by 184/365 (to reflect the one-half year period). The annualized expense ratios reflect reimbursement of expenses by the Fund’s investment adviser for the period beginning May 1, 2019 to October 31, 2019. The “Financial Highlights” tables in the Fund’s financial statements, included in this report, also show the gross expense ratios, without such reimbursements. |
(b) | Hypothetical assumes 5% annual return before expenses. |
47
Additional Federal Income Tax Information (Unaudited)
The Form 1099-DIV you receive in January 2020 will show the tax status of all distributions paid to your account in calendar year 2019. Shareholders are advised to consult their own tax adviser with respect to the tax consequences of their investment in the Funds. As required by the Internal Revenue Code and/or regulations, shareholders must be notified regarding the status of qualified dividend income for individuals and the dividends received deduction for corporations.
Qualified Dividend Income. The Funds designate the following percentage or up to the maximum amount of such dividends allowable pursuant to the Internal Revenue Code, as qualified dividend income eligible for the reduced tax rate.
| Qualified
Dividend
Income |
Large Cap Fund | 100% |
Small Cap Fund | 0% |
Epiphany ESG Fund | 100% |
Qualified Business Income. The Funds designate the following percentage of ordinary income dividends, or up to the maximum amount of such dividends allowable pursuant to the Internal Revenue Code, as qualified business income.
| Qualified
Business
Income |
Large Cap Fund | 0% |
Small Cap Fund | 0% |
Epiphany ESG Fund | 0% |
Dividends Received Deduction. Corporate shareholders are generally entitled to take the dividends received deduction on the portion of the Funds’ dividend distribution that qualifies under tax law. For the Funds’ calendar year 2019 ordinary income dividends, the following percentage qualifies for the corporate dividends received deduction.
| Dividends
Received
Deduction |
Large Cap Fund | 100% |
Small Cap Fund | 0% |
Epiphany ESG Fund | 100% |
48
Additional Federal Income Tax Information (Unaudited) (continued)
The Funds designate the following amounts as long-term capital gains distributions. The amounts designated may not agree with long-term capital gains in the tax character of distribution table due to utilization of earnings and profits distributed to shareholders on redemption of shares.
| | | | Long-Term
Capital Gains
Distributions | |
Large Cap Fund | | | $ | 16,150,871 | |
Small Cap Fund | | | $ | 1,344,166 | |
Epiphany ESG Fund | | | $ | 1,642,707 | |
Trustees and Officers (Unaudited)
The Board of Trustees supervises the business activities of the Trust. Each Trustee serves as a trustee until termination of the Trust unless the Trustee dies, resigns, retires or is removed.
The following table provides information regarding each of the Independent Trustees.
Name, Address*, Age,
Position with Trust**,
Term of Position with Trust | Principal Occupation
During Past 5 Years
and Other Directorships | Other Directorships |
Andrea N. Mullins, 52 Independent Trustee
Since December 2013 Chairperson since March 2017 | Current: Private investor; Independent Contractor, SWM Advisors (since April 2014). | Trustee, Angel Oak Funds Trust (since February 2019) (4 portfolios); Trustee, Angel Oak Strategic Credit Fund (since February 2019). |
Ira P. Cohen, 60 Independent Trustee Since June 2010 | Current: Independent financial services consultant (since February 2005); Executive Vice President of Asset Management Services, Recognos Financial (since August 2015). | Trustee and Audit Committee Chairman, Griffin Institutional Access Credit Fund (since January 2017); Trustee and Audit Committee Chairman, Griffin Institutional Real Estate Access Fund (since May 2014); Trustee, Angel Oak Funds Trust (since October 2014) (4 portfolios) Trustee, Chairman, and Nominating and Governance Committee Chairman, Angel Oak Strategic Credit Fund (since December 2017). |
* | The address for each Trustee is 225 Pictoria Drive, Suite 450, Cincinnati, Ohio 45246. |
** | As of the date of this report, the Trust consists of 12 series. |
49
Trustees and Officers (Unaudited) (continued)
The following table provides information regarding the Trustee who is considered an “interested person” of the Trust, as that term is defined under the 1940 Act. Based on the experience of the Trustee, the Trust concluded that the individual described below should serve as a Trustee.
Name, Address*, Age,
Position with Trust**,
Term of Position with Trust | Principal Occupation
During Past 5 Years | Other Directorships |
Mark J. Seger, 57 Trustee Since March 2017 | Current: Vice Chairman of Ultimus Fund Solutions, LLC (since 1999). Previous: Managing Director and Co-Chief Executive Officer of Ultimus Fund Solutions, LLC (since 1999). | None. |
* | The address for each Trustee is 225 Pictoria Drive, Suite 450, Cincinnati, Ohio 45246. |
** | As of the date of this report, the Trust consists of 12 series. |
The following table provides information regarding the Officers of the Trust:
Name, Address*, Age,
Position with Trust**,
Term of Position with Trust | Principal Occupation
During Past 5 Years | Other Directorships |
Adam T. Kornegay, 34 Principal Executive Officer and President Since April 2018 | Current: Vice President, Business Development Director, Ultimus Fund Solutions, LLC (since March 2015). Previous: Vice President, Citigroup, Inc. (July 2009 to February 2015). | None. |
Gregory T. Knoth, 49 Principal Financial Officer and Treasurer Since April 2019 | Current: Vice President, Mutual Fund Controller, Ultimus Fund Solutions, LLC (sinceJanuary 2016). Previous: Vice President and Manager of Fund Accounting, Huntington Asset Services, Inc. (n/k/a Ultimus Asset Services, LLC) (June 2013 to December 2015). | None. |
Martin R. Dean, 56 Interim Chief Compliance Officer Since May 2019 | Current: Vice President, Director of Fund Compliance of Ultimus Fund Solutions, LLC (since January 2016) Previous: Senior Vice President and Compliance Group Manager, Huntington Asset Services, Inc. (n/k/a Ultimus Asset Services, LLC) (July 2013 to December 2015). | None. |
50
Trustees and Officers (Unaudited) (continued)
Name, Address*, Age,
Position with Trust**,
Term of Position with Trust | Principal Occupation
During Past 5 Years | Other Directorships |
Carol J. Highsmith, 56 Vice President Since August 2008 Secretary Since March 2014 | Current: Assistant Vice President, Ultimus Fund Solutions, LLC (sinceJanuary 2016). Previous: Employed in various positions with Huntington Asset Services, Inc. (n/k/a Ultimus Asset Services, LLC) (November 1994 to December 2015), most recently Vice President of Legal Administration (2005 to December 2015). | None. |
* | The address for each officer is 225 Pictoria Drive, Suite 450, Cincinnati, Ohio 45246. |
** | As of the date of this report, the Trust consists of 12 series. |
Other Information (Unaudited)
The Funds’ Statement of Additional Information (“SAI”) includes additional information about the trustees and is available without charge, upon request. You may call toll-free at (855) 280-9648 to request a copy of the SAI or to make shareholder inquiries.
51
Investment Advisory Agreement Approval (Unaudited)
At a meeting held on June 5 and 6, 2019, the Board of Trustees (the “Board”) considered the renewal of the Investment Advisory Agreements (the “Dana Agreements”) between Valued Advisers Trust (the “Trust”) and Dana Investment Advisors, Inc. (“Dana”) with respect to the Dana Large Cap Equity Fund (the “Large Cap Fund”) and the Dana Small Cap Equity Fund (the “Small Cap Fund”) (collectively, the “Dana Funds”). Dana provided written information to the Board to assist the Board in its considerations.
The Board discussed the contractual arrangements between Dana and the Trust for the Dana Funds. They reflected upon the Board’s prior experience with Dana in managing the Dana Funds, as well as their earlier discussions with Dana.
Counsel then directed the Trustees to a memorandum from his firm that summarized, among other things, the fiduciary duties and responsibilities of the Board in reviewing and approving the Dana Agreements. In assessing the factors and reaching its decision, the Board took into consideration information furnished by Dana and the Trust’s other service providers for the Board’s review and consideration throughout the year, as well as information specifically prepared or presented in connection with the renewal process, including: (i) reports regarding the services and support provided to the Dana Funds by Dana; (ii) quarterly assessments of the investment performance of the Dana Funds; (iii) commentary on the reasons for the performance; (iv) presentations by Dana addressing its investment philosophy, investment strategy, personnel, and operations of Dana; (v) compliance and audit reports concerning the Dana Funds and Dana; (vi) disclosure information contained in the registration statement of the Trust for the Dana Funds and Dana’s Form ADV; and (vii) a memorandum from counsel, that summarized the fiduciary duties and responsibilities of the Board in reviewing and approving the Dana Agreements. The Board also requested and received materials including, without limitation: (a) documents containing information about Dana, including its financial information; a description of its personnel and the services it provides to the Dana Funds; information on Dana’s investment advice and performance; summaries of the Dana Funds’ expenses, compliance program, current legal matters, and other general information; (b) comparative expense and performance information for other mutual funds with strategies similar to the Dana Funds; and (c) the benefits to be realized by Dana from its relationship with the Dana Funds. The Board did not identify any particular information that was most relevant to its consideration to approve the Dana Agreements and each Trustee may have afforded different weight to the various factors.
1. | The nature, extent, and quality of the services to be provided by Dana. The Board considered Dana’s responsibilities under the Dana Agreements. The Trustees considered the services being provided by Dana to the Dana Funds including, without limitation: the quality of its investment advisory services (including research and recommendations with respect to portfolio securities), its process for formulating investment recommendations and assuring compliance with the Dana Funds’ investment objectives and limitations, its coordination of services for the Dana Funds among their service providers, and its efforts to promote the Dana Funds and grow their assets. The Trustees considered Dana’s continuity of, and commitment to retain, qualified personnel and Dana’s commitment to maintain and enhance its resources and systems, the commitment of Dana’s personnel to finding alternatives and options that allow the Dana Funds to maintain their goals, and Dana’s continued cooperation with the Board and counsel for the Dana Funds. The Trustees considered Dana’s personnel, including their education and experience. After considering the foregoing information and further information in the Meeting materials provided by Dana, the Board concluded that, in light of all the facts and circumstances, the nature, extent, and quality of the services provided by Dana were satisfactory and adequate for the Dana Funds. |
52
Investment Advisory Agreement Approval (Unaudited) (continued)
2. | Investment Performance of the Dana Funds and Dana. The Trustees compared the performance of each of the Dana Funds with the performance of funds with similar objectives managed by other investment advisers, with aggregated peer group data, as well as with the performance of each of the Dana Funds’ benchmark. The Trustees also considered the consistency of Dana’s management of the Dana Funds with their investment objectives, strategies, and limitations. The Trustees noted that, as of March 31, 2019, the Large Cap Fund’s performance was above its peer group average and median for the one-month, three-month, and three-year periods, below the average and median for the one-year period, and above the average and equal to the median for the five-year period. The Trustees noted that the Large Cap Fund’s performance was below that of its benchmark for all periods presented. When compared to other funds in its Morningstar category, the Trustees observed that the Large Cap Fund’s performance was above the average and median for the one-month and three-month periods, below the average and median for the one-year and five-year periods, and above the average but below the median for the three-year period for the Institutional Class. The Investor Class was below the average and median for the three-year period. The Trustees also considered the performance of Dana’s separate accounts that were managed in a manner similar to that of the Large Cap Fund and they noted that the performance of Dana’s composite was higher, and that the reasons for the difference were reasonable. The Trustees considered the performance of the Small Cap Fund, and observed that, as of March 31, 2019, the Small Cap Fund performed above the average and median of its peer group for the one-month period, performed below the average but equal to the median for the three-month and one-year periods, and performed below both the average and the median for the three-year period. As compared to its benchmark, the Trustees noted that the Small Cap Fund also underperformed for the three-month, one-year and three-year periods but outperformed for the one-month period. They also noted that the Small Cap Fund’s performance was below the average and median of its Morningstar category for all periods presented. The Trustees also considered the performance of Dana’s separate accounts that were managed in a manner similar to that of the Small Cap Fund and they noted that the performance of the separate account composite was higher, and that the reasons for the difference were reasonable. The Trustees took into consideration discussions with representatives of Dana regarding the reasons for the performance of each of the Dana Funds. After reviewing and discussing these and other relevant factors, the Board concluded, in light of all the facts and circumstances, that the investment performance of the Dana Funds and Dana was satisfactory. |
3. | The costs of the services to be provided and profits to be realized by Dana from the relationship with the Dana Funds. The Trustees considered: (1) Dana’s financial condition; (2) the asset level of the Dana Funds; (3) the overall expenses of each of the Dana Funds; and (4) the nature and frequency of management fee payments. The Trustees reviewed information provided by Dana regarding its profits associated with managing each of the Dana Funds, noting that Dana is currently waiving a portion of its management fee for its services rendered to each of the Dana Funds. The Trustees also considered potential benefits for Dana in managing the Dana Funds. The Trustees then compared the fees and expenses of the Dana Funds (including the management fee) to other comparable mutual funds. The Trustees noted that the Large Cap Fund’s management fee was below the average and median of its peer group and above the average and median of its Morningstar category. The Trustees also noted that the Large Cap Fund’s net expense ratio for the Institutional Class was below the average and median of its peer group and Morningstar category, because of Dana’s contractual commitment to limit the |
53
Investment Advisory Agreement Approval (Unaudited) (continued)
expenses of the Large Cap Fund. They noted that the Investor Class expense ratio was higher than the average and median of its Morningstar category. With respect to the Small Cap Fund, the Trustees noted that the management fee was below the average and median of its peer group and Morningstar category. They also noted that the Small Cap Fund’s expense ratio for the Institutional Class was above the average but below the median of its peer group and below the average and median of its Morningstar category. They noted that the Investor Class expense ratio was higher than the average and median of its Morningstar category. The Board also considered the fact that Dana contractually lowered the management fee for each of the Dana Funds in the past. The Board noted that the fees that Dana assesses for separate account clients that have strategies similar to that of each of the Dana Funds, respectively, could be comparable or lower and they expressed the view that the reasons for such differences were acceptable and reasonable. Based on the foregoing, the Board concluded that the fees to be paid to Dana by each of the Dana Funds and the profits to be realized by Dana, in light of all the facts and circumstances, were fair and reasonable in relation to the nature and quality of the services provided by Dana.
4. | The extent to which economies of scale would be realized as the Dana Funds grow and whether advisory fee levels reflect these economies of scale for the benefit of the Dana Funds’ investors. The Board considered the Dana Funds’ fee arrangements with Dana. The Board considered that while the management fee remained the same at all asset levels, the shareholders experienced benefits from each of the Dana Funds’ expense limitation arrangements. The Trustees noted that once the expenses fell below the cap set by each arrangement, the shareholders would continue to benefit from economies of scale under the Dana Funds’ arrangements with other service providers to the Dana Funds, and the Trustees attributed this benefit, in part, to the direct and indirect efforts of Dana at the inception of each of the Dana Funds to ensure that a cost structure was in place that was beneficial for the Dana Funds as they grew. In light of its ongoing consideration of the Dana Funds’ asset levels, expectations for growth in the Dana Funds, and fee levels, the Board determined that the Dana Funds’ fee arrangements, in light of all the facts and circumstances, were fair and reasonable in relation to the nature and quality of the services provided by Dana. |
5. | Possible conflicts of interest and benefits to Dana. The Trustees evaluated the potential for conflicts of interest and considered such matters as the experience and ability of the advisory personnel assigned to the Dana Funds; the basis of decisions to buy or sell securities for the Dana Funds and the substance and administration of Dana’s code of ethics. The Trustees also considered disclosure in the registration statement of the Trust relating to Dana’s potential conflicts of interest. The Trustees noted that Dana may utilize soft dollars and the Trustees noted Dana’s policies and processes for managing the conflicts of interest that could arise from soft dollar arrangements. The Trustees noted other potential benefits to Dana, including the fact that the Dana Funds provide an attractive vehicle for smaller accounts, which may increase the total assets under management by Dana and provide marginal cost efficiency. Based on the foregoing, the Board determined that the standards and practices of Dana relating to the identification and mitigation of potential conflicts of interest and the benefits to be realized by Dana in managing the Dana Funds were satisfactory. |
After additional consideration of the factors delineated in the memorandum provided by counsel and further discussion among the Board members, the Board determined to approve the continuation of the Dana Agreements between the Trust and Dana.
54
FACTS | WHAT DO THE DANA FUNDS DO WITH YOUR PERSONAL INFORMATION? |
| | |
Why? | Financial companies choose how they share your personal information. Federal law gives consumers the right to limit some but not all sharing. Federal law also requires us to tell you how we collect, share, and protect your personal information. Please read this notice carefully to understand what we do. |
| | |
What? | The types of personal information we collect and share depend on the product or service you have with us. This information can include: ■ Social Security number ■ account balances and account transactions ■ transaction or loss history and purchase history ■ checking account information and wire transfer instructions When you are no longer our customer, we continue to share your information as described in this notice. |
| | |
How? | All financial companies need to share customers’ personal information to run their everyday business. In the section below, we list the reasons financial companies can share their customers’ personal information; the reasons Dana Funds choose to share; and whether you can limit this sharing. |
| | |
Reasons we can share your personal information | Does Dana Funds share? |
For our everyday business purposes —
such as to process your transactions, maintain your account(s), respond to court orders and legal investigations, or report to credit bureaus | Yes |
For our marketing purposes —
to offer our products and services to you | No |
For joint marketing with other financial companies | No |
For our affiliates’ everyday business purposes –
information about your transactions and experiences | No |
For our affiliates’ everyday business purposes –
information about your creditworthiness | No |
For nonaffiliates to market to you | No |
| | |
Questions? | Call 1-855-280-9648 |
55
Who we are |
Who is providing this notice? | Dana Funds
Unified Financial Securities, LLC (Distributor)
Ultimus Fund Solutions, LLC (Administrator) |
What we do |
How do Dana Funds protect my personal information? | To protect your personal information from unauthorized access and use, we use security measures that comply with federal law. These measures include computer safeguards and secured files and buildings. Our service providers are held accountable for adhering to strict policies and procedures to prevent any misuse of your nonpublic personal information. |
How do Dana Funds collect my personal information? | We collect your personal information, for example, when you ■ open an account or deposit money ■ buy securities from us or sell securities to us ■ make deposits or withdrawals from your account or provide account information ■ give us your account information ■ make a wire transfer ■ tell us who receives the money ■ tell us where to send the money ■ show your government-issued ID ■ show your driver’s license |
Why can’t I limit all sharing? | Federal law gives you the right to limit only ■ sharing for affiliates’ everyday business purposes—information about your creditworthiness ■ affiliates from using your information to market to you ■ sharing for nonaffiliates to market to you State laws and individual companies may give you additional rights to limit sharing. |
Definitions |
Affiliates | Companies related by common ownership or control. They can be financial and nonfinancial companies. ■ Dana Investment Advisors, Inc., the investment adviser to the Funds, could be deemed to be an affiliate. |
Nonaffiliates | Companies not related by common ownership or control. They can be financial and nonfinancial companies. ■ The Dana Funds do not share with nonaffiliates so they can market to you. |
Joint marketing | A formal agreement between nonaffiliated financial companies that together market financial products or services to you. ■ The Dana Funds do not jointly market. |
56
This page is intentionally left blank.
PROXY VOTING
A description of the policies and procedures that each Fund uses to determine how to vote proxies relating to portfolio securities and information regarding how each Fund voted those proxies during the most recent twelve month period ended June 30, are available (1) without charge upon request by calling the Funds at (855) 280-9648 and (2) in the Funds’ documents filed with the Securities and Exchange Commission (“SEC”) on the SEC’s website at www.sec.gov.
TRUSTEES
Andrea N. Mullins, Chairperson
Ira P. Cohen
Mark J. Seger
OFFICERS
Adam T. Kornegay, Principal Executive Officer and President
Gregory T. Knoth, Principal Financial Officer and Treasurer
Martin R. Dean, Interim Chief Compliance Officer
Carol J. Highsmith, Vice President and Secretary
INVESTMENT ADVISER
Dana Investment Advisors, Inc.
20700 Swenson Drive, Suite 400
Waukesha, WI 53186
DISTRIBUTOR
Unified Financial Securities, LLC
9465 Counselors Row, Suite 200
Indianapolis, IN 46240
INDEPENDENT REGISTERED PUBLIC ACCOUNTING FIRM
Cohen & Company, Ltd.
1350 Euclid Avenue, Suite 800
Cleveland, OH 44115
LEGAL COUNSEL
Stradley Ronon Stevens & Young, LLP
2005 Market Street, Suite 2600
Philadelphia, PA 19103
CUSTODIAN
Huntington National Bank
41 South High Street
Columbus, OH 43215
ADMINISTRATOR, TRANSFER AGENT AND FUND ACCOUNTANT
Ultimus Fund Solutions, LLC
225 Pictoria Drive, Suite 450
Cincinnati, OH 45246
This report is intended only for the information of shareholders or those who have received the Funds’ prospectus which contains information about each Fund’s management fee and expenses. Please read the prospectus carefully before investing.
Distributed by Unified Financial Securities, LLC
Member FINRA/SIPC
Annual Report October 31, 2019 |
Foundry Partners Fundamental Small Cap
Value Fund
Investor Class – DRSVX
Institutional Class – DRISX
Beginning on January 1, 2021, as permitted by regulations adopted by the Securities and Exchange Commission, paper copies of the Fund’s shareholder reports like this one will no longer be sent by mail, unless you specifically request paper copies of the reports from the Fund or from your financial intermediary such as a broker-dealer or bank. Instead, the reports will be made available on a website, and you will be notified by mail each time a report is posted and provided with a website link to access the report.
If you already elected to receive shareholder reports electronically, you will not be affected by this change and you need not take any action. You may elect to receive shareholder reports and other communications from the Fund electronically by contacting the Fund at (800) 247-1014 or, if you own these shares through a financial intermediary, you may contact your financial intermediary.
You may elect to receive all future reports in paper free of charge. You can inform the Fund that you wish to continue receiving paper copies of your shareholder reports by contacting the Fund at (800) 247-1014. If you own shares through a financial intermediary, you may contact your financial intermediary or follow instructions included with this document to elect to continue to receive paper copies of your shareholder reports. Your election to receive reports in paper will apply to all funds held with the fund complex or at your financial intermediary.
Market Overview and Fund Performance |
Market Review
Trade war, the Federal Reserve Board (the “FED”), a potential Trump impeachment, and BREXIT have been the top narratives driving the markets for the trailing 12 months ended October 31, 2019. The trade wars intensified through the summer of 2019, peaking in August. A single tweet by President Trump assured all that progress was being made in the negotiations. The tweet coupled with a more accommodative FED that cut interest rates three times this year to a target rate range of 1.50% to 1.75%. The FED cited the trade wars as well as an inverted yield curve that has generally signaled a recession in the coming 18-24 months. In addition, the repo market experienced increased volatility to its overnight lending rates, providing a déjà vu moment for investors of the great recession in 2008. With increased liquidity and lower rates the FED effectively assured investors it could and did act quickly to quell any concerns of a recession and assure investors that the FED put is still alive and well. To that end, the market closed the fiscal year end (10/31/2019) at an all time high.
Portfolio Review
Amidst the volatility, the Foundry Partners Fundamental Small Cap Value Fund (the “Fund”) (Institutional Class) underperformed the Fund’s benchmark, the Russell 2000® Value Index, by 67 basis points over the course of the last 12 months ending on October 31, 2019. The largest detractors to performance were Financials, Real Estate, Materials, and Utilities. The Fund’s strongest contributors to performance were Energy, Health Care, Industrials, and Consumer Discretionary.
Financials were the worst performer for the year due to poor stock selection in Banks. Umpqua Holdings and Associated Banc-Corp declined -13.3% and -10.4%, respectively, as they experienced compressed net interest margins due to the inverted yield curve. Donnelley Financial, a capital markets and investment company, declined -27.3% as the company failed to meet analyst EPS estimates. A lack of M&A and capital market transactions coupled with a headwind from foreign exchange weighed on results. We remain underweight in the financial space mainly due to our underweight within the Insurance and Thrift and Mortgage industries.
A flight to safety theme emerged for the first 9 months of the year, butting a strong bid behind REITS and Utilities. Our underweight in these sectors detracted from performance, as these were two of the top three best performing sectors for the year, only Information Technology was better. The expectations for lower rates going forward combined with the increase in volatility created a flight to safety and flight to yield environment for investors. We have been underweight Utilities for quite some time given stretched valuations. While valuations within Real Estate have become more attractive as of late, they still do not warrant a more aggressive weighting as we believe that valuations are more attractive elsewhere.
Heath Care was a strong performing sector driven by stock selection. All of our stocks in this sector performed well including LHC Group, up 21.3%; NextGen Healthcare, climbing 14.4%; and Select Medical, gaining 9.8% over the 12-month period. The ability of these companies to grow their top line coupled with strong balance sheets provided upside to their earnings over the past year.
Annual Report
1
Market Overview and Fund Performance (Continued) |
Information Technology was an additional source of alpha for the Fund during the fiscal year. Within IT services KBR and Science Applications International climbed 44.6% and 21.1%, respectively. KBR, an Engineering and Construction company, reengineered its business model away from hydrocarbons into a more stable and higher profitability government services focused company. The changes transpired over the last year have led to stronger top line growth and expanding margins. Science Applications, a provider of services to the department of defense, intelligence community, and federal civilian agencies, delivered better than expected earnings, revenue and cash flow results due to cost controls and operating efficiencies. The Fund remains overweight the Information Technology sector.
As volatility increases, we believe that stock picking will become an increasingly important factor in outperformance. This bodes well for our contrarian, fundamental value-driven process, as we continue to focus our efforts on building the portfolio one stock at a time. We believe this disciplined, value-based approach - together with our conscious decision to avoid chasing overvalued stocks when they rally - has been the key to our success over the past decade.
The Fund’s performance quoted is past performance and does not guarantee future results. The investment return and principal value of an investment in the Fund will fluctuate so that an investor’s shares, when redeemed, may be worth more or less than their original cost. Current performance of the Fund may be lower or higher than the performance quoted. Performance data current to the most recent month end may be obtained by calling 1-800-247-1014. Information provided with respect to the Fund’s Portfolio Holdings and Sector Weightings are as of October 31, 2019 and are subject to change at any time.
Value stocks may remain undervalued for extended periods of time and the market may not recognize the intrinsic value of these securities.
Micro cap and small cap investing involves greater risk not associated with investing in more established companies, such as greater price volatility, business risk, less liquidity and increased competitive threat.
The opinions expressed are those of the investment management team and are subject to change without notice, as are statements of financial market trends, which are based on current conditions. Under no circumstances does the information contained within represent a recommendation to buy, hold or sell any security and it should not be assumed that the companies discussed were, or will prove to be, profitable. Current and future holdings are subject to risk.
Annual Report
2
Investment Results (Unaudited) |
Average Annual Total Returns(a)
As of October 31, 2019 |
| | Investor
Class | Institutional
Class | Russell 2000®
Value Index(b) |
One Year | 2.28% | 2.55% | 3.22% |
Three Year | 5.36% | 5.64% | 8.60% |
Five Year | 4.87% | 5.14% | 6.24% |
Ten Year | 9.35% | 9.69% | 11.08% |
Since Inception (8/22/07) | N/A | 6.53% | 6.01% |
Since Inception (12/31/03) | 9.06% | N/A | 7.51% |
| | Expense Ratios(c) | |
| | Investor
Class | Institutional
Class | |
| | 1.32% | 1.07% | |
The investment return and principal value of an investment will fluctuate so that an investor’s shares, when redeemed, may be worth more or less than their original cost. The returns shown do not reflect deduction of taxes that a shareholder would pay on Foundry Partners Fundamental Small Cap Value Fund (the “Fund”) distributions or the redemption of Fund shares. THE FUND’S RETURNS REPRESENT PAST PERFORMANCE AND DO NOT PREDICT FUTURE RESULTS. The returns shown are net of all recurring expenses. Current performance of the Fund may be lower or higher than the performance quoted. For more information on the Fund, and to obtain performance data current to the most recent month end, or to request a prospectus, please call 1-800-247-1014.
You should carefully consider the investment objectives, potential risk, management fees, and charges and expenses of the Fund before investing. The Fund’s prospectus contains this and other information about the Fund, and should be read carefully before investing.
(a) | Average annual total returns reflect any change in price per share and assume the reinvestment of all distributions. The Fund’s returns reflect any fee reductions during the applicable periods. If such fee reductions had not occurred, the quoted performance would have been lower. |
(b) | The Russell 2000® Value Index (“Index”) is an unmanaged benchmark that assumes reinvestment of all distributions and excludes the effect of taxes and fees. The Index is a widely recognized unmanaged index of equity prices and is representative of a broader market and range of securities than are found in the Fund’s portfolio. Individuals cannot invest directly in the Index; however, an individual can invest in ETFs or other investment vehicles that attempt to track the performance of a benchmark index. |
(c) | The expense ratios are from the Fund’s prospectus dated February 28, 2019. Foundry Partners, LLC (the “Adviser”) has contractually agreed to waive its management fee and/or reimburse certain Fund operating expenses, but only to the extent necessary so that the Fund’s net expenses, excluding brokerage fees and commissions, borrowing costs (such as interest and dividend expenses on securities sold short), taxes, distribution and service (12b-1) fees, extraordinary expenses and indirect expenses (such as fees and expenses of acquired funds), does not exceed 1.25% of the Fund’s average daily net assets. The contractual agreement is effective through February 29, 2020. This contractual arrangement may only be terminated by mutual consent of the Adviser and the Board of Trustees, and it will automatically terminate upon the termination of the investment advisory agreement between the Trust and the Adviser. Each waiver or reimbursement of an expense by the Adviser is subject to repayment by the Fund within the three years following the date of such waiver or reimbursement, provided that the Fund is able to make the repayment without exceeding the expense limitation in place at the time of the waiver or reimbursement, and the expense limitation in place at the time of the repayment. Information pertaining to the Fund’s expense ratio as of October 31, 2019 can be found in the financial highlights. |
The Fund is distributed by Unified Financial Securities, LLC, member FINRA/SIPC.
Annual Report
3
Investment Results (Unaudited) (Continued) |

The chart above assumes an initial investment of $100,000 made on October 31, 2009 and held through October 31, 2019. THE FUND’S RETURN REPRESENTS PAST PERFORMANCE AND DOES NOT PREDICT FUTURE RESULTS. The returns shown do not reflect deduction of taxes that a shareholder would pay on Fund distributions or the redemption of Fund shares. Investment returns and principal values will fluctuate so that Fund shares, when redeemed, may be worth more or less than their original purchase price. Current performance may be lower or higher than the performance data quoted.
For more information on the Fund, and to obtain performance data current to the most recent month end, or to request a prospectus, please call 1-800-247-1014. You should carefully consider the investment objectives, potential risk, management fees, and charges and expenses of the Fund before investing. The Fund’s prospectus contains important information about the Fund’s investment objectives, potential risks, management fees, charges and expenses, and other information and should be read carefully before investing.
The Fund is distributed by Unified Financial Securities, Inc., member FINRA/SIPC.
Annual Report
4
Fund Holdings (Unaudited) |
(a) | As a percent of net assets. |
Availability of Portfolio Schedules (Unaudited)
The Fund files its complete schedule of portfolio holdings with the Securities and Exchange Commission (“SEC”) for the first and third quarters of each fiscal year within sixty days after the end of the period. The Fund’s portfolio holdings are available at the SEC’s website at www.sec.gov.
Annual Report
5
Foundry Partners Fundamental Small Cap Value Fund |
Schedule of Investments
October 31, 2019
| | Shares | | | Fair Value | |
COMMON STOCKS — 93.71% | | | | |
Communication Services — 2.74% | | | | |
IMAX Corporation(a) | | | 23,441 | | | $ | 500,465 | |
John Wiley & Sons, Inc., Class A | | | 15,112 | | | | 696,210 | |
Meredith Corporation | | | 26,233 | | | | 988,984 | |
TEGNA, Inc. | | | 209,829 | | | | 3,153,730 | |
| | | | | | | | 5,339,389 | |
Consumer Discretionary — 9.66% | | | | |
Adtalem Global Education, Inc.(a) | | | 66,592 | | | | 1,983,110 | |
American Axle & Manufacturing Holdings, Inc.(a) | | | 198,962 | | | | 1,663,322 | |
Bloomin’ Brands, Inc. | | | 116,004 | | | | 2,298,039 | |
Cooper Tire & Rubber Company | | | 63,058 | | | | 1,780,758 | |
Group 1 Automotive, Inc. | | | 36,910 | | | | 3,670,330 | |
KB Home | | | 79,221 | | | | 2,827,398 | |
M/I Homes, Inc.(a) | | | 45,349 | | | | 2,003,519 | |
Movado Group, Inc. | | | 28,991 | | | | 755,216 | |
Wolverine World Wide, Inc. | | | 61,110 | | | | 1,813,744 | |
| | | | | | | | 18,795,436 | |
Consumer Staples — 0.58% | | | | |
Energizer Holdings, Inc. | | | 26,522 | | | | 1,126,920 | |
Energy — 3.26% | | | | |
Enerplus Corporation | | | 124,812 | | | | 752,616 | |
Gran Tierra Energy, Inc.(a) | | | 545,691 | | | | 589,346 | |
Hess Midstream Partners, L.P. | | | 23,047 | | | | 491,132 | |
Matrix Service Company(a) | | | 5,235 | | | | 98,209 | |
Murphy Oil Corporation | | | 25,547 | | | | 527,035 | |
Oasis Petroleum, Inc.(a) | | | 168,831 | | | | 440,649 | |
QEP Resources, Inc. | | | 126,053 | | | | 419,756 | |
W&T Offshore, Inc.(a) | | | 306,251 | | | | 1,234,192 | |
World Fuel Services Corporation | | | 42,739 | | | | 1,785,207 | |
| | | | | | | | 6,338,142 | |
Financials — 24.43% | | | | |
AllianceBernstein Holding LP | | | 127,049 | | | | 3,730,160 | |
Ameris Bancorp | | | 18,883 | | | | 809,137 | |
COMMON STOCKS — (continued) | | | | |
Financials — (continued) | | | | |
Apollo Commercial Real Estate Finance, Inc. | | | 139,107 | | | $ | 2,545,658 | |
Associated Banc-Corporation | | | 159,985 | | | | 3,217,298 | |
Berkshire Hills Bancorp, Inc. | | | 45,692 | | | | 1,417,823 | |
CNO Financial Group, Inc. | | | 149,868 | | | | 2,345,434 | |
Donnelley Financial Solutions, Inc.(a) | | | 79,209 | | | | 895,062 | |
F.N.B. Corporation | | | 195,564 | | | | 2,358,502 | |
First Midwest Bancorp, Inc. | | | 173,051 | | | | 3,554,468 | |
Fulton Financial Corporation | | | 135,357 | | | | 2,309,190 | |
Hancock Whitney Corporation | | | 98,481 | | | | 3,840,759 | |
International Bancshares Corporation | | | 56,454 | | | | 2,312,356 | |
MFA Financial, Inc. | | | 132,434 | | | | 1,005,174 | |
Nelnet, Inc., Class A | | | 14,146 | | | | 866,725 | |
Old National Bancorp | | | 229,877 | | | | 4,136,637 | |
TCF Financial Corporation | | | 48,014 | | | | 1,900,874 | |
Umpqua Holdings Corporation | | | 94,431 | | | | 1,493,898 | |
Valley National Bancorp | | | 88,385 | | | | 1,023,498 | |
Waddell & Reed Financial, Inc., Class A | | | 134,099 | | | | 2,220,679 | |
Washington Federal, Inc. | | | 49,527 | | | | 1,805,754 | |
WesBanco, Inc. | | | 47,688 | | | | 1,792,592 | |
Wintrust Financial Corporation | | | 31,275 | | | | 1,995,971 | |
| | | | | | | | 47,577,649 | |
Health Care — 2.02% | | | | |
AMN Healthcare Services, Inc.(a) | | | 16,790 | | | | 986,580 | |
NextGen Healthcare, Inc.(a) | | | 51,717 | | | | 874,276 | |
Select Medical Holdings Corporation(a) | | | 114,034 | | | | 2,077,700 | |
| | | | | | | | 3,938,556 | |
Industrials — 17.78% | | | | |
AAR Corporation | | | 28,110 | | | | 1,173,593 | |
Aegion Corporation(a) | | | 45,828 | | | | 993,093 | |
Aircastle Ltd. | | | 72,587 | | | | 1,975,818 | |
See accompanying notes which are an integral part of these financial statements.
Annual Report
6
Foundry Partners Fundamental Small Cap Value Fund |
Schedule of Investments (Continued)
October 31, 2019
| | Shares | | | Fair Value | |
COMMON STOCKS — (continued) | | | | |
Industrials — (continued) | | | | |
ArcBest Corporation | | | 25,975 | | | $ | 750,418 | |
Barnes Group, Inc. | | | 37,232 | | | | 2,176,209 | |
EMCOR Group, Inc. | | | 44,493 | | | | 3,902,481 | |
EnerSys | | | 23,391 | | | | 1,563,922 | |
Generac Holdings, Inc.(a) | | | 10,304 | | | | 995,160 | |
Herman Miller, Inc. | | | 39,003 | | | | 1,813,640 | |
Hillenbrand, Inc. | | | 44,154 | | | | 1,359,502 | |
Kelly Services, Inc., Class A | | | 26,848 | | | | 644,620 | |
Kennametal, Inc. | | | 68,134 | | | | 2,108,747 | |
Korn Ferry | | | 24,386 | | | | 894,723 | |
Matthews International Corporation, Class A | | | 50,082 | | | | 1,852,032 | |
Park-Ohio Holdings Corporation | | | 28,034 | | | | 862,326 | |
Regal Beloit Corporation | | | 38,710 | | | | 2,866,476 | |
Rush Enterprises, Inc., Class A | | | 20,933 | | | | 914,563 | |
Universal Forest Products, Inc. | | | 95,444 | | | | 4,806,560 | |
Wabash National Corporation | | | 68,846 | | | | 981,744 | |
WESCO International, Inc.(a) | | | 39,202 | | | | 1,965,980 | |
| | | | | | | | 34,601,607 | |
Information Technology — 14.18% | | | | |
AVX Corporation | | | 111,704 | | | | 1,711,305 | |
Celestica, Inc.(a) | | | 221,781 | | | | 1,601,259 | |
ChipMOS Technology, Inc. - ADR | | | 45,654 | | | | 896,645 | |
CSG Systems International, Inc. | | | 42,765 | | | | 2,464,975 | |
Diodes, Inc.(a) | | | 23,975 | | | | 1,118,433 | |
Itron, Inc.(a) | | | 41,096 | | | | 3,133,981 | |
KBR, Inc. | | | 161,650 | | | | 4,552,064 | |
Sanmina Corporation(a) | | | 91,025 | | | | 2,797,198 | |
ScanSource, Inc.(a) | | | 39,342 | | | | 1,270,747 | |
Sykes Enterprises, Inc.(a) | | | 46,353 | | | | 1,432,076 | |
Tech Data Corporation(a) | | | 23,484 | | | | 2,853,306 | |
Vishay Intertechnology, Inc. | | | 186,981 | | | | 3,767,667 | |
| | | | | | | | 27,599,656 | |
COMMON STOCKS — (continued) | | | | |
Materials — 5.95% | | | | |
Cabot Corporation | | | 50,048 | | | $ | 2,181,593 | |
Cleveland-Cliffs, Inc. | | | 153,261 | | | | 1,108,077 | |
Domtar Corporation | | | 55,191 | | | | 2,008,400 | |
Kraton Corporation(a) | | | 67,520 | | | | 1,513,798 | |
Pan American Silver Corporation | | | 139,174 | | | | 2,372,917 | |
Schnitzer Steel Industries, Inc., Class A | | | 51,488 | | | | 1,098,754 | |
Stepan Company | | | 13,286 | | | | 1,298,308 | |
| | | | | | | | 11,581,847 | |
Real Estate — 9.28% | | | | |
Brandywine Realty Trust | | | 190,171 | | | | 2,905,813 | |
CareTrust REIT, Inc. | | | 50,238 | | | | 1,217,769 | |
CoreCivic, Inc. | | | 62,232 | | | | 949,660 | |
DiamondRock Hospitality Company | | | 191,891 | | | | 1,915,072 | |
GEO Group, Inc. (The) | | | 50,683 | | | | 771,395 | |
Industrial Logistics Properties Trust | | | 41,070 | | | | 872,327 | |
Kite Realty Group Trust | | | 69,100 | | | | 1,231,362 | |
Lexington Realty Trust | | | 413,083 | | | | 4,494,343 | |
Piedmont Office Realty Trust, Inc., Class A | | | 75,972 | | | | 1,704,812 | |
PotlatchDeltic Corporation | | | 23,611 | | | | 1,002,759 | |
Retail Opportunity Investments Corporation | | | 53,445 | | | | 997,551 | |
| | | | | | | | 18,062,863 | |
Utilities — 3.83% | | | | |
ALLETE, Inc. | | | 38,600 | | | | 3,321,916 | |
Otter Tail Corporation | | | 6,762 | | | | 383,270 | |
Portland General Electric Company | | | 65,898 | | | | 3,748,278 | |
| | | | | | | | 7,453,464 | |
Total Common Stocks (Cost $176,845,866) | | | 182,415,529 | |
See accompanying notes which are an integral part of these financial statements.
Annual Report
7
Foundry Partners Fundamental Small Cap Value Fund |
Schedule of Investments (Continued)
October 31, 2019
| | Shares | | | Fair Value | |
MONEY MARKET FUNDS — 6.35% | | | | |
Federated Government Obligations Fund - Institutional Class, 1.71%(b) | | | 12,350,658 | | | | 12,350,658 | |
Total Money Market Funds (Cost $12,350,658) | | | 12,350,658 | |
Total Investments — 100.06% (Cost $189,196,524) | | | 194,766,187 | |
Liabilities in Excess of Other Assets — (0.06)% | | | (117,873 | ) |
NET ASSETS — 100.00% | | $ | 194,648,314 | |
(a) | Non-income producing security. |
(b) | Rate disclosed is the seven day effective yield as of October 31, 2019. |
ADR | — American Depositary Receipt |
REIT | — Real Estate Investment Trust |
The sectors shown on the schedule of investments are based on the Global Industry Classification Standard, or GICS® (“GICS”). The GICS was developed by and/or is the exclusive property of MSCI, Inc. and Standard & Poor’s Financial Services LLC (“S&P”). GICS is a service mark of MSCI, Inc. and S&P and has been licensed for use by Ultimus Fund Solutions, LLC.
See accompanying notes which are an integral part of these financial statements.
Annual Report
8
Foundry Partners Fundamental Small Cap Value Fund |
Statement of Assets and Liabilities
October 31, 2019
Assets | | | | |
Investments in securities at fair value (cost $189,196,524) (Note 3) | | $ | 194,766,187 | |
Receivable for fund shares sold | | | 135,334 | |
Receivable for investments sold | | | 2,491,381 | |
Dividends receivable | | | 97,237 | |
Prepaid expenses | | | 27,747 | |
Total Assets | | | 197,517,886 | |
Liabilities | | | | |
Payable for fund shares redeemed | | | 55,888 | |
Payable for investments purchased | | | 2,614,787 | |
Payable to Adviser (Note 4) | | | 136,157 | |
Accrued distribution (12b-1) fees (Note 4) | | | 4,360 | |
Payable to Administrator (Note 4) | | | 19,112 | |
Payable to trustees | | | 359 | |
Other accrued expenses | | | 38,909 | |
Total Liabilities | | | 2,869,572 | |
Net Assets | | $ | 194,648,314 | |
Net Assets consist of: | | | | |
Paid-in capital | | | 183,107,753 | |
Accumulated earnings | | | 11,540,561 | |
Net Assets | | $ | 194,648,314 | |
Investor Class: | | | | |
Net Assets | | $ | 21,048,372 | |
Shares outstanding | | | 1,024,328 | |
Net asset value, offering and redemption price per share (Note 2) | | $ | 20.55 | |
Institutional Class: | | | | |
Net Assets | | $ | 173,599,942 | |
Shares outstanding | | | 8,404,562 | |
Net asset value, offering and redemption price per share (Note 2) | | $ | 20.66 | |
See accompanying notes which are an integral part of these financial statements.
Annual Report
9
Foundry Partners Fundamental Small Cap Value Fund |
Statement of Operations
For the Year Ended October 31, 2019
Investment Income | | | | |
Dividend income (net of foreign taxes withheld of $17,767) | | $ | 3,730,660 | |
Non-cash income | | | 769,996 | |
Total investment income | | | 4,500,656 | |
Expenses | | | | |
Investment Adviser fees (Note 4) | | | 1,582,946 | |
Administration fees (Note 4) | | | 135,850 | |
Distribution (12b-1) fees, Investor Class (Note 4) | | | 57,394 | |
Fund accounting fees (Note 4) | | | 54,720 | |
Registration expenses | | | 42,136 | |
Custodian fees | | | 30,532 | |
Legal fees | | | 25,626 | |
Printing and postage expenses | | | 23,468 | |
Transfer agent fees (Note 4) | | | 23,000 | |
Audit and tax preparation fees | | | 18,462 | |
Insurance expenses | | | 11,776 | |
Trustee fees | | | 6,590 | |
Miscellaneous expenses | | | 36,304 | |
Net operating expenses | | | 2,048,804 | |
Net investment income | | | 2,451,852 | |
Net Realized and Change in Unrealized Gain (Loss) on Investments | | | | |
Net realized gain on investment securities transactions | | | 4,194,487 | |
Net change in unrealized depreciation of investment securities | | | (2,245,041 | ) |
Net realized and change in unrealized gain on investments | | | 1,949,446 | |
Net increase in net assets resulting from operations | | $ | 4,401,298 | |
See accompanying notes which are an integral part of these financial statements.
Annual Report
10
Foundry Partners Fundamental Small Cap Value Fund |
Statements of Changes in Net Assets
| | For the
Year Ended
October 31,
2019 | | | For the
Year Ended
October 31,
2018 | |
Increase (Decrease) in Net Assets due to: | | | | | | | | |
Operations | | | | | | | | |
Net investment income | | $ | 2,451,852 | | | $ | 1,399,037 | |
Net realized gain on investment securities transactions | | | 4,194,487 | | | | 14,113,059 | |
Net change in unrealized depreciation of investment securities | | | (2,245,041 | ) | | | (26,945,510 | ) |
Net increase (decrease) in net assets resulting from operations | | | 4,401,298 | | | | (11,433,414 | ) |
Distributions to Shareholders From Earnings (Note 2) | | | | | | | | |
Investor Class | | | (2,046,739 | ) | | | (1,339,135 | ) |
Institutional Class | | | (13,206,296 | ) | | | (5,456,746 | ) |
Total Distributions | | | (15,253,035 | ) | | | (6,795,881 | ) |
Capital Transactions - Investor Class | | | | | | | | |
Proceeds from shares sold | | | 1,795,212 | | | | 2,394,716 | |
Reinvestment of distributions | | | 1,992,112 | | | | 1,319,586 | |
Amount paid for shares redeemed | | | (6,777,093 | ) | | | (16,819,179 | ) |
Total Capital Transactions - Investor Class | | | (2,989,769 | ) | | | (13,104,877 | ) |
Capital Transactions - Institutional Class | | | | | | | | |
Proceeds from shares sold | | | 34,498,680 | | | | 38,259,669 | |
Reinvestment of distributions | | | 12,712,182 | | | | 5,229,045 | |
Amount paid for shares redeemed | | | (22,193,984 | ) | | | (22,224,432 | ) |
Total Capital Transactions - Institutional Class | | | 25,016,878 | | | | 21,264,282 | |
Net increase in net assets resulting from capital transactions | | | 22,027,109 | | | | 8,159,405 | |
Total Increase (Decrease) in Net Assets | | | 11,175,372 | | | | (10,069,890 | ) |
Net Assets | | | | | | | | |
Beginning of year | | | 183,472,942 | | | | 193,542,832 | |
End of year | | $ | 194,648,314 | | | $ | 183,472,942 | |
See accompanying notes which are an integral part of these financial statements.
Annual Report
11
Foundry Partners Fundamental Small Cap Value Fund |
Statements of Changes in Net Assets (Continued)
| | For the
Year Ended
October 31,
2019 | | | For the
Year Ended
October 31,
2018 | |
Share Transactions - Investor Class | | | | | | | | |
Shares sold | | | 88,608 | | | | 99,902 | |
Shares issued in reinvestment of distributions | | | 112,231 | | | | 55,144 | |
Shares redeemed | | | (339,496 | ) | | | (710,278 | ) |
Total Share Transactions - Investor Class | | | (138,657 | ) | | | (555,232 | ) |
Share Transactions - Institutional Class | | | | | | | | |
Shares sold | | | 1,708,345 | | | | 1,596,204 | |
Shares issued in reinvestment of distributions | | | 714,167 | | | | 217,786 | |
Shares redeemed | | | (1,111,865 | ) | | | (925,045 | ) |
Total Share Transactions - Institutional Class | | | 1,310,647 | | | | 888,945 | |
See accompanying notes which are an integral part of these financial statements.
Annual Report
12
Foundry Partners Fundamental Small Cap Value Fund |
Investor Class Financial Highlights
(For a share outstanding during each year)
| | For the
Year Ended
October 31,
2019 | | | For the
Year Ended
October 31,
2018 | | | For the
Year Ended
October 31,
2017 | | | For the
Year Ended
October 31,
2016 | | | For the
Year Ended
October 31,
2015 | |
Selected Per Share Data | | | | | | | | | | | | | | | | | | | | |
Net asset value, beginning of year | | $ | 22.11 | | | $ | 24.32 | | | $ | 20.49 | | | $ | 21.41 | | | $ | 23.63 | |
| | | | | | | | | | | | | | | | | | | | | |
Investment operations: | | | | | | | | | | | | | | | | | | | | |
Net investment income | | | 0.25 | | | | 0.12 | | | | 0.05 | | | | 0.16 | | | | 0.19 | |
Net realized and unrealized gain (loss) on investments | | | (0.03 | ) | | | (1.52 | ) | | | 4.37 | | | | 1.32 | | | | (0.11 | ) |
Total from investment operations | | | 0.22 | | | | (1.40 | ) | | | 4.42 | | | | 1.48 | | | | 0.08 | |
| | | | | | | | | | | | | | | | | | | | | |
Less distributions to shareholders from: | | | | | | | | | | | | | | | | | | | | |
Net investment income | | | (0.08 | ) | | | (0.08 | ) | | | (0.13 | ) | | | (0.26 | ) | | | (0.18 | ) |
Net realized gains | | | (1.70 | ) | | | (0.73 | ) | | | (0.46 | ) | | | (2.14 | ) | | | (2.12 | ) |
Total distributions | | | (1.78 | ) | | | (0.81 | ) | | | (0.59 | ) | | | (2.40 | ) | | | (2.30 | ) |
| | | | | | | | | | | | | | | | | | | | | |
Paid in capital from redemption fees | | | — | | | | — | | | | — | | | | — | (a) | | | — | (a) |
| | | | | | | | | | | | | | | | | | | | | |
Net asset value, end of year | | $ | 20.55 | | | $ | 22.11 | | | $ | 24.32 | | | $ | 20.49 | | | $ | 21.41 | |
| | | | | | | | | | | | | | | | | | | | | |
Total Return (b) | | | 2.28% | | | | (6.02 | )% | | | 21.68% | | | | 8.23% | | | | 0.21% | |
| | | | | | | | | | | | | | | | | | | | | |
Ratios and Supplemental Data: | | | | | | | | | | | | | | | | | | | | |
Net assets, end of year (000 omitted) | | $ | 21,048 | | | $ | 25,715 | | | $ | 41,786 | | | $ | 38,864 | | | $ | 60,134 | |
Before waiver: | | | | | | | | | | | | | | | | | | | | |
Ratio of expenses to average net assets | | | 1.32% | | | | 1.31% | | | | 1.36% | | | | 1.43% | | | | 1.41% | |
After waiver: | | | | | | | | | | | | | | | | | | | | |
Ratio of expenses to average net assets | | | 1.32% | | | | 1.31% | | | | 1.36% | | | | 1.43% | | | | 1.37% | |
Ratio of net investment income to average net assets | | | 1.15% | | | | 0.49% | | | | 0.22% | | | | 0.84% | | | | 0.87% | |
Portfolio turnover rate (c) | | | 47.17% | | | | 34.41% | | | | 28.16% | | | | 12.85% | | | | 43.59% | |
(a) | Rounds to less than $0.005 per share. |
(b) | Total return represents the rate that the investor would have earned or lost on an investment in the Fund, assuming reinvestment of dividends, and excludes any sales charges and redemption fees that were charged by the Fund prior to August 30, 2016. |
(c) | Portfolio turnover is calculated on the basis of the Fund as a whole without distinguishing among the classes of shares. |
See accompanying notes which are an integral part of these financial statements.
Annual Report
13
Foundry Partners Fundamental Small Cap Value Fund |
Institutional Class Financial Highlights
(For a share outstanding during each year)
| | For the
Year Ended
October 31,
2019 | | | For the
Year Ended
October 31,
2018 | | | For the
Year Ended
October 31,
2017 | | | For the
Year Ended
October 31,
2016 | | | For the
Year Ended
October 31,
2015 | |
Selected Per Share Data | | | | | | | | | | | | | | | | | | | | |
Net asset value, beginning of year | | $ | 22.24 | | | $ | 24.46 | | | $ | 20.60 | | | $ | 21.52 | | | $ | 23.74 | |
| | | | | | | | | | | | | | | | | | | | | |
Investment operations: | | | | | | | | | | | | | | | | | | | | |
Net investment income | | | 0.27 | | | | 0.18 | | | | 0.11 | | | | 0.25 | | | | 0.26 | |
Net realized and unrealized gain (loss) on investments | | | — | (a) | | | (1.53 | ) | | | 4.39 | | | | 1.29 | | | | (0.12 | ) |
Total from investment operations | | | 0.27 | | | | (1.35 | ) | | | 4.50 | | | | 1.54 | | | | 0.14 | |
| | | | | | | | | | | | | | | | | | | | | |
Less distributions to shareholders from: | | | | | | | | | | | | | | | | | | | | |
Net investment income | | | (0.15 | ) | | | (0.14 | ) | | | (0.18 | ) | | | (0.32 | ) | | | (0.24 | ) |
Net realized gains | | | (1.70 | ) | | | (0.73 | ) | | | (0.46 | ) | | | (2.14 | ) | | | (2.12 | ) |
Total distributions | | | (1.85 | ) | | | (0.87 | ) | | | (0.64 | ) | | | (2.46 | ) | | | (2.36 | ) |
| | | | | | | | | | | | | | | | | | | | | |
Net asset value, end of year | | $ | 20.66 | | | $ | 22.24 | | | $ | 24.46 | | | $ | 20.60 | | | $ | 21.52 | |
| | | | | | | | | | | | | | | | | | | | | |
Total Return (b) | | | 2.55% | | | | (5.78 | )% | | | 22.01% | | | | 8.50% | | | | 0.46% | |
| | | | | | | | | | | | | | | | | | | | | |
Ratios and Supplemental Data: | | | | | | | | | | | | | | | | | | | | |
Net assets, end of year (000 omitted) | | $ | 173,600 | | | $ | 157,758 | | | $ | 151,757 | | | $ | 97,987 | | | $ | 87,023 | |
Before waiver: | | | | | | | | | | | | | | | | | | | | |
Ratio of expenses to average net assets | | | 1.07% | | | | 1.06% | | | | 1.11% | | | | 1.18% | | | | 1.16% | |
After waiver: | | | | | | | | | | | | | | | | | | | | |
Ratio of expenses to average net assets | | | 1.07% | | | | 1.06% | | | | 1.11% | | | | 1.18% | | | | 1.12% | |
Ratio of net investment income to average net assets | | | 1.34% | | | | 0.76% | | | | 0.45% | | | | 1.05% | | | | 1.12% | |
Portfolio turnover rate (c) | | | 47.17% | | | | 34.41% | | | | 28.16% | | | | 12.85% | | | | 43.59% | |
(a) | Rounds to less than $0.005 per share. |
(b) | Total return represents the rate that the investor would have earned or lost on an investment in the Fund, assuming reinvestment of dividends, and excludes any sales charges and redemption fees that were charged by the Fund prior to August 30, 2016. |
(c) | Portfolio turnover is calculated on the basis of the Fund as a whole without distinguishing among the classes of shares. |
See accompanying notes which are an integral part of these financial statements.
Annual Report
14
Foundry Partners Fundamental Small Cap Value Fund |
Notes to the Financial Statements
October 31, 2019
NOTE 1. ORGANIZATION
The Foundry Partners Fundamental Small Cap Value Fund (the “Fund”) is an open-end diversified series of Valued Advisers Trust (the “Trust”). The Trust is a management investment company established under the laws of Delaware by an Agreement and Declaration of Trust dated June 13, 2008 (the “Trust Agreement”). The Trust Agreement permits the Board of Trustees (the “Board”) to issue an unlimited number of shares of beneficial interest of separate series without par value. The Fund is one of a series of funds authorized by the Board. The Fund’s investment adviser is Foundry Partners, LLC (the “Adviser”). The investment objective of the Fund is long-term capital appreciation.
The Fund currently offers Investor Class shares and Institutional Class shares. Each share represents an equal proportionate interest in the assets and liabilities belonging to the applicable class of the Fund and is entitled to such dividends and distributions out of income belonging to the applicable class of the Fund as are declared by the Board. On matters that affect the Fund as a whole, each class has the same voting and other rights and preferences as any other class. On matters that affect only one class, only shareholders of that class may vote. Each class votes separately on matters affecting only that class, or as expressly required to be voted on separately by state or federal law. Shares of each class of a series have the same voting and other rights and preferences as the other classes and series of the Trust for matters that affect the Trust as a whole. The Fund may offer additional classes of shares in the future.
NOTE 2. SIGNIFICANT ACCOUNTING POLICIES
The Fund is an investment company and follows accounting and reporting guidance under Financial Accounting Standards Board Accounting Standards Codification (“ASC”) Topic 946, “Financial Services-Investment Companies”. The following is a summary of significant accounting policies followed by the Fund in the preparation of its financial statements. These policies are in conformity with generally accepted accounting principles in the United States of America (“GAAP”).
Estimates – The preparation of financial statements in conformity with GAAP requires management to make estimates and assumptions that affect the reported amounts of assets and liabilities and disclosure of contingent assets and liabilities at the date of the financial statements and the reported amounts of increases and decreases in net assets from operations during the reporting period. Actual results could differ from those estimates.
Federal Income Taxes – The Fund makes no provision for federal income or excise tax. The Fund has qualified and intends to qualify each year as a regulated investment company (“RIC”) under subchapter M of the Internal Revenue Code of 1986, as amended, by complying with the requirements applicable to RICs and by distributing substantially all of its taxable income. The
Annual Report
15
Foundry Partners Fundamental Small Cap Value Fund |
Notes to the Financial Statements
October 31, 2019
Fund also intends to distribute sufficient net investment income and net realized capital gains, if any, so that it will not be subject to excise tax on undistributed income and gains. If the required amount of net investment income or gains is not distributed, the Fund could incur a tax expense.
As of and during the fiscal year ended October 31, 2019, the Fund did not have a liability for any unrecognized tax benefits. The Fund recognizes interest and penalties, if any, related to unrecognized tax benefits as income tax expense on the Statement of Operations when incurred. During the fiscal year ended October 31, 2019, the Fund did not incur any interest or penalties. Management of the Fund has reviewed tax positions taken in tax years that remain subject to examination by all major tax jurisdictions, including federal (i.e., the last three tax year ends and the interim tax period since then, as applicable). Management believes that there is no tax liability resulting from unrecognized tax benefits related to uncertain tax positions taken.
Expenses – Expenses incurred by the Trust that do not relate to a specific fund of the Trust are allocated to the individual funds based on each fund’s relative net assets or another appropriate basis (as determined by the Board). Expenses attributable to any class are borne by that class. Income, realized gains and losses, unrealized appreciation and depreciation, and fund-wide expenses not allocated to a particular class shall be allocated to each class based on the net assets of that class in relation to the net assets of the entire fund.
Security Transactions and Related Income – The Fund follows industry practice and records security transactions on the trade date for financial reporting purposes. The specific identification method is used for determining gains or losses for financial statement and income tax purposes. Dividend income is recorded on the ex-dividend date and interest income is recorded on an accrual basis. Discounts and premiums on securities purchased are accreted or amortized using the effective interest method, if applicable. Non-cash income, if any, is recorded at the fair market value of the securities received. Withholding taxes on foreign dividends have been provided for in accordance with the Fund’s understanding of the applicable country’s tax rules and rates.
The Fund holds Real Estate Investment Trusts (“REITs”), which pay dividends to their shareholders based upon available funds from operations. It is possible for these dividends to exceed the REIT’s underlying taxable earnings and profits resulting in the excess portion of such dividends being designated as a return of capital. Distributions received from REITs that represent a return of capital or capital gains are recorded as a reduction of the cost of the REITs or as a realized gain, respectively.
Dividends and Distributions – The Fund intends to distribute its net investment income and net realized long-term and short-term capital gains, if any, at least annually. Dividends and distributions to shareholders, which are determined in accordance with income tax regulations, are recorded on the ex-dividend date. The treatment for financial reporting purposes of distributions made to shareholders during the period from net investment income or net realized capital gains may differ from their ultimate treatment for federal income tax purposes. These differences are
Annual Report
16
caused primarily by differences in the timing of the recognition of certain components of income, expense or realized capital gain for federal income tax purposes. Where such differences are permanent in nature, they are reclassified among the components of net assets based on their ultimate characterization for federal income tax purposes. Any such reclassifications will have no effect on net assets, results of operations or net asset value (“NAV”) per share of the Fund.
For the fiscal year ended October 31, 2019, the Fund made the following reclassifications to increase (decrease) the components of net assets:
Paid-In
Capital | Accumulated
Earnings |
$ (34,447) | $ 34,447 |
Share Valuation – The NAV per share of each class of the Fund is calculated each day the New York Stock Exchange is open by dividing the total value of the assets attributable to that class, less liabilities attributable to that class, by the number of shares outstanding of that class.
NOTE 3. SECURITIES VALUATION AND FAIR VALUE MEASUREMENTS
Fair value is defined as the price that the Fund would receive upon selling an investment in a timely transaction to an independent buyer in the principal or most advantageous market of the investment. GAAP establishes a three-tier hierarchy to maximize the use of observable market data and minimize the use of unobservable inputs and to establish classification of fair value measurements for disclosure purposes.
Inputs refer broadly to the assumptions that market participants would use in pricing the asset or liability, including assumptions about risk (the risk inherent in a particular valuation technique used to measure fair value including a pricing model and/or the risk inherent in the inputs to the valuation technique). Inputs may be observable or unobservable. Observable inputs are inputs that reflect the assumptions market participants would use in pricing the asset or liability developed based on market data obtained and available from sources independent of the reporting entity. Unobservable inputs are inputs that reflect the reporting entity’s own assumptions about the assumptions market participants would use in pricing the asset or liability developed based on the best information available in the circumstances.
Various inputs are used in determining the value of the Fund’s investments. These inputs are summarized in the three broad levels listed below.
● | Level 1 – unadjusted quoted prices in active markets for identical investments and/or registered investment companies where the value per share is determined and published and is the basis for current transactions for identical assets or liabilities at the valuation date |
Annual Report
17
Foundry Partners Fundamental Small Cap Value Fund |
Notes to the Financial Statements
October 31, 2019
● | Level 2 – other significant observable inputs (including, but not limited to, quoted prices for an identical security in an inactive market, quoted prices for similar securities, interest rates, prepayment speeds, credit risk, etc.) |
● | Level 3 – significant unobservable inputs (including the Fund’s own assumptions in determining fair value of investments based on the best information available) |
The inputs used to measure fair value may fall into different levels of the fair value hierarchy. In such cases, for disclosure purposes, the level in the fair value hierarchy which is reported, is determined based on the lowest level input that is significant to the fair value measurement in its entirety.
Equity securities that are traded on any stock exchange are generally valued at the last quoted sale price on the security’s primary exchange. Lacking a last sale price, an exchange-traded security is generally valued at its last bid price. Securities traded in the NASDAQ over-the-counter market are generally valued at the NASDAQ Official Closing Price. When using the market quotations and when the market is considered active, the security is classified as a Level 1 security. In the event that market quotations are not readily available or are considered unreliable due to market or other events, the Fund values its securities and other assets at fair value in accordance with policies established by and under the general supervision of the Board. Under these policies, the securities will be classified as Level 2 or 3 within the fair value hierarchy, depending on the inputs used.
Investments in mutual funds, including money market mutual funds, are generally priced at the ending NAV. These securities are categorized as Level 1 securities.
In accordance with the Trust’s valuation policies, the Adviser is required to consider all appropriate factors relevant to the value of securities for which it has determined other pricing sources are not available or reliable as described above. No single method exists for determining fair value, because fair value depends upon the circumstances of each individual case. As a general principle, the current fair value of a security being valued by the Adviser would be the amount that the Fund might reasonably expect to receive upon the current sale. Methods that are in accordance with this principle may, for example, be based on (i) a multiple of earnings; (ii) a discount from market prices of a similar freely traded security (including a derivative security or a basket of securities traded on other markets, exchanges or among dealers); or (iii) yield to maturity with respect to debt issues, or a combination of these and other methods. Fair-value pricing is permitted if, in the Adviser’s opinion, the validity of market quotations appears to be questionable based on factors such as evidence of a thin market in the security based on a small number of quotations, a significant event occurs after the close of a market but before the Fund’s NAV calculation that may affect a security’s value, or the Adviser is aware of any other data that calls into question the reliability of market quotations.
Annual Report
18
The following is a summary of the inputs used to value the Fund’s investments as of October 31, 2019:
Valuation Inputs |
Assets | | Level 1 | | | Level 2 | | | Level 3 | | | Total | |
Common Stocks (a) | | $ | 182,415,529 | | | $ | — | | | $ | — | | | $ | 182,415,529 | |
Money Market Funds | | | 12,350,658 | | | | — | | | | — | | | | 12,350,658 | |
Total | | $ | 194,766,187 | | | $ | — | | | $ | — | | | $ | 194,766,187 | |
(a) | Refer to Schedule of Investments for sector classifications. |
The Fund did not hold any investments at the end of the reporting period for which significant unobservable inputs (Level 3) were used in determining fair value; therefore, no reconciliation of Level 3 securities is included for this reporting period.
NOTE 4. TRANSACTIONS WITH AFFILIATES AND OTHER SERVICE PROVIDERS
Under the terms of the management agreement between the Trust and the Adviser for the Fund, the Adviser manages the Fund’s investments subject to oversight by the Board. As compensation for its management services, the Fund is obligated to pay the Adviser a fee computed and accrued daily and paid monthly at an annual rate of 0.85% of the average daily net assets of the Fund. For the fiscal year ended October 31, 2019, the Adviser earned a fee of $1,582,946 from the Fund. At October 31, 2019, the Fund owed the Adviser $136,157.
The Adviser has contractually agreed to waive its management fee and/or reimburse certain operating expenses, but only to the extent necessary so that the Fund’s net expenses, excluding brokerage fees and commissions, borrowing costs (such as interest and dividend expenses on securities sold short), taxes, distribution and service (12b-1) fees, extraordinary expenses, and any indirect expenses (such as fees and expenses of acquired funds), do not exceed an annual rate of 1.25% of the average daily net assets of the Fund.
Each fee waiver or expense reimbursement by the Adviser is subject to repayment by the Fund within the three years following the date in which the fee waiver or expense reimbursement occurred, provided that the Fund is able to make the repayment without exceeding the expense limitation that is in effect at the time of the repayment or at the time of the fee waiver or expense reimbursement. As of October 31, 2019, the Adviser has made no previous waivers that may be recouped. The contractual agreement is in effect through February 29, 2020. The expense cap may not be terminated prior to this date except by mutual consent of the Adviser and the Board. For the fiscal year ended October 31, 2019, the Adviser did not waive any fees from the Fund.
Annual Report
19
Foundry Partners Fundamental Small Cap Value Fund |
Notes to the Financial Statements
October 31, 2019
The Trust retains Ultimus Fund Solutions, LLC (“Ultimus” or the “Administrator”), to provide the Fund with administration and compliance, including a chief compliance officer, fund accounting and transfer agent services, including all regulatory reporting. For the fiscal year ended October 31, 2019, the Administrator earned fees of $135,850 for administrative and compliance services, $54,720 for fund accounting services, and $23,000 for transfer agent services. At October 31, 2019, the Administrator was owed $19,112 for administrative services.
The officers and one trustee of the Trust are members of management and/or employees of the Administrator. Unified Financial Securities, LLC (the “Distributor”), a wholly owned subsidiary of Ultimus, acts as the distributor of the Fund’s shares.
The Fund has adopted a Distribution Plan (the “Plan”) pursuant to Rule 12b-1 under the Investment Company Act of 1940 as amended (the “1940 Act”). The Plan provides that the Fund will pay the Distributor or any registered securities dealer, financial institution or any other person (a “Recipient”) a fee aggregating at a rate of 0.25% of the average daily net assets of the Investor Class shares in connection with the promotion and distribution of the Fund’s shares or the provision of personal services to shareholders, including, but not necessarily limited to, advertising, compensation to underwriters, dealers and selling personnel; the printing and mailing of prospectuses to other than current Fund shareholders; the printing and mailing of sales literature; and servicing shareholder accounts. The Fund or the Adviser may pay all or a portion of these fees to any Recipient who renders assistance in distributing or promoting the sale of shares, or who provides certain shareholder services, pursuant to a written agreement. The Plan is a compensation plan, which means that compensation is paid regardless of 12b-1 expenses actually incurred. It is anticipated that the Plan will benefit shareholders because an effective sales program typically is necessary in order for the Fund to reach and maintain a sufficient size to achieve efficiently its investment objectives and to realize economies of scale. For the fiscal year ended October 31, 2019, the Fund accrued $57,394 in 12b-1 fees with respect to Investor Class shares. The Fund owed $4,360 for Investor Class shares 12b-1 fees as of October 31, 2019.
NOTE 5. PURCHASES AND SALES OF SECURITIES
For the fiscal year ended October 31, 2019, purchases and sales of investment securities, other than short-term investments, were $92,421,136 and $83,364,433, respectively.
There were no purchases or sales of long-term U.S. government obligations during the fiscal year ended October 31, 2019.
Annual Report
20
NOTE 6. FEDERAL INCOME TAXES
At October 31, 2019, the net unrealized appreciation (depreciation) of investments for tax purposes was as follows:
Gross unrealized appreciation | | $ | 18,169,737 | |
Gross unrealized depreciation | | | (13,187,089 | ) |
Net unrealized appreciation on investments | | $ | 4,982,648 | |
Tax cost of investments | | $ | 189,783,539 | |
At October 31, 2019, the difference between book basis and tax basis unrealized appreciation (depreciation) is attributable to the tax deferral of losses on wash sales and partnership basis adjustments.
At October 31, 2019, the components of accumulated earnings (accumulated losses) on a tax basis were as follows:
Undistributed ordinary income | | $ | 2,112,332 | |
Undistributed long-term capital gains | | | 4,445,581 | |
Unrealized appreciation on investments | | | 4,982,648 | |
Total accumulated earnings | | $ | 11,540,561 | |
The tax character of distributions paid for the fiscal years ended October 31, 2019 and October 31, 2018 was as follows:
| | 2019 | | | 2018 | |
Distributions paid from: | | | | | | | | |
Ordinary income (a) | | $ | 1,151,123 | | | $ | 1,037,875 | |
Long-term capital gains | | | 14,101,912 | | | | 5,758,006 | |
Total taxable distributions | | $ | 15,253,035 | | | $ | 6,795,881 | |
Total distributions paid | | $ | 15,253,035 | | | $ | 6,795,881 | |
(a) | For federal income tax purposes, distributions of short-term capital gains are treated as ordinary income distributions. |
Annual Report
21
Foundry Partners Fundamental Small Cap Value Fund |
Notes to the Financial Statements
October 31, 2019
NOTE 7. COMMITMENTS AND CONTINGENCIES
The Trust indemnifies its officers and Trustees for certain liabilities that may arise from their performance of their duties to the Trust or the Fund. Additionally, in the normal course of business, the Trust enters into contracts that contain a variety of representations and warranties which provide general indemnifications. The Trust’s maximum exposure under these arrangements is unknown, as this would involve future claims that may be made against the Trust that have not yet occurred.
NOTE 8. SUBSEQUENT EVENTS
Management of the Fund has evaluated the need for disclosures and/or adjustments resulting from subsequent events through the date at which these financial statements were issued. Based upon this evaluation, management has determined there were no items requiring adjustment of the financial statements or additional disclosure.
Annual Report
22
Report of Independent Registered Public Accounting Firm |
To the Shareholders of Foundry Partners Fundamental Small Cap Value Fund and
Board of Trustees of Valued Advisers Trust
Opinion on the Financial Statements
We have audited the accompanying statement of assets and liabilities, including the schedule of investments, of Foundry Partners Fundamental Small Cap Value Fund (the “Fund”), a series of Valued Advisers Trust, as of October 31, 2019, the related statement of operations for the year then ended, the statements of changes in net assets for each of the two years in the period then ended, including the related notes, and the financial highlights for each of the five years in the period then ended (collectively referred to as the “financial statements”). In our opinion, the financial statements present fairly, in all material respects, the financial position of the Fund as of October 31, 2019, the results of its operations for the year then ended, the changes in its net assets for each of the two years in the period then ended, and the financial highlights for each of the five years in the period then ended, in conformity with accounting principles generally accepted in the United States of America.
Basis for Opinion
These financial statements are the responsibility of the Fund’s management. Our responsibility is to express an opinion on the Fund’s financial statements based on our audits. We are a public accounting firm registered with the Public Company Accounting Oversight Board (United States) (“PCAOB”) and are required to be independent with respect to the Fund in accordance with the U.S. federal securities laws and the applicable rules and regulations of the Securities and Exchange Commission and the PCAOB.
We conducted our audits in accordance with the standards of the PCAOB. Those standards require that we plan and perform the audit to obtain reasonable assurance about whether the financial statements are free of material misstatement, whether due to error or fraud.
Our audits included performing procedures to assess the risks of material misstatement of the financial statements, whether due to error or fraud, and performing procedures that respond to those risks. Such procedures included examining, on a test basis, evidence regarding the amounts and disclosures in the financial statements. Our procedures included confirmation of securities owned as of October 31, 2019, by correspondence with the custodian and brokers or by other appropriate auditing procedures where replies from brokers were not received. Our audits also included evaluating the accounting principles used and significant estimates made by management, as well as evaluating the overall presentation of the financial statements. We believe that our audits provide a reasonable basis for our opinion.
We have served as the Fund’s auditor since 2006.
COHEN & COMPANY, LTD.
Cleveland, Ohio
December 20, 2019
Annual Report
23
Summary of Fund Expenses (Unaudited) |
As a shareholder of the Fund, you incur two types of costs: (1) transaction and (2) ongoing costs, including management fees and other Fund expenses. These examples are intended to help you understand your ongoing costs (in dollars) of investing in the Fund and to compare these costs with the ongoing costs of investing in other mutual funds. The example is based on an investment of $1,000 invested at the beginning of the period and held for the entire period from May 1, 2019 through October 31, 2019.
Actual Expenses
The first line of the table for each class provides information about actual account values and actual expenses. You may use the information in these lines, together with the amount you invested, to estimate the expenses that you paid over the period. Simply divide your account value by $1,000 (for example, an $8,600 account value divided by $1,000 = 8.60), then multiply the result by the number in the first line under the heading “Expenses Paid During Period” to estimate the expenses you paid on your account during this period.
Hypothetical Example for Comparison Purposes
The second line of the table for each class provides information about hypothetical account values and hypothetical expenses based on the Fund’s actual expense ratios and an assumed rate of return of 5% per year before expenses, which is not the Fund’s actual return. The hypothetical account values and expenses may not be used to estimate the actual ending account balances or expenses you paid for the period. You may use this information to compare the ongoing costs of investing in the Fund and other funds. To do so, compare this 5% hypothetical example with the 5% hypothetical examples that appear in the shareholder reports of the other funds.
Expenses shown in the table are meant to highlight your ongoing costs only and do not reflect any transactional costs. Therefore, the second line of the table for each class is useful in comparing ongoing costs only and will not help you determine the relative total costs of owning different funds.
|
| Beginning
Account
Value
May 1, 2019 | Ending
Account
Value
October 31, 2019 | Expenses
Paid
During
Period(a) | Annualized
Expense
Ratio |
Foundry Partners Fundamental Small Cap Value Fund |
Investor Class | Actual | $1,000.00 | $ 980.90 | $6.58 | 1.32% |
| | Hypothetical (b) | $1,000.00 | $ 1,018.56 | $6.71 | 1.32% |
Institutional Class | Actual | $1,000.00 | $ 982.40 | $5.34 | 1.07% |
| | Hypothetical (b) | $1,000.00 | $ 1,019.82 | $5.44 | 1.07% |
(a) | Expenses are equal to the Fund’s annualized expense ratios, multiplied by the average account value over the period, multiplied by 184/365 (to reflect the one-half year period). |
(b) | Hypothetical assumes 5% annual return before expenses. |
Annual Report
24
Additional Federal Income Tax Information (Unaudited) |
The Form 1099-DIV you receive in January 2020 will show the tax status of all distributions paid to your account in calendar year 2019. Shareholders are advised to consult their own tax adviser with respect to the tax consequences of their investment in the Fund. As required by the Internal Revenue Code and/or regulations, shareholders must be notified regarding the status of qualified dividend income for individuals and the dividends received deduction for corporations.
Qualified Dividend Income. The Fund designates approximately 100% or up to the maximum amount of such dividends allowable pursuant to the Internal Revenue Code, as qualified dividend income eligible for the reduced tax rate.
Qualified Business Income. The Fund designates approximately 0% of its ordinary income dividends, or up to the maximum amount of such dividends allowable pursuant to the Internal Revenue Code, as qualified business income.
Dividends Received Deduction. Corporate shareholders are generally entitled to take the dividends received deduction on the portion of the Fund’s dividend distribution that qualifies under tax law. For the Fund’s calendar year 2019 ordinary income dividends, 100% qualifies for the corporate dividends received deduction.
For the year ended October 31, 2019, the Fund designated $14,101,912 as long-term capital gain distributions.
Annual Report
25
Trustees and Officers (Unaudited) |
The Board of Trustees supervises the business activities of the Trust. Each Trustee serves as a trustee until termination of the Trust unless the Trustee dies, resigns, retires or is removed.
The following table provides information regarding each of the Independent Trustees.
Name, Address*, Age,
Position with Trust**,
Term of Position with Trust | Principal Occupation During Past 5 Years
and Other Directorships | Other Directorships |
Andrea N. Mullins, 52 Independent Trustee Since December 2013 Chairperson since
March 2017 | Current: Private investor; Independent Contractor, SWM Advisors (since April 2014). | Trustee, Angel Oak Funds Trust (since February 2019) (4 portfolios); Trustee, Angel Oak Strategic Credit Fund (since February 2019). |
Ira P. Cohen, 60 Independent Trustee Since June 2010 | Current: Independent financial services consultant (since February 2005); Executive Vice President of Asset Management Services, Recognos Financial (since August 2015). | Trustee and Audit Committee Chairman, Griffin Institutional Access Credit Fund (since January 2017); Trustee and Audit Committee Chairman, Griffin Institutional Real Estate Access Fund (since May 2014); Trustee, Angel Oak Funds Trust (since October 2014) (4 portfolios) Trustee, Chairman, and Nominating and Governance Committee Chairman, Angel Oak Strategic Credit Fund (since December 2017). |
* | The address for each Trustee is 225 Pictoria Drive, Suite 450, Cincinnati, Ohio 45246. |
** | As of the date of this report, the Trust consists of 12 series. |
Annual Report
26
The following table provides information regarding the Trustee who is considered an “interested person” of the Trust, as that term is defined under the 1940 Act. Based on the experience of the Trustee, the Trust concluded that the individual described below should serve as a Trustee.
Name, Address*, Age,
Position with Trust**,
Term of Position with Trust | Principal Occupation During Past 5 Years | Other Directorships |
Mark J. Seger, 57 Trustee Since March 2017 | Current: Vice Chairman of Ultimus Fund Solutions, LLC (since 1999).
Previous: Managing Director and Co-Chief Executive Officer of Ultimus Fund Solutions, LLC (since 1999). | None. |
* | The address for each Trustee is 225 Pictoria Drive, Suite 450, Cincinnati, Ohio 45246. |
** | As of the date of this report, the Trust consists of 12 series. |
The following table provides information regarding the Officers of the Trust:
Name, Address*, Age,
Position with Trust**,
Term of Position with Trust | Principal Occupation During Past 5 Years | Other Directorships |
Adam T. Kornegay, 34 Principal Executive Officer and President Since April 2018 | Current: Vice President, Business Development Director, Ultimus Fund Solutions, LLC (since March 2015). Previous: Vice President, Citigroup, Inc. (July 2009 to February 2015). | None. |
Gregory T. Knoth, 49 Principal Financial Officer and Treasurer Since April 2019 | Current: Vice President, Mutual Fund Controller, Ultimus Fund Solutions, LLC (since January 2016). Previous: Vice President and Manager of Fund Accounting, Huntington Asset Services, Inc. (n/k/a Ultimus Asset Services, LLC) (June 2013 to December 2015). | None. |
Martin R. Dean, 56 Interim Chief Compliance Officer Since May 2019 | Current: Vice President, Director of Fund Compliance of Ultimus Fund Solutions, LLC (since January 2016) Previous: Senior Vice President and Compliance Group Manager, Huntington Asset Services, Inc. (n/k/a Ultimus Asset Services, LLC) (July 2013 to December 2015). | None. |
Annual Report
27
Trustees and Officers (Unaudited) (Continued) |
Name, Address*, Age,
Position with Trust**,
Term of Position with Trust | Principal Occupation During Past 5 Years | Other Directorships |
Carol J. Highsmith, 55 Vice President Since
August 2008 Secretary Since March 2014 | Current: Assistant Vice President, Ultimus Fund Solutions, LLC (since January 2016). Previous: Employed in various positions with Huntington Asset Services, Inc. (n/k/a Ultimus Asset Services, LLC) (November 1994 to December 2015), most recently Vice President of Legal Administration (2005 to December 2015). | None. |
* | The address for each officer is 225 Pictoria Drive, Suite 450, Cincinnati, Ohio 45246. |
** | As of the date of this report, the Trust consists of 12 series. |
Other Information (Unaudited)
The Fund’s Statement of Additional Information (“SAI”) includes additional information about the trustees and is available without charge, upon request. You may call toll-free at (800) 247-1014 to request a copy of the SAI or to make shareholder inquiries.
Annual Report
28
Investment Advisory Agreement Approval (Unaudited) |
At a meeting held on June 5 and 6, 2019, the Board of Trustees (the “Board”) considered the renewal of the Investment Advisory Agreement (the “Foundry Agreement”) between Valued Advisers Trust (the “Trust”) and Foundry Partners, LLC (“Foundry”) with respect to the Foundry Partners Fundamental Small Cap Value Fund (the “Foundry Fund”). Foundry provided written information to the Board to assist the Board in its considerations.
The Board discussed the contractual arrangements between Foundry and the Trust for the Foundry Fund. They reflected upon the Board’s prior experience with Foundry in managing the Foundry Fund, as well as their earlier discussions with Foundry.
Counsel then directed the Trustees to a memorandum from his firm that summarized, among other things, the fiduciary duties and responsibilities of the Board in reviewing and approving the Foundry Agreement. In assessing the factors and reaching its decision, the Board took into consideration information furnished by Foundry and the Trust’s other service providers for the Board’s review and consideration throughout the year, as well as information specifically prepared or presented in connection with the renewal process, including: (i) reports regarding the services and support provided to the Foundry Fund by Foundry; (ii) quarterly assessments of the investment performance of the Foundry Fund; (iii) commentary on the reasons for the performance; (iv) presentations by Foundry addressing its investment philosophy, investment strategy, personnel, and operations of Foundry; (v) compliance and audit reports concerning the Foundry Fund and Foundry; (vi) disclosure information contained in the registration statement of the Trust for the Foundry Fund and Foundry’s Form ADV; and (vii) a memorandum from counsel, that summarized the fiduciary duties and responsibilities of the Board in reviewing and approving the Foundry Agreement. The Board also requested and received materials including, without limitation: (a) documents containing information about Foundry, including its financial information; a description of its personnel and the services it provides to the Foundry Fund; information on Foundry’s investment advice and performance; summaries of the Foundry Fund’s expenses, compliance program, current legal matters, and other general information; (b) comparative expense and performance information for other mutual funds with strategies similar to the Foundry Fund; and (c) the benefits to be realized by Foundry from its relationship with the Foundry Fund. The Board did not identify any particular information that was most relevant to its consideration to approve the Foundry Agreement and each Trustee may have afforded different weight to the various factors.
| | 1. | The nature, extent, and quality of the services to be provided by Foundry. The Board considered Foundry’s responsibilities under the Foundry Agreement. The Trustees considered the services being provided by Foundry to the Foundry Fund including, without limitation: the quality of its investment advisory services (including research and recommendations with respect to portfolio securities), its process for formulating investment recommendations and assuring compliance with the Foundry Fund’s investment objectives and limitations, its coordination of services for the Foundry Fund among the Foundry Fund’s service providers, and its efforts to promote the Foundry Fund and grow its assets. The Trustees considered Foundry’s continuity of, and commitment to retain qualified personnel, commitment to maintain and enhance its resources and systems, and options that allow the Foundry Fund to maintain its goals, and Foundry’s continued cooperation with the Board and counsel for the Foundry Fund. The Trustees |
Annual Report
29
Investment Advisory Agreement Approval (Unaudited) (Continued) |
considered Foundry’s personnel, including their education and experience. After considering the foregoing information and further information in the Meeting materials provided by Foundry, the Board concluded that, in light of all the facts and circumstances, the nature, extent, and quality of the services provided by Foundry were satisfactory and adequate for the Foundry Fund.
| | 2. | Investment Performance of the Foundry Fund and Foundry. The Trustees compared the performance of the Foundry Fund with the performance of funds with similar objectives managed by other investment advisers, with aggregated peer group data, as well as with the performance of the Foundry Fund’s benchmark. The Trustees also considered the consistency of Foundry’s management of the Foundry Fund with its investment objectives, strategies, and limitations. The Trustees acknowledged that Foundry has served as adviser to the Foundry Fund only since June of 2016, but one portfolio manager has managed the portfolio since 2006 and the other since 2010. The Trustees noted that the Foundry Fund had underperformed as compared to its benchmark for the one-year, three-year, five-year, and ten-year periods ended March 31, 2019, as well as for the shorter term one-month three-month and year-to-date periods. They also noted that the Foundry Fund had underperformed as compared to the average and median of its Morningstar category for the one-month, three-month, one-year, three-year, and ten-year periods ended March 31, 2019. They noted that for the five-year period, the Foundry Fund Institutional Class had outperformed as compared to the average and median of its Morningstar category, and the Investor Class had performance equal to the average but below the median of its Morningstar category. In comparing the Foundry Fund’s performance to that of its custom peer group, the Board noted that the Foundry Fund performed below the average and median for all periods presented. The Board reviewed the performance of Foundry in managing separate accounts with investment strategies similar to that of the Foundry Fund and observed that the Foundry Fund’s performance was very comparable. The Trustees took into consideration discussions with representatives of Foundry during the prior year regarding the reasons for the performance of the Foundry Fund. After further reviewing and discussing these and other relevant factors, the Board concluded, in light of all the facts and circumstances, that the investment performance of the Foundry Fund and Foundry was satisfactory. |
| | 3. | The costs of the services to be provided and profits to be realized by Foundry from the relationship with the Foundry Fund. The Trustees considered: (1) Foundry’s financial condition; (2) the asset level of the Foundry Fund; (3) the overall expenses of the Foundry Fund; and (4) the nature and frequency of management fee payments. The Trustees reviewed information provided by Foundry regarding its profits associated with managing the Foundry Fund, noting that Foundry is not currently waiving any of its management fee. The Trustees also considered potential benefits for Foundry in managing the Foundry Fund. The Trustees then compared the fees and expenses of the Foundry Fund (including the management fee) to other comparable mutual funds. The Trustees noted that the Foundry Fund’s management fee was lower than the average and equal to the median management fees of its peer group, and that the net expense ratio was higher than the |
Annual Report
30
peer group average and median. They noted that the Foundry Fund’s management fee was higher than the average and median of funds in its Morningstar category, and that the Foundry Fund’s net expense ratio was also higher. The Board noted that the fees that Foundry assesses for separate account clients that have strategies similar to that of the Foundry Fund could be comparable or lower and they expressed the view that the reasons for such differences were acceptable and reasonable. Based on the foregoing, the Board concluded that the fees to be paid to Foundry by the Foundry Fund and the profits to be realized by Foundry, in light of all the facts and circumstances, were fair and reasonable in relation to the nature and quality of the services provided by Foundry.
| | 4. | The extent to which economies of scale would be realized as the Foundry Fund grows and whether advisory fee levels reflect these economies of scale for the benefit of the Foundry Fund’s investors. The Board considered the Foundry Fund’s fee arrangements with Foundry. The Board considered that while the management fee remained the same at all asset levels, the Foundry Fund’s shareholders could experience benefits from the Foundry Fund’s expense limitation arrangement if asset levels fell and/or expenses increased. The Trustees noted that although the Foundry Fund’s expenses currently fell below the cap set by the arrangement, the shareholders would continue to benefit from economies of scale under the Foundry Fund’s arrangements with other service providers to the Foundry Fund, and the Trustees attributed this benefit, in part, to the direct and indirect efforts of Foundry to ensure that a cost structure was in place that was beneficial for the Foundry Fund as it grew. In light of its ongoing consideration of the Foundry Fund’s asset and fees levels and expectations for growth, the Board determined that the Foundry Fund’s fee arrangements, in light of all the facts and circumstances, were fair and reasonable in relation to the nature and quality of the services provided by Foundry. |
| | 5. | Possible conflicts of interest and benefits to Foundry. In considering Foundry’s practices regarding conflicts of interest, the Trustees evaluated the potential for conflicts of interest and considered such matters as the experience and ability of the advisory personnel assigned to the Foundry Fund; the basis of decisions to buy or sell securities for the Foundry Fund and/or Foundry’s other accounts; and the substance and administration of Foundry’s code of ethics. The Trustees also considered disclosure in the registration statement of the Trust relating to Foundry’s potential conflicts of interest. The Trustees noted that Foundry may utilize soft dollars and the Trustees noted Foundry’s policies and processes for managing the conflicts of interest that could arise from soft dollar arrangements. The Trustees noted other potential benefits to Foundry, including the fact that the Foundry Fund could provide an attractive vehicle for smaller accounts, which may increase the total assets under management by Foundry. Based on the foregoing, the Board determined that the standards and practices of Foundry relating to the identification and mitigation of potential conflicts of interest and the benefits to be realized by Foundry in managing the Foundry Fund were satisfactory. |
After additional consideration of the factors delineated in the memorandum provided by counsel and further discussion among the Board members, the Board determined to approve the continuation of the Foundry Agreement between the Trust and Foundry.
Annual Report
31
Valued Advisers Trust Privacy Policy |
FACTS | WHAT DOES Foundry Partners Fundamental Small Cap Value Fund (the “Fund”) DO WITH YOUR PERSONAL INFORMATION? |
| | |
Why? | Financial companies choose how they share your personal information. Federal law gives consumers the right to limit some but not all sharing. Federal law also requires us to tell you how we collect, share, and protect your personal information. Please read this notice carefully to understand what we do. |
| | |
What? | The types of personal information we collect and share depend on the product or service you have with us. This information can include: ■ Social Security number ■ account balances and account transactions ■ transaction or loss history and purchase history ■ checking account information and wire transfer instructions When you are no longer our customer, we continue to share your information as described in this notice. |
| | |
How? | All financial companies need to share customers’ personal information to run their everyday business. In the section below, we list the reasons financial companies can share their customers’ personal information; the reasons the Fund chooses to share; and whether you can limit this sharing. |
| | |
Reasons we can share your personal information | Does the Fund share? |
For our everyday business purposes—
such as to process your transactions, maintain your account(s), respond to court orders and legal investigations, or report to credit bureaus | Yes |
For our marketing purposes—
to offer our products and services to you | No |
For joint marketing with other financial companies | No |
For our affiliates’ everyday business purposes—
information about your transactions and experiences | No |
For our affiliates’ everyday business purposes—
information about your creditworthiness | No |
For nonaffiliates to market to you | No |
| | |
Questions? | Call 1-800-247-1014 |
Who we are |
Who is providing this notice? | Foundry Partners Fundamental Small Cap Value Fund
Unified Financial Securities, LLC (Distributor)
Ultimus Fund Solutions, LLC (Administrator) |
| | |
What we do |
How does the Fund protect my personal information? | To protect your personal information from unauthorized access and use, we use security measures that comply with federal law. These measures include computer safeguards and secured files and buildings. Our service providers are held accountable for adhering to strict policies and procedures to prevent any misuse of your nonpublic personal information. |
How does the Fund collect my personal information? | We collect your personal information, for example, when you ■ open an account or deposit money ■ buy securities from us or sell securities to us ■ make deposits or withdrawals from your account or provide account information ■ give us your account information ■ make a wire transfer ■ tell us who receives the money ■ tell us where to send the money ■ show your government-issued ID ■ show your driver’s license |
Why can’t I limit all sharing? | Federal law gives you the right to limit only ■ sharing for affiliates’ everyday business purposes—information about your creditworthiness ■ affiliates from using your information to market to you ■ sharing for nonaffiliates to market to you State laws and individual companies may give you additional rights to limit sharing. |
Definitions |
Affiliates | Companies related by common ownership or control. They can be financial and nonfinancial companies. ■ Foundry Partners, LLC, the investment adviser to the Fund, could be deemed to be an affiliate. |
Nonaffiliates | Companies not related by common ownership or control. They can be financial and nonfinancial companies. ■ The Fund does not share with nonaffiliates so they can market to you. |
Joint marketing | A formal agreement between nonaffiliated financial companies that together market financial products or services to you. ■ The Fund doesn’t jointly market. |
PROXY VOTING
A description of the policies and procedures that the Fund uses to determine how to vote proxies relating to portfolio securities and information regarding how the Fund voted those proxies during the most recent twelve month period ended June 30, are available (1) without charge upon request by calling the Fund at (800) 247-1014 and (2) in Fund documents filed with the Securities and Exchange Commission (“SEC”) on the SEC’s website at www.sec.gov.
TRUSTEES
Andrea N. Mullins, Chairperson
Ira P. Cohen
Mark J. Seger
OFFICERS
Adam T. Kornegay, Principal Executive Officer and President
Gregory T. Knoth, Principal Financial Officer and Treasurer
Martin R. Dean, Interim Chief Compliance Officer
Carol J. Highsmith, Vice President and Secretary
INVESTMENT ADVISER
Foundry Partners, LLC
323 Washington Avenue North, Suite 360
Minneapolis, MN 55401
DISTRIBUTOR
Unified Financial Securities, LLC
9465 Counselors Row, Suite 200
Indianapolis, IN 46240
INDEPENDENT REGISTERED PUBLIC ACCOUNTING FIRM
Cohen & Company, Ltd.
1350 Euclid Avenue, Suite 800
Cleveland, OH 44115
LEGAL COUNSEL
Stradley Ronon Stevens & Young, LLP
2005 Market Street, Suite 2600
Philadelphia, PA 19103
CUSTODIAN
Huntington National Bank
41 South High Street
Columbus, OH 43215
ADMINISTRATOR, TRANSFER AGENT AND FUND ACCOUNTANT
Ultimus Fund Solutions, LLC
225 Pictoria Drive, Suite 450
Cincinnati, OH 45246
This report is intended only for the information of shareholders or those who have received the Fund’s prospectus which contains information about the Fund’s management fee and expenses. Please read the prospectus carefully before investing.
Distributed by Unified Financial Securities, LLC
Member FINRA/SIPC

Annual Report
October 31, 2019
Beginning on January 1, 2021, as permitted by regulations adopted by the Securities and Exchange Commission, paper copies of the Fund’s shareholder reports like this one will no longer be sent by mail, unless you specifically request paper copies of the reports from the Fund or from your financial intermediary such as a broker-dealer or bank. Instead, the reports will be made available on a website, and you will be notified by mail each time a report is posted and provided with a website link to access the report.
If you already elected to receive shareholder reports electronically, you will not be affected by this change and you need not take any action. You may elect to receive shareholder reports and other communications from the Fund electronically by contacting the Fund at (888) 695-3729 or, if you own these shares through a financial intermediary, you may contact your financial intermediary.
You may elect to receive all future reports in paper free of charge. You can inform the Fund that you wish to continue receiving paper copies of your shareholder reports by contacting the Fund at (888) 695-3729. If you own shares through a financial intermediary, you may contact your financial intermediary or follow instructions included with this document to elect to continue to receive paper copies of your shareholder reports. Your election to receive reports in paper will apply to all funds held with the fund complex or at your financial intermediary.
Fund Adviser:
Kovitz Investment Group Partners, LLC
115 South LaSalle Street, 27th Floor
Chicago, IL 60603
Toll Free (888) 695-3729
MANAGEMENT’S DISCUSSION OF FUND PERFORMANCE – (UNAUDITED)
Kovitz Investment Group launched the Green Owl Intrinsic Value Fund (the Fund) with the goal of seeking long-term capital appreciation through high risk-adjusted returns. Relying on a fundamental, research-driven process, the Fund strives to build a diversified portfolio of equity investments through the purchase of competitively advantaged and financially strong companies at prices substantially less than our estimate of their intrinsic values.
As long-term investors, our research process emphasizes the appraisal of factors that we believe matter most to a business’s long-term success. These include the quality of the business, the strength of the balance sheet, the predictability of the cash flows, and the ability of the management team to allocate capital intelligently and judiciously. We believe these attributes are the most reliable predictors of a company’s ability to maximize intrinsic value on a per share basis.
Market and Performance Summary
During the second half of the fiscal year (May 1, 2019 through October 31, 2019), the Fund returned 0.11%. In comparison, the Fund’s benchmark, the S&P 500® Index (“S&P 500”), gained 4.16% during the same period. For the full fiscal year ending October 31, 2019, the Fund returned 10.34%, while the S&P 500 returned 14.33% over the same period. Since inception on December 28, 2011, the Fund has compounded at a rate of 11.88% annually, versus 14.16% annually for the S&P 500 over the same time period.
The second half of the fiscal year ‘19 contained several noteworthy events. Trade tensions between the U.S. and China ratcheted up, only to be followed by an apparent thaw that saw negotiations restart. Bond yields plunged, followed by a partial recovery. Some economic indicators softened, while the U.S. economy remained seemingly at full employment. These headlines proved even more significant in determining the course of the market than company fundamentals, which have generally remained resilient in the face of slowing global growth.
Investor enthusiasm began to percolate as a considerably more dovish Federal Reserve posture began to materialize. While the central bank was on a steady march to raise rates just a year ago, it has spent the past several months trying to insulate the American economy against the threats of a hot and cold trade war and the associated effect of a more tenuous global economy.
Notably, for a brief period, the yield curve for U.S. Treasury obligations inverted as long-term interest rates dipped below short-term rates. Normally, a yield curve is upward sloping because investors typically demand greater compensation for the added risk of owning a bond with a longer maturity relative to a shorter-term bond. An inverted yield curve is something that has portended recessions in the past, and therefore spooked investors as suspicions rose that something nasty was potentially lurking in the economy’s future. However, the sell-off due to this inversion was brief. This was most likely due to the fact that major monetary authorities, including the U.S. Federal Reserve, signaled a willingness to return to an accommodative posture to protect against the uncertainty posed by slowing global growth and fitful Chinese-American trade negotiations. Indeed, a more dovish Fed back-pedaled on its plans for future rate increases and cut the Federal Funds Rate 3 times by one-quarter point each time. This had the effect of boosting investor confidence that the central bank will do whatever is necessary to sustain the decade-old expansion.
Normally, lower rates tend to lift stocks, but those effects are notably absent now. Whether this is due to central bank policy impotence or just the fact that equity valuations remain relatively full, we do not know. While the equity market is up roughly 20% this calendar year, keep in mind that this has really just recouped the losses from the late-2018 sell-off, which was the last time the “R” word reared its head. Of course, it’s tempting to conclude that we are not in normal times, yet every time we sit down to write these communications there are always seemingly abnormal issues with which to grapple. With that in mind, we will continue to invest with the principles that have served us well over the last 20+ years.
1
Probabilities, Not Predictions
If you’re keeping score at home, the primary concerns the market is occupied with include several issues with binary outcomes. Will there be a trade deal or not? Will there be a near-term recession or not? Will interest rates move up or down? Will the President be impeached or not? As we have frequently said over the years, the existence of so much uncertainty is not new. There have always been things to worry about and there will always be things to worry about, so it shouldn’t be something that scares you out of the market. We would argue the primary reason equity markets have performed well over the long-term is that an investor needs to be compensated for taking part in a market with such uncertain outcomes. However, these returns can only be earned through an acceptance that the market will move around a lot and that trying to jump in and out of the market in an attempt to avoid any drops is a futile effort.
As a consequence of this uncertainty, the future should never be viewed as a singular fixed outcome that’s destined to happen and is capable of being predicted (it isn’t!), but as a range of possibilities. Market experience, the judgment that comes with it, and multifaceted and rigorous research, provides necessary insight into the respective scenario analysis and the likelihood of each. While never exactly precise, the resulting probability distributions are still extremely helpful in determining a course of action. It is essential to bear in mind that even if we know (or think we know) the probabilities, that doesn’t mean we know what’s going to happen.
Essentially, this is the definition of risk. As retired London Business School professor Elroy Dimson said, “Risk means more things can happen than will happen.” If there could be only one outcome and it was easily predictable, there would, of course, be no uncertainty and no risk. With no uncertainty regarding what was going to happen, in theory we would know exactly how to position our portfolios to avoid loss and garner maximum gains. Yet, in investing (and life, in general), since there can be many different outcomes, uncertainty and risk are inescapable. As investors, our job is not to predict events. It is to prepare our portfolios for whatever events may be thrown in our path.
All of this serves to validate why we approach investing with the caution necessary to protect from permanent loss of capital. This is why we perform careful analysis when considering investments and use conservative assumptions. This is why we inject skepticism into our analysis and demand a large margin of safety to protect against analytical errors and unpleasant surprises. Investing is a probabilistic activity, not a predictive one.
Performance Attribution
Key Contributors to Relative Results
The individual positions that contributed the most to performance, on a dollar basis, during the year relative to the S&P 500 were: Quanta Services (PWR), CarMax (KMX), Blackstone (BX), CBRE Group (CBRE), and Analog Devices (ADI). On a percentage total return basis, the top performers for the year were: Blackstone (+70.3%), CarMax (+37.2%), US Foods (USFD, +36.0%), Quanta Services (+35.4%), and CBRE Group (+32.9%).
On a sector basis, the largest contributor to relative results was the Fund’s underweight position in the Energy sector. The Fund’s overweight position and security selection in the Consumer Discretionary sector, combined with security selection in Real Estate, also contributed to negative results.
Key Detractors to Relative Results
The individual positions that detracted the most from performance, on a dollar basis, during the relative to the S&P 500 year were: CBS (CBS), American Airlines (AAL), Covetrus (CVET), FedEx (FDX), and Gildan Activewear (GIL). On a percentage basis (excluding dividends), the worst performers for the year were: Covetrus (-57.5%), CBS (-36.2%), Gildan Activewear (-32.2%), American Airlines (-26.8%), and Halliburton (HAL, -26.0%).
2
On a sector basis, security selection in Communication Services along with an underweight position in Information Technology detracted from the Fund’s relative results.
Portfolio Activity
Portfolio activity during the year included the following:
Initiated positions in the following companies: Booking Holdings (BKNG), Covetrus, Delta (DAL), eBay (EBAY), Gildan Activewear, GoDaddy (GDDY), Charles Schwab (SCHW), SS&C Technologies (SSNC), and Tencent Holdings (TCEHY).
Exited positions in the following companies: American Airlines, Bayer (BAYZF), Haliburton, Harley Davidson (HOG), Naspers (NPSNY), Schlumberger (SLB), Starbucks (SBUX), and Walgreens Boots Alliance (WBA).
As of October 31, 2019, the Fund’s five largest positions were: Berkshire Hathaway (BRKB), Quanta, Apple (AAPL), Alphabet (GOOG), and CarMax.
Overall, we remain optimistic about the long-term outlook for the Fund, where the valuation of its holdings, in the aggregate, is significantly lower than that of the overall market. The wide valuation disparities that characterize the current market offer significant opportunities for active management. We remain focused on the careful and patient application of our investment criteria and valuation requirements. Patience, persistence, and a long-term investment horizon are essential to long-term investment success. We encourage our shareholders to take a similar view.
Thank you for your continued support and trust in our ability to manage your investment in the Fund.
3
INVESTMENT RESULTS – (Unaudited)
| | Average Annual Total Returns* (For the periods ended October 31, 2019) | |
| | | | One Year | | | Five Year | | | Since Inception
(December 22, 2011) (a) | | |
| | Green Owl Intrinsic Value Fund | | | 10.34 | % | | | 7.95 | % | | | 11.88 | % | |
| | S&P 500® Index** | | | 14.33 | % | | | 10.78 | % | | | 14.16 | % | |
Total annual operating expenses, as disclosed in the Green Owl Intrinsic Value Fund (the “Fund”) prospectus dated February 28, 2019, were 1.32% of average daily net assets (1.10% after fee waivers/expense reimbursements by Kovitz Investment Group Partners, LLC (the “Adviser”)). The Adviser has agreed to waive its fees and/or reimburse other expenses of the Fund until February 28, 2020, so that Total Annual Fund Operating Expenses do not exceed 1.10%. This operating expense limitation does not apply to interest, taxes, brokerage commissions, other expenditures which are capitalized in accordance with generally accepted accounting principles, other extraordinary expenses not incurred in the ordinary course of the Fund’s business, dividend expense on short sales, expenses incurred under a Rule 12b-1 plan of distribution, “acquired fund fees and expenses,” and expenses that the Fund has incurred but did not actually pay because of an expense offset arrangement. Each waiver and/or reimbursement of an expense is subject to repayment by the Fund within the three years following such waiver or reimbursement, provided that the Fund is able to make the repayment without exceeding the expense limitation in place at the time of the waiver or reimbursement and the expense limitation in place at the time of the repayment. This agreement may only be terminated by mutual consent of the Adviser and the Board of Trustees. Additional information pertaining to the Fund’s expense ratios as of October 31, 2019 can be found in the financial highlights. |
The performance quoted represents past performance, which does not guarantee future results. The investment return and principal value of an investment will fluctuate so that an investor’s shares, when redeemed, may be worth more or less than their original cost. The returns shown do not reflect deduction of taxes that a shareholder would pay on Fund distributions or the redemption of Fund shares. Current performance of the Fund may be lower or higher than the performance quoted. The Fund’s investment objectives, risks, charges and expenses must be considered carefully before investing. Performance data current to the most recent month end may be obtained by calling (888) 695-3729.
(a) | The Fund commenced operations on December 22, 2011. However, the Fund did not invest in long-term securities towards the investment objective until December 27, 2011. December 27, 2011 is the performance calculation inception date. |
* | Return figures reflect any change in price per share and assume the reinvestment of all distributions. The Fund’s returns reflect any fee reductions during the applicable periods. If such fee reductions had not occurred, the quoted performance would have been lower. |
** | The S&P 500® Index is a widely recognized unmanaged index of equity securities and is representative of a broader domestic equity market and range of securities than is found in the Fund’s portfolio. Individuals cannot invest directly in the Index; however, an individual can invest in exchange traded funds or other investment vehicles that attempt to track the performance of a benchmark index. |
The Fund’s investment objectives, strategies, risks, charges and expenses must be considered carefully before investing. The prospectus contains this and other important information about the Fund and may be obtained by calling the same number as above. Please read it carefully before investing.
The Fund is distributed by Unified Financial Securities, LLC, member FINRA/SIPC.
4
The Fund commenced operations on December 22, 2011. However, the Fund did not invest in long-term securities towards the investment objective until December 27, 2011. December 27, 2011 is the performance calculation inception date. The chart above assumes an initial investment of $10,000 made on December 28, 2011 and held through October 31, 2019. The S&P 500® Index is a widely recognized unmanaged index of equity securities and is representative of a broader domestic equity market and range of securities than is found in the Fund’s portfolio. Individuals cannot invest directly in the Index; however, an individual can invest in exchange traded funds or other investment vehicles that attempt to track the performance of a benchmark index. THE FUND’S RETURN REPRESENTS PAST PERFORMANCE AND DOES NOT GUARANTEE FUTURE RESULTS. The returns shown do not reflect deduction of taxes that a shareholder would pay on Fund distributions or the redemption of Fund shares. Investment returns and principal values will fluctuate so that your shares, when redeemed, may be worth more or less than their original purchase price.
Current performance may be lower or higher than the performance data quoted. For more information on the Fund, and to obtain performance data current to the most recent month end or to request a prospectus, please call (888) 695-3729. You should carefully consider the investment objectives, potential risks, management fees, and charges and expenses of the Fund before investing. The Fund’s prospectus contains this and other information about the Fund, and should be read carefully before investing.
The Fund is distributed by Unified Financial Securities, LLC, member FINRA.
5
FUND HOLDINGS – (Unaudited)

(a) | As a percentage of net assets. |
The investment objective of the Green Owl Intrinsic Value Fund is long-term capital appreciation.
Availability of Portfolio Schedule – (Unaudited)
The Fund files its complete schedule of portfolio holdings with the Securities and Exchange Commission (“SEC”) for the first and third quarters of each fiscal year within sixty days after the end of the period. The Fund’s portfolio holdings are available at the SEC’s website at www.sec.gov.
6
GREEN OWL INTRINSIC VALUE FUND
SCHEDULE OF INVESTMENTS
October 31, 2019
| COMMON STOCKS — 93.59% | | Shares | | | Fair Value | |
| Communication Services — 13.91% | | | | | | | | |
Alphabet, Inc., Class C(a) | | | 2,928 | | | $ | 3,689,603 | |
Alphabet, Inc., Class A(a) | | | 773 | | | | 973,052 | |
| CBS Corporation, Class B | | | 57,430 | | | | 2,069,777 | |
Facebook, Inc., Class A(a) | | | 13,800 | | | | 2,644,770 | |
MultiChoice Group Ltd. - ADR(a) | | | 8,305 | | | | 69,762 | |
| Naspers Ltd., Class N - ADR | | | 21,525 | | | | 608,081 | |
| Walt Disney Company (The) | | | 12,480 | | | | 1,621,402 | |
| | | | | | | | 11,676,447 | |
| Consumer Discretionary — 19.21% | | | | | | | | |
Booking Holdings, Inc.(a) | | | 1,292 | | | | 2,647,011 | |
CarMax, Inc.(a) | | | 38,082 | | | | 3,548,100 | |
| eBay, Inc. | | | 23,035 | | | | 811,984 | |
| Expedia Group, Inc. | | | 16,250 | | | | 2,220,725 | |
| General Motors Company | | | 81,340 | | | | 3,022,594 | |
| Gildan Activewear, Inc. | | | 45,180 | | | | 1,153,445 | |
Mohawk Industries, Inc.(a) | | | 15,047 | | | | 2,157,439 | |
Prosus N.V. - ADR(a) | | | 41,525 | | | | 574,706 | |
| | | | | | | | 16,136,004 | |
| Consumer Staples — 3.86% | | | | | | | | |
| Philip Morris International, Inc. | | | 20,630 | | | | 1,680,107 | |
US Foods Holding Corporation(a)(b) | | | 39,337 | | | | 1,560,499 | |
| | | | | | | | 3,240,606 | |
| Financials — 23.03% | | | | | | | | |
| American Express Company | | | 16,500 | | | | 1,935,120 | |
| Aon plc | | | 14,000 | | | | 2,704,240 | |
| Bank of America Corporation | | | 30,244 | | | | 945,730 | |
Berkshire Hathaway, Inc., Class B(a) | | | 25,315 | | | | 5,381,462 | |
Blackstone Group L.P. (The)(c) | | | 37,180 | | | | 1,976,488 | |
| Charles Schwab Corporation (The) | | | 40,970 | | | | 1,667,889 | |
| Citigroup, Inc. | | | 19,575 | | | | 1,406,660 | |
| Goldman Sachs Group, Inc. (The) | | | 8,900 | | | | 1,899,082 | |
| JPMorgan Chase & Company | | | 11,440 | | | | 1,429,084 | |
| | | | | | | | 19,345,755 | |
| Health Care — 1.40% | | | | | | | | |
| Bayer AG | | | 1,000 | | | | 78,450 | |
Covetrus, Inc.(a) | | | 110,404 | | | | 1,094,656 | |
| | | | | | | | 1,173,106 | |
See accompanying notes which are an integral part of these financial statements.
7
GREEN OWL INTRINSIC VALUE FUND
SCHEDULE OF INVESTMENTS – continued
October 31, 2019
| COMMON STOCKS — 93.59% – continued | | Shares | | | Fair Value | |
| Industrials — 17.59% | | | | | | | | |
| AMERCO | | | 5,345 | | | $ | 2,164,939 | |
| Boeing Company (The) | | | 5,037 | | | | 1,712,127 | |
| Delta Air Lines, Inc. | | | 30,975 | | | | 1,706,103 | |
| FedEx Corporation | | | 10,380 | | | | 1,584,611 | |
| Jacobs Engineering Group, Inc. | | | 19,656 | | | | 1,839,408 | |
| Quanta Services, Inc. | | | 110,010 | | | | 4,625,920 | |
| Robert Half International, Inc. | | | 8,433 | | | | 482,958 | |
| Valmont Industries, Inc. | | | 4,750 | | | | 651,653 | |
| | | | | | | | 14,767,719 | |
| Information Technology — 9.04% | | | | | | | | |
| Analog Devices, Inc. | | | 14,865 | | | | 1,585,055 | |
| Apple, Inc. | | | 16,670 | | | | 4,146,829 | |
GoDaddy, Inc., Class A(a) | | | 13,728 | | | | 892,732 | |
| SS&C Technologies Holdings, Inc. | | | 18,545 | | | | 964,525 | |
| | | | | | | | 7,589,141 | |
| Materials — 2.39% | | | | | | | | |
| PPG Industries, Inc. | | | 16,015 | | | | 2,003,797 | |
| | | | | | | | | |
| Real Estate — 3.16% | | | | | | | | |
CBRE Group, Inc., Class A(a) | | | 49,530 | | | | 2,652,332 | |
| Total Common Stocks (Cost $54,732,308) | | | | | | | 78,584,907 | |
| | | | | | | | | |
| MONEY MARKET FUNDS – 6.46% | | | | | | | | |
Federated Treasury Obligations Fund, Institutional Class, 1.44%(d) | | | 5,424,145 | | | | 5,424,145 | |
| Total Money Market Funds (Cost $5,424,145) | | | | | | | 5,424,145 | |
| Total Investments — 100.05% (Cost $60,156,453) | | | | | | | 84,009,052 | |
| Liabilities in Excess of Other Assets — (0.05)% | | | | | | | (43,319 | ) |
| NET ASSETS — 100.00% | | | | | | $ | 83,965,733 | |
(a) | Non-income producing security. |
(b) | All or a portion of the security is held as collateral for written call options. |
(c) | Master Limited Partnership. |
(d) | Rate disclosed is the seven day effective yield as of October 31, 2019. |
ADR — American Depositary Receipt.
The sectors shown on the schedule of investments are based on the Global Industry Classification Standard, or GICS® (“GICS”). The GICS was developed by and/or is the exclusive property of MSCI, Inc. and Standard & Poor’s Financial Services LLC (“S&P”). GICS is a service mark of MSCI, Inc. and S&P and has been licensed for use by Ultimus Fund Solutions, LLC.
See accompanying notes which are an integral part of these financial statements.
8
GREEN OWL INTRINSIC VALUE FUND
SCHEDULE OF OPEN WRITTEN OPTION CONTRACTS
October 31, 2019
Description | | Number of
Contracts | | | Notional
Amount | | | Exercise
Price | | | Expiration
Date | | | Fair
Value | |
Written Call Options – (0.03)% | | | | | | | | | | | | | | | | |
US Foods Holding Corporation | | | (171 | ) | | $ | (678,357 | ) | | $ | 40.00 | | | | January 2020 | | | $ | (27,788 | ) |
Total Written Call Options (Premiums Received $32,385) | | | | | | | | | | $ | (27,788 | ) |
See accompanying notes which are an integral part of these financial statements.
9
GREEN OWL INTRINSIC VALUE FUND
STATEMENT OF ASSETS AND LIABILITIES
October 31, 2019
Assets | | | | |
Investments in securities at fair value (cost $60,156,453) (Note 3) | | $ | 84,009,052 | |
Cash | | | 10,296 | |
Receivable for fund shares sold | | | 500 | |
Dividends receivable | | | 32,336 | |
Tax reclaims receivable | | | 14,338 | |
Prepaid expenses | | | 25,751 | |
Total Assets | | | 84,092,273 | |
| | | | | |
Liabilities | | | | |
Written options, at value (premium received $32,385) (Note 3) | | | 27,788 | |
Payable for fund shares redeemed | | | 852 | |
Payable to Adviser (Note 4) | | | 54,604 | |
Payable to Administrator (Note 4) | | | 10,386 | |
Payable to trustees | | | 1,600 | |
Other accrued expenses | | | 31,310 | |
Total Liabilities | | | 126,540 | |
Net Assets | | $ | 83,965,733 | |
| | | | | |
Net Assets consist of: | | | | |
Paid-in capital | | | 55,906,579 | |
Accumulated earnings | | | 28,059,154 | |
Net Assets | | $ | 83,965,733 | |
| | | | | |
Shares outstanding (unlimited number of shares authorized, no par value) | | | 4,464,893 | |
Net asset value, offering and redemption price per share (Note 2) | | $ | 18.81 | |
See accompanying notes which are an integral part of these financial statements.
10
GREEN OWL INTRINSIC VALUE FUND
STATEMENT OF OPERATIONS
For the year ended October 31, 2019
Investment Income | | | | |
Dividend income (net of foreign taxes withheld of $10,892) | | $ | 1,061,975 | |
Non-cash income | | | 656,056 | |
Total investment income | | | 1,718,031 | |
| | | | | |
Expenses | | | | |
Investment Adviser fees (Note 4) | | | 800,982 | |
Administration fees (Note 4) | | | 64,019 | |
Fund accounting fees (Note 4) | | | 33,050 | |
Registration expenses | | | 28,537 | |
Legal fees | | | 24,290 | |
Transfer agent fees (Note 4) | | | 22,633 | |
Audit and tax preparation fees | | | 17,300 | |
Custodian fees | | | 13,253 | |
Printing and postage expenses | | | 10,055 | |
Trustee fees | | | 6,910 | |
Insurance expenses | | | 6,482 | |
Pricing | | | 3,569 | |
Compliance service fees (Note 4) | | | 3,000 | |
Line of credit (Note 5) | | | 1,737 | |
Interest expense | | | 1,131 | |
Miscellaneous expenses | | | 22,715 | |
Total expenses | | | 1,059,663 | |
Fees contractually waived by Adviser (note 4) | | | (175,543 | ) |
Net operating expenses | | | 884,120 | |
Net investment income | | | 833,911 | |
| | | | | |
Net Realized and Change in Unrealized Gain (Loss) on Investments | | | | |
Net realized gain on: | | | | |
Investment securities transactions | | | 3,445,135 | |
Foreign currency translations | | | 51 | |
Net change in unrealized appreciation (depreciation) on: | | | | |
Investment securities transactions | | | 3,707,986 | |
Written options | | | 4,597 | |
Foreign currency translations | | | (132 | ) |
Net realized and change in unrealized gain on investments | | | 7,157,637 | |
Net increase in net assets resulting from operations | | $ | 7,991,548 | |
See accompanying notes which are an integral part of these financial statements.
11
GREEN OWL INTRINSIC VALUE FUND
STATEMENTS OF CHANGES IN NET ASSETS
| | | For the
Year Ended
October 31, 2019 | | | For the
Year Ended
October 31, 2018 | |
Increase (Decrease) in Net Assets due to: | | | | | | | | |
Operations | | | | | | | | |
Net investment income | | $ | 833,911 | | | $ | 216,732 | |
Net realized gain on investment securities transactions and foreign currency translations | | | 3,445,186 | | | | 7,317,939 | |
Net change in unrealized appreciation (depreciation) of investment securities, written options and foreign currency translations | | | 3,712,451 | | | | (6,111,971 | ) |
Net increase in net assets resulting from operations | | | 7,991,548 | | | | 1,422,700 | |
| | | | | | | | | |
Distributions to Shareholders from Earnings (Note 2) | | | (7,548,220 | ) | | | (1,693,471 | ) |
| | | | | | | | | |
Capital Transactions | | | | | | | | |
Proceeds from shares sold | | | 13,521,730 | | | | 9,383,880 | |
Reinvestment of distributions | | | 7,250,182 | | | | 1,602,548 | |
Amount paid for shares redeemed | | | (15,666,914 | ) | | | (14,366,252 | ) |
Net increase (decrease) in net assets resulting from capital transactions | | | 5,104,998 | | | | (3,379,824 | ) |
Total Increase (Decrease) in Net Assets | | | 5,548,326 | | | | (3,650,595 | ) |
| | | | | | | | | |
Net Assets | | | | | | | | |
Beginning of year | | | 78,417,407 | | | | 82,068,002 | |
End of year | | $ | 83,965,733 | | | $ | 78,417,407 | |
| | | | | | | | | |
Share Transactions | | | | | | | | |
Shares sold | | | 772,039 | | | | 480,295 | |
Shares issued in reinvestment of distributions | | | 448,650 | | | | 83,077 | |
Shares redeemed | | | (885,378 | ) | | | (733,040 | ) |
Net increase (decrease) in shares outstanding | | | 335,311 | | | | (169,668 | ) |
See accompanying notes which are an integral part of these financial statements.
12
GREEN OWL INTRINSIC VALUE FUND
FINANCIAL HIGHLIGHTS
(For a share outstanding during each year)
| | | For the
Year Ended
October 31,
2019 | | | For the
Year Ended
October 31,
2018 | | | For the
Year Ended
October 31,
2017 | | | For the
Year Ended
October 31,
2016 | | | For the
Year Ended
October 31,
2015 | |
Selected Per Share Data | | | | | | | | | | | | | | | | | | | | |
Net asset value, beginning of year | | $ | 18.99 | | | $ | 19.09 | | | $ | 15.08 | | | $ | 14.84 | | | $ | 15.72 | |
Investment operations: | | | | | | | | | | | | | | | | | | | | |
Net investment income | | | 0.19 | | | | 0.05 | | | | 0.04 | | | | 0.06 | | | | 0.08 | |
Net realized and unrealized gain (loss) on investments | | | 1.47 | | | | 0.24 | | | | 4.03 | | | | 0.47 | | | | (0.16 | ) |
Total from investment operations | | | 1.66 | | | | 0.29 | | | | 4.07 | | | | 0.53 | | | | (0.08 | ) |
| | | | | | | | | | | | | | | | | | | | | |
Less distributions to shareholders from: | | | | | | | | | | | | | | | | | | | | |
Net investment income | | | (0.05 | ) | | | (0.04 | ) | | | (0.06 | ) | | | (0.06 | ) | | | (0.20 | ) |
Net realized gains | | | (1.79 | ) | | | (0.35 | ) | | | — | | | | (0.23 | ) | | | (0.60 | ) |
Total distributions | | | (1.84 | ) | | | (0.39 | ) | | | (0.06 | ) | | | (0.29 | ) | | | (0.80 | ) |
Net asset value, end of year | | $ | 18.81 | | | $ | 18.99 | | | $ | 19.09 | | | $ | 15.08 | | | $ | 14.84 | |
| | | | | | | | | | | | | | | | | | | | | |
Total Return(a) | | | 10.34 | % | | | 1.50 | % | | | 27.02 | % | | | 3.65 | % | | | (0.60 | )% |
Ratios and Supplemental Data: | | | | | | | | | | | | | | | | | | | | |
Net assets, end of year (000 omitted) | | $ | 83,966 | | | $ | 78,417 | | | $ | 82,068 | | | $ | 61,267 | | | $ | 59,318 | |
Ratio of expenses to average net assets after expense waiver | | | 1.10 | % | | | 1.10 | % | | | 1.10 | % | | | 1.10 | % | | | 1.10 | % |
Ratio of expenses to average net assets before expense waiver | | | 1.32 | % | | | 1.32 | % | | | 1.32 | % | | | 1.40 | % | | | 1.37 | % |
Ratio of net investment income to average net assets after expense waiver | | | 1.04 | % | | | 0.26 | % | | | 0.22 | % | | | 0.41 | % | | | 0.49 | % |
Portfolio turnover rate | | | 29 | % | | | 33 | % | | | 17 | % | | | 21 | % | | | 33 | % |
(a) | Total return represents the rate that the investor would have earned or lost on an investment in the Fund, assuming reinvestment of distributions. |
See accompanying notes which are an integral part of these financial statements.
13
GREEN OWL INTRINSIC VALUE FUND
NOTES TO THE FINANCIAL STATEMENTS
October 31, 2019
NOTE 1. ORGANIZATION
The Green Owl Intrinsic Value Fund (the “Fund”) is an open-end diversified series of Valued Advisers Trust (the “Trust”). The Trust is a management investment company established under the laws of Delaware by an Agreement and Declaration of Trust dated June 13, 2008 (the “Trust Agreement”). The Trust Agreement permits the Board of Trustees (the “Board”) to issue an unlimited number of shares of beneficial interest of separate series without par value. The Fund is one of a series of funds authorized by the Board. The Fund commenced operations on December 22, 2011. The Fund’s investment adviser is Kovitz Investment Group Partners, LLC (the “Adviser”). The investment objective of the Fund is to provide long-term capital appreciation.
NOTE 2. SIGNIFICANT ACCOUNTING POLICIES
The Fund is an investment company and follows accounting and reporting guidance under Financial Accounting Standards Board Accounting Standards Codification (“ASC”) Topic 946, “Financial Services-Investment Companies”. The following is a summary of significant accounting policies followed by the Fund in the preparation of its financial statements. These policies are in conformity with generally accepted accounting principles in the United States of America (“GAAP”).
Estimates – The preparation of financial statements in conformity with GAAP requires management to make estimates and assumptions that affect the reported amounts of assets and liabilities and disclosure of contingent assets and liabilities at the date of the financial statements and the reported amounts of increases and decreases in net assets from operations during the reporting period. Actual results could differ from those estimates.
Foreign Currency Translation – The accounting records of the Fund are maintained in U.S. dollars. Foreign currency amounts are translated into U.S. dollars at the current rate of exchange each business day to determine the value of investments, and other assets and liabilities. Purchases and sales of foreign securities, and income and expenses, are translated at the prevailing rate of exchange on the respective date of these transactions. The Fund does not isolate that portion of the results of operations resulting from changes in foreign exchange rates on investments from fluctuation arising from changes in market prices of securities held. These fluctuations are included with the unrealized gain or loss from investments. Reported net realized foreign exchange gains or losses arise from sales of foreign currencies, currency gains or losses realized between the trade and settlement dates on securities transactions, and the difference between the amounts of dividends, interest, and foreign withholding taxes recorded on the Fund’s books and the U.S. dollar equivalent of the amounts actually received or paid. Net unrealized foreign exchange gains and losses arise from changes in the fair values of assets and liabilities, other than investments in securities at period end, resulting from changes in exchange rates.
Federal Income Taxes – The Fund makes no provision for federal income or excise tax. The Fund has qualified and intends to qualify each year as a regulated investment company (“RIC”) under subchapter M of the Internal Revenue Code of 1986, as amended, by complying with the requirements applicable to RICs and by distributing substantially all of its taxable income. The Fund also intends to distribute sufficient net investment income and net realized capital gains, if any, so that it will not be subject to excise tax on undistributed income and gains. If the required amount of net investment income or gains is not distributed, the Fund could incur a tax expense.
As of and during the fiscal year ended October 31, 2019, the Fund did not have a liability for any unrecognized tax benefits. The Fund recognizes interest and penalties, if any, related to unrecognized tax benefits as income tax expense on the statement of operations when incurred. During the fiscal year ended October 31, 2019, the Fund did not incur any interest or penalties. Management of the Fund has reviewed tax positions taken in tax years that
14
GREEN OWL INTRINSIC VALUE FUND
NOTES TO THE FINANCIAL STATEMENTS – (continued)
October 31, 2019
NOTE 2. SIGNIFICANT ACCOUNTING POLICIES – continued
remain subject to examination by all major tax jurisdictions, including federal (i.e., the last three tax year ends and the interim tax period since then, as applicable). Management believes that there is no tax liability resulting from unrecognized tax benefits related to uncertain tax positions taken.
Expenses – Expenses incurred by the Trust that do not relate to a specific fund of the Trust are allocated to the individual funds based on each fund’s relative net assets or another appropriate basis (as determined by the Board).
Security Transactions and Related Income – The Fund follows industry practice and records security transactions on the trade date for financial reporting purposes. The specific identification method is used for determining gains or losses for financial statement and income tax purposes. Dividend income is recorded on the ex-dividend date and interest income is recorded on an accrual basis. Discounts and premiums on securities purchased are accreted or amortized using the effective interest method, if applicable.Non-cash income, if any, is recorded at the fair market value of the securities received.Withholding taxes on foreign dividends have been provided for in accordance with the Fund’s understanding of the applicable country’s tax rules and rates.
Dividends and Distributions – The Fund intends to distribute its net investment income and net realized long-term and short-term capital gains, if any, at least annually. Dividends and distributions to shareholders, which are determined in accordance with income tax regulations, are recorded on the ex-dividend date. The treatment for financial reporting purposes of distributions made to shareholders during the period from net investment income or net realized capital gains may differ from their ultimate treatment for federal income tax purposes. These differences are caused primarily by differences in the timing of the recognition of certain components of income, expense or realized capital gain for federal income tax purposes. Where such differences are permanent in nature, they are reclassified among the components of net assets based on their ultimate characterization for federal income tax purposes. Any such reclassifications will have no effect on net assets, results of operations or net asset value (“NAV”) per share of the Fund.
For the fiscal year ended October 31, 2019, the Fund made the following reclassifications to increase (decrease) the components of net assets:
Paid-In
Capital | Accumulated
earnings (deficit) |
| $(650) | $650 |
Derivative Transactions – The following tables identify the location and fair value of derivative instruments on the Statement of Assets and Liabilities as of October 31, 2019 and the effect of derivative instruments on the Statement of Operations for the fiscal year ended October 31, 2019.
As of October 31, 2019:
| | Location of Derivatives on
Statement of Assets and Liabilities |
Derivatives | Liability Derivatives | | Fair Value | |
Equity Price Risk: | | | | | |
Written Call Options | Written options, at value | | $ | (27,788 | ) |
15
GREEN OWL INTRINSIC VALUE FUND
NOTES TO THE FINANCIAL STATEMENTS – (continued)
October 31, 2019
NOTE 2. SIGNIFICANT ACCOUNTING POLICIES – continued
For the fiscal year ended October 31, 2019:
Derivatives | Location of Gain
(Loss) on Derivatives
on Statement of
Operations | | Realized
Gain
(Loss) on
Derivatives | | | Change in
Unrealized
Appreciation
(Depreciation)
on Derivatives | |
Equity Price Risk: | | | | | | | | | |
Written Call Options | Net realized gain and change in unrealized appreciation (depreciation) on written options | | | — | | | $ | 4,597 | |
The following summarizes the average ending monthly fair value of derivatives outstanding during the fiscal year ended October 31, 2019:
| | | Average
Fair Value | |
Written options(a) | | $ | (27,788 | ) |
(a) | Actual fair value as of month end shown due to activity being limited to one month during the fiscal year. |
Balance Sheet Offsetting Information – The following table provides a summary of offsetting financial liabilities and derivatives and the effect of derivative instruments on the Statement of Assets and Liabilities.
| | | | | | | | | | | | | | | Gross Amounts Not Offset
in Statement of Assets and
Liabilities | | | | | |
| | | Gross
Amounts of
Recognized
Liabilities | | | Gross Amount
Offset in
Statement of
Assets and
Liabilities | | | Net Amount
of Assets
Presented in
Statement of
Assets and
Liabilities | | | Financial
Instruments | | | Cash
Collateral
Pledged | | | Net Amount | |
Written call options | | $ | (27,788 | ) | | $ | — | | | $ | (27,788 | ) | | $ | 27,788 | | | $ | — | | | $ | — | |
NOTE 3. SECURITIES VALUATION AND FAIR VALUE MEASUREMENTS
Fair value is defined as the price that the Fund would receive upon selling an investment in a timely transaction to an independent buyer in the principal or most advantageous market of the investment. GAAP establishes a three-tier hierarchy to maximize the use of observable market data and minimize the use of unobservable inputs and to establish classification of fair value measurements for disclosure purposes.
16
GREEN OWL INTRINSIC VALUE FUND
NOTES TO THE FINANCIAL STATEMENTS – (continued)
October 31, 2019
NOTE 3. SECURITIES VALUATION AND FAIR VALUE MEASUREMENTS – continued
Inputs refer broadly to the assumptions that market participants would use in pricing the asset or liability, including assumptions about risk (the risk inherent in a particular valuation technique used to measure fair value including a pricing model and/or the risk inherent in the inputs to the valuation technique). Inputs may be observable or unobservable. Observable inputs are inputs that reflect the assumptions market participants would use in pricing the asset or liability developed based on market data obtained and available from sources independent of the reporting entity. Unobservable inputs are inputs that reflect the reporting entity’s own assumptions about the assumptions market participants would use in pricing the asset or liability developed based on the best information available in the circumstances.
Various inputs are used in determining the value of the Fund’s investments. These inputs are summarized in the three broad levels listed below.
| | ● | Level 1 – unadjusted quoted prices in active markets for identical investments and/or registered investment companies where the value per share is determined and published and is the basis for current transactions for identical assets or liabilities at the valuation date |
| | ● | Level 2 – other significant observable inputs (including, but not limited to, quoted prices for an identical security in an inactive market, quoted prices for similar securities, interest rates, prepayment speeds, credit risk, etc.) |
| | ● | Level 3 – significant unobservable inputs (including the Fund’s own assumptions in determining fair value of investments based on the best information available) |
The inputs used to measure fair value may fall into different levels of the fair value hierarchy. In such cases, for disclosure purposes, the level in the fair value hierarchy which is reported, is determined based on the lowest level input that is significant to the fair value measurement in its entirety.
Equity securities that are traded on any stock exchange are generally valued at the last quoted sale price on the security’s primary exchange. Lacking a last sale price, an exchange-traded security is generally valued at its last bid price. Securities traded in the NASDAQ over-the-counter market are generally valued at the NASDAQ Official Closing Price. When using the market quotations and when the market is considered active, the security is classified as a Level 1 security. In the event that market quotations are not readily available or are considered unreliable due to market or other events, the Fund values its securities and other assets at fair value in accordance with policies established by and under the general supervision of the Board. Under these policies, the securities will be classified as Level 2 or 3 within the fair value hierarchy, depending on the inputs used.
Investments in mutual funds, including money market mutual funds, are generally priced at the ending NAV. These securities are categorized as Level 1 securities.
Call and put options purchased or sold by the Fund are valued at the mean of the last bid and ask prices as provided by a pricing service. If there is no such reported ask price on the valuation date, options are valued at the most recent bid price. If there is no such reported bid price on the valuation date, options are valued at the most recent ask price. Options will generally be categorized as Level 2 securities.
In accordance with the Trust’s valuation policies, the Adviser is required to consider all appropriate factors relevant to the value of securities for which it has determined other pricing sources are not available or reliable as described above. No single method exists for determining fair value, because fair value depends upon the circumstances of each individual case. As a general principle, the current fair value of a security being valued by the Adviser
17
GREEN OWL INTRINSIC VALUE FUND
NOTES TO THE FINANCIAL STATEMENTS – (continued)
October 31, 2019
NOTE 3. SECURITIES VALUATION AND FAIR VALUE MEASUREMENTS – continued
would be the amount that the Fund might reasonably expect to receive upon the current sale. Methods that are in accordance with this principle may, for example, be based on (i) a multiple of earnings; (ii) a discount from market prices of a similar freely traded security (including a derivative security or a basket of securities traded on other markets, exchanges or among dealers); or (iii) yield to maturity with respect to debt issues, or a combination of these and other methods. Fair-value pricing is permitted if, in the Adviser’s opinion, the validity of market quotations appears to be questionable based on factors such as evidence of a thin market in the security based on a small number of quotations, a significant event occurs after the close of a market but before the Fund’s NAV calculation that may affect a security’s value, or the Adviser is aware of any other data that calls into question the reliability of market quotations.
The following is a summary of the inputs used to value the Fund’s investments as of October 31, 2019:
| | | Valuation Inputs | |
Assets | | Level 1 | | | Level 2 | | | Level 3 | | | Total | |
Common Stocks(a) | | $ | 78,584,907 | | | $ | — | | | $ | — | | | $ | 78,584,907 | |
Money Market Funds | | | 5,424,145 | | | | — | | | | — | | | | 5,424,145 | |
Total | | $ | 84,009,052 | | | $ | — | | | $ | — | | | $ | 84,009,052 | |
(a) | Refer to Schedule of Investments for sector classifications. |
| | | Valuation Inputs | |
Liabilities | | Level 1 | | | Level 2 | | | Level 3 | | | Total | |
Written Call Options | | $ | — | | | $ | (27,788 | ) | | $ | — | | | $ | (27,788 | ) |
Total | | $ | — | | | $ | (27,788 | ) | | $ | — | | | $ | (27,788 | ) |
The Fund did not hold any investments at the end of the reporting period for which significant unobservable inputs (Level 3) were used in determining fair value; therefore, no reconciliation of Level 3 securities is included for this reporting period.
NOTE 4. ADVISER FEES AND OTHER TRANSACTIONS
Under the terms of the management agreement, on behalf of the Fund, the Adviser manages the Fund’s investments subject to approval by the Board. As compensation for its management services, the Fund is obligated to pay the Adviser a fee computed and accrued daily and paid monthly at an annual rate of 1.00% of the average daily net assets of the Fund. For the fiscal year ended October 31, 2019, the Adviser earned a fee of $800,982 from the Fund before the reimbursement described below. At October 31, 2019, the Fund owed the Adviser $54,604.
The Adviser has agreed to waive its fees and/or reimburse other expenses of the Fund until February 28, 2020, so that Total Annual Fund Operating Expenses do not exceed 1.10%. This operating expense limitation does not apply to interest, taxes, brokerage commissions, other expenditures which are capitalized in accordance with GAAP, other extraordinary expenses not incurred in the ordinary course of the Fund’s business, dividend expense on short sales, expenses incurred under a Rule 12b-1 plan of distribution, “acquired fund fees and expenses,” and expenses that the Fund has incurred but did not actually pay because of an expense offset arrangement.
18
GREEN OWL INTRINSIC VALUE FUND
NOTES TO THE FINANCIAL STATEMENTS – (continued)
October 31, 2019
NOTE 4. ADVISER FEES AND OTHER TRANSACTIONS – continued
Each waiver and/or reimbursement of an expense is subject to repayment by the Fund within the three years following such waiver or reimbursement, provided that the Fund is able to make the repayment without exceeding the expense limitation in place at the time of the waiver or reimbursement and the expense limitation in place at the time of the repayment. This agreement may only be terminated by mutual consent of the Adviser and the Board of Trustees. For the fiscal year ended October 31, 2019, the Adviser waived fees and/or reimbursed expenses of $175,543.
The amounts subject to repayment by the Fund, pursuant to the aforementioned conditions are as follows:
Recoverable through | | | | |
October 31, 2020 | | $ | 156,094 | |
October 31, 2021 | | | 179,666 | |
October 31, 2022 | | | 175,543 | |
The Trust retains Ultimus Fund Solutions, LLC (“the Administrator”) to provide the Fund with administration, compliance (including a chief compliance officer), fund accounting, and transfer agent services, including all regulatory reporting. For the fiscal year ended October 31, 2019, the Administrator earned fees of $64,019, $3,000, $33,050 and $22,633, for administrative, compliance, accounting and transfer agent services, respectively. At October 31, 2019, the Administrator was owed $10,386 from the Fund for these services.
The officers and one trustee of the Trust are members of management and/or employees of the Administrator. Unified Financial Securities, LLC (the “Distributor”), a wholly-owned subsidiary of the Administrator, serves as the principal distributor of the Fund’s shares. There were no payments made by the Fund to the Distributor during the fiscal year ended October 31, 2019.
During the fiscal year ended October 31, 2019, the Fund paid $10,042 to Kovitz Securities, LLC, an affiliate of the Adviser, for the execution of purchases and sales of the Fund’s portfolio investments.
NOTE 5. LINE OF CREDIT
The Fund participates in a short-term credit agreement (“Line of Credit”) with Huntington National Bank (“HNB”) expiring on September 2, 2020. Under the terms of the agreement, the Fund may borrow the lesser of $1,000,000 or 5% of the Fund’s daily market value at an interest rate of LIBOR plus 150 basis points. The purpose of the agreement is to meet temporary or emergency cash needs, including redemption requests that might otherwise require the untimely disposition of securities. HNB receives an annual facility fee of 0.125% on $1 million, subject to a minimum fee of $1,250, as well as an additional annual fee of 0.125% on any unused portion of the credit facility, for providing the Line of Credit. As of and during the fiscal year ended October 31, 2019, the Fund had no outstanding borrowings under this Line of Credit.
NOTE 6. PURCHASES AND SALES
For the fiscal year ended October 31, 2019, purchases and sales of investment securities, other than short-term investments, were $23,048,998 and $30,138,463, respectively.
There were no purchases or sales of long-term U.S. government obligations during the fiscal year ended October 31, 2019.
19
GREEN OWL INTRINSIC VALUE FUND
NOTES TO THE FINANCIAL STATEMENTS – (continued)
October 31, 2019
NOTE 7. FEDERAL TAX INFORMATION
At October 31, 2019, the net unrealized appreciation (depreciation) of investments for tax purposes was as follows:
Gross unrealized appreciation | | $ | 26,746,054 | |
Gross unrealized depreciation | | | (2,821,785 | ) |
Net unrealized appreciation on investments | | $ | 23,924,269 | |
| | | | | |
Tax cost of investments | | $ | 60,056,875 | |
At October 31, 2019, the difference between book basis and tax basis unrealized appreciation (depreciation) is attributable to the tax deferral of losses on organizational expense amortization and partnership basis adjustments.
On December 13, 2019, the Fund paid an income distribution of $0.167536 per share and a long-term capital gain distribution of $0.782313 per share to shareholders of record on December 12, 2019.
The tax character of distributions paid for the fiscal years ended October 31, 2019 and October 31, 2018 were as follows:
| | | 2019 | | | 2018 | |
Distributions paid from: | | | | | | | | |
Ordinary income(a) | | $ | 727,840 | | | $ | 165,908 | |
Long-term capital gains | | | 6,820,380 | | | | 1,527,563 | |
Total distributions paid | | $ | 7,548,220 | | | $ | 1,693,471 | |
(a) | For federal income tax purposes, distributions of short-term capital gains are treated as ordinary income distributions. |
At October 31, 2019, the components of accumulated earnings (accumulated losses) on a tax basis were as follows:
Undistributed Ordinary Income | | $ | 642,256 | |
Undistributed Long-Term Capital Gains | | | 3,494,402 | |
Accumulated Capital and Other Losses | | | (1,773 | ) |
Unrealized Appreciation on Investments | | | 23,924,269 | |
Total Accumulated Earnings | | $ | 28,059,154 | |
NOTE 8. COMMITMENTS AND CONTINGENCIES
The Trust indemnifies its officers and Trustees for certain liabilities that may arise from their performance of their duties to the Trust or the Fund. Additionally, in the normal course of business, the Trust enters into contracts that contain a variety of representations and warranties which provide general indemnifications. The Trust’s maximum exposure under these arrangements is unknown, as this would involve future claims that may be made against the Trust that have not yet occurred.
NOTE 9. SUBSEQUENT EVENTS
Management of the Fund has evaluated the need for disclosures and/or adjustments resulting from subsequent events through the date at which these financial statements were issued. Based upon this evaluation, management has determined there were no items requiring adjustment of the financial statements or additional disclosure.
20
REPORT OF INDEPENDENT REGISTERED PUBLIC ACCOUNTING FIRM
To the Shareholders of Green Owl Intrinsic Value Fund and
Board of Trustees of Valued Advisers Trust
Opinion on the Financial Statements
We have audited the accompanying statement of assets and liabilities, including the schedule of investments, of Green Owl Intrinsic Value Fund (the “Fund”), a series of Valued Advisers Trust, as of October 31, 2019, the related statement of operations for the year then ended, the statements of changes in net assets for each of the two years in the period then ended, including the related notes, and the financial highlights for each of the five years in the period then ended (collectively referred to as the “financial statements”). In our opinion, the financial statements present fairly, in all material respects, the financial position of the Fund as of October 31, 2019, the results of its operations for the year then ended, the changes in its net assets for each of the two years in the period then ended, and the financial highlights for each of the five years in the period then ended, in conformity with accounting principles generally accepted in the United States of America.
Basis for Opinion
These financial statements are the responsibility of the Fund’s management. Our responsibility is to express an opinion on the Fund’s financial statements based on our audits. We are a public accounting firm registered with the Public Company Accounting Oversight Board (United States) (“PCAOB”) and are required to be independent with respect to the Fund in accordance with the U.S. federal securities laws and the applicable rules and regulations of the Securities and Exchange Commission and the PCAOB.
We conducted our audits in accordance with the standards of the PCAOB. Those standards require that we plan and perform the audit to obtain reasonable assurance about whether the financial statements are free of material misstatement, whether due to error or fraud.
Our audits included performing procedures to assess the risks of material misstatement of the financial statements, whether due to error or fraud, and performing procedures that respond to those risks. Such procedures included examining, on a test basis, evidence regarding the amounts and disclosures in the financial statements. Our procedures included confirmation of securities owned as of October 31, 2019, by correspondence with the custodian and brokers. Our audits also included evaluating the accounting principles used and significant estimates made by management, as well as evaluating the overall presentation of the financial statements. We believe that our audits provide a reasonable basis for our opinion.
We have served as the Fund’s auditor since 2012.
COHEN & COMPANY, LTD.
Cleveland, Ohio
December 20, 2019
21
SUMMARY OF FUND EXPENSES – (Unaudited)
As a shareholder of the Fund, you incur two types of costs: (1) transaction and (2) ongoing costs, including management fees and other Fund expenses. These examples are intended to help you understand your ongoing costs (in dollars) of investing in the Fund and to compare these costs with the ongoing costs of investing in other mutual funds. The example is based on an investment of $1,000 invested at the beginning of the period and held for the entire period from May 1, 2019 through October 31, 2019.
Actual Expenses
The first line of the table below provides information about actual account values and actual expenses. You may use the information in this line, together with the amount you invested, to estimate the expenses that you paid over the period. Simply divide your account value by $1,000 (for example, an $8,600 account value divided by $1,000 = 8.6), then multiply the result by the number in the first line under the heading entitled “Expenses Paid During Period” to estimate the expenses you paid on your account during this period.
Hypothetical Example for Comparison Purposes
The second line of the table below provides information about hypothetical account values and hypothetical expenses based on the Fund’s actual expense ratio and an assumed rate of return of 5% per year before expenses, which is not the Fund’s actual return. The hypothetical account values and expenses may not be used to estimate the actual ending account balance or expenses you paid for the period. You may use this information to compare the ongoing costs of investing in the Fund and other funds. To do so, compare this 5% hypothetical example with the 5% hypothetical examples that appear in the shareholder reports of the other funds.
Expenses shown in the table are meant to highlight your ongoing costs only and do not reflect any transactional costs. Therefore, the second line of the table below is useful in comparing ongoing costs only and will not help you determine the relative costs of owning different funds. In addition, if transaction costs were included, your costs would have been higher.
Green Owl
Intrinsic Value Fund | Beginning
Account Value
May 1, 2019 | Ending
Account Value
October 31, 2019 | Expenses Paid
During Period(a) | Annualized
Expense Ratio |
Actual | $1,000.00 | $1,001.10 | $5.56 | 1.10% |
Hypothetical(b) | $1,000.00 | $1,019.65 | $5.61 | 1.10% |
(a) | Expenses are equal to the Fund’s annualized expense ratio, multiplied by the average account value over the period, multiplied by 184/365 (to reflect the one-half year period). |
(b) | Hypothetical assumes 5% annual return before expenses. |
22
OTHER FEDERAL INCOME TAX INFORMATION – (Unaudited)
The Form 1099-DIV you receive in January 2020 will show the tax status of all distributions paid to your account in calendar year 2019. Shareholders are advised to consult their own tax adviser with respect to the tax consequences of their investment in the Fund. As required by the Internal Revenue Code and/or regulations, shareholders must be notified regarding the status of qualified dividend income for individuals and the dividends received deduction for corporations.
Qualified Dividend Income. The Fund designates approximately100% or up to the maximum amount of such dividends allowable pursuant to the Internal Revenue Code, as qualified dividend income eligible forareduced tax rate.
Qualified Business Income. The Fund designates approximately 0% of its ordinary income dividends, or up to the maximum amount of such dividends allowable pursuant to the Internal Revenue Code, as qualified business income.
Dividends Received Deduction. Corporate shareholders are generally entitled to take the dividends received deduction on the portion of the Fund’s dividend distribution that qualifies under tax law. For the Fund’s calendar year 2019 ordinary income dividends,100% qualifies for the corporate dividends received deduction.
For the year ended October 31, 2019, the Fund designated $6,820,380 as long-term capital gain distributions.
23
TRUSTEES AND OFFICERS – (Unaudited)
The Board of Trustees supervises the business activities of the Trust. Each Trustee serves as a trustee until termination of the Trust unless the Trustee dies, resigns, retires or is removed.
The following table provides information regarding each of the Independent Trustees.
Name, Address*, Age,
Position with Trust**,
Term of Position with Trust | Principal Occupation During
Past 5 Years and Other Directorships | Other Directorships |
Andrea N. Mullins, 52
Independent Trustee Since December 2013 Chairperson since March 2017 | Current: Private investor; Independent Contractor, SWM Advisors (since April 2014). | Trustee, Angel Oak Funds Trust (since February 2019) (4 portfolios); Trustee, Angel Oak Strategic Credit Fund (since February 2019). |
Ira P. Cohen,60
Independent Trustee
Since June 2010 | Current:Independent financial services consultant (since February 2005); Executive Vice President of Asset Management Services, Recognos Financial (since August 2015). | Trustee and Audit Committee Chairman, Griffin Institutional Access Credit Fund (since January 2017); Trustee and Audit Committee Chairman, Griffin Institutional Real Estate Access Fund (since May 2014); Trustee, Angel Oak Funds Trust (since October 2014) (4 portfolios) Trustee, Chairman, and Nominating and Governance Committee Chairman, Angel Oak Strategic Credit Fund (since December 2017). |
The following table provides information regarding the Trustee who is considered an “interested person” of the Trust, as that term is defined under the 1940 Act. Based on the experience of the Trustee, the Trust concluded that the individual described below should serve as a Trustee.
Name, Address*, Age,
Position with Trust**,
Term of Position with Trust | Principal Occupation During
Past 5 Years | Other Directorships |
Mark J. Seger, 57
Trustee Since March 2017 | Current:Vice Chairman of Ultimus Fund Solutions, LLC (since 1999). Previous: Managing Director and Co-Chief Executive Officer of Ultimus Fund Solutions, LLC (since 1999). | None. |
* | The address for each Trustee is 225 Pictoria Drive, Suite 450, Cincinnati, Ohio 45246. |
** | As of the date of this report, the Trust consists of 12 series. |
24
The following table provides information regarding the Officers of the Trust:
Name, Address*, Age,
Position with Trust**,
Term of Position with Trust | Principal Occupation During
Past 5 Years | Other Directorships |
Adam T. Kornegay, 34
Principal Executive Officer and President Since April 2018 | Current: Assistant Vice President, Business Development Director, Ultimus Fund Solutions, LLC (since March 2015). Previous: Vice President, Citigroup, Inc. (July 2009 to February 2015). | None. |
Gregory T. Knoth, 49
Principal Financial Officer and Treasurer Since April 2019 | Current: Vice President, Mutual Fund Controller, Ultimus Fund Solutions, LLC (sinceJanuary 2016). Previous: Vice President and Manager of Fund Accounting, Huntington Asset Services, Inc. (n/k/a Ultimus Asset Services, LLC) (June 2013 to December 2015). | None. |
Martin R. Dean, 56
Interim Chief Compliance Officer Since May 2019 | Current: Vice President, Director of Fund Compliance of Ultimus Fund Solutions, LLC (since January 2016) Previous: Senior Vice President and Compliance Group Manager, Huntington Asset Services, Inc. (n/k/a Ultimus Asset Services, LLC) (July 2013 to December 2015). | None. |
Carol J. Highsmith,55
Vice President
Since August 2008 Secretary Since March 2014 | Current: Assistant Vice President, Ultimus Fund Solutions, LLC (sinceJanuary 2016). Previous: Employed in various positions with Huntington Asset Services, Inc. (n/k/a Ultimus Asset Services, LLC) (November 1994 to December 2015), most recently Vice President of Legal Administration (2005 to December 2015). | None. |
* | The address for each officer is 225 Pictoria Drive, Suite 450, Cincinnati, Ohio 45246. |
** | As of the date of this report, the Trust consists of 12 series. |
OTHER INFORMATION – (Unaudited)
The Fund’s Statement of Additional Information (“SAI”) includes additional information about the trustees and is available without charge, upon request. You may call toll-free at (888) 695-3729 to request a copy of the SAI or to make shareholder inquiries.
25
FACTS | WHAT DOES GREEN OWL INTRINSIC VALUE FUND (THE “FUND”) DO WITH YOUR PERSONAL INFORMATION? |
| | |
Why? | Financial companies choose how they share your personal information. Federal law gives consumers the right to limit some but not all sharing. Federal law also requires us to tell you how we collect, share, and protect your personal information. Please read this notice carefully to understand what we do. |
| | |
What? | The types of personal information we collect and share depend on the product or service you have with us. This information can include: ■ Social Security number ■ account balances and account transactions ■ transaction or loss history and purchase history ■ checking account information and wire transfer instructions When you are no longer our customer, we continue to share your information as described in this notice. |
| | |
How? | All financial companies need to share customers’ personal information to run their everyday business. In the section below, we list the reasons financial companies can share their customers’ personal information; the reasons the Fund chooses to share; and whether you can limit this sharing. |
| | |
Reasons we can share your personal information | Does the Fund share? |
For our everyday business purposes—
such as to process your transactions, maintain your account(s), respond to court orders and legal investigations, or report to credit bureaus | Yes |
For our marketing purposes—
to offer our products and services to you | No |
For joint marketing with other financial companies | No |
For our affiliates’ everyday business purposes—
information about your transactions and experiences | No |
For our affiliates’ everyday business purposes—
information about your creditworthiness | No |
For nonaffiliates to market to you | No |
| | |
Questions? | Call (888) 695-3729 |
26
Who we are |
Who is providing this notice? | Green Owl Intrinsic Value Fund Unified Financial Securities, LLC (Distributor) Ultimus Fund Solutions, LLC (Administrator) |
What we do |
How does the Fund
protect my personal information? | To protect your personal information from unauthorized access and use, we use security measures that comply with federal law. These measures include computer safeguards and secured files and buildings. Our service providers are held accountable for adhering to strict policies and procedures to prevent any misuse of your nonpublic personal information. |
How does the Fund
collect my personal information? | We collect your personal information, for example, when you ■ open an account or deposit money ■ buy securities from us or sell securities to us ■ make deposits or withdrawals from your account or provide account information ■ give us your account information ■ make a wire transfer ■ tell us who receives the money ■ tell us where to send the money ■ show your government-issued ID ■ show your driver’s license |
Why can’t I limit all sharing? | Federal law gives you the right to limit only ■ sharing for affiliates’ everyday business purposes—information about your creditworthiness ■ affiliates from using your information to market to you ■ sharing for nonaffiliates to market to you State laws and individual companies may give you additional rights to limit sharing. |
Definitions |
Affiliates | Companies related by common ownership or control. They can be financial and nonfinancial companies. ■ Kovitz Investment Group Partners, LLC, the investment adviser to the Fund, could be deemed to be an affiliate. |
Nonaffiliates | Companies not related by common ownership or control. They can be financial and nonfinancial companies. ■ The Fund does not share your personal information with nonaffiliates so they can market to you. |
Joint marketing | A formal agreement between nonaffiliated financial companies that together market financial products or services to you. ■ The Fund doesn’t jointly market. |
27
This page intentionally left blank.
This page intentionally left blank.
PROXY VOTING
A description of the policies and procedures that the Fund uses to determine how to vote proxies relating to portfolio securities and information regarding how the Fund voted those proxies during the most recent twelve month period ended June 30, is available (1) without charge upon request by calling the Fund at (888) 695-3729 and (2) in Fund documents filed with the Securities and Exchange Commission (“SEC”) on the SEC’s website at www.sec.gov.
TRUSTEES Andrea N. Mullins, Chairperson Ira P. Cohen Mark J. Seger OFFICERS Adam T. Kornegay, Principal Executive Officer and President Gregory T. Knoth, Principal Financial Officer and Treasurer Martin R. Dean, Interim Chief Compliance Officer Carol J. Highsmith, Vice President and Secretary INVESTMENT ADVISER Kovitz Investment Group Partners, LLC 115 South LaSalle Street, 27th Floor Chicago, IL 60603 DISTRIBUTOR Unified Financial Securities, LLC 9465 Counselors Row, Suite 200 Indianapolis, IN 46240 | INDEPENDENT REGISTERED PUBLIC ACCOUNTING FIRM Cohen & Company, Ltd. 1350 Euclid Avenue, Suite 800 Cleveland, OH 44115 LEGAL COUNSEL Stradley Ronon Stevens & Young, LLP 2005 Market Street, Suite 2600 Philadelphia, PA 19103 CUSTODIAN Huntington National Bank 41 South High Street Columbus, OH 43215 ADMINISTRATOR, TRANSFER AGENT AND FUND ACCOUNTANT Ultimus Fund Solutions, LLC 225 Pictoria Drive, Suite 450 Cincinnati, OH 45246 |
This report is intended only for the information of shareholders or those who have received the Fund’s prospectus which contains information about the Fund’s management fee and expenses. Please read the prospectus carefully before investing.
Distributed by Unified Financial Securities, LLC
Member FINRA/SIPC

SOUND MIND INVESTING FUND (SMIFX)
SMI DYNAMIC ALLOCATION FUND (SMIDX)
SMI 50/40/10 FUND (SMILX)
ANNUAL REPORT |
OCTOBER 31, 2019 |
Beginning on January 1, 2021, as permitted by regulations adopted by the Securities and Exchange Commission, paper copies of the Funds’ shareholder reports like this one will no longer be sent by mail, unless you specifically request paper copies of the reports from the Funds or from your financial intermediary such as a broker-dealer or bank. Instead, the reports will be made available on a website, and you will be notified by mail each time a report is posted and provided with a website link to access the report.
If you already elected to receive shareholder reports electronically, you will not be affected by this change and you need not take any action. You may elect to receive shareholder reports and other communications from the Funds electronically by contacting the Funds at (877) 764-3863 or, if you own these shares through a financial intermediary, you may contact your financial intermediary.
You may elect to receive all future reports in paper free of charge. You can inform the Funds that you wish to continue receiving paper copies of your shareholder reports by contacting the Funds at (877) 764-3863. If you own shares through a financial intermediary, you may contact your financial intermediary or follow instructions included with this document to elect to continue to receive paper copies of your shareholder reports. Your election to receive reports in paper will apply to all funds held with the fund complex or at your financial intermediary.
Funds’ Adviser:
SMI Advisory Services, LLC
4400 Ray Boll Blvd.
Columbus, IN 47203
(877) 764-3863
(877) SMI-FUND
www.smifund.com

Dear Fellow Shareholder,
The major financial trends of the 12-month period ended October 31, 2019 were driven primarily by a dramatic shift in policy direction by the Federal Reserve (the “Fed”).
In mid-December 2018, with economic reports still looking strong but the financial markets showing signs of weakness, investors were hoping the Fed would scale back their aggressive plans for additional rate hikes in 2019, while simultaneously shrinking its massive balance sheet. Instead, Fed Chairman Jerome Powell poked investors in the eye by saying there was no intention of scaling back those plans. Many initially interpreted this statement as a sign that the Fed was no longer going to respond to every whim of the financial markets, as has largely been the case since the global financial crisis in 2008. As soon as Powell’s plan to stay the course hit investors’ ears, the stock market started falling and was on the verge of bear-market territory by Christmas Eve.
As 2019 began, the stock market resumed its downside trajectory and a bear market seemed imminent. But on January 4, a mere three weeks after his previous comments, Chairman Powell reversed course by announcing the Fed actually was paying close attention to the financial markets, and that they were pausing their interest-rate hikes and balance-sheet reduction plans.
The response to this news was just as dramatic as the reaction had been weeks earlier. Investors heard, “The Fed still has our back!” and the stock market began to party like it was (literally) 1999 again.
The stock market began 2019 with one of its best first quarters ever. But by May, trade concerns started to weigh on the market and the S&P 500® Index (“S&P 500”) sold off over -6%. That’s when the Fed’s “temporary pause” in hiking interest rates transformed into a “mid-cycle adjustment” of what was presumed to be a single rate cut on July 31.
That expectation was short-lived, however, as more trade war headlines immediately pushed stocks lower in August. Expectations of another Fed rate cut grew rapidly and the Fed delivered with additional quarter-point rate cuts in September and October. The European Central Bank also joined in, lowering their already negative base interest rate and re-starting their Quantitative Easing program.
If that wasn’t enough to digest, in September, the Fed started “temporary operations” to address “seasonal bottlenecks” in the overnight bank lending market (Repo). When these measures weren’t sufficient to smooth out the problems in the financial plumbing, the Fed restarted their own QE program (while insisting it wasn’t QE) by purchasing $60 billion of Treasury Bills per month starting in October.
1
I’ve written further about each of these components in other venues throughout 2019, but let’s quickly recap. At the end of 2018, the Fed was expecting further rate hikes and balance sheet reduction in 2019. We ended up getting three rate cuts and balance sheet expansion instead.
This is relevant not just in terms of the performance of the financial markets and the SMI strategies over the past 12 months, but in terms of what we should expect moving forward into 2020. As 2019 is coming to a close, Fed Chairman Powell is on record as expecting a pause in rate cuts, as today’s economy appears to be “a pretty sustainable picture.” But given the huge gap between expectations a year ago and the actions that rapidly unfolded, those expectations should be small comfort to investors.
What Should Investors Do Now?
In many respects, our position is much the same as it was a year ago — “dancing with one eye on the exit door.” Thankfully, that’s easy to do using a blended portfolio of SMI’s strategies that emphasize bear market protection. As trend-followers, SMI’s strategy is not to position our portfolios dramatically more conservatively in advance of the market turning lower. Instead, we stay invested and follow the market’s own price clues via our momentum strategies.
This approach is what allows us to harvest the majority of late-cycle bull market gains, as we have the past few years (over the past three years, the S&P 500 has gained +12.10% annualized, while SMIFX is up +9.07% with far greater diversification). But at the same time, we know the strictly defined mechanical triggers built into our primary strategies (Stock Upgrading and Dynamic Asset Allocation) will force us out of our riskiest positions as market prices demonstrate that its trend has changed. This gives us confidence to stay invested and follow our plan, despite high valuations and other apparent risks.
So while we don’t know when the market will zig, zag, or eventually roll over into a full-blown bear market, we continue to advocate the following three steps for investing in what certainly appears to us to be a late-cycle bull market:
| | 1. | Stay Invested — this assumes you’re using an appropriate blend of SMI’s strategies for your risk tolerance and season of life, with a particular emphasis on those SMI strategies that include defensive properties (Dynamic Asset Allocation and Stock Upgrading). |
| | 2. | Have Reasonable Expectations — understand what you own and what’s reasonable to expect from each portfolio component. Taking big risks late in a bull market cycle can produce exciting gains—until the bear market actually arrives, at which point those gains can be erased with remarkable speed. |
| | 3. | Play Good Defense — we believe that opting for a reasonable blend of strategies designed to participate in some of the market’s gains while emphasizing portfolio defense is a sound approach, especially late in a bull market cycle. But you shouldn’t expect that type of portfolio to keep up with the hottest 100% stock market index while the market is continuing higher. Stay patient and remember that defensive portfolios need to be measured over full market cycles (which include both bull and bear markets) for their value to be evident. |
2
Performance Review
SMI’s Stock Upgrading strategy (used in both SMIFX and SMILX) had an unusually hard landscape to navigate over the past 12 months. Trend-following strategies, like Stock Upgrading, are always vulnerable to sharp changes in the market’s primary trends. As we’ve discussed, the Fed’s actions prompted multiple sharp swings of that nature during this period, which negatively impacted Stock Upgrading’s performance.
Most noteworthy among those swings was the deep decline in the closing months of 2018, as the market initially interpreted the Fed’s stance as an indication they would not be intervening on the market’s behalf. While we personally would prefer that approach, the market fell fast and hard, to the degree that Upgrading’s rarely-implemented defensive protocols triggered in December. With that “de-risking” process underway, Upgrading was poorly positioned for the immediate reversal of the Fed’s position in early January, which sent the market soaring. Thankfully, Upgrading’s defensive protocols are phased in and had only been partially deployed.
In addition to the timing difficulties presented in late-2018 and early 2019, it’s important to recognize that returns of large-company stocks over the past 12 months far exceeded those of smaller-company and foreign stocks. Large-company U.S. stocks (Wilshire 5000® Total Markets Index) gained +13.48%, but small-company stock (Russell 2000® Index) gains were far less at just +4.91%. Given that Stock Upgrading provides a diversified portfolio that includes substantial small-company and foreign stock exposure, this diversification hurt the performance of the SMIFX and SMILX during this specific time period.
All of these factors combined to limit SMIFX’s gain to +4.28% over the period. It was a disappointing result, but not entirely surprising given the sudden selloff/recovery pattern repeating in December/January, May/June, and to a lesser extent August/September. That type of choppy market is always going to be challenging for Upgrading.
We remain confident that the enhancement of the Fund’s “offensive” capabilities via the more aggressive funds we’ve added to our available fund universe in recent years, plus the newer “defensive” protocols built into the Upgrading system, should put the Fund in position to produce competitive returns through the completion of the market cycle. Both of these are newer wrinkles added within the past few years, and both detracted from the Funds’ performance during this specific period. But we have reason to think this will be the exception rather than the rule and that both will ultimately prove to be additive to the Funds’ long-term performance.
SMI’s Dynamic Asset Allocation (DAA) strategy (used in both SMIDX and SMILX) performed better than Upgrading during the past year. SMIDX, which is our pure DAA fund, gained 5.97% over the twelve month period. The silver lining in DAA’s performance was that it shined in its role as a portfolio diversifier during both of the period’s primary stock downturns.
Following the massive head fake at the end of 2018, DAA had no stock exposure through the first quarter of 2019, and only had as much as one-third of the portfolio allocated to stocks at any point during 2019. Instead, DAA’s returns came primarily from Gold and Long-term Bonds, with Real Estate also contributing positive performance. So investors in DAA experienced a significant diversification benefit. This was particularly evident in May when stocks fell -6.4% but SMIDX was down less than -0.9%.
3
Dynamic Asset Allocation is primarily a defensive strategy that stands out during periods of market weakness. We’ve had many years of strong stock index returns since the last bear market, but we remain confident that SMIDX will close the performance gap and look much more favorable relative to its benchmarks over the completion of the market cycle. Barring the Fed’s January intervention, we might have witnessed that more powerfully this past year. Eventually, we think such interventions and efforts to hold the next recession/bear market at bay will fail, as such efforts always have eventually, and the performance record will strongly revert in favor of DAA and the funds that utilize it.
SMI’s 50/40/10 portfolio (used in SMILX) consists of 50% DAA, 40% Stock Upgrading, and 10% in a strategy called Sector Rotation. Having already discussed the results of DAA and Upgrading above, the remaining 10% of the fund is invested in Sector Rotation, which had its worst relative performance during the past 12 months of any stretch since this bull market began in 2009. As we’ve discussed previously, while Sector Rotation is a relatively new strategy to the SMI Funds (SMILX has used it as 10% of its portfolio since 2015), this strategy has a long, successful history with the SMI newsletter, where it has been featured as a live strategy since 2003. Despite gaining +10.51% in 2019 (through 10/31/2019), SMILX’s total return for the full 12-month period was just +3.55%, showing how strongly the events of last November and December impacted performance.
While overall performance from all three SMI Funds was below our expectations, it’s important to keep a big-picture perspective. Being insulated against the potential of a market decline is crucial at this point in the stock-market cycle. We know markets are cyclical, and unfortunately the strong gains of recent years don’t make stocks less risky; they actually become more vulnerable the further valuations get stretched. That is why SMI continues to make DAA a core part of our portfolios, including SMILX.
Importantly, all of the SMI Funds are quantitative approaches utilizing strategies supported by extensive testing and, with the exception of DAA, long actual performance histories. We don’t believe that the fundamental dynamics of the market have changed in a way that will make these strategies ineffective in the future, so we continue to stick with these disciplined approaches even as the current market dynamic tests our faith and patience.
This isn’t the first time the performance of diversified, disciplined investing approaches have lagged those of the market’s largest stocks. We had another vivid example of this in the late 1990s, a period that resolved with a bruising bear market and a decline of -50%-80% for many of the market’s leaders. Stock Upgrading held up much better than the market during that early 2000’s bear market and posted some of its strongest relative performance during the years that followed.
The bullish “extend-and-pretend” games of the world’s central banks don’t appear sustainable to us, and we believe our disciplined strategies will provide a safe haven and source of superior performance as the bear side of the market cycle eventually comes to fruition.
4
We understand that following a framework can be difficult for even the most disciplined investor during these unprecedented situations. If you would like help evaluating your risk tolerance or understanding how the SMI strategies can be customized to your individual situation, please contact us at (800) 796-4975. We appreciate the opportunity to serve you!
Blessings,

Mark Biller
Senior Portfolio Manager
The Sound Mind Investing Funds
The SMI Fund lineup, shown below, now offers investors a way to mix and match professionally managed funds to custom tailor the risk level desired for their portfolio. If you’d like assistance customizing your portfolio in this manner, please call a Stewardship Advisor at (800) 796-4975.
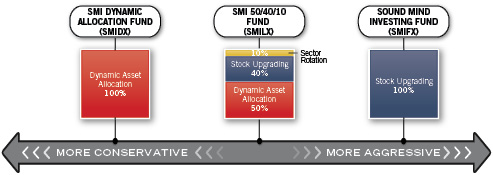
5
PERFORMANCE RESULTS – (Unaudited)
Average Annual Total Returns(a)
(For the periods ended October 31, 2019) |
| | Three
Months | Six Months | One Year | Five Year | Ten Year |
Sound Mind Investing Fund | -0.31% | 1.15% | 4.28% | 5.50% | 9.17% |
Wilshire 5000® Total Market Index(b) | 1.92% | 3.42% | 13.48% | 10.46% | 13.62% |
S&P 500® Index(b) | 2.43% | 4.16% | 14.33% | 10.78% | 13.70% |
SMI Custom Index(c) | 1.43% | 1.75% | 9.85% | 8.14% | 11.58% |
Total annual operating expenses, as disclosed in the Sound Mind Investing Fund’s (“SMI Fund”) prospectus dated February 28, 2019, were 2.04% of average daily net assets, which includes acquired fund fees and expenses. All expenses are reflected in performance results. SMI Advisory Services, LLC (the “Adviser”) contractually has agreed to waive its fee and/or reimburse certain operating expenses, but only to the extent necessary so that total annual operating expenses (excluding interest, taxes, brokerage commissions, other expenses which are capitalized in accordance with generally accepted accounting principles, extraordinary expenses, dividend expense on short sales, 12b-1 fees, and acquired fund fees and expenses) do not exceed 1.50% of the SMI Fund’s average daily net assets through February 29, 2020. Each waiver or reimbursement of an expense by the Adviser is subject to repayment by the SMI Fund within the three years following the date of such waiver or reimbursement, provided that the SMI Fund is able to make the repayment without exceeding the expense limitation in place at the time of the fee waiver or reimbursement and the expense limitation at the time of the repayment. This expense cap may not be terminated prior to this date except by the Board of Trustees (the “Board”). |
Average Annual Total Returns(a)
(For the periods ended October 31, 2019) |
| | Three
Months | Six Months | One Year | Five Year | Since Inception
(February 28, 2013) |
SMI Dynamic Allocation Fund | 3.84% | 6.01% | 5.97% | 1.92% | 4.26% |
Wilshire 5000® Total Market Index(b) | 1.92% | 3.42% | 13.48% | 10.46% | 12.93% |
Bloomberg Barclays U.S. Aggregate Bond Index(b) | 2.35% | 5.71% | 11.51% | 3.24% | 2.89% |
Weighted Index(c) | 2.13% | 4.50% | 13.16% | 7.73% | 9.00% |
Total annual operating expenses, as disclosed in the SMI Dynamic Allocation Fund’s prospectus dated February 28, 2019, were 1.32% of average daily net assets, which includes acquired fund fees and expenses. All expenses are reflected in performance results. The Adviser contractually has agreed to waive its fee and/or reimburse certain operating expenses, but only to the extent necessary so that total annual operating expenses (excluding interest, taxes, brokerage commissions, other expenses which are capitalized in accordance with generally accepted accounting principles, extraordinary expenses, dividend expense on short sales, 12b-1 fees, and acquired fund fees and expenses) do not exceed 1.45% of the SMI Dynamic Allocation Fund’s average daily net assets through February 29, 2020. Each waiver or reimbursement of an expense by the Adviser is subject to repayment by the SMI Dynamic Allocation Fund within the three years following the date of such waiver or reimbursement, provided that the SMI Dynamic Allocation Fund is able to make the repayment without exceeding the expense limitation in place at the time of the fee waiver or reimbursement and the expense limitation at the time of the repayment. This expense cap may not be terminated prior to this date except by the Board. |
6
PERFORMANCE RESULTS – (Unaudited), (Continued)
Average Annual Total Returns(a)
(For the periods ended October 31, 2019) |
| | Three
Months | Six Months | One Year | Since Inception
(April 29, 2015) |
SMI 50/40/10 Fund | 1.50% | 2.71% | 3.55% | 3.04% |
Wilshire 5000® Total Market Index(b) | 1.92% | 3.42% | 13.48% | 10.28% |
Bloomberg Barclays U.S. Aggregate Bond Index(b) | 2.35% | 5.71% | 11.51% | 3.12% |
Weighted Index(c) | 2.13% | 4.50% | 13.16% | 7.58% |
Total annual operating expenses, as disclosed in the SMI 50/40/10 Fund’s prospectus dated February 28, 2019, were 1.57% of average daily net assets (1.78% before fee waivers/expense reimbursements by the Adviser), which includes acquired fund fees and expenses. All expenses are reflected in performance results. The Adviser contractually has agreed to waive its fee and/or reimburse certain expenses, but only to the extent necessary so that total annual operating expenses (excluding interest, taxes, brokerage commissions, other expenses which are capitalized in accordance with generally accepted accounting principles, extraordinary expenses, dividend expense on short sales, 12b-1 fees, and acquired fund fees and expenses) do not exceed 1.15% of the SMI 50/40/10 Fund’s average daily net assets through February 29, 2020. Each waiver or reimbursement of an expense by the Adviser is subject to repayment by the SMI 50/40/10 Fund within the three years following the date of such waiver or reimbursement, provided that the SMI 50/40/10 Fund is able to make the repayment without exceeding the expense limitation in place at the time of the fee waiver or reimbursement and the expense limitation at the time of the repayment. This expense cap may not be terminated prior to this date except by the Board. |
The performance quoted represents past performance, which does not guarantee future results. The investment return and principal value of an investment will fluctuate so that an investor’s shares, when redeemed, may be worth more or less than their original cost. The returns shown do not reflect deduction of taxes that a shareholder would pay on Fund distributions or the redemption of Fund shares. Current performance of the Sound Mind Investing Fund, SMI Dynamic Allocation Fund, and SMI 50/40/10 Fund (each a “Fund” and collectively the “Funds”) may be lower or higher than the performance quoted. Performance data current to the most recent month end may be obtained by calling (877) 764-3863.
(a) | Average annual total returns reflect any change in price per share and assume the reinvestment of all distributions. The Funds’ returns reflect any fee reductions during the applicable periods. If such fee reductions had not occurred, the quoted performance would have been lower. Total returns for periods less than one year are not annualized. |
(b) | The Standard & Poor’s 500® Index (“S&P 500”), Wilshire 5000® Total Market Index (“Wilshire 5000”), Bloomberg Barclays U.S. Aggregate Bond Index, Russell 1000® Value Index, Russell 1000® Growth Index, Russell 2000® Value Index, Russell 2000® Growth Index and MSCI EAFE Index (collectively, the “Indices”) are unmanaged indices that assume reinvestment of all distributions and exclude the effect of taxes and fees. These Indices are widely recognized unmanaged indices and are representative of a broader market and range of securities than is found in each Fund’s portfolio. The returns of the Indices are not reduced by any fees or operating expenses. Individuals cannot invest directly in the Indices; however, an individual can invest in exchange-traded funds or other investment vehicles that attempt to track the performance of a benchmark index. |
(c) | The SMI Custom Index for the Sound Mind Investing Fund is comprised of 20% Russell 1000® Value Index, 20% Russell 1000® Growth Index, 20% Russell 2000® Value Index, 20% Russell 2000® Growth Index and 20% MSCI EAFE Index and the Weighted Index for the SMI Dynamic Allocation Fund and the SMI 50/40/10 Fund is comprised of 60% Wilshire 5000 and 40% Bloomberg Barclays U.S. Aggregate Bond Index. |
The Funds’ investment objectives, risks, charges and expenses must be considered carefully before investing. The prospectus contains this and other important information about the Funds and may be obtained by calling the same number as above. Please read it carefully before investing.
7
PERFORMANCE RESULTS – (Unaudited), (Continued)
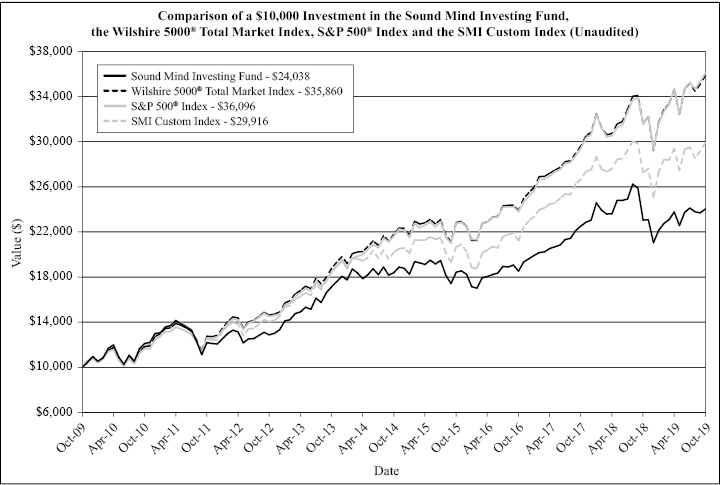
The chart above assumes an initial investment of $10,000 made on October 31, 2009 and held through October 31, 2019. THE FUND’S RETURN REPRESENTS PAST PERFORMANCE AND DOES NOT GUARANTEE FUTURE RESULTS. The returns shown do not reflect deduction of taxes that a shareholder would pay on Fund distributions or the redemption of Fund shares. Investment returns and principal values will fluctuate so that your shares, when redeemed, may be worth more or less than their original purchase price.
Current performance of the Fund may be lower or higher than the performance quoted. For more information on the Fund, and to obtain performance data current to the most recent month end or to request a prospectus, please call (877) 764-3863. You should carefully consider the investment objectives, potential risks, management fees, and charges and expenses of the Fund before investing. The Fund’s prospectus contains this and other information about the Fund, and should be read carefully before investing.
The SMI Custom Index for the Sound Mind Investing Fund is comprised of 20% Russell 1000® Value Index, 20% Russell 1000® Growth Index, 20% Russell 2000® Value Index, 20% Russell 2000® Growth Index and 20% MSCI EAFE Index.
The Fund is distributed by Unified Financial Securities, LLC, member FINRA/SIPC.
8
PERFORMANCE RESULTS – (Unaudited), (Continued)
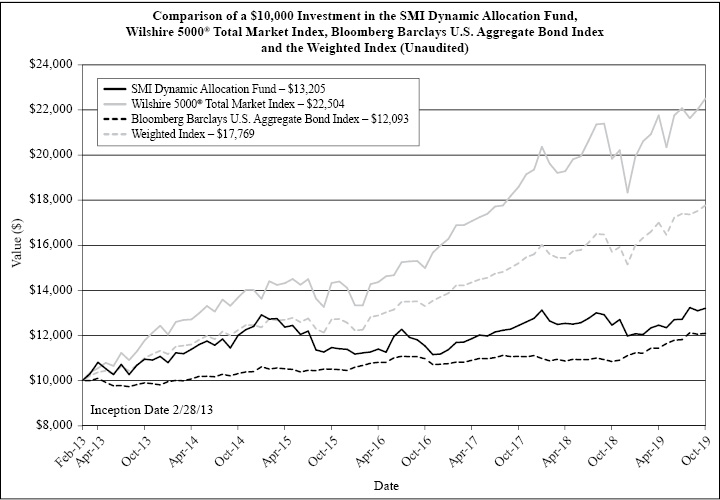
The chart above assumes an initial investment of $10,000 made on February 28, 2013 (commencement of Fund operations) and held through October 31, 2019. THE FUND’S RETURN REPRESENTS PAST PERFORMANCE AND DOES NOT GUARANTEE FUTURE RESULTS. The returns shown do not reflect deduction of taxes that a shareholder would pay on Fund distributions or the redemption of Fund shares. Investment returns and principal values will fluctuate so that your shares, when redeemed, may be worth more or less than their original purchase price.
Current performance of the Fund may be lower or higher than the performance quoted. For more information on the Fund, and to obtain performance data current to the most recent month end or to request a prospectus, please call (877) 764-3863. You should carefully consider the investment objectives, potential risks, management fees, and charges and expenses of the Fund before investing. The Fund’s prospectus contains this and other information about the Fund, and should be read carefully before investing.
The Weighted Index is comprised of 60% Wilshire 5000® Total Market Index and 40% Bloomberg Barclays U.S. Aggregate Bond Index.
The Fund is distributed by Unified Financial Securities, LLC, member FINRA/SIPC.
9
PERFORMANCE RESULTS – (Unaudited), (Continued)
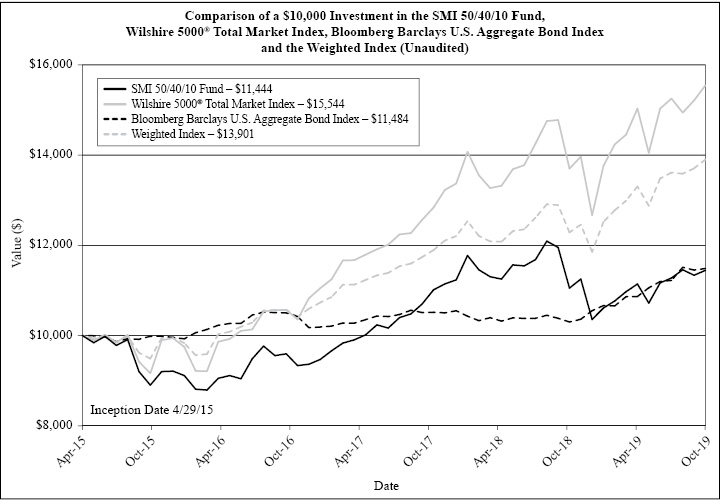
The chart above assumes an initial investment of $10,000 made on April 29, 2015 (commencement of Fund operations) and held through October 31, 2019. THE FUND’S RETURN REPRESENTS PAST PERFORMANCE AND DOES NOT GUARANTEE FUTURE RESULTS. The returns shown do not reflect deduction of taxes that a shareholder would pay on Fund distributions or the redemption of Fund shares. Investment returns and principal values will fluctuate so that your shares, when redeemed, may be worth more or less than their original purchase price. The information presented above, for the periods prior to April 28, 2018 is historical information for the Former SMI 50/40/10 Fund.
Current performance of the Fund may be lower or higher than the performance quoted. For more information on the Fund, and to obtain performance data current to the most recent month end or to request a prospectus, please call (877) 764-3863. You should carefully consider the investment objectives, potential risks, management fees, and charges and expenses of the Fund before investing. The Fund’s prospectus contains this and other information about the Fund, and should be read carefully before investing.
The Weighted Index is comprised of 60% Wilshire 5000® Total Market Index and 40% Bloomberg Barclays U.S. Aggregate Bond Index.
The Fund is distributed by Unified Financial Securities, LLC, member FINRA/SIPC.
10
FUND HOLDINGS – (Unaudited)
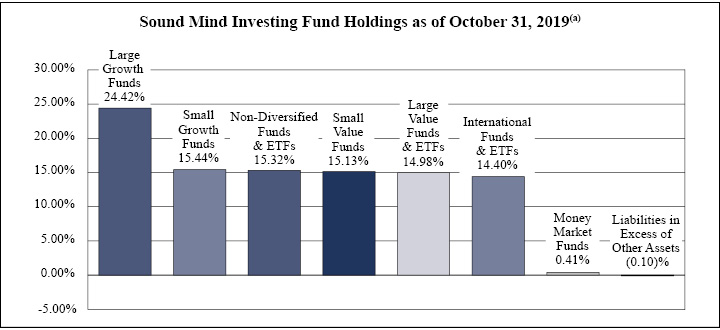
(a) | As a percentage of net assets. |
Sound Mind Investing Fund seeks long-term capital appreciation. The Fund seeks to achieve its objective by investing in a diversified portfolio of other investment companies using a “Stock Upgrading” strategy. The Stock Upgrading investment strategy is a systematic investment approach that is based on the belief of the Adviser that superior returns can be obtained by constantly monitoring the performance of a wide universe of other investment companies, and standing ready to move assets into the funds deemed by the Adviser to be most attractive at the time of analysis.
11
FUND HOLDINGS – (Unaudited), (Continued)
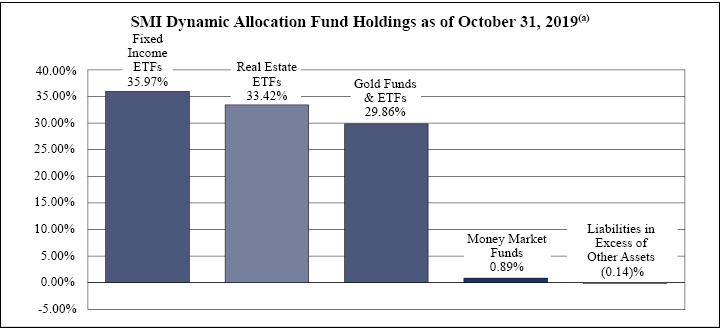
(a) | As a percentage of net assets. |
SMI Dynamic Allocation Fund seeks total return. Total return is composed of both income and capital appreciation. The Fund uses a Dynamic Asset Allocation investment strategy to achieve its investment objective. This is done by investing in securities from the following six asset classes – U.S. Equities, International Equities, Fixed Income Securities, Real Estate, Precious Metals, and Cash.
12
FUND HOLDINGS – (Unaudited), (Continued)

(a) | As a percentage of net assets. |
SMI 50/40/10 Fund seeks total return. Total return is composed of both income and capital appreciation. The Adviser allocates the Fund’s assets on a 50/40/10 basis among various investment strategies as follows:
| | ● | 50% - Dynamic Asset Allocation Strategy (“DAA”) |
| | ● | 40% - Stock Upgrading Strategy |
| | ● | 10% - Sector Rotation Strategy |
The Sector Rotation Strategy involves the Adviser selecting from a universe of mutual funds and exchange-traded funds (“ETFs”) it has compiled using proprietary methods. This universe is specifically designed by the Adviser to balance exposure to a wide variety of market sectors and industries. This universe includes leveraged, non-leveraged funds and inverse underlying funds. The Adviser ranks these funds based on their recent performance across multiple short-term performance periods, then uses an upgrading approach to invest in the top performing market sector or sectors. Once a particular sector or sectors is identified, the Adviser purchases one or more mutual funds or ETFs to gain the desired exposure to that particular sector. This portion of the Fund may be concentrated, meaning that the Fund may be invested in as few as one or two sectors at a time and potentially as few as one underlying mutual fund or ETF.
Availability of Portfolio Schedules – (Unaudited)
Each Fund files its complete schedule of portfolio holdings with the Securities and Exchange Commission (“SEC”) for the first and third quarters of each fiscal year within sixty days after the end of the period. The Funds’ portfolio holdings are available at the SEC’s website at www.sec.gov.
13
SOUND MIND INVESTING FUND
SCHEDULE OF INVESTMENTS
October 31, 2019
MUTUAL FUNDS – 73.40% | | Shares | | | Fair Value | |
Aberdeen Realty Income & Growth Fund, Institutional Class | | | 92,651 | | | $ | 1,669,575 | |
Akre Focus Fund, Institutional Class | | | 213,788 | | | | 9,823,574 | |
Allianz NFJ Dividend Value Fund, Institutional Class | | | 200 | | | | 2,506 | |
Allianz NFJ Small-Cap Value Fund, Institutional Class | | | 162 | | | | 2,834 | |
American Century Equity Income Fund, Investor Class | | | 100 | | | | 925 | |
American Century International Opportunities Fund, Institutional Class | | | 360 | | | | 3,633 | |
American Century Real Estate Fund, Investor Class | | | 53,081 | | | | 1,756,461 | |
AMG Yacktman Focused Fund, Institutional Class | | | 100 | | | | 2,008 | |
AMG Yacktman Fund, Institutional Class | | | 100 | | | | 2,133 | |
Artisan International Small Cap Fund, Investor Class | | | 150 | | | | 2,137 | |
Artisan International Value Fund, Investor Class | | | 150 | | | | 5,352 | |
Artisan Mid Cap Value Fund, Investor Class | | | 279 | | | | 5,563 | |
Artisan Small Cap Fund, Investor Class | | | 125 | | | | 4,219 | |
BlackRock International Opportunities Portfolio, Institutional Class | | | 100 | | | | 2,916 | |
BNY Mellon Opportunistic Small Cap Fund, Investor Shares | | | 100 | | | | 2,615 | |
Bridgeway Small-Cap Growth Fund, Class N | | | 205 | | | | 4,918 | |
Bridgeway Ultra-Small Company Market Fund, Class N | | | 100 | | | | 1,083 | |
Bright Rock Mid Cap Growth Fund, Institutional Class | | | 103,653 | | | | 2,102,073 | |
Buffalo Small Cap Fund, Inc. | | | 150 | | | | 2,055 | |
Champlain Small Company Fund, Institutional Class | | | 100 | | | | 2,044 | |
Chartwell Small Cap Value Fund | | | 118 | | | | 2,209 | |
Columbia Acorn International Fund, Class Z | | | 100 | | | | 3,348 | |
Columbia Acorn Select Fund, Class Z | | | 150 | | | | 2,078 | |
Columbia Contrarian Core Fund, Class Z | | | 91 | | | | 2,434 | |
Columbia Small Cap Growth Fund I, Class Z | | | 100 | | | | 2,062 | |
Davis Opportunity Fund, Class Y | | | 100 | | | | 3,412 | |
Delaware Select Growth Fund, Institutional Class | | | 100 | | | | 3,781 | |
Delaware Small Cap Value Fund, Institutional Class | | | 100 | | | | 6,326 | |
Delaware Value Fund, Institutional Class | | | 144 | | | | 3,157 | |
Deutsche Small Cap Core Fund, Institutional Class | | | 52 | | | | 1,471 | |
DFA International Small Cap Value Portfolio, Institutional Class | | | 100 | | | | 1,858 | |
DFA International Small Company Portfolio, Institutional Class | | | 100 | | | | 1,821 | |
DFA U.S. Small Cap Value Portfolio, Institutional Class | | | 100 | | | | 3,279 | |
Fairholme Fund | | | 100 | | | | 1,936 | |
Fidelity Advisor Growth Opportunities Fund, Institutional Class | | | 131,448 | | | | 12,066,918 | |
Fidelity International Capital Appreciation Fund | | | 246,259 | | | | 5,518,671 | |
Fidelity Mid-Cap Stock Fund | | | 150 | | | | 5,373 | |
Fidelity Real Estate Investment Portfolio | | | 31,924 | | | | 1,510,643 | |
Fidelity Select Construction and Housing Portfolio | | | 27,384 | | | | 1,772,049 | |
See accompanying notes which are an integral part of these financial statements.
14
SOUND MIND INVESTING FUND
SCHEDULE OF INVESTMENTS
October 31, 2019 – (Continued)
MUTUAL FUNDS – 73.40% – continued | | Shares | | | Fair Value | |
Fidelity Select Semiconductors Portfolio | | | 139,459 | | | $ | 1,591,227 | |
Fidelity Small Cap Discovery Fund | | | 100 | | | | 2,310 | |
Fidelity Small Cap Stock Fund | | | 150 | | | | 2,582 | |
Fidelity Small Cap Value Fund | | | 150 | | | | 2,238 | |
Franklin Small Cap Value Fund, Advisor Class | | | 100 | | | | 5,257 | |
Hartford International Opportunities Fund (The), Class Y | | | 248 | | | | 4,091 | |
Heartland Value Fund | | | 100 | | | | 3,753 | |
Hennessy Focus Fund, Institutional Class | | | 77,238 | | | | 6,783,805 | |
Hennessy Focus Fund, Investor Class | | | 50 | | | | 4,256 | |
Invesco Oppenheimer International Small-Mid Company Fund, Class Y | | | 100 | | | | 4,775 | |
Invesco Oppenheimer Mid Cap Value Fund, Class Y | | | 100 | | | | 5,197 | |
Ivy Mid Cap Income Opportunities Fund, Institutional Class | | | 461,016 | | | | 6,924,452 | |
Janus Henderson Contrarian Fund, Class T | | | 222,323 | | | | 4,879,989 | |
Janus Henderson Mid Cap Value Fund, Class T | | | 200 | | | | 3,134 | |
Janus Henderson Overseas Fund, Class T | | | 100 | | | | 3,225 | |
Janus Henderson Venture Fund, Class T | | | 100 | | | | 7,906 | |
JOHCM International Select Fund, Institutional Class | | | 100 | | | | 2,296 | |
JPMorgan Disciplined Equity Fund, Institutional Class | | | 100 | | | | 2,579 | |
JPMorgan Mid Cap Value Fund, Institutional Class | | | 100 | | | | 3,972 | |
JPMorgan Small Cap Equity Fund, Select Class | | | 100 | | | | 5,908 | |
JPMorgan Small Cap Growth Fund, Class L | | | 100 | | | | 1,951 | |
Lazard Global Listed Infrastructure Portfolio, Institutional Class | | | 499,219 | | | | 7,802,788 | |
Longleaf Partners Fund | | | 150 | | | | 3,005 | |
Longleaf Partners International Fund | | | 150 | | | | 2,606 | |
Longleaf Partners Small-Cap Fund | | | 100 | | | | 2,481 | |
Lord Abbett Developing Growth Fund, Inc., Institutional Class | | | 100 | | | | 2,771 | |
MainStay Mackay U.S. Equity Opportunities Fund, Institutional Class | | | 100 | | | | 862 | |
Morgan Stanley Growth Portfolio, Institutional Class | | | 100 | | | | 4,777 | |
Morgan Stanley Multi-Cap Growth Trust, Institutional Class | | | 100 | | | | 4,479 | |
Needham Growth Fund, Institutional Class | | | 67,223 | | | | 3,008,904 | |
Neuberger Berman Genesis Fund, Institutional Class | | | 100 | | | | 5,934 | |
Neuberger Berman Real Estate Fund, Institutional Class | | | 97,503 | | | | 1,494,728 | |
Nicholas Fund, Inc. | | | 50 | | | | 3,445 | |
Oakmark International Fund, Investor Class | | | 150 | | | | 3,620 | |
Oakmark International Small Cap Fund, Institutional Class | | | 150 | | | | 2,285 | |
Oakmark Select Fund, Institutional Class | | | 150 | | | | 6,042 | |
PIMCO StocksPLUS International Fund (U.S. Dollar Hedged), Institutional Class | | | 300,685 | | | | 2,390,449 | |
Polen Growth Fund, Institutional Class | | | 433,940 | | | | 14,159,450 | |
See accompanying notes which are an integral part of these financial statements.
15
SOUND MIND INVESTING FUND
SCHEDULE OF INVESTMENTS
October 31, 2019 – (Continued)
MUTUAL FUNDS – 73.40% – continued | | Shares | | | Fair Value | |
PRIMECAP Odyssey Aggressive Growth Fund | | | 100 | | | $ | 4,346 | |
Principal SmallCap Growth Fund I, Institutional Class | | | 200 | | | | 2,688 | |
ProFunds Real Estate UltraSector ProFund, Investor Class | | | 29,944 | | | | 1,674,780 | |
ProFunds Utilities UltraSector ProFund, Investor Class | | | 15,226 | | | | 918,882 | |
Royce Micro-Cap Fund, Investment Class | | | 106 | | | | 1,098 | |
Royce Opportunity Fund, Investment Class | | | 100 | | | | 1,180 | |
Royce Premier Fund, Investment Class | | | 300 | | | | 4,416 | |
Royce Special Equity Fund, Institutional Class | | | 150 | | | | 2,798 | |
Sextant International Fund, Investor Class | | | 120,185 | | | | 2,195,776 | |
Sterling Capital Stratton Real Estate Fund, Institutional Class | | | 38,765 | | | | 1,670,788 | |
T. Rowe Price International Discovery Fund | | | 75 | | | | 4,881 | |
T. Rowe Price Mid-Cap Growth Fund | | | 50 | | | | 4,719 | |
T. Rowe Price New Horizons Fund | | | 100 | | | | 6,190 | |
T. Rowe Price Small-Cap Value Fund | | | 100 | | | | 4,763 | |
Thornburg Value Fund, Institutional Class | | | 100 | | | | 7,550 | |
TIAA-CREF International Equity Fund, Institutional Class | | | 100 | | | | 1,106 | |
Touchstone Mid Cap Fund, Institutional Class | | | 179,965 | | | | 7,191,382 | |
Touchstone Sands Capital Select Growth Fund, Class Y | | | 100 | | | | 1,444 | |
Tweedy Browne Global Value Fund | | | 150 | | | | 4,175 | |
Value Line Mid Cap Focused Fund, Investor Class | | | 238,449 | | | | 5,930,228 | |
Vanguard Strategic Equity Fund, Investor Class | | | 100 | | | | 3,236 | |
Victory RS Small Cap Growth Fund, Class Y | | | 100 | | | | 7,947 | |
Wasatch Emerging Markets Small Cap Fund, Investor Class | | | 1,000 | | | | 2,840 | |
Wasatch International Growth Fund, Investor Class | | | 150 | | | | 4,446 | |
Wasatch International Opportunities Fund, Institutional Class | | | 878,596 | | | | 3,268,378 | |
Total Mutual Funds (Cost $100,515,731) | | | | | | | 108,375,016 | |
See accompanying notes which are an integral part of these financial statements.
16
SOUND MIND INVESTING FUND
SCHEDULE OF INVESTMENTS
October 31, 2019 – (Continued)
EXCHANGE-TRADED FUNDS – 26.29% | | Shares | | | Fair Value | |
Invesco Aerospace & Defense ETF | | | 24,310 | | | $ | 1,637,035 | |
Invesco DWA Utilities Momentum ETF | | | 34,000 | | | | 1,175,380 | |
Invesco Dynamic Building & Construction ETF | | | 46,400 | | | | 1,553,444 | |
Invesco International Dividend Achievers ETF | | | 1,170 | | | | 18,919 | |
Invesco KBW Property & Casualty Insurance ETF | | | 17,740 | | | | 1,233,285 | |
Invesco S&P 500 Low Volatility ETF | | | 157,650 | | | | 9,075,911 | |
Invesco S&P MidCap Low Volatility ETF | | | 152,980 | | | | 8,161,483 | |
SPDR® SSGA US Large Cap Low Volatility ETF | | | 67,960 | | | | 7,561,909 | |
SPDR® S&P® Insurance ETF | | | 36,470 | | | | 1,254,568 | |
Vanguard Dividend Appreciation ETF | | | 45,490 | | | | 5,441,059 | |
Vanguard Real Estate ETF | | | 18,110 | | | | 1,707,773 | |
Total Exchange-Traded Funds (Cost $36,026,563) | | | | | | | 38,820,766 | |
| | | | | | | | | |
MONEY MARKET FUNDS - 0.41% | | | | | | | | |
Fidelity Investments Money Market Government Portfolio, Institutional Class, 1.76%(a) | | | 604,574 | | | | 604,574 | |
Total Money Market Funds (Cost $604,574) | | | | | | | 604,574 | |
Total Investments — 100.10% (Cost $137,146,868) | | | | | | $ | 147,800,356 | |
Liabilities in Excess of Other Assets — (0.10)% | | | | | | | (150,561 | ) |
NET ASSETS — 100.00% | | | | | | $ | 147,649,795 | |
(a) | Rate disclosed is the seven day effective yield as of October 31, 2019. |
ETF - Exchange-Traded Fund
SPDR - Standard & Poor’s Depositary Receipt
Small investments are occasionally retained in mutual funds that are closed to new investment, or in the manager’s opinion are at risk to close, so as to allow the Fund the flexibility to reinvest in these funds in the future.
See accompanying notes which are an integral part of these financial statements.
17
SMI DYNAMIC ALLOCATION FUND
SCHEDULE OF INVESTMENTS
October 31, 2019
EXCHANGE-TRADED FUNDS – 97.09% | | Shares | | | Fair Value | |
Invesco DB Gold Fund(a) | | | 717,820 | | | $ | 33,062,789 | |
iShares 20+ Year Treasury Bond ETF | | | 154,180 | | | | 21,776,383 | |
iShares iBoxx $Investment Grade Corporate Bond ETF | | | 165,580 | | | | 21,146,222 | |
Vanguard Real Estate ETF(a) | | | 422,920 | | | | 39,881,356 | |
Total Exchange-Traded Funds (Cost $105,273,496) | | | | | | | 115,866,750 | |
| | | | | | | | | |
MUTUAL FUNDS – 2.16% | | | | | | | | |
Gold Bullion Strategy Fund (The), Investor Class | | | 103,070 | | | | 2,570,567 | |
Total Mutual Funds (Cost $2,457,596) | | | | | | | 2,570,567 | |
| | | | | | | | | |
MONEY MARKET FUNDS – 0.89% | | | | | | | | |
Fidelity Investments Money Market Government Portfolio, Institutional Class, 1.76%(b) | | | 1,065,331 | | | | 1,065,331 | |
Total Money Market Funds (Cost $1,065,331) | | | | | | | 1,065,331 | |
Total Investments — 100.14% (Cost $108,796,423) | | | | | | $ | 119,502,648 | |
Liabilities in Excess of Other Assets — (0.14)% | | | | | | | (163,651 | ) |
NET ASSETS — 100.00% | | | | | | $ | 119,338,997 | |
(a) | Represents an investment greater than 25% of the Fund’s net assets. Performance of the Fund may be adversely impacted by concentrated investments in securities. The financial statements and portfolio holdings for these securities can be found at www.sec.gov. As of October 31, 2019, the percentage of net assets invested in Invesco DB Gold Fund and Vanguard Real Estate ETF were 27.70% and 33.42%, respectively, of the Fund. |
(b) | Rate disclosed is the seven day effective yield as of October 31, 2019. |
ETF - Exchange-Traded Fund
See accompanying notes which are an integral part of these financial statements.
18
SMI 50/40/10 FUND
SCHEDULE OF INVESTMENTS
October 31, 2019
EXCHANGE-TRADED FUNDS – 69.55% | | Shares | | | Fair Value | |
Invesco Aerospace & Defense ETF | | | 3,440 | | | $ | 231,650 | |
Invesco DB Gold Fund | | | 237,710 | | | | 10,948,922 | |
Invesco DWA Utilities Momentum ETF | | | 73,910 | | | | 2,555,069 | |
Invesco Dynamic Building & Construction ETF | | | 7,530 | | | | 252,100 | |
Invesco KBW Property & Casualty Insurance ETF | | | 3,210 | | | | 223,159 | |
Invesco S&P 500 Low Volatility ETF | | | 24,730 | | | | 1,423,706 | |
Invesco S&P MidCap Low Volatility ETF | | | 25,150 | | | | 1,341,753 | |
iShares 20+ Year Treasury Bond ETF | | | 37,960 | | | | 5,361,470 | |
iShares iBoxx $Investment Grade Corporate Bond ETF | | | 41,600 | | | | 5,312,736 | |
ProShares Ultra Utilities ETF | | | 36,560 | | | | 2,517,156 | |
SPDR® SSGA US Large Cap Low Volatility ETF | | | 11,800 | | | | 1,312,986 | |
SPDR® S&P® Insurance ETF | | | 6,870 | | | | 236,328 | |
Vanguard Dividend Appreciation ETF | | | 9,600 | | | | 1,148,256 | |
Vanguard Real Estate ETF | | | 113,290 | | | | 10,683,247 | |
Total Exchange-Traded Funds (Cost $40,279,923) | | | | | | | 43,548,538 | |
MUTUAL FUNDS – 30.23% | | | | | | | | |
Aberdeen Realty Income & Growth Fund, Institutional Class | | | 14,782 | | | | 266,378 | |
Akre Focus Fund, Institutional Class | | | 30,787 | | | | 1,414,678 | |
American Century Real Estate Fund, Investor Class | | | 7,198 | | | | 238,189 | |
AMG Yacktman Focused Fund, Institutional Class | | | 100 | | | | 2,008 | |
Bright Rock Mid Cap Growth Fund, Institutional Class | | | 63,736 | | | | 1,292,574 | |
Fidelity Advisor Growth Opportunities Fund, Institutional Class | | | 23,750 | | | | 2,180,227 | |
Fidelity International Capital Appreciation Fund | | | 32,456 | | | | 727,342 | |
Fidelity Real Estate Investment Portfolio | | | 5,498 | | | | 260,180 | |
Fidelity Select Construction and Housing Portfolio | | | 3,714 | | | | 240,303 | |
Fidelity Select Semiconductors Portfolio | | | 22,635 | | | | 258,268 | |
Fidelity Select Software & IT Services Portfolio | | | 12,650 | | | | 240,342 | |
Hennessy Focus Fund, Institutional Class | | | 1,855 | | | | 162,893 | |
Invesco Oppenheimer International Small-Mid Company Fund, Class Y | | | 100 | | | | 4,775 | |
Ivy Mid Cap Income Opportunities Fund, Institutional Class | | | 69,865 | | | | 1,049,365 | |
Lazard Global Listed Infrastructure Portfolio, Institutional Class | | | 76,040 | | | | 1,188,504 | |
Longleaf Partners International Fund | | | 150 | | | | 2,606 | |
Lord Abbett Developing Growth Fund, Inc., Institutional Class | | | 100 | | | | 2,771 | |
Needham Growth Fund, Institutional Class | | | 30,606 | | | | 1,369,939 | |
Neuberger Berman Real Estate Fund, Institutional Class | | | 16,089 | | | | 246,641 | |
Oakmark International Fund, Investor Class | | | 50 | | | | 1,207 | |
PIMCO StocksPLUS International Fund (U.S. Dollar Hedged), Institutional Class | | | 48,249 | | | | 383,578 | |
See accompanying notes which are an integral part of these financial statements.
19
SMI 50/40/10 FUND
SCHEDULE OF INVESTMENTS
October 31, 2019 – (Continued)
MUTUAL FUNDS – 30.23% – continued | | Shares | | | Fair Value | |
Polen Growth Fund, Institutional Class | | | 62,339 | | | $ | 2,034,106 | |
ProFunds Banks UltraSector ProFund, Investor Class | | | 4,923 | | | | 257,517 | |
ProFunds Real Estate UltraSector ProFund, Investor Class | | | 5,690 | | | | 318,248 | |
ProFunds Utilities UltraSector ProFund, Investor Class | | | 15,793 | | | | 953,123 | |
Royce Opportunity Fund, Investment Class | | | 100 | | | | 1,180 | |
Sextant International Fund | | | 62,099 | | | | 1,134,544 | |
Sterling Capital Stratton Real Estate Fund, Institutional Class | | | 5,409 | | | | 233,145 | |
Touchstone Mid Cap Fund, Institutional Class | | | 28,802 | | | | 1,150,931 | |
Value Line Mid Cap Focused Fund, Investor Class | | | 52,540 | | | | 1,306,677 | |
Wasatch International Growth Fund, Investor Class | | | 100 | | | | 2,964 | |
Total Mutual Funds (Cost $17,727,864) | | | | | | | 18,925,203 | |
MONEY MARKET FUNDS – 0.33% | | | | | | | | |
Fidelity Investments Money Market Government Portfolio, Institutional Class, 1.76%(a) | | | 206,474 | | | | 206,474 | |
Total Money Market Funds (Cost $206,474) | | | | | | | 206,474 | |
Total Investments — 100.11% (Cost $58,214,261) | | | | | | $ | 62,680,215 | |
Liabilities in Excess of Other Assets — (0.11)% | | | | | | | (66,508 | ) |
NET ASSETS — 100.00% | | | | | | $ | 62,613,707 | |
(a) | Rate disclosed is the seven day effective yield as of October 31, 2019. |
ETF - Exchange-Traded Fund
SPDR - Standard & Poor’s Depositary Receipt
See accompanying notes which are an integral part of these financial statements.
20
SMI FUNDS
STATEMENTS OF ASSETS AND LIABILITIES
October 31, 2019
| | | Sound Mind
Investing Fund | | | SMI Dynamic
Allocation Fund | | | SMI
50/40/10 Fund | |
Assets | | | | | | | | | | | | |
Investments in securities at fair value (cost $137,146,868, $108,796,423 and $58,214,261, respectively) (Note 3) | | $ | 147,800,356 | | | $ | 119,502,648 | | | $ | 62,680,215 | |
Cash | | | 16,747 | | | | — | | | | 2,572 | |
Receivable for fund shares sold | | | 36,359 | | | | 275 | | | | 510 | |
Dividends receivable | | | 1,417 | | | | 2,031 | | | | 627 | |
Prepaid expenses | | | 26,900 | | | | 16,516 | | | | 11,192 | |
Total Assets | | | 147,881,779 | | | | 119,521,470 | | | | 62,695,116 | |
| | | | | | | | | | | | | |
Liabilities | | | | | | | | | | | | |
Payable for fund shares redeemed | | | 64,986 | | | | 44,800 | | | | 1,775 | |
Payable to Adviser (Note 4) | | | 124,072 | | | | 101,024 | | | | 44,396 | |
Payable to Administrator (Note 4) | | | 8,141 | | | | 5,755 | | | | 3,782 | |
Payable to trustees | | | 2,102 | | | | 1,989 | | | | 1,702 | |
Other accrued expenses | | | 32,683 | | | | 28,905 | | | | 29,754 | |
Total Liabilities | | | 231,984 | | | | 182,473 | | | | 81,409 | |
Net Assets | | $ | 147,649,795 | | | $ | 119,338,997 | | | $ | 62,613,707 | |
| | | | | | | | | | | | | |
Net Assets consist of: | | | | | | | | | | | | |
Paid-in capital | | $ | 146,320,365 | | | $ | 108,717,341 | | | $ | 62,487,997 | |
Accumulated earnings | | | 1,329,430 | | | | 10,621,656 | | | | 125,710 | |
Net Assets | | $ | 147,649,795 | | | $ | 119,338,997 | | | $ | 62,613,707 | |
Shares outstanding (unlimited number of shares authorized, no par value) | | | 15,311,037 | | | | 9,802,583 | | | | 6,618,759 | |
Net asset value, offering and redemption price per share (Note 2) | | $ | 9.64 | | | $ | 12.17 | | | $ | 9.46 | |
See accompanying notes which are an integral part of these financial statements.
21
SMI FUNDS
STATEMENTS OF OPERATIONS
For the year ended October 31, 2019
| | | Sound Mind
Investing Fund | | | SMI Dynamic
Allocation Fund | | | SMI
50/40/10 Fund | |
Investment Income | | | | | | | | | | | | |
Dividend income | | $ | 2,556,095 | | | $ | 2,690,926 | | | $ | 1,062,405 | |
Total investment income | | | 2,556,095 | | | | 2,690,926 | | | | 1,062,405 | |
| | | | | | | | | | | | | |
Expenses | | | | | | | | | | | | |
Investment Adviser fees (Note 4) | | | 1,566,392 | | | | 1,227,221 | | | | 567,317 | |
Administration fees (Note 4) | | | 42,489 | | | | 33,474 | | | | 17,063 | |
Registration fees | | | 34,082 | | | | 32,750 | | | | 48,237 | |
Transfer agent fees (Note 4) | | | 27,460 | | | | 10,977 | | | | 10,988 | |
Fund accounting fees (Note 4) | | | 22,650 | | | | 17,851 | | | | 9,093 | |
Legal fees | | | 20,931 | | | | 21,264 | | | | 21,264 | |
Printing and postage expenses | | | 19,188 | | | | 14,880 | | | | 9,000 | |
Audit and tax preparation fees | | | 17,300 | | | | 17,300 | | | | 20,300 | |
Custodian fees | | | 14,736 | | | | 6,537 | | | | 8,169 | |
Insurance expenses | | | 12,523 | | | | 9,293 | | | | 5,902 | |
Trustee fees | | | 8,422 | | | | 8,228 | | | | 7,055 | |
Compliance service fees (Note 4) | | | 8,100 | | | | 8,100 | | | | 8,100 | |
Line of credit fees | | | 6,005 | | | | 4,768 | | | | 2,408 | |
Interest expense | | | 918 | | | | 1,406 | | | | 1,195 | |
Miscellaneous expenses | | | 44,952 | | | | 30,112 | | | | 25,628 | |
Total expenses | | | 1,846,148 | | | | 1,444,161 | | | | 761,719 | |
Fees contractually waived by Adviser (Note 4) | | | — | | | | — | | | | (33,330 | ) |
Net operating expenses | | | 1,846,148 | | | | 1,444,161 | | | | 728,389 | |
Net investment income | | | 709,947 | | | | 1,246,765 | | | | 334,016 | |
| | | | | | | | | | | | | |
Net Realized and Change in Unrealized Gain (Loss) on Investments | | | | | | | | | | | | |
Long term capital gain dividends from investment companies | | | 6,889,793 | | | | — | | | | 1,095,968 | |
Net realized gain (loss) on investment securities transactions | | | (16,922,243 | ) | | | 4,523,670 | | | | (4,904,653 | ) |
Net change in unrealized appreciation on investment securities | | | 15,285,250 | | | | 890,142 | | | | 5,538,418 | |
Net realized and change in unrealized gain on investments | | | 5,252,800 | | | | 5,413,812 | | | | 1,729,733 | |
Net increase in net assets resulting from operations | | $ | 5,962,747 | | | $ | 6,660,577 | | | $ | 2,063,749 | |
See accompanying notes which are an integral part of these financial statements.
22
SOUND MIND INVESTING FUND
STATEMENTS OF CHANGES IN NET ASSETS
| | | For the Year
Ended
October 31, 2019 | | | For the Year
Ended
October 31, 2018 | |
Increase (Decrease) in Net Assets due to: | | | | | | | | |
Operations | | | | | | | | |
Net investment income | | $ | 709,947 | | | $ | 656,190 | |
Long term capital gain dividends from investment companies | | | 6,889,793 | | | | 5,031,825 | |
Net realized gain (loss) on investment securities transactions | | | (16,922,243 | ) | | | 26,764,180 | |
Net change in unrealized appreciation (depreciation) of investment securities | | | 15,285,250 | | | | (27,142,112 | ) |
Net increase in net assets resulting from operations | | | 5,962,747 | | | | 5,310,083 | |
| | | | | | | | | |
Distributions From Earnings (Note 2) | | | (31,686,762 | ) | | | (17,930,314 | ) |
| | | | | | | | | |
Capital Transactions | | | | | | | | |
Proceeds from shares sold | | | 9,534,328 | | | | 18,137,721 | |
Reinvestment of distributions | | | 31,137,671 | | | | 17,486,000 | |
Amount paid for shares redeemed | | | (41,770,932 | ) | | | (45,095,120 | ) |
Net decrease in net assets resulting from capital transactions | | | (1,098,933 | ) | | | (9,471,399 | ) |
Total Decrease in Net Assets | | | (26,822,948 | ) | | | (22,091,630 | ) |
| | | | | | | | | |
Net Assets | | | | | | | | |
Beginning of year | | | 174,472,743 | | | | 196,564,373 | |
End of year | | $ | 147,649,795 | | | $ | 174,472,743 | |
| | | | | | | | | |
Share Transactions | | | | | | | | |
Shares sold | | | 1,016,592 | | | | 1,445,134 | |
Shares issued in reinvestment of distributions | | | 3,689,298 | | | | 1,493,254 | |
Shares redeemed | | | (4,368,826 | ) | | | (3,658,539 | ) |
Net increase (decrease) in shares outstanding | | | 337,064 | | | | (720,151 | ) |
See accompanying notes which are an integral part of these financial statements.
23
SMI DYNAMIC ALLOCATION FUND
STATEMENTS OF CHANGES IN NET ASSETS
| | | For the Year
Ended
October 31, 2019 | | | For the Year
Ended
October 31, 2018 | |
Increase (Decrease) in Net Assets due to: | | | | | | | | |
Operations | | | | | | | | |
Net investment income | | $ | 1,246,765 | | | $ | 2,175,490 | |
Net realized gain on investment securities transactions | | | 4,523,670 | | | | 6,857,555 | |
Net change in unrealized appreciation (depreciation) of investment securities | | | 890,142 | | | | (8,396,521 | ) |
Net increase in net assets resulting from operations | | | 6,660,577 | | | | 636,524 | |
| | | | | | | | | |
Distributions From Earnings (Note 2) | | | (1,904,317 | ) | | | (1,496,250 | ) |
| | | | | | | | | |
Capital Transactions | | | | | | | | |
Proceeds from shares sold | | | 10,593,607 | | | | 18,353,451 | |
Reinvestment of distributions | | | 1,855,382 | | | | 1,459,188 | |
Amount paid for shares redeemed | | | (30,864,920 | ) | | | (47,956,171 | ) |
Net decrease in net assets resulting from capital transactions | | | (18,415,931 | ) | | | (28,143,532 | ) |
Total Decrease in Net Assets | | | (13,659,671 | ) | | | (29,003,258 | ) |
| | | | | | | | | |
Net Assets | | | | | | | | |
Beginning of year | | | 132,998,668 | | | | 162,001,926 | |
End of year | | $ | 119,338,997 | | | $ | 132,998,668 | |
| | | | | | | | | |
Share Transactions | | | | | | | | |
Shares sold | | | 923,300 | | | | 1,536,089 | |
Shares issued in reinvestment of distributions | | | 168,060 | | | | 122,108 | |
Shares redeemed | | | (2,699,471 | ) | | | (4,035,193 | ) |
Net decrease in shares outstanding | | | (1,608,111 | ) | | | (2,376,996 | ) |
See accompanying notes which are an integral part of these financial statements.
24
SMI 50/40/10 FUND
STATEMENTS OF CHANGES IN NET ASSETS
| | | For the Year
Ended
October 31, 2019 | | | For the Year
Ended
October 31, 2018 | |
Increase (Decrease) in Net Assets due to: | | | | | | | | |
Operations | | | | | | | | |
Net investment income | | $ | 334,016 | | | $ | 447,117 | |
Long term capital gain dividends from investment companies | | | 1,095,968 | | | | 239,699 | |
Net realized gain (loss) on investment securities transactions | | | (4,904,653 | ) | | | 2,393,887 | |
Net change in unrealized appreciation (depreciation) of investment securities | | | 5,538,418 | | �� | | (4,996,464 | ) |
Net increase (decrease) in net assets resulting from operations | | | 2,063,749 | | | | (1,915,761 | ) |
| | | | | | | | | |
Distributions From Earnings (Note 2) | | | (2,086,727 | ) | | | (538,520 | ) |
| | | | | | | | | |
Capital Transactions | | | | | | | | |
Proceeds from shares sold | | | 12,088,587 | | | | 48,116,025 | |
Reinvestment of distributions | | | 2,049,221 | | | | 518,421 | |
Amount paid for shares redeemed | | | (17,805,897 | ) | | | (15,189,948 | ) |
Issued in connection with Fund merger (a) | | | — | | | | 13,307,786 | |
Net increase (decrease) in net assets resulting from capital transactions | | | (3,668,089 | ) | | | 46,752,284 | |
Total Increase (Decrease) in Net Assets | | | (3,691,067 | ) | | | 44,298,003 | |
| | | | | | | | | |
Net Assets | | | | | | | | |
Beginning of year | | | 66,304,774 | | | | 22,006,771 | |
End of year | | $ | 62,613,707 | | | $ | 66,304,774 | |
| | | | | | | | | |
Share Transactions | | | | | | | | |
Shares sold | | | 1,336,143 | | | | 4,812,752 | (b) |
Shares issued in reinvestment of distributions | | | 239,395 | | | | 53,608 | (b) |
Shares redeemed | | | (1,964,177 | ) | | | (1,514,653 | )(b) |
Issued in connection with Fund merger | | | — | | | | 1,373,960 | (b) |
Net increase (decrease) in shares outstanding | | | (388,639 | ) | | | 4,725,667 | |
(a) | See Note 1 of the Notes to the Financial Statements. |
(b) | As described in Note 1 of the Notes to the Financial Statements, the share amounts have been adjusted for a stock split that occurred on April 27, 2018. Financial information for the period prior to April 28, 2018 is that of the Former 50/40/10 Fund. |
See accompanying notes which are an integral part of these financial statements.
25
SOUND MIND INVESTING FUND
FINANCIAL HIGHLIGHTS
(For a share outstanding during each year)
| | | For the Year
Ended
October 31,
2019 | |
Selected Per Share Data: | | | | |
Net asset value, beginning of year | | $ | 11.65 | |
| | | | | |
Income from investment operations: | | | | |
Net investment income (loss)(a) | | | 0.05 | |
Net realized and unrealized gain on investments | | | 0.14 | |
Total from investment operations | | | 0.19 | |
| | | | | |
Less distributions to shareholders from: | | | | |
Net investment income | | | (0.05 | ) |
Net realized gains | | | (2.15 | ) |
Total distributions | | | (2.20 | ) |
Paid in capital from redemption fees | | | — | |
Net asset value, end of year | | $ | 9.64 | |
| | | | | |
Total Return(d) | | | 4.28 | % |
| | | | | |
Ratios and Supplemental Data: | | | | |
Net assets, end of year (000 omitted) | | $ | 147,650 | |
Ratio of expenses to average net assets(e) | | | 1.18 | % |
Ratio of expenses to average net assets excluding interest expense(e) (f) | | | 1.17 | % |
Ratio of net investment income (loss) to average net assets(a) (g) | | | 0.45 | % |
Portfolio turnover rate | | | 192.77 | % |
(a) | Recognition of net investment income by the Fund is affected by the timing of the declaration of dividends by the underlying funds in which the Fund invests. |
(b) | The amount shown for a share outstanding throughout the year does not correspond with the change in aggregate gains and losses in the portfolio of securities during the year because of the timing of sales and purchases of fund shares in relation to fluctuating market values during the year. |
(c) | Rounds to less than $0.005 per share. |
(d) | Total return in the above table represents the rate that the investor would have earned or lost on an investment in the Fund, assuming reinvestment of distributions. |
(e) | These ratios exclude the impact of expenses of the underlying funds in which the Fund invests as represented in the Schedule of Investments. |
(f) | These ratios do not include the effects of other expenses refunded by the underlying funds in which the Fund invests or line of credit interest expense and borrowing costs. |
(g) | This ratio is presented net of expenses and/or expenses refunded by the underlying funds in which the Fund invests. |
See accompanying notes which are an integral part of these financial statements.
26
SOUND MIND INVESTING FUND
FINANCIAL HIGHLIGHTS
(For a share outstanding during each year) – (Continued)
| | For the Year
Ended
October 31,
2018 | | | For the Year
Ended
October 31,
2017 | | | For the Year
Ended
October 31,
2016 | | | For the Year
Ended
October 31,
2015 | |
| | | | | | | | | | | | | | | | |
| | $ | 12.52 | | | $ | 10.30 | | | $ | 11.76 | | | $ | 13.94 | |
| | | | | | | | | | | | | | | | |
| | | | | | | | | | | | | | | | |
| | | 0.04 | | | | (0.05 | ) | | | 0.01 | | | | (0.08 | ) |
| | | 0.26 | | | | 2.27 | | | | 0.04 | (b) | | | 0.16 | |
| | | 0.30 | | | | 2.22 | | | | 0.05 | | | | 0.08 | |
| | | | | | | | | | | | | | | | |
| | | | | | | | | | | | | | | | |
| | | — | | | | — | | | | — | | | | (0.07 | ) |
| | | (1.17 | ) | | | — | | | | (1.51 | ) | | | (2.19 | ) |
| | | (1.17 | ) | | | — | | | | (1.51 | ) | | | (2.26 | ) |
| | | — | | | | — | (c) | | | — | (c) | | | — | (c) |
| | $ | 11.65 | | | $ | 12.52 | | | $ | 10.30 | | | $ | 11.76 | |
| | | | | | | | | | | | | | | | |
| | | 2.36 | % | | | 21.55 | % | | | 0.55 | % | | | 0.16 | % |
| | | | | | | | | | | | | | | | |
| | | | | | | | | | | | | | | | |
| | $ | 174,473 | | | $ | 196,564 | | | $ | 194,678 | | | $ | 227,339 | |
| | | 1.16 | % | | | 1.15 | % | | | 1.16 | % | | | 1.14 | % |
| | | 1.16 | % | | | 1.15 | % | | | 1.15 | % | | | 1.13 | % |
| | | 0.34 | % | | | (0.41 | )% | | | 0.15 | % | | | (0.59 | )% |
| | | 163.54 | % | | | 176.40 | % | | | 131.40 | % | | | 216.17 | % |
See accompanying notes which are an integral part of these financial statements.
27
SMI DYNAMIC ALLOCATION FUND
FINANCIAL HIGHLIGHTS
(For a share outstanding during each year)
| | | For the Year
Ended
October 31,
2019 | |
Selected Per Share Data: | | | | |
Net asset value, beginning of year | | $ | 11.66 | |
| | | | | |
Income from investment operations: | | | | |
Net investment income(a) | | | 0.12 | |
Net realized and unrealized gain (loss) on investments | | | 0.56 | |
Total from investment operations | | | 0.68 | |
| | | | | |
Less distributions to shareholders from: | | | | |
Net investment income | | | (0.17 | ) |
Net realized gains | | | — | |
Total distributions | | | (0.17 | ) |
Paid in capital from redemption fees | | | — | |
Net asset value, end of year | | $ | 12.17 | |
| | | | | |
Total Return(c) | | | 5.97 | % |
| | | | | |
Ratios and Supplemental Data: | | | | |
Net assets, end of year (000 omitted) | | $ | 119,339 | |
Ratio of expenses to average net assets(d) | | | 1.18 | % |
Ratio of expenses to average net assets excluding interest expense(d) (e) | | | 1.17 | % |
Ratio of net investment income to average net assets(a) (f) | | | 1.02 | % |
Portfolio turnover rate | | | 218.06 | % |
(a) | Recognition of net investment income by the Fund is affected by the timing of the declaration of dividends by the underlying funds in which the Fund invests. |
(b) | Rounds to less than $0.005 per share. |
(c) | Total return in the above table represents the rate that the investor would have earned or lost on an investment in the Fund, assuming reinvestment of distributions. |
(d) | These ratios exclude the impact of expenses of the underlying funds in which the Fund invests as represented in the Schedule of Investments. |
(e) | These ratios do not include the effects of other expenses refunded by the underlying funds in which the Fund invests or line of credit interest expense and borrowing costs. |
(f) | This ratio is presented net of expenses and/or expenses refunded by the underlying funds in which the Fund invests. |
See accompanying notes which are an integral part of these financial statements.
28
SMI DYNAMIC ALLOCATION FUND
FINANCIAL HIGHLIGHTS
(For a share outstanding during each year) – (Continued)
| | For the Year
Ended
October 31,
2018 | | | For the Year
Ended
October 31,
2017 | | | For the Year
Ended
October 31,
2016 | | | For the Year
Ended
October 31,
2015 | |
| | | | | | | | | | | | | | | | |
| | $ | 11.75 | | | $ | 10.92 | | | $ | 10.99 | | | $ | 11.81 | |
| | | | | | | | | | | | | | | | |
| | | | | | | | | | | | | | | | |
| | | 0.18 | | | | 0.07 | | | | 0.09 | | | | 0.19 | |
| | | (0.16 | ) | | | 0.79 | | | | (0.02 | ) | | | (0.69 | ) |
| | | 0.02 | | | | 0.86 | | | | 0.07 | | | | (0.50 | ) |
| | | | | | | | | | | | | | | | |
| | | | | | | | | | | | | | | | |
| | | (0.11 | ) | | | (0.03 | ) | | | (0.14 | ) | | | (0.23 | ) |
| | | — | | | | — | | | | — | | | | (0.09 | ) |
| | | (0.11 | ) | | | (0.03 | ) | | | (0.14 | ) | | | (0.32 | ) |
| | | — | | | | — | (b) | | | — | (b) | | | — | (b) |
| | $ | 11.66 | | | $ | 11.75 | | | $ | 10.92 | | | $ | 10.99 | |
| | | | | | | | | | | | | | | | |
| | | 0.15 | % | | | 7.87 | % | | | 0.62 | % | | | (4.52 | )% |
| | | | | | | | | | | | | | | | |
| | | | | | | | | | | | | | | | |
| | $ | 132,999 | | | $ | 162,002 | | | $ | 180,404 | | | $ | 197,539 | |
| | | 1.16 | % | | | 1.16 | % | | | 1.15 | % | | | 1.15 | % |
| | | 1.16 | % | | | 1.15 | % | | | 1.15 | % | | | 1.15 | % |
| | | 1.45 | % | | | 0.57 | % | | | 0.80 | % | | | 1.62 | % |
| | | 61.28 | % | | | 247.10 | % | | | 151.88 | % | | | 248.18 | % |
See accompanying notes which are an integral part of these financial statements.
29
SMI 50/40/10 FUND
FINANCIAL HIGHLIGHTS
(For a share outstanding during each period)
| | | For the Year
Ended
October 31,
2019 | |
Selected Per Share Data: | | | | |
Net asset value, beginning of period | | $ | 9.46 | |
| | | | | |
Income from investment operations: | | | | |
Net investment income (loss)(c) | | | 0.04 | |
Net realized and unrealized gain (loss) on investments | | | 0.26 | |
Total from investment operations | | | 0.30 | |
| | | | | |
Less distributions to shareholders from: | | | | |
Net investment income | | | (0.06 | ) |
Net realized gains | | | (0.24 | ) |
Total distributions | | | (0.30 | ) |
Paid in capital from redemption fees | | | — | |
Net asset value, end of period | | $ | 9.46 | |
| | | | | |
Total Return(f) | | | 3.55 | % |
| | | | | |
Ratios and Supplemental Data: | | | | |
Net assets, end of period (000 omitted) | | $ | 62,614 | |
Ratio of expenses to average net assets(h) | | | 1.16 | % |
Ratio of expenses to average net assets excluding interest expense(h) (j) | | | 1.15 | % |
Ratio of expenses to average net assets before waiver and reimbursement(h) | | | 1.21 | % |
Ratio of net investment income (loss) to average net assets(c) (k) | | | 0.53 | % |
Portfolio turnover rate | | | 225.42 | % |
(a) | As described in Note 1 of the Notes to the Financial Statements, the Former 50/40/10 Fund was reorganized into the SMI Conservative Allocation Fund as of the close of business, April 27, 2018 and subsequently renamed the SMI 50/40/10 Fund. The Fund is the successor to the Former 50/40/10 Fund. The performance and financial information presented incorporates the operations of the Former 50/40/10 Fund, which, as a result of the reorganization, are the Fund’s operations. The per share amounts have been adjusted for a stock split that occurred on April 27, 2018. |
(b) | For the period April 29, 2015 (commencement of operations) to October 31, 2015. |
(c) | Recognition of net investment income by the Fund is affected by the timing of the declaration of dividends by the underlying funds in which the Fund invests. |
(d) | Per share net investment income has been determined on the basis of average shares outstanding during the year. |
(e) | Rounds to less than $0.005 per share. |
(f) | Total return in the above table represents the rate that the investor would have earned or lost on an investment in the Fund, assuming reinvestment of distributions. |
(h) | These ratios exclude the impact of expenses of the underlying funds in which the Fund invests as represented in the Schedule of Investments. |
See accompanying notes which are an integral part of these financial statements.
30
SMI 50/40/10 FUND
FINANCIAL HIGHLIGHTS
(For a share outstanding during each period) – (Continued)
| | For the Year
Ended
October 31,
2018(a) | | | For the Year
Ended
October 31,
2017(a) | | | For the Year
Ended
October 31,
2016(a) | | | For the Period
Ended
October 31,
2015(a)(b) | |
| | | | | | | | | | | | | | | | |
| | $ | 9.65 | | | $ | 8.20 | | | $ | 8.13 | | | $ | 8.83 | |
| | | | | | | | | | | | | | | | |
| | | | | | | | | | | | | | | | |
| | | 0.10 | (d) | | | (0.01 | ) | | | 0.03 | | | | — | (e) |
| | | (0.04 | ) | | | 1.49 | | | | 0.08 | | | | (0.70 | ) |
| | | 0.06 | | | | 1.48 | | | | 0.11 | | | | (0.70 | ) |
| | | | | | | | | | | | | | | | |
| | | | | | | | | | | | | | | | |
| | | (0.11 | ) | | | (0.03 | ) | | | (0.04 | ) | | | — | |
| | | (0.14 | ) | | | — | | | | — | | | | — | |
| | | (0.25 | ) | | | (0.03 | ) | | | (0.04 | ) | | | — | |
| | | — | | | | — | (e) | | | — | (e) | | | — | (e) |
| | $ | 9.46 | | | $ | 9.65 | | | $ | 8.20 | | | $ | 8.13 | |
| | | | | | | | | | | | | | | | |
| | | 0.36 | % | | | 17.99 | % | | | 1.44 | % | | | (8.00 | )%(g) |
| | | | | | | | | | | | | | | | |
| | | | | | | | | | | | | | | | |
| | $ | 66,305 | | | $ | 22,007 | | | $ | 18,363 | | | $ | 13,147 | |
| | | 1.24 | % | | | 1.46 | % | | | 1.45 | % | | | 1.45 | %(i) |
| | | 1.23 | % | | | 1.45 | % | | | 1.45 | % | | | 1.45 | %(i) |
| | | 1.39 | % | | | 1.56 | % | | | 1.76 | % | | | 2.75 | %(i) |
| | | 1.03 | % | | | (0.17 | )% | | | 0.30 | % | | | (0.09 | )%(i) |
| | | 155.28 | % | | | 212.36 | % | | | 146.24 | % | | | 184.30 | %(g) |
(j) | These ratios do not include the effects of other expenses refunded by the underlying funds in which the Fund invests or line of credit interest expense and borrowing costs. |
(k) | This ratio is presented net of expenses and/or expenses refunded by the underlying funds in which the Fund invests. |
See accompanying notes which are an integral part of these financial statements.
31
SMI FUNDS
NOTES TO THE FINANCIAL STATEMENTS
October 31, 2019
NOTE 1. ORGANIZATION
The Sound Mind Investing Fund (“SMI Fund”), SMI Dynamic Allocation Fund and SMI 50/40/10 Fund (formerly the SMI Conservative Allocation Fund) (each a “Fund” and collectively, the “Funds”) are each a diversified series of Valued Advisers Trust (the “Trust”). The Trust is a management investment company established under the laws of Delaware by an Agreement and Declaration of Trust dated June 13, 2008 (the “Trust Agreement”). The Trust Agreement permits the Board of Trustees (the “Board”) to issue an unlimited number of shares of beneficial interest of separate series without par value. Each Fund is one of a series of funds currently authorized by the Board. The investment adviser to the Funds is SMI Advisory Services, LLC (the “Adviser”). The SMI Fund seeks to provide long-term capital appreciation. The SMI Dynamic Allocation Fund and SMI 50/40/10 Fund seek total return.
Each of the Funds is a “fund-of-funds” in which each Fund may invest in other investment companies, including exchange-traded funds. For a discussion on the strategies employed by each of the Funds, please refer to pages 3-4 of this report.
At the close of business on April 27, 2018, the SMI Conservative Allocation Fund was renamed the SMI 50/40/10 Fund and acquired all of the assets and assumed all of the liabilities of the previous SMI 50/40/10 Fund (the “Former 50/40/10 Fund” or “Accounting Survivor”), pursuant to an agreement and plan of reorganization approved by the Board on December 12, 2017. The reorganization qualified as a tax-free reorganization for federal income tax purposes with no gain or loss recognized to the Funds or their shareholders. The SMI 50/40/10 Fund is considered the surviving entity for tax purposes.
The acquisition was accomplished by a tax-free exchange of 2,169,930 shares of the Former 50/40/10 Fund (valued at $23,793,687) for 2,456,576 shares of the SMI Conservative Allocation Fund on April 27, 2018. Upon completion of this exchange, the SMI Conservative Allocation Fund changed its name to the SMI 50/40/10 Fund and assumed the accounting and performance history of the Former 50/40/10 Fund along with adopting the investment strategies that were employed by the Former 50/40/10 Fund. For financial reporting purposes, assets received and shares issued by the SMI Conservative Allocation Fund were recorded at fair value, however, the identified cost of the investments received from the Former 50/40/10 Fund were carried forward to align ongoing reporting for the Accounting Survivor’s realized and unrealized gains and losses with amounts distributable to shareholders for tax purposes. The aggregate net assets and shares outstanding of the SMI Conservative Allocation Fund immediately before the acquisition were $13,307,786 and 1,373,960, respectively, including $837,960 of unrealized appreciation. The aggregate net assets of the Former 50/40/10 Fund at April 27, 2018 of $23,793,687 including market of securities of $23,795,291 which includes $2,713,961 of unrealized appreciation, were combined with those of the SMI Conservative Allocation Fund, resulting in combined aggregate net assets of $37,101,473.
32
SMI FUNDS
NOTES TO THE FINANCIAL STATEMENTS
October 31, 2019 – (Continued)
NOTE 1. ORGANIZATION – (Continued)
Assuming the acquisition had been completed on November 1, 2017, the beginning of the annual reporting period of the Accounting Survivor, the pro forma results of operations for the fiscal year ended October 31, 2018, were as follows:
Net investment income | | $ | 629,809 | |
Net realized and change in unrealized loss on investments | | | (2,541,556 | ) |
Net decrease in net assets resulting from operations | | $ | (1,911,747 | ) |
Because the combined investment portfolios have been managed as a single integrated portfolio since the acquisition was completed, it is not practicable to separate the amounts of revenue and earnings of the SMI Conservative Allocation Fund that have been included in the Accounting Survivor’s statement of operations since April 27, 2018.
Due to the reorganization on April 27, 2018, the number of outstanding shares of the Former 50/40/10 Fund increased by a factor of 1.132099; and since the Former 50/40/10 Fund’s total number of shares outstanding increased, the net asset value decreased. The reorganization did not affect the value of the Former 50/40/10 Fund’s net assets or each shareholder’s proportional ownership interest in those assets. The historical share transactions presented in the Statements of Changes in Net Assets and per share data presented in the Financial Highlights have been adjusted for periods prior to April 27, 2018 as a result.
NOTE 2. SIGNIFICANT ACCOUNTING POLICIES
The Funds are investment companies and follow accounting and reporting guidance under Financial Accounting Standards Board Accounting Standards Codification (“ASC”) Topic 946, “Financial Services-Investment Companies”. The following is a summary of significant accounting policies followed by the Funds in the preparation of their financial statements. These policies are in conformity with the generally accepted accounting principles in the United States of America (“GAAP”).
Estimates – The preparation of financial statements in conformity with GAAP requires management to make estimates and assumptions that affect the reported amounts of assets and liabilities and disclosure of contingent assets and liabilities at the date of the financial statements and the reported amounts of increases and decreases in net assets from operations during the reporting period. Actual results could differ from those estimates.
Federal Income Taxes – The Funds make no provision for federal income or excise tax. Each Fund has qualified and intends to qualify each year as a regulated investment company (“RIC”) under subchapter M of the Internal Revenue Code of 1986, as amended, by complying with the requirements applicable to RICs and by distributing substantially all of its taxable income. Each Fund also intends to distribute sufficient net investment income and net capital gains, if any, so that it will not be subject to excise tax on undistributed income and gains. If the required amount of net investment income or gains is not distributed, the Fund could incur a tax expense.
33
SMI FUNDS
NOTES TO THE FINANCIAL STATEMENTS
October 31, 2019 – (Continued)
NOTE 2. SIGNIFICANT ACCOUNTING POLICIES – (Continued)
As of and during the fiscal year ended October 31, 2019, none of the Funds had a liability for any unrecognized tax benefits. The Funds recognize interest and penalties, if any, related to unrecognized tax benefits as income tax expense on the statements of operations when incurred. During the fiscal year ended October 31, 2019, the Funds did not incur any interest or penalties. Management of the Funds has reviewed tax positions taken in tax years that remain subject to examination by all major tax jurisdictions, including federal (i.e., the last three tax year ends and the interim tax period since then, as applicable). Management believes that there is no tax liability resulting from unrecognized tax benefits related to uncertain tax positions taken.
Expenses – Expenses incurred by the Trust that do not relate to a specific fund of the Trust are allocated to the individual funds based on each fund’s relative net assets or another appropriate basis (as determined by the Board).
Security Transactions and Related Income – The Funds follow industry practice and record security transactions on the trade date for financial reporting purposes. The specific identification method is used for determining gains or losses for financial statement and income tax purposes. Dividend income is recorded on the ex-dividend date and interest income is recorded on an accrual basis. Discounts and premiums on securities purchased are accreted or amortized using the effective interest method, if applicable. Withholding taxes on foreign dividends, if any, have been provided for in accordance with the Funds’ understanding of the applicable country’s tax rules and rates.
Dividends and Distributions – Each Fund intends to distribute its net investment income and net realized long-term and short-term capital gains, if any, at least annually. Dividends and distributions to shareholders, which are determined in accordance with income tax regulations, are recorded on the ex-dividend date. The treatment for financial reporting purposes of distributions made to shareholders during the period from net investment income or net realized capital gains may differ from their ultimate treatment for federal income tax purposes. These differences are caused primarily by differences in the timing of the recognition of certain components of income, expense or realized capital gain for federal income tax purposes. Where such differences are permanent in nature, they are reclassified among the components of the net assets based on their ultimate characterization for federal income tax purposes. Any such reclassifications will have no effect on net assets, results of operations or net asset value (“NAV”) per share of the Funds.
For the fiscal year ended October 31, 2019, the Funds made the following reclassifications to increase (decrease) the components of net assets:
Fund | | Paid-In Capital | | | Accumulated
Earnings | |
SMI 50/40/10 Fund | | $ | (1 | ) | | $ | 1 | |
34
SMI FUNDS
NOTES TO THE FINANCIAL STATEMENTS
October 31, 2019 – (Continued)
NOTE 3. SECURITIES VALUATION AND FAIR VALUE MEASUREMENTS
Fair value is defined as the price that a Fund would receive upon selling an investment in a timely transaction to an independent buyer in the principal or most advantageous market of the investment. GAAP establishes a three-tier hierarchy to maximize the use of observable market data and minimize the use of unobservable inputs and to establish classification of fair value measurements for disclosure purposes.
Inputs refer broadly to the assumptions that market participants would use in pricing the asset or liability, including assumptions about risk (the risk inherent in a particular valuation technique used to measure fair value including a pricing model and/or the risk inherent in the inputs to the valuation technique). Inputs may be observable or unobservable. Observable inputs are inputs that reflect the assumptions market participants would use in pricing the asset or liability developed based on market data obtained and available from sources independent of the reporting entity. Unobservable inputs are inputs that reflect the reporting entity’s own assumptions about the assumptions market participants would use in pricing the asset or liability developed based on the best information available in the circumstances.
Various inputs are used in determining the value of each Fund’s investments. These inputs are summarized in the three broad levels listed below.
| | ● | Level 1 – unadjusted quoted prices in active markets for identical investments and/or registered investment companies where the value per share is determined and published and is the basis for current transactions for identical assets or liabilities at the valuation date |
| | ● | Level 2 – other significant observable inputs (including, but not limited to, quoted prices for an identical security in an inactive market, quoted prices for similar securities, interest rates, prepayment speeds, credit risk, etc.) |
| | ● | Level 3 – significant unobservable inputs (including the Funds’ own assumptions in determining fair value of investments based on the best information available) |
The inputs used to measure fair value may fall into different levels of the fair value hierarchy. In such cases, for disclosure purposes, the level in the fair value hierarchy which is reported, is determined based on the lowest level input that is significant to the fair value measurement in its entirety.
Equity securities that are traded on any stock exchange are generally valued at the last quoted sale price on the security’s primary exchange. Lacking a last sale price, an exchange-traded security is generally valued at its last bid price. Securities traded in the NASDAQ over-the-counter market are generally valued at the NASDAQ Official Closing Price. When using the market quotations and when the market is considered active, the security is classified as a Level 1 security. In the event that market quotations are not readily available or are considered unreliable due to market or other events, a Fund values its securities and other assets at fair value in accordance with policies established by and under the general supervision of the Board. Under these policies, the securities will be classified as Level 2 or 3 within the fair value hierarchy, depending on the inputs used.
35
SMI FUNDS
NOTES TO THE FINANCIAL STATEMENTS
October 31, 2019 – (Continued)
NOTE 3. SECURITIES VALUATION AND FAIR VALUE MEASUREMENTS – (Continued)
Investments in mutual funds, including money market mutual funds, are generally priced at the ending NAV. These securities are categorized as Level 1 securities. In the event that the ending NAV for a mutual fund is unavailable at the end of day pricing time, the Adviser may, in accordance with the Trust’s valuation policies, consider all appropriate factors in determining the fair value of the mutual fund. In such cases the security will generally be categorized as a Level 2 security.
In accordance with the Trust’s valuation policies, the Adviser is required to consider all appropriate factors relevant to the value of securities for which it has determined other pricing sources are not available or reliable as described above. No single method exists for determining fair value, because fair value depends upon the circumstances of each individual case. As a general principle, the current fair value of a security being valued by the Adviser would be the amount that the Fund might reasonably expect to receive upon the current sale. Methods that are in accordance with this principle may, for example, be based on (i) a multiple of earnings; (ii) a discount from market prices of a similar freely traded security (including a derivative security or a basket of securities traded on other markets, exchanges or among dealers); or (iii) yield to maturity with respect to debt issues, or a combination of these and other methods. Fair-value pricing is permitted if, in the Adviser’s opinion, the validity of market quotations appears to be questionable based on factors such as evidence of a thin market in the security based on a small number of quotations, a significant event occurs after the close of a market but before a Fund’s NAV calculation that may affect a security’s value, or the Adviser is aware of any other data that calls into question the reliability of market quotations.
| | | Valuation Inputs | |
SMI Fund | | Level 1 | | | Level 2 | | | Level 3 | | | Total | |
Mutual Funds | | $ | 108,375,016 | | | $ | — | | | $ | — | | | $ | 108,375,016 | |
Exchange-Traded Funds | | | 38,820,766 | | | | — | | | | — | | | | 38,820,766 | |
Money Market Funds | | | 604,574 | | | | — | | | | — | | | | 604,574 | |
Total | | $ | 147,800,356 | | | $ | — | | | $ | — | | | $ | 147,800,356 | |
| | | Valuation Inputs | |
SMI Dynamic Allocation Fund | | Level 1 | | | Level 2 | | | Level 3 | | | Total | |
Exchange-Traded Funds | | $ | 115,866,750 | | | $ | — | | | $ | — | | | $ | 115,866,750 | |
Mutual Funds | | | 2,570,567 | | | | — | | | | — | | | | 2,570,567 | |
Money Market Funds | | | 1,065,331 | | | | — | | | | — | | | | 1,065,331 | |
Total | | $ | 119,502,648 | | | $ | — | | | $ | — | | | $ | 119,502,648 | |
36
SMI FUNDS
NOTES TO THE FINANCIAL STATEMENTS
October 31, 2019 – (Continued)
NOTE 3. SECURITIES VALUATION AND FAIR VALUE MEASUREMENTS – (Continued)
| | | Valuation Inputs | |
SMI 50/40/10 Fund | | Level 1 | | | Level 2 | | | Level 3 | | | Total | |
Exchange-Traded Funds | | $ | 43,548,538 | | | $ | — | | | $ | — | | | $ | 43,548,538 | |
Mutual Funds | | | 18,925,203 | | | | — | | | | — | | | | 18,925,203 | |
Money Market Funds | | | 206,474 | | | | — | | | | — | | | | 206,474 | |
Total | | $ | 62,680,215 | | | $ | — | | | $ | — | | | $ | 62,680,215 | |
NOTE 4. FEES AND OTHER TRANSACTIONS WITH AFFILIATES
Under the terms of the investment advisory agreements with respect to each Fund (the “Advisory Agreements”), the Adviser is responsible for managing each Fund’s investments. As compensation for its management services, each Fund is obligated to pay the Adviser a fee based on the Funds’ average daily net assets as follows:
Fund Assets | | SMI Fund
Management Fee | | | SMI Dynamic
Allocation Fund
Management Fee | | | SMI 50/40/10 Fund
Management Fee | |
$1 – $100 million | | | 1.00 | % | | | 1.00 | % | | | 0.90 | % |
$100,000,001 – $250 million | | | 1.00 | % | | | 1.00 | % | | | 0.80 | % |
$250,000,001 to $500 million | | | 0.90 | % | | | 0.90 | % | | | 0.70 | % |
Over $500 million | | | 0.80 | % | | | 0.80 | % | | | 0.60 | % |
For the fiscal year ended October 31, 2019, fees earned and waived by the Adviser and amounts due to the Adviser at October 31, 2019 were as follows:
| | | SMI Fund
Management Fee | | | SMI Dynamic
Allocation Fund
Management Fee | | | SMI 50/40/10 Fund
Management Fee | |
Management fees earned | | $ | 1,566,392 | | | $ | 1,227,221 | | | $ | 567,317 | |
Fees waived by Adviser | | | — | | | | — | | | | (33,330 | ) |
Payable to Adviser | | | 124,072 | | | | 101,024 | | | | 44,396 | |
Management fees for the Former 50/40/10 Fund were 1.00% for the first $250 million in average daily net assets, 0.90% for the next $250 million in average daily net assets and 0.80% for average daily net assets over $500 million, prior to April 30, 2018.
37
SMI FUNDS
NOTES TO THE FINANCIAL STATEMENTS
October 31, 2019 – (Continued)
NOTE 4. FEES AND OTHER TRANSACTIONS WITH AFFILIATES – (Continued)
The Adviser contractually has agreed to waive its management fee and/or reimburse certain expenses, but only to the extent necessary so that each Fund’s total annual operating expenses (excluding interest, taxes, brokerage commissions, other expenses which are capitalized in accordance with GAAP, extraordinary expenses, dividend expense on short sales, 12b-1 fees, and acquired fund fees and expenses) do not exceed 1.50% of the Fund’s average daily net assets with respect to the SMI Fund, 1.45% with respect to the SMI Dynamic Allocation Fund, and 1.15% with respect to the SMI 50/40/10 Fund. The expense limitation agreement with respect to the Funds is in place through February 29, 2020. Prior to April 30, 2018, the Former 50/40/10 Fund’s expenses were limited to 1.45% of its average daily net assets.
Each waiver or reimbursement by the Adviser is subject to repayment by the applicable Fund within the three years following the date of such waiver or reimbursement, provided that such Fund is able to make the repayment without exceeding the applicable expense limitation at the time of the waiver or reimbursement, and the expense limitation at the time of the repayment.
The amount subject to repayment by the SMI 50/40/10 Fund pursuant to the aforementioned conditions are as follows:
Recoverable through | | Amount | |
October 31, 2020 | | $ | 59,711 | |
October 31, 2021 | | | 88,833 | |
October 31, 2022 | | | 33,330 | |
The Trust retains Ultimus Fund Solutions, LLC (“Ultimus” or “Administrator”) to provide the Funds with administration, compliance (including a chief compliance officer), fund accounting, and transfer agent services, including all regulatory reporting. Expenses incurred by the Funds for these services are allocated to the individual Funds based on each Fund’s relative net assets.
The officers and one trustee of the Trust are members of management and/or employees of the Administrator. Unified Financial Securities, LLC (the “Distributor”) acts as the principal distributor of the Funds’ shares.
38
SMI FUNDS
NOTES TO THE FINANCIAL STATEMENTS
October 31, 2019 – (Continued)
NOTE 4. FEES AND OTHER TRANSACTIONS WITH AFFILIATES – (Continued)
For the fiscal year ended October 31, 2019, fees for administration, compliance, fund accounting, and transfer agent services, and amounts due to the Administrator at October 31, 2019 were as follows:
| | | SMI Fund | | | SMI Dynamic
Allocation Fund | | | SMI
50/40/10 Fund | |
Administration | | $ | 42,489 | | | $ | 33,474 | | | $ | 17,063 | |
Compliance expenses | | | 8,100 | | | | 8,100 | | | | 8,100 | |
Fund accounting | | | 22,650 | | | | 17,851 | | | | 9,093 | |
Transfer agent | | | 27,460 | | | | 10,977 | | | | 10,988 | |
Payable to Administrator | | | 8,141 | | | | 5,755 | | | | 3,782 | |
There were no payments made to the Distributor by the Funds for the fiscal year ended October 31, 2019.
NOTE 5. INVESTMENTS
For the fiscal year ended October 31, 2019, purchases and sales of investment securities, other than short-term investments were as follows:
| | | SMI Fund | | | SMI Dynamic
Allocation Fund | | | SMI
50/40/10 Fund | |
Purchases | | $ | 278,099,156 | | | $ | 264,800,935 | | | $ | 138,927,052 | |
Sales | | $ | 294,784,888 | | | $ | 241,068,721 | | | $ | 131,904,572 | |
There were no purchases or sales of long-term U.S. government obligations during the fiscal year ended October 31, 2019.
NOTE 6. LINE OF CREDIT
During the fiscal year ended October 31, 2019, the Trust, on behalf of the Funds, entered into a short-term credit agreement (“Line of Credit”) with Huntington National Bank (“Huntington”), expiring on January 31, 2020. Under the terms of the agreement, each of the Funds may borrow up to the lesser of 10% of a Fund’s daily market value or $5 million at an interest rate equal to the London Interbank Offered Rate (“LIBOR”) plus 150 basis points, 3.41% as of October 31, 2019. The purpose of the agreement is to meet temporary or emergency cash needs, including redemption requests that might otherwise require the untimely disposition of securities. Huntington receives an annual facility fee of 0.125% on $5 million as well as an additional annual fee of 0.125% on any unused portion of the credit facility, invoiced quarterly, for providing the Line of Credit. The Funds will not borrow money, except (a) from a bank, provided that immediately after such borrowing there is an asset coverage of 300% for
39
SMI FUNDS
NOTES TO THE FINANCIAL STATEMENTS
October 31, 2019 – (Continued)
NOTE 6. LINE OF CREDIT – (Continued)
all borrowings of a Fund; or (b) from a bank or other persons for temporary purposes only, provided that such temporary borrowings are in an amount not exceeding 5% of a Fund’s total assets at the time when the borrowing is made. To the extent that the line of credit is utilized, it will be collateralized by securities in the Funds’ portfolios.
As of October 31, 2019, the Funds had no outstanding borrowings under this Line of Credit.
Fund | | Average
Daily Loan
Balance(a) | | | Weighted
Average
Interest
Rate(a) | | | Number of Days
Outstanding(b) | | | Interest
Expense
Accrued | | | Maximum
Loan
Outstanding | |
SMI Fund | | $ | 720,422 | | | | 3.89% | | | | 11 | | | $ | 862 | | | $ | 3,000,000 | |
SMI Dynamic Allocation Fund | | | 1,177,513 | | | | 3.97% | | | | 10 | | | | 1,295 | | | | 2,375,000 | |
SMI 50/40/10 Fund | | | 320,569 | | | | 3.86% | | | | 34 | | | | 1,181 | | | | 2,625,000 | |
(a) | Averages based on the number of days outstanding. |
(b) | Number of Days Outstanding represents the total days during the fiscal year ended October 31, 2019, that a Fund utilized the Line of Credit. |
NOTE 7. FEDERAL TAX INFORMATION
At October 31, 2019, the net unrealized appreciation (depreciation) of investments for tax purposes was as follows:
| | | SMI Fund | | | SMI Dynamic
Allocation Fund | | | SMI
50/40/10 Fund | |
Gross unrealized appreciation | | $ | 10,488,441 | | | $ | 10,706,225 | | | $ | 4,612,966 | |
Gross unrealized depreciation | | | (188,445 | ) | | | — | | | | (147,012 | ) |
Net unrealized appreciation/(depreciation) on investments | | $ | 10,299,996 | | | $ | 10,706,225 | | | $ | 4,465,954 | |
Tax cost of investments | | $ | 137,500,360 | | | $ | 108,796,423 | | | $ | 58,214,261 | |
40
SMI FUNDS
NOTES TO THE FINANCIAL STATEMENTS
October 31, 2019 – (Continued)
NOTE 7. FEDERAL TAX INFORMATION – (Continued)
The tax character of distributions for the fiscal years ended October 31, 2019 and October 31, 2018 were as follows:
| | | SMI Fund | | | SMI Dynamic Allocation Fund | |
| | | 2019 | | | 2018 | | | 2019 | | | 2018 | |
Distributions paid from: (a) | | | | | | | | | | | | | | | | |
Ordinary income | | $ | 8,111,023 | | | $ | 7,389,940 | | | $ | 1,904,317 | | | $ | 1,496,250 | |
Long-term capital gains | | | 23,575,739 | | | | 10,540,374 | | | | — | | | | — | |
Total taxable distributions paid | | $ | 31,686,762 | | | $ | 17,930,314 | | | $ | 1,904,317 | | | $ | 1,496,250 | |
| | | SMI 50/40/10 Fund | |
| | | 2019 | | | 2018(b) | |
Distributions paid from: (a) | | | | | | | | |
Ordinary income | | $ | 473,367 | | | $ | 170,633 | |
Long-term capital gains | | | 1,613,360 | | | | — | |
Total taxable distributions paid | | $ | 2,086,727 | | | $ | 170,633 | |
(a) | For federal income tax purposes, distributions of short-term capital gains are treated as ordinary income distributions. |
(b) | Distribution amounts reflects those of the tax survivor. |
At October 31, 2019, the components of accumulated earnings (accumulated losses) on a tax basis was as follows:
| | | SMI Fund | | | SMI Dynamic
Allocation Fund | | | SMI
50/40/10 Fund | |
Undistributed ordinary income | | $ | 706,877 | | | $ | 748,730 | | | $ | 47,161 | |
Accumulated capital and other losses | | | (9,677,443 | ) | | | (833,299 | ) | | | (4,387,405 | ) |
Unrealized apprecation on investments | | | 10,299,996 | | | | 10,706,225 | | | | 4,465,954 | |
Total accumulated earnings | | $ | 1,329,430 | | | $ | 10,621,656 | | | $ | 125,710 | |
At October 31, 2019, the difference between book basis and tax basis unrealized appreciation (depreciation) is attributable to the tax deferral of losses on wash sales.
41
SMI FUNDS
NOTES TO THE FINANCIAL STATEMENTS
October 31, 2019 – (Continued)
NOTE 7. FEDERAL TAX INFORMATION – (Continued)
At October 31, 2019, the following Funds had net capital loss carryforwards which are available to offset future net capital gains, if any:
| | | SMI Fund | | | SMI Dynamic
Allocation Fund | | | SMI 50/40/10 Fund | |
| | | Short-Term | | | Long-Term | | | Short-Term | | | Long-Term | | | Short-Term | | | Long-Term | |
Non-Expiring | | $ | 9,677,443 | | | $ | — | | | $ | 833,299 | | | $ | — | | | $ | 4,387,405 | | | $ | — | |
Capital loss carryforwards are available to offset future realized capital gains and thereby reduce further taxable gain distributions. During the fiscal year ended October 31, 2019, the SMI Dynamic Allocation Fund utilized $4,533,054 of their capital loss carryforwards.
NOTE 8. COMMITMENTS AND CONTIGENCIES
The Trust indemnifies its officers and Trustees for certain liabilities that may arise from their performance of their duties to the Trust or the Funds. Additionally, in the normal course of business, the Trust enters into contracts that contain a variety of representations and warranties which provide general indemnifications. The Trust’s maximum exposure under these arrangements is unknown, as this would involve future claims that may be made against the Trust that have not yet occurred.
NOTE 9. SUBSEQUENT EVENT
Management of the Funds has evaluated the need for disclosures and/or adjustments resulting from subsequent events through the date at which these financial statements were issued. Based upon this evaluation, management has determined there were no items requiring adjustment of the financial statements or additional disclosure.
42
REPORT OF INDEPENDENT REGISTERED
PUBLIC ACCOUNTING FIRM
To the Shareholders of Sound Mind Investing Fund, SMI Dynamic Allocation Fund, and
SMI 50/40/10 Fund and
Board of Trustees of Valued Advisers Trust
Opinion on the Financial Statements
We have audited the accompanying statements of assets and liabilities, including the schedules of investments, of Sound Mind Investing Fund, SMI Dynamic Allocation Fund, and SMI 50/40/10 Fund (the “Funds”), each a series of Valued Advisers Trust, as of October 31, 2019, the related statements of operations for the year then ended, the statements of changes in net assets for each of the two years in the period then ended, including the related notes, and the financial highlights for each of the five periods in the period then ended (collectively referred to as the “financial statements”). In our opinion, the financial statements present fairly, in all material respects, the financial position of each of the Funds as of October 31, 2019, the results of their operations for the year then ended, the changes in their net assets for each of the two years in the period then ended, and the financial highlights for each of the five periods in the period then ended, in conformity with accounting principles generally accepted in the United States of America.
Basis for Opinion
These financial statements are the responsibility of the Funds’ management. Our responsibility is to express an opinion on the Funds’ financial statements based on our audits. We are a public accounting firm registered with the Public Company Accounting Oversight Board (United States) (“PCAOB”) and are required to be independent with respect to the Funds in accordance with the U.S. federal securities laws and the applicable rules and regulations of the Securities and Exchange Commission and the PCAOB.
We conducted our audits in accordance with the standards of the PCAOB. Those standards require that we plan and perform the audit to obtain reasonable assurance about whether the financial statements are free of material misstatement, whether due to error or fraud.
Our audits included performing procedures to assess the risks of material misstatement of the financial statements, whether due to error or fraud, and performing procedures that respond to those risks. Such procedures included examining, on a test basis, evidence regarding the amounts and disclosures in the financial statements. Our procedures included confirmation of securities owned as of October 31, 2019, by correspondence with the custodian. Our audits also included evaluating the accounting principles used and significant estimates made by management, as well as evaluating the overall presentation of the financial statements. We believe that our audits provide a reasonable basis for our opinion.
We have served as the auditor of one or more investment companies within SMI Funds since 2006.
COHEN & COMPANY, LTD.
Cleveland, Ohio
December 20, 2019
43
SUMMARY OF FUND EXPENSES – (Unaudited)
As a shareholder of a Fund, you incur two types of costs: (1) transaction costs and (2) ongoing costs, including management fees and other Fund expenses. These examples are intended to help you understand your ongoing costs (in dollars) of investing in each Fund and to compare these costs with the ongoing costs of investing in other mutual funds. Each Fund’s example is based on an investment of $1,000 invested at the beginning of the period and held for the entire period from May 1, 2019 through October 31, 2019.
Actual Expenses
The first line of the table below provides information about actual account values and actual expenses. You may use the information in this line, together with the amount you invested, to estimate the expenses that you paid over the period. Simply divide your account value by $1,000 (for example, an $8,600 account value divided by $1,000 = 8.6), then multiply the result by the number in the first line under the heading entitled “Expenses Paid During Period” to estimate the expenses you paid on your account during this period.
Hypothetical Example for Comparison Purposes
The second line of the table below provides information about hypothetical account values and hypothetical expenses based on the Fund’s actual expense ratio and an assumed rate of return of 5% per year before expenses, which is not the Fund’s actual return. The hypothetical account values and expenses may not be used to estimate the actual ending account balance or expenses you paid for the period. You may use this information to compare the ongoing costs of investing in the Fund and other funds. To do so, compare this 5% hypothetical example with the 5% hypothetical examples that appear in the shareholder reports of the other funds.
Expenses shown in the table are meant to highlight your ongoing costs only and do not reflect any transactional costs. Therefore, the second line of the table below is useful in comparing ongoing costs only and will not help you determine the relative costs of owning different funds. In addition, if transaction costs were included, your costs would have been higher.
44
SUMMARY OF FUND EXPENSES – (Unaudited), (Continued)
| | | Beginning
Account Value
May 1, 2019 | | | Ending
Account Value
October 31, 2019 | | | Expenses Paid
During Period(a) | | | Annualized
Expense Ratio | |
SMI FUND | | | | | | | | | | | | | | | | |
Actual | | $ | 1,000.00 | | | $ | 1,011.50 | | | $ | 5.98 | | | | 1.18 | % |
Hypothetical(b) | | $ | 1,000.00 | | | $ | 1,019.26 | | | $ | 6.01 | | | | 1.18 | % |
| | | | | | | | | | | | | | | | | |
SMI DYNAMIC ALLOCATION FUND | | | | | | | | |
Actual | | $ | 1,000.00 | | | $ | 1,060.10 | | | $ | 6.13 | | | | 1.18 | % |
Hypothetical(b) | | $ | 1,000.00 | | | $ | 1,019.26 | | | $ | 6.01 | | | | 1.18 | % |
| | | | | | | | | | | | | | | | | |
SMI 50/40/10 FUND | | | | | | | | | | | | | | | | |
Actual | | $ | 1,000.00 | | | $ | 1,027.10 | | | $ | 5.93 | | | | 1.16 | % |
Hypothetical(b) | | $ | 1,000.00 | | | $ | 1,019.36 | | | $ | 5.90 | | | | 1.16 | % |
(a) | Expenses are equal to the Fund’s annualized expense ratios, multiplied by the average account value over the period, multiplied by 184/365 (to reflect the one-half year period). |
(b) Hypothetical assumes 5% annual return before expenses.
ADDITIONAL FEDERAL INCOME TAX INFORMATION
(Unaudited)
The Form 1099-DIV you receive in January 2020 will show the tax status of all distributions paid to your account in calendar year 2019. Shareholders are advised to consult their own tax adviser with respect to the tax consequences of their investment in the Fund. As required by the Internal Revenue Code and/or regulations, shareholders must be notified regarding the status of qualified dividend income for individuals and the dividends received deduction for corporations.
Qualified Dividend Income. The SMI Fund, SMI Dynamic Allocation Fund and SMI 50/40/10 Fund designate approximately 7%, 83% and 68%, respectively, or up to the maximum amount of such dividends allowable pursuant to the Internal Revenue Code, as qualified dividend income eligible for a reduced tax rate.
Qualified Business Income. The SMI Dynamic Allocation Fund and SMI 50/40/10 Fund designate approximately 10% and 23%, respectively, of its ordinary income dividends, or up to the maximum amount of such dividends allowable pursuant to the Internal Revenue Code, as qualified business income.
Dividends Received Deduction. Corporate shareholders are generally entitled to take the dividends received deduction on the portion of the Fund’s dividend distribution that qualifies under tax law.For the SMI Fund, SMI Dynamic Allocation Fund and SMI 50/40/10 Fund’s calendar year 2019 ordinary income dividends, 60%, 36% and 94% qualifies for the corporate dividends received deduction.
For the year ended October 31, 2019, The SMI Fund and SMI 50/40/10 Fund designate $23,575,739 and $1,613,360, respectively, as long-term capital gain distributions.
45
TRUSTEES AND OFFICERS – (Unaudited)
The Board of Trustees supervises the business activities of the Trust. Each Trustee serves as a trustee until termination of the Trust unless the Trustee dies, resigns, retires or is removed.
The following table provides information regarding each of the Independent Trustees.
Name, Address*, Age,
Position with Trust**,
Term of Position with Trust | Principal Occupation During
Past 5 Years and Other Directorships | Other Directorships |
Andrea N. Mullins, 52
Independent Trustee Since December 2013 Chairperson since March 2017 | Current: Private investor; Independent Contractor, SWM Advisors (since April 2014). | Trustee, Angel Oak Funds Trust (since February 2019) (4 portfolios); Trustee, Angel Oak Strategic Credit Fund (since February 2019). |
Ira P. Cohen, 60
Independent Trustee
Since June 2010 | Current: Independent financial services consultant (since February 2005); Executive Vice President of Asset Management Services, Recognos Financial (since August 2015). | Trustee and Audit Committee Chairman, Griffin Institutional Access Credit Fund (since January 2017); Trustee and Audit Committee Chairman, Griffin Institutional Real Estate Access Fund (since May 2014); Trustee, Angel Oak Funds Trust (since October 2014) (4 portfolios) Trustee, Chairman, and Nominating and Governance Committee Chairman, Angel Oak Strategic Credit Fund (since December 2017). |
* | The address for each Trustee is 225 Pictoria Drive, Suite 450, Cincinnati, Ohio 45246. |
** | As of the date of this report, the Trust consists of 12 series. |
The following table provides information regarding the Trustee who is considered an “interested person” of the Trust, as that term is defined under the 1940 Act. Based on the experience of the Trustee, the Trust concluded that the individual described below should serve as a Trustee.
Name, Address*, Age,
Position with Trust**,
Term of Position with Trust | Principal Occupation During
Past 5 Years | Other Directorships |
Mark J. Seger, 57
Trustee Since March 2017 | Current: Vice Chairman of Ultimus Fund Solutions, LLC (since 1999). Previous: Managing Director and Co-Chief Executive Officer of Ultimus Fund Solutions, LLC (since 1999). | None. |
* | The address for each Trustee is 225 Pictoria Drive, Suite 450, Cincinnati, Ohio 45246. |
** | As of the date of this report, the Trust consists of 12 series. |
46
TRUSTEES AND OFFICERS – (Unaudited), (Continued)
The following table provides information regarding the Officers of the Trust:
Name, Address*, Age,
Position with Trust**,
Term of Position with Trust | Principal Occupation During
Past 5 Years | Other Directorships |
Adam T. Kornegay, 34
Principal Executive Officer and President Since April 2018 | Current: Vice President, Business Development Director, Ultimus Fund Solutions, LLC (since March 2015). Previous: Vice President, Citigroup, Inc. (July 2009 to February 2015). | None. |
Gregory T. Knoth, 49
Principal Financial Officer and Treasurer Since April 2019 | Current: Vice President, Mutual Fund Controller, Ultimus Fund Solutions, LLC (sinceJanuary 2016). Previous: Vice President and Manager of Fund Accounting, Huntington Asset Services, Inc. (n/k/a Ultimus Asset Services, LLC) (June 2013 to December 2015). | None. |
Martin R. Dean, 56
Interim Chief Compliance Officer Since May 2019 | Current: Vice President, Director of Fund Compliance of Ultimus Fund Solutions, LLC (since January 2016) Previous: Senior Vice President and Compliance Group Manager, Huntington Asset Services, Inc. (n/k/a Ultimus Asset Services, LLC) (July 2013 to December 2015). | None. |
Carol J. Highsmith, 55
Vice President SinceAugust 2008 Secretary Since March 2014 | Current: Assistant Vice President, Ultimus Fund Solutions, LLC (sinceJanuary 2016). Previous: Employed in various positions with Huntington Asset Services, Inc. (n/k/a Ultimus Asset Services, LLC) (November 1994 to December 2015), most recently Vice President of Legal Administration (2005 to December 2015). | None. |
* | The address for each officer is 225 Pictoria Drive, Suite 450, Cincinnati, Ohio 45246. |
** | As of the date of this report, the Trust consists of 12 series. |
47
OTHER INFORMATION – (Unaudited)
The Funds’ Statement of Additional Information (“SAI”) includes additional information about the trustees and is available without charge, upon request. You may call toll-free at (877) 764-3863 to request a copy of the SAI or to make shareholder inquiries.
48
FACTS | WHAT DO THE SMI FUNDS DO WITH YOUR PERSONAL INFORMATION? |
| | |
Why? | Financial companies choose how they share your personal information. Federal law gives consumers the right to limit some but not all sharing. Federal law also requires us to tell you how we collect, share, and protect your personal information. Please read this notice carefully to understand what we do. |
| | |
What? | The types of personal information we collect and share depend on the product or service you have with us. This information can include: ● Social Security number ● account balances and account transactions ● transaction or loss history and purchase history ● checking account information and wire transfer instructions |
| | When you are no longer our customer, we continue to share your information as described in this notice. |
| | |
How? | All financial companies need to share customers’ personal information to run their everyday business. In the section below, we list the reasons financial companies can share their customers’ personal information; the reasons SMI Funds chooses to share; and whether you can limit this sharing. |
| | |
Reasons we can share your personal information | Does SMI Funds share? |
For our everyday business purposes—
such as to process your transactions, maintain your account(s), respond to court orders and legal investigations, or report to credit bureaus | Yes |
For our marketing purposes—
to offer our products and services to you | No |
For joint marketing with other financial companies | No |
For our affiliates’ everyday business purposes—
information about your transactions and experiences | No |
For our affiliates’ everyday business purposes—
information about your creditworthiness | No |
For nonaffiliates to market to you | No |
| | |
Questions? | Call 1-877-764-3863 |
49
Who we are |
Who is providing this notice? | SMI Funds
Unified Financial Securities, LLC (Distributor)
Ultimus Fund Solutions, LLC (Administrator) |
| | |
What we do |
How does SMI Funds protect my personal information? | To protect your personal information from unauthorized access and use, we use security measures that comply with federal law. These measures include computer safeguards and secured files and buildings. |
How does SMI Funds collect my personal information? | We collect your personal information, for example, when you ● open an account or deposit money ● buy securities from us or sell securities to us ● make deposits or withdrawals from your account or provide account information ● give us your account information ● make a wire transfer ● tell us who receives the money ● tell us where to send the money ● show your government-issued ID ● show your driver’s license |
Why can’t I limit all sharing? | Federal law gives you the right to limit only ● sharing for affiliates’ everyday business purposes—information about your creditworthiness ● affiliates from using your information to market to you ● sharing for nonaffiliates to market to you State laws and individual companies may give you additional rights to limit sharing. |
Definitions |
Affiliates | Companies related by common ownership or control. They can be financial and nonfinancial companies. SMI Advisory Services, LLC, the investment adviser to the Funds, could be deemed to be an affiliate. |
Nonaffiliates | Companies not related by common ownership or control. They can be financial and nonfinancial companies. ● The SMI Funds do not share with nonaffiliates so they can market to you. |
Joint marketing | A formal agreement between nonaffiliated financial companies that together market financial products or services to you. ● The SMI Funds do not jointly market. |
50
PROXY VOTING
A description of the policies and procedures that each Fund uses to determine how to vote proxies relating to portfolio securities and information regarding how each Fund voted those proxies during the most recent twelve month period ended June 30 are available (1) without charge upon request by calling the Funds at (877) 764-3863 and (2) in the Funds’ documents filed with the Securities and Exchange Commission (“SEC”) on the SEC’s website at www.sec.gov.
TRUSTEES Andrea N. Mullins, Chairperson Ira P. Cohen Mark J. Seger OFFICERS Adam T. Kornegay, Principal Executive Officer and President Gregory T. Knoth, Principal Financial Officer and Treasurer Martin R. Dean, Interim Chief Compliance Officer Carol J. Highsmith, Vice President and Secretary INVESTMENT ADVISER SMI Advisory Services, LLC 4400 Ray Boll Blvd. Columbus, IN 47203 DISTRIBUTOR Unified Financial Securities, LLC 9465 Counselors Row, Suite 200 Indianapolis, IN 46240 | INDEPENDENT REGISTERED PUBLIC ACCOUNTING FIRM Cohen & Company, Ltd. 1350 Euclid Avenue, Suite 800 Cleveland, OH 44115 LEGAL COUNSEL Stradley Ronon Stevens & Young, LLP 2005 Market Street, Suite 2600 Philadelphia, PA 19103 CUSTODIAN Huntington National Bank 41 South High Street Columbus, OH 43215 ADMINISTRATOR, TRANSFER AGENT AND FUND ACCOUNTANT Ultimus Fund Solutions, LLC 225 Pictoria Drive, Suite 450 Cincinnati, OH 45246 |
This report is intended only for the information of shareholders or those who have received the Funds’ prospectus which contains information about each Fund’s management fee and expenses. Please read the prospectus carefully before investing.
Distributed by Unified Financial Securities, LLC
Member FINRA/SIPC
51
THIS PAGE INTENTIONALLY LEFT BLANK
THIS PAGE INTENTIONALLY LEFT BLANK

SOUND MIND
INVESTING FUND
(SMIFX)
SMI DYNAMIC
ALLOCATION FUND
(SMIDX)
SMI 50/40/10 FUND
(SMILX)
ANNUAL REPORT |
OCTOBER 31, 2019 |
Funds’ Adviser:
SMI Advisory Services, LLC
4400 Ray Boll Blvd.
Columbus, IN 47203
(877) 764-3863
(877) SMI-FUND
www.smifund.com
Item 2. Code of Ethics.
As of the end of the period covered by this report, the registrant has adopted a code of ethics that applies to the registrant’s principal executive officer, principal financial officer, principal accounting officer or controller, or persons performing similar functions, regardless of whether these individuals are employed by the registrant or a third party. Pursuant to Item 12(a)(1), a copy of registrant’s code of ethics is filed as an exhibit to this Form N-CSR. During the period covered by this report, the code of ethics has not been amended, and the registrant has not granted any waivers, including implicit waivers, from the provisions of the code of ethics.
Item 3. Audit Committee Financial Expert.
(a)(1) The registrant’s Board of Trustees has determined that the registrant has at least one audit committee financial expert serving on its audit committee.
(a)(2) The audit committee financial expert is Andrea N. Mullins, who is “independent” for purposes of this Item 3 of Form N-CSR.
Item 4. Principal Accountant Fees and Services.
| Sound Mind Investing Funds: | FY 2019 | $40,500 |
| | FY 2018 | $40,500 |
| | | |
| Green Owl Intrinsic Value Fund: | FY 2019 | $13,500 |
| | FY 2018 | $13,500 |
| | | |
| Foundry Partners Fundamental | | |
| Small Cap Value Fund: | FY 2019 | $14,000 |
| | FY 2018 | $14,000 |
| | | |
| Dana Funds: | FY 2019 | $42,000 |
| | FY 2018 | $28,000 |
| Sound Mind Investing Funds: | FY 2019 | $0 |
| | FY 2018 | $0 |
| | | |
| Green Owl Intrinsic Value Fund: | FY 2019 | $0 |
| | FY 2018 | $0 |
| | | |
| Foundry Partners Fundamental | | |
| Small Cap Value Fund: | FY 2019 | $0 |
| | FY 2018 | $0 |
| | | |
| Dana Funds: | FY 2019 | $0 |
| | FY 2018 | $0 |
| Sound Mind Investing Funds: | FY 2019 | $9,000 |
| | FY 2018 | $9,000 |
| | | |
| Green Owl Intrinsic Value Fund: | FY 2019 | $3,000 |
| | FY 2018 | $3,000 |
| Foundry Partners Fundamental | | |
| Small Cap Value Fund: | FY 2019 | $3,000 |
| | FY 2018 | $3,000 |
| | | |
| Dana Funds: | FY 2019 | $9,000 |
| | FY 2018 | $6,000 |
| Nature of the fees: | Preparation of the 1120 RIC and Excise review |
| Sound Mind Investing Funds: | FY 2019 | $0 |
| | FY 2018 | $0 |
| | | |
| Green Owl Intrinsic Value Fund: | FY 2019 | $0 |
| | FY 2018 | $0 |
| | | |
| Foundry Partners Fundamental | | |
| Small Cap Value Fund: | FY 2019 | $0 |
| | FY 2018 | $0 |
| | | |
| Dana Funds: | FY 2019 | $0 |
| | FY 2018 | $0 |
| (e) | (1)Audit Committee’s Pre-Approval Policies |
The Audit Committee Charter requires the Audit Committee to be responsible for the selection, retention or termination of auditors and, in connection therewith, to (i) evaluate the proposed fees and other compensation, if any, to be paid to the auditors, (ii) evaluate the independence of the auditors, (iii) pre-approve all audit services and, when appropriate, any non-audit services provided by the independent auditors to the Trust, (iv) pre-approve, when appropriate, any non-audit services provided by the independent auditors to the Trust's investment adviser, or any entity controlling, controlled by, or under common control with the investment adviser and that provides ongoing services to the Trust if the engagement relates directly to the operations and financial reporting of the Trust, and (v) receive the auditors’ specific representations as to their independence;
| (2) | All of the services described in paragraphs (b) through (d) of Item 4 were pre-approved by the Audit Committee. |
(f) During audit of registrant's financial statements for the most recent fiscal year, less than 50 percent of the hours expended on the principal accountant's engagement were attributed to work performed by persons other than the principal accountant's full-time, permanent employees.
(g) The aggregate non-audit fees billed by the registrant's accountant for services rendered to the registrant, and rendered to the registrant's investment adviser (not including any sub-adviser whose role is primarily portfolio management and is subcontracted with or overseen by another investment adviser), and any entity controlling, controlled by, or under common control with the adviser that provides ongoing services to the registrant:
| | Registrant | Adviser |
| FY 2019 | $24,000 | $0 |
| FY 2018 | $21,000 | $0 |
(h) Not applicable. The auditor performed no services for the registrant’s investment adviser or any entity controlling, controlled by, or under common control with the investment adviser that provides ongoing services to the registrant.
Item 5. Audit Committee of Listed Companies.NOT APPLICABLE – applies to listed companies only
Item 6. Schedule of Investments.Schedules filed with Item 1.
Item 7. Disclosure of Proxy Voting Policies and Procedures for Closed-End Management Investment Companies. NOT APPLICABLE – applies to closed-end funds only
Item 8. Portfolio Managers of Closed-End Investment Companies.NOT APPLICABLE – applies to closed-end funds only
Item 9. Purchases of Equity Securities by Closed-End Management Investment Company and Affiliated Purchasers. NOT APPLICABLE – applies to closed-end funds only
Item 10. Submission of Matters to a Vote of Security Holders.
The guidelines applicable to shareholders desiring to submit recommendations for nominees to the Registrant's board of trustees are contained in the statement of additional information of the Trust with respect to the Fund(s) for which this Form N-CSR is being filed.
Item 11. Controls and Procedures.
(a) Based on their evaluation of the registrant’s disclosure controls and procedures (as defined in Rule 30a-3(c) under the Investment Company Act of 1940, as amended (the “Act”)) as of a date within 90 days of the filing date of this report, the registrant’s principal executive officer and principal financial officer have concluded that such disclosure controls and procedures are reasonably designed and are operating effectively to ensure that material information relating to the registrant is made known to them by others within those entities, particularly during the period in which this report is being prepared, and that the information required in filings on Form N-CSR is recorded, processed, summarized, and reported on a timely basis.
(b) There were no changes in the registrant’s internal control over financial reporting (as defined in Rule 30a-3(d) under the Investment Company Act of 1940) that occurred during the second fiscal quarter of the period covered by this report that have materially affected, or are reasonably likely to materially affect, the registrant’s internal control over financial reporting.
Item 12. Disclosure of Securities Lending Activities for Closed-End Management Investment Companies.NOT APPLICABLE – applies to closed-end funds only
Item 13. Exhibits.
| (a) (1) | Code is filed herewith. |
| (2) | Certifications by the registrant's principal executive officer and principal financial officer, pursuant to Section 302 of the Sarbanes- Oxley Act of 2002 and required by Rule 30a-2 under the Investment Company Act of 1940 are filed herewith. |
| (b) | Certification pursuant to 18 U.S.C. Section 1350, as adopted pursuant to Section 906 of the Sarbanes-Oxley Act of 2002 is filed herewith. |
Pursuant to the requirements of the Securities Exchange Act of 1934 and the Investment Company Act of 1940, the registrant has duly caused this report to be signed on its behalf by the undersigned, thereunto duly authorized.
| (Registrant) | Valued Advisers Trust | |
| | | |
| By /s/ Adam T. Kornegay | |
| Adam T. Kornegay, President and Principal Executive Officer | |
| | | |
| Date | 1/03/2020 | |
Pursuant to the requirements of the Securities Exchange Act of 1934 and the Investment Company Act of 1940, this report has been signed below by the following persons on behalf of the registrant and in the capacities and on the dates indicated.
| By /s/ Adam T. Kornegay | |
| Adam T. Kornegay, President and Principal Executive Officer | |
| | | |
| Date | 1/03/2020 | |
| | | |
| By /s/ Gregory Knoth | |
| Gregory Knoth, Treasurer and Principal Financial Officer | |
| | | |
| Date | 1/03/2020 | |