united states
securities and exchange commission
washington, d.c. 20549
form n-csr
certified shareholder report of registered management
investment companies
| Investment Company Act file number | 811-22208 | |
Valued Advisers Trust
(Exact name of registrant as specified in charter)
| Ultimus Fund Solutions, LLC 225 Pictoria Drive, Suite 450 | Cincinnati, OH |
| 45246 (Address of principal executive offices) | (Zip code) |
Ultimus Fund Solutions, LLC
Attn: Gregory Knoth
225 Pictoria Drive, Suite 450
Cincinnati, OH 45246
(Name and address of agent for service)
| Registrant's telephone number, including area code: | 513-587-3400 | |
| Date of fiscal year end: | 1/31 | |
| | | |
| Date of reporting period: | 1/31/2020 | |
Item 1. Reports to Stockholders.

Golub Group Equity Fund
GGEFX
Annual Report
January 31, 2020
Beginning on January 1, 2021, as permitted by regulations adopted by the Securities and Exchange Commission, paper copies of the Fund’s shareholder reports like this one will no longer be sent by mail, unless you specifically request paper copies of the reports from the Fund or from your financial intermediary such as a broker-dealer or bank. Instead, the reports will be made available on a website, and you will be notified by mail each time a report is posted and provided with a website link to access the report.
If you already elected to receive shareholder reports electronically, you will not be affected by this change and you need not take any action. You may elect to receive shareholder reports and other communications from the Fund electronically by contacting the Fund at (866) 954-6682 or, if you own these shares through a financial intermediary, you may contact your financial intermediary.
You may elect to receive all future reports in paper free of charge. You can inform the Fund that you wish to continue receiving paper copies of your shareholder reports by contacting the Fund at (866) 954-6682. If you own shares through a financial intermediary, you may contact your financial intermediary or follow instructions included with this document to elect to continue to receive paper copies of your shareholder reports. Your election to receive reports in paper will apply to all funds held with the fund complex or at your financial intermediary.
Summitry LLC
1850 Gateway Drive, Suite 100
San Mateo, CA 94404
(866) 954-6682
Management’s Discussion Of Fund Performance For The Fiscal Year Ended January 31, 2020 (Unaudited)
The Golub Group Equity Fund (the “Fund”) returned 16.15% for the fiscal year ending January 31, 2020. In comparison, our benchmark, the S&P 500® Index (the “S&P 500”)*, returned 21.68% during the same period. Since inception on April 1, 2009, the Fund has returned 269.78% as compared to the 397.31% return of the benchmark.
The S&P 500 logged its best calendar year since 2013 with the majority of global markets following suit. The strong returns across financial assets were accomplished despite a continuation of the trade dispute with China, impeachment proceedings involving a sitting President for only the third time in our country’s history, increasing political polarization in the U.S. and abroad, increasing tensions with Iran, slowing manufacturing trends, and many other factors that could understandably have led investors to seek shelter rather than participate. And yet, markets advanced.
So, what of the future? We wish we had a crystal ball for the markets, but in its absence, we focus on the two things that matter most when building portfolios and building wealth: fundamentals and valuation.
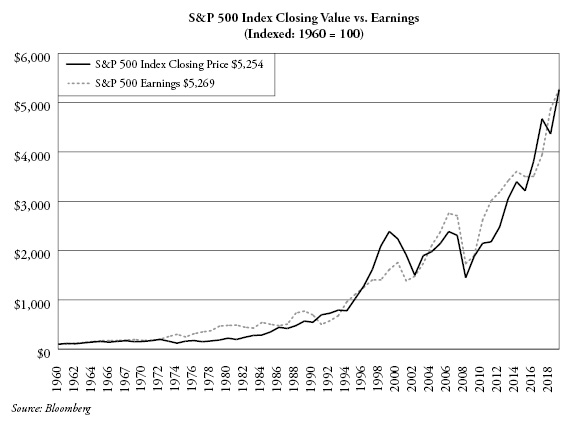
Fundamentals: The chart below delivers a powerful message that fundamentals matter—a lot. The blue line shows the value of the S&P 500 since 1960. The red line shows the level of earnings generated by S&P 500 companies. Statisticians will note that the correlation of these two lines is extremely high (~0.97). Earnings are clearly an important reflection of business fundamentals. If we can build confidence around the direction and pace of earnings growth, we will have done ourselves a service as investors. When we purchase stocks, we therefore focus a great deal of attention on projecting the underlying business’s earnings several years into the future.
1
Management’s Discussion Of Fund Performance For The Fiscal Year Ended January 31, 2020 (Unaudited)
This is nevertheless a simplistic view of business fundamentals. When we look at businesses and project earnings, we consider a multitude of factors, like balance sheet strength, competitive position, cyclicality, the evolving macro and micro-economic environment, etc.
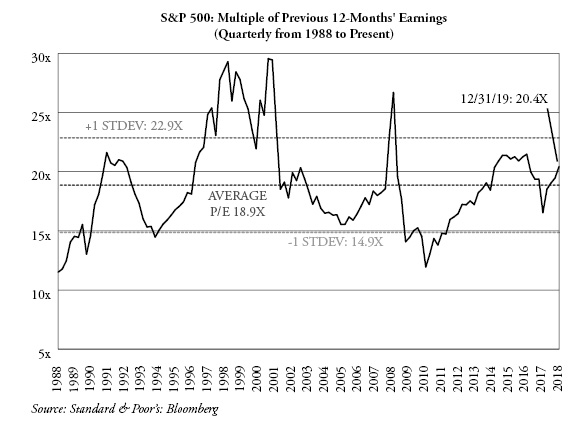
Valuation: The second important factor is valuation. The chart below provides one common measure of total-stock-market valuation, the P/E ratio. It answers the question, what price does the market pay for the earnings generated by the companies that make up the market? And how does that price compare with the past? As you can see, there is variability in this measure over time. Today, the market trades at roughly 20x the earnings that were produced by S&P 500 companies over the previous 12 months. This is slightly above average when compared to the period beginning in 1988, as shown in the chart. We view the market on average as neither expensive nor cheap. But the S&P 500 is an index made up of 500 constituent companies. Some represent better bargains than others. Our job, in a nutshell, is to find businesses with strong fundamentals that are available at bargain prices.
Investing is an inexact science, but having a time-tested discipline focused on fundamentals and valuation should help a lot to improve the consistency of returns. It allows us to spend less time guessing about whether or by how much the market will react to factors that have limited influence on business fundamentals. We don’t need to know if the Republicans or Democrats will control Congress and the White House next November to make a decision about whether a business is well positioned competitively or its stock is cheap or expensive, and we don’t have to guess whether the storming of an embassy in Baghdad and heightened military tensions will impact the market, because we are invested in businesses that are durable.
2
Management’s Discussion Of Fund Performance For The Fiscal Year Ended January 31, 2020 (Unaudited)
During the period, the Fund underperformed on a relative basis primarily due to security selection. From a sector perspective, relative to the benchmark, the portfolio maintained an overweight position in Technology (24.8% vs. 23.9%), Financials (19.4% vs. 15.1%), Communication Services (18.8% vs. 10.6%) and Consumer Discretionary (17.6% vs. 10.3%). The relative overweight sector allocations, in particular Communication Services (820 bps of variance) and Consumer Discretionary (730 bps of variance) were large contributors to the performance difference as compared to our benchmark. Our largest weighted sector, Technology, was also our best performing sector and returned nearly 42% during the period. Our top performing stocks were Apple up 86.2%, Microsoft up 62.9%, Mastercard up 48.2% and Visa up 47.4%. Berkshire Hathaway ended the period as our largest holding, followed by Visa, Alphabet, Facebook and Wells Fargo.
From a sector perspective, Materials and Financials were our worst performing sectors. Two Industrial holdings, Owens Illinois and Bank of New York Mellon, were our worst performing stocks, falling 58.2% and 16.1% respectively during the period.
We added the following five (5) new positions to the Fund: during the period Mastercard, Fox Corporation, Lowe’s, BlackRock and Ulta Beauty. During the period, we sold the following six (6) positions in their entirety: Novartis, Bank of New York Mellon, Deere, Owens Illinois, LabCorp and Allergan.
In addition to the stock and security selection, the advisor’s decision to waive fees and reimburse expenses to the Fund due to the expense limitation cap impacted performance. Had the advisor not waived and reimbursed these expenses, the performance of the Fund would have been lower.
We remain focused on our long-term discipline of investing in high-quality, large-cap businesses that trade at attractive valuations and are confident that our style of investing is particularly well-suited for the period ahead.
Sincerely,
Summitry LLC
* | The S&P 500® Index is a widely recognized unmanaged index of equity prices and is representative of a broader market and range of securities than is found in the Fund’s portfolio. Individuals cannot invest directly in the Index; however, an individual can invest in exchange-traded funds or other investment vehicles that attempt to track the performance of a benchmark index. |
The views in the foregoing discussion were those of the Fund’s investment advisor as of the date set forth above and may not reflect its views on the date this Annual Report is first published or anytime thereafter. These views are intended to assist shareholders in understanding their investment in the Fund and do not constitute investment advice.
The performance information quoted above represents past performance and past performance does not guarantee future results. Investment return and principal value of an investment will fluctuate so that an investor’s shares, when redeemed, may be worth more or less than their original cost. Current performance may be lower or higher than the performance data quoted. Performance data, current to the most recent month end, may be obtained by calling the Fund at 1-866-954-6682. Fee waivers and expense reimbursements have positively impacted Fund performance. An investor should consider the Fund’s investment objectives, risks, and charges and expenses carefully before investing. The Fund’s Prospectus contains this and other important information. For information on the Fund’s expense ratio, please see the Financial Highlights Table found within the accompanying Annual Report.
3
Investment Results (Unaudited)
Average Annual Total Returns as of January 31, 2020 (a)
| One Year | Three Year | Five Year | Ten Year |
Golub Group Equity Fund | 16.15% | 8.98% | 9.34% | 11.07% |
S&P 500® Index(b) | 21.68% | 14.54% | 12.37% | 13.97% |
Total annual operating expenses, as disclosed in the most recent Golub Group Equity Fund (the “Fund”) prospectus dated May 31, 2019, were 1.37% of average daily net assets (1.27% after fee waivers/expense reimbursements by Summitry LLC (the “Adviser”)). The Adviser changed its name from Golub Group, LLC to Summitry LLC effective January 31, 2020. The Adviser has contractually agreed to waive or limit its fees and assume other expenses of the Fund until May 31, 2020, so that Total Annual Fund Operating Expenses do not exceed 1.25%. This contractual arrangement may only be terminated by mutual consent of the Adviser and the Board of Trustees of Valued Advisers Trust (the “Trust”), and it will automatically terminate upon the termination of the investment advisory agreement between the Trust and the Adviser. This operating expense limitation does not apply to: (i) interest, (ii) taxes, (iii) brokerage commissions, (iv) other expenditures which are capitalized in accordance with generally accepted accounting principles, (v) other extraordinary expenses not incurred in the ordinary course of the Fund’s business, (vi) dividend expense on short sales, (vii) expenses incurred under a plan of distribution under Rule 12b-1, and (viii) expenses that the Fund has incurred but did not actually pay because of an expense offset arrangement, if applicable, incurred by the Fund in any fiscal year. The operating expense limitation also excludes any “Acquired Fund Fees and Expenses,” which are the expenses indirectly incurred by the Fund as a result of investing in money market funds or other investment companies that have their own expenses. Each fee waiver or reimbursement of an expense by the Adviser is subject to repayment by the Fund within the three years following such waiver or reimbursement, provided that the Fund is able to make the repayment without exceeding the expense limitation in place at the time of the waiver or reimbursement and the expense limitation in place at the time of the repayment.
The performance quoted represents past performance, which does not guarantee future results. The investment return and principal value of an investment will fluctuate so that an investor’s shares, when redeemed, may be worth more or less than their original cost. The returns shown do not reflect deduction of taxes that a shareholder would pay on Fund distributions or the redemption of Fund shares. Current performance of the Fund may be lower or higher than the performance quoted. The Fund’s investment objectives, risks, charges and expenses must be considered carefully before investing. Performance data current to the most recent month end may be obtained by calling (866) 954-6682.
(a) | Average annual total returns reflect any change in price per share and assume the reinvestment of all distributions. The Fund’s returns reflect any fee reductions during the applicable periods. If such fee reductions had not occurred, the quoted performance would have been lower. Information pertaining to the Fund’s expense ratios as of January 31, 2020 can be found in the financial highlights. |
(b) | The S&P 500® Index (“S&P 500”) is a widely recognized unmanaged index of equity securities and is representative of a broader domestic equity market and range of securities than is found in the Fund’s portfolio. Individuals cannot invest directly in the S&P 500; however, an individual can invest in exchange-traded funds or other investment vehicles that attempt to track the performance of a benchmark index. |
The Fund’s investment objectives, strategies, risks, charges and expenses must be considered carefully before investing. The prospectus contains this and other important information about the Fund and may be obtained by calling (866) 954-6682. Please read it carefully before investing.
The Fund is distributed by Ultimus Fund Distributors, LLC, member FINRA/SIPC.
4
Investment Results (Unaudited)
Comparison of the Growth of a $10,000 Investment in the
Golub Group Equity Fund and the S&P 500® Index
(Unaudited)
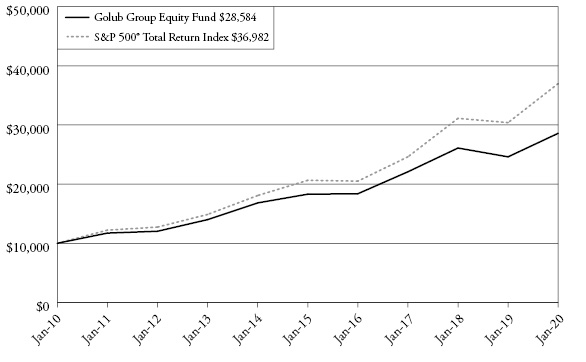
The chart above assumes an initial investment of $10,000 made on January 31, 2010 and held through January 31, 2020. THE FUND’S RETURN REPRESENTS PAST PERFORMANCE AND DOES NOT GUARANTEE FUTURE RESULTS. The returns shown do not reflect deduction of taxes that a shareholder would pay on Fund distributions or the redemption of Fund shares. Investment returns and principal values will fluctuate so that your shares, when redeemed, may be worth more or less than their original purchase price.
Current performance may be lower or higher than the performance data quoted. For more information on the Fund, and to obtain performance data current to the most recent month end or to request a prospectus, please call (866) 954-6682. You should carefully consider the investment objectives, potential risks, management fees, and charges and expenses of the Fund before investing. The Fund’s prospectus contains this and other information about the Fund, and should be read carefully before investing.
The Fund is distributed by Ultimus Fund Distributors, LLC, member FINRA/SIPC.
5
Fund Holdings (Unaudited)
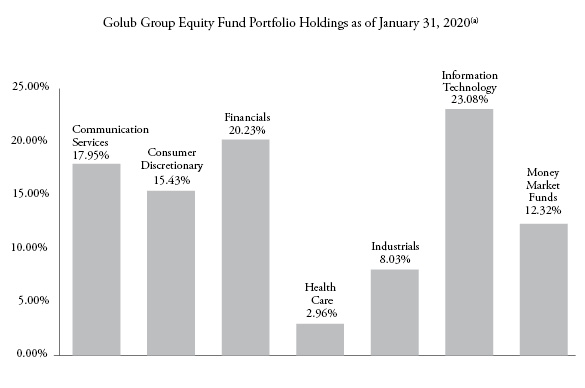
(a) | As a percentage of net assets. As of January 31, 2020, the Fund held no securities in the Consumer Staples, Energy, Materials, Real Estate or Utilities sectors. |
The investment objective of the Fund is to provide long-term capital appreciation. A secondary objective is to provide current income.
Availability of Portfolio Schedule (Unaudited)
The Fund files its complete schedule of portfolio holdings with the Securities and Exchange Commission (the “SEC”) for the first and third quarters of each fiscal year within sixty days after the end of the period. The Fund’s portfolio holdings are available at the SEC’s website at www.sec.gov.
6
Golub Group Equity Fund
Schedule of Investments
January 31, 2020
| | Shares | | | Fair Value | |
COMMON STOCKS — 87.68% | | | | | | | | |
| | | | | | | | | |
Communication Services — 17.95% | | | | | | | | |
Alphabet, Inc., Class A(a) | | | 2,152 | | | $ | 3,083,343 | |
Facebook, Inc., Class A(a) | | | 15,000 | | | | 3,028,650 | |
Fox Corporation, Class A | | | 63,980 | | | | 2,372,378 | |
Walt Disney Company (The) | | | 17,770 | | | | 2,457,769 | |
| | | | | | | | 10,942,140 | |
Consumer Discretionary — 15.43% | | | | | | | | |
Booking Holdings, Inc.(a) | | | 1,348 | | | | 2,467,582 | |
Expedia Group, Inc. | | | 15,165 | | | | 1,644,644 | |
Lowe’s Companies, Inc. | | | 23,120 | | | | 2,687,468 | |
Ulta Beauty, Inc.(a) | | | 9,735 | | | | 2,608,104 | |
| | | | | | | | 9,407,798 | |
Financials — 20.23% | | | | | | | | |
Bank of America Corporation | | | 36,465 | | | | 1,197,146 | |
Berkshire Hathaway, Inc., Class B(a) | | | 18,750 | | | | 4,208,063 | |
BlackRock, Inc. | | | 3,642 | | | | 1,920,609 | |
Citigroup, Inc. | | | 26,610 | | | | 1,980,050 | |
Wells Fargo & Company | | | 64,425 | | | | 3,024,109 | |
| | | | | | | | 12,329,977 | |
Health Care — 2.96% | | | | | | | | |
Medtronic plc | | | 15,630 | | | | 1,804,327 | |
| | | | | | | | | |
Industrials — 8.03% | | | | | | | | |
Flowserve Corporation | | | 35,075 | | | | 1,637,301 | |
General Electric Company | | | 162,540 | | | | 2,023,623 | |
W.W. Grainger, Inc. | | | 4,085 | | | | 1,236,407 | |
| | | | | | | | 4,897,331 | |
Information Technology — 23.08% | | | | | | | | |
Apple, Inc. | | | 7,300 | | | | 2,259,423 | |
Cognizant Technology Solutions Corporation, Class A | | | 36,650 | | | | 2,249,577 | |
Fiserv, Inc.(a) | | | 20,295 | | | | 2,407,190 | |
Mastercard, Inc., Class A | | | 5,180 | | | | 1,636,569 | |
Microsoft Corporation | | | 14,310 | | | | 2,435,991 | |
Visa, Inc., Class A | | | 15,495 | | | | 3,083,041 | |
| | | | | | | | 14,071,791 | |
Total Common Stocks (Cost $38,913,326) | | | | | | | 53,453,364 | |
| | See accompanying notes which are an integral part of these financial statements. | 7 |
Golub Group Equity Fund
Schedule of Investments (continued)
January 31, 2020
| | Shares | | | Fair Value | |
MONEY MARKET FUNDS — 12.32% | | | | | | | | |
| | | | | | | | | |
Fidelity Investments Money Market Government Portfolio, Institutional Class, 1.50%(b) | | | 7,507,798 | | | $ | 7,507,798 | |
Total Money Market Funds (Cost $7,507,798) | | | | | | | 7,507,798 | |
| | | | | | | | | |
Total Investments — 100.00% (Cost $46,421,124) | | | | | | | 60,961,162 | |
| | | | | | | | | |
Liabilities in Excess of Other Assets — 0.00% (c) | | | | | | | (1,062 | ) |
| | | | | | | | | |
NET ASSETS — 100.00% | | | | | | $ | 60,960,100 | |
(a) | Non-income producing security. |
(b) | Rate disclosed is the seven day effective yield as of January 31, 2020. |
The sectors shown on the schedule of investments are based on the Global Industry Classification Standard, or GICS® (“GICS”). The GICS was developed by and/or is the exclusive property of MSCI, Inc. and Standard & Poor’s Financial Services LLC (“S&P”). GICS is a service mark of MSCI, Inc. and S&P and has been licensed for use by Ultimus Fund Solutions, LLC.
8 | See accompanying notes which are an integral part of these financial statements. | |
Golub Group Equity Fund
Statement of Assets and Liabilities
January 31, 2020
Assets |
Investments in securities at fair value (cost $46,421,124) (Note 3) | | $ | 60,961,162 | |
Receivable for fund shares sold | | | 45,928 | |
Dividends receivable | | | 39,009 | |
Prepaid expenses | | | 8,748 | |
Total Assets | | | 61,054,847 | |
Liabilities |
Payable to Adviser (Note 4) | | | 49,061 | |
Payable to Administrator (Note 4) | | | 8,483 | |
Payable to trustees | | | 2,189 | |
Other accrued expenses | | | 35,014 | |
Total Liabilities | | | 94,747 | |
Net Assets | | $ | 60,960,100 | |
Net Assets consist of: | | | | |
Paid-in capital | | $ | 46,633,160 | |
Accumulated earnings | | | 14,326,940 | |
Net Assets | | $ | 60,960,100 | |
Shares outstanding (unlimited number of shares authorized, no par value) | | | 3,176,769 | |
Net asset value (“NAV”), offering and redemption price per share (Note 2) | | $ | 19.19 | |
| | See accompanying notes which are an integral part of these financial statements. | 9 |
Golub Group Equity Fund
Statement of Operations
For the year ended January 31, 2020
Investment Income | | | | |
Dividend income (net of foreign taxes withheld of $22,105) | | $ | 718,248 | |
Non-cash income | | | 66,636 | |
Total investment income | | | 784,884 | |
Expenses | | | | |
Investment Adviser fees (Note 4) | | | 577,277 | |
Administration fees (Note 4) | | | 53,416 | |
Fund accounting fees (Note 4) | | | 25,000 | |
Legal fees | | | 22,741 | |
Transfer agent fees (Note 4) | | | 20,000 | |
Audit and tax preparation fees | | | 17,905 | |
Registration expenses | | | 15,306 | |
Custodian fees | | | 8,696 | |
Printing and postage expenses | | | 8,133 | |
Trustee fees | | | 6,930 | |
Insurance expenses | | | 4,715 | |
Miscellaneous | | | 20,540 | |
Total expenses | | | 780,659 | |
Fees contractually waived by Adviser (Note 4) | | | (58,638 | ) |
Net operating expenses | | | 722,021 | |
Net investment income | | | 62,863 | |
Net Realized and Change in Unrealized Gain (Loss) on Investments |
Net realized gain on investment securities transactions | | | 207,719 | |
Net change in unrealized appreciation of investment securities | | | 8,394,720 | |
Net realized and change in unrealized gain on investments | | | 8,602,439 | |
Net increase in net assets resulting from operations | | $ | 8,665,302 | |
10 | See accompanying notes which are an integral part of these financial statements. | |
Golub Group Equity Fund
Statements of Changes in Net Assets
| | | For the
Year Ended
January 31, 2020 | | | For the
Year Ended
January 31, 2019 | |
Increase (Decrease) in Net Assets due to: | | | | | | | | |
Operations | | | | | | | | |
Net investment income | | $ | 62,863 | | | $ | 38,079 | |
Net realized gain on investment securities transactions | | | 207,719 | | | | 3,492,478 | |
Net change in unrealized appreciation (depreciation) of investment securities | | | 8,394,720 | | | | (7,220,288 | ) |
Net increase (decrease) in net assets resulting from operations | | | 8,665,302 | | | | (3,689,731 | ) |
Distributions to Shareholders (Note 2) | | | (1,590,747 | ) | | | (4,059,632 | ) |
Capital Transactions | | | | | | | | |
Proceeds from shares sold | | | 4,225,568 | | | | 4,740,949 | |
Reinvestment of distributions | | | 1,590,747 | | | | 4,059,632 | |
Amount paid for shares redeemed | | | (6,977,002 | ) | | | (8,377,509 | ) |
Net increase (decrease) in net assets resulting from capital transactions | | | (1,160,687 | ) | | | 423,072 | |
Total Increase (Decrease) in Net Assets | | | 5,913,868 | | | | (7,326,291 | ) |
Net Assets | | | | | | | | |
Beginning of year | | | 55,046,232 | | | | 62,372,523 | |
End of year | | $ | 60,960,100 | | | $ | 55,046,232 | |
Share Transactions | | | | | | | | |
Shares sold | | | 231,273 | | | | 261,657 | |
Shares issued in reinvestment of distributions | | | 84,479 | | | | 248,752 | |
Shares redeemed | | | (382,787 | ) | | | (475,935 | ) |
Net increase (decrease) in shares outstanding | | | (67,035 | ) | | | 34,474 | |
| | See accompanying notes which are an integral part of these financial statements. | 11 |
Golub Group Equity Fund
Financial Highlights
(For a share outstanding during each year)
| | | For the Year Ended January 31, | |
| | | 2020 | | | 2019 | | | 2018 | | | 2017 | | | 2016 | |
Selected Per Share Data | | | | | | | | | | | | | | | | | | | | |
Net asset value, beginning of year | | $ | 16.97 | | | $ | 19.43 | | | $ | 17.79 | | | $ | 15.96 | | | $ | 17.98 | |
| | | | | | | | | | | | | | | | | | | | | |
Investment operations: | | | | | | | | | | | | | | | | | | | | |
Net investment income | | | 0.02 | | | | 0.01 | | | | — | (a) | | | 0.04 | | | | 0.06 | |
Net realized and unrealized gain (loss) on investments | | | 2.72 | | | | (1.17 | ) | | | 3.13 | | | | 3.18 | | | | 0.11 | |
Total from investment operations | | | 2.74 | | | | (1.16 | ) | | | 3.13 | | | | 3.22 | | | | 0.17 | |
| | | | | | | | | | | | | | | | | | | | | |
Less distributions to shareholders from: | | | | | | | | | | | | | | | | | | | | |
Net investment income | | | (0.03 | ) | | | — | | | | — | | | | (0.05 | ) | | | (0.05 | ) |
Net realized gains | | | (0.49 | ) | | | (1.30 | ) | | | (1.49 | ) | | | (1.34 | ) | | | (2.14 | ) |
Total distributions | | | (0.52 | ) | | | (1.30 | ) | | | (1.49 | ) | | | (1.39 | ) | | | (2.19 | ) |
| | | | | | | | | | | | | | | | | | | | | |
Net asset value, end of year | | $ | 19.19 | | | $ | 16.97 | | | $ | 19.43 | | | $ | 17.79 | | | $ | 15.96 | |
| | | | | | | | | | | | | | | | | | | | | |
Total Return(b) | | | 16.15 | % | | | (5.70 | )% | | | 18.18 | % | | | 20.21 | % | | | 0.42 | % |
| | | | | | | | | | | | | | | | | | | | | |
Ratios and Supplemental Data: | | | | | | | | | | | | | | | | | | | | |
Net assets, end of year (000 omitted) | | $ | 60,960 | | | $ | 55,046 | | | $ | 62,373 | | | $ | 53,818 | | | $ | 43,939 | |
Ratio of expenses to average net assets after expense waiver | | | 1.25 | % | | | 1.25 | % | | | 1.25 | % | | | 1.25 | % | | | 1.25 | % |
Ratio of expenses to average net assets before expense waiver | | | 1.35 | % | | | 1.35 | % | | | 1.33 | % | | | 1.37 | % | | | 1.40 | % |
Ratio of net investment income to average net assets after expense waiver | | | 0.11 | % | | | 0.07 | % | | | 0.01 | % | | | 0.22 | % | | | 0.34 | % |
Portfolio turnover rate | | | 27.62 | % | | | 31.30 | % | | | 22.38 | % | | | 26.59 | % | | | 42.99 | % |
(a) | Rounds to less than $0.005 per share. |
(b) | Total return in the above table represents the rate that the investor would have earned or lost on an investment in the Fund, assuming reinvestment of distributions. |
12 | See accompanying notes which are an integral part of these financial statements. | |
Golub Group Equity Fund
Notes to the Financial Statements
January 31, 2020
NOTE 1. ORGANIZATION
The Golub Group Equity Fund (the “Fund”) was organized as an open-end diversified series of Valued Advisers Trust (the “Trust”) on April 1, 2009. The Trust is a management investment company established under the laws of Delaware by an Agreement and Declaration of Trust dated June 13, 2008 (the “Trust Agreement”). The Trust Agreement permits the Board of Trustees (the “Board”) to issue an unlimited number of shares of beneficial interest of separate series without par value. The Fund is one of a series of funds authorized by the Board. The Fund’s investment adviser is Summitry LLC (the “Adviser”). The Adviser changed its name from Golub Group, LLC to Summitry LLC effective January 31, 2020. The investment objective of the Fund is to provide long-term capital appreciation. A secondary objective is to provide current income.
NOTE 2. SIGNIFICANT ACCOUNTING POLICIES
The Fund is an investment company and follows accounting and reporting guidance under Financial Accounting Standards Board Accounting Standards Codification (“ASC”) Topic 946, “Financial Services-Investment Companies.” The following is a summary of significant accounting policies followed by the Fund in the preparation of its financial statements. These policies are in conformity with generally accepted accounting principles in the United States of America (“GAAP”).
Estimates – The preparation of financial statements in conformity with GAAP requires management to make estimates and assumptions that affect the reported amounts of assets and liabilities and disclosure of contingent assets and liabilities at the date of the financial statements and the reported amounts of increases and decreases in net assets from operations during the reporting period. Actual results could differ from those estimates.
Federal Income Taxes – The Fund makes no provision for federal income or excise tax. The Fund has qualified and intends to qualify each year as a regulated investment company (“RIC”) under subchapter M of the Internal Revenue Code of 1986, as amended, by complying with the requirements applicable to RICs and by distributing substantially all of its taxable income. The Fund also intends to distribute sufficient net investment income and net realized capital gains, if any, so that it will not be subject to excise tax on undistributed income and gains. If the required amount of net investment income or gains is not distributed, the Fund could incur a tax expense.
As of and during the fiscal year ended January 31, 2020, the Fund did not have any liabilities for any unrecognized tax benefits. The Fund recognizes interest and penalties, if any, related to unrecognized tax benefits as income tax expense on the statement of operations when incurred. During the fiscal year ended January 31, 2020, the Fund did not incur any interest or penalties. Management of the Fund has reviewed tax positions taken in tax years that remain subject to examination by all major tax jurisdictions, including federal (i.e., the last three tax year ends and the interim tax period since then, as applicable). Management believes that there is no tax liability resulting from unrecognized tax benefits related to uncertain tax positions taken.
Expenses – Expenses incurred by the Trust that do not relate to a specific fund of the Trust are allocated to the individual funds based on each fund’s relative net assets or another appropriate basis (as determined by the Board).
13
Golub Group Equity Fund
Notes to the Financial Statements (continued)
January 31, 2020
Security Transactions and Related Income – The Fund follows industry practice and records security transactions on the trade date for financial reporting purposes. The specific identification method is used for determining gains or losses for financial statement and income tax purposes. Dividend income is recorded on the ex-dividend date and interest income is recorded on an accrual basis. Discounts and premiums on securities purchased are accreted or amortized using the effective interest method, if applicable.Non-cash income, if any, is recorded at the fair market value of the securities received.Withholding taxes on foreign dividends have been provided for in accordance with the Fund’s understanding of the applicable country’s tax rules and rates.
Dividends and Distributions – The Fund intends to distribute its net investment income and net realized long-term and short-term capital gains, if any, at least annually. Dividends and distributions to shareholders, which are determined in accordance with income tax regulations, are recorded on the ex-dividend date. The treatment for financial reporting purposes of distributions made to shareholders during the period from net investment income or net realized capital gains may differ from their ultimate treatment for federal income tax purposes. These differences are caused primarily by differences in the timing of the recognition of certain components of income, expense or realized capital gain for federal income tax purposes. Where such differences are permanent in nature, they are reclassified among the components of net assets based on their ultimate characterization for federal income tax purposes. Any such reclassifications will have no effect on net assets, results of operations or net asset value (“NAV”) per share of the Fund.For the fiscal year ended January 31, 2020, the Fund did not make any reclassifications.
Share Valuation – The NAV is calculated each day the New York Stock Exchange is open by dividing the total value of the Fund’s assets, less liabilities, by the number of shares outstanding for the Fund.
NOTE 3. SECURITIES VALUATION AND FAIR VALUE MEASUREMENTS
Fair value is defined as the price that the Fund would receive upon selling an investment in a timely transaction to an independent buyer in the principal or most advantageous market of the investment. GAAP establishes a three-tier hierarchy to maximize the use of observable market data and minimize the use of unobservable inputs and to establish classification of fair value measurements for disclosure purposes.
Inputs refer broadly to the assumptions that market participants would use in pricing the asset or liability, including assumptions about risk (the risk inherent in a particular valuation technique used to measure fair value including a pricing model and/or the risk inherent in the inputs to the valuation technique). Inputs may be observable or unobservable. Observable inputs are inputs that reflect the assumptions market participants would use in pricing the asset or liability developed based on market data obtained and available from sources independent of the reporting entity. Unobservable inputs are inputs that reflect the reporting entity’s own assumptions about the assumptions market participants would use in pricing the asset or liability developed based on the best information available in the circumstances.
14
Golub Group Equity Fund
Notes to the Financial Statements (continued)
January 31, 2020
Various inputs are used in determining the value of the Fund’s investments. These inputs are summarized in the three broad levels listed below.
● | Level 1 – unadjusted quoted prices in active markets for identical investments and/or registered investment companies where the value per share is determined and published and is the basis for current transactions for identical assets or liabilities at the valuation date |
● | Level 2 – other significant observable inputs (including, but not limited to, quoted prices for an identical security in an inactive market, quoted prices for similar securities, interest rates, prepayment speeds, credit risk, etc.) |
● | Level 3 – significant unobservable inputs (including the Fund’s own assumptions in determining fair value of investments based on the best information available) |
The inputs used to measure fair value may fall into different levels of the fair value hierarchy. In such cases, for disclosure purposes, the level in the fair value hierarchy which is reported, is determined based on the lowest level input that is significant to the fair value measurement in its entirety.
Equity securities that are traded on any stock exchange are generally valued at the last quoted sale price on the security’s primary exchange. Lacking a last sale price, an exchange-traded security is generally valued at its last bid price. Securities traded in the NASDAQ over-the-counter market are generally valued at the NASDAQ Official Closing Price. When using the market quotations and when the market is considered active, the security is classified as a Level 1 security. In the event that market quotations are not readily available or are considered unreliable due to market or other events, the Fund values its securities and other assets at fair value in accordance with policies established by and under the general supervision of the Board. Under these policies, the securities will be classified as Level 2 or 3 within the fair value hierarchy, depending on the inputs used.
Investments in mutual funds, including money market mutual funds, are generally priced at the ending NAV. These securities are categorized as Level 1 securities.
In accordance with the Trust’s valuation policies, the Adviser is required to consider all appropriate factors relevant to the value of securities for which it has determined other pricing sources are not available or reliable as described above. No single method exists for determining fair value, because fair value depends upon the circumstances of each individual case. As a general principle, the current fair value of a security being valued by the Adviser would be the amount that the Fund might reasonably expect to receive upon the current sale. Methods that are in accordance with this principle may, for example, be based on (i) a multiple of earnings; (ii) a discount from market prices of a similar freely traded security (including a derivative security or a basket of securities traded on other markets, exchanges or among dealers); or (iii) yield to maturity with respect to debt issues, or a combination of these and other methods. Fair-value pricing is permitted if, in the Adviser’s opinion, the validity of market quotations appears to be questionable based on factors such as evidence of a thin market in the security based on a small number of quotations, a significant event occurs after the close of a market but before the Fund’s NAV calculation that may affect a security’s value, or the Adviser is aware of any other data that calls into question the reliability of market quotations.
15
Golub Group Equity Fund
Notes to the Financial Statements (continued)
January 31, 2020
The following is a summary of the inputs used to value the Fund’s investments as of January 31, 2020:
| | | Valuation Inputs | | | | | |
Assets | | Level 1 | | | Level 2 | | | Level 3 | | | Total | |
Common Stocks(a) | | $ | 53,453,364 | | | $ | — | | | $ | — | | | $ | 53,453,364 | |
Money Market Funds | | | 7,507,798 | | | | — | | | | — | | | | 7,507,798 | |
Total | | $ | 60,961,162 | | | $ | — | | | $ | — | | | $ | 60,961,162 | |
(a) | Refer to Schedule of Investments for sector classifications. |
The Fund did not hold any investments at the end of the reporting period for which significant unobservable inputs (Level 3) were used in determining fair value; therefore, no reconciliation of Level 3 securities is included for this reporting period. The Fund did not hold any derivative instruments during the reporting period.
NOTE 4. TRANSACTIONS WITH AFFILIATES AND OTHER SERVICE PROVIDERS
Under the terms of the investment advisory agreement on behalf of the Fund, the Adviser manages the Fund’s investments subject to oversight of the Board. As compensation for its services, the Fund pays the Adviser a fee, computed and accrued daily and paid monthly, at an annual rate of 1.00% of the average daily net assets of the Fund. For the fiscal year ended January 31, 2020, the Adviser earned a fee of $577,277 from the Fund before the waivers described below. At January 31, 2020, the Fund owed the Adviser $49,061.
The Adviser has contractually agreed to waive its management fee or limit its fee and reimburse certain Fund operating expenses, until May 31, 2020, so that the ratio of total annual operating expenses does not exceed 1.25%. This operating expense limitation does not apply to interest, taxes, brokerage commissions, other expenditures which are capitalized in accordance with GAAP, other extraordinary expenses not incurred in the ordinary course of the Fund’s business, dividend expense on short sales, expenses incurred under a plan of distribution under Rule 12b-1, and expenses that the Fund has incurred but did not actually pay because of an expense offset arrangement, if applicable, incurred by the Fund in any fiscal year. The operating expense limitation also excludes any “Acquired Fund Fees and Expenses.” Acquired Fund Fees and Expenses represent the pro rata expense indirectly incurred by the Fund as a result of investing in other investment companies, including exchange-traded funds, closed-end funds and money market funds that have their own expenses. For the fiscal year ended January 31, 2020, the Adviser waived fees of $58,638.
16
Golub Group Equity Fund
Notes to the Financial Statements (continued)
January 31, 2020
Each fee waiver or expense reimbursement by the Adviser is subject to repayment by the Fund within three years following such waiver or reimbursement, provided that the Fund is able to make the repayment without exceeding the expense limitation in effect at the time of the waiver and any expense limitation in place at the time of repayment. As of January 31, 2020, the Adviser may seek repayment of investment advisory fee waivers and expense reimbursements as follows:
Recoverable through | | | |
January 31, 2021 | | $ | 45,426 | |
January 31, 2022 | | | 59,903 | |
January 31, 2023 | | | 58,638 | |
The Trust retains Ultimus Fund Solutions, LLC (“Ultimus” or “Administrator”) to provide the Fund with administration and compliance, fund accounting, and transfer agent services, including all regulatory reporting. For the fiscal year ended January 31, 2020, the Administrator earned fees of $53,416 for administration and compliance services, $25,000 for fund accounting services and $20,000 for transfer agent services. At January 31, 2020, the Fund owed the Administrator $8,483 for such services.
The officers and one trustee of the Trust are members of management and/or employees of the Administrator. Ultimus Fund Distributors, LLC (the “Distributor”), a wholly owned subsidiary of Ultimus, acts as the distributor of the Fund’s shares. There were no payments made to the Distributor by the Fund for the fiscal year ended January 31, 2020.
The Fund has adopted a Distribution Plan (the “Plan”) pursuant to Rule 12b-1 under the Investment Company Act of 1940 (the “1940 Act”). The Plan provides that the Fund will pay the Distributor and/or any registered securities dealer, financial institution or any other person (the “Recipient”) a shareholder servicing fee of 0.25% of the average daily net assets of the Fund in connection with the promotion and distribution of the Fund’s shares or the provision of personal services to shareholders, including, but not necessarily limited to, advertising, compensation to underwriters, dealers and selling personnel, the printing and mailing of prospectuses to other than current Fund shareholders, the printing and mailing of sales literature and servicing shareholder accounts (“12b-1 Expenses”). The Fund or Distributor may pay all or a portion of these fees to any Recipient who renders assistance in distributing or promoting the sale of shares, or who provides certain shareholder services, pursuant to a written agreement. The Plan is a compensation plan, which means that compensation is provided regardless of 12b-1 Expenses actually incurred. It is anticipated that the Plan will benefit shareholders because an effective sales program typically is necessary in order for the Fund to reach and maintain a sufficient size to achieve efficiently its investment objectives and to realize economies of scale. The Plan is not active and will not be activated prior to May 31, 2020.
NOTE 5. PURCHASES AND SALES OF SECURITIES
For the fiscal year ended January 31, 2020, purchases and sales of investment securities, other than short-term investments, were $14,538,247 and $18,116,703, respectively.
17
Golub Group Equity Fund
Notes to the Financial Statements (continued)
January 31, 2020
There were no purchases or sales of long-term U.S. government obligations during the fiscal year ended January 31, 2020.
NOTE 6. FEDERAL TAX INFORMATION
At January 31, 2020, the net unrealized appreciation (depreciation) and tax cost of investments for tax purposes was as follows:
Gross unrealized appreciation | | $ | 15,236,157 | |
Gross unrealized depreciation | | | (696,119 | ) |
Net unrealized appreciation on investments | | $ | 14,540,038 | |
Tax cost of investments | | $ | 46,421,124 | |
The tax character of distributions paid for the fiscal years ended January 31, 2020 and January 31, 2019 were as follows:
| | 2020 | | | 2019 | |
Distributions paid from: | | | | | | | | |
Ordinary income (a) | | $ | 85,367 | | | $ | — | |
Long-term capital gains | | | 1,505,380 | | | | 4,059,632 | |
Total distributions paid | | $ | 1,590,747 | | | $ | 4,059,632 | |
(a) | For federal income tax purposes, distributions of short-term capital gains are treated as ordinary income distributions. |
At January 31, 2020, the components of accumulated earnings (deficit) on a tax basis were as follows:
Accumulated capital and other losses | | $ | (213,098 | ) |
Unrealized appreciation (depreciation) | | | 14,540,038 | |
Total accumulated earnings | | $ | 14,326,940 | |
Under current tax law, net investment losses after December 31 and capital losses realized after October 31 of the Fund’s fiscal year may be deferred and treated as occurring on the first business day of the following fiscal year for tax purposes. For the fiscal year ended January 31, 2020, the Fund deferred Post-October capital losses of $201,306. For the fiscal year ended January 31, 2020, the Fund deferred qualified late year ordinary losses of $11,792.
NOTE 7. COMMITMENTS AND CONTINGENCIES
The Trust indemnifies its officers and Trustees for certain liabilities that may arise from their performance of their duties to the Trust or the Fund. Additionally, in the normal course of business, the Trust enters into contracts that contain a variety of representations and warranties which provide general indemnifications. The Trust’s maximum exposure under these arrangements is unknown, as this would involve future claims that may be made against the Trust that have not yet occurred.
18
Golub Group Equity Fund
Notes to the Financial Statements (continued)
January 31, 2020
NOTE 8. SUBSEQUENT EVENTS
Management of the Fund has evaluated the need for disclosures and/or adjustments resulting from subsequent events through the date at which these financial statements were issued. Based upon this evaluation, management has determined there were no items requiring adjustment of the financial statements or additional disclosure.
19
Report of Independent Registered Public Accounting Firm
To the Shareholders of Golub Group Equity Fund and
Board of Trustees of Valued Advisers Trust
Opinion on the Financial Statements
We have audited the accompanying statement of assets and liabilities, including the schedule of investments, of Golub Group Equity Fund (“the Fund”), a series of Valued Advisers Trust, as of January 31, 2020, the related statement of operations for the year then ended, the statements of changes in net assets for each of the two years in the period then ended, including the related notes, and the financial highlights for each of the five years in the period then ended (collectively referred to as the “financial statements”). In our opinion, the financial statements present fairly, in all material respects, the financial position of the Fund as of January 31, 2020, the results of its operations for the year then ended, the changes in its net assets for each of the two years in the period then ended, and the financial highlights for each of the five years in the period then ended, in conformity with accounting principles generally accepted in the United States of America.
Basis for Opinion
These financial statements are the responsibility of the Fund’s management. Our responsibility is to express an opinion on the Fund’s financial statements based on our audits. We are a public accounting firm registered with the Public Company Accounting Oversight Board (United States) (“PCAOB”) and are required to be independent with respect to the Fund in accordance with the U.S. federal securities laws and the applicable rules and regulations of the Securities and Exchange Commission and the PCAOB.
We conducted our audits in accordance with the standards of the PCAOB. Those standards require that we plan and perform the audit to obtain reasonable assurance about whether the financial statements are free of material misstatement whether due to error or fraud.
Our audits included performing procedures to assess the risks of material misstatement of the financial statements, whether due to error or fraud, and performing procedures that respond to those risks. Such procedures included examining, on a test basis, evidence regarding the amounts and disclosures in the financial statements. Our procedures included confirmation of securities owned as of January 31, 2020, by correspondence with the custodian. Our audits also included evaluating the accounting principles used and significant estimates made by management, as well as evaluating the overall presentation of the financial statements. We believe that our audits provide a reasonable basis for our opinion.
We have served as the Fund’s auditor since 2011.
COHEN & COMPANY, LTD.
Cleveland, Ohio
March 24, 2020
20
Summary of Fund Expenses (Unaudited)
As a shareholder of the Fund, you incur two types of costs: (1) transaction and (2) ongoing costs, including management fees and other Fund expenses. These examples are intended to help you understand your ongoing costs (in dollars) of investing in the Fund and to compare these costs with the ongoing costs of investing in other mutual funds. The example is based on an investment of $1,000 invested at the beginning of the period and held for the entire period from August 1, 2019 through January 31, 2020.
Actual Expenses
The first line of the table below provides information about actual account values and actual expenses. You may use the information in this line, together with the amount you invested, to estimate the expenses that you paid over the period. Simply divide your account value by $1,000 (for example, an $8,600 account value divided by $1,000 = 8.6), then multiply the result by the number in the first line under the heading entitled “Expenses Paid During Period” to estimate the expenses you paid on your account during this period.
Hypothetical Example for Comparison Purposes
The second line of the table below provides information about hypothetical account values and hypothetical expenses based on the Fund’s actual expense ratio and an assumed rate of return of 5% per year before expenses, which is not the Fund’s actual return. The hypothetical account values and expenses may not be used to estimate the actual ending account balance or expenses you paid for the period. You may use this information to compare the ongoing costs of investing in the Fund and other funds. To do so, compare this 5% hypothetical example with the 5% hypothetical examples that appear in the shareholder reports of the other funds.
Expenses shown in the table are meant to highlight your ongoing costs only and do not reflect any transactional costs. Therefore, the second line of the table below is useful in comparing ongoing costs only and will not help you determine the relative costs of owning different funds. In addition, if transaction costs were included, your costs would have been higher.
| Beginning
Account Value
August 1, 2019 | Ending
Account Value
January 31, 2020 | Expenses Paid
During Period(a) | Annualized
Expense Ratio |
Actual | $1,000.00 | $1,053.50 | $6.47 | 1.25% |
Hypothetical(b) | $1,000.00 | $1,018.90 | $6.36 | 1.25% |
(a) | Expenses are equal to the Fund’s annualized expense ratios, multiplied by the average account value over the period, multiplied by 184/365 (to reflect the one-half year period). |
(b) | Hypothetical assumes 5% annual return before expenses. |
21
Additional Federal Income Tax Information (Unaudited)
The Form 1099-DIV you receive in January 2021 will show the tax status of all distributions paid to your account in calendar year 2020. Shareholders are advised to consult their own tax adviser with respect to the tax consequences of their investment in the Fund. As required by the Internal Revenue Code and/or regulations, shareholders must be notified regarding the status of qualified dividend income for individuals and the dividends received deduction for corporations.
Qualified Dividend Income. The Fund designates approximately100% or up to the maximum amount of such dividends allowable pursuant to the Internal Revenue Code, as qualified dividend income eligible for a reduced tax rate.
Qualified Business Income. The Fund designates approximately 0% of its ordinary income dividends, or up to the maximum amount of such dividends allowable pursuant to the Internal Revenue Code, as qualified business income.
Dividends Received Deduction. Corporate shareholders are generally entitled to take the dividends received deduction on the portion of the Fund’s dividend distribution that qualifies under tax law. For the Fund’s calendar year 2020 ordinary income dividends,100% qualifies for the corporate dividends received deduction.
For the year ended January 31, 2020, the Fund designated $1,505,380 as long-term capital gain distributions.
22
Trustees and Officers (Unaudited)
The Board of Trustees supervises the business activities of the Trust. Each Trustee serves as a trustee until termination of the Trust unless the Trustee dies, resigns, retires or is removed.
The following table provides information regarding each of the Independent Trustees.
Name, Address*, Age,
Position with Trust**,
Term of Position with Trust | Principal Occupation During Past 5 Years
and Other Directorships | Other Directorships |
Andrea N. Mullins,52
Independent Trustee Since December 2013 Chairperson since March 2017 | Current: Private investor; Independent Contractor, SWM Advisors (since April 2014). | Trustee, Angel Oak Funds Trust (since February 2019) (4 portfolios); Trustee, Angel Oak Strategic Credit Fund (since February 2019); Trustee, Angel Oak Financial Strategies Income Term Trust (since May 2019). |
Ira P. Cohen,61
Independent Trustee
Since June 2010 | Current: Independent financial services consultant (since February 2005); Executive Vice President of Asset Management Services, Recognos Financial (since August 2015). | Trustee and Audit Committee Chairman, Griffin Institutional Access Credit Fund (since January 2017); Trustee and Audit Committee Chairman, Griffin Institutional Real Estate Access Fund (since May 2014); Trustee, Angel Oak Funds Trust (since October 2014) (4 portfolios) Trustee, Chairman, and Nominating and Governance Committee Chairman, Angel Oak Strategic Credit Fund (since December 2017); Trustee and Chairman, Angel Oak Financial Strategies Income Term Trust (since May 2019). |
* | The address for each Trustee is 225 Pictoria Drive, Suite 450, Cincinnati, Ohio 45246. |
** | As of the date of this report, the Trust consists of 12 series. |
23
Trustees and Officers (Unaudited) (continued)
The following table provides information regarding the Trustee who is considered an “interested person” of the Trust, as that term is defined under the 1940 Act. Based on the experience of the Trustee, the Trust concluded that the individual described below should serve as a Trustee.
Name, Address*, Age,
Position with Trust**,
Term of Position with Trust | Principal Occupation During Past 5 Years
and Other Directorships | Other Directorships |
Mark J. Seger***,58
Trustee Since March 2017 | Current: Vice Chairmanand Co-Founder Ultimus Fund Solutions, LLCand its subsidiaries(since 1999). | None. |
| * | The address for each Trustee is 225 Pictoria Drive, Suite 450, Cincinnati, Ohio 45246. |
| ** | As of the date of this report, the Trust consists of 12 series. |
| *** | Mr. Seger is considered an “interested person” of the Trust because of his relationship with the Trust’s administrator, transfer agent, and distributor. |
The following table provides information regarding the Officers of the Trust:
Name, Address*, Age,
Position with Trust**,
Term of Position with Trust | Principal Occupation During Past 5 Years | Other Directorships |
Adam T. Kornegay,35
Principal Executive Officer and President Since April 2018 | Current: Vice President, Business Development Director, Ultimus Fund Solutions, LLC (since March 2015).
Previous: Vice President, Citigroup, Inc. (July 2009 to February 2015). | None. |
Gregory T. Knoth,49
Principal Financial Officer
and Treasurer Since
April 2019 | Current: Vice President, Mutual Fund Controller, Ultimus Fund Solutions, LLC (since January 2016). Previous: Vice President and Manager of Fund Accounting, Huntington Asset Services, Inc. (n/k/a Ultimus Asset Services, LLC) (June 2013 to December 2015). | None. |
Kevin J. Patton, 49 Chief Compliance Officer
Since March 2020 | Current: Senior Compliance Officer, Ultimus Fund Solutions, LLC (since January 2020). Previous: Partner and Chief Compliance Officer, Renaissance Investment Management (August 2005 to January 2020). | None. |
24
Trustees and Officers (Unaudited) (continued)
Name, Address*, Age,
Position with Trust**,
Term of Position with Trust | Principal Occupation During Past 5 Years | Other Directorships |
Carol J. Highsmith,55
Vice President Since August 2008
Secretary Since March 2014 | Current: Vice President, Ultimus Fund Solutions, LLC (sinceDecember 2015).
Previous: Employed in various positions with Huntington Asset Services, Inc. (n/k/a Ultimus Asset Services, LLC) (November 1994 to December 2015), most recently Vice President of Legal Administration (2005 to December 2015). | None. |
* | The address for each Trustee is 225 Pictoria Drive, Suite 450, Cincinnati, Ohio 45246. |
** | As of the date of this report, the Trust consists of 12 series. |
25
Investment Advisory Agreement Approval (Unaudited)
At a meeting held on December 2-3, 2019, the Board of Trustees (the “Board”) considered the renewal of the Investment Advisory Agreement (the “Golub Agreement”) between Valued Advisers Trust (the “Trust”) and Golub Group, LLC (“Golub”) with respect to the Golub Group Equity Fund (the “Golub Fund”). Golub provided written information to the Board to assist the Board in its considerations.
Counsel reminded the Trustees of their fiduciary duties and responsibilities as summarized in a memorandum from his firm, including the factors to be considered, and the application of those factors to Golub and the Golub Agreement. In assessing these factors, the Board took into consideration information furnished by Golub and Trust management for the Board’s review and consideration throughout the year, as well as information specifically prepared or presented in connection with the annual renewal process, including: (i) reports regarding the services and support provided to the Golub Fund and its shareholders by Golub; (ii) quarterly assessments of the investment performance of the Golub Fund by personnel of Golub; (iii) commentary on the reasons for the Golub Fund’s performance; (iv) presentations by Golub addressing Golub’s investment philosophy, investment strategy, personnel, and operations; (v) compliance and audit reports concerning the Golub Fund and Golub; (vi) disclosure information contained in the registration statement for the Golub Fund and the Form ADV of Golub; and (vii) a memorandum from Counsel, that summarized the fiduciary duties and responsibilities of the Board in reviewing and approving the Golub Agreement. The Board also requested and received various informational materials including, without limitation: (a) documents containing information about Golub, including its financial information, a description of personnel and the services it provides to the Golub Fund; information on Golub’s investment advice and performance; summaries of the Golub Fund’s expenses, compliance program, current legal matters, and other general information; (b) comparative expense and performance information for other mutual funds with strategies similar to the Golub Fund; and (c) the benefits to be realized by Golub from its relationship with the Golub Fund. The Board did not identify any particular information that was most relevant to its consideration of the Golub Agreement and each Trustee may have afforded different weight to the various Factors.
1. | The nature, extent, and quality of the services to be provided by Golub. In this regard, the Board considered Golub’s responsibilities under the Golub Agreement. The Trustees considered the services being provided by Golub to the Golub Fund. The Trustees discussed, among other things: the quality of Golub’s investment advisory services (including research and recommendations with respect to portfolio securities), its process for formulating investment recommendations and assuring compliance with the Golub Fund’s investment objectives and limitations, its coordination of services for the Golub Fund among the Golub Fund’s service providers, and its efforts to promote the Golub Fund and grow its assets. The Trustees considered Golub’s continuity of, and commitment to retain, qualified personnel and Golub’s commitment to maintain and enhance its resources and systems. The Trustees considered Golub’s personnel, including the education and experience of the personnel. After considering the foregoing information and further information in the Meeting materials provided by Golub (including Golub’s Form ADV), the Board concluded that, in light of all the facts and circumstances, the nature, extent, and quality of the services provided by Golub were satisfactory and adequate for the Golub Fund. |
26
Investment Advisory Agreement Approval (Unaudited) (continued)
2. | Investment Performance of the Golub Fund and Golub. In considering the investment performance of the Golub Fund and Golub, the Trustees compared the performance of the Golub Fund with the performance of funds in the same Morningstar category, as well as with peer group data and the Golub Fund’s benchmark. The Trustees noted that the Golub Fund had underperformed compared to its peer group average for the one month, three month, one year, three year, and five year periods ended September 30, 2019, but had outperformed for the year-to-date and ten year periods ended on that date. They observed that the Golub Fund performed slightly better than its benchmark for the one month period, but had underperformed for all other periods presented. The Trustees observed that the Golub Fund had outperformed its category average for the one month period ended September 30, 2019, but had underperformed for all other periods presented. The Trustees also considered the consistency of Golub’s management of the Golub Fund with its investment objective, strategies, and limitations. The Trustees considered the Golub Fund’s performance relative to the performance of Golub’s equity composite and noted that the performance of the composite was higher for the one year period ended September 30, 2019 and for the calendar year 2018. They considered Golub’s explanation regarding the reasons for the difference, and determined that the explanation was reasonable. After reviewing and discussing the investment performance of the Golub Fund further, Golub’s experience managing the Golub Fund, Golub’s historical performance, and other relevant factors, the Board concluded, in light of all the facts and circumstances, that the investment performance of the Golub Fund and Golub was acceptable. |
3. | The costs of the services to be provided and profits to be realized by Golub from the relationship with the Golub Fund. In considering the costs of services to be provided and the profits to be realized by Golub from the relationship with the Golub Fund, the Trustees considered: (1) Golub’s financial condition; (2) the asset level of the Golub Fund; (3) the overall expenses of the Golub Fund; and (4) the nature and frequency of advisory fee payments. The Trustees reviewed information provided by Golub regarding its profits associated with managing the Golub Fund. The Trustees also considered potential benefits for Golub in managing the Golub Fund. The Trustees then compared the fees and expenses of the Golub Fund (including the management fee) to other comparable mutual funds. The Trustees observed that the Golub Fund’s advisory fee and net expense ratio were above the average and median of its Morningstar category, but well below the maximum net expense ratio and 100 basis points below the maximum advisory fee. They also noted that the Golub Fund’s advisory fee was higher than the average and slightly higher than the median of its custom peer group, and the net expense ratio was below the average and median of its custom peer group. Based on the foregoing, the Board concluded that the fees to be paid to Golub by the Golub Fund and the profits to be realized by Golub, in light of all the facts and circumstances, were fair and reasonable in relation to the nature and quality of the services provided by Golub. |
4. | The extent to which economies of scale would be realized as the Golub Fund grows and whether advisory fee levels reflect these economies of scale for the benefit of the Golub Fund’s investors. In this regard, the Board considered the Golub Fund’s fee arrangements with Golub. The Board considered that while the management fee remained the same at all asset levels, the Golub Fund’s shareholders had experienced benefits from the Golub Fund’s expense limitation arrangement, and that Golub had agreed to extend that arrangement for another year. They also noted that |
27
Investment Advisory Agreement Approval (Unaudited) (continued)
the Golub Fund’s shareholders would continue to benefit from the economies of scale under the Trust’s agreements with service providers other than Golub. In light of the foregoing, the Board determined that the Golub Fund’s fee arrangements, in light of all the facts and circumstances, were fair and reasonable in relation to the nature and quality of the services provided by Golub.
5. | Possible conflicts of interest and benefits to Golub. In considering Golub’s practices regarding conflicts of interest, the Trustees evaluated the potential for conflicts of interest and considered such matters as the experience and ability of the advisory personnel assigned to the Golub Fund; the basis of decisions to buy or sell securities for the Golub Fund and/or Golub’s other accounts; and the substance and administration of Golub’s code of ethics. The Trustees also considered disclosure in the registration statement of the Trust relating to Golub’s potential conflicts of interest. The Trustees discussed Golub’s practices for seeking best execution for the Golub Fund’s portfolio transactions. In terms of other benefits to Golub, the Trustees considered Golub’s perspective that the Golub Fund provides an investment option for smaller accounts, and that the public nature of the Golub Fund provides credibility to Golub’s operations. Based on the foregoing, the Board determined that Golub’s standards and practices relating to the identification and mitigation of potential conflicts of interest were satisfactory. |
After additional consideration of the factors delineated in the memorandum provided by counsel and further discussion among the Board members, the Board determined to approve the continuation of the Golub Agreement.
28
FACTS | WHAT DOES GOLUB GROUP EQUITY FUND (THE “Fund”) DO WITH YOUR PERSONAL INFORMATION? |
| | |
Why? | Financial companies choose how they share your personal information. Federal law gives consumers the right to limit some but not all sharing. Federal law also requires us to tell you how we collect, share, and protect your personal information. Please read this notice carefully to understand what we do. |
| | |
What? | The types of personal information we collect and share depend on the product or service you have with us. This information can include: ■ Social Security number ■ account balances and account transactions ■ transaction or loss history and purchase history ■ checking account information and wire transfer instructions When you are no longer our customer, we continue to share your information as described in this notice. |
| | |
How? | All financial companies need to share customers’ personal information to run their everyday business. In the section below, we list the reasons financial companies can share their customers’ personal information; the reasons the Fund chooses to share; and whether you can limit this sharing. |
| | |
Reasons we can share your personal information | Does the Fund share? |
For our everyday business purposes —
such as to process your transactions, maintain your account(s), respond to court orders and legal investigations, or report to credit bureaus | Yes |
For our marketing purposes —
to offer our products and services to you | No |
For joint marketing with other financial companies | No |
For our affiliates’ everyday business purposes –
information about your transactions and experiences | No |
For our affiliates’ everyday business purposes –
information about your creditworthiness | No |
For nonaffiliates to market to you | No |
| | |
Questions? | Call (866) 954-6682 |
29
Who we are |
Who is providing this notice? | Golub Group Equity Fund
Ultimus Fund Distributors, LLC (Distributor)
Ulimus Fund Solutions, LLC (Administrator) |
What we do |
How does the Fund protect my personal information? | To protect your personal information from unauthorized access and use, we use security measures that comply with federal law. These measures include computer safeguards and secured files and buildings. Our service providers are held accountable for adhering to strict policies and procedures to prevent any misuse of your nonpublic personal information. |
How does the Fund collect my personal information? | We collect your personal information, for example, when you ■ open an account or deposit money ■ buy securities from us or sell securities to us ■ make deposits or withdrawals from your account or provide account information ■ give us your account information ■ make a wire transfer ■ tell us who receives the money ■ tell us where to send the money ■ show your government-issued ID ■ show your driver’s license |
Why can’t I limit all sharing? | Federal law gives you the right to limit only ■ sharing for affiliates’ everyday business purposes — information about your creditworthiness ■ affiliates from using your information to market to you ■ sharing for nonaffiliates to market to you State laws and individual companies may give you additional rights to limit sharing. |
Definitions |
Affiliates | Companies related by common ownership or control. They can be financial and nonfinancial companies. ■ Summitry LLC, the investment adviser to the Fund, could be deemed to be an affiliate. |
Nonaffiliates | Companies not related by common ownership or control. They can be financial and nonfinancial companies. ■ The Fund does not share your personal information with nonaffiliates so they can market to you. |
Joint marketing | A formal agreement between nonaffiliated financial companies that together market financial products or services to you. ■ The Fund doesn’t jointly market. |
30
This page is intentionally left blank.
This page is intentionally left blank.
This page is intentionally left blank.
Other Information
The Fund’s Statement of Additional Information (“SAI”) includes additional information about the trustees and is available without charge, upon request. You may call toll-free at (866) 954-6682 to request a copy of the SAI or to make shareholder inquiries.
Proxy Voting
A description of the policies and procedures that the Fund uses to determine how to vote proxies relating to portfolio securities and information regarding how the Fund voted those proxies during the most recent twelve month period ended June 30, are available (1) without charge upon request by calling the Fund at (866) 954-6682 and (2) in Fund documents filed with the Securities and Exchange Commission (“SEC”) on the SEC’s website at www.sec.gov.
Trustees Andrea N. Mullins, Chairperson Ira P. Cohen Mark J. Seger Officers Adam T. Kornegay,
Principal Executive Officer and President Gregory T. Knoth,
Principal Financial Officer and Treasurer Kevin J. Patton,
Chief Compliance Officer Carol J. Highsmith,
Vice President and Secretary Investment Adviser Summitry LLC 1850 Gateway Drive, Suite 100 San Mateo, CA 94404 Distributor Ultimus Fund Distributors, LLC 225 Pictoria Drive, Suite 450 Cincinnati, OH 45246 | Independent Registered
Public Accounting Firm Cohen & Company, Ltd. 1350 Euclid Avenue, Suite 800 Cleveland, OH 44115 Legal Counsel Stradley Ronon Stevens & Young, LLP 2005 Market Street, Suite 2600 Philadelphia, PA 19103 Custodian Huntington National Bank 41 South High Street Columbus, OH 43215 Administrator, Transfer Agent and Fund Accountant Ultimus Fund Solutions, LLC 225 Pictoria Drive, Suite 450 Cincinnati, OH 45246 |
This report is intended only for the information of shareholders or those who have received the Fund’s prospectus which contains information about the Fund’s management fee and expenses. Please read the prospectus carefully before investing.
Distributed by Ultimus Fund Distributors, LLC
Member FINRA/SIPC

BELMONT THETA INCOME FUND
Annual Report
January 31, 2020
Beginning on January 1, 2021, as permitted by regulations adopted by the U.S. Securities and Exchange Commission, paper copies of the Fund’s shareholder reports like this one will no longer be sent by mail, unless you specifically request paper copies of the reports from the Fund or from your financial intermediary such as a broker-dealer or bank. Instead, the reports will be made available on a website, and you will be notified by mail each time a report is posted and provided with a website link to access the report.
If you already elected to receive shareholder reports electronically, you will not be affected by this change and you need not take any action. You may elect to receive shareholder reports and other communications from the Fund electronically by contacting the Fund at (800) 789-1087 or, if you own these shares through a financial intermediary, you may contact your financial intermediary.
You may elect to receive all future reports in paper free of charge. You can inform the Fund that you wish to continue receiving paper copies of your shareholder reports by contacting the Fund at (800) 789-1087. If you own shares through a financial intermediary, you may contact your financial intermediary or follow instructions included with this document to elect to continue to receive paper copies of your shareholder reports. Your election to receive reports in paper will apply to all funds held with the fund complex or at your financial intermediary.
Fund Adviser:
Belmont Capital, LLC d/b/a Belmont Capital GroupTM
1875 Century Park E., Suite 1780
Los Angeles, CA 90067
Dear Shareholders:
Overview:
The Belmont Theta Income Fund was launched on April 30th, 2018 with the goal of offering our income generating Theta Overlay Program options strategy in a mutual fund format. The objective of the Fund is the long-term growth of capital and income generation with limited correlation to equity markets.
Performance Results:
For the 12 months ending January 31st, 2020, Institutional Class shares of the Belmont Theta Income Fund returned +1.71% at net asset value. The Fund’s primary benchmark, the CBOE Iron Condor Index, returned -0.22% for the same period.
Explanation of Fund Performance:
The Fund purchases short-term Government fixed income as collateral for the Theta Overlay Program options strategy. The Fund seeks to generate returns through yield of the Government short-term fixed income securities and option premium income realized. The options strategy writes out of the money call and put spreads on the S&P 500 to capitalize on time decay and the volatility risk premium (VRP). Historically, there has been premium between the implied volatility of option pricing and realized volatility of the S&P 500 which the Fund seeks to exploit. The strategy prefers moderate volatility while short-term high velocity moves in the S&P 500 can be negative for strategy performance.
The Fund outperformed its primary benchmark for the year. The fund returned -0.30% in the 1st Quarter due to the uptrend in the S&P 500 and short call spreads being challenged. For the 2nd Quarter, both short call and put spreads were helpful for Fund performance resulting in a +2.18% return. In the 3rd Quarter, the Fund result of +0.20% was primarily derived from the fixed income portion of the portfolio. The 4th Quarter return for the Fund was -0.36% due to the uptrend in the market and short call spreads being tested.
Outlook:
Looking forward the Theta Overlay Program options strategy should continue to benefit from the volatility risk premium (VRP) and our proactive risk management approach tested since 2011. An equity market with less extremes (upside & downside) than experienced recently would also benefit this component of the Fund. The fixed income strategy will continue to be invested in high quality US Treasury securities.
Thank you for your continued support and please reach out with any questions or visit www.belmontcapfunds.com for other information about the Fund.
Stephen J. Solaka
Managing Partner & Portfolio Manager
Investment Results (Unaudited)
Average Annual Total Returns(a)
(For the periods ended January 31, 2020)
| One Year | Since Inception
(April 30, 2018) |
Belmont Theta Income Fund - Institutional Class | 1.71% | 0.28% |
CBOE S&P 500® Iron Condor Index(b) | -0.22% | -3.94% |
ICE BofA US 3-Month Treasury Bill Index(c) | 2.22% | 2.16% |
FTSE 3-Month Treasury Bill Index(d) | 2.18% | 2.14% |
Total annual operating expenses based on estimated amounts for the current fiscal year, as disclosed in the Belmont Theta Income Fund (the “Fund”) prospectus dated May 31, 2019, were 4.97% of average daily net assets (2.20% after fee waivers/expense reimbursements by Belmont Capital, LLC (the “Adviser”)). The Adviser has contractually agreed to waive or limit its fees and to assume other expenses of the Fund until May 31, 2020, so that Total Annual Fund Operating Expenses do not exceed 1.99%. This contractual arrangement may only be terminated by mutual consent of the Adviser and the Board of Trustees of the Trust, and it will automatically terminate upon the termination of the investment advisory agreement between the Fund and the Adviser. This operating expense limitation does not apply to: (i) interest, (ii) taxes, (iii) brokerage commissions, (iv) other expenditures which are capitalized in accordance with generally accepted accounting principles, (v) other extraordinary expenses not incurred in the ordinary course of the Fund’s business, (vi) dividend expense on short sales, (vii) expenses incurred under a plan of distribution under Rule 12b-1, and (viii) expenses that the Fund has incurred but did not actually pay because of an expense offset arrangement, if applicable, in any fiscal year. The operating expense limitation also excludes any “Acquired Fund Fees and Expenses,” which are the expenses indirectly incurred by the Fund as a result of investing in money market funds or other investment companies, including exchange-traded funds, that have their own expenses. Each waiver or reimbursement of an expense by the Adviser is subject to repayment by the Fund within the three years following such waiver or reimbursement, provided that the Fund is able to make the repayment without exceeding the expense limitation in place at the time of the waiver or reimbursement and the expense limitation in place at the time of the repayment. Additional information pertaining to the Fund’s expense ratios as of January 31, 2020 can be found in the financial highlights.
The performance quoted represents past performance, which does not guarantee future results. The investment return and principal value of an investment will fluctuate so that an investor’s shares, when redeemed, may be worth more or less than their original cost. The returns shown do not reflect deduction of taxes that a shareholder would pay on Fund distributions or the redemption of Fund shares. Current performance of the Fund may be lower or higher than the performance quoted. The Fund’s investment objectives, risks, charges and expenses must be considered carefully before investing. Performance data current to the most recent month end may be obtained by calling (800) 789-1087.
(a) | Return figures reflect any change in price per share and assume the reinvestment of all distributions. The Fund’s returns reflect any fee reductions during the applicable periods. If such fee reductions had not occurred, the quoted performance would have been lower. Total returns for periods less than one year are not annualized. |
(b) | The CBOE S&P 500® Iron Condor Index (“Index”) is designed to track the performance of a hypothetical option trading strategy that 1) sells a rolling monthly out-of-the-money (OTM) S&P 500® Index (SPX) put option (delta ≈ - 0.20) and a rolling monthly OTM SPX call option (delta ≈ 0.20); 2) buys a rolling monthly OTM SPX put option (delta ≈ - 0.05) and a rolling monthly OTM SPX call option (delta ≈ 0.05) to reduce risk; and 3) holds a money market account invested in one-month Treasury bills, which is rebalanced on option roll days and is designed to limit the downside return of the Index. |
(c) | The ICE BofA US 3-Month Treasury Bill Index is comprised of a single issue purchased at the beginning of the month and held for a full month. At the end of the month that issue is sold and rolled into a newly selected issue. The issue selected at each month-end rebalancing is the outstanding Treasury Bill that matures closest to, but not beyond, three months from the rebalancing date. To qualify, an issue must have settled on or before the rebalancing date. |
(d) | The FTSE 3-Month Treasury Bill Index is an unmanaged index representing monthly return equivalents of yield averages of the last 3-month Treasury Bill issues. |
The Fund’s investment objectives, strategies, risks, charges and expenses must be considered carefully before investing. The prospectus contains this and other important information about the Fund and may be obtained by calling the same number as above. Please read it carefully before investing.
The Fund is distributed by Ultimus Fund Distributors, LLC, member FINRA/SIPC.
2
Investment Results (Unaudited) (continued)
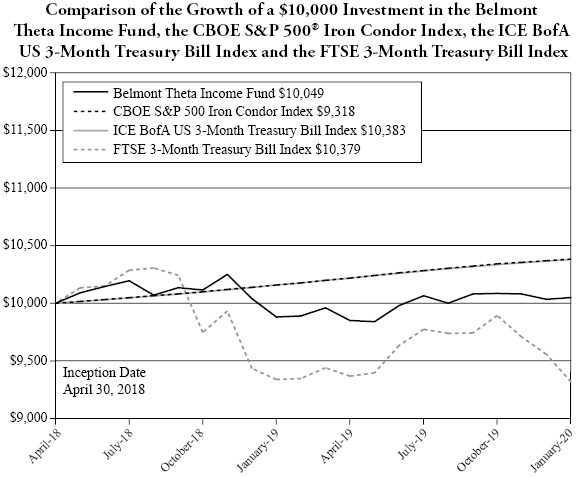
The chart above assumes an initial investment of $10,000 made on April 30, 2018 (commencement of operations) and held through January 31, 2020. The CBOE S&P 500 Iron Condor Index (“Index”) is designed to track the performance of a hypothetical option trading strategy that 1) sells a rolling monthly out-of-the-money (OTM) S&P 500 Index (SPX) put option (delta ≈ - 0.20) and a rolling monthly out-of-the-money (OTM) SPX call option (delta ≈ 0.20); 2) buys a rolling monthly OTM SPX put option (delta ≈ - 0.05) and a rolling monthly OTM SPX call option (delta ≈ 0.05) to reduce risk; and 3) holds a money market account invested in one-month Treasury bills, which is rebalanced on option roll days and is designed to limit the downside return of the Index. The FTSE 3-Month Treasury Bill Index is an unmanaged index representing monthly return equivalents of yield averages of the last 3-month Treasury Bill issues. Individuals cannot invest directly in the Indices; however, an individual may invest in exchange-traded funds or other investment vehicles that attempt to track the performance of a benchmark index. THE FUND’S RETURNS REPRESENT PAST PERFORMANCE AND DO NOT GUARANTEE FUTURE RESULTS. The returns shown do not reflect deduction of taxes that a shareholder would pay on Fund distributions or the redemption of Fund shares. Investment returns and principal values will fluctuate so that your shares, when redeemed, may be worth more or less than their original purchase price.
Current performance may be lower or higher than the performance data quoted. For more information on the Fund, and to obtain performance data current to the most recent month-end, or to request a prospectus, please call (800) 789-1087. You should carefully consider the investment objectives, potential risks, management fees, and charges and expenses of the Fund before investing. The Fund’s prospectus contains this and other information about the Fund, and should be read carefully before investing.
The Fund is distributed by Ultimus Fund Distributors, LLC, member FINRA/SIPC.
3
Fund Holdings (Unaudited)
January 31, 2020
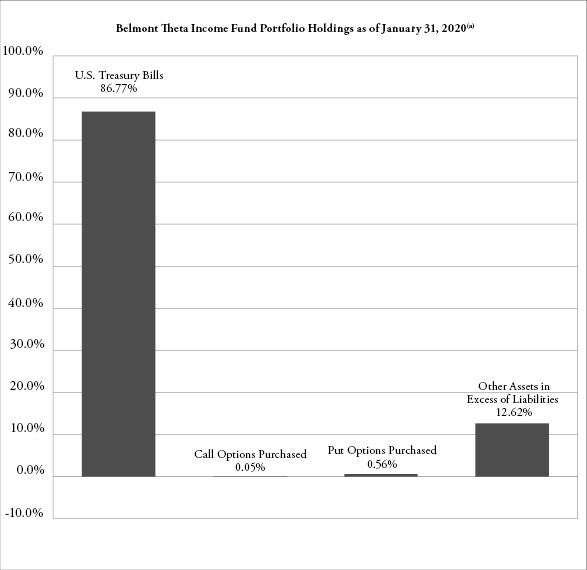
(a) | As a percentage of net assets. |
The investment objective of the Fund is to seek long-term growth of capital and income generation with limited correlation to equity markets.
Availability of Portfolio Schedule (Unaudited)
The Fund files its complete schedule of portfolio holdings with the Securities and Exchange Commission (the “SEC”) for the first and third quarters of each fiscal year within sixty days after the end of the period. The Fund’s portfolio holdings are available at the SEC’s website at www.sec.gov.
4
Belmont Theta Income Fund
Schedule of Investments
January 31, 2020
| | Principal
Amount | | | Fair Value | |
U.S. GOVERNMENT & AGENCY OBLIGATIONS(a)(b) — 86.77% | | | | |
| | | | | | | | | |
United States Treasury Bill, 2.41%, 2/27/2020 | | $ | 2,000,000 | | | $ | 1,998,050 | |
United States Treasury Bill, 2.09%, 3/26/2020 | | | 2,000,000 | | | | 1,995,641 | |
United States Treasury Bill, 1.76%, 5/21/2020 | | | 2,000,000 | | | | 1,990,869 | |
United States Treasury Bill, 1.67%, 8/13/2020 | | | 2,000,000 | | | | 1,983,987 | |
United States Treasury Bill, 1.49%, 11/5/2020 | | | 2,000,000 | | | | 1,977,493 | |
United States Treasury Bill, 1.44%, 12/3/2020 | | | 2,000,000 | | | | 1,976,060 | |
United States Treasury Bill, 1.42%, 12/31/2020 | | | 2,000,000 | | | | 1,973,809 | |
Total U.S. Government & Agency Obligations (Cost $13,889,339) | | | 13,895,909 | |
Description | | Number of
Contracts | | | Notional
Amount | | | Exercise
Price | | Expiration
Date | | Fair Value | |
CALL OPTIONS PURCHASED — 0.05% |
| |
S&P 500 Index | | | 148 | | | $ | 47,737,696 | | | $ | 3,440.00 | | February 2020 | | $ | 7,400 | |
| | | | | | | | | | | | | | | | | | |
PUT OPTIONS PURCHASED — 0.56% |
| |
S&P 500 Index | | | 148 | | | $ | 47,737,696 | | | $ | 2,900.00 | | February 2020 | | $ | 89,540 | |
Total Options Purchased (Cost $118,336) | | | | 96,940 | |
| | | | | | |
Total Investments — 87.38% (Cost $14,007,675) | | | | 13,992,849 | |
Other Assets in Excess of Liabilities — 12.62% | | | | 2,020,748 | |
NET ASSETS — 100.00% | | | $ | 16,013,597 | |
(a) | All of these securities are held as collateral for options. |
(b) | The rate shown represents effective yield at time of purchase. |
| | See accompanying notes which are an integral part of these financial statements. | 5 |
Belmont Theta Income Fund
Schedule of Open Written Option Contracts
January 31, 2020
Description | | Number of
Contracts | | | Notional
Amount | | | Exercise
Price | | Expiration
Date | | Fair Value | |
WRITTEN CALL OPTIONS (0.23)% |
| |
S&P 500 Index | | | (148 | ) | | $ | (47,737,696 | ) | | $ | 3,380.00 | | February 2020 | | $ | (36,630 | ) |
| | | | | | | | | | | | | | | | | | |
WRITTEN PUT OPTIONS (1.32)% |
| |
S&P 500 Index | | | (148 | ) | | | (47,737,696 | ) | | | 3,025.00 | | February 2020 | | | (212,380 | ) |
| | | | | | | | | | | | | | | | | | |
Total Written Options (Premiums Received $301,096) | | | $ | (249,010 | ) |
6 | See accompanying notes which are an integral part of these financial statements. | |
Belmont Theta Income Fund
Statement of Assets and Liabilities
January 31, 2020
Assets |
Investments in securities at fair value (cost $14,007,675) (Note 3) | | $ | 13,992,849 | |
Cash | | | 2,193,416 | |
Cash held at broker for options transactions | | | 126,466 | |
Receivable for fund shares sold | | | 1,473 | |
Interest receivable | | | 2,583 | |
Prepaid expenses | | | 5,053 | |
Total Assets | | | 16,321,840 | |
Liabilities |
Options written, at value (premium received $301,096) | | | 249,010 | |
Payable to Adviser (Note 4) | | | 19,342 | |
Payable to Administrator (Note 4) | | | 6,635 | |
Other accrued expenses | | | 33,256 | |
Total Liabilities | | | 308,243 | |
Net Assets | | $ | 16,013,597 | |
Net Assets consist of: | | | | |
Paid-in capital | | | 16,040,614 | |
Accumulated deficit | | | (27,017 | ) |
Net Assets | | $ | 16,013,597 | |
Institutional Shares: | | | | |
Shares outstanding (unlimited number of shares authorized, no par value) | | | 799,309 | |
Net asset value, offering and redemption price per share (Note 2) | | $ | 20.03 | |
| | See accompanying notes which are an integral part of these financial statements. | 7 |
Belmont Theta Income Fund
Statement of Operations
For the year ended January 31, 2020
Investment Income | | | | |
Interest income | | $ | 355,745 | |
Total investment income | | | 355,745 | |
Expenses | | | | |
Investment Adviser fees (Note 4) | | | 281,934 | |
Administration fees (Note 4) | | | 38,250 | |
Fund accounting fees (Note 4) | | | 27,861 | |
Interest expense | | | 24,961 | |
Legal fees | | | 22,318 | |
Audit and tax preparation fees | | | 18,500 | |
Registration expenses | | | 16,783 | |
Transfer agent fees (Note 4) | | | 12,000 | |
Printing and postage expenses | | | 7,046 | |
Offering cost (Note 2) | | | 5,579 | |
Trustee fees | | | 4,665 | |
Custodian fees | | | 2,750 | |
Miscellaneous expense | | | 23,266 | |
Total expenses | | | 485,913 | |
Fees contractually waived by Adviser (Note 4) | | | (140,267 | ) |
Net operating expenses | | | 345,646 | |
Net investment income | | | 10,099 | |
Net Realized and Change in Unrealized Gain (Loss) on Investments |
Net realized gain (loss) on: | | | | |
Investment securities | | | (465,632 | ) |
Written options | | | 684,705 | |
Change in unrealized appreciation (depreciation) on: | | | | |
Investment securities | | | (52,348 | ) |
Written options | | | 112,947 | |
Net realized and change in unrealized gain on investments | | | 279,672 | |
Net increase in net assets resulting from operations | | $ | 289,771 | |
8 | See accompanying notes which are an integral part of these financial statements. | |
Belmont Theta Income Fund
Statements of Changes in Net Assets
| | | For the
Year Ended
January 31, 2020 | | | For the
Period Ended
January 31, 2019(a) | |
Increase (Decrease) in Net Assets due to: |
Operations |
Net investment income (loss) | | $ | 10,099 | | | $ | (2,580 | ) |
Net realized gain (loss) on investment securities transactions and written options | | | 219,073 | | | | (239,335 | ) |
Net change in unrealized appreciation (depreciation) of investment securities and written options | | | 60,599 | | | | (23,339 | ) |
Net increase (decrease) in net assets resulting from operations | | | 289,771 | | | | (265,254 | ) |
Distributions to shareholders from Earnings (Note 2) | | | (54,114 | ) | | | — | |
Total distributions | | | (54,114 | ) | | | — | |
Capital Transactions - Institutional Class: |
Proceeds from shares sold | | | 5,763,929 | | | | 13,968,292 | |
Reinvestment of distributions | | | 54,114 | | | | — | |
Amount paid for shares redeemed | | | (2,878,935 | ) | | | (864,206 | ) |
Net increase in net assets resulting from capital transactions | | | 2,939,108 | | | | 13,104,086 | |
Total Increase in Net Assets | | | 3,174,765 | | | | 12,838,832 | |
Net Assets | | | | | | | | |
Beginning of year | | | 12,838,832 | | | | — | |
End of year | | $ | 16,013,597 | | | $ | 12,838,832 | |
Share Transactions - Institutional Class: |
Shares sold | | | 291,413 | | | | 692,755 | |
Shares issued in reinvestment of distributions | | | 2,706 | | | | — | |
Shares redeemed | | | (144,618 | ) | | | (42,947 | ) |
Net increase in shares | | | 149,501 | | | | 649,808 | |
(a) | For the period April 30, 2018 (commencement of operations) to January 31, 2019. |
| | See accompanying notes which are an integral part of these financial statements. | 9 |
Belmont Theta Income Fund — Institutional Class
Financial Highlights
(For a share outstanding during each period)
| | | For the Year
Ended
January 31,
2020 | | | For the Period
Ended
January 31,
2019(a) | |
Selected Per Share Data: | | | | | | | | |
Net asset value, beginning of period | | $ | 19.76 | | | $ | 20.00 | |
| | | | | | | | | |
Investment operations: | | | | | | | | |
Net investment income | | | 0.01 | | | | — | (b) |
Net realized and unrealized gain (loss) | | | 0.32 | | | | (0.24 | ) |
Total from investment operations | | | 0.33 | | | | (0.24 | ) |
| | | | | | | | | |
Less distributions to shareholders from: | | | | | | | | |
Net investment income | | | (0.01 | ) | | | — | |
Net realized gains | | | (0.05 | ) | | | — | |
Total distributions | | | (0.06 | ) | | | — | |
| | | | | | | | | |
Net asset value, end of period | | $ | 20.03 | | | $ | 19.76 | |
| | | | | | | | | |
Total Return(c) | | | 1.71 | % | | | (1.20 | )%(d) |
| | | | | | | | | |
Ratios and Supplemental Data: | | | | | | | | |
| | | | | | | | | |
Net assets, end of period (000 omitted) | | $ | 16,014 | | | $ | 12,839 | |
Ratio of net expenses to average net assets(f) | | | 2.14 | % | | | 2.20 | %(e) |
Ratio of expenses to average net assets before waiver and reimbursement | | | 3.02 | % | | | 4.97 | %(e) |
Ratio of net investment income (loss) to average net assets | | | 0.06 | % | | | (0.05 | )%(e) |
Portfolio turnover rate | | | 0 | % | | | 0 | %(d) |
(a) | For the period April 30, 2018 (commencement of operations) to January 31, 2019. |
(b) | Rounds to less than $0.005 per share. |
(c) | Total return represents the rate that the investor would have earned or lost on an investment in the Fund, assuming reinvestment of distributions. |
(f) | This ratio includes the impact of broker interest fees. If this cost had been excluded, the ratio of expenses to average net assets would have been 1.99% for the periods ended January 31, 2020 and January 31, 2019, respectively. |
10 | See accompanying notes which are an integral part of these financial statements. | |
Belmont Theta Income Fund
Notes to the Financial Statements
January 31, 2020
NOTE 1. ORGANIZATION
Belmont Theta Income Fund (the “Fund”) is an open-end diversified series of Valued Advisers Trust (the “Trust”). The Trust is a management investment company established under the laws of Delaware by an Agreement and Declaration of Trust dated June 13, 2008 (the “Trust Agreement”). The Trust Agreement permits the Board of Trustees (the “Board”) to issue an unlimited number of shares of beneficial interest of separate series without par value. The Fund currently offers one class of shares: Institutional Shares. The Fund commenced operations on April 30, 2018. The Fund’s investment adviser is Belmont Capital, LLC d/b/a Belmont Capital GroupTM (the “Adviser”). The investment objective of the Fund is to seek long-term growth of capital and income generation with limited correlation to equity markets.
NOTE 2. SIGNIFICANT ACCOUNTING POLICIES
The Fund is an investment company and follows accounting and reporting guidance under Financial Accounting Standards Board Accounting Standards Codification (“ASC”) Topic 946, “Financial Services-Investment Companies.” The following is a summary of significant accounting policies followed by the Fund in the preparation of its financial statements. These policies are in conformity with generally accepted accounting principles in the United States of America (“GAAP”).
Estimates – The preparation of financial statements in conformity with GAAP requires management to make estimates and assumptions that affect the reported amounts of assets and liabilities and disclosure of contingent assets and liabilities at the date of the financial statements and the reported amounts of increases and decreases in net assets from operations during the reporting period. Actual results could differ from those estimates.
Federal Income Taxes – The Fund makes no provision for federal income or excise tax. The Fund has qualified and intends to qualify each year as a regulated investment company (“RIC”) under subchapter M of the Internal Revenue Code of 1986, as amended, by complying with the requirements applicable to RICs and by distributing substantially all of its taxable income. The Fund also intends to distribute sufficient net investment income and net realized capital gains, if any, so that it will not be subject to excise tax on undistributed income and gains. If the required amount of net investment income or gains is not distributed, the Fund could incur a tax expense.
As of and during the fiscal year ended January 31, 2020, the Fund did not have any liabilities for any unrecognized tax benefits. The Fund recognizes interest and penalties, if any, related to unrecognized tax benefits as income tax expense on the statement of operations when incurred. During the fiscal year ended January 31, 2020, the Fund did not incur any interest or penalties. Management of the Fund has reviewed tax positions taken in tax years that remain subject to examination by all major tax jurisdictions, including federal (i.e., the last three tax year ends and the interim tax period since then, as applicable). Management believes that there is no tax liability resulting from unrecognized tax benefits related to uncertain tax positions taken.
Expenses – Expenses incurred by the Trust that do not relate to a specific fund of the Trust are allocated to the individual funds based on each fund’s relative net assets or another appropriate basis (as determined by the Board).
11
Belmont Theta Income Fund
Notes to the Financial Statements (continued)
January 31, 2020
Offering Costs – The Adviser advanced some of the Fund’s initial offering costs and was subsequently reimbursed by the Fund. Costs of $23,139 incurred in connection with the offering and initial registration of the Fund were deferred and amortized on a straight-line basis over the first twelve months after commencement of operations. As of January 31, 2020, there were no offering costs remaining to be amortized.
Security Transactions and Related Income – The Fund follows industry practice and records security transactions on the trade date for financial reporting purposes. The specific identification method is used for determining gains or losses for financial statement and income tax purposes. Dividend income is recorded on the ex-dividend date and interest income is recorded on an accrual basis. Discounts and premiums on securities purchased are accreted or amortized using the effective interest method, if applicable. Withholding taxes on foreign dividends have been provided for in accordance with the Fund’s understanding of the applicable country’s tax rules and rates.
Dividends and Distributions – The Fund intends to distribute its net investment income and net realized long-term and short-term capital gains, if any, at least annually. Dividends and distributions to shareholders, which are determined in accordance with income tax regulations, are recorded on the ex-dividend date. The treatment for financial reporting purposes of distributions made to shareholders during the period from net investment income or net realized capital gains may differ from their ultimate treatment for federal income tax purposes. These differences are caused primarily by differences in the timing of the recognition of certain components of income, expense or realized capital gain for federal income tax purposes. Where such differences are permanent in nature, they are reclassified among the components of net assets based on their ultimate characterization for federal income tax purposes. Any such reclassifications will have no effect on net assets, results of operations or net asset value (“NAV”) per share of the Fund.For the fiscal year ended January 31, 2020, the Fund did not make any reclassifications.
Share Valuation – The NAV is calculated each day the New York Stock Exchange is open by dividing the total value of the Fund’s assets, less liabilities, by the number of shares outstanding for the Fund.
Options – The Fund utilizes an option premium collection strategy that implements a put spread and a call spread on the S&P 500® Index (SPX) to create a number of defined-risk trades. A defined-risk trade is essentially where a series of financial instruments (such as options) are entered into where the terms and conditions of the financial instruments are, in combination, designed to limit the overall risk. Stock index options are put options and call options on various stock indices. In most respects, they are identical to listed options on common stocks. The option holder who exercises the index option receives an amount of cash if the closing level of the stock index upon which the option is based is greater than, in the case of a call, or less than, in the case of a put, the exercise price of the option. Options trading is a highly specialized activity that entails greater than ordinary investment risk. Options may be more volatile than the underlying investments, and therefore may be subject to greater fluctuation than an investment in the underlying instruments themselves.
In implementing its option premium collection strategy, the Fund will sell (write) a put option (creating a short position) while simultaneously purchasing another put option at a different strike price (creating a long position) – the combination of these two put option positions creates a defined-risk trade. Additionally, the Fund will sell (write) a call option (creating another short position)
12
Belmont Theta Income Fund
Notes to the Financial Statements (continued)
January 31, 2020
while simultaneously purchasing another call option at a different strike price (creating another long position) – the combination of these two call options positions creates another defined-risk trade for the Fund. The Fund’s put spreads and call spreads each contain the following characteristics: (i) the long and short options of each spread have the same number of contracts, (ii) the long option of each spread will have a further out-of-the-money strike price than the short option; (iii) the long option of each spread will have at least the same or longer expiration date than the short option.
The Fund generally utilizes weekly and monthly SPX options with expirations of 90 days or less. SPX options are European-style options, which means that they can be exercised only at expiration. Based on the Adviser’s assessment of market conditions, the Adviser may close one or more sides of a spread at any time for purposes of risk management of the Fund.
The Adviser monitors all SPX option strikes for the optimal sale of put spreads and call spreads. Once the Fund has entered into a position, the Adviser attempts to realize as much of the net premium as possible. The Fund may decide to close its option spread positions prior to expiration, which may result in realizing less than the net option premium initially collected. Positions are generally re-set on a monthly basis, but the Adviser may determine to close and/or adjust option spreads prior to expiration for purposes of risk management. The Adviser may at times determine to take a temporary defensive position and not implement its option spread writing investment strategy. The option premium collection strategy may result in the generation of positive returns for the Fund; however, the loss potential if the strategy is not effective may be greater than the profit potential. The Fund may lose significantly more than the premium it receives in highly volatile market conditions.
The Fund is required to pledge collateral for the option trades and it will hold cash, money market instruments, or treasury bills as collateral for all such options trades. The Fund’s custodian will segregate such collateral for the benefit of the counterparty. Therefore, the Fund must typically maintain a large percentage of cash and cash equivalents within the Fund. The Fund’s option spread positions will effectively lever the portfolio and will target a notional exposure of no greater than three times the pledged collateral value.
13
Belmont Theta Income Fund
Notes to the Financial Statements (continued)
January 31, 2020
Derivative Transactions – The following tables identify the location and fair value of derivative instruments on the Statement of Assets and Liabilities as of January 31, 2020 and the effect of derivative instruments on the Statement of Operations for the fiscal year ended January 31, 2020.
As of January 31, 2020:
Location of Derivatives on Statement of Assets and Liabilities |
Derivatives | Asset Derivatives | Liability Derivatives | | Fair Value | |
Equity Price Risk: | | | | | | |
Options Purchased | Investments in securities at fair value | | | $ | 96,940 | |
Options Written | | Options written at fair value | | | (249,010 | ) |
For the fiscal year ended January 31, 2020:
Derivatives | Location of Gain (Loss) on Derivatives on
Statement of Operations | | Realized Gain
(Loss) on
Derivatives | | | Change in
Unrealized
Appreciation
(Depreciation) on
Derivatives | |
Equity Price Risk: | | | | | | | | | |
Options purchased | Net realized gain and change in unrealized appreciation (depreciation) on investment securities | | $ | (465,769 | ) | | $ | (61,619 | ) |
Options written | Net realized gain and change in unrealized appreciation (depreciation) on written options | | | 684,705 | | | | 112,947 | |
The following summarizes the average ending monthly fair value of derivatives outstanding during the fiscal year ended January 31, 2020:
Derivatives | | Average Fair Value | |
Options Purchased | | $ | 35,716 | |
Options Written | | | (132,907 | ) |
14
Belmont Theta Income Fund
Notes to the Financial Statements (continued)
January 31, 2020
The following table provides a summary of offsetting financial liabilities and derivatives and the effect of derivative instruments on the Statement of Assets and Liabilities as of January 31, 2020:
| | | | | | | | | | | | | | | Gross Amounts Not
Offset in Statements of
Assets and Liabilities | | | | | |
| | Gross
Amounts of
Recognized
Liabilities | | | Gross
Amounts
Offset in
Statement
of Assets
and
Liabilities | | | Net
Amounts of
Liabilities
Presented in
Statement
of Assets
and
Liabilities | | | Financial
Instruments | | | Collateral
Pledged | | | Net Amount | |
Options Written | | $ | 249,010 | | | $ | — | | | $ | 249,010 | | | $ | (249,010 | ) | | $ | — | | | $ | — | |
NOTE 3. SECURITIES VALUATION AND FAIR VALUE MEASUREMENTS
Fair value is defined as the price that the Fund would receive upon selling an investment in a timely transaction to an independent buyer in the principal or most advantageous market of the investment. GAAP establishes a three-tier hierarchy to maximize the use of observable market data and minimize the use of unobservable inputs and to establish classification of fair value measurements for disclosure purposes.
Inputs refer broadly to the assumptions that market participants would use in pricing the asset or liability, including assumptions about risk (the risk inherent in a particular valuation technique used to measure fair value including a pricing model and/or the risk inherent in the inputs to the valuation technique). Inputs may be observable or unobservable. Observable inputs are inputs that reflect the assumptions market participants would use in pricing the asset or liability developed based on market data obtained and available from sources independent of the reporting entity. Unobservable inputs are inputs that reflect the reporting entity’s own assumptions about the assumptions market participants would use in pricing the asset or liability developed based on the best information available in the circumstances.
Various inputs are used in determining the value of the Fund’s investments. These inputs are summarized in the three broad levels listed below.
| | ● | Level 1 – unadjusted quoted prices in active markets for identical investments and/or registered investment companies where the value per share is determined and published and is the basis for current transactions for identical assets or liabilities at the valuation date |
| | ● | Level 2 – other significant observable inputs (including, but not limited to, quoted prices for an identical security in an inactive market, quoted prices for similar securities, interest rates, prepayment speeds, credit risk, etc.) |
| | ● | Level 3 – significant unobservable inputs (including the Fund’s own assumptions in determining fair value of investments based on the best information available) |
15
Belmont Theta Income Fund
Notes to the Financial Statements (continued)
January 31, 2020
The inputs used to measure fair value may fall into different levels of the fair value hierarchy. In such cases, for disclosure purposes, the level in the fair value hierarchy which is reported, is determined based on the lowest level input that is significant to the fair value measurement in its entirety.
Debt securities are valued by using the mean between the closing bid and ask prices provided by a pricing service. If the closing bid and ask prices are not readily available, the pricing service may provide a price determined by a matrix pricing method. Matrix pricing is a mathematical technique used to value fixed income securities without relying exclusively on quoted prices. Matrix pricing takes into consideration recent transactions, yield, liquidity, risk, credit quality, coupon, maturity, type of issue and any other factors or market data the pricing service deems relevant for the actual security being priced and for other securities with similar characteristics. These securities will generally be categorized as Level 2 securities. Securities purchased with a discount or premium are accreted or amortized using the effective interest method. These securities will generally be categorized as Level 2 securities. If the Adviser determines that a price provided by the pricing service does not accurately reflect the fair value of the securities or when prices are not readily available from a pricing service, securities are valued at fair value as determined by the Adviser, in conformity with guidelines adopted by and subject to review of the Board. These securities will generally be categorized as Level 3 securities.
Equity securities that are traded on any stock exchange are generally valued at the last quoted sale price on the security’s primary exchange. Lacking a last sale price, an exchange-traded security is generally valued at its last bid price. Securities traded in the NASDAQ over-the-counter market are generally valued at the NASDAQ Official Closing Price. When using the market quotations and when the market is considered active, the security is classified as a Level 1 security. In the event that market quotations are not readily available or are considered unreliable due to market or other events, the Fund values its securities and other assets at fair value in accordance with policies established by and under the general supervision of the Board. Under these policies, the securities will be classified as Level 2 or 3 within the fair value hierarchy, depending on the inputs used.
Investments in mutual funds, including money market mutual funds, are generally priced at the ending NAV. These securities are categorized as Level 1 securities.
Exchange-traded options on securities and indices purchased or sold by the Fund generally will be valued at the mean of the last bid and ask prices. If there is no such reported ask on the valuation date, purchased options are valued at the most recent bid price. If there is no such reported bid on the valuation date, written options are valued at the most recent ask price. On the last business day of each month, the Chicago Board Options Exchange (“CBOE”) conducts special end-of-month non-trading closing rotations for the sole purpose of determining the fair value of the S&P 500 Index (SPX) option series. For month end valuations of SPX, the CBOE adjusted price will be used if the special end-of-month non-trading closing rotation fair value price differs from the price provided at market close. Options will generally be categorized as Level 2 securities.
In accordance with the Trust’s valuation policies, the Adviser is required to consider all appropriate factors relevant to the value of securities for which it has determined other pricing sources are not available or reliable as described above. No single method exists for determining fair value, because fair value depends upon the circumstances of each individual case. As a general principle, the current fair
16
Belmont Theta Income Fund
Notes to the Financial Statements (continued)
January 31, 2020
value of a security being valued by the Adviser would be the amount that the Fund might reasonably expect to receive upon the current sale. Methods that are in accordance with this principle may, for example, be based on (i) a multiple of earnings; (ii) a discount from market prices of a similar freely traded security (including a derivative security or a basket of securities traded on other markets, exchanges or among dealers); or (iii) yield to maturity with respect to debt issues, or a combination of these and other methods. Fair-value pricing is permitted if, in the Adviser’s opinion, the validity of market quotations appears to be questionable based on factors such as evidence of a thin market in the security based on a small number of quotations, a significant event occurs after the close of a market but before the Fund’s NAV calculation that may affect a security’s value, or the Adviser is aware of any other data that calls into question the reliability of market quotations.
The following is a summary of the inputs used to value the Fund’s investments as of January 31, 2020:
| | | Valuation Inputs | | | | | |
Assets | | Level 1 | | | Level 2 | | | Level 3 | | | Total | |
U.S. Treasury Bills | | $ | — | | | $ | 13,895,909 | | | $ | — | | | $ | 13,895,909 | |
Call Options Purchased | | | — | | | | 7,400 | | | | — | | | | 7,400 | |
Put Options Purchased | | | — | | | | 89,540 | | | | — | | | | 89,540 | |
Total | | $ | — | | | $ | 13,992,849 | | | $ | — | | | $ | 13,992,849 | |
| | | Valuation Inputs | | | | | |
Liabilities | | Level 1 | | | Level 2 | | | Level 3 | | | Total | |
Written Call Options | | $ | — | | | $ | (36,630 | ) | | $ | — | | | $ | (36,630 | ) |
Written Put Options | | | — | | | | (212,380 | ) | | | — | | | | (212,380 | ) |
Total | | $ | — | | | $ | (249,010 | ) | | $ | — | | | $ | (249,010 | ) |
The Fund did not hold any investments at the end of the reporting period for which significant unobservable inputs (Level 3) were used in determining fair value; therefore, no reconciliation of Level 3 securities is included for this reporting period.
NOTE 4. TRANSACTIONS WITH AFFILIATES AND OTHER SERVICE PROVIDERS
Under the terms of the investment advisory agreement, on behalf of the Fund (the “Agreement”), the Adviser manages the Fund’s investments subject to oversight of the Board. As compensation for its services, the Fund pays the Adviser a fee, computed and accrued daily and paid monthly at an annual rate of 1.75% of the average daily net assets of the Fund. For the fiscal year ended January 31, 2020, the Adviser earned a fee of $281,934 from the Fund before the waivers described below. At January 31, 2020, the Fund owed the Adviser $19,342.
The Adviser has contractually agreed to waive its management fee and/or reimburse certain operating expenses, until May 31, 2020, but only to the extent necessary so that the Fund’s net expenses, excluding brokerage fees and commissions, borrowing costs (such as interest and dividend expenses
17
Belmont Theta Income Fund
Notes to the Financial Statements (continued)
January 31, 2020
on securities sold short), taxes, extraordinary expenses, fees and expenses paid under a distribution plan adopted pursuant to Rule 12b-1, fees and expenses paid under a shareholder services plan, and indirect expenses (such as “acquired fund fees and expenses”) do not exceed 1.99%.
Each fee waiver or expense reimbursement by the Adviser is subject to repayment by the Fund within the three years following the date the fee waiver or expense reimbursement occurred, provided that the Fund is able to make the repayment without exceeding the expense limitation that is in effect at the time of the repayment or at the time of the fee waiver or expense reimbursement, whichever is lower. The contractual agreement is in effect through May 31, 2020. The expense cap may not be terminated prior to this date except by the Board. For the fiscal year ended January 31, 2020, the Adviser waived fees or reimbursed expenses totaling $140,267. As of January 31, 2020, the Adviser may seek repayment of investment advisory fee waivers and expense reimbursements as follows:
Recoverable through | | | |
January 31, 2022 | | $ | 142,741 | |
January 31, 2023 | | | 140,267 | |
The Trust retains Ultimus Fund Solutions, LLC (“Ultimus” or the “Administrator”) to provide the Fund with administration and compliance, fund accounting, and transfer agent services, including all regulatory reporting. For the fiscal year ended January 31, 2020, the Administrator earned fees of $38,250 for administration and compliance services, $27,861 for fund accounting services and $12,000 for transfer agent services. At January 31, 2020, the Administrator was owed $6,635 for these services.
The officers and one trustee of the Trust are members of management and/or employees of the Administrator. Ultimus Fund Distributors, LLC (the “Distributor”) acts as the principal distributor of the Fund’s shares. The Distributor operates as a wholly-owned subsidiary of Ultimus.
NOTE 5. PURCHASES AND SALES OF SECURITIES
For the fiscal year ended January 31, 2020, there were no purchases or sales of investment securities, other than short-term investments and short-term U.S. government obligations.
NOTE 6. FEDERAL TAX INFORMATION
At January 31, 2020, the net unrealized appreciation (depreciation) and tax cost of investments for tax purposes was as follows:
Gross unrealized appreciation | | $ | 28,142 | |
Gross unrealized depreciation | | | (21,572 | ) |
Net unrealized appreciation on investments | | $ | 6,570 | |
Tax cost of investments | | $ | 13,737,269 | |
At January 31, 2020, the difference between book basis and tax basis unrealized appreciation (depreciation) is attributable to mark-to-market adjustments related to options contracts.
18
Belmont Theta Income Fund
Notes to the Financial Statements (continued)
January 31, 2020
The tax character of distributions paid for the fiscal year ended January 31, 2020 was as follows:
| | | 2020 | | | 2019 | |
Distributions paid from: | | | | | | | | |
Ordinary income(a) | | $ | 28,031 | | | $ | — | |
Net long-term capital gains | | | 26,083 | | | | — | |
Total distributions paid | | $ | 54,114 | | | $ | — | |
(a) | For federal income tax purposes, distributions of short-term capital gains are treated as ordinary income distributions. |
At January 31, 2020, the components of accumulated earnings (deficit) on a tax basis were as follows:
Accumulated capital and other losses | | $ | (33,587 | ) |
Unrealized appreciation on investments | | | 6,570 | |
Total accumulated earnings | | $ | (27,017 | ) |
Certain qualified losses incurred after October 31, and within the current taxable year, are deemed to arise on the first business day of the Fund’s following taxable year. For the tax year ended January 31, 2020, the Fund deferred post October qualified losses and qualified late year ordinary losses in the amount of $33,044 and $543, respectively.
During the fiscal year ended January 31, 2020, the Fund utilized $103,990 in short-term capital loss carryforwards and $155,984 in long-term capital loss carryforwards.
NOTE 7. COMMITMENTS AND CONTINGENCIES
The Trust indemnifies its officers and Trustees for certain liabilities that may arise from their performance of their duties to the Trust or the Fund. Additionally, in the normal course of business, the Trust enters into contracts that contain a variety of representations and warranties which provide general indemnifications. The Trust’s maximum exposure under these arrangements is unknown, as this would involve future claims that may be made against the Trust that have not yet occurred.
NOTE 8. SUBSEQUENT EVENTS
Management of the Fund has evaluated the need for disclosures and/or adjustments resulting from subsequent events through the date at which these financial statements were issued. Based upon this evaluation, management has determined there were no items requiring adjustment of the financial statements or additional disclosure.
19
Report of Independent Registered Public Accounting Firm
To the Shareholders of Belmont Theta Income Fund and
Board of Trustees of Valued Advisers Trust
Opinion on the Financial Statements
We have audited the accompanying statement of assets and liabilities, including the schedules of investments and open written option contracts, of Belmont Theta Income Fund (“the Fund”), a series of Valued Advisers Trust, as of January 31, 2020, the related statement of operations for the year then ended, and the statements of changes in net assets and the financial highlights for each of the two periods in the period then ended, including the related notes (collectively referred to as the “financial statements”). In our opinion, the financial statements present fairly, in all material respects, the financial position of the Fund as of January 31, 2020, the results of its operations for the year then ended, and the changes in its net assets and the financial highlights for each of the two periods in the period then ended, in conformity with accounting principles generally accepted in the United States of America.
Basis for Opinion
These financial statements are the responsibility of the Fund’s management. Our responsibility is to express an opinion on the Fund’s financial statements based on our audits. We are a public accounting firm registered with the Public Company Accounting Oversight Board (United States) (“PCAOB”) and are required to be independent with respect to the Fund in accordance with the U.S. federal securities laws and the applicable rules and regulations of the Securities and Exchange Commission and the PCAOB.
We conducted our audits in accordance with the standards of the PCAOB. Those standards require that we plan and perform the audit to obtain reasonable assurance about whether the financial statements are free of material misstatement whether due to error or fraud.
Our audits included performing procedures to assess the risks of material misstatement of the financial statements, whether due to error or fraud, and performing procedures that respond to those risks. Such procedures included examining, on a test basis, evidence regarding the amounts and disclosures in the financial statements. Our procedures included confirmation of securities owned as of January 31, 2020, by correspondence with the custodian and broker. Our audits also included evaluating the accounting principles used and significant estimates made by management, as well as evaluating the overall presentation of the financial statements. We believe that our audits provide a reasonable basis for our opinion.
We have served as the Fund’s auditor since 2018.
COHEN & COMPANY, LTD.
Cleveland, Ohio
March 24, 2020
20
Summary of Fund Expenses (Unaudited)
As a shareholder of the Fund, you incur two types of costs: (1) transaction and (2) ongoing costs, including management fees and other Fund expenses. These examples are intended to help you understand your ongoing costs (in dollars) of investing in the Fund and to compare these costs with the ongoing costs of investing in other mutual funds. The example is based on an investment of $1,000 invested at the beginning of the period and held for the entire period from August 1, 2019 through January 31, 2020.
Actual Expenses
The first line of the table below provides information about actual account values and actual expenses. You may use the information in this line, together with the amount you invested, to estimate the expenses that you paid over the period. Simply divide your account value by $1,000 (for example, an $8,600 account value divided by $1,000 = 8.6), then multiply the result by the number in the first line under the heading entitled “Expenses Paid During Period” to estimate the expenses you paid on your account during this period.
Hypothetical Example for Comparison Purposes
The second line of the table below provides information about hypothetical account values and hypothetical expenses based on the Fund’s actual expense ratio and an assumed rate of return of 5% per year before expenses, which is not the Fund’s actual return. The hypothetical account values and expenses may not be used to estimate the actual ending account balance or expenses you paid for the period. You may use this information to compare the ongoing costs of investing in the Fund and other funds. To do so, compare this 5% hypothetical example with the 5% hypothetical examples that appear in the shareholder reports of the other funds.
Expenses shown in the table are meant to highlight your ongoing costs only and do not reflect any transactional costs. Therefore, the second line of the table below is useful in comparing ongoing costs only and will not help you determine the relative costs of owning different funds. In addition, if transaction costs were included, your costs would have been higher.
Belmont Theta Income Fund | Beginning
Account
Value
August 1, 2019 | Ending
Account
Value
January 31, 2020 | Expenses
Paid
During
Period(a) | Annualized
Expense
Ratio |
Actual | $1,000.00 | $ 998.40 | $10.50 | 2.08% |
Hypothetical(b) | $1,000.00 | $ 1,014.70 | $10.58 | 2.08% |
(a) | Expenses are equal to the Fund’s annualized expense ratios, multiplied by the average account value over the period, multiplied by 184/365 (to reflect the one-half year period). |
(b) | Hypothetical assumes 5% annual return before expenses. |
21
Additional Federal Income Tax Information (Unaudited)
The Form 1099-DIV you receive in January 2021 will show the tax status of all distributions paid to your account in calendar year 2020. Shareholders are advised to consult their own tax adviser with respect to the tax consequences of their investment in the Fund. As required by the Internal Revenue Code and/or regulations, shareholders must be notified regarding the status of qualified dividend income for individuals and the dividends received deduction for corporations.
Qualified Dividend Income. The Fund designates approximately 0% or up to the maximum amount of such dividends allowable pursuant to the Internal Revenue Code, as qualified dividend income eligible for a reduced tax rate.
Qualified Business Income. The Fund designates approximately 0% of its ordinary income dividends, or up to the maximum amount of such dividends allowable pursuant to the Internal Revenue Code, as qualified business income.
Dividends Received Deduction. Corporate shareholders are generally entitled to take the dividends received deduction on the portion of the Fund’s dividend distribution that qualifies under tax law. For the Fund’s calendar year 2020 ordinary income dividends, 0% qualifies for the corporate dividends received deduction.
For the year ended January 31, 2020, the Fund designated $26,083 as long-term capital gain distributions.
22
Trustees and Officers (Unaudited)
The Board of Trustees supervises the business activities of the Trust. Each Trustee serves as a trustee until termination of the Trust unless the Trustee dies, resigns, retires or is removed.
The following table provides information regarding each of the Independent Trustees.
Name, Address*, Age,
Position with Trust**,
Term of Position with Trust | Principal Occupation During Past 5 Years
and Other Directorships | Other Directorships |
Andrea N. Mullins, 52
Independent Trustee Since December 2013 Chairperson since March 2017 | Current: Private investor; Independent Contractor, SWM Advisors (since April 2014). | Trustee, Angel Oak Funds Trust (since February 2019) (4 portfolios); Trustee, Angel Oak Strategic Credit Fund (since February 2019); Trustee, Angel Oak Financial Strategies Income Term Trust (since May 2019). |
Ira P. Cohen, 61
Independent Trustee
Since June 2010 | Current: Independent financial services consultant (since February 2005); Executive Vice President of Asset Management Services, Recognos Financial (since August 2015). | Trustee and Audit Committee Chairman, Griffin Institutional Access Credit Fund (since January 2017); Trustee and Audit Committee Chairman, Griffin Institutional Real Estate Access Fund (since May 2014); Trustee, Angel Oak Funds Trust (since October 2014) (4 portfolios) Trustee, Chairman, and Nominating and Governance Committee Chairman, Angel Oak Strategic Credit Fund (since December 2017); Trustee and Chairman, Angel Oak Financial Strategies Income Term Trust (since May 2019). |
* | The address for each Trustee is 225 Pictoria Drive, Suite 450, Cincinnati, Ohio 45246. |
** | As of the date of this report, the Trust consists of 12 series. |
23
Trustees and Officers (Unaudited) (continued)
The following table provides information regarding the Trustee who is considered an “interested person” of the Trust, as that term is defined under the 1940 Act. Based on the experience of the Trustee, the Trust concluded that the individual described below should serve as a Trustee.
Name, Address*, Age,
Position with Trust**,
Term of Position with Trust | Principal Occupation During Past 5 Years
and Other Directorships | Other Directorships |
Mark J. Seger***, 58
Trustee Since March 2017 | Current: Vice Chairman and Co-Founder Ultimus Fund Solutions, LLC and its subsidiaries (since 1999). | None. |
* | The address for each Trustee is 225 Pictoria Drive, Suite 450, Cincinnati, Ohio 45246. |
** | As of the date of this report, the Trust consists of 12 series. |
*** | Mr. Seger is considered an “interested person” of the Trust because of his relationship with the Trust’s administrator, transfer agent, and distributor. |
The following table provides information regarding the Officers of the Trust:
Name, Address*, Age,
Position with Trust**,
Term of Position with Trust | Principal Occupation During Past 5 Years | Other Directorships |
Adam T. Kornegay, 35
Principal Executive Officer and President Since April 2018 | Current: Vice President, Business Development Director, Ultimus Fund Solutions, LLC (since March 2015).
Previous: Vice President, Citigroup, Inc. (July 2009 to February 2015). | None. |
Gregory T. Knoth, 49
Principal Financial Officer
and Treasurer Since
April 2019 | Current: Vice President, Mutual Fund Controller, Ultimus Fund Solutions, LLC (since January 2016). Previous: Vice President and Manager of Fund Accounting, Huntington Asset Services, Inc. (n/k/a Ultimus Asset Services, LLC) (June 2013 to December 2015). | None. |
Kevin J. Patton, 49 Chief Compliance Officer
Since March 2020 | Current: Senior Compliance Officer, Ultimus Fund Solutions, LLC (since January 2020). Previous: Partner and Chief Compliance Officer, Renaissance Investment Management (August 2005 to January 2020). | None. |
24
Trustees and Officers (Unaudited) (continued)
Name, Address*, Age,
Position with Trust**,
Term of Position with Trust | Principal Occupation During Past 5 Years | Other Directorships |
Carol J. Highsmith, 55
Vice President Since August 2008
Secretary Since March 2014 | Current: Vice President, Ultimus Fund Solutions, LLC (since December 2015).
Previous: Employed in various positions with Huntington Asset Services, Inc. (n/k/a Ultimus Asset Services, LLC) (November 1994 to December 2015), most recently Vice President of Legal Administration (2005 to December 2015). | None. |
* | The address for each Trustee is 225 Pictoria Drive, Suite 450, Cincinnati, Ohio 45246. |
** | As of the date of this report, the Trust consists of 12 series. |
25
Investment Advisory Agreement Approval (Unaudited)
At a meeting held on December 2-3, 2019, the Board of Trustees (the “Board”) considered the renewal of the Investment Advisory Agreement (the “Belmont Agreement”) between Valued Advisers Trust (the “Trust”) and Belmont Capital, LLC (“Belmont”) with respect to the Belmont Theta Income Fund (the “Belmont Fund”). Belmont provided written information to the Board to assist the Board in its considerations.
Counsel reminded the Trustees of their fiduciary duties and responsibilities as summarized in a memorandum from his firm, including the factors to be considered, and the application of those factors to Belmont and the Belmont Agreement. In assessing these factors, the Board took into consideration information furnished by Belmont and Trust management for the Board’s review and consideration throughout the year, as well as information specifically prepared or presented in connection with the annual renewal process, including: (i) reports regarding the services and support provided to the Belmont Fund and its shareholders by Belmont; (ii) quarterly assessments of the investment performance of the Belmont Fund by personnel of Belmont; (iii) commentary on the reasons for the Belmont Fund’s performance; (iv) presentations by Belmont addressing Belmont’s investment philosophy, investment strategy, personnel, and operations; (v) compliance and audit reports concerning the Belmont Fund and Belmont; (vi) disclosure information contained in the registration statement for the Belmont Fund and the Form ADV of Belmont; and (vii) a memorandum from Counsel, that summarized the fiduciary duties and responsibilities of the Board in reviewing and approving the Belmont Agreement. The Board also requested and received various informational materials including, without limitation: (a) documents containing information about Belmont, including its financial information, a description of personnel and the services it provides to the Belmont Fund; information on Belmont’s investment advice and performance; summaries of the Belmont Fund’s expenses, compliance program, current legal matters, and other general information; (b) comparative expense and performance information for other mutual funds with strategies similar to the Belmont Fund; and (c) the benefits to be realized by Belmont from its relationship with the Belmont Fund. The Board did not identify any particular information that was most relevant to its consideration of the Belmont Agreement and each Trustee may have afforded different weight to the various Factors.
1. | The nature, extent, and quality of the services to be provided by Belmont. In this regard, the Board considered Belmont’s responsibilities under the Belmont Agreement. The Trustees considered the services being provided by Belmont to the Belmont Fund. The Trustees discussed, among other things: the quality of Belmont’s investment advisory services (including research and recommendations with respect to portfolio securities), its process for formulating investment recommendations and assuring compliance with the Belmont Fund’s investment objectives and limitations, its coordination of services for the Belmont Fund among the Belmont Fund’s service providers, and its efforts to promote the Belmont Fund and grow its assets. The Trustees considered Belmont’s continuity of, and commitment to retain, qualified personnel and Belmont’s commitment to maintain and enhance its resources and systems. The Trustees considered Belmont’s personnel, including the education and experience of the personnel. After considering the foregoing information and further information in the Meeting materials provided by Belmont (including Belmont’s Form ADV), the Board concluded that, in light of all the facts and circumstances, the nature, extent, and quality of the services provided by Belmont were satisfactory and adequate for the Belmont Fund. |
26
Investment Advisory Agreement Approval (Unaudited) (continued)
2. | Investment Performance of the Belmont Fund and Belmont. In considering the investment performance of the Belmont Fund and Belmont, the Trustees compared the performance of the Belmont Fund with the performance of funds in the same Morningstar category, as well as with peer group data and the Belmont Fund’s benchmark. The Trustees noted that the Belmont Fund had outperformed its peer group average and median for the one month and three month periods ended September 30, 2019, but had underperformed the average and median for the year-to-date period ended on that date. For the one-year period they noted that the Fund performed below the median, but just above the average. They observed that the Belmont Fund performed slightly better than its style-specific benchmark for the one month, three month, and one-year periods, but had underperformed for the year-to-date period. With regard to its broad market benchmark, they noted that the Belmont Fund outperformed for the one month and three month periods, but underperformed for the year-to-date and one-year periods. The Trustees observed that the Belmont Fund had underperformed its category average for the one month, year-to-date, and one-year periods ended September 30, 2019, but had outperformed for the three month period. The Trustees also considered the consistency of Belmont’s management of the Belmont Fund with its investment objective, strategies, and limitations. The Trustees considered the Belmont Fund’s performance relative to the performance of Belmont’s theta overlay program and noted that the performance for the year-to-date period ended September 30, 2019 was very close. They considered Belmont’s explanation regarding the reasons for the small difference, and determined that the explanation was reasonable. After reviewing and discussing the investment performance of the Belmont Fund further, Belmont’s experience managing the Belmont Fund, Belmont’s historical performance, and other relevant factors, the Board concluded, in light of all the facts and circumstances, including the short performance record of the Belmont Fund, that the investment performance of the Belmont Fund and Belmont was acceptable. |
3. | The costs of the services to be provided and profits to be realized by Belmont from the relationship with the Belmont Fund. In considering the costs of services to be provided and the profits to be realized by Belmont from the relationship with the Belmont Fund, the Trustees considered: (1) Belmont’s financial condition; (2) the asset level of the Belmont Fund; (3) the overall expenses of the Belmont Fund; and (4) the nature and frequency of advisory fee payments. The Trustees reviewed information provided by Belmont regarding its profits associated with managing the Belmont Fund. The Trustees also considered potential benefits for Belmont in managing the Belmont Fund. The Trustees then compared the fees and expenses of the Belmont Fund (including the management fee) to other comparable mutual funds. The Trustees observed that the Belmont Fund’s advisory fee was, along with several other mutual funds, the highest in its peer group and in its Morningstar category. They also noted that the Belmont Fund’s net expense ratio was above the average and median of its peer group and its Morningstar category, but was well below the maximum in both cases. Based on the foregoing, the Board concluded that the fees to be paid to Belmont by the Belmont Fund and the profits to be realized by Belmont, in light of all the facts and circumstances, were fair and reasonable in relation to the nature and quality of the services provided by Belmont. |
4. | The extent to which economies of scale would be realized as the Belmont Fund grows and whether advisory fee levels reflect these economies of scale for the benefit of the Belmont Fund’s investors. In this regard, the Board considered the Belmont Fund’s fee arrangements with Belmont. The Board |
27
Investment Advisory Agreement Approval (Unaudited) (continued)
considered that while the management fee remained the same at all asset levels, the Belmont Fund’s shareholders had experienced benefits from the Belmont Fund’s expense limitation arrangement, and that Belmont had agreed to extend that arrangement for another year. They also noted that the Belmont Fund’s shareholders would continue to benefit from the economies of scale under the Trust’s agreements with service providers other than Belmont. In light of the foregoing, the Board determined that the Belmont Fund’s fee arrangements, in light of all the facts and circumstances, were fair and reasonable in relation to the nature and quality of the services provided by Belmont.
5. | Possible conflicts of interest and benefits to Belmont. In considering Belmont’s practices regarding conflicts of interest, the Trustees evaluated the potential for conflicts of interest and considered such matters as the experience and ability of the advisory personnel assigned to the Belmont Fund; the basis of decisions to buy or sell securities for the Belmont Fund and/or Belmont’s other accounts; and the substance and administration of Belmont’s code of ethics. The Trustees also considered disclosure in the registration statement of the Trust relating to Belmont’s potential conflicts of interest. The Trustees discussed Belmont’s practices for seeking best execution for the Belmont Fund’s portfolio transactions. The Board noted that Belmont does not engage in soft dollar arrangements and has not identified any indirect benefits from its relationship with the Belmont Fund. Based on the foregoing, the Board determined that Belmont’s standards and practices relating to the identification and mitigation of potential conflicts of interest were satisfactory. |
After additional consideration of the factors delineated in the memorandum provided by counsel and further discussion among the Board members, the Board determined to approve the continuation of the Belmont Agreement.
28
FACTS | WHAT DOES BELMONT THETA INCOME FUND (THE “Fund”) DO WITH YOUR PERSONAL INFORMATION? |
| | |
Why? | Financial companies choose how they share your personal information. Federal law gives consumers the right to limit some but not all sharing. Federal law also requires us to tell you how we collect, share, and protect your personal information. Please read this notice carefully to understand what we do. |
| | |
What? | The types of personal information we collect and share depend on the product or service you have with us. This information can include: ■ Social Security number ■ account balances and account transactions ■ transaction or loss history and purchase history ■ checking account information and wire transfer instructions When you are no longer our customer, we continue to share your information as described in this notice. |
| | |
How? | All financial companies need to share customers’ personal information to run their everyday business. In the section below, we list the reasons financial companies can share their customers’ personal information; the reasons the Fund chooses to share; and whether you can limit this sharing. |
| | |
Reasons we can share your personal information | Does the Fund share? |
For our everyday business purposes —
such as to process your transactions, maintain your account(s), respond to court orders and legal investigations, or report to credit bureaus | Yes |
For our marketing purposes —
to offer our products and services to you | No |
For joint marketing with other financial companies | No |
For our affiliates’ everyday business purposes –
information about your transactions and experiences | No |
For our affiliates’ everyday business purposes –
information about your creditworthiness | No |
For nonaffiliates to market to you | No |
| | |
Questions? | Call (800) 789-1087 |
29
Who we are |
Who is providing this notice? | Belmont Theta Income Fund
Ultimus Fund Distributors, LLC (Distributor)
Ulimus Fund Solutions, LLC (Administrator) |
What we do |
How does the Fund protect my personal information? | To protect your personal information from unauthorized access and use, we use security measures that comply with federal law. These measures include computer safeguards and secured files and buildings. Our service providers are held accountable for adhering to strict policies and procedures to prevent any misuse of your nonpublic personal information. |
How does the Fund collect my personal information? | We collect your personal information, for example, when you ● open an account or deposit money ● buy securities from us or sell securities to us ● make deposits or withdrawals from your account or provide account information ● give us your account information ● make a wire transfer ● tell us who receives the money ● tell us where to send the money ● show your government-issued ID ● show your driver’s license |
Why can’t I limit all sharing? | Federal law gives you the right to limit only ● sharing for affiliates’ everyday business purposes—information about your creditworthiness ● affiliates from using your information to market to you ● sharing for nonaffiliates to market to you State laws and individual companies may give you additional rights to limit sharing. |
Definitions |
Affiliates | Companies related by common ownership or control. They can be financial and nonfinancial companies. ● Belmont Capital, LLC d/b/a Belmont Capital GroupTM, the investment adviser to the Fund, could be deemed to be an affiliate. |
Nonaffiliates | Companies not related by common ownership or control. They can be financial and nonfinancial companies. ● The Fund does not share your personal information with nonaffiliates so they can market to you |
Joint marketing | A formal agreement between nonaffiliated financial companies that together market financial products or services to you. ● The Fund doesn’t jointly market. |
30
This page is intentionally left blank.
This page is intentionally left blank.
This page is intentionally left blank.
Other Information
The Fund’s Statement of Additional Information (“SAI”) includes additional information about the trustees and is available without charge, upon request. You may call toll-free at (800) 789-1087 to request a copy of the SAI or to make shareholder inquiries.
Proxy Voting
A description of the policies and procedures that the Fund uses to determine how to vote proxies relating to portfolio securities and information regarding how the Fund voted those proxies during the most recent twelve month period ended June 30, are available (1) without charge upon request by calling the Fund at (800) 789-1087 and (2) in Fund documents filed with the Securities and Exchange Commission (“SEC”) on the SEC’s website at www.sec.gov.
TRUSTEES
Andrea N. Mullins, Chairperson
Ira P. Cohen
Mark J. Seger | INDEPENDENT REGISTERED PUBLIC ACCOUNTING FIRM
Cohen & Company, Ltd.
1350 Euclid Avenue, Suite 800
Cleveland, OH 44115 |
| | |
OFFICERS
Adam T. Kornegay, Principal Executive Officer and President
Gregory T. Knoth, Principal Financial Officer and Treasurer
Kevin J. Patton, Chief Compliance Officer
Carol J. Highsmith, Vice President and Secretary | LEGAL COUNSEL
Stradley Ronon Stevens & Young, LLP
2005 Market Street, Suite 2600
Philadelphia, PA 19103 |
| | |
INVESTMENT ADVISER
Belmont Capital, LLC d/b/a Belmont Capital Group™
1875 Century Park E., Suite 1780
Los Angeles, CA 90067 | CUSTODIAN
Huntington National Bank
41 South High Street
Columbus, OH 43215 |
| | |
DISTRIBUTOR
Ultimus Fund Distributors, LLC
225 Pictoria Drive, Suite 450
Cincinnati, OH 45246 | ADMINISTRATOR, TRANSFER AGENT
AND FUND ACCOUNTANT
Ultimus Fund Solutions, LLC
225 Pictoria Drive, Suite 450
Cincinnati, OH 45246 |
This report is intended only for the information of shareholders or those who have received the Fund’s prospectus which contains information about the Fund’s management fee and expenses. Please read the prospectus carefully before investing.
Distributed by Ultimus Fund Distributors, LLC
Member FINRA/SIPC
Item 2. Code of Ethics.
As of the end of the period covered by this report, the registrant has adopted a code of ethics that applies to the registrant’s principal executive officer, principal financial officer, principal accounting officer or controller, or persons performing similar functions, regardless of whether these individuals are employed by the registrant or a third party. Pursuant to Item 12(a)(1), a copy of registrant’s code of ethics is filed as an exhibit to this Form N-CSR. During the period covered by this report, the code of ethics has not been amended, and the registrant has not granted any waivers, including implicit waivers, from the provisions of the code of ethics.
Item 3. Audit Committee Financial Expert.
(a)(1) The registrant’s Board of Trustees has determined that the registrant has at least one audit committee financial expert serving on its audit committee.
(a)(2) The audit committee financial expert is Andrea N. Mullins, who is “independent” for purposes of this Item 3 of Form N-CSR.
Item 4. Principal Accountant Fees and Services.
| Golub Group Equity Fund | FY 2020 | $13,500 |
| | FY 2019 | $13,500 |
| | | |
| Belmont Theta Income Fund | FY 2020 | $14,500 |
| | FY 2019 | $14,500 |
| Golub Group Equity Fund | FY 2020 | $0 |
| | FY 2019 | $0 |
| | | |
| Belmont Theta Income Fund | FY 2020 | $0 |
| | FY 2019 | $0 |
| Golub Group Equity Fund | FY 2020 | $3,000 |
| | FY 2019 | $3,000 |
| | | |
| Belmont Theta Income Fund | FY 2020 | $3,000 |
| | FY 2019 | $3,000 |
Nature of the fees: Preparation of the 1120 RIC and Excise review
| Golub Group Equity Fund | FY 2020 | $0 |
| | FY 2019 | $0 |
| | | |
| Belmont Theta Income Fund | FY 2020 | $0 |
| | FY 2019 | $0 |
| (e) | (1) | Audit Committee’s Pre-Approval Policies |
The Audit Committee Charter requires the Audit Committee to be responsible for the selection, retention or termination of auditors and, in connection therewith, to (i) evaluate the proposed fees and other compensation, if any, to be paid to the auditors, (ii) evaluate the independence of the auditors, (iii) pre-approve all audit services and, when appropriate, any non-audit services provided by the independent auditors to the Trust, (iv) pre-approve, when appropriate, any non-audit services provided by the independent auditors to the Trust's investment adviser, or any entity controlling, controlled by, or under common control with the investment adviser and that provides ongoing services to the Trust if the engagement relates directly to the operations and financial reporting of the Trust, and (v) receive the auditors’ specific representations as to their independence.
| (2) | All of the services described in paragraphs (b) through (d) of Item 4 were pre-approved by the Audit Committee. |
| (f) | During audit of registrant's financial statements for the most recent fiscal year, less than 50 percent of the hours expended on the principal accountant's engagement were attributed to work performed by persons other than the principal accountant's full-time, permanent employees. |
| (g) | The aggregate non-audit fees billed by the registrant's accountant for services rendered to the registrant, and rendered to the registrant's investment adviser (not including any sub-adviser whose role is primarily portfolio management and is subcontracted with or overseen by another investment adviser), and any entity controlling, controlled by, or under common control with the adviser that provides ongoing services to the registrant: |
| | Registrant | Adviser |
| FY 2020 | $6,000 | $0 |
| FY 2019 | $6,000 | $0 |
| (h) | Not applicable. The auditor performed no services for the registrant’s investment adviser or any entity controlling, controlled by, or under common control with the investment adviser that provides ongoing services to the registrant. |
Item 5. Audit Committee of Listed Companies.NOT APPLICABLE – applies to listed companies only
Item 6. Schedule of Investments.Schedules filed with Item 1.
Item 7. Disclosure of Proxy Voting Policies and Procedures for Closed-End Management Investment Companies. NOT APPLICABLE – applies to closed-end funds only
Item 8. Portfolio Managers of Closed-End Investment Companies.NOT APPLICABLE – applies to closed-end funds only
Item 9. Purchases of Equity Securities by Closed-End Management Investment Company and Affiliated Purchasers. NOT APPLICABLE – applies to closed-end funds only
Item 10. Submission of Matters to a Vote of Security Holders.
The guidelines applicable to shareholders desiring to submit recommendations for nominees to the Registrant's board of trustees are contained in the statement of additional information of the Trust with respect to the Fund(s) for which this Form N-CSR is being filed.
Item 11. Controls and Procedures.
(a) Based on their evaluation of the registrant’s disclosure controls and procedures (as defined in Rule 30a-3(c) under the Investment Company Act of 1940, as amended (the “Act”)) as of a date within 90 days of the filing date of this report, the registrant’s principal executive officer and principal financial officer have concluded that such disclosure controls and procedures are reasonably designed and are operating effectively to ensure that material information relating to the registrant is made known to them by others within those entities, particularly during the period in which this report is being prepared, and that the information required in filings on Form N-CSR is recorded, processed, summarized, and reported on a timely basis.
(b) There were no changes in the registrant’s internal control over financial reporting (as defined in Rule 30a-3(d) under the Investment Company Act of 1940) that occurred during the second fiscal quarter of the period covered by this report that have materially affected, or are reasonably likely to materially affect, the registrant’s internal control over financial reporting.
Item 12. Disclosure of Securities Lending Activities for Closed-End Management Investment Companies.
NOT APPLICABLE – applies to closed-end funds only
Item 13. Exhibits.
| (a) | (1) | Code is filed herewith. |
Pursuant to the requirements of the Securities Exchange Act of 1934 and the Investment Company Act of 1940, the registrant has duly caused this report to be signed on its behalf by the undersigned, thereunto duly authorized.
| (Registrant) | Valued Advisers Trust | |
| | | |
| By | /s/ Adam T. Kornegay | |
| | Adam T. Kornegay, President and Principal Executive Officer | |
| | | |
| Date | 3/27/2020 | |
Pursuant to the requirements of the Securities Exchange Act of 1934 and the Investment Company Act of 1940, this report has been signed below by the following persons on behalf of the registrant and in the capacities and on the dates indicated.
| By | /s/ Adam T. Kornegay | |
| | Adam T. Kornegay, President and Principal Executive Officer | |
| | | |
| Date | 3/27/2020 | |
| | | |
| By | /s/ Gregory Knoth | |
| | Gregory Knoth, Treasurer and Principal Financial Officer | |
| | | |
| Date | 3/27/2020 | |