united states
securities and exchange commission
washington, d.c. 20549
form n-csr
certified shareholder report of registered management
investment companies
| Investment Company Act file number | 811-22208 | |
| Valued Advisers Trust |
| (Exact name of registrant as specified in charter) |
| Ultimus Fund Solutions, LLC 225 Pictoria Drive, Suite 450 Cincinnati, OH 45246 |
(Address of principal executive offices) (Zip code) |
Ultimus Fund Solutions, LLC Attn: Gregory Knoth 225 Pictoria Drive, Suite 450 Cincinnati, OH 45246 |
| (Name and address of agent for service) |
| Registrant's telephone number, including area code: | 513-587-3400 | |
| Date of fiscal year end: | 5/31 | |
| | | |
| Date of reporting period: | 5/31/2020 | |
Item 1. Reports to Stockholders.
BFS Equity Fund
ANNUAL REPORT
May 31, 2020
Beginning on January 1, 2021, as permitted by regulations adopted by the U.S. Securities and Exchange Commission, paper copies of the Fund’s shareholder reports like this one will no longer be sent by mail, unless you specifically request paper copies of the reports from the Fund or from your financial intermediary such as a broker-dealer or bank. Instead, the reports will be made available on a website, and you will be notified by mail each time a report is posted and provided with a website link to access the report.
If you already elected to receive shareholder reports electronically, you will not be affected by this change and you need not take any action. You may elect to receive shareholder reports and other communications from the Fund electronically by contacting the Fund at (855) 575-2430 or, if you own these shares through a financial intermediary, you may contact your financial intermediary.
You may elect to receive all future reports in paper free of charge. You can inform the Fund that you wish to continue receiving paper copies of your shareholder reports by contacting the Fund at (855) 575-2430. If you own shares through a financial intermediary, you may contact your financial intermediary or follow instructions included with this document to elect to continue to receive paper copies of your shareholder reports. Your election to receive reports in paper will apply to all funds held with the fund complex or at your financial intermediary.

185 Asylum Street ● City Place II ● Hartford, CT 06103 ● (855) 575-2430
BFS Equity Fund
Letter to Shareholders
Dear Fellow Shareholders,
This annual report covers the period June 1, 2019 through May 31, 2020 – the BFS Equity Fund’s sixth full fiscal year.
The BFS Equity Fund (the “Fund”) was launched on November 8, 2013, with initial funds from investors of $1.1 million. On June 1, 2019, at the start of the Fund’s fiscal year, the Fund had net assets of $36.0 million. During the fiscal year, the net assets of the Fund increased 7.8% to $38.9 million, as of May 31, 2020. This growth was driven by net inflows from investors into the Fund, as well as by the positive investment return achieved by the Fund over the past fiscal year. As of May 31, 2020, there were approximately 690 investors in the Fund.
The BFS Equity Fund achieved a total return of 6.32% for the fiscal year commencing June 1, 2019 and ending May 31, 2020, underperforming the S&P 500® Index (“S&P 500”) total return of 12.84% and outperforming the Dow Jones Industrial Average® (“Dow Jones”) total return of 4.83% for the same period. For the three-year period commencing June 1, 2017 and ending May 31, 2020, the Fund achieved an annualized total return of 9.43%, underperforming the S&P 500 annualized three-year total return of 10.23% and outperforming the Dow Jones annualized three-year total return of 9.05% for the same period.
This report includes a commentary from the Lead Portfolio Manager, Rob Bradley, and Co-Portfolio Managers, Tom Sargent, and Keith LaRose. Rob Bradley assumed the role of Lead Portfolio Manager of the Fund April 1, 2020, from Tim Foster who, after 25 years of providing substantial leadership for Bradley, Foster & Sargent, Inc., the company he co-founded and the investment advisor for the Fund, elected to transition into a reduced role at Bradley, Foster & Sargent, Inc. In his reduced role, as of March 31, 2020, Tim Foster completed his tour as Lead Portfolio Manager of the Fund. You will also find a listing of the portfolio holdings as of May 31, 2020, as well as financial statements and detailed information about the performance and positioning of the Fund.
This has been a twelve-month period like no other. From record highs in the market to a total turnaround as investors panicked, recognizing the negative impact that the coronavirus (“COVID-19”) would likely wreak on the global economy. We do not know
1
when the curve of new cases of COVID-19 will flatten or whether the virus will reappear next winter. Some analysts predict a long bear market, while others believe that the market will snap back by the end of this year. No one can forecast this with accuracy. But we do believe that with interest rates near zero, the Administration and Congress will not hesitate to spend whatever it takes to get the economy back on its feet. Clearly, this will increase the U.S. national debt and the Debt/GDP ratio substantially, but for the moment this appears to most observers as a secondary concern.
In conclusion, the important thing for investors is to take the long view. The important principle for creating wealth in the U.S. stock market is time in the market, not timing the market. Now, more than ever, it is important for investors to focus on quality companies ‒ with great brands, sound business models, quality management, wide moats, strong balance sheets, and strong cash flows. We believe that investing in these companies for the long term rather than focusing on the short-term gyrations of the market will preserve capital in times of economic adversity and create wealth in times of economic growth.
In closing, it is important to reiterate our belief that, now more than ever, our investment strategy of investing in quality growth stocks purchased with a risk-mitigating approach and positioned to provide a margin of safety in the case of economic or market weakness is effective over the longer term. We believe the Fund’s ownership of shares in quality companies with sound business models, strong brands, good balance sheets, professional management, and robust cash flow should be able to withstand market corrections, even bear markets, and perform well over the longer term.
The Portfolio Managers of the BFS Equity Fund and I are shareholders together with you. We thank you for the trust that you have placed in us to manage your assets.
Sincerely
Stephen L. Willcox
President and CEO
Bradley, Foster & Sargent, Inc.
2
BFS Equity Fund
Portfolio Managers’ Letter
The BFS Equity Fund celebrated its sixth anniversary last fall. As of the close of the Fund’s fiscal year on May 31, 2020, Fund assets were $38.9 million – up from $36.0 million at the start of the fiscal year on June 1, 2019. The price per share of the BFS Equity Fund has grown from $10 at its inception to $16.10 on May 31, 2020. There were approximately 690 shareholders at the end of the Fund’s fiscal year - primarily client families and friends of Bradley, Foster & Sargent, as well as the principals of the firm.
The Fund achieved a total return of 6.32% for the fiscal year ending May 31, 2020, underperforming the S&P 500 total return of 12.84% and outperforming Dow Jones total return of 4.83% for the same period. The concentration of FAANG stocks (Facebook, Apple, Amazon, Netflix, and Google) in the S&P 500 lifted its total return for this period to 12.84%. The total return of the equally weighted S&P 500 was 2.41% for the period, which the Fund nicely outperformed. For the six-month period ending May 31, 2020, the Fund returned -6.22% versus the S&P 500’s total return of -2.10%.
It was a decidedly challenging year for the Fund, as the stock market experienced one of the most rapid and wrenching bear markets in its history during the first quarter of 2020. The S&P 500 fell from an intraday high of 3,393.52 on February 19, 2020 to an intraday low of 2,191.86 on March 23, 2020 – a wrenching drop of the S&P 500 of 35.4% brought on by the nationwide lockdown due to Covid-19. Then, as investors began to see a light at the end of the tunnel as the predictions of the fatality level of the virus proved exaggerated, the stock market rebounded with great rapidity. The S&P 500 advanced 38.9% from the bottom on March 23 to the end of May 2020. During this period, the Fund’s underweighting in the technology and communications sectors hurt performance, as Covid-19 did little to negatively impact these sectors, and its positions in the financial, industrial and energy holdings weighed on the performance of the Fund. The Fund also maintained a healthy cash position, and this cautious stance during the market rebound also negatively affected performance.
For the three calendar years ending 2019, the Fund’s total cumulative return of 56.10% compared favorably with the S&P 500’s total return of 53.14% - an outperformance of 2.96%. It will be the goal of the Fund’s portfolio managers to overcome this recent performance setback and once again outperform the S&P 500 in coming years.
3
STOCK MARKET COMMENTARY
During the first seven weeks of 2020, the market was hitting one new high after another. The U.S. economy was hitting on all cylinders. U.S. GDP grew at a pace of 2.4% in 2019, Phase I of the trade deal with China had been signed in mid-January. Inflation was under control, and interest rates were low and forecast to move even lower in 2020. Unemployment was 3.5% ‒ the lowest level in 50 years ‒ and 275,000 new jobs had been created in February. The S&P 500 hit its all-time intraday high of 3394 on February 19. Then investors started to pay close attention to the havoc that the coronavirus would likely wreak on the global economy. Thirty-three days later, on March 23rd, the S&P 500 traded at an intraday low of 2192 - a plunge of 35.4%. Never had U.S. investors seen a bear market develop so rapidly.
Investors in the bond market panicked in similar fashion to those in the stock market. Fortunately, the Federal Reserve provided massive liquidity to the credit markets and to money market funds in a series of steps in March and early April. As investors sought safety and liquidity in U.S. government obligations, short-term U.S. Treasury Bills traded for several days at negative yields. With the major actions taken by the Federal Reserve Bank over the past month, interest rates on creditworthy fixed income instruments have dropped to rock bottom levels.
There were three key reasons why the market bottomed and then began its remarkable comeback. The first is that the Federal Reserve Bank did its job well, stepping up to provide liquidity through a huge bond-buying program. In carrying out this desperately needed provision of liquidity, the Federal Reserve Bank’s balance sheet has increased significantly from roughly $4 trillion to $7.2 trillion. Secondly the Trump Administration and Congress enacted the CARES Act in late March, which injected $2.2 trillion into the economy. Investors realized these funds would largely fill the gaping hole in the second and third quarter GDP the lockdown would occasion. And it looks like there is more government spending to come. Finally, the initial fatality rate projections of Covid-19 proved to be greatly exaggerated and hope for a vaccine within a year lifted investors’ hopes.
INVESTMENT COMMENTARY
The primary reason for the Fund’s outperformance, in total cumulative return, of the S&P 500 during the three calendar years ending 2019 was the Fund’s investment strategy of not overweighting the FAANG stocks (Facebook, Apple, Amazon, Netflix and Google) but
4
maintaining a well-diversified portfolio including suitable representation in the financial, industrial and energy sectors. This approach stood us in good stead until the economic expansion ended abruptly in March with the arrival of Covid-19 and the government-mandated lockdown. Investors then favored FAANG type stocks, which were less affected by the lockdown and slammed the other sectors, causing the Fund to underperform the S&P 500 during this period. Moreover, the stock market’s sickening plunge during the first quarter caused us to raise cash to protect capital, and then in the dramatic rebound that took place following the March 23 bottom, we were too cautious in re-committing capital to the market. This was the other main reason for the Fund’s underperformance against its main benchmark for the period.
INVESTMENT STRATEGY
These are challenging times. Covid-19 has caused great pain and suffering in human terms throughout the country. Moreover, the nationwide lockdown mandated to deal with the virus brought with it a huge spike in unemployment – worse than anything we have seen since the Great Depression. It also caused a dramatic drop in economic activity in the U.S. which may result in a GDP of negative 5% or worse in 2020. It is not clear if the recent protests, riots and looting caused by the death of George Floyd will cause the economy to perform even worse. Furthermore, we are facing Presidential and Congressional elections in less than 6 months, and with the polarization so apparent in the country, it is not at all clear how the elections will affect the economy and the stock market.
In the face of these uncertainties and challenges, the stock market has nevertheless come roaring back with the S&P 500 advancing over 45% since the March 23rd bottom, and the NASDAQ recently hitting an all-time high above 10,000. How is this possible? First, investors look to the future, and in this case, they have all but forgotten 2020 corporate earnings and are focused on 2021, when things will have presumably returned to normal. Secondly, they are adhering to the mantra: don’t fight the Fed. The Federal Reserve Bank has made it clear that it will do whatever is necessary to provide adequate liquidity so that the markets can function properly. This means rock bottom interest rates as far as the eye can see, which is causing investors and speculators to come back to the stock market in force. When interest rates are near zero, perhaps a market P/E ratio of 20-25 is not inappropriate. Thirdly, there are many companies which have not only been unaffected by the lockdown but have prospered by it. Examples are Amazon and Microsoft which benefit from working remotely and the closure of retail outlets. There are many others.
5
Finally, there is the excitement the economy will be re-opening step by step in the coming months, and with it, the unemployment rate will presumably drop and economic activity will resume.
With this as a backdrop, we intend to continue investing in best-in-class companies. We plan to maintain strong positions in three of the FAANG companies – Amazon, Apple and Google (Alphabet) – for the time being, as we believe they are positioned to prosper in the current circumstances, and we believe their valuations are still reasonable. We also judge the health care sector to be an attractive and fertile ground for the growth in the years to come, as is the consumer discretionary sector. The financial sector was hit very hard by the lockdown but has rebounded somewhat in the last weeks. The very low interest rates and large potential credit losses in the coming months present, however, real challenges for the banks, but these factors have led to attractive valuations for some of the banks. In general, our investment strategy is to keep on keeping on – not chasing the fast-moving momentum stocks with rapid sales growth but negative earnings nor looking for deep value stocks, but continue to seek out and invest in world class companies with strong brands and franchise, solid balance sheets, strong cash flow, and excellent management teams. While the market may give back some of its recent gains in the face of poor earnings, which many companies will report in the second and third quarters, and from election anxiety, we believe the earnings picture for 2021 looks promising, and plan to invest for the long haul.
CONCLUSION
We, the portfolio managers at Bradley, Foster & Sargent, Inc., are also shareholders of the BFS Equity Fund. We look forward to serving you through our management of the Fund. Thank you for placing your capital under our care.
Robert Bradley
Lead Portfolio Manager | Keith LaRose
Co-Portfolio Manager | Thomas Sargent
Co-Portfolio Manager |
6
BFS Equity Fund
ANNUAL PERFORMANCE REVIEW
(UNAUDITED)
The Fund returned +6.32% for the twelve-month period commencing June 1, 2019 and ending May 31, 2020, underperforming the S&P 500, which returned +12.84%, and outperforming the Dow Jones, which gained 4.83% over the same period.
Key Detractors from Relative Results
| | ● | The Information Technology sector in the Fund, which was up 22.5% for the year, was the worst performing sector relatively, as this sector in the S&P 500, with its large concentration of FAANG stocks, advanced 38.4%. The Fund was underweight this sector, which includes Microsoft, Apple and Alphabet, for most of the year. |
| | ● | The Fund was overweight the Industrials sector as of December 31, 2019, with a 14.5% weighting compared to 9.1% for the S&P 500. The Fund’s performance in this sector lagged the S&P 500 with the Fund’s return -17.2% versus -3.84% for the S&P 500. The Fund’s positions in Boeing and Raytheon Technologies detracted significantly. |
| | ● | The Fund’s performance in the Financials sector was -15.4% versus -7.9% in the S&P 500. The Fund’s holdings of Citicorp and Chubb were the biggest detractors. |
Key Contributors to Relative Results
| | ● | The Consumer Discretionary sector of the Fund was the best performing sector during the period under review, returning +27.8%, relative to the S&P 500 return of +15.6%. Amazon is the largest position in the Fund and the stock was up 37.6% for the period under review. |
| | ● | The single best performing sector for the Fund relative to the S&P 500 benchmark was the Materials sector. The Fund’s return was +25.1% versus +8.1% for the S&P 500. |
| | ● | Weyerhaeuser was the Fund’s single holding in the Real Estate sector during the year. It returned 18.2% vs -1.7% for the S&P 500 sector. |
FUND INFORMATION
May 31, 2020 (Unaudited)
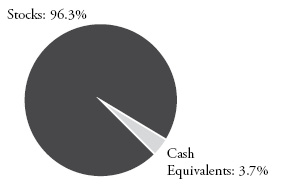
ASSET ALLOCATION
(as a percentage of net assets)
TEN LARGEST HOLDINGS (%) | FUND |
Amazon.com | 5.0 |
Microsoft | 5.0 |
Apple | 4.5 |
Agnico Eagle Mines | 4.1 |
Alphabet, Class A | 3.7 |
Adobe | 3.5 |
SS&C Technologies | 3.4 |
Ecolab | 3.3 |
Zoetis | 3.2 |
Thermo Fisher Scientific | 3.1 |
SECTOR
DIVERSIFICATION (%) | FUND | S&P 500 |
Information Technology | 31.6 | 26.2 |
Healthcare | 14.6 | 15.2 |
Consumer Discretionary | 12.7 | 10.5 |
Materials | 8.9 | 2.5 |
Communication Services | 8.6 | 11.0 |
Financials | 5.5 | 10.5 |
Industrials | 4.9 | 8.0 |
Consumer Staples | 4.8 | 7.1 |
Energy | 4.0 | 2.9 |
Cash Equivalents | 3.7 | 0.0 |
Utilities | 0.7 | 3.2 |
Real Estate | 0.0 | 2.9 |
Availability of Portfolio Schedule (Unaudited)
The Fund files its complete schedule of portfolio holdings with the Securities and Exchange Commission (“SEC”) for the first and third quarters of each fiscal year as an exhibit to its reports on Form N-PORT. The Fund’s Form N-PORT reports. The Fund’s portfolio holdings are available on the SEC’s website at http://www.sec.gov.
7
BFS Equity Fund
Investment Results (Unaudited)
Average Annual Total Returns(a) (For the periods ended May 31, 2020)
| | One
Year | Three
Year | Five
Year | Since Inception
(November 8, 2013) |
BFS Equity Fund | 6.32% | 9.43% | 8.00% | 8.66% |
S&P 500® Index (b) | 12.84% | 10.23% | 9.86% | 10.87% |
Dow Jones Industrial Average® (c) | 4.83% | 9.05% | 9.76% | 10.19% |
Total annual fund operating expenses, as disclosed in the BFS Equity Fund’s (the “Fund”) prospectus dated September 28, 2019, were 1.57% of average daily net assets (1.25% after fee waivers/expense reimbursements by Bradley, Foster & Sargent, Inc. (the “Adviser”)). The Adviser has contractually agreed to waive or limit its fees and to assume other expenses of the Fund until September 30, 2020, so that Total Annual Fund Operating Expenses does not exceed 1.00%. This contractual arrangement may only be terminated by mutual consent of the Adviser and the Board of Trustees of the Valued Advisers Trust (the “Trust”), and it will automatically terminate upon the termination of the investment advisory agreement between the Trust and the Adviser. This operating expense limitation does not apply to: (i) interest, (ii) taxes, (iii) brokerage commissions, (iv) other expenditures which are capitalized in accordance with generally accepted accounting principles, (v) other extraordinary expenses not incurred in the ordinary course of the Fund’s business, (vi) dividend expense on short sales, (vii) expenses incurred under a plan of distribution under Rule 12b-1, and (viii) expenses that the Fund has incurred but did not actually pay because of an expense offset arrangement, if applicable, in any fiscal year. The operating expense limitation also excludes any “Acquired Fund Fees and Expenses,” which are the expenses indirectly incurred by the Fund as a result of investing in money market funds or other investment companies, including exchange-traded funds, that have their own expenses. Each waiver or reimbursement of an expense by the Adviser is subject to repayment by the Fund within the three years following such waiver or reimbursement, provided that the Fund is able to make the repayment without exceeding the expense limitation in place at the time of the waiver or reimbursement and the expense limitation in place at the time of the repayment.
The performance quoted represents past performance, which does not guarantee future results. The investment return and principal value of an investment will fluctuate so that an investor’s shares, when redeemed, may be worth more or less than their original cost. The returns shown do not reflect deduction of taxes that a shareholder would pay on Fund distributions or the redemption of Fund shares. The Fund’s investment objectives, risks, charges and expenses must be considered carefully before investing. Current performance of the Fund may be lower or higher than the performance quoted. Performance data current to the most recent month end may be obtained by calling (855) 575-2430.
(a) | Average annual total returns reflect any change in price per share and assume the reinvestment of all distributions. The Fund’s returns reflect any fee reductions during the applicable periods. If such fee reductions had not occurred, the quoted performance would have been lower. |
(b) | The S&P 500® Index is a widely recognized unmanaged index of equity prices and is representative of a broader market and range of securities than is found in the Fund’s portfolio. The index is an unmanaged benchmark that assumes reinvestment of all distributions and excludes the effect of taxes and fees. Individuals cannot invest directly in this index; however, an individual can invest in exchange-traded funds or other investment vehicles that attempt to track the performance of a benchmark index. |
(c) | The Dow Jones Industrial Average® is a widely recognized unmanaged index of equity prices and is representative of a narrower market and range of securities than is found in the Fund’s portfolio. The index is an unmanaged benchmark that assumes reinvestment of all distributions and excludes the effect of taxes and fees. Individuals cannot invest directly in this index; however, an individual can invest in exchange-traded funds or other investment vehicles that attempt to track the performance of a benchmark index. |
The Fund’s investment objectives, strategies, risks, charges and expenses must be considered carefully before investing. The prospectus contains this and other important information about the Fund and may be obtained by calling the same number as above. Please read it carefully before investing.
The Fund is distributed by Ultimus Fund Distributors, LLC, member FINRA/SIPC.
8
BFS Equity Fund
Investment Results (Unaudited) (continued)
Let’s say hypothetically that $10,000 was invested in the Fund, on November 8, 2013. The following chart shows how the value of your investment would have changed, and also shows how the S&P 500® Index and Dow Jones Industrial Average performed over the same period.
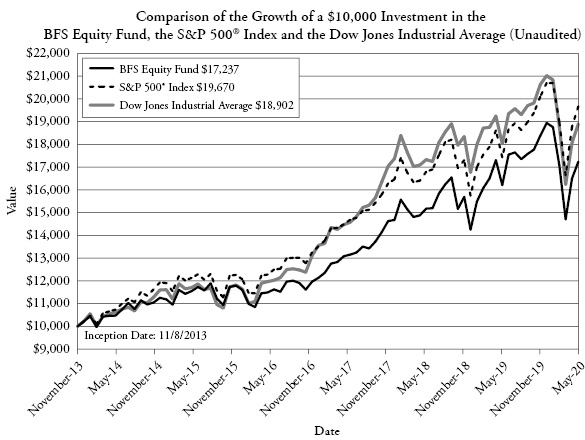
The chart above assumes an initial investment of $10,000 made on November 8, 2013 (commencement of operations) held through May 31, 2020. THE FUND’S RETURN REPRESENTS PAST PERFORMANCE AND DOES NOT GUARANTEE FUTURE RESULTS. The returns shown do not reflect deduction of taxes that a shareholder would pay on Fund distributions or the redemption of Fund shares. Investment returns and principal values will fluctuate so that your shares, when redeemed, may be worth more or less than their original purchase price.
Current performance may be lower or higher than the performance data quoted. For more information on the Fund, and to obtain performance data current to the most recent month-end, or to request a prospectus, please call (855) 575-2430. You should carefully consider the investment objectives, potential risks, management fees, and charges and expenses of the Fund before investing. The Fund’s prospectus contains this and other information about the Fund, and should be read carefully before investing.
The Fund is distributed by Ultimus Fund Distributors, LLC, member FINRA/SIPC.
9
BFS Equity Fund
Schedule of Investments
May 31, 2020
| | Shares | | | Fair Value | |
COMMON STOCKS — 96.35% | | | | | | | | |
| | | | | | | | | |
Aerospace & Defense — 4.24% | | | | | | | | |
Boeing Company (The) | | | 1,000 | | | $ | 145,850 | |
Northrop Grumman Corporation | | | 3,000 | | | | 1,005,600 | |
Raytheon Technologies Corporation | | | 7,669 | | | | 494,804 | |
| | | | | | | | 1,646,254 | |
Banks — 2.50% | | | | | | | | |
JPMorgan Chase & Company | | | 10,000 | | | | 973,100 | |
| | | | | | | | | |
Beverages — 0.68% | | | | | | | | |
PepsiCo, Inc. | | | 2,000 | | | | 263,100 | |
| | | | | | | | | |
Chemicals — 4.81% | | | | | | | | |
Ecolab, Inc. | | | 6,000 | | | | 1,275,480 | |
Sherwin-Williams Company (The) | | | 1,000 | | | | 593,850 | |
| | | | | | | | 1,869,330 | |
Communications Equipment — 2.95% | | | | | | | | |
Cisco Systems, Inc. | | | 24,000 | | | | 1,147,680 | |
| | | | | | | | | |
Consumer Finance — 0.61% | | | | | | | | |
American Express Company | | | 2,500 | | | | 237,675 | |
| | | | | | | | | |
Diversified Financial Services — 2.39% | | | | | | | | |
Berkshire Hathaway, Inc., Class B(a) | | | 5,000 | | | | 927,900 | |
| | | | | | | | | |
Electric Utilities — 0.66% | | | | | | | | |
NextEra Energy, Inc. | | | 1,000 | | | | 255,560 | |
| | | | | | | | | |
Electronic Equipment, Instruments & Components — 1.24% | | | | | | | | |
Amphenol Corporation, Class A | | | 5,000 | | | | 482,800 | |
| | | | | | | | | |
Entertainment — 2.41% | | | | | | | | |
Walt Disney Company (The) | | | 8,000 | | | | 938,400 | |
| | | | | | | | | |
Food & Staples Retailing — 2.78% | | | | | | | | |
Costco Wholesale Corporation | | | 3,500 | | | | 1,079,645 | |
| | | | | | | | | |
Food Products — 1.34% | | | | | | | | |
Mondelez International, Inc., Class A | | | 10,000 | | | | 521,200 | |
10 | See accompanying notes which are an integral part of these financial statements. | |
BFS Equity Fund
Schedule of Investments (continued)
May 31, 2020
| | Shares | | | Fair Value | |
COMMON STOCKS — 96.35% - continued | | | | | | | | |
| | | | | | | | | |
Health Care Equipment & Supplies — 7.47% | | | | | | | | |
Abbott Laboratories | | | 10,000 | | | $ | 949,200 | |
Danaher Corporation | | | 7,000 | | | | 1,166,270 | |
Stryker Corporation | | | 4,000 | | | | 782,920 | |
| | | | | | | | 2,898,390 | |
Hotels, Restaurants & Leisure — 1.00% | | | | | | | | |
Starbucks Corporation | | | 5,000 | | | | 389,950 | |
| | | | | | | | | |
Household Durables — 2.13% | | | | | | | | |
D.R. Horton, Inc. | | | 15,000 | | | | 829,500 | |
| | | | | | | | | |
Interactive Media & Services — 3.69% | | | | | | | | |
Alphabet, Inc., Class A(a) | | | 1,000 | | | | 1,433,520 | |
| | | | | | | | | |
Internet & Direct Marketing Retail — 5.03% | | | | | | | | |
Amazon.com, Inc.(a) | | | 800 | | | | 1,953,896 | |
| | | | | | | | | |
IT Services — 7.88% | | | | | | | | |
Automatic Data Processing, Inc. | | | 5,000 | | | | 732,450 | |
Fiserv, Inc.(a) | | | 9,000 | | | | 960,930 | |
Leidos Holdings, Inc. | | | 5,000 | | | | 526,450 | |
Mastercard, Inc., Class A | | | 1,500 | | | | 451,335 | |
Visa, Inc., Class A | | | 2,000 | | | | 390,480 | |
| | | | | | | | 3,061,645 | |
Life Sciences Tools & Services — 3.14% | | | | | | | | |
Thermo Fisher Scientific, Inc. | | | 3,500 | | | | 1,222,165 | |
| | | | | | | | | |
Machinery — 0.70% | | | | | | | | |
Caterpillar, Inc. | | | 1,000 | | | | 120,130 | |
Deere & Company | | | 1,000 | | | | 152,120 | |
| | | | | | | | 272,250 | |
Media — 2.55% | | | | | | | | |
Comcast Corporation, Class A | | | 25,000 | | | | 990,000 | |
| | | | | | | | | |
Metals & Mining — 4.12% | | | | | | | | |
Agnico Eagle Mines Ltd. | | | 25,000 | | | | 1,600,000 | |
| | See accompanying notes which are an integral part of these financial statements. | 11 |
BFS Equity Fund
Schedule of Investments (continued)
May 31, 2020
| | Shares | | | Fair Value | |
COMMON STOCKS — 96.35% - continued | | | | | | | | |
| | | | | | | | | |
Oil, Gas & Consumable Fuels — 3.99% | | | | | | | | |
Chevron Corporation | | | 4,000 | | | $ | 366,800 | |
Kinder Morgan, Inc. | | | 75,000 | | | | 1,185,000 | |
| | | | | | | | 1,551,800 | |
Pharmaceuticals — 3.95% | | | | | | | | |
Merck & Company, Inc. | | | 3,500 | | | | 282,520 | |
Zoetis, Inc. | | | 9,000 | | | | 1,254,510 | |
| | | | | | | | 1,537,030 | |
Semiconductors & Semiconductor Equipment — 1.06% | | | | | | | | |
Xilinx, Inc. | | | 4,500 | | | | 413,775 | |
| | | | | | | | | |
Software — 13.94% | | | | | | | | |
Adobe, Inc.(a) | | | 3,500 | | | | 1,353,100 | |
Microsoft Corporation | | | 10,500 | | | | 1,924,125 | |
Oracle Corporation | | | 15,000 | | | | 806,550 | |
SS&C Technologies Holdings, Inc. | | | 23,000 | | | | 1,331,585 | |
| | | | | | | | 5,415,360 | |
Specialty Retail — 2.56% | | | | | | | | |
Home Depot, Inc. (The) | | | 4,000 | | | | 993,920 | |
| | | | | | | | | |
Technology Hardware, Storage & Peripherals — 4.50% | | | | | | | | |
Apple, Inc. | | | 5,500 | | | | 1,748,670 | |
| | | | | | | | | |
Textiles, Apparel & Luxury Goods — 2.03% | | | | | | | | |
NIKE, Inc., Class B | | | 8,000 | | | | 788,640 | |
| | | | | | | | | |
Total Common Stocks (Cost $24,841,802) | | | | | | | 37,443,155 | |
| | | | | | | | | |
12 | See accompanying notes which are an integral part of these financial statements. | |
BFS Equity Fund
Schedule of Investments (continued)
May 31, 2020
| | Shares | | | Fair Value | |
MONEY MARKET FUNDS — 4.60% | | | | | | | | |
| | | | | | | | | |
Fidelity Investments Money Market Government Portfolio, Institutional Class, 0.12%(b) | | | 1,789,593 | | | $ | 1,789,593 | |
Total Money Market Funds (Cost $1,789,593) | | | | | | | 1,789,593 | |
| | | | | | | | | |
Total Investments — 100.95% (Cost $26,631,395) | | | | | | | 39,232,748 | |
| | | | | | | | | |
Liabilities in Excess of Other Assets — (0.95)% | | | | | | | (369,048 | ) |
| | | | | | | | | |
NET ASSETS — 100.00% | | | | | | $ | 38,863,700 | |
(a) | Non-income producing security. |
(b) | Rate disclosed is the seven day effective yield as of May 31, 2020. |
The industries shown on the schedule of investments are based on the Global Industry Classification Standard, or GICS® (“GICS”). The GICS was developed by and/or is the exclusive property of MSCI, Inc. and Standard & Poor’s Financial Services LLC (“S&P”). GICS is a service mark of MSCI, Inc. and S&P and has been licensed for use by Ultimus Fund Solutions, LLC.
| | See accompanying notes which are an integral part of these financial statements. | 13 |
BFS Equity Fund
Statement of Assets and Liabilities
May 31, 2020
Assets |
Investments in securities at fair value (cost $26,631,395) (Note 3) | | $ | 39,232,748 | |
Receivable for fund shares sold | | | 60,148 | |
Dividends receivable | | | 31,600 | |
Tax reclaims receivable | | | 6,531 | |
Prepaid expenses | | | 10,770 | |
Total Assets | | | 39,341,797 | |
Liabilities |
Payable for fund shares redeemed | | | 13,166 | |
Payable for investments purchased | | | 402,493 | |
Payable to Adviser (Note 4) | | | 14,345 | |
Payable to Administrator (Note 4) | | | 6,750 | |
Distribution (12b-1) fees accrued (Note 4) | | | 15,141 | |
Payable to trustees | | | 651 | |
Other accrued expenses | | | 25,551 | |
Total Liabilities | | | 478,097 | |
Net Assets | | $ | 38,863,700 | |
Net Assets consist of: | | | | |
Paid-in capital | | $ | 27,410,643 | |
Accumulated earnings | | | 11,453,057 | |
Net Assets | | $ | 38,863,700 | |
Shares outstanding (unlimited number of shares authorized, no par value) | | | 2,413,507 | |
Net asset value, offering and redemption price per share (Note 2) | | $ | 16.10 | |
14 | See accompanying notes which are an integral part of these financial statements. | |
BFS Equity Fund
Statement of Operations
For the year ended May 31, 2020
Investment Income | | | | |
Dividend income (net of foreign taxes withheld of $5,558) | | $ | 581,012 | |
Total investment income | | | 581,012 | |
Expenses | | | | |
Investment Adviser fees (Note 4) | | | 298,463 | |
Distribution (12b-1) fees (Note 4) | | | 99,488 | |
Administration and compliance services fees (Note 4) | | | 38,077 | |
Registration expenses | | | 28,371 | |
Fund accounting fees (Note 4) | | | 25,000 | |
Legal fees | | | 22,302 | |
Transfer agent fees (Note 4) | | | 18,000 | |
Audit and tax preparation fees | | | 17,500 | |
Printing and postage expenses | | | 9,372 | |
Trustee fees | | | 6,395 | |
Insurance expenses | | | 4,518 | |
Custodian fees | | | 4,384 | |
Miscellaneous | | | 32,913 | |
Total expenses | | | 604,783 | |
Fees contractually waived by Adviser (Note 4) | | | (108,051 | ) |
Net operating expenses | | | 496,732 | |
Net investment income | | | 84,280 | |
Net Realized and Change in Unrealized Gain (Loss) on Investments |
Net realized loss on investment securities transactions | | | (910,939 | ) |
Net change in unrealized appreciation on investments | | | 2,979,164 | |
Net realized and change in unrealized gain on investments | | | 2,068,225 | |
Net increase in net assets resulting from operations | | $ | 2,152,505 | |
| | See accompanying notes which are an integral part of these financial statements. | 15 |
BFS Equity Fund
Statements of Changes in Net Assets
Increase (Decrease) in Net Assets due to: | | For the
Year Ended
May 31, 2020 | | | For the
Year Ended
May 31, 2019 | |
Operations | | | | | | | | |
Net investment income | | $ | 84,280 | | | $ | 97,347 | |
Net realized gain (loss) on investment securities transactions | | | (910,939 | ) | | | 715,995 | |
Net change in unrealized appreciation on investments | | | 2,979,164 | | | | 1,346,387 | |
Net increase in net assets resulting from operations | | | 2,152,505 | | | | 2,159,729 | |
Distributions to Shareholders from Earnings (Note 2) | | | (729,409 | ) | | | (1,113,363 | ) |
Capital Transactions | | | | | | | | |
Proceeds from shares sold | | | 4,251,409 | | | | 5,524,451 | |
Reinvestment of distributions | | | 608,093 | | | | 950,796 | |
Amount paid for shares redeemed | | | (3,379,179 | ) | | | (3,311,176 | ) |
Net increase in net assets resulting from capital transactions | | | 1,480,323 | | | | 3,164,071 | |
Total Increase in Net Assets | | | 2,903,419 | | | | 4,210,437 | |
Net Assets | | | | | | | | |
Beginning of year | | | 35,960,281 | | | | 31,749,844 | |
End of year | | $ | 38,863,700 | | | $ | 35,960,281 | |
Share Transactions | | | | | | | | |
Shares sold | | | 255,499 | | | | 360,348 | |
Shares issued in reinvestment of distributions | | | 34,570 | | | | 73,138 | |
Shares redeemed | | | (211,771 | ) | | | (220,822 | ) |
Net increase in shares outstanding | | | 78,298 | | | | 212,664 | |
16 | See accompanying notes which are an integral part of these financial statements. | |
BFS Equity Fund
Financial Highlights
(For a share outstanding during each year)
| | | For the
Year
Ended
May 31,
2020 | | | For the
Year
Ended
May 31,
2019 | | | For the
Year
Ended
May 31,
2018 | | | For the
Year
Ended
May 31,
2017 | | | For the
Year
Ended
May 31,
2016 | |
Selected Per Share Data: | | | | | | | | | | | | | | | | | | | | |
Net asset value, beginning of year | | $ | 15.40 | | | $ | 14.96 | | | $ | 13.01 | | | $ | 11.55 | | | $ | 11.69 | |
Income from investment operations: | | | | | | | | | | | | | | | | | | | | |
Net investment income | | | 0.03 | | | | 0.04 | | | | 0.04 | | | | 0.04 | | | | 0.04 | |
Net realized and unrealized gain/(loss) on investments | | | 0.97 | | | | 0.90 | | | | 1.96 | | | | 1.47 | | | | (0.15 | ) |
Total from investment operations | | | 1.00 | | | | 0.94 | | | | 2.00 | | | | 1.51 | | | | (0.11 | ) |
Less distributions to shareholders from: | | | | | | | | | | | | | | | | | | | | |
Net investment income | | | (0.03 | ) | | | (0.04 | ) | | | (0.04 | ) | | | (0.05 | ) | | | (0.03 | ) |
Net realized gains | | | (0.27 | ) | | | (0.46 | ) | | | (0.01 | ) | | | — | | | | — | |
Total distributions | | | (0.30 | ) | | | (0.50 | ) | | | (0.05 | ) | | | (0.05 | ) | | | (0.03 | ) |
Net asset value, end of year | | $ | 16.10 | | | $ | 15.40 | | | $ | 14.96 | | | $ | 13.01 | | | $ | 11.55 | |
Total Return(a) | | | 6.32 | % | | | 6.84 | % | | | 15.36 | % | | | 13.15 | % | | | (0.91 | )% |
| | | | | | | | | | | | | | | | | | | | | |
Ratios and Supplemental Data: | | | | | | | | | | | | | | | | | | | | |
Net assets, end of year (000 omitted) | | $ | 38,864 | | | $ | 35,960 | | | $ | 31,750 | | | $ | 27,185 | | | $ | 23,884 | |
Ratio of net expenses to average net assets | | | 1.25 | % | | | 1.25 | % | | | 1.25 | % | | | 1.25 | % | | | 1.25 | % |
Ratio of expenses to average net assets before waiver and reimbursement | | | 1.52 | % | | | 1.57 | % | | | 1.65 | % | | | 1.75 | % | | | 1.86 | % |
Ratio of net investment income to average net assets | | | 0.21 | % | | | 0.28 | % | | | 0.26 | % | | | 0.35 | % | | | 0.43 | % |
Portfolio turnover rate | | | 49.27 | % | | | 38.71 | % | | | 38.17 | % | | | 47.82 | % | | | 49.38 | % |
| | | | | | | | | | | | | | | | | | | | | |
(a) | Total return represents the rate that the investor would have earned or lost on an investment in the Fund, assuming reinvestment of distributions. |
| | See accompanying notes which are an integral part of these financial statements. | 17 |
BFS Equity Fund
Notes to the Financial Statements
May 31, 2020
NOTE 1. ORGANIZATION
The BFS Equity Fund (the “Fund”) was organized as an open-end diversified series of Valued Advisers Trust (the “Trust”) on July 23, 2013 and commenced operations on November 8, 2013. The Trust is a management investment company established under the laws of Delaware by an Agreement and Declaration of Trust dated June 13, 2008 (the “Trust Agreement”). The Trust Agreement permits the Board of Trustees (the “Board” or the “Trustees”) to issue an unlimited number of shares of beneficial interest of separate series without par value. The Fund is one of a series of funds authorized by the Board. The Fund’s investment adviser is Bradley, Foster & Sargent, Inc. (the “Adviser”). The investment objective of the Fund is long-term appreciation through growth of principal and income.
NOTE 2. SIGNIFICANT ACCOUNTING POLICIES
The Fund is an investment company and follows accounting and reporting guidance under Financial Accounting Standards Board Accounting Standards Codification (“ASC”) Topic 946, “Financial Services-Investment Companies.” The following is a summary of significant accounting policies followed by the Fund in the preparation of its financial statements. These policies are in conformity with generally accepted accounting principles in the United States of America (“GAAP”).
Estimates – The preparation of financial statements in conformity with GAAP requires management to make estimates and assumptions that affect the reported amounts of assets and liabilities and disclosure of contingent assets and liabilities at the date of the financial statements and the reported amounts of increases and decreases in net assets from operations during the reporting period. Actual results could differ from those estimates.
Federal Income Taxes – The Fund makes no provision for federal income or excise tax. The Fund has qualified and intends to qualify each year as a regulated investment company (“RIC”) under subchapter M of the Internal Revenue Code of 1986, as amended, by complying with the requirements applicable to RICs and by distributing substantially all of its taxable income. The Fund also intends to distribute sufficient net investment income and net realized capital gains, if any, so that it will not be subject to excise tax on undistributed income and gains. If the required amount of net investment income or gains is not distributed, the Fund could incur a tax expense.
As of and during the fiscal year ended May 31, 2020, the Fund did not have any liabilities for any unrecognized tax benefits. The Fund recognizes interest and penalties, if any, related to unrecognized tax benefits as income tax expense on the statement of operations when incurred. During the fiscal year ended May 31, 2020, the Fund did not incur any interest or penalties. Management of the Fund has reviewed tax positions taken in tax years that remain subject to examination by all major tax jurisdictions, including federal (i.e., the last three tax year ends and the interim tax period since then, as applicable). Management believes that there is no tax liability resulting from unrecognized tax benefits related to uncertain tax positions taken.
18
BFS Equity Fund
Notes to the Financial Statements (continued)
May 31, 2020
Expenses – Expenses incurred by the Trust that do not relate to a specific fund of the Trust are allocated to the individual funds based on each fund’s relative net assets or another appropriate basis (as determined by the Board).
Security Transactions and Related Income – The Fund follows industry practice and records security transactions on the trade date for financial reporting purposes. The specific identification method is used for determining gains or losses for financial statement and income tax purposes. Dividend income is recorded on the ex-dividend date and interest income is recorded on an accrual basis. Discounts and premiums on securities purchased are accreted or amortized using the effective interest method, if applicable. Withholding taxes on foreign dividends have been provided for in accordance with the Fund’s understanding of the applicable country’s tax rules and rates.
Dividends and Distributions – The Fund intends to distribute its net investment income and net realized long-term and short-term capital gains, if any, at least annually. Dividends and distributions to shareholders, which are determined in accordance with income tax regulations, are recorded on the ex-dividend date. The treatment for financial reporting purposes of distributions made to shareholders during the period from net investment income or net realized capital gains may differ from their ultimate treatment for federal income tax purposes. These differences are caused primarily by differences in the timing of the recognition of certain components of income, expense or realized capital gain for federal income tax purposes. Where such differences are permanent in nature, they are reclassified among the components of net assets based on their ultimate characterization for federal income tax purposes. Any such reclassifications will have no effect on net assets, results of operations or net asset value (“NAV”) per share of the Fund. For the fiscal year ended May 31, 2020, the Fund did not make any reclassifications.
Share Valuation – The NAV is calculated each day the New York Stock Exchange is open by dividing the total value of the Fund’s assets, less liabilities, by the number of shares outstanding for the Fund.
NOTE 3. SECURITIES VALUATION AND FAIR VALUE MEASUREMENTS
Fair value is defined as the price that the Fund would receive upon selling an investment in a timely transaction to an independent buyer in the principal or most advantageous market of the investment. GAAP establishes a three-tier hierarchy to maximize the use of observable market data and minimize the use of unobservable inputs and to establish classification of fair value measurements for disclosure purposes.
Inputs refer broadly to the assumptions that market participants would use in pricing the asset or liability, including assumptions about risk (the risk inherent in a particular valuation technique used to measure fair value including a pricing model and/or the risk inherent in the inputs to the valuation technique). Inputs may be observable or unobservable. Observable inputs are inputs that reflect the assumptions market participants would use in pricing the asset or liability developed based on market data obtained and available from sources independent of the reporting entity. Unobservable inputs are inputs that reflect
19
BFS Equity Fund
Notes to the Financial Statements (continued)
May 31, 2020
the reporting entity’s own assumptions about the assumptions market participants would use in pricing the asset or liability developed based on the best information available in the circumstances.
Various inputs are used in determining the value of the Fund’s investments. These inputs are summarized in the three broad levels listed below.
| | ● | Level 1 – unadjusted quoted prices in active markets for identical investments and/or registered investment companies where the value per share is determined and published and is the basis for current transactions for identical assets or liabilities at the valuation date |
| | ● | Level 2 – other significant observable inputs (including, but not limited to, quoted prices for an identical security in an inactive market, quoted prices for similar securities, interest rates, prepayment speeds, credit risk, etc.) |
| | ● | Level 3 – significant unobservable inputs (including the Fund’s own assumptions in determining fair value of investments based on the best information available) |
The inputs used to measure fair value may fall into different levels of the fair value hierarchy. In such cases, for disclosure purposes, the level in the fair value hierarchy which is reported, is determined based on the lowest level input that is significant to the fair value measurement in its entirety.
Equity securities that are traded on any stock exchange are generally valued at the last quoted sale price on the security’s primary exchange. Lacking a last sale price, an exchange-traded security is generally valued at its last bid price. Securities traded in the NASDAQ over-the-counter market are generally valued at the NASDAQ Official Closing Price. When using the market quotations and when the market is considered active, the security is classified as a Level 1 security. In the event that market quotations are not readily available or are considered unreliable due to market or other events, the Fund values its securities and other assets at fair value in accordance with policies established by and under the general supervision of the Board. Under these policies, the securities will be classified as Level 2 or 3 within the fair value hierarchy, depending on the inputs used.
Investments in mutual funds, including money market mutual funds, are generally priced at the ending NAV. These securities are categorized as Level 1 securities.
In accordance with the Trust’s valuation policies, the Adviser is required to consider all appropriate factors relevant to the value of securities for which it has determined other pricing sources are not available or reliable as described above. No single method exists for determining fair value, because fair value depends upon the circumstances of each individual case. As a general principle, the current fair value of a security being valued by the Adviser would be the amount that the Fund might reasonably expect to receive upon the current sale. Methods that are in accordance with this principle may, for example, be based on (i) a multiple of earnings; (ii) a discount from market prices of a similar freely traded security (including a derivative security or a basket of securities traded on other markets, exchanges or among dealers); or (iii) yield to maturity with respect to debt
20
BFS Equity Fund
Notes to the Financial Statements (continued)
May 31, 2020
issues, or a combination of these and other methods. Fair-value pricing is permitted if, in the Adviser’s opinion, the validity of market quotations appears to be questionable based on factors such as evidence of a thin market in the security based on a small number of quotations, a significant event occurs after the close of a market but before the Fund’s NAV calculation that may affect a security’s value, or the Adviser is aware of any other data that calls into question the reliability of market quotations.
The following is a summary of the inputs used to value the Fund’s investments as of May 31, 2020:
| | | Valuation Inputs | | | | | |
Assets | | Level 1 | | | Level 2 | | | Level 3 | | | Total | |
Common Stocks(a) | | $ | 37,443,155 | | | $ | — | | | $ | — | | | $ | 37,443,155 | |
Money Market Funds | | | 1,789,593 | | | | — | | | | — | | | | 1,789,593 | |
Total | | $ | 39,232,748 | | | $ | — | | | $ | — | | | $ | 39,232,748 | |
(a) | Refer to Schedule of Investments for industry classifications. |
The Fund did not hold any investments at the end of the reporting period for which significant unobservable inputs (Level 3) were used in determining fair value; therefore, no reconciliation of Level 3 securities is included for this reporting period.
NOTE 4. TRANSACTIONS WITH AFFILIATES AND OTHER SERVICE PROVIDERS
Under the terms of the investment advisory agreement on behalf of the Fund, the Adviser manages the Fund’s investments subject to oversight of the Board. As compensation for its services, the Fund pays the Adviser a fee, computed and accrued daily and paid monthly, at an annual rate of 0.75% of the average daily net assets of the Fund. For the fiscal year ended May 31, 2020, the Adviser earned a fee of $298,463 from the Fund before the waivers described below. At May 31, 2020, the Fund owed the Adviser $14,345.
The Adviser has contractually agreed to waive or limit its management fee and/or reimburse certain operating expenses until September 30, 2020, but only to the extent necessary so that the Fund’s net expenses, excluding brokerage fees and commissions, borrowing costs (such as interest and dividend expenses on securities sold short), taxes, extraordinary expenses, fees and expenses paid under a distribution plan adopted pursuant to Rule 12b-1 fees and indirect expenses (such as “acquired funds fees and expenses”) do not exceed 1.00%.
Each waiver or reimbursement of an expense by the Adviser is subject to repayment by the Fund within the three years following such waiver or reimbursement, provided that the Fund is able to make the repayment without exceeding the expense limitation in place at the time of the waiver or reimbursement and the expense limitation in place at the time of the repayment. The contractual agreement is in effect through September 30, 2020.
21
BFS Equity Fund
Notes to the Financial Statements (continued)
May 31, 2020
The expense cap may not be terminated prior to this date except by mutual consent of the Adviser and the Board. For the fiscal year ended May 31, 2020, the Adviser waived fees of $108,051.
The amounts subject to repayment by the Fund, pursuant to the aforementioned conditions, are as follows:
Recoverable through | | Amount | |
May 31, 2021 | | $ | 117,155 | |
May 31, 2022 | | | 110,755 | |
May 31, 2023 | | | 108,051 | |
The Trust retains Ultimus Fund Solutions, LLC (“Ultimus” or “Administrator”) to provide the Fund with administration and compliance (including a chief compliance officer), fund accounting, and transfer agent services, including all regulatory reporting. For the fiscal year ended May 31, 2020, the Administrator earned fees of $38,077 for administration and compliance services, $25,000 for fund accounting services and $18,000 for transfer agent services. At May 31, 2020, the Fund owed the Administrator $6,750 for such services.
The officers and one trustee of the Trust are members of management and/or employees of the Administrator. Ultimus Fund Distributors, LLC (the “Distributor”) acts as the distributor of the Fund’s shares. The Distributor is a wholly-owned subsidiary of Ultimus.
The Fund has adopted a Distribution Plan (the “Plan”) pursuant to Rule 12b-1 under the Investment Company Act of 1940 (the “1940 Act”). The Plan provides that the Fund will pay the Distributor and/or any registered securities dealer, financial institution or any other person (the “Recipient”) a shareholder servicing fee of 0.25% of the average daily net assets of the Fund in connection with the promotion and distribution of the Fund’s shares or the provision of shareholder support services to shareholders, including, but not necessarily limited to, advertising, compensation to underwriters, dealers and selling personnel, the printing and mailing of prospectuses to other than current Fund shareholders, the printing and mailing of sales literature and servicing shareholder accounts (“12b-1 fees”). The Fund or Distributor may pay all or a portion of these fees to any Recipient who renders assistance in distributing or promoting the sale of shares, or who provides certain shareholder services, pursuant to a written agreement. For the fiscal year ended May 31, 2020, 12b-1 fees incurred by the Fund were $99,488. The Fund owed $15,141 for 12b-1 fees as of May 31, 2020.
22
BFS Equity Fund
Notes to the Financial Statements (continued)
May 31, 2020
NOTE 5. PURCHASES AND SALES OF SECURITIES
For the fiscal year ended May 31, 2020, purchases and sales of investment securities, other than short-term investments, were $19,943,036 and $18,850,472, respectively.
There were no purchases or sales of long-term U.S. government obligations during the fiscal year ended May 31, 2020.
NOTE 6. FEDERAL TAX INFORMATION
At May 31, 2020, the net unrealized appreciation (depreciation) and tax cost of investments for tax purposes was as follows:
Gross unrealized appreciation | | $ | 12,998,383 | |
Gross unrealized depreciation | | | (413,662 | ) |
Net unrealized appreciation on investments | | $ | 12,584,721 | |
Tax cost of investments | | $ | 26,648,027 | |
At May 31, 2020, the difference between book basis and tax basis unrealized appreciation (depreciation) is attributable to the tax deferral of losses on wash sales.
The tax character of distributions paid for the fiscal years ended May 31, 2020 and May 31, 2019 were as follows:
| | 2020 | | | 2019 | |
Distributions paid from: | | | | | | | | |
Ordinary income(a) | | $ | 123,761 | | | $ | 83,219 | |
Long-term capital gains | | | 605,648 | | | | 1,030,144 | |
Total distributions paid | | $ | 729,409 | | | $ | 1,113,363 | |
(a) | For federal income tax purposes, distributions of short-term capital gains are treated as ordinary income distributions. |
At May 31, 2020, the components of accumulated earnings (deficit) on a tax basis were as follows:
Accumulated capital and other losses | | $ | (1,131,664 | ) |
Unrealized appreciation (depreciation) | | | 12,584,721 | |
Total | | $ | 11,453,057 | |
Under current tax law, net investment losses after December 31 and capital losses realized after October 31 of the Fund’s fiscal year may be deferred and treated as occurring on the first business day of the following fiscal year for tax purposes. For the fiscal year ended May 31, 2020, the Fund deferred Post-October capital losses of $1,131,664.
23
BFS Equity Fund
Notes to the Financial Statements (continued)
May 31, 2020
NOTE 7. CORONAVIRUS (COVID-19) PANDEMIC
The COVID-19 pandemic has caused financial markets to experience periods of increased volatility due to uncertainty that exists around its long-term effects. COVID-19 has resulted in varying levels of travel restrictions, quarantines, disruptions to supply chains and customer activity, leading to general concern and economic uncertainty. The full impact and duration of the pandemic cannot necessarily be foreseen. Management continues to monitor developments and navigate accordingly, further evaluating the anticipated impact to financial markets.
NOTE 8. COMMITMENTS AND CONTINGENCIES
The Trust indemnifies its officers and Trustees for certain liabilities that may arise from their performance of their duties to the Trust or the Fund. Additionally, in the normal course of business, the Trust enters into contracts that contain a variety of representations and warranties which provide general indemnifications. The Trust’s maximum exposure under these arrangements is unknown, as this would involve future claims that may be made against the Trust that have not yet occurred.
NOTE 9. SUBSEQUENT EVENTS
Management of the Fund has evaluated the need for disclosures and/or adjustments resulting from subsequent events through the date at which these financial statements were issued. Based upon this evaluation, management has determined there were no items requiring adjustment of the financial statements or additional disclosure.
24
Report of Independent Registered Public Accounting Firm
To the Shareholders of BFS Equity Fund and
Board of Trustees of Valued Advisers Trust
Opinion on the Financial Statements
We have audited the accompanying statement of assets and liabilities, including the schedule of investments, of BFS Equity Fund (the “Fund”), a series of Valued Advisers Trust, as of May 31, 2020, the related statement of operations for the year then ended, the statements of changes in net assets for each of the two years in the period then ended, including the related notes, and the financial highlights for each of the five years in the period then ended (collectively referred to as the “financial statements”). In our opinion, the financial statements present fairly, in all material respects, the financial position of the Fund as of May 31, 2020, the results of its operations for the year then ended, the changes in its net assets for each of the two years in the period then ended, and the financial highlights for each of the five years in the period then ended, in conformity with accounting principles generally accepted in the United States of America.
Basis for Opinion
These financial statements are the responsibility of the Fund’s management. Our responsibility is to express an opinion on the Fund’s financial statements based on our audits. We are a public accounting firm registered with the Public Company Accounting Oversight Board (United States) (“PCAOB”) and are required to be independent with respect to the Fund in accordance with the U.S. federal securities laws and the applicable rules and regulations of the Securities and Exchange Commission and the PCAOB.
We conducted our audits in accordance with the standards of the PCAOB. Those standards require that we plan and perform the audit to obtain reasonable assurance about whether the financial statements are free of material misstatement whether due to error or fraud.
Our audits included performing procedures to assess the risks of material misstatement of the financial statements, whether due to error or fraud, and performing procedures that respond to those risks. Such procedures included examining, on a test basis, evidence regarding the amounts and disclosures in the financial statements. Our procedures included confirmation of securities owned as of May 31, 2020, by correspondence with the custodian and broker. Our audits also included evaluating the accounting principles used and significant estimates made by management, as well as evaluating the overall presentation of the financial statements. We believe that our audits provide a reasonable basis for our opinion.
We have served as the Fund’s auditor since 2013.
COHEN & COMPANY, LTD.
Cleveland, Ohio
July 28, 2020
25
BFS Equity Fund
Summary of Fund Expenses (Unaudited)
As a shareholder of the Fund, you incur two types of costs: (1) transaction and (2) ongoing costs, including management fees and other Fund expenses. These examples are intended to help you understand your ongoing costs (in dollars) of investing in the Fund and to compare these costs with the ongoing costs of investing in other mutual funds. The example is based on an investment of $1,000 invested at the beginning of the period and held for the entire period from December 1, 2019 through May 31, 2020.
Actual Expenses
The first line of the table below provides information about actual account values and actual expenses. You may use the information in this line, together with the amount you invested, to estimate the expenses that you paid over the period. Simply divide your account value by $1,000 (for example, an $8,600 account value divided by $1,000 = 8.6), then multiply the result by the number in the first line under the heading entitled “Expenses Paid During Period” to estimate the expenses you paid on your account during this period.
Hypothetical Example for Comparison Purposes
The second line of the table below provides information about hypothetical account values and hypothetical expenses based on the Fund’s actual expense ratio and an assumed rate of return of 5% per year before expenses, which is not the Fund’s actual return. The hypothetical account values and expenses may not be used to estimate the actual ending account balance or expenses you paid for the period. You may use this information to compare the ongoing costs of investing in the Fund and other funds. To do so, compare this 5% hypothetical example with the 5% hypothetical examples that appear in the shareholder reports of other funds.
Expenses shown in the table are meant to highlight your ongoing costs only and do not reflect any transactional costs. Therefore, the second line of the table below is useful in comparing ongoing costs only and will not help you determine the relative costs of owning different funds. In addition, if transaction costs were included, your costs would have been higher.
| | Beginning
Account Value
December 1, 2019 | Ending
Account Value
May 31, 2020 | Expenses Paid
During Period(a) | Annualized
Expense Ratio |
Actual | $1,000.00 | $ 937.80 | $6.06 | 1.25% |
Hypothetical(b) | $1,000.00 | $ 1,018.75 | $6.31 | 1.25% |
(a) | Expenses are equal to the Fund’s annualized expense ratio, multiplied by the average account value over the period, multiplied by 183/366 (to reflect the one-half year period). |
(b) | Hypothetical assumes 5% annual return before expenses. |
26
Additional Federal Income Tax Information
(Unaudited)
The Form 1099-DIV you receive in January 2021 will show the tax status of all distributions paid to your account in calendar year 2020. Shareholders are advised to consult their own tax adviser with respect to the tax consequences of their investment in the Fund. As required by the Internal Revenue Code and/or regulations, shareholders must be notified regarding the status of qualified dividend income for individuals and the dividends received deduction for corporations.
Qualified Dividend Income. The Fund designates approximately 100% or up to the maximum amount of such dividends allowable pursuant to the Internal Revenue Code, as qualified dividend income eligible for a reduced tax rate.
Qualified Business Income. The Fund designates approximately 0% of its ordinary income dividends, or up to the maximum amount of such dividends allowable pursuant to the Internal Revenue Code, as qualified business income.
Dividends Received Deduction. Corporate shareholders are generally entitled to take the dividends received deduction on the portion of the Fund’s dividend distribution that qualifies under tax law. For the Fund’s calendar year 2020 ordinary income dividends, 100% qualifies for the corporate dividends received deduction.
For the year ended May 31, 2020, the Fund designated $605,648 as long-term capital gain distributions.
Trustees and Officers (Unaudited)
The Board of Trustees supervises the business activities of the Trust. Each Trustee serves as a trustee until termination of the Trust unless the Trustee dies, resigns, retires or is removed.
The following table provides information regarding each of the Independent Trustees.
Name, Address*, (Age), Position with Trust**,
Term of Position with Trust | Principal Occupation During
Past 5 Years and Other Directorships | Other Directorships |
Andrea N. Mullins, (53)
Independent Trustee
Since December 2013 Chairperson since
March 2017 | Current: Private investor; Independent Contractor, SWM Advisors (since April 2014). | Trustee, Angel Oak Funds Trust (since February 2019) (4 portfolios); Trustee, Angel Oak Strategic Credit Fund (since February 2019); Trustee, Angel Oak Financial Strategies Income Term Trust (since May 2019); Trustee, Angel Oak Dynamic Financial Strategies Income Term Trust (since 2019) |
27
Trustees and Officers (Unaudited) (continued)
Name, Address*, (Age), Position with Trust**,
Term of Position with Trust | Principal Occupation During
Past 5 Years and Other Directorships | Other Directorships |
Ira P. Cohen, (61)
Independent Trustee
Since June 2010 | Current: Independent financial services consultant (since February 2005); Executive Vice President of Asset Management Services, Recognos Financial (since August 2015). | Trustee and Audit Committee Chairman, Griffin Institutional Access Credit Fund (since January 2017); Trustee and Audit Committee Chairman, Griffin Institutional Real Estate Access Fund (since May 2014); Trustee, Angel Oak Funds Trust (since October 2014) (4 portfolios); Trustee, Chairman, and Nominating and Governance Committee Chairman, Angel Oak Strategic Credit Fund (since December 2017); Trustee and Chairman, Angel Oak Financial Strategies Income Term Trust (since May 2019); Trustee, Angel Oak Dynamic Financial Strategies Income Term Trust (since 2019) |
* | The address for each Trustee is 225 Pictoria Drive, Suite 450, Cincinnati, Ohio 45246. |
** | As of the date of this report, the Trust consists of 12 series. |
The following table provides information regarding the Trustee who is considered an “interested person” of the Trust, as that term is defined under the 1940 Act. Based on the experience of the Trustee, the Trust concluded that the individual described below should serve as a Trustee.
Name, Address*, (Age),
Position with Trust**,
Term of Position with Trust | Principal Occupation During
Past 5 Years and Other Directorships | Other Directorships |
Mark J. Seger***, (58)
Trustee
Since March 2017 | Current: Vice Chairman and Co-Founder, Ultimus Fund Solutions, LLC and its subsidiaries (since 1999). | None. |
* | The address for each Trustee is 225 Pictoria Drive, Suite 450, Cincinnati, Ohio 45246. |
** | As of the date of this report, the Trust consists of 12 series. |
*** | Mr. Seger is considered an “interested person” of the Trust because of his relationship with the Trust’s administrator, transfer agent, and distributor. |
28
Trustees and Officers (Unaudited) (continued)
The following table provides information regarding the Officers of the Trust:
Name, Address*, (Age),
Position with Trust**,
Term of Position with Trust | Principal Occupation During Past 5 Years | Other Directorships |
Adam T. Kornegay, (35)
Principal Executive Officer and President
Since April 2018 | Current: Vice President, Business Development Director, Ultimus Fund Solutions, LLC (since March 2015). | None. |
Gregory T. Knoth, (50)
Principal Financial Officer and Treasurer
Since April 2019 | Current: Vice President, Mutual Fund Controller, Ultimus Fund Solutions, LLC (since January 2016). Previous: Vice President and Manager of Fund Accounting, Huntington Asset Services, Inc. (n/k/a Ultimus Asset Services, LLC) (June 2013 to December 2015). | None. |
Kevin J. Patton, (50)
Chief Compliance Officer
Since March 2020 | Current: Assistant Vice President, Compliance Officer, Ultimus Fund Solutions, LLC (since January 2020). Previous: Partner and Chief Compliance Officer, Renaissance Investment Management (August 2005 to January 2020). | None. |
Carol J. Highsmith, (55)
Vice President
Since August 2008 Secretary
Since March 2014 | Current: Vice President, Ultimus Fund Solutions, LLC (since December 2015). Previous: Employed in various positions with Huntington Asset Services, Inc. (n/k/a Ultimus Asset Services, LLC) (November 1994 to December 2015), most recently Vice President of Legal Administration (2005 to December 2015). | None. |
* | The address for each Trustee is 225 Pictoria Drive, Suite 450, Cincinnati, Ohio 45246. |
** | As of the date of this report, the Trust consists of 12 series. |
29
FACTS | WHAT DOES BFS EQUITY FUND (THE “FUND”) DO WITH YOUR PERSONAL INFORMATION? |
| | |
Why? | Financial companies choose how they share your personal information. Federal law gives consumers the right to limit some but not all sharing. Federal law also requires us to tell you how we collect, share, and protect your personal information. Please read this notice carefully to understand what we do. |
| | |
What? | The types of personal information we collect and share depend on the product or service you have with us. This information can include: ■ Social Security number ■ account balances and account transactions ■ transaction or loss history and purchase history ■ checking account information and wire transfer instructions When you are no longer our customer, we continue to share your information as described in this notice. |
| | |
How? | All financial companies need to share customers’ personal information to run their everyday business. In the section below, we list the reasons financial companies can share their customers’ personal information; the reasons the Fund chooses to share; and whether you can limit this sharing. |
| | |
Reasons we can share your personal information | Does the Fund share? |
For our everyday business purposes —
such as to process your transactions, maintain your account(s), respond to court orders and legal investigations, or report to credit bureaus | Yes |
For our marketing purposes —
to offer our products and services to you | No |
For joint marketing with other financial companies | No |
For our affiliates’ everyday business purposes –
information about your transactions and experiences | No |
For our affiliates’ everyday business purposes –
information about your creditworthiness | No |
For nonaffiliates to market to you | No |
| | |
Questions? | Call (855) 575-2430 |
30
Who we are |
Who is providing this notice? | BFS Equity Fund
Ultimus Fund Distributors, LLC (Distributor)
Ultimus Fund Solutions, LLC (Administrator) |
What we do |
How does the Fund protect my personal information? | To protect your personal information from unauthorized access and use, we use security measures that comply with federal law. These measures include computer safeguards and secured files and buildings. Our service providers are held accountable for adhering to strict policies and procedures to prevent any misuse of your nonpublic personal information. |
How does the Fund collect my personal information? | We collect your personal information, for example, when you ■ open an account or deposit money ■ buy securities from us or sell securities to us ■ make deposits or withdrawals from your account ■ give us your account information ■ make a wire transfer ■ tell us who receives the money ■ tell us where to send the money ■ show your government-issued ID ■ show your driver’s license |
Why can’t I limit all sharing? | Federal law gives you the right to limit only ■ sharing for affiliates’ everyday business purposes — information about your creditworthiness ■ affiliates from using your information to market to you ■ sharing for nonaffiliates to market to you State laws and individual companies may give you additional rights to limit sharing. |
Definitions |
Affiliates | Companies related by common ownership or control. They can be financial and nonfinancial companies. ■ Bradley, Foster & Sargent, Inc., the investment adviser to the Fund, could be deemed to be an affiliate. |
Nonaffiliates | Companies not related by common ownership or control. They can be financial and nonfinancial companies. ■ The Fund does not share your personal information with nonaffiliates so they can market to you. |
Joint marketing | A formal agreement between nonaffiliated financial companies that together market financial products or services to you. ■ The Fund doesn’t jointly market. |
31
This page is intentionally left blank.
This page is intentionally left blank.
Other Information (Unaudited)
The Fund’s Statement of Additional Information (“SAI”) includes additional information about the trustees and is available without charge, upon request. You may call toll-free at (855) 575-2430 to request a copy of the SAI or to make shareholder inquiries.
Proxy Voting
A description of the policies and procedures that the Fund uses to determine how to vote proxies relating to portfolio securities and information regarding how the Fund voted those proxies during the most recent twelve month period ended June 30 are available (1) without charge upon request by calling the Fund at (855) 575-2430 and (2) in Fund documents filed with the Securities and Exchange Commission (“SEC”) on the SEC’s website at www.sec.gov.
TRUSTEES
Andrea N. Mullins, Chairperson
Ira P. Cohen
Mark J. Seger
OFFICERS
Adam T. Kornegay, Principal Executive Officer and President
Gregory T. Knoth, Principal Financial Officer and Treasurer
Kevin J. Patton, Chief Compliance Officer
Carol J. Highsmith, Vice President and Secretary
INVESTMENT ADVISER
Bradley, Foster & Sargent, Inc.
185 Asylum Street, City Place II
Hartford, CT 06103
DISTRIBUTOR
Ultimus Fund Distributors, LLC
225 Pictoria Drive, Suite 450
Cincinnati, OH 45246
INDEPENDENT REGISTERED PUBLIC ACCOUNTING FIRM
Cohen & Company, Ltd.
1350 Euclid Avenue, Suite 800
Cleveland, OH 44115
LEGAL COUNSEL
Stradley Ronon Stevens & Young, LLP
2005 Market Street, Suite 2600
Philadelphia, PA 19103
CUSTODIAN
Huntington National Bank
41 South High Street
Columbus, OH 43215
ADMINISTRATOR, TRANSFER AGENT AND FUND ACCOUNTANT
Ultimus Fund Solutions, LLC
225 Pictoria Drive, Suite 450
Cincinnati, OH 45246
This report is intended only for the information of shareholders or those who have received the Fund’s prospectus which contains information about the Fund’s management fee and expenses. Please read the prospectus carefully before investing.
Distributed by Ultimus Fund Distributors, LLC
Member FINRA/SIPC
Beginning on January 1, 2021, as permitted by regulations adopted by the Securities and Exchange Commission, paper copies of the Fund’s shareholder reports like this one will no longer be sent by mail, unless you specifically request paper copies of the reports from the Fund or from your financial intermediary such as a broker-dealer or bank. Instead, the reports will be made available on a website, and you will be notified by mail each time a report is posted and provided with a website link to access the report.
If you already elected to receive shareholder reports electronically, you will not be affected by this change and you need not take any action. You may elect to receive shareholder reports and other communications from the Fund electronically by contacting the Fund at (877) 336-6763 or, if you own these shares through a financial intermediary, you may contact your financial intermediary.
You may elect to receive all future reports in paper free of charge. You can inform the Fund that you wish to continue receiving paper copies of your shareholder reports by contacting the Fund at (877) 336-6763. If you own shares through a financial intermediary, you may contact your financial intermediary or follow instructions included with this document to elect to continue to receive paper copies of your shareholder reports. Your election to receive reports in paper will apply to all funds held with the fund complex or at your financial intermediary.
To Shareholders of the LS Opportunity Fund,
Prospector Partners, LLC (“Prospector”), based in Guilford, CT is the sub-adviser of the LS Opportunity Fund (“LSOFX” or the “Fund”). Prospector has a long/short hedge fund track record that spans 23 years with a substantially similar investment objective to LSOFX and brings its experience to our Fund in a daily liquid mutual fund format with a goal of downside protection and consistency of returns.
The Fund aims to generate long-term capital appreciation by investing in both long and short positions within a portfolio consisting of primarily publicly traded common stock, with less net exposure than that of the stock market in general. Through extensive research, risk management, and no leverage in the long book, the Fund strives to preserve capital while delivering solid risk-adjusted returns and managing volatility. For additional information, please visit our website at www.longshortadvisors.com.
5 Year Anniversary and 5 Star Ranking
First and foremost, we at Long Short Advisors would like to thank the team at Prospector for another job well done. As of May 31, 2020, Prospector has been the sub-adviser of the Fund for five years and their top notch absolute and risk adjusted returns earned them a five-star ranking from Morningstar. We look forward to the next five years as Prospector continues to deliver.
| | ● | Goal of Stability: net exposure between 50% and 80%, no market timing |
| | ● | Goal of Safety: value plays in both long and short holdings, no “big factor” bets |
| | ● | Familiarity: investing in sectors they know extremely well |
| | ● | Reinvestment: 80% Investment Reuse |
| | ● | Functionality: shorting for Alpha, not just for hedging |
| | ● | Skin in the Game: experienced team with their money on the line next to yours |
For more information on investment strategy, call Long Short Advisors at 215-399-9409.
1
Performance
For the 12-month period ended May 31, 2020 (the “Period”), LSOFX returned +0.62%, while the HFRX Equity Hedge Index (“HFRX”) returned -2.90%. However, the S&P 500® Index (“S&P 500”) finished the Period with a return of +12.84%.
Performance of LSOFX, S&P 500 and HFRX
During the Year Ended May 31, 2020
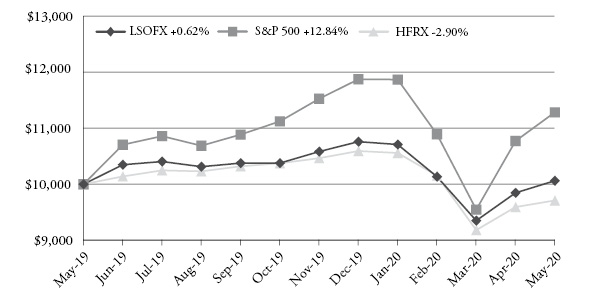
Performance Since Prospector Became Sub-Adviser of LSOFX
(June 2015 - May 2020)
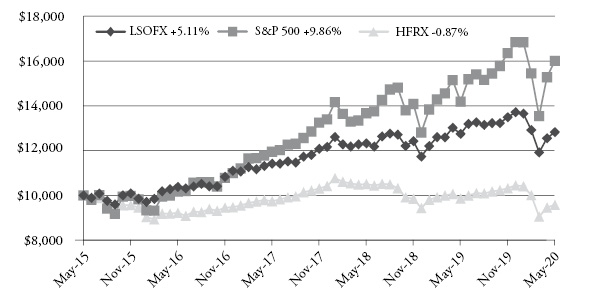
Coronavirus Pandemic
These are uncharted waters for all of us. The COVID-19 virus pandemic is first and foremost a health crisis with associated economic and financial fallout. The health data relative to testing is spotty and poor. Our leaders are trying to manage a crisis without the ability to adequately
2
measure the scope and spread of the disease. We have no idea what the denominator is, so all estimates of infection, serious illness and mortality rates are suspect. The Federal Reserve, under the able leadership of Jerome Powell, along with other global central banks have moved decisively with lower short-term rates and massive quantitative easing programs to cushion the liquidity crunch and soften the financial aspects of the crisis. The U.S. Congress then moved quickly and decisively with unprecedented fiscal stimulus through the CARES Act and Paycheck Protection Program to absorb some of the near-term economic damage from the abrupt economic crash and unemployment spike. We expect more stimulus to come as the federal government uses its balance sheet and borrowing power to keep the economy afloat.
The management of the health crisis is paramount and will be the most critical determinant of the length, depth, and breadth of the economic downturn that is upon us. The success or failure of aggressive mitigation efforts such as social distancing and sheltering in place strategies implemented by many states will dictate the intermediate future. Ultimately, we will need widespread and effective testing and contact tracing capabilities to control the pandemic. Questions abound regarding the economic recession; will there be a V-shaped recovery? Unlikely… U-shaped? Or L-shaped? Will the virus fade with warmer weather conditions and reoccur next fall like the seasonal flu virus? Will therapeutic treatments emerge in the short or medium term? Will a vaccine be discovered in a year or two? How quickly might billions of doses of said vaccine be available?
Will there be long lasting behavioral changes as a result of COVID-19? Will we ever shake hands again? Is remote working at scale here to stay? How long will it take for certain percentages of the population to overcome anxiety regarding eating out, attending a concert or sporting event, staying overnight in a hotel room, riding mass transit or shoe-horning onto an airplane to visit a tourist destination? Surely e-commerce, technology, and healthcare will continue to grow. Global supply chains of strategically important goods will redomesticate. How and where we work and live will experience some level of permanent change at the margin. The scope and scale of those changes depends on the management of the pandemic from this point forward. A shorter decisive resolution might trigger a shorter collective memory…
Our Stock Market Distress Playbook
During the 23-year history of our management team, we have experienced three significant equity market sell offs, including the burst of the internet bubble in 2000, the Great Financial Crisis of 2008, and now this coronavirus pandemic. Each time, we return to a few key strategic portfolio management actions: fine-tune what we already own, seek to add names we know well but had not owned due to elevated valuations, and evaluate the risks and opportunities characterized by the events of the current crisis.
Fine Tune What We Own
First, we seek to upgrade the quality of the balance sheets in your portfolio. As you are aware, we are chronically “allergic” to leverage and debt in our positions. That said, there is always room for improvement when the music stops, and a market crisis erupts. Generally, this re-underwriting process leads us to hold larger balance sheets with more staying power.
3
Second, we reduce the gross exposure in the portfolio to reduce overall risk during the heightened uncertainty. We entered 2020 with gross exposure of 119% and left the first quarter with 94% gross exposure at March 31, 2020. Our net exposure began 2020 at 58%, bottomed out at 44% in mid-March near the low point of the S&P 500, before rebounding to 55% through purchase activity and the market recovery by the end of the quarter. We now stand at the end of the Period at 56%.
We reduce cyclicality in the portfolio at the margin. Again, you are aware that we chronically are underweight cyclical sectors of the market such as industrials, materials, technology, and consumer discretionary. This time is no different. When we start to see through the severity of the economic downturn, we would begin to reintroduce cyclicality into the portfolio through investments in quality balance sheets in these same areas.
Finally, we actively and aggressively manage our tax position. We are loathed to deliver a taxable gain at the same time as a total return loss to our customers. Recall that more than 20% of the assets in the Fund’s strategy is internal money. As such, we pay close attention to maximizing after tax returns for our clients.
New Additions
During the Period, we took advantage of the market sell-off to purchase Visa, Inc. (V) and MasterCard, Inc. (MA). We admire both franchises given their international brand recognition and scope, pricing power, oligopoly status, and essential function in the economy. They are also in a prime position to capitalize on the continued movement away from cash transactions (which COVID-19 is accelerating) and the rise of digital payments. For downside mitigation, both companies maintain fortress balance sheets and strong liquidity, which we are especially attracted to in this uncertain environment. Visa senior debt is rated AA-, and MasterCard senior debt is rated A+ by Standard & Poors. Additionally, revenue and core profitability held up relatively well during the 2008 Financial Crisis with free cash flow generation through the period. In this crisis, assuming the weak March activity persists for the remainder of the year, we believe EPS downside is limited to a manageable double-digit decline from 2019. Historically, these franchises have traded at elevated multiples reflecting their quality and growth averaging 30x earnings and below a 3% free cash flow yield over the past 5 years. As the COVID-19 crisis unfolded, we had the rare opportunity to purchase Visa and MasterCard at a 5-year low on P/E and near a 5-year high on free cash flow yields. We appreciate the opportunity to own superior businesses at fair prices.
Key Opportunities
Property and casualty underwriter stocks have been harshly punished by the market over concerns of potentially having to pay COVID-19 related claims under business interruption clauses in their commercial property policies as well as plummeting yields on fixed income investments hurting reinvestment rates and slowing book value growth. While there is truth to the latter concern, we feel that the first one, which is the more material, immediate concern, is unfounded. Our property and casualty holdings generally consist of personal lines insurers such as Progressive and Mercury General who have little commercial property exposure, or main street carriers such as Selective and Hanover Insurance Group, who write small commercial policies largely using Insurance Service Office (ISO) standard forms which
4
specifically exclude coverage for a pandemic. While not unusual for politicians to propose legislation in the aftermath of a large loss to extend insurance policies to respond to events specifically excluded (e.g. Hurricane Sandy, World Trade Center, et al), the U.S. judicial system tends to ultimately enforce the principles of contract law. We feel strongly that this will remain the case. Reinsurance industry exposure to COVID-19 is difficult to handicap, and we are short several reinsurance companies in your portfolio. However, we maintain a large long position in RenaissanceRe, a reinsurer with a dominant franchise in natural catastrophe reinsurance, a class of contracts with less COVID-19 exposure.
Insurance intermediaries, including Brown & Brown and Arthur J. Gallagher, stand to benefit from dramatically higher future rates for insurance which are in the offing. These capital-light businesses charge commissions and fees and bear no underwriting risk. We expect organic growth to dip in the next couple of quarters as the headcount-related premium lines such as workers compensation contract with rising unemployment, before reaccelerating into an economic recovery as insurance rates accelerate.
On the bank side, our net exposure is among the lowest in the strategy’s 23-year history, which was a good thing during the first quarter. We trimmed exposure due to a decent rally in bank stocks during the fourth quarter of 2019 combined with twin concerns about an overdue credit cycle and a persistent low interest rate outlook. Today, banks in the U.S. are better prepared to handle this crisis than in 2008. They have significantly higher capital levels and liquidity, plus many of the higher risk loan categories are now held by non-bank lenders, hedge funds, etc. In other words, the capital ratios relative to risk assets are double where they were prior to the Great Financial Crisis, and the loan underwriting standards are significantly more stringent than 12 years ago. They also hold fewer exotic instruments and engage in significantly less proprietary trading. Their digital capabilities, built through large consistent investing in technology over the past decade, allow them to service customers seamlessly and remotely, which is currently essential. Finally bank stocks are historically inexpensive on a price to tangible book value basis and have robust 5% dividend yields that look sustainable unless the downturn becomes materially worse, or the Fed reverses their current stance and forces banks to cut dividends to accrete capital. Regulators and legislators are using the banking infrastructure to deliver stimulus to small businesses, i.e. they are part of the solution, not the epicenter of the problem as during the Great Financial Crisis.
That said, there are few safe haven loan categories this time around; especially at risk are: energy, hospitality, restaurants, retail, travel, leveraged loans, etc. Also, buybacks are suspended for the time being, and M&A activity has halted as well, both of which are core elements of the book value growth thesis for owning bank stocks. Once we can see through the depths of the recession to recovery, we are likely to add bank stock exposure to participate in the ultimate cyclical rebound of the economy.
Outlook
The range of outcomes in the short to intermediate term is wide and hinges on the imminent outcome of the “bending the curve” effort to curtail the COVID-19 pandemic. Economic contraction, trade and geopolitical concerns weigh heavily. The upcoming United States
5
presidential election is right around the corner and a shift in power could prolong market volatility.
Interest and mortgage rates continue near historically low levels, inflation is non-existent, and a recession is here. We are carefully monitoring aggregate corporate debt levels (especially BBB- debt which is a single notch above junk status), which now sit above pre-2008 crisis levels and loom as a problem without aggressive Fed buying through the latest quantitative easing program. Unemployment has also spiked to double digit levels and has not yet stabilized.
In our estimation, equity valuations remain at elevated levels due to the sharp decline in expected earnings for the rest of 2020 and into 2021. Recovery in aggregate earnings will be slow as certain industries such as hospitality, entertainment, banking, and travel will take much longer to return to pre-coronavirus levels. Treasury and high-grade corporate bond yields look unattractive after the dramatic flight to safety rally during the current health crisis. In any case, the values inherent in your portfolio should attract acquirers and other investors over time. Meanwhile, we still believe equities are a superior asset allocation alternative to bonds over the longer term.
Thank you for your continued support and we look forward to reporting to you again following our semi-annual date of November 30, 2020.
Steadfast, we remain committed to our goal of making you money while protecting your wealth.
- Your Team at Long Short Advisors
Long Book
Top Positions
At Period’s end, the Fund contained 61 long positions in the portfolio representing companies with what management believes represents long-term value and favorable characteristics such as a discount to private market value, attractive free cash flow yields, and strong balance sheets. The Fund’s top 10 long positions represented approximately 26% of the portfolio and included Aflac (AFL), Arthur J. Gallagher (AJG), Berkshire Hathaway (BRK.B), Brown & Brown (BRO), Merck (MRK), Nestle (NESN), PNC Financial (PNC), Progressive (PGR), Renaissance RE (RNR) and US Bancorp (USB).
Contributors
The five stocks in the long book that contributed the largest returns during the Period, from largest to smallest were: Microsoft (MSFT), American International Group (AIG), Swedish Match AB (SWMA.SS), Sysco (SYY) and Brown & Brown (BRO).
6
Detractors
Over the Period, the three stocks in the long book that detracted from returns the most during the Period, from largest to smallest were: Darden Restaurants (DRI), Axis Capital Holdings (AXS) and Fifth Third Bancorp (FITB).
Largest Purchases
The top purchases by dollar value in the long book for the Period were: The Hanover Insurance Group (THG), Arthur J. Gallagher (AJG), Swedish Match AB (SWMA.SS), Fifth Third Bancorp (FITB) and RenaissanceRe Holdings (RNR).
Largest Sales
The top sales by dollar value in the long book for the Period were: Microsoft (MSFT), The Hanover Insurance Group (THG), Cincinnati Financial (CINF), Berkshire Hathaway Inc. (BRK/B) and Swedish Match AB (SWMA.SS).
Short Book
Top Positions
The Fund’s short book at Period’s end contained 29 individual companies that management believes have business model challenges, excessive valuations, and/or potential balance sheet issues. The Fund’s top 20 short positions represented approximately 20% of the portfolio.
“The Secret of Wealth Creation is to Avoid Large Losses”
-John Gillespie, portfolio manager
Mutual fund investing involves risk and principal loss is possible. You should carefully consider the investment objectives, potential risks, management fees, and charges and expenses of the Fund before investing. The Fund’s prospectus contains this and other information about the Fund and should be read carefully before investing. You may obtain a current copy of the Fund’s prospectus by calling 1-877-336-6763. The Fund is distributed by Ultimus Fund Distributors, LLC
Investment in shares of a long/short equity fund have the potential for significant risk and volatility. A short equity strategy can diminish returns in a rising market as well as having the potential for unlimited losses. These types of funds typically have a high portfolio turnover that could increase transaction costs and cause short-term capital gains to be realized.
The performance data quoted represents past performance; past performance does not guarantee future results. The investment return and principal value of an investment in the Fund will fluctuate so that an investor’s shares, when redeemed, may be worth more or less than their original cost. Current performance of the Fund may be lower or higher than the performance quoted. For performance current to the most recent month end, call 1-877-336-6763.
7
Investment Results (Unaudited)
Average Annual Total Returns(a)
(For the periods ended May 31, 2020) | |
| | One
Year | Three
Year | Five
Year | Since
Inception
(September 30,
2010) | |
LS Opportunity Fund | 0.62% | 3.96% | 5.11% | 5.69% | |
S&P 500® Index(b) | 12.84% | 10.23% | 9.86% | 13.01% | |
HFRX Equity Hedge Index(c) | -2.90% | -0.57% | -0.87% | 0.11% | |
Total annual operating expenses, as disclosed in the LS Opportunity Fund’s (the “Fund”) prospectus dated September 28, 2019, were 3.13% of average daily net assets (2.91% after fee waivers and expense reimbursements by Long Short Advisors, LLC (the “Adviser”)). The Adviser has entered into an expense limitation agreement, pursuant to which it will waive its fees and/or reimburse other expenses of the Fund until September 30, 2020, so that Total Annual Fund Operating Expenses does not exceed 1.95%. This operating expense limitation does not apply to borrowing costs such as interest and dividends on securities sold short, taxes, brokerage commissions, other expenditures which are capitalized in accordance with generally accepted accounting principles, other extraordinary expenses not incurred in the ordinary course of the Fund’s business, expenses incurred under a Rule 12b-1 plan of distribution, “acquired fund fees and expenses,” and expenses that the Fund has incurred but did not actually pay because of an expense offset arrangement. Each fee waiver or reimbursement of an expense by the Adviser is subject to repayment by the Fund within the three years following such waiver or reimbursement, provided that the Fund is able to make the repayment without exceeding the expense limitation in place at the time of the waiver or reimbursement and the expense limitation in place at the time of the repayment. This agreement may only be terminated by mutual consent of the Adviser and the Board of Trustees. |
The performance quoted represents past performance, which does not guarantee future results. The investment return and principal value of an investment will fluctuate so that an investor’s shares, when redeemed, may be worth more or less than their original cost. The returns shown do not reflect deduction of taxes that a shareholder would pay on Fund distributions or the redemption of Fund shares. Prior to May 28, 2015, the Fund’s performance was attributable to a previous sub-adviser. The Fund’s investment objectives, risks, charges and expenses must be considered carefully before investing. Current performance of the Fund may be lower or higher than the performance quoted. Performance data current to the most recent month end may be obtained by calling (877) 336-6763.
8
(a) Average annual total returns reflect any change in price per share and assume the reinvestment of all distributions, if any. The Fund’s returns reflect any fee reductions during the applicable periods. If such fee reductions had not occurred, the quoted performance would have been lower.
(b) The S&P 500® Index is a widely recognized unmanaged index of equity prices and is representative of a broader market and range of securities than is found in the Fund’s portfolio. The index is an unmanaged benchmark that assumes reinvestment of all distributions and excludes the effect of taxes and fees. Individuals cannot invest directly in this index; however, an individual can invest in exchange-traded funds or other investment vehicles that attempt to track the performance of a benchmark index.
(c) The HFRX Equity Hedge Index is compiled by Hedge Fund Research, Inc. It is comprised solely of hedge funds and is designed to be representative of the overall composition of the hedge fund universe implementing a long/short equity strategy. The index is not available for direct investment.
The Fund’s investment objectives, risks, charges and expenses must be considered carefully before investing. The prospectus contains this and other important information about the Fund and may be obtained by calling (877) 336-6763. Please read it carefully before investing.
The Fund is distributed by Ultimus Fund Distributors, LLC, member FINRA/SIPC.
9
Comparison of the Growth of a $10,000 Investment in the LS Opportunity Fund,
the HFRX Equity Hedge Index and the S&P 500® Index (Unaudited)

The chart above assumes an initial investment of $10,000 made on September 30, 2010 (commencement of Fund operations) and held through May 31, 2020. THE FUND’S RETURNS REPRESENT PAST PERFORMANCE AND DO NOT GUARANTEE FUTURE RESULTS. The returns shown do not reflect deduction of taxes that a shareholder would pay on the Fund’s distributions or the redemption of the Fund’s shares. Investment returns and principal values will fluctuate so that your shares, when redeemed, may be worth more or less than their original purchase price.
Current performance may be lower or higher than the performance data quoted. For more information on the Fund, and to obtain performance data current to the most recent month-end, or to request a prospectus, please call (877) 336-6763. You should carefully consider the investment objectives, potential risks, management fees, and charges and expenses of the Fund before investing. The Fund’s prospectus contains this and other information about the Fund, and should be read carefully before investing.
The Fund is distributed by Ultimus Fund Distributors, LLC, member FINRA/SIPC.
10
Fund Holdings (Unaudited)
Sector Exposure (5/31/2020)
(Based on Net Assets)
| | Long | | Short | | Gross | | Net |
Consumer Discretionary | 2.43% | | -0.29% | | 2.72% | | 2.14% |
Consumer Staples | 10.14% | | -3.27% | | 13.41% | | 6.87% |
Energy | 2.19% | | 0.00% | | 2.19% | | 2.19% |
Financials | 36.07% | | -14.04% | | 50.11% | | 22.03% |
Health Care | 8.34% | | -1.44% | | 9.78% | | 6.90% |
Industrials | 5.14% | | 0.00% | | 5.14% | | 5.14% |
Information Technology | 12.96% | | 0.00% | | 12.96% | | 12.96% |
Materials | 1.44% | | 0.00% | | 1.44% | | 1.44% |
Real Estate | 0.48% | | 0.00% | | 0.48% | | 0.48% |
Total Sector Exposure | 79.19% | | -19.04% | | 98.23% | | 60.15% |
Money Market & Other Investments | 9.94% | | -3.75% | | 13.69% | | 6.19% |
The LS Opportunity Fund seeks to generate long-term capital appreciation by investing in both long and short positions within a portfolio consisting of primarily publicly-traded common stock, with less net exposure than that of the stock market in general.
Availability of Portfolio Schedules (Unaudited)
The Fund files its complete schedule of portfolio holdings with the Securities and Exchange Commission (“SEC”) for the first and third quarters of each fiscal year as an exhibit to its reports on Form N-PORT. The Fund’s Form N-PORT reports are available on the SEC’s website at http://www.sec.gov.
11
LS Opportunity Fund
Schedule of Investments
May 31, 2020
Common Stocks - Long - Domestic — 65.94% | | Shares | | | Fair Value | |
Consumer Discretionary — 2.43% | | | | | | | | |
eBay, Inc.(a) | | | 21,550 | | | $ | 981,387 | |
Home Depot, Inc. (The) (a) | | | 4,130 | | | | 1,026,222 | |
| | | | | | | | 2,007,609 | |
Consumer Staples — 7.04% | | | | | | | | |
Church & Dwight Company, Inc.(a) | | | 20,200 | | | | 1,516,414 | |
Coca-Cola Company (The)(a) | | | 15,800 | | | | 737,544 | |
Colgate-Palmolive Company(a) | | | 12,850 | | | | 929,441 | |
J.M. Smucker Company (The)(a) | | | 5,650 | | | | 643,705 | |
Mondelez International, Inc., Class A(a) | | | 21,850 | | | | 1,138,822 | |
Procter & Gamble Company (The) | | | 7,350 | | | | 852,012 | |
| | | | | | | | 5,817,938 | |
Energy — 1.37% | | | | | | | | |
Devon Energy Corporation | | | 28,100 | | | | 303,761 | |
Parsley Energy, Inc., Class A | | | 39,650 | | | | 362,401 | |
Schlumberger Ltd. | | | 25,450 | | | | 470,062 | |
| | | | | | | | 1,136,224 | |
Financials — 31.19% | | | | | | | | |
Aflac, Inc.(a) | | | 53,450 | | | | 1,949,322 | |
Alleghany Corporation(b) | | | 820 | | | | 420,742 | |
Arthur J. Gallagher & Company(a) | | | 23,300 | | | | 2,196,724 | |
Berkshire Hathaway, Inc., Class B(a) (b) | | | 9,990 | | | | 1,853,943 | |
Brown & Brown, Inc.(a) | | | 59,550 | | | | 2,393,910 | |
Cboe Global Markets, Inc.(a) | | | 11,550 | | | | 1,229,613 | |
Globe Life, Inc.(a) | | | 19,700 | | | | 1,517,294 | |
Hanover Insurance Group, Inc. (The) | | | 11,600 | | | | 1,164,060 | |
IBERIABANK Corporation | | | 12,350 | | | | 523,764 | |
JPMorgan Chase & Company | | | 11,800 | | | | 1,148,258 | |
Marsh & McLennan Companies, Inc. | | | 8,250 | | | | 873,840 | |
Mercury General Corporation(a) | | | 18,650 | | | | 750,290 | |
PJT Partners, Inc., Class A(a) | | | 15,250 | | | | 834,023 | |
PNC Financial Services Group, Inc. (The)(a) | | | 20,560 | | | | 2,344,660 | |
Primerica, Inc.(a) | | | 9,450 | | | | 1,073,898 | |
Progressive Corporation (The)(a) | | | 24,650 | | | | 1,914,812 | |
Selective Insurance Group, Inc.(a) | | | 16,950 | | | | 889,028 | |
U.S. Bancorp(a) | | | 48,900 | | | | 1,738,884 | |
Voya Financial, Inc.(a) | | | 21,750 | | | | 979,838 | |
| | | | | | | | 25,796,903 | |
See accompanying notes which are an integral part of these financial statements.
12
LS Opportunity Fund
Schedule of Investments – continued
May 31, 2020
Common Stocks - Long - Domestic — 65.94% - continued | | Shares | | | Fair Value | |
Health Care — 5.79% | | | | | | | | |
Abbott Laboratories(a) | | | 11,100 | | | $ | 1,053,612 | |
Cigna Corporation | | | 5,240 | | | | 1,033,957 | |
Johnson & Johnson (a) | | | 6,850 | | | | 1,018,938 | |
Merck & Company, Inc. (a) | | | 20,850 | | | | 1,683,012 | |
| | | | | | | | 4,789,519 | |
Industrials — 3.91% | | | | | | | | |
Carrier Global Corporation(a) (b) | | | 7,410 | | | | 151,683 | |
Eaton Corporation plc(a) | | | 12,200 | | | | 1,035,780 | |
General Dynamics Corporation | | | 6,480 | | | | 951,458 | |
Otis Worldwide Corporation(a) | | | 7,880 | | | | 414,882 | |
Raytheon Technologies Corporation(a) | | | 10,510 | | | | 678,105 | |
| | | | | | | | 3,231,908 | |
Information Technology — 12.96% | | | | | | | | |
FLIR Systems, Inc.(a) | | | 20,850 | | | | 963,270 | |
Leidos Holdings, Inc.(a) | | | 14,550 | | | | 1,531,969 | |
Mastercard, Inc., Class A | | | 3,680 | | | | 1,107,275 | |
Maxim Integrated Products, Inc. | | | 17,250 | | | | 994,980 | |
Microsoft Corporation(a) | | | 8,280 | | | | 1,517,310 | |
Oracle Corporation(a) | | | 16,550 | | | | 889,894 | |
Paychex, Inc.(a) | | | 10,100 | | | | 730,028 | |
PayPal Holdings, Inc. (a) (b) | | | 6,710 | | | | 1,040,117 | |
Science Applications International Corporation(a) | | | 6,800 | | | | 598,672 | |
Visa, Inc., Class A | | | 5,520 | | | | 1,077,725 | |
Xilinx, Inc.(a) | | | 2,900 | | | | 266,655 | |
| | | | | | | | 10,717,895 | |
Materials — 0.77% | | | | | | | | |
Newmont Mining Corporation | | | 10,900 | | | | 637,323 | |
| | | | | | | | | |
Real Estate — 0.48% | | | | | | | | |
Howard Hughes Corporation (The)(b) | | | 7,820 | | | | 396,083 | |
TOTAL COMMON STOCKS - LONG - DOMESTIC (Cost $51,043,987) | | | 54,531,402 | |
See accompanying notes which are an integral part of these financial statements.
13
LS Opportunity Fund
Schedule of Investments – continued
May 31, 2020
Common Stocks - Long - International — 13.25% | | Shares | | | Fair Value | |
Consumer Staples — 3.10% | | | | | | | | |
Nestlé S.A. | | | 20,350 | | | $ | 2,197,381 | |
Swedish Match AB | | | 5,250 | | | | 364,007 | |
| | | | | | | | 2,561,388 | |
Energy — 0.82% | | | | | | | | |
Suncor Energy, Inc.(a) | | | 39,650 | | | | 678,808 | |
| | | | | | | | | |
Financials — 4.88% | | | | | | | | |
Lancashire Holdings Ltd. | | | 107,600 | | | | 902,756 | |
RenaissanceRe Holdings Ltd.(a) | | | 18,635 | | | | 3,128,071 | |
| | | | | | | | 4,030,827 | |
Health Care — 2.55% | | | | | | | | |
Medtronic plc(a) | | | 13,000 | | | | 1,281,540 | |
Roche Holding AG | | | 2,400 | | | | 830,150 | |
| | | | | | | | 2,111,690 | |
Industrials — 1.23% | | | | | | | | |
Pentair plc | | | 26,000 | | | | 1,017,640 | |
| | | | | | | | | |
Materials — 0.67% | | | | | | | | |
Agnico Eagle Mines Ltd.(a) | | | 8,700 | | | | 556,800 | |
TOTAL COMMON STOCKS - LONG - INTERNATIONAL (Cost $10,208,229) | | | 10,957,153 | |
| | | | | | | | | |
Money Market Funds — 9.94% | | | | | | | | |
Invesco Treasury Portfolio, Institutional Class, 0.08%(c) | | | 8,218,544 | | | | 8,218,544 | |
TOTAL MONEY MARKET FUNDS (Cost $8,218,544) | | | 8,218,544 | |
TOTAL INVESTMENTS — 89.13% (Cost $69,470,760) | | | 73,707,099 | |
Other Assets in Excess of Liabilities — 10.87% | | | 8,987,614 | |
NET ASSETS — 100.00% | | $ | 82,694,713 | |
(a) | All or a portion of the security is held as collateral for securities sold short. The fair value of this collateral on May 31, 2020, was $30,439,029. |
(b) | Non-income producing security. |
(c) | Rate disclosed is the seven day effective yield as of May 31, 2020. |
See accompanying notes which are an integral part of these financial statements.
14
LS Opportunity Fund
Schedule of Securities Sold Short
May 31, 2020
Common Stocks - Short - Domestic — (10.09)% | | Shares | | | Fair Value | |
Consumer Discretionary — (0.29)% | | | | | | | | |
Service Corporation International | | | (6,200 | ) | | $ | (244,466 | ) |
| | | | | | | | | |
Consumer Staples — (3.27)% | | | | | | | | |
Clorox Company (The) | | | (4,620 | ) | | | (952,875 | ) |
Constellation Brands, Inc., Class A | | | (1,370 | ) | | | (236,599 | ) |
Kimberly-Clark Corporation | | | (6,940 | ) | | | (981,594 | ) |
Lancaster Colony Corporation | | | (3,460 | ) | | | (530,972 | ) |
| | | | | | | | (2,702,040 | ) |
Financials — (5.09)% | | | | | | | | |
American International Group, Inc. | | | (26,500 | ) | | | (796,590 | ) |
Community Bank System, Inc. | | | (6,600 | ) | | | (392,172 | ) |
Everest Re Group Ltd. | | | (5,080 | ) | | | (1,007,923 | ) |
Horace Mann Educators Corporation | | | (20,100 | ) | | | (734,052 | ) |
Prudential Financial, Inc. | | | (14,450 | ) | | | (880,872 | ) |
Truist Financial Corporation | | | (10,750 | ) | | | (395,385 | ) |
| | | | | | | | (4,206,994 | ) |
Health Care — (1.44)% | | | | | | | | |
Boston Scientific Corporation(a) | | | (8,850 | ) | | | (336,212 | ) |
HCA Healthcare, Inc. | | | (1,980 | ) | | | (211,662 | ) |
Stryker Corporation | | | (3,270 | ) | | | (640,037 | ) |
| | | | | | | | (1,187,911 | ) |
TOTAL COMMON STOCKS - SHORT - DOMESTIC (Proceeds Received $9,588,083) | | | (8,341,411 | ) |
| | | | | | | | | |
Common Stocks - Short - International — (8.95)% | | | | | | | | |
Financials — (8.95)% | | | | | | | | |
Bank of Montreal | | | (10,650 | ) | | | (525,322 | ) |
Bank of Nova Scotia (The)(a) | | | (14,000 | ) | | | (560,931 | ) |
Canadian Imperial Bank of Commerce(a) | | | (13,050 | ) | | | (836,760 | ) |
Chubb Ltd. | | | (4,798 | ) | | | (585,068 | ) |
Comdirect Bank AG(a) | | | (4,100 | ) | | | (60,138 | ) |
Commonwealth Bank of Australia | | | (26,355 | ) | | | (1,119,640 | ) |
Muenchener Rueckversicherungs-Gesellschaft AG | | | (5,330 | ) | | | (1,209,939 | ) |
Swiss Re AG | | | (13,650 | ) | | | (924,144 | ) |
See accompanying notes which are an integral part of these financial statements.
15
LS Opportunity Fund
Schedule of Securities Sold Short – continued
May 31, 2020
Common Stocks - Short - International — (10.09)% - continued | | Shares | | | Fair Value | |
Financials — (8.95)% - continued | | | | | | | | |
Westpac Banking Corporation | | | (21,035 | ) | | $ | (241,385 | ) |
Willis Towers Watson plc | | | (6,590 | ) | | | (1,337,109 | ) |
TOTAL COMMON STOCKS - SHORT - INTERNATIONAL (Proceeds Received $8,029,390) | | | (7,400,436 | ) |
| | | | | | | | | |
Exchange-Traded Funds - Short — (3.75)% | | | | | | | | |
Energy Select Sector SPDR® Fund | | | (11,200 | ) | | | (434,112 | ) |
Invesco Dynamic Large Cap Value ETF | | | (10,250 | ) | | | (350,448 | ) |
iShares Russell 2000 ETF | | | (6,980 | ) | | | (969,521 | ) |
SPDR® S&P MIDCAP 400® ETF Trust | | | (2,790 | ) | | | (897,069 | ) |
SPDR® S&P 500® ETF Trust | | | (1,480 | ) | | | (450,394 | ) |
TOTAL EXCHANGE-TRADED FUNDS - SHORT (Proceeds Received $2,663,800) | | | (3,101,544 | ) |
TOTAL SECURITIES SOLD SHORT — (22.79)% (Proceeds Received $20,281,273) | | $ | (18,843,391 | ) |
(a) | Non-dividend expense producing security. |
ETF — Exchange-Traded Fund
SPDR — Standard & Poor’s Depositary Receipt
The sectors shown on the schedule of investments and schedule of securities sold short are based on the Global Industry Classification Standard, or GICS® (“GICS”). The GICS was developed by and/or is the exclusive property of MSCI, Inc. and Standard & Poor’s Financial Services LLC (“S&P”). GICS is a service mark of MSCI, Inc. and S&P and has been licensed for use by Ultimus Fund Solutions, LLC.
See accompanying notes which are an integral part of these financial statements.
16
LS Opportunity Fund
Statement of Assets and Liabilities
May 31, 2020
Assets | | | | |
Investments in securities, at fair value (cost $69,470,760) (Note 3) | | $ | 73,707,099 | |
Deposits at broker for securities sold short (Note 2) | | | 27,730,695 | |
Cash | | | 9,125 | |
Receivable for fund shares sold | | | 26,311 | |
Receivable for investments sold | | | 638,643 | |
Dividends and interest receivable | | | 88,252 | |
Tax reclaims receivable | | | 35,543 | |
Prepaid expenses | | | 16,217 | |
Total Assets | | | 102,251,885 | |
Liabilities | | | | |
Investments in securities sold short, at fair value (proceeds received $20,281,273) (Note 2) | | | 18,843,391 | |
Payable for fund shares redeemed | | | 102,757 | |
Payable for investments purchased | | | 420,090 | |
Dividend expense payable on short positions | | | 28,741 | |
Payable to Adviser (Note 4) | | | 114,795 | |
Payable to Administrator (Note 4) | | | 10,815 | |
Payable to trustees | | | 820 | |
Other accrued expenses | | | 35,763 | |
Total Liabilities | | | 19,557,172 | |
| | | | | |
Net Assets | | $ | 82,694,713 | |
| | | | | |
Net Assets consist of: | | | | |
Paid-in capital | | $ | 78,312,905 | |
Accumulated earnings | | | 4,381,808 | |
Net Assets | | $ | 82,694,713 | |
| | | | | |
Shares outstanding (unlimited number of shares authorized, no par value) | | | 5,912,262 | |
Net asset value, offering and redemption price per share (Note 2) | | $ | 13.99 | |
See accompanying notes which are an integral part of these financial statements.
17
LS Opportunity Fund
Statement of Operations
For the year ended May 31, 2020
Investment Income | | | | |
Dividend income (net of foreign taxes withheld of $11,434) | | $ | 1,636,065 | |
Interest income | | | 309,077 | |
Total investment income | | | 1,945,142 | |
Expenses | | | | |
Investment Adviser fees (Note 4) | | | 1,472,206 | |
Dividend expense on securities sold short (Note 2) | | | 733,534 | |
Administration fees (Note 4) | | | 62,622 | |
Fund accounting fees (Note 4) | | | 38,216 | |
Registration expenses | | | 29,466 | |
Legal fees | | | 24,055 | |
Audit and tax preparation expenses | | | 18,500 | |
Transfer agent fees (Note 4) | | | 18,000 | |
Custodian fees | | | 16,367 | |
Printing and postage expenses | | | 14,106 | |
Compliance services fees (Note 4) | | | 12,000 | |
Short sale & interest expense | | | 10,455 | |
Trustee expenses | | | 7,083 | |
Miscellaneous | | | 42,749 | |
Total expenses | | | 2,499,359 | |
Fees waived by Adviser (Note 4) | | | (116,628 | ) |
Net operating expenses | | | 2,382,731 | |
Net investment loss | | | (437,589 | ) |
Net Realized and Change in Unrealized Gain (Loss) on Investments | | | | |
Net realized gain (loss) on: | | | | |
Investment securities | | | (2,482,295 | ) |
Securities sold short | | | 2,403,717 | |
Foreign currency | | | (10,461 | ) |
Change in unrealized appreciation (depreciation) on: | | | | |
Investment securities | | | (3,000,337 | ) |
Securities sold short | | | 2,182,482 | |
Foreign currency translations | | | 2,206 | |
Net realized and change in unrealized loss on investments | | | (904,688 | ) |
Net decrease in net assets resulting from operations | | $ | (1,342,277 | ) |
See accompanying notes which are an integral part of these financial statements.
18
LS Opportunity Fund
Statements of Changes in Net Assets
| | | For the
Year Ended
May 31,
2020 | | | For the
Year Ended
May 31,
2019 | |
Increase (Decrease) in Net Assets due to: | | | | | | | | |
Operations | | | | | | | | |
Net investment loss | | $ | (437,589 | ) | | $ | (91,656 | ) |
Net realized gain (loss) on investment transactions | | | (89,039 | ) | | | 1,406,038 | |
Change in unrealized appreciation (depreciation) on investments | | | (815,649 | ) | | | 668,002 | |
Net increase (decrease) in net assets resulting from operations | | | (1,342,277 | ) | | | 1,982,384 | |
Distributions to Shareholders from Earnings (Note 2) | | | (1,066,252 | ) | | | (1,590,970 | ) |
Capital Transactions | | | | | | | | |
Proceeds from shares sold | | | 37,652,913 | | | | 35,089,641 | |
Reinvestment of distributions | | | 996,116 | | | | 1,461,700 | |
Amount paid for shares redeemed | | | (22,298,906 | ) | | | (18,147,526 | ) |
Net increase in net assets resulting from capital transactions | | | 16,350,123 | | | | 18,403,815 | |
Total Increase in Net Assets | | | 13,941,594 | | | | 18,795,229 | |
Net Assets | | | | | | | | |
Beginning of year | | | 68,753,119 | | | | 49,957,890 | |
End of year | | $ | 82,694,713 | | | $ | 68,753,119 | |
Share Transactions | | | | | | | | |
Shares sold | | | 2,592,658 | | | | 2,520,064 | |
Shares issued in reinvestment of distributions | | | 67,579 | | | | 109,327 | |
Shares redeemed | | | (1,632,887 | ) | | | (1,322,231 | ) |
Net increase in shares outstanding | | | 1,027,350 | | | | 1,307,160 | |
See accompanying notes which are an integral part of these financial statements.
19
LS Opportunity Fund
Financial Highlights
(For a share outstanding during each year)
| | | For the
Year Ended
May 31,
2020 | | | For the
Year Ended
May 31,
2019 | | | For the
Year Ended
May 31,
2018 | | | For the
Year Ended
May 31,
2017 | | | For the
Year Ended
May 31,
2016 | |
Selected Per Share Data: | | | | | | | | | | | | | | | | | | | | |
Net asset value, beginning of year | | $ | 14.07 | | | $ | 13.96 | | | $ | 13.44 | | | $ | 12.22 | | | $ | 12.55 | |
Investment operations: | | | | | | | | | | | | | | | | | | | | |
Net investment loss | | | (0.07 | ) | | | (0.01 | ) | | | (0.08 | ) | | | (0.09 | ) | | | (0.21 | ) |
Net realized and unrealized gain on investments | | | 0.17 | (a) | | | 0.47 | | | | 1.14 | | | | 1.31 | | | | 0.66 | |
Total from investment operations | | | 0.10 | | | | 0.46 | | | | 1.06 | | | | 1.22 | | | | 0.45 | |
Less distributions to shareholders from: | | | | | | | | | | | | | | | | | | | | |
Net realized gains | | | (0.18 | ) | | | (0.35 | ) | | | (0.54 | ) | | | — | | | | (0.78 | ) |
Paid in capital from redemption fees(b) | | | — | | | | — | | | | — | | | | — | (c) | | | — | (c) |
Net asset value, end of year | | $ | 13.99 | | | $ | 14.07 | | | $ | 13.96 | | | $ | 13.44 | | | $ | 12.22 | |
Total Return(d)(e) | | | 0.62 | % | | | 3.44 | % | | | 7.95 | % | | | 9.98 | % | | | 3.80 | % |
Ratios and Supplemental Data: | | | | | | | | | | | | | | | | | | | | |
Net assets, end of year (000 omitted) | | $ | 82,695 | | | $ | 68,753 | | | $ | 49,958 | | | $ | 37,616 | | | $ | 25,148 | |
Ratio of net expenses to average net assets(f) | | | 2.84 | % | | | 2.89 | % | | | 2.97 | % | | | 2.88 | % | | | 2.93 | % |
Ratio of expenses to average net assets before waiver and reimbursement(f) | | | 2.97 | % | | | 3.11 | % | | | 3.33 | % | | | 3.34 | % | | | 3.92 | % |
Ratio of net investment loss to average net assets | | | (0.52 | )% | | | (0.15 | )% | | | (0.82 | )% | | | (0.81 | )% | | | (1.11 | )% |
Portfolio turnover rate | | | 69.47 | % | | | 40.31 | % | | | 55.31 | % | | | 75.09 | % | | | 89.54 | % |
(a) | The amount shown for a share outstanding throughout the year does not accord with the change in aggregate gains and losses in the portfolio of securities during the year because of the timing of sales and purchases of fund shares in relation to fluctuating market values during the year. |
(b) | Prior to September 28, 2016, the Fund charged a 2.00% redemption fee for shares redeemed within 60 days of purchase. |
(c) | Rounds to less than $0.005 per share. |
(d) | Total return represents the rate that the investor would have earned or lost on an investment in the Fund, assuming reinvestment of distributions. |
(e) | Excludes redemption fee. |
(f) | Includes dividend and interest expense of 0.89%, 0.94%, 1.02%, 0.93% and 0.98% for the fiscal years ended May 31, 2020, 2019, 2018, 2017 and 2016, respectively. |
See accompanying notes which are an integral part of these financial statements.
20
LS Opportunity Fund
Notes to the Financial Statements
May 31, 2020
NOTE 1. ORGANIZATION
The LS Opportunity Fund (the “Fund”) is an open-end, diversified series of Valued Advisers Trust (the “Trust”). The Trust is a management investment company established under the laws of Delaware by an Agreement and Declaration of Trust dated June 13, 2008 (the “Trust Agreement”). The Trust Agreement permits the Board of Trustees (the “Board” or the “Trustees”) to issue an unlimited number of shares of beneficial interest of separate series without par value. The Fund is one of a series of funds authorized by the Board. The Fund’s investment adviser is Long Short Advisors, LLC (the “Adviser”). The Adviser has retained Prospector Partners, LLC (the “Sub-Adviser”) to serve as the sub-adviser to provide portfolio management and related services to the Fund. The Sub-Adviser receives a fee from the Adviser (not the Fund) for these services. The investment objective of the Fund is to generate long-term capital appreciation by investing in both long and short positions within a portfolio consisting of primarily publicly-traded common stock, with less net exposure than that of the stock market in general.
NOTE 2. SIGNIFICANT ACCOUNTING POLICIES
The Fund is an investment company and follows accounting and reporting guidance under Financial Accounting Standards Board Accounting Standards Codification (“ASC”) Topic 946, “Financial Services-Investment Companies.” The following is a summary of significant accounting policies followed by the Fund in the preparation of its financial statements. These policies are in conformity with generally accepted accounting principles in the United States of America (“GAAP”).
Estimates – The preparation of financial statements in conformity with GAAP requires management to make estimates and assumptions that affect the reported amounts of assets and liabilities and disclosure of contingent assets and liabilities at the date of the financial statements and the reported amounts of increases and decreases in net assets from operations during the reporting period. Actual results could differ from those estimates.
Federal Income Taxes – The Fund makes no provision for federal income or excise tax. The Fund has qualified and intends to qualify each year as a regulated investment company (“RIC”) under subchapter M of the Internal Revenue Code of 1986, as amended, by complying with the requirements applicable to RICs and by distributing substantially all of its taxable income. The Fund also intends to distribute sufficient net investment income and net realized capital gains, if any, so that it will not be subject to excise tax on undistributed income and gains. If the required amount of net investment income or gains is not distributed, the Fund could incur a tax expense.
As of and during the fiscal year ended May 31, 2020, the Fund did not have any liabilities for any unrecognized tax benefits. The Fund recognizes interest and penalties, if any, related to unrecognized tax benefits as income tax expense on the statement of operations when
21
LS Opportunity Fund
Notes to the Financial Statements – continued
May 31, 2020
NOTE 2. SIGNIFICANT ACCOUNTING POLICIES – continued
incurred. During the fiscal year ended May 31, 2020, the Fund did not incur any interest or penalties. Management of the Fund has reviewed tax positions taken in tax years that remain subject to examination by all major tax jurisdictions, including federal (i.e., the last three tax year ends and the interim tax period since then, as applicable). Management believes that there is no tax liability resulting from unrecognized tax benefits related to uncertain tax positions taken.
Expenses – Expenses incurred by the Trust that do not relate to a specific fund of the Trust are allocated to the individual funds based on each fund’s relative net assets or another appropriate basis (as determined by the Board).
Security Transactions and Related Income – The Fund follows industry practice and records security transactions on the trade date for financial reporting purposes. For financial statement and income tax purposes, the specific identification method is used for determining capital gains or losses. Dividend income and dividend expense are recorded on the ex-dividend date and interest income and expense is recorded on an accrual basis. Dividend income from real estate investment trusts (REITs) and distributions from limited partnerships are recognized on the ex-dividend date. The calendar year end classification of distributions received from REITs during the fiscal year are reported subsequent to year end; accordingly, the Fund estimates the character of REIT distributions based on the most recent information available. Income or loss from Limited Partnerships is reclassified among the components of net assets upon receipt of Schedules K-1(Form 1065). Non-cash income, if any, is recorded at the fair market value of the securities received. Withholding taxes on foreign dividends, if any, have been provided for in accordance with the Fund’s understanding of the applicable country’s tax rules and rates.
Foreign Currency Translation – Foreign currency amounts are translated into U.S. dollars as follows: (i) assets and liabilities at the rate of exchange at the end of the respective period; and (ii) purchases and sales of securities and income and expenses at the rate of exchange prevailing on the dates of such transactions. The portion of the results of operations arising from changes in the exchange rates and the portion due to fluctuations arising from changes in the market prices of securities are not isolated. Such fluctuations are included with the net realized and unrealized gain or loss on investments.
The Fund may enter into transactions to purchase or sell foreign currencies to protect the U.S. dollar value of its underlying portfolio securities against the effect of possible adverse movements in foreign exchange rates. Principal risks associated with such transactions include the movement in value of the foreign currency relative to the U.S. dollar and the ability of the counterparty to meet its obligations. Reported net realized foreign exchange gains or losses arise from sales of foreign currencies, currency gains or losses realized between the trade and settlement dates on securities transactions, and the difference between the amounts of dividends, interest, and foreign withholding taxes recorded on the company’s books and the
22
LS Opportunity Fund
Notes to the Financial Statements – continued
May 31, 2020
NOTE 2. SIGNIFICANT ACCOUNTING POLICIES – continued
U.S. dollar equivalent of the amounts actually received or paid. These instruments involve market risk, credit risk, or both in excess of the amount that would be recognized in the Statement of Assets and Liabilities. Risks arise from the possible inability of counterparties to meet the terms of their contracts and from movement in currency and securities values and interest rates.
Dividends and Distributions - The Fund intends to distribute its net investment income and net realized long-term and short-term capital gains, if any, at least annually. Dividends and distributions to shareholders, which are determined in accordance with income tax regulations, are recorded on the ex-dividend date. The treatment for financial reporting purposes of distributions made to shareholders during the period from net investment income or net realized capital gains may differ from their ultimate treatment for federal income tax purposes. These differences are caused primarily by differences in the timing of the recognition of certain components of income, expense or realized capital gain for federal income tax purposes. Where such differences are permanent in nature, they are reclassified among the components of net assets based on their ultimate characterization for federal income tax purposes. Any such reclassifications will have no effect on net assets, results of operations or net asset value (“NAV”) per share of the Fund.
For the fiscal year ended May 31, 2020, the Fund made the following reclassifications to increase (decrease) the components of net assets, which were due to operating losses:
| | Paid-In
Capital | | | Accumulated
Earnings
(Deficit) | |
| | $ | (144,791 | ) | | $ | 144,791 | |
Share Valuation – The NAV is calculated each day the New York Stock Exchange is open by dividing the total value of the Fund’s assets, less liabilities, by the number of shares outstanding for the Fund.
Short Sales – The Fund may make short sales as part of its overall portfolio management strategies or to offset a potential decline in value of a security. The Fund may engage in short sales with respect to various types of securities, including exchange-traded funds (ETFs). A short sale involves the sale of a security that is borrowed from a broker or other institution to complete the sale. The Fund may engage in short sales with respect to securities it owns, as well as securities that it does not own. Short sales expose the Fund to the risk that it will be required to acquire, convert or exchange securities to replace the borrowed securities (also known as “covering” the short position) at a time when the securities sold short have appreciated in value, thus resulting in a loss to the Fund. The amount of loss may exceed the proceeds received in a short sale. The Fund’s investment performance may also suffer if the
23
LS Opportunity Fund
Notes to the Financial Statements – continued
May 31, 2020
NOTE 2. SIGNIFICANT ACCOUNTING POLICIES – continued
Fund is required to close out a short position earlier than it had intended. The Fund must segregate assets determined to be liquid in accordance with procedures established by the Board, or otherwise cover its position in a permissible manner. The Fund will be required to pledge liquid assets to the broker in order to secure its performance on short sales. As a result, the assets pledged may not be available to meet the Fund’s needs for immediate cash or other liquidity. In addition, the Fund may be subject to expenses related to short sales that are not typically associated with investing in securities directly, such as costs of borrowing and margin account maintenance costs associated with the Fund’s open short positions. These types of short sales expenses are sometimes referred to as the “negative cost of carry,” and will reduce the Fund’s potential return on a short sale. The amount of restricted cash or cash equivalents held at the broker as collateral for securities sold short was $27,730,695 as of May 31, 2020.
Dividend expenses on securities sold short and borrowing costs are not covered under the Adviser’s expense limitation agreement with the Fund and, therefore, these expenses will be borne by the shareholders of the Fund.
Purchasing Call Options – The Fund may purchase call options. As the holder of a call option, the Fund has the right to purchase the underlying security at the exercise price at any time during the option period. The Fund may enter into closing sale transactions with respect to such options, exercise them or permit them to expire. The Fund may also purchase call options on relevant stock indexes. Call options may also be purchased by the Fund for the purpose of acquiring the underlying securities for its portfolio. Utilized in this fashion, the purchase of call options enables the Fund to acquire the securities at the exercise price of the call option plus the premium paid. At times the net cost of acquiring securities in this manner may be less than the cost of acquiring the securities directly. This technique may also be useful to the Fund in purchasing a large block of securities that would be more difficult to acquire by direct market purchases. So long as it holds such a call option rather than the underlying security itself, the Fund is partially protected from any unexpected decline in the market price of the underlying security and in such event could allow the call option to expire, incurring a loss only to the extent of the premium paid for the option.
Purchasing Put Options – The Fund may purchase put options. As the holder of a put option, the Fund has the right to sell the underlying security at the exercise price at any time during the option period. The Fund may enter into closing sale transactions with respect to such options, exercise them or permit them to expire. The Fund may purchase a put option on an owned underlying security (a “protective put”) as a defensive technique to protect against an anticipated decline in the value of the security. Such hedge protection is provided only during the life of the put option when the Fund, as the holder of the put option, is able to sell the underlying security at the put exercise price regardless of any decline in the underlying security’s market price. The Fund may also purchase put options at a time when it does not own the underlying security. By purchasing put options on a security it does not own, the
24
LS Opportunity Fund
Notes to the Financial Statements – continued
May 31, 2020
NOTE 2. SIGNIFICANT ACCOUNTING POLICIES – continued
Fund seeks to benefit from a decline in the market price of the underlying security. If the put option is not sold when it has remaining value, and if the market price of the underlying security remains equal to or greater than the exercise price during the life of the put option, the Fund will lose its entire premium paid for the put option. In order for the purchase of a put option to be profitable, the market price of the underlying security must decline sufficiently below the exercise price to cover the premium and transaction costs.
Writing Options – The Fund may write covered call options on equity securities that the Fund is eligible to purchase to extend a holding period to obtain long-term capital gain treatment, to earn premium income, to assure a definite price for a security it has considered selling, or to close out options previously purchased. The Fund may write covered call options if, immediately thereafter, not more than 30% of its net assets would be committed to such transactions. A call option gives the holder (buyer) the right to purchase a security at a specified price (the exercise price) at any time until a certain date (the expiration date). A call option is “covered” if the Fund owns the underlying security subject to the call option at all times during the option period. When the Fund writes a covered call option, it maintains a segregated account with its custodian, cash, or liquid portfolio securities in an amount not less than the exercise price at all times while the option is outstanding.
The Fund may write covered put options on equity securities and futures contracts that the Fund is eligible to purchase to earn premium income or to assure a definite price for a security if it is considering acquiring the security at a lower price than the current market price or to close out options previously purchased. The Fund may not write a put option if, immediately thereafter, more than 25% of its net assets would be committed to such transactions. A put option gives the holder of the option the right to sell, and the writer has the obligation to buy, the underlying security at the exercise price at any time during the option period. The operation of put options in other respects is substantially identical to that of call options. When the Fund writes a covered put option, it maintains in a segregated account with its custodian cash or liquid portfolio securities in an amount not less than the exercise price at all times while the put option is outstanding.
Foreign Currency Exchange Contracts – The Fund may engage in foreign currency exchange transactions. The value of the Fund’s portfolio securities that are invested in non-U.S. dollar denominated instruments as measured in U.S. dollars may be affected favorably or unfavorably by changes in foreign currency exchange rates, and the Fund may incur costs in connection with conversions between various currencies. The Fund will conduct its foreign currency exchange transactions either on a spot (i.e., cash) basis at the spot rate prevailing in the foreign currency exchange market or through forward foreign currency exchange contracts, to purchase or sell foreign currencies. A forward foreign currency exchange contract involves an obligation to purchase or sell a specific currency at a future date, which may be any fixed number of days from the date of the contract agreed upon by the parties, at a price set at
25
LS Opportunity Fund
Notes to the Financial Statements – continued
May 31, 2020
NOTE 2. SIGNIFICANT ACCOUNTING POLICIES – continued
the time of the contract. These contracts are traded directly between currency traders (usually large commercial banks) and their customers. The Fund will not, however, hold foreign currency except in connection with the purchase and sale of foreign portfolio securities. The Fund did not transact in forward foreign currency exchange contracts during the fiscal year ended May 31, 2020.
Derivative Transactions – The following table identifies the effect of derivative instruments on the Statement of Operations for the fiscal year ended May 31, 2020.
For the fiscal year ended May 31, 2020:
Derivatives | Location of Gain
(Loss) on Derivatives on
Statement of Operations | | Realized Gain
(Loss) on
Derivatives | | | Change in
Unrealized
Appreciation
(Depreciation) on
Derivatives | |
Equity Price Risk: | | | | | | | | | |
Options purchased | Net realized gain (loss) and change in unrealized appreciation (depreciation) on investment securities | | $ | 1,278 | | | $ | (1,058 | ) |
The Fund is not subject to a master netting arrangement and its policy is to not offset assets and liabilities related to its investment in derivatives.
The following summarizes the average ending monthly fair value of derivatives outstanding during the fiscal year ended May 31, 2020:
Derivatives | | Average Fair
Value | |
Options Purchased | | $ | 321 | |
NOTE 3. SECURITIES VALUATION AND FAIR VALUE MEASUREMENTS
Fair value is defined as the price that the Fund would receive upon selling an investment in a timely transaction to an independent buyer in the principal or most advantageous market of the investment. GAAP establishes a three-tier hierarchy to maximize the use of observable market data and minimize the use of unobservable inputs and to establish classification of fair value measurements for disclosure purposes.
Inputs refer broadly to the assumptions that market participants would use in pricing the asset or liability, including assumptions about risk (the risk inherent in a particular valuation technique used to measure fair value including a pricing model and/or the risk inherent in
26
LS Opportunity Fund
Notes to the Financial Statements – continued
May 31, 2020
NOTE 3. SECURITIES VALUATION AND FAIR VALUE MEASUREMENTS – continued
the inputs to the valuation technique). Inputs may be observable or unobservable. Observable inputs are inputs that reflect the assumptions market participants would use in pricing the asset or liability developed based on market data obtained and available from sources independent of the reporting entity. Unobservable inputs are inputs that reflect the reporting entity’s own assumptions about the assumptions market participants would use in pricing the asset or liability developed based on the best information available in the circumstances.
Various inputs are used in determining the value of the Fund’s investments. These inputs are summarized in the three broad levels listed below.
| | ● | Level 1 – unadjusted quoted prices in active markets for identical investments and/or registered investment companies where the value per share is determined and published and is the basis for current transactions for identical assets or liabilities at the valuation date |
| | ● | Level 2 – other significant observable inputs (including, but not limited to, quoted prices for an identical security in an inactive market, quoted prices for similar securities, interest rates, prepayment speeds, credit risk, etc.) |
| | ● | Level 3 – significant unobservable inputs (including the Fund’s own assumptions in determining fair value of investments based on the best information available) |
The inputs used to measure fair value may fall into different levels of the fair value hierarchy. In such cases, for disclosure purposes, the level in the fair value hierarchy which is reported, is determined based on the lowest level input that is significant to the fair value measurement in its entirety.
Equity securities that are traded on any stock exchange are generally valued at the last quoted sale price on the security’s primary exchange. Lacking a last sale price, an exchange-traded security is generally valued at its last bid price, except in the case of a security sold short, in which case the last ask price is utilized. Securities traded in the NASDAQ over-the-counter market are generally valued at the NASDAQ Official Closing Price. When using the market quotations and when the market is considered active, the security is classified as a Level 1 security. In the event that market quotations are not readily available or are considered unreliable due to market or other events, the Fund values its securities and other assets at fair value in accordance with policies established by and under the general supervision of the Board. Under these policies, the securities will be classified as Level 2 or 3 within the fair value hierarchy, depending on the inputs used.
Investments in mutual funds, including money market mutual funds, are generally priced at the ending NAV. These securities are categorized as Level 1 securities.
Option contracts in which the Fund invests are generally traded on an exchange. Exchange-traded options on securities and indexes purchased or sold by a Fund generally will be valued at
27
LS Opportunity Fund
Notes to the Financial Statements – continued
May 31, 2020
NOTE 3. SECURITIES VALUATION AND FAIR VALUE MEASUREMENTS – continued
the mean of the last bid and ask prices. If there is no such reported ask on the valuation date, options are valued at the most recent bid price. If there is no such reported bid on the valuation date, options are valued at the most recent ask price. If the Fund decides that a price provided by the pricing service does not accurately reflect the fair value of the securities, when prices are not readily available from a pricing service, or when restricted or illiquid securities are being valued, securities are valued at fair value as determined by the Adviser, in conformity with policies adopted by and subject to review by the Board. These securities will generally be categorized as Level 2 securities.
In accordance with the Trust’s valuation policies, the Adviser is required to consider all appropriate factors relevant to the value of securities for which it has determined other pricing sources are not available or reliable as described above. No single method exists for determining fair value, because fair value depends upon the circumstances of each individual case. As a general principle, the current fair value of a security being valued by the Adviser would be the amount that the Fund might reasonably expect to receive upon the current sale. Methods that are in accordance with this principle may, for example, be based on (i) a multiple of earnings; (ii) a discount from market prices of a similar freely traded security (including a derivative security or a basket of securities traded on other markets, exchanges or among dealers); or (iii) yield to maturity with respect to debt issues, or a combination of these and other methods. Fair-value pricing is permitted if, in the Adviser’s opinion, the validity of market quotations appears to be questionable based on factors such as evidence of a thin market in the security based on a small number of quotations, a significant event occurs after the close of a market but before the Fund’s NAV calculation that may affect a security’s value, or the Adviser is aware of any other data that calls into question the reliability of market quotations.
The following is a summary of the inputs used to value the Fund’s investments as of May 31, 2020:
| | | Valuation Inputs | |
Assets | | Level 1 | | | Level 2 | | | Level 3 | | | Total | |
Common Stocks Domestic (a) | | $ | 54,531,402 | | | $ | — | | | $ | — | | | $ | 54,531,402 | |
Common Stocks International (a) | | | 10,957,153 | | | | — | | | | — | | | | 10,957,153 | |
Money Market Funds | | | 8,218,544 | | | | — | | | | — | | | | 8,218,544 | |
Total | | $ | 73,707,099 | | | $ | — | | | $ | — | | | $ | 73,707,099 | |
(a) | Refer to Schedule of Investments for sector classifications. |
28
LS Opportunity Fund
Notes to the Financial Statements – continued
May 31, 2020
NOTE 3. SECURITIES VALUATION AND FAIR VALUE MEASUREMENTS – continued
| | | Valuation Inputs | |
Liabilities | | Level 1 | | | Level 2 | | | Level 3 | | | Total | |
Common Stocks Domestic (a) | | $ | (8,341,411 | ) | | $ | — | | | $ | — | | | $ | (8,341,411 | ) |
Common Stocks International (a) | | | (7,400,436 | ) | | | — | | | | — | | | | (7,400,436 | ) |
Exchange-Traded Funds | | | (3,101,544 | ) | | | — | | | | — | | | | (3,101,544 | ) |
Total | | $ | (18,843,391 | ) | | $ | — | | | $ | — | | | $ | (18,843,391 | ) |
(a) | Refer to Schedule of Securities Sold Short for sector classifications. |
The Fund did not hold any investments at the end of the reporting period for which significant unobservable inputs (Level 3) were used in determining fair value; therefore, no reconciliation of Level 3 securities is included for this reporting period.
NOTE 4. FEES AND OTHER TRANSACTIONS WITH AFFILIATES
The Adviser, under the terms of the management agreement, manages the Fund’s investments. As compensation for its management services, the Fund pays the Adviser a fee, computed and accrued daily and paid monthly, at an annual rate of 1.75% of the Fund’s average daily net assets. For the fiscal year ended May 31, 2020, the Adviser earned a fee of $1,472,206 from the Fund before the waivers described below. At May 31, 2020, the Adviser was owed $114,795 from the Fund for management services.
The Adviser has contractually agreed to waive its management fee and/or reimburse certain Fund operating expenses, but only to the extent necessary so that the Fund’s net expenses (excluding borrowing costs such as interest and dividends on securities sold short, taxes, brokerage commissions, other expenditures which are capitalized in accordance with generally accepted accounting principles, other extraordinary expenses not incurred in the ordinary course of the Fund’s business, expenses incurred under a Rule 12b-1 plan of distribution, “acquired fund fees and expenses” (i.e., investment companies in which the Fund may invest), and expenses that the Fund has incurred but did not actually pay because of an expense offset arrangement) do not exceed 1.95% of the average daily net assets of the Fund.
Each fee waiver or expense reimbursement by the Adviser is subject to repayment by the Fund within the three years following the date in which the fee waiver or expense reimbursement occurred, provided that the Fund is able to make the repayment without exceeding the expense limitation that is in effect at the time of the repayment, and the expense limitation that is in effect at the time of the fee waiver or expense reimbursement, whichever is lower. The contractual agreement is in effect through September 30, 2020. The expense cap may not be terminated prior to this date except by mutual consent of the Adviser and the Board.
29
LS Opportunity Fund
Notes to the Financial Statements – continued
May 31, 2020
NOTE 4. FEES AND OTHER TRANSACTIONS WITH AFFILIATES – continued
For the fiscal year ended May 31, 2020, the Adviser waived fees of $116,628. The amounts subject to repayment by the Fund, pursuant to the aforementioned conditions, are as follows:
Recoverable through | | Amount | |
May 31, 2021 | | $ | 137,869 | |
May 31, 2022 | | $ | 136,581 | |
May 31, 2023 | | $ | 116,628 | |
The Adviser has retained the Sub-Adviser to provide portfolio management and related services to the Fund. The Sub-Adviser receives a fee from the Adviser (not the Fund) for these services.
The Trust retains Ultimus Fund Solutions, LLC (“Ultimus” or the “Administrator”) to provide the Fund with administration, compliance (including a chief compliance officer), fund accounting and transfer agent services, including all regulatory reporting. For the fiscal year ended May 31, 2020, the Administrator earned fees of $62,622 for administration services, $12,000 for compliance services, $38,216 for fund accounting services and $18,000 for transfer agent services. At May 31, 2020, the Fund owed the Administrator $10,815 for such services.
The officers and one trustee of the Trust are members of management and/or employees of the Administrator. Ultimus Fund Distributors, LLC (the “Distributor”) acts as the distributor of the Fund’s shares. The Distributor is a wholly-owned subsidiary of the Administrator. There were no payments made to the Distributor by the Fund for the fiscal year ended May 31, 2020.
NOTE 5. PURCHASES AND SALES OF SECURITIES
For the fiscal year ended May 31, 2020, purchases and sales of investment securities, other than short-term investments, were $75,378,415 and $65,959,265, respectively.
There were no purchases or sales of long-term U.S. government obligations during the fiscal year ended May 31, 2020.
30
LS Opportunity Fund
Notes to the Financial Statements – continued
May 31, 2020
NOTE 6. FEDERAL TAX INFORMATION
At May 31, 2020, the net unrealized appreciation (depreciation) and tax cost of investments for tax purposes was as follows:
Gross unrealized appreciation | | $ | 9,894,837 | |
Gross unrealized depreciation | | | (4,584,885 | ) |
Net unrealized appreciation on investments | | $ | 5,309,952 | |
Tax cost of investments and securities sold short | | $ | 49,553,756 | |
The difference between book basis and tax basis unrealized appreciation is attributable primarily to the tax deferral of losses on wash sales and return of capital distributions from underlying investments.
The tax character of distributions paid for the fiscal years ended May 31, 2020 and May 31, 2019 were as follows:
| | | 2020 | | | 2019 | |
Distributions paid from:(a) | | | | | | | | |
Ordinary income | | $ | — | | | $ | — | |
Long-term capital gains | | | 1,066,252 | | | | 1,590,970 | |
Total distributions paid | | $ | 1,066,252 | | | $ | 1,590,970 | |
(a) | For federal income tax purposes, distributions of short-term capital gains are treated as ordinary income distributions. |
At May 31, 2020, the components of accumulated earnings (deficit) on a tax basis were as follows:
Accumulated capital and other losses | | $ | (929,690 | ) |
Unrealized appreciation on investments | | | 5,311,498 | |
Total accumulated earnings | | $ | 4,381,808 | |
Under current tax law, net investment losses after December 31 and capital losses realized after October 31 of the Fund’s fiscal year may be deferred and treated as occurring on the first business day of the following fiscal year for tax purposes. For the fiscal year ended May 31, 2020, the Fund deferred Post-October capital losses of $577,663. For the fiscal year ended May 31, 2020, the Fund deferred qualified late year ordinary losses of $347,057.
31
LS Opportunity Fund
Notes to the Financial Statements – continued
May 31, 2020
NOTE 7. CORONAVIRUS (COVID-19) PANDEMIC
The COVID-19 pandemic has caused financial markets to experience periods of increased volatility due to uncertainty that exists around its long-term effects. COVID-19 has resulted in varying levels of travel restrictions, quarantines, disruptions to supply chains and customer activity, leading to general concern and economic uncertainty. The full impact and duration of the pandemic cannot necessarily be foreseen. Management continues to monitor developments and navigate accordingly, further evaluating the anticipated impact to financial markets.
NOTE 8. COMMITMENTS AND CONTINGENCIES
The Trust indemnifies its officers and Trustees for certain liabilities that may arise from their performance of their duties to the Trust or the Fund. Additionally, in the normal course of business, the Trust enters into contracts that contain a variety of representations and warranties which provide general indemnifications. The Trust’s maximum exposure under these arrangements is unknown, as this would involve future claims that may be made against the Trust that have not yet occurred.
NOTE 9. SUBSEQUENT EVENTS
Management of the Fund has evaluated the need for disclosures and/or adjustments resulting from subsequent events through the date at which these financial statements were issued. Based upon this evaluation, management has determined there were no items requiring adjustment of the financial statements or additional disclosure.
32
Report of Independent Registered Public Accounting Firm
To the Shareholders of LS Opportunity Fund and
Board of Trustees of Valued Advisers Trust
Opinion on the Financial Statements
We have audited the accompanying statement of assets and liabilities, including the schedules of investments and securities sold short, of LS Opportunity Fund (the “Fund”), a series of Valued Advisers Trust, as of May 31, 2020, the related statement of operations for the year then ended, the statements of changes in net assets for each of the two years in the period then ended, including the related notes, and the financial highlights for each of the five years in the period then ended (collectively referred to as the “financial statements”). In our opinion, the financial statements present fairly, in all material respects, the financial position of the Fund as of May 31, 2020, the results of its operations for the year then ended, the changes in its net assets for each of the two years in the period then ended, and the financial highlights for each of the five years in the period then ended, in conformity with accounting principles generally accepted in the United States of America.
Basis for Opinion
These financial statements are the responsibility of the Fund’s management. Our responsibility is to express an opinion on the Fund’s financial statements based on our audits. We are a public accounting firm registered with the Public Company Accounting Oversight Board (United States) (“PCAOB”) and are required to be independent with respect to the Fund in accordance with the U.S. federal securities laws and the applicable rules and regulations of the Securities and Exchange Commission and the PCAOB.
We conducted our audits in accordance with the standards of the PCAOB. Those standards require that we plan and perform the audit to obtain reasonable assurance about whether the financial statements are free of material misstatement whether due to error or fraud.
Our audits included performing procedures to assess the risks of material misstatement of the financial statements, whether due to error or fraud, and performing procedures that respond to those risks. Such procedures included examining, on a test basis, evidence regarding the amounts and disclosures in the financial statements. Our procedures included confirmation of securities owned as of May 31, 2020, by correspondence with the custodian and brokers or by other appropriate auditing procedures where replies from brokers or counterparties were not received. Our audits also included evaluating the accounting principles used and significant estimates made by management, as well as evaluating the overall presentation of the financial statements. We believe that our audits provide a reasonable basis for our opinion.
We have served as the Fund’s auditor since 2011.
COHEN & COMPANY, LTD.
Cleveland, Ohio
July 28, 2020
33
Summary of Fund Expenses (Unaudited)
As a shareholder of the Fund, you incur two types of costs: (1) transaction and (2) ongoing costs, including management fees and other Fund expenses. These examples are intended to help you understand your ongoing costs (in dollars) of investing in the Fund and to compare these costs with the ongoing costs of investing in other mutual funds. The example is based on an investment of $1,000 invested at the beginning of the period and held for the entire period from December 1, 2019 through May 31, 2020.
Actual Expenses
The first line of the table below provides information about actual account values and actual expenses. You may use the information in this line, together with the amount you invested, to estimate the expenses that you paid over the period. Simply divide your account value by $1,000 (for example, an $8,600 account value divided by $1,000 = 8.6), then multiply the result by the number in the first line under the heading entitled “Expenses Paid During Period” to estimate the expenses you paid on your account during this period.
Hypothetical Example for Comparison Purposes
The second line of the table below provides information about hypothetical account values and hypothetical expenses based on the Fund’s actual expense ratio and an assumed rate of return of 5% per year before expenses, which is not the Fund’s actual return. The hypothetical account values and expenses may not be used to estimate the actual ending account balance or expenses you paid for the period. You may use this information to compare the ongoing costs of investing in the Fund and other funds. To do so, compare this 5% hypothetical example with the 5% hypothetical examples that appear in the shareholder reports of the other funds.
Expenses shown in the table are meant to highlight your ongoing costs only and do not reflect any transactional costs. Therefore, the second line of the table below is useful in comparing ongoing costs only and will not help you determine the relative costs of owning different funds. In addition, if transaction costs were included, your costs would have been higher.
| Beginning
Account Value
December 1,
2019 | Ending
Account Value
May 31, 2020 | Expenses Paid
During Period(a) | Annualized
Expense Ratio |
Actual | $ 1,000.00 | $ 950.80 | $ 14.39 | 2.95% |
Hypothetical(b) | $ 1,000.00 | $ 1,010.25 | $ 14.83 | 2.95% |
(a) | Expenses are equal to the Fund’s annualized expense ratio, multiplied by the average account value over the period, multiplied by 183/366 (to reflect the one-half year period). |
(b) | Hypothetical assumes 5% annual return before expenses. |
34
Additional Federal Income Tax Information (Unaudited)
The Form 1099-DIV you receive in January 2021 will show the tax status of all distributions paid to your account in calendar year 2020. Shareholders are advised to consult their own tax adviser with respect to the tax consequences of their investment in the Fund. As required by the Internal Revenue Code and/or regulations, shareholders must be notified regarding the status of qualified dividend income for individuals and the dividends received deduction for corporations.
Qualified Dividend Income. The Fund designates approximately 0% or up to the maximum amount of such dividends allowable pursuant to the Internal Revenue Code, as qualified dividend income eligible for a reduced tax rate.
Qualified Business Income. The Fund designates approximately 0% of its ordinary income dividends, or up to the maximum amount of such dividends allowable pursuant to the Internal Revenue Code, as qualified business income.
Dividends Received Deduction. Corporate shareholders are generally entitled to take the dividends received deduction on the portion of the Fund’s dividend distribution that qualifies under tax law. For the Fund’s calendar year 2020 ordinary income dividends, 0% qualifies for the corporate dividends received deduction.
For the year ended May 31, 2020, the Fund designated $1,066,252 as long-term capital gain distributions.
35
Investment Advisory Agreement Renewal Approval (Unaudited)
At a meeting held on March 4, 2020, the Board of Trustees (the “Board”) considered the renewal of the Investment Advisory Agreement (the “LSA Agreement”) between Valued Advisers Trust (the “Trust”) and Long Short Advisors, LLC (“LSA”) with respect to the LS Opportunity Fund (the “LS Fund”). LSA provided written information to the Board to assist the Board in its considerations.
Counsel reminded the Trustees of their fiduciary duties and responsibilities as summarized in a memorandum from his firm, including the factors to be considered, and the application of those factors to LSA and the LSA Agreement. In assessing the factors and reaching its decision, the Board took into consideration information furnished by LSA and the Trust’s other service providers for the Board’s review and consideration throughout the year, as well as information specifically prepared or presented in connection with the renewal process, including: (i) reports regarding the services and support provided to the LS Fund by LSA; (ii) quarterly assessments of the investment performance of the LS Fund; (iii) commentary on the reasons for the performance; (iv) presentations by LSA addressing its investment philosophy, investment strategy, personnel, and operations of LSA; (v) compliance and audit reports concerning the LS Fund and LSA; (vi) disclosure information contained in the registration statement of the Trust for the LS Fund and LSA’s Form ADV; (vii) information relating to the manner in which LSA oversees Prospector Partners, LLC, the LS Fund’s sub-adviser; and (viii) a memorandum from counsel, that summarized the fiduciary duties and responsibilities of the Board in reviewing and approving the LSA Agreement. The Board also requested and received various informational materials including, without limitation: (a) documents containing information about LSA, including its financial information; a description of its personnel and the services it provides to the LS Fund; information on LSA’s investment advice and performance; summaries of the LS Fund’s expenses, compliance program, current legal matters, and other general information; (b) comparative expense and performance information for other mutual funds with strategies similar to the LS Fund; and (c) the benefits to be realized by LSA from its relationship with the LS Fund. The Board did not identify any particular information that was most relevant to its consideration to approve the LSA Agreement and each Trustee may have afforded different weight to the various factors.
1. | The nature, extent, and quality of the services to be provided by LSA. In this regard, the Board considered LSA’s responsibilities under the LSA Agreement. The Trustees considered the services being provided by LSA to the LS Fund including its process for overseeing the sub-adviser’s portfolio management of the LS Fund, assuring compliance with the LS Fund’s investment objectives and limitations, its coordination of services for the LS Fund among the LS Fund’s service providers, and its efforts to promote the LS Fund and grow its assets. The Trustees reviewed the steps LSA takes to oversee and supervise the sub-adviser, as described in the materials provided by LSA. The Trustees considered LSA’s continuity of, and commitment to retain, qualified personnel and LSA’s commitment to maintain and enhance its resources and systems. The Trustees considered LSA’s personnel, including the education and experience of LSA’s personnel. After considering the foregoing information and further information in the Meeting materials provided by LSA (including LSA’s Form ADV), the Board concluded that, in light of all |
36
Investment Advisory Agreement Renewal Approval (Unaudited) – continued
the facts and circumstances, the nature, extent and quality of the services provided by LSA were satisfactory and adequate for the LS Fund.
2. | Investment performance of the LS Fund and LSA. In considering the investment performance of the LS Fund, the Trustees noted that LSA did not manage any accounts directly and that it had delegated the portfolio management responsibilities of the LS Fund to a sub-adviser. Accordingly, the Trustees concluded that their consideration of this factor for LSA was less relevant in their determination of LSA’s performance of its duties than other factors. The Trustees considered the consistency of LSA’s management oversight of the LS Fund’s sub-adviser with the LS Fund’s investment objective, strategies, and limitations. The Trustees also compared the performance of the LS Fund with the performance of its Morningstar category. The Trustees noted that the LS Fund’s performance was above the average and median of its Morningstar category for the one-month, one-year, 3-year, 5-year and since inception periods ended December 31, 2019, and the LS Fund’s performance for the 3-month period was below that of the average but above the median. As compared to its custom peer group, the Trustees observed that the performance of the LS Fund was above the average and median for the one-month, one-year, 3-year, 5-year and since inception periods ended December 31, 2019, and below the average and median for the 3-month period. After reviewing and discussing the investment performance of the LS Fund further, LSA’s experience in overseeing the sub-adviser to the LS Fund, the LS Fund’s historical performance, and other relevant factors, the Board concluded, in light of all the facts and circumstances, that the investment performance, and LSA’s oversight of the sub-adviser to the LS Fund was satisfactory. |
3. | The costs of the services to be provided and profits to be realized by LSA from its relationship with the LS Fund. In considering the costs of services to be provided and the profits to be realized by LSA from its relationship with the LS Fund, the Trustees considered: (1) LSA’s financial condition; (2) asset levels of the LS Fund; (3) the overall expenses of the LS Fund; and (4) the nature and frequency of advisory fee payments. The Trustees reviewed information provided by LSA regarding its profits associated with managing the LS Fund. The Trustees also considered potential benefits for LSA in managing the LS Fund. The Trustees then compared the fees and expenses of the LS Fund (including the management fee) to other comparable mutual funds. The Trustees noted that the LS Fund’s management fee and next expense ratio were higher than the average and median of its Morningstar category, and higher than the average and median of its peer group. In this regard, the Trustees reflected upon their discussion with representatives of LSA earlier in the Meeting, and commented on LSA’s assertion that the firm provided a premium product in comparison to other products to which they were compared in the marketplace. The Board concluded that the fees to be paid to LSA by the LS Fund and the profits to be realized by LSA, in light of all the facts and circumstances, were fair and reasonable in relation to the nature and quality of the services provided by LSA. |
4. | The extent to which economies of scale would be realized as the LS Fund grows and whether advisory fee levels reflect these economies of scale for the benefit of the LS Fund’s investors. In this regard, the Board considered the LS Fund’s fee arrangements with LSA. |
37
Investment Advisory Agreement Renewal Approval (Unaudited) – continued
The Board considered that while the management fee remained the same at all asset levels, the LS Fund’s shareholders had experienced benefits from the expense limitation arrangement. The Trustees noted that once the LS Fund’s expenses fell below the cap set by the arrangement, the shareholders would continue to benefit from the economies of scale under the LS Fund’s agreements with service providers other than LSA. In light of its ongoing consideration of the LS Fund’s asset levels, expectations for growth in the LS Fund, and fee levels, the Board determined that the LS Fund’s fee arrangements, in light of all the facts and circumstances, were fair and reasonable in relation to the nature and quality of the services provided by LSA.
5. | Possible conflicts of interest and benefits to LSA. In considering LSA’s practices regarding conflicts of interest, the Trustees evaluated the potential for conflicts of interest and considered such matters as the experience and ability of the advisory personnel assigned to the LS Fund; and the substance and administration of LSA’s code of ethics. The Trustees also considered disclosure in the registration statement of the Trust relating to LSA’s potential conflicts of interest. The Trustees noted that LSA identified no other potential benefits (in addition to the management fee) to LSA. Based on the foregoing, the Board determined that LSA’s standards and practices relating to the identification and mitigation of potential conflicts of interest and the benefits to be realized by LSA in managing the LS Fund were satisfactory. |
After additional consideration of the factors delineated in the memorandum provided by counsel and further discussion among the Board members, the Board determined to approve the continuation of the LSA Agreement between the Trust and LSA.
Investment Sub-Advisory Agreement Renewal Approval (Unaudited)
At a meeting held on March 4, 2020, the Board of Trustees (the “Board”) considered the renewal of the Investment Sub-Advisory Agreement (the “Prospector Agreement”) between Long Short Advisors, LLC (“LSA”) and Prospector Partners, LLC (“Prospector”) with respect to the LS Opportunity Fund (the “LS Fund”). Prospector provided written information to the Board to assist the Board in its considerations.
Counsel reminded the Trustees of their fiduciary duties and responsibilities as summarized in a memorandum from his firm, including the factors to be considered, and the application of those factors to Prospector and the Prospector Agreement. In assessing the factors and reaching its decision, the Board took into consideration information furnished by Prospector and the Trust’s other service providers for the Board’s review and consideration throughout the year, as well as information specifically prepared or presented in connection with the renewal process, including: (i) reports regarding the services and support provided to the LS Fund by Prospector; (ii) quarterly assessments of the investment performance of the LS Fund; (iii) commentary on the reasons for the performance; (iv) compliance and audit reports concerning the LS Fund and Prospector; (v) disclosure information contained in the registration statement of the Trust for the LS Fund and Prospector’s Form ADV; (vi) a memorandum from counsel, that summarized the fiduciary duties and responsibilities of
38
Investment Sub-Advisory Agreement Renewal Approval (Unaudited) – continued
the Board in reviewing and approving the Prospector Agreement. The Board also requested and received various informational materials including, without limitation: (a) documents containing information about Prospector, including its financial information; a description of its personnel and the services it provides to the LS Fund; information on Prospector’s investment advice and performance; summaries of the LS Fund’s expenses, compliance program, current legal matters, and other general information; (b) comparative expense and performance information for other mutual funds with strategies similar to the LS Fund; and (c) the benefits to be realized by Prospector from its relationship with the LS Fund. The Board did not identify any particular information that was most relevant to its consideration to approve the Prospector Agreement and each Trustee may have afforded different weight to the various factors.
1. | The nature, extent, and quality of the services to be provided by Prospector. In this regard, the Board considered Prospector’s responsibilities under the Prospector Agreement. The Board considered the services being provided by Prospector to the LS Fund, including without limitation: the quality of its investment sub-advisory services (including research and recommendations with respect to portfolio securities), and its process for formulating investment recommendations and assuring compliance with the LS Fund’s investment objectives and limitations. The Board considered Prospector’s continuity of, and commitment to retain, qualified personnel and Prospector’s commitment to maintain its resources and systems. The Board considered Prospector’s personnel, including the education and experience of the personnel and Prospector’s compliance program, policies and procedures. The Board considered the arrangements between LSA and Prospector pursuant to which Prospector has an on-going arrangement with respect to the Fund in which it would agree to waive, to a degree, a portion of its sub-advisory fees and commit to an exclusivity arrangement between itself and LSA with respect to managing other mutual funds with similar objectives. After considering the foregoing information and further information in the Meeting materials provided by Prospector (including its Form ADV), the Board concluded that, in light of all the facts and circumstances, the nature, extent, and quality of the services provided by Prospector were satisfactory and adequate for the LS Fund. |
2. | Investment Performance of the LS Fund and Prospector. In considering the investment performance of the LS Fund and Prospector, the Trustees considered the consistency of Prospector’s management of the LS Fund with the LS Fund’s investment objective, strategies, and limitations. The Trustees also compared the performance of the LS Fund with the performance of its Morningstar category. The Trustees focused on the performance since Prospector assumed its role as sub-adviser on May 28, 2015. They noted that the LS Fund’s performance was above the average and median of its Morningstar category for the one-month, one-year and 3-year periods ended December 31, 2019, and below the average but above the median for the 3-month period. As compared to its custom peer group, the Trustees observed that the performance of the LS Fund was above the average and median for the one-month, one-year, and 3-year periods ended December 31, 2019, and below the average and median for the 3-month period. The Trustees also observed that the LS Fund had outperformed equal to its style- |
39
Investment Sub-Advisory Agreement Renewal Approval (Unaudited) – continued
specific benchmark for the one-month period and had outperformed the benchmark for the 3-month, one-year, and 3-year periods ended December 31, 2019. They also noted that the LS Fund had outperformed the style-specific benchmark for the period since Prospector began managing the portfolio. With respect to its broad-based benchmark, the Trustees noted that the LS Fund had underperformed for all periods considered. After reviewing and discussing the investment performance of the LS Fund further, Prospector’s experience sub-advising the LS Fund, the LS Fund’s performance since Prospector began managing the portfolio, and other relevant factors, the Board concluded, in light of all the facts and circumstances, that the investment performance of the LS Fund and Prospector was satisfactory.
3. | The costs of the services to be provided and profits to be realized by Prospector from the relationship with the LS Fund. In this regard, the Board considered: (1) Prospector’s financial condition; (2) asset levels of the LS Fund; (3) the overall expenses of the LS Fund; and (4) the nature and frequency of sub-advisory fee payments. The Trustees reviewed information provided by Prospector regarding its profits associated with managing the LS Fund. The Board also considered potential benefits for Prospector in managing the Fund. The Board compared the fees and expenses of the Fund (including the sub-advisory fee) to other private fund accounts managed by Prospector, and determined that the fee arrangements were relatively comparable in light of the differing structures. Following this comparison and upon further consideration and discussion of the foregoing, the Board concluded that the fees to be paid to Prospector by LSA and the profits to be realized by Prospector, in light of all the facts and circumstances, were fair and reasonable in relation to the nature and quality of the services provided by Prospector. |
4. | The extent to which economies of scale would be realized as the Fund grows and whether advisory fee levels reflect these economies of scale for the benefit of the LS Fund’s investors. In this regard, the Board considered the Fund’s fee arrangements with Prospector. The Board considered that while the sub-advisory fee changed with changes in the Fund’s assets, the Fund’s shareholders did not realize any changes in their overall expenses as Prospector’s fee was paid entirely from the advisory fee paid to LSA, which was fixed. The Board considered the sub-advisory fees in light of the overall arrangement with the Fund’s investment adviser. In light of the foregoing, the Board determined that the LS Fund’s fee arrangements for Prospector, in light of all the facts and circumstances, were fair and reasonable in relation to the nature and quality of the services provided by Prospector. |
5. | Possible conflicts of interest and benefits to Prospector. In evaluating Prospector’s practices regarding conflicts of interest, the Trustees evaluated the potential for conflicts of interest and considered such matters as the experience and ability of the advisory personnel assigned to the LS Fund; the basis of decisions to buy or sell securities for the LS Fund and/or Prospector’s other accounts; the substance and administration of Prospector’s code of ethics and other relevant policies described in Prospector’s Form ADV, and affiliations and associations of Prospector and its principals. The Board concluded that the foregoing matters were appropriately disclosed and managed by Prospector. With respect to benefits to Prospector (in addition to the fees under the Prospector Agreement), the Board noted |
40
Investment Sub-Advisory Agreement Renewal Approval (Unaudited) – continued
that Prospector would benefit from its relationship with the LS Fund as the LS Fund would provide a more diversified investor base and an alternative vehicle in which to place clients with initial investments below the minimum for its private funds. Following further consideration and discussion, the Board determined that Prospector’s standards and practices relating to the identification and mitigation of potential conflicts of interest were satisfactory and the benefits to be realized by Prospector from managing the LS Fund were satisfactory.
After additional consideration of the factors delineated in the memorandum provided by counsel and further discussion among the Board members, the Board determined to approve the continuation of the Prospector Agreement between LSA and Prospector.
41
Trustees and Officers (Unaudited)
The Board of Trustees supervises the business activities of the Trust. Each Trustee serves as a trustee until termination of the Trust unless the Trustee dies, resigns, retires or is removed.
The following table provides information regarding each of the Independent Trustees.
Name, Address*, (Age),
Position with Trust**,
Term of Position with Trust | | Principal Occupation During Past 5 Years
and Other Directorships | | Other Directorships |
Andrea N. Mullins, (53) Independent Trustee
Since December 2013 Chairperson
since March 2017 | | Current: Private investor; Independent Contractor, SWM Advisors (since April 2014). | | Trustee, Angel Oak Funds Trust (since February 2019) (4 portfolios); Trustee, Angel Oak Strategic Credit Fund (since February 2019); Trustee, Angel Oak Financial Strategies Income Term Trust (since May 2019); Trustee, Angel Oak Dynamic Financial Strategies Income Term Trust (since 2019). |
Ira P. Cohen, (61) Independent Trustee
Since June 2010 | | Current: Independent financial services consultant (since February 2005); Executive Vice President of Asset Management Services, Recognos Financial (since August 2015). | | Trustee and Audit Committee Chairman, Griffin Institutional Access Credit Fund (since January 2017); Trustee and Audit Committee Chairman, Griffin Institutional Real Estate Access Fund (since May 2014); Trustee, Angel Oak Funds Trust (since October 2014) (4 portfolios); Trustee, Chairman, and Nominating and Governance Committee Chairman, Angel Oak Strategic Credit Fund (since December 2017); Trustee and Chairman, Angel Oak Financial Strategies Income Term Trust (since May 2019); Trustee, Angel Oak Dynamic Financial Strategies Income Term Trust (since 2019). |
* | The address for each Trustee is 225 Pictoria Drive, Suite 450, Cincinnati, Ohio 45246. |
** | As of the date of this report, the Trust consists of 12 series. |
42
The following table provides information regarding the Trustee who is considered an “interested person” of the Trust, as that term is defined under the 1940 Act. Based on the experience of the Trustee, the Trust concluded that the individual described below should serve as a Trustee.
Name, Address*, (Age),
Position with Trust**,
Term of Position with Trust | | Principal Occupation During Past 5 Years and Other Directorships | | Other Directorships |
Mark J. Seger***, (58)
Trustee
Since March 2017 | | Current: Vice Chairman and Co-Founder, Ultimus Fund Solutions, LLC and its subsidiaries (since 1999). | | None. |
* | The address for each Trustee is 225 Pictoria Drive, Suite 450, Cincinnati, Ohio 45246. |
** | As of the date of this report, the Trust consists of 12 series. |
*** | Mr. Seger is considered an “interested person” of the Trust because of his relationship with the Trust’s administrator, transfer agent, and distributor. |
The following table provides information regarding the Officers of the Trust:
Name, Address*, (Age),
Position with Trust**,
Term of Position with Trust | | Principal Occupation During Past 5 Years | | Other Directorships |
Adam T. Kornegay, (35) Principal Executive Officer and President
Since April 2018 | | Current: Vice President, Business Development Director, Ultimus Fund Solutions, LLC (since March 2015). | | None. |
Gregory T. Knoth, (50) Principal Financial Officer and Treasurer
Since April 2019 | | Current: Vice President, Mutual Fund Controller, Ultimus Fund Solutions, LLC (since January 2016). Previous: Vice President and Manager of Fund Accounting, Huntington Asset Services, Inc. (n/k/a Ultimus Asset Services, LLC) (June 2013 to December 2015). | | None. |
Kevin J. Patton, (50)
Chief Compliance Officer
Since March 2020 | | Current: Assistant Vice President, Compliance Officer, Ultimus Fund Solutions, LLC (since January 2020) Previous: Partner and Chief Compliance Officer, Renaissance Investment Management (August 2005 to January 2020). | | None. |
43
Name, Address*, (Age),
Position with Trust**,
Term of Position with Trust | | Principal Occupation During Past 5 Years | | Other Directorships |
Carol J. Highsmith, (55)
Vice President
Since August 2008 Secretary
Since March 2014 | | Current: Vice President, Ultimus Fund Solutions, LLC (since December 2015). Previous: Employed in various positions with Huntington Asset Services, Inc. (n/k/a Ultimus Asset Services, LLC) (November 1994 to December 2015), most recently Vice President of Legal Administration (2005 to December 2015). | | None. |
* | The address for each Trustee is 225 Pictoria Drive, Suite 450, Cincinnati, Ohio 45246. |
** | As of the date of this report, the Trust consists of 12 series. |
44
FACTS | WHAT DOES LS OPPORTUNITY FUND (THE “FUND”) DO WITH YOUR PERSONAL INFORMATION? |
| | |
Why? | Financial companies choose how they share your personal information. Federal law gives consumers the right to limit some but not all sharing. Federal law also requires us to tell you how we collect, share, and protect your personal information. Please read this notice carefully to understand what we do. |
| | |
What? | The types of personal information we collect and share depend on the product or service you have with us. This information can include: ■ Social Security number ■ account balances and account transactions ■ transaction or loss history and purchase history ■ checking account information and wire transfer instructions When you are no longer our customer, we continue to share your information as described in this notice. |
| | |
How? | All financial companies need to share customers’ personal information to run their everyday business. In the section below, we list the reasons financial companies can share their customers’ personal information; the reasons the Fund chooses to share; and whether you can limit this sharing. |
| | |
Reasons we can share your personal information | Does the Fund share? |
For our everyday business purposes —
such as to process your transactions, maintain your account(s), respond to court orders and legal investigations, or report to credit bureaus | Yes |
For our marketing purposes —
to offer our products and services to you | No |
For joint marketing with other financial companies | No |
For our affiliates’ everyday business purposes –
information about your transactions and experiences | No |
For our affiliates’ everyday business purposes –
information about your creditworthiness | No |
For nonaffiliates to market to you | No |
| | |
Questions? | Call (877) 336-6763 |
45
Who we are |
Who is providing this notice? | LS Opportunity Fund
Ultimus Fund Distributors, LLC (Distributor)
Ultimus Fund Solutions, LLC (Administrator) |
What we do |
How does the Fund protect my personal information? | To protect your personal information from unauthorized access and use, we use security measures that comply with federal law. These measures include computer safeguards and secured files and buildings. Our service providers are held accountable for adhering to strict policies and procedures to prevent any misuse of your nonpublic personal information. |
How does the Fund collect my personal information? | We collect your personal information, for example, when you ■ open an account or deposit money ■ buy securities from us or sell securities to us ■ make deposits or withdrawals from your account ■ give us your account information ■ make a wire transfer ■ tell us who receives the money ■ tell us where to send the money ■ show your government-issued ID ■ show your driver’s license |
Why can’t I limit all sharing? | Federal law gives you the right to limit only ■ sharing for affiliates’ everyday business purposes — information about your creditworthiness ■ affiliates from using your information to market to you ■ sharing for nonaffiliates to market to you State laws and individual companies may give you additional rights to limit sharing. |
Definitions |
Affiliates | Companies related by common ownership or control. They can be financial and nonfinancial companies. ■ Long Short Advisors, LLC, the investment adviser to the Fund, could be deemed to be an affiliate. |
Nonaffiliates | Companies not related by common ownership or control. They can be financial and nonfinancial companies. ■ The Fund does not share your personal information with nonaffiliates so they can market to you. |
Joint marketing | A formal agreement between nonaffiliated financial companies that together market financial products or services to you. ■ The Fund doesn’t jointly market. |
46
This page intentionally left blank.
This page intentionally left blank.
This page intentionally left blank.
OTHER INFORMATION
The Fund’s Statement of Additional Information (“SAI”) includes additional information about the trustees and is available without charge, upon request. You may call toll-free at (877) 336-6763 to request a copy of the SAI or to make shareholder inquiries.
PROXY VOTING
A description of the policies and procedures that the Fund uses to determine how to vote proxies relating to portfolio securities and information regarding how the Fund voted those proxies during the most recent twelve month period ended June 30 are available (1) without charge upon request by calling the Fund at (877) 336-6763 and (2) in Fund documents filed with the Securities and Exchange Commission (“SEC”) on the SEC’s website at www.sec.gov.
TRUSTEES
Andrea N. Mullins, Chairperson
Ira P. Cohen
Mark J. Seger
OFFICERS
Adam T. Kornegay, Principal Executive Officer and President
Gregory T. Knoth, Principal Financial Officer and Treasurer
Kevin J. Patton, Chief Compliance Officer
Carol J. Highsmith, Vice President and Secretary
INVESTMENT ADVISER
Long Short Advisors, LLC
130 N. 18th Street, 26th floor, Suite 2675
Philadelphia, PA 19103
DISTRIBUTOR
Ultimus Fund Distributors, LLC
225 Pictoria Drive, Suite 450
Cincinnati, OH 45246
INDEPENDENT REGISTERED PUBLIC ACCOUNTING FIRM
Cohen & Company, Ltd.
1350 Euclid Avenue, Suite 800
Cleveland, OH 44115
LEGAL COUNSEL
Stradley Ronon Stevens & Young, LLP
2005 Market Street, Suite 2600
Philadelphia, PA 19103
CUSTODIAN
U.S. Bank, N.A.
425 Walnut Street
Cincinnati, OH 45202
ADMINISTRATOR, TRANSFER AGENT AND FUND ACCOUNTANT
Ultimus Fund Solutions, LLC
225 Pictoria Drive, Suite 450
Cincinnati, OH 45246
This report is intended only for the information of shareholders or those who have received the Fund’s prospectus which contains information about the Fund’s management fee and expenses. Please read the prospectus carefully before investing.
Distributed by Ultimus Fund Distributors, LLC
Member FINRA/SIPC
Item 2. Code of Ethics.
As of the end of the period covered by this report, the registrant has adopted a code of ethics that applies to the registrant's principal executive officer, principal financial officer, principal accounting officer or controller, or persons performing similar functions, regardless of whether these individuals are employed by the registrant or a third party. Pursuant to Item 12(a)(1), a copy of registrant’s code of ethics is filed as an exhibit to this Form N-CSR. During the period covered by this report, the code of ethics has not been amended, and the registrant has not granted any waivers, including implicit waivers, from the provisions of the code of ethics.
Item 3. Audit Committee Financial Expert.
(a)(1) The registrant’s Board of Trustees has determined that the registrant has at least one audit committee financial expert serving on its audit committee.
(a)(2) The audit committee financial expert is Andrea N. Mullins, who is “independent” for purposes of this Item 3 of Form N-CSR.
Item 4. Principal Accountant Fees and Services.
| LS Opportunity Fund: | FY 2020 | $14,500 |
| | FY 2019 | $14,500 |
| BFS Equity Fund: | FY 2020 | $13,500 |
| | FY 2019 | $13,500 |
| LS Opportunity Fund: | FY 2020 | $0 |
| | FY 2019 | $0 |
| BFS Equity Fund: | FY 2020 | $0 |
| | FY 2019 | $0 |
| LS Opportunity Fund: | FY 2020 | $3,000 |
| | FY 2019 | $3,000 |
| BFS Equity Fund: | FY 2020 | $3,000 |
| | FY 2019 | $3,000 |
Nature of the fees: Preparation of the 1120 RIC and Excise review
| LS Opportunity Fund: | FY 2020 | $0 |
| | FY 2019 | $0 |
| BFS Equity Fund: | FY 2020 | $0 |
| | FY 2019 | $0 |
| (e) | (1) | Audit Committee’s Pre-Approval Policies |
The Audit Committee Charter requires the Audit Committee to be responsible for the selection, retention or termination of auditors and, in connection therewith, to (i) evaluate the proposed fees and other compensation, if any, to be paid to the auditors, (ii) evaluate the independence of the auditors, (iii) pre-approve all audit services and, when appropriate, any non-audit services provided by the independent auditors to the Trust, (iv) pre-approve, when appropriate, any non-audit services provided by the independent auditors to the Trust's investment adviser, or any entity controlling, controlled by, or under common control with the investment adviser and that provides ongoing services to the Trust if the engagement relates directly to the operations and financial reporting of the Trust, and (v) receive the auditors’ specific representations as to their independence;
| (2) | All of the services described in paragraphs (b) through (d) of Item 4 were pre-approved by the Audit Committee. |
(f) During audit of registrant's financial statements for the most recent fiscal year, less than 50 percent of the hours expended on the principal accountant's engagement were attributed to work performed by persons other than the principal accountant's full-time, permanent employees.
(g) The aggregate non-audit fees billed by the registrant's accountant for services rendered to the registrant, and rendered to the registrant's investment adviser (not including any sub-adviser whose role is primarily portfolio management and is subcontracted with or overseen by another investment adviser), and any entity controlling, controlled by, or under common control with the adviser that provides ongoing services to the registrant:
| Registrant | Adviser |
| FY 2020 | $6,000 | $0 |
| FY 2019 | $6,000 | $0 |
(h) Not applicable. The auditor performed no services for the registrant’s investment adviser or any entity controlling, controlled by, or under common control with the investment adviser that provides ongoing services to the registrant.
Item 5. Audit Committee of Listed Companies. NOT APPLICABLE – applies to listed companies only
Item 6. Schedule of Investments. Schedules filed with Item 1.
Item 7. Disclosure of Proxy Voting Policies and Procedures for Closed-End Management Investment Companies. NOT APPLICABLE – applies to closed-end funds only
Item 8. Portfolio Managers of Closed-End Investment Companies. NOT APPLICABLE – applies to closed-end funds only
Item 9. Purchases of Equity Securities by Closed-End Management Investment Company and Affiliated Purchasers. NOT APPLICABLE – applies to closed-end funds only
Item 10. Submission of Matters to a Vote of Security Holders.
The guidelines applicable to shareholders desiring to submit recommendations for nominees to the Registrant's board of trustees are contained in the statement of additional information of the Trust with respect to the Fund(s) for which this Form N-CSR is being filed.
Item 11. Controls and Procedures.
(a) Based on their evaluation of the registrant’s disclosure controls and procedures (as defined in Rule 30a-3(c) under the Investment Company Act of 1940, as amended (the “Act”)) as of a date within 90 days of the filing date of this report, the registrant’s principal executive officer and principal financial officer have concluded that such disclosure controls and procedures are reasonably designed and are operating effectively to ensure that material information relating to the registrant is made known to them by others within those entities, particularly during the period in which this report is being prepared, and that the information required in filings on Form N-CSR is recorded, processed, summarized, and reported on a timely basis.
(b) There were no changes in the registrant’s internal control over financial reporting (as defined in Rule 30a-3(d) under the Investment Company Act of 1940) that occurred during the second fiscal quarter of the period covered by this report that have materially affected, or are reasonably likely to materially affect, the registrant’s internal control over financial reporting.
Item 12. Disclosure of Securities Lending Activities for Closed-End Management Investment Companies. NOT APPLICABLE – applies to closed-end funds only
Item 13. Exhibits.
Pursuant to the requirements of the Securities Exchange Act of 1934 and the Investment Company Act of 1940, the registrant has duly caused this report to be signed on its behalf by the undersigned, thereunto duly authorized.
| (Registrant) | Valued Advisers Trust | |
| | | |
| By | /s/ Adam T. Kornegay | |
| Adam T. Kornegay, President and Principal Executive Officer | |
| | | |
| Date | 8/04/2020 | |
Pursuant to the requirements of the Securities Exchange Act of 1934 and the Investment Company Act of 1940, this report has been signed below by the following persons on behalf of the registrant and in the capacities and on the dates indicated.
| By | /s/ Adam T. Kornegay | |
| | Adam T. Kornegay, President and Principal Executive Officer | |
| | |
| Date | 8/04/2020 | |
| | | |
| By | /s/ Gregory Knoth | |
| Gregory Knoth, Treasurer and Principal Financial Officer | |
| | | |
| Date | 8/04/2020 | |