united states
securities and exchange commission
washington, d.c. 20549
form n-csr
certified shareholder report of registered management
investment companies
| Investment Company Act file number | 811-22208 | |
| Valued Advisers Trust |
| (Exact name of registrant as specified in charter) |
| Ultimus Fund Solutions, LLC 225 Pictoria Drive, Suite 450 Cincinnati, OH | 45246 |
| (Address of principal executive offices) | (Zip code) |
Ultimus Fund Solutions, LLC
Attn: Gregory Knoth
225 Pictoria Drive, Suite 450
Cincinnati, OH 45246
(Name and address of agent for service)
| Registrant's telephone number, including area code: | 513-587-3400 | |
| Date of fiscal year end: | 5/31 | |
| | | |
| Date of reporting period: | 5/31/2019 | |
Item 1. Reports to Stockholders.
BFS Equity Fund
ANNUAL REPORT
May 31, 2019
Beginning on January 1, 2021, as permitted by regulations adopted by the Securities and Exchange Commission, paper copies of the Fund’s shareholder reports like this one will no longer be sent by mail, unless you specifically request paper copies of the reports from the Fund or from your financial intermediary such as a broker-dealer or bank. Instead, the reports will be made available on a website, and you will be notified by mail each time a report is posted and provided with a website link to access the report.
If you already elected to receive shareholder reports electronically, you will not be affected by this change and you need not take any action. You may elect to receive shareholder reports and other communications from the Fund electronically by contacting the Fund at (855) 575-2430 or, if you own these shares through a financial intermediary, you may contact your financial intermediary.
You may elect to receive all future reports in paper free of charge. You can inform the Fund that you wish to continue receiving paper copies of your shareholder reports by contacting the Fund at (855) 575-2430. If you own shares through a financial intermediary, you may contact your financial intermediary or follow instructions included with this document to elect to continue to receive paper copies of your shareholder reports. Your election to receive reports in paper will apply to all funds held with the fund complex or at your financial intermediary.

185 Asylum Street ● City Place II ● Hartford, CT 06103 ● (855) 575-2430
BFS Equity Fund
Letter to Shareholders
Dear Fellow Shareholders,
This annual report covers the period June 1, 2018 through May 31, 2019 – the BFS Equity Fund’s fifth full fiscal year.
The BFS Equity Fund (the “Fund”) was launched on November 8, 2013, with initial funds from investors of $1.1 million. On June 1, 2018, at the start of the Fund’s fiscal year, the Fund had net assets of $31.7 million. During the fiscal year, the net assets of the Fund increased 13.3% to $36.0 million, as of May 31, 2019. This growth was driven by inflows from investors into the Fund, as well as by the positive investment return achieved by the Fund over the past fiscal year. As of May 31, 2019, there were approximately 635 investors in the Fund.
The BFS Equity Fund achieved a total return of 6.84% for the fiscal year commencing June 1, 2018 and ending May 31, 2019, outperforming the S&P 500® Index (“S&P 500”) total return of 3.78% and the Dow Jones Industrial Average (“Dow Jones”) total return of 4.05% for the same period. For the three-year period commencing June 1, 2016 and ending May 31, 2019, the Fund achieved an annualized total return of 11.72%, equaling the S&P 500 total return of 11.72%.
This report includes a commentary from the Lead Portfolio Manager, Tim Foster, and Co-Portfolio Managers, Tom Sargent and Keith LaRose. You will also find a listing of the portfolio holdings as of May 31, 2019, as well as financial statements and detailed information about the performance and positioning of the BFS Equity Fund.
The current economic expansion is now the longest on record. There are indications that the U.S. economy may well continue to expand for some years. The S&P 500 just hit its all-time high, inflation is less than 2%, interest rates are declining, unemployment continues at a low level, and the government continues to spend at a high level. Also, it appears highly likely that the Federal Reserve (the “Fed”) will begin to cut rates – possibly as many as two more times in the next six months – as it continues to shift to a more accommodative monetary policy. These are all signs that the economy will continue to expand in 2019.
1
Nonetheless, we believe that an element of caution is appropriate, at this time. Corporate earnings growth has slowed, some sectors of the stock market have outsized valuations, there is the potential for a more pronounced inverted yield curve, and there is a growing certainty that the daunting strategic issues on trade between China and the U.S. will remain unresolved for an extended period. Geo-political hotspots in the Persian Gulf and North Korea and negative market yields on as much as $13 trillion in sovereign debt worldwide, including Germany, Japan, Sweden, and Switzerland, add to the clouds of worry on the horizon.
In closing, it is important to reiterate our belief that, now more than ever, our investment strategy of investing in quality growth stocks purchased with a risk-mitigating approach and positioned to provide a margin of safety in the case of economic or market weakness is effective over the longer term. We believe the Fund’s ownership of shares in quality companies with sound business models, strong brands, good balance sheets, professional management, and robust cash flow should be able to withstand market corrections, even bear markets, and perform well over the longer term.
The Portfolio Managers of the BFS Equity Fund and I are shareholders together with you. We thank you for the trust that you have placed in us to manage your assets.
Sincerely,
Stephen L. Willcox
President and CEO
Bradley, Foster & Sargent, Inc.
2
BFS Equity Fund
Portfolio Managers Letter
The BFS Equity Fund celebrated its fifth anniversary last fall. Since its inception, Fund assets have grown to approximately $36 million and the price per share of the BFS Equity Fund has grown from $10 to $15.40 at the close of the Fund’s fiscal year on May 31, 2019. Our shareholder base has broadened, but is still primarily client families and friends of Bradley, Foster & Sargent, as well as the principals of the firm. The Fund had a good year performance wise. Total return for the trailing twelve month period was +6.84% for the Fund, while the S&P 500 total return was +3.78%. For the six month period ending May 31, 2019, the Fund returned +3.31% versus +0.74% for the S&P 500. The stock market hit a peak valuation last September, then experienced a 20% swoon into Christmas Eve. By the end of April, however, the market had regained its former high. May was a challenging month, dropping 6%, but for the twelve month period, equity returns were positive and only modestly below the very long term averages.
Political rancor has been especially divisive as both parties have migrated further left and right leaving very little common ground in the middle. It has been both the best of times as well as the worst of times, depending on your perspective. Clearly, the good news has been that the economy continues to grow. During two quarters over the past year, real GDP growth exceeded the 3% mark for the first time in about five years. Labor markets have been robust. Unemployment is near an all-time low at 3.6%. Wages are growing 3.1% as measured by average hourly earnings. Both business and consumer confidence are high. Inflation has remained subdued. Depending on the inflation measure you choose, inflation lies somewhere between 1.5% and 2.5% - very close to the Federal Reserve Board’s stated target of 2%. Full employment and stable prices are the Fed’s primary (but generally conflicting) goals. It is evident the Fed has navigated its mission well, but not without controversy and not without a rather dramatic shift in the Fed’s stated course of policy.
Late last year, the Fed forecast a policy of continuing 25 basis point hikes to the Fed Funds rate with as many as four hikes expected for 2019. As the economy slowed into the fourth quarter last year and investors feared the potential for the economy to slip back into recession, a selling wave commenced culminating in the 20% correction into the end of the year. Between the declines in economic data, including the Leading Economic
3
Indicators as well as the Purchasing Manager surveys, and the stock rout, the Fed shifted to a wait and see, or “data dependent”, policy. By the end of May, Fed Funds futures shifted from a less than 20% chance of a rate cut to more than 80%.
When it comes to economic recoveries, sometimes slower is better. The past decade of below average growth sidestepped much of the historical inflationary pressures enabling the Fed to maintain an accommodative policy. With Fed Funds currently targeted at 2.25-2.5% and inflation running close to 2%, real interest rates are very close to zero – historically a still accommodative level. The dilemma that arises, however, is that low inflation expectations have kept longer maturity bonds at virtually the same level, thus flattening or slightly inverting the yield curve. An inverted yield curve has historically been a red flag to potential recession. But without higher real rates, higher inflation and more robust economic growth straining resources, modest economic growth can likely be further sustained and recession averted for the near future.
INVESTMENT STRATEGY
A year ago, with corporate earnings growth roaring along at a double-digit clip, it seemed likely a more traditional boom – bust economic cycle would play out. We forecast rising inflation as well as rising interest rates. We were wrong on both counts. The good news is that currently with modest economic growth, modest corporate earnings growth, modest inflation, stable interest rates AND a market P/E that does not appear too excessive, the market can continue in an upward trajectory.
In terms of risk, one of our primary concerns is the changing nature of the market itself. There has always been a rational case for passive investing – put your money in a broad equity index, leave it there and you will inevitably participate financially with the long term growth of the economy. Over the duration of this bull market cycle, the passive approach has gained the lion’s share of investable funds from both individual and institutional investors alike. This approach works wonderfully in a bull market, such as the last decade, but not so well when markets turn ugly. The key phrase above of “leaving it there” tends to get thrown under the bus when markets turn south. It is not rational to sell when stock prices go down. It is emotional, and emotions are a big driver to the cyclicality of markets. Adding fuel to that fire is the roughly one trillion dollars of assets that are invested in funds and ETFs with market momentum as a key algorithmic driver. Buy high, sell low. It makes no sense to the fundamental investor, but there is enough money chasing that strategy to inflame volatility. While there is not much the long-only investor can do about these sharp downdrafts when they occur from a level of reasonable
4
valuation, the fundamental investor can eschew the buying frenzies when valuations are driven to excessive levels. The past two 20% corrections we have endured during the past couple of years appear to be good examples of volatility driven funds adding fuel to the correction fire. Buying frenzies have occurred more on a sector rotational basis. Before this cycle reaches its final inning, we may see a tsunami of bond fund selling and stock fund buying to set the top for the cycle. Stay tuned!
Some signs of market “toppiness” are currently evident, primarily the IPO market with wild valuations chasing yet-to-be or may-never-to-be profitable cult stocks like Uber. On the other hand, best in class and globally preeminent companies like Caterpillar and Deere sell at below market P/E multiples with above average dividend yields. President Trump’s tariff tirades have been particularly challenging to the industrial sector, but we believe that has led to some very attractive values within the sector. A flat yield curve challenges net interest margins for the banks, but that challenge has led to very attractive valuations for money center banks like J.P. Morgan and Citicorp. The cry from Vermont for “Medicare For All” dealt a setback to the entire healthcare sector and in particular to managed care companies like United Health Group (UNH), but whether “Medicare As Is” or “Medicare For All” prevails, the economies of scale for UNH should ensure continued growth under either scenario.
One investment theme we like to think about is “companies the world can’t do without”. Often these companies carry lofty valuations due to their entrenched and durable competitive positioning. Some we own. Some we don’t. But it is worth spending some time trying to identify great candidates so when negative events do occur (that we view as temporary – not systemic), we will be in a position to establish new positions or add to our existing positions. Sometimes that negative event may just be a total market setback, as occurred in the fourth quarter of last year. Sometimes it is more specific, like regulatory initiatives or tariff threats. We mentioned Caterpillar and Deere. It is not that there aren’t other manufacturers of construction and agricultural equipment, but these two companies represent the leading technologies and highest quality of equipment. Further, their global dealership networks for sales and service present formidable moats around their share of market. Ecolab is another premier “can’t do without” fortress. Their products and services are not highly visible to consumers, but the cleaning, filtering, sterilizing products and services they provide are what keep many hotels, restaurants, energy and industrial companies humming. How about Disney? Is there a child on planet earth that has not
5
in some way come to love a Disney character or franchise? Thirty years ago, we all did without Google and Amazon, but not so today. These are companies that literally changed the world so we can no longer do without them!
INVESTMENT COMMENTARY
In both magnitude and duration, this recovery cycle has been the longest on record. Being such an outlier may in itself give one pause, but cycles are driven by excess. Excess valuation may be the top contender, but we are a long way from the 20+ market P/E multiples that set up the post Y2K 50% bear market. As well, the more recent bear market crash of 2008 was teed off by vastly over extended financial institution balance sheets and poor lending standards. It has taken many years and significant restructuring, but those excesses appear to be history now as well. The Nifty Fifty had its comeuppance back in the 1970’s. More recently, must own FAANG stocks appeared to have only one trajectory – until they didn’t anymore. Those companies are all doing fine, but there is now somewhat more rationality to their valuations of late. Bitcoin? Zero to $20,000 and back again. Billions vaporized by hacking. Hardly the store of value most folks would choose to store their wealth in. Cannabis stocks may be the latest poster children for excess valuation, but no doubt the better part of the currently listed cannabis stocks will end going up in smoke (sorry about that!).
Avoid hype. Seek value. Maintain investment disciplines. Consider the sustainability of the businesses you are buying. These are tenets that have served investors well over many, many market cycles, particularly if one believes we may be in the latter innings of the cycle, as we do.
Some sector highlights of the past twelve months follow:
Healthcare
Healthcare was the Fund’s largest sector weighting at 21.9% and also the Fund’s largest sector overweight versus the S&P 500 Healthcare sector at 14.2%. The overweight served the Fund well with performance of +22.1% versus the S&P 500 sector return of +7.7%. We maintained our strategy within the Healthcare sector to focus on life science equipment providers versus traditional pharmaceutical companies. Danaher was our top performer with a return of +33.8%, followed by Mettler Toledo at +31.3%. Our recent purchase of United Health Group (UNH) was the only negative performer in the sector with a return of -12.3%. Unfortunately, our purchase of UNH came just before the concept of “Medicare For All” surfaced, but we believe the company can do well even in the event politics swing in that direction.
6
Information Technology
The Information Technology sector was the Fund’s second largest weighting at 19.4%, a slight underweight to the S&P 500 Tech sector weighting of 21.2%. The Fund’s stock selection in the sector led to better returns relative to the S&P 500 Tech sector benchmark, returning +10.8% versus +4.4% for the S&P 500 Tech sector. First Data, Microsoft, ADP and Cisco were the Fund’s top contributors with returns of +28.6%, +27.2%, +25.7% and +25.4%, respectively. Coherent and Apple were the only losing positions returning -26.6% and -4.88%, respectively. Coherent was sold.
Industrials
The Fund’s Industrials sector holdings were the third largest sector weighting at 15.7% and a large overweight to the S&P 500 weighting of 9.3%. We generally believe the Industrials sector offers more attractive valuations than most other S&P 500 sectors. Industrials faced major headwinds during the past year, however, due to tariffs imposed by the president. We believe ultimately these tariffs will be negotiated with a favorable outcome for these companies, but the timing of resolution is still very uncertain. The Fund’s Industrials sector’s performance was a disappointing -7.1% versus -1.0% for the S&P 500 Industrials sector. Although we like, and continue to hold Caterpillar, Raytheon and 3M, all three hurt our absolute and relative sector performance with returns of -19.1%, -15.1% and -12.0%, respectively. The best performing industrial sector holding was Fortive at +5.1%.
Consumer Discretionary
The Fund was slightly underweight the Consumer Discretionary sector at 8.4% versus the S&P 500 at 10.2%. Relative performance in the sector was very good with the Fund returning +13.9% versus +5.9% for the S&P 500 Consumer Discretionary sector. The Fund’s standout performer was Starbucks with a +37.2% return. We had one negative return in the sector from NVR Corp at -8.1%. The position was subsequently sold.
Consumer Staples
As we mentioned in last year’s report, the world has changed in terms of consumer packaged goods. Consumer tastes have shifted from processed foods to fresh foods and the Consumer Staples sector has suffered. The Fund is underweight the sector at 6.8% versus the S&P 500 weighting of 7.4%. The Fund outperformed the S&P 500 in this sector with a return of +20.7% versus +15.6%, respectively. Mondelez reversed its negative
7
performance from the year before, returning +32.5%. Costco continues to be a big winner for the Fund and returned +22.1%. Kraft Heinz had a disastrous year, but the Fund’s loss was limited to -8.6% when the position was sold.
Communication Services
This sector, new to the S&P 500 last year, has a 10.4% weighting for the S&P 500. The Fund was underweight relative to the S&P 500 at 6.3%. Performance lagged the S&P 500 Communication Services sector, returning +7.2% versus +11.6% for the S&P 500. Former highfliers, Alphabet and Facebook, both had disappointing returns of +0.6% and -21.8%, respectively. The Fund’s big winner was Disney, which gained +34.9%. Facebook was sold due to a profound decline in support from users and advertisers alike, as well as adverse regulatory concerns. We see Alphabet and Disney as core long term holdings.
Financials
With the flat to slightly inverted yield curve serving as a headwind for the sector, the Fund is underweight the Financials sector at 10.4% versus 13.2% for the S&P 500 Financials sector. The underweighting, as well as stock selection, were both helpful in generating a +6.5% return versus -2.3% for the S&P 500. American Express lead the gainers with a +18.4% return, followed by Chubb with a +14.3% return. Banks were particularly depressed by the flat yield curve, with J.P. Morgan gaining only +1.8%, while Citigroup lost -4.3%.
Energy
Energy stocks have been a challenge with falling oil prices most of the past year. The Fund is underweighted at 3.7% versus 4.9% for the S&P 500 Energy sector. Returns were negative for both the Fund and the S&P 500. The Fund had a negative return of -25.4%, while the S&P 500 had a loss of -20.1%. Every one of the Fund’s holdings declined with Schlumberger faring the worst at -41.0%. Schlumberger and Apache were sold and EOG Resources, the premier player in the prolific Permian shale basin, was purchased.
Materials
The Fund was close to benchmark weighted in the Materials sector at 2.8% versus 2.6% for the S&P 500 Materials sector. The Fund’s returns far outpaced the benchmark with the Fund gaining +38.7% while the S&P 500 lost -7.3%. We sold the Fund’s Mosaic
8
position in a very timely manner creating a +19.8% return, but our biggest winner, by far, was Ecolab at +30.5%. We really consider Ecolab as more of an essential service company than a commodity material company, but it sure helped to outpace the benchmark!
Utilities and Real Estate
The Fund had no exposure to the Utilities and Real Estate sectors, which make up only 3.4% and 3.2%, respectively, of the S&P 500 Index. Returns for the S&P 500 Utilities and Real Estate sectors were attractive, however, returning +18.4% and +19.9%, respectively. With very slow growth, above market P/E multiples and historically low dividend yields, virtually the entire Utilities sector looks overpriced to us.
CLOSING COMMENTS
With corporate profits up double digits over the past twelve months, it is somewhat surprising that stock returns have only amounted to low single digits. The timing of the 20% market correction last fall is largely to blame. So far in 2019, the inverse is true. Profits are expected to rise mid-single digits, while the market has already gained a mid-teen percentage return. We expect continued volatility, driven in part by the growing impact of momentum players. Another 10% move to the downside, or the upside, would be no surprise. The primary market underpinnings remain positive. The economy continues to grow. Valuations are not unreasonably high. Inflation is low. The Fed remains accommodative. Corporate profits are growing. Each of these factors seems to be a little less compelling than earlier in the cycle, however, so our return expectations are modest as well. We are comfortable staying the course with our focus on buying good companies at fair prices and worrying less about the vagaries of the market as a whole.
We, the portfolio managers at Bradley, Foster & Sargent, Inc., are also shareholders of the BFS Equity Fund. We look forward to serving you through our management of the Fund. Thank you for placing your capital under our care.
Timothy Foster
Lead Portfolio Manager | Keith LaRose
Co-Portfolio Manager | Thomas Sargent
Co-Portfolio Manager |
9
BFS Equity Fund
ANNUAL PERFORMANCE REVIEW
(Unaudited)
The Fund returned +6.84% for the twelve month period commencing June 1, 2018 and ending May 31, 2019, outperforming the S&P 500, which returned +3.78%, and the Dow Jones, which gained +4.05% over the same period.
Key Detractors from Relative Results
| | ● | With falling oil prices over the period, the Energy sector was the worst performing sector for both the Fund (-25.4%) as well as for the S&P 500 (-20.1%). Schlumberger returned -41.0% and was sold. |
| | ● | The Fund had no exposure to both the Utilities and Real Estate sectors of the S&P 500 which returned 18.4% and 19.9%, respectively, for the S&P 500. |
| | ● | The Fund overweighted the Industrials sector at 15.7% versus 9.3% for the S&P 500. The Fund’s performance lagged the S&P 500 with the Fund’s return -7.1% versus -1.0% for the S&P 500. Trade tariffs significantly impaired performance for this sector. |
Key Contributors to Relative Results
| | ● | The Healthcare sector was the Fund’s largest weighting at 21.9% as well as one of the best performing sectors, returning +22.1%, relative to the S&P 500 return of +7.7%. Danaher was the second largest position for the Fund and the stock returned +33.8%. |
| | ● | The single best performing sector for the Fund relative to the S&P 500 benchmark was the Materials sector. The Fund’s return was +38.7% versus -7.3% for the S&P 500. |
| | ● | Information Technology was the second largest weighting in the Fund at 19.4% versus 21.2% for the S&P 500. Stock selection generated a superior return of +10.8% versus +4.4% for the S&P 500 Tech sector. |
FUND INFORMATION(a)
May 31, 2019 (Unaudited)
ASSET ALLOCATION

TEN LARGEST HOLDINGS (%) | FUND |
Alphabet Inc. | 3.4 |
Danaher | 3.3 |
Chubb | 3.0 |
Walt Disney | 2.9 |
Raytheon | 2.9 |
Ecolab | 2.8 |
Oracle | 2.8 |
Microsoft | 2.8 |
United Health Group | 2.7 |
Costco | 2.7 |
SECTOR
DIVERSIFICATION (%) | FUND | S&P 500 |
Healthcare | 21.9 | 14.2 |
Information Technology | 19.4 | 21.2 |
Industrials | 15.7 | 9.3 |
Financials | 10.4 | 13.2 |
Consumer Discretionary | 8.4 | 10.2 |
Consumer Staples | 6.8 | 7.4 |
Communication Services | 6.3 | 10.4 |
Energy | 3.7 | 4.9 |
Materials | 2.8 | 2.6 |
Utilities | 0.0 | 3.4 |
Real Estate | 0.0 | 3.2 |
Cash Equivalents | 4.6 | 0.0 |
(a) | Fund percentages based on net assets as of May 31, 2019. |
10
BFS Equity Fund
Investment Results (Unaudited)
Average Annual Total Returns(a) (For the periods ended May 31, 2019)
| | One Year | Three Year | Five Year | Since Inception
(November 8, 2013) |
BFS Equity Fund | 6.84% | 11.72% | 8.59% | 9.08% |
S&P 500® Index(b) | 3.78% | 11.72% | 9.66% | 10.51% |
Dow Jones Industrial Average®(c) | 4.05% | 14.45% | 10.88% | 11.19% |
Total annual fund operating expenses, as disclosed in the BFS Equity Fund’s (the “Fund”) prospectus dated September 28, 2018, were 1.65% of average daily net assets (1.25% after fee waivers/expense reimbursements by Bradley, Foster & Sargent, Inc. (the “Adviser”)). The Adviser has contractually agreed to waive or limit its fees and to assume other expenses of the Fund until September 30, 2019, so that Total Annual Fund Operating Expenses does not exceed 1.00%. This contractual arrangement may only be terminated by mutual consent of the Adviser and the Board of Trustees of the Trust, and it will automatically terminate upon the termination of the investment advisory agreement between the Fund and the Adviser. This operating expense limitation does not apply to: (i) interest, (ii) taxes, (iii) brokerage commissions, (iv) other expenditures which are capitalized in accordance with generally accepted accounting principles, (v) other extraordinary expenses not incurred in the ordinary course of the Fund’s business, (vi) dividend expense on short sales, (vii) expenses incurred under a plan of distribution under Rule 12b-1, and (viii) expenses that the Fund has incurred but did not actually pay because of an expense offset arrangement, if applicable, in any fiscal year. The operating expense limitation also excludes any “Acquired Fund Fees and Expenses,” which are the expenses indirectly incurred by the Fund as a result of investing in money market funds or other investment companies, including exchange-traded funds, that have their own expenses. Each waiver or reimbursement of an expense by the Adviser is subject to repayment by the Fund within the three years following such waiver or reimbursement, provided that the Fund is able to make the repayment without exceeding the expense limitation in place at the time of the waiver or reimbursement and the expense limitation in place at the time of the repayment.
The performance quoted represents past performance, which does not guarantee future results. The investment return and principal value of an investment will fluctuate so that an investor’s shares, when redeemed, may be worth more or less than their original cost. The returns shown do not reflect deduction of taxes that a shareholder would pay on Fund distributions or the redemption of Fund shares. The Fund’s investment objectives, risks, charges and expenses must be considered carefully before investing. Current performance of the Fund may be lower or higher than the performance quoted. Performance data current to the most recent month end may be obtained by calling (855) 575-2430.
(a) | Average annual total returns reflect any change in price per share and assume the reinvestment of all distributions. The Fund’s returns reflect any fee reductions during the applicable periods. If such fee reductions had not occurred, the quoted performance would have been lower. |
(b) | The S&P 500® Index is a widely recognized unmanaged index of equity prices and is representative of a broader market and range of securities than is found in the Fund’s portfolio. The index is an unmanaged benchmark that assumes reinvestment of all distributions and excludes the effect of taxes and fees. Individuals cannot invest directly in this index; however, an individual can invest in exchange-traded funds or other investment vehicles that attempt to track the performance of a benchmark index. |
(c) | The Dow Jones Industrial Average® is a widely recognized unmanaged index of equity prices and is representative of a narrower market and range of securities than is found in the Fund’s portfolio. The index is an unmanaged benchmark that assumes reinvestment of all distributions and excludes the effect of taxes and fees. Individuals cannot invest directly in this index; however, an individual can invest in exchange-traded funds or other investment vehicles that attempt to track the performance of a benchmark index. |
The Fund’s investment objectives, strategies, risks, charges and expenses must be considered carefully before investing. The prospectus contains this and other important information about the Fund and may be obtained by calling the same number as above. Please read it carefully before investing.
The Fund is distributed by Unified Financial Securities, LLC, member FINRA/SIPC.
11
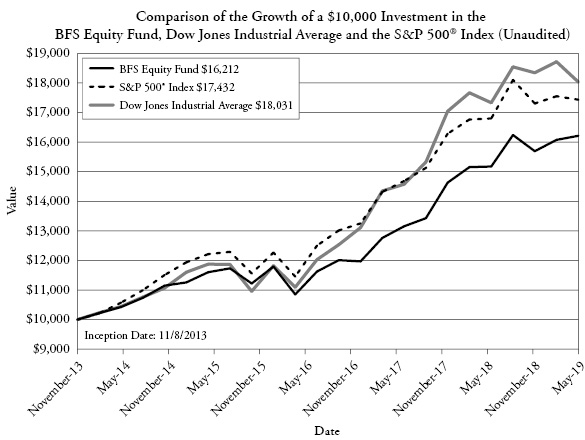
The chart above assumes an initial investment of $10,000 made on November 8, 2013 (commencement of operations) held through May 31, 2019.THE FUND’S RETURN REPRESENTS PAST PERFORMANCE AND DOES NOT GUARANTEE FUTURE RESULTS.The returns shown do not reflect deduction of taxes that a shareholder would pay on Fund distributions or the redemption of Fund shares. Investment returns and principal values will fluctuate so that your shares, when redeemed, may be worth more or less than their original purchase price.
Current performance may be lower or higher than the performance data quoted. For more information on the Fund, and to obtain performance data current to the most recent month end or to request a prospectus, please call (855) 575-2430. You should carefully consider the investment objectives, potential risks, management fees, and charges and expenses of the Fund before investing. The Fund’s prospectus contains this and other information about the Fund, and should be read carefully before investing.
The Fund is distributed by Unified Financial Securities, LLC, member FINRA/SIPC.
Availability of Portfolio Schedule (Unaudited)
The Fund files its complete schedule of investments with the Securities and Exchange Commission (“SEC”) as of the end of the first and third quarters of each fiscal year on Form N-Q. The Fund’s Forms N-Q are available at the SEC’s website at www.sec.gov.
12
BFS Equity Fund
Schedule of Investments
May 31, 2019
| | Shares | | | Fair Value | |
COMMON STOCKS — 95.40% | | | | | | | | |
| | | | | | | | | |
Aerospace & Defense — 5.37% | | | | | | | | |
Raytheon Company | | | 6,000 | | | $ | 1,047,000 | |
United Technologies Corporation | | | 7,000 | | | | 884,100 | |
| | | | | | | | 1,931,100 | |
Banks — 5.24% | | | | | | | | |
Citigroup, Inc. | | | 15,000 | | | | 932,250 | |
JPMorgan Chase & Company | | | 9,000 | | | | 953,640 | |
| | | | | | | | 1,885,890 | |
Beverages — 2.45% | | | | | | | | |
Constellation Brands, Inc., Class A | | | 5,000 | | | | 882,250 | |
| | | | | | | | | |
Chemicals — 2.82% | | | | | | | | |
Ecolab, Inc. | | | 5,500 | | | | 1,012,495 | |
| | | | | | | | | |
Communications Equipment — 2.46% | | | | | | | | |
Cisco Systems, Inc. | | | 17,000 | | | | 884,510 | |
| | | | | | | | | |
Consumer Finance — 2.07% | | | | | | | | |
American Express Company | | | 6,500 | | | | 745,615 | |
| | | | | | | | | |
Electronic Equipment, Instruments & Components — 4.52% | | | | | | | | |
Amphenol Corporation, Class A | | | 9,000 | | | | 783,000 | |
TE Connectivity Ltd. | | | 10,000 | | | | 842,300 | |
| | | | | | | | 1,625,300 | |
Entertainment — 2.94% | | | | | | | | |
Walt Disney Company (The) | | | 8,000 | | | | 1,056,320 | |
| | | | | | | | | |
Food & Staples Retailing — 2.66% | | | | | | | | |
Costco Wholesale Corporation | | | 4,000 | | | | 958,320 | |
| | | | | | | | | |
Food Products — 1.70% | | | | | | | | |
Mondelez International, Inc., Class A | | | 12,000 | | | | 610,200 | |
| | | | | | | | | |
Health Care Equipment & Supplies — 7.28% | | | | | | | | |
Abbott Laboratories | | | 8,000 | | | | 609,040 | |
Danaher Corporation | | | 9,000 | | | | 1,188,090 | |
Stryker Corporation | | | 4,500 | | | | 824,580 | |
| | | | | | | | 2,621,710 | |
Health Care Providers & Services — 2.69% | | | | | | | | |
UnitedHealth Group, Inc. | | | 4,000 | | | | 967,200 | |
| | See accompanying notes which are an integral part of these financial statements. | 13 |
BFS Equity Fund
Schedule of Investments (continued)
May 31, 2019
| | Shares | | | Fair Value | |
COMMON STOCKS — 95.40% - continued | | | | | | | | |
| | | | | | | | | |
Hotels, Restaurants & Leisure — 2.12% | | | | | | | | |
Starbucks Corporation | | | 10,000 | | | $ | 760,600 | |
| | | | | | | | | |
Industrial Conglomerates — 1.78% | | | | | | | | |
3M Company | | | 4,000 | | | | 639,000 | |
| | | | | | | | | |
Insurance — 3.05% | | | | | | | | |
Chubb Ltd. | | | 7,500 | | | | 1,095,525 | |
| | | | | | | | | |
Interactive Media & Services — 3.38% | | | | | | | | |
Alphabet, Inc., Class A(a) | | | 1,100 | | | | 1,217,150 | |
| | | | | | | | | |
Internet & Direct Marketing Retail — 2.46% | | | | | | | | |
Amazon.com, Inc.(a) | | | 500 | | | | 887,535 | |
| | | | | | | | | |
IT Services — 2.23% | | | | | | | | |
Automatic Data Processing, Inc. | | | 5,000 | | | | 800,600 | |
| | | | | | | | | |
Life Sciences Tools & Services — 6.80% | | | | | | | | |
Illumina, Inc.(a) | | | 3,000 | | | | 920,730 | |
Mettler-Toledo International, Inc.(a) | | | 1,000 | | | | 723,090 | |
Thermo Fisher Scientific, Inc. | | | 3,000 | | | | 800,940 | |
| | | | | | | | 2,444,760 | |
Machinery — 8.54% | | | | | | | | |
Caterpillar, Inc. | | | 6,000 | | | | 718,860 | |
Deere & Company | | | 5,000 | | | | 700,850 | |
Fortive Corporation | | | 10,000 | | | | 761,500 | |
Stanley Black & Decker, Inc. | | | 7,000 | | | | 890,540 | |
| | | | | | | | 3,071,750 | |
Oil, Gas & Consumable Fuels — 3.72% | | | | | | | | |
Chevron Corporation | | | 6,000 | | | | 683,100 | |
EOG Resources, Inc. | | | 8,000 | | | | 655,040 | |
| | | | | | | | 1,338,140 | |
Pharmaceuticals — 5.13% | | | | | | | | |
Johnson & Johnson | | | 3,000 | | | | 393,450 | |
Novartis AG - ADR | | | 7,500 | | | | 642,300 | |
Zoetis, Inc. | | | 8,000 | | | | 808,400 | |
| | | | | | | | 1,844,150 | |
14 | See accompanying notes which are an integral part of these financial statements. | |
BFS Equity Fund
Schedule of Investments (continued)
May 31, 2019
| | Shares | | | Fair Value | |
COMMON STOCKS — 95.40% - continued | | | | | | | | |
| | | | | | | | | |
Software — 8.20% | | | | | | | | |
Adobe, Inc.(a) | | | 3,500 | | | $ | 948,150 | |
Microsoft Corporation | | | 8,000 | | | | 989,440 | |
Oracle Corporation | | | 20,000 | | | | 1,012,000 | |
| | | | | | | | 2,949,590 | |
Specialty Retail — 2.11% | | | | | | | | |
Home Depot, Inc. (The) | | | 4,000 | | | | 759,400 | |
| | | | | | | | | |
Technology Hardware, Storage & Peripherals — 1.95% | | | | | | | | |
Apple, Inc. | | | 4,000 | | | | 700,280 | |
| | | | | | | | | |
Textiles, Apparel & Luxury Goods — 1.72% | | | | | | | | |
NIKE, Inc., Class B | | | 8,000 | | | | 617,120 | |
| | | | | | | | | |
Total Common Stocks (Cost $24,684,321) | | | | | | | 34,306,510 | |
| | | | | | | | | |
MONEY MARKET FUNDS — 4.64% | | | | | | | | |
| | | | | | | | | |
Fidelity Investments Money Market Government Portfolio, Institutional Class, 2.31%(b) | | | 1,668,933 | | | | 1,668,933 | |
Total Money Market Funds (Cost $1,668,933) | | | | | | | 1,668,933 | |
| | | | | | | | | |
Total Investments — 100.04% (Cost $26,353,254) | | | | | | | 35,975,443 | |
| | | | | | | | | |
Liabilities in Excess of Other Assets — (0.04)% | | | | | | | (15,162 | ) |
| | | | | | | | | |
NET ASSETS — 100.00% | | | | | | $ | 35,960,281 | |
(a) | Non-income producing security. |
(b) | Rate disclosed is the seven day effective yield as of May 31, 2019. |
ADR - American Depositary Receipt
The industries shown on the schedule of investments are based on the Global Industry Classification Standard, or GICS® (“GICS”). The GICS was developed by and/or is the exclusive property of MSCI, Inc. and Standard & Poor’s Financial Services LLC (“S&P”). GICS is a service mark of MSCI, Inc. and S&P and has been licensed for use by Ultimus Fund Solutions, LLC.
| | See accompanying notes which are an integral part of these financial statements. | 15 |
BFS Equity Fund
Statement of Assets and Liabilities
May 31, 2019
Assets |
Investments in securities at fair value (cost $26,353,254) (Note 3) | | $ | 35,975,443 | |
Receivable for fund shares sold | | | 8,994 | |
Dividends receivable | | | 34,600 | |
Prepaid expenses | | | 12,870 | |
Total Assets | | | 36,031,907 | |
Liabilities |
Payable for fund shares redeemed | | | 4,000 | |
Payable to Adviser (Note 4) | | | 19,528 | |
Payable to Administrator (Note 4) | | | 6,750 | |
Distribution (12b-1) fees accrued (Note 4) | | | 15,675 | |
Other accrued expenses | | | 25,673 | |
Total Liabilities | | | 71,626 | |
Net Assets | | $ | 35,960,281 | |
Net Assets consist of: | | | | |
Paid-in capital | | $ | 25,930,320 | |
Accumulated earnings | | | 10,029,961 | |
Net Assets | | $ | 35,960,281 | |
Shares outstanding (unlimited number of shares authorized, no par value) | | | 2,335,209 | |
Net asset value, offering and redemption price per share (Note 2) | | $ | 15.40 | |
16 | See accompanying notes which are an integral part of these financial statements. | |
BFS Equity Fund
Statement of Operations
For the year ended May 31, 2019
Investment Income | | | | |
Dividend income | | $ | 532,632 | |
Total investment income | | | 532,632 | |
Expenses | | | | |
Investment Adviser fees (Note 4) | | | 261,074 | |
Distribution (12b-1) fees (Note 4) | | | 87,025 | |
Administration fees (Note 4) | | | 38,250 | |
Registration expenses | | | 26,912 | |
Legal fees | | | 25,032 | |
Fund accounting fees (Note 4) | | | 25,000 | |
Transfer agent fees (Note 4) | | | 18,000 | |
Audit and tax preparation fees | | | 18,000 | |
Printing and postage expenses | | | 7,027 | |
Trustee fees | | | 6,915 | |
Insurance expenses | | | 4,392 | |
Custodian fees | | | 4,208 | |
Miscellaneous | | | 24,205 | |
Total expenses | | | 546,040 | |
Fees contractually waived by Adviser (Note 4) | | | (110,755 | ) |
Net operating expenses | | | 435,285 | |
Net investment income | | | 97,347 | |
Net Realized and Change in Unrealized Gain (Loss) on Investments |
Net realized gain on investment securities transactions | | | 715,995 | |
Net change in unrealized appreciation on investments | | | 1,346,387 | |
Net realized and change in unrealized gain on investments | | | 2,062,382 | |
Net increase in net assets resulting from operations | | $ | 2,159,729 | |
| | See accompanying notes which are an integral part of these financial statements. | 17 |
BFS Equity Fund
Statements of Changes in Net Assets
Increase (Decrease) in Net Assets due to: | | For the
Year Ended
May 31, 2019 | | | For the
Year Ended
May 31, 2018(a) | |
Operations | | | | | | | | |
Net investment income | | $ | 97,347 | | | $ | 76,860 | |
Net realized gain on investment securities transactions | | | 715,995 | | | | 968,655 | |
Net change in unrealized appreciation on investments | | | 1,346,387 | | | | 3,076,603 | |
Net increase in net assets resulting from operations | | | 2,159,729 | | | | 4,122,118 | |
Distributions to Shareholders from Earnings (Note 2) | | | (1,113,363 | ) | | | (97,004 | ) |
Capital Transactions | | | | | | | | |
Proceeds from shares sold | | | 5,524,451 | | | | 3,055,217 | |
Reinvestment of distributions | | | 950,796 | | | | 84,293 | |
Amount paid for shares redeemed | | | (3,311,176 | ) | | | (2,599,930 | ) |
Net increase in net assets resulting from capital transactions | | | 3,164,071 | | | | 539,580 | |
Total Increase in Net Assets | | | 4,210,437 | | | | 4,564,694 | |
Net Assets | | | | | | | | |
Beginning of year | | | 31,749,844 | | | | 27,185,150 | |
End of year | | $ | 35,960,281 | | | $ | 31,749,844 | |
Share Transactions | | | | | | | | |
Shares sold | | | 360,348 | | | | 213,569 | |
Shares issued in reinvestment of distributions | | | 73,138 | | | | 5,801 | |
Shares redeemed | | | (220,822 | ) | | | (185,706 | ) |
Net increase in shares outstanding | | | 212,664 | | | | 33,664 | |
(a) | For the year ended May 31, 2018, the Fund had Distributions to Shareholders from earnings from net investment income and net realized gains of $78,543 and $18,461, respectively. As of May 31, 2018, accumulated net investment income was $25,353. |
18 | See accompanying notes which are an integral part of these financial statements. | |
BFS Equity Fund
Financial Highlights
(For a share outstanding during each year)
| | | For the
Year
Ended
May 31,
2019 | | | For the
Year
Ended
May 31,
2018 | | | For the
Year
Ended
May 31,
2017 | | | For the
Year
Ended
May 31,
2016 | | | For the
Year
Ended
May 31,
2015 | |
Selected Per Share Data: | | | | | | | | | | | | | | | | | | | | |
Net asset value, beginning of year | | $ | 14.96 | | | $ | 13.01 | | | $ | 11.55 | | | $ | 11.69 | | | $ | 10.73 | |
Income from investment operations: | | | | | | | | | | | | | | | | | | | | |
Net investment income | | | 0.04 | | | | 0.04 | | | | 0.04 | | | | 0.04 | | | | 0.02 | |
Net realized and unrealized gain/(loss) on investments | | | 0.90 | | | | 1.96 | | | | 1.47 | | | | (0.15 | ) | | | 0.97 | |
Total from investment operations | | | 0.94 | | | | 2.00 | | | | 1.51 | | | | (0.11 | ) | | | 0.99 | |
Less distributions to shareholders from: | | | | | | | | | | | | | | | | | | | | |
Net investment income | | | (0.04 | ) | | | (0.04 | ) | | | (0.05 | ) | | | (0.03 | ) | | | (0.03 | ) |
Net realized gains | | | (0.46 | ) | | | (0.01 | ) | | | — | | | | — | | | | — | |
Total distributions | | | (0.50 | ) | | | (0.05 | ) | | | (0.05 | ) | | | (0.03 | ) | | | (0.03 | ) |
Net asset value, end of year | | $ | 15.40 | | | $ | 14.96 | | | $ | 13.01 | | | $ | 11.55 | | | $ | 11.69 | |
Total Return(a) | | | 6.84 | % | | | 15.36 | % | | | 13.15 | % | | | (0.91 | )% | | | 9.27 | % |
| | | | | | | | | | | | | | | | | | | | | |
Ratios and Supplemental Data: | | | | | | | | | | | | | | | | | | | | |
Net assets, end of year (000 omitted) | | $ | 35,960 | | | $ | 31,750 | | | $ | 27,185 | | | $ | 23,884 | | | $ | 20,167 | |
Ratio of net expenses to average net assets | | | 1.25 | % | | | 1.25 | % | | | 1.25 | % | | | 1.25 | % | | | 1.25 | % |
Ratio of expenses to average net assets before waiver and reimbursement | | | 1.57 | % | | | 1.65 | % | | | 1.75 | % | | | 1.86 | % | | | 2.26 | % |
Ratio of net investment income to average net assets | | | 0.28 | % | | | 0.26 | % | | | 0.35 | % | | | 0.43 | % | | | 0.30 | % |
Portfolio turnover rate | | | 38.71 | % | | | 38.17 | % | | | 47.82 | % | | | 49.38 | % | | | 51.17 | % |
| | | | | | | | | | | | | | | | | | | | | |
(a) | Total return represents the rate that the investor would have earned or lost on an investment in the Fund, assuming reinvestment of distributions. |
| | See accompanying notes which are an integral part of these financial statements. | 19 |
BFS Equity Fund
Notes to the Financial Statements
May 31, 2019
NOTE 1. ORGANIZATION
The BFS Equity Fund (the “Fund”) was organized as an open-end diversified series of Valued Advisers Trust (the “Trust”) on July 23, 2013 and commenced operations on November 8, 2013. The Trust is a management investment company established under the laws of Delaware by an Agreement and Declaration of Trust dated June 13, 2008 (the “Trust Agreement”). The Trust Agreement permits the Board of Trustees (the “Board”) to issue an unlimited number of shares of beneficial interest of separate series without par value. The Fund is one of a series of funds authorized by the Board. The Fund’s investment adviser is Bradley, Foster & Sargent, Inc. (the “Adviser”). The investment objective of the Fund is long-term appreciation through growth of principal and income.
NOTE 2. SIGNIFICANT ACCOUNTING POLICIES
The Fund is an investment company and follows accounting and reporting guidance under Financial Accounting Standards Board Accounting Standards Codification (“ASC”) Topic 946, “Financial Services-Investment Companies.” The following is a summary of significant accounting policies followed by the Fund in the preparation of its financial statements. These policies are in conformity with generally accepted accounting principles in the United States of America (“GAAP”).
Estimates – The preparation of financial statements in conformity with GAAP requires management to make estimates and assumptions that affect the reported amounts of assets and liabilities and disclosure of contingent assets and liabilities at the date of the financial statements and the reported amounts of increases and decreases in net assets from operations during the reporting period. Actual results could differ from those estimates.
Federal Income Taxes – The Fund makes no provision for federal income or excise tax. The Fund has qualified and intends to qualify each year as a regulated investment company (“RIC”) under subchapter M of the Internal Revenue Code of 1986, as amended, by complying with the requirements applicable to RICs and by distributing substantially all of its taxable income. The Fund also intends to distribute sufficient net investment income and net realized capital gains, if any, so that it will not be subject to excise tax on undistributed income and gains. If the required amount of net investment income or gains is not distributed, the Fund could incur a tax expense.
As of and during the fiscal year ended May 31, 2019, the Fund did not have a liability for any unrecognized tax benefits. The Fund recognizes interest and penalties, if any, related to unrecognized tax benefits as income tax expense on the statement of operations when incurred. During the fiscal year ended May 31, 2019, the Fund did not incur any interest or penalties. Management of the Fund has reviewed tax positions taken in tax years that remain subject to examination by all major tax jurisdictions, including federal (i.e., the last three tax year ends and the interim tax period since then, as applicable). Management believes that there is no tax liability resulting from unrecognized tax benefits related to uncertain tax positions taken.
20
BFS Equity Fund
Notes to the Financial Statements (continued)
May 31, 2019
Expenses – Expenses incurred by the Trust that do not relate to a specific fund of the Trust are allocated to the individual funds based on each fund’s relative net assets or another appropriate basis (as determined by the Board).
Security Transactions and Related Income – The Fund follows industry practice and records security transactions on the trade date for financial reporting purposes. The specific identification method is used for determining gains or losses for financial statement and income tax purposes. Dividend income is recorded on the ex-dividend date and interest income is recorded on an accrual basis. Discounts and premiums on securities purchased are accreted or amortized using the effective interest method, if applicable. Withholding taxes on foreign dividends have been provided for in accordance with the Fund’s understanding of the applicable country’s tax rules and rates.
Dividends and Distributions– The Fund intends to distribute its net investment income and net realized long-term and short-term capital gains, if any, at least annually. Dividends and distributions to shareholders, which are determined in accordance with income tax regulations, are recorded on the ex-dividend date. The treatment for financial reporting purposes of distributions made to shareholders during the period from net investment income or net realized capital gains may differ from their ultimate treatment for federal income tax purposes. These differences are caused primarily by differences in the timing of the recognition of certain components of income, expense or realized capital gain for federal income tax purposes. Where such differences are permanent in nature, they are reclassified among the components of net assets based on their ultimate characterization for federal income tax purposes. Any such reclassifications will have no effect on net assets, results of operations or net asset value per share (“NAV”) of the Fund. For the fiscal year ended May 31, 2019, the Fund did not make any reclassifications.
Share Valuation – The NAV is calculated each day the New York Stock Exchange is open by dividing the total value of the Fund’s assets, less liabilities, by the number of shares outstanding for the Fund.
NOTE 3. SECURITIES VALUATION AND FAIR VALUE MEASUREMENTS
All investments in securities are recorded at their estimated fair value. Fair value is defined as the price that the Fund would receive upon selling an investment in a timely transaction to an independent buyer in the principal or most advantageous market of the investment. GAAP establishes a three-tier hierarchy to maximize the use of observable market data and minimize the use of unobservable inputs and to establish classification of fair value measurements for disclosure purposes.
Inputs refer broadly to the assumptions that market participants would use in pricing the asset or liability, including assumptions about risk (the risk inherent in a particular valuation technique used to measure fair value including a pricing model and/or the risk inherent in the inputs to the valuation technique). Inputs may be observable or unobservable. Observable inputs are inputs that reflect the assumptions market participants would use in pricing the asset or liability developed based on market data obtained and available from sources independent of the reporting entity. Unobservable inputs are inputs that reflect
21
BFS Equity Fund
Notes to the Financial Statements (continued)
May 31, 2019
the reporting entity’s own assumptions about the assumptions market participants would use in pricing the asset or liability developed based on the best information available in the circumstances.
Various inputs are used in determining the value of the Fund’s investments. These inputs are summarized in the three broad levels listed below.
| | ● | Level 1 – unadjusted quoted prices in active markets for identical investments and/or registered investment companies where the value per share is determined and published and is the basis for current transactions for identical assets or liabilities at the valuation date |
| | ● | Level 2 – other significant observable inputs (including, but not limited to, quoted prices for an identical security in an inactive market, quoted prices for similar securities, interest rates, prepayment speeds, credit risk, etc.) |
| | ● | Level 3 – significant unobservable inputs (including the Fund’s own assumptions in determining fair value of investments based on the best information available) |
The inputs used to measure fair value may fall into different levels of the fair value hierarchy. In such cases, for disclosure purposes, the level in the fair value hierarchy which is reported, is determined based on the lowest level input that is significant to the fair value measurement in its entirety.
Equity securities that are traded on any stock exchange are generally valued at the last quoted sale price on the security’s primary exchange. Lacking a last sale price, an exchange-traded security is generally valued at its last bid price. Securities traded in the NASDAQ over-the-counter market are generally valued at the NASDAQ Official Closing Price. When using the market quotations and when the market is considered active, the security is classified as a Level 1 security. In the event that market quotations are not readily available or are considered unreliable due to market or other events, the Fund values its securities and other assets at fair value in accordance with policies established by and under the general supervision of the Board. Under these policies, the securities will be classified as Level 2 or 3 within the fair value hierarchy, depending on the inputs used.
Investments in mutual funds, including money market mutual funds, are generally priced at the ending NAV. These securities are categorized as Level 1 securities.
In accordance with the Trust’s valuation policies, the Adviser is required to consider all appropriate factors relevant to the value of securities for which it has determined other pricing sources are not available or reliable as described above. No single method exists for determining fair value, because fair value depends upon the circumstances of each individual case. As a general principle, the current fair value of a security being valued by the Adviser would be the amount that the Fund might reasonably expect to receive upon the current sale. Methods that are in accordance with this principle may, for example, be based on (i) a multiple of earnings; (ii) a discount from market prices of a similar freely traded security (including a derivative security or a basket of securities traded on other markets, exchanges or among dealers); or (iii) yield to maturity with respect to debt
22
BFS Equity Fund
Notes to the Financial Statements (continued)
May 31, 2019
issues, or a combination of these and other methods. Fair-value pricing is permitted if, in the Adviser’s opinion, the validity of market quotations appears to be questionable based on factors such as evidence of a thin market in the security based on a small number of quotations, a significant event occurs after the close of a market but before the Fund’s NAV calculation that may affect a security’s value, or the Adviser is aware of any other data that calls into question the reliability of market quotations.
The following is a summary of the inputs used to value the Fund’s investments as of May 31, 2019:
| | | Valuation Inputs | | | | | |
Assets | | Level 1 | | | Level 2 | | | Level 3 | | | Total | |
Common Stocks(a) | | $ | 34,306,510 | | | $ | — | | | $ | — | | | $ | 34,306,510 | |
Money Market Funds | | | 1,668,933 | | | | — | | | | — | | | | 1,668,933 | |
Total | | $ | 35,975,443 | | | $ | — | | | $ | — | | | $ | 35,975,443 | |
(a) | Refer to Schedule of Investments for industry classifications. |
The Fund did not hold any investments at the end of the reporting period for which significant unobservable inputs (Level 3) were used in determining fair value; therefore, no reconciliation of Level 3 securities is included for this reporting period.
NOTE 4. TRANSACTIONS WITH AFFILIATES AND OTHER SERVICE PROVIDERS
Under the terms of the investment advisory agreement on behalf of the Fund, the Adviser manages the Fund’s investments subject to oversight of the Board. As compensation for its services, the Fund pays the Adviser a fee, computed and accrued daily and paid monthly, at an annual rate of 0.75% of the average daily net assets of the Fund. For the fiscal year ended May 31, 2019, the Adviser earned a fee of $261,074 from the Fund before the waivers described below. At May 31, 2019, the Fund owed the Adviser $19,528.
The Adviser has contractually agreed to waive its management fee and/or reimburse certain operating expenses until September 30, 2019, but only to the extent necessary so that the Fund’s net expenses, excluding brokerage fees and commissions, borrowing costs (such as interest and dividend expenses on securities sold short), taxes, extraordinary expenses, fees and expenses paid under a distribution plan adopted pursuant to Rule 12b-1, fees and expenses paid under a shareholder services plan, and indirect expenses (such as “acquired funds fees and expenses”) does not exceed 1.00%.
Each waiver or reimbursement of an expense by the Adviser is subject to repayment by the Fund within the three years following such waiver or reimbursement, provided that the Fund is able to make the repayment without exceeding the expense limitation in place at the time of the waiver or reimbursement and the expense limitation in place at the time of the repayment. The contractual agreement is in effect through September 30, 2019. The expense cap may not be terminated prior to this date except by mutual consent of the Adviser and the Board. For the fiscal year ended May 31, 2019, the Adviser waived fees of
23
BFS Equity Fund
Notes to the Financial Statements (continued)
May 31, 2019
$110,755. As of May 31, 2019, the Adviser may seek repayment of investment advisory fees waived and expense reimbursements in the amount of $124,587, $117,155, and $110,755, pursuant to the aforementioned conditions, from the Fund no later than May 31, 2020, 2021, and 2022, respectively.
The Trust retains Ultimus Fund Solutions, LLC (“Ultimus” or “Administrator”) to provide the Fund with administration and compliance, fund accounting, and transfer agent services, including all regulatory reporting. For the fiscal year ended May 31, 2019, the Administrator earned fees of $38,250 for administration and compliance services, $25,000 for fund accounting services and $18,000 for transfer agent services. At May 31, 2019, the Fund owed the Administrator $6,750 for such services.
The officers and one trustee of the Trust are members of management and/or employees of the Administrator. Unified Financial Securities, LLC (the “Distributor” or “Unified”) acts as the principal distributor of the Fund’s shares.
The Fund has adopted a Distribution Plan (the “Plan”) pursuant to Rule 12b-1 under the Investment Company Act of 1940 (the “1940 Act”). The Plan provides that the Fund will pay the Distributor and/or any registered securities dealer, financial institution or any other person (the “Recipient”) a shareholder servicing fee of 0.25% of the average daily net assets of the Fund in connection with the promotion and distribution of the Fund’s shares or the provision of personal services to shareholders, including, but not necessarily limited to, advertising, compensation to underwriters, dealers and selling personnel, the printing and mailing of prospectuses to other than current Fund shareholders, the printing and mailing of sales literature and servicing shareholder accounts (“12b-1 Expenses”). The Fund or Distributor may pay all or a portion of these fees to any Recipient who renders assistance in distributing or promoting the sale of shares, or who provides certain shareholder services, pursuant to a written agreement. For the fiscal year ended May 31, 2019, 12b-1 fees incurred by the Fund were $87,025. The Fund owed $15,675 for 12b-1 fees as of May 31, 2019.
NOTE 5. PURCHASES AND SALES OF SECURITIES
For the fiscal year ended May 31, 2019, purchases and sales of investment securities, other than short-term investments, were $14,317,033 and $13,105,325, respectively.
There were no purchases or sales of long-term U.S. government obligations during the fiscal year ended May 31, 2019.
NOTE 6. FEDERAL TAX INFORMATION
At May 31, 2019, the net unrealized appreciation (depreciation) of investments for tax purposes was as follows:
Gross unrealized appreciation | | $ | 10,166,618 | |
Gross unrealized depreciation | | | (596,717 | ) |
Net unrealized appreciation on investments | | $ | 9,569,901 | |
Tax cost of investments | | $ | 26,405,542 | |
24
BFS Equity Fund
Notes to the Financial Statements (continued)
May 31, 2019
At May 31, 2019, the difference between book basis and tax basis unrealized appreciation (depreciation) is attributable to the tax deferral of losses on wash sales.
At May 31, 2019, the components of distributable earnings (accumulated losses) on a tax basis were as follows:
Undistributed ordinary income | | $ | 39,481 | |
Undistributed long-term capital gains | | | 420,579 | |
Unrealized appreciation (depreciation) | | | 9,569,901 | |
Total | | $ | 10,029,961 | |
The tax character of distributions for the fiscal years ended May 31, 2019 and May 31, 2018 were as follows:
| | 2019 | | | 2018 | |
Distributions paid from:(a) | | | | | | | | |
Ordinary income | | $ | 83,219 | | | $ | 78,543 | |
Long-term capital gains | | | 1,030,144 | | | | 18,461 | |
Total distributions paid | | $ | 1,113,363 | | | $ | 97,004 | |
(a) | For federal income tax purposes, distributions of short-term capital gains are treated as ordinary income distributions. |
NOTE 7. COMMITMENTS AND CONTINGENCIES
The Trust indemnifies its officers and trustees for certain liabilities that may arise from their performance of their duties to the Trust or the Fund. Additionally, in the normal course of business, the Trust enters into contracts that contain a variety of representations and warranties which provide general indemnifications. The Trust’s maximum exposure under these arrangements is unknown, as this would involve future claims that may be made against the Trust that have not yet occurred.
NOTE 8. SUBSEQUENT EVENTS
Management of the Fund has evaluated the need for disclosures and/or adjustments resulting from subsequent events through the date these financial statements were issued. Based upon this evaluation, management has determined there were no items requiring adjustment of the financial statements or additional disclosure.
25
Report of Independent Registered Public Accounting Firm
To the Shareholders of BFS Equity Fund and
Board of Trustees of Valued Advisers Trust
Opinion on the Financial Statements
We have audited the accompanying statement of assets and liabilities, including the schedule of investments, of BFS Equity Fund (“The Fund”), a series of Valued Advisers Trust, as of May 31, 2019, and the related statement of operations for the year then ended, the statements of changes in net assets for each of the two years in the period then ended, including the related notes, and the financial highlights for each of the five years in the period then ended (collectively referred to as the “financial statements”). In our opinion, the financial statements present fairly, in all material respects, the financial position of the Fund as of May 31, 2019, the results of its operations for the year then ended, the changes in its net assets for each of the two years in the period then ended, and the financial highlights for each of the five years in the period then ended, in conformity with accounting principles generally accepted in the United States of America.
Basis for Opinion
These financial statements are the responsibility of the Fund’s management. Our responsibility is to express an opinion on the Fund’s financial statements based on our audits. We are a public accounting firm registered with the Public Company Accounting Oversight Board (United States) (“PCAOB”) and are required to be independent with respect to the Fund in accordance with the U.S. federal securities laws and the applicable rules and regulations of the Securities and Exchange Commission and the PCAOB.
We conducted our audits in accordance with the standards of the PCAOB. Those standards require that we plan and perform the audit to obtain reasonable assurance about whether the financial statements are free of material misstatement, whether due to error or fraud.
Our audits included performing procedures to assess the risks of material misstatement of the financial statements, whether due to error or fraud, and performing procedures that respond to those risks. Such procedures included examining, on a test basis, evidence regarding the amounts and disclosures in the financial statements. Our procedures included confirmation of securities owned as of May 31, 2019, by correspondence with the custodian. Our audits also included evaluating the accounting principles used and significant estimates made by management, as well as evaluating the overall presentation of the financial statements. We believe that our audits provide a reasonable basis for our opinion.
We have served as the Fund’s auditor since 2013.
COHEN & COMPANY, LTD.
Cleveland, Ohio
July 29, 2019
26
BFS Equity Fund
Summary of Fund Expenses (Unaudited)
As a shareholder of the Fund, you incur two types of costs: (1) transaction and (2) ongoing costs, including management fees; and other Fund expenses. These examples are intended to help you understand your ongoing costs (in dollars) of investing in the Fund and to compare these costs with the ongoing costs of investing in other mutual funds. The example is based on an investment of $1,000 invested at the beginning of the period and held for the entire period from December 1, 2018 through May 31, 2019.
Actual Expenses
The first line of the table below provides information about actual account values and actual expenses. You may use the information in this line, together with the amount you invested, to estimate the expenses that you paid over the period. Simply divide your account value by $1,000 (for example, an $8,600 account value divided by $1,000 = 8.6), then multiply the result by the number in the first line under the heading entitled “Expenses Paid During Period” to estimate the expenses you paid on your account during this period.
Hypothetical Example for Comparison Purposes
The second line of the table below provides information about hypothetical account values and hypothetical expenses based on the Fund’s actual expense ratio and an assumed rate of return of 5% per year before expenses, which is not the Fund’s actual return. The hypothetical account values and expenses may not be used to estimate the actual ending account balance or expenses you paid for the period. You may use this information to compare the ongoing costs of investing in the Fund and other funds. To do so, compare this 5% hypothetical example with the 5% hypothetical examples that appear in the shareholder reports of the other funds.
Expenses shown in the table are meant to highlight your ongoing costs only and do not reflect any transactional costs. Therefore, the second line of the table below is useful in comparing ongoing costs only and will not help you determine the relative costs of owning different funds. In addition, if transaction costs were included, your costs would have been higher.
| | Beginning
Account Value
December 1, 2018 | Ending
Account Value
May 31, 2019 | Expenses Paid
During Period(a) | Annualized
Expense Ratio |
Actual | $1,000.00 | $1,033.10 | $ 6.34 | 1.25% |
Hypothetical(b) | $1,000.00 | $1,018.70 | $ 6.29 | 1.25% |
(a) | Expenses are equal to the Fund’s annualized expense ratios, multiplied by the average account value over the period, multiplied by 182/365 (to reflect the one-half year period). |
(b) | Hypothetical assumes 5% annual return before expenses. |
27
Additional Federal Income Tax Information
(Unaudited)
The Form 1099-DIV you receive in January 2020 will show the tax status of all distributions paid to your account in calendar year 2019. Shareholders are advised to consult their own tax adviser with respect to the tax consequences of their investment in the Fund. As required by the Internal Revenue Code and/or regulations, shareholders must be notified regarding the status of qualified dividend income for individuals and the dividends received deduction for corporations.
Qualified Dividend Income. The Fund designates approximately 100% or up to the maximum amount of such dividends allowable pursuant to the Internal Revenue Code, as qualified dividend income eligible for the reduced tax rate.
Dividends Received Deduction. Corporate shareholders are generally entitled to take the dividends received deduction on the portion of the Fund’s dividend distribution that qualifies under tax law. For the Fund’s calendar year 2019 ordinary income dividends, 100% qualifies for the corporate dividends received deduction.
For the fiscal year ended May 31, 2019, the Fund designated $1,030,144 as 20% long-term capital gain distributions.
Trustees and Officers (Unaudited)
The Board of Trustees supervises the business activities of the Trust. Each Trustee serves as a trustee until termination of the Trust unless the Trustee dies, resigns, retires or is removed.
The following table provides information regarding each of the Independent Trustees.
Name, Address*, Age,
Position with Trust**,
Term of Position with Trust | Principal Occupation During
Past 5 Years and Other Directorships | Other Directorships |
Andrea N. Mullins, 52
Independent Trustee
Since December 2013 Chairperson since
March 2017 | Current:Private investor; Independent Contractor, SWM Advisors (since April 2014). | Trustee, Angel Oak Funds Trust (since February 2019) (4 portfolios); Trustee, Angel Oak Strategic Credit Fund (since February 2019) Angel Oak Financial Strategies Income Term Trust (since April 2019). |
28
Trustees and Officers (Unaudited) (continued)
Name, Address*, Age,
Position with Trust**,
Term of Position with Trust | Principal Occupation During
Past 5 Years and Other Directorships | Other Directorships |
Ira P. Cohen,60
Independent Trustee
Since June 2010 | Current:Independent financial services consultant (since February 2005); Executive Vice President of Asset Management Services, Recognos Financial (since August 2015). | Trustee and Audit Committee Chairman, Griffin Institutional Access Credit Fund (since January 2017); Trustee and Audit Committee Chairman, Griffin Institutional Real Estate Access Fund (since May 2014); Trustee, Angel Oak Financial Strategies Income Term Trust (since April 2019) Angel Oak Funds Trust (since October 2014) (4 portfolios) Trustee, Chairman, and Nominating and Governance Committee Chairman, Angel Oak Strategic Credit Fund (since December 2017). |
The following table provides information regarding the Trustee who is considered an “interested person” of the Trust, as that term is defined under the 1940 Act. Based on the experience of the Trustee, the Trust concluded that the individual described below should serve as a Trustee.
Name, Address*, Age,
Position with Trust**,
Term of Position with Trust | Principal Occupation During Past 5 Years | Other Directorships |
Mark J. Seger, 57
Trustee
Since March 2017 | Current:Vice Chairman of Ultimus Fund Solutions, LLC (since 1999). Previous: Managing Director and Co-Chief Executive Officer of Ultimus Fund Solutions, LLC (since 1999). | None. |
* | The address for each Trustee is 225 Pictoria Drive, Suite 450, Cincinnati, Ohio 45246. |
** | As of the date of this report, the Trust consists of 12 series. |
29
Trustees and Officers (Unaudited) (continued)
The following table provides information regarding the Officers of the Trust:
Name, Address*, Age,
Position with Trust**,
Term of Position with Trust | Principal Occupation During Past 5 Years | Other Directorships |
Adam T. Kornegay,34
Principal Executive Officer and President
Since April 2018 | Current:Assistant Vice President, Business Development Director, Ultimus Fund Solutions, LLC (since March 2015). Previous:Vice President, Citigroup, Inc. (July 2009 to February 2015). | None. |
Gregory Knoth, 49
Principal Financial Officer and Treasurer
Since April 2019 | Current:Vice President, Mutual Fund Controller, Ultimus Fund Solutions, LLC (since December 2015). Previous:Vice President and Manager of Fund Accounting, Huntington Asset Services, Inc. (n/k/a Ultimus Asset Services, LLC) (June 2013 to December 2015). | None. |
Martin R. Dean, 55
Interim Chief
Compliance Officer
Since May 2019 | Current:Vice President, Director of Fund Compliance of Ultimus Fund Solutions, LLC (since January 2016) Previous:Senior Vice President and Compliance Group Manager, Huntington Asset Services, Inc. (n/k/a Ultimus Asset Services, LLC) (July 2013 to December 2015). | None. |
Carol J. Highsmith, 54
Vice President
Since August 2008 Secretary
Since March 2014 | Current:Assistant Vice President, Ultimus Fund Solutions, LLC (since December 2015). Previous: Employed in various positions with Huntington Asset Services, Inc. (n/k/a Ultimus Asset Services, LLC) (November 1994 to December 2015), most recently Vice President of Legal Administration (2005 to December 2015). | None. |
* | The address for each officer is 225 Pictoria Drive, Suite 450, Cincinnati, Ohio 45246. |
** | As of the date of this report, the Trust consists of 12 series. |
Other Information (Unaudited)
The Fund’s Statement of Additional Information (“SAI”) includes additional information about the trustees and is available without charge, upon request. You may call toll-free at (855) 575-2430 to request a copy of the SAI or to make shareholder inquiries.
30
FACTS | WHAT DOES VALUED ADVISERS TRUST DO WITH YOUR PERSONAL INFORMATION? |
| | |
Why? | Financial companies choose how they share your personal information. Federal law gives consumers the right to limit some but not all sharing. Federal law also requires us to tell you how we collect, share, and protect your personal information. Please read this notice carefully to understand what we do. |
| | |
What? | The types of personal information we collect and share depend on the product or service you have with us. This information can include: ■ Social Security number ■ account balances and account transactions ■ transaction or loss history and purchase history ■ checking account information and wire transfer instructions When you areno longer our customer, we continue to share your information as described in this notice. |
| | |
How? | All financial companies need to share customers’ personal information to run their everyday business. In the section below, we list the reasons financial companies can share their customers’ personal information; the reasons Valued Advisers Trust chooses to share; and whether you can limit this sharing. |
| | |
Reasons we can share your personal information | Does Valued Advisers Trust share? |
For our everyday business purposes —
such as to process your transactions, maintain your account(s), respond to court orders and legal investigations, or report to credit bureaus | Yes |
For our marketing purposes —
to offer our products and services to you | Yes |
For joint marketing with other financial companies | No |
For our affiliates’ everyday business purposes –
information about your transactions and experiences | No |
For our affiliates’ everyday business purposes –
information about your creditworthiness | No |
For nonaffiliates to market to you | No |
| | |
Questions? | Call 1-855-575-2430 |
31
Who we are |
Who is providing this notice? | Valued Advisers Trust |
What we do |
How does Valued Advisers Trust protect my personal information? | To protect your personal information from unauthorized access and use, we use security measures that comply with federal law. These measures include computer safeguards and secured files and buildings. |
How does Valued Advisers Trust collect my personal information? | We collect your personal information, for example, when you ■ open an account or deposit money ■ buy securities from us or sell securities to us ■ make deposits or withdrawals from your account or provide account information ■ give us your account information ■ make a wire transfer ■ tell us who receives the money ■ tell us where to send the money ■ show your government-issued ID ■ show your driver’s license |
Why can’t I limit all sharing? | Federal law gives you the right to limit only ■ sharing for affiliates’ everyday business purposes — information about your creditworthiness ■ affiliates from using your information to market to you ■ sharing for nonaffiliates to market to you State laws and individual companies may give you additional rights to limit sharing. |
Definitions |
Affiliates | Companies related by common ownership or control. They can be financial and nonfinancial companies. |
Nonaffiliates | Companies not related by common ownership or control. They can be financial and nonfinancial companies. ■Valued Advisers Trust does not share your personal information with nonaffiliates so they can market to you. |
Joint marketing | A formal agreement between nonaffiliated financial companies that together market financial products or services to you. ■Valued Advisers Trust doesn’t jointly market financial products or services to you. |
32
This page is intentionally left blank.
Proxy Voting
A description of the policies and procedures that each Fund uses to determine how to vote proxies relating to portfolio securities and information regarding how each Fund voted those proxies during the most recent twelve month period ended June 30, is available without charge upon request by (1) calling the Fund at (855) 575-2430 and (2) from Fund documents filed with the Securities and Exchange Commission (“SEC”) on the SEC’s website at www.sec.gov.
TRUSTEES
Andrea N. Mullins, Chairperson
Ira P. Cohen
Mark J. Seger
OFFICERS
Adam T. Kornegay, Principal Executive Officer and President
Gregory Knoth, Principal Financial Officer and Treasurer
Martin R. Dean, Interim Chief Compliance Officer
Carol J. Highsmith, Vice President and Secretary
INVESTMENT ADVISER
Bradley, Foster & Sargent, Inc.
185 Asylum Street, City Place II
Hartford, CT 06103
DISTRIBUTOR
Unified Financial Securities, LLC
9465 Counselors Row, Suite 200
Indianapolis, IN 46240
INDEPENDENT REGISTERED PUBLIC ACCOUNTING FIRM
Cohen & Company, Ltd.
1350 Euclid Avenue, Suite 800
Cleveland, OH 44115
LEGAL COUNSEL
Stradley Ronon Stevens & Young, LLP
2005 Market Street, Suite 2600
Philadelphia, PA 19103
CUSTODIAN
Huntington National Bank
41 South High Street
Columbus, OH 43215
ADMINISTRATOR, TRANSFER AGENT AND FUND ACCOUNTANT
Ultimus Fund Solutions, LLC
225 Pictoria Drive, Suite 450
Cincinnati, OH 45246
This report is intended only for the information of shareholders or those who have received the Fund’s prospectus which contains information about the Fund’s management fee and expenses. Please read the prospectus carefully before investing.
Distributed by Unified Financial Securities, LLC
Member FINRA/SIPC
Beginning on January 1, 2021, as permitted by regulations adopted by the Securities and Exchange Commission, paper copies of the Fund’s shareholder reports like this one will no longer be sent by mail, unless you specifically request paper copies of the reports from the Fund or from your financial intermediary such as a broker-dealer or bank. Instead, the reports will be made available on a website, and you will be notified by mail each time a report is posted and provided with a website link to access the report.
If you already elected to receive shareholder reports electronically, you will not be affected by this change and you need not take any action. You may elect to receive shareholder reports and other communications from the Fund electronically by contacting the Fund at (877) 336-6763 or, if you own these shares through a financial intermediary, you may contact your financial intermediary.
You may elect to receive all future reports in paper free of charge. You can inform the Fund that you wish to continue receiving paper copies of your shareholder reports by contacting the Fund at (877) 336-6763. If you own shares through a financial intermediary, you may contact your financial intermediary or follow instructions included with this document to elect to continue to receive paper copies of your shareholder reports. Your election to receive reports in paper will apply to all funds held with the fund complex or at your financial intermediary.
To Shareholders of the LS Opportunity Fund,
Prospector Partners, LLC (“Prospector”), based in Guilford, CT is the sub-advisor of the LS Opportunity Fund (“LSOFX” or the “Fund”). Prospector has a long/short hedge fund track record that spans 20 years with a substantially similar investment objective to LSOFX and brings its experience to our Fund in a daily liquid mutual fund format with a goal of downside protection and consistency of returns.
The Fund aims to generate long-term capital appreciation by investing in both long and short positions within a portfolio consisting of primarily publicly traded common stock, with less net exposure than that of the stock market in general. Through extensive research, risk management, and no leverage in the long book, the Fund strives to preserve capital while delivering solid risk-adjusted returns and managing volatility. For additional information, please visit our website at www.longshortadvisors.com.
“Grind It Out” Consistency
First and foremost, we at Long Short Advisors would like to thank the team at Prospector Partners for another job well done. As of May 31, 2019, Prospector Partners has been the sub-advisor of the LS Opportunity Fund for four years.
This year has ushered in the return of volatility to the markets, which led to the long-awaited return to interest in long/short investing. Over the past 12 months, LSOFX saw ~40% growth in assets as investors began to value the consistency of returns offered by long/short funds instead of “home-run” investments. As volatility increases, global growth slows, and geopolitical tensions strain the international economy, we believe that the flow of capital into long/short funds will continue to grow.
We believe in Prospector’s defensive approach to investing: win by not losing. Prospector evaluates every long and short position from a credit perspective and runs an analysis to determine the maximum loss that could result from taking the position. If either the credit or maximum loss analyses fail to meet requirements, the Fund will not invest. Prospector’s aversion to large losses in the Fund is augmented by their vested interest in the Fund’s success, as a significant amount of their own capital is invested in LSOFX. Most importantly, the win by not losing approach has driven results, namely top-tier risk-adjusted returns and consistency of returns.
How do we show consistency?
Take a look at Figure 1: Sharpe Ratio vs. Omega below. The LS Opportunity Fund, highlighted in dark blue, stands out among its peer group (Morningstar Long Short Equity Universe) in the preferred upper right quadrant.
1
Risk-Adjusted Return and Consistency Measures vs Peer Group
4 Years Ending May 31, 2019
Consistency of Returns - Preferred Quadrant = Upper Right
Analysis of Peer Group (5%-95%): Open End Funds - U.S. - Long-Short Equity

Figure 1: Sharpe Ratio vs Omega
The Sharpe ratio uses standard deviation to measure a fund’s risk-adjusted returns; the higher the ratio, the better a fund’s returns have been relative to the risk of its investments. Because it uses standard deviation, the Sharpe ratio can be used to compare risk-adjusted returns across all fund categories.
The Omega ratio is a relative measure of the likelihood of achieving a given return, such as a minimum acceptable return (MAR) or a target return; the higher the omega value, the greater the probability that a given return will be met or exceeded.
Omega divides expected returns into two parts: gains and losses, or returns above the expected rate (the upside) and those below it (the downside). Simply put, consider Omega as the ratio of upside (good) returns relative to downside (bad) returns.
All statistical jargon aside, we believe Omega gives a more complete picture of an investment’s likelihood of success than the Sharpe ratio. Thus, if two potential investments were identical in Sharpe and return but the second had a higher Omega, then it would be the wiser choice in which to invest.
Evidenced by the Fund’s excellence in both Sharpe and Omega relative to its peers, Prospector’s investment strategy can work for more than just a flash in the pan. Steady, consistent returns have always been, and remain, a top priority.
Congratulations to Prospector Partners for leading the LS Opportunity Fund to this high honor and a strong demonstration of consistency.
2
Looking Forward
Quantitative performance figures and risk data are both backward-looking affirmations of the results, but we believe a strict adherence to qualitative characteristics can potentially drive the Fund’s success moving forward. Prospector Partners have developed many key attributes in an effort to generate constant returns over the past 22 years as an asset manager and now for four years as the manager of the LS Opportunity Fund. To name a few:
| | ● | Goal of Stability: net exposure between 50% and 80%, no market timing |
| | ● | Goal of Safety: value plays in both long and short holdings, no “big factor” bets |
| | ● | Familiarity: investing in sectors they know extremely well |
| | ● | Reinvestment: 80% Investment Reuse |
| | ● | Functionality: shorting for Alpha, not just for hedging |
| | ● | Skin in the Game: experienced team with their money on the line next to yours |
Prospector Partners’ consistent investment philosophy and attributes have fueled consistent returns in the LS Opportunity Fund.
For more information on investment strategy, call Long Short Advisors at 215-399-9409.
Performance
For the 12-month period ended May 31, 2019 (the “Period”), LSOFX returned +3.44%, while the HFRX Equity Hedge Index returned -6.18%. However, the S&P 500 Index finished the Period with a return of +3.78%.
Performance of LSOFX, S&P 500 and HFRX
During the Year Ended May 31, 2019
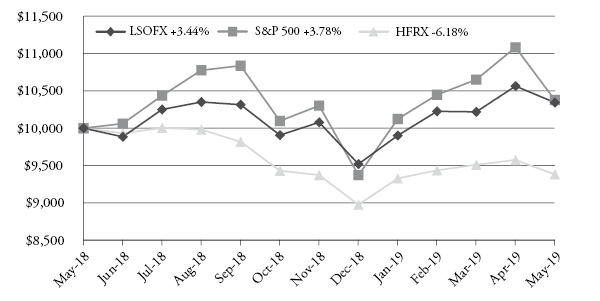
3
Performance Since Prospector Became Sub-Adviser of LSOFX
(June 2015 - May 2019)

Current Market Commentary
It’s been a year since Jerome Powell led his first FOMC meeting as Chairman. Powell’s outlook on the economy at the time was rosy. During the March 2018 meeting, the economic outlook strengthened and the 2019 GDP growth forecast rose from 2.1% to 2.4% with benign inflation expectations. Despite political pressure from the White House, the Fed’s “dot plot” indicated three rate hikes in 2018, three in 2019, and two in 2020. Additionally, Powell stated the Fed’s balance sheet would continue to run off, barring a significant and unexpected weakening in the outlook.
Fast forward 12 months and the Fed’s outlook has changed entirely. The 2019 GDP growth outlook has slowed, and the Fed is also expressing concern regarding current market sentiment and global growth. Internationally, 10-year government yields have once again gone negative in Germany and Japan. As a result, Fed officials are unlikely to raise rates and will halt the runoff of the $4.0 trillion balance sheet at the end of September.
The market’s prognosis on the economy is worse. The yield curve is partially inverted (which could be indicative of a looming recession) and the market is assigning a significant probability the Fed will cut rates this year. No doubt the White House will pressure the Fed to cut rates in front of the upcoming 2020 election. That said, numerous Fed officials are dismissing the possibility of a rate cut. Whether a cut comes to fruition or not, the yield curve should remain relatively flat this year. We also believe the fixed income markets will remain in a “holding pattern” until further economic data is released and as we see developments in trade talks and Brexit.
In past letters, we have asserted that there are no immediate signs of a U.S. recession, despite what the curve is indicating. To summarize, credit quality is excellent, GDP growth is robust (albeit slower), most investment-grade corporate balance sheets are in good shape, the consumer remains healthy, and there aren’t obvious financial excesses. The only recession indicators we can point to are a widening of credit spreads off the early 2018 low levels and
4
inversions in the yield curve (which can be a false flag as we discussed last year). That said, recessions are often sourced from exogenous events which arrive with little warning.
If a recession occurs in the near term, we think it will likely be a mild one and unlike the 2008 recession. It has been some time since we experienced a garden-variety recession (the last one occurring in 2001 when the U.S. economy contracted a mere 0.6%). We also do not see asset bubbles that could result in a disastrous implosion. However, one area of concern is in the private equity and leveraged lending markets. Given this extended period of low rates, investors have “chased” returns by flocking to illiquid assets. The private credit market alone has nearly quadrupled in size since 2007. There has also been a dramatic rise in “dry powder” and deal valuations; the average private equity deal through the cycle has risen from 7x Enterprise Value / EBITDA to 13x, coupled with an increase in leverage. Our interpretation is too much capital is chasing too few deals. This results in private investment firms paying higher prices and/or accepting a lower return. In the event of a “normal” recession, lower-quality leveraged loans and portfolio companies will likely come under pressure. While not a large systemic risk to the economy, pressure on private markets could create a negative wealth effect, freeze up the alternative credit market, and leave many portfolio companies “broken” which could exacerbate an economic contraction.
Another area of concern is the national debt level of the U.S. which now stands at $22 trillion. This figure represents a $2 trillion increase since President Trump took office. Today, national Debt / GDP stands at 104%, far above the 63% level in 2007. A higher debt level constrains future growth and makes it harder to engage in discretionary fiscal spending to limit the impact of an economic contraction. Additionally, the recent tax cut will further exacerbate the fiscal deficit, effectively removing a fiscal tool that could have been used in the next downturn.
As for the international markets, China is worrisome. The U.S. / China trade talks are a wildcard with an uncertain outcome. However, our greatest concern is the Chinese leveraging cycle of the past decade. Total debt / GDP is estimated to be over 300% which has almost doubled in size since 2007. With growth in China modestly slowing (if you trust the official numbers) and a surge in known defaults (¥120B defaults in 2018, four times the 2017 rate), China looks increasingly due for a deleveraging cycle. While we are not experts on China and hold no direct exposure in your portfolio, any economic contraction will inevitably spill over to the global economy.
If a recession or economic shock is around the corner, we believe our focus on first questioning the downside of every potential investment can act as a buffer. Your portfolio is invested in companies with conservatively-stated balance sheets, substantial franchise values, what we believe are significant cash flow generating capabilities, trading at reasonable valuations and avoiding excessive risk taking. Importantly, we are short companies that exhibit the opposite characteristics. That said, if an economic contraction does not occur, we believe your portfolio should continue to produce what we feel are acceptable risk-adjusted returns.
Portfolio Implications from the Dovish Turn by the Fed
We continue to avoid the “buy growth regardless of price” segment of the market in general and this sector in particular. Value investing with an emphasis on capital protection remains our focus.
5
Given our value bias, you might expect an inflection in Fed policy would drive some level of portfolio rebalancing. Surprisingly, that is not the case at this time, as we see significant opportunity in two traditionally value-oriented industries: property casualty insurance and banking.
Our case for property casualty stocks revolves around stable business conditions where pricing continues to modestly out pace loss costs, reasonable valuations, accretive capital management, and a steady wave of industry consolidation that has seen seven portfolio companies acquired at premium prices over the past five years.
On the banking side, one might expect us to be nervous this late in the economic cycle at the prospect of an adverse credit cycle slashing banking industry profitability. This cycle looks different to us. The significant credit exposures are resident in the non-bank leveraged-loan market as well as the bloated Baa-/ BBB-and high yield securitized debenture markets. We believe that the banking institutions we own in your portfolio will outperform the credit experience of a typical bank through a normal recession. When combined with discount valuations, modest earnings growth, robust capital management, and a reawakening of consolidation, we feel the investment prospects of our banks are bright.
Spill in the Ketchup Aisle
On February 21st, 2019, Kraft Heinz (KHC) reported earnings results that sent the stock cratering down 27% the next day. KHC not only reported EPS below the consensus estimate for 4Q, but it also issued weak 2019 guidance, slashed its dividend by 36%, and most notably recorded a $15.4B impairment charge on the carrying value of its U.S. Refrigerated and Canada Retail units, along with the trademarks of its Kraft and Oscar Mayer brands. While our philosophy of avoiding highly-levered companies kept us relatively safe from this catastrophe (portfolio holding Berkshire Hathaway (BRK.B) did decline on the announcement, given its large ownership of KHC), it inspired us to reevaluate the category as a whole and make some modest portfolio changes.
First, some background; in June of 2013, the Brazilian private equity firm 3G Capital, with the help of Berkshire Hathaway, closed on a deal to take the centuries-old ketchup maker H.J. Heinz private. The deal came at a price of $28B (including the assumption of Heinz’s debt) and represented a 20% premium to the company’s stock price the day before the announcement. Later, in March of 2015, the group merged H.J. Heinz with then publicly traded Kraft Foods to create Kraft Heinz (KHC), the third largest food and beverage company in North America.
3G Capital has earned a reputation for ruthlessly cutting costs and driving profit margins higher by implementing a strategy known as Zero-Based Budgeting, or ZBB for short. ZBB is a framework whereby managers must justify all expenses from scratch each year, no matter how small, as opposed to using the prior year’s budget as a baseline. This process is more time consuming than traditional budgeting practices and often requires a significant shift in the culture of an organization, as non-necessities such as private jets, expensive hotels, or even seemingly innocuous activities such as single-sided printing are removed from daily practices.
6
While 3G did not invent Zero-Based Budgeting, it is often cited as the one who perfected and popularized the practice after implementing the strategy at various acquired companies. The results were most notable at two giants in the consumer staples category, AB InBev (the product of InBev’s $52B purchase of Anheuser Busch in 2008, orchestrated by 3G), and Kraft Heinz. For example, ABInBev currently boasts an industry-leading EBITDA margin of 39.2% for fiscal year 2018 (compared to Heineken at 21.2% and Molson Coors at 21.8%), while Kraft Heinz expanded its EBITDA margins from 18.8% in 2012 (pre-3G acquisition and Kraft merger) to as high as 31.9% in 2016.
Although ZBB often required significant layoffs, amongst other difficult choices, the results were simply too great to ignore. Zero-Based Budgeting became the Topic Du Jour at investment conferences and in company earnings calls in the years that followed. Many companies announced that they would be launching their own ZBB programs, whether due to pressure from activist investors or their own boardrooms. The premise was that ZBB would allow companies to realize cost savings that would then enable them to reinvest behind their businesses and drive growth.
While 3G changed how companies viewed themselves internally, it also inspired investors to view these companies through a 3G-like lens. “If 3G drove margins to 39% at ABI, why can’t the same be done at XYZ beverage company?” There is no doubt that the prospect of 1,000+ basis points of margin expansion had a significant impact on the private market value assumptions of investors (such as ourselves at Prospector), thus boosting valuations of lower-margin businesses throughout the past couple of years. Despite revenue growth in the low single-digits and inflation in commodities and transportation costs, the earnings growth playbook was still possible with continued cost cutting.
Things began to change as large legacy brands started seeing their market shares eroding to competition by more specialized local brands and private label competition (a trend we discussed in past letters and a major theme to our short positions in the sector). It appeared that years of overhead reduction, including marketing and advertising investment, might be putting these companies at a disadvantage in an ever-changing consumer landscape marked with shifts to specialized and online channels, along with consumer preference towards better-for-you products. These fears seemed confirmed with KHC’s earnings results.
As mentioned earlier, this event caused us to reevaluate our holdings in the sector: Mondelez International (MDLZ), for example. While MDLZ has been executing well, has strong brands, and has had an impressive run of margin expansion (growing adjusted operating margins from 10.6% to 16.7% since 2013), our thesis (and estimate of private market value) called for further expansion into the 18-20% range. Given the likelihood that excessive cost cutting will be called into question by the industry and MDLZ stock’s relative strength, we decided to reduce our position.
We continue to believe in the long-term prospects for well-run consumer staples franchises. We prefer those companies that remain on the cutting edge by identifying the needs of today’s ever-changing consumer, delivering differentiated products, while investing at appropriate levels that enable these brands to flourish. We avoid those who are overly-reliant on a small number of powerful retailers for their distribution as well as those who are unduly exposed
7
to volatile commodity prices for their inputs. Not surprisingly, we seek to short companies challenged by the aforementioned industry dynamics.
Outlook
After a ten-year post-financial crisis period of consistent underlying conditions for equity investing, fundamentals are shifting. Modestly-slowing economic growth and macro concerns have given investors pause and led to a rerating of certain risk assets. Regardless, the U.S. economy remains fundamentally healthy and continues to be a global leader.
Interest and mortgage rates continue near historically low levels, having retracted by 90 basis points from the November highs as inflation remains benign and economic growth moderates. Although we are clearly late in the economic cycle, the odds of a 2019 recession without a full-blown trade war seem low. Investment-grade corporations have decent balance sheets and are currently producing acceptable free cash flows. We are carefully monitoring aggregate corporate debt levels (especially the BBB-debt which is a single notch above junk status), which now sit above pre-2008 crisis levels. The 2018 corporate tax cuts and the ability to repatriate foreign cash holdings should continue to drive higher employment, M&A activity, and capital returns including buybacks and dividends. Profit margins remain near all-time high levels, currently 11%, and look to be at some risk from higher wages, interest expense, and input costs.
In our estimation, equity valuations have quickly bounced back to elevated levels. During the last four months of 2018, we moved to the seventh decile from the tenth decile on trailing operating earnings, only to rebound back to the ninth decile by spring of 2019. Equities look most reasonable when comparing earnings yields to Treasury or even high-grade corporate bond yields. In any case, the values inherent in your portfolio should attract acquirers and other investors over time. Meanwhile, we believe equities are a superior asset allocation alternative to bonds over the longer term.
Steadfast, we remain committed to our goal of making you money while protecting your wealth.
Long Book
Top Positions
At Period’s end, the Fund contained 68 long positions in the portfolio representing companies with what management believes represents long-term value and favorable characteristics such as a discount to private market value, attractive free cash flow yields, and strong balance sheets. The Fund’s top 10 long positions represented approximately 29% of the portfolio and included Aflac (AFL), Berkshire Hathaway (BRK.B), Brown & Brown (BRO), Axis Capital (AXS), Microsoft (MSFT), PNC Financial (PNC), Progressive (PGR), Renaissance RE (RNR), Nestle (NESN), and US Bancorp (USB).
Contributors
The five stocks in the long book that contributed the largest returns during the Period, from largest to smallest were:
8
RenaissanceRe Holdings (RNR), Church & Dwight (CHD), Microsoft (MSFT), Nestle S.A. (NESN. SW) and Merck & Co. (MRK).
Detractors
The three stocks in the long book that detracted from returns the most during the Period, from largest to smallest were:
William Hill PLC (WMH.LN), Schlumberger (SLB), and Noble Energy (NBL)
If listing 5 names, the next two are: KeyCorp (KEY), Invesco (IVZ)
Largest Purchases
The top purchases by dollar value in the long book for the Period were:
SunTrust Bank (STI), Leidos Holdings (LDOS), PNC Financial Services Group (PNC), Axis Capital Holdings (AXS) and Hanover Insurance Group (THG)
Largest Sales
The top sales by dollar value in the long book for the Period were:
SunTrust Bank (STI), T. Rowe Price Group (TROW), Hartford Financial Services Group (HIG), Marsh & McLennan Companies (MMC) and Arch Capital Group (ACGL)
Short Book
Top Positions
The Fund’s short book at Period’s end contained 40 individual companies that have business model challenges, excessive valuations, and/or potential balance sheet issues. The Fund’s top 20 short positions represented approximately 22% of the portfolio.
“The Secret of Wealth Creation is to Avoid Large Losses”
-John Gillespie, portfolio manager
As we write this annual update the U.S. Stock Market is again approaching record highs. We believe it is a great time to be adding to a proven long/short manager.
Thank you for your continued support and we look forward to reporting to you again following our semi-annual date of November 30, 2019.
Steadfast, we remain committed to making you money while protecting your wealth.
Long Short Advisors
9
Mutual Fund investing involves risk, principal loss is possible. You should carefully consider the investment objectives, potential risks, management fees, and charges and expenses of the Fund before investing. The Fund’s prospectus contains this and other information about the Fund, and should be read carefully before investing. You may obtain a current copy of the Fund’s prospectus by calling 1.877.336.6763. The Fund is distributed by Unified Financial Securities, LLC.
Investment in shares of a long/short equity fund has the potential for significant risk and volatility. A short equity strategy can diminish returns in a rising market as well as having the potential for unlimited losses. These types of funds typically have a high portfolio turnover that could increase transaction costs and cause short-term capital gains to be realized.
The performance data quoted represents past performance; past performance does not guarantee future results. The investment return and principal value of an investment in the Fund will fluctuate so that an investor’s shares, when redeemed, may be worth more or less than their original cost. Current performance of the Fund may be lower or higher than the performance quoted. For performance current to the most recent month end, call 1-877-336-6763.
10
Investment Results (Unaudited)
Average Annual Total Returns(a)
(For the periods ended May 31, 2019) | |
| | One
Year | Three
Year | Five
Year | Since
Inception
(September 30,
2010) | |
LS Opportunity Fund | 3.44% | 7.09% | 5.08% | 6.29% | |
S&P 500® Index(b) | 3.78% | 11.72% | 9.66% | 13.03% | |
HFRX Equity Hedge Index(c) | -6.18% | 2.24% | 0.69% | 0.47% | |
Total annual operating expenses, as disclosed in the LS Opportunity Fund’s (the “Fund”) prospectus dated September 28, 2018, were 3.33% of average daily net assets (2.97% after fee waivers and expense reimbursements by Long Short Advisors, LLC (the “Adviser”)). The Adviser has entered into an expense limitation agreement, pursuant to which it will waive its fees and/or reimburse other expenses of the Fund until September 30, 2019, so that Total Annual Fund Operating Expenses does not exceed 1.95%. This operating expense limitation does not apply to borrowing costs such as interest and dividends on securities sold short, taxes, brokerage commissions, other expenditures which are capitalized in accordance with generally accepted accounting principles, other extraordinary expenses not incurred in the ordinary course of the Fund’s business, expenses incurred under a Rule 12b-1 plan of distribution, “acquired fund fees and expenses,” and expenses that the Fund has incurred but did not actually pay because of an expense offset arrangement. Each fee waiver or reimbursement of an expense by the Adviser is subject to repayment by the Fund within the three years following such waiver or reimbursement, provided that the Fund is able to make the repayment without exceeding the expense limitation in place at the time of the waiver or reimbursement and the expense limitation in place at the time of the repayment. This agreement may only be terminated by mutual consent of the Adviser and the Board of Trustees. |
The performance quoted represents past performance, which does not guarantee future results.The investment return and principal value of an investment will fluctuate so that an investor’s shares, when redeemed, may be worth more or less than their original cost. The returns shown do not reflect deduction of taxes that a shareholder would pay on Fund distributions or the redemption of Fund shares. Prior to May 28, 2015, the Fund’s performance was attributable to a previous sub-adviser. The Fund’s investment objectives, risks, charges and expenses must be considered carefully before investing. Current performance of the Fund may be lower or higher than the performance quoted. Performance data current to the most recent month end may be obtained by calling (877) 336-6763.
(a) Average annual total returns reflect any change in price per share and assume the reinvestment of all distributions, if any. The Fund’s returns reflect any fee reductions during the applicable periods. If such fee reductions had not occurred, the quoted performance would have been lower.
11
(b) The S&P 500® Index (“Index”) is a widely recognized unmanaged index of equity prices and is representative of a broader market and range of securities than is found in the Fund’s portfolio. The Index is an unmanaged benchmark that assumes reinvestment of all distributions and excludes the effect of taxes and fees. Individuals cannot invest directly in this Index; however, an individual can invest in exchange-traded funds or other investment vehicles that attempt to track the performance of a benchmark index.
(c) The HFPX Equity Hedge Index is compiled by Hedge Fund Research, Inc. It is comprised solely of hedge funds, and is designed to be representative of the overall composition of the hedge fund universe implementing a long/short equity strategy. The index is not available for direct investment.
The Fund’s investment objectives, risks, charges and expenses must be considered carefully before investing. The prospectus contains this and other important information about the Fund and may be obtained by calling (877) 336-6763. Please read it carefully before investing.
The Fund is distributed by Unified Financial Securities, LLC, member FINRA/SIPC.
12
Comparison of the Growth of a $10,000 Investment in the LS Opportunity Fund,
the HFRX Equity Hedge Index and the S&P 500® Index (Unaudited)

The chart above assumes an initial investment of $10,000 made on September 30, 2010 (commencement of Fund operations) and held through May 31, 2019.THE FUND’S RETURNS REPRESENT PAST PERFORMANCE AND DO NOT GUARANTEE FUTURE RESULTS.The returns shown do not reflect deduction of taxes that a shareholder would pay on the Fund’s distributions or the redemption of the Fund’s shares. Investment returns and principal values will fluctuate so that your shares, when redeemed, may be worth more or less than their original purchase price.
Current performance may be lower or higher than the performance data quoted. For more information on the Fund, and to obtain performance data current to the most recent month-end, or to request a prospectus, please call (877) 336-6763. You should carefully consider the investment objectives, potential risks, management fees, and charges and expenses of the Fund before investing. The Fund’s prospectus contains this and other information about the Fund, and should be read carefully before investing.
The Fund is distributed by Unified Financial Securities, LLC, member FINRA/SIPC.
13
Fund Holdings (Unaudited)
Sector Exposure (5/31/2019)
(Based on Net Assets)
| | Long | Short | Gross | Net |
Consumer Discretionary | 4.67% | -1.52% | 6.19% | 3.15% |
Consumer Staples | 8.32% | -5.98% | 14.30% | 2.34% |
Energy | 3.04% | 0.00% | 3.04% | 3.04% |
Financials | 45.63% | -19.61% | 65.24% | 26.02% |
Health Care | 6.74% | -1.53% | 8.27% | 5.21% |
Industrials | 4.27% | -0.72% | 4.99% | 3.55% |
Information Technology | 10.53% | 0.00% | 10.53% | 10.53% |
Materials | 1.58% | 0.00% | 1.58% | 1.58% |
Real Estate | 0.40% | 0.00% | 0.40% | 0.40% |
Total Sector Exposure | 85.18% | -29.36% | 114.54% | 55.82% |
Call Options Purchased | 0.00%(a) | 0.00%(a) | 0.00%(a) | 0.00%(a) |
Money Market & Other Investments | 14.82% | -0.37% | 15.19% | 14.45% |
(a) | Rounds to less than 0.005%. |
The LS Opportunity Fund seeks to generate long-term capital appreciation by investing in both long and short positions within a portfolio consisting of primarily publicly-traded common stock, with less net exposure than that of the stock market in general.
Availability of Portfolio Schedules (Unaudited)
The Fund files its complete schedule of investments with the Securities and Exchange Commission (“SEC”) as of the end of the first and third quarters of each fiscal year on Form N-Q. The Fund’s Forms N-Q are available at the SEC’s website at www.sec.gov.
14
LS Opportunity Fund
Schedule of Investments
May 31, 2019
Common Stocks - Long - Domestic — 72.18% | | Shares | | | Fair Value | |
Consumer Discretionary — 4.15% | | | | | | | | |
Darden Restaurants, Inc. | | | 3,500 | | | $ | 407,120 | |
eBay, Inc.(a) | | | 16,000 | | | | 574,880 | |
Home Depot, Inc. (The)(a) | | | 3,350 | | | | 635,997 | |
Hyatt Hotels Corporation, Class A(a) | | | 4,100 | | | | 296,184 | |
Lowe‘s Companies, Inc.(a) | | | 10,000 | | | | 932,800 | |
| | | | | | | | 2,846,981 | |
Consumer Staples — 5.23% | | | | | | | | |
Church & Dwight Company, Inc.(a) | | | 15,300 | | | | 1,138,473 | |
Coca-Cola Company (The)(a) | | | 7,600 | | | | 373,388 | |
Colgate-Palmolive Company(a) | | | 17,400 | | | | 1,211,388 | |
Mondelez International, Inc., Class A(a) | | | 17,100 | | | | 869,535 | |
| | | | | | | | 3,592,784 | |
Energy — 1.75% | | | | | | | | |
Halliburton Company | | | 11,900 | | | | 253,351 | |
Hess Corporation(a) | | | 4,680 | | | | 261,425 | |
Noble Energy, Inc.(a) | | | 20,100 | | | | 430,140 | |
Schlumberger Ltd. | | | 7,400 | | | | 256,706 | |
| | | | | | | | 1,201,622 | |
Financials — 40.37% | | | | | | | | |
Aflac, Inc.(a) | | | 29,800 | | | | 1,528,740 | |
Arthur J. Gallagher & Company | | | 9,100 | | | | 766,220 | |
Axis Capital Holdings Ltd.(a) | | | 23,700 | | | | 1,412,046 | |
Berkshire Hathaway, Inc., Class B(a)(b) | | | 13,970 | | | | 2,757,957 | |
Berkshire Hills Bancorp, Inc. | | | 13,800 | | | | 402,822 | |
Brown & Brown, Inc.(a) | | | 63,300 | | | | 1,998,381 | |
Cboe Global Markets, Inc. | | | 5,500 | | | | 596,970 | |
Central Pacific Financial Corporation(a) | | | 21,600 | | | | 600,264 | |
Cincinnati Financial Corporation(a) | | | 10,450 | | | | 1,026,608 | |
Citigroup, Inc.(a) | | | 13,800 | | | | 857,670 | |
Comerica, Inc. | | | 8,000 | | | | 550,560 | |
Federated Investors, Inc., Class B(a) | | | 25,800 | | | | 787,674 | |
Franklin Resources, Inc. | | | 19,400 | | | | 617,308 | |
Hanover Insurance Group, Inc. (The)(a) | | | 9,250 | | | | 1,129,980 | |
Jefferies Financial Group, Inc.(a) | | | 21,100 | | | | 372,837 | |
Kearny Financial Corporation | | | 30,300 | | | | 406,323 | |
See accompanying notes which are an integral part of these financial statements.
15
LS Opportunity Fund
Schedule of Investments – continued
May 31, 2019
Common Stocks - Long - Domestic — 72.18% - continued | | Shares | | | Fair Value | |
Financials — 40.37% - continued | | | | | | | | |
KeyCorp(a) | | | 63,700 | | | $ | 1,017,289 | |
Mercury General Corporation(a) | | | 15,600 | | | | 899,340 | |
PJT Partners, Inc., Class A(a) | | | 12,200 | | | | 450,180 | |
PNC Financial Services Group, Inc. (The)(a) | | | 16,760 | | | | 2,132,878 | |
Primerica, Inc.(a) | | | 9,390 | | | | 1,078,535 | |
ProAssurance Corporation | | | 14,000 | | | | 525,280 | |
Progressive Corporation (The)(a) | | | 20,000 | | | | 1,585,600 | |
Selective Insurance Group, Inc.(a) | | | 9,400 | | | | 673,510 | |
Torchmark Corporation(a) | | | 16,000 | | | | 1,368,160 | |
U.S. Bancorp(a) | | | 29,900 | | | | 1,500,980 | |
Voya Financial, Inc. | | | 14,000 | | | | 713,020 | |
| | | | | | | | 27,757,132 | |
Health Care — 4.60% | | | | | | | | |
Abbott Laboratories(a) | | | 10,100 | | | | 768,913 | |
Johnson & Johnson(a) | | | 5,200 | | | | 681,980 | |
Merck & Company, Inc.(a) | | | 16,400 | | | | 1,299,044 | |
Patterson Companies, Inc.(a) | | | 19,685 | | | | 413,779 | |
| | | | | | | | 3,163,716 | |
Industrials — 4.27% | | | | | | | | |
CIRCOR International, Inc.(a)(b) | | | 10,300 | | | | 435,278 | |
Eaton Corporation plc(a) | | | 11,500 | | | | 856,635 | |
Illinois Tool Works, Inc. | | | 2,940 | | | | 410,542 | |
Kirby Corporation(a)(b) | | | 6,100 | | | | 472,018 | |
United Technologies Corporation(a) | | | 6,020 | | | | 760,326 | |
| | | | | | | | 2,934,799 | |
Information Technology — 10.53% | | | | | | | | |
FLIR Systems, Inc.(a) | | | 15,700 | | | | 758,781 | |
Leidos Holdings, Inc. | | | 15,800 | | | | 1,190,214 | |
Microsoft Corporation(a) | | | 18,050 | | | | 2,232,424 | |
Oracle Corporation | | | 13,500 | | | | 683,100 | |
Paychex, Inc.(a) | | | 7,400 | | | | 634,846 | |
PayPal Holdings, Inc.(a)(b) | | | 6,700 | | | | 735,325 | |
Science Applications International Corporation(a) | | | 9,400 | | | | 721,356 | |
Xilinx, Inc.(a) | | | 2,800 | | | | 286,468 | |
| | | | | | | | 7,242,514 | |
See accompanying notes which are an integral part of these financial statements.
16
LS Opportunity Fund
Schedule of Investments – continued
May 31, 2019
Common Stocks - Long - Domestic — 72.18% - continued | | Shares | | | Fair Value | |
Materials — 0.88% | | | | | | | | |
Newmont Mining Corporation | | | 18,300 | | | $ | 605,547 | |
| | | | | | | | | |
Real Estate — 0.40% | | | | | | | | |
Cousins Properties, Inc.(a) | | | 30,523 | | | | 276,233 | |
TOTAL COMMON STOCKS - LONG -DOMESTIC (Cost $43,279,611) | | | 49,621,328 | |
| | | | | | | | | |
Common Stocks -Long - International — 13.00% | | | | | | | | |
Consumer Discretionary — 0.52% | | | | | | | | |
William Hill plc | | | 211,000 | | | | 357,629 | |
| | | | | | | | | |
Consumer Staples — 3.09% | | | | | | | | |
Carlsberg A/S, Series B | | | 3,225 | | | | 424,883 | |
Nestlé S.A. | | | 17,100 | | | | 1,700,417 | |
| | | | | | | | 2,125,300 | |
Energy — 1.29% | | | | | | | | |
Suncor Energy, Inc.(a) | | | 28,900 | | | | 890,120 | |
| | | | | | | | | |
Financials — 5.26% | | | | | | | | |
Lancashire Holdings Ltd. | | | 101,500 | | | | 902,847 | |
RenaissanceRe Holdings Ltd.(a) | | | 15,570 | | | | 2,716,031 | |
| | | | | | | | 3,618,878 | |
Health Care — 2.14% | | | | | | | | |
Medtronic plc(a) | | | 8,500 | | | | 786,930 | |
Roche Holdings AG | | | 2,590 | | | | 680,673 | |
| | | | | | | | 1,467,603 | |
See accompanying notes which are an integral part of these financial statements.
17
LS Opportunity Fund
Schedule of Investments – continued
May 31, 2019
Common Stocks -Long - International — 13.00% - continued | | Shares | | | Fair Value | |
Materials — 0.70% | | | | | | | | |
Agnico Eagle Mines Ltd.(a) | | | 11,000 | | | $ | 479,490 | |
TOTAL COMMON STOCKS -LONG -INTERNATIONAL
(Cost $8,045,119) | | | 8,939,020 | |
| | | | | | | | | |
Money Market Funds —11.33% | | | | | | | | |
Invesco Treasury Portfolio, Institutional Class, 2.28%(c) | | | 7,792,177 | | | | 7,792,177 | |
TOTAL MONEY MARKET FUNDS (Cost $7,792,177) | | | 7,792,177 | |
Description | | Number of
Contracts | | | Notional
Amount | | | Exercise
Price | | | Expiration Date | | | Fair Value | |
Call Options Purchased — 0.00%(d) | | | | | | | | |
American International Group, Inc. | | | 7 | | | $ | 35,749 | | | $ | 50.00 | | | | January 2020 | | | $ | 3,098 | |
TOTAL CALL OPTIONS PURCHASED (Cost $2,040) | | | 3,098 | |
TOTAL INVESTMENTS — 96.51% (Cost $59,118,947) | | | 66,355,623 | |
Other Assets in Excess of Liabilities — 3.49% | | | 2,397,496 | |
NET ASSETS — 100.00% | | $ | 68,753,119 | |
(a) | All or a portion of the security is held as collateral for securities sold short. The fair value of this collateral on May 31, 2019, was $30,147,849. |
(b) | Non-income producing security. |
(c) | Rate disclosed is the seven day effective yield as of May 31, 2019. |
(d) | Rounds to less than 0.005%. |
See accompanying notes which are an integral part of these financial statements.
18
LS Opportunity Fund
Schedule of Securities Sold Short
May 31, 2019
Common Stocks - Short - Domestic — (20.84)% | | Shares | | | Fair Value | |
Consumer Discretionary— (1.52)% | | | | | | | | |
M.D.C. Holdings, Inc. | | | (12,944 | ) | | $ | (406,830 | ) |
McDonald‘s Corporation | | | (1,900 | ) | | | (376,713 | ) |
Tesla, Inc.(a) | | | (845 | ) | | | (156,460 | ) |
Toll Brothers, Inc. | | | (3,100 | ) | | | (107,787 | ) |
| | | | | | | | (1,047,790 | ) |
Consumer Staples—(5.45)% | | | | | | | | |
Clorox Company (The) | | | (3,730 | ) | | | (555,061 | ) |
Constellation Brands, Inc., Class A | | | (1,090 | ) | | | (192,331 | ) |
Kellogg Company | | | (4,600 | ) | | | (241,776 | ) |
Kimberly-Clark Corporation | | | (5,610 | ) | | | (717,463 | ) |
Procter & Gamble Company (The) | | | (6,680 | ) | | | (687,439 | ) |
Sysco Corporation | | | (10,100 | ) | | | (695,082 | ) |
Walmart, Inc. | | | (6,500 | ) | | | (659,360 | ) |
| | | | | | | | (3,748,512 | ) |
Financials— (11.62)% | | | | | | | | |
Affiliated Managers Group, Inc. | | | (3,210 | ) | | | (269,062 | ) |
Alleghany Corporation(a) | | | (1,500 | ) | | | (994,950 | ) |
Ameriprise Financial, Inc. | | | (8,580 | ) | | | (1,186,014 | ) |
Community Bank System, Inc. | | | (8,200 | ) | | | (506,842 | ) |
Glacier Bancorp, Inc. | | | (6,700 | ) | | | (264,047 | ) |
Great Western Bancorp, Inc. | | | (6,800 | ) | | | (211,276 | ) |
Horace Mann Educators Corporation | | | (11,400 | ) | | | (461,814 | ) |
Markel Corporation(a) | | | (805 | ) | | | (852,390 | ) |
Marsh & McLennan Companies, Inc. | | | (7,200 | ) | | | (688,320 | ) |
Principal Financial Group, Inc. | | | (7,300 | ) | | | (376,461 | ) |
Prudential Financial, Inc. | | | (9,100 | ) | | | (840,658 | ) |
Travelers Companies, Inc. (The) | | | (4,970 | ) | | | (723,483 | ) |
Trustmark Corporation | | | (7,900 | ) | | | (250,983 | ) |
Valley National Bancorp | | | (19,100 | ) | | | (187,562 | ) |
Webster Financial Corporation | | | (3,900 | ) | | | (172,692 | ) |
| | | | | | | | (7,986,554 | ) |
Health Care—(1.53)% | | | | | | | | |
Boston Scientific Corporation(a) | | | (14,800 | ) | | | (568,468 | ) |
Stryker Corporation | | | (2,620 | ) | | | (480,089 | ) |
| | | | | | | | (1,048,557 | ) |
See accompanying notes which are an integral part of these financial statements.
19
LS Opportunity Fund
Schedule of Securities Sold Short – continued
May 31, 2019
Common Stocks - Short - Domestic — (20.84)% - continued | | Shares | | | Fair Value | |
Industrials—(0.72)% | | | | | | | | |
Union Pacific Corporation | | | (2,960 | ) | | $ | (493,669 | ) |
| | | | | | | | | |
TOTAL COMMON STOCKS - SHORT - DOMESTIC (Proceeds Received $13,727,732) | | | (14,325,082 | ) |
| | | | | | | | | |
Common Stocks-Short-International—(8.52)% | | | | | | | | |
Consumer Staples—(0.53)% | | | | | | | | |
Anheuser-Busch InBev S.A./N.V. - ADR | | | (4,500 | ) | | | (366,300 | ) |
| | | | | | | | | |
Financials—(7.99)% | | | | | | | | |
Arch Capital Group Ltd.(a) | | | (11,500 | ) | | | (395,945 | ) |
Canadian Imperial Bank of Commerce | | | (7,300 | ) | | | (553,194 | ) |
Chubb Ltd. | | | (4,988 | ) | | | (728,597 | ) |
Comdirect Bank AG | | | (3,400 | ) | | | (37,533 | ) |
Commonwealth Bank of Australia | | | (25,205 | ) | | | (1,372,767 | ) |
Intact Financial Corporation | | | (4,700 | ) | | | (404,044 | ) |
Muenchener Rueckversicherungs-Gesellschaft AG | | | (3,040 | ) | | | (734,016 | ) |
Swiss Re AG | | | (7,200 | ) | | | (683,242 | ) |
Westpac Banking Corporation | | | (30,685 | ) | | | (584,111 | ) |
| | | | (5,493,449 | ) |
TOTAL COMMON STOCKS - SHORT - INTERNATIONAL
(Proceeds Received $5,702,765) | | | (5,859,749 | ) |
| | | | | | | | | |
Exchange-Traded Funds - Short—(0.37)% | | | | | | | | |
Invesco QQQ Trust Series 1 | | | (1,461 | ) | | | (254,141 | ) |
TOTAL EXCHANGE-TRADED FUNDS - SHORT (Proceeds Received $263,875) | | | (254,141 | ) |
TOTAL SECURITIES SOLD SHORT—(29.73)% (Proceeds Received $19,694,372) | | $ | (20,438,972 | ) |
(a) | Non-dividend expense producing security. |
ADR – American Depositary Receipt
The sectors shown on the schedule of investments and schedule of securities sold short are based on the Global Industry Classification Standard, or GICS® (“GICS”). The GICS was developed by and/or is the exclusive property of MSCI, Inc. and Standard & Poor‘s Financial Services LLC (“S&P”). GICS is a service mark of MSCI, Inc. and S&P and has been licensed for use by Ultimus Fund Solutions, LLC.
See accompanying notes which are an integral part of these financial statements.
20
LS Opportunity Fund
Statement of Assets and Liabilities
May 31, 2019
Assets | | | | |
Investments in securities, at fair value (cost $59,118,947) (Note 3) | | $ | 66,355,623 | |
Deposits at broker for securities sold short and options (Note 2) | | | 21,773,962 | |
Receivable for fund shares sold | | | 1,025,012 | |
Receivable for investments sold | | | 314,772 | |
Dividends and interest receivable | | | 97,292 | |
Tax reclaims receivable | | | 15,409 | |
Prepaid expenses | | | 19,222 | |
Total Assets | | | 89,601,292 | |
Liabilities | | | | |
Investments in securities sold short, at fair value (proceeds received $19,694,372) (Note 2) | | | 20,438,972 | |
Payable for fund shares redeemed | | | 46,650 | |
Payable for investments purchased | | | 157,627 | |
Dividend expense payable on short positions | | | 59,292 | |
Payable to Adviser (Note 4) | | | 99,336 | |
Payable to Administrator (Note 4) | | | 10,536 | |
Other accrued expenses | | | 35,760 | |
Total Liabilities | | | 20,848,173 | |
| | | | | |
Net Assets | | $ | 68,753,119 | |
| | | | | |
Net Assets consist of: | | | | |
Paid-in capital | | $ | 62,107,573 | |
Accumulated earnings | | | 6,645,546 | |
Net Assets | | $ | 68,753,119 | |
| | | | | |
Shares outstanding (unlimited number of shares authorized, no par value) | | | 4,884,912 | |
Net asset value, offering and redemption price per share (Note 2) | | $ | 14.07 | |
See accompanying notes which are an integral part of these financial statements.
21
LS Opportunity Fund
Statement of Operations
For the year ended May 31, 2019
Investment Income | | | | |
Dividend income (net of foreign taxes withheld of $25,507) | | $ | 1,337,466 | |
Interest income | | | 326,782 | |
Total investment income | | | 1,664,248 | |
Expenses | | | | |
Investment Adviser fees (Note 4) | | | 1,063,908 | |
Dividend expense on securities sold short (Note 2) | | | 568,912 | |
Administration fees (Note 4) | | | 46,452 | |
Fund accounting fees (Note 4) | | | 36,172 | |
Registration expenses | | | 27,353 | |
Legal fees | | | 26,829 | |
Audit and tax preparation expenses | | | 18,696 | |
Printing and postage expenses | | | 18,085 | |
Transfer agent fees (Note 4) | | | 18,000 | |
Custodian fees | | | 15,396 | |
Compliance services fees (Note 4) | | | 12,000 | |
Trustee expenses | | | 7,316 | |
Short sale & interest expense | | | 531 | |
Miscellaneous | | | 32,835 | |
Total expenses | | | 1,892,485 | |
Fees waived by Adviser (Note 4) | | | (136,581 | ) |
Net operating expenses | | | 1,755,904 | |
Net investment loss | | | (91,656 | ) |
Net Realized and Change in Unrealized Gain (Loss) on Investments | | | | |
Net realized gain (loss) on: | | | | |
Investment securities | | | 1,571,194 | |
Securities sold short | | | (207,897 | ) |
Written options | | | 26,500 | |
Foreign currency | | | 16,241 | |
Change in unrealized appreciation (depreciation) on: | | | | |
Investment securities | | | 1,109,849 | |
Securities sold short | | | (344,808 | ) |
Written options contracts | | | (96,715 | ) |
Foreign currency translations | | | (324 | ) |
Net realized and change in unrealized gain on investments | | | 2,074,040 | |
Net increase in net assets resulting from operations | | $ | 1,982,384 | |
See accompanying notes which are an integral part of these financial statements.
22
LS Opportunity Fund
Statements of Changes in Net Assets
| | | For the Year
Ended
May 31, 2019 | | | For the Year
Ended
May 31, 2018(a) | |
| | | | | | | | | |
Increase (Decrease) in Net Assets due to: | | | | | | | | |
Operations | | | | | | | | |
Net investment loss | | $ | (91,656 | ) | | $ | (315,024 | ) |
Net realized gain on investment transactions | | | 1,406,038 | | | | 1,244,655 | |
Change in unrealized appreciation on investments | | | 668,002 | | | | 1,859,928 | |
Net increase in net assets resulting from operations | | | 1,982,384 | | | | 2,789,559 | |
Distributions to Shareholders from Earnings (Note 2) | | | (1,590,970 | ) | | | (1,405,960 | ) |
Capital Transactions | | | | | | | | |
Proceeds from shares sold | | | 35,089,641 | | | | 20,806,506 | |
Reinvestment of distributions | | | 1,461,700 | | | | 1,227,435 | |
Amount paid for shares redeemed | | | (18,147,526 | ) | | | (11,075,635 | ) |
Net increase in net assets resulting from capital transactions | | | 18,403,815 | | | | 10,958,306 | |
Total Increase in Net Assets | | | 18,795,229 | | | | 12,341,905 | |
Net Assets | | | | | | | | |
Beginning of year | | | 49,957,890 | | | | 37,615,985 | |
End of year | | $ | 68,753,119 | | | $ | 49,957,890 | |
Share Transactions | | | | | | | | |
Shares sold | | | 2,520,064 | | | | 1,496,470 | |
Shares issued in reinvestment of distributions | | | 109,327 | | | | 89,594 | |
Shares redeemed | | | (1,322,231 | ) | | | (806,979 | ) |
Net increase in shares outstanding | | | 1,307,160 | | | | 779,085 | |
(a) | For the year ended May 31, 2018, the Fund had Distributions to Shareholders from net realized gains of $1,405,960. As of May 31, 2018, accumulated net investment loss was $(109,651). |
See accompanying notes which are an integral part of these financial statements.
23
LS Opportunity Fund
Financial Highlights
(For a share outstanding during each year)
| | | For the
Year Ended
May 31,
2019 | | | For the
Year Ended
May 31,
2018 | | | For the
Year Ended
May 31,
2017 | | | For the
Year Ended
May 31,
2016 | | | For the
Year Ended
May 31,
2015 | |
| | | | | | | | | | | | | | | | | | | | | |
Selected Per Share Data: | | | | | | | | | | | | | | | | | | | | |
Net asset value, beginning of year | | $ | 13.96 | | | $ | 13.44 | | | $ | 12.22 | | | $ | 12.55 | | | $ | 12.72 | |
Investment operations: | | | | | | | | | | | | | | | | | | | | |
Net investment loss | | | (0.01 | ) | | | (0.08 | ) | | | (0.09 | ) | | | (0.21 | ) | | | (0.42 | ) |
Net realized and unrealized gain on investments | | | 0.47 | | | | 1.14 | | | | 1.31 | | | | 0.66 | | | | 0.49 | |
Total from investment operations | | | 0.46 | | | | 1.06 | | | | 1.22 | | | | 0.45 | | | | 0.07 | |
Less distributions to shareholders from: | | | | | | | | | | | | | | | | | | | | |
Net realized gains | | | (0.35 | ) | | | (0.54 | ) | | | — | | | | (0.78 | ) | | | (0.24 | ) |
Paid in capital from redemption fees(a) | | | — | | | | — | | | | — | (b) | | | — | (b) | | | — | |
Net asset value, end of year | | $ | 14.07 | | | $ | 13.96 | | | $ | 13.44 | | | $ | 12.22 | | | $ | 12.55 | |
Total Return(c)(d) | | | 3.44 | % | | | 7.95 | % | | | 9.98 | % | | | 3.80 | % | | | 0.50 | % |
Ratios and Supplemental Data: | | | | | | | | | | | | | | | | | | | | |
Net assets, end of year (000 omitted) | | $ | 68,753 | | | $ | 49,958 | | | $ | 37,616 | | | $ | 25,148 | | | $ | 96,269 | |
Ratio of net expenses to average net assets(e) | | | 2.89 | % | | | 2.97 | % | | | 2.88 | % | | | 2.93 | % | | | 2.51 | % |
Ratio of expenses to average net assets before waiver and reimbursement(e) | | | 3.11 | % | | | 3.33 | % | | | 3.34 | % | | | 3.92 | % | | | 2.60 | % |
Ratio of net investment loss to average net assets | | | (0.15 | )% | | | (0.82 | )% | | | (0.81 | )% | | | (1.11 | )% | | | (1.72 | )% |
Portfolio turnover rate | | | 40.31 | % | | | 55.31 | % | | | 75.09 | % | | | 89.54 | % | | | 551.53 | % |
(a) | Prior to September 28, 2016, the Fund charged a 2.00% redemption fee for shares redeemed within 60 days of purchase. |
(b) | Rounds to less than $0.005 per share. |
(c) | Total return represents the rate that the investor would have earned or lost on an investment in the Fund, assuming reinvestment of distributions. |
(d) | Excludes redemption fee. |
(e) | Includes dividend and interest expense of 0.94%, 1.02%, 0.93%, 0.98% and 0.56% for the fiscal years ended May 31, 2019, 2018, 2017, 2016 and 2015, respectively. |
See accompanying notes which are an integral part of these financial statements.
24
LS Opportunity Fund
Notes to the Financial Statements
May 31, 2019
NOTE 1. ORGANIZATION
The LS Opportunity Fund (the “Fund”) is an open-end, diversified series of Valued Advisers Trust (the “Trust”). The Trust is a management investment company established under the laws of Delaware by an Agreement and Declaration of Trust dated June 13, 2008 (the “Trust Agreement”). The Trust Agreement permits the Board of Trustees (the “Board”) to issue an unlimited number of shares of beneficial interest of separate series without par value. The Fund is one of a series of funds authorized by the Board. The Fund’s investment adviser is Long Short Advisors, LLC (the “Adviser”). The Adviser has retained Prospector Partners, LLC (the “Sub-Adviser”) to serve as the sub-adviser to provide portfolio management and related services to the Fund. The Sub-Adviser receives a fee from the Adviser (not the Fund) for these services. The investment objective of the Fund is to generate long-term capital appreciation by investing in both long and short positions within a portfolio consisting of primarily publicly-traded common stock, with less net exposure than that of the stock market in general.
NOTE 2. SIGNIFICANT ACCOUNTING POLICIES
The Fund is an investment company and follows accounting and reporting guidance under Financial Accounting Standards Board Accounting Standards Codification (“ASC”) Topic 946, “Financial Services-Investment Companies.” The following is a summary of significant accounting policies followed by the Fund in the preparation of its financial statements. These policies are in conformity with generally accepted accounting principles in the United States of America (“GAAP”).
Estimates– The preparation of financial statements in conformity with GAAP requires management to make estimates and assumptions that affect the reported amounts of assets and liabilities and disclosure of contingent assets and liabilities at the date of the financial statements and the reported amounts of increases and decreases in net assets from operations during the reporting period. Actual results could differ from those estimates.
Federal Income Taxes– The Fund makes no provision for federal income or excise tax. The Fund has qualified and intends to qualify each year as a regulated investment company (“RIC”) under subchapter M of the Internal Revenue Code of 1986, as amended, by complying with the requirements applicable to RICs and by distributing substantially all of its taxable income. The Fund also intends to distribute sufficient net investment income and net realized capital gains, if any, so that it will not be subject to excise tax on undistributed income and gains. If the required amount of net investment income or gains is not distributed, the Fund could incur a tax expense.
As of and during the fiscal year ended May 31, 2019, the Fund did not have any liability for any unrecognized tax benefits. The Fund recognizes interest and penalties, if any, related to unrecognized tax benefits as income tax expense on the statement of operations when incurred. During the fiscal year ended May 31, 2019, the Fund did not incur any interest or penalties.
25
LS Opportunity Fund
Notes to the Financial Statements – continued
May 31, 2019
NOTE 2. SIGNIFICANT ACCOUNTING POLICIES– continued
Management of the Fund has reviewed tax positions taken in tax years that remain subject to examination by all major tax jurisdictions, including federal (i.e., the last three tax year ends and the interim tax period since then, as applicable). Management believes that there is no tax liability resulting from unrecognized tax benefits related to uncertain tax positions taken.
Expenses– Expenses incurred by the Trust that do not relate to a specific fund of the Trust are allocated to the individual funds based on each fund’s relative net assets or other appropriate basis as determined under the direction of the Board.
Security Transactions and Related Income – The Fund follows industry practice and records security transactions on the trade date for financial reporting purposes. For financial statement and income tax purposes, the specific identification method is used for determining capital gains or losses. Dividend income and dividend expense are recorded on the ex-dividend date and interest income is recorded on an accrual basis. Dividend income from real estate investment trusts (REITs) and distributions from limited partnerships are recognized on the ex-date. The calendar year end classification of distributions received from REITs during the fiscal year are reported subsequent to year end; accordingly, the Fund estimates the character of REIT distributions based on the most recent information available. Income or loss from Limited Partnerships is reclassified among the components of net assets upon receipt of Schedules K-1(Form 1065). Discounts and premiums on securities purchased are amortized or accreted using the effective interest method. Withholding taxes on foreign dividends have been provided for in accordance with the Fund’s understanding of the applicable country’s tax rules and rates.
Foreign Currency Translation – Foreign currency amounts are translated into U.S. dollars as follows: (i) assets and liabilities at the rate of exchange at the end of the respective period; and (ii) purchases and sales of securities and income and expenses at the rate of exchange prevailing on the dates of such transactions. The portion of the results of operations arising from changes in the exchange rates and the portion due to fluctuations arising from changes in the market prices of securities are not isolated. Such fluctuations are included with the net realized and unrealized gain or loss on investments.
The Fund may enter into transactions to purchase or sell foreign currencies to protect the U.S. dollar value of its underlying portfolio securities against the effect of possible adverse movements in foreign exchange rates. Principal risks associated with such transactions include the movement in value of the foreign currency relative to the U.S. dollar and the ability of the counterparty to meet its obligations. Reported net realized foreign exchange gains or losses arise from sales of foreign currencies, currency gains or losses realized between the trade and settlement dates on securities transactions, and the difference between the amounts of dividends, interest, and foreign withholding taxes recorded on the company’s books and the U.S. dollar equivalent of the amounts actually received or paid. These instruments involve
26
LS Opportunity Fund
Notes to the Financial Statements – continued
May 31, 2019
NOTE 2. SIGNIFICANT ACCOUNTING POLICIES– continued
market risk, credit risk, or both in excess of the amount that would be recognized in the Statement of Assets and Liabilities. Risks arise from the possible inability of counterparties to meet the terms of their contracts and from movement in currency and securities values and interest rates.
Dividends and Distributions – The Fund intends to distribute its net investment income and net realized long-term and short-term capital gains, if any, at least annually. Dividends and distributions to shareholders, which are determined in accordance with income tax regulations, are recorded on the ex-dividend date. The treatment for financial reporting purposes of distributions made to shareholders during the period from net investment income or net realized capital gains may differ from their ultimate treatment for federal income tax purposes. These differences are caused primarily by differences in the timing of the recognition of certain components of income, expense or realized capital gain for federal income tax purposes. Where such differences are permanent in nature, they are reclassified among the components of net assets based on their ultimate characterization for federal income tax purposes. Any such reclassifications will have no effect on net assets, results of operations or net asset value (“NAV”) per share of the Fund.
For the fiscal year ended May 31, 2019, the Fund made the following reclassifications to increase (decrease) the components of net assets, which were due to net operating losses:
Paid-In Capital | Accumulated
Earnings |
$(200,791) | $200,791 |
Share Valuation– The NAV is calculated each day the New York Stock Exchange is open by dividing the total value of the Fund’s assets, less liabilities, by the number of shares outstanding for the Fund.
Short Sales– The Fund may make short sales as part of its overall portfolio management strategies or to offset a potential decline in value of a security. The Fund may engage in short sales with respect to various types of securities, including exchange-traded funds (ETFs). A short sale involves the sale of a security that is borrowed from a broker or other institution to complete the sale. The Fund may engage in short sales with respect to securities it owns, as well as securities that it does not own. Short sales expose the Fund to the risk that it will be required to acquire, convert or exchange securities to replace the borrowed securities (also known as “covering” the short position) at a time when the securities sold short have appreciated in value, thus resulting in a loss to the Fund. The amount of loss may exceed the proceeds received in a short sale. The Fund’s investment performance may also suffer if the Fund is required to close out a short position earlier than it had intended. The Fund must segregate assets determined to be liquid in accordance with procedures established by the
27
LS Opportunity Fund
Notes to the Financial Statements – continued
May 31, 2019
NOTE 2. SIGNIFICANT ACCOUNTING POLICIES– continued
Board, or otherwise cover its position in a permissible manner. The Fund will be required to pledge liquid assets to the broker in order to secure its performance on short sales. As a result, the assets pledged may not be available to meet the Fund’s needs for immediate cash or other liquidity. In addition, the Fund may be subject to expenses related to short sales that are not typically associated with investing in securities directly, such as costs of borrowing and margin account maintenance costs associated with the Fund’s open short positions. These types of short sales expenses are sometimes referred to as the “negative cost of carry,” and will reduce the Fund’s potential return on a short sale. The amount of restricted cash or cash equivalents held at the broker as collateral for securities sold short was $21,773,962 as of May 31, 2019.
Dividend expenses on securities sold short and borrowing costs are not covered under the Adviser’s expense limitation agreement with the Fund and, therefore, these expenses will be borne by the shareholders of the Fund.
Purchasing Call Options– The Fund may purchase call options. As the holder of a call option, the Fund has the right to purchase the underlying security at the exercise price at any time during the option period. The Fund may enter into closing sale transactions with respect to such options, exercise them or permit them to expire. The Fund may also purchase call options on relevant stock indexes. Call options may also be purchased by the Fund for the purpose of acquiring the underlying securities for its portfolio. Utilized in this fashion, the purchase of call options enables the Fund to acquire the securities at the exercise price of the call option plus the premium paid. At times the net cost of acquiring securities in this manner may be less than the cost of acquiring the securities directly. This technique may also be useful to the Fund in purchasing a large block of securities that would be more difficult to acquire by direct market purchases. So long as it holds such a call option rather than the underlying security itself, the Fund is partially protected from any unexpected decline in the market price of the underlying security and in such event could allow the call option to expire, incurring a loss only to the extent of the premium paid for the option.
Purchasing Put Options – The Fund may purchase put options. As the holder of a put option, the Fund has the right to sell the underlying security at the exercise price at any time during the option period. The Fund may enter into closing sale transactions with respect to such options, exercise them or permit them to expire. The Fund may purchase a put option on an owned underlying security (a “protective put”) as a defensive technique to protect against an anticipated decline in the value of the security. Such hedge protection is provided only during the life of the put option when the Fund, as the holder of the put option, is able to sell the underlying security at the put exercise price regardless of any decline in the underlying security’s market price. The Fund may also purchase put options at a time when it does not own the underlying security. By purchasing put options on a security it does not own, the Fund seeks to benefit from a decline in the market price of the underlying security. If the put option is not sold when it has remaining value, and if the market price of the underlying
28
LS Opportunity Fund
Notes to the Financial Statements – continued
May 31, 2019
NOTE 2. SIGNIFICANT ACCOUNTING POLICIES– continued
security remains equal to or greater than the exercise price during the life of the put option, the Fund will lose its entire premium paid for the put option. In order for the purchase of a put option to be profitable, the market price of the underlying security must decline sufficiently below the exercise price to cover the premium and transaction costs.
Writing Options– The Fund may write covered call options on equity securities that the Fund is eligible to purchase to extend a holding period to obtain long-term capital gain treatment, to earn premium income, to assure a definite price for a security it has considered selling, or to close out options previously purchased. The Fund may write covered call options if, immediately thereafter, not more than 30% of its net assets would be committed to such transactions. A call option gives the holder (buyer) the right to purchase a security at a specified price (the exercise price) at any time until a certain date (the expiration date). A call option is “covered” if the Fund owns the underlying security subject to the call option at all times during the option period. When the Fund writes a covered call option, it maintains a segregated account with its custodian, cash, or liquid portfolio securities in an amount not less than the exercise price at all times while the option is outstanding.
The Fund may write covered put options on equity securities and futures contracts that the Fund is eligible to purchase to earn premium income or to assure a definite price for a security if it is considering acquiring the security at a lower price than the current market price or to close out options previously purchased. The Fund may not write a put option if, immediately thereafter, more than 25% of its net assets would be committed to such transactions. A put option gives the holder of the option the right to sell, and the writer has the obligation to buy, the underlying security at the exercise price at any time during the option period. The operation of put options in other respects is substantially identical to that of call options. When the Fund writes a covered put option, it maintains in a segregated account with its custodian cash or liquid portfolio securities in an amount not less than the exercise price at all times while the put option is outstanding.
Foreign Currency Exchange Contracts – The Fund may engage in foreign currency exchange transactions. The value of the Fund’s portfolio securities that are invested in non-U.S. dollar denominated instruments as measured in U.S. dollars may be affected favorably or unfavorably by changes in foreign currency exchange rates, and the Fund may incur costs in connection with conversions between various currencies. The Fund will conduct its foreign currency exchange transactions either on a spot (i.e., cash) basis at the spot rate prevailing in the foreign currency exchange market, or through forward foreign currency exchange contracts, to purchase or sell foreign currencies. A forward foreign currency exchange contract involves an obligation to purchase or sell a specific currency at a future date, which may be any fixed number of days from the date of the contract agreed upon by the parties, at a price set at the time of the contract. These contracts are traded directly between currency traders (usually large commercial banks) and their customers. The Fund will not, however, hold foreign
29
LS Opportunity Fund
Notes to the Financial Statements – continued
May 31, 2019
NOTE 2. SIGNIFICANT ACCOUNTING POLICIES– continued
currency except in connection with the purchase and sale of foreign portfolio securities. The Fund did not transact in forward foreign currency exchange contracts during the fiscal year ended May 31, 2019.
Derivative Transactions – The following tables identify the location and fair value of derivative instruments on the Statement of Assets and Liabilities as of May 31, 2019, and the effect of derivative instruments on the Statement of Operations for the fiscal year ended May 31, 2019.
As of May 31, 2019:
| | Location of Derivatives on Statement of Assets and Liabilities | | | | |
Derivatives | Asset Derivatives | Liability Derivatives | | Fair Value | |
Equity Risk: | | | | | | |
Options Purchased | Investments in securities at fair value | | | $ | 3,098 | |
For the fiscal year ended May 31, 2019:
Derivatives | Location of Gain
(Loss) on Derivatives on
Statement of Operations | | Realized Gain
(Loss) on
Derivatives | | | Change in
Unrealized
Appreciation
(Depreciation) on
Derivatives | |
Equity Risk: | | | | | | | | | |
Options Purchased | Net realized gain (loss) and change in unrealized appreciation (depreciation) on investment securities | | $ | (162,027 | ) | | $ | 191,922 | |
Options Written | Net realized gain (loss) and change in unrealized appreciation (depreciation) on written option contracts | | | 26,500 | | | | (96,715 | ) |
The Fund is not subject to a master netting arrangement and its policy is to not offset assets and liabilities related to its investment in derivatives.
The following summarizes the average ending monthly market fair of derivatives outstanding during the fiscal year ended May 31, 2019:
Derivatives | | Average Fair
Value | |
Options Purchased | | $ | 106,302 | |
Options Written | | | (27,354 | ) |
30
LS Opportunity Fund
Notes to the Financial Statements – continued
May 31, 2019
NOTE 3. SECURITIES VALUATION AND FAIR VALUE MEASUREMENTS
All investments in securities are recorded at their estimated fair value. Fair value is defined as the price that the Fund would receive upon selling an investment in a timely transaction to an independent buyer in the principal or most advantageous market of the investment. GAAP establishes a three-tier hierarchy to maximize the use of observable market data and minimize the use of unobservable inputs and to establish classification of fair value measurements for disclosure purposes.
Inputs refer broadly to the assumptions that market participants would use in pricing the asset or liability, including assumptions about risk (the risk inherent in a particular valuation technique used to measure fair value including a pricing model and/or the risk inherent in the inputs to the valuation technique). Inputs may be observable or unobservable. Observable inputs are inputs that reflect the assumptions market participants would use in pricing the asset or liability developed based on market data obtained and available from sources independent of the reporting entity. Unobservable inputs are inputs that reflect the reporting entity’s own assumptions about the assumptions market participants would use in pricing the asset or liability developed based on the best information available in the circumstances.
Various inputs are used in determining the value of the Fund‘s investments. These inputs are summarized in the three broad levels listed below.
| | ● | Level 1 – unadjusted quoted prices in active markets for identical investments and/or registered investment companies where the value per share is determined and published and is the basis for current transactions for identical assets or liabilities at the valuation date |
| | ● | Level 2 – other significant observable inputs (including, but not limited to, quoted prices for an identical security in an inactive market, quoted prices for similar securities, interest rates, prepayment speeds, credit risk, etc.) |
| | ● | Level 3 – significant unobservable inputs (including the Fund‘s own assumptions in determining fair value of investments based on the best information available) |
The inputs used to measure fair value may fall into different levels of the fair value hierarchy. In such cases, for disclosure purposes, the level in the fair value hierarchy which is reported, is determined based on the lowest level input that is significant to the fair value measurement in its entirety.
Equity securities that are traded on any stock exchange are generally valued at the last quoted sale price on the security’s primary exchange. Lacking a last sale price, an exchange-traded security is generally valued at its last bid price, except in the case of a security sold short, in which case the last ask price is utilized. Securities traded in the NASDAQ over-the-counter market are generally valued at the NASDAQ Official Closing Price. When using the market quotations and when the market is considered active, the security is classified as a Level
31
LS Opportunity Fund
Notes to the Financial Statements – continued
May 31, 2019
NOTE 3. SECURITIES VALUATION AND FAIR VALUE MEASUREMENTS–continued
1 security. In the event that market quotations are not readily available or are considered unreliable due to market or other events, the Fund values its securities and other assets at fair value in accordance with policies established by and under the general supervision of the Board. Under these policies, the securities will be classified as Level 2 or 3 within the fair value hierarchy, depending on the inputs used.
Investments in mutual funds, including money market mutual funds, are generally priced at the ending NAV. These securities are categorized as Level 1 securities.
Call and put options purchased or sold by the Fund are valued at the mean of the last bid and ask prices as provided by a pricing service. If there is no such reported ask price on the valuation date, options are valued at the most recent bid price. If there is no such reported bid price on the valuation date, options are valued at the most recent ask price. Options will generally be categorized as Level 2 securities.
In accordance with the Trust’s valuation policies, the Adviser is required to consider all appropriate factors relevant to the value of securities for which it has determined other pricing sources are not available or reliable as described above. No single method exists for determining fair value, because fair value depends upon the circumstances of each individual case. As a general principle, the current fair value of a security being valued by the Adviser would be the amount that the Fund might reasonably expect to receive upon the current sale. Methods that are in accordance with this principle may, for example, be based on (i) a multiple of earnings; (ii) a discount from market prices of a similar freely traded security (including a derivative security or a basket of securities traded on other markets, exchanges or among dealers); or (iii) yield to maturity with respect to debt issues, or a combination of these and other methods. Fair-value pricing is permitted if, in the Adviser’s opinion, the validity of market quotations appears to be questionable based on factors such as evidence of a thin market in the security based on a small number of quotations, a significant event occurs after the close of a market but before the Fund’s NAV calculation that may affect a security’s value, or the Adviser is aware of any other data that calls into question the reliability of market quotations.
The following is a summary of the inputs used to value the Fund’s investments as of May 31, 2019:
| | | Valuation Inputs | |
Assets | | Level 1 | | | Level 2 | | | Level 3 | | | Total | |
Common Stocks Domestic(a) | | $ | 49,621,328 | | | $ | — | | | $ | — | | | $ | 49,621,328 | |
Common Stocks International(a) | | | 8,514,137 | | | | 424,883 | | | | — | | | | 8,939,020 | |
Call Options Purchased | | | — | | | | 3,098 | | | | — | | | | 3,098 | |
Money Market Funds | | | 7,792,177 | | | | — | | | | — | | | | 7,792,177 | |
Total | | $ | 65,927,642 | | | $ | 427,981 | | | $ | — | | | $ | 66,355,623 | |
(a) | Refer to Schedule of Investments for sector classifications. |
32
LS Opportunity Fund
Notes to the Financial Statements – continued
May 31, 2019
NOTE 3. SECURITIES VALUATION AND FAIR VALUE MEASUREMENTS–continued
| | | Valuation Inputs | |
Liabilites | | Level 1 | | | Level 2 | | | Level 3 | | | Total | |
Common Stocks Domestic(a) | | $ | (14,325,082 | ) | | $ | — | | | $ | — | | | $ | (14,325,082 | ) |
Common Stocks International(a) | | | (5,859,749 | ) | | | — | | | | — | | | | (5,859,749 | ) |
Exchange-Traded Funds | | | (254,141 | ) | | | — | | | | — | | | | (254,141 | ) |
Total | | $ | (20,438,972 | ) | | $ | — | | | $ | — | | | $ | (20,438,972 | ) |
(a) | Refer to Schedule of Securities Sold Short for sector classifications. |
The Fund did not hold any investments at the end of the reporting period for which significant unobservable inputs (Level 3) were used in determining fair value; therefore, no reconciliation of Level 3 securities is included for this reporting period.
NOTE 4. TRANSACTIONS WITH AFFILIATES AND OTHER SERVICE PROVIDERS
The Adviser, under the terms of the management agreement (the “Agreement”), manages the Fund’s investments. As compensation for its management services, the Fund pays the Adviser a fee, computed and accrued daily and paid monthly, at an annual rate of 1.75% of the Fund’s average net assets. For the fiscal year ended May 31, 2019, the Adviser earned a fee of $1,063,908 from the Fund before the waivers described below. At May 31, 2019, the Adviser was owed $99,336 from the Fund for advisory services.
The Adviser has contractually agreed to waive its management fee and/or reimburse certain Fund operating expenses, but only to the extent necessary so that the Fund’s net expenses (excluding interest, taxes, brokerage commissions, other expenditures which are capitalized in accordance with generally accepted accounting principles, other extraordinary expenses not incurred in the ordinary course of the Fund’s business, dividend and interest expense on short sales, expenses incurred under a Rule 12b-1 plan of distribution, “acquired fund fees and expenses” (i.e., investment companies in which the Fund may invest), and expenses that the Fund has incurred but did not actually pay because of an expense offset arrangement) does not exceed 1.95% of the average daily net assets.
Each fee waiver or expense reimbursement by the Adviser is subject to repayment by the Fund within the three years following the date in which the fee waiver or expense reimbursement occurred, provided that the Fund is able to make the repayment without exceeding the expense limitation that is in effect at the time of the repayment or at the time of the fee waiver or expense reimbursement, whichever is lower. The contractual agreement is in effect through September 30, 2019. The expense cap may not be terminated prior to this date except by mutual consent of the Adviser and the Board. For the fiscal year ended May 31, 2019, the
33
LS Opportunity Fund
Notes to the Financial Statements – continued
May 31, 2019
NOTE 4. TRANSACTIONS WITH AFFILIATES AND OTHER SERVICE PROVIDERS–continued
Adviser waived fees of $136,581. The amount subject to repayment by the Fund, pursuant to the aforementioned conditions, are as follows:
Recoverable Through | | Amount | |
May 31, 2020 | | $ | 166,292 | |
May 31, 2021 | | $ | 137,869 | |
May 31, 2022 | | $ | 136,581 | |
The Adviser has retained the Sub-Adviser to provide portfolio management and related services to the Fund. The Sub-Adviser receives a fee from the Adviser (not the Fund) for these services.
The Trust retains Ultimus Fund Solutions, LLC (the “Administrator”) to provide the Fund with administration, compliance (including a chief compliance officer), fund accounting and transfer agent services, including all regulatory reporting. For the fiscal year ended May 31, 2019, the Administrator earned fees of $46,452 for administration services, $12,000 for compliance services, $36,172 for fund accounting services and $18,000 for transfer agent services. At May 31, 2019, the Fund owed the Administrator $10,536 for such services.
The officers and one trustee of the Trust are members of management and/or employees of the Administrator. Unified Financial Securities, LLC (the “Distributor”) acts as the principal distributor of the Fund’s shares. There were no payments made to the Distributor by the Fund for the fiscal year ended May 31, 2019.
NOTE 5. INVESTMENT TRANSACTIONS
For the fiscal year ended May 31, 2019, purchases and sales of investment securities, other than short-term investments, were $38,598,406 and $29,407,003, respectively.
There were no purchases or sales of long-term U.S. government obligations during the fiscal year ended May 31, 2019.
34
LS Opportunity Fund
Notes to the Financial Statements – continued
May 31, 2019
NOTE 6. FEDERAL TAX INFORMATION
At May 31, 2019, the net unrealized appreciation (depreciation) of investments for tax purposes was as follows:
Gross unrealized appreciation | | $ | 9,241,446 | |
Gross unrealized depreciation | | | (3,003,250 | ) |
Net unrealized appreciation on investments | | $ | 6,238,196 | |
Tax cost of investments and securities sold short | | $ | 39,678,455 | |
The difference between book basis and tax basis unrealized appreciation is attributable primarily to the tax deferral of losses on wash sale, straddles, constructive sales and return of capital distributions from underlying investments.
The tax character of distributions for the fiscal years ended May 31, 2019 and May 31, 2018 were as follows:
| | | 2019 | | | 2018 | |
Distributions paid from:(a) | | | | | | | | |
Ordinary income | | $ | — | | | $ | — | |
Long-term capital gains | | | 1,590,970 | | | | 1,405,960 | |
Total distributions paid | | $ | 1,590,970 | | | $ | 1,405,960 | |
(a) | For federal income tax purposes, distributions of short-term capital gains are treated as ordinary income distributions. |
At May 31, 2019, the components of distributable earnings (accumulated losses) on a tax basis were as follows:
Undistributed long-term capital gains | | $ | 420,768 | |
Accumulated capital and other losses | | | (12,758 | ) |
Unrealized appreciation (depreciation) | | | 6,237,536 | |
Total | | $ | 6,645,546 | |
Certain qualified late year ordinary losses incurred after December 31, and within the current taxable year, are deemed to arise on the first business day of the Fund’s following taxable year. For the tax year ended May 31, 2019, the Fund deferred qualified late year ordinary losses in the amount of $6,842.
35
LS Opportunity Fund
Notes to the Financial Statements – continued
May 31, 2019
NOTE 7. COMMITMENTS AND CONTINGENCIES
The Trust indemnifies its officers and trustees for certain liabilities that may arise from their performance of their duties to the Trust or the Fund. Additionally, in the normal course of business, the Trust enters into contracts that contain a variety of representations and warranties which provide general indemnifications. The Trust’s maximum exposure under these arrangements is unknown, as this would involve future claims that may be made against the Trust that have not yet occurred.
NOTE 8. SUBSEQUENT EVENT
Management of the Fund has evaluated the need for disclosures and/or adjustments resulting from subsequent events through the date at which these financial statements were issued. Based upon this evaluation, management has determined there were no items requiring adjustment of the financial statements or additional disclosure.
36
Report of Independent Registered Public Accounting Firm
To the Shareholders of LS Opportunity Fund and
Board of Trustees of Valued Advisers Trust
Opinion on the Financial Statements
We have audited the accompanying statement of assets and liabilities, including the schedules of investments and securities sold short, of LS Opportunity Fund (the “Fund”), a series of Valued Advisers Trust, as of May 31, 2019, and the related statement of operations for the year then ended, the statements of changes in net assets for each of the two years in the period then ended, including the related notes, and the financial highlights for each of the five years in the period then ended (collectively referred to as the “financial statements”). In our opinion, the financial statements present fairly, in all material respects, the financial position of the Fund as of May 31, 2019, the results of its operations for the year then ended, the changes in its net assets for each of the two years in the period then ended, and the financial highlights for each of the five years in the period then ended, in conformity with accounting principles generally accepted in the United States of America.
Basis for Opinion
These financial statements are the responsibility of the Fund’s management. Our responsibility is to express an opinion on the Fund’s financial statements based on our audits. We are a public accounting firm registered with the Public Company Accounting Oversight Board (United States) (“PCAOB”) and are required to be independent with respect to the Fund in accordance with the U.S. federal securities laws and the applicable rules and regulations of the Securities and Exchange Commission and the PCAOB.
We conducted our audits in accordance with the standards of the PCAOB. Those standards require that we plan and perform the audit to obtain reasonable assurance about whether the financial statements are free of material misstatement, whether due to error or fraud.
Our audits included performing procedures to assess the risks of material misstatement of the financial statements, whether due to error or fraud, and performing procedures that respond to those risks. Such procedures included examining, on a test basis, evidence regarding the amounts and disclosures in the financial statements. Our procedures included confirmation of securities owned as of May 31, 2019, by correspondence with the custodian and brokers or by other appropriate auditing procedures where replies from brokers or counterparties were not received. Our audits also included evaluating the accounting principles used and significant estimates made by management, as well as evaluating the overall presentation of the financial statements. We believe that our audits provide a reasonable basis for our opinion.
We have served as the Fund’s auditor since 2011.
COHEN & COMPANY, LTD.
Cleveland, Ohio
July 29, 2019
37
Summary of Fund Expenses (Unaudited)
As a shareholder of the Fund, you incur two types of costs: (1) transaction and (2) ongoing costs, including management fees; and other Fund expenses. These examples are intended to help you understand your ongoing costs (in dollars) of investing in the Fund and to compare these costs with the ongoing costs of investing in other mutual funds. The example is based on an investment of $1,000 invested at the beginning of the period and held for the entire period from December 1, 2018 through May 31, 2019.
Actual Expenses
The first line of the table below provides information about actual account values and actual expenses. You may use the information in this line, together with the amount you invested, to estimate the expenses that you paid over the period. Simply divide your account value by $1,000 (for example, an $8,600 account value divided by $1,000 = 8.6), then multiply the result by the number in the first line under the heading entitled “Expenses Paid During Period” to estimate the expenses you paid on your account during this period.
Hypothetical Example for Comparison Purposes
The second line of the table below provides information about hypothetical account values and hypothetical expenses based on the Fund’s actual expense ratio and an assumed rate of return of 5% per year before expenses, which is not the Fund’s actual return. The hypothetical account values and expenses may not be used to estimate the actual ending account balance or expenses you paid for the period. You may use this information to compare the ongoing costs of investing in the Fund and other funds. To do so, compare this 5% hypothetical example with the 5% hypothetical examples that appear in the shareholder reports of the other funds.
Expenses shown in the table are meant to highlight your ongoing costs only and do not reflect any transactional costs. Therefore, the second line of the table below is useful in comparing ongoing costs only and will not help you determine the relative costs of owning different funds.
| Beginning
Account Value
December 1,
2018 | Ending
Account Value
May 31, 2019 | Expenses Paid
During Period(a) | Annualized
Expense Ratio |
Actual | $ 1,000.00 | $ 1,026.30 | 15.29 | 3.03% |
Hypothetical(b) | $ 1,000.00 | $ 1,009.84 | 15.16 | 3.03% |
(a) | Expenses are equal to the Fund’s annualized expense ratios, multiplied by the average account value over the period, multiplied by 182/365 (to reflect the one-half year period). |
(b) | Hypothetical assumes 5% annual return before expenses. |
38
Additional Federal Income Tax Information (Unaudited)
The Form 1099-DIV you receive in January 2020 will show the tax status of all distributions paid to your account in calendar year 2019. Shareholders are advised to consult their own tax adviser with respect to the tax consequences of their investment in the Fund. As required by the Internal Revenue Code and/or regulations, shareholders must be notified regarding the status of qualified dividend income for individuals and the dividends received deduction for corporations.
Qualified Dividend Income.The Fund designates approximately 0% or up to the maximum amount of such dividends allowable pursuant to the Internal Revenue Code, as qualified dividend income eligible for a reduced tax rate.
Dividends Received Deduction. Corporate shareholders are generally entitled to take the dividends received deduction on the portion of the Fund’s dividend distribution that qualifies under tax law. For the Fund’s calendar year 2019 ordinary income dividends, 0% qualifies for the corporate dividends received deduction.
For the fiscal year ended May 31, 2019, the Fund designated $1,590,970 as 20% long-term capital gain distributions.
39
Investment Advisory Agreement Renewal Approval (Unaudited)
At a meeting held on March 5-6, 2019, the Board of Trustees (the “Board”) considered the renewal of the Investment Advisory Agreement (the “LSA Agreement”) between Valued Advisers Trust (the “Trust”) and Long Short Advisors, LLC (“LSA”) with respect to the LS Opportunity Fund (the “LS Fund”). LSA provided written information to the Board to assist the Board in its considerations.
The Board discussed the contractual arrangements between LSA and the Trust for the LS Fund. They reflected upon the Board’s prior experience with LSA in managing the LS Fund, as well as their earlier discussions with LSA.
Counsel then directed the Trustees to a memorandum from his firm that summarized, among other things, the fiduciary duties and responsibilities of the Board in reviewing and approving the LSA Agreement. In assessing the factors and reaching its decision, the Board took into consideration information furnished by LSA and the Trust’s other service providers for the Board’s review and consideration throughout the year, as well as information specifically prepared or presented in connection with the renewal process, including: (i) reports regarding the services and support provided to the LS Fund by LSA; (ii) quarterly assessments of the investment performance of the LS Fund; (iii) commentary on the reasons for the performance; (iv) presentations by LSA addressing its investment philosophy, investment strategy, personnel, and operations of LSA; (v) compliance and audit reports concerning the LS Fund and LSA; (vi) disclosure information contained in the registration statement of the Trust for the LS Fund and LSA’s Form ADV; (vii) information relating to the manner in which LSA oversees Prospector Partners, LLC, the LS Fund’s sub-adviser; and (viii) a memorandum from counsel, that summarized the fiduciary duties and responsibilities of the Board in reviewing and approving the LSA Agreement. The Board also requested and received materials including, without limitation: (a) documents containing information about LSA, including its financial information; a description of its personnel and the services it provides to the LS Fund; information on LSA’s investment advice and performance; summaries of the LS Fund’s expenses, compliance program, current legal matters, and other general information; (b) comparative expense and performance information for other mutual funds with strategies similar to the LS Fund; and (c) the benefits to be realized by LSA from its relationship with the LS Fund. The Board did not identify any particular information that was most relevant to its consideration to approve the LSA Agreement and each Trustee may have afforded different weight to the various factors.
1. | The nature, extent, and quality of the services to be provided by LSA. In this regard, the Board considered LSA’s responsibilities under the LSA Agreement. The Trustees considered the services being provided by LSA to the LS Fund including its process for overseeing the sub-adviser’s portfolio management of the LS Fund, assuring compliance with the LS Fund’s investment objectives and limitations, its coordination of services for the LS Fund among the LS Fund’s service providers, and its efforts to promote the LS Fund and grow its assets. The Trustees reviewed the steps LSA takes to oversee and supervise the sub-adviser, as described in the materials provided by LSA. The Trustees considered LSA’s continuity of, and commitment to retain, qualified personnel and LSA’s commitment to maintain and enhance its resources and systems. The Trustees considered |
40
Investment Advisory Agreement Renewal Approval (Unaudited) – continued
LSA’s personnel, including the education and experience of LSA’s personnel. After considering the foregoing information and further information in the Meeting materials provided by LSA (including LSA’s Form ADV), the Board concluded that, in light of all the facts and circumstances, the nature, extent and quality of the services provided by LSA were satisfactory and adequate for the LS Fund.
2. | Investment performance of the LS Fund and LSA. In considering the investment performance of the LS Fund, the Trustees noted that LSA did not manage any accounts directly and that it had delegated the portfolio management responsibilities of the LS Fund to a sub-adviser. Accordingly, the Trustees concluded that their consideration of this factor for LSA was less relevant in their determination of LSA’s performance of its duties than other factors. The Trustees considered the consistency of LSA’s management oversight of the LS Fund’s sub-adviser with the LS Fund’s investment objective, strategies, and limitations. The Trustees also compared the performance of the LS Fund with the performance of its Morningstar category. The Trustees noted that the LS Fund’s performance was above the average and median of its Morningstar category for the three-month, one-year, 3-year, and 5-year periods ended December 31, 2018, and the LS Fund’s performance for the one-month period was below that of the average and median. After reviewing and discussing the investment performance of the LS Fund further, LSA’s experience in overseeing the sub-adviser to the LS Fund, the LS Fund’s historical performance, and other relevant factors, the Board concluded, in light of all the facts and circumstances, that the investment performance, and LSA’s oversight of the sub-adviser to the LS Fund was satisfactory. |
3. | The costs of the services to be provided and profits to be realized by LSA from its relationship with the LS Fund. In considering the costs of services to be provided and the profits to be realized by LSA from its relationship with the LS Fund, the Trustees considered: (1) LSA’s financial condition; (2) asset levels of the LS Fund; (3) the overall expenses of the LS Fund; and (4) the nature and frequency of advisory fee payments. The Trustees reviewed information provided by LSA regarding its profits associated with managing the LS Fund. The Trustees also considered potential benefits for LSA in managing the LS Fund. The Trustees then compared the fees and expenses of the LS Fund (including the management fee) to other comparable mutual funds. The Trustees noted that the LS Fund’s management fee and next expense ratio were higher than the average and median of its Morningstar category, and higher than the average and median of its peer group. In this regard, the Trustees reflected upon their discussion with a representative of LSA earlier in the Meeting, and commented on LSA’s assertion that the firm provided a premium product in comparison to other products to which they were compared in the marketplace. The Board concluded that the fees to be paid to LSA by the LS Fund and the profits to be realized by LSA, in light of all the facts and circumstances, were fair and reasonable in relation to the nature and quality of the services provided by LSA. |
4. | The extent to which economies of scale would be realized as the LS Fund grows and whether advisory fee levels reflect these economies of scale for the benefit of the LS Fund’s investors. In this regard, the Board considered the LS Fund’s fee arrangements with LSA. |
41
Investment Advisory Agreement Renewal Approval (Unaudited) – continued
The Board considered that while the management fee remained the same at all asset levels, the LS Fund’s shareholders had experienced benefits from the expense limitation arrangement. The Trustees noted that once the LS Fund’s expenses fell below the cap set by the arrangement, the shareholders would continue to benefit from the economies of scale under the LS Fund’s agreements with service providers other than LSA. In light of its ongoing consideration of the LS Fund’s asset levels, expectations for growth in the LS Fund, and fee levels, the Board determined that the LS Fund’s fee arrangements, in light of all the facts and circumstances, were fair and reasonable in relation to the nature and quality of the services provided by LSA.
5. | Possible conflicts of interest and benefits to LSA. In considering LSA’s practices regarding conflicts of interest, the Trustees evaluated the potential for conflicts of interest and considered such matters as the experience and ability of the advisory personnel assigned to the LS Fund; and the substance and administration of LSA’s code of ethics. The Trustees also considered disclosure in the registration statement of the Trust relating to LSA’s potential conflicts of interest. The Trustees noted that LSA identified no other potential benefits (in addition to the management fee) to LSA. Based on the foregoing, the Board determined that LSA’s standards and practices relating to the identification and mitigation of potential conflicts of interest and the benefits to be realized by LSA in managing the LS Fund were satisfactory. |
After additional consideration of the factors delineated in the memorandum provided by counsel and further discussion among the Board members, the Board determined to approve the continuation of the LSA Agreement between the Trust and LSA.
Investment Sub-Advisory Agreement Renewal Approval (Unaudited)
At a meeting held on March 5-6, 2019, the Board of Trustees (the “Board”) considered the renewal of the Investment Sub-Advisory Agreement (the “Prospector Agreement”) between Long Short Advisors, LLC (“LSA”) and Prospector Partners, LLC (“Prospector”) with respect to the LS Opportunity Fund (the “LS Fund”). Prospector provided written information to the Board to assist the Board in its considerations.
The Board discussed the contractual arrangements between LSA and Prospector for the LS Fund. They reflected upon the Board’s prior experience with Prospector in managing the LS Fund, as well as their earlier discussions with LSA regarding LSA’s experience with Prospector.
Counsel then directed the Trustees to a memorandum from his firm that summarized, among other things, the fiduciary duties and responsibilities of the Board in reviewing and approving the Prospector Agreement. In assessing the factors and reaching its decision, the Board took into consideration information furnished by Prospector and the Trust’s other service providers for the Board’s review and consideration throughout the year, as well as information specifically prepared or presented in connection with the renewal process, including: (i) reports regarding the services and support provided to the LS Fund by Prospector; (ii) quarterly assessments of the investment performance of the LS Fund; (iii) commentary on the reasons for the performance; (iv) compliance and audit reports concerning the LS Fund and Prospector;
42
Investment Sub-Advisory Agreement Renewal Approval (Unaudited) – continued
(v) disclosure information contained in the registration statement of the Trust for the LS Fund and Prospector’s Form ADV; (vi) a memorandum from counsel, that summarized the fiduciary duties and responsibilities of the Board in reviewing and approving the Prospector Agreement. The Board also requested and received various informational materials including, without limitation: (a) documents containing information about Prospector, including its financial information; a description of its personnel and the services it provides to the LS Fund; information on Prospector’s investment advice and performance; summaries of the LS Fund’s expenses, compliance program, current legal matters, and other general information; (b) comparative expense and performance information for other mutual funds with strategies similar to the LS Fund; and (c) the benefits to be realized by Prospector from its relationship with the LS Fund. The Board did not identify any particular information that was most relevant to its consideration to approve the Prospector Agreement and each Trustee may have afforded different weight to the various factors.
1. | The nature, extent, and quality of the services to be provided by Prospector. In this regard, the Board considered Prospector’s responsibilities under the Prospector Agreement. The Board considered the services being provided by Prospector to the LS Fund, including without limitation: the quality of its investment sub-advisory services (including research and recommendations with respect to portfolio securities), and its process for formulating investment recommendations and assuring compliance with the LS Fund’s investment objectives and limitations. The Board considered Prospector’s continuity of, and commitment to retain, qualified personnel and Prospector’s commitment to maintain its resources and systems. The Board considered Prospector’s personnel, including the education and experience of the personnel and Prospector’s compliance program, policies and procedures. The Board considered the arrangements between LSA and Prospector pursuant to which Prospector has an on-going arrangement with respect to the Fund in which it would agree to waive, to a degree, a portion of its sub-advisory fees and commit to an exclusivity arrangement between itself and LSA with respect to managing other mutual funds with similar objectives. After considering the foregoing information and further information in the Meeting materials provided by Prospector (including its Form ADV), the Board concluded that, in light of all the facts and circumstances, the nature, extent, and quality of the services provided by Prospector were satisfactory and adequate for the LS Fund. |
2. | Investment Performance of the LS Fund and Prospector. In considering the investment performance of the LS Fund and Prospector, the Trustees considered the consistency of Prospector’s management of the LS Fund with the LS Fund’s investment objective, strategies, and limitations. The Trustees also compared the performance of the LS Fund with the performance of its Morningstar category. The Trustees focused on the performance since Prospector assumed its role as sub-adviser on May 28, 2015. They noted that the LS Fund’s performance was above the average and median of its Morningstar category for the one-year and 3-year periods ended December 31, 2018. The Trustees also observed that the LS Fund had outperformed its style-specific benchmark and its broad-based benchmark for the one year period, and outperformed the style-specific benchmark for the period since Prospector began managing the LS Fund. After |
43
Investment Sub-Advisory Agreement Renewal Approval (Unaudited) – continued
reviewing and discussing the investment performance of the LS Fund further, Prospector’s experience sub-advising the LS Fund, the LS Fund’s performance since Prospector began managing the portfolio, and other relevant factors, the Board concluded, in light of all the facts and circumstances, that the investment performance of the LS Fund and Prospector was satisfactory.
3. | The costs of the services to be provided and profits to be realized by Prospector from the relationship with the LS Fund. In this regard, the Board considered: (1) Prospector’s financial condition; (2) asset levels of the LS Fund; (3) the overall expenses of the LS Fund; and (4) the nature and frequency of sub-advisory fee payments. The Trustees reviewed information provided by Prospector regarding its profits associated with managing the LS Fund. The Board also considered potential benefits for Prospector in managing the Fund. The Board compared the fees and expenses of the Fund (including the sub-advisory fee) to other private fund accounts managed by Prospector, and determined that the fee arrangements were relatively comparable in light of the differing structures. Following this comparison and upon further consideration and discussion of the foregoing, the Board concluded that the fees to be paid to Prospector by LSA and the profits to be realized by Prospector, in light of all the facts and circumstances, were fair and reasonable in relation to the nature and quality of the services provided by Prospector. |
4. | The extent to which economies of scale would be realized as the Fund grows and whether advisory fee levels reflect these economies of scale for the benefit of the LS Fund’s investors. In this regard, the Board considered the Fund’s fee arrangements with Prospector. The Board considered that while the sub-advisory fee changed with changes in the Fund’s assets, the Fund’s shareholders did not realize any changes in their overall expenses as Prospector’s fee was paid entirely from the advisory fee paid to LSA, which was fixed. The Board considered the sub-advisory fees in light of the overall arrangement with the Fund’s investment adviser. In light of the foregoing, the Board determined that the LS Fund’s fee arrangements for Prospector, in light of all the facts and circumstances, were fair and reasonable in relation to the nature and quality of the services provided by Prospector. |
5. | Possible conflicts of interest and benefits to Prospector. In evaluating Prospector’s practices regarding conflicts of interest, the Trustees evaluated the potential for conflicts of interest and considered such matters as the experience and ability of the advisory personnel assigned to the LS Fund; the basis of decisions to buy or sell securities for the LS Fund and/or Prospector’s other accounts; the substance and administration of Prospector’s code of ethics and other relevant policies described in Prospector’s Form ADV, and affiliations and associations of Prospector and its principals. The Board concluded that the foregoing matters were appropriately disclosed and managed by Prospector. With respect to benefits to Prospector (in addition to the fees under the Prospector Agreement), the Board noted that Prospector would benefit from its relationship with the LS Fund as the LS Fund would provide a more diversified investor base and an alternative vehicle in which to place clients with initial investments below the minimum for its private funds. Following further consideration and discussion, the Board determined that Prospector’s standards and practices relating to the identification and mitigation of potential conflicts of interest |
44
Investment Sub-Advisory Agreement Renewal Approval (Unaudited) – continued
were satisfactory and the benefits to be realized by Prospector from managing the LS Fund were satisfactory.
After additional consideration of the factors delineated in the memorandum provided by counsel and further discussion among the Board members, the Board determined to approve the continuation of the Prospector Agreement between LSA and Prospector.
45
Trustees and Officers (Unaudited)
The Board of Trustees supervises the business activities of the Trust. Each Trustee serves as a trustee until termination of the Trust unless the Trustee dies, resigns, retires or is removed.
The following table provides information regarding each of the Independent Trustees.
Name, Address*, Age,
Position with Trust**,
Term of Position with Trust | | Principal Occupation During Past 5 Years
and Other Directorships | | Other Directorships |
Andrea N. Mullins, 52 Independent Trustee
Since December 2013 Chairperson
since March 2017 | | Current:Private investor; Independent Contractor, SWM Advisors (since April 2014). | | Trustee, Angel Oak Funds Trust (since February 2019) (4 portfolios); Trustee, Angel Oak Strategic Credit Fund (since February 2019); Angel Oak Financial Strategies Income Term Trust (since April 2019). |
Ira P. Cohen, 60 Independent Trustee
Since June 2010 | | Current:Independent financial services consultant (since February 2005); Executive Vice President of Asset Management Services, Recognos Financial (since August 2015). | | Trustee and Audit Committee Chairman, Griffin Institutional Access Credit Fund (since January 2017); Trustee and Audit Committee Chairman, Griffin Institutional Real Estate Access Fund (since May 2014); Trustee, Angel Oak Funds Trust (since October 2014) (4 portfolios) Trustee, Chairman, and Nominating and Governance Committee Chairman, Angel Oak Strategic Credit Fund (since December 2017); Angel Oak Financial Strategies Income Term Trust (since April 2019). |
46
The following table provides information regarding the Trustee who is considered an “interested person” of the Trust, as that term is defined under the 1940 Act. Based on the experience of the Trustee, the Trust concluded that the individual described below should serve as a Trustee.
Name, Address*, Age,
Position with Trust**,
Term of Position with Trust | | Principal Occupation During Past 5 Years | | Other Directorships |
Mark J. Seger,57
Trustee
Since March 2017 | | Current:Vice Chairman of Ultimus Fund Solutions, LLC (since 1999). Previous:Managing Director and Co-Chief Executive Officer of Ultimus Fund Solutions, LLC (since 1999). | | None. |
* | The address for each Trustee is 225 Pictoria Drive, Suite 450, Cincinnati, Ohio 45246. |
** | As of the date of this report, the Trust consists of 12 series. |
The following table provides information regarding the Officers of the Trust:
Name, Address*, Age,
Position with Trust**,
Term of Position with Trust | | Principal Occupation During Past 5 Years | | Other Directorships |
Adam T. Kornegay, 34 Principal Executive Officer and President
Since April 2018 | | Current:Assistant Vice President, Business Development Director, Ultimus Fund Solutions, LLC (since March 2015). Previous: Vice President, Citigroup, Inc. (July 2009 to February 2015). | | None. |
Gregory Knoth, 49 Principal Financial Officer and Treasurer
Since April 2019 | | Current: Vice President, Mutual Fund Controller, Ultimus Fund Solutions, LLC (since December 2015). Previous: Vice President and Manager of Fund Accounting, Huntington Asset Services, Inc. (n/k/a Ultimus Asset Services, LLC) (June 2013 to December 2015). | | None. |
Martin R. Dean, 55
Interim Chief Compliance Officer
Since May 2019 | | Current:Vice President, Director of Fund Compliance of Ultimus Fund Solutions, LLC (since January 2016) Previous: Senior Vice President and Compliance Group Manager, Huntington Asset Services, Inc. (n/k/a Ultimus Asset Services, LLC) (July 2013 to December 2015). | | None. |
47
Name, Address*, Age,
Position with Trust**,
Term of Position with Trust | | Principal Occupation During Past 5 Years | | Other Directorships |
Carol J. Highsmith, 54
Vice President
Since August 2008 Secretary
Since March 2014 | | Current:Assistant Vice President, Ultimus Fund Solutions, LLC (since December 2015). Previous: Employed in various positions with Huntington Asset Services, Inc. (n/k/a Ultimus Asset Services, LLC) (November 1994 to December 2015), most recently Vice President of Legal Administration (2005 to December 2015). | | None. |
* | The address for each officer is 225 Pictoria Drive, Suite 450, Cincinnati, Ohio 45246. |
** | As of the date of this report, the Trust consists of 12 series. |
Other Information (Unaudited)
The Fund’s Statement of Additional Information (“SAI”) includes additional information about the trustees and is available without charge, upon request. You may call toll-free at (877) 336-6763 to request a copy of the SAI or to make shareholder inquiries.
48
FACTS | WHAT DOES VALUED ADVISERS TRUST DO WITH YOUR PERSONAL INFORMATION? |
| | |
Why? | Financial companies choose how they share your personal information. Federal law gives consumers the right to limit some but not all sharing. Federal law also requires us to tell you how we collect, share, and protect your personal information. Please read this notice carefully to understand what we do. |
| | |
What? | The types of personal information we collect and share depend on the product or service you have with us. This information can include: ■ Social Security number ■ account balances and account transactions ■ transaction or loss history and purchase history ■ checking account information and wire transfer instructions When you areno longer our customer, we continue to share your information as described in this notice. |
| | |
How? | All financial companies need to share customers’ personal information to run their everyday business. In the section below, we list the reasons financial companies can share their customers’ personal information; the reasons Valued Advisers Trust chooses to share; and whether you can limit this sharing. |
| | |
Reasons we can share your personal information | Does Valued Advisers Trust share? |
For our everyday business purposes —
such as to process your transactions, maintain your account(s), respond to court orders and legal investigations, or report to credit bureaus | Yes |
For our marketing purposes —
to offer our products and services to you | Yes |
For joint marketing with other financial companies | No |
For our affiliates’ everyday business purposes –
information about your transactions and experiences | No |
For our affiliates’ everyday business purposes –
information about your creditworthiness | No |
For nonaffiliates to market to you | No |
| | |
Questions? | Call (877) 336-6763 |
49
Who we are |
Who is providing this notice? | Valued Advisers Trust |
What we do |
How does Valued Advisers Trust protect my personal information? | To protect your personal information from unauthorized access and use, we use security measures that comply with federal law. These measures include computer safeguards and secured files and buildings. |
How does Valued Advisers Trust collect my personal information? | We collect your personal information, for example, when you ■ open an account or deposit money ■ buy securities from us or sell securities to us ■ make deposits or withdrawals from your account or provide account information ■ give us your account information ■ make a wire transfer ■ tell us who receives the money ■ tell us where to send the money ■ show your government-issued ID ■ show your driver’s license |
Why can’t I limit all sharing? | Federal law gives you the right to limit only ■ sharing for affiliates’ everyday business purposes — information about your creditworthiness ■ affiliates from using your information to market to you ■ sharing for nonaffiliates to market to you State laws and individual companies may give you additional rights to limit sharing. |
Definitions |
Affiliates | Companies related by common ownership or control. They can be financial and nonfinancial companies. |
Nonaffiliates | Companies not related by common ownership or control. They can be financial and nonfinancial companies. ■Valued Advisers Trust does not share your personal information with nonaffiliates so they can market to you. |
Joint marketing | A formal agreement between nonaffiliated financial companies that together market financial products or services to you. ■Valued Advisers Trust doesn’t jointly market financial products or services to you. |
50
This page intentionally left blank.
This page intentionally left blank.
This page intentionally left blank.
PROXY VOTING
A copy of the policies and procedures that the Fund uses to determine how to vote proxies relating to securities held in the Fund’s portfolio, as well as a record of how the Fund voted any such proxies during the most recent twelve month period ended June 30, is available without charge and upon request by (1) calling the Fund at (877) 336-6763 and (2) from Fund documents filed with the Securities and Exchange Commission (“SEC”) on the SEC’s website at www.sec.gov.
TRUSTEES
Andrea N. Mullins, Chairperson
Ira P. Cohen
Mark J. Seger
OFFICERS
Adam T. Kornegay, Principal Executive Officer and President
Gregory Knoth, Principal Financial Officer and Treasurer
Martin R. Dean, Interim Chief Compliance Officer
Carol J. Highsmith, Vice President and Secretary
INVESTMENT ADVISER
Long Short Advisors, LLC
130 N. 18th Street, 26th floor, Suite 2675
Philadelphia, PA 19103
DISTRIBUTOR
Unified Financial Securities, LLC
9465 Counselors Row, Suite 200
Indianapolis, IN 46240
INDEPENDENT REGISTERED PUBLIC ACCOUNTING FIRM
Cohen & Company, Ltd.
1350 Euclid Avenue, Suite 800
Cleveland, OH 44115
LEGAL COUNSEL
Stradley Ronon Stevens & Young, LLP
2005 Market Street, Suite 2600
Philadelphia, PA 19103
CUSTODIAN
U.S. Bank, N.A.
425 Walnut Street
Cincinnati, OH 45202
ADMINISTRATOR, TRANSFER AGENT AND FUND ACCOUNTANT
Ultimus Fund Solutions, LLC
225 Pictoria Drive, Suite 450
Cincinnati, OH 45246
This report is intended only for the information of shareholders or those who have received the Fund’s prospectus which contains information about the Fund’s management fee and expenses. Please read the prospectus carefully before investing.
Distributed by Unified Financial Securities, LLC
Member FINRA/SIPC
Item 2. Code of Ethics.
As of the end of the period covered by this report, the registrant has adopted a code of ethics that applies to the registrant's principal executive officer, principal financial officer, principal accounting officer or controller, or persons performing similar functions, regardless of whether these individuals are employed by the registrant or a third party. Pursuant to Item 12(a)(1), a copy of registrant’s code of ethics is filed as an exhibit to this Form N-CSR. During the period covered by this report, the code of ethics has not been amended, and the registrant has not granted any waivers, including implicit waivers, from the provisions of the code of ethics.
Item 3. Audit Committee Financial Expert.
(a)(1) The registrant’s Board of Trustees has determined that the registrant has at least one audit committee financial expert serving on its audit committee.
(a)(2) The audit committee financial expert is Andrea N. Mullins, who is “independent” for purposes of this Item 3 of Form N-CSR.
Item 4. Principal Accountant Fees and Services.
| LS Opportunity Fund: | FY 2019 | $14,500 |
| | FY 2018 | $14,500 |
| | | |
| BFS Equity Fund: | FY 2019 | $13,500 |
| | FY 2018 | $13,500 |
| LS Opportunity Fund: | FY 2019 | $0 |
| | FY 2018 | $0 |
| | | |
| BFS Equity Fund: | FY 2019 | $0 |
| | FY 2018 | $0 |
| LS Opportunity Fund: | FY 2019 | $3,000 |
| | FY 2018 | $3,000 |
| | | |
| BFS Equity Fund: | FY 2019 | $3,000 |
| | FY 2018 | $3,000 |
Nature of the fees: Preparation of the 1120 RIC and Excise review
| LS Opportunity Fund: | FY 2019 | $0 |
| | FY 2018 | $0 |
| | | |
| BFS Equity Fund: | FY 2019 | $0 |
| | FY 2018 | $0 |
| (e) | (1) | Audit Committee’s Pre-Approval Policies |
The Audit Committee Charter requires the Audit Committee to be responsible for the selection, retention or termination of auditors and, in connection therewith, to (i) evaluate the proposed fees and other compensation, if any, to be paid to the auditors, (ii) evaluate the independence of the auditors, (iii) pre-approve all audit services and, when appropriate, any non-audit services provided by the independent auditors to the Trust, (iv) pre-approve, when appropriate, any non-audit services provided by the independent auditors to the Trust's investment adviser, or any entity controlling, controlled by, or under common control with the investment adviser and that provides ongoing services to the Trust if the engagement relates directly to the operations and financial reporting of the Trust, and (v) receive the auditors’ specific representations as to their independence;
| (2) | All of the services described in paragraphs (b) through (d) of Item 4 were pre-approved by the Audit Committee. |
(f) During audit of registrant's financial statements for the most recent fiscal year, less than 50 percent of the hours expended on the principal accountant's engagement were attributed to work performed by persons other than the principal accountant's full-time, permanent employees.
(g) The aggregate non-audit fees billed by the registrant's accountant for services rendered to the registrant, and rendered to the registrant's investment adviser (not including any sub-adviser whose role is primarily portfolio management and is subcontracted with or overseen by another investment adviser), and any entity controlling, controlled by, or under common control with the adviser that provides ongoing services to the registrant:
| | Registrant | Adviser |
| FY 2019 | $6,000 | $0 |
| FY 2018 | $6,000 | $0 |
(h) Not applicable. The auditor performed no services for the registrant’s investment adviser or any entity controlling, controlled by, or under common control with the investment adviser that provides ongoing services to the registrant.
Item 5. Audit Committee of Listed Companies.NOT APPLICABLE – applies to listed companiesonly
Item 6. Schedule of Investments.Schedules filed with Item 1.
Item 7. Disclosure of Proxy Voting Policies and Procedures for Closed-End Management Investment Companies.NOT APPLICABLE – applies to closed-end funds only
Item 8. Portfolio Managers of Closed-End Investment Companies.NOT APPLICABLE – applies to closed-end funds only
Item 9. Purchases of Equity Securities by Closed-End Management Investment Company and Affiliated Purchasers.NOT APPLICABLE – applies to closed-end funds only
Item 10. Submission of Matters to a Vote of Security Holders.
The guidelines applicable to shareholders desiring to submit recommendations for nominees to the Registrant's board of trustees are contained in the statement of additional information of the Trust with respect to the Fund(s) for which this Form N-CSR is being filed.
Item 11. Controls and Procedures.
(a) Based on their evaluation of the registrant’s disclosure controls and procedures (as defined in Rule 30a-3(c) under the Investment Company Act of 1940, as amended (the “Act”)) as of a date within 90 days of the filing date of this report, the registrant’s principal executive officer and principal financial officer have concluded that such disclosure controls and procedures are reasonably designed and are operating effectively to ensure that material information relating to the registrant is made known to them by others within those entities, particularly during the period in which this report is being prepared, and that the information required in filings on Form N-CSR is recorded, processed, summarized, and reported on a timely basis.
(b) There were no changes in the registrant’s internal control over financial reporting (as defined in Rule 30a-3(d) under the Investment Company Act of 1940) that occurred during the second fiscal quarter of the period covered by this report that have materially affected, or are reasonably likely to materially affect, the registrant’s internal control over financial reporting.
Item 12. Disclosure of Securities Lending Activities for Closed-End Management Investment Companies.NOT APPLICABLE
Item 13. Exhibits.
| (a) | (1) | Code is filed herewith. |
| (2) | Certifications by the registrant's principal executive officer and principal financial officer, pursuant to Section 302 of the Sarbanes- Oxley Act of 2002 and required by Rule 30a-2 under the Investment Company Act of 1940 are filed herewith. |
| (b) | Certification pursuant to 18 U.S.C. Section 1350, as adopted pursuant to Section 906 of the Sarbanes-Oxley Act of 2002 is filed herewith. |
Pursuant to the requirements of the Securities Exchange Act of 1934 and the Investment Company Act of 1940, the registrant has duly caused this report to be signed on its behalf by the undersigned, thereunto duly authorized.
| (Registrant) | Valued Advisers Trust | |
| | | |
| By | /s/Adam T. Kornegay | |
| | Adam T. Kornegay, President and Principal Executive Officer |
| | | |
| Date | 7/26/2019 | |
| | | |
| Pursuant to the requirements of the Securities Exchange Act of 1934 and the Investment Company Act of 1940, this report has been signed below by the following persons on behalf of the registrant and in the capacities and on the dates indicated. |
| | | |
| By | /s/ Adam T. Kornegay | |
| | Adam T. Kornegay, President and Principal Executive Officer |
| | | |
| Date | 7/26/2019 | |
| | | |
| By | /s/Gregory Knoth | |
| | Gregory Knoth, Treasurer and Principal Financial Officer |
| | | |
| Date | 7/26/2019 | |