united states
securities and exchange commission
washington, d.c. 20549
form n-csr
certified shareholder report of registered management
investment companies
Investment Company Act file number 811-22208
Valued Advisers Trust
(Exact name of registrant as specified in charter)
Ultimus Fund Solutions, LLC 225 Pictoria Drive, Suite 450 Cincinnati, OH 45246
(Address of principal executive offices) (Zip code)
Ultimus Fund Solutions, LLC
Attn: Gregory Knoth
225 Pictoria Drive, Suite 450
Cincinnati, OH 45246
(Name and address of agent for service)
Registrant's telephone number, including area code: 513-587-3400
Date of fiscal year end: 5/31
Date of reporting period: 5/31/2021
Item 1. Reports to Stockholders.
(a)
| |
| BFS Equity Fund |
| |
| |
| |
| |
| |
| |
| |
| |
| |
| |
| |
| |
| |
| |
| |
| ANNUAL REPORT |
| |
| |
| May 31, 2021 |
| |
| |
| |
| |
| |
| |
| |
| |
| |
| |
| |
| |
| |
| |
| |
| |
| |
| |
| |
| |
| |
| |
| |
 |
| |
| 185 Asylum Street ● City Place II ● Hartford, CT 06103 ● (855) 575-2430 |
BFS Equity Fund
Letter to Shareholders
Dear Fellow Shareholders,
This annual report covers the period June 1, 2020, through May 31, 2021 – the BFS Equity Fund’s seventh full fiscal year.
The BFS Equity Fund (the “Fund”) was launched on November 8, 2013, with initial funds from investors of $1.1 million. On June 1, 2020, at the start of the Fund’s fiscal year, the Fund had net assets of $38.9 million. During the fiscal year, the net assets of the Fund increased 25.4% to $48.8 million, as of May 31, 2021. This growth was driven by net inflows from investors into the Fund, as well as by the positive investment return achieved by the Fund over the past fiscal year. As of May 31, 2021, there were approximately 700 investors in the Fund.
The BFS Equity Fund achieved a total return of 34.68% for the fiscal year commencing June 1, 2020, and ending May 31, 2021, underperforming the S&P 500® Index (“S&P 500”) total return of 40.32% and underperforming the Dow Jones Industrial Average (“Dow Jones”) total return of 38.79% for the same period. For the three-year period commencing June 1, 2018, and ending May 31, 2021, the Fund achieved an annualized total return of 15.23%, underperforming the S&P 500 annualized three-year total return of 18.00% and outperforming the Dow Jones annualized three-year total return of 14.82% for the same period. For the five-year period commencing June 1, 2016, and ending May 31, 2021, the Fund achieved an annualized total return of 14.83%, underperforming the S&P 500 annualized five-year total return of 17.16% and underperforming the Dow Jones annualized five-year total return of 16.88% for the same period.
This report includes a commentary from the Lead Portfolio Manager, Rob Bradley, and Co-Portfolio Managers, Tom Sargent, and Keith LaRose. Rob Bradley assumed the role of Lead Portfolio Manager of the Fund April 1, 2020, from Tim Foster who, after 25 years of providing substantial leadership for Bradley, Foster & Sargent, Inc., the company he co-founded and the investment advisor for the Fund, elected to transition into a reduced role at Bradley, Foster & Sargent, Inc. In his reduced role, as of March 31, 2020, Tim Foster completed his tour as Lead Portfolio Manager of the Fund. In the report you
will also find a listing of the portfolio holdings as of May 31, 2021, as well as financial statements and detailed information about the performance and positioning of the BFS Equity Fund.
The last twelve months has been a period of change. The equity market has been more anticipatory than in previous cycles, with returns being pulled forward. U.S. corporate debt has risen to the highest level on record – now at about 50% of GDP, while cash holdings of S&P 500 companies increased to an all-time high during 2020. The Fed has maintained an accommodative monetary policy during the last year but a continued rise in inflation that proves not to be transitory could lead to a tightening of monetary conditions and slower growth in output and business profits. The prospects for the passage of large fiscal spending programs before the end of the calendar year are uncertain and the resulting impact on deficit spending is unclear. Housing prices are rising rapidly because of a shortfall in supply and a rise in construction costs. There has been considerable shrinkage in the workforce and the remote work from anywhere employment model could persist indefinitely. Digitalization of the workforce has rapidly accelerated through the application of technology, automation, and robotics and the differential in wages based on education and skill levels continues to widen. There is increasing concern that the COVID-19 pandemic has not stabilized and that the Delta and other new variants are more threatening than initially perceived, especially for the unvaccinated. And the U.S. vaccination programs have slowed dramatically, even stalling in numerous states, as resistance to inoculations appears, at least at the moment, to be firmly entrenched.
All of these are potential catalysts that could impact the risk of investing in common stocks in the near-term. We believe that it is important for investors to take the long view. The important principle for creating wealth in the U.S. stock market is time in the market, not timing the market. Now, more than ever, it is important for investors to focus on quality companies ‒ with great brands, sound business models, quality management, wide moats, strong balance sheets, and strong cash flows. Investing in these companies for the long term rather than focusing on the short-term gyrations of the market will preserve capital in times of economic adversity and create wealth in times of economic growth.
In closing, it is important to reiterate our belief that, now more than ever, our investment strategy of investing in quality growth stocks purchased with a risk-mitigating approach and positioned to provide a margin of safety in the case of economic or market weakness is effective over the longer term. We believe the Fund’s ownership of shares in quality
companies with sound business models, strong brands, good balance sheets, professional management, and robust cash flow should be able to withstand market corrections, even bear markets, and perform well over the longer term.
The Portfolio Managers of the BFS Equity Fund and I are shareholders together with you. We thank you for the trust that you have placed in us to manage your assets.
Sincerely
Stephen L. Willcox
President and CEO
Bradley, Foster & Sargent, Inc.
BFS Equity Fund
Portfolio Managers’ Letter
The BFS Equity Fund celebrated its seventh anniversary last fall. As of the close of the Fund’s fiscal year on May 31, 2021, Fund assets were $48.8 million – up from $38.9 million at the start of the fiscal year on June 1, 2020. The price per share of the BFS Equity Fund has grown from $10 at its inception to $21.36 on May 31, 2021 – a compound annual growth rate of 11.79%. Our number of shareholders exceeds 700, primarily client families and friends of Bradley, Foster & Sargent, as well as principals of the firm.
The performance of the Fund for the year ending May 31, 2021, was 34.68%, compared to the total return for the Dow Jones of 38.79% and the S&P 500 of 40.32% for the period. In the six-month period ending May 31, 2021, the Fund returned 14.36% vs. the S&P 500’s total return of 16.95%.
As noted in our November 2020 Semi-Annual letter, volatility was the byword for the stock market. At the start of the Fund’s fiscal year on June 1, 2020, the S&P 500 opened at 3038.78; it closed the Fund’s fiscal year on May 28, 2021, at 4204.11 with a total return of 40.32%. However, during this seemingly unstoppable bull market, the S&P 500 tumbled 10.6% (intraday) in September. This was followed with an 8.5% drop in October, both caused primarily by uncertainties in the outcome of the 2020 elections. Finally, in November 2020, amidst the resulting clarity from the Biden win, the 12+ year bull market continued its relentless ascent, shrugging off the January 6 riot in the Capitol building in Washington D.C., spikes in the prices of commodities, and the specter of inflation. Buoyancy over the domestic housing market, a swift economic recovery from stimulus, superior earnings from agile companies, and burgeoning consumer optimism propelled the gains.
During this period, the Fund’s underweighting in industrials, materials, and energy undercut comparative performance, as did a sizeable cash position of 3%-5%. Our positioning in communication services, healthcare, consumer discretionary, and real estate recaptured some of the difference and, more recently with the start of the 2021 calendar year, our valuation-sensitive underweighting in technology has served the Fund well as in the first five months of 2021, the Fund outperformed the NASDAQ. Stock-selection, premised on valuation and fundamentals, continue to inspire our analyses, as does a longer-term outlook with an eye for the competitive leadership and growth prospects that make for outstanding companies and successful investments.
For the three calendar years ending 2020, the Fund’s total cumulative return of 42.54% compared favorably with the equal-weighted S&P 500® Index’s total return of 34.64% and the Dow Jones total return of 32.75% - outperformances of 7.90% and 9.79%, respectively. However, the Fund underperformed the technology-ascendant (FAANG+) S&P 500’s total return of 48.82% during this period. It is the goal of the Fund’s portfolio managers to overcome this underperformance over the coming years.
STOCK MARKET COMMENTARY
The first five calendar months of 2021 has started similarly to 2020 - a robust stock market on a path to taking out all new highs with volatility somewhat subdued. As this letter is written on June 30, 2021, the S&P 500 stands at 4295 – just below its all-time high of 4300 – 92.1% above the March 23, 2020, low of the Covid-abyss. Remarkably the S&P 500 is 26.9% above its February 19th, 2020, high mark, before the news of the pandemic took hold.
However, the outward optics belie an uneasy tension in the market, perhaps best illuminated by the much-loved NASDAQ. Amidst the course of this implacable bull market, the growth stock-laden NASDAQ has been the bellwether for risk appetite, as many investors have been attracted to so-called growth stocks at any price. Many hedge funds, often known for their nimbleness, have been caught flatfooted recently. Several long-tenured equity long-short hedge funds nearly went out of business, caught in a short squeeze in Gamestop and AMC (see the Bradley, Foster & Sargent Quarterly Commentary, March 2021). Other reputable funds have negative returns for the year, 14% or more below the S&P 500’s total return.
The government’s massive fiscal stimulus combined with the Federal Reserve’s dramatic increase in the money supply has resuscitated U.S. GDP growth, which miraculously contracted only -3.5% in 2020, after plunging 32.4% in the second quarter. This was the U.S. economy’s first contraction in twelve years. During the first quarter of 2021, U.S. GDP accelerated to +6.4% in Q1, and economists are projecting 6.6% GDP growth in Q2 2021. Employment has recovered with unemployment halving to 6.2% in March 2021 (from 13.1% in June 2020), but it is still a long way from the 3.6% pre-pandemic levels in February 2020.
In formulating our strategy for the Fund in the coming year, we are mindful of the following data points: (1) since February 2020, the Fed’s balance sheet has doubled, from $4.2 trillion to $8.1 trillion; (2) COVID-19 stimulus spending under the Trump
and Biden administrations now totals approximately $4.5 trillion, all funded by deficit spending; (3) the U.S. equity market has surged to all-time highs, resulting in a market cap equivalent of more than 200% of U.S. GDP; and (4) the yield on the U.S. 10-year Treasury Note exploded from 0.51% in August 2020 to 1.45% at present. Accordingly, the stock market should be bolstered by the strong fiscal and monetary tail winds, as well as the rock bottom level of interest rates, but the market’s rich valuation and the possibility of higher inflation and interest rates lead us to take a cautionary approach in the year to come.
INVESTMENT COMMENTARY
For the fiscal year ending May 31, 2021, the Fund returned 34.68%. Financials, Communications, Consumer Discretionary, and Real Estate were our most profitable investments, and our performance exceeded the respective S&P sectors most notably in Health Care (+38.1% vs +22.0%), Real Estate (+41.5% vs +29.7%), Consumer Discretion (+47.4% vs +38.6%), and Utilities (+17.0% vs +13.0%).
Stocks contributing to our outperformance in these sectors in the fiscal year included Danaher (+54.3%) Iqvia (+36.0%) and Thermo Fisher (+34.8%) in Healthcare, DR Horton (+74.0%), Home Depot (31.3%), and Lowes (26.8%) in Consumer Discretionary, and JPMorgan (+74.2%) and American Express (+71.0%) in Financials. Deere (+140.6%) and Caterpillar (105.4%) in Industrials, boosted performance.
Regarding relative performance, the Fund’s total return for the year was 34.68% – below the S&P 500’s total return of 40.32%. There were several reasons for this underperformance: underweighting the industrial and financial sectors, security selection in these sectors, as well as in the materials sector, and a sizeable cash position. For much of the year, the Fund was underweight the industrial sector and had only small positions in Deere and Caterpillar, which performed very well, and had no exposure to UPS. On the other hand, the Fund was overweight in the Materials sector, but its holdings of Barrick Gold Corporation, Agnico Eagle, and Ecolabs hurt relative performance considerably. Finally, the Fund’s cash position, which averaged 4-5% throughout the year, contributed approximately 2% to the Fund’s relative underperformance to the S&P 500.
As we discussed in our Semi-Annual letter, we believed 2021 was going to see a strong rebound in corporate earnings. We also cited caution over speculative and momentum stocks and a recognition that volatility could elevate, necessitating a higher-than-average cash holding to deploy into dislocations. Consequently, we structured the Fund with
broad diversity and balance in stocks of high-quality companies. For example, our largest weighting, the S&P 500 Technology Sector, which has two of our largest positions (Microsoft and Apple at 8.4% of our overall portfolio) posted the strongest return of any sector during the period under review at 42.64%. In the final seven months of 2020, this sector was up 34.1%, yet for first five months of 2021, it appreciated only 6.4%, trailing the S&P 500 by nearly 625 bps. Our weighting of 22.0% in this sub-sector (vs its 26.2% weighting in the S&P 500) led to underperformance in the latter half of 2020 and outperformance in first half of 2021 from this dynamic.
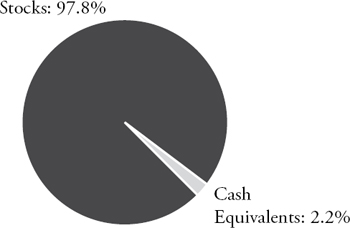
The Fund is off to a strong start in the first six months of 2021 up 12.10%. Our largest positions at the end of the fiscal year are Microsoft, Amazon, Alphabet, Apple, and Fiserv, which account for 19.5% of the overall portfolio, with our top ten holdings responsible for roughly 1/3 of our total portfolio of forty-nine stocks. Cash is 2.2%, down from the 5.0% that we kept on hand during much of the first part of the Fund’s fiscal year.
INVESTMENT STRATEGY
We recognize four dominant themes in the equity market right now: (1) inflation and its implications on sectoral leadership and corporate earnings; (2) labor shortages; (3) rising yields in the 10-year and 30-year bonds; and (4) tax policies at the corporate and personal level.
Despite these potential issues that could derail the market’s upward trend, there are still reasons to be bullish, even with the view that the best days of the market cycle may be behind us. A lower return environment is not tantamount to a bear market. We remain in a period of accommodative monetary policy and negative real rates of interest. Moreover, there are world-class companies which are structural winners with robust cash flows that are still trading below their intrinsic value. This suggests equities continue to provide a superior risk/reward opportunity for longer-term capital appreciation.
World-class companies with strong cash flow, margins, earnings growth, and balance sheets will continue to anchor our portfolio. The stalwarts of Microsoft, Amazon, Alphabet, and Facebook (newly added) feature prominently, along with best-in-class consumer companies (Home Depot, Lowes, Costco, Starbucks), financials (American Express, JP Morgan, Goldman Sachs), industrials (Caterpillar, Deere), media (Comcast, Disney), and healthcare (which we are overweight). We are also looking to add more
cyclical plays, with FedEx being a recent addition. Finally, we are long Oil (Conoco Phillips), Gold (Agnico Eagle) and Copper (Freeport McMoRan) as proxies for economic recovery and hedges against inflation.
We also note two important factors. Firstly, U.S. equities, according to a JP Morgan report, have beaten the rest of the world MSCI indices by 7% per annum over the past 13 years, but U.S. multiples are now at all-time highs against the rest of the world. Thus, we are keeping an eye out for best-in-class opportunities outside of the US that blend value with growth. Our position in Taiwan Semiconductors reflects this. Secondly, during the year under review, there has been a rotation in the market from Growth to Value, and then more recently investors have been favoring Growth. The implication for the Fund is that Value or GARP “growth at a reasonable price” stocks may not do as well as Growth stocks, as risk-loving investors regather confidence and chase performance. We carry a 2.2% cash position to deploy into dislocations which may arise.
CONCLUSION
We, the portfolio managers at Bradley, Foster & Sargent, Inc., are also shareholders of the BFS Equity Fund. We look forward to serving you through our management of the Fund. Thank you for placing your capital under our care.
| Robert H. Bradley | Keith G. LaRose | Thomas D. Sargent |
| Lead Portfolio Manager | Co-Portfolio Manager | Co-Portfolio Manager |
BFS Equity Fund
ANNUAL PERFORMANCE REVIEW (UNAUDITED)
The Fund returned +34.68% for the twelve month period commencing June 1, 2020, and ending May 31, 2021, underperforming the S&P 500, which returned +40.32% and the Dow Jones, which gained +38.79% over the same period.
Key Detractors from Relative Results
| ● | The Industrial sector in the Fund, which was up 18.16% for the year, was the worst performing sector relatively, as this sector in the S&P 500, with its large concentration of Deere, Caterpillar, and UPS advanced 57.96%. The Fund was slightly underweight this sector but had only modest positions in Deere and Caterpillar and did not own UPS. |
| ● | The Fund was significantly overweight the Materials sector, but its positions in Barrick Gold and Agnico Eagle as well as Ecolabs hurt relative performance. |
| ● | The Fund’s cash position of 4-5% during the year contributed approximately 2% to the Fund’s underperformance relative to the S&P 500. |
Key Contributors to Relative Results
| ● | The Consumer Discretionary sector of the Fund returned 47.39% during the period, which compared favorably relative to the S&P 500’s sector return of +38.64%. D.R. Horton and Amazon were the best performers with returns of 72.46% and 38.41% for the fiscal year. |
| ● | The Fund’s health care sector returned 38.09% - considerably ahead of the S&P 500 sector’s return of 22.02%. Danaher and Thermo Fisher were the standouts with returns for the period of 62.81% and 43.60%, respectively. |
| ● | The Fund’s position in Apple was the Fund’s single largest contributor in dollar terms, adding over $1 million in realized and unrealized gains. |
FUND INFORMATION
May 31, 2021 (Unaudited)
ASSET ALLOCATION
(as a percentage of net assets)
| TEN LARGEST HOLDINGS (%) | | FUND |
| Microsoft | | 4.7 |
| Amazon.com | | 4.2 |
| Alphabet, Class A | | 3.9 |
| Apple | | 3.9 |
| Fiserv | | 3.1 |
| Berkshire Hathaway, Class B | | 3.0 |
| Agnico Eagle Mines | | 3.0 |
| ConocoPhillips | | 2.9 |
| Costco | | 2.8 |
| Facebook | | 2.8 |
| SECTOR | | | | |
| DIVERSIFICATION (%) | | FUND | | S&P 500 |
| Technology | | 22.0 | | 26.2 |
| Healthcare | | 15.8 | | 13.0 |
| Consumer Discretionary | | 12.1 | | 12.1 |
| Communication Services | | 11.5 | | 11.1 |
| Materials | | 10.2 | | 2.8 |
| Financials | | 9.6 | | 11.9 |
| Industrials | | 8.5 | | 8.9 |
| Consumer Staples | | 5.2 | | 6.0 |
| Energy | | 2.9 | | 2.8 |
| Cash Equivalents | | 2.2 | | 0.0 |
| Utilities | | 0.0 | | 2.6 |
| Real Estate | | 0.0 | | 2.6 |
Availability of Portfolio Schedules (Unaudited)
The Fund files its complete schedule of portfolio holdings with the Securities and Exchange Commission (“SEC”) for the first and third quarters of each fiscal year as an exhibit to its reports on Form N-PORT. The Fund’s Form N-PORT reports are available on the SEC’s website at http://www.sec.gov.
BFS Equity Fund
Investment Results (Unaudited)
Average Annual Total Returns(a) (For the periods ended May 31, 2021)
| | One | Three | Five | Since Inception |
| | Year | Year | Year | (November 8, 2013) |
| BFS Equity Fund | 34.68% | 15.23% | 14.83% | 11.79% |
| S&P 500® Index(b) | 40.32% | 18.00% | 17.16% | 14.38% |
| Dow Jones Industrial Average®(c) | 38.79% | 14.82% | 16.88% | 13.61% |
Total annual fund operating expenses, as disclosed in the BFS Equity Fund’s prospectus dated September 28, 2020, as supplemented May 6, 2021, were 1.52% of average daily net assets (1.25% after fee waivers/expense reimbursements by Bradley, Foster & Sargent, Inc. (the “Adviser”)). The Adviser has contractually agreed to waive or limit its fees and to assume other expenses of the Fund until September 30, 2021, so that Total Annual Fund Operating Expenses does not exceed 1.00%. This contractual arrangement may only be terminated by mutual consent of the Adviser and the Board of Trustees of the Valued Advisers Trust (the “Trust”), and it will automatically terminate upon the termination of the investment advisory agreement between the Trust and the Adviser. This operating expense limitation does not apply to: (i) interest, (ii) taxes, (iii) brokerage commissions, (iv) other expenditures which are capitalized in accordance with generally accepted accounting principles, (v) other extraordinary expenses not incurred in the ordinary course of the Fund’s business, (vi) dividend expense on short sales, (vii) expenses incurred under a plan of distribution under Rule 12b-1, and (viii) expenses that the Fund has incurred but did not actually pay because of an expense offset or brokerage/service arrangements, if applicable, in any fiscal year. The operating expense limitation also excludes any “Acquired Fund Fees and Expenses,” which are the expenses indirectly incurred by the Fund as a result of investing in money market funds or other investment companies, including exchange-traded funds, that have their own expenses. Each waiver or reimbursement of an expense by the Adviser is subject to repayment by the Fund within the three years following such waiver or reimbursement, provided that the Fund is able to make the repayment without exceeding the expense limitation in place at the time of the waiver or reimbursement and the expense limitation in place at the time of the repayment.
The performance quoted represents past performance, which does not guarantee future results. The investment return and principal value of an investment will fluctuate so that an investor’s shares, when redeemed, may be worth more or less than their original cost. The returns shown do not reflect deduction of taxes that a shareholder would pay on Fund distributions or the redemption of Fund shares. The Fund’s investment objectives, risks, charges and expenses must be considered carefully before investing. Current performance of the Fund may be lower or higher than the performance quoted. Performance data current to the most recent month end may be obtained by calling (855) 575-2430.
| (a) | Average annual total returns reflect any change in price per share and assume the reinvestment of all distributions. The Fund’s returns reflect any fee reductions during the applicable periods. If such fee reductions had not occurred, the quoted performance would have been lower. |
| (b) | The S&P 500® Index is a widely recognized unmanaged index of equity prices and is representative of a broader market and range of securities than is found in the Fund’s portfolio. The index is an unmanaged benchmark that assumes reinvestment of all distributions and excludes the effect of taxes and fees. Individuals cannot invest directly in this index; however, an individual can invest in exchange-traded funds or other investment vehicles that attempt to track the performance of a benchmark index. |
| (c) | The Dow Jones Industrial Average® is a widely recognized unmanaged index of equity prices and is representative of a narrower market and range of securities than is found in the Fund’s portfolio. The index is an unmanaged benchmark that assumes reinvestment of all distributions and excludes the effect of taxes and fees. Individuals cannot invest directly in this index; however, an individual can invest in exchange-traded funds or other investment vehicles that attempt to track the performance of a benchmark index. |
The Fund’s investment objectives, strategies, risks, charges and expenses must be considered carefully before investing. The prospectus contains this and other important information about the Fund and may be obtained by calling the same number as above. Please read it carefully before investing.
The Fund is distributed by Ultimus Fund Distributors, LLC, member FINRA/SIPC.
BFS Equity Fund
Investment Results (Unaudited) (continued)
$10,000 Over 10 Years
Let’s say hypothetically that $10,000 was invested in the Fund, on November 8, 2013. The following chart shows how the value of your investment would have changed, and also shows how the S&P 500® Index and Dow Jones Industrial Average performed over the same period.
Comparison of the Growth of a $10,000 Investment in the
BFS Equity Fund, the S&P 500® Index and the Dow Jones Industrial Average (Unaudited)
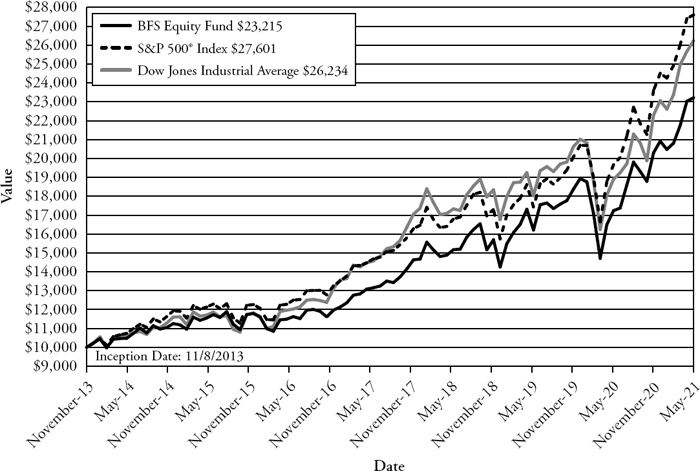
The chart above assumes an initial investment of $10,000 made on November 8, 2013 (commencement of operations) held through May 31, 2021. THE FUND’S RETURN REPRESENTS PAST PERFORMANCE AND DOES NOT GUARANTEE FUTURE RESULTS. The returns shown do not reflect deduction of taxes that a shareholder would pay on Fund distributions or the redemption of Fund shares. Investment returns and principal values will fluctuate so that your shares, when redeemed, may be worth more or less than their original purchase price.
Current performance may be lower or higher than the performance data quoted. For more information on the Fund, and to obtain performance data current to the most recent month-end, or to request a prospectus, please call (855) 575-2430. You should carefully consider the investment objectives, potential risks, management fees, and charges and expenses of the Fund before investing. The Fund’s prospectus contains this and other information about the Fund, and should be read carefully before investing.
The Fund is distributed by Ultimus Fund Distributors, LLC, member FINRA/SIPC.
| BFS Equity Fund |
| Schedule of Investments |
| May 31, 2021 |
| | | Shares | | | Fair Value | |
| COMMON STOCKS — 97.85% | | | | | | | | |
| | | | | | | | | |
| Aerospace & Defense — 2.14% | | | | | | | | |
| Northrop Grumman Corp. | | | 2,000 | | | $ | 731,740 | |
| Raytheon Technologies Corp. | | | 3,500 | | | | 310,485 | |
| | | | | | | | 1,042,225 | |
| Banking — 2.53% | | | | | | | | |
| JPMorgan Chase & Co. | | | 7,500 | | | | 1,231,800 | |
| | | | | | | | | |
| Beverages — 1.21% | | | | | | | | |
| PepsiCo, Inc. | | | 4,000 | | | | 591,760 | |
| | | | | | | | | |
| Biotech & Pharmaceuticals — 5.17% | | | | | | | | |
| AbbVie, Inc. | | | 10,000 | | | | 1,132,000 | |
| Johnson & Johnson | | | 3,000 | | | | 507,750 | |
| Zoetis, Inc. | | | 5,000 | | | | 883,400 | |
| | | | | | | | 2,523,150 | |
| Cable & Satellite — 2.35% | | | | | | | | |
| Comcast Corp., Class A | | | 20,000 | | | | 1,146,800 | |
| | | | | | | | | |
| Chemicals — 4.60% | | | | | | | | |
| Ecolab, Inc. | | | 4,500 | | | | 967,860 | |
| Sherwin-Williams Co. (The) | | | 4,500 | | | | 1,275,885 | |
| | | | | | | | 2,243,745 | |
| E-Commerce Discretionary — 4.13% | | | | | | | | |
| Amazon.com, Inc.(a) | | | 625 | | | | 2,014,419 | |
| | | | | | | | | |
| Electrical Equipment — 1.17% | | | | | | | | |
| Keysight Technologies, Inc.(a) | | | 4,000 | | | | 569,520 | |
| | | | | | | | | |
| Entertainment Content — 1.46% | | | | | | | | |
| Walt Disney Co. (The)(a) | | | 4,000 | | | | 714,600 | |
| | | | | | | | | |
| Food — 1.30% | | | | | | | | |
| Mondelez International, Inc., Class A | | | 10,000 | | | | 635,300 | |
| | | | | | | | | |
| Health Care Facilities & Services — 4.01% | | | | | | | | |
| IQVIA Holdings, Inc.(a) | | | 3,000 | | | | 720,480 | |
| UnitedHealth Group, Inc. | | | 3,000 | | | | 1,235,760 | |
| | | | | | | | 1,956,240 | |
| Home Construction — 2.44% | | | | | | | | |
| D.R. Horton, Inc. | | | 12,500 | | | | 1,191,125 | |
See accompanying notes which are an integral part of these financial statements.
| BFS Equity Fund |
| Schedule of Investments (continued) |
| May 31, 2021 |
| | | Shares | | | Fair Value | |
| COMMON STOCKS — 97.85% - continued | | | | | | | | |
| | | | | | | | | |
| Institutional Financial Services — 1.83% | | | | | | | | |
| Goldman Sachs Group, Inc. (The) | | | 2,400 | | | $ | 892,848 | |
| | | | | | | | | |
| Insurance — 4.38% | | | | | | | | |
| Berkshire Hathaway, Inc., Class B(a) | | | 5,000 | | | | 1,447,200 | |
| Marsh & McLennan Cos., Inc. | | | 5,000 | | | | 691,750 | |
| | | | | | | | 2,138,950 | |
| Internet Media & Services — 6.57% | | | | | | | | |
| Alphabet, Inc., Class A(a) | | | 800 | | | | 1,885,480 | |
| Facebook, Inc., Class A(a) | | | 4,000 | | | | 1,314,920 | |
| | | | | | | | 3,200,400 | |
| Leisure Facilities & Services — 0.58% | | | | | | | | |
| Starbucks Corp. | | | 2,500 | | | | 284,700 | |
| | | | | | | | | |
| Machinery — 3.76% | | | | | | | | |
| Caterpillar, Inc. | | | 1,000 | | | | 241,080 | |
| Deere & Co. | | | 1,000 | | | | 361,100 | |
| Parker-Hannifin Corp. | | | 4,000 | | | | 1,232,600 | |
| | | | | | | | 1,834,780 | |
| Medical Equipment & Devices — 6.60% | | | | | | | | |
| Danaher Corp. | | | 4,000 | | | | 1,024,560 | |
| Stryker Corp. | | | 4,000 | | | | 1,021,080 | |
| Thermo Fisher Scientific, Inc. | | | 2,500 | | | | 1,173,750 | |
| | | | | | | | 3,219,390 | |
| Metals & Mining — 5.57% | | | | | | | | |
| Agnico Eagle Mines Ltd. | | | 20,000 | | | | 1,435,000 | |
| Freeport-McMoRan, Inc. | | | 30,000 | | | | 1,281,600 | |
| | | | | | | | 2,716,600 | |
| Oil & Gas Producers — 2.86% | | | | | | | | |
| ConocoPhillips | | | 25,000 | | | | 1,393,500 | |
| | | | | | | | | |
| Retail - Consumer Staples — 2.72% | | | | | | | | |
| Costco Wholesale Corp. | | | 3,500 | | | | 1,323,945 | |
| | | | | | | | | |
| Retail - Discretionary — 5.02% | | | | | | | | |
| Home Depot, Inc. (The) | | | 4,000 | | | | 1,275,640 | |
| Lowe’s Cos., Inc. | | | 6,000 | | | | 1,168,980 | |
| | | | | | | | 2,444,620 | |
See accompanying notes which are an integral part of these financial statements.
| BFS Equity Fund |
| Schedule of Investments (continued) |
| May 31, 2021 |
| | | Shares | | | Fair Value | |
| COMMON STOCKS — 97.85% - continued | | | | | | | | |
| | | | | | | | | |
| Semiconductors — 1.20% | | | | | | | | |
| Taiwan Semiconductor Manufacturing Co., Ltd. - ADR | | | 5,000 | | | $ | 586,800 | |
| | | | | | | | | |
| Software — 9.54% | | | | | | | | |
| Adobe Systems, Inc.(a) | | | 2,000 | | | | 1,009,160 | |
| Microsoft Corp. | | | 9,000 | | | | 2,247,120 | |
| Oracle Corp. | | | 7,500 | | | | 590,550 | |
| SS&C Technologies Holdings, Inc. | | | 11,000 | | | | 812,570 | |
| | | | | | | | 4,659,400 | |
| Specialty Finance — 0.82% | | | | | | | | |
| American Express Co. | | | 2,500 | | | | 400,325 | |
| | | | | | | | | |
| Technology Hardware — 3.83% | | | | | | | | |
| Apple, Inc. | | | 15,000 | | | | 1,869,150 | |
| | | | | | | | | |
| Technology Services — 6.32% | | | | | | | | |
| Automatic Data Processing, Inc. | | | 3,000 | | | | 588,060 | |
| Fiserv, Inc.(a) | | | 13,000 | | | | 1,497,600 | |
| MasterCard, Inc., Class A | | | 1,500 | | | | 540,870 | |
| Visa, Inc., Class A | | | 2,000 | | | | 454,600 | |
| | | | | | | | 3,081,130 | |
| Telecommunications — 1.16% | | | | | | | | |
| T-Mobile US, Inc.(a) | | | 4,000 | | | | 565,800 | |
| | | | | | | | | |
| Transportation & Logistics — 2.58% | | | | | | | | |
| FedEx Corp. | | | 4,000 | | | | 1,259,240 | |
| | | | | | | | | |
| Total Common Stocks (Cost $28,336,092) | | | | | | | 47,732,262 | |
See accompanying notes which are an integral part of these financial statements.
| BFS Equity Fund |
| Schedule of Investments (continued) |
| May 31, 2021 |
| | | Shares | | | Fair Value | |
| MONEY MARKET FUNDS — 3.58% | | | | | | | | |
| | | | | | | | | |
| Fidelity Investments Money Market Government Portfolio, Institutional Class, 0.01%(b) | | | 1,745,424 | | | $ | 1,745,424 | |
| Total Money Market Funds (Cost $1,745,424) | | | | | | | 1,745,424 | |
| | | | | | | | | |
| Total Investments — 101.43% (Cost $30,081,516) | | | | | | | 49,477,686 | |
| | | | | | | | | |
| Liabilities in Excess of Other Assets — (1.43)% | | | | | | | (696,897 | ) |
| | | | | | | | | |
| NET ASSETS — 100.00% | | | | | | $ | 48,780,789 | |
| (a) | Non-income producing security. |
| (b) | Rate disclosed is the seven day effective yield as of May 31, 2021. |
See accompanying notes which are an integral part of these financial statements.
| BFS Equity Fund |
| Statement of Assets and Liabilities |
| May 31, 2021 |
| Assets | | | |
| Investments in securities at fair value (cost $30,081,516) (Note 3) | | $ | 49,477,686 | |
| Receivable for fund shares sold | | | 57,196 | |
| Receivable for investments sold | | | 591,232 | |
| Dividends receivable | | | 45,602 | |
| Prepaid expenses | | | 8,688 | |
| Total Assets | | | 50,180,404 | |
| Liabilities | | | | |
| Payable for fund shares redeemed | | | 1,400 | |
| Payable for investments purchased | | | 1,317,410 | |
| Payable to Adviser (Note 4) | | | 24,155 | |
| Payable to Administrator (Note 4) | | | 7,169 | |
| Distribution (12b-1) fees accrued (Note 4) | | | 20,010 | |
| Other accrued expenses | | | 29,471 | |
| Total Liabilities | | | 1,399,615 | |
| Net Assets | | $ | 48,780,789 | |
| Net Assets consist of: | | | | |
| Paid-in capital | | $ | 25,090,960 | |
| Accumulated earnings | | | 23,689,829 | |
| Net Assets | | $ | 48,780,789 | |
| Shares outstanding (unlimited number of shares authorized, no par value) | | | 2,283,606 | |
| Net asset value, offering and redemption price per share (Note 2) | | $ | 21.36 | |
See accompanying notes which are an integral part of these financial statements.
| BFS Equity Fund |
| Statement of Operations |
| For the year ended May 31, 2021 |
| Investment Income | | | | |
| Dividend income (net of foreign taxes withheld of $11,876) | | $ | 499,504 | |
| Total investment income | | | 499,504 | |
| Expenses | | | | |
| Investment Adviser fees (Note 4) | | | 329,262 | |
| Distribution (12b-1) fees (Note 4) | | | 109,754 | |
| Administration and compliance services fees (Note 4) | | | 39,097 | |
| Registration expenses | | | 27,185 | |
| Fund accounting fees (Note 4) | | | 25,000 | |
| Legal fees | | | 20,623 | |
| Transfer agent fees (Note 4) | | | 18,000 | |
| Audit and tax preparation fees | | | 17,500 | |
| Printing and postage expenses | | | 9,376 | |
| Trustee fees | | | 4,971 | |
| Custodian fees | | | 4,319 | |
| Insurance expenses | | | 3,081 | |
| Miscellaneous | | | 35,324 | |
| Total expenses | | | 643,492 | |
| Fees contractually waived by Adviser (Note 4) | | | (93,387 | ) |
| Net operating expenses | | | 550,105 | |
| Net investment loss | | | (50,601 | ) |
| Net Realized and Change in Unrealized Gain (Loss) on Investments | | | | |
| Net realized gain on: | | | | |
| Investment securities transactions | | | 6,170,271 | |
| Foreign currency | | | 19 | |
| Net change in unrealized appreciation on investments | | | 6,794,817 | |
| Net realized and change in unrealized gain on investments | | | 12,965,107 | |
| Net increase in net assets resulting from operations | | $ | 12,914,506 | |
See accompanying notes which are an integral part of these financial statements.
| BFS Equity Fund |
| Statements of Changes in Net Assets |
| | | For the | | | For the | |
| | | Year Ended | | | Year Ended | |
| Increase (Decrease) in Net Assets due to: | | May 31, 2021 | | | May 31, 2020 | |
| Operations | | | | | | | | |
| Net investment income (loss) | | $ | (50,601 | ) | | $ | 84,280 | |
| Net realized gain (loss) on investment securities transactions and foreign currency | | | 6,170,290 | | | | (910,939 | ) |
| Net change in unrealized appreciation on investments | | | 6,794,817 | | | | 2,979,164 | |
| Net increase in net assets resulting from operations | | | 12,914,506 | | | | 2,152,505 | |
| Distributions to Shareholders from Earnings (Note 2) | | | (677,735 | ) | | | (729,409 | ) |
| Capital Transactions | | | | | | | | |
| Proceeds from shares sold | | | 3,372,117 | | | | 4,251,409 | |
| Reinvestment of distributions | | | 565,222 | | | | 608,093 | |
| Amount paid for shares redeemed | | | (6,257,021 | ) | | | (3,379,179 | ) |
| Net increase (decrease) in net assets resulting from capital transactions | | | (2,319,682 | ) | | | 1,480,323 | |
| Total Increase in Net Assets | | | 9,917,089 | | | | 2,903,419 | |
| Net Assets | | | | | | | | |
| Beginning of year | | | 38,863,700 | | | | 35,960,281 | |
| End of year | | $ | 48,780,789 | | | $ | 38,863,700 | |
| Share Transactions | | | | | | | | |
| Shares sold | | | 175,156 | | | | 255,499 | |
| Shares issued in reinvestment of distributions | | | 29,717 | | | | 34,570 | |
| Shares redeemed | | | (334,774 | ) | | | (211,771 | ) |
| Net increase (decrease) in shares outstanding | | | (129,901 | ) | | | 78,298 | |
See accompanying notes which are an integral part of these financial statements.
| BFS Equity Fund |
| Financial Highlights |
| (For a share outstanding during each year) |
| | | For the | | | For the | | | For the | | | For the | | | For the | |
| | | Year | | | Year | | | Year | | | Year | | | Year | |
| | | Ended | | | Ended | | | Ended | | | Ended | | | Ended | |
| | | May 31, | | | May 31, | | | May 31, | | | May 31, | | | May 31, | |
| | | 2021 | | | 2020 | | | 2019 | | | 2018 | | | 2017 | |
| Selected Per Share Data: | | | | | | | | | | | | | | | | | | | | |
| Net asset value, beginning of year | | $ | 16.10 | | | $ | 15.40 | | | $ | 14.96 | | | $ | 13.01 | | | $ | 11.55 | |
| Income from investment operations: | | | | | | | | | | | | | | | | | | | | |
| Net investment income (loss) | | | (0.02 | ) | | | 0.03 | | | | 0.04 | | | | 0.04 | | | | 0.04 | |
| Net realized and unrealized gain on investments | | | 5.57 | | | | 0.97 | | | | 0.90 | | | | 1.96 | | | | 1.47 | |
| Total from investment operations | | | 5.55 | | | | 1.00 | | | | 0.94 | | | | 2.00 | | | | 1.51 | |
| Less distributions to shareholders from: | | | | | | | | | | | | | | | | | | | | |
| Net investment income | | | — | | | | (0.03 | ) | | | (0.04 | ) | | | (0.04 | ) | | | (0.05 | ) |
| Net realized gains | | | (0.29 | ) | | | (0.27 | ) | | | (0.46 | ) | | | (0.01 | ) | | | — | |
| Total distributions | | | (0.29 | ) | | | (0.30 | ) | | | (0.50 | ) | | | (0.05 | ) | | | (0.05 | ) |
| Net asset value, end of year | | $ | 21.36 | | | $ | 16.10 | | | $ | 15.40 | | | $ | 14.96 | | | $ | 13.01 | |
| Total Return(a) | | | 34.68 | % | | | 6.32 | % | | | 6.84 | % | | | 15.36 | % | | | 13.15 | % |
| Ratios and Supplemental Data: | | | | | | | | | | | | | | | | | | | | |
| Net assets, end of year (000 omitted) | | $ | 48,781 | | | $ | 38,864 | | | $ | 35,960 | | | $ | 31,750 | | | $ | 27,185 | |
| Ratio of net expenses to average net assets | | | 1.25 | % | | | 1.25 | % | | | 1.25 | % | | | 1.25 | % | | | 1.25 | % |
| Ratio of expenses to average net assets before waiver and reimbursement | | | 1.46 | % | | | 1.52 | % | | | 1.57 | % | | | 1.65 | % | | | 1.75 | % |
| Ratio of net investment income (loss) to average net assets | | | (0.12 | )% | | | 0.21 | % | | | 0.28 | % | | | 0.26 | % | | | 0.35 | % |
| Portfolio turnover rate | | | 68.77 | % | | | 49.27 | % | | | 38.71 | % | | | 38.17 | % | | | 47.82 | % |
| (a) | Total return represents the rate that the investor would have earned or lost on an investment in the Fund, assuming reinvestment of distributions. |
See accompanying notes which are an integral part of these financial statements.
| BFS Equity Fund |
| Notes to the Financial Statements |
| May 31, 2021 |
NOTE 1. ORGANIZATION
The BFS Equity Fund (the “Fund”) is registered under the Investment Company Act of 1940, as amended (“1940 Act”), as an open-end diversified series of Valued Advisers Trust (the “Trust”) and commenced operations on November 8, 2013. The Trust is a management investment company established under the laws of Delaware by an Agreement and Declaration of Trust dated June 13, 2008 (the “Trust Agreement”). The Trust Agreement permits the Board of Trustees (the “Board” or the “Trustees”) to issue an unlimited number of shares of beneficial interest of separate series without par value. The Fund is one of a series of funds authorized by the Board. The Fund’s investment adviser is Bradley, Foster & Sargent, Inc. (the “Adviser”). The investment objective of the Fund is long-term appreciation through growth of principal and income.
NOTE 2. SIGNIFICANT ACCOUNTING POLICIES
The Fund is an investment company and follows accounting and reporting guidance under Financial Accounting Standards Board Accounting Standards Codification (“ASC”) Topic 946, “Financial Services-Investment Companies.” The following is a summary of significant accounting policies followed by the Fund in the preparation of its financial statements. These policies are in conformity with generally accepted accounting principles in the United States of America (“GAAP”).
Estimates – The preparation of financial statements in conformity with GAAP requires management to make estimates and assumptions that affect the reported amounts of assets and liabilities and disclosure of contingent assets and liabilities at the date of the financial statements and the reported amounts of increases and decreases in net assets from operations during the reporting period. Actual results could differ from those estimates.
Federal Income Taxes – The Fund makes no provision for federal income or excise tax. The Fund has qualified and intends to qualify each year as a regulated investment company (“RIC”) under subchapter M of the Internal Revenue Code of 1986, as amended, by complying with the requirements applicable to RICs and by distributing substantially all of its taxable income. The Fund also intends to distribute sufficient net investment income and net realized capital gains, if any, so that it will not be subject to excise tax on undistributed income and gains. If the required amount of net investment income or gains is not distributed, the Fund could incur a tax expense.
As of and during the fiscal year ended May 31, 2021, the Fund did not have any liabilities for any unrecognized tax benefits. The Fund recognizes interest and penalties, if any, related to unrecognized tax benefits as income tax expense on the Statement of Operations when incurred. During the fiscal year ended May 31, 2021, the Fund did not incur any interest or penalties. Management of the Fund has reviewed tax positions taken in tax years that remain subject to examination by all major tax jurisdictions, including federal (i.e., the last three tax year ends and the interim tax period since then, as applicable). Management believes that there is no tax liability resulting from unrecognized tax benefits related to uncertain tax positions taken.
| BFS Equity Fund |
| Notes to the Financial Statements (continued) |
| May 31, 2021 |
Expenses – Expenses incurred by the Trust that do not relate to a specific fund of the Trust are allocated to the individual funds based on each fund’s relative net assets or another appropriate basis (as determined by the Board).
Security Transactions and Related Income – The Fund follows industry practice and records security transactions on the trade date for financial reporting purposes. For financial statement and income tax purposes, the specific identification method is used for determining capital gains or losses. Dividend income and dividend expense are recorded on the ex-dividend date and interest income is recorded on an accrual basis. Dividend income from real estate investment trusts (REITs) and distributions from limited partnerships are recognized on the ex-date. The calendar year end classification of distributions received from REITs during the fiscal year are reported subsequent to year end; accordingly, the Fund estimates the character of REIT distributions based on the most recent information available. Income or loss from Limited Partnerships is reclassified among the components of net assets upon receipt of Schedules K-1 (Form 1065). Non-cash income, if any, is recorded at the fair market value of the securities received. Withholding taxes on foreign dividends have been provided for in accordance with the Fund’s understanding of the applicable country’s tax rules and rates.
Foreign Currency Translation – The accounting records of the Fund are maintained in U.S. dollars. Foreign currency amounts are translated into U.S. dollars at the current rate of exchange each business day to determine the value of investments, and other assets and liabilities. Purchases and sales of foreign securities, and income and expenses, are translated at the prevailing rate of exchange on the respective date of these transactions. The Fund does not isolate that portion of the results of operations resulting from changes in foreign exchange rates on investments from fluctuation arising from changes in market prices of securities held. These fluctuations are included with the unrealized gain or loss from investments. Reported net realized foreign exchange gains or losses arise from sales of foreign currencies, currency gains or losses realized between the trade and settlement dates on securities transactions, and the difference between the amounts of dividends, interest, and foreign withholding taxes recorded on the Fund’s books and the U.S. dollar equivalent of the amounts actually received or paid. Net unrealized foreign exchange gains and losses arise from changes in the fair values of assets and liabilities, other than investments in securities at period end, resulting from changes in exchange rates.
Dividends and Distributions – The Fund intends to distribute its net investment income and net realized long-term and short-term capital gains, if any, at least annually. Dividends and distributions to shareholders, which are determined in accordance with income tax regulations, are recorded on the ex-dividend date. The treatment for financial reporting purposes of distributions made to shareholders during the period from net investment income or net realized capital gains may differ from their ultimate treatment for federal income tax purposes. These differences are caused primarily by differences in the timing of the recognition of certain components of income, expense or realized capital gain for federal income tax purposes. Where such differences are permanent in nature, they are reclassified among the components of net assets based on their ultimate characterization for federal income tax purposes. Any such reclassifications will have no effect on net assets, results of operations or net asset value (“NAV”) per share of the Fund.
| BFS Equity Fund |
| Notes to the Financial Statements (continued) |
| May 31, 2021 |
For the fiscal year ended May 31, 2021, the Fund made the following reclassifications to increase (decrease) the components of net assets:
| | | Accumulated Earnings |
| Paid-In Capital | | (Deficit) |
| $(1) | | $1 |
Share Valuation – The NAV is calculated each day the New York Stock Exchange (the “NYSE”) is open by dividing the total value of the Fund’s assets, less liabilities, by the number of shares outstanding for the Fund.
NOTE 3. SECURITIES VALUATION AND FAIR VALUE MEASUREMENTS
The Fund values its portfolio securities at fair value as of the close of regular trading on the NYSE (normally 4:00 p.m. Eastern time) on each business day the NYSE is open for business. Fair value is defined as the price that the Fund would receive upon selling an investment in a timely transaction to an independent buyer in the principal or most advantageous market of the investment. GAAP establishes a three-tier hierarchy to maximize the use of observable market data and minimize the use of unobservable inputs and to establish classification of fair value measurements for disclosure purposes.
Inputs refer broadly to the assumptions that market participants would use in pricing the asset or liability, including assumptions about risk (the risk inherent in a particular valuation technique used to measure fair value including a pricing model and/or the risk inherent in the inputs to the valuation technique). Inputs may be observable or unobservable. Observable inputs are inputs that reflect the assumptions market participants would use in pricing the asset or liability developed based on market data obtained and available from sources independent of the reporting entity. Unobservable inputs are inputs that reflect the reporting entity’s own assumptions about the assumptions market participants would use in pricing the asset or liability developed based on the best information available in the circumstances.
Various inputs are used in determining the value of the Fund’s investments. These inputs are summarized in the three broad levels listed below.
| ● | Level 1 – unadjusted quoted prices in active markets for identical investments and/ or registered investment companies where the value per share is determined and published and is the basis for current transactions for identical assets or liabilities at the valuation date |
| ● | Level 2 – other significant observable inputs (including, but not limited to, quoted prices for an identical security in an inactive market, quoted prices for similar securities, interest rates, prepayment speeds, credit risk, etc.) |
| ● | Level 3 – significant unobservable inputs (including the Fund’s own assumptions in determining fair value of investments based on the best information available) |
| BFS Equity Fund |
| Notes to the Financial Statements (continued) |
| May 31, 2021 |
The inputs used to measure fair value may fall into different levels of the fair value hierarchy. In such cases, for disclosure purposes, the level in the fair value hierarchy which is reported is determined based on the lowest level input that is significant to the fair value measurement in its entirety.
Equity securities that are traded on any stock exchange are generally valued at the last quoted sale price on the security’s primary exchange. Lacking a last sale price, an exchange-traded security is generally valued at its last bid price. Securities traded in the NASDAQ over-the-counter market are generally valued at the NASDAQ Official Closing Price. When using the market quotations and when the market is considered active, the security is classified as a Level 1 security. In the event that market quotations are not readily available or are considered unreliable due to market or other events, the Fund values its securities and other assets at fair value in accordance with policies established by and under the general supervision of the Board. Under these policies, the securities will be classified as Level 2 or 3 within the fair value hierarchy, depending on the inputs used.
Investments in mutual funds, including money market mutual funds, are generally priced at the ending NAV. These securities are categorized as Level 1 securities.
In accordance with the Trust’s valuation policies, the Adviser is required to consider all appropriate factors relevant to the value of securities for which it has determined other pricing sources are not available or reliable as described above. No single method exists for determining fair value, because fair value depends upon the circumstances of each individual case. As a general principle, the current fair value of a security being valued by the Adviser would be the amount that the Fund might reasonably expect to receive upon the current sale. Methods that are in accordance with this principle may, for example, be based on (i) a multiple of earnings; (ii) a discount from market prices of a similar freely traded security (including a derivative security or a basket of securities traded on other markets, exchanges or among dealers); or (iii) yield to maturity with respect to debt issues, or a combination of these and other methods. Fair-value pricing is permitted if, in the Adviser’s opinion, the validity of market quotations appears to be questionable based on factors such as evidence of a thin market in the security based on a small number of quotations, a significant event occurs after the close of a market but before the Fund’s NAV calculation that may affect a security’s value, or the Adviser is aware of any other data that calls into question the reliability of market quotations.
The following is a summary of the inputs used to value the Fund’s investments as of May 31, 2021:
| | | Valuation Inputs | | | | |
| Assets | | Level 1 | | | Level 2 | | | Level 3 | | | Total | |
| Common Stocks(a) | | $ | 47,732,262 | | | $ | — | | | $ | — | | | $ | 47,732,262 | |
| Money Market Funds | | | 1,745,424 | | | | — | | | | — | | | | 1,745,424 | |
| Total | | $ | 49,477,686 | | | $ | — | | | $ | — | | | $ | 49,477,686 | |
| (a) | Refer to Schedule of Investments for industry classifications. |
| BFS Equity Fund |
| Notes to the Financial Statements (continued) |
| May 31, 2021 |
The Fund did not hold any investments at the end of the reporting period for which significant unobservable inputs (Level 3) were used in determining fair value; therefore, no reconciliation of Level 3 securities is included for this reporting period.
NOTE 4. FEES AND OTHER TRANSACTIONS WITH AFFILIATES
Under the terms of the investment advisory agreement on behalf of the Fund, the Adviser manages the Fund’s investments subject to oversight of the Board. As compensation for its services, the Fund pays the Adviser a fee, computed and accrued daily and paid monthly, at an annual rate of 0.75% of the average daily net assets of the Fund. For the fiscal year ended May 31, 2021, the Adviser earned a fee of $329,262 from the Fund before the waivers described below. At May 31, 2021, the Fund owed the Adviser $24,155.
The Adviser has contractually agreed to waive or limit its management fee and/or reimburse certain operating expenses until September 30, 2021, but only to the extent necessary so that the Fund’s net expenses, excluding brokerage fees and commissions, borrowing costs (such as interest and dividend expenses on securities sold short), taxes, extraordinary expenses, fees and expenses paid under a distribution plan adopted pursuant to Rule 12b-1 fees and indirect expenses (such as “acquired funds fees and expenses”) do not exceed 1.00%.
Each waiver or reimbursement of an expense by the Adviser is subject to repayment by the Fund within the three years following such waiver or reimbursement, provided that the Fund is able to make the repayment without exceeding the expense limitation in place at the time of the waiver or reimbursement and the expense limitation in place at the time of the repayment. The contractual agreement is in effect through September 30, 2021. This contractual arrangement may only be terminated by mutual consent of the Adviser and the Board, and it will automatically terminate upon the termination of the investment advisory agreement between the Fund and the Adviser. For the fiscal year ended May 31, 2021, the Adviser waived fees of $93,387.
The amounts subject to repayment by the Fund, pursuant to the aforementioned conditions, are as follows:
| Recoverable through | | Amount | |
| May 31, 2022 | | $ | 110,755 | |
| May 31, 2023 | | | 108,051 | |
| May 31, 2024 | | | 93,387 | |
The Trust retains Ultimus Fund Solutions, LLC (“Ultimus” or “Administrator”) to provide the Fund with administration and compliance (including a chief compliance officer), fund accounting, and transfer agent services, including all regulatory reporting. For the fiscal year ended May 31, 2021, the Administrator earned fees of $39,097 for administration and compliance services, $25,000 for fund accounting services and $18,000 for transfer agent services. At May 31, 2021, the Fund owed the Administrator $7,169 for such services.
The officers and one trustee of the Trust are members of management and/or employees of the Administrator and are not paid by the Trust for services to the Fund. Ultimus Fund Distributors, LLC (the “Distributor”), a wholly owned subsidiary of Ultimus, acts as the distributor of the Fund’s shares.
| BFS Equity Fund |
| Notes to the Financial Statements (continued) |
| May 31, 2021 |
The Fund has adopted a Distribution Plan (the “Plan”) pursuant to Rule 12b-1 under the 1940 Act. The Plan provides that the Fund will pay the Distributor and/or any registered securities dealer, financial institution or any other person (the “Recipient”) a shareholder servicing fee of 0.25% of the average daily net assets of the Fund in connection with the promotion and distribution of the Fund’s shares or the provision of shareholder support services to shareholders, including, but not necessarily limited to, advertising, compensation to underwriters, dealers and selling personnel, the printing and mailing of prospectuses to other than current Fund shareholders, the printing and mailing of sales literature and servicing shareholder accounts (“12b-1 fees”). The Fund or Distributor may pay all or a portion of these fees to any Recipient who renders assistance in distributing or promoting the sale of shares, or who provides certain shareholder services, pursuant to a written agreement. For the fiscal year ended May 31, 2021, 12b-1 fees incurred by the Fund were $109,754. The Fund owed $20,010 for 12b-1 fees as of May 31, 2021.
NOTE 5. PURCHASES AND SALES OF SECURITIES
For the fiscal year ended May 31, 2021, purchases and sales of investment securities, other than short-term investments, were $29,211,752 and $31,873,837, respectively.
There were no purchases or sales of long-term U.S. government obligations during the fiscal year ended May 31, 2021.
NOTE 6. FEDERAL TAX INFORMATION
At May 31, 2021, the net unrealized appreciation (depreciation) and tax cost of investments for tax purposes was as follows:
| Gross unrealized appreciation | | $ | 19,402,767 | |
| Gross unrealized depreciation | | | (19,617 | ) |
| Net unrealized appreciation on investments | | $ | 19,383,150 | |
| Tax cost of investments | | $ | 30,094,536 | |
At May 31, 2021, the difference between book basis and tax basis unrealized appreciation (depreciation) is attributable to the tax deferral of losses on wash sales.
The tax character of distributions paid for the fiscal years ended May 31, 2021 and May 31, 2020 were as follows:
| | | 2021 | | | 2020 | |
| Distributions paid from: | | | | | | | | |
| Ordinary income(a) | | $ | — | | | $ | 123,761 | |
| Long-term capital gains | | | 677,735 | | | | 605,648 | |
| Total distributions paid | | $ | 677,735 | | | $ | 729,409 | |
| (a) | For federal income tax purposes, distributions of short-term capital gains are treated as ordinary income distributions. |
| BFS Equity Fund |
| Notes to the Financial Statements (continued) |
| May 31, 2021 |
At May 31, 2021, the components of accumulated earnings (deficit) on a tax basis were as follows:
| Undistributed ordinary income | | $ | 1,733,996 | |
| Undistributed long-term capital gains | | | 2,572,683 | |
| Unrealized appreciation (depreciation) | | | 19,383,150 | |
| Total accumulated earnings | | $ | 23,689,829 | |
NOTE 7. COMMITMENTS AND CONTINGENCIES
The Trust indemnifies its officers and Trustees for certain liabilities that may arise from their performance of their duties to the Trust or the Fund. Additionally, in the normal course of business, the Trust enters into contracts that contain a variety of representations and warranties which provide general indemnifications. The Trust’s maximum exposure under these arrangements is unknown, as this would involve future claims that may be made against the Trust that have not yet occurred.
NOTE 8. SUBSEQUENT EVENTS
Management of the Fund has evaluated the need for disclosure and/or adjustments resulting from subsequent events through the date these financial statements were issued. Effective July 23, 2021, the Adviser completed an equity recapitalization to reallocate capital ownership interests among its management team in an effort to ensure firm continuity as certain founding shareholders of the Adviser move toward retirement. Because this recapitalization resulted in a technical change of control of the Adviser, the investment advisory agreement between the Adviser and the Trust with respect to the Fund automatically terminated. At a meeting held on April 28, 2021, the Board approved an interim investment advisory agreement and a new investment advisory agreement. The new investment advisory agreement is subject to shareholder approval. The interim agreement, which became effective on July 23, 2021, will terminate upon the earlier of (i) 150 days from its effective date or (ii) the date of approval of a new investment advisory agreement by the shareholders of the Fund. Except for the effective and termination dates, the deposit of advisory fees into an escrow account, and other terms required by the 1940 Act, the terms of the interim agreement and the new agreement are identical to the terms of the previous investment advisory agreement. There were no changes in the investment strategy of the Fund or the portfolio managers of the Fund as a result of the change of control of the Adviser. There were no changes to the fees paid to the Adviser by the Fund, and all fees under the interim agreement will be held in escrow pending shareholder approval of the new agreement. The new agreement was submitted to the shareholders of the Fund for approval via a proxy solicitation. There are no additional items requiring adjustment of financial statements or additional disclosure.
| Report of Independent Registered Public Accounting Firm |
To the Shareholders of BFS Equity Fund and
Board of Trustees of Valued Advisers Trust
Opinion on the Financial Statements
We have audited the accompanying statement of assets and liabilities, including the schedule of investments, of BFS Equity Fund (the “Fund”), a series of Valued Advisers Trust, as of May 31, 2021, the related statement of operations for the year then ended, the statements of changes in net assets for each of the two years in the period then ended, the related notes, and the financial highlights for each of the five years in the period then ended (collectively referred to as the “financial statements”). In our opinion, the financial statements present fairly, in all material respects, the financial position of the Fund as of May 31, 2021, the results of its operations for the year then ended, the changes in net assets for each of the two years in the period then ended, and the financial highlights for each of the five years in the period then ended, in conformity with accounting principles generally accepted in the United States of America.
Basis for Opinion
These financial statements are the responsibility of the Fund’s management. Our responsibility is to express an opinion on the Fund’s financial statements based on our audits. We are a public accounting firm registered with the Public Company Accounting Oversight Board (United States) (“PCAOB”) and are required to be independent with respect to the Fund in accordance with the U.S. federal securities laws and the applicable rules and regulations of the Securities and Exchange Commission and the PCAOB.
We conducted our audits in accordance with the standards of the PCAOB. Those standards require that we plan and perform the audit to obtain reasonable assurance about whether the financial statements are free of material misstatement whether due to error or fraud.
Our audits included performing procedures to assess the risks of material misstatement of the financial statements, whether due to error or fraud, and performing procedures that respond to those risks. Such procedures included examining, on a test basis, evidence regarding the amounts and disclosures in the financial statements. Our procedures included confirmation of securities owned as of May 31, 2021, by correspondence with the custodian and broker. Our audits also included evaluating the accounting principles used and significant estimates made by management, as well as evaluating the overall presentation of the financial statements. We believe that our audits provide a reasonable basis for our opinion.
We have served as the Fund’s auditor since 2013.
COHEN & COMPANY, LTD.
Cleveland, Ohio
July 28, 2021
| BFS Equity Fund |
| Summary of Fund Expenses (Unaudited) |
As a shareholder of the Fund, you incur two types of costs: (1) transaction and (2) ongoing costs, including management fees and other Fund expenses. These examples are intended to help you understand your ongoing costs (in dollars) of investing in the Fund and to compare these costs with the ongoing costs of investing in other mutual funds. The example is based on an investment of $1,000 invested at the beginning of the period and held for the entire period from December 1, 2020 through May 31, 2021.
Actual Expenses
The first line of the table below provides information about actual account values and actual expenses. You may use the information in this line, together with the amount you invested, to estimate the expenses that you paid over the period. Simply divide your account value by $1,000 (for example, an $8,600 account value divided by $1,000 = 8.6), then multiply the result by the number in the first line under the heading entitled “Expenses Paid During Period” to estimate the expenses you paid on your account during this period.
Hypothetical Example for Comparison Purposes
The second line of the table below provides information about hypothetical account values and hypothetical expenses based on the Fund’s actual expense ratio and an assumed rate of return of 5% per year before expenses, which is not the Fund’s actual return. The hypothetical account values and expenses may not be used to estimate the actual ending account balance or expenses you paid for the period. You may use this information to compare the ongoing costs of investing in the Fund and other funds. To do so, compare this 5% hypothetical example with the 5% hypothetical examples that appear in the shareholder reports of other funds.
Expenses shown in the table are meant to highlight your ongoing costs only and do not reflect any transactional costs. Therefore, the second line of the table below is useful in comparing ongoing costs only and will not help you determine the relative costs of owning different funds. In addition, if transaction costs were included, your costs would have been higher.
| | | Beginning | | Ending | | | | |
| | | Account Value | | Account Value | | Expenses Paid | | Annualized |
| | | December 1, 2020 | | May 31, 2021 | | During Period(a) | | Expense Ratio |
| | | | | | | | | |
| Actual | | $1,000.00 | | $1,143.60 | | $6.68 | | 1.25% |
| Hypothetical(b) | | $1,000.00 | | $1,018.70 | | $6.29 | | 1.25% |
| (a) | Expenses are equal to the Fund’s annualized expense ratio, multiplied by the average account value over the period, multiplied by 182/365 (to reflect the one-half year period). |
| (b) | Hypothetical assumes 5% annual return before expenses. |
| Additional Federal Income Tax Information (Unaudited) |
The Form 1099-DIV you receive in January 2022 will show the tax status of all distributions paid to your account in calendar year 2021. Shareholders are advised to consult their own tax adviser with respect to the tax consequences of their investment in the Fund. As required by the Internal Revenue Code and/or regulations, shareholders must be notified regarding the status of qualified dividend income for individuals and the dividends received deduction for corporations.
Qualified Dividend Income. The Fund designates approximately 0% or up to the maximum amount of such dividends allowable pursuant to the Internal Revenue Code, as qualified dividend income eligible for a reduced tax rate.
Qualified Business Income. The Fund designates approximately 0% of its ordinary income dividends, or up to the maximum amount of such dividends allowable pursuant to the Internal Revenue Code, as qualified business income.
Dividends Received Deduction. Corporate shareholders are generally entitled to take the dividends received deduction on the portion of the Fund’s dividend distribution that qualifies under tax law. For the Fund’s calendar year 2021 ordinary income dividends, 0% qualifies for the corporate dividends received deduction.
For the year ended May 31, 2021, the Fund designated $677,735 as long-term capital gain distributions.
| Trustees and Officers (Unaudited) |
The Board of Trustees supervises the business activities of the Trust. Each Trustee serves as a trustee until termination of the Trust unless the Trustee dies, resigns, retires or is removed.
The following table provides information regarding each of the Independent Trustees.
Name, Address*, (Age),
Position with Trust**,
Term of Position with Trust | Principal Occupation During
Past 5 Years and Other Directorships | Other Directorships |
Andrea N. Mullins, (54)
Independent Trustee
Since December 2013
Chairperson since
March 2017 | Current: Private investor; Independent Contractor, SWM Advisors (since April 2014). | Trustee, Angel Oak Funds Trust (since February 2019) (5 portfolios); Trustee, Angel Oak Strategic Credit Fund (since February 2019); Trustee, Angel Oak Financial Strategies Income Term Trust (since May 2019); Trustee, Angel Oak Dynamic Financial Strategies Income Term Trust (since June 2020). |
| Trustees and Officers (Unaudited) (continued) |
Name, Address*, (Age),
Position with Trust**,
Term of Position with Trust | Principal Occupation During
Past 5 Years and Other Directorships | Other Directorships |
Ira P. Cohen, (62)
Independent Trustee
Since June 2010 | Current: Independent financial services consultant (since February 2005); Executive Vice President of Asset Management Services, Recognos Financial (since August 2015). | Trustee and Audit Committee Chairman, Griffin Institutional Access Credit Fund (since January 2017); Trustee and Audit Committee Chairman, Griffin Institutional Real Estate Access Fund (since May 2014); Trustee, Angel Oak Funds Trust (since October 2014) (5 portfolios) Trustee, Chairman, and Nominating and Governance Committee Chairman, Angel Oak Strategic Credit Fund (since December 2017) Trustee and Chairman, Angel Oak Financial Strategies Income Term Trust (since May 2019); Trustee, Angel Oak Dynamic Financial Strategies Income Term Trust (since June 2020). |
The following table provides information regarding the Trustee who is considered an “interested person” of the Trust, as that term is defined under the 1940 Act. Based on the experience of the Trustee, the Trust concluded that the individual described below should serve as a Trustee.
Name, Address*, (Age),
Position with Trust**,
Term of Position with Trust | Principal Occupation During
Past 5 Years and Other Directorships | Other Directorships |
Mark J. Seger***, (59)
Trustee
Since March 2017 | Current: Vice Chairman and Co-Founder, Ultimus Fund Solutions, LLC and its subsidiaries (since 1999). | None. |
| * | The address for each Trustee is 225 Pictoria Drive, Suite 450, Cincinnati, Ohio 45246. |
| ** | As of the date of this report, the Trust consists of 13 series. |
| *** | Mr. Seger is considered an “interested person” of the Trust because of his relationship with the Trust’s administrator, transfer agent, and distributor. |
| Trustees and Officers (Unaudited) (continued) |
The following table provides information regarding the Officers of the Trust:
Name, Address*, (Age),
Position with Trust**,
Term of Position with Trust | Principal Occupation During Past 5 Years | Other Directorships |
Adam T. Kornegay, (36)
Principal Executive Officer
and President
Since April 2018 | Current: Vice President, Business Development Director, Ultimus Fund Solutions, LLC (since March 2015). | None. |
Gregory T. Knoth, (51)
Principal Financial Officer
and Treasurer
Since April 2019 | Current: Senior Vice President, Mutual Fund Controller, Ultimus Fund Solutions, LLC (since January 2016). | None. |
Kevin J. Patton, (51)
Chief Compliance Officer
Since March 2020 | Current: Assistant Vice President, Compliance Officer, Ultimus Fund Solutions, LLC (since January 2020). Previous: Partner and Chief Compliance Officer, Renaissance Investment Management (August 2005 to January 2020). | None. |
Carol J. Highsmith, (56)
Vice President
Since August 2008
Secretary
Since March 2014 | Current: Vice President, Ultimus Fund Solutions, LLC (since December 2015). | None. |
Matthew J. Miller, (45)
Vice President
since December 2011 | Current: Assistant Vice President, Relationship Management, Ultimus Fund Solutions, LLC (since December 2015). | None. |
Stephen L. Preston, (54)
AML Officer
since June 2017 | Current: Chief Compliance Officer of Ultimus Fund Distributors, LLC (since June 2011). Previous: Chief Compliance Officer, Ultimus Fund Solutions, LLC (June 2011 to August 2019); Chief Compliance Officer, Unified Financial Securities, LLC (April 2018 to December 2019). | None. |
| * | The address for each Officer is 225 Pictoria Drive, Suite 450, Cincinnati, Ohio 45246. |
| ** | As of the date of this report, the Trust consists of 13 series. |
| BFS Equity Fund |
| Investment Advisory Agreement Approval (Unaudited) |
At a meeting held on April 28, 2021, the Board of Trustees (the “Board”) considered the approval of an Interim Investment Advisory Agreement (the “Interim Agreement”) between Valued Advisers Trust (the “Trust”) and Bradley, Foster & Sargent, Inc. (“BFS”) with respect to the BFS Equity Fund (the “Fund”), and the approval of a new Investment Advisory Agreement (the “BFS Agreement”) between the Trust and BFS with respect to the Fund. BFS provided written information to the Board to assist the Board in its considerations.
The Interim Agreement and the BFS Agreement were necessary because of a transaction whereby BFS completed an equity recapitalization to reallocate capital ownership interests among its management team in an effort to ensure firm continuity as certain founding shareholders of BFS move toward retirement. Because this recapitalization resulted in a technical change of control of BFS, the existing investment advisory agreement between BFS and the Trust with respect to the Fund automatically terminated.
The Interim Agreement, which became effective on July 23, 2021, will terminate upon the earlier of (i) 150 days from its effective date or (ii) the date of approval of a new investment advisory agreement by the shareholders of the Fund. Except for the effective and termination dates, the deposit of advisory fees into an escrow account, and other terms required by the 1940 Act, the terms of the Interim Agreement and the BFS Agreement are identical to the terms of the Fund’s previous investment advisory agreement. There were no changes in the investment strategy of the Fund or the portfolio managers of the Fund as a result of the change of control of BFS. There were no changes to the fees paid to BFS by the Fund, and all fees under the Interim Agreement will be held in escrow pending shareholder approval of the BFS Agreement.
The Board discussed the existing arrangements between BFS and the Trust with respect to the Fund. The Board discussed with Counsel, among other things, the fiduciary duties and responsibilities of the Board in reviewing and approving the BFS Agreement. In assessing the factors and reaching its decision, the Board considered information furnished by BFS and the Trust’s other service providers for the Board’s review and consideration throughout the year, as well as information specifically prepared and/or presented in connection with the approval process, including: (i) reports regarding the services and support provided to the Fund and its shareholders by BFS; (ii) quarterly assessments of the investment performance of the Fund by personnel of BFS; (iii) commentary on the reasons for the performance; (iv) presentations by BFS addressing its investment philosophy, investment strategy, personnel and operations; (v) compliance and audit reports concerning the Fund and BFS; (vi) disclosure information contained in the registration statement for the Fund and the Form ADV of BFS; and (vii) a memorandum from counsel, that summarized the fiduciary duties and responsibilities of the Board in reviewing and approving the BFS Agreement. The Board also requested and received various informational materials including, without limitation: (a) documents containing information about BFS, including its financial information; a description of its personnel and the services it provides to the Fund; information on BFS’s investment advice and performance; summaries of Fund expenses, compliance program, current legal matters, and other general information; (b)
| BFS Equity Fund |
| Investment Advisory Agreement Approval (Unaudited) (continued) |
comparative expense and performance information for other mutual funds with strategies similar to the Fund; and (c) the benefits to be realized by BFS from its relationship with the Fund. In considering the foregoing, the Board also considered the impact, if any, that the change of control transaction would have on the ability of BFS to continue to provide a similar level and quality of services to the Fund and its shareholders as had previously been provided. The Board did not identify any particular information that was most relevant to its consideration to approve the BFS Agreement and each Trustee may have afforded different weight to the various factors.
| 1. | The nature, extent, and quality of the services to be provided by BFS. The Board considered responsibilities that BFS would have under the BFS Agreement. The Trustees considered the services proposed to be provided by BFS to the Fund and their experience with BFS in providing similar services, including without limitation: the quality of advisory services (including research and recommendations with respect to portfolio securities), the process for formulating investment recommendations and assuring compliance with the Fund’s investment objectives and limitations, the coordination of services for the Fund among the Fund’s service providers, and efforts to promote the Fund and grow its assets. The Trustees considered BFS’s continuity of, and commitment to retain, qualified personnel, BFS’s commitment to maintain its resources and systems, and BFS’s cooperation with the Board and counsel for the Fund. The Trustees considered BFS’s personnel, including the education and experience of the personnel and BFS’s compliance program, policies and procedures. The Trustees specifically acknowledged the fact that the personnel associated with the day-to-day management of the Fund is not anticipated to change. After considering the foregoing information and further information in the meeting materials provided by BFS, the Board concluded that, in light of all the facts and circumstances, the nature, extent, and quality of the services proposed to be provided by BFS will be satisfactory and adequate for the Fund. |
| 2. | Investment Performance of the Fund and BFS. The Trustees compared the performance of the Fund with the performance of funds with similar objectives managed by other investment advisers, with aggregated peer group data, as well as with the performance of the Fund’s benchmark. The Trustees also considered the consistency of BFS’s management of the Fund with its investment objectives, strategies, and limitations. The Trustees noted that the Fund had underperformed as compared to its benchmark for the one-year, three-year, five-year, and since inception periods ended December 31, 2020. They also noted that the Fund had underperformed as compared to the median of its Morningstar custom category for the one-year, three-year, five-year and since inception periods. With regard to the custom peer group, the Trustees noted that the Fund had also underperformed as compared to the median for the one-year, three-year, five-year and since inception periods ended December 31, 2020. The Board reviewed the performance of BFS in managing a composite with investment strategies similar to that of the Fund and observed that the Fund’s performance was above the composite for the calendar year 2019 and below the composite for the calendar year 2020. The Trustees took into |
| BFS Equity Fund |
| Investment Advisory Agreement Approval (Unaudited) (continued) |
consideration discussions with representatives of BFS regarding the reasons for the performance of the Fund. After further reviewing and discussing these and other relevant factors, the Board concluded, in light of all the facts and circumstances, that the investment performance of the Fund and BFS was satisfactory.
| 3. | The costs of the services to be provided and profits to be realized by BFS from the relationship with the Fund. The Trustees considered: (1) BFS’s financial condition; (2) the asset level of the Fund; (3) the overall expenses of the Fund; and (4) the nature and frequency of advisory fee payments. The Trustees reviewed information provided by BFS regarding its profits associated with managing the Fund, noting that BFS is currently waiving a portion of its management fee. The Trustees also considered potential benefits for BFS in managing the Fund. The Trustees then compared the fees and expenses of the Fund (including the management fee) to other comparable mutual funds. The Trustees noted that the Fund’s management fee was above the average and median management fees of its Morningstar custom category. The Trustees also noted that the Fund’s net expense ratio was also above that of the average and median of its custom category, taking into consideration BFS’s contractual commitment to limit the expenses of the Fund. When comparing the Fund’s fees to those of its custom peer group, the Trustees noted that the Fund’s management fee was above the average and the median. They also noted that the Fund’s net expense ratio was also above both the average and median of the peer group. The Trustees also noted that the Fund’s management fee is below the fee charged by BFS to its separately managed accounts, based on the average size of shareholder accounts in the Fund. Based on the foregoing, the Board concluded that the fees to be paid to BFS by the Fund and the profits to be realized by BFS, in light of all the facts and circumstances, were fair and reasonable in relation to the nature and quality of the services provided by BFS. |
| 4. | The extent to which economies of scale would be realized as the Fund grows and whether advisory fee levels reflect these economies of scale for the benefit of the Fund’s investors. The Board considered the Fund’s proposed fee arrangements with BFS, noting that the proposed fees are the same as the current fees paid to BFS. The Board considered that while the management fee remained the same at all asset levels, the Fund’s shareholders experienced benefits from the Fund’s expense limitation arrangement. The Board also considered the fact that BFS has the ability to seek recoupment of fees previously waived and/or reimbursed to the Fund in connection with its management of the Fund. The Trustees noted that once the Fund’s expenses fell below the cap set by the arrangement, the Fund’s shareholders would continue to benefit from the economies of scale under the Fund’s agreements with service providers other than BFS. In light of its ongoing consideration of the Fund’s asset levels, expectations for growth in the Fund, and fee levels, the Board determined that the Fund’s fee arrangements, in light of all the facts and circumstances, were fair and reasonable in relation to the nature and quality of the services to be provided by BFS. The Board also determined that it was in the best interest of shareholders to approve |
| BFS Equity Fund |
| Investment Advisory Agreement Approval (Unaudited) (continued) |
and authorize BFS to seek reimbursement from the Fund following the change of control transaction of fees waived for, and expenses reimbursed to the Fund prior to the transaction.
| 5. | Possible conflicts of interest and benefits to BFS. The Trustees evaluated the potential for conflicts of interest and considered such matters as the experience and ability of the advisory personnel assigned to the Fund; the basis of decisions to buy or sell securities for the Fund and/or BFS’s other accounts; and the substance and administration of BFS’s code of ethics. The Trustees also considered disclosure in the registration statement of the Trust relating to BFS’s potential conflicts of interest. The Trustees noted that BFS does not utilize soft dollars. The Trustees noted other potential benefits to BFS, including the fact that the Fund provides an attractive vehicle for smaller accounts, which may increase the total assets under management by BFS. Based on the foregoing, the Board determined that the standards and practices of BFS relating to the identification and mitigation of potential conflicts of interest and the benefits to be realized by BFS in managing the Fund were satisfactory. |
After additional consideration of the factors delineated in the memorandum provided by counsel and further discussion among the Board members, the Board determined to approve the BFS Agreement.
| FACTS | WHAT DOES BFS EQUITY FUND (THE “FUND”) DO WITH YOUR PERSONAL INFORMATION? |
| |
| Why? | Financial companies choose how they share your personal information. Federal law gives consumers the right to limit some but not all sharing. Federal law also requires us to tell you how we collect, share, and protect your personal information. Please read this notice carefully to understand what we do. |
| |
| What? | The types of personal information we collect and share depend on the product or service you have with us. This information can include: ■ Social Security number ■ account balances and account transactions ■ transaction or loss history and purchase history ■ checking account information and wire transfer instructions When you are no longer our customer, we continue to share your information as described in this notice. |
| |
| How? | All financial companies need to share customers’ personal information to run their everyday business. In the section below, we list the reasons financial companies can share their customers’ personal information; the reasons the Fund chooses to share; and whether you can limit this sharing. |
| |
| Reasons we can share your personal information | Does the Fund
share? |
For our everyday business purposes — such as to process your transactions, maintain your account(s), respond to court orders and legal investigations, or report to credit bureaus | Yes |
For our marketing purposes — to offer our products and services to you | No |
| For joint marketing with other financial companies | No |
For our affiliates’ everyday business purposes – information about your transactions and experiences | No |
For our affiliates’ everyday business purposes – information about your creditworthiness | No |
| For nonaffiliates to market to you | No |
| | | |
| Questions? | Call (855) 575-2430 |
| Who we are |
| Who is providing this notice? | BFS Equity Fund Ultimus Fund Distributors, LLC (Distributor) Ultimus Fund Solutions, LLC (Administrator) |
| What we do |
How does the Fund protect
my personal information? | To protect your personal information from unauthorized access and use, we use security measures that comply with federal law. These measures include computer safeguards and secured files and buildings. Our service providers are held accountable for adhering to strict policies and procedures to prevent any misuse of your nonpublic personal information. |
How does the Fund collect
my personal information? | We collect your personal information, for example, when you ■ open an account or deposit money ■ buy securities from us or sell securities to us ■ make deposits or withdrawals from your account ■ give us your account information ■ make a wire transfer ■ tell us who receives the money ■ tell us where to send the money ■ show your government-issued ID ■ show your driver’s license |
Why can’t I limit all
sharing? | Federal law gives you the right to limit only ■ sharing for affiliates’ everyday business purposes — information about your creditworthiness ■ affiliates from using your information to market to you ■ sharing for nonaffiliates to market to you State laws and individual companies may give you additional rights to limit sharing. |
| Definitions |
| Affiliates | Companies related by common ownership or control. They can be financial and nonfinancial companies. ■ Bradley, Foster & Sargent, Inc., the investment adviser to the Fund, could be deemed to be an affiliate. |
| Nonaffiliates | Companies not related by common ownership or control. They can be financial and nonfinancial companies. ■ The Fund does not share your personal information with nonaffiliates so they can market to you. |
| Joint marketing | A formal agreement between nonaffiliated financial companies that together market financial products or services to you. ■ The Fund doesn’t jointly market. |
| Other Information (Unaudited) |
The Fund’s Statement of Additional Information (“SAI”) includes additional information about the trustees and is available without charge, upon request. You may call toll-free at (855) 575-2430 to request a copy of the SAI or to make shareholder inquiries.
A description of the policies and procedures that the Fund uses to determine how to vote proxies relating to portfolio securities and information regarding how the Fund voted those proxies during the most recent twelve month period ended June 30, are available (1) without charge upon request by calling the Fund at (855) 575-2430 and (2) in Fund documents filed with the Securities and Exchange Commission (“SEC”) on the SEC’s website at www.sec.gov.
TRUSTEES Andrea N. Mullins, Chairperson Ira P. Cohen Mark J. Seger OFFICERS Adam T. Kornegay, Principal Executive Officer and
President Gregory T. Knoth, Principal Financial Officer and
Treasurer Kevin J. Patton, Chief Compliance Officer Carol J. Highsmith, Vice President and Secretary INVESTMENT ADVISER Bradley, Foster & Sargent, Inc. 185 Asylum Street, City Place II Hartford, CT 06103 DISTRIBUTOR Ultimus Fund Distributors, LLC 225 Pictoria Drive, Suite 450 Cincinnati, OH 45246 | | INDEPENDENT REGISTERED PUBLIC ACCOUNTING FIRM Cohen & Company, Ltd. 1350 Euclid Avenue, Suite 800 Cleveland, OH 44115 LEGAL COUNSEL Troutman Pepper Hamilton Sanders LLP 3000 Two Logan Square 18th and Arch Streets Philadelphia, PA 19103 CUSTODIAN Huntington National Bank 41 South High Street Columbus, OH 43215 ADMINISTRATOR, TRANSFER AGENT AND FUND ACCOUNTANT Ultimus Fund Solutions, LLC 225 Pictoria Drive, Suite 450 Cincinnati, OH 45246 |
This report is intended only for the information of shareholders or those who have received the Fund’s prospectus which contains information about the Fund’s management fee and expenses. Please read the prospectus carefully before investing.
Distributed by Ultimus Fund Distributors, LLC
Member FINRA/SIPC
BFS-AR-21
To Shareholders of the LS Opportunity Fund,
Prospector Partners, LLC (“Prospector”), based in Guilford, CT is the sub-advisor of the LS Opportunity Fund (“LSOFX” or the “Fund”). Prospector has a long/short hedge fund track record that spans 24 years with a substantially similar investment objective to LSOFX and brings its experience to our Fund in a daily liquid mutual fund format with a goal of downside risk mitigation and consistency of returns.
The Fund aims to generate long-term capital appreciation by investing in both long and short positions within a portfolio consisting of primarily publicly traded common stock, with less net exposure than that of the stock market in general. Through extensive research, risk management, and no leverage in the long book, the Fund strives to preserve capital while delivering solid risk-adjusted returns and managing volatility. For additional information, please visit our website at www.longshortadvisors.com.
First and foremost, we at Long Short Advisors would like to thank the team at Prospector Partners for another job well done and we look forward to the years to come. As of May 31, 2021, Prospector Partners has been the sub-advisor of the LS Opportunity Fund for six years. The team’s absolute and risk-adjusted returns earned the LS Opportunity Fund a 4-Star Overall Morningstar Rating™ out of 179 funds in the US Fund Long Short category as of May 31, 2021 based on risk-adjusted returns.* Over the years, Prospector Partners has shown to deliver the following:
| ● | Goal of Stability: net exposure between 50% and 80%, no market timing |
| ● | Goal of Safety: value plays in both long and short holdings, no “big factor” bets |
| ● | Familiarity: investing in sectors they know extremely well |
| ● | Reinvestment: 80% Investment Reuse |
| ● | Functionality: shorting for Alpha, not just for hedging |
| ● | Skin in the Game: experienced team with their money on the line next to yours |
For more information on investment strategy, call Long Short Advisors at 215-399-9409.
| * | As of May 31, 2021, LSOFX received the following Morningstar Rating™ in the US Long Short category for the 3-year, 5-year periods, and 10-year periods respectively: 3 stars out of 179 funds, 4 stars out of 151 funds, and 4 stars out of 49 funds. |
Performance
For the 12-month period ended May 31, 2021 (the “Period”), LSOFX returned +23.17%, while the HFRX Equity Hedge Index (“HFRX”) returned +21.65%. The S&P 500® Index (“S&P 500”) finished the Period with a return of +40.32%.
Performance of LSOFX, S&P 500 and HFRX
During the Year Ended May 31, 2021
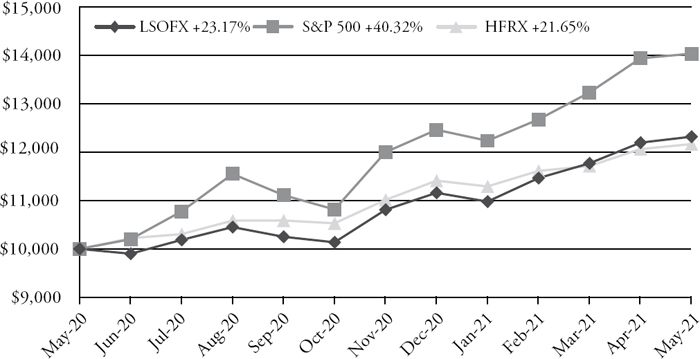
Performance Since Prospector Became Sub-Adviser of LSOFX
(May 2015 - May 2021)

Past performance does not guarantee future results.
Current Market Environment
The new year began with the Georgia Senate runoff which saw both seats going to Democrats, thereby giving the Dems an effective majority in the Senate. Unshockingly, a new $1.9 trillion stimulus package was passed along party lines soon thereafter. The multi-trillions of dollars of government stimulus and additional trillions of monetary support by the Fed has left the United States awash in cash. As can be seen in the charts below, the U.S. money supply has skyrocketed, and stimulus checks have left the U.S. consumer with a considerable amount of cash in their pocketbooks.
M2 Money Stock

Source: Board of Governers of the Federal Reserve System (US)
Personal Savings Rate
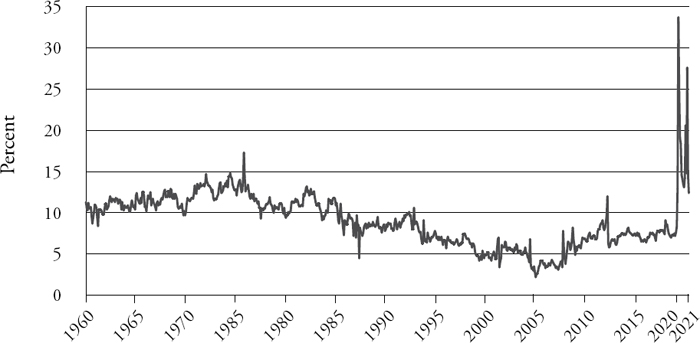
Source: Board of Governers of the Federal Reserve System (US)
The result of all of this has undoubtedly aided the rise in risk assets during the first few months of 2021, and has led to some speculative market actions that, to us, are reminiscent of the late-1990’s dotcom bubble. By way of example:
- Leadership of loss-making companies: As readers may recall, the latter stages of the dotcom bubble were marked by nascent companies, in many cases with barely more than a business plan, coming public at multi-billion dollar market caps and with valuations being rationalized by clicks, page views, or some similar metric. Similarly, the first two months (especially) of 2021 saw loss-making companies lead the market…in many cases being up hundreds of percent through February. For example, within the Russell 3000 Index, companies that reported losses over the trailing 12 months were up, on average, over 20% for the first two months of the year, while profit-reporting companies gained on average only 9%. More striking, the top 20 gainers in the index (each one in the loss-making category) were up an average of 226% - with every one of them appreciating over 100% for the first two months of the year.
- Rise of the retail trader: In January, a group of heavily-shorted stocks (some of which being questioned as viable going concerns prior to this) saw rapid price appreciation, driven largely by investors organizing on Reddit message boards in an effort to cause short squeezes, and thus dramatic increases in the prices of those stocks. This casino-like atmosphere was seemingly made easier by the rise of commissionless trading on apps such as Robinhood – giving traders the ability to transact endlessly at zero cost. As an acquaintance of ours who works in the restaurant industry, but was engaging in this trading activity put it: “It’s so easy; you log onto the message board in the morning, buy what they’re pitching, and just don’t get left holding the bag at the end of the day.” GameStop (GME), which became the “poster child” of this movement, saw its shares rise from a price of around $20 per share to a high of $483 in a matter of days and, echoing the period of the dotcom bubble, high profile investment managers could be seen on CNBC rationalizing the head-scratching valuations of these companies.
- “Blank check” companies: More formally known as SPACs (special purpose acquisition companies), have quickly risen to prominence as a preferred way for private companies to IPO with less red tape and cost. As the “blank check” moniker implies, these are public companies which raise capital from investors with the promise to eventually find a private company to purchase with those funds. Typically, this must be done within a two-year period, or the money is returned to shareholders. In just the first three months of 2021, literally hundreds of these SPACs have raised billions of dollars from investors and most of them are still looking for private companies to purchase. This didn’t stop many of them rising considerably above their IPO price, despite it being unknown what investors were really buying at the time. According to the Wall Street Journal (WSJ), at the end of March there were 430 SPACs looking for acquisition targets. Much like dotcom companies at the turn of the century seemed to fall under the weight of too much supply, as IPO after IPO came to market and 180-day lock ups expired, causing a flood of investors to look for the exits, the SPAC market risks a similar outcome. Indeed, after seeing average gains of over 5% in January and February (and 231 consecutive SPACs going public without dipping below their IPO price), the WSJ reported that SPACs rose merely 0.1% upon their debuts during March.
- Nonfungible tokens (NFTs) and digital currencies: Next on the list of hard-to-value assets that we saw billions of dollars of money flow to during the first few months of 2021 are NFTs and digital currencies. While the long-term prospects of both of these types of assets could be debated, assessing a proper valuation to either of them currently comes down to “whatever the next person is willing to pay me.” And, much like the aforementioned loss-making companies, these two asset classes were caught up in the speculative frenzy which marked early 2021. For example, Bitcoin, which started the year just under $30,000 rallied to just under $60,000 at quarter end. And, NFTs, which are simplistically described as files which are attached to and verify the authenticity of any digital item such as a video or music file, a GIF or a meme, etc., were being auctioned for exorbitant sums. For example, the first tweet ever, from Twitter cofounder Jack Dorsey was sold for a whopping $2.9 million (if you don’t want to dole out that sort of cash, feel free to scroll back to March 21, 2006 to see that tweet by @jack for yourself in his Twitter timeline).
As we entered March, the steam started to come out of some of these speculative assets. For example, taking a look at a broad index, loss-making companies in the Russell 3000 Index were down on average 3% in March in contrast to an average 5% gain for companies which posted profits over the trailing 12 months. Additionally, most of the stocks which were targeted on Reddit message boards have traded back down closer to where they were trading prior to the short squeezes (save for a handful of the more popular ones, including GME, which continue to trade much higher than before the frenzy, although significantly below their peak prices). As noted earlier, SPACs aren’t being met with nearly the same fanfare as they were earlier in the year, and the foreboding supply portends a questionable future for the over 400 still looking for a partner.
Meanwhile, starting mid-February, we saw a significant rotation from growth to value stocks, with the S&P 500® Value Index rising 10.8% during the quarter, while the Growth counterpart was up only 2.1%. This value outperformance was possibly a result of the 10-year Treasury’s persistent rise and increased expectations for future inflation. As we’ve discussed in prior letters, it’s harder to justify ever-increasing valuations for fast-growing companies in an increasing interest rate environment. Will this rotation persist and be anywhere near the magnitude of what we’ve seen over the past 10 years+ of growth outperformance? Only time will tell, but boring as it may be in comparison to investing in tweets, we will continue with our process of searching for long-term investments in undervalued companies and will leave the investing in NFTs and the like to others.
Bank Investing Update
Last year was a rollercoaster for bank stocks. We were fortunate to be underweight the sector relative to our history heading into the pandemic. By March 2020, the regional bank index declined over 50% from the start of the year as the pandemic instilled fears of a major recession and credit losses not seen since the Great Financial Crisis. You may recall we began to warm back up to banks during Q3 2020 for a number of reasons and significantly increased net exposure. From the end of Q3 2020 to now, the regional bank index has increased 86% due to unprecedented stimulus, higher rates, the mass vaccination effort, benign credit quality, and a gradual return to normal.
The stunning performance over the past six months begs to ask the question “is the bank rally over”? While the “easy money” has been made, we believe the sector has further upside. Arguably the largest source of potential upside is the continued improvement in the interest rate environment. Last year, the 10-year Treasury yield hit an intra-day low of 32 basis points in March and has since rallied to 164 basis points. A continued increase in the long end of the curve is beneficial to reinvestment rates on securities and loan yields to retail customers. Inflation concerns are also starting to influence the market and there is discussion of a Fed Funds hike in 2022 - the Dallas Fed President expects a rate hike next year along with three other FOMC members. This would be a boon to the commercial banks in your portfolio which price commercial loans off short-term rates.
We are also encouraged by the resumption of bank merger activity in Q4 2020. In a post-COVID environment, achieving economies of scale and digital synergies via M&A (and internally for the matter) is a path to higher profitability. Attractive and well-structured deals have been rewarded as evidenced by your holding, PNC Financial Services Group (PNC). In November 2020, PNC announced the acquisition of BBVA USA, the deal being a good use of excess capital and 21% accretive to earnings. Since announcement, PNC has outperformed, returning 43% versus 37% for the KBW Nasdaq Bank Index. Based on conversations with management teams and commentary from investment bankers, we expect M&A to meaningfully accelerate. Anecdotally, the CEO of Toronto-Dominion stated he is “very open” to acquiring a U.S. regional lender, and multiple banks in your portfolio could be attractive targets and might command a significant premium. These holdings include KeyCorp, Comerica, First Horizon, and Synovus.
While loan growth has been muted given the impact of the pandemic and subdued economic activity, a continued recovery should be supportive of loan growth. Some bankers we’ve spoken with are optimistic regarding growth in the back half of 2021, given improving pipelines and conversations with potential borrowers. Notably, banks are sitting on excess amounts of liquidity and can meet a spike in loan demand. Banks are also resuming share repurchase programs and the Fed announced they will be removing temporary restrictions on shareholder returns for most banks on June 30th. As a result, it’s possible for some banks to achieve mid to high-single digit yields on dividends + buybacks relative to current prices, which we view as highly attractive in today’s market environment.
Despite these tailwinds, the sector retains defensive attributes as mentioned in previous letters. To summarize, banks remain overcapitalized relative to history, even with massive loss reserves built over the course of 2020 (which we expect to be released over time). The sector continues to retain low-risk loan books and is awash in excess liquidity given government and monetary stimulus. While valuations for the sector have recovered from bottom decile relative to history, they remain inexpensive. Since 1992, bank stocks remain cheap at the 26th percentile at just under 13x forward earnings. On a price-to-tangible-book-value basis, the sector is valued below average at the 42nd percentile or 1.9x. Assuming the aforementioned earnings tailwinds continue to take hold and multiples expand, there is meaningful upside. For aspirational purposes, at the 70th percentile of historical valuations, the sector would command a P/E of 16x and 3.3x on a price-to-tangible-book-value basis.
Outlook
2021 looks to be a transitional year. We are clearly in the early stages of a new economic cycle, following the coronavirus-induced recession of 2020. Continued progress on vaccinations will allow the U.S. economy to return to more familiar footing with the resumption of dining out, air travel for business and pleasure, and large group gatherings. The recent United States elections, although closely contested, have ushered in a change in administration with attendant changes in the agenda around stimulus, spending, taxes, and trade. The razor-thin margins in Congress are likely to temper any radical policy shifts. Importantly the volatility emanating from the executive branch should ease.
While interest and mortgage rates have lifted, they are coming off historically low levels, while inflation remains below target. We see early signs of reinflation in Treasury and Treasury Inflation-Protected (TIP) yields from the historically high levels of government spending here and around the world. We are carefully monitoring aggregate corporate debt levels (especially BBB- debt which is a single notch above junk status), currently above pre-2008 crisis levels and which looms as a potential problem absent continued aggressive Fed support. Unemployment has shown significant improvement but continues to be an issue.
In our estimation, overall equity valuations remain at elevated levels, due to the sharp rebound in equities, which has outpaced prospective positive earnings revisions. The high valuations of a small number of enormous technology companies certainly exert upward pressure to the overall averages. Recovery in aggregate earnings will take time as certain industries such as hospitality, entertainment, and travel are tied to the success of a vaccine rollout plan and will take longer to return to pre-coronavirus levels. Treasury and high-grade corporate bond yields look unattractive after the dramatic flight to safety rally during 2020. In any case, value investing is ripe for a continued period of outperformance, and the bargains inherent in your portfolio should attract acquirers and other investors over time. Meanwhile, we still believe equities represent a superior asset allocation alternative to bonds over the longer term.
Thank you for your continued support and we look forward to reporting to you again following our semi-annual date of November 30, 2021.
Steadfast, we remain committed to making you money while aiming to protect your wealth. - Your Team at Long Short Advisors
Long Book
Top Positions
At period’s end, the Fund contained 62 long positions in the portfolio representing companies with what management believes represents long-term value and favorable characteristics such as a discount to private market value, attractive free cash flow yields, and strong balance sheets. The Fund’s top 10 long positions represented approximately 28% of the portfolio and included Alleghany (Y), Arthur J. Gallagher (AJG), Brown & Brown (BRO), Comerica (CMA), First Horizon (FHN), Globe Lift (GL), JP Morgan Chase (JPM), Keycorp (KEY), Renaissance RE (RNR) and US Bancorp (USB).
Contributors
The five stocks in the long book that contributed the largest returns during the Period, from largest to smallest were: PNC Financial Services Group (PNC), U.S. Bancorp (USB), First Horizon (FHN), Comerica (CMA) and KeyCorp (KEY).
Detractors
Over the Period, the three stocks in the long book that detracted from returns the most, from largest to smallest were: RenaissanceRe Holdings (RNR), Merck (MRK), and Teledyne Technologies (TDY).
Largest Purchases
The top purchases by dollar value in the long book for the Period were: Berkshire Hathaway (BRK/B), Alleghany (Y), Comerica (CMA), KeyCorp (KEY), and First Horizon (FHN).
Largest Sales
The top sales by dollar value in the long book for the Period were: Berkshire Hathaway (BRK/B), FLIR Systems (FLIR), PNC Financial Services Group (PNC), Hanover Insurance Group (THG) and Aflac (AFL)
Short Book
Top Positions
The Fund’s short book at Period’s end contained 27 short positions, 23 of which were individual companies that have business model challenges, excessive valuations, and/or potential balance sheet issues. The Fund’s top 20 short positions represented approximately 22% of the portfolio.
“The Secret of Wealth Creation is to Avoid Large Losses”
-John Gillespie, Portfolio Manager
Mutual fund investing involves risk and principal loss is possible. You should carefully consider the investment objectives, potential risks, management fees, and charges and expenses of the Fund before investing. The Fund’s prospectus contains this and other information about the Fund and should be read carefully before investing. You may obtain a current copy of the Fund’s prospectus by calling 1-877-336-6763. The Fund is distributed by Ultimus Fund Distributors, LLC.
Investment in shares of a long/short equity fund have the potential for significant risk and volatility. A short equity strategy can diminish returns in a rising market as well as having the potential for unlimited losses. These types of funds typically have a high portfolio turnover that could increase transaction costs and cause short-term capital gains to be realized.
The performance data quoted represents past performance; past performance does not guarantee future results. The investment return and principal value of an investment in the Fund will fluctuate so that an investor’s shares, when redeemed, may be worth more or less than their original cost. Current performance of the Fund may be lower or higher than the performance quoted. For performance current to the most recent month end, call 1-877-336-6763.
Morningstar Disclosure:
© 2021 Morningstar. All Rights Reserved. The information contained herein: (1) is proprietary to Morningstar; (2) may not be copied or distributed; and (3) is not warranted to be accurate, complete or timely. Neither Morningstar nor its content providers are responsible for any damages or losses arising from any use of this information. Past performance is no guarantee of future results.
The Morningstar Rating™ for funds, or “star rating”, is calculated for managed products (including mutual funds, variable annuity and variable life subaccounts, exchange-traded funds, closed-end funds, and separate accounts) with at least a three-year history. Exchange-traded funds and open-ended mutual funds are considered a single population for comparative purposes. It is calculated based on a Morningstar Risk-Adjusted Return measure that accounts for variation in a managed product’s monthly excess performance, placing more emphasis on downward variations and rewarding consistent performance. The Morningstar Rating does not include any adjustment for sales loads. The top 10% of products in each product category receive 5 stars, the next 22.5% receive 4 stars, the next 35% receive 3 stars, the next 22.5% receive 2 stars, and the bottom 10% receive 1 star. The Overall Morningstar Rating for a managed product is derived from a weighted average of the performance figures associated with its three-, five-, and 10-year (if applicable) Morningstar Rating metrics. The weights are: 100% three-year rating for 36-59 months of total returns, 60% five-year rating/40% three-year rating for 60-119 months of total returns, and 50% 10-year rating/30% five-year rating/20% three-year rating for 120 or more months of total returns. While the 10-year overall star rating formula seems to give the most weight to the 10- year period, the most recent three-year period actually has the greatest impact because it is included in all three rating periods. As of 5/31/2021, the LS Opportunity Fund was rated against the following numbers of US Long Short category funds over the following time periods: 179 funds in the last three years, 151 funds in the last five years, and 49 funds in the last 10 years. Past performance is no guarantee of future results.
Investment Results (Unaudited)
Average Annual Total Returns(a) (For the periods ended May 31, 2021) |
| | | | | | | | | | |
| | | One | | Three | | Five | | Ten | |
| | | Year | | Year | | Year | | Year | |
| LS Opportunity Fund | | 23.17% | | 8.63% | | 8.76% | | 6.26% | |
| S&P 500® Index(b) | | 40.32% | | 18.00% | | 17.16% | | 14.38% | |
| HFRX Equity Hedge Index(c) | | 21.65% | | 3.49% | | 4.77% | | 2.04% | |
Total annual operating expenses, as disclosed in the LS Opportunity Fund’s (the “Fund”) prospectus dated September 28, 2020, were 2.99% of average daily net assets (2.86% after fee waivers and expense reimbursements by Long Short Advisors, LLC (the “Adviser”)). The Adviser has entered into an expense limitation agreement, pursuant to which it will waive its fees and/or reimburse other expenses of the Fund until September 30, 2021, so that Total Annual Fund Operating Expenses does not exceed 1.95%. This operating expense limitation does not apply to borrowing costs such as interest and dividends on securities sold short, taxes, brokerage commissions, other expenditures which are capitalized in accordance with generally accepted accounting principles, other extraordinary expenses not incurred in the ordinary course of the Fund’s business, expenses incurred under a Rule 12b-1 plan of distribution, “acquired fund fees and expenses,” and expenses that the Fund has incurred but did not actually pay because of an expense offset arrangement. Each fee waiver or reimbursement of an expense by the Adviser is subject to repayment by the Fund within the three years following such waiver or reimbursement, provided that the Fund is able to make the repayment without exceeding the expense limitation in place at the time of the waiver or reimbursement and the expense limitation in place at the time of the repayment. This agreement may only be terminated by mutual consent of the Adviser and the Board of Trustees. |
The performance quoted represents past performance, which does not guarantee future results. The investment return and principal value of an investment will fluctuate so that an investor’s shares, when redeemed, may be worth more or less than their original cost. The returns shown do not reflect deduction of taxes that a shareholder would pay on Fund distributions or the redemption of Fund shares. Prior to May 28, 2015, the Fund’s performance was attributable to a previous sub-adviser. The Fund’s investment objectives, risks, charges and expenses must be considered carefully before investing. Current performance of the Fund may be lower or higher than the performance quoted. Performance data current to the most recent month end may be obtained by calling (877) 336-6763.
| (a) | Average annual total returns reflect any change in price per share and assume the reinvestment of all distributions, if any. The Fund’s returns reflect any fee reductions during the applicable periods. If such fee reductions had not occurred, the quoted performance would have been lower. |
| (b) | The S&P 500® Index is a widely recognized unmanaged index of equity prices and is representative of a broader market and range of securities than is found in the Fund’s portfolio. The index is an unmanaged benchmark that assumes reinvestment of all distributions and excludes the effect of taxes and fees. Individuals cannot invest directly in this index; however, an individual can invest in exchange-traded funds or other investment vehicles that attempt to track the performance of a benchmark index. |
| (c) | The HFRX Equity Hedge Index is compiled by Hedge Fund Research, Inc. It is comprised solely of hedge funds and is designed to be representative of the overall composition of the hedge fund universe implementing a long/short equity strategy. The index is not available for direct investment. |
The Fund’s investment objectives, risks, charges and expenses must be considered carefully before investing. The prospectus contains this and other important information about the Fund and may be obtained by calling (877) 336-6763. Please read it carefully before investing.
The Fund is distributed by Ultimus Fund Distributors, LLC, member FINRA/SIPC.
Comparison of the Growth of a $10,000 Investment in the LS Opportunity Fund,
the HFRX Equity Hedge Index and the S&P 500® Index (Unaudited)
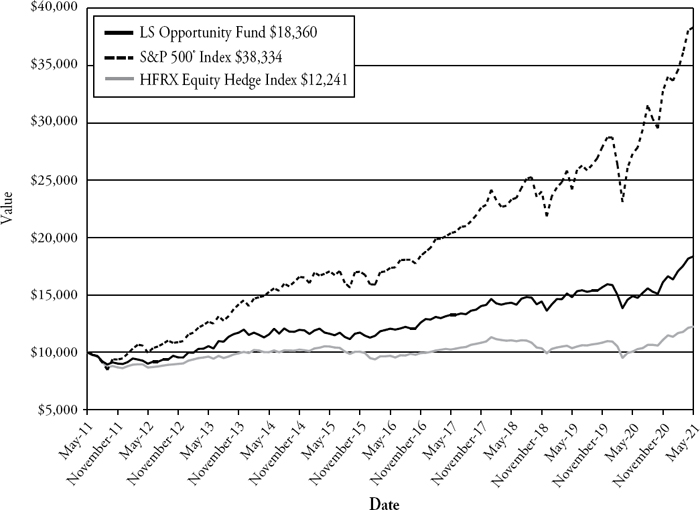
The chart above assumes an initial investment of $10,000 made on May 31, 2011 and held through May 31, 2021. THE FUND’S RETURNS REPRESENT PAST PERFORMANCE AND DO NOT GUARANTEE FUTURE RESULTS. The returns shown do not reflect deduction of taxes that a shareholder would pay on the Fund’s distributions or the redemption of the Fund’s shares. Investment returns and principal values will fluctuate so that your shares, when redeemed, may be worth more or less than their original purchase price.
Current performance may be lower or higher than the performance data quoted. For more information on the Fund, and to obtain performance data current to the most recent month-end, or to request a prospectus, please call (877) 336-6763. You should carefully consider the investment objectives, potential risks, management fees, and charges and expenses of the Fund before investing. The Fund’s prospectus contains this and other information about the Fund, and should be read carefully before investing.
The Fund is distributed by Ultimus Fund Distributors, LLC, member FINRA/SIPC.
| Fund Holdings (Unaudited) | |
Sector Exposure (5/31/2021)
(Based on Net Assets)
| | | Long | | | Short | | | Gross | | | Net | |
| Consumer Discretionary | | | 2.49 | % | | | -3.26 | % | | | 5.75 | % | | | -0.77 | % |
| Consumer Staples | | | 6.18 | % | | | -2.82 | % | | | 9.00 | % | | | 3.36 | % |
| Energy | | | 4.43 | % | | | 0.00 | % | | | 4.43 | % | | | 4.43 | % |
| Financials | | | 47.16 | % | | | -13.70 | % | | | 60.86 | % | | | 33.46 | % |
| Health Care | | | 8.11 | % | | | -1.86 | % | | | 9.97 | % | | | 6.25 | % |
| Industrials | | | 6.54 | % | | | -1.20 | % | | | 7.74 | % | | | 5.34 | % |
| Materials | | | 3.08 | % | | | 0.00 | % | | | 3.08 | % | | | 3.08 | % |
| Real Estate | | | 1.61 | % | | | 0.00 | % | | | 1.61 | % | | | 1.61 | % |
| Technology | | | 5.90 | % | | | 0.00 | % | | | 5.90 | % | | | 5.90 | % |
| Exchange-Traded Funds | | | 1.30 | % | | | -3.20 | % | | | 4.50 | % | | | -1.90 | % |
| Total Sector Exposure | | | 86.80 | % | | | -26.04 | % | | | 112.84 | % | | | 60.76 | % |
| Money Market Funds | | | 12.41 | % | | | 0.00 | % | | | 12.41 | % | | | 12.41 | % |
The LS Opportunity Fund seeks to generate long-term capital appreciation by investing in both long and short positions within a portfolio consisting of primarily publicly-traded common stock, with less net exposure than that of the stock market in general.
Availability of Portfolio Schedules (Unaudited)
The Fund files its complete schedule of portfolio holdings with the Securities and Exchange Commission (“SEC”) for the first and third quarters of each fiscal year as an exhibit to its reports on Form N-PORT. The Fund’s Form N-PORT reports are available on the SEC’s website at http://www.sec.gov.
| LS Opportunity Fund |
| Schedule of Investments |
| May 31, 2021 |
| | | Shares | | | Fair Value | |
| Common Stocks - Long - Domestic — 74.38% | | | | | | | | |
| Consumer Discretionary — 2.49% | | | | | | | | |
| Darden Restaurants, Inc. | | | 4,100 | | | $ | 587,243 | |
| eBay, Inc. (a) | | | 22,050 | | | | 1,342,404 | |
| Home Depot, Inc. (The) (a) | | | 4,300 | | | | 1,371,313 | |
| | | | | | | | 3,300,960 | |
| Consumer Staples — 5.06% | | | | | | | | |
| Church & Dwight Co., Inc.(a) | | | 18,900 | | | | 1,620,297 | |
| Coca-Cola Co. (The) (a) | | | 19,200 | | | | 1,061,568 | |
| JM Smucker Co. (The) (a) | | | 8,500 | | | | 1,132,965 | |
| Mondelez International, Inc., Class A(a) | | | 26,500 | | | | 1,683,545 | |
| Procter & Gamble Co. (The) | | | 8,910 | | | | 1,201,514 | |
| | | | | | | | 6,699,889 | |
| Energy — 4.43% | | | | | | | | |
| Hess Corp. | | | 11,200 | | | | 938,784 | |
| Pioneer Natural Resources Co.(a) | | | 16,399 | | | | 2,495,764 | |
| Schlumberger Ltd. | | | 77,800 | | | | 2,437,474 | |
| | | | | | | | 5,872,022 | |
| Financials — 41.49% | | | | | | | | |
| Aflac, Inc.(a) | | | 26,300 | | | | 1,490,684 | |
| Alleghany Corp.(a) (b) | | | 6,341 | | | | 4,543,770 | |
| Arthur J Gallagher & Co.(a) | | | 20,650 | | | | 3,027,497 | |
| Berkshire Hathaway, Inc., Class B(a) (b) | | | 7,365 | | | | 2,131,726 | |
| Brown & Brown, Inc.(a) | | | 56,350 | | | | 2,959,502 | |
| Cboe Global Markets, Inc.(a) | | | 20,400 | | | | 2,270,520 | |
| Comerica, Inc.(a) | | | 49,250 | | | | 3,865,631 | |
| Federated Investors, Inc., Class B | | | 58,250 | | | | 1,852,350 | |
| First Horizon National Corp.(a) | | | 190,808 | | | | 3,638,709 | |
| Globe Life, Inc.(a) | | | 33,550 | | | | 3,536,841 | |
| JPMorgan Chase & Co.(a) | | | 22,500 | | | | 3,695,400 | |
| KeyCorp(a) | | | 150,550 | | | | 3,468,672 | |
| PJT Partners, Inc., Class A(a) | | | 14,400 | | | | 1,048,608 | |
| PNC Financial Services Group, Inc. (The) (a) | | | 15,010 | | | | 2,922,147 | |
| Primerica, Inc.(a) | | | 9,650 | | | | 1,565,327 | |
| Progressive Corp. (The) (a) | | | 29,050 | | | | 2,878,274 | |
| Synovus Financial Corp. | | | 44,950 | | | | 2,207,944 | |
| U.S. Bancorp(a) | | | 78,700 | | | | 4,783,385 | |
| Voya Financial, Inc.(a) | | | 26,450 | | | | 1,733,004 | |
See accompanying notes which are an integral part of these financial statements.
| LS Opportunity Fund |
| Schedule of Investments – continued |
| May 31, 2021 |
| | | Shares | | | Fair Value | |
| Common Stocks - Long - Domestic — 74.38% – continued | | | | | | | | |
| Financials — 41.49% - continued | | | | | | | | |
| W.R. Berkley Corp. | | | 16,850 | | | $ | 1,314,132 | |
| | | | | | | | 54,934,123 | |
| Health Care — 6.10% | | | | | | | | |
| Abbott Laboratories(a) | | | 8,850 | | | | 1,032,352 | |
| Cigna Corp.(a) | | | 6,320 | | | | 1,635,932 | |
| Johnson & Johnson(a) | | | 7,170 | | | | 1,213,523 | |
| Merck & Co., Inc.(a) | | | 36,050 | | | | 2,735,835 | |
| NuVasive, Inc.(b) | | | 21,450 | | | | 1,462,890 | |
| | | | | | | | 8,080,532 | |
| Industrials — 5.19% | | | | | | | | |
| Carrier Global Corp.(a) | | | 9,010 | | | | 413,829 | |
| Eaton Corp. PLC(a) | | | 12,300 | | | | 1,786,574 | |
| General Dynamics Corp.(a) | | | 7,850 | | | | 1,490,793 | |
| Otis Worldwide Corp.(a) | | | 9,580 | | | | 750,402 | |
| Raytheon Technologies Corp.(a) | | | 15,160 | | | | 1,344,844 | |
| Robert Half International, Inc. | | | 12,200 | | | | 1,083,238 | |
| | | | | | | | 6,869,680 | |
| Materials — 2.11% | | | | | | | | |
| Newmont Goldcorp Corp. | | | 9,050 | | | | 664,994 | |
| PPG Industries, Inc. | | | 11,850 | | | | 2,129,682 | |
| | | | | | | | 2,794,676 | |
| Real Estate — 1.61% | | | | | | | | |
| Howard Hughes Corp. (The)(b) | | | 20,120 | | | | 2,129,300 | |
| | | | | | | | | |
| Technology — 5.90% | | | | | | | | |
| Leidos Holdings, Inc.(a) | | | 17,650 | | | | 1,813,537 | |
| Microsoft Corp.(a) | | | 4,765 | | | | 1,189,725 | |
| Oracle Corp.(a) | | | 20,100 | | | | 1,582,674 | |
| Paychex, Inc.(a) | | | 12,250 | | | | 1,238,965 | |
| PayPal Holdings, Inc.(a) (b) | | | 4,825 | | | | 1,254,597 | |
| Science Applications International Corp.(a) | | | 8,200 | | | | 736,852 | |
| | | | | | | | 7,816,350 | |
| | | | | | | | | |
| Total Common Stocks - Long - Domestic (Cost $72,673,130) | | | | | | | 98,497,532 | |
See accompanying notes which are an integral part of these financial statements.
| LS Opportunity Fund |
| Schedule of Investments – continued |
| May 31, 2021 |
| | | Shares | | | Fair Value | |
| Common Stocks - Long - International — 11.12% | | | | | | | | |
| Consumer Staples — 1.12% | | | | | | | | |
| Nestle S.A. | | | 12,000 | | | $ | 1,482,094 | |
| | | | | | | | | |
| Financials — 5.67% | | | | | | | | |
| Everest Re Group Ltd. | | | 5,310 | | | | 1,380,388 | |
| First BanCorp. | | | 87,400 | | | | 1,117,846 | |
| Lancashire Holdings Ltd. | | | 140,750 | | | | 1,258,301 | |
| RenaissanceRe Holdings Ltd.(a) | | | 24,385 | | | | 3,758,216 | |
| | | | | | | | 7,514,751 | |
| Health Care — 2.01% | | | | | | | | |
| Medtronic PLC(a) | | | 15,700 | | | | 1,987,462 | |
| Roche Holding AG | | | 1,940 | | | | 680,520 | |
| | | | | | | | 2,667,982 | |
| Industrials — 1.35% | | | | | | | | |
| Pentair PLC | | | 25,850 | | | | 1,782,875 | |
| | | | | | | | | |
| Materials — 0.97% | | | | | | | | |
| Agnico Eagle Mines Ltd.(a) | | | 10,550 | | | | 756,963 | |
| Kinross Gold Corp. | | | 64,950 | | | | 526,095 | |
| | | | | | | | 1,283,058 | |
| Total Common Stocks - Long - International (Cost $12,935,327) | | | | | | | 14,730,760 | |
| | | | | | | | | |
| Exchange-Traded Funds — 1.30% | | | | | | | | |
| Aberdeen Standard Physical Platinum Shares ETF(b) | | | 15,550 | | | | 1,717,653 | |
| Total Exchange-Traded Funds (Cost $1,422,043) | | | | | | | 1,717,653 | |
See accompanying notes which are an integral part of these financial statements.
| LS Opportunity Fund |
| Schedule of Investments – continued |
| May 31, 2021 |
| | | Shares | | | Fair Value | |
| Money Market Funds — 12.41% | | | | | | | | |
| Invesco Treasury Portfolio, Institutional Class, 0.01%(c) | | | 16,428,954 | | | $ | 16,428,954 | |
| Total Money Market Funds (Cost $16,428,954) | | | | | | | 16,428,954 | |
| Total Investments — 99.21% (Cost $103,459,454) | | | | | | | 131,374,899 | |
| Other Assets in Excess of Liabilities — 0.79% | | | | | | | 1,048,608 | |
| NET ASSETS — 100.00% | | | | | | $ | 132,423,507 | |
| (a) | All or a portion of the security is held as collateral for securities sold short. The fair value of this collateral on May 31, 2021, was $53,327,660. |
| (b) | Non-income producing security. |
| (c) | Rate disclosed is the seven day effective yield as of May 31, 2021. |
ETF — Exchange-Traded Fund
See accompanying notes which are an integral part of these financial statements.
| LS Opportunity Fund |
| Schedule of Securities Sold Short |
| May 31, 2021 |
| | | Shares | | | Fair Value | |
| Common Stocks - Short - Domestic — (15.50)% | | | | | | | | |
| Consumer Discretionary — (3.26)% | | | | | | | | |
| Lowe’s Cos., Inc. | | | (15,470 | ) | | $ | (3,014,020 | ) |
| Service Corp. International | | | (24,750 | ) | | | (1,312,245 | ) |
| | | | | | | | (4,326,265 | ) |
| Consumer Staples — (2.83)% | | | | | | | | |
| Clorox Co. (The) | | | (2,660 | ) | | | (470,102 | ) |
| Kellogg Co. | | | (23,350 | ) | | | (1,529,191 | ) |
| Kimberly-Clark Corp. | | | (13,360 | ) | | | (1,745,217 | ) |
| | | | | | | | (3,744,510 | ) |
| Financials — (6.35)% | | | | | | | | |
| Allstate Corp. | | | (11,225 | ) | | | (1,533,447 | ) |
| American International Group, Inc. | | | (32,150 | ) | | | (1,698,806 | ) |
| Community Bank System, Inc. | | | (12,100 | ) | | | (981,552 | ) |
| Horace Mann Educators Corp. | | | (24,450 | ) | | | (974,822 | ) |
| Prudential Financial, Inc. | | | (17,600 | ) | | | (1,882,672 | ) |
| Travelers Cos., Inc. (The) | | | (8,350 | ) | | | (1,333,495 | ) |
| | | | | | | | (8,404,794 | ) |
| Health Care — (1.86)% | | | | | | | | |
| Boston Scientific Corp.(a) | | | (16,100 | ) | | | (685,055 | ) |
| HCA Healthcare, Inc. | | | (4,690 | ) | | | (1,007,365 | ) |
| Stryker Corp. | | | (3,030 | ) | | | (773,468 | ) |
| | | | | | | | (2,465,888 | ) |
| Industrials — (1.20)% | | | | | | | | |
| Deere & Co. | | | (1,950 | ) | | | (704,145 | ) |
| Snap-on, Inc. | | | (3,450 | ) | | | (878,439 | ) |
| | | | | | | | (1,582,584 | ) |
| Total Common Stocks - Short - Domestic (Proceeds Received $18,211,023) | | | | | | | (20,524,041 | ) |
See accompanying notes which are an integral part of these financial statements.
| LS Opportunity Fund |
| Schedule of Securities Sold Short – continued |
| May 31, 2021 |
| | | Shares | | | Fair Value | |
| Common Stocks - Short - International — (7.35)% | | | | | | | | |
| Financials — (7.35)% | | | | | | | | |
| Aon PLC, Class A | | | (8,740 | ) | | $ | (2,214,454 | ) |
| Bank of Montreal | | | (10,050 | ) | | | (1,055,071 | ) |
| Bank of Nova Scotia (The) | | | (13,200 | ) | | | (888,515 | ) |
| Canadian Imperial Bank of Commerce | | | (6,150 | ) | | | (725,206 | ) |
| Commonwealth Bank of Australia | | | (32,005 | ) | | | (2,480,480 | ) |
| Muenchener Rueckversicherungs-Gesellshaft AG | | | (3,870 | ) | | | (1,114,141 | ) |
| Swiss Re AG | | | (13,000 | ) | | | (1,258,242 | ) |
| | | | | | | | | |
| Total Common Stocks - Short - International (Proceeds Received $7,075,681) | | | | | | | (9,736,109 | ) |
| | | | | | | | | |
| Exchange-Traded Funds — (3.20)% | | | | | | | | |
| iShares Russell 1000 Value ETF | | | (6,450 | ) | | | (1,039,289 | ) |
| iShares Russell 2000 ETF | | | (5,350 | ) | | | (1,206,425 | ) |
| SPDR® S&P® MidCap 400 ETF Trust | | | (2,450 | ) | | | (1,219,511 | ) |
| Vanguard S&P 500 ETF | | | (1,990 | ) | | | (768,399 | ) |
| | | | | | | | | |
| Total Exchange-Traded Funds (Proceeds Received $3,855,797) | | | | | | | (4,233,624 | ) |
| | | | | | | | | |
| Total Securities Sold Short — (26.05)% (Proceeds Received $29,142,501) | | | | | | $ | (34,493,774 | ) |
| (a) | Non-dividend expense producing security. |
ETF — Exchange-Traded Fund
SPDR — Standard & Poor’s Depositary Receipt
See accompanying notes which are an integral part of these financial statements.
| LS Opportunity Fund |
| Statement of Assets and Liabilities |
| May 31, 2021 |
| Assets | | | | |
| Investments in securities, at fair value (cost $103,459,454) (Note 3) | | $ | 131,374,899 | |
| Deposits at broker for securities sold short (Note 2) | | | 35,643,650 | |
| Cash | | | 9,348 | |
| Receivable for fund shares sold | | | 9,324 | |
| Dividends receivable | | | 133,416 | |
| Tax reclaims receivable | | | 37,344 | |
| Prepaid expenses | | | 18,354 | |
| Total Assets | | | 167,226,335 | |
| Liabilities | | | | |
| Investments in securities sold short, at fair value (proceeds received $29,142,501) (Note 2) | | | 34,493,774 | |
| Payable for fund shares redeemed | | | 27,440 | |
| Dividend expense payable on short positions | | | 38,026 | |
| Payable to Adviser (Note 4) | | | 187,558 | |
| Payable to Administrator (Note 4) | | | 14,296 | |
| Other accrued expenses | | | 41,734 | |
| Total Liabilities | | | 34,802,828 | |
| | | | | |
| Net Assets | | $ | 132,423,507 | |
| | | | | |
| Net Assets consist of: | | | | |
| Paid-in capital | | $ | 105,488,229 | |
| Accumulated earnings | | | 26,935,278 | |
| Net Assets | | $ | 132,423,507 | |
| | | | | |
| Shares outstanding (unlimited number of shares authorized, no par value) | | | 7,784,057 | |
| Net asset value, offering and redemption price per share (Note 2) | | $ | 17.01 | |
See accompanying notes which are an integral part of these financial statements.
| LS Opportunity Fund |
| Statement of Operations |
| For the year ended May 31, 2021 |
| Investment Income | | | | |
| Dividend income (net of foreign taxes withheld of $22,559) | | $ | 1,860,034 | |
| Total investment income | | | 1,860,034 | |
| | | | | |
| Expenses | | | | |
| Investment Adviser fees (Note 4) | | | 1,943,465 | |
| Dividend expense on securities sold short (Note 2) | | | 703,738 | |
| Short sale & interest expense | | | 142,377 | |
| Administration fees (Note 4) | | | 83,445 | |
| Fund accounting fees (Note 4) | | | 41,126 | |
| Registration expenses | | | 27,748 | |
| Legal fees | | | 21,125 | |
| Printing and postage expenses | | | 20,368 | |
| Custodian fees | | | 19,473 | |
| Audit and tax preparation expenses | | | 18,500 | |
| Transfer agent fees (Note 4) | | | 18,000 | |
| Compliance services fees (Note 4) | | | 12,000 | |
| Trustee expenses | | | 6,336 | |
| Miscellaneous | | | 40,895 | |
| Total expenses | | | 3,098,596 | |
| Fees waived by Adviser (Note 4) | | | (81,080 | ) |
| Net operating expenses | | | 3,017,516 | |
| Net investment loss | | | (1,157,482 | ) |
| Net Realized and Change in Unrealized Gain (Loss) on Investments | | | | |
| Net realized gain (loss) on: | | | | |
| Investment securities | | | 10,294,602 | |
| Securities sold short | | | (2,359,528 | ) |
| Purchased options | | | (79,050 | ) |
| Foreign currency | | | (6,853 | ) |
| Change in unrealized appreciation (depreciation) on: | | | | |
| Investment securities | | | 23,679,106 | |
| Securities sold short | | | (6,789,155 | ) |
| Foreign currency translations | | | 819 | |
| Net realized and change in unrealized gain on investments | | | 24,739,941 | |
| Net increase in net assets resulting from operations | | $ | 23,582,459 | |
See accompanying notes which are an integral part of these financial statements.
| LS Opportunity Fund |
| Statements of Changes in Net Assets |
| | | For the | | | For the | |
| | | Year Ended | | | Year Ended | |
| | | May 31, | | | May 31, | |
| | | 2021 | | | 2020 | |
| Increase (Decrease) in Net Assets due to: | | | | | | | | |
| Operations | | | | | | | | |
| Net investment loss | | $ | (1,157,482 | ) | | $ | (437,589 | ) |
| Net realized gain (loss) on investment transactions | | | 7,849,171 | | | | (89,039 | ) |
| Change in unrealized appreciation (depreciation) on investments | | | 16,890,770 | | | | (815,649 | ) |
| Net increase (decrease) in net assets resulting from operations | | | 23,582,459 | | | | (1,342,277 | ) |
| Distributions to Shareholders from Earnings (Note 2) | | | (1,399,284 | ) | | | (1,066,252 | ) |
| Capital Transactions | | | | | | | | |
| Proceeds from shares sold | | | 63,170,477 | | | | 37,652,913 | |
| Reinvestment of distributions | | | 1,315,287 | | | | 996,116 | |
| Amount paid for shares redeemed | | | (36,940,145 | ) | | | (22,298,906 | ) |
| Net increase in net assets resulting from capital transactions | | | 27,545,619 | | | | 16,350,123 | |
| Total Increase in Net Assets | | | 49,728,794 | | | | 13,941,594 | |
| Net Assets | | | | | | | | |
| Beginning of year | | | 82,694,713 | | | | 68,753,119 | |
| End of year | | $ | 132,423,507 | | | $ | 82,694,713 | |
| Share Transactions | | | | | | | | |
| Shares sold | | | 4,208,876 | | | | 2,592,658 | |
| Shares issued in reinvestment of distributions | | | 86,646 | | | | 67,579 | |
| Shares redeemed | | | (2,423,727 | ) | | | (1,632,887 | ) |
| Net increase in shares outstanding | | | 1,871,795 | | | | 1,027,350 | |
See accompanying notes which are an integral part of these financial statements.
| LS Opportunity Fund |
| Financial Highlights |
| (For a share outstanding during each year) |
| | | For the | | | For the | | | For the | | | For the | | | For the | |
| | | Year Ended | | | Year Ended | | | Year Ended | | | Year Ended | | | Year Ended | |
| | | May 31, | | | May 31, | | | May 31, | | | May 31, | | | May 31, | |
| | | 2021 | | | 2020 | | | 2019 | | | 2018 | | | 2017 | |
| Selected Per Share Data: | | | | | | | | | | | | | | | | | | | | |
| Net asset value, beginning of year | | $ | 13.99 | | | $ | 14.07 | | | $ | 13.96 | | | $ | 13.44 | | | $ | 12.22 | |
| Investment operations: | | | | | | | | | | | | | | | | | | | | |
| Net investment loss | | | (0.13 | ) | | | (0.07 | ) | | | (0.01 | ) | | | (0.08 | ) | | | (0.09 | ) |
| Net realized and unrealized gain on investments | | | 3.35 | | | | 0.17 | (a) | | | 0.47 | | | | 1.14 | | | | 1.31 | |
| Total from investment operations | | | 3.22 | | | | 0.10 | | | | 0.46 | | | | 1.06 | | | | 1.22 | |
| Less distributions to shareholders from: | | | | | | | | | | | | | | | | | | | | |
| Net realized gains | | | (0.20 | ) | | | (0.18 | ) | | | (0.35 | ) | | | (0.54 | ) | | | — | |
| Paid in capital from redemption fees(b) | | | — | | | | — | | | | — | | | | — | | | | — | (c) |
| Net asset value, end of year | | $ | 17.01 | | | $ | 13.99 | | | $ | 14.07 | | | $ | 13.96 | | | $ | 13.44 | |
| Total Return(d)(e) | | | 23.17 | % | | | 0.62 | % | | | 3.44 | % | | | 7.95 | % | | | 9.98 | % |
| Ratios and Supplemental Data: | | | | | | | | | | | | | | | | | | | | |
| Net assets, end of year (000 omitted) | | $ | 132,424 | | | $ | 82,695 | | | $ | 68,753 | | | $ | 49,958 | | | $ | 37,616 | |
| Ratio of net expenses to average net assets (f) | | | 2.71 | % | | | 2.84 | % | | | 2.89 | % | | | 2.97 | % | | | 2.88 | % |
| Ratio of expenses to average net assets before waiver and reimbursement(f) | | | 2.78 | % | | | 2.97 | % | | | 3.11 | % | | | 3.33 | % | | | 3.34 | % |
| Ratio of net investment loss to average net assets | | | (1.04 | )% | | | (0.52 | )% | | | (0.15 | )% | | | (0.82 | )% | | | (0.81 | )% |
| Portfolio turnover rate | | | 69.69 | % | | | 69.47 | % | | | 40.31 | % | | | 55.31 | % | | | 75.09 | % |
| (a) | The amount shown for a share outstanding throughout the year does not accord with the change in aggregate gains and losses in the portfolio of securities during the year because of the time of sales and purchases of fund shares in relation to fluctuating market values during the year. |
| (b) | Prior to September 28, 2016, the Fund charged a 2.00% redemption fee for shares redeemed within 60 days of purchase. |
| (c) | Rounds to less than $0.005 per share. |
| (d) | Total return represents the rate that the investor would have earned or lost on an investment in the Fund, assuming reinvestment of distributions. |
| (e) | Excludes redemption fee. |
| (f) | Includes dividend and interest expense of 0.76%, 0.89%, 0.94%, 1.02% and 0.93% for the fiscal years ended May 31, 2021, 2020, 2019, 2018 and 2017, respectively. |
See accompanying notes which are an integral part of these financial statements.
| LS Opportunity Fund |
| Notes to the Financial Statements |
| May 31, 2021 |
NOTE 1. ORGANIZATION
The LS Opportunity Fund (the “Fund”) is registered under the Investment Company Act of 1940, as amended (“1940 Act”), as an open-end, diversified series of Valued Advisers Trust (the “Trust”). The Trust is a management investment company established under the laws of Delaware by an Agreement and Declaration of Trust dated June 13, 2008 (the “Trust Agreement”). The Trust Agreement permits the Board of Trustees (the “Board” or the “Trustees”) to issue an unlimited number of shares of beneficial interest of separate series without par value. The Fund is one of a series of funds authorized by the Board. The Fund’s investment adviser is Long Short Advisors, LLC (the “Adviser”). The Adviser has retained Prospector Partners, LLC (the “Sub-Adviser”) to serve as the sub-adviser to provide portfolio management and related services to the Fund. The Sub-Adviser receives a fee from the Adviser (not the Fund) for these services. The investment objective of the Fund is to generate long-term capital appreciation by investing in both long and short positions within a portfolio consisting of primarily publicly-traded common stock, with less net exposure than that of the stock market in general.
NOTE 2. SIGNIFICANT ACCOUNTING POLICIES
The Fund is an investment company and follows accounting and reporting guidance under Financial Accounting Standards Board Accounting Standards Codification (“ASC”) Topic 946, “Financial Services-Investment Companies.” The following is a summary of significant accounting policies followed by the Fund in the preparation of its financial statements. These policies are in conformity with generally accepted accounting principles in the United States of America (“GAAP”).
Estimates – The preparation of financial statements in conformity with GAAP requires management to make estimates and assumptions that affect the reported amounts of assets and liabilities and disclosure of contingent assets and liabilities at the date of the financial statements and the reported amounts of increases and decreases in net assets from operations during the reporting period. Actual results could differ from those estimates.
Federal Income Taxes – The Fund makes no provision for federal income or excise tax. The Fund has qualified and intends to qualify each year as a regulated investment company (“RIC”) under subchapter M of the Internal Revenue Code of 1986, as amended, by complying with the requirements applicable to RICs and by distributing substantially all of its taxable income. The Fund also intends to distribute sufficient net investment income and net realized capital gains, if any, so that it will not be subject to excise tax on undistributed income and gains. If the required amount of net investment income or gains is not distributed, the Fund could incur a tax expense.
As of and during the fiscal year ended May 31, 2021, the Fund did not have any liabilities for any unrecognized tax benefits. The Fund recognizes interest and penalties, if any, related
| LS Opportunity Fund |
| Notes to the Financial Statements – continued |
| May 31, 2021 |
NOTE 2. SIGNIFICANT ACCOUNTING POLICIES – continued
to unrecognized tax benefits as income tax expense on the Statement of Operations when incurred. During the fiscal year ended May 31, 2021, the Fund did not incur any interest or penalties. Management of the Fund has reviewed tax positions taken in tax years that remain subject to examination by all major tax jurisdictions, including federal (i.e., the last three tax year ends and the interim tax period since then, as applicable). Management believes that there is no tax liability resulting from unrecognized tax benefits related to uncertain tax positions taken.
Expenses – Expenses incurred by the Trust that do not relate to a specific fund of the Trust are allocated to the individual funds based on each fund’s relative net assets or another appropriate basis (as determined by the Board).
Security Transactions and Related Income – The Fund follows industry practice and records security transactions on the trade date for financial reporting purposes. For financial statement and income tax purposes, the specific identification method is used for determining capital gains or losses. Dividend income and dividend expense are recorded on the ex-dividend date and interest income is recorded on an accrual basis. Dividend income from real estate investment trusts (REITs) and distributions from limited partnerships are recognized on the ex-date. The calendar year end classification of distributions received from REITs during the fiscal year are reported subsequent to year end; accordingly, the Fund estimates the character of REIT distributions based on the most recent information available. Income or loss from Limited Partnerships is reclassified among the components of net assets upon receipt of Schedules K-1 (Form 1065). Non-cash income, if any, is recorded at the fair market value of the securities received. Withholding taxes on foreign dividends have been provided for in accordance with the Fund’s understanding of the applicable country’s tax rules and rates.
Foreign Currency Translation – Foreign currency amounts are translated into U.S. dollars as follows: (i) assets and liabilities at the rate of exchange at the end of the respective period; and (ii) purchases and sales of securities and income and expenses at the rate of exchange prevailing on the dates of such transactions. The portion of the results of operations arising from changes in the exchange rates and the portion due to fluctuations arising from changes in the market prices of securities are not isolated. Such fluctuations are included with the net realized and unrealized gain or loss on investments.
The Fund may enter into transactions to purchase or sell foreign currencies to protect the U.S. dollar value of its underlying portfolio securities against the effect of possible adverse movements in foreign exchange rates. Principal risks associated with such transactions include the movement in value of the foreign currency relative to the U.S. dollar and the ability of the counterparty to meet its obligations. Reported net realized foreign exchange gains or losses arise from sales of foreign currencies, currency gains or losses realized between the trade and settlement dates on securities transactions, and the difference between the amounts of
| LS Opportunity Fund |
| Notes to the Financial Statements – continued |
| May 31, 2021 |
NOTE 2. SIGNIFICANT ACCOUNTING POLICIES – continued
dividends, interest, and foreign withholding taxes recorded on the company’s books and the U.S. dollar equivalent of the amounts actually received or paid. These instruments involve market risk, credit risk, or both in excess of the amount that would be recognized in the Statement of Assets and Liabilities. Risks arise from the possible inability of counterparties to meet the terms of their contracts and from movement in currency and securities values and interest rates.
Dividends and Distributions – The Fund intends to distribute its net investment income and net realized long-term and short-term capital gains, if any, at least annually. Dividends and distributions to shareholders, which are determined in accordance with income tax regulations, are recorded on the ex-dividend date. The treatment for financial reporting purposes of distributions made to shareholders during the period from net investment income or net realized capital gains may differ from their ultimate treatment for federal income tax purposes. These differences are caused primarily by differences in the timing of the recognition of certain components of income, expense or realized capital gain for federal income tax purposes. Where such differences are permanent in nature, they are reclassified among the components of net assets based on their ultimate characterization for federal income tax purposes. Any such reclassifications will have no effect on net assets, results of operations or net asset value (“NAV”) per share of the Fund.
For the fiscal year ended May 31, 2021, the Fund made the following reclassifications to increase (decrease) the components of net assets, which were due to operating losses:
| | | | Accumulated | |
| Paid-In | | | Earnings | |
| Capital | | | (Deficit) | |
| $ | (370,295 | ) | | $ | 370,295 | |
Share Valuation – The NAV is calculated each day the New York Stock Exchange (the “NYSE”) is open by dividing the total value of the Fund’s assets, less liabilities, by the number of shares outstanding for the Fund.
Short Sales – The Fund may make short sales as part of its overall portfolio management strategies or to offset a potential decline in value of a security. The Fund may engage in short sales with respect to various types of securities, including exchange-traded funds (ETFs). A short sale involves the sale of a security that is borrowed from a broker or other institution to complete the sale. The Fund may engage in short sales with respect to securities it owns, as well as securities that it does not own. Short sales expose the Fund to the risk that it will be required to acquire, convert or exchange securities to replace the borrowed securities (also known as “covering” the short position) at a time when the securities sold short have appreciated in value, thus resulting in a loss to the Fund. The amount of loss may exceed the
| LS Opportunity Fund |
| Notes to the Financial Statements – continued |
| May 31, 2021 |
NOTE 2. SIGNIFICANT ACCOUNTING POLICIES – continued
proceeds received in a short sale. The Fund’s investment performance may also suffer if the Fund is required to close out a short position earlier than it had intended. The Fund must segregate assets determined to be liquid in accordance with procedures established by the Board, or otherwise cover its position in a permissible manner. The Fund will be required to pledge liquid assets to the broker in order to secure its performance on short sales. As a result, the assets pledged may not be available to meet the Fund’s needs for immediate cash or other liquidity. In addition, the Fund may be subject to expenses related to short sales that are not typically associated with investing in securities directly, such as costs of borrowing and margin account maintenance costs associated with the Fund’s open short positions. These types of short sales expenses are sometimes referred to as the “negative cost of carry,” and will reduce the Fund’s potential return on a short sale. The amount of restricted cash or cash equivalents held at the broker as collateral for securities sold short was $35,643,650 as of May 31, 2021.
Dividend expenses on securities sold short and borrowing costs are not covered under the Adviser’s expense limitation agreement with the Fund and, therefore, these expenses will be borne by the shareholders of the Fund.
Purchasing Call Options – The Fund may purchase call options. As the holder of a call option, the Fund has the right to purchase the underlying security at the exercise price at any time during the option period. The Fund may enter into closing sale transactions with respect to such options, exercise them or permit them to expire. The Fund may also purchase call options on relevant stock indexes. Call options may also be purchased by the Fund for the purpose of acquiring the underlying securities for its portfolio. Utilized in this fashion, the purchase of call options enables the Fund to acquire the securities at the exercise price of the call option plus the premium paid. At times the net cost of acquiring securities in this manner may be less than the cost of acquiring the securities directly. This technique may also be useful to the Fund in purchasing a large block of securities that would be more difficult to acquire by direct market purchases. So long as it holds such a call option rather than the underlying security itself, the Fund is partially protected from any unexpected decline in the market price of the underlying security and in such event could allow the call option to expire, incurring a loss only to the extent of the premium paid for the option.
Purchasing Put Options – The Fund may purchase put options. As the holder of a put option, the Fund has the right to sell the underlying security at the exercise price at any time during the option period. The Fund may enter into closing sale transactions with respect to such options, exercise them or permit them to expire. The Fund may purchase a put option on an owned underlying security (a “protective put”) as a defensive technique to protect against an anticipated decline in the value of the security. Such hedge protection is provided only during the life of the put option when the Fund, as the holder of the put option, is able to sell the underlying security at the put exercise price regardless of any decline in the underlying security’s market price. The Fund may also purchase put options at a time when it does not
| LS Opportunity Fund |
| Notes to the Financial Statements – continued |
| May 31, 2021 |
NOTE 2. SIGNIFICANT ACCOUNTING POLICIES – continued
own the underlying security. By purchasing put options on a security it does not own, the Fund seeks to benefit from a decline in the market price of the underlying security. If the put option is not sold when it has remaining value, and if the market price of the underlying security remains equal to or greater than the exercise price during the life of the put option, the Fund will lose its entire premium paid for the put option. In order for the purchase of a put option to be profitable, the market price of the underlying security must decline sufficiently below the exercise price to cover the premium and transaction costs.
Writing Options – The Fund may write covered call options on equity securities that the Fund is eligible to purchase to extend a holding period to obtain long-term capital gain treatment, to earn premium income, to assure a definite price for a security it has considered selling, or to close out options previously purchased. The Fund may write covered call options if, immediately thereafter, not more than 30% of its net assets would be committed to such transactions. A call option gives the holder (buyer) the right to purchase a security at a specified price (the exercise price) at any time until a certain date (the expiration date). A call option is “covered” if the Fund owns the underlying security subject to the call option at all times during the option period. When the Fund writes a covered call option, it maintains a segregated account with its custodian, cash, or liquid portfolio securities in an amount not less than the exercise price at all times while the option is outstanding.
The Fund may write covered put options on equity securities and futures contracts that the Fund is eligible to purchase to earn premium income or to assure a definite price for a security if it is considering acquiring the security at a lower price than the current market price or to close out options previously purchased. The Fund may not write a put option if, immediately thereafter, more than 25% of its net assets would be committed to such transactions. A put option gives the holder of the option the right to sell, and the writer has the obligation to buy, the underlying security at the exercise price at any time during the option period. The operation of put options in other respects is substantially identical to that of call options. When the Fund writes a covered put option, it maintains in a segregated account with its custodian cash or liquid portfolio securities in an amount not less than the exercise price at all times while the put option is outstanding.
Foreign Currency Exchange Contracts – The Fund may engage in foreign currency exchange transactions. The value of the Fund’s portfolio securities that are invested in non-U.S. dollar denominated instruments as measured in U.S. dollars may be affected favorably or unfavorably by changes in foreign currency exchange rates, and the Fund may incur costs in connection with conversions between various currencies. The Fund will conduct its foreign currency exchange transactions either on a spot (i.e., cash) basis at the spot rate prevailing in the foreign currency exchange market or through forward foreign currency exchange contracts, to purchase or sell foreign currencies. A forward foreign currency exchange contract involves an obligation to purchase or sell a specific currency at a future date, which may be any
| LS Opportunity Fund |
| Notes to the Financial Statements – continued |
| May 31, 2021 |
NOTE 2. SIGNIFICANT ACCOUNTING POLICIES – continued
fixed number of days from the date of the contract agreed upon by the parties, at a price set at the time of the contract. These contracts are traded directly between currency traders (usually large commercial banks) and their customers. The Fund will not, however, hold foreign currency except in connection with the purchase and sale of foreign portfolio securities. The Fund did not transact in forward foreign currency exchange contracts during the fiscal year ended May 31, 2021.
Derivative Transactions – The following tables identify the location and fair value of derivative instruments on the Statement of Operations for the fiscal year ended May 31, 2021.
For the fiscal year ended May 31, 2021:
| | | | | | | | Change in | |
| | | | | | | | Unrealized | |
| | | Location of Gain | | Realized Gain | | | Appreciation | |
| | | (Loss) on Derivatives on | | (Loss) on | | | (Depreciation) on | |
| Derivatives | | Statement of Operations | | Derivatives | | | Derivatives | |
| Equity Price Risk: | | | | | | | | | | |
| Options purchased | | Net realized gain (loss) on purchased options | | $ | (79,050 | ) | | $ | — | |
The Fund is not subject to a master netting arrangement and its policy is to not offset assets and liabilities related to its investment in derivatives.
The following summarizes the average ending monthly fair value of derivatives outstanding during the fiscal year ended May 31, 2021:
| | | Average | |
| Derivatives | | Market Value | |
| Options Purchased | | $ | 4,126 | |
NOTE 3. SECURITIES VALUATION AND FAIR VALUE MEASUREMENTS
The Fund values its portfolio securities at fair value as of the close of regular trading on the NYSE (normally 4:00 p.m. Eastern time) on each business day the NYSE is open for business. Fair value is defined as the price that the Fund would receive upon selling an investment in a timely transaction to an independent buyer in the principal or most advantageous market of the investment. GAAP establishes a three-tier hierarchy to maximize the use of observable market data and minimize the use of unobservable inputs and to establish classification of fair value measurements for disclosure purposes.
| LS Opportunity Fund |
| Notes to the Financial Statements – continued |
| May 31, 2021 |
NOTE 3. SECURITIES VALUATION AND FAIR VALUE MEASUREMENTS – continued
Inputs refer broadly to the assumptions that market participants would use in pricing the asset or liability, including assumptions about risk (the risk inherent in a particular valuation technique used to measure fair value including a pricing model and/or the risk inherent in the inputs to the valuation technique). Inputs may be observable or unobservable. Observable inputs are inputs that reflect the assumptions market participants would use in pricing the asset or liability developed based on market data obtained and available from sources independent of the reporting entity. Unobservable inputs are inputs that reflect the reporting entity’s own assumptions about the assumptions market participants would use in pricing the asset or liability developed based on the best information available in the circumstances.
Various inputs are used in determining the value of the Fund’s investments. These inputs are summarized in the three broad levels listed below.
| ● | Level 1 – unadjusted quoted prices in active markets for identical investments and/or registered investment companies where the value per share is determined and published and is the basis for current transactions for identical assets or liabilities at the valuation date |
| ● | Level 2 – other significant observable inputs (including, but not limited to, quoted prices for an identical security in an inactive market, quoted prices for similar securities, interest rates, prepayment speeds, credit risk, etc.) |
| ● | Level 3 – significant unobservable inputs (including the Fund’s own assumptions in determining fair value of investments based on the best information available) |
The inputs used to measure fair value may fall into different levels of the fair value hierarchy. In such cases, for disclosure purposes, the level in the fair value hierarchy which is reported is determined based on the lowest level input that is significant to the fair value measurement in its entirety.
Equity securities that are traded on any stock exchange are generally valued at the last quoted sale price on the security’s primary exchange. Lacking a last sale price, an exchange-traded security is generally valued at its last bid price, except in the case of a security sold short, in which case the last ask price is utilized. Securities traded in the NASDAQ over-the-counter market are generally valued at the NASDAQ Official Closing Price. When using the market quotations and when the market is considered active, the security is classified as a Level 1 security. In the event that market quotations are not readily available or are considered unreliable due to market or other events, the Fund values its securities and other assets at fair value in accordance with policies established by and under the general supervision of the
| LS Opportunity Fund |
| Notes to the Financial Statements – continued |
| May 31, 2021 |
NOTE 3. SECURITIES VALUATION AND FAIR VALUE MEASUREMENTS – continued
Board. Under these policies, the securities will be classified as Level 2 or 3 within the fair value hierarchy, depending on the inputs used.
Investments in mutual funds, including money market mutual funds, are generally priced at the ending NAV. These securities are categorized as Level 1 securities.
Option contracts in which the Fund invests are generally traded on an exchange. Exchange-traded options on securities and indexes purchased or sold by the Fund generally will be valued at the mean of the last bid and ask prices. If there is no such reported ask on the valuation date, options are valued at the most recent bid price. If there is no such reported bid on the valuation date, options are valued at the most recent ask price. If the Fund decides that a price provided by the pricing service does not accurately reflect the fair value of the securities, when prices are not readily available from a pricing service, or when restricted or illiquid securities are being valued, securities are valued at fair value as determined by the Adviser, in conformity with policies adopted by and subject to review of the Board. These securities will generally be categorized as Level 2 securities.
In accordance with the Trust’s valuation policies, the Adviser is required to consider all appropriate factors relevant to the value of securities for which it has determined other pricing sources are not available or reliable as described above. No single method exists for determining fair value, because fair value depends upon the circumstances of each individual case. As a general principle, the current fair value of a security being valued by the Adviser would be the amount that the Fund might reasonably expect to receive upon the current sale. Methods that are in accordance with this principle may, for example, be based on (i) a multiple of earnings; (ii) a discount from market prices of a similar freely traded security (including a derivative security or a basket of securities traded on other markets, exchanges or among dealers); or (iii) yield to maturity with respect to debt issues, or a combination of these and other methods. Fair-value pricing is permitted if, in the Adviser’s opinion, the validity of market quotations appears to be questionable based on factors such as evidence of a thin market in the security based on a small number of quotations, a significant event occurs after the close of a market but before the Fund’s NAV calculation that may affect a security’s value, or the Adviser is aware of any other data that calls into question the reliability of market quotations.
| LS Opportunity Fund |
| Notes to the Financial Statements – continued |
| May 31, 2021 |
NOTE 3. SECURITIES VALUATION AND FAIR VALUE MEASUREMENTS – continued
The following is a summary of the inputs used to value the Fund’s investments as of May 31, 2021:
| | | Valuation Inputs | |
| Assets | | Level 1 | | | Level 2 | | | Level 3 | | | Total | |
| Common Stocks Domestic (a) | | $ | 98,497,532 | | | $ | — | | | $ | — | | | $ | 98,497,532 | |
| Common Stocks International (a) | | | 14,730,760 | | | | — | | | | — | | | | 14,730,760 | |
| Exchange-Traded Funds | | | 1,717,653 | | | | — | | | | — | | | | 1,717,653 | |
| Money Market Funds | | | 16,428,954 | | | | — | | | | — | | | | 16,428,954 | |
| Total | | $ | 131,374,899 | | | $ | — | | | $ | — | | | $ | 131,374,899 | |
| (a) | Refer to Schedule of Investments for sector classifications. |
| | | Valuation Inputs | |
| Liabilities | | Level 1 | | | Level 2 | | | Level 3 | | | Total | |
| Common Stocks Domestic(a) | | $ | (20,524,041 | ) | | $ | — | | | $ | — | | | $ | (20,524,041 | ) |
| Common Stocks International(a) | | | (9,736,109 | ) | | | — | | | | — | | | | (9,736,109 | ) |
| Exchange-Traded Funds | | | (4,233,624 | ) | | | — | | | | — | | | | (4,233,624 | ) |
| Total | | $ | (34,493,774 | ) | | $ | — | | | $ | — | | | $ | (34,493,774 | ) |
| (a) | Refer to Schedule of Securities Sold Short for sector classifications. |
The Fund did not hold any investments at the end of the reporting period for which significant unobservable inputs (Level 3) were used in determining fair value; therefore, no reconciliation of Level 3 securities is included for this reporting period.
NOTE 4. FEES AND OTHER TRANSACTIONS WITH AFFILIATES
The Adviser, under the terms of the management agreement (the “Agreement”), manages the Fund’s investments. As compensation for its management services, the Fund pays the Adviser a fee, computed and accrued daily and paid monthly, at an annual rate of 1.75% of the Fund’s average daily net assets. For the fiscal year ended May 31, 2021, the Adviser earned a fee of $1,943,465 from the Fund before the waivers described below. At May 31, 2021, the Adviser was owed $187,558 from the Fund for management services.
The Adviser has contractually agreed to waive its management fee and/or reimburse certain Fund operating expenses, but only to the extent necessary so that the Fund’s net expenses (excluding borrowing costs such as interest and dividends on securities sold short, taxes, brokerage commissions, other expenditures which are capitalized in accordance with generally accepted accounting principles, other extraordinary expenses not incurred in the ordinary course of the Fund’s business, expenses incurred under a Rule 12b-1 plan of distribution, “acquired fund fees and expenses” (i.e., investment companies in which the Fund may invest),
| LS Opportunity Fund |
| Notes to the Financial Statements – continued |
| May 31, 2021 |
NOTE 4. FEES AND OTHER TRANSACTIONS WITH AFFILIATES – continued
and expenses that the Fund has incurred but did not actually pay because of an expense offset arrangement) do not exceed 1.95% of the average daily net assets of the Fund.
Each fee waiver or expense reimbursement by the Adviser is subject to repayment by the Fund within the three years following the date in which the fee waiver or expense reimbursement occurred, provided that the Fund is able to make the repayment without exceeding the expense limitation that is in effect at the time of the repayment or at the time of the fee waiver or expense reimbursement, whichever is lower. The contractual agreement is in effect through September 30, 2021. The expense cap may not be terminated prior to this date except by mutual consent of the Adviser and the Board. For the fiscal year ended May 31, 2021, the Adviser waived fees of $81,080. The amounts subject to repayment by the Fund, pursuant to the aforementioned conditions, are as follows:
| Recoverable through | | Amount | |
| May 31, 2022 | | $ | 136,581 | |
| May 31, 2023 | | | 116,628 | |
| May 31, 2024 | | | 81,080 | |
The Adviser has retained the Sub-Adviser to provide portfolio management and related services to the Fund. The Sub-Adviser receives a fee from the Adviser (not the Fund) for these services.
The Trust retains Ultimus Fund Solutions, LLC (“Ultimus” or the “Administrator”) to provide the Fund with administration, compliance (including a chief compliance officer), fund accounting and transfer agent services, including all regulatory reporting. For the fiscal year ended May 31, 2021, the Administrator earned fees of $83,445 for administration services, $12,000 for compliance services, $41,126 for fund accounting services and $18,000 for transfer agent services. At May 31, 2021, the Fund owed the Administrator $14,296 for such services.
The officers and one trustee of the Trust are members of management and/or employees of the Administrator and are not paid by the Trust for services to the Fund. Ultimus Fund Distributors, LLC (the “Distributor”), a wholly owned subsidiary of Ultimus, acts as the distributor of the Fund’s shares. There were no payments made to the Distributor by the Fund for the fiscal year ended May 31, 2021.
NOTE 5. PURCHASES AND SALES OF SECURITIES
For the fiscal year ended May 31, 2021, purchases and sales of investment securities, other than short-term investments, were $91,480,955 and $82,493,585, respectively.
| LS Opportunity Fund |
| Notes to the Financial Statements – continued |
| May 31, 2021 |
NOTE 5. PURCHASES AND SALES OF SECURITIES – continued
There were no purchases or sales of long-term U.S. government obligations during the fiscal year ended May 31, 2021.
NOTE 6. FEDERAL TAX INFORMATION
At May 31, 2021, the net unrealized appreciation (depreciation) and tax cost of investments and securities sold short for tax purposes was as follows:
| Gross unrealized appreciation | | $ | 27,332,871 | |
| Gross unrealized depreciation | | | (5,666,852 | ) |
| Net unrealized appreciation on investments | | $ | 21,666,019 | |
| Tax cost of investments and securities sold short | | $ | 75,215,106 | |
The difference between book basis and tax basis unrealized appreciation is attributable primarily to the tax deferral of losses on wash sales, grantor trust adjustments and return of capital distributions from underlying investments.
The tax character of distributions paid for the fiscal years ended May 31, 2021 and May 31, 2020 were as follows:
| | | 2021 | | | 2020 | |
| Distributions paid from:(a) | | | | | | | | |
| Ordinary income | | $ | — | | | $ | — | |
| Long-term capital gains | | | 1,399,284 | | | | 1,066,252 | |
| Total distributions paid | | $ | 1,399,284 | | | $ | 1,066,252 | |
| (a) | For federal income tax purposes, distributions of short-term capital gains are treated as ordinary income distributions. |
At May 31, 2021, the components of accumulated earnings (deficit) on a tax basis were as follows:
| Undistributed long-term capital gains | | $ | 5,851,596 | |
| Accumulated capital and other losses | | | (584,702 | ) |
| Unrealized appreciation on investments | | | 21,666,019 | |
| Unrealized appreciation on foreign currency translations | | | 2,365 | |
| Total accumulated earnings | | $ | 26,935,278 | |
| LS Opportunity Fund |
| Notes to the Financial Statements – continued |
| May 31, 2021 |
NOTE 6. FEDERAL TAX INFORMATION – continued
Certain qualified late year ordinary losses incurred after December 31, and within the current taxable year, are deemed to arise on the first business day of the Fund’s following taxable year. For the tax year ended May 31, 2021, the Fund deferred Qualified Late Year Ordinary Losses in the amount of $580,679.
NOTE 7. SECTOR RISK
If the Fund has significant investments in the securities of issuers within a particular sector, any development affecting that sector will have a greater impact on the value of the net assets of the Fund than would be the case if the Fund did not have significant investments in that sector. In addition, this may increase the risk of loss in the Fund and increase the volatility of the Fund’s NAV per share. For instance, economic or market factors, regulatory changes or other developments may negatively impact all companies in a particular sector, and therefore the value of the Fund’s portfolio will be adversely affected. As of May 31, 2021, the Fund had 33.46% of the net value of its net assets invested in stocks within the Financial sector.
NOTE 8. COMMITMENTS AND CONTINGENCIES
The Trust indemnifies its officers and Trustees for certain liabilities that may arise from their performance of their duties to the Trust or the Fund. Additionally, in the normal course of business, the Trust enters into contracts that contain a variety of representations and warranties which provide general indemnifications. The Trust’s maximum exposure under these arrangements is unknown, as this would involve future claims that may be made against the Trust that have not yet occurred.
NOTE 9. SUBSEQUENT EVENTS
Management of the Fund has evaluated the need for disclosures and/or adjustments resulting from subsequent events through the date at which these financial statements were issued. Based upon this evaluation, management has determined there were no items requiring adjustment of the financial statements or additional disclosure.
Report of Independent Registered Public Accounting Firm
To the Shareholders of LS Opportunity Fund and
Board of Trustees of Valued Advisers Trust
Opinion on the Financial Statements
We have audited the accompanying statement of assets and liabilities, including the schedules of investments and securities sold short, of LS Opportunity Fund (the “Fund”), a series of Valued Advisers Trust, as of May 31, 2021, the related statement of operations for the year then ended, the statements of changes in net assets for each of the two years in the period then ended, the related notes, and the financial highlights for each of the five years in the period then ended (collectively referred to as the “financial statements”). In our opinion, the financial statements present fairly, in all material respects, the financial position of the Fund as of May 31, 2021, the results of its operations for the year then ended, the changes in net assets for each of the two years in the period then ended, and the financial highlights for each of the five years in the period then ended, in conformity with accounting principles generally accepted in the United States of America.
Basis for Opinion
These financial statements are the responsibility of the Fund’s management. Our responsibility is to express an opinion on the Fund’s financial statements based on our audits. We are a public accounting firm registered with the Public Company Accounting Oversight Board (United States) (“PCAOB”) and are required to be independent with respect to the Fund in accordance with the U.S. federal securities laws and the applicable rules and regulations of the Securities and Exchange Commission and the PCAOB.
We conducted our audits in accordance with the standards of the PCAOB. Those standards require that we plan and perform the audit to obtain reasonable assurance about whether the financial statements are free of material misstatement whether due to error or fraud.
Our audits included performing procedures to assess the risks of material misstatement of the financial statements, whether due to error or fraud, and performing procedures that respond to those risks. Such procedures included examining, on a test basis, evidence regarding the amounts and disclosures in the financial statements. Our procedures included confirmation of securities owned as of May 31, 2021, by correspondence with the custodian and broker. Our audits also included evaluating the accounting principles used and significant estimates made by management, as well as evaluating the overall presentation of the financial statements. We believe that our audits provide a reasonable basis for our opinion.
We have served as the Fund’s auditor since 2011.
COHEN & COMPANY, LTD.
Cleveland, Ohio
July 28, 2021
| Summary of Fund Expenses (Unaudited) |
As a shareholder of the Fund, you incur two types of costs: (1) transaction and (2) ongoing costs, including management fees and other Fund expenses. These examples are intended to help you understand your ongoing costs (in dollars) of investing in the Fund and to compare these costs with the ongoing costs of investing in other mutual funds. The example is based on an investment of $1,000 invested at the beginning of the period and held for the entire period from December 1, 2020 through May 31, 2021.
Actual Expenses
The first line of the table below provides information about actual account values and actual expenses. You may use the information in this line, together with the amount you invested, to estimate the expenses that you paid over the period. Simply divide your account value by $1,000 (for example, an $8,600 account value divided by $1,000 = 8.6), then multiply the result by the number in the first line under the heading entitled “Expenses Paid During Period” to estimate the expenses you paid on your account during this period.
Hypothetical Example for Comparison Purposes
The second line of the table below provides information about hypothetical account values and hypothetical expenses based on the Fund’s actual expense ratio and an assumed rate of return of 5% per year before expenses, which is not the Fund’s actual return. The hypothetical account values and expenses may not be used to estimate the actual ending account balance or expenses you paid for the period. You may use this information to compare the ongoing costs of investing in the Fund and other funds. To do so, compare this 5% hypothetical example with the 5% hypothetical examples that appear in the shareholder reports of other funds.
Expenses shown in the table are meant to highlight your ongoing costs only and do not reflect any transactional costs. Therefore, the second line of the table below is useful in comparing ongoing costs only and will not help you determine the relative costs of owning different funds. In addition, if transaction costs were included, your costs would have been higher.
| | | | Beginning | | | | | | | | | | |
| | | | Account Value | | | Ending | | | | | | | |
| | | | December 1, | | | Account Value | | | Expenses Paid | | | Annualized | |
| | | | 2020 | | | May 31, 2021 | | | During Period(a) | | | Expense Ratio | |
| Actual | | | $ 1,000.00 | | | $ 1,139.60 | | | $15.05 | | | 2.82% | |
| Hypothetical(b) | | | $ 1,000.00 | | | $ 1,010.86 | | | $14.14 | | | 2.82% | |
| (a) | Expenses are equal to the Fund’s annualized expense ratio, multiplied by the average account value over the period, multiplied by 182/365 (to reflect the one-half year period). |
| (b) | Hypothetical assumes 5% annual return before expenses. |
| Additional Federal Income Tax Information (Unaudited) |
The Form 1099-DIV you receive in January 2022 will show the tax status of all distributions paid to your account in calendar year 2021. Shareholders are advised to consult their own tax adviser with respect to the tax consequences of their investment in the Fund. As required by the Internal Revenue Code and/or regulations, shareholders must be notified regarding the status of qualified dividend income for individuals and the dividends received deduction for corporations.
Qualified Dividend Income. The Fund designates approximately 0% or up to the maximum amount of such dividends allowable pursuant to the Internal Revenue Code, as qualified dividend income eligible for a reduced tax rate.
Qualified Business Income. The Fund designates approximately 0% of its ordinary income dividends, or up to the maximum amount of such dividends allowable pursuant to the Internal Revenue Code, as qualified business income.
Dividends Received Deduction. Corporate shareholders are generally entitled to take the dividends received deduction on the portion of the Fund’s dividend distribution that qualifies under tax law. For the Fund’s calendar year 2021 ordinary income dividends, 0% qualifies for the corporate dividends received deduction.
For the year ended May 31, 2021, the Fund designated $1,399,284 as long-term capital gain distributions.
| Investment Advisory Agreement Renewal Approval (Unaudited) |
At a meeting held on March 1-2. 2021, the Board of Trustees (the “Board”) considered the renewal of the Investment Advisory Agreement (the “LSA Agreement”) between Valued Advisers Trust (the “Trust”) and Long Short Advisors, LLC (“LSA”) with respect to the LS Opportunity Fund (the “LS Fund”). LSA provided written information to the Board to assist the Board in its considerations.
Counsel reminded the Trustees of their fiduciary duties and responsibilities with respect to its consideration of the continuance of investment advisory agreements, including the factors to be considered, and the application of those factors to LSA and the LSA Agreement. In assessing the factors and reaching its decision, the Board took into consideration information furnished by LSA and the Trust’s other service providers for the Board’s review and consideration throughout the year, as well as information specifically prepared or presented in connection with the renewal process, including: (i) reports regarding the services and support provided to the LS Fund by LSA; (ii) quarterly assessments of the investment performance of the LS Fund; (iii) commentary on the reasons for the performance; (iv) presentations by LSA addressing its investment philosophy, investment strategy, personnel, and operations of LSA; (v) compliance and audit reports concerning the LS Fund and LSA; (vi) disclosure information contained in the registration statement of the Trust for the LS Fund and LSA’s Form ADV; (vii) information relating to the manner in which LSA oversees Prospector Partners, LLC, the LS Fund’s sub-adviser; and (viii) a memorandum from counsel, that summarized the fiduciary duties and responsibilities of the Board in reviewing and approving the LSA Agreement. The Board also requested and received various informational materials including, without limitation: (a) documents containing information about LSA, including its financial information; a description of its personnel and the services it provides to the LS Fund; information on LSA’s investment advice and performance; summaries of the LS Fund’s expenses, compliance program, current legal matters, and other general information; (b) comparative expense and performance information for other mutual funds with strategies similar to the LS Fund; and (c) the benefits to be realized by LSA from its relationship with the LS Fund. The Board did not identify any particular information that was most relevant to its consideration to approve the LSA Agreement and each Trustee may have afforded different weight to the various factors.
| 1. | The nature, extent, and quality of the services to be provided by LSA. In this regard, the Board considered LSA’s responsibilities under the LSA Agreement. The Trustees considered the services being provided by LSA to the LS Fund including its process for overseeing the sub-adviser’s portfolio management of the LS Fund, assuring compliance with the LS Fund’s investment objectives and limitations, its coordination of services for the LS Fund among the LS Fund’s service providers, and its efforts to promote the LS Fund and grow its assets. The Trustees reviewed the steps LSA takes to oversee and supervise the sub-adviser, as described in the materials provided by LSA. The Trustees considered LSA’s continuity of, and commitment to retain, qualified personnel and LSA’s commitment to maintain and enhance its resources and systems. The Trustees considered LSA’s personnel, including the education and experience of LSA’s personnel. After considering the foregoing information and further information in the Meeting materials |
| Investment Advisory Agreement Renewal Approval (Unaudited) – continued |
provided by LSA (including LSA’s Form ADV), the Board concluded that, in light of all the facts and circumstances, the nature, extent and quality of the services provided by LSA were satisfactory and adequate for the LS Fund.
| 2. | Investment performance of the LS Fund and LSA. In considering the investment performance of the LS Fund, the Trustees noted that LSA did not manage any accounts directly and that it had delegated the portfolio management responsibilities of the LS Fund to a sub-adviser. Accordingly, the Trustees concluded that their consideration of this factor for LSA was less relevant in their determination of LSA’s performance of its duties than other factors. The Trustees considered the consistency of LSA’s management oversight of the LS Fund’s sub-adviser with the LS Fund’s investment objective, strategies, and limitations. The Trustees also compared the performance of the LS Fund with the performance of its Morningstar category. The Trustees noted that the LS Fund’s performance was below the average but above the median of the category for the one-year period ended December 31, 2020, above both the average and median for the three-year and five-year periods, and below the average but equal to the median for the ten-year period. As compared to its custom peer group, the Trustees observed that the performance of the LS Fund was below the median for the one-year and since inception periods ended December 31, 2020, and above the median for the three-year and five-year periods. After reviewing and discussing the investment performance of the LS Fund further, LSA’s experience in overseeing the sub-adviser to the LS Fund, the LS Fund’s historical performance, and other relevant factors, the Board concluded, in light of all the facts and circumstances, that the investment performance, and LSA’s oversight of the sub-adviser to the LS Fund was satisfactory. |
| 3. | The costs of the services to be provided and profits to be realized by LSA from its relationship with the LS Fund. In considering the costs of services to be provided and the profits to be realized by LSA from its relationship with the LS Fund, the Trustees considered: (1) LSA’s financial condition; (2) asset levels of the LS Fund; (3) the overall expenses of the LS Fund; and (4) the nature and frequency of advisory fee payments. The Trustees reviewed information provided by LSA regarding its profits associated with managing the LS Fund. The Trustees also considered potential benefits for LSA in managing the LS Fund. The Trustees then compared the fees and expenses of the LS Fund (including the management fee) to other comparable mutual funds. The Trustees noted that the LS Fund’s management fee and net expense ratio were higher than the average and median of its Morningstar category, and higher than the average and median of its peer group. In this regard, the Trustees reflected upon their previous discussions with representatives of LSA, and commented on LSA’s assertion that the firm provided a premium product in comparison to other products to which they were compared in the marketplace. The Board concluded that the fees to be paid to LSA by the LS Fund and the profits to be realized by LSA, in light of all the facts and circumstances, were fair and reasonable in relation to the nature and quality of the services provided by LSA. |
| 4. | The extent to which economies of scale would be realized as the LS Fund grows and whether advisory fee levels reflect these economies of scale for the benefit of the LS Fund’s investors. In this regard, the Board considered the LS Fund’s fee arrangements with LSA. |
| Investment Advisory Agreement Renewal Approval (Unaudited) – continued |
The Board considered that while the management fee remained the same at all asset levels, the LS Fund’s shareholders had experienced benefits from the expense limitation arrangement. The Trustees noted that once the LS Fund’s expenses fell below the cap set by the arrangement, the shareholders would continue to benefit from the economies of scale under the LS Fund’s agreements with service providers other than LSA. In light of its ongoing consideration of the LS Fund’s asset levels, expectations for growth in the LS Fund, and fee levels, the Board determined that the LS Fund’s fee arrangements, in light of all the facts and circumstances, were fair and reasonable in relation to the nature and quality of the services provided by LSA.
| 5. | Possible conflicts of interest and benefits to LSA. In considering LSA’s practices regarding conflicts of interest, the Trustees evaluated the potential for conflicts of interest and considered such matters as the experience and ability of the advisory personnel assigned to the LS Fund; and the substance and administration of LSA’s code of ethics. The Trustees also considered disclosure in the registration statement of the Trust relating to LSA’s potential conflicts of interest. The Trustees noted that LSA identified no other potential benefits (in addition to the management fee) to LSA. Based on the foregoing, the Board determined that LSA’s standards and practices relating to the identification and mitigation of potential conflicts of interest and the benefits to be realized by LSA in managing the LS Fund were satisfactory. |
After additional consideration of the relevant factors and further discussion among the Board members, the Board determined to approve the continuation of the LSA Agreement between the Trust and LSA.
| Investment Sub-Advisory Agreement Renewal Approval (Unaudited) |
At a meeting held on March 1-2. 2021, the Board of Trustees (the “Board”) considered the renewal of the Investment Sub-Advisory Agreement (the “Prospector Agreement”) between Long Short Advisors, LLC (“LSA”) and Prospector Partners, LLC (“Prospector”) with respect to the LS Opportunity Fund (the “LS Fund”). Prospector provided written information to the Board to assist the Board in its considerations.
Counsel reminded the Trustees of their fiduciary duties and responsibilities with respect to its consideration of the continuance of investment sub-advisory agreements, including the factors to be considered, and the application of those factors to Prospector and the Prospector Agreement. In assessing the factors and reaching its decision, the Board took into consideration information furnished by Prospector and the Trust’s other service providers for the Board’s review and consideration throughout the year, as well as information specifically prepared or presented in connection with the renewal process, including: (i) reports regarding the services and support provided to the LS Fund by Prospector; (ii) quarterly assessments of the investment performance of the LS Fund; (iii) commentary on the reasons for the performance; (iv) compliance and audit reports concerning the LS Fund and Prospector; (v) disclosure information contained in the registration statement of the Trust for the LS Fund and Prospector’s Form ADV; (vi) a memorandum from counsel, that summarized the
| Investment Sub-Advisory Agreement Renewal Approval (Unaudited) – continued |
fiduciary duties and responsibilities of the Board in reviewing and approving the Prospector Agreement. The Board also requested and received various informational materials including, without limitation: (a) documents containing information about Prospector, including its financial information; a description of its personnel and the services it provides to the LS Fund; information on Prospector’s investment advice and performance; summaries of the LS Fund’s expenses, compliance program, current legal matters, and other general information; (b) comparative expense and performance information for other mutual funds with strategies similar to the LS Fund; and (c) the benefits to be realized by Prospector from its relationship with the LS Fund. The Board did not identify any particular information that was most relevant to its consideration to approve the Prospector Agreement and each Trustee may have afforded different weight to the various factors.
| 1. | The nature, extent, and quality of the services to be provided by Prospector. In this regard, the Board considered Prospector’s responsibilities under the Prospector Agreement. The Board considered the services being provided by Prospector to the LS Fund, including without limitation: the quality of its investment sub-advisory services (including research and recommendations with respect to portfolio securities), and its process for formulating investment recommendations and assuring compliance with the LS Fund’s investment objectives and limitations. The Board considered Prospector’s continuity of, and commitment to retain, qualified personnel and Prospector’s commitment to maintain its resources and systems. The Board considered Prospector’s personnel, including the education and experience of the personnel and Prospector’s compliance program, policies and procedures. The Board considered the arrangements between LSA and Prospector pursuant to which Prospector has an on-going arrangement with respect to the Fund in which it would agree to waive, to a degree, a portion of its sub-advisory fees and commit to an exclusivity arrangement between itself and LSA with respect to managing other mutual funds with similar objectives. After considering the foregoing information and further information in the Meeting materials provided by Prospector (including its Form ADV), the Board concluded that, in light of all the facts and circumstances, the nature, extent, and quality of the services provided by Prospector were satisfactory and adequate for the LS Fund. |
| 2. | Investment Performance of the LS Fund and Prospector. In considering the investment performance of the LS Fund and Prospector, the Trustees considered the consistency of Prospector’s management of the LS Fund with the LS Fund’s investment objective, strategies, and limitations. The Trustees also compared the performance of the LS Fund with the performance of its Morningstar category. The Trustees focused on the performance since Prospector assumed its role as sub-adviser on May 28, 2015. They noted that the LS Fund’s performance was below the average but above the median of the category for the one-year period ended December 31, 2020, and above both the average and median for the three-year and five-year periods. As compared to its custom peer group, the Trustees observed that the performance of the LS Fund was below the median for the one-year period and above the median for the three-year and five-year periods. The Trustees also observed that the LS Fund had underperformed as compared to its style-specific benchmark for the one-year period ended December 31, 2020, but |
| Investment Sub-Advisory Agreement Renewal Approval (Unaudited) – continued |
had outperformed its style-specific benchmark for the one-month, three-month, three-year, and five-year periods. They also noted that the LS Fund had outperformed the style-specific benchmark for the period since Prospector began managing the portfolio. With respect to its broad-based benchmark, the Trustees noted that the LS Fund had underperformed for all periods considered. After reviewing and discussing the investment performance of the LS Fund further, Prospector’s experience sub-advising the LS Fund, the LS Fund’s performance since Prospector began managing the portfolio, and other relevant factors, the Board concluded, in light of all the facts and circumstances, that the investment performance of the LS Fund and Prospector was satisfactory.
| 3. | The costs of the services to be provided and profits to be realized by Prospector from the relationship with the LS Fund. In this regard, the Board considered: (1) Prospector’s financial condition; (2) asset levels of the LS Fund; (3) the overall expenses of the LS Fund; and (4) the nature and frequency of sub-advisory fee payments. The Trustees reviewed information provided by Prospector regarding its profits associated with managing the LS Fund. The Board also considered potential benefits for Prospector in managing the Fund. The Board compared the fees and expenses of the Fund (including the sub-advisory fee) to other private fund accounts managed by Prospector, and determined that the fee arrangements were relatively comparable in light of the differing structures. Following this comparison and upon further consideration and discussion of the foregoing, the Board concluded that the fees to be paid to Prospector by LSA and the profits to be realized by Prospector, in light of all the facts and circumstances, were fair and reasonable in relation to the nature and quality of the services provided by Prospector. |
| 4. | The extent to which economies of scale would be realized as the Fund grows and whether advisory fee levels reflect these economies of scale for the benefit of the LS Fund’s investors. In this regard, the Board considered the Fund’s fee arrangements with Prospector. The Board considered that while the sub-advisory fee changed with changes in the Fund’s assets, the Fund’s shareholders did not realize any changes in their overall expenses as Prospector’s fee was paid entirely from the advisory fee paid to LSA, which was fixed. The Board considered the sub-advisory fees in light of the overall arrangement with the Fund’s investment adviser. In light of the foregoing, the Board determined that the LS Fund’s fee arrangements for Prospector, in light of all the facts and circumstances, were fair and reasonable in relation to the nature and quality of the services provided by Prospector. |
| 5. | Possible conflicts of interest and benefits to Prospector. In evaluating Prospector’s practices regarding conflicts of interest, the Trustees evaluated the potential for conflicts of interest and considered such matters as the experience and ability of the advisory personnel assigned to the LS Fund; the basis of decisions to buy or sell securities for the LS Fund and/or Prospector’s other accounts; the substance and administration of Prospector’s code of ethics and other relevant policies described in Prospector’s Form ADV, and affiliations and associations of Prospector and its principals. The Board concluded that the foregoing matters were appropriately disclosed and managed by Prospector. With respect to benefits to Prospector (in addition to the fees under the Prospector Agreement), the Board noted that Prospector would benefit from its relationship with the LS Fund as the LS Fund |
| Investment Sub-Advisory Agreement Renewal Approval (Unaudited) – continued |
would provide a more diversified investor base and an alternative vehicle in which to place clients with initial investments below the minimum for its private funds. Following further consideration and discussion, the Board determined that Prospector’s standards and practices relating to the identification and mitigation of potential conflicts of interest were satisfactory and the benefits to be realized by Prospector from managing the LS Fund were satisfactory.
After additional consideration of the relevant factors and further discussion among the Board members, the Board determined to approve the continuation of the Prospector Agreement between LSA and Prospector.
| Trustees and Officers (Unaudited) |
The Board of Trustees supervises the business activities of the Trust. Each Trustee serves as a trustee until termination of the Trust unless the Trustee dies, resigns, retires or is removed.
The following table provides information regarding each of the Independent Trustees.
Name, Address*, (Age),
Position with Trust**,
Term of Position with Trust | | Principal Occupation During Past 5 Years
and Other Directorships | | Other Directorships |
Andrea N. Mullins, (54)
Independent Trustee
Since December 2013
Chairperson
since March 2017 | | Current: Private investor; Independent Contractor, SWM Advisors (since April 2014). | | Trustee, Angel Oak Funds Trust (since February 2019) (5 portfolios); Trustee, Angel Oak Strategic Credit Fund (since February 2019) Trustee, Angel Oak Financial Strategies Income Term Trust (since May 2019); Trustee, Angel Oak Dynamic Financial Strategies Income Term Trust (since June 2020). |
Ira P. Cohen, (62)
Independent Trustee
Since June 2010 | | Current: Independent financial services consultant (since February 2005); Executive Vice President of Asset Management Services, Recognos Financial (since August 2015). | | Trustee and Audit Committee Chairman, Griffin Institutional Access Credit Fund (since January 2017); Trustee and Audit Committee Chairman, Griffin Institutional Real Estate Access Fund (since May 2014); Trustee, Angel Oak Funds Trust (since October 2014) (5 portfolios) Trustee, Chairman, and Nominating and Governance Committee Chairman, Angel Oak Strategic Credit Fund (since December 2017) Trustee and Chairman, Angel Oak Financial Strategies Income Term Trust (since May 2019); Trustee, Angel Oak Dynamic Financial Strategies Income Term Trust (since June 2020). |
| * | The address for each Trustee is 225 Pictoria Drive, Suite 450, Cincinnati, Ohio 45246. |
| ** | As of the date of this report, the Trust consists of 13 series. |
| Trustees and Officers (Unaudited) - continued |
The following table provides information regarding the Trustee who is considered an “interested person” of the Trust, as that term is defined under the 1940 Act. Based on the experience of the Trustee, the Trust concluded that the individual described below should serve as a Trustee.
Name, Address*, (Age),
Position with Trust**,
Term of Position with Trust | | Principal Occupation During Past 5 Years
and Other Directorships | | Other Directorships |
Mark J. Seger***, (59)
Trustee
Since March 2017 | | Current: Vice Chairman and Co-Founder, Ultimus Fund Solutions, LLC and its subsidiaries (since 1999). | | None. |
| * | The address for each Trustee is 225 Pictoria Drive, Suite 450, Cincinnati, Ohio 45246. |
| ** | As of the date of this report, the Trust consists of 13 series. |
| *** | Mr. Seger is considered an “interested person” of the Trust because of his relationship with the Trust’s administrator, transfer agent, and distributor. |
The following table provides information regarding the Officers of the Trust:
Name, Address*, (Age),
Position with Trust**,
Term of Position with Trust | | Principal Occupation During Past 5 Years | | Other Directorships |
Adam T. Kornegay, (36)
Principal Executive Officer
and President
Since April 2018 | | Current: Vice President, Business Development Director, Ultimus Fund Solutions, LLC (since March 2015). | | None. |
Gregory T. Knoth, (51)
Principal Financial Officer
and Treasurer
Since April 2019 | | Current:Senior Vice President, Mutual Fund Controller, Ultimus Fund Solutions, LLC (since January 2016). | | None. |
Kevin J. Patton, (51)
Chief Compliance Officer
Since March 2020 | | Current: Assistant Vice President, Compliance Officer, Ultimus Fund Solutions, LLC (since January 2020). Previous:Partner and Chief Compliance Officer, Renaissance Investment Management (August 2005 to January 2020). | | None. |
Carol J. Highsmith,(56)
Vice President
Since August 2008
Secretary
Since March 2014 | | Current: Vice President, Ultimus Fund Solutions, LLC (since December 2015). | | None. |
Trustees and Officers (Unaudited) - continued
Name, Address*, (Age),
Position with Trust**,
Term of Position with Trust | | Principal Occupation During Past 5 Years | | Other Directorships |
Matt J. Miller,(45)
Vice President
Since December 2011 | | Current: Assistant Vice President, Relationship Management, Ultimus Fund Solutions, LLC (since December 2015). | | None. |
Stephen L. Preston,(54)
AML Officer
Since June 2017 | | Current: Chief Compliance Officer, Ultimus Fund Distributors, LLC (since June 2011). Previous:Chief Compliance Officer, Ultimus Fund Solutions, LLC (June 2011 to August 2019); Chief Compliance Officer, Unified Financial Securities, LLC (April 2018 to December 2019). | | None. |
| * | The address for each Officer is 225 Pictoria Drive, Suite 450, Cincinnati, Ohio 45246. |
| ** | As of the date of this report, the Trust consists of 13 series. |
| FACTS | WHAT DOES LS OPPORTUNITY FUND (THE “FUND”) DO WITH YOUR PERSONAL INFORMATION? |
| |
| Why? | Financial companies choose how they share your personal information. Federal law gives consumers the right to limit some but not all sharing. Federal law also requires us to tell you how we collect, share, and protect your personal information. Please read this notice carefully to understand what we do. |
| |
| What? | The types of personal information we collect and share depend on the product or service you have with us. This information can include: ■ Social Security number ■ account balances and account transactions ■ transaction or loss history and purchase history ■ checking account information and wire transfer instructions When you are no longer our customer, we continue to share your information as described in this notice. |
| |
| How? | All financial companies need to share customers’ personal information to run their everyday business. In the section below, we list the reasons financial companies can share their customers’ personal information; the reasons the Fund chooses to share; and whether you can limit this sharing. |
| |
| Reasons we can share your personal information | Does the Fund
share? |
For our everyday business purposes — such as to process your transactions, maintain your account(s), respond to court orders and legal investigations, or report to credit bureaus | Yes |
For our marketing purposes — to offer our products and services to you | No |
| For joint marketing with other financial companies | No |
For our affiliates’ everyday business purposes – information about your transactions and experiences | No |
For our affiliates’ everyday business purposes – information about your creditworthiness | No |
| For nonaffiliates to market to you | No |
| | | |
| Questions? | Call (877) 336-6763 |
| Who we are |
| Who is providing this notice? | LS Opportunity Fund Ultimus Fund Distributors, LLC (Distributor) Ultimus Fund Solutions, LLC (Administrator) |
| What we do |
How does the Fund protect my
personal information? | To protect your personal information from unauthorized access and use, we use security measures that comply with federal law. These measures include computer safeguards and secured files and buildings. Our service providers are held accountable for adhering to strict policies and procedures to prevent any misuse of your nonpublic personal information. |
How does the Fund collect my
personal information? | We collect your personal information, for example, when you ■ open an account or deposit money ■ buy securities from us or sell securities to us ■ make deposits or withdrawals from your account ■ give us your account information ■ make a wire transfer ■ tell us who receives the money ■ tell us where to send the money ■ show your government-issued ID ■ show your driver’s license |
| Why can’t I limit all sharing? | Federal law gives you the right to limit only ■ sharing for affiliates’ everyday business purposes — information about your creditworthiness ■ affiliates from using your information to market to you ■ sharing for nonaffiliates to market to you State laws and individual companies may give you additional rights to limit sharing. |
| Definitions |
| Affiliates | Companies related by common ownership or control. They can be financial and nonfinancial companies. ■ Long Short Advisors, LLC, the investment adviser to the Fund, could be deemed to be an affiliate. |
| Nonaffiliates | Companies not related by common ownership or control. They can be financial and nonfinancial companies. ■ The Fund does not share your personal information with nonaffiliates so they can market to you. |
| Joint marketing | A formal agreement between nonaffiliated financial companies that together market financial products or services to you. ■ The Fund doesn’t jointly market. |
| OTHER INFORMATION (Unaudited) |
The Fund’s Statement of Additional Information (“SAI”) includes additional information about the trustees and is available without charge, upon request. You may call toll-free at (877) 336-6763 to request a copy of the SAI or to make shareholder inquiries.
A description of the policies and procedures that the Fund uses to determine how to vote proxies relating to portfolio securities and information regarding how the Fund voted those proxies during the most recent twelve month period ended June 30, are available (1) without charge upon request by calling the Fund at (877) 336-6763 and (2) in Fund documents filed with the Securities and Exchange Commission (“SEC”) on the SEC’s website at www.sec.gov.
TRUSTEES Andrea N. Mullins, Chairperson Ira P. Cohen Mark J. Seger OFFICERS Adam T. Kornegay, Principal Executive Officer and President Gregory T. Knoth, Principal Financial Officer and Treasurer Kevin J. Patton, Chief Compliance Officer Carol J. Highsmith, Vice President and Secretary INVESTMENT ADVISER Long Short Advisors, LLC 1818 Market Street, 33rd Floor, Suite 3323 Philadelphia, PA 19103 DISTRIBUTOR Ultimus Fund Distributors, LLC 225 Pictoria Drive, Suite 450 Cincinnati, OH 45246 | | INDEPENDENT REGISTERED PUBLIC ACCOUNTING FIRM Cohen & Company, Ltd. 1350 Euclid Avenue, Suite 800 Cleveland, OH 44115 LEGAL COUNSEL Troutman Pepper Hamilton Sanders LLP 3000 Two Logan Square 18th and Arch Streets Philadelphia, PA 19103 CUSTODIAN U.S. Bank, N.A. 425 Walnut Street Cincinnati, OH 45202 ADMINISTRATOR, TRANSFER AGENT AND FUND ACCOUNTANT Ultimus Fund Solutions, LLC 225 Pictoria Drive, Suite 450 Cincinnati, OH 45246 |
This report is intended only for the information of shareholders or those who have received the Fund’s prospectus which contains information about the Fund’s management fee and expenses. Please read the prospectus carefully before investing.
Distributed by Ultimus Fund Distributors, LLC
Member FINRA/SIPC
LS-AR-21
(b) Not Applicable
Item 2. Code of Ethics.
As of the end of the period covered by this report, the registrant has adopted a code of ethics that applies to the registrant's principal executive officer, principal financial officer, principal accounting officer or controller, or persons performing similar functions, regardless of whether these individuals are employed by the registrant or a third party. Pursuant to Item 13(a)(1), a copy of registrant’s code of ethics is filed as an exhibit to this Form N-CSR. During the period covered by this report, the code of ethics has not been amended, and the registrant has not granted any waivers, including implicit waivers, from the provisions of the code of ethics.
Item 3. Audit Committee Financial Expert.
(a)(1) The registrant’s Board of Trustees has determined that the registrant has at least one audit committee financial expert serving on its audit committee.
(a)(2) The audit committee financial expert is Andrea N. Mullins, who is “independent” for purposes of this Item 3 of Form N-CSR.
Item 4. Principal Accountant Fees and Services.
LS Opportunity Fund: FY 2021 $14,500
FY 2020 $14,500
BFS Equity Fund: FY 2021 $13,500
FY 2020 $13,500
LS Opportunity Fund: FY 2021 $0
FY 2020 $0
BFS Equity Fund: FY 2021 $0
FY 2020 $0
LS Opportunity Fund: FY 2021 $3,000
FY 2020 $3,000
BFS Equity Fund: FY 2021 $3,000
FY 2020 $3,000
Nature of the fees: Preparation of the 1120 RIC and Excise review
LS Opportunity Fund: FY 2021 $0
FY 2020 $0
BFS Equity Fund: FY 2021 $0
FY 2020 $0
| (e) | (1) Audit Committee’s Pre-Approval Policies |
The Audit Committee Charter requires the Audit Committee to be responsible for the selection, retention or termination of auditors and, in connection therewith, to (i) evaluate the proposed fees and other compensation, if any, to be paid to the auditors, (ii) evaluate the independence of the auditors, (iii) pre-approve all audit services and, when appropriate, any non-audit services provided by the independent auditors to the Trust, (iv) pre-approve, when appropriate, any non-audit services provided by the independent auditors to the Trust's investment adviser, or any entity controlling, controlled by, or under common control with the investment adviser and that provides ongoing services to the Trust if the engagement relates directly to the operations and financial reporting of the Trust, and (v) receive the auditors’ specific representations as to their independence;
| (2) | All of the services described in paragraphs (b) through (d) of Item 4 were pre-approved by the Audit Committee. |
(f) During audit of registrant's financial statements for the most recent fiscal year, less than 50 percent of the hours expended on the principal accountant's engagement were attributed to work performed by persons other than the principal accountant's full-time, permanent employees.
(g) The aggregate non-audit fees billed by the registrant's accountant for services rendered to the registrant, and rendered to the registrant's investment adviser (not including any sub-adviser whose role is primarily portfolio management and is subcontracted with or overseen by another investment adviser), and any entity controlling, controlled by, or under common control with the adviser that provides ongoing services to the registrant:
Registrant Adviser
FY 2021 $ 6,000 $ 0
FY 2020 $ 6,000 $ 0
(h) Not applicable. The auditor performed no services for the registrant’s investment adviser or any entity controlling, controlled by, or under common control with the investment adviser that provides ongoing services to the registrant.
Item 5. Audit Committee of Listed Companies. NOT APPLICABLE – applies to listed companies only
Item 6. Schedule of Investments. Schedules filed with Item 1.
Item 7. Disclosure of Proxy Voting Policies and Procedures for Closed-End Management Investment Companies. NOT APPLICABLE – applies to closed-end funds only
Item 8. Portfolio Managers of Closed-End Investment Companies. NOT APPLICABLE – applies to closed-end funds only
Item 9. Purchases of Equity Securities by Closed-End Management Investment Company and Affiliated Purchasers. NOT APPLICABLE – applies to closed-end funds only
Item 10. Submission of Matters to a Vote of Security Holders.
The guidelines applicable to shareholders desiring to submit recommendations for nominees to the Registrant's board of trustees are contained in the statement of additional information of the Trust with respect to the Fund(s) for which this Form N-CSR is being filed.
Item 11. Controls and Procedures.
(a) Based on their evaluation of the registrant’s disclosure controls and procedures (as defined in Rule 30a-3(c) under the Investment Company Act of 1940, as amended (the “Act”)) as of a date within 90 days of the filing date of this report, the registrant’s principal executive officer and principal financial officer have concluded that such disclosure controls and procedures are reasonably designed and are operating effectively to ensure that material information relating to the registrant is made known to them by others within those entities, particularly during the period in which this report is being prepared, and that the information required in filings on Form N-CSR is recorded, processed, summarized, and reported on a timely basis.
(b) There were no changes in the registrant’s internal control over financial reporting (as defined in Rule 30a-3(d) under the Investment Company Act of 1940) that occurred during the period covered by this report that have materially affected, or are reasonably likely to materially affect, the registrant’s internal control over financial reporting.
Item 12. Disclosure of Securities Lending Activities for Closed-End Management Investment Companies. NOT APPLICABLE – applies to closed-end funds only
Item 13. Exhibits.
(a) (1) Code is filed herewith.
(3) Not Applicable
(b) Certification pursuant to 18 U.S.C. Section 1350, as adopted pursuant to Section 906 of the Sarbanes-Oxley Act of 2002 is filed herewith
Pursuant to the requirements of the Securities Exchange Act of 1934 and the Investment Company Act of 1940, the registrant has duly caused this report to be signed on its behalf by the undersigned, thereunto duly authorized.
(Registrant) Valued Advisers Trust
By /s/ Adam T. Kornegay
Adam T. Kornegay, President and Principal Executive Officer
Date 8/5/2021
Pursuant to the requirements of the Securities Exchange Act of 1934 and the Investment Company Act of 1940, this report has been signed below by the following persons on behalf of the registrant and in the capacities and on the dates indicated.
By /s/ Adam T. Kornegay
Adam T. Kornegay, President and Principal Executive Officer
Date 8/5/2021
By /s/ Gregory Knoth
Gregory Knoth, Treasurer and Principal Financial Officer
Date 8/5/2021