united states
securities and exchange commission
washington, d.c. 20549
form n-csr
certified shareholder report of registered management
investment companies
Investment Company Act file number 811-22208
Valued Advisers Trust
(Exact name of registrant as specified in charter)
Ultimus Fund Solutions, LLC 225 Pictoria Drive, Suite 450 Cincinnati, OH 45246
(Address of principal executive offices) (Zip code)
Ultimus Fund Solutions, LLC
Attn: Zachary Richmond
225 Pictoria Drive, Suite 450
Cincinnati, OH 45246
(Name and address of agent for service)
Registrant's telephone number, including area code: 513-587-3400
Date of fiscal year end: 5/31
Date of reporting period: 5/31/2022
Item 1. Reports to Stockholders.
(a)
BFS Equity Fund
ANNUAL REPORT
May 31, 2022

185 Asylum Street • City Place II • Hartford, CT 06103 • (855) 575-2430
BFS Equity Fund
Letter to Shareholders (Unaudited)
Dear Shareholders,
This annual report covers the period June 1, 2021 through May 31, 2022 – the BFS Equity Fund’s eighth full fiscal year.
The BFS Equity Fund (the “Fund”) was launched on November 8, 2013, with initial funds from investors of $1.1 million. On June 1, 2021, at the start of the Fund’s fiscal year, the Fund had net assets of $48.8 million. During the fiscal year, the net assets of the Fund declined modestly to $46.8 million due to the difficult market environment. As of May 31, 2022, there were approximately 731 investors in the Fund.
The Fund generated a net return of -4.71% for the fiscal year commencing June 1, 2021 and ending May 31, 2022. For the three-year period commencing June 1, 2019, and ending May 31, 2022, the Fund achieved an annualized total return of 10.92%; and for the five-year period commencing June 1, 2017, and ending May 31, 2022, the Fund achieved an annualized total return of 10.96%.
Given the very challenging investment environment and unsettled economic outlook, it is important to reiterate our belief that, now more than ever, our investment strategy of investing in quality growth and value stocks purchased with a risk-mitigating approach and positioned to provide a margin of safety in the case of economic or market weakness is effective over the longer term. We believe the Fund’s ownership of shares in quality companies with sound business models, strong brands, good balance sheets, professional management, and robust cash flow should be able to withstand market corrections, even bear markets, and perform well over the longer term.
This report includes an extensive commentary from the Lead Portfolio Manager, Rob Bradley, and Co-Portfolio Managers, Tom Sargent and Keith LaRose.
We thank you for the trust that you have placed in us to manage your assets. Sincerely,
Galan G. Daukas
President and CEO
Bradley, Foster & Sargent, Inc.
BFS Equity Fund
Portfolio Manager’s Letter (Unaudited)
May 31, 2022
The BFS Equity Fund (the “Fund”) celebrated its eighth anniversary last fall. As of the close of the Fund’s fiscal year on May 31, 2022, Fund assets were $46.8 million. The price per share of the Fund has grown from $10 at its inception to $18.52 on May 31, 2022 – a compound annual growth rate (including dividends paid) of 9.72%.
The performance of the Fund for the year ended May 31, 2022, was -4.71%, compared to the total return for the Dow Jones Industrial Average (“Dow Jones”) of -2.65% and the S&P 500 Index (“S&P 500”) of -0.30% for the period. In the six-month period ended May 31, 2022, the Fund returned -12.60% vs. the S&P 500’s total return of -8.85%.
For the three calendar years ending 2021, the Fund’s total cumulative return of 83.11% compared favorably with the total cumulative return of the Dow Jones of 66.34% during this period - an outperformance of 16.77%. However, the Fund underperformed the total cumulative return of 100.37% for the S&P 500 during this period due to the heavy weighting of the FAANG plus Microsoft stocks in the S&P 500. It is the goal of the Fund’s portfolio managers to overcome this underperformance vs the S&P 500 over the coming years
The long bull market that commenced in March 2009 came to an end during the first months of 2022. There were two main reasons that caused the stock market to roll over: the first was the expectation of higher interest rates to combat the highest level of inflation in the U.S. in 40 years; the second was Russia’s invasion of Ukraine in February 2022.
From its all-time intra-day high of 16,212.23 on November 22, 2021, the NASDAQ Composite dropped 31.9% to its intra-day low on May 20, 2022. The S&P 500 did not decline as much as the technology-laden NASDAQ Composite, but the S&P 500 dropped 20.9% from its all-time intra-day high of 4,818.62 to its intra-day low of 3,810.32 on May 20, 2022. Bear markets are generally defined as a 20% drop so investors experienced a bear market decline during this period.
INVESTMENT COMMENTARY
For the fiscal year ended May 31, 2022, the Fund’s total return was -4.71%. The most profitable sector by far was the Energy sector followed by the Health Care and Consumer Staples sectors. The sectors which were the major detractors in terms of absolute performance were the Consumer Discretionary, Communications and Materials sectors.
The stock that contributed most to absolute performance was Conoco Phillips (+107.5%). In the Consumer Staples sector, Costco contributed most (+32.2%). In the Health Care sector, the two stocks that contributed most positively to performance were United Health
BFS Equity Fund
Portfolio Manager’s Letter (Unaudited) (continued)
May 31, 2022
Group (21.4%) and Thermo Fisher Scientific (21.1%). In the Technology sector, Apple was up 20.2%
The key detractors from the absolute performance of the Fund were the following: FedEx (-35.8%), Agnico Eagle Mines (-32.7%), Amazon (-25.4%), and Qualcomm (-21.3%).
Regarding relative performance, the Fund’s total return for the year was -4.71%, below the S&P 500’s total return of -0.30%. The main reason for this underperformance was security selection in the Materials (Agnico Eagle), Industrial (FedEx), and Information Technology (Qualcomm) sectors. Positive security selection in the Consumer Staples (Costco) and Energy (Conoco Phillips) sectors helped to mitigate the underperformance.
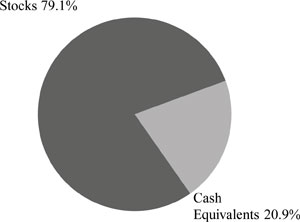
As discussed in the paragraphs below in the Stock Market Outlook section, the Federal Reserve’s steps to curb inflation have resulted in a steep upward trajectory in the path of interest rates. This has caused a contraction in the valuation of most stocks. The greatest sell-off has occurred thus far in 2022 in stocks of growth companies with rapid revenue growth but negative cash flow. Value stocks have declined less than growth stocks, but both have been affected by this revaluation. The Fund owns both value stocks and growth stocks. Based upon the statements of the Federal Reserve this year that they intend to raise interest rates throughout 2022, the Fund has accumulated significant cash reserves (which include short-term U.S. Treasury bills) which, as of May 31, 2022, represented 20.9% of the market value of the Fund.
Our largest five equity positions at the end of the fiscal year are in this order: Conoco Phillips, Microsoft, Alphabet, Apple, and United Health Group, which accounted for 25.1% of the overall portfolio. Our top ten holdings are responsible for roughly 40% of our total portfolio of thirty-six stocks.
STOCK MARKET OUTLOOK
At its January 2022 meeting, the Federal Reserve announced that the Fed Funds rate would be increased at its March meeting. With the Federal Reserve well behind the curve in dealing with an inflation rate of approximately 8%, investors understood that the increase in the Fed Funds rate in March would likely be the first in a series of interest rate hikes throughout 2022. Additionally, the Federal Reserve announced that the bank would curtail its quantitative easing policy, reducing its holdings of U.S. Treasury bonds and mortgage-backed securities. Since the beginning of 2022, the yield on the bellwether 10-year U.S. Treasury has increased almost 100% from 1.6% to 3.0%, as this letter goes to press. Many analysts believe that the yield on the 10-year U.S. Treasury will rise to 4% or more by the end of the year.
BFS Equity Fund
Portfolio Manager’s Letter (Unaudited) (continued)
May 31, 2022
The upward trajectory of interest rates is the primary reason for the stock market’s decline thus far in 2022. Higher interest rates not only result in falling bond prices but also cause a contraction in the valuation (Price/Earnings ratio) of the stock market. At the start of 2022, the P/E ratio on the forward operating earnings was approximately 21.5; at the end of May 2022, the P/E ratio had fallen to 18.0. If interest rates continue their steep upward climb, as the Federal Reserve seeks to bring inflation under control, the P/E ratio on the S&P 500 could fall to 16 or less, which would cause a further 10% or more drop in the market.
Investors are also worried that the Federal Reserve’s efforts to bring inflation down to the 2-3% level might cause a recession later this year or in 2023. Despite ample levels of liquidity and the likelihood of fiscal stimulus to the tune of a projected $1 trillion federal budget deficit for the fiscal year ending September 30, 2022, many analysts point to the serious recession in 1981-1982 caused by President Reagan’s and Federal Reserve Chairman Volker’s successful effort to break the back of inflation. Moreover, the U.S. highest gasoline prices on record will surely put a dent in the pocket of consumers in America. All the above has resulted in the lowest reading of consumer sentiment in the U.S. since 2011. Accordingly, we are cautious about the likely path of the stock market over the coming months.
INVESTMENT STRATEGY
In formulating our strategy for the Fund for the remainder of 2022, we remain cautious about the market’s trajectory, due to Federal Reserve need to get out in front of the highest level of inflation in 40 years. Realizing that it is currently behind the curve, the Federal Reserve will be not only raising the Fed Funds rate at future meetings but also shrinking its balance sheet through QT (Quantitative Tightening), reducing the financial assets it holds on its balance sheet by selling them into the financial markets or letting them mature without rolling them over. These may well cause a further contraction in the valuation of the stock market and even induce a recession as discussed above.
Accordingly, our strategy for the Fund is to continue to own what we consider to be world-class companies with strong cash flow, good margins, robust earnings growth, and strong balance sheets. We plan for the foreseeable future to remain overweight in the Energy and Materials sectors as a hedge against inflation. We also intend to own a combination of core/value stocks as well as growth stocks. Finally, we plan to continue to hold substantial dry powder in cash reserves and T-bills, as we observe the rise in interest rates, and its consequences, as the Federal Reserve deals with inflation. Although this current downturn in the stock market with high levels of volatility is painful, we look forward to the time when high quality stocks can be bought at bargain prices.
BFS Equity Fund
Portfolio Manager’s Letter (Unaudited) (continued)
May 31, 2022
CONCLUSION
We, the portfolio managers at Bradley, Foster & Sargent, Inc., are also shareholders of the BFS Equity Fund. We look forward to continuing to serve you through our management of the Fund. Thank you for placing your capital under our care.
| Robert Bradley | Keith LaRose | Thomas Sargent |
| Lead Portfolio Manager | Co-Portfolio Manager | Co-Portfolio Manager |
BFS Equity Fund
Performance Review (Unaudited)
The Fund returned -4.71% for the twelve-month period commencing June 1, 2021 and ending May 31, 2022, underperforming the S&P 500, which returned -0.30% and the Dow Jones, which returned -2.65% over the same period.
Key Detractors from Relative Results
| 1. | The Fund was significantly overweight the Materials sector relative to S&P 500 sector weighting, and the Materials sector of the Fund was down -24.36% for the year. This was the Fund’s worst performing sector relatively with its positions in Agnico Eagle, Freeport McMoRan and Ecolab. |
| 2. | The Fund’s positions in Amazon, D.R. Horton, and Dick’s Sporting Goods detracted from the Fund’s performance in the Consumer Discretionary sector relative to the corresponding sector in the S&P 500. |
| 3. | The Fund’s positions in Qualcomm, Nvidia and Palo Alto caused the Fund’s underperformance in the Technology sector relative to the corresponding sector in the S&P 500. |
Key Contributors to Relative Results
| 1. | The Fund was overweight in the Energy sector, and its position in ConocoPhillips (+107.5%) helped the Fund’s Energy sector significantly outperform the corresponding sector in the S&P 500. The Fund’s position in ConocoPhillips contributed over $1.4 million in unrealized gains in the Fund for the period. |
| 2. | The Fund’s Consumer Staples sector returned 13.22% – ahead of the S&P 500 sector’s return of 9.19%. Costco and Pepsi were the leaders in this sector with returns for the period of 32.2% and 16.5%. |
FUND INFORMATION
May 31, 2022
ASSET ALLOCATION
(as a percentage of net assets)
| TEN LARGEST HOLDINGS (%) | | | | FUND |
| ConocoPhillips | | | | 6.0 |
| Microsoft | | | | 5.2 |
| Alphabet | | | | 4.9 |
| Apple | | | | 4.8 |
| UnitedHealth Group | | | | 4.3 |
| Amazon | | | | 3.6 |
| Raytheon | | | | 3.0 |
| Thermo Fisher Scientific | | | | 3.0 |
| Home Depot | | | | 2.6 |
| Sherwin-Williams | | | | 2.6 |
| | | | | |
| SECTOR | | | | |
| DIVERSIFICATION (%) | | FUND | | S&P 500 |
| Technology | | 16.8 | | 27.1 |
| Healthcare | | 16.0 | | 14.4 |
| Consumer Discretionary | | 9.5 | | 10.9 |
| Financials | | 7.4 | | 11.2 |
| Communication Services | | 7.4 | | 8.8 |
| Industrials | | 6.0 | | 7.8 |
| Energy | | 6.0 | | 4.8 |
| Consumer Staples | | 5.0 | | 6.5 |
| Materials | | 5.0 | | 2.8 |
| Utilities | | 0.0 | | 3.0 |
| Real Estate | | 0.0 | | 2.7 |
| Cash Equivalents | | 20.9 | | 0.0 |
BFS Equity Fund
Performance Review (Unaudited) (continued)
Availability of Portfolio Schedules
The Fund files its complete schedule of portfolio holdings with the Securities and Exchange Commission (“SEC”) for the first and third quarters of each fiscal year as an exhibit to its reports on Form N-PORT. The Fund’s Form N-PORT reports are available on the SEC’s website at http://www. sec.gov and on the Fund’s website at www.bfsfunds.com.
Investment Results (Unaudited)
Average Annual Total Returns* as of May 31, 2022
| | | | | | | Since Inception |
| | | One Year | | Five Year | | (November 8, 2013) |
| BFS Equity Fund | | (4.71)% | | 10.96% | | 9.72% |
| S&P 500® Index(a) | | (0.30)% | | 13.38% | | 12.55% |
| Dow Jones Industrial Average(b) | | (2.65)% | | 11.87% | | 11.58% |
Total annual fund operating expenses, as disclosed in the BFS Equity Fund’s (the “Fund”) prospectus dated September 28, 2021 were 1.46% of average daily net assets (1.25% after fee waivers/expense reimbursements by Bradley, Foster & Sargent, Inc. (the “Adviser”)). The Adviser has contractually agreed to waive or limit its fees and to assume other expenses of the Fund until September 30, 2022, so that Total Annual Fund Operating Expenses does not exceed 1.00%. This contractual arrangement may only be terminated by mutual consent of the Adviser and the Board of Trustees of the Valued Advisers Trust (the “Trust”), and it will automatically terminate upon the termination of the investment advisory agreement between the Trust and the Adviser. This operating expense limitation does not apply to: (i) interest, (ii) taxes, (iii) brokerage commissions, (iv) other expenditures which are capitalized in accordance with generally accepted accounting principles, (v) other extraordinary expenses not incurred in the ordinary course of the Fund’s business, (vi) dividend expense on short sales, (vii) expenses incurred under a plan of distribution under Rule 12b-1, and (viii) expenses that the Fund has incurred but did not actually pay because of an expense offset or brokerage/service arrangements, if applicable, in any fiscal year. The operating expense limitation also excludes any “Acquired Fund Fees and Expenses,” which are the expenses indirectly incurred by the Fund as a result of investing in money market funds or other investment companies, including exchange-traded funds, that have their own expenses. Each waiver or reimbursement of an expense by the Adviser is subject to repayment by the Fund within the three years following the date of such waiver or reimbursement, provided that the Fund is able to make the repayment without exceeding the expense limitation in place at the time of the waiver or reimbursement and the expense limitation in place at the time of the repayment.
The performance quoted represents past performance, which does not guarantee future results. The investment return and principal value of an investment will fluctuate so that an investor’s shares, when redeemed, may be worth more or less than their original cost. The returns shown do not reflect deduction of taxes that a shareholder would pay on Fund distributions or the redemption of Fund shares. The Fund’s investment objectives, risks, charges and expenses must be considered carefully before investing. Current performance of the Fund may be lower or higher than the performance quoted. Performance data current to the most recent month end may be obtained by calling (855) 575-2430.
| * | Average annual total returns reflect any change in price per share and assume the reinvestment of all distributions. The Fund’s returns reflect any fee reductions during the applicable periods. If such fee reductions had not occurred, the quoted performance would have been lower. |
| (a) | The S&P 500® Index is a widely recognized unmanaged index of equity prices and is representative of a broader market and range of securities than is found in the Fund’s portfolio. The index is an unmanaged benchmark that assumes reinvestment of all distributions and excludes the effect of taxes and fees. Individuals cannot invest directly in this index; however, an individual can invest in exchange-traded funds or other investment vehicles that attempt to track the performance of a benchmark index. |
Investment Results (Unaudited) (continued)
| (b) | The Dow Jones Industrial Average® is a widely recognized unmanaged index of equity prices and is representative of a narrower market and range of securities than is found in the Fund’s portfolio. The index is an unmanaged benchmark that assumes reinvestment of all distributions and excludes the effect of taxes and fees. Individuals cannot invest directly in this index; however, an individual can invest in exchange-traded funds or other investment vehicles that attempt to track the performance of a benchmark index. |
The Fund’s investment objectives, strategies, risks, charges and expenses must be considered carefully before investing. The prospectus contains this and other important information about the Fund and may be obtained by calling (855) 575-2430. Please read it carefully before investing.
The Fund is distributed by Ultimus Fund Distributors, LLC, Member FINRA/SIPC.
Investment Results (Unaudited)
$10,000 Over 10 Years
Let’s say hypothetically that $10,000 was invested in the Fund, on November 8, 2013. The following chart shows how the value of your investment would have changed, and also shows how the S&P 500® Index and Dow Jones Industrial Average® performed over the same period.
Comparison of the Growth of a $10,000 Investment in the BFS Equity Fund, the S&P 500® Index, and the Dow Jones Industrial Average (Unaudited)
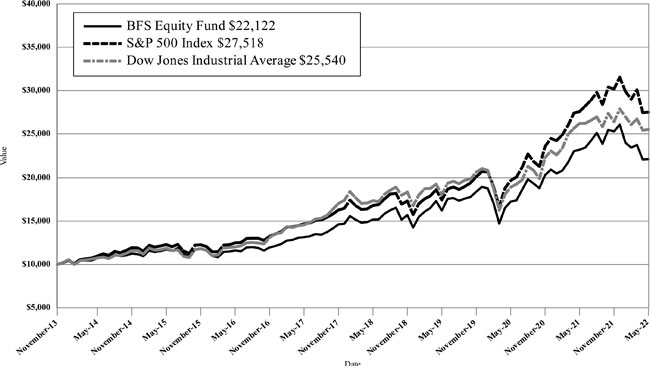
The chart above assumes an initial investment of $10,000 made on November 8, 2013 (commencement of operations) and held through May 31, 2022. THE FUND’S RETURN REPRESENTS PAST PERFORMANCE AND DOES NOT GUARANTEE FUTURE RESULTS. The returns shown do not reflect deduction of taxes that a shareholder would pay on Fund distributions or the redemption of Fund shares. Investment returns and principal values will fluctuate so that your shares, when redeemed, may be worth more or less than their original purchase price.
Current performance may be lower or higher than the performance data quoted. For more information on the Fund, and to obtain performance data current to the most recent month-end, or to request a prospectus, please call (855) 575-2430. You should carefully consider the investment objectives, potential risks, management fees, and charges and expenses of the Fund before investing. The Fund’s prospectus contains this and other information about the Fund, and should be read carefully before investing.
The Fund is distributed by Ultimus Fund Distributors, LLC, Member FINRA/SIPC.
| BFS Equity Fund |
| Schedule of Investments |
| May 31, 2022 |
| COMMON STOCKS — 79.08% | | Shares | | | Fair Value | |
| Aerospace & Defense — 5.05% | | | | | | | | |
| Northrop Grumman Corp. | | | 2,000 | | | $ | 935,940 | |
| Raytheon Technologies Corp. | | | 15,000 | | | | 1,426,800 | |
| | | | | | | | 2,362,740 | |
| Banking — 2.12% | | | | | | | | |
| JPMorgan Chase & Co. | | | 7,500 | | | | 991,725 | |
| | | | | | | | | |
| Beverages — 2.48% | | | | | | | | |
| Constellation Brands, Inc., Class A | | | 2,000 | | | | 490,940 | |
| PepsiCo, Inc. | | | 4,000 | | | | 671,000 | |
| | | | | | | | 1,161,940 | |
| Biotech & Pharmaceuticals — 3.86% | | | | | | | | |
| Bristol-Myers Squibb Co. | | | 10,000 | | | | 754,500 | |
| Johnson & Johnson | | | 3,000 | | | | 538,590 | |
| Zoetis, Inc., Class A | | | 3,000 | | | | 512,790 | |
| | | | | | | | 1,805,880 | |
| Cable & Satellite — 0.47% | | | | | | | | |
| Comcast Corp., Class A | | | 5,000 | | | | 221,400 | |
| | | | | | | | | |
| Chemicals — 3.28% | | | | | | | | |
| Ecolab, Inc. | | | 2,000 | | | | 327,820 | |
| Sherwin-Williams Co. (The) | | | 4,500 | | | | 1,206,180 | |
| | | | | | | | 1,534,000 | |
| E-Commerce Discretionary — 3.60% | | | | | | | | |
| Amazon.com, Inc.(a) | | | 700 | | | | 1,682,933 | |
| | | | | | | | | |
| Health Care Facilities & Services — 5.63% | | | | | | | | |
| IQVIA Holdings, Inc.(a) | | | 3,000 | | | | 645,750 | |
| UnitedHealth Group, Inc. | | | 4,000 | | | | 1,987,120 | |
| | | | | | | | 2,632,870 | |
| Home Construction — 0.80% | | | | | | | | |
| D.R. Horton, Inc. | | | 5,000 | | | | 375,750 | |
| | | | | | | | | |
| Institutional Financial Services — 1.68% | | | | | | | | |
| Goldman Sachs Group, Inc. (The) | | | 2,400 | | | | 784,440 | |
| | | | | | | | | |
| Insurance — 2.72% | | | | | | | | |
| Berkshire Hathaway, Inc., Class B(a) | | | 1,500 | | | | 473,970 | |
| Marsh & McLennan Cos., Inc. | | | 5,000 | | | | 799,750 | |
| | | | | | | | 1,273,720 | |
| Internet Media & Services — 6.94% | | | | | | | | |
| Alphabet, Inc., Class A(a) | | | 1,000 | | | | 2,275,240 | |
| Meta Platforms, Inc., Class A(a) | | | 5,000 | | | | 968,200 | |
| | | | | | | | 3,243,440 | |
| Medical Equipment & Devices — 6.55% | | | | | | | | |
| Danaher Corp. | | | 4,000 | | | | 1,055,280 | |
| Stryker Corp. | | | 2,500 | | | | 586,250 | |
| Thermo Fisher Scientific, Inc. | | | 2,500 | | | | 1,418,925 | |
| | | | | | | | 3,060,455 | |
| Metals & Mining — 1.70% | | | | | | | | |
| Agnico Eagle Mines Ltd. | | | 15,000 | | | | 793,950 | |
See accompanying notes which are an integral part of these financial statements.
| BFS Equity Fund |
| Schedule of Investments (continued) |
| May 31, 2022 |
| COMMON STOCKS — 79.08% - continued | | Shares | | | Fair Value | |
| Oil & Gas Producers — 6.01% | | | | | | | | |
| ConocoPhillips | | | 25,000 | | | $ | 2,809,000 | |
| | | | | | | | | |
| Retail - Consumer Staples — 2.50% | | | | | | | | |
| Costco Wholesale Corp. | | | 2,500 | | | | 1,165,550 | |
| | | | | | | | | |
| Retail - Discretionary — 5.10% | | | | | | | | |
| Home Depot, Inc. (The) | | | 4,000 | | | | 1,211,000 | |
| Lowe’s Cos., Inc. | | | 6,000 | | | | 1,171,800 | |
| | | | | | | | 2,382,800 | |
| Software — 8.23% | | | | | | | | |
| Adobe, Inc.(a) | | | 2,000 | | | | 832,960 | |
| Microsoft Corp. | | | 9,000 | | | | 2,446,830 | |
| SS&C Technologies Holdings, Inc. | | | 9,000 | | | | 575,910 | |
| | | | | | | | 3,855,700 | |
| Specialty Finance — 0.90% | | | | | | | | |
| American Express Co. | | | 2,500 | | | | 422,050 | |
| | | | | | | | | |
| Technology Hardware — 4.77% | | | | | | | | |
| Apple, Inc. | | | 15,000 | | | | 2,232,600 | |
| | | | | | | | | |
| Technology Services — 3.73% | | | | | | | | |
| Automatic Data Processing, Inc. | | | 3,000 | | | | 668,820 | |
| MasterCard, Inc., Class A | | | 3,000 | | | | 1,073,610 | |
| | | | | | | | 1,742,430 | |
| Transportation & Logistics — 0.96% | | | | | | | | |
| FedEx Corp. | | | 2,000 | | | | 449,160 | |
| | | | | | | | | |
| Total Common Stocks (Cost $20,915,013) | | | | | | | 36,984,533 | |
| | | | | | | | | |
| | | Principal | | | | |
| U.S. GOVERNMENT & AGENCIES — 10.64% | | Amount | | | | |
| United States Treasury Bill, 0.84%, 8/4/2022(b) | | $ | 2,000,000 | | | | 1,996,557 | |
| United States Treasury Bill, 1.40%, 11/10/2022(b) | | | 3,000,000 | | | | 2,980,682 | |
| Total U.S. Government & Agencies (Cost $4,978,305) | | | | | | | 4,977,239 | |
| | | | | | | | | |
| MONEY MARKET FUNDS - 9.26% | | Shares | | | | |
| Fidelity Investments Money Market Government Portfolio, Institutional Class, 0.64%(c) | | | 4,329,568 | | | | 4,329,568 | |
| Total Money Market Funds (Cost $4,329,568) | | | | | | | 4,329,568 | |
| | | | | | | | | |
| Total Investments — 98.98% (Cost $30,222,886) | | | | | | | 46,291,340 | |
| | | | | | | | | |
| Other Assets in Excess of Liabilities — 1.02% | | | | | | | 475,021 | |
| | | | | | | | | |
| NET ASSETS — 100.00% | | | | | | $ | 46,766,361 | |
| (a) | Non-income producing security. |
| (b) | Rate shown is the effective yield at time of purchase. |
| (c) | Rate disclosed is the seven day effective yield as of May 31, 2022. |
See accompanying notes which are an integral part of these financial statements.
| BFS Equity Fund |
| Statement of Assets and Liabilities |
| May 31, 2022 |
| Assets | | | |
| Investments in securities at fair value (cost $30,222,886) (Note 3) | | $ | 46,291,340 | |
| Receivable for investments sold | | | 492,821 | |
| Dividends receivable | | | 52,470 | |
| Prepaid expenses | | | 8,292 | |
| Total Assets | | | 46,844,923 | |
| Liabilities | | | | |
| Payable for fund shares redeemed | | | 1,000 | |
| Payable to Adviser (Note 4) | | | 22,587 | |
| Payable to Administrator (Note 4) | | | 6,926 | |
| Distribution (12b-1) fees accrued (Note 4) | | | 19,871 | |
| Other accrued expenses | | | 28,178 | |
| Total Liabilities | | | 78,562 | |
| Net Assets | | $ | 46,766,361 | |
| Net Assets consist of: | | | | |
| Paid-in capital | | $ | 30,287,311 | |
| Accumulated earnings | | | 16,479,050 | |
| Net Assets | | $ | 46,766,361 | |
| Shares outstanding (unlimited number of shares authorized, no par value) | | | 2,524,501 | |
| Net asset value, offering and redemption price per share (Note 2) | | $ | 18.52 | |
See accompanying notes which are an integral part of these financial statements
| BFS Equity Fund |
| Statement of Operations |
| For the year ended May 31, 2022 |
| Investment Income | | | |
| Dividend income (net of foreign taxes withheld of $2,961) | | $ | 569,162 | |
| Interest income | | | 3,239 | |
| Total investment income | | | 572,401 | |
| Expenses | | | | |
| Investment Adviser fees (Note 4) | | | 383,752 | |
| Distribution (12b-1) fees (Note 4) | | | 127,918 | |
| Administration and compliance services fees (Note 4) | | | 43,772 | |
| Registration expenses | | | 25,900 | |
| Fund accounting fees (Note 4) | | | 25,063 | |
| Legal fees | | | 19,819 | |
| Audit and tax preparation fees | | | 18,460 | |
| Transfer agent fees (Note 4) | | | 18,090 | |
| Printing and postage expenses | | | 13,078 | |
| Trustee fees | | | 6,137 | |
| Custodian fees | | | 4,731 | |
| Insurance expenses | | | 2,658 | |
| Interest expense | | | 91 | |
| Miscellaneous | | | 33,752 | |
| Total expenses | | | 723,221 | |
| Fees contractually waived by Adviser (Note 4) | | | (83,599 | ) |
| Net operating expenses | | | 639,622 | |
| Net investment loss | | | (67,221 | ) |
| Net Realized and Change in Unrealized Gain (Loss) on Investments | | | | |
| Net realized gain on: | | | | |
| Investment securities transactions | | | 1,088,978 | |
| Net change in unrealized depreciation on investments | | | (3,327,716 | ) |
| Net realized and change in unrealized loss on investments | | | (2,238,738 | ) |
| Net decrease in net assets resulting from operations | | $ | (2,305,959 | ) |
See accompanying notes which are an integral part of these financial statements.
| BFS Equity Fund |
| Statements of Changes in Net Assets |
| | | For the Year Ended For the Year Ended | |
| | | May 31, 2022 | | | May 31, 2021 | |
| Increase (Decrease) in Net Assets due to: | | | | | | | | |
| Operations | | | | | | | | |
| Net investment loss | | $ | (67,221 | ) | | $ | (50,601 | ) |
| Net realized gain on investment securities transactions | | | 1,088,978 | | | | 6,170,290 | |
| Net change in unrealized appreciation (depreciation) on investments | | | (3,327,716 | ) | | | 6,794,817 | |
| Net increase (decrease) in net assets resulting from operations | | | (2,305,959 | ) | | | 12,914,506 | |
| Distributions to Shareholders from Earnings (Note 2) | | | (4,932,792 | ) | | | (677,735 | ) |
| Capital Transactions | | | | | | | | |
| Proceeds from shares sold | | | 4,636,535 | | | | 3,372,117 | |
| Reinvestment of distributions | | | 3,969,021 | | | | 565,222 | |
| Amount paid for shares redeemed | | | (3,381,233 | ) | | | (6,257,021 | ) |
| Net increase (decrease) in net assets resulting from capital transactions | | | 5,224,323 | | | | (2,319,682 | ) |
| Total Increase (Decrease) in Net Assets | | | (2,014,428 | ) | | | 9,917,089 | |
| Net Assets | | | | | | | | |
| Beginning of year | | | 48,780,789 | | | | 38,863,700 | |
| End of year | | $ | 46,766,361 | | | $ | 48,780,789 | |
| Share Transactions | | | | | | | | |
| Shares sold | | | 212,101 | | | | 175,156 | |
| Shares issued in reinvestment of distributions | | | 186,866 | | | | 29,717 | |
| Shares redeemed | | | (158,072 | ) | | | (334,774 | ) |
| Net increase (decrease) in shares outstanding | | | 240,895 | | | | (129,901 | ) |
See accompanying notes which are an integral part of these financial statements.
| BFS Equity Fund |
| Financial Highlights |
| (For a share outstanding during each year) |
| | | For the Years Ended May 31, | |
| | | 2022 | | | 2021 | | | 2020 | | | 2019 | | | 2018 | |
| Selected Per Share Data: | | | | | | | | | | | | | | | |
| Net asset value, beginning of year | | $ | 21.36 | | | $ | 16.10 | | | $ | 15.40 | | | $ | 14.96 | | | $ | 13.01 | |
| Income from investment operations: | | | | | | | | | | | | | | | | | | | | |
| Net investment income (loss) | | | (0.03 | ) | | | (0.02 | ) | | | 0.03 | | | | 0.04 | | | | 0.04 | |
| Net realized and unrealized gain/(loss) on investments | | | (0.71 | ) | | | 5.57 | | | | 0.97 | | | | 0.90 | | | | 1.96 | |
| Total from investment operations | | | (0.74 | ) | | | 5.55 | | | | 1.00 | | | | 0.94 | | | | 2.00 | |
| Less distributions to shareholders from: | | | | | | | | | | | | | | | | | | | | |
| Net investment income | | | — | | | | — | | | | (0.03 | ) | | | (0.04 | ) | | | (0.04 | ) |
| Net realized gains | | | (2.10 | ) | | | (0.29 | ) | | | (0.27 | ) | | | (0.46 | ) | | | (0.01 | ) |
| Total distributions | | | (2.10 | ) | | | (0.29 | ) | | | (0.30 | ) | | | (0.50 | ) | | | (0.05 | ) |
| Net asset value, end of year | | $ | 18.52 | | | $ | 21.36 | | | $ | 16.10 | | | $ | 15.40 | | | $ | 14.96 | |
| Total Return(a) | | | (4.71 | )% | | | 34.68 | % | | | 6.32 | % | | | 6.84 | % | | | 15.36 | % |
| Ratios and Supplemental Data: | | | | | | | | | | | | | | | | | | | | |
| Net assets, end of year (000 omitted) | | $ | 46,766 | | | $ | 48,781 | | | $ | 38,864 | | | $ | 35,960 | | | $ | 31,750 | |
| Ratio of net expenses to average net assets | | | 1.25 | % | | | 1.25 | % | | | 1.25 | % | | | 1.25 | % | | | 1.25 | % |
| Ratio of expenses to average net assets before waiver and reimbursement | | | 1.41 | % | | | 1.46 | % | | | 1.52 | % | | | 1.57 | % | | | 1.65 | % |
| Ratio of net investment income (loss) to average net assets | | | (0.13 | )% | | | (0.12 | )% | | | 0.21 | % | | | 0.28 | % | | | 0.26 | % |
| Portfolio turnover rate | | | 61.08 | % | | | 68.77 | % | | | 49.27 | % | | | 38.71 | % | | | 38.17 | % |
| | | | | | | | | | | | | | | | | | | | | |
| (a) | Total return represents the rate that the investor would have earned or lost on an investment in the Fund, assuming reinvestment of distributions. |
See accompanying notes which are an integral part of these financial statements.
| BFS Equity Fund |
| Notes to the Financial Statements |
| May 31, 2022 |
NOTE 1. ORGANIZATION
The BFS Equity Fund (the “Fund”) is registered under the Investment Company Act of 1940, as amended (“1940 Act”), as an open-end diversified series of Valued Advisers Trust (the “Trust”) and commenced operations on November 8, 2013. The Trust is a management investment company established under the laws of Delaware by an Agreement and Declaration of Trust dated June 13, 2008 (the “Trust Agreement”). The Trust Agreement permits the Board of Trustees (the “Board” or the “Trustees”) to issue an unlimited number of shares of beneficial interest of separate series without par value. The Fund is one of a series of funds authorized by the Board. The Fund’s investment adviser is Bradley, Foster & Sargent, Inc. (the “Adviser”). The investment objective of the Fund is long-term appreciation through growth of principal and income.
NOTE 2. SIGNIFICANT ACCOUNTING POLICIES
The Fund is an investment company and follows accounting and reporting guidance under Financial Accounting Standards Board Accounting Standards Codification (“ASC”) Topic 946, “Financial Services-Investment Companies”, including Accounting Standards Update 2013-08. The following is a summary of significant accounting policies followed by the Fund in the preparation of its financial statements. These policies are in conformity with generally accepted accounting principles in the United States of America (“GAAP”).
Estimates – The preparation of financial statements in conformity with GAAP requires management to make estimates and assumptions that affect the reported amounts of assets and liabilities and disclosure of contingent assets and liabilities at the date of the financial statements and the reported amounts of increases and decreases in net assets from operations during the reporting period. Actual results could differ from those estimates.
Federal Income Taxes – The Fund makes no provision for federal income or excise tax. The Fund has qualified and intends to qualify each year as a regulated investment company (“RIC”) under subchapter M of the Internal Revenue Code of 1986, as amended, by complying with the requirements applicable to RICs and by distributing substantially all of its taxable income. The Fund also intends to distribute sufficient net investment income and net realized capital gains, if any, so that it will not be subject to excise tax on undistributed income and gains. If the required amount of net investment income or gains is not distributed, the Fund could incur a tax expense.
As of and during the fiscal year ended May 31, 2022, the Fund did not have any liabilities for any unrecognized tax benefits. The Fund recognizes interest and penalties, if any, related to unrecognized tax benefits as income tax expense on the Statement of Operations when incurred. During the fiscal year ended May 31, 2022, the Fund did not incur any interest or penalties. Management of the Fund has reviewed tax positions taken in tax years
| BFS Equity Fund |
| Notes to the Financial Statements (continued) |
| May 31, 2022 |
that remain subject to examination by all major tax jurisdictions, including federal (i.e., the last three tax year ends and the interim tax period since then, as applicable). Management believes that there is no tax liability resulting from unrecognized tax benefits related to uncertain tax positions taken.
Expenses – Expenses incurred by the Trust that do not relate to a specific fund of the Trust are allocated to the individual funds based on each fund’s relative net assets or another appropriate basis (as determined by the Board).
Security Transactions and Related Income – The Fund follows industry practice and records security transactions on the trade date for financial reporting purposes. For financial statement and income tax purposes, the specific identification method is used for determining capital gains or losses. Dividend income is recorded on the ex-dividend date and interest income is recorded on an accrual basis. Dividend income from real estate investment trusts (REITs) and distributions from limited partnerships are recognized on the ex-date. The calendar year end classification of distributions received from REITs during the fiscal year are reported subsequent to year end; accordingly, the Fund estimates the character of REIT distributions based on the most recent information available. Income or loss from Limited Partnerships is reclassified among the components of net assets upon receipt of Schedules K-1 (Form 1065). Non-cash income, if any, is recorded at the fair market value of the securities received. Withholding taxes on foreign dividends, if any, have been provided for in accordance with the Fund’s understanding of the applicable country’s tax rules and rates.
Foreign Currency Translation – The accounting records of the Fund are maintained in U.S. dollars. Foreign currency amounts are translated into U.S. dollars at the current rate of exchange each business day to determine the value of investments, and other assets and liabilities. Purchases and sales of foreign securities, and income and expenses, are translated at the prevailing rate of exchange on the respective date of these transactions. The Fund does not isolate that portion of the results of operations resulting from changes in foreign exchange rates on investments from fluctuation arising from changes in market prices of securities held. These fluctuations are included with the unrealized gain or loss from investments. Reported net realized foreign exchange gains or losses arise from sales of foreign currencies, currency gains or losses realized between the trade and settlement dates on securities transactions, and the difference between the amounts of dividends, interest, and foreign withholding taxes recorded on the Fund’s books and the U.S. dollar equivalent of the amounts actually received or paid. Net unrealized foreign exchange gains and losses arise from changes in the fair values of assets and liabilities, other than investments in securities at period end, resulting from changes in exchange rates.
| BFS Equity Fund |
| Notes to the Financial Statements (continued) |
| May 31, 2022 |
Dividends and Distributions – The Fund intends to distribute its net investment income and net realized long-term and short-term capital gains, if any, at least annually. Dividends and distributions to shareholders, which are determined in accordance with income tax regulations, are recorded on the ex-dividend date. The treatment for financial reporting purposes of distributions made to shareholders during the period from net investment income or net realized capital gains may differ from their ultimate treatment for federal income tax purposes. These differences are caused primarily by differences in the timing of the recognition of certain components of income, expense or realized capital gain for federal income tax purposes. Where such differences are permanent in nature, they are reclassified among the components of net assets based on their ultimate characterization for federal income tax purposes. Any such reclassifications will have no effect on net assets, results of operations or net asset value (“NAV”) per share of the Fund.
For the fiscal year ended May 31, 2022, the Fund made the following reclassifications to increase (decrease) the components of net assets:
| | | Accumulated Earnings |
| Paid-In Capital | | (Deficit) |
| $(27,972) | | $27,972 |
Share Valuation – The NAV is calculated each day the New York Stock Exchange (the “NYSE”) is open by dividing the total value of the Fund’s assets, less liabilities, by the number of shares outstanding for the Fund.
NOTE 3. SECURITIES VALUATION AND FAIR VALUE MEASUREMENTS
The Fund values its portfolio securities at fair value as of the close of regular trading on the NYSE (normally 4:00 p.m. Eastern time) on each business day the NYSE is open for business. Fair value is defined as the price that the Fund would receive upon selling an investment in a timely transaction to an independent buyer in the principal or most advantageous market of the investment. GAAP establishes a three-tier hierarchy to maximize the use of observable market data and minimize the use of unobservable inputs and to establish classification of fair value measurements for disclosure purposes.
Inputs refer broadly to the assumptions that market participants would use in pricing the asset or liability, including assumptions about risk (the risk inherent in a particular valuation technique used to measure fair value including a pricing model and/or the risk inherent in the inputs to the valuation technique). Inputs may be observable or unobservable. Observable inputs are inputs that reflect the assumptions market participants would use in pricing the asset or liability developed based on market data obtained and available from sources independent of the reporting entity. Unobservable inputs are inputs that reflect the reporting entity’s own assumptions about the assumptions market participants would use
| BFS Equity Fund |
| Notes to the Financial Statements (continued) |
| May 31, 2022 |
in pricing the asset or liability developed based on the best information available in the circumstances.
Various inputs are used in determining the value of the Fund’s investments. These inputs are summarized in the three broad levels listed below.
| ● | Level 1 – unadjusted quoted prices in active markets for identical investments and/or registered investment companies where the value per share is determined and published and is the basis for current transactions for identical assets or liabilities at the valuation date |
| ● | Level 2 – other significant observable inputs (including, but not limited to, quoted prices for an identical security in an inactive market, quoted prices for similar securities, interest rates, prepayment speeds, credit risk, etc.) |
| ● | Level 3 – significant unobservable inputs (including the Fund’s own assumptions in determining fair value of investments based on the best information available) |
The inputs used to measure fair value may fall into different levels of the fair value hierarchy. In such cases, for disclosure purposes, the level in the fair value hierarchy which is reported is determined based on the lowest level input that is significant to the fair value measurement in its entirety.
Equity securities that are traded on any stock exchange are generally valued at the last quoted sale price on the security’s primary exchange. Lacking a last sale price, an exchange-traded security is generally valued at its last bid price. Securities traded in the NASDAQ over-the-counter market are generally valued at the NASDAQ Official Closing Price. When using the market quotations and when the market is considered active, the security is classified as a Level 1 security. In the event that market quotations are not readily available or are considered unreliable due to market or other events, the Fund values its securities and other assets at fair value in accordance with policies established by and under the general supervision of the Board. Under these policies, the securities will be classified as Level 2 or 3 within the fair value hierarchy, depending on the inputs used.
Investments in mutual funds, including money market mutual funds, are generally priced at the ending NAV. These securities are categorized as Level 1 securities.
In accordance with the Trust’s valuation policies, the Adviser is required to consider all appropriate factors relevant to the value of securities for which it has determined other pricing sources are not available or reliable as described above. No single method exists for determining fair value, because fair value depends upon the circumstances of each individual case. As a general principle, the current fair value of a security being valued by the Adviser would be the amount that the Fund might reasonably expect to receive upon
| BFS Equity Fund |
| Notes to the Financial Statements (continued) |
| May 31, 2022 |
the current sale. Methods that are in accordance with this principle may, for example, be based on (i) a multiple of earnings; (ii) a discount from market prices of a similar freely traded security (including a derivative security or a basket of securities traded on other markets, exchanges or among dealers); or (iii) yield to maturity with respect to debt issues, or a combination of these and other methods. Fair-value pricing is permitted if, in the Adviser’s opinion, the validity of market quotations appears to be questionable based on factors such as evidence of a thin market in the security based on a small number of quotations, a significant event occurs after the close of a market but before the Fund’s NAV calculation that may affect a security’s value, or the Adviser is aware of any other data that calls into question the reliability of market quotations.
The following is a summary of the inputs used to value the Fund’s investments as of May 31, 2022:
| | | Valuation Inputs | |
| Assets | | Level 1 | | | Level 2 | | | Level 3 | | | Total | |
| Common Stocks (a) | | $ | 36,984,533 | | | $ | — | | | $ | — | | | $ | 36,984,533 | |
| U.S. Government & Agencies | | | — | | | | 4,977,239 | | | | — | | | | 4,977,239 | |
| Money Market Funds | | | 4,329,568 | | | | — | | | | — | | | | 4,329,568 | |
| Total | | $ | 41,314,101 | | | $ | 4,977,239 | | | $ | — | | | $ | 46,291,340 | |
| (a) | Refer to Schedule of Investments for industry classifications. |
The Fund did not hold any investments at the end of the reporting period for which significant unobservable inputs (Level 3) were used in determining fair value; therefore, no reconciliation of Level 3 securities is included for this reporting period.
NOTE 4. FEES AND OTHER TRANSACTIONS WITH AFFILIATES AND OTHER SERVICE PROVIDERS
Under the terms of the investment advisory agreement on behalf of the Fund, the Adviser manages the Fund’s investments subject to oversight of the Board. As compensation for its services, the Fund pays the Adviser a fee, computed and accrued daily and paid monthly, at an annual rate of 0.75% of the average daily net assets of the Fund. For the fiscal year ended May 31, 2022, the Adviser earned a fee of $383,752 from the Fund before the waivers described below. At May 31, 2022, the Fund owed the Adviser $22,587.
The Adviser has contractually agreed to waive or limit its management fee and/or reimburse certain operating expenses until September 30, 2022, but only to the extent necessary so that the Fund’s net expenses, excluding brokerage fees and commissions, borrowing costs (such as interest and dividend expenses on securities sold short), taxes, extraordinary expenses, fees and expenses paid under a distribution plan adopted pursuant to Rule 12b-1 fees and indirect expenses (such as “acquired funds fees and expenses”) do not exceed 1.00%.
| BFS Equity Fund |
| Notes to the Financial Statements (continued) |
| May 31, 2022 |
Each waiver or reimbursement of an expense by the Adviser is subject to repayment by the Fund within the three years following the date of such waiver or reimbursement, provided that the Fund is able to make the repayment without exceeding the expense limitation in place at the time of the waiver or reimbursement and the expense limitation in place at the time of the repayment. This contractual arrangement may only be terminated by mutual consent of the Adviser and the Board, and it will automatically terminate upon the termination of the investment advisory agreement between the Trust and the Adviser. For the fiscal year ended May 31, 2022, the Adviser waived fees of $83,599.
The amounts subject to repayment by the Fund, pursuant to the aforementioned conditions, are as follows:
| Recoverable Through |
| May 31, 2023 | | $ | 108,051 | |
| May 31, 2024 | | | 93,387 | |
| May 31, 2025 | | | 83,599 | |
The Trust retains Ultimus Fund Solutions, LLC (“Ultimus” or “Administrator”) to provide the Fund with administration, fund accounting, and transfer agent services, including all regulatory reporting. Prior to April 1, 2022, the Administrator also provided certain compliance services to the Fund. For the fiscal year ended May 31, 2022, the Administrator earned fees of $43,772 for administration and compliance services, $25,063 for fund accounting services and $18,090 for transfer agent services. At May 31, 2022, the Fund owed the Administrator $6,926 for such services.
Effective April 1, 2022, Northern Lights Compliance Services, LLC (“NLCS”), an affiliate of Ultimus, provides a Chief Compliance Officer to the Trust, as well as related compliance services, pursuant to a consulting agreement between NLCS and the Trust. Under the terms of such agreement, NLCS receives fees from the Fund.
The officers and one trustee of the Trust are members of management and/or employees of the Administrator or of NLCS, and are not paid by the Trust for services to the Fund. Ultimus Fund Distributors, LLC (the “Distributor”) acts as the distributor of the Fund’s shares. The Distributor is a wholly-owned subsidiary of Ultimus. There were no payments made to the Distributor by the Fund for the fiscal year ended May 31, 2022.
The Fund has adopted a Distribution Plan (the “Plan”) pursuant to Rule 12b-1 under the 1940 Act. The Plan provides that the Fund will pay the Distributor and/or any registered securities dealer, financial institution or any other person (the “Recipient”) a shareholder servicing fee of 0.25% of the average daily net assets of the Fund in connection with the promotion and distribution of the Fund’s shares or the provision of shareholder support services to shareholders, including, but not necessarily limited to, advertising,
| BFS Equity Fund |
| Notes to the Financial Statements (continued) |
| May 31, 2022 |
compensation to underwriters, dealers and selling personnel, the printing and mailing of prospectuses to other than current Fund shareholders, the printing and mailing of sales literature and servicing shareholder accounts (“12b-1 fees”). The Fund or Distributor may pay all or a portion of these fees to any Recipient who renders assistance in distributing or promoting the sale of shares, or who provides certain shareholder services, pursuant to a written agreement. For the fiscal year ended May 31, 2022, 12b-1 fees incurred by the Fund were $127,918. The Fund owed $19,871 for 12b-1 fees as of May 31, 2022.
NOTE 5. PURCHASES AND SALES OF SECURITIES
For the fiscal year ended May 31, 2022, purchases and sales of investment securities, other than short-term investments, were $28,970,439 and $37,479,999, respectively.
There were no purchases or sales of long-term U.S. government obligations during the fiscal year ended May 31, 2022.
NOTE 6. FEDERAL TAX INFORMATION
At May 31, 2022, the net unrealized appreciation (depreciation) and tax cost of investments for tax purposes was as follows:
| Gross unrealized appreciation | | $ | 16,414,696 | |
| Gross unrealized depreciation | | | (402,598 | ) |
| Net unrealized appreciation on investments | | $ | 16,012,098 | |
| | | | | |
| Tax cost of investments | | $ | 30,279,242 | |
At May 31, 2022, the difference between book basis and tax basis unrealized appreciation (depreciation) is attributable to the tax deferral of losses on wash sales.
The tax character of distributions paid for the fiscal years ended May 31, 2022 and May 31, 2021, were as follows:
| | | 2022 | | | 2021 | |
| Distributions paid from: | | | |
| Ordinary income(a) | | $ | 1,733,996 | | | $ | — | |
| Long-term capital gains | | | 3,198,796 | | | | 677,735 | |
| Total distributions paid | | $ | 4,932,792 | | | $ | 677,735 | |
| (a) | Short-term capital gain distributions are treated as ordinary income for tax purposes. |
| BFS Equity Fund |
| Notes to the Financial Statements (continued) |
| May 31, 2022 |
At May 31, 2022, the components of accumulated earnings (deficit) on a tax basis were as follows:
| Undistributed long-term capital gains | | $ | 506,201 | |
| Accumulated capital and other losses | | | (39,249 | ) |
| Unrealized appreciation (depreciation) | | | 16,012,098 | |
| Total accumulated earnings | | $ | 16,479,050 | |
Certain qualified late year ordinary losses incurred after December 31, and within the current taxable year, are deemed to arise on the first business day of the Fund’s following taxable year. For the tax year ended May 31, 2022, the Fund deferred Qualified Late Year Ordinary Losses in the amount of $39,249.
NOTE 7. COMMITMENTS AND CONTINGENCIES
The Trust indemnifies its officers and Trustees for certain liabilities that may arise from their performance of their duties to the Trust or the Fund. Additionally, in the normal course of business, the Trust enters into contracts that contain a variety of representations and warranties which provide general indemnifications. The Trust’s maximum exposure under these arrangements is unknown, as this would involve future claims that may be made against the Trust that have not yet occurred.
NOTE 8. SUBSEQUENT EVENTS
Management of the Fund has evaluated the need for disclosures and/or adjustments resulting from subsequent events through the date at which these financial statements were issued. Based upon this evaluation, management has determined there were no items requiring adjustment of the financial statements or additional disclosure.
Report of Independent Registered Public Accounting Firm
To the Shareholders of BFS Equity Fund and
Board of Trustees of Valued Advisers Trust
Opinion on the Financial Statements
We have audited the accompanying statement of assets and liabilities, including the schedule of investments, of BFS Equity Fund (the “Fund”), a series of Valued Advisers Trust, as of May 31, 2022, the related statement of operations for the year then ended, the statements of changes in net assets for each of the two years in the period then ended, the related notes, and the financial highlights for each of the five years in the period then ended (collectively referred to as the “financial statements”). In our opinion, the financial statements present fairly, in all material respects, the financial position of the Fund as of May 31, 2022, the results of its operations the year then ended, the changes in net assets for each of the two years in the period then ended, and the financial highlights for each of the five years in the period then ended, in conformity with accounting principles generally accepted in the United States of America.
Basis for Opinion
These financial statements are the responsibility of the Fund’s management. Our responsibility is to express an opinion on the Fund’s financial statements based on our audits. We are a public accounting firm registered with the Public Company Accounting Oversight Board (United States) (“PCAOB”) and are required to be independent with respect to the Fund in accordance with the U.S. federal securities laws and the applicable rules and regulations of the Securities and Exchange Commission and the PCAOB.
We conducted our audits in accordance with the standards of the PCAOB. Those standards require that we plan and perform the audit to obtain reasonable assurance about whether the financial statements are free of material misstatement whether due to error or fraud.
Our audits included performing procedures to assess the risks of material misstatement of the financial statements, whether due to error or fraud, and performing procedures that respond to those risks. Such procedures included examining, on a test basis, evidence regarding the amounts and disclosures in the financial statements. Our procedures included confirmation of securities owned as of May 31, 2022, by correspondence with the custodian and broker. Our audits also included evaluating the accounting principles used and significant estimates made by management, as well as evaluating the overall presentation of the financial statements. We believe that our audits provide a reasonable basis for our opinion.
We have served as the Fund’s auditor since 2013.
COHEN & COMPANY, LTD.
Cleveland, Ohio
July 26, 2022
Summary of Fund Expenses (Unaudited)
As a shareholder of the Fund, you incur two types of costs: (1) transaction and (2) ongoing costs, including management fees and other Fund expenses. These examples are intended to help you understand your ongoing costs (in dollars) of investing in the Fund and to compare these costs with the ongoing costs of investing in other funds. The example is based on an investment of $1,000 invested at the beginning of the period and held for the entire period from December 1, 2021 through May 31, 2022.
Actual Expenses
The first line of the table below provides information about actual account values and actual expenses. You may use the information in this line, together with the amount you invested, to estimate the expenses that you paid over the period. Simply divide your account value by $1,000 (for example, an $8,600 account value divided by $1,000 = 8.6), then multiply the result by the number in the first line under the heading “Expenses Paid During Period” to estimate the expenses you paid on your account during this period.
Hypothetical Example for Comparison Purposes
The second line of the table below provides information about hypothetical account values and hypothetical expenses based on the Fund’s actual expense ratio and an assumed rate of return of 5% per year before expenses, which is not the Fund’s actual return. The hypothetical account values and expenses may not be used to estimate the actual ending account balance or expenses you paid for the period. You may use this information to compare the ongoing costs of investing in the Fund and other funds. To do so, compare this 5% hypothetical example with the 5% hypothetical examples that appear in the shareholder reports of other funds.
Expenses shown in the table are meant to highlight your ongoing costs only and do not reflect any transactional costs. Therefore, the second line of the table below is useful in comparing ongoing costs only and will not help you determine the relative costs of owning different funds. In addition, if transaction costs were included, your costs would have been higher.
| | | Beginning | | | Ending | | | | | | |
| | | Account | | | Account | | | Expenses | | | |
| | | Value | | | Value | | | Paid | | | Annualized |
| | | December | | | May 31, | | | During | | | Expense |
| | | 1, 2021 | | | 2022 | | | Period(a) | | | Ratio |
| Actual | | $ | 1,000.00 | | | $ | 874.00 | | | $ | 5.84 | | | 1.25% |
| Hypothetical(b) | | $ | 1,000.00 | | | $ | 1,018.70 | | | $ | 6.29 | | | 1.25% |
| (a) | Expenses are equal to the Fund’s annualized expense ratio, multiplied by the average account value over the period, multiplied by 182/365 (to reflect the one-half year period). |
| (b) | Hypothetical assumes 5% annual return before expenses. |
| Additional Federal Income Tax Information (Unaudited) |
The Form 1099-DIV you receive in January 2023 will show the tax status of all distributions paid to your account in calendar year 2022. Shareholders are advised to consult their own tax adviser with respect to the tax consequences of their investment in the Fund. As required by the Internal Revenue Code and/or regulations, shareholders must be notified regarding the status of qualified dividend income for individuals and the dividends received deduction for corporations.
Qualified Dividend Income. The Fund designates approximately 28.63% or up to the maximum amount of such dividends allowable pursuant to the Internal Revenue Code, as qualified dividend income eligible for a reduced tax rate.
Qualified Business Income. The Fund designates approximately 0% of its ordinary income dividends, or up to the maximum amount of such dividends allowable pursuant to the Internal Revenue Code, as qualified business income.
Dividends Received Deduction. Corporate shareholders are generally entitled to take the dividends received deduction on the portion of the Fund’s dividend distribution that qualifies under tax law. For the Fund’s calendar year 2022 ordinary income dividends, 27.02% qualifies for the corporate dividends received deduction.
For the year ended May 31, 2022, the Fund designated $3,198,796 as long-term capital gain distributions.
| Trustees and Officers (Unaudited) |
The Board of Trustees supervises the business activities of the Trust. Each Trustee serves as a trustee until termination of the Trust unless the Trustee dies, resigns, retires or is removed.
The following table provides information regarding each of the Independent Trustees.
Name, Address*, (Age),
Position with Trust**,
Term of Position with Trust | Principal Occupation During
Past 5 Years and Other
Directorships | Other Directorships |
Andrea N. Mullins, 55
Independent Trustee
Since December 2013
Chairperson since
March 2017 | Current: Private investor; Independent Contractor, SWM Advisors (since April 2014). | Trustee, Angel Oak Funds Trust (since February 2019) (5 portfolios); Trustee, Angel Oak Strategic Credit Fund (since February 2019); Trustee, Angel Oak Financial Strategies Income Term Trust (since May 2019); Trustee, Angel Oak Dynamic Financial Strategies Income Term Trust (since June 2020); Trustee, Angel Oak Credit Opportunities Term Trust (since January 2021); Trustee and Audit Committee Chair, Cushing Mutual Funds Trust (since November 2021) (2 portfolios); Trustee and Audit Committee Chair,Cushing MLP & Infrastructure Fund (since November 2021). |
| Trustees and Officers (Unaudited) (continued) |
Name, Address*, (Age),
Position with Trust**, Term
of Position with Trust | Principal Occupation During
Past 5 Years and Other
Directorships | Other Directorships |
Ira P. Cohen, 63
Independent Trustee
Since June 2010 | Current: Independent financial services consultant (since February 2005); Executive Vice President of Asset Management Services, Recognos Financial (since August 2015). | Trustee and Audit Committee Chairman, Apollo Diversified Real Estate Fund (since March 2022); Trustee, Chairman and Nominating and Governance Committee Chairman, Angel Oak Funds Trust (since October 2014) (5 portfolios); Trustee, Chairman, and Nominating and Governance Committee Chairman, Angel Oak Strategic Credit Fund (since December 2017); Trustee, Chairman, and Nominating and Governance Committee Chairman, Angel Oak Financial Strategies Income Term Trust (since May 2019); Trustee, Chairman, and Nominating and Governance Committee Chairman, Angel Oak Dynamic Financial Strategies Income Term Trust (since June 2020); Trustee, Chairman, and Nominating and Governance Committee Chairman, Angel Oak Credit Opportunities Term Trust (since January 2021); Trustee and Nominating and Governance Committee Chairman, U.S. Fixed Income Trust (since March 2019). |
| * | The address for each Trustee is 225 Pictoria Drive, Suite 450, Cincinnati, Ohio 45246. |
| ** | As of the date of this report, the Trust consists of 15 series. |
The following table provides information regarding the Trustee who is considered an “interested person” of the Trust, as that term is defined under the 1940 Act.
| Trustees and Officers (Unaudited) (continued) |
Name, Address*, (Age),
Position with Trust**,
Term of Position with Trust | Principal Occupation During
Past 5 Years and Other
Directorships | Other Directorships |
Mark J. Seger***, 60
Trustee Since March 2017 | Current: Vice Chairman and Co-Founder, Ultimus Fund Solutions, LLC and its subsidiaries (since 1999). | None. |
| * | The address for each Trustee is 225 Pictoria Drive, Suite 450, Cincinnati, Ohio 45246. |
| ** | As of the date of this report, the Trust consists of 16 series. |
| *** | Mr. Seger is considered an “interested person” of the Trust because of his relationship with the Trust’s administrator, transfer agent, and distributor. |
The following table provides information regarding the Officers of the Trust:
Name, Address*, (Age),
Position with Trust**,
Term of Position with Trust | Principal Occupation During
Past 5 Years | Other Directorships |
Matthew J. Miller, 46
Principal Excecutive Officer
and President Since March
2022
Vice President
From December 2011 to
March 2022 | Current: Vice President, Ultimus Fund Solutions, LLC (since December 2015). | None. |
N. Lynn Bowley, 63
Chief Compliance Officer
Since April 2022 | Current: Senior Vice President, Senior Compliance Officer, Northern Lights Compliance Services, LLC (since January 2007). | None. |
Carol J. Highsmith, 57
Vice President Since August
2008
Secretary Since March 2014 | Current: Vice President, Ultimus Fund Solutions, LLC (since December 2015). | None. |
Zachary P. Richmond, 42
Principal Financial Officer
and Treasurer Since
September 2021 | Current:Vice President, Financial Administration, Ultimus Fund Solutions, LLC (since February 2019). Previous:Assistant Vice President, Associate Director of Financial Administration, Ultimus Fund Solutions, LLC (December 2015 to February 2019). | None. |
| Trustees and Officers (Unaudited) (continued) |
Name, Address*, (Age),
Position with Trust**, Term
of Position with Trust | Principal Occupation During
Past 5 Years and Other
Directorships | Other Directorships |
Stephen L. Preston, 55
AML Officer Since June
2017 | Current: Chief Compliance Officer of Ultimus Fund Distributors, LLC (since June 2011), Vice President, Financial Operations Principal, and Anti-Money Laundering Officer, Ultimus Fund Distributors, LLC (since April 2021), Treasurer, Financial Operations Principal, Chief Compliance Officer, and Anti-Money Laundering Officer, Northern Lights Distributors, LLC (since April 2021). Previous: Chief Compliance Officer, Ultimus Fund Solutions, LLC (June 2011 to August 2019); Chief Compliance Officer, Unified Financial Securities, LLC (April 2018 to December 2019) | None. |
| * | The address for each Officer is 225 Pictoria Drive, Suite 450, Cincinnati, Ohio 45246. |
| ** | As of the date of this report, the Trust consists of 15 series. |
Other Information (Unaudited)
The Fund’s Statement of Additional Information (“SAI”) includes additional information about the trustees and is available without charge, upon request. You may call toll-free at (855) 575-2430 to request a copy of the SAI or to make shareholder inquiries.
Privacy Policy
| FACTS | WHAT DOES BFS EQUITY FUND (THE “FUND”) DO WITH YOUR PERSONAL INFORMATION? |
| |
| Why? | Financial companies choose how they share your personal information. Federal law gives consumers the right to limit some but not all sharing. Federal law also requires us to tell you how we collect, share, and protect your personal information. Please read this notice carefully to understand what we do. |
| |
| What? | The types of personal information we collect and share depend on the product or service you have with us. This information can include: |
| | |
| | ■ Social Security number |
| | |
| | ■ account balances and account transactions |
| | |
| | ■ transaction or loss history and purchase history |
| | |
| | ■ checking account information and wire transfer instructions |
| | |
| | When you are no longer our customer, we continue to share your information as described in this notice. |
| |
| How? | All financial companies need to share customers’ personal information to run their everyday business. In the section below, we list the reasons financial companies can share their customers’ personal information; the reasons the Fund chooses to share; and whether you can limit this sharing. |
| Reasons we can share your personal information | Does the Fund share? |
For our everyday business purposes —
such as to process your transactions, maintain your account(s), respond to court orders and legal investigations, or report to credit bureaus | Yes |
For our marketing purposes —
to offer our products and services to you | No |
| For joint marketing with other financial companies | No |
For our affiliates’ everyday business purposes —
information about your transactions and experiences | No |
For our affiliates’ everyday business purposes —
information about your creditworthiness | No |
| For nonaffiliates to market to you | No |
| Questions? | Call (855) 575-2430 |
| Who we are |
| Who is providing this notice? | BFS Equity Fund
Ultimus Fund Distributors, LLC (Distributor)
Ultimus Fund Solutions, LLC (Administrator) |
| What we do |
| How does the Fund protect my personal information? | To protect your personal information from unauthorized access and use, we use security measures that comply with federal law. These measures include computer safeguards and secured files and buildings. Our service providers are held accountable for adhering to strict policies and procedures to prevent any misuse of your nonpublic personal information. |
| How does the Fund collect my personal information? | We collect your personal information, for example, when you ■ open an account or deposit money ■ buy securities from us or sell securities to us ■ make deposits or withdrawals from your account ■ give us your account information ■ make a wire transfer ■ tell us who receives the money ■ tell us where to send the money ■ show your government-issued ID ■ show your driver’s license |
| Why can’t I limit all sharing? | Federal law gives you the right to limit only ■ sharing for affiliates’ everyday business purposes — information about your creditworthiness ■ affiliates from using your information to market to you ■ sharing for nonaffiliates to market to you State laws and individual companies may give you additional rights to limit sharing. |
| Definitions |
| Affiliates | Companies related by common ownership or control. They can be financial and nonfinancial companies. ■ Bradley, Foster & Sargent, Inc., the investment adviser to the Fund, could be deemed to be an affiliate. |
| Nonaffiliates | Companies not related by common ownership or control. They can be financial and nonfinancial companies. ■ The Fund does not share your personal information with nonaffiliates so they can market to you |
| Joint marketing | A formal agreement between nonaffiliated financial companies that together market financial products or services to you. ■ The Fund does not jointly market. |
Proxy Voting
A description of the policies and procedures that the Fund uses to determine how to vote proxies relating to portfolio securities and information regarding how the Fund voted those proxies during the most recent twelve month period ended June 30, are available (1) without charge upon request by calling the Fund at (855) 575-2430 and (2) in Fund documents filed with the SEC on the SEC’s website at www.sec.gov.
TRUSTEES
Andrea N. Mullins, Chairperson
Ira P. Cohen
Mark J. Seger
OFFICERS
Matthew J. Miller, Principal Executive Officer and
President
Zachary P. Richmond, Principal Financial Officer and
Treasurer
N. Lynn Bowley, Chief Compliance Officer
Carol J. Highsmith, Vice President and Secretary INVESTMENT ADVISER
Bradley, Foster & Sargent, Inc.
185 Asylum Street, City Place II
Hartford, CT 06103 DISTRIBUTOR
Ultimus Fund Distributors, LLC
225 Pictoria Drive, Suite 450
Cincinnati, OH 45246 | INDEPENDENT REGISTERED
PUBLIC ACCOUNTING FIRM
Cohen & Company, Ltd.
1350 Euclid Avenue, Suite 800
Cleveland, OH 44115 LEGAL COUNSEL
Troutman Pepper Hamilton Sanders LLP
3000 Two Logan Square
18th and Arch Streets
Philadelphia, PA 19103 CUSTODIAN
Huntington National Bank
41 South High Street
Columbus, OH 43215 ADMINISTRATOR, TRANSFER AGENT AND FUND ACCOUNTANT
Ultimus Fund Solutions, LLC
225 Pictoria Drive, Suite 450
Cincinnati, OH 45246 |
This report is intended only for the information of shareholders or those who have received the Fund’s prospectus which contains information about the Fund’s management fee and expenses. Please read the prospectus carefully before investing.
Distributed by Ultimus Fund Distributors, LLC, Member FINRA/SIPC
BFS-AR-22
LS Opportunity Fund
Management’s Discussion of Fund Performance
May 31, 2022 - (Unaudited)
To Shareholders of the LS Opportunity Fund,
Long Short Advisors, LLC, based in Palm Beach Gardens, FL is the advisor of the LS Opportunity Fund (“LSOFX” or the “Fund”) and Prospector Partners, LLC (“Prospector”), based in Guildford, CT is the sub-advisor of the Fund. Prospector has a long/short hedge fund track record that spans 24 years with a substantially similar investment objective to LSOFX and brings its experience to our Fund in a daily liquid mutual fund format with a goal of downside risk mitigation and consistency of returns.
The Fund aims to generate long-term capital appreciation by investing in both long and short positions within a portfolio consisting of primarily publicly traded common stock, with less net exposure than that of the stock market in general. Through extensive research, risk management, and no leverage in the long book, the Fund strives to preserve capital while delivering solid risk-adjusted returns and managing volatility. For additional information, please visit our website at www.longshortadvisors.com.
First and foremost, we at Long Short Advisors would like to thank the team at Prospector Partners for another job well done and we look forward to the years to come. As of May 31, 2022, Prospector Partners has been the sub-advisor of the Fund for seven years. The team’s absolute and risk-adjusted returns earned the Fund a 4-Star Overall Morningstar Rating™ out of 179 funds in the US Fund Long Short category as of May 31, 2022 based on risk-adjusted returns.*
Building on that success, we believe 2022 is the most exciting time to invest in Prospector Partners’ long short style of investing in over 20 years. While we do not believe there is a bad time to invest with Prospector Partners or in long short, there can be times, like now, where the stars align and offer investors what we see as a great opportunity to invest in what is otherwise a challenging investment climate. As evidenced by asset flows across the industry, money is leaving traditional bonds and stocks and seeking opportunities in alternatives of which we believe long short is a favorable choice.
Investors should think of the multiple potential ways to win with the Fund and consider how it might complement their portfolios. Headwinds have in our opinion become tailwinds for long short value style investing in the following ways:
| 1. | Growth has switched to value, which benefits the long book relative to core and growth equity. |
| 2. | Rates are rising which allows us to earn interest on our short proceeds that sit in cash. |
LS Opportunity Fund
Management’s Discussion of Fund Performance (continued)
May 31, 2022 - (Unaudited)
| 3. | Fed tightening is increasing the cost of capital and challenging corporate balance sheets creating the best shorting environment since the lead up to the Great Financial Crisis during the market correction of October 2007 to March 2009. |
| 4. | Persistent higher levels of volatility have returned, offering ample opportunities for entry and exit from long and short investing – Volatility is the friend of the active long short investor. |
For more information on investment strategy and how the Fund can help your portfolio, call Long Short Advisors at 215-399-9409.
| * | As of May 31, 2022, LSOFX received the following Morningstar Rating™ in the US Long Short category for the 3-year, 5-year periods, and 10-year periods respectively: 3 stars out of 179 funds, 4 stars out of 156 funds, and 4 stars out of 58 funds. |
Performance
For the 12-month period ended May 31, 2022 (the “Period”), LSOFX returned -0.77%, while the S&P 500® Index (“S&P 500”) finished the Period with a return of -0.30%.
Performance of LSOFX and S&P 500
During the Year Ended May 31, 2022
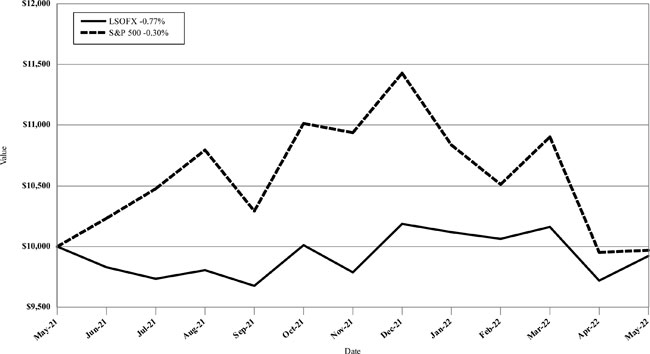
LS Opportunity Fund
Management’s Discussion of Fund Performance (continued)
May 31, 2022 - (Unaudited)
Performance Since Prospector Became Sub-Adviser of LSOFX
(June 2015 - May 2022)
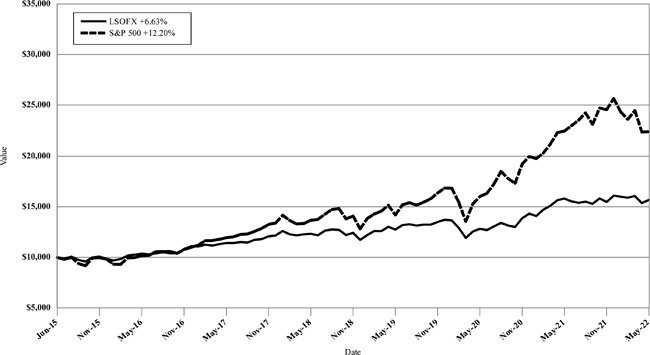
Past performance does not guarantee future results.
Current Market Environment
The new year started as we expected: inflation continuing to rise, the Federal Reserve getting increasingly hawkish, interest rates rising, and with a rotation out of growth stocks into value. However, in mid- January, the market’s attention turned to Russia’s building of troops on Ukraine’s border, and ultimately to Vladimir Putin’s and Russia’s invasion - the consequences of which are myriad. Unprecedented sanctions were quickly imposed by much of the world, impacting Russia’s ability to export goods and services and limiting their ability to travel as airspaces across Europe and North America were closed off to Russian aircraft. Many businesses around the globe made independent decisions to cease doing business in and with Russia. The impact of these sanctions worsened the pandemic-induced supply shortage seen in many industries and further fan the flames of inflation.
Brent crude oil, which was rallying as demand from the economy’s “reopening” outpaced growth in supply, spiked 35% in a little over a week on the prospects of Russia’s supply (estimated at 12% of worldwide production) being taken off the market. Wheat rose over 50%, given Ukraine and Russia combined produce almost 30% of worldwide supply.
LS Opportunity Fund
Management’s Discussion of Fund Performance (continued)
May 31, 2022 - (Unaudited)
The shortage of automobiles was further exacerbated, as many manufacturers rely on wire harnesses produced in Ukraine. These are examples of the many commodities and products which have been dramatically impacted by the outbreak of war, causing fears of uncontrolled inflation and even stagflation. Against this backdrop, both stocks and bonds sold off during the period.
So, what does this all mean for your portfolio? While the Fund has no direct investments in Russia or Ukraine, a handful of investments generate a modest amount of revenues from the region. Given our largely domestic focus, we made only minor changes to the portfolio based on potential impacts from the conflict. However, the far reaching impacts of the war have implications for portfolio positioning. Europe’s economy will likely be hit harder than the U.S., especially given the continent’s reliance on Russian natural gas. Russia is Europe’s largest external source for gas, providing over 30% of their supplies, and any material reduction coming from Russia will have serious implications for Europe’s economy. Thus, our predilection for domestic investments remains in place. Domestically, unemployment levels are below 4%, and the U.S. consumer continues to be in great shape partially as a result of trillions of dollars of pandemic stimulus. However inflationary pressures cannot be ignored. Wages are growing, but costs of goods are growing faster. Odds of a slowdown have increased in our estimation and we have gradually reduced exposure to cyclically-exposed companies, including lowering our large bank bet - much of that via liquidating the First Horizon position (discussed further below) – but also by trimming certain names we deemed as more exposed to credit should the economy turn. Additionally, we have modestly increased exposure to defensive sectors such as healthcare and property-casualty insurers.
Two For the Good Guys!
During the period, your portfolio benefited from the announced acquisitions of two holdings: First Horizon Corp. (FHN), and Alleghany Corp. (Y), one of our largest bank positions and largest property- casualty insurance holding respectively. Focusing on FHN first…after a robust year of deal-making in the US bank sector in 2021, the current year is off to a decent start. To date, there have been over 50 M&A deals announced totaling $15 billion in value. Fortunately, your portfolio benefited disproportionately in the period as FHN received an all-cash bid from Toronto-Dominion Bank. The purchase price totaled $13.4 billion, or a +37% purchase price premium.
By way of background, our investment in Tennessee-based First Horizon originated via a holding in IBERIABANK (which was purchased by FHN in early 2020). As the pandemic ensued, we added to the FHN position. In our view, the bank was well-positioned for
LS Opportunity Fund
Management’s Discussion of Fund Performance (continued)
May 31, 2022 - (Unaudited)
the COVID environment. Their large mortgage bank and fixed income trading business greatly benefited from the zero-interest rate environment and exhibited counter-cyclical attributes. Also appealing were earnings per share tailwinds in the form of cost and revenue synergies resulting from First Horizon’s merger with Iberia Bank. Additionally, there was downside protection in the form of a large credit mark on Iberia’s acquired loan book. As the pandemic progressed, First Horizon’s balance sheet became increasingly “asset sensitive,” resulting in an embedded “call option” on higher rates.
We especially liked the geographic footprint of First Horizon which has a large presence in the attractive markets of Tennessee, the Carolinas, Florida, Georgia, and Texas. We view these markets positively given the presence of pro-business policies and strong in-migration trends fueled by the relative cost of living, job growth, quality of life, and warm weather. Our theory is this should translate into above trend loan growth and be supportive to credit quality in the face of higher rates. As a result, we view the South as an attractive market for mergers and acquisitions (“M&A”), and pegged First Horizon as a long-term M&A candidate. Management teams are confirming our rationale, as the attractiveness of the Southeast is a key reason why Toronto-Dominion is acquiring First Horizon. PNC also cited the attractiveness of the South with their $11.6 billion acquisition of BBVA USA in the first half of 2021.
While the potential to be acquired is never the sole reason we own a stock, in your portfolio, there are other banks which we view as highly attractive M&A targets. These include Georgia-based Synovus Financial Corp. (SNV), Florida-based SouthState Corp. (SSB), and Comerica, Inc. (CMA) which has a large presence in Texas and growing franchises in Florida, Arizona, and North Carolina. We expect the trend of bank consolidation to continue across the United States, with a particular emphasis in the South as supported by the commentary of large potential acquirers. Your portfolio remains in a good position to potentially benefit from this continued trend of consolidation, which is usually an important catalyst to realizing value.
While our outlook on property-casualty consolidation is less enthusiastic in the near term than banks (insurers are reaping the rewards of years of rate increases, and are more inclined to feel the need to consolidate during a “softer” rate environment), part of our thesis for owning Alleghany was its being undervalued on a “sum-of-the-parts / private market value” basis, and we’re happy to see that value recognized. We initiated our Alleghany position in May of 2020. The company owns a variety of businesses, but insurance and reinsurance are the largest contributors to aggregate results. Fundamentals for re/insurance started improving in 2019 and we were confident that earnings in 2021-
LS Opportunity Fund
Management’s Discussion of Fund Performance (continued)
May 31, 2022 - (Unaudited)
2022 would be much improved. Investor concerns regarding aggregate industry exposure to COVID insurance claims yielded an attractive opportunity in the stock. We knew their businesses well, having followed developments for years, and valued the segments on a sum-of-the-parts analysis, including private market values for comparable re/insurance enterprises sold in recent years. We concluded that shares of Y were selling well below our derived intrinsic value and invested accordingly. On March 21, 2022, Berkshire Hathaway (BRK.A/B) announced an agreement to acquire Alleghany for $848 per share, a 29% premium to Alleghany’s average stock price over the previous 30 days.
It’s worth delving into a recent investment we view similarly to Alleghany - Fairfax Financial (FFH-TSE). Fairfax has been referred to as the “Berkshire of Canada” from time to time. The company owns many sizeable reinsurance and insurance enterprises, as well as a diverse mix of non-insurance businesses, either via 100% ownership, or partial ownership via common stock holdings. We have followed developments at the company for many years and find the current positioning to be quite favorable for the environment of today. On what appears to be the precipice of several Federal Reserve interest rate increases, we note the sizeable cash and short term investment balances of FFH, which equates to ~44% of invested assets and >2x tangible common equity. As we have shared with our thoughts on Alleghany, much value has been created in the re/insurance sector in recent years, and by our estimation, the current share price of FFH does not accurately reflect the private market values of its insurance subsidiaries. Interestingly, in December of 2021, FFH sold 10% of one of its subsidiaries, Odyssey Re, for $900M, implying a $9 billion valuation for that subsidiary. For point of reference, Odyssey accounts for less than half of FFH’s tangible equity, and the aggregate market capitalization of FFH is $13 billion. With a view that FFH is significantly undervalued, we initiated a position in FFH earlier in 2022.
Outlook
2022 is setting up to be what we believe will be a pivotal year. In our opinion, much will depend on how successful the Federal Reserve is at transitioning from an ultra-stimulative posture, to a less accommodative one (the elusive soft landing), while the U.S. and rest of the world is dealing with the impacts of Russia’s invasion of Ukraine. At this point it appears that the U.S. consumer remains resilient, with healthy balance sheets following trillions in fiscal stimulus. The impacts from the COVID-19 pandemic are waning and immunity from prior infections, increasing vaccinations, and release of anti-virals should help further the reopening of our economy.
LS Opportunity Fund
Management’s Discussion of Fund Performance (continued)
May 31, 2022 - (Unaudited)
Interest and mortgage rates have lifted off historically low levels, with 30-year mortgage rates recently topping 5% - potentially a psychologically important level. We are seeing reinflation in many areas of the economy, and are watching this closely given the historically high levels of government spending here and around the world. Unemployment has shown significant improvement, but labor continues to be an issue as the participation rate continues to be low and labor shortages are impacting many industries.
In our estimation, overall equity valuations remain at elevated levels. Treasury and high-grade corporate bond yields are at risk of going higher and below investment grade corporate bonds are facing the very real possibility of a credit cycle, spread widening, a pick-up in defaults and an unwilling Federal Reserve to bail them out. In any case, we believe that active long short value investing is ripe for a period of outperformance, and the bargains inherent in your long portfolio should attract acquirers and other investors over time. Meanwhile, the challenged companies face tremendous pressure allowing shorts the dual benefit of making money and hedging out unwanted volatility to protect your capital. That said we still believe a portfolio of risk managed equities represents a superior asset allocation alternative to bonds over the longer term.
Thank you for your continued support and we look forward to reporting to you again following our semi-annual date of November 30, 2022.
Steadfast, we remain committed to the goal of making you money while aiming to protect your wealth.
- Your Team at Long Short Advisors
Long Book
Top Positions
At period’s end, the Fund contained 63 long positions in the portfolio representing companies with what management believes represents long-term value and favorable characteristics such as a discount to private market value, attractive free cash flow yields, and strong balance sheets. The Fund’s top 10 long positions represented approximately 28% of the portfolio and included Arthur J. Gallagher Co. (AJG), Berkshire Hathaway, Inc. (BRK/B), Brown & Brown, Inc. (BRO), Globe Life, Inc. (GL), Johnson & Johnson (JNJ), Merck & Co. (MRK), Pioneer Natural Resources Co. (PXD), Progressive Corp. (PGR), Schlumberger Ltd. (SLB), US Bancorp (USB).
LS Opportunity Fund
Management’s Discussion of Fund Performance (continued)
May 31, 2022 - (Unaudited)
Contributors
The five stocks in the long book that contributed the largest returns during the Period, from largest to smallest were: Pioneer Natural Resources Co. (PXD), Schlumberger Ltd. (SLB), First Horizon Corp. (FHN), Merck & Co. (MRK) and Progressive Corp. (PGR).
Detractors
Over the Period, the three stocks in the long book that detracted from returns the most during the Period, from largest to smallest were: PayPal Holdings, Inc. (PYPL), PPG Industries, Inc. (PPG), and Howard Hughes Corp. (HHC).
Largest Purchases
The top purchases by dollar value in the long book for the Period were: Berkshire Hathaway Inc. (BRK/B), State Street Corp. (STT), Sensata Technologies Holdings plc (ST), Kemper Corp. (KMPR), and Johnson & Johnson (JNJ).
Largest Sales
The top sales by dollar value in the long book for the Period were: Alleghany Corp. (Y), First Horizon Corp. (FHN), JPMorgan Chase & Co. (JPM), Comerica, Inc. (CMA), and Robert Half International, Inc. (RHI).
Short Book
Top Positions
The Fund’s short book at Period’s end contained 28 short positions, 27 of which were individual companies that have business model challenges, excessive valuations, and/or potential balance sheet issues. The Fund’s top 20 short positions represented approximately 27% of the portfolio.
Disclosure
Mutual fund investing involves risk and principal loss is possible. You should carefully consider the investment objectives, potential risks, management fees, and charges and expenses of the Fund before investing. The Fund’s prospectus contains this and other information about the Fund and should be read carefully before investing. You may obtain a current copy of the Fund’s prospectus by calling 1-877-336-6763. The Fund is distributed by Ultimus Fund Distributors, LLC.
Investments in shares of a long/short equity fund have the potential for significant risk and volatility. A short equity strategy can diminish returns in a rising market as well as having
LS Opportunity Fund
Management’s Discussion of Fund Performance (continued)
May 31, 2022 - (Unaudited)
the potential for unlimited losses. These types of funds typically have a high portfolio turnover that could increase transaction costs and cause short-term capital gains to be realized.
The performance data quoted represents past performance; past performance does not guarantee future results. The investment return and principal value of an investment in the Fund will fluctuate so that an investor’s shares, when redeemed, may be worth more or less than their original cost. Current performance of the Fund may be lower or higher than the performance quoted. The Fund’s returns reflect any fee reductions during the applicable periods. If such fee reductions had not occurred, the quoted performance would have been lower. For performance current to the most recent month end, call 1-877-336-6763.
Morningstar Disclosure:
© 2022 Morningstar. All Rights Reserved. The information contained herein: (1) is proprietary to Morningstar; (2) may not be copied or distributed; and (3) is not warranted to be accurate, complete or timely. Neither Morningstar nor its content providers are responsible for any damages or losses arising from any use of this information. Past performance is no guarantee of future results.
The Morningstar Rating™ for funds, or “star rating”, is calculated for managed products (including mutual funds, variable annuity and variable life subaccounts, exchange-traded funds, closed-end funds, and separate accounts) with at least a three-year history. Exchange-traded funds and open-ended mutual funds are considered a single population for comparative purposes. It is calculated based on a Morningstar Risk-Adjusted Return measure that accounts for variation in a managed product’s monthly excess performance, placing more emphasis on downward variations and rewarding consistent performance. The Morningstar Rating does not include any adjustment for sales loads. The top 10% of products in each product category receive 5 stars, the next 22.5% receive 4 stars, the next 35% receive 3 stars, the next 22.5% receive 2 stars, and the bottom 10% receive 1 star. The Overall Morningstar Rating for a managed product is derived from a weighted average of the performance figures associated with its three-, five-, and 10-year (if applicable) Morningstar Rating metrics. The weights are: 100% three-year rating for 36-59 months of total returns, 60% five-year rating/40% three-year rating for 60-119 months of total returns, and 50% 10-year rating/30% five-year rating/20% three-year rating for 120 or more months of total returns. While the 10-year overall star rating formula seems to give the most weight to the 10- year period, the most recent three-year period actually has the greatest impact because it is included in all three rating periods. As of May 31, 2022, the LS Opportunity Fund was rated against the following numbers of US Long Short category funds over the following time periods: 179 funds in the last three years, 156 funds in the last five years, and 58 funds in the last 10 years. Past performance is no guarantee of future results.
Investment Results (Unaudited)
Average Annual Total Returns(a) as of May 31, 2022
| | One Year | | Five Year | | Ten Year |
| LS Opportunity Fund | | (0.77)% | | 6.55% | | 7.30% |
| S&P 500® Index(b) | | (0.30)% | | 13.38% | | 14.40% |
Total annual operating expenses, as disclosed in the LS Opportunity Fund’s (the “Fund”) prospectus dated September 28, 2021, were 2.81% of average daily net assets (2.74% after fee waivers and expense reimbursements by Long Short Advisors, LLC (the “Adviser”)). The Adviser has entered into an expense limitation agreement, pursuant to which it will waive its fees and/or reimburse other expenses of the Fund until September 30, 2022, so that Total Annual Fund Operating Expenses does not exceed 1.95%. This operating expense limitation does not apply to borrowing costs such as interest and dividends on securities sold short, taxes, brokerage commissions, other expenditures which are capitalized in accordance with generally accepted accounting principles, other extraordinary expenses not incurred in the ordinary course of the Fund’s business, expenses incurred under a Rule 12b-1 plan of distribution, “acquired fund fees and expenses,” and expenses that the Fund has incurred but did not actually pay because of an expense offset arrangement. Each fee waiver or reimbursement of an expense by the Adviser is subject to repayment by the Fund within the three years following the date of such waiver or reimbursement, provided that the Fund is able to make the repayment without exceeding the expense limitation in place at the time of the waiver or reimbursement and the expense limitation in place at the time of the repayment. This agreement may only be terminated by mutual consent of the Adviser and the Board of Trustees.
The performance quoted represents past performance, which does not guarantee future results. The investment return and principal value of an investment will fluctuate so that an investor’s shares, when redeemed, may be worth more or less than their original cost. The returns shown do not reflect deduction of taxes that a shareholder would pay on Fund distributions or the redemption of Fund shares. Prior to May 28, 2015, the Fund’s performance was attributable to a previous sub-adviser. The Fund’s investment objectives, risks, charges and expenses must be considered carefully before investing. Current performance of the Fund may be lower or higher than the performance quoted. Performance data current to the most recent month end may be obtained by calling (877) 336-6763.
| (a) | Average annual total returns reflect any change in price per share and assume the reinvestment of all distributions. The Fund’s returns reflect any fee reductions during the applicable periods. If such fee reductions had not occurred, the quoted performance would have been lower. |
| (b) | The S&P 500® Index is a widely recognized unmanaged index of equity prices and is representative of a broader market and range of securities than is found in the Fund’s portfolio. The index is an unmanaged benchmark that assumes reinvestment of all distributions and excludes the effect of taxes and fees. Individuals cannot invest directly in this index; however, an individual can invest in exchange-traded funds or other investment vehicles that attempt to track the performance of a benchmark index. |
The Fund’s investment objectives, risks, charges and expenses must be considered carefully before investing. The prospectus contains this and other important information about the Fund and may be obtained by calling (877) 336-6763. Please read it carefully before investing.
The Fund is distributed by Ultimus Fund Distributors, LLC, Member FINRA/SIPC.
Investment Results (Unaudited) (continued)
Comparison of the Growth of a $10,000 Investment in the LS Opportunity Fund and the S&P 500® Index (Unaudited)
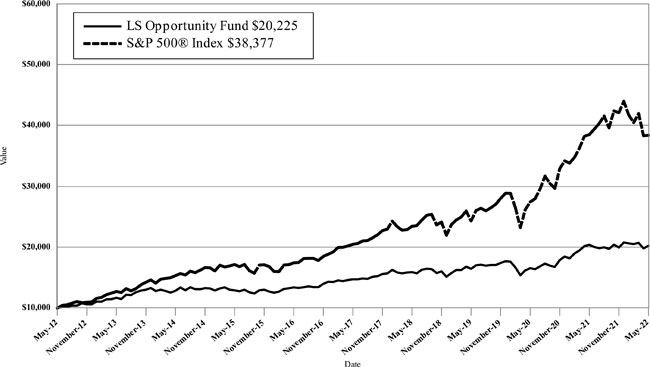
The chart above assumes an initial investment of $10,000 made on May 31, 2012 and held through May 31, 2022. THE FUND’S RETURNS REPRESENT PAST PERFORMANCE AND DO NOT GUARANTEE FUTURE RESULTS. The returns shown do not reflect deduction of taxes that a shareholder would pay on the Fund’s distributions or the redemption of the Fund’s shares. Investment returns and principal values will fluctuate so that your shares, when redeemed, may be worth more or less than their original purchase price.
Current performance may be lower or higher than the performance data quoted. For more information on the Fund, and to obtain performance data current to the most recent month-end, or to request a prospectus, please call (877) 336-6763. You should carefully consider the investment objectives, potential risks, management fees, and charges and expenses of the Fund before investing. The Fund’s prospectus contains this and other information about the Fund, and should be read carefully before investing.
The Fund is distributed by Ultimus Fund Distributors, LLC, member FINRA/SIPC.
Fund Holdings (Unaudited)
May 31, 2022
Sector Exposure
(Based on Net Assets)
| | Long | | | Short | | | Gross | | | Net | |
| Communications. | | 0.50 | % | | 0.00 | % | | 0.50 | % | | 0.50 | % |
| Consumer Discretionary | | 3.30 | % | | -3.60 | % | | 6.90 | % | | -0.30 | % |
| Consumer Staples | | 6.77 | % | | -6.14 | % | | 12.91 | % | | 0.63 | % |
| Energy | | 6.76 | % | | -1.30 | % | | 8.06 | % | | 5.46 | % |
| Financials | | 44.87 | % | | -13.44 | % | | 58.31 | % | | 31.43 | % |
| Health Care | | 12.04 | % | | -2.49 | % | | 14.53 | % | | 9.55 | % |
| Industrials | | 9.26 | % | | -1.83 | % | | 11.09 | % | | 7.43 | % |
| Materials. | | 3.39 | % | | 0.00 | % | | 3.39 | % | | 3.39 | % |
| Real Estate | | 1.30 | % | | 0.00 | % | | 1.30 | % | | 1.30 | % |
| Technology | | 5.58 | % | | 0.00 | % | | 5.58 | % | | 5.58 | % |
| Exchange-Traded Funds. | | 1.22 | % | | -2.55 | % | | 3.77 | % | | -1.33 | % |
| Total Sector Exposure | | 94.99 | % | | -31.35 | % | | 126.34 | % | | 63.64 | % |
| Money Market Funds | | 3.69 | % | | 0.00 | % | | 3.69 | % | | 3.69 | % |
The LS Opportunity Fund seeks to generate long-term capital appreciation by investing in both long and short positions within a portfolio consisting of primarily publicly-traded common stock, with less net exposure than that of the stock market in general.
Availability of Portfolio Schedules (Unaudited)
The Fund files its complete schedule of portfolio holdings with the Securities and Exchange Commission (the “SEC”) for the first and third quarters of each fiscal year as an exhibit to its reports on Form N-PORT. The Fund’s Form N-PORT reports are available on the SEC’s website at http:// www.sec.gov and on the Fund’s website at http://www.longshortadvisors.com.
| LS Opportunity Fund |
| Schedule of Investments |
| May 31, 2022 |
| COMMON STOCKS - LONG - DOMESTIC — 81.52% | | Shares | | | Fair Value | |
| Communications — 0.50% | | | | | | | | |
| Expedia Group, Inc.(a) | | | 5,400 | | | $ | 698,382 | |
| | | | | | | | | |
| Consumer Discretionary — 3.30% | | | | | | | | |
| Darden Restaurants, Inc.(b) | | | 14,450 | | | | 1,806,251 | |
| eBay, Inc.(b) | | | 22,650 | | | | 1,102,376 | |
| Home Depot, Inc. (The)(b) | | | 5,600 | | | | 1,695,400 | |
| | | | | | | | 4,604,027 | |
| Consumer Staples — 4.67% | | | | | | | | |
| Church & Dwight Co., Inc.(b) | | | 22,550 | | | | 2,030,853 | |
| Colgate-Palmolive Co. | | | 9,650 | | | | 760,517 | |
| Mondelez International, Inc., Class A(b) | | | 29,150 | | | | 1,852,774 | |
| Procter & Gamble Co. (The) | | | 12,610 | | | | 1,864,767 | |
| | | | | | | | 6,508,911 | |
| Energy — 6.76% | | | | | | | | |
| Hess Corp. | | | 11,500 | | | | 1,415,305 | |
| Pioneer Natural Resources Co.(b) | | | 16,849 | | | | 4,683,011 | |
| Schlumberger Ltd.(b) | | | 72,250 | | | | 3,320,610 | |
| | | | | | | | 9,418,926 | |
| Financials — 38.10% | | | | | | | | |
| Arthur J. Gallagher & Co.(b) | | | 19,175 | | | | 3,105,200 | |
| Berkshire Hathaway, Inc., Class B(a) (b) | | | 19,535 | | | | 6,172,668 | |
| Brown & Brown, Inc.(b) | | | 53,700 | | | | 3,188,169 | |
| Cboe Global Markets, Inc.(b) | | | 15,475 | | | | 1,737,997 | |
| Citigroup, Inc. | | | 16,050 | | | | 857,231 | |
| Comerica, Inc.(b) | | | 37,150 | | | | 3,091,252 | |
| Federated Hermes, Inc.(b) | | | 78,150 | | | | 2,654,756 | |
| Globe Life, Inc.(b) | | | 36,850 | | | | 3,595,455 | |
| Kemper Corp. | | | 26,000 | | | | 1,373,580 | |
| KeyCorp(b) | | | 137,500 | | | | 2,744,500 | |
| PJT Partners, Inc., Class A(b) | | | 14,800 | | | | 1,122,432 | |
| PNC Financial Services Group, Inc. (The)(b) | | | 13,910 | | | | 2,439,953 | |
| Primerica, Inc.(b) | | | 19,300 | | | | 2,431,800 | |
| Progressive Corp. (The)(b) | | | 31,900 | | | | 3,808,222 | |
| SouthState Corp. | | | 17,700 | | | | 1,430,514 | |
| State Street Corp.(b) | | | 29,350 | | | | 2,127,582 | |
| Synovus Financial Corp.(b) | | | 60,900 | | | | 2,597,385 | |
| U.S. Bancorp(b) | | | 80,300 | | | | 4,261,520 | |
| Voya Financial, Inc.(b) | | | 39,300 | | | | 2,696,373 | |
| W.R. Berkley Corp.(b) | | | 23,870 | | | | 1,697,873 | |
| | | | | | | | 53,134,462 | |
| Health Care — 10.35% | | | | | | | | |
| Abbott Laboratories(b) | | | 8,200 | | | | 963,171 | |
| Cigna Corp.(b) | | | 11,020 | | | | 2,956,556 | |
| Johnson & Johnson(b) | | | 18,120 | | | | 3,253,084 | |
| Merck & Co., Inc.(b) | | | 38,610 | | | | 3,553,277 | |
| NuVasive, Inc.(a) | | | 29,550 | | | | 1,696,466 | |
| Pfizer, Inc.(b) | | | 37,850 | | | | 2,007,564 | |
| | | | | | | | 14,430,118 | |
See accompanying notes which are an integral part of these financial statements.
| LS Opportunity Fund |
| Schedule of Investments (continued) |
| May 31, 2022 |
| COMMON STOCKS - LONG - DOMESTIC — 81.52% - continued | | Shares | | | Fair Value | |
| Industrials — 8.47% | | | | | | | | |
| Carrier Global Corp.(b) | | | 32,810 | | | $ | 1,289,761 | |
| Eaton Corp. PLC(b) | | | 14,550 | | | | 2,016,630 | |
| General Dynamics Corp.(b) | | | 9,165 | | | | 2,061,300 | |
| Littelfuse, Inc.(b) | | | 6,050 | | | | 1,634,710 | |
| Otis Worldwide Corp.(b) | | | 18,930 | | | | 1,408,392 | |
| Raytheon Technologies Corp.(b) | | | 15,560 | | | | 1,480,067 | |
| Sensata Technologies Holding PLC | | | 39,800 | | | | 1,911,594 | |
| | | | | | | | 11,802,454 | |
| Materials — 2.49% | | | | | | | | |
| Air Products & Chemicals, Inc. | | | 2,900 | | | | 713,863 | |
| Newmont Goldcorp Corp. | | | 12,220 | | | | 829,127 | |
| PPG Industries, Inc.(b) | | | 15,250 | | | | 1,928,972 | |
| | | | | | | | 3,471,962 | |
| Real Estate — 1.30% | | | | | | | | |
| Howard Hughes Corp. (The)(a) (b) | | | 21,520 | | | | 1,810,478 | |
| | | | | | | | | |
| Technology — 5.58% | | | | | | | | |
| Leidos Holdings, Inc.(b) | | | 26,050 | | | | 2,722,224 | |
| Microsoft Corp.(b) | | | 4,865 | | | | 1,322,648 | |
| Oracle Corp.(b) | | | 22,100 | | | | 1,589,432 | |
| Paychex, Inc.(b) | | | 10,550 | | | | 1,306,407 | |
| PayPal Holdings, Inc.(a) (b) | | | 9,925 | | | | 845,709 | |
| | | | | | | | 7,786,420 | |
| | | | | | | | | |
| Total Common Stocks - Long - Domestic (Cost $95,950,063) | | | | | | | 113,666,140 | |
| | | | | | | | | |
| COMMON STOCKS - LONG - INTERNATIONAL — 12.25% | | | | | | | | |
| Consumer Staples — 2.10% | | | | | | | | |
| Carlsberg A/S, Class B | | | 10,450 | | | | 1,330,302 | |
| Nestle S.A. | | | 13,100 | | | | 1,597,544 | |
| | | | | | | | 2,927,846 | |
| Financials — 6.77% | | | | | | | | |
| Everest Re Group Ltd. | | | 6,110 | | | | 1,726,075 | |
| Fairfax Financial Holdings Ltd. | | | 3,820 | | | | 2,119,133 | |
| First BanCorp. | | | 184,400 | | | | 2,753,092 | |
| RenaissanceRe Holdings Ltd.(b) | | | 18,505 | | | | 2,840,888 | |
| | | | | | | | 9,439,188 | |
| Health Care — 1.69% | | | | | | | | |
| Medtronic PLC(b) | | | 23,600 | | | | 2,363,541 | |
| | | | | | | | | |
| Industrials — 0.79% | | | | | | | | |
| Pentair PLC | | | 22,050 | | | | 1,106,249 | |
| | | | | | | | | |
| Materials — 0.90% | | | | | | | | |
| Agnico Eagle Mines Ltd.(b) | | | 23,689 | | | | 1,253,858 | |
| | | | | | | | | |
| Total Common Stocks - Long - International (Cost $16,854,505) | | | | | | | 17,090,682 | |
See accompanying notes which are an integral part of these financial statements.
| LS Opportunity Fund |
| Schedule of Investments (continued) |
| May 31, 2022 |
| EXCHANGE-TRADED FUNDS — 1.22% | | Shares | | | Fair Value | |
| Aberdeen Standard Physical Platinum Shares ETF(a) (b) | | | 18,850 | | | $ | 1,696,500 | |
| Total Exchange-Traded Funds (Cost $1,754,824) | | | | | | | 1,696,500 | |
| | | | | | | | | |
| MONEY MARKET FUNDS — 3.69% | | | | | | | | |
| Invesco Treasury Portfolio, Institutional Class, 0.54%(c) | | | 5,146,668 | | | | 5,146,668 | |
| Total Money Market Funds (Cost $5,146,668) | | | | | | | 5,146,668 | |
| | | | | | | | | |
| Total Investments — 98.68% (Cost $119,706,060) | | | | | | | 137,599,990 | |
| | | | | | | | | |
| Other Assets in Excess of Liabilities — 1.32% | | | | | | | 1,844,563 | |
| NET ASSETS — 100.00% | | | | | | $ | 139,444,553 | |
| (a) | Non-income producing security. |
| (b) | All or a portion of the security is held as collateral for securities sold short. The fair value of this collateral on May 31, 2022, was $65,093,190. |
| (c) | Rate disclosed is the seven day effective yield as of May 31, 2022. |
ETF - Exchange-Traded Fund
See accompanying notes which are an integral part of these financial statements.
| LS Opportunity Fund |
| Schedule of Securities Sold Short |
| May 31, 2022 |
| COMMON STOCKS - SHORT - DOMESTIC - (24.70)% | | Shares | | | Fair Value | |
| Consumer Discretionary - (3.60)% | | | | | | | | |
| Lowe’s Cos., Inc. | | | (6,920 | ) | | $ | (1,351,476 | ) |
| McDonald’s Corp. | | | (4,550 | ) | | | (1,147,556 | ) |
| Service Corp. International | | | (36,000 | ) | | | (2,521,081 | ) |
| | | | | | | | (5,020,113 | ) |
| Consumer Staples - (6.14)% | | | | | | | | |
| Campbell Soup Co. | | | (37,950 | ) | | | (1,818,184 | ) |
| Hershey Co. (The) | | | (9,800 | ) | | | (2,074,758 | ) |
| Kellogg Co. | | | (32,600 | ) | | | (2,273,523 | ) |
| Kimberly-Clark Corp. | | | (17,960 | ) | | | (2,389,040 | ) |
| | | | | | | | (8,555,505 | ) |
| Energy - (1.30)% | | | | | | | | |
| Chevron Corp. | | | (10,350 | ) | | | (1,807,730 | ) |
| | | | | | | | | |
| Financials - (9.34)% | | | | | | | | |
| CNO Financial Group, Inc. | | | (72,650 | ) | | | (1,494,411 | ) |
| Community Bank System, Inc. | | | (24,250 | ) | | | (1,600,500 | ) |
| Dime Community Bancshares, Inc. | | | (20,700 | ) | | | (650,808 | ) |
| Horace Mann Educators Corp. | | | (25,100 | ) | | | (1,015,546 | ) |
| Independent Bank Corp. | | | (8,450 | ) | | | (703,885 | ) |
| M&T Bank Corp. | | | (6,518 | ) | | | (1,173,044 | ) |
| Prudential Financial, Inc. | | | (12,009 | ) | | | (1,275,956 | ) |
| Travelers Cos., Inc. (The) | | | (11,700 | ) | | | (2,094,768 | ) |
| Truist Financial Corp. | | | (47,500 | ) | | | (2,362,650 | ) |
| Washington Trust Bancorp, Inc. | | | (13,150 | ) | | | (660,130 | ) |
| | | | | | | | (13,031,698 | ) |
| Health Care - (2.49)% | | | | | | | | |
| Boston Scientific Corp. (a) | | | (20,850 | ) | | | (855,058 | ) |
| CVS Health Corp. | | | (9,500 | ) | | | (919,125 | ) |
| HCA Healthcare, Inc. | | | (5,640 | ) | | | (1,186,656 | ) |
| Stryker Corp. | | | (2,195 | ) | | | (514,728 | ) |
| | | | | | | | (3,475,567 | ) |
| Industrials - (1.83)% | | | | | | | | |
| Deere & Co. | | | (2,500 | ) | | | (894,450 | ) |
| Snap-on, Inc. | | | (7,450 | ) | | | (1,653,006 | ) |
| | | | | | | | (2,547,456 | ) |
| | | | | | | | | |
| TOTAL COMMON STOCKS - SHORT - DOMESTIC (Proceeds Received $33,496,790) | | | | | | | (34,438,069 | ) |
| | | | | | | | | |
| COMMON STOCKS - SHORT - INTERNATIONAL - (4.10)% | | | | | | | | |
| Financials - (4.10)% | | | | | | | | |
| Commonwealth Bank of Australia | | | (41,405 | ) | | | (3,100,399 | ) |
| Muenchener Rueckversicherungs-Gesellshaft AG | | | (5,020 | ) | | | (1,226,848 | ) |
| Swiss Re AG | | | (16,850 | ) | | | (1,386,062 | ) |
| | | | | | | | | |
| TOTAL COMMON STOCKS - SHORT - INTERNATIONAL (Proceeds Received $5,266,348) | | | | | | | (5,713,309 | ) |
See accompanying notes which are an integral part of these financial statements.
| LS Opportunity Fund |
| Schedule of Securities Sold Short (continued) |
| May 31, 2022 |
| EXCHANGE-TRADED FUNDS - (2.55)% | | Shares | | | Fair Value | |
| Vanguard Energy ETF | | | (29,350 | ) | | $ | (3,558,394 | ) |
| TOTAL EXCHANGE-TRADED FUNDS (Proceeds Received $3,179,024) | | | | | | | (3,558,394 | ) |
| | | | | | | | | |
| TOTAL SECURITIES SOLD SHORT - (31.35)% (Proceeds Received $41,942,162) | | | | | | $ | (43,709,772 | ) |
| (a) | Non-dividend expense producing security. |
ETF - Exchange-Traded Fund
See accompanying notes which are an integral part of these financial statements.
| LS Opportunity Fund |
| Statement of Assets and Liabilities |
| May 31, 2022 |
| Assets | | | |
| Investments in securities, at fair value (cost $119,706,060) (Note 3) | | $ | 137,599,990 | |
| Deposits at broker for securities sold short (Note 2) | | | 46,259,306 | |
| Receivable for fund shares sold | | | 10,736 | |
| Dividends receivable | | | 308,509 | |
| Tax reclaims receivable | | | 22,447 | |
| Prepaid expenses | | | 17,336 | |
| Total Assets | | | 184,218,324 | |
| Liabilities | | | | |
| Investments in securities sold short, at fair value (proceeds received $41,942,162) (Note 2) | | | 43,709,772 | |
| Payable for fund shares redeemed | | | 16,155 | |
| Payable for investments purchased | | | 698,483 | |
| Dividend expense payable on short positions | | | 98,046 | |
| Payable to Adviser (Note 4) | | | 198,376 | |
| Payable to Administrator (Note 4) | | | 14,691 | |
| Other accrued expenses | | | 38,248 | |
| Total Liabilities | | | 44,773,771 | |
| Net Assets | | $ | 139,444,553 | |
| Net Assets consist of: | | | | |
| Paid-in capital | | $ | 118,375,626 | |
| Accumulated earnings | | | 21,068,927 | |
| Net Assets | | $ | 139,444,553 | |
| Shares outstanding (unlimited number of shares authorized, no par value) | | | 8,628,170 | |
| Net asset value, offering and redemption price per share (Note 2) | | $ | 16.16 | |
See accompanying notes which are an integral part of these financial statements.
| LS Opportunity Fund |
| Statement of Operations |
| For the year ended May 31, 2022 |
| Investment Income | | | |
| Dividend income (net of foreign taxes withheld of $26,881) | | $ | 2,571,503 | |
| Total investment income | | | 2,571,503 | |
| Expenses | | | | |
| Investment Adviser fees (Note 4) | | | 2,410,601 | |
| Dividend expense on securities sold short (Note 2) | | | 1,093,029 | |
| Short sale and interest expense | | | 173,198 | |
| Administration fees (Note 4) | | | 103,329 | |
| Fund accounting fees (Note 4) | | | 43,927 | |
| Registration expenses | | | 28,878 | |
| Custodian fees | | | 20,436 | |
| Legal fees | | | 19,684 | |
| Audit and tax preparation expenses | | | 19,460 | |
| Transfer agent fees (Note 4) | | | 18,090 | |
| Printing and postage expenses | | | 14,871 | |
| Compliance services fees (Note 4) | | | 12,000 | |
| Trustee expenses | | | 6,975 | |
| Miscellaneous | | | 35,349 | |
| Total expenses | | | 3,999,827 | |
| Fees waived by Adviser (Note 4) | | | (47,098 | ) |
| Net operating expenses | | | 3,952,729 | |
| Net investment loss | | | (1,381,226 | ) |
| Net Realized and Change in Unrealized Gain (Loss) on Investments | | | | |
| Net realized gain (loss) on: | | | | |
| Investment securities | | | 12,081,102 | |
| Securities sold short | | | (5,468,665 | ) |
| Foreign currency | | | (9,082 | ) |
| Change in unrealized appreciation (depreciation) on: | | | | |
| Investment securities | | | (10,021,515 | ) |
| Securities sold short | | | 3,583,663 | |
| Foreign currency translations | | | (3,173 | ) |
| Net realized and change in unrealized gain on investments | | | 162,330 | |
| Net decrease in net assets resulting from operations | | $ | (1,218,896 | ) |
See accompanying notes which are an integral part of these financial statements.
| LS Opportunity Fund |
| Statements of Changes in Net Assets |
| | | For the Year | | | For the Year | |
| | | Ended May 31, | | | Ended May 31, | |
| | | 2022 | | | 2021 | |
| Increase (Decrease) in Net Assets due to: | | | | | | | | |
| Operations | | | | | | | | |
| Net investment loss | | $ | (1,381,226 | ) | | $ | (1,157,482 | ) |
| Net realized gain on investment transactions | | | 6,603,355 | | | | 7,849,171 | |
| Change in unrealized appreciation (depreciation) on investments | | | (6,441,025 | ) | | | 16,890,770 | |
| Net increase (decrease) in net assets resulting from operations | | | (1,218,896 | ) | | | 23,582,459 | |
| Distributions to Shareholders from Earnings (Note 2) | | | (5,931,433 | ) | | | (1,399,284 | ) |
| Capital Transactions | | | | | | | | |
| Proceeds from shares sold | | | 38,556,706 | | | | 63,170,477 | |
| Reinvestment of distributions | | | 5,523,480 | | | | 1,315,287 | |
| Amount paid for shares redeemed | | | (29,908,811 | ) | | | (36,940,145 | ) |
| Net increase in net assets resulting from capital transactions | | | 14,171,375 | | | | 27,545,619 | |
| Total Increase in Net Assets | | | 7,021,046 | | | | 49,728,794 | |
| Net Assets | | | | | | | | |
| Beginning of year | | | 132,423,507 | | | | 82,694,713 | |
| End of year | | $ | 139,444,553 | | | $ | 132,423,507 | |
| Share Transactions | | | | | | | | |
| Shares sold | | | 2,335,149 | | | | 4,208,876 | |
| Shares issued in reinvestment of distributions | | | 340,116 | | | | 86,646 | |
| Shares redeemed | | | (1,831,152 | ) | | | (2,423,727 | ) |
| Net increase in shares outstanding | | | 844,113 | | | | 1,871,795 | |
See accompanying notes which are an integral part of these financial statements.
| LS Opportunity Fund |
| Financial Highlights |
| (For a share outstanding during each year) |
| | | For the Years Ended May 31, | |
| | | 2022 | | | 2021 | | | 2020 | | | 2019 | | | 2018 | |
| Selected Per Share Data: | | | | | | | | | | | | | | | |
| Net asset value, beginning of year | | $ | 17.01 | | | $ | 13.99 | | | $ | 14.07 | | | $ | 13.96 | | | $ | 13.44 | |
| Investment operations: | | | | | | | | | | | | | | | | | | | | |
| Net investment loss | | | (0.15 | ) | | | (0.13 | ) | | | (0.07 | ) | | | (0.01 | ) | | | (0.08 | ) |
| Net realized and unrealized gain on investments | | | 0.02 | | | | 3.35 | | | | 0.17 | (a) | | | 0.47 | | | | 1.14 | |
| Total from investment operations | | | (0.13 | ) | | | 3.22 | | | | 0.10 | | | | 0.46 | | | | 1.06 | |
| Less distributions to shareholders from: | | | | | | | | | | | | | | | | | | | | |
| Net realized gains | | | (0.72 | ) | | | (0.20 | ) | | | (0.18 | ) | | | (0.35 | ) | | | (0.54 | ) |
| Net asset value, end of year | | $ | 16.16 | | | $ | 17.01 | | | $ | 13.99 | | | $ | 14.07 | | | $ | 13.96 | |
| Total Return(b) | | | (0.77 | )% | | | 23.17 | % | | | 0.62 | % | | | 3.44 | % | | | 7.95 | % |
| Ratios and Supplemental Data: | | | | | | | | | | | | | | | | | | | | |
| Net assets, end of year (000 omitted) | | $ | 139,445 | | | $ | 132,424 | | | $ | 82,695 | | | $ | 68,753 | | | $ | 49,958 | |
| Ratio of net expenses to average net assets (c) | | | 2.87 | % | | | 2.71 | % | | | 2.84 | % | | | 2.89 | % | | | 2.97 | % |
| Ratio of expenses to average net assets before waiver and reimbursement(c) | | | 2.90 | % | | | 2.78 | % | | | 2.97 | % | | | 3.11 | % | | | 3.33 | % |
| Ratio of net investment loss to average net assets | | | (1.00 | )% | | | (1.04 | )% | | | (0.52 | )% | | | (0.15 | )% | | | (0.82 | )% |
| Portfolio turnover rate | | | 55.37 | % | | | 69.69 | % | | | 69.47 | % | | | 40.31 | % | | | 55.31 | % |
| (a) | The amount shown for a share outstanding throughout the year does not accord with the change in aggregate gains and losses in the portfolio of securities during the year due to the timing of sales and purchases of fund shares in relation to fluctuating market values during the year. |
| (b) | Total return represents the rate that the investor would have earned or lost on an investment in the Fund, assuming reinvestment of distributions. |
| (c) | Includes dividend and interest expense of 0.92%, 0.76%, 0.89%, 0.94% and 1.02% for the fiscal years ended May 31, 2022, 2021, 2020, 2019 and 2018, respectively. |
See accompanying notes which are an integral part of these financial statements.
| LS Opportunity Fund |
| Notes to the Financial Statements |
| May 31, 2022 |
NOTE 1. ORGANIZATION
The LS Opportunity Fund (the “Fund”) is registered under the Investment Company Act of 1940, as amended (“1940 Act”), as an open-end, diversified series of Valued Advisers Trust (the “Trust”). The Trust is a management investment company established under the laws of Delaware by an Agreement and Declaration of Trust dated June 13, 2008 (the “Trust Agreement”). The Trust Agreement permits the Board of Trustees (the “Board” or the “Trustees”) to issue an unlimited number of shares of beneficial interest of separate series without par value. The Fund is one of a series of funds authorized by the Board. The Fund’s investment adviser is Long Short Advisors, LLC (the “Adviser”). The Adviser has retained Prospector Partners, LLC (the “Sub-Adviser”) to serve as the sub-adviser to provide portfolio management and related services to the Fund. The Sub-Adviser receives a fee from the Adviser (not the Fund) for these services. The investment objective of the Fund is to generate long-term capital appreciation by investing in both long and short positions within a portfolio consisting of primarily publicly-traded common stock, with less net exposure than that of the stock market in general.
NOTE 2. SIGNIFICANT ACCOUNTING POLICIES
The Fund is an investment company and follows accounting and reporting guidance under Financial Accounting Standards Board Accounting Standards Codification (“ASC”) Topic 946, “Financial Services-Investment Companies”, including Accounting Standards Update 2013-08. The following is a summary of significant accounting policies followed by the Fund in the preparation of its financial statements. These policies are in conformity with generally accepted accounting principles in the United States of America (“GAAP”).
Estimates – The preparation of financial statements in conformity with GAAP requires management to make estimates and assumptions that affect the reported amounts of assets and liabilities and disclosure of contingent assets and liabilities at the date of the financial statements and the reported amounts of increases and decreases in net assets from operations during the reporting period. Actual results could differ from those estimates.
Federal Income Taxes – The Fund makes no provision for federal income or excise tax. The Fund has qualified and intends to qualify each year as a regulated investment company (“RIC”) under subchapter M of the Internal Revenue Code of 1986, as amended, by complying with the requirements applicable to RICs and by distributing substantially all of its taxable income. The Fund also intends to distribute sufficient net investment income and net realized capital gains, if any, so that it will not be subject to excise tax on undistributed income and gains. If the required amount of net investment income or gains is not distributed, the Fund could incur a tax expense.
| LS Opportunity Fund |
| Notes to the Financial Statements (continued) |
| May 31, 2022 |
As of and during the fiscal year ended May 31, 2022, the Fund did not have any liabilities for any unrecognized tax benefits. The Fund recognizes interest and penalties, if any, related to unrecognized tax benefits as income tax expense on the Statement of Operations when incurred. During the fiscal year ended May 31, 2022, the Fund did not incur any interest or penalties. Management of the Fund has reviewed tax positions taken in tax years that remain subject to examination by all major tax jurisdictions, including federal (i.e., the last three tax year ends and the interim tax period since then, as applicable). Management believes that there is no tax liability resulting from unrecognized tax benefits related to uncertain tax positions taken.
Expenses – Expenses incurred by the Trust that do not relate to a specific fund of the Trust are allocated to the individual funds based on each fund’s relative net assets or another appropriate basis (as determined by the Board).
Security Transactions and Related Income – The Fund follows industry practice and records security transactions on the trade date for financial reporting purposes. For financial statement and income tax purposes, the specific identification method is used for determining capital gains or losses. Dividend income and dividend expense are recorded on the ex-dividend date and interest income is recorded on an accrual basis. Dividend income from real estate investment trusts (REITs) and distributions from limited partnerships are recognized on the ex-date. The calendar year end classification of distributions received from REITs during the fiscal year are reported subsequent to year end; accordingly, the Fund estimates the character of REIT distributions based on the most recent information available. Income or loss from Limited Partnerships is reclassified among the components of net assets upon receipt of Schedules K-1 (Form 1065). Non-cash income, if any, is recorded at the fair market value of the securities received. Withholding taxes on foreign dividends, if any, have been provided for in accordance with the Fund’s understanding of the applicable country’s tax rules and rates.
Foreign Currency Translation – Foreign currency amounts are translated into U.S. dollars as follows: (i) assets and liabilities at the rate of exchange at the end of the respective period; and (ii) purchases and sales of securities and income and expenses at the rate of exchange prevailing on the dates of such transactions. The portion of the results of operations arising from changes in the exchange rates and the portion due to fluctuations arising from changes in the market prices of securities are not isolated. Such fluctuations are included with the net realized and unrealized gain or loss on investments.
The Fund may enter into transactions to purchase or sell foreign currencies to protect the U.S. dollar value of its underlying portfolio securities against the effect of possible adverse movements in foreign exchange rates. Principal risks associated with such transactions include the movement in value of the foreign currency relative to the U.S. dollar and the
| LS Opportunity Fund |
| Notes to the Financial Statements (continued) |
| May 31, 2022 |
ability of the counterparty to meet its obligations. Reported net realized foreign exchange gains or losses arise from sales of foreign currencies, currency gains or losses realized between the trade and settlement dates on securities transactions, and the difference between the amounts of dividends, interest, and foreign withholding taxes recorded on the company’s books and the U.S. dollar equivalent of the amounts actually received or paid. These instruments involve market risk, credit risk, or both in excess of the amount that would be recognized in the Statement of Assets and Liabilities. Risks arise from the possible inability of counterparties to meet the terms of their contracts and from movement in currency and securities values and interest rates.
Dividends and Distributions – The Fund intends to distribute its net investment income and net realized long-term and short-term capital gains, if any, at least annually. Dividends and distributions to shareholders, which are determined in accordance with income tax regulations, are recorded on the ex-dividend date. The treatment for financial reporting purposes of distributions made to shareholders during the period from net investment income or net realized capital gains may differ from their ultimate treatment for federal income tax purposes. These differences are caused primarily by differences in the timing of the recognition of certain components of income, expense or realized capital gain for federal income tax purposes. Where such differences are permanent in nature, they are reclassified among the components of net assets based on their ultimate characterization for federal income tax purposes. Any such reclassifications will have no effect on net assets, results of operations or net asset value (“NAV”) per share of the Fund.
For the fiscal year ended May 31, 2022, the Fund made the following reclassifications to increase (decrease) the components of net assets:
| | | Accumulated Earnings |
| Paid-In Capital | | (Deficit) |
| $(1,283,978) | | $1,283,978 |
Share Valuation – The NAV is calculated each day the New York Stock Exchange (the “NYSE”) is open by dividing the total value of the Fund’s assets, less liabilities, by the number of shares outstanding for the Fund.
Short Sales – The Fund may make short sales as part of its overall portfolio management strategies or to offset a potential decline in value of a security. The Fund may engage in short sales with respect to various types of securities, including exchange-traded funds (ETFs). A short sale involves the sale of a security that is borrowed from a broker or other institution to complete the sale. The Fund may engage in short sales with respect to securities it owns, as well as securities that it does not own. Short sales expose the Fund to the risk that it will be required to acquire, convert or exchange securities to replace the borrowed securities (also known as “covering” the short position) at a time when the
| LS Opportunity Fund |
| Notes to the Financial Statements (continued) |
| May 31, 2022 |
securities sold short have appreciated in value, thus resulting in a loss to the Fund. The amount of loss may exceed the proceeds received in a short sale. The Fund’s investment performance may also suffer if the Fund is required to close out a short position earlier than it had intended. The Fund must segregate assets determined to be liquid in accordance with procedures established by the Board, or otherwise cover its position in a permissible manner. The Fund will be required to pledge liquid assets to the broker in order to secure its performance on short sales. As a result, the assets pledged may not be available to meet the Fund’s needs for immediate cash or other liquidity. In addition, the Fund may be subject to expenses related to short sales that are not typically associated with investing in securities directly, such as costs of borrowing and margin account maintenance costs associated with the Fund’s open short positions. These types of short sales expenses are sometimes referred to as the “negative cost of carry,” and will reduce the Fund’s potential return on a short sale. The amount of restricted cash or cash equivalents held at the broker as collateral for securities sold short was $46,259,306 as of May 31, 2022.
Dividend expenses on securities sold short and borrowing costs are not covered under the Adviser’s expense limitation agreement with the Fund and, therefore, these expenses will be borne by the shareholders of the Fund.
Purchasing Call Options – The Fund may purchase call options. As the holder of a call option, the Fund has the right to purchase the underlying security at the exercise price at any time during the option period. The Fund may enter into closing sale transactions with respect to such options, exercise them or permit them to expire. The Fund may also purchase call options on relevant stock indexes. Call options may also be purchased by the Fund for the purpose of acquiring the underlying securities for its portfolio. Utilized in this fashion, the purchase of call options enables the Fund to acquire the securities at the exercise price of the call option plus the premium paid. At times the net cost of acquiring securities in this manner may be less than the cost of acquiring the securities directly. This technique may also be useful to the Fund in purchasing a large block of securities that would be more difficult to acquire by direct market purchases. So long as it holds such a call option rather than the underlying security itself, the Fund is partially protected from any unexpected decline in the market price of the underlying security and in such event could allow the call option to expire, incurring a loss only to the extent of the premium paid for the option. The Fund did not transact in purchased call option contracts during the fiscal year ended May 31, 2022.
Purchasing Put Options – The Fund may purchase put options. As the holder of a put option, the Fund has the right to sell the underlying security at the exercise price at any time during the option period. The Fund may enter into closing sale transactions with respect to such options, exercise them or permit them to expire. The Fund may purchase a put option on an owned underlying security (a “protective put”) as a defensive technique
| LS Opportunity Fund |
| Notes to the Financial Statements (continued) |
| May 31, 2022 |
to protect against an anticipated decline in the value of the security. Such hedge protection is provided only during the life of the put option when the Fund, as the holder of the put option, is able to sell the underlying security at the put exercise price regardless of any decline in the underlying security’s market price. The Fund may also purchase put options at a time when it does not own the underlying security. By purchasing put options on a security it does not own, the Fund seeks to benefit from a decline in the market price of the underlying security. If the put option is not sold when it has remaining value, and if the market price of the underlying security remains equal to or greater than the exercise price during the life of the put option, the Fund will lose its entire premium paid for the put option. In order for the purchase of a put option to be profitable, the market price of the underlying security must decline sufficiently below the exercise price to cover the premium and transaction costs. The Fund did not transact in purchased put option contracts during the fiscal year ended May 31, 2022.
Writing Options – The Fund may write covered call options on equity securities that the Fund is eligible to purchase to extend a holding period to obtain long-term capital gain treatment, to earn premium income, to assure a definite price for a security it has considered selling, or to close out options previously purchased. The Fund may write covered call options if, immediately thereafter, not more than 30% of its net assets would be committed to such transactions. A call option gives the holder (buyer) the right to purchase a security at a specified price (the exercise price) at any time until a certain date (the expiration date). A call option is “covered” if the Fund owns the underlying security subject to the call option at all times during the option period. When the Fund writes a covered call option, it maintains a segregated account with its custodian, cash, or liquid portfolio securities in an amount not less than the exercise price at all times while the option is outstanding.
The Fund may write covered put options on equity securities and futures contracts that the Fund is eligible to purchase to earn premium income or to assure a definite price for a security if it is considering acquiring the security at a lower price than the current market price or to close out options previously purchased. The Fund may not write a put option if, immediately thereafter, more than 25% of its net assets would be committed to such transactions. A put option gives the holder of the option the right to sell, and the writer has the obligation to buy, the underlying security at the exercise price at any time during the option period. The operation of put options in other respects is substantially identical to that of call options. When the Fund writes a covered put option, it maintains in a segregated account with its custodian cash or liquid portfolio securities in an amount not less than the exercise price at all times while the put option is outstanding. The Fund did not transact in written option contracts during the fiscal year ended May 31, 2022.
Foreign Currency Exchange Contracts – The Fund may engage in foreign currency exchange transactions. The value of the Fund’s portfolio securities that are invested in
| LS Opportunity Fund |
| Notes to the Financial Statements (continued) |
| May 31, 2022 |
non-U.S. dollar denominated instruments as measured in U.S. dollars may be affected favorably or unfavorably by changes in foreign currency exchange rates, and the Fund may incur costs in connection with conversions between various currencies. The Fund will conduct its foreign currency exchange transactions either on a spot (i.e., cash) basis at the spot rate prevailing in the foreign currency exchange market or through forward foreign currency exchange contracts, to purchase or sell foreign currencies. A forward foreign currency exchange contract involves an obligation to purchase or sell a specific currency at a future date, which may be any fixed number of days from the date of the contract agreed upon by the parties, at a price set at the time of the contract. These contracts are traded directly between currency traders (usually large commercial banks) and their customers. The Fund will not, however, hold foreign currency except in connection with the purchase and sale of foreign portfolio securities. The Fund did not transact in forward foreign currency exchange contracts during the fiscal year ended May 31, 2022.
NOTE 3. SECURITIES VALUATION AND FAIR VALUE MEASUREMENTS
The Fund values its portfolio securities at fair value as of the close of regular trading on the NYSE (normally 4:00 p.m. Eastern time) on each business day the NYSE is open for business. Fair value is defined as the price that the Fund would receive upon selling an investment in a timely transaction to an independent buyer in the principal or most advantageous market of the investment. GAAP establishes a three-tier hierarchy to maximize the use of observable market data and minimize the use of unobservable inputs and to establish classification of fair value measurements for disclosure purposes.
Inputs refer broadly to the assumptions that market participants would use in pricing the asset or liability, including assumptions about risk (the risk inherent in a particular valuation technique used to measure fair value including a pricing model and/or the risk inherent in the inputs to the valuation technique). Inputs may be observable or unobservable. Observable inputs are inputs that reflect the assumptions market participants would use in pricing the asset or liability developed based on market data obtained and available from sources independent of the reporting entity. Unobservable inputs are inputs that reflect the reporting entity’s own assumptions about the assumptions market participants would use in pricing the asset or liability developed based on the best information available in the circumstances.
Various inputs are used in determining the value of the Fund’s investments. These inputs are summarized in the three broad levels listed below.
| ● | Level 1 – unadjusted quoted prices in active markets for identical investments and/or registered investment companies where the value per share is determined and published and is the basis for current transactions for identical assets or liabilities at the valuation date |
| LS Opportunity Fund |
| Notes to the Financial Statements (continued) |
| May 31, 2022 |
| ● | Level 2 – other significant observable inputs (including, but not limited to, quoted prices for an identical security in an inactive market, quoted prices for similar securities, interest rates, prepayment speeds, credit risk, etc.) |
| ● | Level 3 – significant unobservable inputs (including the Fund’s own assumptions in determining fair value of investments based on the best information available) |
The inputs used to measure fair value may fall into different levels of the fair value hierarchy. In such cases, for disclosure purposes, the level in the fair value hierarchy which is reported is determined based on the lowest level input that is significant to the fair value measurement in its entirety.
Equity securities that are traded on any stock exchange are generally valued at the last quoted sale price on the security’s primary exchange. Lacking a last sale price, an exchange-traded security is generally valued at its last bid price, except in the case of a security sold short, in which case the last ask price is utilized. Securities traded in the NASDAQ over-the-counter market are generally valued at the NASDAQ Official Closing Price. When using the market quotations and when the market is considered active, the security is classified as a Level 1 security. In the event that market quotations are not readily available or are considered unreliable due to market or other events, the Fund values its securities and other assets at fair value in accordance with policies established by and under the general supervision of the Board. Under these policies, the securities will be classified as Level 2 or 3 within the fair value hierarchy, depending on the inputs used. Investments in mutual funds, including money market mutual funds, are generally priced at the ending NAV. These securities are categorized as Level 1 securities.
Option contracts in which the Fund invests are generally traded on an exchange. Exchange-traded options on securities and indexes purchased or sold by the Fund generally will be valued at the mean of the last bid and ask prices. If there is no such reported ask on the valuation date, options are valued at the most recent bid price. If there is no such reported bid on the valuation date, options are valued at the most recent ask price. If the Fund decides that a price provided by the pricing service does not accurately reflect the fair value of the securities, when prices are not readily available from a pricing service, or when restricted or illiquid securities are being valued, securities are valued at fair value as determined by the Adviser, in conformity with policies adopted by and subject to review of the Board. These securities will generally be categorized as Level 2 securities.
In accordance with the Trust’s valuation policies, the Adviser is required to consider all appropriate factors relevant to the value of securities for which it has determined other pricing sources are not available or reliable as described above. No single method exists for determining fair value, because fair value depends upon the circumstances of each individual case. As a general principle, the current fair value of a security being valued by
| LS Opportunity Fund |
| Notes to the Financial Statements (continued) |
| May 31, 2022 |
the Adviser would be the amount that the Fund might reasonably expect to receive upon the current sale. Methods that are in accordance with this principle may, for example, be based on (i) a multiple of earnings; (ii) a discount from market prices of a similar freely traded security (including a derivative security or a basket of securities traded on other markets, exchanges or among dealers); or (iii) yield to maturity with respect to debt issues, or a combination of these and other methods. Fair-value pricing is permitted if, in the Adviser’s opinion, the validity of market quotations appears to be questionable based on factors such as evidence of a thin market in the security based on a small number of quotations, a significant event occurs after the close of a market but before the Fund’s NAV calculation that may affect a security’s value, or the Adviser is aware of any other data that calls into question the reliability of market quotations.
The following is a summary of the inputs used to value the Fund’s investments as of May 31, 2022:
| | | Valuation Inputs | |
| Assets | | Level 1 | | | Level 2 | | | Level 3 | | | Total | |
| Common Stocks -Long-Domestic (a) | | $ | 113,666,140 | | | $ | — | | | $ | — | | | $ | 113,666,140 | |
| Common Stocks -Long-International (a) | | | 17,090,682 | | | | — | | | | — | | | | 17,090,682 | |
| Exchange-Traded Funds | | | 1,696,500 | | | | — | | | | — | | | | 1,696,500 | |
| Money Market Funds | | | 5,146,668 | | | | — | | | | — | | | | 5,146,668 | |
| Total | | $ | 137,599,990 | | | $ | — | | | $ | — | | | $ | 137,599,990 | |
| (a) | Refer to Schedule of Investments for sector classifications. |
| | | Valuation Inputs | |
| Liabilities | | Level 1 | | | Level 2 | | | Level 3 | | | Total | |
| Common Stocks-Short- Domestic(a) | | $ | (34,438,069 | ) | | $ | — | | | $ | — | | | $ | (34,438,069 | ) |
| Common Stocks-Short- International(a) | | | (5,713,309 | ) | | | — | | | | — | | | | (5,713,309 | ) |
| Exchange-Traded Funds | | | (3,558,394 | ) | | | — | | | | — | | | | (3,558,394 | ) |
| Total | | $ | (43,709,772 | ) | | $ | — | | | $ | — | | | $ | (43,709,772 | ) |
| (a) | Refer to Schedule of Securities Sold Short for sector classifications. |
The Fund did not hold any investments at the end of the reporting period for which significant unobservable inputs (Level 3) were used in determining fair value; therefore, no reconciliation of Level 3 securities is included for this reporting period.
| LS Opportunity Fund |
| Notes to the Financial Statements (continued) |
| May 31, 2022 |
NOTE 4. FEES AND OTHER TRANSACTIONS WITH AFFILIATES AND OTHER SERVICE PROVIDERS
The Adviser, under the terms of the management agreement (the “Agreement”), manages the Fund’s investments. As compensation for its management services, the Fund pays the Adviser a fee, computed and accrued daily and paid monthly, at an annual rate of 1.75% of the Fund’s average daily net assets. For the fiscal year ended May 31, 2022, the Adviser earned a fee of $2,410,601 from the Fund before the waivers described below. At May 31, 2022, the Adviser was owed $198,376 from the Fund for management services.
The Adviser has contractually agreed to waive its management fee and/or reimburse certain Fund operating expenses, but only to the extent necessary so that the Fund’s net expenses (excluding borrowing costs such as interest and dividends on securities sold short, taxes, brokerage commissions, other expenditures which are capitalized in accordance with generally accepted accounting principles, other extraordinary expenses not incurred in the ordinary course of the Fund’s business, expenses incurred under a Rule 12b-1 plan of distribution, “acquired fund fees and expenses” (i.e., investment companies in which the Fund may invest), and expenses that the Fund has incurred but did not actually pay because of an expense offset arrangement) do not exceed 1.95% of the average daily net assets of the Fund.
Each fee waiver or expense reimbursement by the Adviser is subject to repayment by the Fund within the three years following the date on which the fee waiver or expense reimbursement occurred, provided that the Fund is able to make the repayment without exceeding the expense limitation that is in effect at the time of the repayment or at the time of the fee waiver or expense reimbursement, whichever is lower. The contractual agreement is in effect through September 30, 2022. The expense cap may not be terminated prior to this date except by mutual consent of the Adviser and the Board. For the fiscal year ended May 31, 2022, the Adviser waived fees of $47,098. The amounts subject to repayment by the Fund, pursuant to the aforementioned conditions, are as follows:
| Recoverable Through |
| May 31, 2023 | | $ | 116,628 | |
| May 31, 2024 | | | 81,080 | |
| May 31, 2025 | | | 47,098 | |
The Trust retains Ultimus Fund Solutions, LLC (“Ultimus” or the “Administrator”) to provide the Fund with administration, fund accounting and transfer agent services, including all regulatory reporting. Prior to April 1, 2022, the Administrator also provided certain compliance services to the Fund. For the fiscal year ended May 31, 2022, the Administrator earned fees of $103,329 for administration services, $12,000 for compliance
| LS Opportunity Fund |
| Notes to the Financial Statements (continued) |
| May 31, 2022 |
services, $43,927 for fund accounting services and $18,090 for transfer agent services. At May 31, 2022, the Fund owed the Administrator $14,691 for such services.
Effective April 1, 2022, Northern Lights Compliance Services, LLC (“NLCS”), an affiliate of Ultimus, provides a Chief Compliance Officer to the Trust, as well as related compliance services, pursuant to a consulting agreement between NLCS and the Trust. Under the terms of such agreement, NLCS receives fees from the Fund.
The officers and one trustee of the Trust are members of management and/or employees of the Administrator, or of NLCS, and are not paid by the Trust for services to the Fund. Ultimus Fund Distributors, LLC (the “Distributor”) acts as the distributor of the Fund’s shares. The Distributor is a wholly-owned subsidiary of Ultimus. There were no payments made to the Distributor by the Fund for the fiscal year ended May 31, 2022.
NOTE 5. PURCHASES AND SALES OF SECURITIES
For the fiscal year ended May 31, 2022, purchases and sales of investment securities, including short sales and covers, other than short-term investments, were $97,799,853 and $89,683,039, respectively.
There were no purchases or sales of long-term U.S. government obligations during the fiscal year ended May 31, 2022.
NOTE 6. FEDERAL TAX INFORMATION
At May 31, 2022, the net unrealized appreciation (depreciation) and tax cost of investments and securities sold short for tax purposes was as follows:
| Gross unrealized appreciation | | $ | 20,838,049 | |
| Gross unrealized depreciation | | | (5,660,442 | ) |
| Net unrealized appreciation on investments | | $ | 15,177,607 | |
| Tax cost of investments and securities sold short | | $ | 78,712,611 | |
The difference between book basis and tax basis unrealized appreciation is attributable primarily to the tax deferral of losses on wash sales, grantor trust adjustments and return of capital distributions from underlying investments.
| LS Opportunity Fund |
| Notes to the Financial Statements (continued) |
| May 31, 2022 |
The tax character of distributions paid for the fiscal years ended May 31, 2022 and May 31, 2021 were as follows:
| | | 2022 | | | 2021 | |
| Distributions paid from:(a) | | | | | | | | |
| Ordinary income | | $ | — | | | $ | — | |
| Long-term capital gains | | | 5,931,433 | | | | 1,399,284 | |
| Total distributions paid | | $ | 5,931,433 | | | $ | 1,399,284 | |
| (a) | Short-term capital gain distributions are treated as ordinary income for tax purposes. |
At May 31, 2022, the components of accumulated earnings (deficit) on a tax basis were as follows:
| Undistributed long-term capital gains | | $ | 6,590,288 | |
| Accumulated capital and other losses | | | (698,160 | ) |
| Unrealized appreciation on investments | | | 15,176,799 | |
| Total accumulated earnings | | $ | 21,068,927 | |
Certain qualified late year ordinary losses incurred after December 31, and within the current taxable year, are deemed to arise on the first business day of the Fund’s following taxable year. For the tax year ended May 31, 2022, the Fund deferred Qualified Late Year Ordinary Losses in the amount of $695,084.
NOTE 7. SECTOR RISK
If the Fund has significant investments in the securities of issuers within a particular sector, any development affecting that sector will have a greater impact on the value of the net assets of the Fund than would be the case if the Fund did not have significant investments in that sector. In addition, this may increase the risk of loss in the Fund and increase the volatility of the Fund’s NAV per share. For instance, economic or market factors, regulatory changes or other developments may negatively impact all companies in a particular sector, and therefore the value of the Fund’s portfolio will be adversely affected. As of May 31, 2022, the Fund had 31.43% of the net long/short value of its net assets invested in stocks within the Financials sector.
NOTE 8. COMMITMENTS AND CONTINGENCIES
The Trust indemnifies its officers and Trustees for certain liabilities that may arise from their performance of their duties to the Trust or the Fund. Additionally, in the normal course of business, the Trust enters into contracts that contain a variety of representations and warranties which provide general indemnifications. The Trust’s maximum exposure
| LS Opportunity Fund |
| Notes to the Financial Statements (continued) |
| May 31, 2022 |
under these arrangements is unknown, as this would involve future claims that may be made against the Trust that have not yet occurred.
NOTE 9. SUBSEQUENT EVENTS
Management of the Fund has evaluated the need for disclosures and/or adjustments resulting from subsequent events through the date at which these financial statements were issued. Based upon this evaluation, management has determined there were no items requiring adjustment of the financial statements or additional disclosure.
| Report of Independent Registered Public Accounting Firm |
To the Shareholders of LS Opportunity Fund and
Board of Trustees of Valued Advisers Trust
Opinion on the Financial Statements
We have audited the accompanying statement of assets and liabilities, including the schedules of investments and securities sold short, of LS Opportunity Fund (the “Fund”), a series of Valued Advisers Trust, as of May 31, 2022, the related statement of operations for the year then ended, the statements of changes in net assets for each of the two years in the period then ended, the related notes, and the financial highlights for each of the five years in the period then ended (collectively referred to as the “financial statements”). In our opinion, the financial statements present fairly, in all material respects, the financial position of the Fund as of May 31, 2022, the results of its operations for the year then ended, the changes in net assets for each of the two years in the period then ended, and the financial highlights for each of the five years in the period then ended, in conformity with accounting principles generally accepted in the United States of America.
Basis for Opinion
These financial statements are the responsibility of the Fund’s management. Our responsibility is to express an opinion on the Fund’s financial statements based on our audits. We are a public accounting firm registered with the Public Company Accounting Oversight Board (United States) (“PCAOB”) and are required to be independent with respect to the fund in accordance with the U.S. federal securities laws and the applicable rules and regulations of the Securities and Exchange Commission and the PCAOB.
We conducted our audits in accordance with the standards of the PCAOB. Those standards require that we plan and perform the audit to obtain reasonable assurance about whether the financial statements are free of material misstatement whether due to error or fraud.
Our audits included performing procedures to assess the risks of material misstatement of the financial statements, whether due to error or fraud, and performing procedures that respond to those risks. Such procedures included examining, on a test basis, evidence regarding the amounts and disclosures in the financial statements. Our procedures included confirmation of securities owned as of May 31, 2022, by correspondence with the custodian and brokers. Our audits also included evaluating the accounting principles used and significant estimates made by management, as well as evaluating the overall presentation of the financial statements. We believe that our audits provide a reasonable basis for our opinion.
We have served as the Fund’s auditor since 2011.
COHEN & COMPANY, LTD.
Cleveland, Ohio
July 26, 2022
| Summary of Fund Expenses (Unaudited) |
As a shareholder of the Fund, you incur two types of costs: (1) transaction and (2) ongoing costs, including management fees and other Fund expenses. These examples are intended to help you understand your ongoing costs (in dollars) of investing in the Fund and to compare these costs with the ongoing costs of investing in other funds. The example is based on an investment of $1,000 invested at the beginning of the period and held for the entire period from December 1, 2021 through May 31, 2022.
Actual Expenses
The first line of the table below provides information about actual account values and actual expenses. You may use the information in this line, together with the amount you invested, to estimate the expenses that you paid over the period. Simply divide your account value by $1,000 (for example, an $8,600 account value divided by $1,000 = 8.6), then multiply the result by the number in the first line under the heading “Expenses Paid During Period” to estimate the expenses you paid on your account during this period.
Hypothetical Example for Comparison Purposes
The second line of the table below provides information about hypothetical account values and hypothetical expenses based on the Fund’s actual expense ratio and an assumed rate of return of 5% per year before expenses, which is not the Fund’s actual return. The hypothetical account values and expenses may not be used to estimate the actual ending account balance or expenses you paid for the period. You may use this information to compare the ongoing costs of investing in the Fund and other funds. To do so, compare this 5% hypothetical example with the 5% hypothetical examples that appear in the shareholder reports of other funds.
Expenses shown in the table are meant to highlight your ongoing costs only and do not reflect any transactional costs. Therefore, the second line of the table below is useful in comparing ongoing costs only and will not help you determine the relative costs of owning different funds. In addition, if transaction costs were included, your costs would have been higher.
| | | Beginning | | | Ending | | | | | | |
| | | Account | | | Account | | | Expenses | | | |
| | | Value | | | Value | | | Paid | | | Annualized |
| | | December | | | May 31, | | | During | | | Expense |
| | | 1, 2021 | | | 2022 | | | Period(a) | | | Ratio |
| Actual | | $ | 1,000.00 | | | $ | 1,013.70 | | | $ | 15.38 | | | 3.06% |
| Hypothetical(b) | | $ | 1,000.00 | | | $ | 1,009.66 | | | $ | 15.35 | | | 3.06% |
| (a) | Expenses are equal to the Fund’s annualized expense ratio, multiplied by the average account value over the period, multiplied by 182/365 (to reflect the one-half year period). |
| (b) | Hypothetical assumes 5% annual return before expenses. |
| Additional Federal Income Tax Information (Unaudited) |
The Form 1099-DIV you receive in January 2023 will show the tax status of all distributions paid to your account in calendar year 2022. Shareholders are advised to consult their own tax adviser with respect to the tax consequences of their investment in the Fund. As required by the Internal Revenue Code and/or regulations, shareholders must be notified regarding the status of qualified dividend income for individuals and the dividends received deduction for corporations.
Qualified Dividend Income. The Fund designates approximately 0% or up to the maximum amount of such dividends allowable pursuant to the Internal Revenue Code, as qualified dividend income eligible for a reduced tax rate.
Qualified Business Income. The Fund designates approximately 0% of its ordinary income dividends, or up to the maximum amount of such dividends allowable pursuant to the Internal Revenue Code, as qualified business income.
Dividends Received Deduction. Corporate shareholders are generally entitled to take the dividends received deduction on the portion of the Fund’s dividend distribution that qualifies under tax law. For the Fund’s calendar year 2022 ordinary income dividends, 0% qualifies for the corporate dividends received deduction.
For the year ended May 31, 2022, the Fund designated $5,931,433 as long-term capital gain distributions.
| Adviser Agreement Renewal (Unaudited) |
At a meeting held on March 17, 2022, the Board of Trustees (the “Board”) considered the renewal of the Investment Advisory Agreement (the “LSA Agreement”) between Valued Advisers Trust (the “Trust”) and Long Short Advisors, LLC (“LSA”) with respect to the LS Opportunity Fund (the “LS Fund”). LSA provided written information to the Board to assist the Board in its considerations.
Counsel reminded the Trustees of their fiduciary duties and responsibilities with respect to their consideration of the continuance of investment advisory agreements, including the factors to be considered, and the application of those factors to LSA and the LSA Agreement. In assessing the factors and reaching its decision, the Board took into consideration information furnished by LSA and the Trust’s other service providers for the Board’s review and consideration throughout the year at regular Board meetings, as well as information specifically prepared or presented in connection with the renewal process, including information presented at this meeting. The Board requested and was provided with, and reflected on, information and reports relevant to the annual renewal of the LSA Agreement, including: (i) reports regarding the services and support provided to the LS Fund by LSA; (ii) quarterly assessments of the investment performance of the LS Fund; (iii) commentary on the reasons for the performance; (iv) presentations by LSA addressing its investment philosophy, investment strategy, personnel, and operations; (v) compliance and audit reports concerning the LS Fund and LSA; (vi) disclosure information contained in the Trust’s registration statement and LSA’s Form ADV; (vii) information relating to the manner in which LSA oversees Prospector Partners, LLC, the LS Fund’s sub-adviser; and (viii) a memorandum from counsel, that summarized the fiduciary duties and responsibilities of the Board in reviewing and approving the LSA Agreement. The Board also requested and received various informational materials including, without limitation: (a) documents containing information about LSA, including its financial information; a description of its personnel and the services it provides to the LS Fund; information on LSA’s investment advice and performance; summaries of the LS Fund’s expenses, compliance program, current legal matters, and other general information; (b) comparative expense and performance information for other mutual funds with strategies similar to the LS Fund; and (c) the benefits to be realized by LSA from its relationship with the LS Fund. The Board did not identify any particular information that was most relevant to its consideration of the LSA Agreement and each Trustee may have afforded different weight to the various factors.
1. The nature, extent, and quality of the services to be provided by LSA. In this regard, the Board considered LSA’s responsibilities under the LSA Agreement. The Trustees considered the services being provided by LSA to the LS Fund including its process for overseeing the sub-adviser’s portfolio management of the LS Fund, assuring compliance with the LS Fund’s investment objectives and limitations, its coordination of services for the LS Fund among the LS Fund’s service providers, and its efforts to promote the LS Fund and grow its assets. The Trustees reviewed the steps LSA takes to oversee and supervise the sub-adviser, as described in the materials provided by LSA. The Trustees considered LSA’s continuity of, and commitment to retain, qualified personnel and LSA’s commitment to maintain and enhance its resources and systems. The Trustees considered LSA’s personnel, including the education and experience of LSA’s personnel. After considering the foregoing information and further information in the Meeting materials provided by LSA (including LSA’s Form ADV), the Board concluded that, in light of all the facts and circumstances, the nature, extent and quality of the services provided by LSA were satisfactory and adequate for the LS Fund.
2. Investment performance of the LS Fund and LSA. In considering the investment performance of the LS Fund, the Trustees noted that LSA did not manage any accounts directly and that it had delegated the portfolio management responsibilities of the LS Fund to a sub-adviser.
| Adviser Agreement Renewal (Unaudited) (continued) |
Accordingly, the Trustees concluded that their consideration of this factor for LSA was less relevant in their determination of LSA’s performance of its duties than other factors. The Trustees considered the consistency of LSA’s management oversight of the LS Fund’s sub-adviser with the LS Fund’s investment objective, strategies, and limitations. The Trustees also compared the performance of the LS Fund with the performance of its Morningstar category. The Trustees noted that the LS Fund’s performance was below the average and median of the category for the one-year period ended December 31, 2021, below the average but above the median for the three-year period, and above both the median and the average for the five-year and ten-year periods. As compared to its custom peer group, the Trustees observed that the performance of the LS Fund was above the median for the one-year, three-year, and five-year periods ended December 31, 2021, and below the median for the since inception period. After reviewing and discussing the investment performance of the LS Fund further, LSA’s experience in overseeing the sub-adviser to the LS Fund, the LS Fund’s historical performance, and other relevant factors, the Board concluded, in light of all the facts and circumstances, that the investment performance, and LSA’s oversight of the sub-adviser to the LS Fund was satisfactory.
3. The costs of the services to be provided and profits to be realized by LSA from its relationship with the LS Fund. In considering the costs of services to be provided and the profits to be realized by LSA from its relationship with the LS Fund, the Trustees considered: (1) LSA’s financial condition; (2) asset levels of the LS Fund; (3) the overall expenses of the LS Fund; and (4) the nature and frequency of advisory fee payments. The Trustees reviewed information provided by LSA regarding its profits associated with managing the LS Fund. The Trustees also considered potential benefits for LSA in managing the LS Fund. The Trustees then compared the fees and expenses of the LS Fund (including the management fee) to other comparable mutual funds. The Trustees noted that the LS Fund’s management fee and net expense ratio were higher than the average and median of its Morningstar category, and higher than the average and median of its peer group. In this regard, the Trustees reflected upon their previous discussions with representatives of LSA, and commented on LSA’s assertion that the firm provided a premium product in comparison to other products to which they were compared in the marketplace. The Board concluded that the fees to be paid to LSA by the LS Fund and the profits to be realized by LSA, in light of all the facts and circumstances, were fair and reasonable in relation to the nature and quality of the services provided by LSA.
4. The extent to which economies of scale would be realized as the LS Fund grows and whether advisory fee levels reflect these economies of scale for the benefit of the LS Fund’s investors. In this regard, the Board considered the LS Fund’s fee arrangements with LSA. The Board considered that while the management fee remained the same at all asset levels, the LS Fund’s shareholders had experienced benefits from the expense limitation arrangement. The Trustees noted that once the LS Fund’s expenses fell below the cap set by the arrangement, the shareholders would continue to benefit from the economies of scale under the LS Fund’s agreements with service providers other than LSA. In light of its ongoing consideration of the LS Fund’s asset levels, expectations for growth in the LS Fund, and fee levels, the Board determined that the LS Fund’s fee arrangements, in light of all the facts and circumstances, were fair and reasonable in relation to the nature and quality of the services provided by LSA.
5. Possible conflicts of interest and benefits to LSA. In considering LSA’s practices regarding conflicts of interest, the Trustees evaluated the potential for conflicts of interest and considered such
| Adviser Agreement Renewal (Unaudited) (continued) |
matters as the experience and ability of the advisory personnel assigned to the LS Fund; and the substance and administration of LSA’s code of ethics. The Trustees also considered disclosure in the registration statement of the Trust relating to LSA’s potential conflicts of interest. The Trustees noted that LSA identified no other potential benefits (in addition to the management fee) to LSA. Based on the foregoing, the Board determined that LSA’s standards and practices relating to the identification and mitigation of potential conflicts of interest and the benefits to be realized by LSA in managing the LS Fund were satisfactory.
After additional consideration of the relevant factors and further discussion among the Board members, the Board determined to approve the continuation of the LSA Agreement between the Trust and LSA.
| Sub-Adviser Agreement Renewal (Unaudited) |
At a meeting held on March 17, 2022, the Board of Trustees (the “Board”) considered the renewal of the Investment Sub-Advisory Agreement (the “Prospector Agreement”) between Long Short Advisors, LLC (“LSA”) and Prospector Partners, LLC (“Prospector”) with respect to the LS Opportunity Fund (the “LS Fund”). Prospector provided written information to the Board to assist the Board in its considerations.
Counsel reminded the Trustees of their fiduciary duties and responsibilities with respect to their consideration of the continuance of investment sub-advisory agreements, including the factors to be considered, and the application of those factors to Prospector and the Prospector Agreement. In assessing the factors and reaching its decision, the Board took into consideration information furnished by Prospector and the Trust’s other service providers for the Board’s review and consideration throughout the year at regular Board meetings, as well as information specifically prepared or presented in connection with the renewal process, including information presented at this meeting. The Board requested and was provided with, and reflected on, information and reports relevant to the annual renewal of the Prospector Agreement, including: (i) reports regarding the services and support provided to the LS Fund by Prospector; (ii) quarterly assessments of the investment performance of the LS Fund; (iii) commentary on the reasons for the performance; (iv) compliance and audit reports concerning the LS Fund and Prospector; (v) disclosure information contained in the Trust’s registration statement and Prospector’s Form ADV; and (vi) a memorandum from Counsel, that summarized the fiduciary duties and responsibilities of the Board in reviewing and approving the Prospector Agreement. The Board also requested and received various informational materials including, without limitation: (a) documents containing information about Prospector, including its financial information; a description of its personnel and the services it provides to the LS Fund; information on Prospector’s investment advice and performance; summaries of the LS Fund’s expenses, compliance program, current legal matters, and other general information; (b) comparative expense and performance information for other mutual funds with strategies similar to the LS Fund; and (c) the benefits to be realized by Prospector from its relationship with the LS Fund. The Board did not identify any particular information that was most relevant to its consideration to approve the Prospector Agreement and each Trustee may have afforded different weight to the various Factors.
1. The nature, extent, and quality of the services to be provided by Prospector. In this regard, the Board considered Prospector’s responsibilities under the Prospector Agreement. The Board considered the services being provided by Prospector to the LS Fund, including without limitation: the quality of its investment sub-advisory services (including research and recommendations with respect to portfolio securities), and its process for formulating investment recommendations and assuring compliance with the LS Fund’s investment objectives and limitations. The Board considered Prospector’s continuity of, and commitment to retain, qualified personnel and Prospector’s commitment to maintain its resources and systems. The Board considered Prospector’s personnel, including the education and experience of the personnel and Prospector’s compliance program, policies and procedures. The Board considered the arrangements between LSA and Prospector pursuant to which Prospector has an on-going arrangement with respect to the Fund in which it would agree to waive, to a degree, a portion of its sub-advisory fees and commit to an exclusivity arrangement between itself and LSA with respect to managing other mutual funds with similar objectives. After considering the foregoing information and further information in the Meeting materials provided by Prospector (including its Form ADV), the Board concluded that, in light of all
| Sub-Adviser Agreement Renewal (Unaudited) (continued) |
the facts and circumstances, the nature, extent, and quality of the services provided by Prospector were satisfactory and adequate for the LS Fund.
2. Investment Performance of the LS Fund and Prospector. In considering the investment performance of the LS Fund and Prospector, the Trustees considered the consistency of Prospector’s management of the LS Fund with the LS Fund’s investment objective, strategies, and limitations. The Trustees also compared the performance of the LS Fund with the performance of its Morningstar category. The Trustees focused on the performance since Prospector assumed its role as sub-adviser on May 28, 2015. They noted that the LS Fund’s performance was below the average and median of the category for the one-year period ended December 31, 2021, below the average but above the median for the three-year period, and above both the median and the average for the five-year period. As compared to its custom peer group, the Trustees observed that the performance of the LS Fund was above the median for the one-year, three-year, and five-year periods ended December 31, 2021. The Trustees also observed that the LS Fund had outperformed as compared to its style-specific benchmark for the one-year period ended December 31, 2021, and for the period since Prospector began managing the portfolio. With respect to its broad-based benchmark, the Trustees noted that the LS Fund had underperformed for all periods considered. After reviewing and discussing the investment performance of the LS Fund further, Prospector’s experience sub-advising the LS Fund, the LS Fund’s performance since Prospector began managing the portfolio, and other relevant factors, the Board concluded, in light of all the facts and circumstances, that the investment performance of the LS Fund and Prospector was satisfactory.
3. The costs of the services to be provided and profits to be realized by Prospector from the relationship with the LS Fund. In this regard, the Board considered: (1) Prospector’s financial condition; (2) asset levels of the LS Fund; (3) the overall expenses of the LS Fund; and (4) the nature and frequency of sub-advisory fee payments. The Trustees reviewed information provided by Prospector regarding its profits associated with managing the LS Fund. The Board also considered potential benefits for Prospector in managing the Fund. The Board compared the fees and expenses of the Fund (including the sub-advisory fee) to other private fund accounts managed by Prospector, and determined that the fee arrangements were relatively comparable in light of the differing structures. Following this comparison and upon further consideration and discussion of the foregoing, the Board concluded that the fees to be paid to Prospector by LSA and the profits to be realized by Prospector, in light of all the facts and circumstances, were fair and reasonable in relation to the nature and quality of the services provided by Prospector.
4. The extent to which economies of scale would be realized as the Fund grows and whether advisory fee levels reflect these economies of scale for the benefit of the LS Fund’s investors. In this regard, the Board considered the Fund’s fee arrangements with Prospector. The Board considered that while the sub-advisory fee changed with changes in the Fund’s assets, the Fund’s shareholders did not realize any changes in their overall expenses as Prospector’s fee was paid entirely from the advisory fee paid to LSA, which was fixed. The Board considered the sub-advisory fees in light of the overall arrangement with the Fund’s investment adviser. In light of the foregoing, the Board determined that the LS Fund’s fee arrangements for Prospector, in light of all the facts and circumstances, were fair and reasonable in relation to the nature and quality of the services provided by Prospector.
| Sub-Adviser Agreement Renewal (Unaudited) (continued) |
5. Possible conflicts of interest and benefits to Prospector. In evaluating Prospector’s practices regarding conflicts of interest, the Trustees evaluated the potential for conflicts of interest and considered such matters as the experience and ability of the advisory personnel assigned to the LS Fund; the basis of decisions to buy or sell securities for the LS Fund and/or Prospector’s other accounts; the substance and administration of Prospector’s code of ethics and other relevant policies described in Prospector’s Form ADV, and affiliations and associations of Prospector and its principals. The Board concluded that the foregoing matters were appropriately disclosed and managed by Prospector. With respect to benefits to Prospector (in addition to the fees under the Prospector Agreement), the Board noted that Prospector would benefit from its relationship with the LS Fund as the LS Fund would provide a more diversified investor base and an alternative vehicle in which to place clients with initial investments below the minimum for its private funds. Following further consideration and discussion, the Board determined that Prospector’s standards and practices relating to the identification and mitigation of potential conflicts of interest were satisfactory and the benefits to be realized by Prospector from managing the LS Fund were satisfactory.
After additional consideration of the relevant factors and further discussion among the Board members, the Board determined to approve the continuation of the Prospector Agreement between LSA and Prospector.
| Trustees and Officers (Unaudited) |
The Board of Trustees supervises the business activities of the Trust. Each Trustee serves as a trustee until termination of the Trust unless the Trustee dies, resigns, retires or is removed.
The following table provides information regarding each of the Independent Trustees.
Name, Address*, (Age),
Position with Trust**,
Term of Position with Trust | Principal Occupation During
Past 5 Years and Other
Directorships | Other Directorships |
Andrea N. Mullins, 55
Independent Trustee
Since December 2013
Chairperson since
March 2017 | Current: Private investor; Independent Contractor, SWM Advisors (since April 2014). | Trustee, Angel Oak Funds Trust (since February 2019) (5 portfolios); Trustee, Angel Oak Strategic Credit Fund (since February 2019); Trustee, Angel Oak Financial Strategies Income Term Trust (since May 2019); Trustee, Angel Oak Dynamic Financial Strategies Income Term Trust (since June 2020); Trustee, Angel Oak Credit Opportunities Term Trust (since January 2021); Trustee and Audit Committee Chair, Cushing Mutual Funds Trust (since November 2021) (2 portfolios); Trustee and Audit Committee Chair,Cushing MLP & Infrastructure Fund (since November 2021). |
| Trustees and Officers (Unaudited) (continued) |
Name, Address*, (Age),
Position with Trust**, Term
of Position with Trust | Principal Occupation During
Past 5 Years and Other
Directorships | Other Directorships |
Ira P. Cohen, 63
Independent Trustee
Since June 2010 | Current: Independent financial services consultant (since February 2005); Executive Vice President of Asset Management Services, Recognos Financial (since August 2015). | Trustee and Audit Committee Chairman, Apollo Diversified Real Estate Fund (since March 2022); Trustee, Chairman and Nominating and Governance Committee Chairman, Angel Oak Funds Trust (since October 2014) (5 portfolios); Trustee, Chairman, and Nominating and Governance Committee Chairman, Angel Oak Strategic Credit Fund (since December 2017); Trustee, Chairman, and Nominating and Governance Committee Chairman, Angel Oak Financial Strategies Income Term Trust (since May 2019); Trustee, Chairman, and Nominating and Governance Committee Chairman, Angel Oak Dynamic Financial Strategies Income Term Trust (since June 2020); Trustee, Chairman, and Nominating and Governance Committee Chairman, Angel Oak Credit Opportunities Term Trust (since January 2021); Trustee and Nominating and Governance Committee Chairman, U.S. Fixed Income Trust (since March 2019). |
| * | The address for each Trustee is 225 Pictoria Drive, Suite 450, Cincinnati, Ohio 45246. |
| ** | As of the date of this report, the Trust consists of 15 series. |
The following table provides information regarding the Trustee who is considered an “interested person” of the Trust, as that term is defined under the 1940 Act.
| Trustees and Officers (Unaudited) (continued) |
Name, Address*, (Age),
Position with Trust**,
Term of Position with Trust | Principal Occupation During
Past 5 Years and Other
Directorships | Other Directorships |
Mark J. Seger***, 60
Trustee Since March 2017 | Current: Vice Chairman and Co-Founder, Ultimus Fund Solutions, LLC and its subsidiaries (since 1999). | None. |
| * | The address for each Trustee is 225 Pictoria Drive, Suite 450, Cincinnati, Ohio 45246. |
| ** | As of the date of this report, the Trust consists of 16 series. |
| *** | Mr. Seger is considered an “interested person” of the Trust because of his relationship with the Trust’s administrator, transfer agent, and distributor. |
The following table provides information regarding the Officers of the Trust:
Name, Address*, (Age),
Position with Trust**,
Term of Position with Trust | Principal Occupation During
Past 5 Years | Other Directorships |
Matthew J. Miller, 46
Principal Excecutive Officer
and President Since March
2022
Vice President
From December 2011 to
March 2022 | Current: Vice President, Ultimus Fund Solutions, LLC (since December 2015). | None. |
N. Lynn Bowley, 63
Chief Compliance Officer
Since April 2022 | Current: Senior Vice President, Senior Compliance Officer, Northern Lights Compliance Services, LLC (since January 2007). | None. |
Carol J. Highsmith, 57
Vice President Since August
2008
Secretary Since March 2014 | Current: Vice President, Ultimus Fund Solutions, LLC (since December 2015). | None. |
Zachary P. Richmond, 42
Principal Financial Officer
and Treasurer Since
September 2021 | Current:Vice President, Financial Administration, Ultimus Fund Solutions, LLC (since February 2019). Previous:Assistant Vice President, Associate Director of Financial Administration, Ultimus Fund Solutions, LLC (December 2015 to February 2019). | None. |
| Trustees and Officers (Unaudited) (continued) |
Name, Address*, (Age),
Position with Trust**, Term
of Position with Trust | Principal Occupation During
Past 5 Years and Other
Directorships | Other Directorships |
Stephen L. Preston, 55
AML Officer Since June
2017 | Current: Chief Compliance Officer of Ultimus Fund Distributors, LLC (since June 2011), Vice President, Financial Operations Principal, and Anti-Money Laundering Officer, Ultimus Fund Distributors, LLC (since April 2021), Treasurer, Financial Operations Principal, Chief Compliance Officer, and Anti-Money Laundering Officer, Northern Lights Distributors, LLC (since April 2021). Previous: Chief Compliance Officer, Ultimus Fund Solutions, LLC (June 2011 to August 2019); Chief Compliance Officer, Unified Financial Securities, LLC (April 2018 to December 2019) | None. |
| * | The address for each Officer is 225 Pictoria Drive, Suite 450, Cincinnati, Ohio 45246. |
| ** | As of the date of this report, the Trust consists of 15 series. |
Other Information (Unaudited)
The Fund’s Statement of Additional Information (“SAI”) includes additional information about the trustees and is available without charge, upon request. You may call toll-free at (855) 575-2430 to request a copy of the SAI or to make shareholder inquiries.
Privacy Policy
| FACTS | WHAT DOES LS OPPORTUNITY FUND (THE “FUND”) DO WITH YOUR PERSONAL INFORMATION? |
| |
| Why? | Financial companies choose how they share your personal information. Federal law gives consumers the right to limit some but not all sharing. Federal law also requires us to tell you how we collect, share, and protect your personal information. Please read this notice carefully to understand what we do. |
| |
| What? | The types of personal information we collect and share depend on the product or service you have with us. This information can include: |
| | |
| | ■ Social Security number |
| | |
| | ■ account balances and account transactions |
| | |
| | ■ transaction or loss history and purchase history |
| | |
| | ■ checking account information and wire transfer instructions |
| | |
| | When you are no longer our customer, we continue to share your information as described in this notice. |
| |
| How? | All financial companies need to share customers’ personal information to run their everyday business. In the section below, we list the reasons financial companies can share their customers’ personal information; the reasons the Fund chooses to share; and whether you can limit this sharing. |
| Reasons we can share your personal information | Does the Fund share? |
For our everyday business purposes —
such as to process your transactions, maintain your account(s), respond to court orders and legal investigations, or report to credit bureaus | Yes |
For our marketing purposes —
to offer our products and services to you | No |
| For joint marketing with other financial companies | No |
For our affiliates’ everyday business purposes —
information about your transactions and experiences | No |
For our affiliates’ everyday business purposes —
information about your creditworthiness | No |
| For nonaffiliates to market to you | No |
| Questions? | Call (877) 336-6763 |
| Who we are |
| Who is providing this notice? | LS Opportunity Fund
Ultimus Fund Distributors, LLC (Distributor)
Ultimus Fund Solutions, LLC (Administrator) |
| What we do |
| How does the Fund protect my personal information? | To protect your personal information from unauthorized access and use, we use security measures that comply with federal law. These measures include computer safeguards and secured files and buildings. Our service providers are held accountable for adhering to strict policies and procedures to prevent any misuse of your nonpublic personal information. |
| How does the Fund collect my personal information? | We collect your personal information, for example, when you ■ open an account or deposit money ■ buy securities from us or sell securities to us ■ make deposits or withdrawals from your account ■ give us your account information ■ make a wire transfer ■ tell us who receives the money ■ tell us where to send the money ■ show your government-issued ID ■ show your driver’s license |
| Why can’t I limit all sharing? | Federal law gives you the right to limit only ■ sharing for affiliates’ everyday business purposes— information about your creditworthiness ■ affiliates from using your information to market to you ■ sharing for nonaffiliates to market to you State laws and individual companies may give you additional rights to limit sharing. |
| Definitions |
| Affiliates | Companies related by common ownership or control. They can be financial and nonfinancial companies. ■ Long Short Advisors, LLC, the investment adviser to the Fund, could be deemed to be an affiliate. |
| Nonaffiliates | Companies not related by common ownership or control. They can be financial and nonfinancial companies. ■ The Fund does not share your personal information with nonaffiliates so they can market to you |
| Joint marketing | A formal agreement between nonaffiliated financial companies that together market financial products or services to you. ■ The Fund does not jointly market. |
Proxy Voting
A description of the policies and procedures that the Fund uses to determine how to vote proxies relating to portfolio securities and information regarding how the Fund voted those proxies during the most recent twelve month period ended June 30, are available (1) without charge upon request by calling the Fund at (855) 575-2430 and (2) in Fund documents filed with the SEC on the SEC’s website at www.sec.gov.
TRUSTEES Andrea N. Mullins, Chairperson Ira P. Cohen Mark J. Seger OFFICERS Matthew J. Miller, Principal Executive Officer and President Zachary P. Richmond, Principal Financial Officer and Treasurer N. Lynn Bowley, Chief Compliance Officer Carol J. Highsmith, Vice President and Secretary INVESTMENT ADVISER Long Short Advisors, LLC 3330 Fairchild Gardens Avenue, Suite 30428 Palm Beach Gardens, FL 33420 DISTRIBUTOR Ultimus Fund Distributors, LLC 225 Pictoria Drive, Suite 450 Cincinnati, OH 45246 | INDEPENDENT REGISTERED PUBLIC ACCOUNTING FIRM Cohen & Company, Ltd. 1350 Euclid Avenue, Suite 800 Cleveland, OH 44115 LEGAL COUNSEL Troutman Pepper Hamilton Sanders LLP 3000 Two Logan Square 18th and Arch Streets Philadelphia, PA 19103 CUSTODIAN U.S. Bank, N.A. 425 Walnut Street Cincinnati, OH 45202 ADMINISTRATOR, TRANSFER AGENT AND FUND ACCOUNTANT Ultimus Fund Solutions, LLC 225 Pictoria Drive, Suite 450 Cincinnati, OH 45246 |
This report is intended only for the information of shareholders or those who have received the Fund’s prospectus which contains information about the Fund’s management fee and expenses. Please read the prospectus carefully before investing.
Distributed by Ultimus Fund Distributors, LLC, Member FINRA/SIPC
LS-AR-22
(b) Not Applicable
Item 2. Code of Ethics.
As of the end of the period covered by this report, the registrant has adopted a code of ethics that applies to the registrant's principal executive officer, principal financial officer, principal accounting officer or controller, or persons performing similar functions, regardless of whether these individuals are employed by the registrant or a third party. Pursuant to Item 13(a)(1), a copy of registrant’s code of ethics is filed as an exhibit to this Form N-CSR. During the period covered by this report, the code of ethics has not been amended, and the registrant has not granted any waivers, including implicit waivers, from the provisions of the code of ethics.
Item 3. Audit Committee Financial Expert.
(a)(1) The registrant’s Board of Trustees has determined that the registrant has at least one audit committee financial expert serving on its audit committee.
(a)(2) The audit committee financial expert is Andrea N. Mullins, who is “independent” for purposes of this Item 3 of Form N-CSR.
Item 4. Principal Accountant Fees and Services.
LS Opportunity Fund: FY 2022 $15,500
FY 2021 $14,500
BFS Equity Fund: FY 2022 $14,500
FY 2021 $13,500
LS Opportunity Fund: FY 2022 $0
FY 2021 $0
BFS Equity Fund: FY 2022 $0
FY 2021 $0
LS Opportunity Fund: FY 2022 $3,000
FY 2021 $3,000
BFS Equity Fund: FY 2022 $3,000
FY 2021 $3,000
Nature of the fees: Preparation of the 1120 RIC and Excise review
LS Opportunity Fund: FY 2022 $0
FY 2021 $0
BFS Equity Fund: FY 2022 $0
FY 2021 $0
| (e) | (1) Audit Committee’s Pre-Approval Policies |
The Audit Committee Charter requires the Audit Committee to be responsible for the selection, retention or termination of auditors and, in connection therewith, to (i) evaluate the proposed fees and other compensation, if any, to be paid to the auditors, (ii) evaluate the independence of the auditors, (iii) pre-approve all audit services and, when appropriate, any non-audit services provided by the independent auditors to the Trust, (iv) pre-approve, when appropriate, any non-audit services provided by the independent auditors to the Trust's investment adviser, or any entity controlling, controlled by, or under common control with the investment adviser and that provides ongoing services to the Trust if the engagement relates directly to the operations and financial reporting of the Trust, and (v) receive the auditors’ specific representations as to their independence;
| (2) | All of the services described in paragraphs (b) through (d) of Item 4 were pre-approved by the Audit Committee. |
(f) During audit of registrant's financial statements for the most recent fiscal year, less than 50 percent of the hours expended on the principal accountant's engagement were attributed to work performed by persons other than the principal accountant's full-time, permanent employees.
(g) The aggregate non-audit fees billed by the registrant's accountant for services rendered to the registrant, and rendered to the registrant's investment adviser (not including any sub-adviser whose role is primarily portfolio management and is subcontracted with or overseen by another investment adviser), and any entity controlling, controlled by, or under common control with the adviser that provides ongoing services to the registrant:
Registrant Adviser
FY 2022 $ 6,000 $ 0
FY 2021 $ 6,000 $ 0
(h) Not applicable. The auditor performed no services for the registrant’s investment adviser or any entity controlling, controlled by, or under common control with the investment adviser that provides ongoing services to the registrant.
Item 5. Audit Committee of Listed Companies. NOT APPLICABLE – applies to listed companies only
Item 6. Schedule of Investments. Schedules filed with Item 1.
Item 7. Disclosure of Proxy Voting Policies and Procedures for Closed-End Management Investment Companies. NOT APPLICABLE – applies to closed-end funds only
Item 8. Portfolio Managers of Closed-End Investment Companies. NOT APPLICABLE – applies to closed-end funds only
Item 9. Purchases of Equity Securities by Closed-End Management Investment Company and Affiliated Purchasers. NOT APPLICABLE – applies to closed-end funds only
Item 10. Submission of Matters to a Vote of Security Holders.
The guidelines applicable to shareholders desiring to submit recommendations for nominees to the Registrant's board of trustees are contained in the statement of additional information of the Trust with respect to the Fund(s) for which this Form N-CSR is being filed.
Item 11. Controls and Procedures.
(a) Based on their evaluation of the registrant’s disclosure controls and procedures (as defined in Rule 30a-3(c) under the Investment Company Act of 1940, as amended (the “Act”)) as of a date within 90 days of the filing date of this report, the registrant’s principal executive officer and principal financial officer have concluded that such disclosure controls and procedures are reasonably designed and are operating effectively to ensure that material information relating to the registrant is made known to them by others within those entities, particularly during the period in which this report is being prepared, and that the information required in filings on Form N-CSR is recorded, processed, summarized, and reported on a timely basis.
(b) There were no changes in the registrant’s internal control over financial reporting (as defined in Rule 30a-3(d) under the Investment Company Act of 1940) that occurred during the period covered by this report that have materially affected, or are reasonably likely to materially affect, the registrant’s internal control over financial reporting.
Item 12. Disclosure of Securities Lending Activities for Closed-End Management Investment Companies. NOT APPLICABLE – applies to closed-end funds only
Item 13. Exhibits.
(a) (1) Code is filed herewith.
(3) Not Applicable
Pursuant to the requirements of the Securities Exchange Act of 1934 and the Investment Company Act of 1940, the registrant has duly caused this report to be signed on its behalf by the undersigned, thereunto duly authorized.
(Registrant) Valued Advisers Trust
By /s/ Matthew J. Miller
Matthew J. Miller, President and Principal Executive Officer
Date 8/3/2022
Pursuant to the requirements of the Securities Exchange Act of 1934 and the Investment Company Act of 1940, this report has been signed below by the following persons on behalf of the registrant and in the capacities and on the dates indicated.
By /s/ Matthew J. Miller
Matthew J. Miller, President and Principal Executive Officer
Date 8/3/2022
By /s/ Zachary P. Richmond
Zachary P. Richmond, Treasurer and Principal Financial Officer
Date 8/3/2022